Attached files
Table of Contents
UNITED STATES
SECURITIES AND EXCHANGE COMMISSION
Washington, D.C. 20549
FORM 10-K
[X] ANNUAL REPORT PURSUANT TO SECTION 13 OR 15(d) OF
THE SECURITIES EXCHANGE ACT OF 1934
| For The Fiscal Year Ended | DECEMBER 31, 2010 |
Commission File Number 000-23377
INTERVEST BANCSHARES CORPORATION
(Exact name of registrant as specified in its charter)
| Delaware | 13-3699013 | |||
| (State or other jurisdiction of incorporation) | (I.R.S. Employer Identification No.) |
| One Rockefeller Plaza, Suite 400 New York, New York 10020-2002 |
||||
| (Address of principal executive offices including Zip Code) | ||||
| (212) 218-2800 | ||||
| (Registrant’s telephone number, including area code) | ||||
Securities registered pursuant to Section 12(b) of the Securities Exchange Act of 1934
| Class A Common Stock, par value $1.00 per share | The NASDAQ Global Select Market | |||
| (Title of class) | (Name of Each Exchange on Which Registered) |
Securities registered pursuant to Section 12(g) of the Securities Exchange Act of 1934
| None | ||||
| (Title of class) |
Indicate by check mark if the registrant is a well-known seasoned issuer, as defined in Rule 405 of the Securities Act: Yes No XX.
Indicate by check mark if the registrant is not required to file reports pursuant to Section 13 or 15(d) of the Act: Yes No XX.
Indicate by check mark whether the registrant: (1) has filed all reports required to be filed by Section 13 or 15(d) of the Securities Exchange Act of 1934 during the preceding 12 months (or for such shorter period that the registrant was required to file such reports), and (2) has been subject to such filing requirements for the past 90 days: Yes XX No .
Indicate by check mark whether the registrant has submitted electronically and posted on its corporate Web site, if any, every Interactive Data File required to be submitted and posted pursuant to Rule 405 of Regulation S-T during the preceding 12 months (or for such shorter period that the registrant was required to submit and post such files): Yes No . * The registrant has not yet been phased into the interactive data requirements.
Indicate by check mark if disclosure of delinquent filers pursuant to Item 405 of Regulation S-K is not contained herein, and will not be contained, to the best of the Registrant’s knowledge, in definitive proxy or information statements incorporated by reference in Part III of this Form 10-K or any amendments to this Form 10-K: Yes No XX.
Indicate by check mark whether the registrant is a large accelerated filer, an accelerated filer, a non-accelerated filer or a smaller reporting company (as defined in Rule 12b-2 of the Exchange Act). Check one:
Large Accelerated Filer Accelerated Filer Non-accelerated Filer XX Smaller Reporting Company
Indicate by check mark whether the registrant is a shell company (as defined in Rule 12b-2 of the Exchange Act): Yes No XX.
The aggregate market value of 6,218,108 shares of the Registrant’s common stock outstanding on June 30, 2010 (which excludes 2,902,704 shares held by affiliates as a group) was $34,199,594. This value is computed by reference to the closing sale price of $5.50 per share on June 30, 2010 of the Registrant’s common stock on the NASDAQ Global Select Market. On the close of business on February 28, 2011, there were 21,126,489 shares of the Registrant’s common stock outstanding.
DOCUMENTS INCORPORATED BY REFERENCE
Portions of the definitive Proxy Statement for the 2011 Annual Meeting of Stockholders to be held in May 2011 are incorporated by reference into Parts II and III of this Form 10-K.
Table of Contents
Intervest Bancshares Corporation and Subsidiaries
2010 ANNUAL REPORT ON FORM 10-K
TABLE OF CONTENTS
| PART I | Page | |||||
| Item 1 | 2 | |||||
| Item 1A | 28 | |||||
| Item 1B | 39 | |||||
| Item 2 | 39 | |||||
| Item 3 | 39 | |||||
| Item 4 | 39 | |||||
| 39 | ||||||
| PART II | ||||||
| Item 5 | 41 | |||||
| Item 6 | 45 | |||||
| Item 7 | Management’s Discussion and Analysis of Financial Condition and Results of Operations |
46 | ||||
| Item7A | 70 | |||||
| Item 8 | 70 | |||||
| Item 9 | Changes In and Disagreements with Accountants on Accounting and Financial Disclosure |
111 | ||||
| Item 9A | 111 | |||||
| Item 9B | 111 | |||||
| PART III | ||||||
| Item 10 | 111 | |||||
| Item 11 | 111 | |||||
| Item 12 | Security Ownership of Certain Beneficial Owners and Management and Related Stockholder Matters |
111 | ||||
| Item 13 | Certain Relationships and Related Transactions, and Director Independence |
111 | ||||
| Item 14 | 111 | |||||
| PART IV | ||||||
| Item 15 | 112 | |||||
| Signatures | 114 | |||||
1
Table of Contents
PART I
The disclosures and discussions set forth in this report on Form 10-K are qualified by the paragraph “Private Securities Litigation Reform Act Safe Harbor Statement” that follows and by “Item 1A Risk Factors.”
Private Securities Litigation Reform Act Safe Harbor Statement
We are making this statement in order to satisfy the “Safe Harbor” provision contained in the Private Securities Litigation Reform Act of 1995. The statements contained in this report on Form 10-K that are not statements of historical fact may include forward-looking statements with respect to our beliefs, plans, objectives, goals, expectations, anticipations, assumptions, estimates, intentions, and future performance, and involve known and unknown risks, uncertainties and other factors, which may be beyond our control, and which may cause our actual results, performance or achievements to be materially different from our future results, performance or achievements expressed or implied by such forward-looking statements. We discuss these and other uncertainties in the “Risk Factors” section of this report. We assume no obligation to update any forward looking statements.
General
Intervest Bancshares Corporation
Intervest Bancshares Corporation (IBC) is a bank holding company incorporated in 1993 under the laws of the State of Delaware. IBC’s Class A common stock trades on the Nasdaq Global Select Market under the symbol “IBCA.” IBC is the parent company of Intervest National Bank (INB) and IBC owns 100% of its capital stock. INB accounts for 99% of our consolidated assets. INB’s business is banking and real estate lending. IBC also owns 100% of Intervest Mortgage Corporation (IMC) whose business also focused on commercial and multifamily real estate lending that was funded through the issuance of its subordinated debentures in public offerings. IMC has not conducted new business since 2009 and effective January 1, 2011, IMC was merged into IBC and IMC’s remaining net assets were transferred to IBC. At December 31, 2010, IMC had no outstanding debt, total assets of $9.5 million and stockholder’s equity of $8.7 million. IBC also owns 100% of the capital stock of four statutory business trusts (Intervest Statutory Trust II, III, IV and V), all of which are unconsolidated entities for financial statement purposes as required by U.S. generally accepted accounting principles (GAAP). The trusts were formed for the sole purpose of issuing and administering trust preferred securities and lending the proceeds to IBC. They do not conduct any trade or business.
References to “we,” “us” and “our” in this report refer to IBC and its consolidated subsidiaries on a consolidated basis, unless otherwise specified. The offices of IBC and INB’s headquarters and full-service banking office are located on the entire fourth floor of One Rockefeller Plaza in New York City, New York, 10020-2002. The main telephone number is 212-218-2800.
IBC’s primary purpose is the ownership of INB. It does not engage in any other substantial business activities other than a limited amount of real estate mortgage lending, including the participation in loans originated by INB. From time to time, IBC also issues debt and equity securities to raise funds as needed for working capital purposes. During 2010, IBC raised a total of $25 million of new capital, most of which was down streamed to INB to strengthen its capital. For a further discussion of the new capital, our regulatory capital requirements, our formal agreements with our regulators and other regulatory matters, see the section “Supervision and Regulation” and notes 11 and 20 to the consolidated financial statements included in this report.
Available Information
IBC’s annual reports on Form 10-K, quarterly reports on Form 10-Q, current reports on Form 8-K, Proxy Statements and any amendments to those reports, can be obtained (excluding exhibits) without charge by writing to: Intervest Bancshares Corporation, Attention: Secretary, One Rockefeller Plaza (Suite 400) New York, New York 10020. In addition, the reports (with exhibits) are available on the Securities and Exchange Commission’s website www.sec.gov. IBC has a website at www.intervestbancsharescorporation.com that is used for limited purposes. INB also has a website at www.intervestnatbank.com. The information on both of these web sites is not and should not be considered part of this report and is not incorporated by reference in this report.
2
Table of Contents
Intervest National Bank
INB is a nationally chartered commercial bank that began business on April 1, 1999. Its headquarters and full-service banking office is located at One Rockefeller Plaza, Suite 400, in New York City, and it has a total of six full-service banking offices in Pinellas County, Florida - four in Clearwater, one in Clearwater Beach and one in South Pasadena. INB conducts a personalized commercial and consumer banking business that attracts deposits from the general public. It provides internet banking services through its web site www.intervestnatbank.com, which also attracts deposit customers from outside its primary market areas. INB uses the deposits, together with funds generated from its operations, principal repayments on loans and securities and other sources, to originate mortgage loans secured by commercial and multifamily real estate and to purchase investment securities.
INB’s revenues are derived primarily from interest and fees received from originating loans, and from interest and dividends earned on security and other short-term investments. The principal sources of funds for INB’s lending activities are deposits, repayment of loans, maturities and calls of securities and cash flow generated from operations. INB’s principal expenses consist of interest paid on deposits and borrowings and operating, general and administrative expenses. INB’s deposit flows and the rates it pays on deposits are influenced by interest rates on competing investments available to depositors and general market rates of interest. INB’s loan volume is affected primarily by the interest rates it charges on loans, customer demand for loans, the general supply of money available for lending purposes, the rates offered by its competitors, and the terms and credit risks associated with the loans. INB faces strong competition in the attraction of deposits and the origination of loans. INB’s deposits are insured by the Federal Deposit Insurance Corporation (FDIC) to the extent permitted by law. INB’s core data processing is outsourced and is performed by Fiserv, Inc, a leading global provider of information management and electronic commerce systems for the financial services industry.
INB’s operations are significantly influenced by general and local economic conditions, particularly those in the New York City metropolitan area and the State of Florida where most of the properties that secure INB’s mortgage loans are concentrated, and by related monetary and fiscal policies of banking regulatory agencies, including the Federal Reserve Bank of New York (FRB) and FDIC. INB is subject to the supervision, regulation and examination of the Office of the Comptroller of the Currency of the United States of America (OCC). INB is a party to a formal agreement with the OCC and INB’s capital ratios were excess of its current regulatory requirements as December 31, 2010 as discussed in the section “Supervision and Regulation” in this report.
Business Overview and Strategy
Our business strategy is to attract deposits and use those funds to originate commercial and multifamily real estate loans, as well as other types of loans, on a profitable basis, while maintaining the combination of efficient customer service and loan underwriting and low-cost infrastructure. We rely upon the relationships we have developed with our borrowers and brokers with whom we have done business in the past as primary sources of new loans. We believe that our ability to rapidly and efficiently process and close mortgage loans gives us a competitive advantage. We also emphasize providing exceptional customer service as a means to attract and retain customers. We deliver personalized service and respond with flexibility to customer needs. We believe the above factors distinguish us from larger banks that operate in our primary market areas. In addition, we have a website, I-NetMortgageClearingHouse.com, which is an interactive web portal connecting buyers and sellers of real estate mortgages. The website provides access to banks and credit unions throughout the country so that prospective buyers of mortgage loans can easily access information about potential portfolio properties and sellers of loans can efficiently list mortgages for sale. We expect this website to be beneficial to our business strategy.
Our lending activities are comprised almost entirely of the origination for our loan portfolio of first mortgage loans secured by commercial and multifamily real estate (including rental and cooperative/condominium apartment buildings, office buildings, mixed-use properties, shopping centers, hotels, restaurants, industrial/warehouse properties, parking lots/garages, mobile home parks, self-storage facilities and some vacant land). Loans we originate normally have terms of five years or less and the portfolio had an average life of approximately 3.5 years at December 31, 2010. As a matter of policy, we do not own or originate construction/development loans or condominium conversion loans. We generally lend in geographical areas that are in the process of being revitalized or redeveloped, with a concentration of loans on properties located in New York and Florida.
3
Table of Contents
Our new originations during the last two years have nearly all been fixed-rate loans due to the demand by borrowers for longer-term, fixed-rate product that has been driven by the historically low interest rate environment. We expect this demand for longer-term, fixed-rate product to continue for a period of time. Fixed-rate loans constituted approximately 78% of our loan portfolio at December 31, 2010.
INB solicits deposit accounts from individuals, small businesses and professional firms located throughout its primary market areas in New York and Florida through the offering of a variety of deposit products and providing online and telephone banking. INB uses its internet web site www.intervestnatbank.com to attract and retain deposit customers from both within and outside its primary market areas. In 2010, due primarily to higher regulatory capital requirements applicable to INB, INB gradually reduced the size of its balance sheet by decreasing its deposit rates and encouraging net deposit outflow, repaying its borrowed funds as they matured and decreasing the volume of its new loan originations from historical levels.
Our revenues consist of interest, dividends and fees earned on our interest-earning assets, which are comprised of mortgage loans, securities and other short-term investments, and noninterest income. Our expenses consist of interest paid on our interest-bearing liabilities, which are comprised of deposits, borrowed funds, as well as our operating and general expenses. Our profitability depends primarily on our net interest income, which is the difference between interest income generated from our interest-earning assets and interest expense incurred on our interest-bearing liabilities. Net interest income is dependent upon the interest-rate spread, which is the difference between the average yield earned on interest-earning assets and the average rate paid on interest-bearing liabilities. When interest-earning assets approximate or exceed interest-bearing liabilities, any positive interest-rate spread will generate net interest income. Our profitability is also affected by the level of our noninterest income and expenses, provisions for loan and real estate losses and income tax expense or benefit. Our profitability is also significantly affected by general and local economic conditions, competition, changes in market interest rates, changes in real estate values, government policies and actions of regulatory authorities.
Our noninterest income is derived mostly from loan and other banking fees as well as income from loan prepayments. When a mortgage loan is repaid prior to maturity, we may recognize prepayment income, which consists of the recognition of unearned fees associated with such loans at the time of payoff and the receipt of additional prepayment fees and/or interest in certain cases, in accordance with the prepayment provisions of the mortgage loan. Our income from loan prepayments fluctuates and cannot be predicted. Normally, loan prepayments tend to increase during periods of declining interest rates and tend to decrease during periods of increasing interest rates. However, given the nature and type of mortgage loans we originate we may still experience loan prepayments notwithstanding the effects of movements in interest rates.
Our noninterest expenses are derived primarily from the following: salaries and employee benefits; occupancy and equipment; data processing; advertising and promotion; professional fees and services; FDIC insurance; general insurance; real estate activities; and other operating and general expenses. We also record provisions for loan and real estate losses. FDIC insurance premium rates for all FDIC insured banks have increased substantially since 2008 and may increase further in the future.
Our operating results since 2007 have been negatively affected by a weak economy, high rates of unemployment, increased office and retail vacancy rates and an increased supply of distressed properties for sale in the marketplace at discounted prices, all of which significantly reduced commercial and multifamily real estate values both nationally and in our lending areas. These unfavorable conditions resulted in a number of our loans becoming nonperforming and substantially increased our loan and real estate loss provisions and related expenses. We have taken and continue to take various steps to resolve our nonperforming and problem loans, including proceeding with foreclosures on many of the collateral properties and attempting to sell them, working with certain borrowers to provide payment relief and, in limited cases, accepting partial payment as full satisfaction of the loan.
In May 2010, due to the cost of and delays we have encountered in connection with foreclosure proceedings and to respond to concerns from INB’s regulator to reduce criticized assets, we completed a large bulk sale in order to accelerate the reduction of problem assets. We sold in bulk certain non-performing and underperforming loans on commercial real estate and multi-family properties and some real estate owned.
4
Table of Contents
The assets sold aggregated to approximately $207 million and consisted of $192.6 million of loans and $14.4 million of real estate. The assets were sold at a substantial discount to their then net carrying values of $197.7 million for net proceeds of $119.1 million. As a result of this bulk sale, we recorded a $78.7 million combined provision for loan and real estate losses, which contributed approximately $44 million our net after tax loss of $55 million in 2010. We also recorded additional provisions for loan and real estate losses during 2010 apart from the bulk sale due to the weak economy and declining real estate values.
At December 31, 2010, our nonaccrual loans and real estate owned totaled $80.0 million, or 3.86% of total assets, compared to $155.8 million, or 6.49%, at December 31, 2009. We intend to actively manage our remaining problem assets by working toward their resolution on an individual basis. Additional increases in our level of nonperforming assets could have an adverse effect on our financial condition, operating results and regulatory capital.
Market Area
Our primary market area for our New York office is the New York metropolitan area, consisting of the five boroughs of New York City and the areas surrounding them. New York City is the nation’s financial capital and the home of more than 8 million individuals representing virtually every race and nationality. The City also has a vibrant and diverse business community with many businesses and professional service firms. Historically, the New York City metropolitan area has benefited from being the corporate headquarters of many large industrial and commercial national companies, which have, in turn, attracted many smaller companies, particularly within the service industry. The New York City metropolitan area is particularly sensitive to the economic health of the United States. Our primary market area for our Florida offices is Pinellas County, which is the most populous county in the Tampa Bay area of Florida. This area also has many seasonal residents. The Tampa Bay area is located on the West Coast of Florida, midway up the Florida peninsula. The major cities in the area are Tampa (Hillsborough County) and St. Petersburg and Clearwater (Pinellas County). INB’s deposit-gathering market also includes its internet web site www.intervestnatbank.com, which attracts deposit customers from both within and outside its primary market areas.
Competition
In one or more aspects of our business, we compete with other commercial banks, savings and loan associations, credit unions, finance companies, mutual funds, insurance companies, brokerage and investment banking companies, and other financial intermediaries. Most of these competitors are larger than we are and are increasing their efforts to serve smaller commercial borrowers. In addition, many of these competitors, by virtue of their size and resources, may enjoy efficiencies and competitive advantages over us in pricing, delivery and marketing of their products and services. We believe that, despite the continued growth of large institutions and the potential for large out-of-area banking and financial institutions to enter our market area, there will continue to be opportunities for efficiently-operated, service-oriented, well-capitalized, community-based banking organizations to grow by serving customers that are not well served by larger institutions or do not wish to bank with such large institutions.
Competition for depositors’ funds and for credit-worthy loan customers is intense and is based upon interest rates and other credit and service charges, the quality of service provided, the convenience of banking facilities, the products offered and, in the case of larger commercial borrowers, relative lending limits.
Lending Activities
General
Our lending activities emphasize the origination of first mortgage loans secured by commercial and multifamily real estate. We also offer commercial and consumer loans, although such lending has not been emphasized and we do not presently expect to become more active in such lending. Our volume of loan originations is dependent on a number of factors, including the following: customer demand; interest rates charged by us; availability of funds to lend; rates offered by competitors; and whether the terms and credit risks associated with the loans are suitable for our portfolio. We tend to lend in areas that are in the process of being revitalized or redeveloped, with a concentration of loans on properties located in New York and Florida. A large number of the properties in New York are located in Manhattan, Brooklyn, Queens, Long Island, Staten Island and the Bronx.
5
Table of Contents
Many of the multifamily properties located in New York City and surrounding boroughs are also subject to rent control and rent stabilization laws, which limit the ability of the property owners to increase rents, which may in turn limit the borrower’s ability to repay those mortgage loans. A large number of the properties in Florida are located in Clearwater, Tampa, St. Petersburg, Orlando, Fort Lauderdale, Hollywood and Miami. At December 31, 2010, we also had loans on properties in Connecticut, Georgia, Illinois, Indiana, Kentucky, Maryland, North Carolina, New Jersey, Ohio, Pennsylvania, South Carolina and Virginia.
Our lending activities are conducted pursuant to written policies and defined lending limits, including types and amounts of loans. In originating real estate loans, we primarily consider the net operating income generated by the underlying property to support the loan’s debt service, the marketability and value of the property, the financial resources, income level and managerial expertise of the borrower with respect to the property, and any lending experience we have with the borrower. All potential new loans are referred to one of our two senior lending officers, the Chairman and the President, both of whom have substantial experience in commercial and multifamily real estate lending. Generally, all loans that we originate must be first reviewed and approved by our Loan Committee, which is comprised of three members of our Board of Directors, one of whom is also our Chairman. As a national bank, INB may not make a loan or extend credit to a single or related group of borrowers in excess of 15% of INB’s unimpaired capital and surplus. Additional amounts may be loaned, not in excess of 10% of unimpaired capital and surplus, if such loans or extensions of credit are secured by readily-marketable collateral.
Our loan portfolio is concentrated in first mortgage loans secured by commercial and multifamily real estate properties (including rental and cooperative/condominium apartment buildings, office buildings, mixed-use properties, shopping centers, hotels, restaurants, industrial/warehouse properties, parking lots/garages, mobile home parks, self storage facilities and vacant land). At December 31, 2010 such loans consisted of 575 loans with an aggregate principal balance of $1.34 billion and an average loan size of $2.3 million. Loans with principal balances of more than $10 million consisted of 10 loans or $132 million, with the largest loan being $16.3 million. Loans with principal balances of $5 million to $10 million consisted of 57 loans and aggregated to $374 million.
The following table sets forth information regarding the loan portfolio.
| At December 31, | ||||||||||||||||||||
| ($ in thousands) |
2010 | 2009 | 2008 | 2007 | 2006 | |||||||||||||||
| Commercial real estate loans |
$ | 948,275 | $ | 1,128,646 | $ | 1,081,865 | $ | 932,351 | $ | 812,063 | ||||||||||
| Residential multifamily loans |
380,180 | 529,431 | 599,721 | 657,387 | 634,753 | |||||||||||||||
| Land development and other land loans |
12,550 | 32,934 | 31,430 | 33,318 | 54,917 | |||||||||||||||
| Residential 1-4 family loans |
416 | 441 | 464 | 486 | 35 | |||||||||||||||
| Commercial business loans |
1,454 | 1,687 | 684 | 575 | 745 | |||||||||||||||
| Consumer loans |
107 | 616 | 373 | 315 | 218 | |||||||||||||||
| Loans receivable, gross |
1,342,982 | 1,693,755 | 1,714,537 | 1,624,432 | 1,502,731 | |||||||||||||||
| Deferred loan fees |
(5,656 | ) | (7,591 | ) | (8,826 | ) | (10,400 | ) | (12,078 | ) | ||||||||||
| Loans receivable, net of deferred fees |
1,337,326 | 1,686,164 | 1,705,711 | 1,614,032 | 1,490,653 | |||||||||||||||
| Allowance for loan losses |
(34,840 | ) | (32,640 | ) | (28,524 | ) | (21,593 | ) | (17,833 | ) | ||||||||||
| Loans receivable, net |
$ | 1,302,486 | $ | 1,653,524 | $ | 1,677,187 | $ | 1,592,439 | $ | 1,472,820 | ||||||||||
| Loans included above that were on nonaccrual status |
$ | 52,923 | $ | 123,877 | $ | 108,610 | $ | 90,756 | $ | 3,274 | ||||||||||
| Loan included above that have been restructured and were on accrual status |
$ | 3,632 | $ | 97,311 | $ | - | $ | - | $ | - | ||||||||||
| Accruing loans included above which were contractually past due 90 days or more |
$ | 7,481 | $ | 6,800 | $ | 1,964 | $ | 11,853 | $ | - | ||||||||||
| Interest income not recorded on loans that were on nonaccrual status during the year |
$ | 2,850 | $ | 8,950 | $ | 7,999 | $ | 4,546 | $ | 153 | ||||||||||
6
Table of Contents
The following table sets forth information regarding loans with principal balances of more than $10 million at December 31, 2010.
| ($ in thousands) Property Type |
Property Location | Principal Balance |
Current Interest Rate |
Maturity Date |
Status | |||||||||||||
| Office building |
New York, New York | $ | 16,297 | 6.00 | % | Aug 2013 | Performing | |||||||||||
| Office building |
New York, New York | 15,695 | 6.13 | % | Apr 2015 | Performing | ||||||||||||
| Retail stores |
White Plains, New York | 15,403 | 6.00 | % | Sep 2015 | Performing | ||||||||||||
| Office building |
Miami, Florida | 14,834 | 6.50 | % | Oct 2011 | Nonaccrual | ||||||||||||
| Residential Multifamily |
Tampa, Florida | 12,874 | 5.75 | % | Sep 2020 | Performing | ||||||||||||
| Office building |
Ft. Lauderdale, Florida | 12,356 | 5.88 | % | May 2011 | Performing | ||||||||||||
| Retail stores |
Manorville, New York | 11,563 | 6.25 | % | Sep 2024 | Performing | ||||||||||||
| Retail stores |
Brooklyn, New York | 11,351 | 6.00 | % | Nov 2013 | Performing | ||||||||||||
| Hotel |
New York, New York | 11,304 | 6.45 | % | Jul 2012 | Performing | ||||||||||||
| Office building |
New York, New York | 10,787 | 6.00 | % | Apr 2014 | Performing | ||||||||||||
| $ | 132,464 | |||||||||||||||||
The following table sets forth the geographic distribution of the gross loan portfolio.
| At December 31, | ||||||||||||||||||||||||||||||||||||||||
| 2010 | 2009 | 2008 | 2007 | 2006 | ||||||||||||||||||||||||||||||||||||
| ($ in thousands) | Amount | |
% of Total |
|
Amount | |
% of Total |
|
Amount | |
% of Total |
|
Amount | |
% of Total |
|
Amount | |
% of Total |
| ||||||||||||||||||||
| New York |
$ | 916,485 | 68 | % | $ | 1,123,300 | 66 | % | $ | 1,122,459 | 66 | % | $ | 1,046,704 | 64 | % | $ | 1,005,946 | 67 | % | ||||||||||||||||||||
| Florida |
310,560 | 23 | 392,712 | 23 | 403,553 | 23 | 412,076 | 26 | 366,393 | 24 | ||||||||||||||||||||||||||||||
| Connecticut & New Jersey |
44,298 | 3 | 66,119 | 4 | 74,698 | 4 | 62,552 | 4 | 52,185 | 4 | ||||||||||||||||||||||||||||||
| All Other States |
71,639 | 6 | 111,624 | 7 | 113,827 | 7 | 103,100 | 6 | 78,207 | 5 | ||||||||||||||||||||||||||||||
| $ | 1,342,982 | 100 | % | $ | 1,693,755 | 100 | % | $ | 1,714,537 | 100 | % | $ | 1,624,432 | 100 | % | $ | 1,502,731 | 100 | % | |||||||||||||||||||||
The following table sets forth the scheduled contractual principal repayments of the loan portfolio.
| At December 31, | ||||||||||||||||||||
| ($ in thousands) |
2010 | 2009 | 2008 | 2007 | 2006 | |||||||||||||||
| Due within one year |
$ | 248,566 | $ | 290,761 | $ | 377,081 | $ | 401,061 | $ | 366,457 | ||||||||||
| Due over one to five years |
858,184 | 1,088,987 | 941,504 | 870,558 | 918,255 | |||||||||||||||
| Due over five years |
236,232 | 314,007 | 395,952 | 352,813 | 218,019 | |||||||||||||||
| $ | 1,342,982 | $ | 1,693,755 | $ | 1,714,537 | $ | 1,624,432 | $ | 1,502,731 | |||||||||||
The following table sets forth the scheduled contractual principal repayments of the loan portfolio by loan type.
| At December 31, 2010 | ||||||||||||||||
| ($ in thousands) |
|
Due Within One Year |
|
|
Due Over One to Five Years |
|
|
Due Over Five Years |
|
Total | ||||||
| Commercial real estate loans |
$ | 162,019 | $ | 641,174 | $ | 145,082 | $ | 948,275 | ||||||||
| Residential multifamily loans |
80,559 | 209,338 | 90,283 | 380,180 | ||||||||||||
| Land development and other land loans |
4,756 | 7,343 | 451 | 12,550 | ||||||||||||
| Residential 1-4 family loans |
- | - | 416 | 416 | ||||||||||||
| Commercial business loans |
1,186 | 268 | - | 1,454 | ||||||||||||
| Consumer loans |
46 | 61 | - | 107 | ||||||||||||
| $ | 248,566 | $ | 858,184 | $ | 236,232 | $ | 1,342,982 | |||||||||
The following table sets forth the activity in the net loan portfolio.
| For the Year Ended December 31, | ||||||||||||||||||||
| ($ in thousands) |
2010 | 2009 | 2008 | 2007 | 2006 | |||||||||||||||
| Loans receivable, net, at beginning of year |
$ | 1,653,524 | $ | 1,677,187 | $ | 1,592,439 | $ | 1,472,820 | $ | 1,352,805 | ||||||||||
| Originations |
76,623 | 200,145 | 386,892 | 554,630 | 548,474 | |||||||||||||||
| Sales and principal repayments |
(286,365 | ) | (185,076 | ) | (267,490 | ) | (431,954 | ) | (426,787 | ) | ||||||||||
| Transfers to foreclosed real estate |
(40,885 | ) | (27,748 | ) | (25,070 | ) | (975 | ) | - | |||||||||||
| Chargeoffs |
(100,146 | ) | (8,103 | ) | (4,227 | ) | - | - | ||||||||||||
| Decrease in deferred loan fees |
1,935 | 1,235 | 1,574 | 1,678 | 980 | |||||||||||||||
| Net increase in allowance for loan losses |
(2,200 | ) | (4,116 | ) | (6,931 | ) | (3,760 | ) | (2,652 | ) | ||||||||||
| Loans receivable, net, at end of year |
$ | 1,302,486 | $ | 1,653,524 | $ | 1,677,187 | $ | 1,592,439 | $ | 1,472,820 | ||||||||||
7
Table of Contents
The following table sets forth the types of properties securing the mortgage loan portfolio.
| At December 31, | ||||||||||||||||||||
| ($ in thousands) |
2010 | 2009 | 2008 | 2007 | 2006 | |||||||||||||||
| Commercial Real Estate: |
||||||||||||||||||||
| Retail stores |
$ | 492,596 | $ | 546,199 | $ | 550,905 | $ | 428,170 | $ | 298,652 | ||||||||||
| Office buildings |
239,047 | 294,637 | 265,123 | 242,240 | 244,767 | |||||||||||||||
| Industrial/warehouse |
77,890 | 96,646 | 83,903 | 82,968 | 103,971 | |||||||||||||||
| Hotels |
55,044 | 94,266 | 93,168 | 100,446 | 89,333 | |||||||||||||||
| Mobile home parks |
21,082 | 23,391 | 21,351 | 15,449 | 18,627 | |||||||||||||||
| Parking lots/garages |
25,488 | 26,332 | 29,010 | 23,305 | 18,551 | |||||||||||||||
| Other |
37,128 | 47,175 | 38,405 | 39,773 | 38,162 | |||||||||||||||
| Residential Multifamily (5 or more units) |
380,180 | 529,431 | 599,721 | 657,387 | 634,753 | |||||||||||||||
| Vacant Land |
12,550 | 32,934 | 31,430 | 33,318 | 54,917 | |||||||||||||||
| Residential 1-4 Family |
416 | 441 | 464 | 486 | 35 | |||||||||||||||
| $ | 1,341,421 | $ | 1,691,452 | $ | 1,713,480 | $ | 1,623,542 | $ | 1,501,768 | |||||||||||
The following table sets forth information regarding the credit quality of the loan portfolio at December 31, 2010 based on internally assigned grades.
| ($ in thousands) | Pass (1) | Special Mention (1) | Substandard (1) (2) | Total | ||||||||||||
| Commercial real estate loans |
$ | 858,632 | $ | 23,295 | $ | 66,348 | $ | 948,275 | ||||||||
| Residential multifamily loans |
346,589 | 14,127 | 19,464 | 380,180 | ||||||||||||
| Land development and other land loans |
9,417 | 2,837 | 296 | 12,550 | ||||||||||||
| Residential 1-4 family loans |
416 | - | - | 416 | ||||||||||||
| Commercial business loans |
1,454 | - | - | 1,454 | ||||||||||||
| Consumer loans |
107 | - | - | 107 | ||||||||||||
| Loans receivable, gross |
$ | 1,216,615 | $ | 40,259 | $ | 86,108 | $ | 1,342,982 | ||||||||
| (1) | See note 3 to the consolidated financial statements in this report for a definition of these grades. |
| (2) | Consist of $52.9 million of nonaccrual loans, $3.6 million of accruing TDRs and $29.5 million of other performing loans. |
Commercial and Multifamily Real Estate Lending
Commercial and multifamily real estate lending is generally considered to have more credit risk than traditional 1-4 family residential lending because these loans tend to involve larger loan balances to single borrowers and their repayment is typically dependent upon the successful operation and management of the underlying real estate for income-producing properties. In addition, we have and may continue to originate loans on vacant or substantially vacant properties, owner-occupied properties and vacant land, all of which typically have limited or no income streams and depend upon other sources of cash flow from the borrower for repayment. All the above loans require ongoing evaluation and monitoring since they may be affected to a greater degree by adverse conditions in the real estate market or the economy or changes in government regulation.
Mortgage loans on commercial and multifamily real estate typically provide for periodic payments of interest and principal during the term of the mortgage, with the remaining principal balance and any accrued interest due at the maturity date. The majority of the mortgage loans originated by us provide for balloon payments at maturity, which means that a substantial part of or the entire original principal amount is due in one lump sum payment at maturity. If the net revenue from the property is not sufficient to make all debt service payments due on the mortgage or, if at maturity or the due date of any balloon payment, the owner of the property fails to raise the funds (by refinancing the loan, sale of the property or otherwise) to make the lump sum payment, we could sustain a loss on our investment in the mortgage loan. As noted elsewhere in this report, we have experienced a significant increase in nonaccrual loans since early 2007 and we have incurred a high level of loan chargeoffs and loan and real estate loss provisions.
We have historically originated short-term real estate mortgage loans with balloon payments at maturity and with terms of no more than 10 years and with either fixed or variable interest rates, including many with predetermined interest rate increases over the life of the loan. For those loans originated with terms of greater than 10 years, almost all of them are self-liquidating loans. Since early 2007, as a result of competitive market conditions and lower pricing in originating loans, we began placing greater reliance on fixed-rate loan originations with somewhat longer maturities. To illustrate, fixed-rate loans constituted approximately 78% of the loan portfolio at December 31, 2010, compared to approximately 40% at December 31, 2006.
8
Table of Contents
Loans in the portfolio had an average life of approximately 3.5 years at December 31, 2010, compared with 3 years at December 31, 2006. We may experience loan prepayments, the amount of which cannot be predicted, and reinvestment risk associated with the investment of the resulting proceeds.
As part of our written policies for real estate loans, loan-to-value ratios (the ratio that the original principal amount of the loan bears to the lower of the purchase price or appraised value of the property securing the loan at the time of origination) on loans originated by us typically do not exceed 80% and in practice, rarely exceed 75%. Debt service coverage ratios (the ratio of the net operating income generated by the property securing the loan to the required debt service) on multi-family and commercial real estate loans originated typically are not less than 1.2 times. We may from time to time originate mortgage loans on vacant or substantially vacant properties and vacant land for which there is limited or no cash flow being generated by the operation of the underlying real estate. We may also require personal guarantees from the principals of our borrowers as additional security, although loans are often originated on a limited recourse basis. In originating loans, we consider the ability of the net operating income generated by the real estate to support the debt service, the financial resources, income level and managerial expertise of the borrower, the marketability of the property and our lending experience with the borrower. Our mortgage loans are not insured or guaranteed by governmental agencies. In the event of a default on a mortgage loan we originate, our ability to recover our investment is dependent upon the market value of the mortgaged property.
Loan Solicitation and Processing
Historically, mortgage brokers have been the source of substantially all of the real estate loans we originate. To a lesser extent, our loan originations are also derived from advertising in newspapers and trade journals, existing customers, direct solicitation by our officers and walk-in customers. The mortgage brokers are paid a fee by the borrower upon our funding of the loan. Our underwriting procedures require the following: an appraisal of the property securing the mortgage loan that is performed by a licensed or certified appraiser approved by us to determine the property’s adequacy as collateral; a physical inspection of the property by us; mortgage title insurance; flood insurance when required; fire insurance; casualty and liability insurance and environmental surveys. In addition, we have an internal appraisal review process to monitor third party appraisals. We also perform analyses for relevant real property and financial factors, which may include: the condition and use of the subject property; the property’s income-producing capacity; and the quality, experience and financial creditworthiness of the property’s owner. Credit reports and other verifications, including searches related to the requirements of the Office of Foreign Assets Control (OFAC) and the USA Patriot Act, are obtained to substantiate specific information relating to the applicant’s income, credit standing and legal status.
Loan Origination, Loan Fees and Prepayment Income From the Early Repayment of Loans.
We normally charge loan origination fees on the mortgage loans we originate based on a percentage of the principal amount of the loan. These fees are normally comprised of a fee that is received from the borrower at the time the loan is originated and another similar fee that is contractually due when the loan is repaid. The total fees, net of related direct loan origination costs, are deferred and amortized over the contractual life of the loan as an adjustment to the loan’s yield. At December 31, 2010, we had $5.7 million of net unearned loan fees and $5.5 million of loan fees receivable. We also earn other fee income from the servicing of the loans we originate.
When a mortgage loan is repaid prior to maturity, we may recognize prepayment income, which consists of the recognition of unearned fees associated with such loans at the time of payoff and the receipt of additional prepayment fees and or interest in certain cases in accordance with the prepayment provisions in the mortgage loan. The amount and timing of, as well as income from loan prepayments, if any, cannot be predicted and can fluctuate significantly. Normally, the number of mortgage loans that are prepaid tends to increase during periods of declining interest rates and tends to decrease during periods of increasing interest rates. However, given the nature and type of the mortgage loans we originate, we may still experience loan prepayments notwithstanding the effects of movements in interest rates. Loan prepayment income totaled $1.4 million in 2010, $1.2 million in 2009 and $2.4 million in 2008. During 2010 and 2009, we experienced a lower volume of loan prepayments primarily due to the effects of the recent crisis in the credit markets (which reduced funding sources available in the lending markets for both new and refinancing of existing loans) as well as declining real estate values.
9
Table of Contents
Asset Quality
We consider asset quality to be of primary importance to our business and results of operations. After a loan is originated, we undertake various steps (such as an annual physical inspection of the subject property and periodic reviews of loan files in order to monitor loan documentation, rent rolls and the value of the property securing the loan) with the objective of quickly identifying, evaluating and initiating corrective actions if necessary. We also constantly monitor the payment status of our outstanding loans and pursue a timely follow-up on any delinquencies, including initiating collection procedures even before a loan is 90 days past due as necessary. We also assess substantial late fees on delinquent loan payments.
All of our loans are subject to the risk of default, otherwise known as credit risk, which represents the possibility of us not recovering amounts due from our borrowers. The underlying credit quality of our loan portfolio is dependent primarily on each borrower’s ability to continue to make required loan payments and, in the event a borrower is unable to continue to do so, the value of the collateral securing the loan. A borrower’s ability to pay in the case of multifamily and commercial real estate loans is typically dependent on the cash flow generated by the property, which in turn is impacted by general economic conditions. Other factors, such as unanticipated expenditures or changes in the financial markets, may also impact a borrower’s ability to pay. Collateral values, particularly real estate values, are also impacted by a variety of factors including general economic conditions, demographics, maintenance and collection or foreclosure delays. Additionally, political issues, including armed conflicts, acts of terrorism, or natural disasters, such as hurricanes, may have an adverse impact on economic conditions of the country as a whole and may be more pronounced in specific geographic regions. All of these aforementioned factors affect the rents and occupancy of the properties, which in turn affect the market value of the mortgaged properties underlying our loans.
Loan concentrations are defined as amounts loaned to a number of borrowers engaged in similar activities or on properties located in a particular geographic area. Our loan portfolio is concentrated in commercial real estate and multifamily mortgage loans (including land loans), which represented 99.8% of the total loan portfolio at December 31, 2010. The properties securing our mortgage loans are also concentrated in two states, New York and Florida, representing 68% and 23%, respectively, of the total dollar amount of loans outstanding at December 31, 2010. Many of the properties in New York are located in New York City and are subject to rent control and rent stabilization laws, which limit the ability of the property owners to increase rents, which in turn may affect the borrower’s ability to repay the mortgage loan. As such, these properties may not be affected by the general movement of real estate values in the same manner as other income-producing properties. Many of the properties securing our loans are also located in areas that are being revitalized or redeveloped, which can be impacted more severely by a downturn in real estate values.
We place loans on nonaccrual status when principal or interest becomes 90 days or more past due or earlier in certain cases, unless the loan is well secured and in the process of collection. All previously accrued and uncollected interest and late charges on loans placed on nonaccrual status are reversed through a charge to interest income. While loans are on nonaccrual status, interest income is normally recognized only to the extent cash is received until a return to accrual status is warranted. In some circumstances, interest continues to accrue on mortgage loans that have matured and the borrower continues to make monthly payments of principal and interest. These loans are classified as 90 days past due and still accruing interest.
Since early 2007, our asset quality has been negatively impacted by a weak economy, high rates of unemployment, increased office and retail vacancy rates and lower commercial real estate values. At December 31, 2010, our nonperforming assets amounted to $80.0 million, or 3.86% of total assets, and consisted of $52.9 million of nonaccrual loans and $27.1 million of real estate acquired through foreclosure. Nonaccrual loans at December 31, 2010 included $21 million of performing restructured loans (TDRs) that were classified as nonaccrual based on regulatory guidance. At December 31, 2010, we also had $3.6 million of accruing TDRs. All of these TDRs continue to pay as agreed under their renegotiated terms. TDRs are loans on which we have granted certain concessions to the borrowers to provide payment relief generally consisting of the deferral of principal and or interest payments for a period of time, or a partial reduction in interest payments. Nonaccrual and restructured loans are considered impaired loans under GAAP. At December 31, 2010, there we had no other loans classified as impaired.
10
Table of Contents
At December 31, 2010, in addition to nonaccrual loans and TDRs, we had $29.5 million of other performing loans for which there were concerns regarding the ability of the borrowers to meet existing repayment terms. Such loans were classified as substandard and reflect the distinct possibility, but not the probability, that we will not be able to collect all amounts due according to the contractual terms of the loan. Such loans may never become delinquent, nonaccrual or impaired and these loans are considered in the determination of the adequacy of the allowance for loan losses.
We estimate the fair value of the properties that collateralize our loans based on a variety of information, including the use of available appraisals, estimates of market value by licensed appraisers or local real estate brokers and the knowledge and experience of our two senior lending officers (the Chairman and President) and our Chief Credit Officer related to values of properties in our geographical market areas. These officers take into consideration the type, location and occupancy of the property as well as current economic conditions in the area the property is located in assessing estimates of fair value. Our current policy is to have externally prepared appraisals or indications of value, or internally prepared valuations completed for new, restructured, or renewed loans; upon classification or downgrade of a loan; upon accepting a deed in lieu of foreclosure; upon transfer of a loan to foreclosed real estate, and at least annually thereafter for all real estate owned and for loans that continue to be classified.
We may acquire and retain title in real property pursuant to a foreclosure of a mortgage loan in the normal course of business either directly or through a subsidiary or an affiliated entity. These properties are held for sale. Upon foreclosure of the property, the related loan is transferred from the loan portfolio to the foreclosed real estate category at the estimated fair value of the property, less estimated selling costs. Such amount becomes the new cost basis of the property. Adjustments made to reduce the carrying value at the time of transfer are charged to the allowance for loan losses as a loan chargeoff. After foreclosure, we periodically perform market valuations and the property continues to be carried at the lower of cost or estimated fair value less estimated selling costs. Changes in the valuation allowance of the property are charged to the “Provision for Real Estate Losses”. Revenues and expenses from operations of the property are included in the caption “Real Estate Activities.”
The table that follows summarizes our nonperforming assets and past due loans as of the dates indicated.
| ($ in thousands) |
|
At Dec 31, 2009 |
|
|
At Mar 31, 2010 |
|
|
At Jun 30, 2010 |
|
|
At Sep 30, 2010 |
|
|
At Dec 31, 2010 |
| |||||
| Nonaccrual loans |
$ | 123,877 | $ | 96,248 | $ | 18,927 | $ | 38,560 | $ | 52,923 | ||||||||||
| Real estate acquired through foreclosure |
31,866 | 57,858 | 34,259 | 38,792 | 27,064 | |||||||||||||||
| Total nonperforming assets (1) |
$ | 155,743 | $ | 154,106 | $ | 53,186 | $ | 77,352 | $ | 79,987 | ||||||||||
| Loan past due 90 days and still accruing |
$ | 6,800 | $ | 3,629 | $ | 8,788 | $ | 16,865 | $ | 7,481 | ||||||||||
| Loans past due 31-89 days and still accruing |
$ | 5,925 | $ | 14,427 | $ | 13,066 | $ | 5,264 | $ | 11,364 | ||||||||||
| Nonperforming assets to total assets |
6.49% | 6.75% | 2.46% | 3.68% | 3.86% | |||||||||||||||
| Nonaccrual loans to total gross loans |
7.31% | 5.87% | 1.35% | 2.82% | 3.94% | |||||||||||||||
| Allowance for loan losses to total net loans |
1.94% | 1.73% | 2.17% | 2.37% | 2.61% | |||||||||||||||
| Allowance for loan losses to nonaccrual loans |
26.35% | 29.40% | 160.4% | 83.6% | 65.8% |
| (1) | Exclude certain securities accounted for on a cash basis of accounting. See note 2 to the consolidated financial statements in this report. |
The table that follows summarizes the change in nonaccrual loans for the periods indicated.
| ($ in thousands) |
|
Year Ended Dec 31, 2009 |
|
|
Quarter Ended Mar 31, 2010 |
|
|
Quarter Ended Jun 30, 2010 |
|
|
Quarter Ended Sep 30, 2010 |
|
|
Quarter Ended Dec 31, 2010 |
|
|
Year Ended Dec 31, 2010 |
| ||||||
| Balance at beginning of period |
$ | 108,610 | $ | 123,877 | $ | 96,248 | $ | 18,927 | $ | 38,560 | $ | 123,877 | ||||||||||||
| New additions |
80,471 | 26,399 | 16,025 | 30,658 | 14,851 | 87,933 | ||||||||||||||||||
| Sales and principal repayments |
(29,353 | ) | (12,056 | ) | (52,176 | ) | (8 | ) | (385 | ) | (64,625 | ) | ||||||||||||
| Chargeoffs |
(8,103 | ) | (13,979 | ) | (39,155 | ) | (140 | ) | (103 | ) | (53,377 | ) | ||||||||||||
| Transfers to foreclosed real estate |
(27,748 | ) | (27,993 | ) | (2,015 | ) | (10,877 | ) | - | (40,885 | ) | |||||||||||||
| Balance at end of period |
$ | 123,877 | $ | 96,248 | $ | 18,927 | $ | 38,560 | $ | 52,923 | $ | 52,923 |
The table that follows summarizes the change in TDRs for the periods indicated.
| ($ in thousands) |
|
Year Ended Dec 31, 2009 |
|
|
Quarter Ended Mar 31, 2010 |
|
|
Quarter Ended Jun 30, 2010 |
|
|
Quarter Ended Sep 30, 2010 |
|
|
Quarter Ended Dec 31, 2010 |
|
|
Year Ended Dec 31, 2010 |
| ||||||
| Balance at beginning of period |
$ | - | $ | 97,311 | $ | 116,905 | $ | 21,362 | $ | 617 | $ | 97,311 | ||||||||||||
| New additions (reductions) |
99,816 | 20,438 | 7,087 | (20,624 | ) | 3,017 | 9,918 | |||||||||||||||||
| Sales and principal repayments |
(2,505 | ) | (844 | ) | (58,781 | ) | (121 | ) | (2 | ) | (59,748 | ) | ||||||||||||
| Chargeoffs |
- | - | (43,849 | ) | - | - | (43,849 | ) | ||||||||||||||||
| Balance at end of period |
$ | 97,311 | $ | 116,905 | $ | 21,362 | $ | 617 | $ | 3,632 | $ | 3,632 |
11
Table of Contents
The table that follows summarizes nonaccrual loans and TDRs at December 31, 2010 by collateral type and location.
| Property Type ($ in thousands) |
New York | Florida | New Jersey | Ohio | Totals | # of Loans | ||||||||||||||||||
| Retail |
$ 3,017 | $ | 10,834 | $ 500 | $ | 4,712 | $ | 19,063 | 5 | |||||||||||||||
| Office Building |
5,973 | 17,485 | - | - | 23,458 | 4 | ||||||||||||||||||
| Warehouse |
2,614 | - | - | - | 2,614 | 2 | ||||||||||||||||||
| Mixed Use |
3,929 | - | - | - | 3,929 | 2 | ||||||||||||||||||
| Mulitifamily |
2,981 | 2,863 | - | 1,647 | 7,491 | 4 | ||||||||||||||||||
| $ 18,514 | $ | 31,182 | $ 500 | $ | 6,359 | $ | 56,555 | 17 |
The table that follows details foreclosed real estate we own at December 31, 2010.
| Property Type ($ in thousands) |
City | State | Date Acquired | Net Carrying Value | ||||||
| Undeveloped Land |
Hollywood | Florida | Feb 2008 | $ 2,645 | ||||||
| Hotel |
Orlando | Florida | Apr 2009 | 5,820 | ||||||
| Office Building |
Yonkers | New York | Aug 2009 | 2,112 | ||||||
| Multifamily |
Austell | Georgia | Sep 2009 | 3,696 | ||||||
| Undeveloped Land |
Perryville | Maryland | Apr 2010 | 1,914 | ||||||
| Multifamily |
Louisville | Kentucky | Jul 2010 | 7,488 | ||||||
| Multifamily |
Louisville | Kentucky | Jul 2010 | 3,389 | ||||||
| $ 27,064 |
(1) Carrying value is reported net of any valuation allowance that has been recorded due to decreases in the estimated fair value of the property subsequent to the date of foreclosure. The total valuation allowance amounted to $2.7 million at December 31, 2010. See note 6 to the consolidated financial statements in this report for activity in this allowance.
The following tables summarize the changes in foreclosed real estate for the periods indicated.
|
|
Quarter Ended Mar 31, 2010 |
|
|
Quarter Ended Jun 30, 2010 |
|
|
Quarter Ended Sep 30, 2010 |
|
|
Quarter Ended Dec 31, 2010 |
|
|
Year Ended Dec 31, 2010 |
| ||||||||||||||||||||||||||
| ($ in thousands) |
Amount | # | Amount | # | Amount | # | Amount | # | Amount | # | ||||||||||||||||||||||||||||||
| Balance at beginning of period |
$ | 31,866 | 10 | $ | 57,858 | 15 | $ | 34,259 | 8 | $ | 38,792 | 9 | $ | 31,866 | 10 | |||||||||||||||||||||||||
| Transfers from loan portfolio |
27,993 | 5 | 2,015 | 1 | 10,877 | 2 | - | - | 40,885 | 8 | ||||||||||||||||||||||||||||||
| Writedowns after foreclosure |
(2,001 | ) | - | (8,520 | ) | - | (2,984 | ) | - | (2,004 | ) | - | (15,509 | ) | - | |||||||||||||||||||||||||
| Sales |
- | - | (17,094 | ) | (8 | ) | (3,360 | ) | (1 | ) | (9,724 | ) | (2 | ) | (30,178 | ) | (11 | ) | ||||||||||||||||||||||
| Balance at end of period |
$ | 57,858 | 15 | $ | 34,259 | 8 | $ | 38,792 | 9 | $ | 27,064 | 7 | $ | 27,064 | 7 | |||||||||||||||||||||||||
Allowance for Loan Losses
A detailed discussion of the factors that we use in computing the allowance for loan losses can be found in Item 7 under the caption “Critical Accounting Policies” in this report.
The table that follows sets forth information regarding the activity in our allowance for loan losses.
| At December 31, | ||||||||||||||||||||
| ($ in thousands) |
2010 | 2009 | 2008 | 2007 | 2006 | |||||||||||||||
| Allowance at beginning of year (1) |
$ | 32,640 | $ | 28,524 | $ | 21,593 | $ | 17,833 | $ | 15,181 | ||||||||||
| Provision for loan losses charged to expense (3) |
101,463 | 10,865 | 11,158 | 3,760 | 2,652 | |||||||||||||||
| Chargeoffs: (3) |
||||||||||||||||||||
| Commercial real estate |
(59,469 | ) | (3,253 | ) | - | - | - | |||||||||||||
| Residential multifamily |
(34,576 | ) | (1,799 | ) | (2,333 | ) | - | - | ||||||||||||
| Land development and other land loans |
(6,101 | ) | (3,051 | ) | (1,894 | ) | - | - | ||||||||||||
| Total chargeoffs |
(100,146 | ) | (8,103 | ) | (4,227 | ) | - | - | ||||||||||||
| Recoveries |
883 | 1,354 | - | - | - | |||||||||||||||
| Allowance at end of year (1) (2) |
$ | 34,840 | $ | 32,640 | $ | 28,524 | $ | 21,593 | $ | 17,833 | ||||||||||
| Total loans, net of deferred fees |
$ | 1,337,326 | $ | 1,686,164 | $ | 1,705,711 | $ | 1,614,032 | $ | 1,490,653 | ||||||||||
| Average loans outstanding during the year |
$ | 1,489,004 | $ | 1,721,688 | $ | 1,693,749 | $ | 1,601,271 | $ | 1,451,366 | ||||||||||
| Ratio of allowance to net loans receivable |
2.61 | % | 1.94 | % | 1.67 | % | 1.34 | % | 1.20 | % | ||||||||||
| Ratio of net chargeoffs to average loans |
6.67 | % | 0.39 | % | 0.25 | % | - | - | ||||||||||||
| (1) | Nearly all of the allowance for loan losses is allocated to real estate loans. |
| (2) | The total amount at December 31, 2010, 2009 and 2008, included a specific valuation allowance for impaired loans in the amount of $7.2 million, $13.8 million and $8.2 million, respectively. |
| (3) | Includes a $73.4 million provision and $82.2 million of chargeoffs recorded in connection with the bulk sale discussed elsewhere in this report. |
12
Table of Contents
Security Investment Activities
Securities INB purchases are classified as held to maturity and are carried at amortized cost when INB has the intent and ability to hold them to maturity. Historically INB has purchased debt securities that are issued directly by the U.S. government or one of its agencies (FHLB, FNMA, FHLMC or FFCB) with short- to intermediate-maturity terms that have either adjustable rates, predetermined rate increases or fixed rates of interest, and callable features by the issuer. From time to time, INB has selectively purchased corporate securities, consisting of trust-preferred notes. INB’s goal is to maintain a securities portfolio with a short weighted-average life of no more than five years, which allows for the resulting cash flows to either be reinvested in similar securities, used to fund loan commitments, pay off borrowings or fund deposit outflows as needed. INB’s securities portfolio does not contain securities of any issuer with an aggregate book value and aggregate market value in excess of 10% of its stockholders’ equity, excluding those issued by the U.S. government or its agencies.
The investment securities carry market risk (insofar as increases in market interest rates would generally cause a decline in their market value), prepayment risk (insofar as they may be called or repaid before their stated maturity during times of low market interest rates and we may then have to reinvest the funds at a lower interest rate) and credit risk (insofar as they may default, particularly as it relates to our investments in corporate securities). We may from time to time maintain a securities available-for-sale portfolio for securities that we will hold for indefinite periods of time that we may sell in response to changes in interest rates or other factors, including asset/liability management. We have never engaged in trading activities nor own or invest in any collateralized debt obligations, collateralized mortgage obligations, or any preferred or common stock of FNMA or FHLMC.
We also invest in other short-term instruments (including overnight and term federal funds, bank commercial paper and certificates of deposit) to temporarily invest excess cash flow generated from our deposit-gathering activities and operations. Cash and short-term investments at December 31, 2010 amounted to $23.9 million.
The following table summarizes the amortized cost (carrying value), contractual maturities and weighted-average yields of INB’s portfolio of securities held to maturity. The table excludes the Federal Home Loan Bank of New York (FHLB) and the Federal Reserve Bank of New York (FRB) stock investments required to be held by INB in order to be a member of the FHLB and FRB.
|
|
Due One Year or Less |
|
|
Due After One Year to Five Years |
|
|
Due After Five Years to Ten Years |
|
|
Due After Ten Years |
|
Total | ||||||||||||||||||||||||||||
| ($ in thousands) |
|
Carrying Value |
|
|
Avg. Yield |
|
|
Carrying Value |
|
|
Avg. Yield |
|
|
Carrying Value |
|
|
Avg. Yield |
|
|
Carrying Value |
|
|
Avg. Yield |
|
|
Carrying Value |
|
|
Avg. Yield |
| ||||||||||
| At December 31, 2010: U.S. government agencies (1) |
$ | 5,025 | 0.43 | % | $ | 388,852 | 1.51 | % | $ | 209,313 | 1.84 | % | $ | 6,565 | 2.27 | % | $ | 609,755 | 1.63 | % | ||||||||||||||||||||
| Corporate (1) |
- | - | - | - | - | - | 4,580 | 2.02 | 4,580 | 2.02 | ||||||||||||||||||||||||||||||
| $ | 5,025 | 0.43 | % | $ | 388,852 | 1.51 | % | $ | 209,313 | 1.84 | % | $ | 11,145 | 2.15 | % | $ | 614,335 | 1.63 | % | |||||||||||||||||||||
| At December 31, 2009: |
||||||||||||||||||||||||||||||||||||||||
| U.S. government agencies |
$ | 22,077 | 2.77 | % | $ | 440,741 | 2.38 | % | $ | 149,742 | 3.62 | % | $ | 16,524 | 4.24 | % | $ | 629,084 | 2.74 | % | ||||||||||||||||||||
| Corporate |
- | - | - | - | - | - | 5,772 | 1.67 | 5,772 | 1.67 | ||||||||||||||||||||||||||||||
| $ | 22,077 | 2.77 | % | $ | 440,741 | 2.38 | % | $ | 149,742 | 3.62 | % | $ | 22,296 | 3.57 | % | $ | 634,856 | 2.73 | % | |||||||||||||||||||||
| At December 31, 2008: |
||||||||||||||||||||||||||||||||||||||||
| U.S. government agencies |
$ | 15,773 | 3.41 | % | $ | 356,804 | 3.53 | % | $ | 82,991 | 4.73 | % | $ | 11,982 | 4.97 | % | $ | 467,550 | 3.77 | % | ||||||||||||||||||||
| Corporate |
- | - | - | - | - | - | 8,031 | 5.32 | 8,031 | 5.32 | ||||||||||||||||||||||||||||||
| $ | 15,773 | 3.41 | % | $ | 356,804 | 3.53 | % | $ | 82,991 | 4.73 | % | $ | 20,013 | 5.11 | % | $ | 475,581 | 3.80 | % | |||||||||||||||||||||
| At December 31, 2007: |
||||||||||||||||||||||||||||||||||||||||
| U.S. government agencies |
$ | 73,952 | 5.01 | % | $ | 183,984 | 4.90 | % | $ | 74,150 | 5.17 | % | $ | 3,988 | 4.98 | % | $ | 336,074 | 4.99 | % | ||||||||||||||||||||
| Corporate |
- | - | - | - | - | - | 8,031 | 5.78 | 8,031 | 5.78 | ||||||||||||||||||||||||||||||
| $ | 73,952 | 5.01 | % | $ | 183,984 | 4.90 | % | $ | 74,150 | 5.17 | % | $ | 12,019 | 5.52 | % | $ | 344,105 | 5.01 | % | |||||||||||||||||||||
| At December 31, 2006: |
||||||||||||||||||||||||||||||||||||||||
| U.S. government agencies |
$ | 112,454 | 4.11 | % | $ | 284,555 | 5.17 | % | $ | 996 | 5.02 | % | $ | - | - | % | $ | 398,005 | 4.87 | % | ||||||||||||||||||||
| Corporate |
- | - | - | - | - | - | 6,010 | 5.62 | 6,010 | 5.62 | ||||||||||||||||||||||||||||||
| $ | 112,454 | 4.11 | % | $ | 284,555 | 5.17 | % | $ | 996 | 5.02 | % | $ | 6,010 | 5.62 | % | $ | 404,015 | 4.88 | % | |||||||||||||||||||||
(1) See note 2 to the consolidated financial statements in this report for further information regarding market values and impairment.
13
Table of Contents
Sources of Funds
Our primary sources of funds consist of the following: retail deposits obtained through INB’s branch offices and the mail; principal repayments of loans; maturities and calls of securities; borrowings through FHLB advances or the federal funds market; brokered deposits; and cash flow provided by operating activities. For additional detail concerning our actual cash flows, see the consolidated statements of cash flows included in this report.
INB’s deposit accounts are solicited from individuals, small businesses and professional firms located throughout INB’s primary market areas through the offering of a variety of deposit products. INB also uses its internet web site www.intervestnatbank.com to attract deposit customers from both within and outside its primary market areas. INB believes it does not have a concentration of deposits from any one source. INB’s deposit products include the following: certificates of deposit (including denominations of $100,000 or more); individual retirement accounts (IRAs); checking and other demand deposit accounts; negotiable order of withdrawal (NOW) accounts; savings accounts; and money market accounts. Interest rates offered by INB on deposit accounts are normally competitive with those in INB’s principal market areas. The determination of rates and terms on deposit accounts also take into account INB’s liquidity requirements, outstanding loan commitments, desired capital levels and government regulations. Maturity terms, service fees and withdrawal penalties on deposit products are reviewed and established by INB on a periodic basis. INB also offers internet banking services, ATM services with access to local, state and national networks, wire transfers, automated clearing house (ACH) transfers, direct deposit of payroll and social security checks and automated drafts for various accounts. In addition, INB offers safe deposit boxes to its customers in Florida. INB periodically reviews the scope of the banking products and services it offers consistent with market opportunities and its available resources.
INB relies heavily on certificates of deposit (time deposits) as its main source of funds. Consolidated deposits amounted to $1.77 billion at December 31, 2010 and time deposits represented 74% or $1.30 billion of those deposits. Time deposits of $100,000 or more at December 31, 2010 totaled $639 million and included $159 million of brokered deposits. Brokered deposits had a weighted average remaining term and stated interest rate of 2.4 years and 4.96%, respectively, at December 31, 2010 and $31 million of those deposits mature by December 31, 2011. See the section “Supervision and Regulation” for a discussion on restrictions that have been placed on INB with respect to the pricing of its deposit products and accepting and rolling over maturing brokered deposits.
Time deposits are the only deposit accounts offered by INB that have stated maturity dates. These deposits are generally considered to be rate sensitive and have a higher cost than deposits with no stated maturities, such as checking, savings and money market accounts. At December 31, 2010, $432 million, or 33%, of INB’s total time deposits (inclusive of brokered deposits) mature by December 31, 2011. INB expects to retain or replace a significant portion of its non-brokered deposits maturing over the next twelve months.
The following table sets forth the distribution of deposit accounts by type.
| At December 31, | ||||||||||||||||||||||||||||||||||||||||
| 2010 | 2009 | 2008 | 2007 | 2006 | ||||||||||||||||||||||||||||||||||||
| ($ in thousands) |
Amount | |
% of Total |
|
Amount | |
% of Total |
|
Amount | |
% of Total |
|
Amount | |
% of Total |
|
Amount | |
% of Total |
| ||||||||||||||||||||
| Demand |
$ | 4,149 | 0.2 | % | $ | 3,429 | 0.2 | % | $ | 3,275 | 0.2 | % | $ | 4,303 | 0.3 | % | $ | 4,849 | 0.3 | % | ||||||||||||||||||||
| Interest checking |
10,126 | 0.6 | 9,117 | 0.4 | 4,512 | 0.2 | 5,668 | 0.3 | 12,934 | 0.8 | ||||||||||||||||||||||||||||||
| Savings |
10,123 | 0.6 | 11,682 | 0.6 | 8,262 | 0.5 | 8,399 | 0.5 | 10,684 | 0.7 | ||||||||||||||||||||||||||||||
| Money Market |
436,740 | 24.7 | 496,065 | 24.4 | 328,660 | 17.6 | 235,804 | 14.2 | 224,673 | 14.1 | ||||||||||||||||||||||||||||||
| Certificates of deposit |
1,304,945 | 73.9 | 1,509,691 | 74.4 | 1,519,426 | 81.5 | 1,405,000 | 84.7 | 1,335,394 | 84.1 | ||||||||||||||||||||||||||||||
| $ | 1,766,083 | 100.0 | % | $ | 2,029,984 | 100.0 | % | $ | 1,864,135 | 100.0 | % | $ | 1,659,174 | 100.0 | % | $ | 1,588,534 | 100.0 | % | |||||||||||||||||||||
At December 31, 2010, 2009, 2008, 2007 and 2006, individual retirement account deposits totaled $260 million, $289 million, $278 million, $236 million and $219 million, respectively, nearly all of which were certificates of deposit.
The following table sets forth total deposits by offices in New York and Florida.
| At December 31, | ||||||||||||||||||||
| ($ in thousands) |
2010 | 2009 | 2008 | 2007 | 2006 | |||||||||||||||
| New York Main Office |
$ | 824,306 | $ | 990,777 | $ | 964,117 | $ | 933,403 | $ | 875,474 | ||||||||||
| Florida Offices (six offices) |
941,777 | 1,039,207 | 900,018 | 725,771 | 713,060 | |||||||||||||||
| $ | 1,766,083 | $ | 2,029,984 | $ | 1,864,135 | $ | 1,659,174 | $ | 1,588,534 | |||||||||||
14
Table of Contents
The following table sets forth certificate of deposits by remaining maturity.
| At December 31, | ||||||||||||||||||||||||||||||||||||||||
| 2010 | 2009 | 2008 | 2007 | 2006 | ||||||||||||||||||||||||||||||||||||
| ($ in thousands) |
Amount |
|
Wtd- Avg Stated |
|
|
Amount |
|
|
Wtd- Avg Stated |
|
|
Amount |
|
|
Wtd- Avg Stated |
|
|
Amount |
|
|
Wtd- Avg Stated |
|
|
Amount |
|
|
Wtd- Avg Stated |
| ||||||||||||
| Within one year |
$ | 431,881 | 3.09 | % | $ | 591,746 | 3.63 | % | $ | 571,085 | 4.27 | % | $ | 495,002 | 4.82 | % | $ | 630,454 | 4.77 | % | ||||||||||||||||||||
| Over one to two years |
349,174 | 3.63 | 256,025 | 4.28 | 333,041 | 4.62 | 296,318 | 4.74 | 193,993 | 4.49 | ||||||||||||||||||||||||||||||
| Over two to three years |
298,287 | 4.26 | 241,217 | 4.45 | 171,647 | 5.08 | 233,248 | 4.81 | 204,636 | 4.59 | ||||||||||||||||||||||||||||||
| Over three to four years |
113,587 | 3.78 | 251,745 | 4.61 | 168,814 | 5.09 | 129,949 | 5.27 | 178,767 | 4.71 | ||||||||||||||||||||||||||||||
| Over four years |
112,016 | 4.13 | 168,958 | 4.31 | 274,839 | 5.05 | 250,483 | 5.16 | 127,544 | 5.36 | ||||||||||||||||||||||||||||||
| $ | 1,304,945 | 3.65 | % | $ | 1,509,691 | 4.11 | % | $ | 1,519,426 | 4.67 | % | $ | 1,405,000 | 4.90 | % | $ | 1,335,394 | 4.75 | % | |||||||||||||||||||||
The following table sets forth net deposit flows.
| For the Year Ended December 31, | ||||||||||||||||||||
| ($ in thousands) |
2010 | 2009 | 2008 | 2007 | 2006 | |||||||||||||||
| Net increase (decrease) before interest credited |
$ | (324,496 | ) | $ | 89,654 | $ | 124,487 | $ | (5,460 | ) | $ | 148,600 | ||||||||
| Net interest credited |
60,595 | 76,195 | 80,474 | 76,100 | 64,604 | |||||||||||||||
| Net deposit (decrease) increase |
$ | (263,901 | ) | $ | 165,849 | $ | 204,961 | $ | 70,640 | $ | 213,204 | |||||||||
The following table sets forth the remaining maturities of certificates of deposit of $100,000 or more.
| At December 31, | ||||||||||||||||||||
| ($ in thousands) | 2010 | 2009 | 2008 | 2007 | 2006 | |||||||||||||||
| Due within three months or less |
$ 62,432 | $ 87,778 | $ 78,458 | $ 52,540 | $ 60,534 | |||||||||||||||
| Due over three months to six months |
24,354 | 47,607 | 36,436 | 31,128 | 69,121 | |||||||||||||||
| Due over six months to one year |
91,977 | 78,441 | 89,549 | 75,284 | 111,387 | |||||||||||||||
| Due over one year |
460,167 | 478,804 | 458,458 | 427,106 | 249,840 | |||||||||||||||
| Total (1) |
$638,930 | $692,630 | $662,901 | $586,058 | $490,882 | |||||||||||||||
| As a percentage of total deposits |
36% | 34% | 36% | 35% | 31% | |||||||||||||||
| (1) Includes brokered CDs as follows: |
$159,149 | $170,117 | $173,012 | $165,865 | $ 55,652 | |||||||||||||||
INB also borrows funds from time to time on an overnight or short-term basis to manage its liquidity needs. INB has agreements with correspondent banks whereby it could borrow as of December 31, 2010 up to $38 million on an unsecured basis. In addition, as a member of the FHLB and FRB, INB can also borrow from these institutions on a secured basis. At December 31, 2010, INB had available collateral consisting of investment securities and certain loans to support additional total borrowings of approximately $650 million from the FHLB and FRB if needed.
The following is a summary of certain information regarding INB’s borrowings in the aggregate.
| For the Year Ended December 31, | ||||||||||||||||||||
| ($ in thousands) |
2010 | 2009 | 2008 | 2007 | 2006 | |||||||||||||||
| Balance at year end |
$ | 25,500 | $ | 61,500 | $ | 50,500 | $ | - | $ | 25,000 | ||||||||||
| Maximum amount outstanding at any month end |
$ | 55,500 | $ | 61,500 | $ | 95,200 | $ | 49,000 | $ | 46,200 | ||||||||||
| Average outstanding balance for the year |
$ | 40,171 | $ | 51,042 | $ | 33,897 | $ | 16,908 | $ | 10,215 | ||||||||||
| Weighted-average interest rate paid for the year |
3.85 | % | 3.82 | % | 3.07 | % | 5.44 | % | 5.32 | % | ||||||||||
| Weighted-average interest rate at year end |
4.02 | % | 3.18 | % | 3.81 | % | - | % | 5.44 | % | ||||||||||
IBC’s historical sources of funds to meet its obligations have been derived from the following: interest income from short-term investments; monthly dividends from INB; and monthly management fees from its subsidiaries for providing them with certain administrative services. IBC’s historical sources of working capital have been derived from the issuance of its common stock through public or private offerings, exercise of its common stock warrants/options, the issuance of its trust preferred securities and preferred stock and the issuance of its subordinated debentures to the public. During 2010, IBC raised a total of $25 million of new capital in two separate transactions. For a further discussion of the new capital as well as regulatory limitations placed on IBC with respect to paying dividends, interest payments and incurring new debt, see the section “Supervision and Regulation” and notes 11 and 20 to the consolidated financial statements in this report.
15
Table of Contents
The following table summarizes IBC’s debentures and related accrued interest payable outstanding:
| At December 31, | ||||||||||||||||||||
| ($ in thousands) |
2010 | 2009 | 2008 | 2007 | 2006 | |||||||||||||||
| Subordinated debentures |
$ | - | $ | - | $ | - | $ | - | $ | 1,250 | ||||||||||
| Subordinated debentures – convertible into Class A common stock |
- | - | - | - | 1,710 | |||||||||||||||
| Subordinated debentures – trust preferred securities (1) |
56,702 | 56,702 | 56,702 | 56,702 | 56,702 | |||||||||||||||
| Accrued interest payable – debentures (1) |
2,262 | 85 | 122 | 137 | 1,396 | |||||||||||||||
| $ | 58,964 | $ | 56,787 | $ | 56,824 | $ | 56,839 | $ | 61,058 | |||||||||||
| Weighted average interest rate for the year |
3.79% | 4.78% | 6.16% | 6.30% | 7.13% | |||||||||||||||
(1) See note 10 to the consolidated financial statements in this report for a further discussion.
Employees
At December 31, 2010, we employed 73 full-time equivalent employees. We provide various benefits to our employees, including group life, health, dental and disability insurance, a 401(k) retirement plan and a long-term employee incentive plan. None of our employees are covered by a collective bargaining agreement and we consider our employee relations to be satisfactory.
Federal and State Taxation
IBC and its subsidiaries file a consolidated federal income tax return and combined state and city income tax returns in New York. IBC also files a franchise tax return in Delaware. INB files a state income tax return in Florida. All the returns are filed on a calendar year basis. Consolidated income tax returns have the effect of eliminating intercompany income and expense, including dividends, from the computation of consolidated taxable income for the taxable year in which the items occur. In accordance with an income tax sharing agreement, income tax charges or credits are allocated among IBC and its subsidiaries on the basis of their respective taxable income or taxable loss that is included in the consolidated income tax return.
Banks and bank holding companies are subject to federal and state income taxes in essentially the same manner as other corporations. Florida, New York State and New York City taxable income is calculated under applicable sections of the Internal Revenue Code of 1986, as amended (the “Code”), with some modifications required by state and city law. Although INB’s federal income tax liability is determined under provisions of the Code, which is applicable to all taxpayers, Sections 581 through 597 of the Code apply specifically to financial institutions.
As a Delaware corporation not earning income in Delaware, IBC is exempt from Delaware corporate income tax but is required to file an annual report with and pay an annual franchise tax to the State of Delaware. The tax is imposed as a percentage of the capital base of IBC and is reported in the line item “All other” in the noninterest expense section of the consolidated statement of earnings. Total franchise tax expense in 2010, 2009 and 2008 was approximately $0.1 million in each year.
See note 15 to the consolidated financial statements and the section “Critical Accounting Policies” in this report for a further discussion of income taxes and our deferred tax asset.
Investment in Subsidiaries
The following table provides information regarding IBC’s subsidiaries:
| At December 31, 2010 | Subsidiary’s (Loss) Earnings For The Period: | |||||||||||||||||||||||||||||||
| % of | For the Year Ended December 31, | |||||||||||||||||||||||||||||||
| Voting | ||||||||||||||||||||||||||||||||
| ($ in thousands) |
|
Stock Owned by IBC |
|
|
Total Investment By IBC |
|
|
IBC’s Equity in Underlying Net Assets |
|
2010 | 2009 | 2008 | 2007 | 2006 | ||||||||||||||||||
| Interevst National Bank |
100 | % | $227,098 | $227,098 | $(50,242) | $5,722 | $8,256 | $20,306 | $22,969 | |||||||||||||||||||||||
| Intervest Mortgage Corporation |
100 | % | 8,696 | 8,696 | (1,572) | (1,098) | 831 | 890 | 3,126 | |||||||||||||||||||||||
| Intervest Statutory Trusts |
100 | % | 1,702 | 1,702 | - | - | - | - | - | |||||||||||||||||||||||
16
Table of Contents
Supervision and Regulation
The supervision and regulation of banks or bank holding companies and their subsidiaries is intended primarily for the protection of depositors, the FDIC deposit insurance fund and the banking system as a whole, and not for the protection of our stockholders or creditors. The regulatory agencies have broad enforcement power, including the power to impose substantial fines and other penalties for violations of laws and regulations. To the extent that the following information describes statutory and regulatory provisions and formal agreements, it is qualified in its entirety by reference to the particular statutory or regulatory provision or formal agreement. Any changes in the aforementioned may have a material effect on our business, results of operations and financial condition.
Bank Holding Company Regulation
IBC is a holding company under the Bank Holding Company Act of 1956 (BHCA) and is subject to supervision, regulation and examination by the Board of Governors of the Federal Reserve System (FRB). The BHCA and other federal laws subject bank holding companies to particular restrictions on the types of activities in which they may engage and to a broad range of supervisory requirements and activities, including regulatory enforcement actions for violations of laws and regulations.
Scope of Permissible Activities. A bank holding company generally may not engage in, or acquire or control, directly or indirectly, voting securities or assets of any company that is engaged in activities other than those of banking, managing or controlling banks. Additionally, the Gramm-Leach Bliley Financial Services Modernization Act of 1999 (Modernization Act), permits bank holding companies to become financial holding companies and thereby engage in, or acquire shares of any company engaged in, activities that are financial in nature or incidental to financial activities. Such activities include securities underwriting, dealings in or making a market in securities and insurance underwriting and agency activities. A bank holding company may elect to become a financial holding company under the Modernization Act if meets certain requirements. The FRB also serves as the “umbrella” regulator for financial holding companies and has the power to examine new activities, regulate and supervise activities that are financial in nature or determined to be incidental to such financial activities.
Source of Strength for Subsidiaries. A bank holding company must serve as a source of financial and managerial strength for its subsidiary banks and must not conduct its operations in an unsafe or unsound manner. If the FRB believes that an activity of a bank holding company or control of a nonbank subsidiary constitutes a serious risk to the financial safety, soundness or stability of a subsidiary bank or the bank holding company and is inconsistent with sound banking practices, the FRB may require that the bank holding company terminate the activity or terminate its control of the subsidiary engaging in that activity. See the section “Written Agreement” below.
Mergers and Acquisitions by Bank Holding Companies. Subject to certain exceptions, a bank holding company is required to obtain the prior approval of the FRB before it may merge or consolidate with another bank holding company, acquire all or substantially all of the assets of any bank, or, direct or indirect, ownership or control of any voting securities of any bank or bank holding company, if after such acquisition the bank holding company would control, directly or indirectly, more than 5% of the voting securities of such bank or bank holding company. In approving bank acquisitions by bank holding companies, the FRB is required to consider the financial and managerial resources and future prospects of the bank holding company and the banks concerned, the convenience and needs of the communities to be served, and various competitive factors.
Anti-Tying Restrictions. Subject to certain exceptions, a bank holding company and its subsidiaries are prohibited from engaging in certain tying arrangements in connection with any extension of credit, lease or sale of property or furnishing of services.
Capital Adequacy. The FRB has capital adequacy guidelines for bank holding companies that are based upon a risk-based capital determination, whereby a bank holding company’s capital adequacy is determined by assigning different categories of assets and off-balance sheet items to broad risk categories. The guidelines divide the qualifying total capital of a bank holding company into Tier 1 capital (core capital elements), Tier 2 capital (supplementary capital elements) and Tier 3 capital (market risk capital elements). Tier 1 capital consists primarily of, subject to certain limitations, common stock, noncumulative perpetual preferred stock, minority interests in consolidated subsidiaries and qualifying trust preferred securities.
17
Table of Contents
Goodwill and certain other intangibles are excluded from Tier 1 capital. Tier 2 capital may consist of, subject to certain limitations, an amount equal to the allowance for loan and lease losses, limited other types of preferred stock not included in Tier 1 capital, hybrid capital instruments and term subordinated debt. Tier 3 capital includes qualifying unsecured subordinated debt. The Tier 1 capital must comprise at least 50% of the qualifying total capital categories. Every bank holding company has to achieve and maintain a minimum Tier 1 capital ratio of at least 4% and a minimum total capital ratio of at least 8% of risk-weighted assets. In addition, bank holding companies are required to maintain a minimum ratio of Tier 1 capital to average total consolidated assets (leverage capital ratio) of at least 3% for strong banks and bank holding companies and a minimum leverage ratio of at least 4% for all other bank holding companies. At December 31 2010, IBC’s Tier 1 capital and total capital ratios were 13.56% and 14.83%, respectively, and its leverage capital ratio was 10.06%.
Dividends. IBC’s ability to pay cash dividends on its capital stock is dependent upon its level of cash on hand and upon the cash dividends received from INB. IBC must first pay its operating and interest expenses from funds it receives from its subsidiaries. As a result, stockholders may receive cash dividends from IBC only to the extent that funds are available after payment of the aforementioned expenses. In addition, the FRB generally prohibits a bank holding company from paying cash dividends except out of its net income, provided that the prospective rate of earnings retention appears consistent with the bank holding company’s capital needs, asset quality and overall financial condition. In February 2010, the FRB, informed IBC that it may not, without the prior approval of the FRB, pay dividends on or redeem its capital stock, pay interest on or redeem its trust preferred securities, or incur new debt. See the section “Written Agreement” below.
Control Acquisitions. The Bank Control Act prohibits a person or group of persons from acquiring “control” of a bank holding company unless the FRB has been notified and has not objected to the transaction. Under a rebuttable presumption established by the FRB, the acquisition of 10% or more of a class of voting securities of a bank holding company with a class of securities registered under Section 12 of the Exchange Act, such as us, would, under the circumstances set forth in the presumption, constitute acquisition of control of such company. In addition, any entity is required to obtain the approval of the FRB before acquiring 25% (5% in the case of an acquirer that is a bank holding company) or more of our outstanding voting securities.
Enforcement Authority. The FRB may impose civil or criminal penalties or may institute a cease-and-desist proceeding for the violation of applicable laws and regulations. IBC is also under the jurisdiction of the Securities and Exchange Commission (SEC) and various state securities commissions for matters related to the offering and sale of its securities, and is subject to the SEC rules and regulations relating to periodic reporting, reporting to shareholders, proxy solicitation and insider trading. IBC’s Class A common stock is listed on the Nasdaq Global Select Market and, as a result, IBC is also subject to the rules of Nasdaq for listed companies.
Written Agreement. In January 2011, IBC entered into a written agreement (the “Federal Reserve Agreement”) with the FRB which requires IBC’s Board of Directors to take the steps necessary to utilize IBC’s financial and managerial resources to serve as a source of strength to INB, including causing INB to comply with its Formal Agreement. In addition, IBC cannot declare or pay dividends without the prior approval of the FRB and the Director of the Division of Banking Supervision and Regulation of the Board of Governors (the “Banking Director”). IBC also cannot take any payments representing a reduction in capital from INB without prior approval of the FRB and IBC cannot not make any distributions of interest, principal or other sums on its subordinated debentures or trust preferred securities without prior approval from the FRB and the Banking Director. Further, IBC may not incur, increase or guarantee any debt or purchase or redeem any shares of its stock without prior approval of the FRB. IBC is also required within 90 days of the date of the Federal Reserve Agreement to submit a plan to continue to maintain sufficient capital. Finally, IBC must notify the FRB when appointing any new director or senior executive officer or changing responsibilities of any senior executive officer, and IBC is also restricted in making certain severance and indemnification payments. We are committed to taking all necessary actions to promptly address the requirements of the Federal Reserve Agreement.
18
Table of Contents
Other Legislation. The Emergency Economic Stabilization Act of 2008 (EESA) provided for the Troubled Asset Relief Program (TARP) to be signed into law. TARP gave the United States Treasury Department (Treasury) authority to deploy up to $750 billion into the financial system with an objective of improving liquidity in capital markets. In October 2008, Treasury announced plans to direct $250 billion of this authority into preferred stock investments in banks. On December 23, 2008, IBC voluntarily applied for and was approved to participate in the above program and sold to the Treasury 25,000 shares of its Series A Fixed Rate Cumulative Perpetual Preferred Stock, with a liquidation preference of $1,000 per share, along with a ten year warrant to purchase at any time up to 691,882 shares of IBC’s Class A common stock for $5.42 per share, for a total cash investment of $25 million from the Treasury. The American Recovery and Reinvestment Act of 2009 allows a participating institution to repay its TARP investment subject to approval of the institution’s primary regulator. See note 11 to the consolidated financial statements in this report for a further discussion of the above transaction and other regulatory requirements and restrictions imposed by TARP.
Bank Regulation
INB is a nationally chartered bank that is subject to the regulation and examination by the Office of the Comptroller of the Currency (OCC), its primary regulator, and by virtue of the insurance of INB’s deposits, it is also subject to the supervision and regulation of the FDIC. Because INB is a member of the Federal Reserve System, it is subject to regulation pursuant to the Federal Reserve Act. In addition, because the FRB regulates IBC, as described above, the FRB also has supervisory authority, which directly affects INB. The FDIC and other federal banking agencies have broad enforcement powers, including, but not limited to, the power to terminate deposit insurance and impose substantial fines and other civil and criminal penalties.
Transactions with Affiliates. Under Section 23A and 23B of the Federal Reserve Act, subject to certain exemptions, INB may engage in a transaction with an affiliate, as such term is defined therein, only if the aggregate amount of the transactions with one affiliate or with all affiliates does not exceed 10% or 20%, respectively, of the capital stock and surplus of INB. INB is also generally prohibited from purchasing a low-quality asset from an affiliate. Any transaction between INB and an affiliate must be on terms and conditions that are consistent with safe and sound banking practices. Additionally, transactions with affiliates, can only be made on terms and under circumstances, including credit standards, that are substantially the same, or at least as favorable to INB, as those prevailing at the time for comparable transactions with nonaffiliated companies, or, in the absence of comparable transactions, on terms and under circumstances, including credit standards, that in good faith would be offered to nonaffiliated companies.
Loans to One Borrower. INB generally may not make loans or extend credit to a single or related group of borrowers in excess of 15% of unimpaired capital and surplus. An additional amount may be loaned, up to 10% of unimpaired capital and surplus, if the loan is secured by readily marketable collateral, which generally does not include real estate. As of December 31, 2010, INB was in compliance with the loans-to-one-borrower limitations.
Loans to Insiders. INB is prohibited from extending credit to its executive officers, directors, principal shareholders and their related interests, collectively referred to as “insiders,” unless the extension of credit is made on substantially the same terms and in accordance with underwriting procedures that are not less stringent than those prevailing at the time for comparable transactions with unrelated persons. INB as a matter of policy does not extended such credit and there were no such loans outstanding at December 31, 2010.
Reserve Requirements. Pursuant to Regulation D, INB must hold a percentage of certain types of deposits as reserves in the form of vault cash, as a deposit in a Federal Reserve Bank or as a deposit in a pass-through account at a correspondent institution.
Dividends. When INB pays cash dividends on its capital stock its pays them to IBC since IBC is the sole shareholder of INB. INB’s dividend policy is to pay dividends at levels consistent with maintaining its desired liquidity and capital ratios and debt servicing obligations. INB’s board of directors may declare dividends to be paid out of INB’s undivided profits. No dividends may be paid by INB without the OCC’s approval if the total amount of all dividends, including the proposed dividend, declared by INB in any calendar year exceeds INB’s total retained net income for that year, combined with its retained net income of the preceding two years.
19
Table of Contents
Also, INB may not declare or pay any dividends if, after making the dividend, INB would be “undercapitalized” and no dividend may be paid by INB if it is in default of any deposit insurance assessment due to the FDIC. In January 2010, INB suspended its cash dividend payments to IBC in order to preserve its capital. See the section “Formal Agreement” below.
Capital Adequacy. In general, capital adequacy regulations for national banks such as INB, are similar to the FRB guidelines discussed earlier. Under the OCC’s regulations and guidelines, all banks must maintain minimum ratios of capital as follows: Tier 1 capital to total average assets (leverage ratio) - 4%; Tier 1 capital to risk-weighted assets - 4%; and total capital to risk-weighted assets - 8%. In April 2009, INB agreed with the OCC to maintain its minimum capital ratios at specified levels higher than those otherwise required by applicable regulations as follows: Tier 1 capital to total average assets (leverage ratio) - 9%; Tier 1 capital to risk-weighted assets - 10%; and total capital to risk-weighted assets - 12%. At December 31, 2010, INB’s Tier 1 capital and total capital ratios were 12.96% and 14.22%, respectively, and its leverage capital ratio was 9.61%. See the section “Formal Agreement” below.
Prompt Corrective Action. Federal banking agencies have the authority to take “prompt corrective action” with respect to depository institutions that do not meet minimum capital requirements. Applicable regulations divide banks into five different categories, depending on their level of capital: (i) a well-capitalized bank; (ii) an adequately capitalized bank; (iii) an undercapitalized bank; (iv) a significantly undercapitalized bank; and (v) a critically undercapitalized bank.
A bank is deemed to be “well-capitalized” if it has a total risk-based capital ratio of 10% or more, a Tier 1 risk-based capital ratio of 6% or more and a leverage ratio of 5% or more, and if the bank is not subject to an order or capital directive to meet and maintain a specific capital level. A bank is deemed to be “adequately capitalized” if it has a total risk-based capital ratio of 8% or more, a Tier 1 risk-based capital ratio of 4% or more and a leverage ratio of 4% or more (unless the bank is rated 1 in its most recent examination, in which instance it must maintain a leverage ratio of 3% or more) and does not meet the definition of a well-capitalized bank. A bank is deemed to be “undercapitalized” if it has a total risk-based capital ratio of less than 8%, a Tier 1 risk-based capital ratio of less than 4%, or a leverage ratio of less than 4%. A bank is deemed to be “significantly undercapitalized” if it has a total risk-based capital ratio of less than 6%, a Tier 1 risk-based capital ratio of less than 3% or a leverage ratio of less than 3%. A bank is deemed to be “critically undercapitalized” if it has a ratio of tangible equity to total tangible assets that is equal to or less than 2%. In addition, the OCC may reclassify a well-capitalized bank as adequately capitalized and may require an adequately capitalized or an undercapitalized bank to comply with certain supervisory actions, if the OCC has determined that the bank is in unsafe or unsound condition or that the bank has not corrected a less-than-satisfactory rating for any of the categories of asset quality, management, earnings or liquidity.
A bank’s capital category is determined solely for the purpose of applying prompt corrective action regulations and the capital category may not constitute an accurate representation of a bank’s overall financial condition or prospects for other purposes. If a bank is classified as undercapitalized, significantly undercapitalized or critically undercapitalized, it is required to submit a capital restoration plan to the OCC and becomes subject to certain requirements restricting the bank’s payment of capital distributions, management fees and compensation of senior executive officers of the bank, requiring that the OCC monitor the condition of the bank, restricting the growth of the bank’s assets, requiring prior approval of certain expansion proposals and restricting the activities of the bank.
Formal Agreement. In December 2010, INB entered into a formal written agreement (the “Formal Agreement”) with the OCC. The Formal Agreement superseded and replaced a Memorandum of Understanding (“MOU”) entered into on April 7, 2009 between INB and the OCC. The Formal Agreement requires INB to take certain actions, including the development of strategic and capital plans covering at least three years, completing a management assessment, and developing programs related to: loan portfolio management; criticized assets; credit concentrations; loan review; accounting for other real estate owned; maintaining an adequate allowance for loan losses; liquidity risk management; and interest rate risk. INB is required and is submitting periodic progress reports to the OCC regarding various aspects of the foregoing actions. INB’s Board of Directors appointed a compliance committee to monitor and coordinate INB’s performance under the Formal Agreement.
20
Table of Contents
The Formal Agreement also limits INB’s ability to pay dividends to IBC and requires INB to maintain Tier 1 capital at least equal to 9% of adjusted total assets, Tier 1 capital at least equal to 10% of risk-weighted assets; and total risk-based capital at least equal to 12% of risk-weighted assets. These are the same levels that INB agreed to maintain beginning April 7, 2009. We are aggressively working to address the Formal Agreement and to date have enhanced various procedures and policies and are developing or have developed formal action plans to comply with all of the requirements of the Formal Agreement. All of our actions will be subject to the on-going review, satisfaction and approval of the OCC.
Interest Rate and Brokered Deposit Restrictions. Financial institutions that are less than well capitalized are barred from paying interest on their deposit products at rates of interest in excess of 75 basis points above the national rate unless it receives an exemption from the FDIC that the institution’s local market rate is above the national rate. In addition, they cannot accept, renew or rollover brokered deposits without approval from their primary regulator.
As a result of INB’s Formal Agreement with the OCC, INB is not allowed to accept, renew or rollover brokered deposits without the prior approval of the OCC and it is also required, in the absence of a waiver from the FDIC (based on a determination by the FDIC that INB operates in high cost deposit markets) to maintain its deposit pricing at or below the national rates published by the FDIC, plus 75 basis points. At December 31, 2010, INB had total brokered deposits of $159 million, of which $31 million (20%) mature by December 31, 2011. At December 31, 2010, all of the rates offered on INB’s deposit products were at levels at or below the FDIC national rates plus 75 basis points. The FDIC’s national rate is a simple average of rates paid by U.S. depository institutions as calculated by the FDIC. These restrictions could have a material adverse effect on INB’s business and ability to generate and retain deposits.
Deposit Insurance Assessments. INB’s deposits are insured up to applicable limits through the FDIC’s Deposit Insurance Fund (DIF) generally up to a maximum of $250,000 per separately insured depositor. Insured institutions are required to pay insurance premiums based on the risk each institution poses to DIF. Currently, annual assessment rate ranges from $0.05 to $0.43 per $100 of insured deposits, based on the institution’s relative risk to the DIF, as measured by the institution’s regulatory capital position and other supervisory factors. The FDIC also has the authority to raise or lower assessment rates on insured deposits, subject to limits, and to impose special additional assessments. The FDIC can terminate a depository institution’s deposit insurance if it finds that the institution is being operated in an unsafe and unsound manner or has violated any rule, regulation, order or condition administered by the institution’s regulatory authorities. Any termination of deposit insurance would have a material adverse effect on INB. INB also participates in the FDIC’s Transaction Account Guarantee Program which provides, for a fee, full FDIC insurance coverage for non interest-bearing transaction accounts and qualifying NOW accounts, regardless of the dollar amount, and is in addition to the standard FDIC insurance of $250,000 per depositor.
In February 2009, the FDIC substantially increased assessment rates as of the second quarter of 2009. In May 2009, the FDIC imposed a 5 basis point special assessment on each institution’s assets (excluding Tier 1 capital) as reported as of June 30, 2009, up to a maximum special assessment amount of one tenth of one percent of the institution’s assessment base for the second quarter 2009 risk-based assessment. INB paid a special assessment of $1.1 million. On December 31, 2009, insured depository institutions were required to prepay their estimated quarterly risk-based assessments for the fourth quarter of 2009 and for all of 2010, 2011 and 2012, together with their quarterly risk-based assessment for the third quarter of 2009. INB paid a total of $18.0 million on December 31, 2009 of which $15.8 million related to 2010 through 2012. The amount was recorded as a prepaid asset and is being charged to expense during the periods to which it relates.
In October 2010, the FDIC adopted a new Restoration Plan to ensure that the DIF reserve ratio reaches 1.35% by September 30, 2020, as required by the Federal Deposit Insurance Reform Act of 2005 (“Reform Act”). Among other things, the Restoration Plan provides that the FDIC will forego the uniform three basis point increase in initial assessment rates that was previously scheduled to take effect on January 1, 2011 and will maintain the current assessment rate schedule for all insured depository institutions until the reserve ratio reaches 1.15%.
21
Table of Contents
The FDIC intends further rulemaking in 2011 regarding the requirement under the Reform Act that the FDIC offset the effect on institutions with less than $10 billion in assets (such as INB) of the requirement that the reserve ratio reach 1.35% by September 30, 2020, rather than 1.15% by the end of 2016 (as required under the prior restoration plan), so that more of the cost of raising the reserve ratio to 1.35% will be borne by institutions with more than $10 billion in assets. The Dodd-Frank Act discussed later in this section also broadens the base for FDIC insurance assessments. Assessments will now be based on the average consolidated total assets less tangible equity capital of a financial institution. This could result in an increase in deposit insurance assessments to be paid by INB. This change will be effective for the fiscal quarter beginning April 1, 2011.
In addition to the assessment for deposit insurance, institutions are also required to make payments on bonds issued in the late 1980s by the Financing Corporation to recapitalize a predecessor deposit insurance fund. That payment is established quarterly and during the four quarters ending December 31, 2010 averaged 1.08 basis points of assessable deposits.
Community Reinvestment. Under the Community Reinvestment Act (CRA) of 1977, INB must assist in meeting the credit needs of the communities in its market areas by, among other things, providing credit to low and moderate-income individuals and neighborhoods. The FDIC applies the lending, investment and service tests to assess a bank’s CRA performance and assigns to a bank a rating of “outstanding,” “satisfactory,” “needs to improve,” or “substantial noncompliance” on the basis of the bank’s performance under these tests. All banks are required to publicly disclose their CRA performance ratings.
Regulation of Lending Activity. In addition to the laws and regulations discussed above, INB is also subject to certain consumer laws and regulations, including, but not limited to, the Truth in Lending Act, the Real Estate Settlement Procedures Act, the Equal Credit Opportunity Act of 1974, and their associated Regulations Z, X and B, respectively.
Monetary Policy and Economic Control. Commercial banking is affected not only by general economic conditions, but also by the monetary policies of the FRB. Changes in the discount rate on member bank borrowing, availability of borrowing at the “discount window,” open market operations, the imposition of changes in reserve requirements against member banks’ deposits and assets of foreign branches and the imposition of and changes in reserve requirements against certain borrowings by banks and their affiliates are some of the instruments of monetary policy available to the FRB. These monetary policies are used in varying combinations to influence overall growth and distributions of bank loans, investments and deposits, and this use may affect interest rates charged on loans or paid on deposits. The monetary policies of the FRB, which have a significant effect on the operating results of commercial banks, are influenced by various factors, including inflation, unemployment, short-term and long-term changes in the international trade balance and in the fiscal policies of the United States Government.
Other Legislation Affecting Us
The Riegle-Neal Interstate Banking and Branching Efficiency Act of 1994 facilitates the interstate expansion and consolidation of banking organizations by permitting bank holding companies that are adequately capitalized and managed to acquire banks located in states outside their home states regardless of whether such acquisitions are authorized under the law of the host state. The Act also permits interstate mergers of banks, with some limitations and the establishment of new branches on an interstate basis provided that such action is authorized by the law of the host state.
The Gramm-Leach-Bliley Act of 1999 permits banks, securities firms and insurance companies to affiliate under a common holding company structure. In addition to allowing new forms of financial services combinations, this Act clarifies how financial services conglomerates will be regulated by the different federal and state regulators. The Gramm-Leach-Bliley Act amended the BHCA and expanded the permissible activities of certain qualifying bank holding companies, known as financial holding companies. In addition to engaging in banking and activities closely related to banking, as determined by the FRB by regulation or order, financial holding companies may engage in activities that are financial in nature or incidental to financial activities that are complementary to a financial activity and do not pose a substantial risk to the safety and soundness of depository institutions or the financial system generally.
22
Table of Contents
Under the Gramm-Leach-Bliley Act, all financial institutions, including us, were required to develop privacy policies, restrict the sharing of nonpublic customer data with nonaffiliated parties at the customer’s request, and establish procedures and practices to protect customer data from unauthorized access.
The USA Patriot Act of 2001 requires financial institutions to help prevent, detect and prosecute international money laundering and financing of terrorism. Financial institutions are required to collect customer information, monitor transactions and report certain information to U.S. law enforcement agencies, such as the U.S. Treasury Department Office of Foreign Assets Control (OFAC) concerning customers and their transactions. INB has systems and procedures in place designed to comply with the USA Patriot Act.
The Sarbanes-Oxley Act of 2002 imposes a myriad of corporate governance and accounting measures designed so that shareholders are treated and have full and accurate information about the public companies in which they invest. All public companies are affected by the Act. Some of the principal provisions of the Act include: the creation of an independent accounting oversight board (PCAOB) to oversee the audit of public companies and auditors who perform such audits; auditor independence provisions which restrict non-audit services that independent accountants may provide to their audit clients; additional corporate governance and responsibility measures which (a) require the chief executive officer and chief financial officer to certify financial statements and internal controls and to forfeit salary and bonuses in certain situations, and (b) protect whistleblowers and informants; expansion of the authority and responsibilities of a company’s audit, nominating and compensation committees; mandatory disclosure by analysts of potential conflicts of interest; and enhanced penalties for fraud and other violations.
The Dodd-Frank Wall Street Reform and Consumer Protection Act (Dodd-Frank Act) enacted in 2010, will have a broad impact on the financial services industry, imposing significant regulatory and compliance changes, including the imposition of increased capital, leverage, and liquidity requirements, and numerous other provisions designed to improve supervision and oversight of, and strengthen safety and soundness within, the financial services sector. Additionally, the Dodd-Frank Act establishes a new framework of authority to conduct systemic risk oversight within the financial system to be distributed among new and existing federal regulatory agencies, including the Financial Stability Oversight Council (the “Council”), the FRB, the OCC and the FDIC.
The following items provide a brief description of the relevant provisions of the Dodd-Frank Act and their potential impact on our operations and activities, both currently and prospectively.
Increased Capital Standards and Enhanced Supervision. Federal banking agencies are broadly required to establish minimum leverage and risk-based capital requirements for banks and bank holding companies. Compliance with heightened capital standards may reduce our ability to generate or originate revenue-producing assets and thereby restrict revenue generation from banking and non-banking operations. The Dodd-Frank Act also generally increases regulatory oversight, supervision and examination, and reporting obligations of banks, bank holding companies and their respective subsidiaries. Compliance with new regulatory requirements and expanded examination processes could increase our cost of operations.
Imposition of Restrictions on Activities. Although subject to various phase-in periods, the Dodd-Frank Act will impose a variety of restrictions and prohibitions on the activities of holding companies and banks. In particular, the Dodd-Frank Act requires that certain swaps and derivatives activities be “pushed out” of insured depository institutions and conducted in non-bank affiliates, significantly restricts the ability of a member of a depository institution holding company group to invest in or sponsor certain private funds, and broadly restricts such entities from engaging in “proprietary trading,” subject to limited exemptions. We have never engaged in or expect to engage in the aforementioned activities.
Expanded FDIC Resolution Authority. The Dodd-Frank Act creates a new mechanism for the FDIC to conduct the orderly liquidation of certain “covered financial companies,” including bank holding companies and systemically significant non-bank financial companies. Upon certain findings being made, the FDIC may be appointed receiver for a covered financial company, and would be tasked to conduct an orderly liquidation of the entity. This gives the FDIC more discretion than in the traditional bankruptcy context.
23
Table of Contents
Trust Preferred Securities. Under the Dodd-Frank Act, bank holding companies are prohibited from including in their Tier 1 regulatory capital certain hybrid debt and equity securities issued on or after May 19, 2010. Among the securities included in this prohibition are trust preferred securities (TRUPS), which IBC has used in the past as a tool for raising Tier 1 capital. Although IBC is permitted to continue to include its existing outstanding TRUPS in its Tier 1 capital, the prohibition on the use of these securities as Tier 1 capital going forward may limit IBC’s ability to raise capital in the future. The provisions of the Dodd-Frank Act do not apply to any hybrid capital instrument issued prior to October 4, 2010 to the U.S. government or a U.S. government agency under the EESA, such as TARP. Accordingly, IBC’s outstanding preferred stock held by the U.S. Treasury also continues to count as Tier 1 capital under the provisions of this legislation.
Furthermore, under FRB requirements, beginning March 31, 2011, the amount of qualifying cumulative perpetual preferred stock (excluding senior preferred stock issued to the U.S. Treasury) and qualifying TRUPS, as well as certain types of minority interest, that may be included as Tier 1 capital will be limited to 25 percent of the sum of core capital elements net of goodwill. We do not have any goodwill or minority interests. Additionally, the excess amounts of restricted core capital elements in the form of qualifying TRUPS included in Tier 2 capital will be limited to 50 percent of Tier 1 capital (net of goodwill). However, amounts in excess of this limit will still be taken into account in the overall assessment of an organization’s funding and financial condition. In the last five years before the underlying subordinated note matures, the associated TRUPS must be treated as limited-life preferred stock. Thus, in the last five years of the life of the note, the outstanding amount of TRUPS will be excluded from Tier 1 capital and included in Tier 2 capital, subject, together with subordinated debt and other limited-life preferred stock, to a limit of 50 percent of Tier 1 capital. During this period, the TRUPS will be amortized out of Tier 2 capital by one-fifth of the original amount (less redemptions) each year and excluded totally from Tier 2 capital during the last year of life of the underlying note. Based on our current capital levels, we do not expect IBC’s Tier 1 capital to be reduced when the changes described above become effective on March 31, 2011.
The Consumer Financial Protection Bureau. The Dodd-Frank Act creates a new, independent Consumer Financial Protection Bureau (the “Bureau”), within the Federal Reserve. The Bureau is tasked with establishing and implementing rules and regulations under certain federal consumer protection laws with respect to the conduct of providers of certain consumer financial products and services. The Bureau has rulemaking authority over many of the statutes governing products and services offered to bank consumers. In addition, the Dodd-Frank Act permits states to adopt consumer protection laws and regulations that are stricter than those regulations promulgated by the Bureau and state attorneys general are permitted to enforce consumer protection rules adopted by the Bureau against certain state-chartered institutions. Compliance with any such new regulations could increase our cost of operations and, in addition, could limit our ability to expand into new products and services falling within the jurisdiction of the Bureau.
Deposit Insurance. The Dodd-Frank Act makes permanent the general $250,000 deposit insurance limit for insured deposits and extends until January 1, 2013, federal deposit coverage for the full net amount held by depositors in non-interest-bearing transaction accounts. Amendments to the Federal Deposit Insurance Act also revise the assessment base against which an insured depository institution’s deposit insurance premiums paid to the FDIC’s DIF will be calculated. Under the amendments, the assessment base will no longer be the institution’s deposit base, but rather its average consolidated total assets less its average tangible equity. This may shift the burden of deposit insurance premiums toward those depository institutions that rely on funding sources other than U.S. deposits. Additionally, the Dodd-Frank Act makes changes to the minimum designated reserve ratio of the DIF, increasing the minimum from 1.15 percent to 1.35 percent of the estimated amount of total insured deposits, and eliminating the requirement that the FDIC pay dividends to depository institutions when the reserve ratio exceeds certain thresholds. Several of these provisions could impact the FDIC deposit insurance premiums paid by INB. The Dodd-Frank Act also provides that, effective one year after the date of enactment, depository institutions may pay interest on demand deposits, which could raise our cost of funds.
Mortgage Loan Origination and Risk Retention. The Dodd-Frank Act contains additional requirements that may affect our operations and increase our compliance costs. For example, it imposes new standards for mortgage loan originations on all lenders, including banks, in an effort to require steps to verify a borrower’s ability to repay.
24
Table of Contents
In addition, the Dodd-Frank Act generally requires lenders or securitizers to retain an economic interest in the credit risk relating to loans the lender sells or mortgage and other asset-backed securities that the securitizer issues. The risk retention requirement generally will be 5%, but could be increased or decreased by regulation.
Transactions with Affiliates. The Dodd-Frank Act generally enhances the restrictions on transactions with affiliates under Section 23A and 23B of the Federal Reserve Act, including an expansion of the definition of “covered transactions” and an increase in the amount of time for which collateral requirements regarding covered credit transactions must be satisfied. The ability of the FRB to grant exemptions from these restrictions is also narrowed by the Dodd-Frank Act, including a requirement that the FRB coordinate with the FDIC in considering whether to grant an exemption.
Transactions with Insiders. Insider transaction limitations are expanded through the strengthening of loan restrictions to insiders and the expansion of the types of transactions subject to the various limits, including derivatives transactions, repurchase agreements, reverse repurchase agreements and securities lending or borrowing transactions. Restrictions are also placed on certain asset sales to and from an insider to a depository institution, including requirements that such sales be on market terms and, in certain circumstances, approved by the institution’s board of directors.
Enhanced Lending Limits. The Dodd-Frank Act strengthens the existing limits on a depository institution’s credit exposure to one borrower. Federal banking law currently limits a national bank’s ability to extend credit to one person (or group of related persons) in an amount exceeding certain thresholds. The Dodd-Frank Act expands the scope of these restrictions to include credit exposure arising from derivative transactions, repurchase agreements, and securities lending and borrowing transactions.
Corporate Governance. The Dodd-Frank Act addresses many investor protection, corporate governance, and executive compensation matters that will affect most U.S. publicly traded companies. The Dodd-Frank Act (1) grants shareholders of U.S. publicly traded companies an advisory vote on executive compensation; (2) enhances independence requirements for compensation committee members; (3) requires companies listed on national securities exchanges to adopt incentive-based compensation clawback policies for executive officers; and (4) provides the SEC with authority to adopt proxy access rules that would allow shareholders of publicly traded companies to nominate candidates for election as a director and have those nominees included in a company’s proxy materials. As a participant in TARP, we have been subject to these requirements since December 2008.
Many of the requirements called for in the Dodd-Frank Act will be implemented over time and most will be subject to implementing regulations over the course of several years. Given the uncertainty associated with the manner in which the provisions of the Dodd-Frank Act will be implemented by the various regulatory agencies and through regulations, the full extent of the impact such requirements will have on our operations is unclear. The changes resulting from the Dodd-Frank Act may impact the profitability of our business activities, require changes to certain of our business practices, impose upon us more stringent capital, liquidity and leverage requirements or otherwise adversely affect our business. These changes may also require us to invest significant management attention and resources to evaluate and make any changes necessary to comply with new statutory and regulatory requirements. Failure to comply with the new requirements may negatively impact our results of operations and financial condition.
Basel III. Current risk-based capital guidelines that banks and bank holding companies are subject to may change beginning in 2013. International banking regulators have agreed upon significant changes in the regulation of capital required to be held by banks and their holding companies to support their businesses. The new rules, known as Basel III, generally increase the capital required to be held and narrow the types of instruments qualifying as appropriate capital and impose a new liquidity measurement.
Basel III does not apply to U.S. banks or holding companies automatically. Among other things, the Dodd-Frank Act requires U.S. regulators to reform the U.S. banking system under which the safety and soundness of banks and other financial institutions, individually and systemically, are regulated. Such reform will include the regulation of capital and liquidity, and will most likely include all or portions of the Basel III framework.
25
Table of Contents
The Basel III requirements are complex and will be phased in over many years, and when fully phased-in on January 1, 2019, banking institutions will be required to maintain heightened Tier 1 common equity, Tier 1 capital, and total capital ratios, as well as maintaining a “capital conservation buffer,” all of which is discussed in greater detail below. If these revisions were adopted currently, we estimate they would have some impact on our regulatory capital ratios based on our current understanding of the revisions to capital qualifications but we would still be in compliance with Basel III thresholds. We await clarification from our banking regulators on their interpretation of Basel III and any additional requirements to the stated thresholds. Additionally, the FDIC has approved issuance of an interagency proposed rulemaking to implement certain provisions of Section 171 of the Dodd-Frank Act (Section 171). Section 171 provides that the capital requirements generally applicable to insured banks shall serve as a floor for other capital requirements the agencies establish. The FDIC noted that the advanced approaches of Basel III allow for reductions in risk-based capital requirements below those generally applicable to insured banks and, accordingly, need to be modified to be consistent with Section 171.
In the U.S, key elements of Basel III are likely to be applied first to large “core” banks subject to the Basel II capital regime and eventually to the vast majority of U.S. banks subject to Basel I, such as us. However, U.S. regulators will have to address a number of important and complex issues during the implementation process, including the impact of the statutory capital-related provisions of the Dodd-Frank Act and whether and how best to implement Basel III capital initiatives.
In general, significant tightening of U.S. capital requirements would most likely increase the cost of capital, among other things, which could have significant adverse impacts on banks’ and bank holding companies’ profitability and growth opportunities. Although most financial institutions would be affected, the business impacts could be felt unevenly, depending upon the business and product mix of each institution. Other potential effects could include less ability to pay cash dividends and repurchase common shares, higher dilution of common shareholders, and a higher risk that financial institutions fall below regulatory capital thresholds in an adverse economic cycle.
An explanation of Basel III initiatives follows:
Common Equity Risk-Based Capital. The minimum requirement for the common equity component of Tier 1 capital will be increased from 2% of risk-weighted assets under the current framework to 4.5%, measured after the application of stricter capital guidelines. However, when combined with the capital conservation buffer (described below), the resulting new common equity requirement will, as a practical matter, be 7% of risk-weighted assets. This new minimum requirement will be phased-in beginning with a 3.5% requirement in January 2013 and increasing to 4.5% by January 2015.
Tier 1 Risk-based Capital. Over the same period (2013 to 2015), the minimum Tier 1 capital requirement will increase from 4% of risk-weighted assets under the current framework, to 6% using a narrower definition of Tier 1 capital (which, for example, permits mortgage servicing rights, certain deferred tax assets, and minority investments in qualifying financial institutions to be recognized as tier 1 capital only up to an aggregate of 15 percent of common equity, and would entirely exclude trust preferred securities from Tier 1 capital). When combined with the capital conservation buffer, this amounts to an effective minimum tier 1 capital requirement of 8.5%. Instruments no longer qualifying as non-common equity Tier 1 capital (e.g., trust preferred securities) or Tier 2 capital will be phased out over a 10-year period beginning in January 2013, with recognition of those instruments as qualifying capital being reduced by 10 percent each year, using the nominal amount outstanding on January 1, 2013, as a baseline. Capital instruments that no longer qualify as common equity, however, generally will be excluded altogether from common equity as of January 1, 2013.
Total Risk-Based Capital. The minimum requirement for total capital under the new framework remains unchanged at 8% of risk-weighted assets. However, the requirement must be satisfied using a more stringent definition of capital. Thus, when combined with the capital conservation buffer, the total capital requirement under Basel III is effectively 10.5%.
Capital Conservation Buffer. The capital conservation buffer, which must consist of common equity, is a capital cushion to be maintained and intended to be available to absorb losses during times of financial stress. Under Basel III, this buffer will be set at 2.5% of risk-weighted assets.
26
Table of Contents
Although banks will be permitted to draw on the conservation buffer during periods of stress, as regulatory capital levels get closer to the minimum requirements (i.e., as the buffer is depleted), greater constraints on earnings distributions such as dividend payments and discretionary employee bonuses will be triggered. As a result, institutions subject to Basel III are likely, as a practical matter, to target levels of capital that exceed not just the regulatory minimums, but rather the regulatory minimums plus the capital conservation buffer.
Leverage Ratio. The minimum risk-based capital requirements under Basel III will be supplemented by a non-risked-based minimum tier 1 leverage ratio, which has been tentatively set at 3%. The appropriateness of the 3% ratio (and the use in the numerator of Tier 1 capital as opposed to total capital or common equity) will be assessed during a parallel run period from 2013-2017, with the leverage ratio requirement not becoming final until 2018.
Countercyclical Capital Buffer. In addition to the capital conservation buffer described above, Basel III also contemplates a countercyclical capital buffer that would be funded on a jurisdiction-specific basis during periods of excess credit growth resulting in a build-up of systemic risk. This buffer would cover a range of 0% to 2.5% of risk-weighted assets and would need to be composed of common equity “or other fully loss absorbing capital” when funded, and would be implemented according to “national circumstances.”
Net Stable Funding Ratio. The Basel III framework includes a minimum net stable funding ratio (NSFR), which is intended to promote longer-term structural funding of banks’ balance sheets, off-balance sheet exposures and capital markets activities. The revised NSFR is not scheduled to take effect as a minimum standard until 2018.
The U.S. banking agencies have informally indicated that they expect to propose regulations implementing Basel III in 2011, with final adoption of implementing regulations in 2012. The regulations that will become applicable to us may be different from the Basel III framework discussed above.
Other Regulation - Mortgage Lending
Residential properties may be subject to rent control and rent stabilization laws, which may restrict the owner from raising rents on apartments. If real estate taxes, fuel costs and maintenance of and repairs to the property were to increase substantially, and such increases are not offset by increases in rental income, the ability of the owner of the property to make payments due on the loan might be adversely affected.
Laws and regulations relating to asbestos require that whenever any work is undertaken in a property in an area in which asbestos is present, the asbestos must be removed or encapsulated in accordance with such and laws and regulations. The cost of asbestos removal or encapsulation may be substantial, and if there were not sufficient cash flow from the property, after debt service on mortgages, to fund the required work, and the owner of the property fails to fund such work from other sources, the value of the property could be adversely affected, with consequent impairment of the security for the mortgage. Laws and regulations relating to the storage, disposal and clean up of hazardous or toxic substances at real property have been adopted. Such laws may impose a lien on the real property superior to any mortgages on the property. In the event such a lien was imposed on any property which serves as security for a mortgage owned by us, the security for such mortgage could be impaired.
Our lending business is regulated by federal, state and, in certain cases, local laws, including, but not limited to, the Equal Credit Opportunity Act of 1974 and Regulation B. The Equal Credit Opportunity Act and Regulation B prohibit creditors from discriminating against applicants on the basis of race, color, religion, national origin, sex, age or marital status. Regulation B also restricts creditors from obtaining certain types of information from loan applicants. Among other things, it also requires lenders to advise applicants of the reasons for any credit denial. Equal Credit Opportunity Act violations can also result in fines, penalties and other remedies.
We are also subject to various other federal, state and local laws, rules and regulations governing, among other things, the licensing of mortgage lenders and servicers. We must comply with procedures mandated for mortgage lenders and servicers, and must provide disclosures to certain borrowers. Failure to comply with these laws, as well as with the laws described above, may result in civil and criminal liability, termination or suspension of licenses, rights of rescission for mortgage loans, lawsuits and/or administrative enforcement actions. Additional legislative and regulatory proposals have been made and others can be expected. It is not possible to predict whether or in what form final proposals may be adopted and, if adopted, what their effect will be on us.
27
Table of Contents
The following risk factors contain important information about us and our business and should be read in their entirety. Additional risks and uncertainties not known to us or that we now believe to be not material could also impair our business. If any of the following risks actually occur, our business, results of operations and financial condition could suffer significantly.
Risks Related to Our Business
Weak economic conditions both nationally and in our New York and Florida markets could continue to negatively impact our asset quality, financial condition and operating results.
Since the end of 2007, we have been negatively impacted by a weak economy, high rates of unemployment, increased office and retail vacancy rates and lower commercial real estate values both nationally and in our primary markets, New York and Florida, all of which have resulted in a significant increase in our nonperforming assets and associated loan and real estate loss provisions and expenses to carry these assets. Unlike larger banks that are more geographically diversified, our business and results of operations are closely tied to the local economic conditions and commercial real estate values in New York and Florida.
At December 31, 2010, our nonperforming assets amounted to $80 million, or 3.86% of our total assets, and were comprised of $52.9 million of nonaccrual loans and $27.1 million of real estate acquired through foreclosure. At December 31, 2010, we also had two loans totaling $3.6 million that were categorized as accruing troubled debt restructured loans (TDRs). At December 31, 2010, we also had $29.5 million of performing loans for which there were concerns regarding the ability of the borrowers to meet existing repayment terms. Such potential problem loans were classified as substandard and reflect the distinct possibility, but not the probability, that we will not be able to collect all amounts due according to the contractual terms of the loan. The timing and amount of the resolution and/or disposition of all these assets cannot be predicted with certainty. Our ability to complete foreclosure or other proceedings to acquire and sell certain collateral properties in many cases can be delayed by various factors including bankruptcy proceedings and an overloaded court system. No assurance can be given that we will not be required to sell these as well as other problem assets in the future at a loss.
A sustained and prolonged economic and real estate downturn could continue to adversely affect the quality of our assets, further increase our nonperforming assets, credit losses, real estate losses and related carrying expenses, and reduce the demand for our products and services, which could adversely affect our financial condition and results of operations.
We may have higher loan and real estate losses than we have allowed for which could adversely affect our financial condition and operating results.
We maintain an allowance for loan losses and a valuation allowance for real estate losses that we believe reflect the amount of losses inherent in our loan and real estate portfolios. There is a risk that we may experience losses that could exceed the allowances we have set aside. In determining the size of the allowances, we make various assumptions and judgments about the collectability of our loan portfolio and the estimated market values of the underlying collateral properties and of real estate owned, which are discussed under the caption “Critical Accounting Policies” in this report. If our assumptions and judgments prove to be incorrect, we may have to increase these allowances by recording additional loss provisions, which could adversely affect on our operating results and financial condition. There can be no assurances that the allowances will be adequate to protect us against actual losses that we may incur. Furthermore, our regulators may require us to make additional provisions for loan and real estate losses and/or recognize additional charge-offs after their periodic review of these portfolios and related allowances, which also may adversely affect our financial condition and results of operations.
We are subject to the risks and costs associated with owning real estate, which could adversely affect our operating results and financial condition.
From time to time, we need to foreclose on the properties that collateralize our mortgage loans that are in default as a means of repayment and may thereafter own and operate such properties, which expose us to risks and costs inherent in the ownership of real estate.
28
Table of Contents
The amount that we may realize from the sale of a collateral property is dependent upon the market value of the property at the time we are able to find a buyer and actually sell the asset. Such market value may not, at any given time, be sufficient to satisfy the outstanding principal amount of our loans.
Costs associated with the ownership of real estate, principally real estate taxes, insurance, maintenance and repair costs, may exceed the rental income earned from the property, if any, and we may therefore have to advance additional funds in order to protect our investment. Further, hazardous substances could be discovered on the properties and we may be required to remove the substances from and remediate the properties at our expense, which could be substantial. We may not have adequate remedies against the owners of the properties or other responsible parties and the remedies may involve substantial delay and expense to us and we may find it difficult to sell the affected properties and we may be forced to own the properties for an extended period of time. All of the above factors could adversely affect our operating results and financial condition.
Our loan portfolio is concentrated in loans secured by commercial and multi-family real estate, which increases the risk associated with our loan portfolio.
Our loan portfolio is concentrated in loans secured by commercial and multi-family real estate (including rental apartment buildings, retail condominium units, office buildings, mixed-use properties, shopping centers, hotels, restaurants, industrial/warehouse properties, parking lots/garages, mobile home parks, self-storage facilities and some vacant land). This concentration increases the risk associated with our loan portfolio because commercial real estate and multi-family loans are generally considered riskier than many other kinds of loans, like single family residential real estate loans, since these loans tend to involve larger loan balances to one borrower or groups of related borrowers and repayment of such loans is typically dependent upon the successful operation of the underlying real estate. Additionally, we have loans secured by vacant or substantially vacant properties as well as some vacant land, all of which typically do not have adequate or any income streams and depend upon other sources of cash flow from the borrower for repayment. A number of our borrowers also have more than one mortgage loan outstanding with us. Likewise, a number of these borrowers may also own other properties that are encumbered by separate mortgages from other lenders. Consequently, an adverse development with respect to the borrower may expose us to a greater risk of loss with respect to our otherwise performing loans with the same borrower. Furthermore, banking regulators continue to give commercial real estate lending greater scrutiny and banks with higher levels of these loans are expected to implement improved underwriting, internal controls, risk management policies and portfolio stress testing, as well as maintain higher levels of allowances for possible losses and capital levels as a result of commercial real estate lending growth and exposures.
Regardless of the underwriting criteria we utilize, lending losses may be experienced as a result of various factors beyond our control, including, among other things, changes in market and economic conditions affecting the value of our loan collateral and problems affecting the credit and business of our borrowers. Our ability to recover our investment in the mortgage loans we originate is dependent on the market value of the properties underlying such loans because many of our mortgage loans permit no recourse or limited recourse against the property’s owner. In addition, our losses in connection with delinquent and foreclosed loans may be more pronounced because our commercial and multi-family real estate mortgage loans generally defer repayment of a substantial part of the original principal amount until maturity. All of the above factors could adversely affect our operating results and financial condition.
The properties securing our loans are concentrated in New York and Florida, which increases the risk associated with our loan portfolio.
The properties securing our loans are concentrated in New York and Florida (our primary lending markets), which have and continue to suffer weak economic conditions and lower commercial real estate values. Additionally, we have and will continue to lend in geographical areas that are in the process of being revitalized or redeveloped which can be negatively impacted to a greater degree in an economic downturn. Properties securing our loans in these types of neighborhoods may be more susceptible to fluctuations in value than properties in more established areas. Many of the multi-family properties located in New York City and surrounding areas are also subject to rent control and rent stabilization laws, which limit the ability of the property owners to increase rents, which may in turn limit the borrower’s ability to repay those mortgage loans which results in a higher degree of risk.
29
Table of Contents
Taxes on real property in Florida have also increased substantially in recent years, and New York is facing budget deficits that could result in higher taxes. Higher taxes may adversely affect our borrowers’ cash flows and our costs of operating foreclosed property as well as real estate values generally.
Political issues, including armed conflicts and acts of terrorism, may have an adverse impact on economic conditions of the country as a whole and may be more pronounced in specific geographic regions. Economic conditions affect the market value of the mortgaged properties underlying our loans as well as the levels of rent and occupancy of income-producing properties. Since a large number of properties underlying our mortgage loans are located in New York City, we may be more vulnerable to the adverse impact of such occurrences than other institutions. Acts of terrorism could have a significant impact on our ability to conduct our business. Such events could affect the ability of our borrowers to repay their loans, could impair the value of the collateral securing our loans, and could cause significant property damage, thus increasing our expenses and/or reducing our revenues.
All of the above factors could adversely affect our operating results and financial condition.
Due to our concentration in commercial and multifamily real estate loans, the OCC’s policies and INB’s Formal Agreement with the OCC require us to strengthen our management and systems, which has increased our expenses and raised the amount of capital we must maintain, and is expected to further increase our operating costs.
The OCC and other bank regulators require banks with concentrations of assets to have management, policies, procedures and systems appropriate to manage these risks, especially where the real estate loans are concentrated geographically or in particular lines of business. Commercial real estate (inclusive of multifamily properties and vacant land) comprised 99.8% of our total loan portfolio and 65% of our total assets, and represented 722% of our total stockholders’ equity at December 31, 2010. As discussed in the section “Supervision and Regulation” in this report, we are required to hold higher levels of capital as a result of the risks of our concentration in commercial and multifamily real estate loans. INB’s Formal Agreement with the OCC, among other things, requires us to strengthen our management and systems. These efforts will require increased management time and costs, including additional personnel and costs of consultants and other third parties.
Our loans are relatively short-term and we face the risk of borrowers being unable to refinance or pay their loans at maturity which could adversely affect our earnings, credit quality and liquidity.
Our commercial and multifamily real estate loans have an average maturity of approximately 3.5 years as of December 31, 2010. Our borrowers are expected to have to refinance their loans at maturity or payoff the loans at maturity from other sources of cash or from sales of the underlying collateral property. We are therefore subject to the risks that our borrowers will not be able to repay or refinance their loans from us due to adverse conditions in their businesses, unavailability of alternative financing, or an inability to timely sell the property securing our loan.
The recent disruptions in credit markets and real estate markets, the virtual disappearance of the commercial real estate securitization market and other lenders’ diversification away from commercial real estate lending, as well as declines in property values have all increased our credit risks, increased our delinquent and nonperforming loans, and our foreclosures and the potential for future losses on our loans. Problem and foreclosed loans increase our costs and take additional time and effort to manage. These conditions also reduce the rate of payoffs on our loans, which reduces our customary liquidity from loan turnover.
Our ability to fully realize our deferred tax asset will be reduced in the future if our estimates of future taxable income from our operations and tax planning strategies do not support our deferred tax amount or if the amount of our net operating loss carryforward and certain other tax attributes realizable for income tax purposes is reduced under Section 382 of the Internal Revenue Code as a result of future sales of our capital securities that cause a change in control as defined by Section 382.
At December 31, 2010, we had a deferred tax asset of $47.1 million, which includes a gross net operating loss carryforward (NOL) of approximately $61.3 million (or $26.6 million tax-effected). The NOL was generated from the May 2010 discounted bulk sale of nonperforming and underperforming assets. This deferred tax asset is available to reduce income taxes payable on our future taxable earnings.
30
Table of Contents
We perform quarterly reviews of the realizability of our deferred tax asset and have determined that a valuation allowance was not required at any time during the reporting periods in this report because we believe that it is more likely than not that our deferred tax asset will be fully realized. This conclusion is based on our prior earnings history, exclusive of the NOL generated in the second quarter of 2010, coupled with evidence indicating that we will be able to generate an adequate amount of future taxable income over a reasonable period of time to fully utilize the deferred tax asset. Our ability to realize our deferred tax asset could be reduced in the future if our estimates of future taxable income from our operations and tax planning strategies do not support the realization of our deferred tax asset.
In addition, the amount of NOLs and certain other tax attributes realizable for income tax purposes may be reduced under Section 382 of the Internal Revenue Code by sales of our common stock, including transactions in the open market by 5% or greater shareholders, if an ownership change is deemed to occur under Section 382 of the Internal Revenue Code. The determination of whether an ownership change has occurred under Section 382 is highly fact specific and can occur through one or more acquisitions of capital stock (including open market trading) if the result of such acquisitions is that the percentage of our outstanding common stock held by shareholders or groups of shareholders owning at least 5% of our common stock at the time of such acquisition, as determined under Section 382, is more than 50 percentage points higher than the lowest percentage of our outstanding common stock owned by such shareholders or groups of shareholders within the prior three-year period.
As discussed in note 11 to the consolidated financial statements included in this report, in May, October and November of 2010, IBC sold a total of 850,000, 10,600,000 and 1,086,377 shares of its Class A common stock, respectively, through a private placement and a public offering. We have determined based on an internal analysis that the completion of these transactions did not result in a change of control as defined by Section 382, although no assurance can be given that taxing authorities would agree with such determination. The combination of these sales with any future sales of IBC’s common stock during the period defined above, could increase the risk of a change in control as determined under Section 382 and result in the partial loss of the availability of our NOLs, which would require us to write-off and expense a portion of our then deferred tax asset amount.
Hurricanes or other adverse weather or environmental events could negatively affect our local economies or disrupt our operations, which would have an adverse effect on our business or results of operations.
Our market areas in Florida are especially susceptible to hurricanes and tropical storms and related flooding and wind damage, as well as other disasters such as the recent BP oil spill in the Gulf of Mexico. Such weather and other environmental events can disrupt operations, result in damage to properties and negatively affect the local economy, all of which may adversely affect the cash flows, values and marketability of properties in Florida that secure our loans. Furthermore, hurricane and other storm damage in Florida have increased the cost of property and casualty insurance premiums. We cannot predict whether or to what extent damage may be caused by such events. Such events could result in a decline in loan originations, a decline in the value or destruction of properties securing our loans and an increase in loan delinquencies, foreclosures or loan and real estate losses, all of which could negatively impact our results of operations and financial condition.
We may be required to recognize additional impairment charges on our investment in trust preferred securities, which would adversely affect our operating results and financial condition.
INB owns trust preferred security investments with a net carrying value of $4.6 million at December 31, 2010 that are classified as held to maturity as discussed in note 2 to the consolidated financial statements in this report. The estimated fair values of these securities are depressed due to the weakened economy and financial condition of a large number of the issuing banks as well as from restrictions that have been or can be placed on the payment of interest by regulatory agencies, which have severely reduced the demand for these securities and rendered their trading market inactive. In 2009 and 2010, we recorded other than temporary impairment (“OTTI”) charges totaling $3.5 million on these securities. The OTTI determination was based on an increase in the aggregate amount of deferred and defaulted interest payments on the underlying collateral by the issuing banks such that it is no longer probable that INB will recover its full investment in the applicable security. There can be no assurance that there will not be further write downs in the future on these trust preferred securities, which could adversely affect our operating results and financial condition.
31
Table of Contents
Our business strategy may not be successful.
Our business strategy is to attract deposits and originate commercial and multi-family real estate loans on a profitable basis. Our ability to execute this strategy depends on factors outside of our control, including the state of economic conditions generally and in our market areas in particular, as well as interest rate trends, the state of credit markets, loan demand, competition, government regulations, regulatory restrictions, capital needs and other factors. We can provide no assurance that we will be successful in maintaining or increasing the level of our loans and deposits at an acceptable risk or on profitable terms, while also managing the costs of resolving our nonperforming assets. There can be no assurance that there will be any future growth in our current business or that it will be profitable.
We depend on a small number of executive officers and other key employees to implement our business strategy and our business may suffer if we lose their services.
Our success is dependent on the business expertise of a small number of executive officers and other key employees. Mr. Lowell Dansker, age 60, our Chairman, and Mr. Keith Olsen, age 57, President of INB, have historically made all of the underwriting and lending decisions for us. We recently hired a new chief credit officer and a new asset/liability manager to enhance the management team’s breadth and depth.
If Mr. Dansker or Mr. Olsen or any of our other executive officers or key employees were to become unavailable for any reason, our business may be adversely affected because of their skills and knowledge of the markets in which we operate, their years of real estate lending experience and the difficulty of promptly finding qualified replacement personnel. To attract and retain qualified personnel to support our business, we offer various employee benefits, including executive employment agreements. We have a written management succession plan that identifies internal officers to perform executive officer functions in case of temporary disruptions due to such things as illnesses or leaves of absence. The plan contains procedures regarding the selection of permanent replacements, if any, for key officers. There can be no assurance that this plan would be effective or that we would be able to attract and retain qualified personnel. Competition for qualified personnel may also lead to increased hiring and retention costs.
We face strong competition in our market areas.
Our primary markets consist of the New York City area and the Tampa Bay area of Florida, which are highly competitive and such competition may increase further. We experience competition in both lending and attracting deposits from other banks and nonbanks located within and outside our primary market areas, some of which are significantly larger institutions with greater resources, lower cost of funds or a more established market presence. Nonbank competitors for deposits and deposit-type accounts include savings associations, credit unions, securities firms, investment bankers, money market funds, life insurance companies and the mutual fund industry. For loans, we experience competition from other banks, savings associations, finance companies, mortgage bankers and brokers, insurance companies, credit card companies, credit unions, pension funds and securities firms. Because our business depends on our ability to attract deposits and originate loans profitably, our ability to efficiently compete for depositors and borrowers is critical to our success. External factors that may impact our ability to compete include changes in local economic conditions and commercial real estate values, changes in interest rates, regulatory actions that limit the rates we pay on our deposits to market rates, changes in the credit markets and funds available for lending generally, advances in technology, changes in government regulations and the consolidation of banks and thrifts within our marketplace.
We depend on brokers for our loan originations and any reduction in referrals could limit our ability to grow or maintain the size of our loan portfolio.
We rely significantly on referrals from commercial real estate mortgage brokers for our loan originations. Our loan origination volume depends on our ability to continue to attract these referrals from mortgage brokers. If those referrals were to decline or not expand, there can be no assurances that other sources of loan originations would be available to us.
32
Table of Contents
Liquidity risks could negatively affect our operations and business.
Liquidity is essential to our business. An inability to raise funds through deposits, borrowings, repayments of loans, or other sources could have a substantial negative effect on our liquidity. In addition to deposits, our primary funding sources include unsecured federal funds that we purchase from correspondent banks as well as secured advances, both short- and longer-term, that are available from the Federal Home Loan Bank of New York and the Federal Reserve Bank of New York, with the use of our investment securities and certain loans that have and can be pledged as collateral. Other sources of liquidity that may be available to us, but cannot be assured, include our ability to issue and sell debentures, preferred stock or common stock in public or private transactions.
Our access to adequate amounts of funding sources on terms that are acceptable to us could be impaired by factors that affect us specifically or the financial services industry or economy in general. Our ability to borrow could also be impaired by factors that are not specific to us, such as further disruption in the financial markets, adverse changes in the financial condition of our correspondent banks that supply us with federal funds, or negative views and expectations about the prospects for the financial services industry in light of the recent turmoil faced by banking organizations and the credit markets. There can be no assurance that our current level of liquidity sources will be adequate or will not be adversely affected in the future and reduce the availability of funds to us.
Volatility in the capital and credit markets may negatively impact our business.
The capital and credit markets have most recently experienced severe volatility and disruption. In some cases, the markets produced downward pressure on stock prices and reduced credit availability for certain issuers without regard to those issuers’ underlying financial condition or performance. If market disruption and volatility were to continue or worsen, we may experience adverse effects, which may be material, on our ability to access capital or credit and on our business, financial condition and results of operations.
Changes in interest rates could adversely impact our earnings and we must continually identify and invest in mortgage loans or other instruments with rates of return above our cost of funds.
As a financial institution, we are subject to the risk of fluctuations in interest rates. A significant change in interest rates could have a material adverse effect on our profitability, which depends primarily on the generation of net interest income which is dependent on our interest rate spread, which is the difference between yields earned on our interest-earning assets and the rates paid on our interest-bearing liabilities. As a result, our success depends on our ability to invest a substantial percentage of our assets in mortgage loans with rates of return that exceed our cost of funds. We expect lower rates of return from our investment securities, especially our government securities and overnight investments, than from our loans. Regulatory requirements for greater liquidity may adversely affect our profitability. Both the pricing and mix of our interest-earning assets and our interest-bearing liabilities are impacted by such external factors as our local economies, competition for loans and deposits, the state of the credit markets, government monetary policy and market interest rates.
Fluctuations in interest rates are difficult to predict and manage and, therefore, there can be no assurance of our ability to maintain a consistent positive interest rate spread. There can be no assurances that a sudden and substantial change in interest rates may not adversely impact our earnings, our cost of funds, loan demand, and the value of our collateral and investment securities. For a further discussion of our management of interest rate risk, see the caption entitled “Asset and Liability Management” in this report.
Our level of indebtedness may adversely affect our financial condition and our business.
Our borrowed funds (exclusive of deposits) and related interest payable was approximately $85 million at December 31, 2010. This level of indebtedness could make it difficult for us to satisfy all of our obligations to the holders of our debt and could limit our ability to obtain additional debt financing to fund our working capital requirements.
The inability to incur additional indebtedness could adversely affect our business and financial condition by, among other things, limiting our flexibility in planning for, or reacting to, changes in our industry; and placing us at a competitive disadvantage with respect to our competitors who may operate on a less leveraged basis.
33
Table of Contents
As a result, this may make us more vulnerable to changes in economic conditions and require us to dedicate a substantial portion of our cash flow from operations to the repayment of our indebtedness, which would reduce the funds available for other purposes. In 2010, consistent with FRB requirements, we deferred our interest payments on our $56.7 million of outstanding trust preferred securities and suspended dividend payments on our $25 million of outstanding TARP cumulative preferred stock. Furthermore, the FRB has prohibited us from incurring any new indebtedness or paying dividends without their approval. All of the above could negatively impact our ability to raise new capital or new debt.
Reputational risk and social factors may negatively impact us.
Our ability to attract and retain depositors and customers is highly dependent upon consumer and other external perceptions of either or both of our business practices and financial condition. Adverse perceptions could damage our reputation to a level that could lead to difficulties in generating and maintaining deposit accounts, accessing credit markets and increased regulatory scrutiny on our business. Borrower payment behaviors also affect us. To the extent that borrowers determine to stop paying on their loans where the financed properties’ market values are less than the amount of their loan, or otherwise, our costs and losses may increase. Adverse developments or perceptions regarding the business practices or financial condition of our competitors, or our industry as a whole, may also indirectly adversely impact our reputation.
In addition, adverse reputational impacts on third parties with whom we have important relationships may also adversely impact our reputation. All of the above factors may result in greater regulatory and/or legislative scrutiny, which may lead to laws or regulations that may change or constrain the manner in which we engage with our customers and the products we offer and may also increase our litigation risk. If these risks were to materialize they could negatively impact our business, financial condition and results of operations.
Future acquisitions and expansion activities may disrupt our business, dilute existing shareholders and adversely affect our operating results.
We periodically evaluate potential acquisitions and expansion opportunities. We cannot assure you that we will be able to identify such opportunities, nor adequately or profitably manage the resulting growth therefrom. Acquiring other banks, branches or businesses, as well as other geographic and product expansion activities, involve various risks including: risks of unknown or contingent liabilities; unanticipated costs and delays; risks that acquired new businesses do not perform consistent with our growth and profitability expectations; risks of entering new markets or product areas where we have limited experience; risks that growth will strain our infrastructure, staff, internal controls and management, which may require additional personnel, time and expenditures; exposure to potential asset quality issues with acquired institutions; difficulties, expenses and delays of integrating the operations and personnel of acquired institutions, and start-up delays and costs of other expansion activities; potential disruptions to our business; possible loss of key employees and customers of acquired institutions; potential short-term decreases in profitability; and diversion of our management’s time and attention from our existing operations and business.
Attractive acquisition or expansion opportunities may not be available to us in the future.
While we seek continued organic growth, as our earnings and capital position improve, we may consider the acquisition of other businesses or expansion into new product lines. Competition could increase prices for potential acquisitions that we believe are attractive. Furthermore, acquisitions are subject to regulatory approvals. Among other things, our regulators will consider our capital, liquidity, profitability, regulatory compliance and other factors when considering acquisitions or expansion proposals.
Regulatory Risks
We operate in a highly regulated industry and government regulations significantly affect our business.
The banking industry is extensively regulated with regulations intended primarily to protect depositors. Regulations affect, among other things, our lending practices, capital structure, investment practices, and asset allocations, operating practices, and growth and dividend policy.
34
Table of Contents
Regulations may limit the manner in which we may conduct our business, increase our operating and compliance costs and other expenses, reduce our revenues and impose higher capital and liquidity requirements on us, any or all of which could adversely affect our business. See the section “Supervision and Regulation” in this report for a further discussion.
Our current operations and activities are subject to heightened regulatory oversight which may negatively impact our business and results of operations.
On December 9, 2010, INB entered into formal written agreement (the “Formal Agreement”) with the OCC. The Formal Agreement superseded and replaced a Memorandum of Understanding (MOU) entered into by INB with the OCC on April 7, 2009. The Formal Agreement requires INB to take certain actions, including the development of strategic and capital plans covering at least three years, completing a management assessment, and developing programs related to: loan portfolio management; criticized assets; credit concentrations; loan review; accounting for other real estate owned; maintaining an adequate allowance for loan losses; liquidity risk management; and interest rate risk. Additionally, INB is required to and is submitting periodic progress reports to the OCC regarding various aspects of the foregoing actions. INB’s Board of Directors was required and has appointed a compliance committee to monitor and coordinate INB’s performance under the Formal Agreement. Many of the plans and programs we have instituted are subject to OCC’s review and approval. The Formal Agreement also limits INB’s ability to pay cash dividends to IBC and establishes individual minimum capital ratios requiring INB to continue to maintain Tier 1 Capital at least equal to 9% of adjusted total assets, Tier 1 Capital at least equal to 10% of risk-weighted assets; and Total risk-based capital at least equal to 12% of risk-weighted assets. These are the same levels that INB had previously agreed to maintain beginning on April 7, 2009 and, as of the date filing of this Report on Form 10-K, INB continued to be in compliance with those requirements.
As a result of the Formal Agreement, INB is not allowed to accept, renew or rollover brokered deposits without the prior approval of the OCC and it is also required, in the absence of a waiver from the FDIC (based on a determination by the FDIC that INB operates in high cost deposit markets) to maintain its deposit pricing at or below the national rates published by the FDIC, plus 75 basis points. At December 31, 2010, INB had total brokered deposits of $159 million, of which $33 million (20%) mature by December 31, 2011. At December 31, 2010, all of the rates offered on INB’s deposit products were at levels at or below the FDIC national rates plus 75 basis points. The FDIC’s national rate is a simple average of rates paid by U.S. depository institutions as calculated by the FDIC.
In January 2011, IBC entered into a written agreement (the “Federal Reserve Agreement”) with the Federal Reserve Bank of New York (FRBNY) which requires IBC’s Board of Directors are to take the steps necessary to utilize IBC’s financial and managerial resources to serve as a source of strength to INB, including causing INB to comply with its Formal Agreement with the OCC. In addition, IBC cannot declare or pay dividends on its capital stock without the prior approval of the FRBNY and the Director of the Division of Banking Supervision and Regulation of the Board of Governors (the “Banking Director”). IBC also cannot take any payments representing a reduction in capital from INB without prior approval of the FRBNY and IBC cannot not make any distributions of interest, principal or other sums on its subordinated debentures or trust preferred securities without prior approval from the FRBNY and the Banking Director. Further, IBC may not incur, increase or guarantee any debt or purchase or redeem any shares of its stock without prior approval of the FRBNY. IBC is also required to submit a plan to maintain sufficient capital within 90 days of the date of the Federal Reserve Agreement. Furthermore, in appointing any new director or senior executive officer or changing responsibilities of any senior executive officer, IBC must notify the Federal Reserve Board and IBC is also restricted in making certain severance and indemnification payments. IBC and its Board of Directors are committed to taking all necessary actions to promptly address the requirements of the Federal Reserve Agreement.
As a result of all of the above, our operations, lending activities and capital levels are subject to heightened regulatory oversight, over and above the extensive regulation which normally applies to us under existing regulations, which will increase our expenses and could negatively impact our business. In addition, failure to comply with these heightened requirements could lead to additional regulatory actions, expenses and other restrictions, including the possible sale, merger, liquidation or receivership of INB or IBC.
35
Table of Contents
IBC has relied on cash dividends from its subsidiaries.
IBC is a separate and distinct legal entity from INB. Prior to January 2010, INB made cash dividend payments to IBC to fund the interest payments on IBC’s outstanding debt and the cash dividend requirements on IBC’s outstanding preferred stock held by the U.S. Treasury. Various federal and state laws and regulations limit the amount of dividends that a bank may pay to its parent company. In addition, IBC’s right to participate in a distribution of assets upon the liquidation or reorganization of a subsidiary is subject to the prior claims of the subsidiary’s creditors.
In January 2010, INB’s primary regulator, the OCC, prohibited INB from paying any cash dividends to IBC. INB accordingly suspended its cash dividend payments. Under the Formal Agreement discussed in the preceding risk factor, INB may make payments of dividends or capital distributions to IBC only: (a) when the INB is in compliance with its approved capital plan and would remain in compliance with its approved capital plan immediately following the payment of any dividend; (b) when INB is in compliance with 12 U.S.C. §§ 56 and 60; and (c) following the prior written determination of no supervisory objection by OCC. IBC’s inability to receive dividends from INB materially and adversely affects IBC’s liquidity and its ability to service its debt, pay its other obligations, or pay cash dividends on its common or preferred stock, which could have a material adverse effect on our business.
FDIC deposit insurance premiums have increased substantially and may increase further, which will adversely affect our results of operations
Our operating results have been negatively impacted by a substantial increase in FDIC premiums for all FDIC insured banks. Our FDIC insurance expense for 2009 increased 246% from 2008 to $5.2 million, which included a special assessment imposed in June 2009 on all insured banks and amounted to $1.1 million for us.
We expect deposit insurance premiums will continue to remain at a high level and may increase further for all banks, including the possibility of additional special assessments, due to recent strains on the FDIC deposit insurance fund resulting from recent bank failures and an increase in the number of banks likely to fail over the next few years. Our current level of FDIC insurance expense as well as any further increases thereto will adversely affect our operating results.
IBC is not paying dividends on its preferred stock or common stock and is deferring distributions on its trust preferred securities. The failure to resume paying dividends on our preferred stock and trust preferred securities may adversely affect us.
We historically paid cash dividends before we suspended dividend payments on our preferred and common stock and distributions on our trust preferred securities pursuant to the requests of the FRB and the OCC on February 1, 2010 and January 10, 2010, respectively. There can be no assurance that any such dividends or interest will resume in the future. The payment of dividends are generally limited to amounts available from current earnings. We incurred a large loss from operations in 2010. Future payment of cash dividends on our common stock, if any, will also be subject to the prior payment of all accrued and unpaid dividends and deferred distributions on our Series A Preferred Stock and trust preferred securities. Furthermore, current and proposed regulatory requirements for increased capital and liquidity will limit our ability to pay dividends on our preferred and common stock and make distributions on our outstanding trust preferred securities.
At December 31, 2010, we had $1.4 million of unpaid dividends owing on our preferred stock and $2.3 million of deferred distributions owing on our trust preferred securities. With respect to our Series A Preferred Stock, if we miss six quarterly dividend payments, whether or not consecutive, the U.S Treasury will have the right to appoint two directors to our board of directors until all accrued but unpaid dividends have been paid.
We are subject to restrictions as a result of our participation in the U.S Treasury’s Capital Purchase Program.
We voluntarily participated in the TARP Capital Purchase Program and we are now subject to various restrictions as defined therein, including standards for executive compensation and corporate governance for as long as the Treasury holds our Series A Preferred Stock, or any common stock that may be issued to them pursuant to the warrant they hold.
36
Table of Contents
These standards generally apply to our Chief Executive Officer, Chief Financial Officer and the three next most highly compensated senior executive officers. The standards include (1) ensuring that incentive compensation for senior executives does not encourage unnecessary and excessive risks that threaten the value of the financial institution; (2) required clawback of any bonus or incentive compensation paid to a senior executive based on statements of earnings, gains or other criteria that are later proven to be materially inaccurate; (3) prohibition on making golden parachute payments to senior executives; and (4) agreement not to deduct for tax purposes executive compensation in excess of $500,000 for each senior executive.
This deductibility limit on executive compensation, which currently only affects our Chairman’s compensation, will increase the overall after-tax cost of our compensation programs in future periods and we could potentially be subject to the above restrictions for a ten-year time period. Pursuant to the American Recovery and Reinvestment Act of 2009, further compensation restrictions, including significant limitations on incentive compensation and “golden parachute” payments, have been imposed on our most highly compensated employees, which may make it more difficult for us to retain and recruit qualified personnel, which could negatively impact our business, financial condition and results of operations.
Accounting, Systems and Internal Control Risks
Changes in accounting standards may affect our performance.
Our accounting policies and procedures are fundamental to how we record and report our financial condition and results of operations. From time to time, there are changes in the financial accounting and reporting standards that govern the preparation of financial statements in accordance with GAAP. These changes can be difficult to predict and can materially impact how we record and report our financial condition and operating results.
The Financial Accounting Standards Board has and continues to issue a large number of accounting standards that necessarily require all companies to exercise significant judgment and interpretation in the application of those standards. For example, banks now need to use “significant” judgment when assessing the estimated fair value of the assets and liabilities sitting on their balance sheets even though market values can change rapidly and may not be representative due to the inactivity of certain markets. These judgments and estimates could lead to inaccuracy and/or incomparability of financial statements in the banking industry. Future changes in financial accounting and reporting standards, including marking all our assets and liabilities to market values, could have a negative effect on our operating results and financial condition and even require us to restate prior period financial statements.
The accuracy of our judgments and estimates about financial and accounting matters will impact operating results and financial condition.
We necessarily make certain estimates and judgments in preparing our financial statements. The quality and accuracy of those estimates and judgments will have an impact our operating results and financial condition. For a further discussion, see the caption “Critical Accounting Policies” in this Report on Form 10-K.
Failure to maintain an effective system of internal control over financial reporting may not allow us to be able to accurately report our financial condition, operating results or prevent fraud.
We regularly review and update our internal control over financial reporting, disclosure controls and procedures, and corporate governance policies and procedures. We maintain controls and procedures to mitigate against risks such as processing system failures and errors, and customer or employee fraud. We maintain insurance coverage for certain of these risks.
Any system of controls and procedures, however well designed and operated, is based in part on certain assumptions and can provide only reasonable assurances that the objectives of the system are met. Events could occur which are not prevented or detected by our internal controls or are not insured against or are in excess of our insurance limits. Any failure or circumvention of our controls and procedures or failure to comply with regulations related to controls and procedures could have a material adverse effect on our business, results of operations and financial condition.
37
Table of Contents
A breach of information security could negatively affect our business.
We depend upon data processing, communication and information exchange on a variety of computing platforms and networks, including over the internet. Communications and information systems are essential to the conduct of our business, as we use such systems to manage our customer relationships, general ledger, deposits and loans. We cannot be certain that all of our systems are entirely free from vulnerability to attack, despite safeguards we have instituted.
We also rely on the services of a variety of vendors to meet our data processing and communication needs. If information security is breached, information can be lost or misappropriated and could result in financial loss or costs to us or damages to others. These costs or losses could materially exceed the amount of insurance coverage, if any, which would adversely affect our earnings. Our ability to meet the needs of our customers competitively, and in a cost-efficient manner, is dependent on our ability to keep pace with technological advances and to invest in new technology as it becomes available. Many of our competitors have greater resources to invest in technology than we do and may be better equipped to market new technology-driven products and services. The inability to keep pace with technological changes on our part could also have a material adverse impact on our business, financial condition and operating results.
38
Table of Contents
Item 1B. Unresolved Staff Comments
None
The office of IBC and INB’s headquarters and full-service banking office are located in leased premises (of approximately 21,500 sq. ft.) on the entire fourth floor of One Rockefeller Plaza in New York City, New York, 10020. The lease expires in March 2014. INB’s principal office in Florida is located at 625 Court Street, Clearwater, Florida, 33756. INB also operates five other branch offices in Florida; three of which are in Clearwater, Florida, at 1875 Belcher Road North, 2175 Nursery Road and 2575 Ulmerton Road, one is at 6750 Gulfport Blvd, South Pasadena, Florida, and one is at 483 Mandalay Avenue, Clearwater Beach, Florida. With the exception of the Belcher and Mandalay offices, which are leased through June 2012 and January 2016, respectively, INB owns all the properties in which its offices are located in Florida. Additionally, INB has options to extend the terms of the Belcher lease (for an additional five years) and the Mandalay lease (for up to an additional five years). All the above leases contain operating escalation clauses related to real estate taxes and operating costs based upon various criteria and are accounted for as operating leases. INB’s office at 625 Court Street consists of a two-story building containing approximately 22,000 sq. ft. INB occupies the ground floor (approximately 8,500 sq. ft.) and leases the 2nd floor to a single commercial tenant. The branch office at 1875 Belcher Road is a two-story building in which INB leases approximately 5,100 sq. ft. on the ground floor. The branch office at 2175 Nursery Road is a one-story building containing approximately 2,700 sq. ft., which is entirely occupied by INB. The branch office at 2575 Ulmerton Road is a three-story building containing approximately 17,000 sq. ft. INB occupies the ground floor (approximately 2,500 sq. ft.) and leases the upper floors to various commercial tenants. The branch office at 6750 Gulfport Blvd. is a one-story building containing approximately 2,800 sq. ft., which is entirely occupied by INB. The branch office at 483 Mandalay Avenue is located in a shopping center known as Pelican Walk Plaza in which INB leases approximately 2,100 sq. ft. In addition, each of INB’s Florida offices include drive-through teller facilities (except for Mandalay) and Automated Teller Machines (ATMs). INB also owns a two-story building located on property contiguous to its Court Street office in Florida, which. contains approximately 12,000 sq. ft. and is leased to commercial tenants. At December 31, 2010, INB also owned property across from its Court Street office, which consists of an office building with approximately 1,400 sq.ft. that is leased to one commercial tenant. This property provides additional parking for the Court Street branch. The property was sold in February 2011 and INB retained the parking rights for its branch. We believe our current facilities are adequate to meet our present and currently foreseeable needs.
We are periodically a party to or otherwise involved in legal proceedings arising in the normal course of business, such as foreclosure proceedings. Based on review and consultation with legal counsel, we do not believe that there is any pending or threatened proceeding against us, which, if determined adversely, would have a material effect on our business, results of operations, financial position or liquidity.
Item 4. [Removed and Reserved]
Executive Officers and Other Significant Employees
John J. Arvonio, age 48, has served as Chief Financial Officer and Chief Accounting Officer of Intervest Bancshares Corporation since August 2006 and December 2005, respectively, and as Senior Vice President, Chief Financial Officer and Secretary of Intervest National Bank since September 2000. Prior to that, Mr. Arvonio served as Vice President, Controller and Secretary of Intervest National Bank since April 1998. Mr. Arvonio also serves as an Administrator of Intervest Statutory Trust V. Mr. Arvonio received a Bachelor of Business Administration degree from Iona College and is a certified public accountant. Mr. Arvonio has more than 20 years of banking experience, including serving as Vice President, Accounting Policy and Technical Advisor for The Greater New York Savings Bank from 1992 to 1997, Manager of Financial Reporting for the Leasing and Investment Banking Divisions of Citibank from 1989 to 1992, and as a Senior Auditor for Ernst & Young from 1985 to 1989.
39
Table of Contents
Gail Balmaceda, age 39, has served as Vice President and Operations Manager of the New York Division of Intervest National Bank since 2007. Prior to that, Ms. Balmaceda has served in various capacities since 1999, including as an Assistant Vice President in 2006 and as Operations Supervisor from 2003 to 2005.
Lowell S. Dansker, age 60, has served as Chairman of the Board of Directors, Chief Executive Officer and Chairman of the Executive Committee of Intervest Bancshares Corporation since August 2006. He previously served as Vice Chairman of the Board of Directors, President, Treasurer and member of the Executive Committee of Intervest Bancshares Corporation, except for Vice Chairman, since incorporation in 1993. Mr. Dansker served as Vice Chairman from October 2003 to August 2006. Mr. Dansker also serves as the Chairman, Chief Executive Officer and Chairman of the Executive and Loan Committees of Intervest National Bank and as an Administrator of Intervest Statutory Trust II through V. Mr. Dansker received a Bachelor of Science in Business Administration from Babson College and a Law degree from the University of Akron School of Law and has been admitted to practice in New York, Ohio, Florida and the District of Columbia.
Matthew E. Englert, age 31, serves as Vice President and ALCO Officer of Intervest National Bank, since August 2010. Prior to joining Intervest National Bank, Mr. Englert worked for Sovereign Bank, a subsidiary of Banco Santander, as an Interest Rate Risk Analyst. Prior to that, he served as a Treasury Analyst, also for Sovereign Bank. Mr. Englert earned a Bachelors degree in Finance from Kutztown University and a Bachelors degree in Political Science from York College of Pennsylvania.
Stephen A. Helman, age 71, has served as a Director, and as Vice President and Secretary of Intervest Bancshares Corporation since December 2003 and February 2006, respectively. Mr. Helman is also a Vice President and Director of Intervest National Bank. Mr. Helman also is a member of the Executive Committee of Intervest Bancshares Corporation and an Administrator of Intervest Statutory Trust V. Mr. Helman received a Bachelor of Arts degree from the University of Rochester and a law degree from Columbia University. Mr. Helman has been a practicing attorney for more than 25 years.
John H. Hoffmann, age 59, has served as Vice President of Intervest National Bank since January 1, 2009. Prior to that, he served as Chief Financial Officer of Intervest Mortgage Corporation since August 2006 and as Vice President and Controller from 2002 to August 2006. Mr. Hoffmann received a Bachelor of Business Administration degree from Susquehanna University and is a certified public accountant. Mr. Hoffmann has more than 22 years of banking experience. Mr. Hoffmann was an Accounting Manager for Smart World Technologies, an Internet service provider, from 1998 to 2000 and a Vice President of Mortgage Accounting for The Greater New York Savings Bank from 1987 to 1997.
Erik E. Larson, age 38, has served as Vice President, Loan Operations Officer in the Florida Division of Intervest National Bank since October 2005. Prior to that, Mr. Larson was an Assistant Vice President with Intervest National Bank both in Loan Operations and Branch Management capacities. Mr. Larson joined Intervest National Bank in 1998. Prior to that, Mr. Larson served in a supervisory position with Barnett Bank. Mr. Larson received a Bachelors degree in Mathematics from Stockton State College, Pomona, New Jersey.
John W. Loock, age 60, has served as Vice President and Controller of Intervest National Bank since September 2007. He previously served as Assistant Vice President and Assistant Controller of Intervest National Bank from 1999 to August 2007. Mr. Loock received a Bachelor of Mathematics and Master of Business Administration degrees from Iona College. Mr. Loock has more than 30 years of banking experience encompassing various positions with small to large banking institutions.
Elizabeth Macias, age 55, has served as Vice President of Information Technology, Systems and Security for Intervest National Bank since October 2005. Ms. Macias has worked in the area of Bank Management Information Systems and Technology for over 24 years and Banking in general for over 30 years. Ms. Macias received a Bachelors of Science in Business from Manhattan College and an AAS, in Computer Digital Systems from PSI Institute in New York. Prior to joining Intervest National Bank, Ms. Macias served as Vice President and Director of Management Information Systems at First Central Savings Bank from April 2004 to September 2005. Prior to that, Ms. Macias served as Vice President-Director of Management Information Systems and Product Development for New York National Bank from 1983 to 2004.
40
Table of Contents
Keith A. Olsen, age 57, has served as a Director and as President of Intervest National Bank since July 2001 and February 21, 2008, respectively. Mr. Olsen served as President of the Florida Division of Intervest National Bank from July 2001 to February 21, 2008. Prior to that, Mr. Olsen was the President of Intervest Bank from 1994 until it merged into Intervest National Bank in July 2001. Mr. Olsen also served as Senior Vice President of Intervest Bank from 1991 to 1994. Mr. Olsen received an Associates degree from St. Petersburg Junior College and a Bachelors degree in Business Administration and Finance from the University of Florida, Gainesville. He is also a graduate of the Florida School of Banking of the University of Florida, Gainesville, the National School of Real Estate Finance of Ohio State University and the Graduate School of Banking of the South of Louisiana State University. Mr. Olsen has been in banking for more than 30 years.
Michael Primiani, age 50, has served as Vice President, Compliance/BSA Officer and New York Office Security Officer for Intervest National Bank since December 2005. Mr. Primiani received an Associate Degree in Business Management from Queensborough Community College. Mr. Primiani has more that 26 years of banking experience. Prior to joining Intervest National Bank, Mr. Primiani served as Vice President, BSA Officer and Branch Administrator for First Central Savings Bank from March 2001 to December 2005. Prior to that, Mr. Primiani served as Assistant Vice President and Branch Manager for Astoria Federal Savings from May 1987 to February 2001, and in various supervisory positions at Astoria Federal Savings from 1979 to 1987.
Diane S. Rathburn, age 48, has served as Vice President, Operations/Human Resource Manager of the Florida Division of Intervest National Bank since January 2003. Prior to that, Mrs. Rathburn was an Assistant Vice President, Branch Coordinator and Assistant Vice President, Branch Administrator since August 1999. Mrs. Rathburn joined Intervest National Bank in July 1991. Prior to that, Mrs. Rathburn served in a supervisory position of the Bookkeeping Department of Southeast Bank.
David B. Stroyan, age 64, has served as Vice President of the Florida Division of Intervest National Bank since November 2008. Prior to that, Mr. Stroyan was Executive Vice President and Senior Loan Officer of Bank of Central Florida and prior to that was Senior Vice President of Mercantile Bank. Mr. Stroyan received a Bachelors degree from the Georgia Institute of Technology. He is also a graduate of The School of Banking of the South at Louisiana State University. Mr. Stroyan has over 25 years of banking experience.
Robert W. Tonne, age 56, has served as Vice President and Chief Credit Officer for Intervest National Bank since February 2010. Mr. Tonne has over 30 years experience in various credit and lending functions. Mr. Tonne began his banking career with The Bank of New York in 1976. Mr. Tonne received a Masters of Business Administration from Adelphi University in 1979 and a Bachelor of Business Administration from Hofstra University in 1976. Prior to joining Intervest National Bank, Mr. Tonne served as a Senior Vice President with Sovereign Bank/Independence Community Bank since 2000. While at Sovereign/Independence, Mr. Tonne held various positions including Team Leader/Portfolio Monitoring Department and Credit Deputy for the New York Lending Team. Prior to 2000, Mr. Tonne served at Allied Irish Bank, Fleet Bank, and The Bank of New York in various credit and lending functions.
PART II
Item 5. Market for Registrant’s Common Equity, Related Stockholder Matters and Issuer Purchases of Equity Securities
Market for Securities
IBC’s Class A common stock is listed for trading on the Nasdaq Global Select Market under the symbol “IBCA.”. At January 29, 2011, there were 21,126,489 shares of Class A common stock outstanding. At December 31, 2010, there were approximately 100 holders of record of the Class A common stock and approximately 1,800 beneficial owners of the Class A common stock, which includes persons or entities that hold their stock in nominee form or in street name through various brokerage firms. The market price of the Class A common stock on the close of business on December 31, 2010 and January 31, 2011 was $2.93 and $2.63 per share, respectively.
41
Table of Contents
The following table shows the high and low sales prices per share for the Class A common stock by calendar quarter for the periods indicated. The quotations set forth below reflect inter-dealer quotations that do not include retail markups, markdowns or commissions and may not represent actual transactions.
| 2010 |
2009 |
|||||||||||||||||||
| High | Low | High | Low | |||||||||||||||||
| First quarter |
$ | 4.79 | $ | 3.29 | $ | 4.99 | $ | 1.89 | ||||||||||||
| Second quarter |
$ | 7.00 | $ | 3.86 | $ | 4.95 | $ | 2.05 | ||||||||||||
| Third quarter |
$ | 5.40 | $ | 1.93 | $ | 3.81 | $ | 2.31 | ||||||||||||
| Fourth quarter |
$ | 2.98 | $ | 1.91 | $ | 3.60 | $ | 2.80 | ||||||||||||
Common Dividends
IBC’s common stockholders are entitled to receive cash dividends when and if declared by IBC’s board of directors out of funds legally available for such purposes. No common dividends have been declared or paid since June 2008, when a cash dividend of $0.25 per share was paid on Class A and Class B Common Stock. We do not intend to pay dividends on our common stock in the foreseeable future as described below.
Preferred Dividends
In December 2008 IBC sold 25,000 shares of its Series A Preferred Stock to the U.S. Treasury and the holder of those shares is entitled to receive cumulative cash dividends when and if declared by IBC at the current annual rate of 5%, payable quarterly, including the amount of any accrued and unpaid dividends for any prior period. In February of 2010, IBC’s Board of Directors determined to suspend cash dividend payments on IBC’s common and preferred stock pursuant to a request from the FRB. At December 31, 2010, IBC had unpaid preferred stock dividends in arrears of $1.4 million. If IBC misses six quarterly dividend payments on the Series A Preferred Stock, whether or not consecutive, the U.S. Treasury will have the right to appoint two directors to IBC’s board of directors until all accrued but unpaid dividends have been paid. IBC had missed the February, May, August, and November 2010 and February 2011 dividend payments as of the date of filing of this report.
Restrictions on Payment of Dividends
IBC’s ability to pay cash dividends is limited to an amount equal to its surplus, which represents the excess of its net assets over paid-in-capital or, if there is no surplus, its net earnings for the current and/or immediately preceding fiscal year. The primary source of funds for any cash dividends payable to IBC’s stockholders would be the dividends received from IBC’s subsidiary INB. The payment of cash dividends by a subsidiary is determined by that subsidiary’s board of directors and is dependent upon a number of factors, including the subsidiary’s capital requirements, applicable regulatory limitations, results of operations and financial condition.
IBC’s ability to pay cash dividends is further limited by the funding requirements of its outstanding trust preferred securities. These securities were issued to raise additional Tier 1 capital for INB. In addition, for so long as the Series A Preferred Stock is outstanding, IBC may not declare or pay dividends on its common stock, or repurchase shares of its common stock, unless all accrued and unpaid dividends for all past dividend periods on the Series A Preferred Stock have been paid in full. Furthermore, until the earlier of December 23, 2012, or when all of the Series A Preferred Stock is no longer owned by the U.S. Treasury, subject to limited exceptions, IBC may not pay common dividends in excess of the 0.25 per share paid in 2008 without the prior consent of the U.S. Treasury.
Prior to 2010, INB paid cash dividends to IBC in order to provide funds for the debt service on IBC’s outstanding trust preferred securities and for cash dividend requirements of the Series A Preferred Stock. Total dividends paid by INB in 2009, 2008 and 2007 were $3.9 million, $3.5 million and $3.5 million, respectively. In January 2010, INB was required by its primary regulator to suspended payments of dividends. In February of 2010, the Federal Reserve Bank of New York also informed IBC that it may not, without the prior approval of the Federal Reserve Bank of New York, pay dividends on its capital stock or redeem shares of its capital stock, pay interest on or redeem IBC’s trust preferred securities or incur new debt. Accordingly IBC suspended such activities.
See the section “Supervision and Regulation” in this report for further discussion of the above restrictions.
42
Table of Contents
Share Repurchases
There were no shares of common stock repurchased in 2010 or 2009.
Equity Compensation Plans
The following table summarizes information regarding equity compensation plans as of December 31, 2010.
|
Number of securities to be warrants and rights |
Weighted average exercise price of outstanding options, warrants and rights |
Number of securities remaining available for future issuance under equity excluding securities in column (a) | ||||
| (a) | (b) | (c) | ||||
| Plans approved by stockholders (1) |
353,540 | $9.48 | 77,160 | |||
|
Plans not approved by stockholders |
- | - | - | |||
(1) These amounts exclude option held by U.S Treasury for 691,882 shares. See note 14 to the consolidated financial statements for detail on these securities.
43
Table of Contents
Stock Performance Graph
The following graph compares the cumulative total shareholder return of IBC’s Class A common stock against the cumulative total return of the Nasdaq Stock Market (U.S. companies) Composite Index, an index for banks with total assets of $1 billion to $5 billion, and the Nasdaq Bank index. The graph was prepared by SNL Financial L.C. and assumes that $100 was invested on December 31, 2005 and that all applicable dividends were reinvested. The points marked on the horizontal axis correspond to December 31 of each year. Each of the referenced indices is calculated in the same manner. The graph depicts past performance and should not be considered to be an indication of future performance.
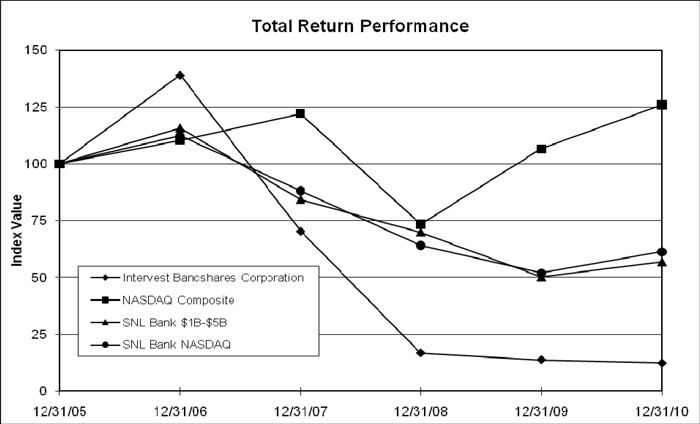
| Period Ending | ||||||||||||||||||||||||
| Index | 12/31/05 | 12/31/06 | 12/31/07 | 12/31/08 | 12/31/09 | 12/31/10 | ||||||||||||||||||
| Intervest Bancshares Corporation |
100.00 | 139.03 | 70.28 | 16.74 | 13.76 | 12.30 | ||||||||||||||||||
| NASDAQ Composite |
100.00 | 110.39 | 122.15 | 73.32 | 106.57 | 125.91 | ||||||||||||||||||
| SNL Bank $1B-$5B |
100.00 | 115.72 | 84.29 | 69.91 | 50.11 | 56.81 | ||||||||||||||||||
| SNL Bank NASDAQ |
100.00 | 112.27 | 88.14 | 64.01 | 51.93 | 61.27 | ||||||||||||||||||
44
Table of Contents
Item 6. Selected Financial Data
The table that follows should be read in conjunction with our consolidated financial statements, together with the related notes thereto, and Management’s Discussion and Analysis of Financial Condition and Results of Operation, all of which are contained elsewhere in this report. The financial information in the table is qualified in its entirety by the detailed information and financial statements appearing elsewhere in this report.
| At or For The Year Ended December 31, | ||||||||||||||||||||
| ($ in thousands, except per share data) | 2010 | 2009 | 2008 | 2007 | 2006 | |||||||||||||||
| Financial Condition Data: |
||||||||||||||||||||
| Total assets |
$2,070,868 | $2,401,204 | $2,271,833 | $2,021,392 | $1,971,753 | |||||||||||||||
| Cash and cash equivalents |
23,911 | 7,977 | 54,903 | 33,086 | 40,195 | |||||||||||||||
| Securities held to maturity, net |
614,335 | 634,856 | 475,581 | 344,105 | 404,015 | |||||||||||||||
| Loans receivable, net of deferred fees |
1,337,326 | 1,686,164 | 1,705,711 | 1,614,032 | 1,490,653 | |||||||||||||||
| Allowance for loan losses |
34,840 | 32,640 | 28,524 | 21,593 | 17,833 | |||||||||||||||
| Checking and savings deposits |
24,398 | 24,228 | 16,049 | 18,370 | 28,467 | |||||||||||||||
| Money market deposits |
436,740 | 496,065 | 328,660 | 235,804 | 224,673 | |||||||||||||||
| Certificates of deposits |
1,145,796 | 1,339,574 | 1,346,414 | 1,239,135 | 1,279,742 | |||||||||||||||
| Brokered certificates of deposits |
159,149 | 170,117 | 173,012 | 165,865 | 55,652 | |||||||||||||||
| Total deposits |
1,776,083 | 2,029,984 | 1,864,135 | 1,659,174 | 1,588,534 | |||||||||||||||
| Borrowed funds and related accrued interest payable |
84,676 | 118,552 | 149,566 | 136,434 | 172,909 | |||||||||||||||
| Available lines of credit |
688,000 | 581,000 | 457,000 | 353,000 | 377,000 | |||||||||||||||
| Preferred equity |
23,852 | 23,466 | 23,080 | - | - | |||||||||||||||
| Common equity |
162,108 | 190,588 | 188,894 | 179,561 | 170,046 | |||||||||||||||
| Asset Quality Data: |
||||||||||||||||||||
| Nonaccrual loans |
$ 52,923 | $ 123,877 | $ 108,610 | $ 90,756 | $ 3,274 | |||||||||||||||
| Foreclosed real estate, net of valuation allowance |
27,064 | 31,866 | 9,081 | - | - | |||||||||||||||
| Investment securities on a cash basis |
2,318 | 1,385 | - | - | - | |||||||||||||||
| Accruing troubled debt restructured loans |
3,632 | 97,311 | - | - | - | |||||||||||||||
| Loans 90 days past due and still accruing |
7,481 | 6,800 | 1,964 | 11,853 | - | |||||||||||||||
| Loan chargeoffs |
100,146 | 8,103 | 4,227 | - | - | |||||||||||||||
| Loan recoveries |
883 | 1,354 | - | - | - | |||||||||||||||
| Real estate chargeoffs |
15,614 | - | - | - | - | |||||||||||||||
| Impairment writedowns on security investments |
1,192 | 2,258 | - | - | - | |||||||||||||||
| Operations Data: |
||||||||||||||||||||
| Interest and dividend income |
$107,072 | $123,598 | $128,497 | $131,916 | $128,605 | |||||||||||||||
| Interest expense |
62,692 | 81,000 | 90,335 | 89,653 | 78,297 | |||||||||||||||
| Net interest and dividend income |
44,380 | 42,598 | 38,162 | 42,263 | 50,308 | |||||||||||||||
| Provision for loan losses |
101,463 | 10,865 | 11,158 | 3,760 | 2,652 | |||||||||||||||
| Net interest and dividend (expense) income after loan loss provision |
(57,083) | 31,733 | 27,004 | 38,503 | 47,656 | |||||||||||||||
| Noninterest income |
2,110 | 297 | 5,026 | 8,825 | 6,855 | |||||||||||||||
| Noninterest expenses: |
||||||||||||||||||||
| Provision for real estate losses |
15,509 | 2,275 | 518 | - | - | |||||||||||||||
| Real estate expenses (1) |
4,105 | 4,945 | 4,281 | 489 | - | |||||||||||||||
| All other noninterest expenses |
19,069 | 19,864 | 14,074 | 12,387 | 13,027 | |||||||||||||||
| (Loss) earnings before income taxes |
(93,656) | 4,946 | 13,157 | 34,452 | 41,484 | |||||||||||||||
| (Benefit) provision for income taxes |
(40,348) | 1,816 | 5,891 | 15,012 | 17,953 | |||||||||||||||
| Net (loss) earnings before preferred dividend requirements |
(53,308) | 3,130 | 7,266 | 19,440 | 23,531 | |||||||||||||||
| Preferred dividend requirements (2) |
1,667 | 1,632 | 41 | - | - | |||||||||||||||
| Net (loss) earnings available to common stockholders |
$ (54,975) | $ 1,498 | $ 7,225 | $ 19,440 | $ 23,531 | |||||||||||||||
| Per Common Share Data: |
||||||||||||||||||||
| Basic (loss) earnings per share |
$ (4.95) | $ 0.18 | $ 0.87 | $ 2.35 | $ 2.98 | |||||||||||||||
| Diluted (loss) earnings per share |
(4.95) | 0.18 | 0.87 | 2.31 | 2.82 | |||||||||||||||
| Cash dividends per share |
- | - | 0.25 | 0.25 | - | |||||||||||||||
| Book value per share (3) |
7.61 | 23.04 | 22.84 | 22.23 | 20.31 | |||||||||||||||
| Market price per share |
2.93 | 3.28 | 3.99 | 17.22 | 34.41 | |||||||||||||||
| (1) | Real estate expenses are comprised of expenditures consisting of real estate taxes, insurance, utilities and other charges required to protect our interest in real estate acquired through foreclosure and properties collateralizing our nonaccrual loans. |
| (2) | Represents dividend requirements on preferred stock held by the U.S. Treasury and amortization of related preferred stock discount. |
| (3) | Represents total common stockholders’ equity less preferred stock dividends in arrears (of $1.4 million only at December 31, 2010) divided by the number of common shares outstanding. |
45
Table of Contents
Item 6. Selected Financial Data, Continued
| At or For The Year Ended December 31, | ||||||||||||||||||||
| ($ in thousands) | 2010 | 2009 | 2008 | 2007 | 2006 | |||||||||||||||
| Other Data and Ratios: |
||||||||||||||||||||
| Common shares outstanding |
21,126,489 | 8,270,812 | 8,270,812 | 8,075,812 | 8,371,595 | |||||||||||||||
| Common stock warrants and options outstanding |
1,045,422 | 1,019,722 | 959,512 | 332,640 | 195,000 | |||||||||||||||
| Average common shares outstanding used to calculate: |
||||||||||||||||||||
| Basic (loss) earnings per common share |
11,101,196 | 8,270,812 | 8,259,091 | 8,275,539 | 7,893,489 | |||||||||||||||
| Diluted (loss) earnings per common share |
11,101,196 | 8,270,812 | 8,267,781 | 8,422,017 | 8,401,379 | |||||||||||||||
| Adjusted net (loss) earnings used for diluted (loss) earnings per common share |
$ (54,975) | $ 1,498 | $ 7,225 | $ 19,484 | $ 23,679 | |||||||||||||||
| Net interest margin |
2.11% | 1.83% | 1.79% | 2.11% | 2.75% | |||||||||||||||
| Return on average assets |
-2.42% | 0.13% | 0.34% | 0.96% | 1.28% | |||||||||||||||
| Return on average common equity |
-32.20% | 1.65% | 3.94% | 11.05% | 15.82% | |||||||||||||||
| Noninterest income to average assets |
0.10% | 0.01% | 0.23% | 0.44% | 0.37% | |||||||||||||||
| Noninterest expenses to average assets (4) |
0.87% | 0.84% | 0.65% | 0.61% | 0.71% | |||||||||||||||
| Nonperforming assets to total assets (5) |
3.86% | 6.49% | 5.18% | 4.49% | 0.17% | |||||||||||||||
| Nonaccrual loans to total gross loans |
3.94% | 7.31% | 6.33% | 5.59% | 0.22% | |||||||||||||||
| Loans, net of unearned income to deposits |
76% | 83% | 92% | 97% | 94% | |||||||||||||||
| Loans, net of unearned income to deposits (bank only) |
72% | 79% | 85% | 88% | 84% | |||||||||||||||
| Allowance for loan losses to total net loans |
2.61% | 1.94% | 1.67% | 1.34% | 1.20% | |||||||||||||||
| Allowance for loan losses to nonaccrual loans |
66% | 26% | 26% | 24% | 545% | |||||||||||||||
| Efficiency ratio (6) |
41% | 46% | 33% | 24% | 23% | |||||||||||||||
| Average stockholders’ equity to average total assets |
8.60% | 9.03% | 8.55% | 8.69% | 8.06% | |||||||||||||||
| Stockholders’ equity to total assets |
8.98% | 8.91% | 9.33% | 8.88% | 8.62% | |||||||||||||||
| Tier 1 capital to average assets |
10.06% | 11.17% | 12.21% | 11.59% | 11.43% | |||||||||||||||
| Tier 1 capital to risk-weighted assets |
13.56% | 14.18% | 14.27% | 13.53% | 13.85% | |||||||||||||||
| Total capital to risk-weighted assets |
14.83% | 15.44% | 15.52% | 14.78% | 14.95% | |||||||||||||||
| (4) | For purposes of this calculation, noninterest expenses excludes real estate expenses and provisions for real estate losses. |
| (5) | Ratio excludes $2.3 million and $1.4 million of securities on a cash basis of accounting at December 31, 2010 and 2009, respectively. |
| (6) | Defined as noninterest expenses (excluding provisions for real estate losses and real estate expenses) as a percentage of net interest and dividend income plus noninterest income. |
Item 7. Management’s Discussion and Analysis of Financial Condition and Results of Operations
General
This section presents discussion and analysis of our financial condition at December 31, 2010 and 2009, and our results of operations for each of the three years in the period ended December 31, 2010. This section should be read in conjunction with our accompanying consolidated financial statements in this report. For a detailed discussion of our business, see Item 1 “Business” in this report.
Critical Accounting Policies
General. The preparation of our consolidated financial statements and the information included in management’s discussion and analysis is governed by policies that are based on accounting principles generally accepted in the United States (GAAP) and general practices within the banking industry. The financial information contained in our financial statements is, to a significant extent, based on measures of the financial effects of transactions and events that have already occurred. A variety of factors could affect the ultimate value that is obtained either when earning income, recognizing an expense, recovering an asset or relieving a liability. In addition, GAAP itself may change from one previously acceptable method to another method.
An accounting policy is deemed to be “critical” if it is important to a company’s results of operations and financial condition, and requires significant judgment and estimates on the part of management in its application. The preparation of financial statements and related disclosures in conformity with GAAP requires management to make estimates and assumptions that affect certain amounts reported in the financial statements and related disclosures. Actual results could differ from these estimates and assumptions. We believe that the estimates and assumptions used in connection with the amounts reported in our consolidated financial statements and related disclosures are reasonable and made in good faith.
46
Table of Contents
We consider our critical accounting policies to be those that relate to the determination of the following: our allowance for loan losses; our valuation allowance for real estate losses; other than temporary impairment assessments of our security investments; and the need for and amount of a valuation allowance for our deferred tax asset. These items are considered critical accounting estimates because each is highly susceptible to change from period to period and require us to make numerous assumptions about a variety of information that directly affect the calculation of the amounts reported in our consolidated financial statements. For example, the impact of a large unexpected chargeoff could deplete the allowance for loan losses and potentially require us to record increased loan loss provisions to replenish the allowance, which could negatively affect our operating results and financial condition. For a summary of our other significant accounting policies, see note 1 to the consolidated financial statements in this report.
Allowance for Loan Losses. The allowance for loan losses reflects our judgment as to the estimated credit losses that may result from defaults in our loan portfolio. The allowance for loan losses is established through a loan loss provision charged to expense. Loans are charged off against the allowance when we believe that the collection of any portion of the principal amount of the loan balance is confirmed as a loss. Subsequent recoveries of previous chargeoffs are added back to the allowance. We evaluate the adequacy of our allowance for loan losses at least quarterly or more frequently when necessary. This evaluation is inherently subjective as it requires us to make estimates that are susceptible to significant revision as more information becomes available. The allowance consists of specific and general components. For loans that are not impaired, the general component of the allowance is based on a number of factors. We begin with our actual historical loss experience by major loan category expressed as a percentage of outstanding loans. Because actual loss experience may not adequately predict the level of losses inherent in a portfolio, we then review other qualitative factors to determine if our historical loss rate should be increased or decreased based upon a review of those factors. Our evaluation considers the following qualitative factors.
(i) Size of our loans. Our loan portfolio has many individual loans with large principal balances. At December 31, 2010, the average real estate loan was $2.2 million, with the largest loan being $16.3 million. In addition, loans of $5 million or more represented approximately 38% of the loan portfolio. These indicators have improved slightly for a number of quarters as new loan originations have been curtailed dramatically since the middle of 2009 and those loans that were originated were smaller balance loans. The default of a larger size loan may have a greater negative impact on our lending losses.
(ii) Concentrations of our loans. Our loan portfolio is concentrated in loans secured by commercial and multifamily real estate, including some properties that are vacant or substantially vacant and vacant land, all of which are generally considered to have more credit risk than traditional 1-4 family residential lending because these loans tend to involve larger loan balances to single borrowers and their repayment is typically dependent upon the successful operation of the underlying real estate for income-producing properties. Additionally, loans on vacant properties and land typically do not have adequate or any income streams and depend upon other sources of cash flow from the borrower for repayment. The number of vacant land loans in the portfolio, while never a substantial amount relative to the entire portfolio, has decreased substantially over the last several years and currently represents approximately 1% of the portfolio or $13 million. These vacant land loans are personally guaranteed. The properties that collateralize our loans are also concentrated in two states, New York (68%) and Florida (23%), and many are located in geographical areas of those states that are being revitalized or redeveloped, which are negatively impacted to a greater degree in an economic downturn. Both of these states have experienced weak economic conditions, high rates of unemployment, increased office and retail vacancy rates and lower real estate values. Additionally, many of the multifamily properties located in New York City and surrounding boroughs are also subject to rent control and rent stabilization laws, which limit the ability of the property owners to increase rents, which may in turn limit the borrower’s ability to repay those mortgage loans. All of the above factors increase the risk profile of our loan portfolio.
(iii) Changes in our review of specific problem loans, including loans on nonaccrual status, and estimates of fair value of the underlying properties. When a loan experiences payment problems, an internal review is initiated by our Chief Credit Officer to re-evaluate the internal credit rating that is assigned to the loan.
47
Table of Contents
We also engage an independent third party to perform quarterly reviews of the portfolio, which includes all problem loans. Nonaccrual and/or problem loans are normally downgraded based on known facts and circumstances at the time of review, which includes the review of rent rolls, financial statements and strength of borrower’s repayment sources and a physical inspection and a determination of the estimated fair value of the collateral property. Estimates of fair value are determined based on a variety of information, including available appraisals and the knowledge and experience of our two senior lending officers and chief credit officer related to values of properties in our lending market areas. Our policy is to obtain externally prepared appraisals or other indications of value for all new, restructured, or renewed loans; upon the classification or downgrade of a loan; and upon foreclosure and transfer of a loan to foreclosed real estate, and at least annually thereafter for all impaired loans and real estate owned. In addition to appraisals, consideration is also given to the type, location and occupancy of the property and current economic conditions in the area the property is located in assessing estimates of fair value. We believe our process of reviewing loans and determining estimated fair values is effective.
(iv) Changes in the volume of our past due loans, nonaccrual loans and adversely classified assets. On May 25, 2010, we sold a total of $192.6 million of certain non-performing and underperforming loans in a bulk sale in order to expedite the resolution of such assets. Due to the then market conditions, the assets were sold at a significant discount to their net carrying values. This transaction significantly decreased our nonaccrual and problem loans. In addition, our special mention and substandard rated loans decreased from approximately $131 million and $178 million, respectively, prior to the bulk sale to approximately $40 million and $86 million, respectively, at December 31, 2010. In determining our historical loss rate, we excluded the effect of the May 2010 bulk sale since these assets were sold substantially below their net carrying values as we were required to expedite the reduction of our problem assets during a time when the financial markets were volatile and real property values were depressed. A transaction that is unusual and deemed not reflective of normal charge-off history can be excluded from an historical analysis and we believe the net result of the bulk sale is not indicative of the ultimate losses that would have occurred had the assets been resolved on an individual basis, over time and not on a steeply discounted immediate bulk sale basis.
(v) Adverse situations which may affect our borrowers’ ability to repay. Nonaccrual/problem loans are reviewed individually based on the facts and circumstances known to us at that time. An assessment is made as to whether there are specific issues unique to each loan or borrower that caused the problem or whether such issues identified are generic/systemic to the entire or a large portion of the loan portfolio and as such increase the risk profile of the loan portfolio. In addition to the negative impact from the weak economy, high rates of unemployment, and increased office and retail vacancy rates, we believe that a large number of our loans that became nonaccrual also had specific issues unique to each loan that resulted in the loan being classified as nonaccrual.
(vi) Changes in national, regional and local (New York and Florida) economic and business conditions and other developments that may affect the collectability of our loan portfolio, including impacts of political, regulatory, legal and competitive changes on the portfolio. We continually monitor real estate market and economic conditions, both locally in our lending areas and on a national level. The monitoring process is done through the review of various publications, discussions with brokers and existing customers and analysis of market rents. The economy and commercial and multifamily real estate markets both nationally and in our New York and Florida markets remain weak, although they show signs of improvement. Political and regulatory issues, including armed conflicts and acts of terrorism, or natural disasters such as hurricanes, may have an adverse impact on economic conditions as a whole and may be more pronounced on loans in specific geographic regions.
(vii) Changes to our lending policies and procedures, underwriting standards, risk selection (loan volumes and loan terms) and to our collection, loan chargeoff and recovery practices. We have not relaxed any of these policies, procedures and practices. Furthermore, we believe that we have become more risk averse over the last year by being more selective in originating new loans. The loan-to-value ratio (the ratio that the original principal amount of the loan bears to the lower of the purchase price or appraised value of the property securing the loan at the time of origination) on a new loan normally does not exceed 75%.
48
Table of Contents
The debt service coverage ratio (the ratio of the net operating income generated by the property securing the loan to the required debt service) on a new loan typically is not less than 1.2 times. We have also enhanced our loan monitoring procedures by creating penetration reports and enhancing exception reports evidencing various types of financial or performance data of the collateral property, and accelerating the ordering of new appraisals when loans are experiencing difficulty. In addition, reviews and action plans are updated on a quarterly basis for all classified loans.
(viii) Changes in the experience, ability and depth of our lending management and other relevant staff. During 2010, we hired a Chief Credit Officer with 25 years of experience who reviews the assignment of credit ratings for all loans and attends all loan committee meetings and provides his input. We also added to and expect to continue to expand the number of our loan relationship managers to monitor our loans. These changes coupled with the depth of our existing staff and the substantial experience of our Chairman and President in commercial and multifamily real estate lending have had a positive effect on this qualitative factor. We believe there is substantial experience on our lending and underwriting staff and on our Loan Committee.
In addition the general component discussed earlier, the specific component of the allowance relates to loans that are impaired. A loan is normally deemed impaired when, based upon current information and events, it is probable that we will be unable to collect both principal and interest due according to the contractual terms of the loan agreement. We consider a variety of factors in determining whether a loan is impaired, including (i) any notice from the borrower that the borrower will be unable to repay all principal and interest amounts contractually due under the loan agreement, (ii) any delinquency in the principal and/or interest payments other than minimal delays or shortfalls in payments, and (iii) other information known by us that would indicate the full repayment of principal and interest is not probable. We generally consider delinquencies of 60 days or less to be minimal delays, and accordingly do not consider such delinquent loans to be impaired in the absence of other indications.
Our impaired loans normally consist of loans on nonaccrual status and those classified as troubled debt restructurings (TDRs). Generally, impairment for all of our loans is calculated on a loan-by-loan basis using either the estimated fair value of the loan’s collateral less estimated selling costs (for collateral dependent loans) or the present value of the loan’s cash flows (for non-collateral dependent loans). Any calculated impairment is recognized as a valuation allowance within the overall allowance for loan losses and a charge through the provision for loan losses. We may charge off any portion of the impaired loan with a corresponding decrease to the valuation allowance when such impairment is deemed uncollectible. The net carrying amount of an impaired loan (net of the valuation allowance) does not at any time exceed the recorded investment in the loan.
Valuation Allowance for Real Estate Losses. We maintain a valuation allowance for real estate we acquire through foreclosure. We estimate the fair value of our real estate in the same manner as impaired loans. As the properties are actively marketed for sale, we may periodically adjust the carrying values of the real estate to reflect changes in fair values resulting from changing market conditions through an increase to the valuation allowance for real estate losses and a charge to the provision for real estate losses.
We believe, based on information known to us at December 31, 2010, that the level of our allowance for loan losses and valuation allowance for real estate losses was adequate to cover estimated losses in our loan and real estate owned portfolios at such date. Although we believe we use the best information available to make determinations with respect to these allowances, future adjustments to one or both allowances may be necessary if facts and circumstances differ from those previously assumed in their determination. For example, a prolonged downturn in real estate values and economic conditions could have an adverse impact on our asset quality and may result in a higher level of losses than we have provide for which would result in additional loss provisions.
Additionally, our regulators, as an integral part of their examination process, periodically review both of these allowances based on the regulators’ judgment concerning information available to them during their examination process as well as other factors they utilize for all banks. Accordingly, they may require us to take certain chargeoffs and/or recognize additions to the allowances based on their judgments.
49
Table of Contents
Valuation Allowance for Deferred Tax Assets. At December 31, 2010, we determined that we were not required to maintain a valuation allowance for our deferred tax asset. The need for as well as adjustments (increases or decreases) to the deferred tax asset valuation allowance is determined by us based upon changes in the expected realization of the deferred tax assets.
We evaluate our deferred tax assets for recoverability quarterly based on all available evidence. This process involves significant judgment on our part and includes assumptions that are subject to change from period to period based on changes in tax laws or variances between our projected earnings and our actual results. We are required to establish a valuation allowance for deferred tax assets if we determine, based on available evidence at the time the determination is made, that it is more likely than not that some portion or all of the deferred tax assets will not be fully realized. In evaluating the more-likely-than-not criterion, we consider all positive and negative evidence as of the end of each reporting period. The realization of our deferred tax assets ultimately depends on the existence of sufficient future taxable income in the carryforward period under the tax law. Due to significant estimates utilized in establishing the valuation allowance and the potential for changes in facts and circumstances, we may be required to establish and/or record adjustments to the valuation allowance in future reporting periods. Such a charge could have a material adverse effect on our results of operations, financial condition and regulatory capital position.
As disclosed in greater detail in note 15 to the consolidated financial statements in this report, at December 31, 2010, we had a deferred tax asset in the amount of $47 million, which includes a gross net operating loss carryfoward (NOL) totaling $61 million (representing $27 million of the total deferred tax asset). We have determined that a valuation allowance was not required at any time during the reporting periods in this report because we believe that it is more likely than not that our deferred tax asset will be fully realized. This conclusion is based on our prior earnings history (exclusive of the NOL generated in the second quarter of 2010) coupled with evidence (such as our profitable fourth quarter of 2010) indicating that we will be able to generate an adequate amount of future taxable income over a reasonable period of time to fully utilize the deferred tax asset. Our ability to realize our deferred tax asset could be reduced in the future if our estimates of future taxable income from our operations and tax planning strategies do not support the realization of our deferred tax asset.
We also need to consider that the amount of our NOLs and certain other tax attributes realizable for income tax purposes may be reduced under Section 382 of the Internal Revenue Code by sales of our common stock, including transactions in the open market by 5% or greater shareholders, if an ownership change is deemed to have occured under Section 382 of the Internal Revenue Code by such sales. The determination of whether an ownership change has occurred is highly fact specific and can occur through one or more acquisitions of capital stock (including open market trading) if the result of such acquisitions is that the percentage of our outstanding common stock held by shareholders or groups of shareholders owning at least 5% of our common stock at the time of such acquisition, as determined under Section 382, is more than 50 percentage points higher than the lowest percentage of our outstanding common stock owned by such shareholders or groups of shareholders within the prior three-year period.
As discussed in note 11 to the consolidated financial statements included in this report, in May, October and November 2010, IBC sold to various investors 850,000, 10,600,000 and 1,086,377 shares of its Class A common stock, respectively. We have determined based on an internal analysis that the completion of these transactions did not result in a change of control as defined by Section 382, although no assurance can be given that taxing authorities would agree with such determination. The combination of these sales with any future sales of IBC’s common stock during the period defined above, could increase the risk of a change in control as determined under Section 382 and result in the partial loss of the availability of our NOLs, which would require us to expense a portion of our then deferred tax asset amount.
Other Than Temporary Impairment Charges on Security Investments. For a discussion of the factors and estimates used in assessing for and computing other than temporary impairment charges on our security investments, see notes 1 and 2 to the consolidated financial statements.
50
Table of Contents
Comparison of Financial Condition at December 31, 2010 and 2009.
A comparison of selected consolidated balance sheet information follows:
| At December 31, 2010 | At December 31, 2009 | |||||||||||||||||||
| ($ in thousands) | Carrying Value |
% of Total Assets |
Carrying Value |
% of Total Assets |
||||||||||||||||
| Cash and cash equivalents |
$ | 23,911 | 1.2% | $ | 7,977 | 0.3% | ||||||||||||||
| Security investments |
623,990 | 30.1 | 645,564 | 26.9 | ||||||||||||||||
| Loans receivable, net of deferred fees and allowance for loan losses |
1,302,486 | 62.9 | 1,653,524 | 68.9 | ||||||||||||||||
| Foreclosed real estate, net of valuation allowance |
27,064 | 1.3 | 31,866 | 1.3 | ||||||||||||||||
| All other assets |
93,417 | 4.5 | 62,273 | 2.6 | ||||||||||||||||
| Total assets |
$ | 2,070,868 | 100.0% | $ | 2,401,204 | 100.0% | ||||||||||||||
| Deposits |
$ | 1,766,083 | 85.3% | $ | 2,029,984 | 84.5% | ||||||||||||||
| Borrowed funds and related interest payable |
84,676 | 4.1 | 118,552 | 5.0 | ||||||||||||||||
| All other liabilities |
34,149 | 1.6 | 38,614 | 1.6 | ||||||||||||||||
| Total liabilities |
1,884,908 | 91.0 | 2,187,150 | 91.1 | ||||||||||||||||
| Total stockholders’ equity |
185,960 | 9.0 | 214,054 | 8.9 | ||||||||||||||||
| Total liabilities and stockholders’ equity |
$ | 2,070,868 | 100.0% | $ | 2,401,204 | 100.0% | ||||||||||||||
General
Consolidated assets at December 31, 2010 decreased by $330 million, or 14%, to $2.07 billion, from $2.40 billion at December 31, 2009, primarily reflecting a decrease in loans receivable and security investments, partially offset by increases in cash equivalents and all other assets. The net reduction in the size of our balance sheet in 2010 was the result of several factors discussed below.
On May 25, 2010, in order to accelerate the reduction of our problem assets, we completed a transaction to remove a large portion of our problem assets from our balance sheet. We sold in bulk certain non-performing and underperforming loans on commercial real estate and multifamily properties and some real estate owned. The assets sold aggregated to approximately $207 million and consisted of $192.6 million of loans and $14.4 million of real estate owned. All of the assets were sold at a substantial discount to their net carrying values of $197.7 million for an aggregate purchase price of $121.5 million, or $119.1 million after selling costs. As a result of this bulk sale, we recorded a $78.7 million combined provision for loan and real estate losses, which contributed approximately $44 million to our net loss of $55.0 million for 2010. At December 31, 2010, our deferred tax asset increased by $29 million from December 31, 2009 to $47.1 million. A large portion of the increase was attributable to the tax-effect of the net operating loss carryfoward generated by this bulk sale transaction.
Also contributing to the decrease in our balance sheet was higher regulatory capital requirements applicable to INB. During 2010, INB gradually reduced its balance sheet by decreasing its deposit rates and encouraging net deposit outflow, repaying its borrowed funds as they matured and decreasing the volume of its new loan originations from historical levels. These actions accounted for an additional $123 million net decrease in our balance sheet, which positively impacted our regulatory capital ratios.
In order to increase INB’s regulatory capital, IBC raised additional capital in 2010. In May, IBC sold in a private placement 850,000 shares of its Class A common stock at a price of $5.00 per share for net proceeds of approximately $4.0 million. In October, IBC sold in an underwritten public offering 10,600,000 shares of its Class A common stock at a price of $1.95 per share for net proceeds of approximately $19.1 million. In November, the underwriter of the public offering exercised a portion of its over-allotment option to purchase an additional 1,086,377 shares of Class A common stock at a price of $1.95 per share for additional net proceeds of approximately $1.9 million. IBC invested nearly all of the proceeds totaling $25.0 million from these transactions as capital contributions to INB. INB’s capital ratios at December 31, 2010 were in excess of its regulatory capital requirements. See the section “Supervision and Regulation” and notes 11 and 20 to the consolidated financial statements in this report for more information regarding our capital requirements as well as a discussion of our formal agreements with our regulators.
51
Table of Contents
Cash and Cash Equivalents
Cash and cash equivalents include interest-bearing and noninterest-bearing cash balances with banks, and other short-term investments that have original maturities of three months or less. Cash and cash equivalents increased to $24 million at December 31, 2010 from $8 million at December 31, 2009. The level of cash and cash equivalents fluctuates based on various factors, including our liquidity needs, loan demand, deposit flows, calls of securities, repayments of borrowed funds and alternative investment opportunities. See the section “Liquidity and Capital Resources” in this report for a discussion of our liquidity.
Security Investments
Security investments consist of securities held to maturity and Federal Reserve Bank (FRB) and Federal Home Loan Bank of New York (FHLB) stock. Securities are classified as held to maturity and are carried at amortized cost when we have the intent and ability to hold them to maturity. Such investments, all of which are held by INB, decreased to $614 million at December 31, 2010, from $635 million at December 31, 2009. The decrease reflected $766 million of calls, $26 million of maturities, a $24 million transfer to the available-for-sale portfolio and $1.2 million of impairment writedowns. The aggregate of these items exceeded $798 million of new purchases during the period. In 2010, INB’s investment portfolio experienced a high level of calls by the issuers due to the low interest rate environment.
In March 2010, securities held to maturity with a carrying value of $24.1 million (estimated fair value of $24.8 million) were transferred to the available-for-sale category and promptly sold. A gain of $0.7 million was realized from this transaction. The securities sold consisted of non-callable, fixed-rate U.S. government agency securities that were scheduled to mature at various times from 2011 through 2013. This transaction was undertaken as one of the steps to enhance INB’s capital levels in response to its higher regulatory capital requirements. At December 31, 2010 and 2009, there were no securities classified as available for sale.
At December 31, 2010, securities held to maturity consisted of investment grade rated debt obligations of the Federal Home Loan Bank, Federal Farm Credit Bank, Federal National Mortgage Association and Federal Home Loan Mortgage Corporation totaling $609.7 million and noninvestment grade rated corporate securities (consisting of variable-rate pooled trust preferred securities backed by obligations of companies in the banking industry) totaling $4.6 million. As discussed in more detail in note 2 to the consolidated financial statements in this report, impairment charges totaling $3.5 million have been recorded on these trust preferred security investments.
At December 31, 2010, the held to maturity portfolio had a weighted-average yield to earliest call date of 1.63% and a weighted-average remaining contractual maturity of 5.0 years. Nearly all of the securities have fixed interest rates or have predetermined rate increases and call features that allow the issuer to call the security before its stated maturity without penalty. Over the next twelve months, approximately $290 million of securities in the portfolio could potentially be called assuming interest rates remain at or near levels as of December 31, 2010. A large portion of the resulting proceeds would then be reinvested into similar securities and potentially at lower rates. Securities with call features routinely have higher yields than securities with non-callable features with the same maturity at the time of purchase. However, the lack of call protection or the expiration of the non-callable period of the security will most likely result in the early call of securities in a declining or flat rate environment, which results in re-investment risk of the proceeds.
At December 31, 2010 and 2009, the held-to-maturity portfolio’s estimated fair value was $607 million and $631 million, respectively. At December 31, 2010, the portfolio had a net unrealized loss of $7.7 million, compared to a net unrealized loss of $4.3 million at December 31, 2009. See note 2 to the consolidated financial statements in this report for information on and a discussion of unrealized losses. For additional historical information on the securities portfolio, see the caption entitled “Security Investment Activities” in Item 1 “Business” of this report.
52
Table of Contents
In order for INB to be a member of FRB and FHLB, INB must maintain an investment in the capital stock of each entity, which amounted to $5.2 million and $4.4 million, respectively, at December 31, 2010. The FRB stock has historically paid a dividend of 6%, while the FHLB stock dividend fluctuates quarterly and was most recently at the rate of 6.50% for the quarter ended December 31, 2010. The total required investment fluctuates based on INB’s capital level for the FRB stock and INB’s loans and outstanding FHLB borrowings for the FHLB stock.
Loans Receivable, Net of Deferred Fees
Total loans receivable, net of unearned fees, amounted to $1.33 billion at December 31, 2010, a $349 million decrease from $1.68 billion at December 31, 2009. The decrease was due to $286 million of principal repayments (resulting from the bulk sale of loans, other loan payoffs and normal amortization), $41 million of loans transferred to real estate owned and $100 million of loan chargeoffs (which included approximately $80 million of chargeoffs related to the bulk sale), partially offset by $77 million of new loan originations.
The new loan originations are secured primarily by commercial real estate and the loans are nearly all fixed-rate with a weighted-average yield and term of 6.17% and 4.9 years, respectively. The terms of these loans have largely been a function of the demand by borrowers for longer-term, fixed-rate product that has been driven by the historically low interest rate environment. We expect this demand for longer-term, fixed-rate product to continue for the foreseeable future. Fixed-rate loans constituted approximately 78% of the consolidated loan portfolio at December 31, 2010. See the section “Asset and Liability Management” for a further discussion of fixed-rate loans.
New loan originations for 2010 decreased from $200 million in 2009, reflecting the effects of a decrease in suitable lending opportunities for us as well as INB’s efforts to shrink its balance sheet and maintain its loan portfolio at a prudent level relative to its increased capital requirements.
For additional information on and discussion of the loan portfolio, see the section entitled “Lending Activities” in Item 1 “Business” of this report.
Nonaccrual and Restructured Loans (Impaired Loans)
Nonaccrual loans decreased to $52.9 million (or 15 loans) at December 31, 2010, from $123.9 million (or 34 loans) at December 31, 2009. Loans classified as troubled debt restructurings (TDRs) decreased to $3.6 million (or 2 loans) at December 31, 2010, from $97.3 million (or 18 loans) at December 31, 2009.
As a result of the bulk sale of assets described earlier, our impaired loans (nonaccrual loans and TDRs) decreased substantially from December 31, 2009. TDRs are loans on which INB has granted certain concessions to provide payment relief to the borrower. These concessions generally consist of the deferral of principal and or interest payments for a period of time, or a partial reduction in interest payments. In the third quarter of 2010, INB re-classified approximately $21 million of performing TDRs to nonaccrual status based on regulatory guidance. These TDRs continue to pay as agreed under their renegotiated terms. At December 31, 2010, a specific valuation allowance (included as part of the overall allowance for loan losses) in the amount of $7.1 million was maintained on nonaccrual loans and $0.1 million for TDRs.
At December 31, 2010, there were three loans totaling $7.5 million that were classified as ninety days past due and still accruing interest. These loans were past their maturity date but the borrowers were making monthly loan payments. The majority of these loans are expected to be extended at market terms. In addition to our nonaccrual loans and TDRs, at December 31, 2010, there were an additional 11 loans totaling $29.5 million for which there were concerns regarding the ability of the borrowers to meet existing repayment terms. These loans are classified as substandard for regulatory purposes and reflect the distinct possibility, but not the probability, that we will not be able to collect all amounts due according to the contractual terms of the loan. Such loans may never become delinquent, nonaccrual or impaired. Potential problem loans are considered in the determination of the overall adequacy of the allowance for loan losses.
For additional information on and discussion of nonaccrual loans, TDRs and potential problem loans, see the section entitled “Asset Quality” in Item 1 “Business” of this report.
53
Table of Contents
Allowance for Loan Losses
The allowance for loan losses amounted to $34.8 million at December 31, 2010, compared to $32.6 million at December 31, 2009. The allowance represented 2.61% of total loans (net of deferred fees) outstanding at December 31, 2010, compared to 1.94% at December 31, 2009. The net change in the allowance in 2010 was due to $101.5 million of loan loss provisions and $0.9 million of recoveries, nearly all of which was offset by $100.1 million of chargeoffs. Approximately $80 million of the chargeoffs and $73.4 million of the provisions was attributable to the bulk sale. Approximately $28.1 million of the provisions was attributable to the following factors: credit rating downgrades on various loans; lower estimates of value on several collateral properties resulting in loan chargeoffs; our assessment of the continued weakness in the economies and commercial real estate markets in Florida and New York and their impact on our loan portfolio; and input received from INB’s primary regulator.
At December 31, 2010 and 2009, the allowance for loan losses included a specific valuation allowance in the aggregate amount of $7.2 million and $13.8 million, respectively, for total nonaccrual and restructured loans, all of which are considered impaired loans. The reduction in the valuation allowance was due to the chargeoffs attributable to the bulk sale and a lower level of impaired loans.
For additional information on and discussion of the allowance for loan losses, see the caption entitled “Allowance for Loan Losses” in Item 1” Business” of this report. For a discussion of the criteria used to determine the adequacy of the allowance for loan losses, see the section entitled “Critical Accounting Policies” at the beginning of Item 7 of this report.
Foreclosed Real Estate
Real estate acquired through foreclosure, net of a valuation allowance, amounted to $27.0 million at December 31, 2010, compared to $31.8 million at December 31, 2009. For additional information on and discussion of foreclosed real estate, see the section entitled “Asset Quality” in Item 1 “Business” of this report.
All Other Assets
The following table sets forth the composition of all other assets:
| At December 31, | ||||||||
| ($ in thousands) | 2010 | 2009 | ||||||
| Accrued interest receivable |
$ | 8,925 | $ | 11,196 | ||||
| Loan fees receivable |
5,470 | 7,890 | ||||||
| Income tax receivable |
11,985 | - | ||||||
| Premises and equipment, net |
4,612 | 4,924 | ||||||
| Deferred income tax asset |
47,079 | 18,044 | ||||||
| Deferred debenture offering costs, net |
853 | 890 | ||||||
| Investment in unconsolidated subsidiaries |
1,702 | 1,702 | ||||||
| Deferred issuance costs from brokered CDs |
813 | 1,182 | ||||||
| Prepaid deposit insurance assessments |
11,204 | 15,765 | ||||||
| All other |
774 | 680 | ||||||
| $ | 93,417 | $ | 62,273 | |||||
Accrued interest receivable fluctuates based on the level of interest-earning assets and the timing of interest payments received. Loan fees receivable are fees due to us in accordance with the terms of our mortgage loans. Such amounts are generally due upon the full repayment of the loan. This fee is recorded as deferred income at the time a loan is originated and is then amortized to interest income over the life of the loan as a yield adjustment. The decrease was due to payments exceeding new fees that were charged on new loan originations as well as a lower level of new originations.
The increase in income tax receivable is due to the projected partial carryback of the NOL generated in the second quarter of 2010. This receivable represents mostly federal income taxes we paid on our taxable income in 2008 and 2009 that are refundable under NOL carryback rules. This receivable is expected to be collected from the Internal Revenue Service shortly after completion and filing of our 2010 federal income tax return in 2011. Premises and equipment decreased as purchases were more than offset by normal depreciation and amortization.
54
Table of Contents
The deferred tax asset relates to the unrealized benefit for net temporary differences between the our financial statement carrying amounts of existing assets and liabilities and their respective tax bases that will result in future income tax deductions. Such items are normally comprised of the allowance for loan losses, valuation allowance for real estate losses and capitalized real estate expenses, all of which will become tax deductible when actual chargeoffs are incurred, and our net operating loss carryforward that can be used to offset future taxable income. The increase in the deferred tax asset was attributable to the tax-effect of the net operating loss carryforward generated by bulk sale transaction in May 2010. See the section “Critical Accounting Policies” and note 15 to the consolidated financial statements in this report for further discussion of the deferred tax asset.
Deferred debenture offering costs consist primarily of underwriters’ commissions and are amortized over the terms of the debentures. The net decrease was due to normal amortization. The investment in unconsolidated subsidiaries consists of IBC’s total common stock investment in its wholly owned business trusts, Intervest Statutory Trust II, III, IV and V.
Prepaid deposit insurance assessments relates to the unamortized portion of the estimated amount of INB’s FDIC insurance premiums for 2011 and 2012 that was prepaid by INB on December 30, 2009. This prepayment requirement was imposed on all FDIC insured institutions in order to recapitalize the Deposit Insurance Fund. The prepaid asset will be charged to expense during the future periods to which it relates. Deferred issuance costs from brokered deposits decreased due to normal amortization. These costs are being amortized to interest expense over the life of the deposits.
Deposits
Deposits at December 31, 2010 decreased to $1.77 billion from $2.03 billion at December 31, 2009, due to a $204.7 million decrease in time deposits and a $59.3 million decrease in money market deposit accounts, resulting from INB’s planned shrinkage through a reduction in its deposit rates. At December 31, 2010, certificate of deposit accounts totaled $1.31 billion, and checking, savings and money market accounts aggregated to $461 million. The same categories of deposit accounts totaled $1.51 billion and $520 million, respectively, at December 31, 2009. Certificate of deposit accounts represented 73.9% of total consolidated deposits at December 31, 2010, compared to 74.4% at December 31, 2009. At December 31, 2010 and 2009, certificate of deposit accounts included $159 million and $170 million of brokered deposits, respectively.
For additional information on and discussion of deposits, see the section entitled “Sources of Funds” in Item 1 “Business” of this report.
Borrowed Funds and Related Interest Payable
The following table summarizes borrowed funds and related interest payable:
| At December 31, 2010 | At December 31, 2009 | |||||||||||||||
| ($ in thousands) | Principal | Accrued Interest |
Principal | Accrued Interest |
||||||||||||
| Debentures Capital Securities - IBC |
$56,702 | $2,262 | $ 56,702 | $85 | ||||||||||||
| FHLB advances - INB |
25,500 | 64 | 61,500 | 98 | ||||||||||||
| Mortgage note payable - INB |
148 | - | 167 | - | ||||||||||||
| $82,350 | $2,326 | $118,369 | $183 | |||||||||||||
Borrowed funds and related interest payable decreased to $85 million at December 31, 2010, from $118 million at December 31, 2009, due to the maturity and repayment of $36 million of FHLB borrowings, partially offset by a $2.2 million increase in accrued interest payable on junior subordinated notes relating to IBC’s outstanding trust preferred securities.
For additional information on and discussion of borrowed funds, see notes 8 through 10 to the consolidated financial statements included in this report, as well as the sections entitled “Liquidity and Capital Resources” in Item 7 and “Sources of Funds” in Item 1 “Business” of this report.
55
Table of Contents
All Other Liabilities
The following table sets forth the composition of all other liabilities:
| At December 31, | ||||||||
| ($ in thousands) |
2010 | 2009 | ||||||
| Mortgage escrow funds payable |
$20,709 | $24,363 | ||||||
| Official checks outstanding |
6,605 | 5,216 | ||||||
| Accrued interest payable on deposits |
4,593 | 6,201 | ||||||
| All other liabilities |
2,242 | 2,834 | ||||||
| $34,149 | $38,614 | |||||||
Mortgage escrow funds payable fluctuate and represent advance payments made to us by borrowers for property taxes and insurance that we remit to third parties when due. Official checks outstanding represent checks issued by INB in the normal course of business which fluctuate based on banking activity. Accrued interest payable on deposits fluctuates based on total deposits and the timing of interest payments. All other liabilities are comprised mainly of accrued expenses and fees received on loan commitments that have not yet been funded.
Stockholders’ Equity
The following table sets forth the change in stockholders’ equity:
| Outstanding | ||||||||||||||||||||
| ($ in thousands, except per share amounts) | Amount | Class A Shares |
Class B Shares |
Total Shares |
Amount Per Share |
|||||||||||||||
| Common stockholders’ equity at December 31, 2009 |
$190,588 | 7,690,812 | 580,000 | 8,270,812 | $23.04 | |||||||||||||||
| Net loss before preferred dividend requirements |
(53,308 | ) | - | - | - | (4.80 | ) | |||||||||||||
| Amortization of preferred stock discount |
(386 | ) | - | - | - | (0.03 | ) | |||||||||||||
| Reversal of previously accrued preferred dividends |
160 | - | - | - | 0.01 | |||||||||||||||
| Compensation from stock options/restricted stock |
42 | - | - | - | - | |||||||||||||||
| Sale of common stock in private placement (1) |
3,995 | 850,000 | - | 850,000 | 4.70 | |||||||||||||||
| Sale of common stock in public offering (2) |
21,017 | 11,686,377 | - | 11,686,377 | 1.80 | |||||||||||||||
| Conversion of Class B shares into Class A shares (3) |
- | 580,000 | (580,000 | ) | - | - | ||||||||||||||
| Issuance of restricted common stock award |
- | 319,300 | - | 319,300 | - | |||||||||||||||
| Common stockholders’ equity at December 31, 2010 |
$162,108 | 21,126,489 | - | 21,126,489 | $ 7.67 | |||||||||||||||
| Preferred stockholder’s equity at December 31, |
$ 23,466 | |||||||||||||||||||
| Amortization of preferred stock discount |
386 | |||||||||||||||||||
| Preferred stockholder’s equity at December 31, 2010 |
$ 23,852 | |||||||||||||||||||
| Total stockholders’ equity at December 31, 2010 |
$185,960 | |||||||||||||||||||
| (1) | On May 25, 2010, IBC sold in a private placement 850,000 shares of its Class A common stock for an aggregate purchase price of $4,250,000. The net proceeds from the sale of the shares amounted to $3,955,000. |
| (2) | On October 20, 2010, IBC sold in a public offering 10,600,000 shares of its Class A common stock for an aggregate purchase price of $20,670,000. On November 3, 2010, the underwriter of the public offering exercised a portion of their over-allotment option to purchase an additional 1,086,377 shares of Class A common stock for an aggregate purchase price of $2,118,435. The net proceeds from the sale of all these shares amounted to $21,017,000. |
| (3) | Concurrent with the public offering, on October 20, 2010, the three holders of all of IBC’s issued and outstanding Class B common stock converted all of their shares into shares of Class A common stock at the conversion rate of one share of Class A common stock for each share of Class B common stock. IBC will no longer issue, or authorize the issuance of, any Class B common stock. |
| (4) | On December 23, 2008, IBC sold to the United States Department of the Treasury 25,000 shares of IBC’s Fixed Rate Cumulative Perpetual Preferred Stock, Series A, with a liquidation preference of $1,000 per share, along with a ten year warrant to purchase at any time up to 691,882 shares of IBC’s Class A common stock for $5.42 per share, for a total cash investment of $25 million from the Treasury. The total investment was allocated between preferred and common equity as described in more detail in note 11 to the consolidated financial statements in this report. In February 2010, IBC ceased declaration and payment of the preferred dividends. At December 31, 2010, the amount of preferred share dividends in arrears totaled $1.4 million. Dividends in arrears are recorded as reduction in common stockholders’ equity only when they are declared and payable. Common stock book value per share, after adjusting for the dividends in arrears, was $7.61 at December 31, 2010. |
56
Table of Contents
Comparison of Results of Operations for the Years Ended December 31, 2010 and 2009.
Overview
In 2010, we reported a net loss available to common stockholders of $55.0 million, or $4.95 per diluted common share, compared to net earnings available to common stockholders of $1.5 million, or $0.18 per diluted common share, in 2009. The results reported for both periods were reduced by $1.6 million of preferred dividend requirements related to IBC’s outstanding preferred stock held by the U.S. Treasury. The net loss for 2010 was driven by a bulk sale of nonperforming and underperforming assets (discussed earlier in this report) and additional loan and real estate loss provisions due to declining commercial real estate values and continued weakness in the economy.
Selected information regarding results of operations follows:
| ($ in thousands) | 2010 | 2009 | ||||||
| Interest and dividend income |
$ | 107,072 | $ | 123,598 | ||||
| Interest expense |
62,692 | 81,000 | ||||||
| Net interest and dividend income |
44,380 | 42,598 | ||||||
| Provision for loan losses |
101,463 | 10,865 | ||||||
| Provisions for real estate losses |
15,509 | 2,275 | ||||||
| Noninterest income |
2,110 | 297 | ||||||
| Noninterest expenses |
23,174 | 24,809 | ||||||
| (Loss) earnings before taxes |
(93,656 | ) | 4,946 | |||||
| (Benefit) provision for income taxes |
(40,348 | ) | 1,816 | |||||
| Net (loss) earnings before preferred dividend requirements |
(53,308 | ) | 3,130 | |||||
| Preferred dividend requirements (1) |
(1,667 | ) | (1,632 | ) | ||||
| Net (loss) earnings available to common stockholders |
$ | (54,975 | ) | $ | 1,498 | |||
| (1) Represents dividend requirements of 5% on $25 million of cumulative Series A preferred stock held by the U.S. Treasury and amortization of related preferred stock discount. See note 11 to the consolidated financial statements in this report. |
||||||||
Net Interest and Dividend Income
Net interest and dividend income is our primary source of earnings and is influenced by the amount, distribution and repricing characteristics of our interest-earning assets and interest-bearing liabilities as well as by the relative levels and movements of interest rates. Net interest and dividend income is the difference between interest income earned on our interest-earning assets, such as loans and securities, and interest expense paid on our interest-bearing liabilities, such as deposits and borrowings.
As detailed in the table that follows, net interest and dividend income increased by $1.8 million to $44.4 million in 2010, from $42.6 million in 2009. The increase in income reflected an improved net interest margin, partially offset by the impact of the planned reduction in the size of our balance sheet as well as the sale of performing loans as part of the bulk sale. Average interest-earning assets decreased by $216 million from 2009, due to a decrease of $233 million in average loans, partially offset by a $17 million aggregate increase in average security investments and other short-term investments. Average interest-bearing liabilities decreased by $130 million from 2009 due to a $110 million decrease in average deposits and a $21 million decrease in average borrowed funds.
Our net interest margin increased to 2.11% in 2010, from 1.83% in 2009, primarily due to our cost of funds decreasing at a faster pace than the yield on our interest-earning assets. The yield on interest-earning assets decreased to 5.08% in 2010 from 5.32% in 2009 due to the impact of calls and maturities totaling $793 million of higher yielding U.S. government agency security investments (coupled with the reinvestment of those proceeds into similar securities with market interest rates that were significantly lower) and the sale of performing TDRs and other loans totaling $108 million and yielding approximately 5%, partially offset by a decrease in nonaccrual loans and the related amount of interest not accrued on such loans.
The historically low interest rate environment resulted in the call of nearly all of our investment securities purchased prior to 2010. Interest income that was not recorded on nonaccrual loans totaled $2.9 million in 2010, compared to $9.0 million in 2009. Our cost of funds decreased to 3.20% in 2010 from 3.87% in 2009, reflecting lower rates paid on deposits, the positive impact of the early retirement of higher cost borrowings in 2009 and lower rates paid on floating-rate capital securities.
57
Table of Contents
The following table provides information on average assets, liabilities and stockholders’ equity; yields earned on interest-earning assets; and rates paid on interest-bearing liabilities for 2010 and 2009. The yields and rates shown are based on a computation of income/expense (including any related fee income or expense) for each year divided by average interest-earning assets/interest-bearing liabilities during each year. Average balances are derived from daily balances. Net interest margin is computed by dividing net interest and dividend income by the average of total interest-earning assets during each year. The interest rate spread is the difference between the average yield earned on interest-earning assets and the average rate paid on interest-bearing liabilities. The net interest margin is greater than the interest rate spread due to the additional income earned on those assets funded by non-interest-bearing liabilities, demand deposits and stockholders’ equity.
| For the Year Ended December 31, | ||||||||||||||||||||||||||||
| 2010 | 2009 | |||||||||||||||||||||||||||
| ($ in thousands) | Average Balance |
Interest Inc./Exp. |
Yield/ Rate |
Average Balance |
Interest Inc./Exp. |
Yield/ Rate |
||||||||||||||||||||||
| Interest-earning assets: |
||||||||||||||||||||||||||||
| Loans (1) |
$ | 1,489,004 | $ | 94,638 | 6.36 | % | $ | 1,721,688 | $ | 106,105 | 6.16 | % | ||||||||||||||||
| Securities |
599,519 | 12,411 | 2.07 | 586,344 | 17,473 | 2.98 | ||||||||||||||||||||||
| Other interest-earning assets |
18,502 | 23 | 0.12 | 14,544 | 20 | 0.14 | ||||||||||||||||||||||
| Total interest-earning assets |
2,107,025 | $ | 107,072 | 5.08 | % | 2,322,576 | $ | 123,598 | 5.32 | % | ||||||||||||||||||
| Noninterest-earning assets |
93,411 | 34,846 | ||||||||||||||||||||||||||
| Total assets |
$ | 2,200,436 | $ | 2,357,422 | ||||||||||||||||||||||||
| Interest-bearing liabilities: |
||||||||||||||||||||||||||||
| Interest checking deposits |
$ | 9,722 | $ | 97 | 1.00 | % | $ | 6,776 | $ | 107 | 1.58 | % | ||||||||||||||||
| Savings deposits |
10,807 | 91 | 0.84 | 9,899 | 185 | 1.87 | ||||||||||||||||||||||
| Money market deposits |
469,813 | 5,107 | 1.09 | 435,203 | 8,531 | 1.96 | ||||||||||||||||||||||
| Certificates of deposit |
1,373,270 | 53,692 | 3.91 | 1,521,104 | 66,705 | 4.39 | ||||||||||||||||||||||
| Total deposit accounts |
1,863,612 | 58,987 | 3.17 | 1,972,982 | 75,528 | 3.83 | ||||||||||||||||||||||
| FHLB advances |
40,171 | 1,546 | 3.85 | 51,042 | 1,951 | 3.82 | ||||||||||||||||||||||
| Debentures and related interest payable |
- | - | - | 9,936 | 796 | 8.01 | ||||||||||||||||||||||
| Debentures - capital securities |
56,702 | 2,148 | 3.79 | 56,702 | 2,713 | 4.78 | ||||||||||||||||||||||
| Mortgage note payable |
158 | 11 | 6.96 | 176 | 12 | 6.82 | ||||||||||||||||||||||
| Total borrowed funds |
97,031 | 3,705 | 3.82 | 117,856 | 5,472 | 4.64 | ||||||||||||||||||||||
| Total interest-bearing liabilities |
1,960,643 | 62,692 | 3.20 | % | 2,090,838 | 81,000 | 3.87 | % | ||||||||||||||||||||
| Noninterest-bearing deposits |
3,524 | 3,101 | ||||||||||||||||||||||||||
| Noninterest-bearing liabilities |
47,072 | 50,606 | ||||||||||||||||||||||||||
| Preferred stockholder’s equity |
23,668 | 23,290 | ||||||||||||||||||||||||||
| Common stockholders’ equity |
165,529 | 189,587 | ||||||||||||||||||||||||||
| Total liabilities and stockholders’ equity |
$ | 2,200,436 | $ | 2,357,422 | ||||||||||||||||||||||||
| Net interest and dividend income/spread |
$ | 44,380 | 1.88 | % | $ | 42,598 | 1.45 | % | ||||||||||||||||||||
| Net interest-earning assets/margin (2) |
$ | 146,382 | 2.11 | % | $ | 231,738 | 1.83 | % | ||||||||||||||||||||
| Ratio of total interest-earning assets to total interest-bearing liabilities |
1.08x | 1.11x | ||||||||||||||||||||||||||
| Other Ratios: |
||||||||||||||||||||||||||||
| Return on average assets |
-2.42% | 0.13% | ||||||||||||||||||||||||||
| Return on average common equity |
-32.20% | 1.65% | ||||||||||||||||||||||||||
| Noninterest expense to average assets (3) |
0.87% | 0.84% | ||||||||||||||||||||||||||
| Efficiency ratio (4) |
41% | 46% | ||||||||||||||||||||||||||
| Average stockholders’ equity to average assets |
8.60% | 9.03% | ||||||||||||||||||||||||||
| (1) | Includes average nonaccrual loans of $53.2 million in 2010 and $120.3 million in 2009. Interest not recorded on such loans totaled $2.9 million in 2010 and $9.0 million in 2009. |
| (2) | Net interest margin is reported exclusive of income from loan prepayments, which is included as a component of noninterest income. Inclusive of income from loan prepayments, the margin would compute to 2.17% and 1.89% for 2010 and 2009, respectively. |
| (3) | Noninterest expenses for this ratio excludes real estate activities expenses. |
| (4) | Defined as noninterest expenses (excluding the provisions for loan and real estate losses and real estate activities expense) as a percentage of net interest and dividend income plus noninterest income. |
58
Table of Contents
The following table provides information regarding changes in interest and dividend income and interest expense. For each category of interest-earning assets and interest-bearing liabilities, information is provided on changes attributable to (1) changes in rate (change in rate multiplied by prior volume), (2) changes in volume (change in volume multiplied by prior rate) and (3) changes in rate-volume (change in rate multiplied by change in volume).
| For the Year Ended December 31, 2010 vs. 2009 | ||||||||||||||||
| Increase (Decrease) Due To Change In: | ||||||||||||||||
| ($ in thousands) | Rate | Volume | Rate/Volume | Total | ||||||||||||
| Interest-earning assets: |
||||||||||||||||
| Loans |
$ 3,443 | $(14,333) | $ (577) | $(11,467) | ||||||||||||
| Securities |
(5,336) | 393 | (119) | (5,062) | ||||||||||||
| Other interest-earning assets |
(3) | 6 | - | 3 | ||||||||||||
| Total interest-earning assets |
(1,896) | (13,934) | (696) | (16,526) | ||||||||||||
| Interest-bearing liabilities: |
||||||||||||||||
| Interest checking deposits |
(39) | 47 | (18) | (10) | ||||||||||||
| Savings deposits |
(102) | 17 | (9) | (94) | ||||||||||||
| Money market deposits |
(3,786) | 678 | (316) | (3,424) | ||||||||||||
| Certificates of deposit |
(7,301) | (6,490) | 778 | (13,013) | ||||||||||||
| Total deposit accounts |
(11,228) | (5,748) | 435 | (16,541) | ||||||||||||
| FHLB advances |
15 | (415) | (5) | (405) | ||||||||||||
| Debentures, related interest payable and all other |
(796) | (797) | 796 | (797) | ||||||||||||
| Debentures - capital securities |
(561) | - | (4) | (565) | ||||||||||||
| Total borrowed funds |
(1,342) | (1,212) | 787 | (1,767) | ||||||||||||
| Total interest-bearing liabilities |
(12,570) | (6,960) | 1,222 | (18,308) | ||||||||||||
| Net change in interest and dividend income |
$ 10,674 | $ (6,974) | $(1,918) | $ 1,782 | ||||||||||||
Provision for Loan Losses and Provision for Real Estate Losses
The provision for loan losses increased by $90.6 million to $101.5 million in 2010, from $10.9 million in 2009. Approximately $73.4 million of the increase was due to the bulk sale (discussed elsewhere in this report) and $28.1 million was attributable to: a higher level of credit rating downgrades on various loans; lower estimates of value on several collateral properties; our assessment of the continued weakness in the economy and commercial real estate markets and their impact on our loan portfolio; and input received from INB’s primary regulator.
The provision for real estate losses increased by $13.2 million to $15.5 million in 2010, from $2.3 million in 2009. The increase included $5.3 million related to the bulk sale and the remainder was the result of declining real estate values during the period and their negative impact on properties we own through foreclosure. In 2010, the weak economy, high unemployment, increased office and retail vacancy rates and an increased supply of distressed properties for sale in the marketplace at discounted prices significantly reduced commercial and multifamily real estate values both nationally and in our lending areas. These factors negatively impacted our loan and real estate owned portfolios.
Noninterest Income
Noninterest income increased by $1.8 million to $2.1 million in 2010 and is summarized as follows:
| For the Year Ended December 31, | ||||||||
| ($ in thousands) | 2010 | 2009 | ||||||
| Customer service fees |
$ 460 | $ 412 | ||||||
| Income from mortgage lending activities (1) |
1,646 | 1,214 | ||||||
| Income from the early repayment of mortgage loans (2) |
1,420 | 1,235 | ||||||
| Loss from early call of investment securities (3) |
(917) | (306) | ||||||
| Gain on sale of securities available for sale (4) |
693 | - | ||||||
| Impairment writedowns on investments securities (5) |
(1,192) | (2,258) | ||||||
| $ 2,110 | $ 297 | |||||||
| (1) | Consists mostly of fees from expired loan commitments and loan servicing, maintenance and inspection charges. |
| (2) | Consists of the recognition of unearned fees associated with such loans at the time of payoff and the receipt of prepayment penalties and interest in certain cases. |
| (3) | Consists of the recognition of any unamortized premium or discount at time of call. |
| (4) | See note 2 to the consolidated financial statements in this report for a discussion of the gain. |
| (5) | Consists of other than temporary impairment charges on trust preferred security investments (which are discussed in more detail in note 2 to the consolidated financial statements in this report). |
59
Table of Contents
Noninterest Expenses
Noninterest expenses, excluding provisions for real estate losses, decreased by $1.6 million to $23.2 million in 2010 and are summarized as follows:
| For the Year Ended December 31, | ||||||||
| ($ in thousands) |
2010 | 2009 | ||||||
| Salaries and employee benefits |
$6,472 | $6,247 | ||||||
| Occupancy and equipment, net |
1,812 | 1,903 | ||||||
| Data processing |
1,712 | 1,131 | ||||||
| Professional fees and services |
2,368 | 1,812 | ||||||
| Stationery, printing and supplies |
173 | 178 | ||||||
| Postage and delivery |
126 | 111 | ||||||
| FDIC insurance |
4,772 | 5,221 | ||||||
| General insurance |
538 | 378 | ||||||
| Director and committee fees |
369 | 372 | ||||||
| Advertising and promotion |
71 | 191 | ||||||
| Real estate activities expense |
4,105 | 4,945 | ||||||
| Loss on the early extinguishment of debentures |
- | 1,702 | ||||||
| All other expenses |
656 | 618 | ||||||
| $23,174 | $24,809 | |||||||
Salaries and employee benefits expense increased primarily due to the addition of two officers (ALCO and Chief Credit) as well as normal salary increases and a higher cost of providing medical insurance benefits.
Data processing expense increased due to nonrecurring fees associated with the conversion of INB’s main data processing from one software to another. INB uses a third-party service provider to run its core computer system. INB expects substantial savings in its data processing costs going forward of approximately $0.8 million for each of the next seven years.
Professional fees and services increased primarily due to a higher level of legal costs incurred in our collection efforts with nonaccrual loans and to comply with our regulatory matters as well as increased internal and external audit fees, consulting fees and regulatory examination fees.
FDIC insurance expense decreased primarily due to a $1.1 million one-time assessment in June 2009 that did not recur in 2010 and a decrease in total deposits, partially offset by increased premium rates. For a further discussion, of FDIC premiums, see the section “Deposit Insurance Assessments” under the caption “Supervision and Regulation” in Item 1 “Business” of this report. General insurance expense also increased due to higher premiums for director and general liability insurance.
Advertising and promotion decreased due to less advertisements for new loans and deposits.
Real estate activities expense is comprised of expenditures consisting of real estate taxes, insurance, utilities and other charges required to protect our interest in real estate acquired through foreclosure and various properties collateralizing our nonaccrual loans. The amount for 2009 included $0.9 million of utility charges related to one property that did not recur in 2010. The loss on the early extinguishment of debentures represents unamortized issuance costs that were expensed in connection with the repayment of debentures prior to their stated maturity as discussed in note 9 to the consolidated financial statements included in this report.
Our efficiency ratio, which is a measure of our ability to control expenses, and reflects our expenses as a percentage of our revenues, improved to 41% for 2010, compared to 46% for 2009.
(Benefit)Provision for Income Taxes
We recorded an income tax benefit of $40.3 million in 2010 due to a pre-tax loss, compared to $1.8 million of income tax expense on pre-tax earnings in 2009. Our effective tax rate (inclusive of state and local taxes) was 43.1% in 2010, compared to 36.7% in 2009. The 2009 rate was positively impacted by refunds totaling $0.6 million of state taxes paid in years prior to 2008.
60
Table of Contents
Comparison of Results of Operations for the Years Ended December 31, 2009 and 2008.
Overview
Consolidated net earnings available to common stockholders for 2009 decreased by $5.7 million to $1.5 million, or $0.18 per diluted common share, from $7.2 million, or $0.87 per diluted common share, in 2008. Lower earnings was due to an $8.2 million increase in noninterest expenses, a $4.7 million decrease in noninterest income and $1.6 million of preferred stock dividend requirements, partially offset by a $4.1 million decrease in the provision for income taxes, a $4.4 million increase in net interest and dividend income and a $0.3 million decrease in the provision for loan losses. Return on average assets and common equity decreased to 0.13% and 1.65%, respectively, in 2009, from 0.34% and 3.94%, respectively, in 2008
Selected information regarding results of operations follows:
| Consolidated | ||||||||
| ($ in thousands) |
2009 | 2008 | ||||||
| Interest and dividend income |
$123,598 | $128,497 | ||||||
| Interest expense |
81,000 | 90,335 | ||||||
| Net interest and dividend income |
42,598 | 38,162 | ||||||
| Provision for loan losses |
10,865 | 11,158 | ||||||
| Provisions for real estate losses |
2,275 | 518 | ||||||
| Noninterest income |
297 | 5,026 | ||||||
| Noninterest expenses |
24,809 | 18,355 | ||||||
| Earnings before taxes |
4,946 | 13,157 | ||||||
| Provision for income taxes |
1,816 | 5,891 | ||||||
| Net earnings before preferred dividend requirements |
3,130 | 7,266 | ||||||
| Preferred dividend requirements (1) |
(1,632 | ) | (41 | ) | ||||
| Net earnings available to common stockholders |
$ 1,498 | $ 7,225 | ||||||
(1) Represents dividend requirements of 5% on $25 million of cumulative Series A preferred stock held by the U.S. Treasury and amortization of related preferred stock discount. See note 11 to the consolidated financial statements in this report.
Net Interest and Dividend Income
Net interest and dividend income is our primary source of earnings and is influenced by the amount, distribution and repricing characteristics of our interest-earning assets and interest-bearing liabilities as well as by the relative levels and movements of interest rates. Net interest and dividend income is the difference between interest income earned on our interest-earning assets, such as loans and securities, and interest expense paid on our interest-bearing liabilities, such as deposits and borrowings.
As detailed in the following table, net interest and dividend income increased by $4.4 million to $42.6 million in 2009, from $38.2 million in 2008, primarily due to an improved net interest margin and an increase in our average balance sheet. Total average interest-earning assets increased by $186 million in 2009 from 2008, due to growth of $28 million in loans and $158 million in security and other short-term investments in the aggregate. This growth was funded primarily by a $202 million increase in average interest-bearing deposits and a $28 million increase in average stockholders’ equity (primarily due to the receipt of TARP proceeds), partially offset by a $38 million reduction in average borrowed funds.
Our net interest margin increased slightly to 1.83% in 2009, from 1.79% in 2008, due to our cost of funds decreasing at a slightly faster pace than the yield on our interest-earning assets. The yield on interest-earning assets decreased to 5.32% in 2009 from 6.01% in 2008 due to the impact of calls of $592 million of higher yielding U.S. government agency security investments (coupled with the reinvestment of those proceeds into similar securities with market interest rates that were 77 basis points lower), and a higher level ($1.0 million) of interest income not recorded on nonaccrual loans. The historically low interest rate environment resulted in the call of nearly all our investment securities purchased prior to 2009.
Our cost of funds decreased to 3.87% in 2009 from 4.69% in 2008, reflecting lower rates paid on deposits and adjustable-rate borrowings as well as the early retirement of higher-cost, fixed-rate debentures. Interest income that was not recorded on nonaccrual loans totaled $9.0 million in 2009, compared to $8.0 million in 2008.
61
Table of Contents
The following table provides information on average assets, liabilities and stockholders’ equity; yields earned on interest-earning assets; and rates paid on interest-bearing liabilities for 2009 and 2008. The yields and rates shown are based on a computation of income/expense (including any related fee income or expense) for each year divided by average interest-earning assets/interest-bearing liabilities during each year. Average balances are derived from daily balances. Net interest margin is computed by dividing net interest and dividend income by the average of total interest-earning assets during each year. The interest rate spread is the difference between the average yield earned on interest-earning assets and the average rate paid on interest-bearing liabilities. The net interest margin is greater than the interest rate spread due to the additional income earned on those assets funded by non-interest-bearing liabilities, demand deposits and stockholders’ equity.
| For the Year Ended December 31, | ||||||||||||||||||||||||||||
| 2009 | 2008 | |||||||||||||||||||||||||||
| ($ in thousands) |
|
Average Balance |
|
|
Interest Inc./Exp. |
|
|
Yield/ Rate |
|
|
Average Balance |
|
|
Interest Inc./Exp. |
|
|
Yield/ Rate |
| ||||||||||
| Interest-earning assets: |
||||||||||||||||||||||||||||
| Loans (1) |
$ | 1,721,688 | $ | 106,105 | 6.16 | % | $ | 1,693,749 | $ | 109,793 | 6.48 | % | ||||||||||||||||
| Securities |
586,344 | 17,473 | 2.98 | 422,356 | 18,287 | 4.33 | ||||||||||||||||||||||
| Other interest-earning assets |
14,544 | 20 | 0.14 | 20,297 | 417 | 2.05 | ||||||||||||||||||||||
| Total interest-earning assets |
2,322,576 | $ | 123,598 | 5.32 | % | 2,136,402 | $ | 128,497 | 6.01 | % | ||||||||||||||||||
| Noninterest-earning assets |
34,846 | 26,317 | ||||||||||||||||||||||||||
| Total assets |
$ | 2,357,422 | $ | 2,162,719 | ||||||||||||||||||||||||
| Interest-bearing liabilities: |
||||||||||||||||||||||||||||
| Interest checking deposits |
$ | 6,776 | $ | 107 | 1.58 | % | $ | 5,455 | $ | 97 | 1.78 | % | ||||||||||||||||
| Savings deposits |
9,899 | 185 | 1.87 | 8,448 | 249 | 2.95 | ||||||||||||||||||||||
| Money market deposits |
435,203 | 8,531 | 1.96 | 302,027 | 10,571 | 3.50 | ||||||||||||||||||||||
| Certificates of deposit |
1,521,104 | 66,705 | 4.39 | 1,455,059 | 69,719 | 4.79 | ||||||||||||||||||||||
| Total deposit accounts |
1,972,982 | 75,528 | 3.83 | 1,770,989 | 80,636 | 4.55 | ||||||||||||||||||||||
| FHLB advances and Federal funds purchased |
51,042 | 1,951 | 3.82 | 33,897 | 1,039 | 3.07 | ||||||||||||||||||||||
| Debentures and related interest payable |
9,936 | 796 | 8.01 | 65,225 | 5,150 | 7.90 | ||||||||||||||||||||||
| Debentures - capital securities |
56,702 | 2,713 | 4.78 | 56,702 | 3,496 | 6.17 | ||||||||||||||||||||||
| Mortgage note payable |
176 | 12 | 6.82 | 193 | 14 | 7.25 | ||||||||||||||||||||||
| Total borrowed funds |
117,856 | 5,472 | 4.64 | 156,017 | 9,699 | 6.22 | ||||||||||||||||||||||
| Total interest-bearing liabilities |
2,090,838 | 81,000 | 3.87 | % | 1,927,006 | 90,335 | 4.69 | % | ||||||||||||||||||||
| Noninterest-bearing deposits |
3,101 | 3,885 | ||||||||||||||||||||||||||
| Noninterest-bearing liabilities |
50,606 | 46,884 | ||||||||||||||||||||||||||
| Preferred stockholder’s equity |
23,290 | 609 | ||||||||||||||||||||||||||
| Common stockholders’ equity |
189,587 | 184,335 | ||||||||||||||||||||||||||
| Total liabilities and stockholders’ equity |
$ | 2,357,422 | $ | 2,162,719 | ||||||||||||||||||||||||
| Net interest and dividend income/spread |
$ | 42,598 | 1.45 | % | $ | 38,162 | 1.32 | % | ||||||||||||||||||||
| Net interest-earning assets/margin (2) |
$ | 231,738 | 1.83 | % | $ | 209,396 | 1.79 | % | ||||||||||||||||||||
| Ratio of total interest-earning assets to total interest-bearing liabilities |
1.11x | 1.11x | ||||||||||||||||||||||||||
| Other Ratios: |
||||||||||||||||||||||||||||
| Return on average assets |
0.13% | 0.34% | ||||||||||||||||||||||||||
| Return on average common equity |
1.65% | 3.94% | ||||||||||||||||||||||||||
| Noninterest expense to average assets (3) |
0.84% | 0.65% | ||||||||||||||||||||||||||
| Efficiency ratio (4) |
46% | 33% | ||||||||||||||||||||||||||
| Average stockholders’ equity to average assets |
9.03% | 8.55% | ||||||||||||||||||||||||||
| (1) | Includes average nonaccrual loans of $120.3 million in 2009 and $105.6 million in 2008. Interest not recorded on such loans totaled $9.0 million in 2009 and $8.0 million in 2008. |
| (2) | Net interest margin is reported exclusive of income from loan prepayments, which is included as a component of noninterest income. Inclusive of income from loan prepayments, the margin would compute to 1.89% and 1.90% for 2009 and 2008, respectively. |
| (3) | Noninterest expenses for this ratio excludes real estate activities expenses. |
| (4) | Defined as noninterest expenses (excluding the provisions for loan and real estate losses and real estate actives expense) as a percentage of net interest and dividend income plus noninterest income. |
62
Table of Contents
The following table provides information regarding changes in interest and dividend income and interest expense. For each category of interest-earning assets and interest-bearing liabilities, information is provided on changes attributable to (1) changes in rate (change in rate multiplied by prior volume), (2) changes in volume (change in volume multiplied by prior rate) and (3) changes in rate-volume (change in rate multiplied by change in volume).
| For the Year Ended December 31, 2009 vs. 2008 | ||||||||||||||||
| Increase (Decrease) Due To Change In: | ||||||||||||||||
| ($ in thousands) |
Rate | Volume | Rate/Volume | Total | ||||||||||||
| Interest-earning assets: |
||||||||||||||||
| Loans |
$ | (5,420) | $ | 1,810 | $ (78) | $ | (3,688) | |||||||||
| Securities |
(5,702) | 7,101 | (2,213) | (814) | ||||||||||||
| Other interest-earning assets |
(388) | (118) | 109 | (397) | ||||||||||||
| Total interest-earning assets |
(11,510) | 8,793 | (2,182) | (4,899) | ||||||||||||
| Interest-bearing liabilities: |
||||||||||||||||
| Interest checking deposits |
(11) | 24 | (3) | 10 | ||||||||||||
| Savings deposits |
(91) | 43 | (16) | (64) | ||||||||||||
| Money market deposits |
(4,651) | 4,661 | (2,050) | (2,040) | ||||||||||||
| Certificates of deposit |
(5,820) | 3,164 | (358) | (3,014) | ||||||||||||
| Total deposit accounts |
(10,573) | 7,892 | (2,427) | (5,108) | ||||||||||||
| FHLB advances and Federal funds purchased |
254 | 526 | 132 | 912 | ||||||||||||
| Debentures and related interest payable |
72 | (4,368) | (58) | (4,354) | ||||||||||||
| Debentures - capital securities |
(788) | - | 5 | (783) | ||||||||||||
| Mortgage note payable |
(1) | (1) | - | (2) | ||||||||||||
| Total borrowed funds |
(463) | (3,843) | 79 | (4,227) | ||||||||||||
| Total interest-bearing liabilities |
(11,036) | 4,049 | (2,348) | (9,335) | ||||||||||||
| Net change in interest and dividend income |
$ | (474) | $ | 4,744 | $ 166 | $ | 4,436 | |||||||||
Provision for Loan Losses and Provision for Real Estate Losses
The provision for loan losses decreased by $0.3 million to $10.9 million in 2009, from $11.2 million in 2008. The decrease was attributable to a reduction in gross loans outstanding (accounting for $1.1 million of less provision), largely offset by $0.8 million of additional provision attributable to credit downgrades on both accrual and nonaccrual loans and lower estimates of real estate values on certain collateral properties. Total loans outstanding decreased by $21 million in 2009, compared to $90 million of growth in 2008.
The provision for real estate losses increased by $1.8 million to $2.3 million in 2009, from $0.5 million in 2008. After foreclosure, we periodically perform market valuations of properties we own and hold for sale. Decreases in the estimated fair value of the properties are recorded as an increase to the valuation allowance and a charge to the provision for real estate losses.
Noninterest Income
Noninterest income decreased by $4.7 million to $0.3 million in 2009 and is summarized as follows:
| For the Year Ended December 31, | ||||||||
| ($ in thousands) |
2009 | 2008 | ||||||
| Customer service fees |
$ 412 | $ 684 | ||||||
| Income from mortgage lending activities (1) |
1,214 | 1,675 | ||||||
| Income from the early repayment of mortgage loans (2) |
1,235 | 2,363 | ||||||
| (Loss) gain from early call of investment securities (3) |
(306) | 304 | ||||||
| Impairment writedowns on investments securities (4) |
(2,258) | - | ||||||
| $ 297 | $5,026 | |||||||
| (1) | Consists mostly of fees from expired loan commitments and loan servicing, maintenance and inspection charges. |
| (2) | Consists of the recognition of unearned fees associated with such loans at the time of payoff and the receipt of prepayment penalties and interest in certain cases. |
| (3) | Consists of the recognition of any unamortized premium or discount at time of call. |
| (4) | Consists of other than temporary impairment charges on trust preferred security investments (which are discussed in more detail in note 2 to the consolidated financial statements in this report). |
The decrease in customer service fees was due to a lower level of income from early withdrawal penalties, while the decrease in income from mortgage lending activities was due to less inspection charges resulting from a lower level of new originations.
63
Table of Contents
We believe that the volume of loan prepayments and prepayment income derived therefrom has decreased over the last several years due to longer-term, fixed-rate loans that we have originated since the beginning of 2007, as well as the effects of the crisis in the credit markets in general (which severely reduced funds available in the general marketplace for real estate lending) as well as declining commercial real estate values.
Noninterest Expenses
Noninterest expenses, excluding provisions for real estate losses, increased by $6.4 million to $24.8 million in 2009 and are summarized as follows:
| For the Year Ended December 31, | ||||||||
| ($ in thousands) |
2009 | 2008 | ||||||
| Salaries and employee benefits |
$ 6,247 | $ 6,039 | ||||||
| Occupancy and equipment, net |
1,903 | 1,755 | ||||||
| Data processing |
1,131 | 1,016 | ||||||
| Professional fees and services |
1,812 | 1,549 | ||||||
| Stationery, printing and supplies |
178 | 175 | ||||||
| Postage and delivery |
111 | 106 | ||||||
| FDIC insurance |
5,221 | 1,517 | ||||||
| General insurance |
378 | 216 | ||||||
| Director and committee fees |
372 | 336 | ||||||
| Advertising and promotion |
191 | 253 | ||||||
| Real estate activities expense |
4,945 | 4,281 | ||||||
| Loss on the early extinguishment of debentures |
1,702 | 570 | ||||||
| All other expenses |
618 | 542 | ||||||
| $24,809 | $18,355 | |||||||
Salaries and employee benefits expense increased primarily due to normal salary increases and higher medical insurance benefits totaling $0.2 million and a decrease of $0.2 million in direct fee income due to less loans originated, partially offset by a $0.2 million decrease in stock-based compensation expense.
Occupancy and equipment expense increased primarily due to higher real estate taxes and a decrease in sublease rental income. Professional fees and services increased primarily due to a higher level of legal costs incurred in our collection efforts with nonaccrual loans as well as increased internal and external audit fees, consulting fees and regulatory examination fees.
FDIC insurance expense increased due to a higher rate structure for insurance premiums and a one-time assessment of $1.1 million imposed by the FDIC in June 2009 on all insured financial institutions as well as growth in deposits during 2009. For a further discussion, see the section “Deposit Insurance Assessments” under the caption “Supervision and Regulation” in Item 1 “Business” of this report. General insurance expense also increased due to higher premiums.
Real estate activities expense is comprised of expenditures consisting of real estate taxes, insurance, utilities and other charges required to protect our interest in real estate acquired through foreclosure and various properties collateralizing our nonaccrual loans. The amount for 2009 included $0.9 million of utility charges related to one property, while the 2008 amount included a $0.3 million loss from the sale of a foreclosed property.
The loss on the early extinguishment of debentures represents unamortized issuance costs that were expensed in connection with the repayment of debentures prior to their stated maturity as discussed in note 9 to the consolidated financial statements included in this report.
Our efficiency ratio, which is a measure of our ability to control our expenses as a percentage of our revenues, was 46% for 2009, compared to 33% for 2008. This ratio was negatively affected in 2009 primarily by the impact of nonperforming assets and related loss of net interest income, and higher FDIC insurance expense.
Provision for Income Taxes
The provision for income taxes decreased by $4.1 million to $1.8 million in 2009, from $5.9 million in 2008, primarily due to lower pre-tax income. Our effective tax rate (inclusive of state and local taxes) was 36.7% in 2009, compared to 44.8% in 2008. The 2009 rate was positively impacted by refunds totaling $0.6 million of state taxes paid in years prior to 2008.
64
Table of Contents
Off-Balance Sheet and Other Financing Arrangements
We are a party to financial instruments with off-balance sheet risk in the normal course of our business to meet the financing needs of our customers. For a further information on and discussion of these financial instruments, see note 19 to the consolidated financial statements included in this report.
Liquidity and Capital Resources
General. Liquidity risk involves the risk of being unable to fund our assets with the appropriate duration and rate-based liabilities, as well as the risk of not being able to meet unexpected cash needs. We manage our liquidity position on a daily basis to assure that funds are available to meet our operating requirements, loan and investment commitments, deposit withdrawals and debt service obligations. Our primary sources of funds consist of the following: retail deposits obtained through INB’s branch offices and the mail; principal repayments of loans; maturities and calls of securities; borrowings through FHLB advances or the federal funds market; brokered deposits; and cash flow provided by our operating activities. For additional detail concerning our actual cash flows, see the consolidated statements of cash flows included in this report.
Intervest National Bank. INB’s lending business is dependent on its ability to generate a positive interest rate spread between the yields earned on its loans and the rates offered on its deposits. INB relies heavily on certificates of deposit (time deposits) as its main source of funds and it needs to pay competitive interest rates to attract and retain deposits to fund its loan originations. The stability of deposits as a funding source is affected by numerous factors, including returns available to our depositors on alternative investments, safety and FDIC insurance limits, the quality of our customer service and other competitive forces.
Due primarily to higher regulatory capital requirements applicable to INB, INB gradually reduced its balance sheet during 2010 by decreasing its deposit rates and encouraging deposit outflow. INB may reduce its deposits further during 2011 and expects to fund any deposit reductions mainly through the expected calls of its agency security investments. INB’s objective is to maintain its deposit rates at levels that will promote a stable deposit base and at the same time adjust to its cash flow needs. See the section “Supervision and Regulation” for restrictions placed on INB with respect to deposits rates it can offer and on accepting, renewing and rolling over brokered deposits.
Total deposits decreased to $1.77 billion at December 31, 2010, from $2.03 billion at December 31, 2009, reflecting decreases of $205 million in certificate of deposit accounts (CDs) and $59 million in money market deposit accounts. CDs are the only deposit accounts offered by INB that have stated maturity dates. At December 31, 2010, CDs totaled $1.30 billion, and checking, savings and money market accounts aggregated to $461 million. At December 31, 2010, CDs represented 74% of total deposits and CDs of $100,000 or more totaled $639 million and included $159 million of brokered deposits. Brokered deposits had a weighted-average remaining term and stated interest rate of 2.4 years and 4.96%, respectively, at December 31, 2010, and $31 million mature by December 31, 2011. At December 31, 2010, $432 million, or 33%, of total CDs (inclusive of brokered deposits) mature within one year. INB expects to repay its brokered deposits as they mature and to retain or replace a significant portion of its remaining CDs. INB has historically targeted its loan-to-deposit ratio in a range from 75% to 85%. This ratio was 72% at December 31, 2010.
INB also borrows funds from time to time on an overnight or short-term basis to manage its liquidity needs. As a member of the FRB and FHLB, INB can borrow from both on a secured basis. At December 31, 2010, INB had $25.5 million of FHLB advances outstanding, of which $8.0 million mature in 2011, $10.5 million in 2012 and $7.0 million in 2013. INB expects to have the flexibility to either repay or replace its outstanding borrowings with short-term advances as they mature. At December 31, 2010, INB had available collateral consisting of investment securities and certain pledged loans to support additional total secured borrowings of $650 million if needed. INB expects to pledge additional loans as collateral to increase its borrowing capacity with the FHLB. At December 31, 2010, INB also had overnight unsecured lines of credit totaling $38 million with correspondent banks. In the event that any of INB’s existing lines of credit were not accessible or were limited, INB could designate all or a portion of its un-pledged U.S. government agency investment securities portfolio as available for sale and sell such securities as needed to provide liquidity.
65
Table of Contents
INB invests in U.S. government agency debt obligations to emphasize safety and liquidity. At December 31, 2010, all of these security investments totaling $609 million were classified as held to maturity, and nearly all have call features that allow the issuer to call the security at par value before their stated maturity and without penalty. At December 31, 2010, the agency securities had a weighted-average remaining stated maturity of 4.8 years, and $5 million, or 0.8%, contractually mature within one year, which excludes potential calls. Over the next twelve months, $290 million in securities could potentially be called if interest rates remain at or near current levels as of December 31, 2010, a large portion of which would then be reinvested into similar securities.
At December 31, 2010, INB had cash and short-term investments totaling $24 million, and $215 million of its loan portfolio (excluding nonaccrual loans) mature within one year. INB expects to extend or refinance a large portion of these maturing loans. At December 31, 2010, INB had commitments to lend of $7 million, most of which are anticipated to be funded over the next 12 months from the sources of funds described above.
Intervest Bancshares Corporation. At December 31, 2010, IBC had cash and short-term investments totaling $4.9 million. IBC’s historical sources of funds to meet its obligations have been derived from the following: interest income from short-term investments; monthly dividends from INB; and monthly management fees from its subsidiaries for providing them with certain administrative services. IBC’s historical sources of working capital have been derived from the issuance of its common stock through public or private offerings, exercise of its common stock warrants, the issuance of its trust preferred securities and preferred stock and the issuance of its subordinated debentures to the public. During 2010, IMC distributed $11.1 million of its cash on hand to IBC as a return of capital, which was redeployed by IBC as additional capital investments in INB.
At December 31, 2010, IBC had issued and outstanding $56.7 million of trust preferred securities and $25 million of Series A Preferred Stock held by the U.S. Treasury, all of which are eligible for inclusion in IBC’s Tier 1 regulatory capital. The proceeds from the issuances of these securities have been invested in INB at various times through capital contributions. See notes 10, 11 and 20 to the consolidated financial statements in this report.
The trust preferred securities contractually mature at various times through 2036 and as of December 31, 2010 had the following interest rates: $45 million had variable rates that reset quarterly based on 3 month libor plus an additional predetermined spread ranging from 240 to 295 basis points, and the remaining $10 million was fixed at 6.83% until September 16, 2011, and thereafter reverts to a variable rate that resets quarterly based on 3 month libor plus an additional 165 basis points. The holder of the Series A Preferred Stock is entitled to a quarterly cash dividend at the rate of 5% per year until December 2013, after which the dividend rate increases to 9% per year. Dividends need not be declared and paid, but the dividend is a cumulative dividend and failure by IBC to pay dividends for six dividend periods, whether or not consecutive, would trigger board appointment rights for the holder of the Preferred Stock.
Prior to January 1, 2010, INB paid cash dividends to IBC for the debt service on IBC’s trust preferred securities as well as for IBC’s payment of dividends on the preferred stock. In January 2010, INB was informed by its primary regulator, the OCC, that it is not permitted to pay any cash dividends to IBC. INB accordingly suspended its cash dividend payments to IBC. In turn, IBC also suspended its payments of interest on the trust preferred securities as well as preferred dividend payments as discussed below. In February 2010, the FRB, IBC’s primary regulator, informed IBC that it may not, without the prior approval of the FRB, pay dividends on or redeem its capital stock, pay interest on or redeem its trust preferred securities, or incur new debt. At December 31, 2010, the total amount of undeclared and unpaid dividends in arrears was $1.4 million.
In March 2010, IBC also exercised its right to defer regularly scheduled interest payments on its $55 million of junior subordinated notes relating to its outstanding trust preferred securities noted above. IBC has the right to defer such payments for up to 20 consecutive quarterly periods without default or penalty. During the deferral period, the respective statutory trusts, which are wholly owned subsidiaries of IBC that were formed to issue the trust preferred securities, have likewise suspended the declaration and payment of dividends on the trust preferred securities. The regularly scheduled interest payments continue to be accrued for payment in the future and are reported as interest expense for financial statement purposes. At December 31, 2010, the total amount of accrued and unpaid interest was $2.3 million.
66
Table of Contents
The deferral of interest payments as well as the suspension of preferred dividend payments is likely to adversely affect IBC’s ability to borrow funds on commercially reasonable terms, or at all. The interest and preferred dividend payments referred to above will resume at such time as both IBC and INB are permitted to do so and upon the determination that such payments are consistent with IBC’s and INB’s overall financial performance and capital requirements.
During 2010, IBC raised a total of $25 million of new working capital as discussed in greater detail in note 11 to the consolidated financial statements in this report. Also see the section “Supervision and Regulation” and note 20 to the consolidated financial statements for a further discussion of IBC’s and INB’s capital requirements and other regulatory matters pertaining to each, including formal agreements with their respective regulators.
Other. Additional information concerning securities held to maturity, deposits, borrowings and preferred stock, including interest rates and maturity dates thereon, can be found in notes 2, 7, 8, 10 and 11 to the consolidated financial statements included in this report, as well as in various places in Item 1 “Business” of this report. We consider our current liquidity and sources of funds sufficient to satisfy our outstanding lending commitments and maturing liabilities.
We are not aware of any trends, known demands, commitments or uncertainties other than those discussed above or elsewhere in this report that are expected to have a material impact on our future operating results, liquidity or capital resources. However, there can be no assurances that adverse conditions will not arise in the credit and capital markets or from the restrictions placed on us by our regulators (with respect to utilizing brokered CDs, placing rate caps on INB’s deposit rates, paying dividends and incurring new debt) that would adversely impact our liquidity and ability to raise funds (either through attracting deposits, from borrowings or sales of assets) to meet our operations and satisfy our outstanding lending commitments and maturing liabilities or raise new working capital if needed.
Contractual Obligations
The table below summarizes our contractual obligations as of December 31, 2010.
| Amounts Due In | ||||||||||||||||||||
| ($ in thousands) | Total | 2011 | 2012 and 2013 |
2014 and 2015 |
2016 and Later |
|||||||||||||||
| Deposits with stated maturities |
$ | 1,304,945 | $ | 431,881 | $ | 647,461 | $ | 177,234 | $ | 48,369 | ||||||||||
| Deposits with no stated maturities |
461,138 | 461,138 | - | - | - | |||||||||||||||
| Subordinated debentures - capital securities |
56,702 | - | - | - | 56,702 | |||||||||||||||
| Mortgage escrow payable and official checks outstanding |
27,314 | 27,314 | - | - | - | |||||||||||||||
| FHLB advances |
25,500 | 8,000 | 17,500 | - | - | |||||||||||||||
| Unfunded loan commitments and lines of credit (1) |
7,121 | 7,121 | - | - | - | |||||||||||||||
| Operating lease payments |
4,980 | 1,240 | 3,216 | 518 | 6 | |||||||||||||||
| Accrued interest payable on deposits |
4,593 | 4,593 | - | - | - | |||||||||||||||
| Preferred cumulative dividends (2) |
3,750 | 1,250 | 2,500 | - | - | |||||||||||||||
| Accrued interest payable on all borrowed funds |
2,326 | 2,326 | - | - | - | |||||||||||||||
| Preferred cumulative dividends unpaid and in arrears |
1,441 | 1,441 | - | - | - | |||||||||||||||
| Death benefit payments |
990 | 257 | 560 | 173 | - | |||||||||||||||
| Mortgage note payable |
148 | 20 | 44 | 51 | 33 | |||||||||||||||
| $ | 1,900,948 | $ | 946,581 | $ | 671,281 | $ | 177,976 | $ | 105,110 | |||||||||||
| (1) | Since some of the commitments are expected to expire without being drawn upon, the total commitment amount does not necessarily represent future cash requirements. |
| (2) | Assumes $25 million of cumulative preferred stock will be outstanding through December 2013 with a dividend rate of 5% per year. |
Regulatory Capital and Regulatory Matters
IBC and INB are subject to various regulatory capital requirements and each is operating under formal agreements with their respective primary regulator as discussed in more detail in the section “Supervision and Regulation” in Item 1 “Business” and in note 20 to the consolidated financial statements included in this report.
67
Table of Contents
Asset and Liability Management
We have interest rate risk that arises from differences in the repricing of our assets and liabilities within a given time period. We have never engaged in trading or hedging activities, nor invested in interest rate derivatives or entered into interest rate swaps. The primary objective of our asset/liability management strategy is to limit, within established guidelines, the adverse effect of changes in interest rates on our net interest income and capital.
In this regard, INB, whose assets represent 99% of our consolidated assets, engages an outside consultant to prepare quarterly reports using an earnings simulation model to quantify the effects of various interest rate scenarios on INB’s projected net interest and dividend income over specified periods. These computations begin with our internally prepared gap analysis which is then further adjusted for additional assumptions regarding balance sheet growth and composition, and the pricing and repricing and maturity characteristics of INB’s balance sheet. Gap analysis measures the difference between interest-earning assets and interest-bearing liabilities that mature or reprice within a given time period. As noted in the footnotes to the gap table that follows, there are numerous assumptions that are made by us to compute the gap. A change in any of these assumptions would materially alter the results of the gap analysis as well as the simulation analysis noted above.
An asset or liability is normally considered to be interest-rate sensitive if it will reprice or mature within one year or less. The interest-rate sensitivity gap is the difference between interest-earning assets and interest-bearing liabilities scheduled to mature or reprice within one-year. A gap is considered positive when the amount of interest rate-sensitive assets exceeds the amount of interest rate-sensitive liabilities. Conversely, a gap is considered negative when the opposite is true. In a period of rising interest rates, a negative gap would tend to adversely affect net interest income, while a positive gap would tend to increase net interest income. In a period of falling interest rates, a negative gap would tend to increase net interest income, while a positive gap would tend to adversely affect net interest income. If the repricing of our assets and liabilities were equally flexible and moved concurrently, the impact of any increase or decrease in interest rates on our net interest income would be minimal.
A simple interest rate gap analysis by itself may not be an accurate indicator of how net interest income will be affected by changes in interest rates for the following reasons. Income associated with interest-earning assets and costs associated with interest-bearing liabilities may not be affected uniformly by changes in interest rates. In addition, the magnitude and duration of changes in interest rates may have a significant impact on net interest income. For example, although certain assets and liabilities may have similar maturities or periods of repricing, they may react in different degrees to changes in market interest rates. Interest rates on certain types of assets and liabilities fluctuate in advance of changes in general market interest rates, while interest rates on other types may lag behind changes in market rates. Callable features of certain assets and liabilities, in addition to the foregoing, may also cause actual experience to vary from the analysis. In addition, certain assets with adjustable rates may have features generally referred to as “interest rate caps and floors,” which limit changes in interest rates on a short-term basis and over the life of the asset. In the event of a change in interest rates, asset prepayment and early deposit withdrawal levels also could deviate significantly from those assumed in calculating the interest-rate gap. The amount of loan prepayments cannot be predicted with accuracy and we experience reinvestment risk associated with the investment of the resulting proceeds. The ability of many borrowers to service their debts also may decrease in the event of an interest-rate increase, and the behavior of depositors may be different from those assumed in the gap analysis.
The number of fixed-rate loans in our loan portfolio has increased significantly over the last several years. To illustrate, fixed-rate loans constituted approximately 78% of our loan portfolio at December 31, 2010, compared to approximately 40% at December 31, 2006. We also have many loans (approximately 20% of the portfolio) that have terms that call for predetermined interest rate increases at various times over the life of the loan, which may or may not be at the same magnitude as general changes in market rates. We also have a limited number (approximately 2% of the portfolio) of floating-rate loans that have a “floor” or minimum rate that was determined in relation to prevailing market rates on the date of origination. This floor only adjusts upwards in the event of increases in the loan’s interest rate.
68
Table of Contents
The table below summarizes our interest-earning assets and interest-bearing liabilities as of December 31, 2010, that are scheduled to mature or reprice within the periods shown.
| ($ in thousands) |
|
0-3 Months |
|
|
4-12 Months |
|
|
Over 1-5 Years |
|
|
Over 5 Years |
|
Total | |||||||
| Loans (1) |
$ | 82,017 | $ | 224,731 | $ | 861,197 | $ | 122,114 | $ | 1,290,059 | ||||||||||
| Securities held to maturity (2) |
193,737 | 329,503 | 88,777 | - | 612,017 | |||||||||||||||
| Short-term investments |
18,721 | - | - | - | 18,721 | |||||||||||||||
| FRB and FHLB stock |
4,428 | - | - | 5,227 | 9,655 | |||||||||||||||
| Total rate-sensitive assets |
$ | 298,903 | $ | 554,234 | $ | 949,974 | $ | 127,341 | $ | 1,930,452 | ||||||||||
| Deposit accounts (3): |
||||||||||||||||||||
| Interest checking deposits |
$ | 10,126 | $ | - | $ | - | $ | - | $ | 10,126 | ||||||||||
| Savings deposits |
10,123 | - | - | - | 10,123 | |||||||||||||||
| Money market deposits |
436,740 | - | - | - | 436,740 | |||||||||||||||
| Certificates of deposit |
139,515 | 292,366 | 824,695 | 48,369 | 1,304,945 | |||||||||||||||
| Total deposits |
596,504 | 292,366 | 824,695 | 48,369 | 1,761,934 | |||||||||||||||
| FHLB advances (1) |
3,000 | 5,000 | 17,500 | - | 25,500 | |||||||||||||||
| Debentures and mortgage note |
46,392 | 10,310 | - | 148 | 56,850 | |||||||||||||||
| Accrued interest on all borrowed |
2,326 | - | - | - | 2,326 | |||||||||||||||
| Total borrowed funds |
51,718 | 15,310 | 17,500 | 148 | 84,676 | |||||||||||||||
| Total rate-sensitive liabilities |
$ | 648,222 | $ | 307,676 | $ | 842,195 | $ | 48,517 | $ | 1,846,610 | ||||||||||
| GAP (repricing differences) |
$ | (349,319) | $ | 246,558 | $ | 107,779 | $ | 78,824 | $ | 83,842 | ||||||||||
| Cumulative GAP |
$ | (349,319) | $ | (102,761) | $ | 5,018 | $ | 83,842 | $ | 83,842 | ||||||||||
| Cumulative GAP to total assets |
(16.9)% | (5.0)% | 0.2% | 4.0% | 4.0% | |||||||||||||||
Significant assumptions used in preparing the gap table above follow:
(1) Floating-rate loans, loans with predetermined rate increases and floating-rate borrowings are included in the period in which their interest rates are next scheduled to adjust rather than in the period in which they mature. Fixed-rate loans and borrowings are scheduled according to their contractual maturities. Deferred loan fees and the effect of possible loan prepayments are excluded from the analysis. Nonaccrual loans of $52.9 million and foreclosed real estate of $27.1 million are also excluded from the table although some portion is expected to return to an interest-earning status in the near term.
(2) Securities are scheduled according to the earlier of their next callable date or the date on which the interest rate on the security is scheduled to change. Nearly all have predetermined interest rate increases or “steps up” to a specified rate on one or more predetermined dates. Generally, the security becomes eligible for redemption by the issuer at the date of the first scheduled step-up. The net carrying value ($2.3 million) of corporate securities that are on a cash basis of accounting are excluded from the table.
(3) Interest checking, savings and money market deposits are regarded as 100% readily accessible withdrawable accounts and certificates of deposit are scheduled according to their contractual maturity dates. This assumption contributes significantly to the liability sensitive position reported per the one-year gap analysis. However, if such deposits were treated differently, the one-year gap would then change. Depositors may not necessarily immediately withdraw funds in the event deposit rates offered by INB did not change as quickly and uniformly as changes in general market rates.
At December 31, 2010, the gap analysis above indicated that our interest-bearing liabilities that were scheduled to mature or reprice within one-year exceeded our interest-earning assets that were scheduled to mature or reprice within one-year. This one-year interest rate sensitivity gap amounted to a negative $103 million, or a negative 5.0% of total assets, at December 31, 2010. As a result of the negative one-year gap, the composition of our balance sheet at December 31, 2010 was considered “liability-sensitive,” indicating that our interest-bearing liabilities would generally reprice with changes in interest rates more rapidly than our interest-earning assets.
Based on our recent analysis of the earnings simulation model described earlier, the two-year cumulative risk to our net interest and dividend income would be a negative 5.8% for a 100 basis point rate decrease shock and a negative 8.0% for a 200 basis point rate increase shock. The model covers a 24 month horizon and assumes interest rate changes are gradually ramped up or down over a 12 month horizon using various assumptions based upon a parallel yield curve shift and subsequently sustained at those levels for the remainder of the simulation horizon. There can be no assurances that a sudden and substantial change in interest rates may not adversely impact our net interest and dividend income to a larger extent if interest rates on our assets and liabilities do not change at the same speed, to the same extent, or on the same basis, than those assumed in the model.
69
Table of Contents
Recent Accounting Standards Update
See note 1 the consolidated financial statements for a discussion of this topic.
Impact of Inflation and Changing Prices
Our financial statements and related financial data presented in this report have been prepared in accordance with accounting principles generally accepted in the United States of America, which require the measurement of financial position and operating results in terms of historical dollars without considering changes in the relative purchasing power of money over time due to inflation. The primary impact of inflation on our operations is reflected in increased operating costs. Because virtually all of our assets and liabilities are monetary in nature, changes in interest rates have a more significant impact on our performance than do the effects of changes in the general rate of inflation and in prices. Interest rates do not necessarily move in the same direction or in the same magnitude as the prices of goods and services.
Item 7A. Quantitative and Qualitative Disclosures About Market Risk
Market risk is the risk of loss from adverse changes in market prices and interest rates. Our market risk arises primarily from interest rate risk inherent in our lending, security investing, deposit-taking and borrowing activities. We do not engage in and accordingly have no risk related to trading accounts, commodities, interest rate hedges or foreign exchange. The measurement of market risk associated with financial instruments is meaningful only when all related and offsetting on-and off-balance sheet transactions are aggregated, and the resulting net positions are identified. Disclosures about the fair value of financial instruments which reflect changes in market prices and rates, can be found in note 21 to the consolidated financial statements included in this report. We also actively monitor and manage our interest rate risk exposure as discussed under the caption “Asset and Liability Management.”
Item 8. Financial Statements and Supplementary Data
Financial Statements
The following are included in this item:
- Management’s Report on Internal Control over Financial Reporting (page 71)
- Report of Independent Registered Public Accounting Firm on Internal Control (page 72)
- Report of Independent Registered Public Accounting Firm (page 73 )
- Consolidated Balance Sheets at December 31, 2010 and 2009 (page 74)
- Consolidated Statements of Operations for the Years Ended December 31, 2010, 2009 and 2008 (page 75)
- Consolidated Statements of Changes in Stockholders’ Equity for the Years Ended
December 31, 2010, 2009 and 2008 (page 76)
- Consolidated Statements of Cash Flows for the Years Ended December 31, 2010, 2009 and 2008 (page 77)
- Notes to the Consolidated Financial Statements (pages 79 to 110)
Supplementary Data
Other financial statement schedules and inapplicable periods with respect to schedules listed above are omitted because the conditions requiring their filing do not exist or the information required thereby is included in the consolidated financial statements filed, including the notes thereto.
70
Table of Contents
Management’s Report on Internal Control Over Financial Reporting
Board of Directors and Stockholders
Intervest Bancshares Corporation
New York, New York:
The management of Intervest Bancshares Corporation and subsidiaries (the “Company”) is responsible for establishing and maintaining effective internal control over financial reporting, including safeguarding of assets. The Company’s internal control structure contains monitoring mechanisms and actions are taken to correct deficiencies identified.
There are inherent limitations in the effectiveness of any internal control, including the possibility of human error and the circumvention or overriding of controls. Accordingly, even effective internal control can provide only reasonable assurance with respect to financial statement preparation. Further, because of changes in conditions, the effectiveness of internal control may vary over time.
Management assessed the effectiveness of the Company’s internal control over financial reporting, including safeguarding of assets as of December 31, 2010. This assessment was based on criteria for effective internal control over financial reporting, including safeguarding of assets, described in “Internal Control – Integrated Framework,” issued by the Committee of Sponsoring Organizations of the Treadway Commission. Based on this assessment, management believes that, as of December 31, 2010, the Company maintained effective internal control over financial reporting, including safeguarding of assets.
| /s/ Lowell S. Dansker |
| Lowell S. Dansker, Chairman and Chief Executive Officer |
| (Principal Executive Officer) |
| March 10, 2011 |
| /s/ John J. Arvonio |
| John J. Arvonio, Chief Financial and Accounting Officer |
| (Principal Financial Officer) |
| March 10, 2011 |
71
Table of Contents
Report of Independent Registered Public Accounting Firm on Internal Control
Board of Directors and Stockholders
Intervest Bancshares Corporation
New York, New York:
We have audited Intervest Bancshares Corporation and Subsidiaries (the “Company”) internal control over financial reporting as of December 31, 2010, based on criteria established in Internal Control-Integrated Framework issued by the Committee of Sponsoring Organizations of the Treadway Commission (COSO). The Company’s management is responsible for maintaining effective internal control over financial reporting and for its assessment of the effectiveness of internal control over financial reporting, included in the accompanying management assessment report (see page 71). Our responsibility is to express an opinion on the Company’s internal control over financial reporting based on our audit.
We conducted our audit in accordance with the standards of the Public Company Accounting Oversight Board (United States). Those standards require that we plan and perform the audit to obtain reasonable assurance about whether effective internal control over financial reporting was maintained in all material respects. Our audit included obtaining an understanding of internal control over financial reporting, assessing the risk that a material weakness exists and testing and evaluating the design and operating effectiveness of internal control based on the assessed risk. Our audit also included performing such other procedures as we considered necessary in the circumstances. We believe that our audit provides a reasonable basis for our opinion.
A company’s internal control over financial reporting is a process designed to provide reasonable assurance regarding the reliability of financial reporting and the preparation of financial statements for external purposes in accordance with generally accepted accounting principles. A company’s internal control over financial reporting includes those policies and procedures that (1) pertain to the maintenance of records that, in reasonable detail, accurately and fairly reflect the transactions and dispositions of the assets of the company; (2) provide reasonable assurance that transactions are recorded as necessary to permit preparation of financial statements in accordance with generally accepted accounting principles, and that receipts and expenditures of the company are being made only in accordance with authorizations of management and directors of the company; and (3) provide reasonable assurance regarding prevention or timely detection of unauthorized acquisition, use, or disposition of the company’s assets that could have a material effect on the financial statements.
Because of its inherent limitations, internal control over financial reporting, may not prevent or detect misstatements. Also, projections of any evaluation effectiveness to future periods are subject to the risk that the controls may become inadequate because of changes in conditions, or that the degree of compliance with the policies or procedures may deteriorate.
In our opinion, the Company maintained, in all material respects, effective internal control over financial reporting as of December 31, 2010, based on the criteria established in Internal Control-Integrated Framework issued by the Committee of Sponsoring Organizations of the Treadway Commission (COSO).
We have also audited, in accordance with the standards of the Public Company Accounting Oversight Board (United States), the consolidated financial statements as of December 31, 2010 and 2009 and for each of the years in the three-year period ended December 31, 2010 of the Company and our report dated March 10, 2011 expressed an unqualified opinion on those financial statements.
| /s/ Hacker, Johnson & Smith, P.A., P.C. |
| Hacker, Johnson & Smith, P.A., P.C. |
| Tampa, Florida |
| March 10, 2011 |
72
Table of Contents
Report of Independent Registered Public Accounting Firm
Board of Directors and Stockholders
Intervest Bancshares Corporation
New York, New York:
We have audited the accompanying consolidated balance sheets of Intervest Bancshares Corporation and Subsidiaries (the “Company”) as of December 31, 2010 and 2009 and the related consolidated statements of operations, changes in stockholders’ equity, and cash flows for each of the years in the three-year period ended December 31, 2010. These financial statements are the responsibility of the Company’s management. Our responsibility is to express an opinion on these financial statements based on our audits.
We conducted our audits in accordance with the standards of the Public Company Accounting Oversight Board (United States). Those standards require that we plan and perform the audit to obtain reasonable assurance about whether the financial statements are free of material misstatement. An audit includes examining, on a test basis, evidence supporting the amounts and disclosures in the financial statements. An audit also includes assessing the accounting principles used and significant estimates made by management, as well as evaluating the overall financial statement presentation. We believe that our audits provide a reasonable basis for our opinion.
In our opinion, the consolidated financial statements referred to above present fairly, in all material respects, the financial position of the Company at December 31, 2010 and 2009, and the results of its operations and its cash flows for each of the years in the three-year period ended December 31, 2010, in conformity with U.S. generally accepted accounting principles.
We have also audited, in accordance with the standards of the Public Company Accounting Oversight Board (United States), the Company’s internal control over financial reporting as of December 31, 2010, based on the criteria established in Internal Control-Integrated Framework issued by the Committee of Sponsoring Organizations of the Treadway Commission and our report dated March 10, 2011 expressed an unqualified opinion on the effectiveness of the Company’s internal control over financial reporting.
| /s/ Hacker, Johnson & Smith, P.A., P.C. |
| Hacker, Johnson & Smith, P.A., P.C. |
| Tampa, Florida |
| March 10, 2011 |
73
Table of Contents
Intervest Bancshares Corporation and Subsidiaries
Consolidated Balance Sheets
| At December 31, | ||||||||
| ($ in thousands, except par value) | 2010 | 2009 | ||||||
| ASSETS | ||||||||
| Cash and due from banks |
$ | 5,190 | $ | 6,318 | ||||
| Federal funds sold and other short-term investments |
18,721 | 1,659 | ||||||
| Total cash and cash equivalents |
23,911 | 7,977 | ||||||
| Securities held to maturity (estimated fair value of $606,658 and $630,554, respectively) |
614,335 | 634,856 | ||||||
| Federal Reserve Bank and Federal Home Loan Bank stock, at cost |
9,655 | 10,708 | ||||||
| Loans receivable (net of allowance for loan losses of $34,840 and $32,640, respectively) |
1,302,486 | 1,653,524 | ||||||
| Accrued interest receivable |
8,925 | 11,196 | ||||||
| Loan fees receivable |
5,470 | 7,890 | ||||||
| Premises and equipment, net |
4,612 | 4,924 | ||||||
| Foreclosed real estate (net of valuation allowance of $2,688 and $2,793, respectively) |
27,064 | 31,866 | ||||||
| Deferred income tax asset |
47,079 | 18,044 | ||||||
| Other assets |
27,331 | 20,219 | ||||||
| Total assets |
$ | 2,070,868 | $ | 2,401,204 | ||||
| LIABILITIES |
||||||||
| Deposits: |
||||||||
| Noninterest-bearing demand deposit accounts |
$ | 4,149 | $ | 3,429 | ||||
| Interest-bearing deposit accounts: |
||||||||
| Checking (NOW) accounts |
10,126 | 9,117 | ||||||
| Savings accounts |
10,123 | 11,682 | ||||||
| Money market accounts |
436,740 | 496,065 | ||||||
| Certificate of deposit accounts |
1,304,945 | 1,509,691 | ||||||
| Total deposit accounts |
1,766,083 | 2,029,984 | ||||||
| Borrowed funds: |
||||||||
| Federal Home Loan Bank advances |
25,500 | 61,500 | ||||||
| Subordinated debentures - capital securities |
56,702 | 56,702 | ||||||
| Accrued interest payable on all borrowed funds |
2,326 | 183 | ||||||
| Mortgage note payable |
148 | 167 | ||||||
| Total borrowed funds |
84,676 | 118,552 | ||||||
| Accrued interest payable on deposits |
4,593 | 6,201 | ||||||
| Mortgage escrow funds payable |
20,709 | 24,363 | ||||||
| Other liabilities |
8,847 | 8,050 | ||||||
| Total liabilities |
1,884,908 | 2,187,150 | ||||||
| Commitments and contingencies (notes 5, 10, 11,17,18,19 and 20) |
||||||||
| STOCKHOLDERS’ EQUITY |
||||||||
| Preferred stock ($1.00 par value; 300,000 shares authorized; 25,000 issued and outstanding) |
25 | 25 | ||||||
| Additional paid-in-capital, preferred |
24,975 | 24,975 | ||||||
| Preferred stock discount |
(1,148 | ) | (1,534) | |||||
| Class A common stock ($1.00 par value; 62,000,000 shares authorized; |
21,126 | 8,095 | ||||||
| Class B common stock ($1.00 par value;700,000 shares authorized |
- | 580 | ||||||
| Additional paid-in-capital, common |
84,705 | 81,353 | ||||||
| Unearned compensation on restricted common stock awards |
(749 | ) | - | |||||
| Retained earnings |
57,026 | 110,560 | ||||||
| Treasury common stock (404,339 shares at cost at December 31, 2009) |
- | (10,000) | ||||||
| Total stockholders’ equity |
185,960 | 214,054 | ||||||
| Total liabilities and stockholders’ equity |
$ | 2,070,868 | $ | 2,401,204 | ||||
See accompanying notes to consolidated financial statements.
74
Table of Contents
Intervest Bancshares Corporation and Subsidiaries
Consolidated Statements of Operations
| Year Ended December 31, | ||||||||||||
| ($ in thousands, except per share data) |
2010 | 2009 | 2008 | |||||||||
| INTEREST AND DIVIDEND INCOME |
||||||||||||
| Loans receivable |
$94,638 | $ | 106,105 | $ | 109,793 | |||||||
| Securities |
12,411 | 17,473 | 18,287 | |||||||||
| Other interest-earning assets |
23 | 20 | 417 | |||||||||
| Total interest and dividend income |
107,072 | 123,598 | 128,497 | |||||||||
| INTEREST EXPENSE |
||||||||||||
| Deposits |
58,987 | 75,528 | 80,636 | |||||||||
| Subordinated debentures |
- | 796 | 5,150 | |||||||||
| Subordinated debentures - capital securities |
2,148 | 2,713 | 3,496 | |||||||||
| FHLB advances and all other borrowed funds |
1,557 | 1,963 | 1,053 | |||||||||
| Total interest expense |
62,692 | 81,000 | 90,335 | |||||||||
| Net interest and dividend income |
44,380 | 42,598 | 38,162 | |||||||||
| Provision for loan losses |
101,463 | 10,865 | 11,158 | |||||||||
| Net interest and dividend (expense) income after provision for loan losses |
(57,083) | 31,733 | 27,004 | |||||||||
| NONINTEREST INCOME |
||||||||||||
| Income from the early repayment of mortgage loans |
1,420 | 1,235 | 2,363 | |||||||||
| Income from mortgage lending activities |
1,646 | 1,214 | 1,675 | |||||||||
| Customer service fees |
460 | 412 | 684 | |||||||||
| Gain from sales of securities available for sale |
693 | - | - | |||||||||
| (Loss) gain from early call of investment securities |
(917) | (306) | 304 | |||||||||
| Impairment writedowns on investment securities |
(1,192) | (2,258) | - | |||||||||
| Total noninterest income |
2,110 | 297 | 5,026 | |||||||||
| NONINTEREST EXPENSES |
||||||||||||
| Salaries and employee benefits |
6,472 | 6,247 | 6,039 | |||||||||
| Occupancy and equipment, net |
1,812 | 1,903 | 1,755 | |||||||||
| Data processing |
1,712 | 1,131 | 1,016 | |||||||||
| Professional fees and services |
2,368 | 1,812 | 1,549 | |||||||||
| Stationery, printing, supplies, postage and delivery |
299 | 289 | 281 | |||||||||
| FDIC insurance |
4,772 | 5,221 | 1,517 | |||||||||
| General insurance |
538 | 378 | 216 | |||||||||
| Director and committee fees |
369 | 372 | 336 | |||||||||
| Advertising and promotion |
71 | 191 | 253 | |||||||||
| Real estate activities expense |
4,105 | 4,945 | 4,281 | |||||||||
| Provision for real estate losses |
15,509 | 2,275 | 518 | |||||||||
| Loss on early extinguishment of debentures |
- | 1,702 | 570 | |||||||||
| All other |
656 | 618 | 542 | |||||||||
| Total noninterest expenses |
38,683 | 27,084 | 18,873 | |||||||||
| (Loss) earnings before income taxes |
(93,656) | 4,946 | 13,157 | |||||||||
| (Benefit) provision for income taxes |
(40,348) | 1,816 | 5,891 | |||||||||
| Net (loss) earnings |
(53,308) | 3,130 | 7,266 | |||||||||
| Preferred stock dividend requirements and discount amortization |
1,667 | 1,632 | 41 | |||||||||
| Net (loss) earnings available to common stockholders |
$ | (54,975) | $ | 1,498 | $ | 7,225 | ||||||
| Basic (loss) earnings per common share |
$ | (4.95) | $ | 0.18 | $ | 0.87 | ||||||
| Diluted (loss) earnings per common share |
$ | (4.95) | $ | 0.18 | $ | 0.87 | ||||||
| Cash dividends per common share |
$ | - | $ | - | $ | 0.25 | ||||||
See accompanying notes to consolidated financial statements.
75
Table of Contents
Intervest Bancshares Corporation and Subsidiaries
Consolidated Statements of Changes in Stockholders’ Equity
| Year Ended December 31, | ||||||||||||
| ($ in thousands) | 2010 | 2009 | 2008 | |||||||||
| PREFERRED STOCK |
||||||||||||
| Balance at beginning of year |
$ 25 | $ 25 | $ - | |||||||||
| Issuance of 25,000 shares of Series A to U.S. Treasury |
- | - | 25 | |||||||||
| Balance at end of year |
25 | 25 | 25 | |||||||||
| ADDITIONAL PAID-IN-CAPITAL, PREFERRED |
||||||||||||
| Balance at beginning of year |
24,975 | 24,975 | - | |||||||||
| Issuance of 25,000 shares of Series A to U.S. Treasury |
- | - | 24,975 | |||||||||
| Balance at end of year |
24,975 | 24,975 | 24,975 | |||||||||
| PREFERRED STOCK DISCOUNT |
||||||||||||
| Balance at beginning of year |
(1,534 | ) | (1,920 | ) | - | |||||||
| Allocation of estimated fair value of common stock warrant issued |
- | - | (1,930) | |||||||||
| Amortization of preferred stock discount |
386 | 386 | 10 | |||||||||
| Balance at end of year |
(1,148 | ) | (1,534 | ) | (1,920) | |||||||
| CLASS A COMMON STOCK |
||||||||||||
| Balance at beginning of year |
8,095 | 8,095 | 8,095 | |||||||||
| Issuance of 850,000 shares in a private placement |
850 | - | - | |||||||||
| Issuance of 11,686,377 shares in a public offering |
11,686 | - | - | |||||||||
| Issuance of 319,300 shares of restricted stock to employees/directors |
319 | - | - | |||||||||
| Issuance of 580,000 shares upon conversion of Class B common stock |
580 | - | - | |||||||||
| Retirement of 404,339 shares of treasury stock |
(404 | ) | - | - | ||||||||
| Balance at end of year |
21,126 | 8,095 | 8,095 | |||||||||
| CLASS B COMMON STOCK |
||||||||||||
| Balance at beginning of year |
580 | 580 | 385 | |||||||||
| Issuance of 195,000 shares upon exercise of stock warrants |
- | - | 195 | |||||||||
| Conversion of 580,000 shares into Class A common stock |
(580 | ) | - | - | ||||||||
| Balance at end of year |
- | 580 | 580 | |||||||||
| ADDITIONAL PAID-IN-CAPITAL, COMMON |
||||||||||||
| Balance at beginning of year |
81,353 | 81,157 | 77,176 | |||||||||
| Issuance of 195,000 Class B shares, inclusive of income tax benefits |
- | - | 1,608 | |||||||||
| Issuance of 850,000 Class A shares in a private placement, net of issuance costs |
3,145 | - | - | |||||||||
| Issuance of 11,686,377 Class A shares in a public offering, net of issuance costs |
9,331 | - | - | |||||||||
| Issuance of 319,300 Class A shares of restricted stock to employees/directors |
431 | - | - | |||||||||
| Retirement of 404,339 Class A shares of treasury stock |
(9,596 | ) | - | - | ||||||||
| Compensation expense related to grants of restricted stock and stock options |
41 | 196 | 443 | |||||||||
| Estimated fair value allocated to common stock warrant issued to U.S. Treasury |
- | - | 1,930 | |||||||||
| Balance at end of year |
84,705 | 81,353 | 81,157 | |||||||||
| UNEARNED COMPENSATION ON RESTRICTED COMMON STOCK AWARDS |
|
|||||||||||
| Balance at beginning of year |
- | - | - | |||||||||
| Issuance of 319,300 shares of restricted Class A stock to employees/directors |
(750 | ) | - | - | ||||||||
| Amortization of unearned compensation to compensation expense |
1 | - | - | |||||||||
| Balance at end of year |
(749 | ) | - | - | ||||||||
| RETAINED EARNINGS |
||||||||||||
| Balance at beginning of year |
110,560 | 109,062 | 103,906 | |||||||||
| Net (loss) earnings for the year |
(53,308 | ) | 3,130 | 7,266 | ||||||||
| Preferred stock dividends accrued |
160 | (128 | ) | (32) | ||||||||
| Cash dividends paid to common stockholders |
- | - | (2,068) | |||||||||
| Cash dividends paid to preferred stockholder - U.S Treasury |
- | (1,118 | ) | - | ||||||||
| Preferred stock discount amortization |
(386 | ) | (386 | ) | (10) | |||||||
| Balance at end of year |
57,026 | 110,560 | 109,062 | |||||||||
| TREASURY COMMON STOCK |
||||||||||||
| Balance at beginning of year |
(10,000 | ) | (10,000 | ) | (10,000) | |||||||
| Retirement of 404,339 shares of treasury stock |
10,000 | - | - | |||||||||
| Balance at end of year |
- | (10,000 | ) | (10,000) | ||||||||
| Total stockholders’ equity at end of year |
$185,960 | $214,054 | $211,974 | |||||||||
76
Table of Contents
Intervest Bancshares Corporation and Subsidiaries
Consolidated Statements of Changes in Stockholders’ Equity, Continued
| Year Ended December 31, | ||||||||||||
| ($ in thousands) | 2010 | 2009 | 2008 | |||||||||
| Total preferred stockholder’s equity at end of year |
$ 23,852 | $ 23,466 | $ 23,080 | |||||||||
| Total common stockholders’ equity at end of year |
162,108 | 190,588 | 188,894 | |||||||||
| Total stockholders’ equity at end of year |
$185,960 | $214,054 | $211,974 | |||||||||
| RECONCILIATION OF COMMON SHARES OUTSTANDING |
||||||||||||
| Total Class A and Class B shares outstanding at beginning of year |
8,270,812 | 8,270,812 | 8,075,812 | |||||||||
| Issuance of shares upon the exercise of common stock warrants |
- | - | 195,000 | |||||||||
| Issuance of shares in a private placement |
850,000 | - | - | |||||||||
| Issuance of shares in a public offering |
11,686,377 | - | - | |||||||||
| Issuance of shares of restricted stock to employees/directors |
319,300 | - | - | |||||||||
| Total Class A and Class B shares outstanding at end of year |
21,126,489 | 8,270,812 | 8,270,812 | |||||||||
See accompanying notes to consolidated financial statements.
77
Table of Contents
Intervest Bancshares Corporation and Subsidiaries
Consolidated Statements of Cash Flows
| Year Ended December 31, | ||||||||||||
| ($ in thousands) | 2010 | 2009 | 2008 | |||||||||
| OPERATING ACTIVITIES |
||||||||||||
| Net (loss) earnings before preferred dividend requirements |
$ | (53,308 | ) | $ | 3,130 | $ | 7,266 | |||||
| Adjustments to reconcile net (loss) earnings to net cash provided |
||||||||||||
| Depreciation and amortization |
368 | 510 | 556 | |||||||||
| Provisions for loan and real estate losses |
116,972 | 13,140 | 11,676 | |||||||||
| Deferred income tax benefit |
(29,035 | ) | (4,541 | ) | (3,116) | |||||||
| Compensation expense related to grants of common stock and options |
41 | 196 | 443 | |||||||||
| Amortization of deferred debenture offering costs |
37 | 145 | 778 | |||||||||
| Amortization of premiums (accretion) of discounts and deferred loan fees, net |
951 | (2,856 | ) | (5,447) | ||||||||
| Net gain from sale of securities available for sale |
(693 | ) | - | - | ||||||||
| Net loss (gain) on sales of foreclosed real estate |
127 | (10 | ) | 314 | ||||||||
| Net loss on early extinguishments of debentures |
- | 1,702 | 570 | |||||||||
| Impairment writedowns on investment securities |
1,192 | 2,258 | - | |||||||||
| Net increase (decrease) in accrued interest payable on debentures |
2,177 | (1,997 | ) | (1,200) | ||||||||
| Net increase (decrease ) in official checks outstanding |
1,389 | (6,643 | ) | (558) | ||||||||
| Net change in all other assets and liabilities |
(3,378 | ) | (12,380 | ) | 4,707 | |||||||
| Net cash provided by (used in) operating activities |
36,840 | (7,346 | ) | 15,989 | ||||||||
| INVESTING ACTIVITIES |
||||||||||||
| Maturities and calls of securities held to maturity |
789,442 | 611,451 | 411,523 | |||||||||
| Purchases of securities held to maturity |
(798,231 | ) | (774,237 | ) | (542,705) | |||||||
| Proceeds from sales of securities available for sale |
24,772 | - | - | |||||||||
| Proceeds from sales of foreclosed real estate |
14,035 | 48 | 15,186 | |||||||||
| Proceeds from sales of loans |
110,001 | - | - | |||||||||
| Repayments (originations) of loans receivable, net |
116,640 | (11,065 | ) | (119,431) | ||||||||
| Redemptions (purchases) of FRB and FHLB stock, net |
1,053 | (1,807 | ) | (2,550) | ||||||||
| Purchases of premises and equipment, net |
(56 | ) | (19 | ) | (74) | |||||||
| Net cash provided by (used in) investing activities |
257,656 | (175,629 | ) | (238,051) | ||||||||
| FINANCING ACTIVITIES |
||||||||||||
| Net (decrease) increase in deposits |
(263,901 | ) | 165,849 | 204,961 | ||||||||
| Net (decrease) increase in mortgage escrow funds payable |
(3,654 | ) | 335 | (51) | ||||||||
| Net (decrease) increase in FHLB advances - original terms of 3 months or less |
(11,000 | ) | 11,000 | - | ||||||||
| Net (decrease) increase in FHLB advances - original terms of more than 3 months |
(25,000 | ) | - | 50,500 | ||||||||
| Principal repayments of debentures and mortgage note payable |
(19 | ) | (40,017 | ) | (36,266) | |||||||
| Cash received from issuance of preferred stock and common stock warrant |
- | - | 25,000 | |||||||||
| Cash received from issuance of common stock upon exercise of stock warrants |
- | - | 1,467 | |||||||||
| Excess tax benefit from exercise of stock warrants recorded to paid in capital |
- | - | 336 | |||||||||
| Cash received from issuance of common stock, net of issuance costs |
25,012 | - | - | |||||||||
| Cash dividends paid to preferred stockholder - U.S. Treasury |
- | (1,118 | ) | - | ||||||||
| Cash dividends paid to common stockholders |
- | - | (2,068) | |||||||||
| Net cash (used in) provided by financing activities |
(278,562 | ) | 136,049 | 243,879 | ||||||||
| Net increase (decrease) in cash and cash equivalents |
15,934 | (46,926 | ) | 21,817 | ||||||||
| Cash and cash equivalents at beginning of year |
7,977 | 54,903 | 33,086 | |||||||||
| Cash and cash equivalents at end of year |
$ | 23,911 | $ | 7,977 | $ | 54,903 | ||||||
| SUPPLEMENTAL DISCLOSURES |
||||||||||||
| Cash paid for interest |
$ | 62,120 | $ | 83,519 | $ | 90,497 | ||||||
| Cash paid for income taxes |
929 | 5,748 | 8,437 | |||||||||
| Loans transferred to foreclosed real estate |
40,885 | 27,748 | 25,070 | |||||||||
| Loans originated to finance sales of foreclosed real estate |
16,016 | 2,650 | - | |||||||||
| Loans held to maturity transferred to loans available for sale |
110,001 | - | - | |||||||||
| Preferred stock dividend requirements and amortization of related discount |
1,667 | 1,632 | 41 | |||||||||
| Securities held to maturity transferred to securities available for sale |
24,079 | - | - | |||||||||
See accompanying notes to consolidated financial statements.
78
Table of Contents
Intervest Bancshares Corporation and Subsidiaries
Notes to Consolidated Financial Statements
For the Years Ended December 31, 2010, 2009 and 2008
| 1. | Description of Business and Summary of Significant Accounting Policies |
Intervest Bancshares Corporation (IBC) is a bank holding company incorporated in 1993 under the laws of the State of Delaware. IBC’s Class A common stock trades on the Nasdaq Global Select Market: symbol IBCA. IBC is the parent company of Intervest National Bank (INB) and IBC owns 100% of its capital stock. IBC also owns 100% of Intervest Mortgage Corporation (IMC) whose business focused on commercial and multifamily real estate lending funded by the issuance of its subordinated debentures in public offerings. IMC has not conducted new business since 2009 and was merged into IBC effective January 1, 2011. IBC does not engage in any other substantial business activities other than a limited amount of real estate mortgage lending, including the participation in loans originated by INB. IBC issues debt and equity securities to raise funds as needed for working capital purposes.
Our business is banking and real estate lending conducted through INB’s operations. INB is a nationally chartered commercial bank that opened on April 1, 1999. INB has accounted for over 96% on average of our total consolidated assets during the reporting periods of this report. We have only one operating segment, which is defined as a component of an enterprise that engages in business activities from which it may earn revenues and incur expenses whose separate financial information is available and evaluated regularly by a company’s chief decision makers to perform resource allocations and performance assessments.
INB’s headquarters and full-service banking office is located in Rockefeller Plaza in New York City, and it has a total of six full-service banking offices in Pinellas County, Florida - four in Clearwater, one in Clearwater Beach and one in South Pasadena. INB conducts a personalized commercial and consumer banking business that attracts deposits from the general public. It provides internet banking services through its web site www.intervestnatbank.com, which also attracts deposit customers from outside its primary market areas. INB uses the deposits, together with funds generated from its operations, principal repayments of loans and securities and other sources, to originate mortgage loans secured by commercial and multifamily real estate and to purchase investment securities. References to “we,” “us” and “our” in these notes refer to IBC and its consolidated subsidiaries on a consolidated basis, unless otherwise specified. The offices of IBC and INB’s headquarters and full-service banking office are located on the entire fourth floor of One Rockefeller Plaza in New York City, New York, 10020-2002. The main telephone number is 212-218-2800.
Our business strategy is to attract deposits and use those funds to originate commercial and multifamily real estate loans on a profitable basis, while maintaining the combination of efficient customer service and loan underwriting and a low-cost infrastructure. We rely upon the relationships we have developed with our borrowers and brokers with whom we have done business in the past as primary sources of new loans. We believe that our ability to rapidly and efficiently process and close mortgage loans gives us a competitive advantage. We also emphasize providing exceptional customer service as a means to attract and retain customers. We deliver personalized service and respond with flexibility to customer needs. We believe the above factors distinguish us from larger banks that operate in our primary market areas. In addition, we have a website, I-netMortgageClearingHouse.com, which is an interactive web portal connecting buyers and sellers of real estate mortgages. The website provides access to banks and credit unions throughout the country so that prospective buyers of mortgage loans can access information about potential portfolio properties and sellers of loans can efficiently list mortgages for sale. We expect this website to be beneficial to our business strategy.
Our lending activities emphasize the origination for portfolio first mortgage loans secured by commercial and multifamily real estate. As a matter of policy, we do not own or originate construction/development loans or condominium conversion loans. We tend to lend in geographical areas that are in the process of being revitalized or redeveloped, with a concentration of loans on properties located in New York and Florida. We solicit deposit accounts from individuals, small businesses and professional firms located throughout our primary market areas in New York and Florida through the offering of a variety of deposit products.
79
Table of Contents
Intervest Bancshares Corporation and Subsidiaries
Notes to Consolidated Financial Statements
For the Years Ended December 31, 2010, 2009 and 2008
| 1. | Description of Business and Summary of Significant Accounting Policies, Continued |
Principles of Consolidation, Basis of Presentation and Use of Estimates
The consolidated financial statements include the accounts of IBC and its consolidated subsidiaries. All significant intercompany balances and transactions have been eliminated in consolidation. Certain reclassifications have been made to prior year amounts to conform to the current year’s presentation. Our accounting and reporting policies conform to Generally Accepted Accounting Principles (“GAAP”) and to general practices within the banking industry.
In preparing the consolidated financial statements, we are required to make estimates and assumptions that affect the reported amounts of our assets, liabilities and disclosure of our contingent liabilities as of the date of the consolidated financial statements, and revenues and expenses during the reporting periods. Actual results could differ from those estimates. Estimates that are particularly susceptible to significant change currently relate to the determination of our allowance for loan losses, valuation allowance for real estate losses, other than temporary impairment assessments of our security investments and the need for and amount of a valuation allowance for our deferred tax asset. These estimates involve a higher degree of complexity and subjectivity and require assumptions about highly uncertain matters. Current market conditions increase the risk and complexity of the judgments in these estimates.
Cash Equivalents
For purposes of reporting cash flows, our cash equivalents include cash and balances due from banks, federal funds sold (generally sold for one-day periods) and commercial paper and other short-term investments that have maturities of three months or less from the time of purchase.
Securities Held to Maturity
Securities for which we have the ability and intent to hold until maturity are classified as securities held to maturity and are carried at cost, adjusted for accretion of discounts and amortization of premiums, which are recognized into interest income using the interest method over the period to maturity. Securities that are held for indefinite periods of time which we intend to use as part of our asset/liability management strategy, or that may be sold in response to changes in interest rates or other factors, are classified as available for sale and are carried at fair value. Unrealized gains and losses on securities available for sale, net of related income taxes, are reported as a separate component of comprehensive income. Realized gains and losses from sales of securities are determined using the specific identification method. We do not purchase securities for the purpose of engaging in trading activities.
We evaluate our security investments for other than temporary impairment (“OTTI”) at least quarterly or more frequently when conditions warrant such evaluation. Impairment is assessed at the individual security level. We consider an investment security to be impaired if, after a review of available evidence, the full collection of our principal investment and interest over the life of the security is no longer probable. The assessment for and the amount of impairment requires the exercise of considerable judgment by us and is entirely an estimate and not a precise determination. Our impairment evaluation process considers factors such as the expected cash flows of the security, severity, length of time and anticipated recovery period of the cash shortfalls, recent events specific to the issuer, including investment downgrades by rating agencies and current and anticipated economic and regulatory conditions of its industry, and the issuer’s financial condition, capital strength and near-term prospects. We also consider our intent and ability to retain the security for a period of time sufficient to allow for a recovery in fair value, or until maturity. Among the factors that we consider in determining our intent and ability to retain the security is a review of our capital adequacy, interest rate risk position and liquidity. If it is deemed that OTTI has occurred, the security is written down to a new cost basis and the resulting loss is charged to operations as a component of noninterest income.
80
Table of Contents
Intervest Bancshares Corporation and Subsidiaries
Notes to Consolidated Financial Statements
For the Years Ended December 31, 2010, 2009 and 2008
| 1. | Description of Business and Summary of Significant Accounting Policies, Continued |
Federal Home Loan Bank of New York and Federal Reserve Bank of New York Stock
As a member of these institutions, INB is required to purchase and hold capital stock of each entity based on various criteria. Such investments are carried at cost and we periodically review each to determine if any impairment exists for these investments.
Loans Receivable
Loans for which we have the intent and ability to hold for the foreseeable future or until maturity or satisfaction are carried at their outstanding principal net of chargeoffs, the allowance for loan losses, unamortized discounts and deferred loan fees or costs. Loan origination and commitment fees, net of certain costs, are deferred and amortized to interest income as an adjustment to the yield of the related loans over the contractual life of the loans using the interest method. When a loan is paid off or sold, or if a commitment expires unexercised, any unamortized net deferred amount is credited or charged to operations.
All loans are placed on nonaccrual status when principal or interest becomes 90 days or more past due or earlier in certain cases unless the loan is well secured and in the process of collection. Past due status is based on contractual terms of the loan. When a loan is placed on nonaccrual status, all interest accrued but not collected is reversed against interest income and amortization of net deferred fee income is discontinued. Interest payments received on loans in nonaccrual status are recognized as income on a cash basis unless future collections of principal are doubtful, in which case the payments received are applied as a reduction of principal. Loans are returned to accrual status when all the principal and interest amounts contractually due are brought current and future payments are reasonably assured. In some circumstances, interest continues to accrue on mortgage loans that have matured and the borrower continues to make monthly payments of principal and interest.
Allowance for Loan Losses and Impaired Loans
The allowance for loan losses is netted against loans receivable and is increased by provisions charged to operations and decreased by chargeoffs (net of recoveries). The adequacy of the allowance is evaluated at least quarterly with consideration given to our historical lending loss rate adjusted for the review of the following qualitative factors: the nature and size of our loan portfolio; overall portfolio quality; loan concentrations by type and location of the collateral property; specific problem loans and estimates of fair value of the related collateral; historical chargeoffs and recoveries; trends in nonaccrual loans; adverse situations which may affect the borrowers’ ability to repay; our perception of the current and anticipated economic conditions in our lending areas as well as national economic conditions; trends in our loan volume and associated terms; changes in our risk selection, underwriting standards, and policies and procedures in making new loans; and the experience, ability and depth of our lending team and other staff.
All loans are normally deemed impaired when, based upon current information and events, it is probable that we will be unable to collect both principal and interest due according to the contractual terms of the loan agreement. Impairment for larger balance loans can be measured based on either the present value of expected future cash flows, discounted at the loan’s effective interest rate; the observable market price of the loan; or the estimated fair value of the loan’s collateral, if payment of the principal and interest is dependent upon the collateral. When the fair value of the property is less than the recorded investment in the loan, this deficiency is recognized as a specific valuation allowance (recorded as part of the allowance for loan losses) with a charge to expense through the provision for loan losses. We consider a variety of factors in determining whether a loan is impaired, including (i) any notice from the borrower that the borrower will be unable to repay all principal and interest amounts contractually due under the loan agreement, (ii) any delinquency in the principal and/or interest payments other than minimal delays or shortfalls in payments, and (iii) other information known by us that would indicate the full repayment of principal and interest is not probable.
81
Table of Contents
Intervest Bancshares Corporation and Subsidiaries
Notes to Consolidated Financial Statements
For the Years Ended December 31, 2010, 2009 and 2008
| 1. | Description of Business and Summary of Significant Accounting Policies, Continued |
We generally consider delinquencies of 60 days or less to be minimal delays, and accordingly we do not consider such delinquent loans to be impaired in the absence of other indications.
Our impaired loans normally consist of loans on nonaccrual status and those classified as troubled debt restructurings (TDRs). Generally, impairment for all of our impaired loans is calculated on a loan-by-loan basis using either the estimated fair value of the loan’s collateral less estimated selling costs (for collateral dependent loans) or the present value of the loan’s cash flows (for non-collateral dependent loans). Any calculated impairment is recognized as a valuation allowance within the overall allowance for loan losses and a charge through the provision for loan losses. We may charge off any portion of the impaired loan with a corresponding decrease to the valuation allowance when such impairment is deemed uncollectible. The net carrying amount of an impaired loan (net of the valuation allowance) does not at any time exceed the recorded investment in the loan.
A TDR is a loan that we have restructured, for economic or legal reasons related to a borrower’s financial difficulties, and for which we have granted certain concessions to the borrower that we would not otherwise have considered. These concessions are made to provide payment relief generally consisting of the deferral of principal and or interest payments for a period of time, or a partial reduction in interest payments. A loan that is extended or renewed at a stated interest rate equal to the current interest rate for a new loan originated by us with similar risk is not reported as a restructured loan. A TDR that is on nonaccrual status is returned to an accrual status if ultimate collectability of principal is assured, and the borrower has demonstrated satisfactory payment performance either before or after the restructuring, usually consisting of a six-month period.
Our regulators, as an integral part of their examination process, also periodically review our allowances for loan and real estate losses. Accordingly, we may be required to take chargeoffs and/or recognize additions to these allowances based on the regulators’ judgment concerning information available to them during their examination.
Premises and Equipment
Land is carried at cost. Buildings, leasehold improvements and furniture, fixtures and equipment are carried at cost, less accumulated depreciation and amortization. Depreciation is computed using the straight-line method over the estimated useful life of the asset. Leasehold improvements are amortized using the straight-line method over the terms of the related leases, or the useful life of the asset, whichever is shorter. Maintenance, repairs and minor improvements are expensed as incurred, while major improvements are capitalized.
Deferred Debenture Offering Costs
Costs relating to offerings of our debentures consisting primarily of underwriters’ commissions are amortized over the life of the debentures. At December 31, 2010, these costs totaled $0.8 million, net of accumulated amortization of $0.3 million, compared to $0.9 million, net of accumulated amortization of $0.2 million, at December 31, 2009.
Foreclosed Real Estate and Valuation Allowance For Real Estate Losses
Real estate that we acquire through loan foreclosure or similar proceedings is held for sale. At the time we acquire the property, the related loan is transferred from the loan portfolio to foreclosed real estate at the estimated fair value of the property less estimated selling costs. Such amount becomes the new cost basis of the property. Adjustments made to reduce the carrying value at the time of transfer are charged to the allowance for loan losses. As the properties are actively marketed for sale, we may periodically adjust the carrying values of the real estate to reflect decreases in estimated fair values resulting from changing market conditions through a charge to operations (provision for real estate losses) and an increase to the valuation allowance for real estate losses. As the properties are sold, the valuation allowance associated with the property, if any, is charged off.
82
Table of Contents
Intervest Bancshares Corporation and Subsidiaries
Notes to Consolidated Financial Statements
For the Years Ended December 31, 2010, 2009 and 2008
| 1. | Description of Business and Summary of Significant Accounting Policies, Continued |
Revenue and expenses from the operations of foreclosed real estate are included in the caption “Real Estate Activities” in the consolidated statements of operations. This line item is comprised of any rental income received, and real estate taxes, insurance, utilities and other charges that we pay to protect our interest in real estate acquired through foreclosure as well as properties collateralizing our nonaccrual loans. We also incur certain legal costs in our collection efforts with the above assets, which are included as part of the line item “Professional Fees and Services” in the consolidated statements of operations.
Stock-Based Compensation
We recognize the cost of our employee and director services received in exchange for awards of our equity instruments (such as restricted stock, stock option and warrant grants) based on the grant-date fair value of the awards. Compensation cost related to the awards is recognized on a straight-line basis over the requisite service period, which is normally the vesting period of the grants. The fair value of options and warrants granted is estimated using the Black-Scholes option-pricing model based on various assumptions that are described in note 14. The fair value of restricted stock grants is based on the closing market value of the stock as reported on the Nasdaq Stock Market on the grant date.
Advertising Costs
Advertising costs are expensed as incurred.
Income Taxes
Current income tax expense reflects taxes to be paid or refunded for the current period by applying the provisions of the enacted tax law to our taxable income or loss.
Deferred income taxes are recognized for the tax consequences of temporary differences by applying enacted statutory tax rates, applicable to future years, to differences between the financial statement carrying amounts and the tax basis of existing assets and liabilities. The effect on deferred tax assets and liabilities of a change in tax rates is recognized in income tax expense in the period that includes the enactment date. Deferred tax assets are reduced by a valuation allowance if, based on the weight of evidence available, it is more likely than not that some portion or all of a deferred tax asset will not be realized. Certain tax benefits attributable to stock options, restricted stock and warrants are credited to additional paid-in-capital. Accruals of interest and penalties related to unrecognized tax benefits are recognized in income tax expense.
Uncertain tax positions are recognized if it is more likely (a likelihood of more than 50 percent) than not that the tax position will be realized or sustained upon examination. A tax position that meets the more-likely-than-not recognition threshold is initially and subsequently measured as the largest amount of tax benefit that has a greater than 50 percent likelihood of being realized upon settlement with a taxing authority. The determination of whether or not a tax position has met the more-likely-than-not recognition threshold considers the facts, circumstances, and information available at the reporting date and is subject to management’s judgment. At December 31, 2010, we were not aware of any uncertain tax positions that would have a material effect on our financial statements.
Earnings (Loss) Per Common Share
Basic earnings (loss) per common share is calculated by dividing net earnings (loss) available to common stockholders by the weighted-average number of shares of all common stock outstanding. Unvested restricted stock is deemed to be issued and outstanding. Diluted earnings (loss) per common share is calculated by dividing net earnings (loss) available to common stockholders by the weighted-average number of shares of common stock and dilutive potential common stock shares that may be outstanding in the future. Potential common stock shares consist of shares that may arise from outstanding dilutive common stock warrants and options (the number of which is computed using the “treasury stock method”).
83
Table of Contents
Intervest Bancshares Corporation and Subsidiaries
Notes to Consolidated Financial Statements
For the Years Ended December 31, 2010, 2009 and 2008
| 1. | Description of Business and Summary of Significant Accounting Policies, Continued |
When applying the treasury stock method, we add: the assumed proceeds from stock option and warrant exercises; the tax benefit that would have been credited to additional paid-in capital assuming exercise of non-qualified stock options and warrants and the unamortized compensation costs related to unvested shares of stock options and warrants. We then divide this sum by our average stock price for the period to calculate shares assumed to be repurchased. The excess of the number of shares issuable over the number of shares assumed to be repurchased is added to basic weighted average common shares to calculate diluted earnings (loss) per common share.
Off-Balance Sheet Financial Instruments
We enter into off-balance sheet financial instruments consisting of commitments to extend credit, unused lines of credit and from time to time standby letters of credit. Such financial instruments are recorded in the financial statements when they are funded or related fees are received.
Recent Accounting Standards Update
In January 2010, the Financial Accounting Standards Board (“FASB”) issued Accounting Standards Update “ASU” No. 2010-01 “Accounting for Distributions to Shareholders with Components of Stock and Cash (Topic 505),” which clarifies that a distribution to shareholders that offers them the ability to elect to receive their entire distribution in cash or stock with a potential limitation on the total amount of cash that all shareholders can receive in the aggregate is considered a share issuance that is reflected in EPS prospectively and is not a stock dividend. We adopted this guidance and it had no effect on our consolidated financial statements.
In January 2010, the FASB issued ASU No. 2010-06 “Improving Disclosures About Fair Value Measurements (Topic 820),” which amends the guidance for fair value measurements and disclosures. The guidance in ASU 2010-06 requires a reporting entity to disclose separately the amounts of significant transfers in and out of Level 1 and Level 2 fair value measurements and to describe the reasons for the transfers. Furthermore, it requires a reporting entity to present separately information about purchases, sales, issuances, and settlements in the reconciliation for fair value measurements using significant unobservable inputs; clarifies existing fair value disclosures about the level of disaggregation and about inputs and valuation techniques used to measure fair value; and amends guidance on employers’ disclosures about postretirement benefit plan assets to require that disclosures be provided by classes of assets instead of by major categories of assets. We adopted this guidance and it had no effect on our consolidated financial statements.
In February 2010, the FASB issued ASU No. 2010-09, Subsequent Events (Topic 855): Amendments to Certain Recognition and Disclosure Requirements. The amendments in the ASU remove the requirement for companies that are subject to the periodic reporting requirements of the Exchange Act to disclose a date through which subsequent events have been evaluated in both issued and revised financial statements. Revised financial statements include financial statements revised as a result of either correction of an error or retrospective application of GAAP. The FASB also clarified that if the financial statements have been revised, then an entity that is not an SEC filer should disclose both the date that the financial statements were issued or available to be issued and the date the revised financial statements were issued or available to be issued. The FASB believes these amendments remove potential conflicts with the SEC’s literature. We adopted this guidance and it had no effect on our consolidated financial statements.
84
Table of Contents
Intervest Bancshares Corporation and Subsidiaries
Notes to Consolidated Financial Statements
For the Years Ended December 31, 2010, 2009 and 2008
| 1. | Description of Business and Summary of Significant Accounting Policies, Continued |
In March 2010, the FASB issued ASU No. 2010-11, “Derivatives and Hedging (Topic 815),” which clarifies that the only type of embedded credit derivative feature related to the transfer of credit risk that is exempt from derivative bifurcation requirements is one that is in the form of subordination of one financial instrument to another. As a result, entities that have contracts containing an embedded credit derivative feature in a form other than such subordination will need to assess those embedded credit derivatives to determine if bifurcation and separate accounting as a derivative is required. We adopted this guidance and it had no effect on our consolidated financial statements.
In July 2010, the FASB issued ASU No. 2010-20, “Receivables (Topic 310): Disclosures about the Credit Quality of Financing Receivables and the Allowance for Credit Losses.” The new disclosures will require significantly more information about credit quality in a financial institution’s loan portfolio. This statement addresses only disclosures and does not change recognition or measurement of the allowance. This statement was effective for us on January 1, 2011. The adoption of this guidance is not expected to have a material impact on our consolidated financial statements.
In January 2011 the FASB issued ASU No. 2011-01, “Deferral of the Effective Date of Disclosures about Troubled Debt Restructurings in Update No. 2010-20.” This ASU temporarily delays the effective date of the disclosures about troubled debt restructurings in Update 2010-20 for public entities. The delay is intended to allow the FASB time to complete its deliberations on what constitutes a troubled debt restructuring. The effective date of the new disclosures about troubled debt restructurings for public entities and the guidance for determining what constitutes a troubled debt restructuring will then be coordinated. Currently, that guidance is anticipated to be effective for interim and annual periods ending after June 15, 2011.
85
Table of Contents
Intervest Bancshares Corporation and Subsidiaries
Notes to Consolidated Financial Statements
For the Years Ended December 31, 2010, 2009 and 2008
| 2. | Securities Held to Maturity |
The carrying value (amortized cost) and estimated fair value of securities held to maturity are as follows:
| ($ in thousands) | Number of Securities |
Amortized Cost |
Gross Unrealized Gains |
Gross Unrealized Losses |
Estimated Fair Value |
Wtd-Avg Yield |
Wtd-Avg Remaining Maturity |
|||||||||||||||||||||
| At December 31, 2010 | ||||||||||||||||||||||||||||
| U.S. government agencies (1) | 345 | $609,755 | $1,661 | $5,468 | $605,948 | 1.63% | 4.8 Years | |||||||||||||||||||||
| Corporate (2) | 8 | 4,580 | - | 3,870 | 710 | 2.02% | 22.6 Years | |||||||||||||||||||||
| 353 | $614,335 | $1,661 | $9,338 | $606,658 | 1.63% | 5.0 Years | ||||||||||||||||||||||
| At December 31, 2009 | ||||||||||||||||||||||||||||
| U.S. government agencies (1) | 387 | $629,084 | $2,458 | $3,136 | $628,406 | 2.74% | 4.3 Years | |||||||||||||||||||||
| Corporate (2) | 8 | 5,772 | - | 3,624 | 2,148 | 1.67% | 23.6 Years | |||||||||||||||||||||
| 395 | $634,856 | $2,458 | $6,760 | $630,554 | 2.73% | 4.5 Years | ||||||||||||||||||||||
(1) Consist of debt obligations of U.S. government sponsored agencies - FHLB, FNMA, FHLMC or FFCB.
(2) Consist of variable-rate pooled trust preferred securities backed by obligations of companies in the banking industry.
The amortized cost at December 31, 2010 and 2009 is reported net of other than temporary impairment charges of $3.5 million and $2.3 million, respectively.
The estimated fair values of securities with gross unrealized losses segregated between securities that have been in a continuous unrealized loss position for less than twelve months and those for twelve months or longer at the respective dates are summarized as follows:
| Less Than Twelve Months | Twelve Months or Longer | Total | ||||||||||||||||||||||||||
| ($ in thousands) | |
Number of Securities |
|
|
Estimated Fair Value |
|
|
Gross Unrealized Losses |
|
|
Estimated Fair Value |
|
|
Gross Unrealized Losses |
|
|
Estimated Fair Value |
|
|
Gross Unrealized Losses |
| |||||||
| At December 31, 2010 |
||||||||||||||||||||||||||||
| U.S. government agencies |
186 | $316,238 | $5,468 | $ - | $ - | $316,238 | $5,468 | |||||||||||||||||||||
| Corporate |
8 | - | - | 710 | 3,870 | 710 | 3,870 | |||||||||||||||||||||
| 194 | $316,238 | $5,468 | $ 710 | $3,870 | $316,948 | $9,338 | ||||||||||||||||||||||
| At December 31, 2009 |
||||||||||||||||||||||||||||
| U.S. government agencies |
188 | $280,275 | $2,881 | $15,117 | $ 255 | $295,392 | $3,136 | |||||||||||||||||||||
| Corporate |
8 | - | - | 2,148 | 3,624 | 2,148 | 3,624 | |||||||||||||||||||||
| 196 | $280,275 | $2,881 | $17,265 | $3,879 | $297,540 | $6,760 | ||||||||||||||||||||||
We believe that the cause of unrealized gains and losses on the U.S. government agencies securities portfolio is directly related to changes in market interest rates, which has been consistent with our experience. In general, as interest rates rise, the estimated fair value of fixed-rate securities will decrease; as interest rates fall, their value will increase. All of the securities in the agency portfolio have either fixed interest rates or have predetermined scheduled interest rate increases and have call features that allow the issuer to call the security at par before its stated maturity without penalty. INB, which holds the portfolio, has the ability and intent to hold all of the investments for a period of time sufficient for the estimated fair value of the securities with unrealized losses to recover, which may be at time of maturity. Historically, INB has always recovered the cost of its investments in U.S. government agency securities upon maturity. We view all the gross unrealized losses related to the agency portfolio to be temporary for the reasons noted above. The estimated fair values disclosed in the table above for U.S. government agency securities are obtained from third-party brokers who provide quoted prices derived from active markets for identical or similar securities.
INB owns trust preferred securities that are also classified as held to maturity. The estimated fair values of these securities are depressed due to the weakened economy and the financial condition of a large number of the issuing banks as well as from restrictions that have been or can be placed on the payment of interest by regulatory agencies, which have severely reduced the demand for these securities and rendered their trading market inactive. We concluded that an adverse change in the estimated future cash flows has occurred to such a level that all of these securities have been other than temporarily impaired to varying degrees.
86
Table of Contents
Intervest Bancshares Corporation and Subsidiaries
Notes to Consolidated Financial Statements
For the Years Ended December 31, 2010, 2009 and 2008
| 2. | Securities Held to Maturity, Continued |
The OTTI determinations are based on increases in the aggregate amount of deferred and defaulted interest payments on the underlying collateral by the issuing banks such that it is no longer probable that INB will recover its full investment in the applicable security over time as indicated by an expected cash flow analysis prepared by a third party broker utilizing guidance prescribed under GAAP. There can be no assurance that there will not be further write downs on these trust preferred securities as conditions change.
The following table provides various information regarding trust preferred securities.
| ($ in thousands) | ||||||||||||||||||||||||||||||||||||||||||
| Cusip # (1) | Credit Rating |
Cost Basis |
Write Downs (2) |
Adj. Cost Basis |
Estimated Fair Value (3) |
Unrealized Loss |
% of Collateral Defaulted |
% of Collateral Deferred |
# of Banks in Pool |
OTTI (4) |
Discount Margin (4) |
|||||||||||||||||||||||||||||||
| At December 31, 2010 | ||||||||||||||||||||||||||||||||||||||||||
| 74041PAEO |
C | $ | 1,000 | $ | (642 | ) | $ | 358 | $ | 33 | $ | (325 | ) | 34.53 | % | 9.34 | % | 39 | Yes | 1.90 | % | |||||||||||||||||||||
| 74040XAD6 |
C+ | 1,016 | (262 | ) | 754 | 154 | (600 | ) | 14.39 | % | 15.94 | % | 54 | Yes | 1.80 | % | ||||||||||||||||||||||||||
| 74040XAE4 |
C+ | 994 | (241 | ) | 753 | 152 | (601 | ) | 14.39 | % | 15.94 | % | 54 | Yes | 1.80 | % | ||||||||||||||||||||||||||
| 74040XAE4 |
C+ | 994 | (241 | ) | 753 | 152 | (601 | ) | 14.39 | % | 15.94 | % | 54 | Yes | 1.80 | % | ||||||||||||||||||||||||||
| 74040YAF9 |
C | 981 | (629 | ) | 352 | 12 | (340 | ) | 15.69 | % | 29.80 | % | 58 | Yes | 1.70 | % | ||||||||||||||||||||||||||
| 74040YAE2 |
C | 1,000 | (648 | ) | 352 | 12 | (340 | ) | 15.69 | % | 29.80 | % | 58 | Yes | 1.70 | % | ||||||||||||||||||||||||||
| 74041UAE9 |
C+ | 1,022 | (393 | ) | 629 | 98 | (531 | ) | 7.56 | % | 26.17 | % | 64 | Yes | 1.57 | % | ||||||||||||||||||||||||||
| 74041UAE9 |
C+ | 1,023 | (394 | ) | 629 | 97 | (532 | ) | 7.56 | % | 26.17 | % | 64 | Yes | 1.57 | % | ||||||||||||||||||||||||||
| $ | 8,030 | $ | (3,450 | ) | $ | 4,580 | $ | 710 | $ | (3,870 | ) | |||||||||||||||||||||||||||||||
| At December 31, 2009 | ||||||||||||||||||||||||||||||||||||||||||
| 74041PAEO |
C+ | $ | 1,000 | $ | (636 | ) | $ | 364 | $ | 109 | $ | (255 | ) | 22.61 | % | 20.23 | % | 39 | Yes | 1.90 | % | |||||||||||||||||||||
| 74040XAD6 |
CC | 1,016 | (235 | ) | 781 | 315 | (466 | ) | 14.39 | % | 11.94 | % | 54 | Yes | 1.80 | % | ||||||||||||||||||||||||||
| 74040XAE4 |
CC | 994 | (214 | ) | 780 | 315 | (465 | ) | 14.39 | % | 11.94 | % | 54 | Yes | 1.80 | % | ||||||||||||||||||||||||||
| 74040XAE4 |
CC | 994 | (212 | ) | 782 | 314 | (468 | ) | 14.39 | % | 11.94 | % | 54 | Yes | 1.80 | % | ||||||||||||||||||||||||||
| 74040YAF9 |
CC | 981 | (471 | ) | 510 | 155 | (355 | ) | 11.53 | % | 22.80 | % | 58 | Yes | 1.70 | % | ||||||||||||||||||||||||||
| 74040YAE2 |
CC | 1,000 | (490 | ) | 510 | 154 | (356 | ) | 11.53 | % | 22.80 | % | 58 | Yes | 1.70 | % | ||||||||||||||||||||||||||
| 74041UAE9 |
CC | 1,022 | - | 1,022 | 393 | (629 | ) | 3.78 | % | 11.30 | % | 64 | No | 1.57 | % | |||||||||||||||||||||||||||
| 74041UAE9 |
CC | 1,023 | - | 1,023 | 393 | (630 | ) | 3.78 | % | 11.30 | % | 64 | No | 1.57 | % | |||||||||||||||||||||||||||
| $ | 8,030 | $ | (2,258 | ) | $ | 5,772 | $ | 2,148 | $ | (3,624 | ) | |||||||||||||||||||||||||||||||
(1) Cusip 74041PAE0, 74040YAF9, 74040YAE2 and 74041UAE9 have been placed on cash basis accounting because INB is currently not receiving contractual interest payments on these securities. The cash flows for the interest payments on these securities are being redirected to a more senior class of bondholders to pay down the principal balance on the more senior class faster. This occurs when deferral and default activity reduces the security’s underlying performing collateral to a level where a predetermined coverage test fails and requires cash flows from interest payments to be redirected to a senior class of security holders. If no additional deferrals or defaults occur, such test will eventually be met again through the redirection of the cash flow and cash interest payments would resume on INB’s bonds, although no such assurance can be given as to the amount and timing of the resumption, if any.
(2) Writedowns are derived from the difference between the book value of the security and the projected present value of the security’s cash flows as indicated per an analysis performed using guidance prescribed by GAAP.
(3) Obtained from Moody’s pricing service, which uses a complex valuation model that factors in numerous assumptions and data, including anticipated discounts related to illiquid trading markets, credit and interest rate risk, which under GAAP would be considered Level 3 inputs. INB believes that the actual values that would be realized in an orderly market under normal credit conditions between a willing buyer and seller would approximate the projected present value of the securities’ cash flows and therefore, these estimated fair values are used for disclosure purposes only and are not used for calculating and recording impairment. INB also has the intent and the ability to retain these trust preferred securities until maturity and currently has no intention of selling them.
(4) In determining whether there is OTTI, INB relies on a cash flow analysis as prescribed under GAAP and prepared by a third party broker to determine whether conditions are such that the projected cash flows are insufficient to recover INB’s principal investment. The basic methodology under GAAP is to compare the present value of the cash flows that are derived from assumptions made with respect to deferrals, defaults and prepayments from quarter to quarter. A decline in the present value versus that for the previous quarter is considered to be an adverse change. The discount margin in the table above represents the incremental credit spread used to derive the discount rate for present value computations. Other assumptions utilized: prepayments of 1% annually and 100% at maturity and annual defaults of 75 bps with a 15% recovery after a 2 year lag.
87
Table of Contents
Intervest Bancshares Corporation and Subsidiaries
Notes to Consolidated Financial Statements
For the Years Ended December 31, 2010, 2009 and 2008
| 2. | Securities Held to Maturity, Continued |
The amortized cost and estimated fair value of securities held to maturity by remaining term to contractual maturity as of December 31, 2010 is as follows:
| ($ in thousands) | Amortized Cost | Estimated Fair Value | Average Yield | |||||||||
| Due in one year or less |
$ 5,025 | $ 5,025 | 0.43 | % | ||||||||
| Due after one year through five years |
388,852 | 388,384 | 1.51 | |||||||||
| Due after five years through ten years |
209,313 | 206,201 | 1.84 | |||||||||
| Due after ten years |
11,145 | 7,048 | 2.15 | |||||||||
| $614,335 | $606,658 | 1.63 | % | |||||||||
In March 2010, securities held to maturity with a carrying value of $24.1 million (estimated fair value of $24.8 million) were transferred to available-for-sale and promptly sold. A gross gain of $0.7 million was realized. The securities sold consisted non-callable, fixed-rate U.S. government agency securities that were scheduled to mature at various times from 2011 through 2013. This transaction was undertaken to enhance INB’s capital level in response to its higher regulatory capital requirements. At December 31, 2010 and 2009, there were no securities classified as available for sale. There were no sales of securities in 2009 or 2008.
| 3. | Loans Receivable |
Major classifications of loans receivable are summarized as follows:
| At December 31, 2010 |
At December 31, 2009 |
|||||||||||||||
| ($ in thousands) |
# of Loans | Amount | # of Loans | Amount | ||||||||||||
| Commercial real estate loans |
372 | $ | 948,275 | 403 | $ | 1,128,646 | ||||||||||
| Residential multifamily loans |
193 | 380,180 | 234 | 529,431 | ||||||||||||
| Land development and other land loans |
10 | 12,550 | 15 | 32,934 | ||||||||||||
| Residential 1-4 family loans |
2 | 416 | 2 | 441 | ||||||||||||
| Commercial business loans |
20 | 1,454 | 22 | 1,687 | ||||||||||||
| Consumer loans |
8 | 107 | 25 | 616 | ||||||||||||
| Loans receivable, gross |
605 | 1,342,982 | 701 | 1,693,755 | ||||||||||||
| Deferred loan fees |
(5,656 | ) | (7,591 | ) | ||||||||||||
| Loans receivable, net of deferred fees |
1,337,326 | 1,686,164 | ||||||||||||||
| Allowance for loan losses |
(34,840 | ) | (32,640 | ) | ||||||||||||
| Loans receivable, net (1) |
$ | 1,302,486 | $ | 1,653,524 | ||||||||||||
(1) At December 31, 2010 and 2009, there were $52.9 million and $123.9 million of loans, respectively, on nonaccrual status and $3.6 million and $97.3 million, respectively, of TDRs, and all were considered impaired loans. At December 31, 2010 and 2009, a specific valuation allowance (included in the allowance for loan losses) totaling $7.2 million and $13.8 million, respectively, was maintained on impaired loans. At December 31, 2010 and 2009, there were three loans totaling $7.5 million and two loans totaling $6.8 million, respectively, that were ninety days past due and still accruing interest. The loans were past their maturity date and the borrowers were making monthly payments.
Total impaired loans at December 31, 2010 summarized by collateral type and location follow:
| ($ in thousands) | New York | Florida | New Jersey | Ohio | Totals | Valuation Allowance |
# of Loans |
|||||||||||||||||||||
| Commercial real estate: |
||||||||||||||||||||||||||||
| Retail |
$ 3,017 | $ 10,834 | $500 | $4,712 | $19,063 | $3,741 | 5 | |||||||||||||||||||||
| Office Building |
5,973 | 17,485 | - | - | 23,458 | 2,542 | 4 | |||||||||||||||||||||
| Warehouse |
2,614 | - | - | - | 2,614 | 112 | 2 | |||||||||||||||||||||
| Mixed Use |
3,929 | - | - | - | 3,929 | 515 | 2 | |||||||||||||||||||||
| Residential mulitifamily |
2,981 | 2,863 | - | 1,647 | 7,491 | 295 | 4 | |||||||||||||||||||||
| $18,514 | $31,182 | $500 | $6,359 | $56,555 | $7,205 | 17 | ||||||||||||||||||||||
In May 2010, we sold in bulk $83.7 million of nonaccrual loans, $102.6 million of accruing TDRs and $5.9 million of other performing loans. The loans were sold at a substantial discount to their net carrying values for proceeds of $110.0 million. In connection with the sale, we recorded $82.2 million of loan chargeoffs and a $73.4 million provision for loan losses.
88
Table of Contents
Intervest Bancshares Corporation and Subsidiaries
Notes to Consolidated Financial Statements
For the Years Ended December 31, 2010, 2009 and 2008
| 3. | Loans Receivable, Continued |
Selected information related to impaired loans is summarized as follows:
| For the Year Ended December 31, | ||||||||||||
| ($ in thousands) |
2010 | 2009 | 2008 | |||||||||
| Interest income that was not recorded on nonaccrual loans under contractual terms |
$ 2,850 | $ 8,950 | $ 7,999 | |||||||||
| Average principal balance of nonaccrual loans |
53,207 | 120,309 | 105,622 | |||||||||
| Average principal balance of restructured loans |
48,554 | 60,751 | - | |||||||||
Age analysis of past due loans at December 31, 2010 is summarized as follows:
| ($ in thousands) |
|
Past Due 30-59 |
|
|
Past Due 60-89 |
|
|
Past Due > 90 Days |
|
|
Total Past Due |
|
|
Past Due 90 Days or More and Still Accruing |
|
|
Non-Accrual Loans |
| ||||||
| Commercial real estate loans |
$ 2,731 | $ 681 | $ 13,039 | $ 16,450 | $ 7,100 | $ 45,432 | ||||||||||||||||||
| Residential multifamily loans |
4,331 | 3,327 | 6,741 | 14,400 | 381 | 7,491 | ||||||||||||||||||
| Land development and other land loans |
294 | - | - | 294 | - | - | ||||||||||||||||||
| $ 7,356 | $ 4,008 | $ 19,780 | $ 31,144 | $ 7,481 | $ 52,923 |
The following table sets forth information regarding the credit quality of the loan portfolio at December 31, 2010 based on internally assigned grades.
| ($ in thousands) |
Pass | Special Mention | Substandard (1) | Total | ||||||||||||
| Commercial real estate loans |
$ 858,632 | $23,295 | $66,348 | $ 948,275 | ||||||||||||
| Residential multifamily loans |
346,589 | 14,127 | 19,464 | 380,180 | ||||||||||||
| Land development and other land loans |
9,417 | 2,837 | 296 | 12,550 | ||||||||||||
| Residential 1-4 family loans |
416 | - | - | 416 | ||||||||||||
| Commercial business loans |
1,454 | - | - | 1,454 | ||||||||||||
| Consumer loans |
107 | - | - | 107 | ||||||||||||
| Loans receivable, gross |
$1,216,615 | $40,259 | $86,108 | $1,342,982 |
| (1) | Consist of $52.9 million of nonaccrual loans, $3.6 million of accruing TDRs and $29.5 million of other performing loans. |
Internally assigned loan grades are defined as follows:
Pass – Loan’s primary source of repayment is satisfactory, with secondary sources very likely to be realized if necessary.
Special Mention – Loan has potential weaknesses that deserve close attention. If left uncorrected, these potential weaknesses may result in the deterioration of the loan’s repayment prospects or our credit position at some future date. Such loans are not adversely classified.
Substandard – Loan is inadequately protected by the current worth and paying capacity of the obligor or of the collateral pledged. Such loans have a well-defined weakness or weaknesses that jeopardize the full repayment of the loan. They are characterized by the distinct possibility that we will sustain some loss if the deficiencies are not corrected.
Doubtful – Loan has all the weaknesses inherent in one classified substandard with the added characteristics that the weaknesses make collection or liquidation in full, on the basis of currently existing facts, conditions, and values, highly questionable and improbable.
Loss – Loan is considered uncollectible and of such little value that continuance as an asset is not warranted. This classification does not mean that the asset has absolutely no recovery or salvage value, but rather it is not practical or desirable to defer writing off this basically worthless asset even though partial recovery may be affected in the future.
The geographic distribution of the loan portfolio by state is as follows:
| At December 31, 2010 | At December 31, 2009 | |||||||||||||||
| ($ in thousands) |
Amount | % of Total | Amount | % of Total | ||||||||||||
| New York |
$ 916,485 | 68% | $1,123,300 | 66 | % | |||||||||||
| Florida |
310,560 | 23 | 392,712 | 23 | ||||||||||||
| Connecticut and New Jersey |
44,298 | 3 | 66,119 | 4 | ||||||||||||
| All other |
71,639 | 6 | 111,624 | 7 | ||||||||||||
| $1,342,982 | 100% | $1,693,755 | 100 | % | ||||||||||||
89
Table of Contents
Intervest Bancshares Corporation and Subsidiaries
Notes to Consolidated Financial Statements
For the Years Ended December 31, 2010, 2009 and 2008
| 4. | Allowance for Loan Losses |
Activity in the allowance for loan losses is as follows:
| For the Year Ended December 31, | ||||||||||||
| ($ in thousands) |
2010 | 2009 | 2008 | |||||||||
| Allowance at beginning of year |
$ | 32,640 | $ | 28,524 | $ | 21,593 | ||||||
| Provision for loan losses charged to expense |
101,463 | 10,865 | 11,158 | |||||||||
| Loan recoveries |
883 | 1,354 | - | |||||||||
| Loan chargeoffs: |
||||||||||||
| Commercial real estate |
(59,469 | ) | (3,253 | ) | - | |||||||
| Residential multifamily |
(34,576 | ) | (1,799 | ) | (2,333 | ) | ||||||
| Land development and other land loans |
(6,101 | ) | (3,051 | ) | (1,894 | ) | ||||||
| Total loan chargeoffs |
(100,146 | ) | (8,103 | ) | (4,227 | ) | ||||||
| Allowance at end of year |
$ | 34,840 | $ | 32,640 | $ | 28,524 | ||||||
| 5. | Premises and Equipment, Lease Commitments, Rental Expense and Sublease Income |
Premises and equipment is as follows:
| At December 31, | ||||||||
| ($ in thousands) |
2010 | 2009 | ||||||
| Land |
$ | 1,516 | $ | 1,516 | ||||
| Buildings |
5,038 | 5,029 | ||||||
| Leasehold improvements |
1,645 | 1,632 | ||||||
| Furniture, fixtures and equipment |
1,688 | 1,679 | ||||||
| Total cost |
9,887 | 9,856 | ||||||
| Less accumulated deprecation and amortization |
(5,275 | ) | (4,932 | ) | ||||
| Net book value |
$ | 4,612 | $ | 4,924 | ||||
Depreciation and amortization of premises and equipment is reflected as a component of noninterest expense in the consolidated statements of operations and amounted to $0.4 million in 2010 and $0.5 million in 2009 and $0.6 million in 2008.
The offices of IBC and INB’s headquarters and full-service banking office are located in leased premises on the entire fourth floor of One Rockefeller Plaza in New York City, with such lease expiring in March 2014. In addition, INB leases its Belcher Road and Mandalay Avenue branch offices in Florida, with such leases expiring in June 2012 and January 2016, respectively. Additionally, INB has options to extend the Belcher office lease (for an additional five years) and the Mandalay office lease (for an additional five years) prior to expiration, the cost of which is not reflected in the table below. All the leases above contain operating escalation clauses related to taxes and operating costs based upon various criteria and are accounted for as operating leases. In addition, the lease for the New York office contains a provision by which the rental payments are scheduled to increase on October 1, 2011 based on the then fair market value of rents for comparable space. The estimate of the increased rents has been reflected in the table below. INB owns all of its remaining offices in Florida and also leases a portion of the space in its office buildings in Florida that is not used for banking operations to other companies under leases that expire at various times through May 2015.
Future minimum annual lease payments and sublease income due under non-cancelable leases as of December 31, 2010 are as follows:
| Minimum Rentals | ||||||||
| ($ in thousands) |
Lease Expense (1) | Sublease Income (1) | ||||||
| In 2011 |
$1,240 | $309 | ||||||
| In 2012 |
1,642 | 221 | ||||||
| In 2013 |
1,574 | 73 | ||||||
| In 2014 |
446 | 31 | ||||||
| In 2015 and thereafter |
78 | 7 | ||||||
| $4,980 | $641 | |||||||
| (1) | Rent expense under operating leases aggregated to $1.1 million in 2010, 2009 and 2008. Lease rental income aggregated to $0.4 million in 2010 and 2009 and $0.5 million in 2008. |
90
Table of Contents
Intervest Bancshares Corporation and Subsidiaries
Notes to Consolidated Financial Statements
For the Years Ended December 31, 2010, 2009 and 2008
| 6. | Foreclosed Real Estate and Valuation Allowance for Real Estate Losses |
Real estate acquired through foreclosure by property type is summarized as follows:
| At December 31, 2010 | At December 31, 2009 | |||||||||||||||
| ($ in thousands) |
# of Properties | Amount (1) | # of Properties | Amount (1) | ||||||||||||
| Commercial real estate |
2 | $7,932 | 4 | $11,390 | ||||||||||||
| Residential multifamily |
3 | 14,573 | 2 | 13,013 | ||||||||||||
| Undeveloped land |
2 | 4,559 | 4 | 7,463 | ||||||||||||
| Real estate acquired through foreclosure |
7 | $27,064 | 10 | $31,866 | ||||||||||||
(1) Reported net of valuation allowance.
In May 2010, $14.4 million of foreclosed real estate was sold in a bulk sale at substantial discounts to their then net carrying values for net proceeds of $9.1 million. In connection with the sale, we recorded a $5.3 million provision for real estate losses and a like amount of real estate chargeoffs.
Activity in the valuation allowance for real estate losses is as follows:
| For the Year Ended December 31, | ||||||||||||
| ($ in thousands) |
2010 | 2009 | 2008 | |||||||||
| Valuation allowance at beginning of year |
$ 2,793 | $ 518 | $ - | |||||||||
| Provision for real estate losses charged to expense |
15,509 | 2,275 | 518 | |||||||||
| Real estate charge-offs: |
||||||||||||
| Commercial real estate |
(4,963 | ) | - | - | ||||||||
| Residential multifamily |
(7,880 | ) | - | - | ||||||||
| Land development and other land loans |
(2,771 | ) | - | - | ||||||||
| Total real estate chargeoffs |
(15,614 | ) | - | - | ||||||||
| Valuation allowance at end of year |
$ 2,688 | $2,793 | $518 | |||||||||
| 7. | Deposits |
Scheduled maturities of certificates of deposit accounts (CDs) are as follows:
| At December 31, 2010 | At December 31, 2009 | |||||||||||||||
| ($ in thousands) |
Amount |
|
Wtd-Avg Stated Rate |
|
Amount |
|
Wtd-Avg Stated Rate |
| ||||||||
| Within one year |
$ | 431,881 | 3.09 | % | $ | 591,746 | 3.63 | % | ||||||||
| Over one to two years |
349,174 | 3.63 | 256,025 | 4.28 | ||||||||||||
| Over two to three years |
298,287 | 4.26 | 241,217 | 4.45 | ||||||||||||
| Over three to four years |
113,587 | 3.78 | 251,745 | 4.61 | ||||||||||||
| Over four years |
112,016 | 4.13 | 168,958 | 4.31 | ||||||||||||
| $ | 1,304,945 | 3.65 | % | $ | 1,509,691 | 4.11 | % | |||||||||
CDs of $100,000 or more totaled $639 million and $693 million at December 31, 2010 and 2009, respectively, and included brokered CDs of $159 million and $170 million, respectively. At December 31, 2010, CDs of $100,000 or more by remaining maturity were as follows: $179 million due within one year; $176 million due over one to two years; $162 million due over two to three years; $59 million due over three to four years; and $63 million thereafter.
Interest expense on deposit accounts is as follows:
| For the Year Ended December 31, | ||||||||||||
| ($ in thousands) |
2010 | 2009 | 2008 | |||||||||
| Interest checking accounts |
$ | 97 | $ | 107 | $ | 97 | ||||||
| Savings accounts |
91 | 185 | 249 | |||||||||
| Money market accounts |
5,107 | 8,531 | 10,571 | |||||||||
| Certificates of deposit accounts |
53,692 | 66,705 | 69,719 | |||||||||
| $ | 58,987 | $ | 75,528 | $ | 80,636 | |||||||
91
Table of Contents
Intervest Bancshares Corporation and Subsidiaries
Notes to Consolidated Financial Statements
For the Years Ended December 31, 2010, 2009 and 2008
| 8. | FHLB Advances and Lines of Credit |
At December 31, 2010, INB had $38 million of unsecured credit lines that were cancelable at any time. As a member of the Federal Home Loan Bank of New York (FHLB) and the Federal Reserve Bank of New York (FRB), INB can borrow from these institutions on a secured basis. At December 31, 2010, INB had available collateral consisting of investment securities and certain loans that could be pledged to support additional total borrowings of approximately $650 million from the FHLB and FRB if needed.
The following is a summary of certain information regarding FHLB advances in the aggregate:
| ($ in thousands) |
2010 | 2009 | 2008 | |||||||||
| Balance at year end |
$ | 25,500 | $ | 61,500 | $ | 50,500 | ||||||
| Maximum amount outstanding at any month end |
$ | 55,500 | $ | 61,500 | $ | 95,200 | ||||||
| Average outstanding balance for the year |
$ | 40,171 | $ | 51,042 | $ | 33,898 | ||||||
| Weighted-average interest rate paid for the year |
3.85 | % | 3.82 | % | 3.07 | % | ||||||
| Weighted-average interest rate at year end |
4.02 | % | 3.18 | % | 3.81 | % |
Scheduled contractual maturities of FHLB advances as of December 31, 2010 were as follows:
| ($ in thousands) |
Amount | |
Wtd. Avg. Rate |
| ||||
| Maturing in 2011 |
$ | 8,000 | 3.83 | % | ||||
| Maturing in 2012 |
10,500 | 4.02 | % | |||||
| Maturing in 2013 |
7,000 | 4.22 | % | |||||
| $ | 25,500 | 4.02 | % |
| 9. | Loss on Early Extinguishments of Debentures |
In 2009, debentures totaling to $40 million of principal and $1.3 million of related accrued interest payable were repaid at various times with cash on hand prior to their stated maturity. A loss of $1.7 million from the early extinguishment of debentures was recorded in 2009. This loss represented the expensing of remaining related unamortized issuance costs at the time of the debenture repayments. In 2008, a total of $36.3 million of principal amount of debentures and $1.6 million of related accrued interest payable were repaid prior to maturity. A loss from the early extinguishment of debentures of $0.6 million was recorded in 2008.
| 10. | Subordinated Debentures - Capital Securities |
Capital Securities (commonly referred to as trust preferred securities) outstanding are summarized as follows:
| ($ in thousands) |
Amount | |||
| Capital Securities II - debentures due September 17, 2033 |
$ | 15,464 | ||
| Capital Securities III - debentures due March 17, 2034 |
15,464 | |||
| Capital Securities IV - debentures due September 20, 2034 |
15,464 | |||
| Capital Securities V - debentures due December 15, 2036 |
10,310 | |||
| $ | 56,702 |
The securities are obligations of IBC’s wholly owned statutory business trusts, Intervest Statutory Trust II, III, IV and V, respectively. Each Trust was formed with a capital contribution from IBC and for the sole purpose of issuing and administering the Capital Securities. The proceeds from the issuance of the Capital Securities together with the capital contribution for each Trust were used to acquire IBC’s Junior Subordinated Debentures that are due concurrently with the Capital Securities. The Capital Securities, net of IBC’s capital contributions of $1.7 million, total $55 million and qualify as regulatory Tier 1 capital up to certain limits. IBC has guaranteed the payment of distributions on, payments on any redemptions of, and any liquidation distribution with respect to the Capital Securities. Issuance costs associated with Capital Securities II to IV were capitalized and are being amortized over the life of the securities using the straight-line method. The unamortized balance totaled $853,000 at December 31, 2010. There were no issuance costs associated with Capital Securities V.
92
Table of Contents
Intervest Bancshares Corporation and Subsidiaries
Notes to Consolidated Financial Statements
For the Years Ended December 31, 2010, 2009 and 2008
| 10. | Subordinated Debentures - Capital Securities, Continued |
As of December 31, 2010, interest payments on the Junior Subordinated Debentures (and the corresponding distributions on the Capital Securities) are payable in arrears as follows:
| • | Capital Securities II - quarterly at the rate of 2.95% over 3 month libor; |
| • | Capital Securities III - quarterly at the rate of 2.79% over 3 month libor; |
| • | Capital Securities IV - quarterly at the rate of 2.40% over 3 month libor; and |
| • | Capital Securities V - quarterly at the fixed rate of 6.83% per annum until September 15, 2011 and thereafter at the rate of 1.65% over 3 month libor. |
Interest payments may be deferred at any time and from time to time during the term of the Junior Subordinated Debentures at IBC’s election for up to 20 consecutive quarterly periods, or 5 years. There is no limitation on the number of extension periods IBC may elect, provided, however, no deferral period may extend beyond the maturity date of the Junior Subordinated Debentures. During an interest deferral period, interest will continue to accrue on the Junior Subordinated Debentures and interest on such accrued interest will accrue at an annual rate equal to the interest rate in effect for such deferral period, compounded quarterly from the date such interest would have been payable were it not deferred. At the end of the deferral period, IBC will be obligated to pay all interest then accrued and unpaid. In February 2010, IBC exercised its right to defer interest payments. This deferral does not constitute a default under the indenture governing the securities. At December 31, 2010, IBC had accrued and owing a total of $2.3 million of interest payments on the Junior Subordinated Debentures.
All of the Capital Securities are subject to mandatory redemption as follows: (i) in whole, but not in part, upon repayment of the Junior Subordinated Debentures at stated maturity or earlier, at the option of IBC, within 90 days following the occurrence and continuation of certain changes in the tax or capital treatment of the Capital Securities, or a change in law such that the statutory trust would be considered an investment company, contemporaneously with the redemption by IBC of the Junior Subordinated Debentures; and (ii) in whole or in part at any time for Capital Securities II, III, and IV and on or after September 15, 2011 for Capital Securities V contemporaneously with the optional redemption by IBC of the Junior Subordinated Debentures in whole or in part. Any redemption would be subject to the receipt of regulatory approvals.
| 11. | Stockholders’ Equity |
As of December 31, 2010, IBC was authorized to issue up to 63,000,000 shares of its capital stock, consisting of 62,000,000 shares of Class A common stock, 700,000 shares of Class B common stock and 300,000 shares of preferred stock. IBC’s board of directors determines the powers, preferences and rights, and the qualifications, limitations, and restrictions thereof on any series of preferred stock issued. A total of 25,000 shares of preferred stock are designated as Series A and are owned by the U.S. Treasury as described later in this footnote.
In 2010, IBC completed the following transactions:
| • | May 25 - 850,000 shares of its Class A common stock were issued in a private placement at price of $5.00 per share for net proceeds of $4.0 million. |
| • | June 30 - 404,339 shares of its Class A common stock (held as treasury stock) were cancelled. The shares had an aggregate cost of $10.0 million or average purchase price per share of $24.73. |
| • | October 20 - 10,600,000 shares of its Class A common stock were issued in a public offering at a price of $1.95 per share for net proceeds of $19.1 million. Concurrent with the offering, the three holders of IBC’s then outstanding Class B common stock totaling 580,000 shares converted all of their shares into shares of Class A common stock at the conversion rate of one share of Class A common stock for each share of Class B common stock. As condition of the public stock offering, IBC agreed to no longer issue or authorize the issuance of any Class B common stock. |
93
Table of Contents
Intervest Bancshares Corporation and Subsidiaries
Notes to Consolidated Financial Statements
For the Years Ended December 31, 2010, 2009 and 2008
| 11. | Stockholders’ Equity, Continued |
| • | November 3 - 1,086,377 shares of its Class A common stock were issued in connection with the exercise by the underwriter of a portion of its over-allotment option at a price of $1.95 per share for net proceeds of $1.9 million. |
| • | December 9 - 319,300 shares of its restricted Class A common stock were awarded and issued to employees and directors as discussed in note 14. |
On December 23, 2008, IBC issued and sold to the United States Treasury (the “Treasury”) 25,000 shares of its Fixed Rate Cumulative Perpetual Preferred Stock, Series A (the “Preferred Shares”), along with a ten year warrant (the “Warrant”) to purchase at any time up to 691,882 shares of IBC’s Class A common stock for $5.42 per share, for a total cash investment for both the shares and the warrant of $25 million from the Treasury (the “Transaction”). The Transaction was completed pursuant to, and is governed by, the U.S. Treasury’s Capital Purchase Program (the “CPP”).
GAAP required the Transaction proceeds of $25 million to be allocated between the Preferred Shares and Warrant based on the ratio of the estimated fair value of the Warrant to the aggregate estimated fair value of both the Preferred Shares and the Warrant. The value of the Warrant was computed to be $1.6 million using the Black Scholes model with the following inputs: expected dividend yield of 4.61%; expected stock volatility of 81%, risk-free interest rate of 1.60% and expected life of 5 years.
The value of the Preferred Shares was computed to be $18.7 million based on the net present value of the expected cash flows over five years using a discount rate of 12%, which represented IBC’s estimated incremental borrowing rate for a similar transaction in the private sector. The allocation of the Transaction proceeds to the Warrant was recorded as a “preferred stock discount” against the Preferred Shares, with a corresponding and equal entry to additional paid in common equity in the amount of $1.9 million, computed as follows ($1.6 million divided by the sum of ($1.6 million plus $18.7 million) multiplied by the Transaction proceeds of $25 million). This discount is being amortized over five years on a straight-line basis and reduces earnings or increases losses available to common stockholders in each year.
The Preferred Shares carry a 5% per year cumulative preferred dividend rate, payable quarterly. The dividend rate increases to 9% beginning in December 2013. Dividends compound if they accrue and are not paid and they also reduce earnings or increase losses available to common stockholders. The Preferred Shares have a liquidation preference of $1,000 per share, plus accrued and unpaid dividends. IBC may redeem the Preferred Shares at any time, in whole or in part, subject to the approval of its primary regulator. While the Preferred Shares are outstanding, certain restrictions apply to IBC, including, among others the following. The Preferred Shares have a senior rank and IBC cannot issue other preferred stock senior to the Preferred Shares. Until December 23, 2012, unless the Preferred Shares have been redeemed in whole or the Treasury has transferred all of the shares to a non-affiliated third party, IBC may not increase its common stock cash dividend (which was last paid in June 2008 in the amount of $0.25 per share) or repurchase common stock or other equity shares (subject to certain limited exceptions) without the Treasury’s approval.
The Preferred Shares generally are non-voting, other than in connection with proposals to issue preferred stock senior to the Preferred Shares, certain merger transactions, amendments to the rights of the holder of the Preferred Shares, and other than in connection with the board representation rights mentioned below, or as required by Delaware State law.
Dividends on IBC’s common stock can be resumed only if all Preferred Share dividends in arrears have been paid. Similar restrictions apply to IBC’s ability to repurchase common stock if Preferred Share dividends are not paid. A failure to pay a total of six Preferred Share dividends, whether or not consecutive, gives the holders of the Preferred Shares the right to elect two directors to IBC’s board of directors. That right would continue until IBC pays all dividends in arrears.
94
Table of Contents
Intervest Bancshares Corporation and Subsidiaries
Notes to Consolidated Financial Statements
For the Years Ended December 31, 2010, 2009 and 2008
| 11. | Stockholders’ Equity, Continued |
In February 2010, IBC ceased declaration and payment of the Preferred Share Dividend. IBC has missed the February, May, August and November 2010 and February 2011 dividend payments as of the date of filing of this report. At December 31, 2010, the amount of Preferred Share Dividends undeclared, unpaid and in arrears totaled $1.4 million.
The Warrant held by the Treasury is exercisable at any time at the option of the Treasury and expires on December 23, 2018. The Warrant has anti-dilution protections and certain other protections for the holder, as well as potential registration rights upon written request from the Treasury. If requested by the Treasury, the Warrant (and the underlying common stock) may need to be listed on a national securities exchange. The Treasury has agreed not to exercise voting rights with respect to common shares it may acquire upon exercise of the Warrant. If the Preferred Shares are redeemed in whole, IBC can purchase the Warrant or any common shares held by the Treasury at their fair market value at that time.
Our senior executive officers have agreed to limit certain compensation, bonus, incentive and other benefits plans, arrangements, and policies with respect to them during the period that the Treasury owns any securities acquired in the Transaction. Among other things, no executive compensation in excess of $500,000 per annum can be deducted for tax purposes.
| 12. | Asset and Dividend Restrictions |
In addition to the restrictions discussed in note 11, INB is required under FRB regulations to maintain reserves against its transaction accounts. At December 31, 2010 and 2009, balances maintained as reserves were approximately $0.5 million and $1.4 million, respectively. The FRB pays interest on required and excess reserve balances based on a defined formula.
As a member of the FRB and FHLB, INB must maintain an investment in the capital stock of each entity. At December 31, 2010 and 2009, the total investment aggregated to $9.7 million and $10.7 million, respectively. At December 31, 2010 and 2009, U.S. government agency security investments with a carrying value of approximately $53 million and $100 million, respectively, were pledged against lines of credit. At December 31, 2010 and 2009, certain mortgage loans totaling approximately $167 million and $17 million, respectively, were also pledged against lines of credit.
The payment of cash dividends by IBC to its common and preferred shareholders and the payment of cash dividends by IBC’s subsidiaries to IBC itself are subject to various regulatory restrictions, as well as restrictions that may arise from any outstanding indentures and other capital securities as discussed in the footnote above. These restrictions take into consideration various factors such as whether there are sufficient net earnings, as defined, liquidity, asset quality, capital adequacy and economic conditions. No cash common stock dividends have been declared or paid since June 2008. In 2009, cash dividends totaling $1.1 million were declared and paid on the Series A Preferred Stock held by the U.S. Treasury. No preferred dividends were declared or paid in 2010 as discussed below.
In February 2010, the FRB, IBC’s primary regulator, informed IBC that it may not, without the prior approval of the FRB, pay dividends on or redeem its capital stock, pay interest on or redeem its trust preferred securities, or incur new debt. INB was also informed by its primary regulator, the OCC, that it cannot pay any cash dividends to IBC. Accordingly, INB and IBC suspended the payment of all dividends in 2010. At December 31, 2010, the amount of preferred dividends undeclared, unpaid and in arrears totaled $1.4 million. At December 31, 2010, IBC had accrued and owing a total of $2.3 million of interest payments on its Capital Securities.
95
Table of Contents
Intervest Bancshares Corporation and Subsidiaries
Notes to Consolidated Financial Statements
For the Years Ended December 31, 2010, 2009 and 2008
| 13. | Profit Sharing Plans |
We have a tax-qualified profit sharing plan for our employees in accordance with the provisions of Section 401(k) of the Internal Revenue Code, whereby our eligible employees meeting certain length-of-service requirements may make tax-deferred contributions up to certain limits. We made discretionary matching contributions of up to 4% in 2010 and 3% in 2009 and 2008 of employee compensation, which vest to the employees over a five-year period. Total cash contributions to the plan aggregated to $146,000, $105,000 and $106,000 in 2010, 2009 and 2008, respectively, and were included in the line item “salaries and employee benefits” in the consolidated statements of operations.
| 14. | Common Stock Options and Restricted Stock |
We have a shareholder-approved Long Term Incentive Plan (the “Plan”) under which stock options and other forms of incentive compensation may be awarded from time to time to our officers, employees and directors. The maximum number of shares of Class A common stock that may be awarded under the Plan is 750,000. As of December 31, 2010, 77,160 shares of Class A common stock remained available for award under the Plan.
In December 2010, 2009 and 2008, a total of 41,400, 73,210, and 135,590 options to purchase Class A common stock were awarded under the Plan, respectively. Additionally, in December 2010, a total of 319,300 shares of restricted Class A common stock were awarded under the Plan. There were no restricted stock grants in 2009 or 2008.
All outstanding shares of restricted common stock were unvested at December 31, 2010 and they vest 100% on December 9, 2013, or earlier upon a change of control of IBC (as that term is defined in the restricted stock agreement) or if the participant’s employment terminates because of death or disability. The record holder of the restricted shares possess all the rights of a holder of our common stock, including the right to receive dividends on and to vote the restricted shares. The restricted shares may not be sold, transferred, pledged, assigned, encumbered, or otherwise alienated or hypothecated until they become fully vested and transferable in accordance the agreement.
A summary of selected information regarding stock and option awards follows:
| 2010 Stock Grant |
2010 Option Grant |
2009 Option Grant |
2008 Option Grant |
|||||||||||||
| Total shares of stock or options awarded |
319,300 | 41,400 | 73,210 | 135,590 | ||||||||||||
| Total estimated fair value of award |
$750,355 | $59,202 | $123,725 | $221,012 | ||||||||||||
| Estimated fair value per share/option (1) |
$ 2.35 | $ 1.43 | $ 1.69 | $ 1.63 | ||||||||||||
| Expected dividend yield (2) |
NA | 0% | 0% | 3.33% | ||||||||||||
| Expected stock volatility (3) |
NA | 72% | 67% | 81% | ||||||||||||
| Risk-free interest rate (4) |
NA | 2.82% | 2.52% | 2.18% | ||||||||||||
| Expected term in years (5) |
NA | 6.0 | 6.0 | 5.0 | ||||||||||||
(1) The fair value of each option award was estimated as of the grant date of the award using the Black-Scholes option-pricing model using the assumptions noted in the table above. The assumptions are subjective in nature, involve uncertainties and therefore, cannot be determined with precision. The Black-Scholes option pricing model also contains certain inherent limitations when applied to options which are not immediately exercisable and are not traded on public markets. The fair value of the stock award was based on the closing market price of the Class A common stock on the grant date.
(2) Expected dividend yield for the 2008 grant was calculated using a $0.25 per share dividend divided by the option’s exercise
price. No dividends were assumed for grants in 2009 and 2010.
(3) Expected stock volatility is estimated based on an assessment of historical volatility of the Class A common stock.
(4) Risk-free interest rate was derived from a U.S. Treasury security having a similar expected life as the option as of the grant date.
(5) Expected term (average life) was calculated using the “simplified method” as prescribed by the SEC.
96
Table of Contents
Intervest Bancshares Corporation and Subsidiaries
Notes to Consolidated Financial Statements
For the Years Ended December 31, 2010, 2009 and 2008
| 14. | Common Stock Options and Restricted Stock, Continued |
A summary of the activity in IBC’s common stock warrants/options and related information for the last three years follows:
| Exercise Price Per Warrant/Option | Wtd-Avg. | |||||||||||||||||||||||||||
| Class A Common Stock Options: |
$5.42 | $17.10 | $7.50 | $4.02 | $3.00 | Total |
|
Exercise Price |
| |||||||||||||||||||
| Outstanding at December 31, 2007 |
- | 137,640 | - | - | - | 137,640 | $17.10 | |||||||||||||||||||||
| Forfeited |
- | (4,800 | ) | - | - | - | (4,800 | ) | $17.10 | |||||||||||||||||||
| Expired (1) |
- | (800 | ) | - | - | - | (800 | ) | $17.10 | |||||||||||||||||||
| Warrant sold in 2008 to U.S. Treasury |
691,882 | - | - | - | - | 691,882 | $ 5.42 | |||||||||||||||||||||
| Options granted in 2008 to directors |
- | - | 57,600 | - | - | 57,600 | $ 7.50 | |||||||||||||||||||||
| Options granted in 2008 to employees |
- | - | 77,990 | - | - | 77,990 | $ 7.50 | |||||||||||||||||||||
| Outstanding at December 31, 2008 |
691,882 | 132,040 | 135,590 | - | - | 959,512 | $ 7.32 | |||||||||||||||||||||
| Forfeited |
- | (3,700 | ) | - | - | - | (3,700 | ) | $17.10 | |||||||||||||||||||
| Expired (1) |
- | (4,400 | ) | (4,900 | ) | - | - | (9,300 | ) | $12.04 | ||||||||||||||||||
| Options granted in 2009 to directors |
- | - | - | 38,700 | - | 38,700 | $ 4.02 | |||||||||||||||||||||
| Options granted in 2009 to employees |
- | - | - | 34,510 | - | 34,510 | $ 4.02 | |||||||||||||||||||||
| Outstanding at December 31, 2009 |
691,882 | 123,940 | 130,690 | 73,210 | - | 1,019,722 | $ 7.01 | |||||||||||||||||||||
| Forfeited |
- | - | - | (1,500 | ) | - | (1,500 | ) | $ 4.02 | |||||||||||||||||||
| Expired (1) |
- | (5,800 | ) | (8,400 | ) | - | - | (14,200 | ) | $11.42 | ||||||||||||||||||
| Options granted in 2010 to employees |
- | - | - | - | 41,400 | 41,400 | $ 3.00 | |||||||||||||||||||||
| Outstanding at December 31, 2010 |
691,882 | 118,140 | 122,290 | 71,710 | 41,400 | 1,045,422 | $ 6.79 | |||||||||||||||||||||
| Expiration date |
12/23/18 | 12/13/17 | 12/11/18 | 12/10/19 | 12/09/20 | |||||||||||||||||||||||
| Vested and exercisable (2) |
100% | 100% | 100% | 33.33% | 0% | |||||||||||||||||||||||
| Wtd-avg contractual remaining term (in years) |
8.0 | 7.0 | 8.0 | 8.9 | 9.9 | 8.0 | ||||||||||||||||||||||
| Intrinsic value December 31, 2010 (3) |
- | - | - | - | - | - | ||||||||||||||||||||||
| Class B Common Stock Warrants: |
$10.00 | $6.67 | ||||||||||||||||||||||||||
| Outstanding at December 31, 2007 |
50,000 | 145,000 | 195,000 | $ 7.52 | ||||||||||||||||||||||||
| Warrants exercised in 2008 (4) |
(50,000 | ) | (145,000 | ) | (195,000 | ) | $ 7.52 | |||||||||||||||||||||
| Outstanding at December 31, 2009 and 2010 |
- | - | - | |||||||||||||||||||||||||
(1) Represent vested options issued to former employees or directors that expired unexercised.
(2) The $4.02 options further vest and become exercisable at the rate of 33.33% on December 10, 2011 and 2012. The $3.00 options vest and become exercisable at the rate of 33.33% on December 9, 2011, 2012 and 2013.
(3) Intrinsic value is zero since the closing price of the Class A common stock on December 31, 2010 of $2.93 was below the exercise price of the options.
(4) Total intrinsic value of Class B warrants exercised in 2008 was $1.0 million and the related income tax benefit was $0.3 million, which was recorded in paid in capital. Intrinsic value was calculated using the closing stock price of $12.40 of the Class A common stock on January 22, 2008 in excess of the exercise price multiplied by the number of warrants exercised. The Class B stock was converted into Class A common stock in October 2010.
Stock-based compensation expense is recognized on a straight-line basis over the vesting period and totaled $41,000, $196,000 and $443,000, in 2010, 2009 and 2008, respectively. Stock-based compensation expense is recorded as an expense and a corresponding increase to stockholders’ equity. At December 31, 2010, pre-tax compensation cost related to all nonvested awards of options and restricted stock not yet recognized totaled $889,000 and will be recognized over a weighted average period of approximately 2.9 years.
97
Table of Contents
Intervest Bancshares Corporation and Subsidiaries
Notes to Consolidated Financial Statements
For the Years Ended December 31, 2010, 2009 and 2008
| 15. | Income Taxes |
We file a consolidated federal income tax return and combined state and city income tax returns in New York. IBC also files a franchise tax return in Delaware and INB files a state income tax return in Florida. All returns are filed on a calendar year basis. Tax returns that are no longer subject to examination by taxing authorities are as follows: Federal, New York State and Florida - for years prior to 2007; and New York City - for years prior to 2006.
Allocation of federal, state and local income taxes between current and deferred portions is as follows:
| ($ in thousands) | Current | Deferred | Total | |||||||||
| Year Ended December 31, 2010: |
||||||||||||
| Federal |
$(11,313) | $(20,100) | $(31,413) | |||||||||
| State and Local |
- | (8,935) | (8,935) | |||||||||
| $(11,313) | $(29,035) | $(40,348) | ||||||||||
| Year Ended December 31, 2009: |
||||||||||||
| Federal |
$ 5,205 | $(3,678) | $ 1,527 | |||||||||
| State and Local |
1,152 | (863) | 289 | |||||||||
| $ 6,357 | $(4,541) | $ 1,816 | ||||||||||
| Year Ended December 31, 2008: |
||||||||||||
| Federal |
$ 6,411 | $(2,534) | $ 3,877 | |||||||||
| State and Local |
2,596 | (582) | 2,014 | |||||||||
| $ 9,007 | $(3,116) | $ 5,891 | ||||||||||
The components of the deferred tax benefit are as follows:
| For the Year Ended December 31, |
||||||||||||
| ($ in thousands) |
2010 | 2009 | 2008 | |||||||||
| NOL carryforward |
$(26,636 | ) | $ - | $ - | ||||||||
| Allowances for loan losses and real estate losses |
(940 | ) | (2,767 | ) | (3,214 | ) | ||||||
| Capitalized real estate expenses |
(1,136 | ) | (831 | ) | - | |||||||
| Impairment writedowns on investment securities |
(517 | ) | (972 | ) | - | |||||||
| Deferred compensation and benefits |
124 | (15 | ) | (68 | ) | |||||||
| Depreciation |
65 | 19 | 72 | |||||||||
| Deferred income |
5 | 25 | 94 | |||||||||
| $(29,035 | ) | $(4,541 | ) | $(3,116 | ) | |||||||
We had a deferred tax asset relating to the unrealized benefit for net temporary differences between the financial statement carrying amounts of existing assets and liabilities and their respective tax bases that will result in future income tax deductions as well as an unused net operating loss carryforward (NOL) of $55.5 million for Federal and $87.5 million for state and local as of December 31, 2010 that may be applied against future taxable income. The carryforward expires in 2030.
The tax effects of the temporary differences that give rise to the deferred tax asset are as follows:
| At December 31, | ||||||||
| ($ in thousands) |
2010 | 2009 | ||||||
| NOL carryforward |
$ | 26,636 | $ | - | ||||
| Allowances for loan losses and real estate losses |
16,210 | 15,270 | ||||||
| Capitalized real estate expenses |
1,967 | 831 | ||||||
| Impairment writedowns on investment securities |
1,489 | 972 | ||||||
| Deferred compensation and benefits |
734 | 858 | ||||||
| Depreciation |
38 | 103 | ||||||
| Deferred income |
5 | 10 | ||||||
| Total deferred tax asset |
$ | 47,079 | $ | 18,044 | ||||
98
Table of Contents
Intervest Bancshares Corporation and Subsidiaries
Notes to Consolidated Financial Statements
For the Years Ended December 31, 2010, 2009 and 2008
| 15. | Income Taxes, Continued |
A valuation allowance was not required during the reporting periods because we believe that it is more likely than not that our deferred tax assets will be fully realized. This conclusion is based on our prior earnings history, exclusive of the NOL generated in the second quarter of 2010, coupled with evidence indicating that we will be able to generate an adequate amount of future taxable income to fully utilize the deferred tax asset. Our ability to realize our deferred tax asset could be reduced in the future if our estimates of future taxable income from our operations and tax planning strategies do not support our deferred tax amount. In addition, the amount of our net operating loss carryforwards and certain other tax attributes realizable for income tax purposes may be reduced under Section 382 of the Internal Revenue Code as a result of offerings of our capital securities, which could trigger a “change in control” as defined in Section 382.
The reconciliation between the statutory federal income tax rate and our effective income tax rate (including state and local taxes) is as follows:
| For the Year Ended December 31, |
||||||||||||
| 2010 | 2009 | 2008 | ||||||||||
| Federal statutory income tax rate |
(35.0 | )% | 35.0 | % | 35.0 | % | ||||||
| State and local income tax rate, net of federal benefit |
(8.4 | ) | 3.8 | 8.0 | ||||||||
| All other |
0.3 | (2.1 | ) | 1.8 | ||||||||
| (43.1 | )% | 36.7 | % | 44.8 | % | |||||||
The state and local income tax rate for 2009 in the table above was reduced by $629,000 of refunds of taxes paid to Florida for years prior to 2008 as a result of an audit and amended returns. Income taxes payable in 2008 was reduced by the tax benefit from the exercise of common stock warrants (calculated as the difference between the fair market value of the stock issued at the time of the exercise and the warrant exercise price, multiplied by the effective income tax rate). The net tax benefit amounted to $0.3 million and was recorded as an increase to paid-in capital. There were no such transactions in 2010 or 2009.
| 16. | (Loss) Earnings Per Common Share |
Net (loss) earnings applicable to common stockholders and the weighted-average number of shares used for basic and diluted (loss) earnings per common share computations are summarized in the table that follows:
| For the Year Ended December 31, |
||||||||||||
| ($ in thousands, except share and per share amounts) |
2010 | 2009 | 2008 | |||||||||
| Basic (Loss) Earnings Per Common Share: |
||||||||||||
| Net (loss) earnings available to common stockholders |
$(54,975) | $1,498 | $7,225 | |||||||||
| Weighted-Average number of common shares outstanding |
11,101,196 | 8,270,812 | 8,259,091 | |||||||||
| Basic (Loss) Earnings Per Common Share |
$(4.95) | $0.18 | $0.87 | |||||||||
| Diluted (Loss) Earnings Per Common Share: |
||||||||||||
| Net (loss) earnings available to common stockholders |
$(54,975) | $1,498 | $7,225 | |||||||||
| Weighted-Average number of common shares outstanding: |
||||||||||||
| Common shares outstanding |
11,101,196 | 8,270,812 | 8,259,091 | |||||||||
| Potential dilutive shares resulting from exercise of warrants/options (1) |
- | - | 8,690 | |||||||||
| Total average number of common shares outstanding used for dilution |
11,101,196 | 8,270,812 | 8,267,781 | |||||||||
| Diluted (Loss) Earnings Per Common Share |
$(4.95) | $0.18 | $0.87 | |||||||||
| (1) | All outstanding options/warrants were considered for the EPS computations and only those that are dilutive are included in the computations above using the treasury stock method. In 2009 and 2008, 1,019,722 and 132,040 of options/warrants were not dilutive because the exercise price of each was above the average market price of the Class A common stock during these periods. In 2010, all outstanding options/warrants were not considered dilutive due the net loss incurred. |
99
Table of Contents
Intervest Bancshares Corporation and Subsidiaries
Notes to Consolidated Financial Statements
For the Years Ended December 31, 2010, 2009 and 2008
| 17. | Contingencies |
We are periodically a party to or otherwise involved in legal proceedings arising in the normal course of business, such as foreclosure proceedings. Based on review and consultation with our legal counsel, we do not believe that there is any pending or threatened proceeding against us, which, if determined adversely, would have a material effect on our business, results of operations, financial position or liquidity.
| 18. | Contractual Death Benefit Payments |
IBC and IMC are contractually obligated to pay death benefits to the spouse of each company’s former chairman, Jerome Dansker, pursuant to the terms of his employment agreements. The agreements require the payment to his spouse of an amount called the “Distribution Amount” during a period called the “Distribution Term.” The Distribution Amount, in the case of IBC, is 25% of the amounts that would have been paid monthly to him as salary by IBC and the Distribution Term is the balance of the term of the agreement, or through June 30, 2014. In the case of IMC, the Distribution Amount is 50% of the amounts that would have been paid monthly to him as salary by IMC and the Distribution Term is likewise through June 30, 2014.
As a result of the former chairman’s death in August 2006, a consolidated death benefit payable and corresponding expense of $1.5 million was recorded at that time. The payable is included in the consolidated balance sheet in the line item “other liabilities” and the expense was recorded in the consolidated statement of operations in the line item “salaries and employee benefits.” The amount recorded represented the estimated net present value of the total monthly death benefit payments of $1.9 million that is payable to Jerome Dansker’s spouse through June 30, 2014. The difference between the estimated net present value and the total payments of $1.9 million is being recorded as interest expense in future periods through June 30, 2014 and included as a component of “salaries and employee benefits.” At December 31, 2010, the remaining amount of death benefit payments payable totaled $1.1 million and are due as follows: $0.3 million each year from 2011 to 2013 and $0.2 million in 2014. In the event of the death of the former chairman’s spouse prior to June 30, 2014, any remaining unpaid payments will be paid in a lump sum to the spouse’s estate.
| 19. | Off-Balance Sheet Financial Instruments |
We are party to financial instruments with off-balance sheet risk in the normal course of business to meet the financing needs of our customers. These instruments are in the form of commitments to extend credit and unused lines of credit and may involve, to varying degrees, elements of credit and interest rate risk in excess of the amounts recognized in the consolidated financial statements. Our maximum exposure to credit risk is represented by the contractual amount of those instruments. Commitments to extend credit are agreements to lend funds to a customer as long as there is no violation of any condition established in the contract. Such commitments generally have fixed expiration dates or other termination clauses and normally require payment of fees to us. Since some of the commitments are expected to expire without being drawn upon, the total commitment amount does not necessarily represent future cash requirements. We evaluate each customer’s creditworthiness on a case-by-case basis. INB from time to time issues standby letters of credit, which are conditional commitments issued by INB to guarantee the performance of a customer to a third party. The credit risk involved in the underwriting of letters of credit is essentially the same as that involved in originating loans.
The contractual amounts of off-balance sheet financial instruments are as follows:
| At December 31, |
||||||||
| ($ in thousands) | 2010 | 2009 | ||||||
| Commitments to extend credit |
$6,305 | $26,823 | ||||||
| Unused lines of credit |
816 | 968 | ||||||
| $7,121 | $27,791 | |||||||
100
Table of Contents
Intervest Bancshares Corporation and Subsidiaries
Notes to Consolidated Financial Statements
For the Years Ended December 31, 2010, 2009 and 2008
| 20. | Regulatory Capital and Regulatory Matters |
IBC is suject to regulation, examination and supervision by the FRB. INB is subject to regulation, examination and supervision by the Federal Deposit Insurance Corporation (“FDIC”) and the Office of the Comptroller of the Currency (“OCC”). Both IBC and INB are subject to various minimum regulatory capital requirements. Failure to comply with these requirements can initiate mandatory and discretionary actions by the regulators that, if undertaken, could have a material adverse effect on our financial condition, results of operations and business. Under capital adequacy guidelines and the regulatory framework for prompt corrective action, we must meet specific capital guidelines that involve quantitative measures of our assets, liabilities and certain off-balance sheet items as calculated under regulatory accounting practices. These capital amounts are also subject to qualitative judgement by the regulators about components, risk weighting and other factors. Quantitative measures established by the regulations to ensure capital adequacy require us to maintain minimum amounts and ratios of total Tier 1 capital to risk-weighted assets, total Tier 1 capital to average assets and total regulatory capital to risk weighted assets, as defined by the regulations.
IBC has trust preferred securities (TRUPS) outstanding (that were issued prior to 2007 and mature at various times from 2033 through 2036) which can be included in Tier 1 capital of bank holding companies. Bank holding companies generally may include cumulative perpetual preferred stock and trust preferred securities in Tier 1 capital up to 25 percent of total core capital elements (excluding senior preferred stock issued to the U.S. Treasury, all of which qualifies as Tier 1 capital without restriction). Amounts of qualifying cumulative perpetual preferred stock and qualifying trust preferred securities in excess of this limit may be included in Tier 2 capital.
Beginning March 31, 2011, the amount of qualifying cumulative perpetual preferred stock (excluding senior preferred stock issued to the U.S. Treasury for which there is no limit) and qualifying trust preferred securities, as well as certain types of minority interest, that may be included as Tier 1 capital will be limited to 25 percent of the sum of core capital elements net of goodwill. We do not have any goodwill or minority interests. Additionally, the excess amounts of restricted core capital elements in the form of qualifying trust preferred securities included in Tier 2 capital will be limited to 50 percent of Tier 1 capital (net of goodwill). However, amounts in excess of this limit will still be taken into account in the overall assessment of an organization’s funding and financial condition. In the last five years before the underlying subordinated note matures, the associated trust preferred securities must be treated as limited-life preferred stock. Thus, in the last five years of the life of the note, the outstanding amount of trust preferred securities will be excluded from Tier 1 capital and included in Tier 2 capital, subject, together with subordinated debt and other limited-life preferred stock, to a limit of 50 percent of Tier 1 capital. During this period, the trust preferred securities will be amortized out of Tier 2 capital by one-fifth of the original amount (less redemptions) each year and excluded totally from Tier 2 capital during the last year of life of the underlying note. Based on its current capital levels, we do not expect IBC’s Tier 1 capital to be reduced when the changes described above become effective.
Under the recently enacted Dodd Frank Wall Street Reform and Consumer Protection Act, certain bank holding companies will not be able to count “hybrid capital instruments,” such as TRUPS, as Tier 1 capital. These provisions apply to IBC as follows: holding companies, such as IBC, with at least $500 million but less than $15 billion in total consolidated assets cannot count as Tier 1 capital any hybrid capital instruments, including TRUPS, issued on or after May 19, 2010. However, these holding companies can continue to count as Tier 1 capital any hybrid capital instruments issued before May 19, 2010. These provisions do not apply to any hybrid capital instrument issued prior to October 4, 2010 to the U.S. government or a U.S. government agency under the Emergency Economic Stabilization Act of 2008, such as Troubled Asset Relief Program (TARP). Accordingly, IBC’s outstanding TRUPS and preferred stock held by the U.S. Treasury will continue to count as Tier 1 capital under the provisions of this legislation.
101
Table of Contents
Intervest Bancshares Corporation and Subsidiaries
Notes to Consolidated Financial Statements
For the Years Ended December 31, 2010, 2009 and 2008
| 20. | Regulatory Capital and Regulatory Matters, Continued |
In April 2009, INB agreed with the OCC to maintain its minimum capital ratios at specified levels higher than those otherwise required by applicable regulations as noted in the second table that follows. At December 31, 2010 and 2009, we believe that IBC and INB met all capital adequacy requirements to which they are subject. As of the date of filing of this report, we are not aware of any conditions or events that would have changed the status of such compliance with regulatory capital requirements from December 31, 2010. There can be no assurances that INB or IBC will not be required to maintain regulatory capital at higher levels in the future.
Information regarding our regulatory capital and related ratios is summarized as follows:
| INB |
IBC Consolidated |
|||||||||||||||
| At December 31, | At December 31, | At December 31, | At December 31, | |||||||||||||
| ($ in thousands) | 2010 | 2009 | 2010 | 2009 | ||||||||||||
| Tier 1 Capital (1) |
$197,660 | $239,698 | $208,091 | $269,054 | ||||||||||||
| Tier 2 Capital |
19,254 | 23,541 | 19,370 | 23,827 | ||||||||||||
| Total risk-based capital |
$216,914 | $263,239 | $227,461 | $292,881 | ||||||||||||
| Net risk-weighted assets |
$1,525,185 | $1,874,750 | $1,534,108 | $1,897,331 | ||||||||||||
| Average assets for regulatory purposes |
$2,057,155 | $2,384,842 | $2,069,318 | $2,408,538 | ||||||||||||
| Total capital to risk-weighted assets |
14.22% | 14.04% | 14.83% | 15.44% | ||||||||||||
| Tier 1 capital to risk-weighted assets |
12.96% | 12.79% | 13.56% | 14.18% | ||||||||||||
| Tier 1 capital to average assets |
9.61% | 10.05% | 10.06% | 11.17% | ||||||||||||
(1) IBC’s consolidated Tier 1 capital at December 31, 2010 and 2009 included $55 million of IBC’s outstanding qualifying trust preferred securities and $25 million of IBC’s cumulative perpetual preferred stock held by the U.S. Treasury.
The table that follows presents information regarding capital adequacy.
| Capital Requirements | ||||||||||||||||||||||||||||||||
| Actual Capital | Minimum Under Corrective Action |
To Be “Well Capitalized” Under Prompt Corrective Action Provisions |
Minimum Under Agreement with OCC |
|||||||||||||||||||||||||||||
| ($ in thousands) | Amount | Ratio | Amount | Ratio | Amount | Ratio | Amount | Ratio | ||||||||||||||||||||||||
| Consolidated at Dec 31, 2010: (1) |
|
|||||||||||||||||||||||||||||||
| Total capital to risk-weighted assets |
$227,461 | 14.83% | $122,729 | 8.00% | NA | NA | NA | NA | ||||||||||||||||||||||||
| Tier 1 capital to risk-weighted assets |
$208,091 | 13.56% | $ 61,364 | 4.00% | NA | NA | NA | NA | ||||||||||||||||||||||||
| Tier 1 capital to average assets |
$208,091 | 10.06% | $ 82,773 | 4.00% | NA | NA | NA | NA | ||||||||||||||||||||||||
| Consolidated at Dec 31, 2009: (1) |
|
|||||||||||||||||||||||||||||||
| Total capital to risk-weighted assets |
$292,881 | 15.44% | $151,786 | 8.00% | NA | NA | NA | NA | ||||||||||||||||||||||||
| Tier 1 capital to risk-weighted assets |
$269,054 | 14.18% | $ 75,893 | 4.00% | NA | NA | NA | NA | ||||||||||||||||||||||||
| Tier 1 capital to average assets |
$269,054 | 11.17% | $ 96,342 | 4.00% | NA | NA | NA | NA | ||||||||||||||||||||||||
| INB at Dec 31, 2010: |
||||||||||||||||||||||||||||||||
| Total capital to risk-weighted assets |
$216,914 | 14.22% | $122,015 | 8.00% | $152,519 | 10.00% | $183,022 | 12.00% | ||||||||||||||||||||||||
| Tier 1 capital to risk-weighted assets |
$197,660 | 12.96% | $ 61,007 | 4.00% | $ 91,511 | 6.00% | $152,519 | 10.00% | ||||||||||||||||||||||||
| Tier 1 capital to average assets |
$197,660 | 9.61% | $ 82,286 | 4.00% | $102,858 | 5.00% | $185,144 | 9.00% | ||||||||||||||||||||||||
| INB at Dec 31, 2009: |
||||||||||||||||||||||||||||||||
| Total capital to risk-weighted assets |
$263,239 | 14.04% | $149,980 | 8.00% | $187,475 | 10.00% | $224,970 | 12.00% | ||||||||||||||||||||||||
| Tier 1 capital to risk-weighted assets |
$239,698 | 12.79% | $ 74,990 | 4.00% | $112,485 | 6.00% | $187,475 | 10.00% | ||||||||||||||||||||||||
| Tier 1 capital to average assets |
$239,698 | 10.05% | $ 95,394 | 4.00% | $119,242 | 5.00% | $214,636 | 9.00% | ||||||||||||||||||||||||
|
(1) Assuming IBC had excluded all of its eligible outstanding trust preferred securities (which totaled $55 million) from its Tier 1 capital and included the entire amount in its Tier 2 capital, consolidated proforma capital ratios at December 31, 2010 would have been 14.83%, 9.98% and 7.40%, respectively. |
| |||||||||||||||||||||||||||||||
102
Table of Contents
Intervest Bancshares Corporation and Subsidiaries
Notes to Consolidated Financial Statements
For the Years Ended December 31, 2010, 2009 and 2008
| 20. | Regulatory Capital and Regulatory Matters, Continued |
In December 2010, INB entered into a formal written agreement (the “Formal Agreement”) with the OCC. The Formal Agreement superseded and replaced a Memorandum of Understanding (“MOU”) entered into on April 7, 2009 between INB and the OCC. The Formal Agreement requires INB to take certain actions, including the development of strategic and capital plans covering at least three years, completing a management assessment, and developing programs related to: loan portfolio management; criticized assets; credit concentrations; loan review; accounting for other real estate owned; maintaining an adequate allowance for loan losses; liquidity risk management; and interest rate risk. INB is required and is submitting periodic progress reports to the OCC regarding various aspects of the foregoing actions. INB’s Board of Directors appointed a compliance committee to monitor and coordinate INB’s performance under the Formal Agreement.
The Formal Agreement also limits INB’s ability to pay dividends to IBC and requires INB to maintain Tier 1 capital at least equal to 9% of adjusted total assets, Tier 1 capital at least equal to 10% of risk-weighted assets; and total risk-based capital at least equal to 12% of risk-weighted assets. These are the same levels that INB agreed to maintain beginning April 7, 2009. We are aggressively working to address the Formal Agreement and to date have enhanced various procedures and policies and are developing or have developed formal action plans to comply with all of the requirements of the Formal Agreement. All of our actions will be subject to the on-going review, satisfaction and approval of the OCC.
As a result of the Formal Agreement, INB is not allowed to accept brokered deposits without the prior approval of the OCC and it is also required, in the absence of a waiver from the FDIC, based on a determination that INB operates in high cost deposit markets, to maintain its deposit pricing at or below the national rates published by the FDIC, plus 75 basis points. At December 31, 2010, all of INB’s deposit products were at levels at or below the FDIC national rates plus 75 basis points. The FDIC’s national rate is a simple average of rates paid by U.S. depository institutions as calculated by the FDIC.
In January 2011, as a result of the above, IBC also entered into a written agreement (the “Federal Reserve Agreement”) with the FRB which requires IBC’s Board of Directors to take the steps necessary to utilize IBC’s financial and managerial resources to serve as a source of strength to INB, including causing INB to comply with its Formal Agreement. In addition, IBC cannot declare or pay dividends without the prior approval of the FRB and the Director of the Division of Banking Supervision and Regulation of the Board of Governors (the “Banking Director”). IBC also cannot take any payments representing a reduction in capital from INB without prior approval of the FRB and IBC cannot not make any distributions of interest, principal or other sums on its subordinated debentures or trust preferred securities without prior approval from the FRB and the Banking Director. Further, IBC may not incur, increase or guarantee any debt or purchase or redeem any shares of its stock without prior approval of the FRB. IBC is also required within 90 days of the date of the Federal Reserve Agreement to submit a plan to continue to maintain sufficient capital. Finally, IBC must notify the FRB when appointing any new director or senior executive officer or changing responsibilities of any senior executive officer, and IBC is also restricted in making certain severance and indemnification payments. We are committed to taking all necessary actions to promptly address the requirements of the Federal Reserve Agreement.
103
Table of Contents
Intervest Bancshares Corporation and Subsidiaries
Notes to Consolidated Financial Statements
For the Years Ended December 31, 2010, 2009 and 2008
| 21. | Fair Value Measurements |
We use fair value measurements to record fair value adjustments to certain assets and liabilities and to determine fair value disclosures. Currently, we have no assets or liabilities that are recorded at fair value on a recurring basis, such as securities available for sale. From time to time, we may be required to record at fair value other assets or liabilities on a non-recurring basis, such as impaired loans, impaired investment securities and foreclosed real estate. These non-recurring fair value adjustments involve the application of lower-of-cost-or-market accounting or writedowns of individual assets. In accordance with GAAP, we group our assets and liabilities at fair value in three levels, based on the markets in which the assets are traded and the reliability of the assumptions used to determine fair value, as follows:
Level 1 - Valuation is based upon quoted prices for identical instruments traded in active markets;
Level 2 - Valuation is based upon quoted prices for similar instruments in active markets, quoted prices for identical or similar instruments in markets that are not active and model-based valuation techniques for which all significant assumptions are observable in the market; and
Level 3 - Valuation is generated from model-based techniques that use significant assumptions not observable in the market. These assumptions reflect our estimates of assumptions that market participants would use in pricing the asset or liability. Valuation techniques include the use of discounted cash flow models. The results cannot be determined with precision and may not be realized in an actual sale or immediate settlement of the asset or liability.
We base our fair values on the price that would be received to sell an asset or paid to transfer a liability in an orderly transaction between market participants at the measurement date. GAAP requires us to maximize the use of observable inputs and minimize the use of unobservable inputs when measuring fair value. Our assessment of the significance of a particular input to the fair value measurement in its entirety requires considerable judgment, by us and considers factors specific to the asset or liability.
The following describes valuation methodologies used for assets measured at fair value on a non-recurring basis.
Impaired Loans. All of our loans are evaluated individually for impairment. A loan is considered impaired when, based upon current information and events, it is probable that we will be unable to collect all amounts due, including principal and interest, according to the contractual terms of the loan agreement. Our impaired loans are normally collateral dependent and, as such, are carried at the lower of our net recorded investment in the loan or the estimated fair value of the collateral less estimated selling costs. Adjustments to the recorded investment are made through a specific valuation allowance that is recorded as part of the overall allowance for loan losses. Estimates of fair value of the collateral properties is determined based on a variety of information, including available appraisals and the knowledge and experience of our two senior lending officers and chief credit officer related to values of properties in our lending market areas. Our policy is to obtain externally prepared appraisals or other indications of value for all new, restructured, or renewed loans; upon the classification or downgrade of a loan; and upon foreclosure and transfer of a loan to foreclosed real estate, and at least annually thereafter for all impaired loans and real estate owned. In addition to appraisals, consideration is also given to the type, location and occupancy of the property and current economic conditions in the area the property is located in assessing estimates of fair value. Accordingly, fair value estimates for impaired loans are classified as Level 3.
Other Than Temporary Impaired Investment Securities. We evaluate our security investments for other than temporary impairment (“OTTI”) at least quarterly or more frequently when conditions warrant such evaluation. Impairment is assessed at the individual security level.
104
Table of Contents
Intervest Bancshares Corporation and Subsidiaries
Notes to Consolidated Financial Statements
For the Years Ended December 31, 2010, 2009 and 2008
| 21. | Fair Value Measurements, Continued |
We consider an investment security to be impaired if, after a review of available evidence, the full collection of contractual principal and interest over the life of the security is no longer probable. The assessment for and the amount of impairment requires considerable judgment by us and is entirely an estimate and not a precise determination. Our impairment evaluation process considers all available evidence, including factors such as the expected cash flows of the security, severity, length of time and anticipated recovery period of the cash shortfalls, recent events specific to the issuer, including investment downgrades by rating agencies and current and anticipated economic and regulatory conditions of its industry, and the issuer’s financial condition, capital strength and near-term prospects. We also consider our intent and ability to retain the security for a period of time sufficient to allow for a recovery in fair value, or until maturity. Among the factors that we consider in determining our intent and ability to retain the security is a review of our capital adequacy, interest rate risk position and liquidity. Accordingly, fair value estimates for securities deemed to have other than temporary impairment are classified as Level 3. If it is deemed that OTTI has occurred, the security is written down to a new cost basis and the resulting loss is charged to earnings as a component of non-interest income.
Foreclosed Real Estate. Fair value is estimated in the same manner as impaired loans and, as such, is also classified as Level 3. As these properties are actively marketed, the estimated fair values may be periodically adjusted through increases to the valuation allowance for real estate losses to reflect decreases in estimated values resulting from changing market conditions.
The following table provides information regarding our assets measured at fair value on a nonrecurring basis.
| Carrying Value At December 31, 2010 |
Total Losses (3) Year Ended December 31, |
|||||||||||||||||||||||||||
| ($ in thousands) | Total | Level 1 | Level 2 | Level 3 | 2010 | 2009 | 2008 | |||||||||||||||||||||
| Impaired loans (1): |
||||||||||||||||||||||||||||
| Commercial real estate |
$49,064 | $ | - | $ - | $49,064 | $58,828 | $5,248 | $4,964 | ||||||||||||||||||||
| Residential multifamily |
7,491 | - | - | 7,491 | 26,210 | 3,508 | 4,944 | |||||||||||||||||||||
| Land |
- | - | - | - | 4,696 | 3,601 | 2,525 | |||||||||||||||||||||
| Total impaired loans |
56,555 | - | - | 56,555 | 89,734 | 12,357 | 12,433 | |||||||||||||||||||||
| Impaired securities (2) |
4,580 | - | - | 4,580 | 1,192 | 2,258 | - | |||||||||||||||||||||
| Foreclosed real estate |
27,064 | - | - | 27,064 | 15,636 | 2,275 | 832 | |||||||||||||||||||||
|
(1) Comprised of nonaccrual loans and TDRs and excludes a specific valuation allowance of $7.2 million. See note 3. (2) Comprised of certain investments in trust preferred securities considered other than temporarily impaired. (3) Represents total losses recognized on all assets measured at fair value on a nonrecurring basis during the period indicated. The loss for impaired loans represents the change (before net chargeoffs) during the period in the corresponding specific valuation allowance and the loss for foreclosed real estate represents writedowns in carrying values subsequent to foreclosure (recorded as provisions for real estate losses) adjusted for any gains or losses from the sale of the properties during the period. A large portion of the losses for impaired loans and foreclosed real estate in 2010 were attributable to a bulk sale in which such assets were sold at significant discounts to their estimated fair values. The loss on investment securities represents OTTI charges recorded as a component of noninterest income. |
| |||||||||||||||||||||||||||
The following table presents information regarding the change is assets measured at fair value on a nonrecurring basis for the year ended December 31, 2010.
| ($ in thousands) | Impaired Securities |
Impaired Loans |
Foreclosed Real Estate |
|||||||||
| Balance at December 31, 2009 |
$3,727 | $221,188 | $ 31,866 | |||||||||
| Net new impaired securities and loans |
2,045 | 97,852 | - | |||||||||
| Other than temporary impairment writedowns |
(1,192 | ) | - | - | ||||||||
| Principal repayments/sales |
- | (124,374 | ) | (30,051 | ) | |||||||
| Chargeoffs of impaired loans |
- | (97,226 | ) | - | ||||||||
| Impaired loans transferred to foreclosed real estate |
- | (40,885 | ) | 40,885 | ||||||||
| Writedowns of carrying value subsequent to foreclosure |
- | - | (15,509 | ) | ||||||||
| Loss on sales |
- | - | (127 | ) | ||||||||
| Balance at December 31, 2010 |
$4,580 | $ 56,555 | $ 27,064 | |||||||||
105
Table of Contents
Intervest Bancshares Corporation and Subsidiaries
Notes to Consolidated Financial Statements
For the Years Ended December 31, 2010, 2009 and 2008
| 21. | Fair Value of Measurements, Continued |
The carrying and estimated fair values of our financial instruments are as follows:
| ($ in thousands) | At December 31, 2010 |
At December 31, 2009 |
||||||||||||||
| Carrying Value |
Fair Value |
Carrying Value |
Fair Value |
|||||||||||||
| Financial Assets: |
||||||||||||||||
| Cash and cash equivalents |
$ | 23,911 | $ | 23,911 | $ | 7,977 | $ | 7,977 | ||||||||
| Securities held to maturity, net |
614,335 | 606,658 | 634,856 | 630,554 | ||||||||||||
| FRB and FHLB stock |
9,655 | 9,655 | 10,708 | 10,708 | ||||||||||||
| Loans receivable, net |
1,302,486 | 1,336,412 | 1,653,524 | 1,655,591 | ||||||||||||
| Loan fees receivable |
5,470 | 4,441 | 7,890 | 6,221 | ||||||||||||
| Accrued interest receivable |
8,925 | 8,925 | 11,196 | 11,196 | ||||||||||||
| Financial Liabilities: |
||||||||||||||||
| Deposits |
1,766,083 | 1,821,899 | 2,029,984 | 2,088,502 | ||||||||||||
| Borrowed funds plus accrued interest payable |
84,676 | 83,661 | 118,552 | 118,524 | ||||||||||||
| Accrued interest payable on deposits |
4,593 | 4,593 | 6,201 | 6,201 | ||||||||||||
| Off-Balance Sheet Instruments: |
||||||||||||||||
| Commitments to lend |
143 | 143 | 267 | 267 | ||||||||||||
Fair value estimates are made at a specific point in time based on available information. Where available, quoted market prices are used. However, a significant portion of our financial instruments, such as mortgage loans, do not have an active marketplace in which they can be readily sold or purchased to determine fair value. Consequently, fair value estimates for such instruments are based on assumptions made by us that include the instrument’s credit risk characteristics and future estimated cash flows and prevailing interest rates.
As a result, these fair value estimates are subjective in nature, involve uncertainties and matters of significant judgment and therefore, cannot be determined with precision. Accordingly, changes in any of our assumptions could cause the fair value estimates to deviate substantially. The fair value estimates also do not reflect any additional premium or discount that could result from offering for sale, at one time, our entire holdings of a particular financial instrument, nor estimated transaction costs. Further, the tax ramifications related to the realization of unrealized gains and losses can have a significant effect on and have not been considered in the fair value estimates. Finally, fair value estimates do not attempt to estimate the value of anticipated future business, our customer relationships, branch network, and the value of assets and liabilities that are not considered financial instruments, such as core deposit intangibles and premises and equipment.
The following methods and assumptions were used to estimate the fair value of financial instruments:
Cash and Cash Equivalents. The carrying amount is a reasonable estimate of fair value because of the relatively short time between the origination of the instrument and its expected realization.
Securities. The estimated fair value of U.S government agency securities held to maturity are obtained from third-party brokers who provide quoted prices derived from active markets for identical or similar securities. The estimated fair value of trust preferred security investments which currently do not have an active trading market are obtained from a third-party pricing service, which uses a complex valuation model that factors in numerous assumptions and data, including anticipated discounts related to illiquid trading markets, credit and interest rate risk, which are considered Level 3 inputs. The estimated fair value of the FRB and FHLB stock approximates carrying value since the securities are redeemable at cost.
Loans Receivable. The estimated fair value of accruing loans is based on a discounted cash flow analysis, using interest rates currently being offered by INB for loans with similar terms to borrowers of similar credit quality. The determination of the estimated fair value of impaired loans was discussed earlier in this footnote.
106
Table of Contents
Intervest Bancshares Corporation and Subsidiaries
Notes to Consolidated Financial Statements
For the Years Ended December 31, 2010, 2009 and 2008
| 21. | Fair Value of Measurements, Continued |
We can make no assurance that our perception and quantification of all the factors we use in determining fair value, including our estimate of credit risk, would be viewed in the same manner as that of a potential investor. Therefore, changes in any of our assumptions could cause the reported fair value estimates of our loans to deviate substantially.
Deposits. The estimated fair value of deposits with no stated maturity, such as savings, money market, checking and noninterest-bearing demand deposit accounts approximates carrying value since these deposits are payable on demand. The estimated fair value of certificates of deposit are based on the discounted value of their contractual cash flows. The discount rate used in the present value computation was estimated by comparison to current interest rates offered by INB for certificates of deposit with similar remaining maturities.
Borrowed Funds and Accrued Interest Payable. The estimated fair value of borrowed funds and related accrued interest payable is based on a discounted cash flow analysis. The discount rate used in the present value computation was estimated by comparison to what we believe to be our incremental borrowing rate for similar arrangements.
All Other Financial Assets and Liabilities. The estimated fair value of accrued interest receivable and accrued interest payable on deposits approximates their carrying values since these instruments are payable on demand or have short-term maturities. The estimated fair value of loan fees receivable is based on the discounted value of their contractual cash flows using the same discount rate that is used to value loans receivable.
Off-Balance Sheet Instruments. The carrying amounts of commitments to lend approximates estimated fair value. Estimated fair value is based on fees currently charged to enter into similar agreements, taking into account the remaining terms of the agreements and the counter party’s credit standing.
107
Table of Contents
Intervest Bancshares Corporation and Subsidiaries
Notes to Consolidated Financial Statements
For the Years Ended December 31, 2010, 2009 and 2008
| 22. | Holding Company Financial Information |
Condensed Balance Sheets
| At December 31, |
||||||||||||
| ($ in thousands) | 2010 | 2009 | ||||||||||
| ASSETS |
||||||||||||
| Cash and due from banks |
$ | 119 | $ | 185 | ||||||||
| Short-term investments |
4,818 | 6,705 | ||||||||||
| Total cash and cash equivalents |
4,937 | 6,890 | ||||||||||
| Investment in consolidated subsidiaries |
235,794 | 261,066 | ||||||||||
| Investment in unconsolidated subsidiaries - Intervest Statutory Trusts |
1,702 | 1,702 | ||||||||||
| Deferred debenture offering costs, net of amortization |
853 | 890 | ||||||||||
| Premises and equipment, net |
411 | 538 | ||||||||||
| All other assets |
1,312 | 26 | ||||||||||
| Total assets |
$ | 245,009 | $ | 271,112 | ||||||||
| LIABILITIES |
||||||||||||
| Debentures payable - capital securities |
$ | 56,702 | $ | 56,702 | ||||||||
| Accrued interest payable on debentures |
2,262 | 85 | ||||||||||
| All other liabilities |
85 | 271 | ||||||||||
| Total liabilities |
59,049 | 57,058 | ||||||||||
| STOCKHOLDERS’ EQUITY |
||||||||||||
| Preferred equity, net of preferred stock discount |
23,852 | 23,466 | ||||||||||
| Common equity |
162,108 | 190,588 | ||||||||||
| Total stockholders’ equity |
185,960 | 214,054 | ||||||||||
| Total liabilities and stockholders’ equity |
$ | 245,009 | $ | 271,112 | ||||||||
|
Condensed Statements of Operations
|
| |||||||||||
| For the Year Ended December 31, |
||||||||||||
| ($ in thousands) | 2010 | 2009 | 2008 | |||||||||
| Interest income |
$ | 36 | $ | 148 | $ | 259 | ||||||
| Dividend income from subsidiary (1) |
- | 3,933 | 3,507 | |||||||||
| Interest expense |
2,148 | 2,713 | 3,496 | |||||||||
| Net interest and dividend (expense) income |
(2,112 | ) | 1,368 | 270 | ||||||||
| Credit for loan losses |
- | 30 | - | |||||||||
| Management fee income from subsidiaries |
155 | 430 | 450 | |||||||||
| Other non-interest income |
2 | 21 | - | |||||||||
| All other noninterest expenses |
806 | 679 | 582 | |||||||||
| (Loss) income before income taxes |
(2,761 | ) | 1,170 | 138 | ||||||||
| Credit for income taxes (2) |
1,267 | 1,269 | 1,548 | |||||||||
| Net (loss) earnings before (loss) earnings of subsidiaries |
(1,494 | ) | 2,439 | 1,686 | ||||||||
| Equity in undistributed (loss) earnings of Intervest National Bank |
(50,242 | ) | 1,789 | 4,749 | ||||||||
| Equity in undistributed (loss) earnings of Intervest Mortgage Corporation |
(1,572 | ) | (1,098 | ) | 831 | |||||||
| Consolidated net (loss) earnings |
(53,308 | ) | 3,130 | 7,266 | ||||||||
| Preferred stock dividend requirements and discount amortization (3) |
1,667 | 1,632 | 41 | |||||||||
| Consolidated net (loss) earnings available to common stockholders |
$ | (54,975 | ) | $ | 1,498 | $7,225 | ||||||
| (1) | Represent dividends paid to IBC from INB to provide funds for the debt service on IBC’s outstanding debentures payable - capital securities and for the cash dividend requirements on IBC’s outstanding preferred stock held by the U.S Treasury under the TARP program. The debt service on the debentures payable is included in IBC’s interest expense. The proceeds from the issuance of the capital securities and preferred stock are invested in the capital of INB. In 2010, INB suspended the payment of dividends to IBC as requested by its primary regulator. |
| (2) | Dividends from subsidiaries are eliminated in consolidation and are not included in IBC’s computation of pre-tax income for purposes of computing income taxes. |
| (3) | Represents dividend requirements on $25 million of 5% cumulative Series A Preferred Stock issued on December 23, 2008 to the U.S Treasury and amortization of related preferred stock discount associated with this transaction. |
108
Table of Contents
Intervest Bancshares Corporation and Subsidiaries
Notes to Consolidated Financial Statements
For the Years Ended December 31, 2010, 2009 and 2008
| 22. | Holding Company Financial Information, Continued |
Condensed Statements of Cash Flows
| For the Year Ended December 31, |
||||||||||||
| ($ in thousands) | 2010 | 2009 | 2008 | |||||||||
| OPERATING ACTIVITIES |
||||||||||||
| Consolidated net (loss) earnings |
$ | (53,308 | ) | $ 3,130 | $ 7,266 | |||||||
| Adjustments to reconcile net (loss) earnings to net cash (used in) provided by operating activities: |
||||||||||||
| Equity in loss (earnings) of subsidiaries before dividends |
51,814 | (4,624 | ) | (9,087) | ||||||||
| Cash dividends received from subsidiary - Intervest National Bank |
- | 3,933 | 3,507 | |||||||||
| Increase (decrease) in accrued interest payable on debentures |
2,177 | (37 | ) | (15 | ) | |||||||
| All other |
(1,148 | ) | 115 | (152 | ) | |||||||
| Net cash (used in) provided by operating activities |
(465 | ) | 2,517 | 1,519 | ||||||||
| INVESTING ACTIVITIES |
||||||||||||
| Investment in capital of subsidiary - Intervest National Bank |
(37,600 | ) | (9,320 | ) | (25,000 | ) | ||||||
| Return of capital from subsidiary - Intervest Mortgage Corporation |
11,100 | 9,320 | - | |||||||||
| Net decrease in loans receivable |
- | 2,616 | 49 | |||||||||
| Net cash (used in) provided by investing activities |
(26,500 | ) | 2,616 | (24,951 | ) | |||||||
| FINANCING ACTIVITIES |
||||||||||||
| Cash received from issuance of preferred stock and common stock warrant |
- | - | 25,000 | |||||||||
| Cash received from issuance of common stock upon exercise of stock warrants |
- | - | 1,467 | |||||||||
| Excess tax benefit from exercise of stock warrants recorded to paid in capital |
- | - | 336 | |||||||||
| Cash received from issuance of common stock, net of issuance costs |
25,012 | - | - | |||||||||
| Cash dividends paid to common stockholders |
- | - | (2,068 | ) | ||||||||
| Cash dividends paid to preferred stockholder |
- | (1,118 | ) | - | ||||||||
| Net cash provided by (used in) financing activities |
25,012 | (1,118 | ) | 24,735 | ||||||||
| Net (decrease) increase in cash and cash equivalents |
(1,953 | ) | 4,015 | 1,303 | ||||||||
| Cash and cash equivalents at beginning of year |
6,890 | 2,875 | 1,572 | |||||||||
| Cash and cash equivalents at end of year |
$ 4,937 | $ 6,890 | $ 2,875 | |||||||||
| SUPPLEMENTAL DISCLOSURES |
||||||||||||
| Cash paid (received) during the year for: |
||||||||||||
| Interest |
$ - | $ 2,713 | $ 3,474 | |||||||||
| Income taxes |
- | (1,225 | ) | (1,592 | ) | |||||||
| Noncash transactions: |
||||||||||||
| Subsidiaries’ compensation expense related to common stock options |
41 | 196 | 443 | |||||||||
| Preferred dividend requirements and amortization of preferred stock discount |
1,667 | 1,632 | 41 | |||||||||
109
Table of Contents
Intervest Bancshares Corporation and Subsidiaries
Notes to Consolidated Financial Statements
For the Years Ended December 31, 2010, 2009 and 2008
| 23. | Selected Quarterly Financial Data (Unaudited) |
The following information is as of or for the period ended:
| 2010 |
||||||||||||||||
| ($ in thousands, except per share amounts) | Q1 | Q2 | Q3 | Q4 | ||||||||||||
| Interest and dividend income |
$ | 29,631 | $ | 27,429 | $ | 25,265 | $ | 24,747 | ||||||||
| Interest expense |
17,141 | 16,064 | 15,180 | 14,307 | ||||||||||||
| Net interest and dividend income |
12,490 | 11,365 | 10,085 | 10,440 | ||||||||||||
| Provision for loan losses |
9,639 | 87,533 | 1,598 | 2,693 | ||||||||||||
| Net interest and dividend income (expense) after provision for loan losses |
2,851 | (76,168 | ) | 8,487 | 7,747 | |||||||||||
| Noninterest income |
512 | 518 | 7 | 1,073 | ||||||||||||
| Noninterest expenses |
7,666 | 14,971 | 8,812 | 7,234 | ||||||||||||
| (Loss) earnings before income taxes |
(4,303 | ) | (90,621 | ) | (318 | ) | 1,586 | |||||||||
| (Benefit) provision for income taxes |
(1,825 | ) | (39,172 | ) | (78 | ) | 727 | |||||||||
| Net (loss) earnings |
(2,478 | ) | (51,449 | ) | (240 | ) | 859 | |||||||||
| Preferred dividend requirements and discount amortization |
409 | 415 | 421 | 422 | ||||||||||||
| Net (loss) earnings available to common stockholders |
$ | (2,887 | ) | $ | (51,864 | ) | $ | (661 | ) | $ | 437 | |||||
| Basic (loss) earnings per common share |
$ | (0.35 | ) | $ | (6.02 | ) | $ | (0.07 | ) | $ | 0.02 | |||||
| Diluted (loss) earnings per common share |
(0.35 | ) | (6.02 | ) | (0.07 | ) | 0.02 | |||||||||
| Cash dividends paid per common share |
- | - | - | - | ||||||||||||
| Total assets |
$ | 2,284,257 | $ | 2,164,442 | $ | 2,104,098 | $ | 2,070,868 | ||||||||
| Total cash, short-term investments and security investments |
547,537 | 656,779 | 627,559 | 638,246 | ||||||||||||
| Total loans, net of unearned fees |
1,634,140 | 1,395,564 | 1,363,312 | 1,337,326 | ||||||||||||
| Total deposits |
1,926,772 | 1,852,356 | 1,806,834 | 1,766,083 | ||||||||||||
| Total borrowed funds and related accrued interest payable |
103,060 | 98,582 | 89,135 | 84,676 | ||||||||||||
| Total stockholders’ equity |
211,274 | 164,302 | 164,072 | 185,960 | ||||||||||||
| 2009 |
||||||||||||||||
| ($ in thousands, except per share amounts) | Q1 | Q2 | Q3 | Q4 | ||||||||||||
| Interest and dividend income |
$ | 30,679 | $ | 30,804 | $ | 30,939 | $ | 31,176 | ||||||||
| Interest expense |
21,389 | 20,607 | 19,924 | 19,080 | ||||||||||||
| Net interest and dividend income |
9,290 | 10,197 | 11,015 | 12,096 | ||||||||||||
| Provision for loan losses |
1,857 | 2,686 | 2,396 | 3,926 | ||||||||||||
| Net interest and dividend income after provision for loan losses |
7,433 | 7,511 | 8,619 | 8,170 | ||||||||||||
| Noninterest income |
73 | 57 | 95 | 72 | ||||||||||||
| Noninterest expenses |
5,939 | 6,554 | 7,336 | 7,255 | ||||||||||||
| Earnings before income taxes |
1,567 | 1,014 | 1,378 | 987 | ||||||||||||
| Provision for income taxes |
672 | 236 | 627 | 281 | ||||||||||||
| Net earnings |
895 | 778 | 751 | 706 | ||||||||||||
| Preferred dividend requirements and discount amortization |
405 | 409 | 409 | 409 | ||||||||||||
| Net earnings available to common stockholders |
$ | 490 | $ | 369 | $ | 342 | $ | 297 | ||||||||
| Basic earnings per common share |
$ | 0.06 | $ | 0.04 | $ | 0.04 | $ | 0.04 | ||||||||
| Diluted earnings per common share |
0.06 | 0.04 | 0.04 | 0.04 | ||||||||||||
| Cash dividends paid per common share |
- | - | - | - | ||||||||||||
| Total assets |
$ | 2,317,613 | $ | 2,380,044 | $ | 2,382,170 | $ | 2,401,204 | ||||||||
| Total cash, short-term investments and security investments |
584,562 | 600,092 | 638,902 | 653,541 | ||||||||||||
| Total loans, net of unearned fees |
1,708,752 | 1,746,087 | 1,696,064 | 1,686,164 | ||||||||||||
| Total deposits |
1,938,123 | 1,995,165 | 2,012,995 | 2,029,984 | ||||||||||||
| Total borrowed funds and related accrued interest payable |
122,194 | 118,035 | 107,547 | 118,552 | ||||||||||||
| Total stockholders’ equity |
212,617 | 213,137 | 213,619 | 214,054 | ||||||||||||
110
Table of Contents
Item 9. Changes In and Disagreements with Accountants on Accounting and Financial Disclosure
Not Applicable
Item 9A. Controls and Procedures
Our management evaluated, with the participation of our Principal Executive and Financial Officers, the effectiveness of our disclosure controls and procedures (as defined in Rule 13a-15(e) or 15d-15(e) under the Securities Exchange Act of 1934) as of the end of the period covered by this report. Based on such evaluation, the Principal Executive and Financial Officers have concluded that our disclosure controls and procedures are designed to ensure that information required to be disclosed in the reports we file or furnish under the Securities Exchange Act of 1934 is recorded, processed, summarized and reported within the time periods specified in the SEC’s rules and regulations, and are operating in an effective manner. There were no changes in our internal control over financial reporting that occurred during our most recent fiscal quarter that has materially affected, or is reasonably likely to materially affect, our internal control over financial reporting.
Item 9B. Other Information - Not Applicable
PART III
Item 10. Directors, Executive Officers and Corporate Governance
Directors. The information required by this item is contained under the section entitled “Proposal One: Election of Directors” of IBC’s definitive proxy statement for its 2011 Annual Meeting (the “Proxy Statement”) to be held in May 2011, which will be filed with the SEC within 120 days from December 31, 2010, and is incorporated herein by reference.
Executive Officers. The information required by this item is set forth at the end of Part I of this report under the caption “Executive Officers and Other Key Employees.”
Compliance with Section 16(a) Beneficial Ownership Reporting Compliance. The information required by this item is contained under the section entitled “Compliance with Section 16(a) of the Securities Exchange Act of 1934” in the Proxy Statement and is incorporated herein by reference.
Audit Committee Financial Expert. The information required by this item regarding the Audit Committee of our Board of Directors, including information regarding audit committee financial experts serving on the Audit Committee is contained in the section of the Proxy Statement entitled “Corporate Governance Principles and Board Matters” and is incorporated herein by reference.
Code of Business Conduct and Ethics. We have a written code of business conduct and ethics that applies to our directors, officers and employees, and also has a written code of ethics for our principal executive and financial officers. Our Audit Committee has procedures for the submission of complaints or concerns regarding financial statement disclosures and other matters. A copy of these documents will be furnished without charge to beneficial holders of Class A common stock by writing to: Intervest Bancshares Corporation, Attention: Secretary, One Rockefeller Plaza, Suite 400, New York, NY 10020.
Item 11. Executive Compensation
The information required by this item is contained in the section entitled “Executive Compensation” of the Proxy Statement and is incorporated /herein by reference.
Item 12. Security Ownership of Certain Beneficial Owners and Management and Related
Stockholder Matters
The information required by this item is contained in the sections entitled “Security Ownership of Certain Beneficial Owners and Management” and “Stock Warrant Exercises, Grants and Outstanding Equity Awards” of the Proxy Statement and are incorporated herein by reference.
Item 13. Certain Relationships and Related Transactions, and Director Independence
The information required by this item is contained in the sections entitled “Corporate Governance Principles and Board Matters” and “Certain Relationships and Related Transactions” of the Proxy Statement and is incorporated herein by reference.
Item 14. Principal Accountant Fees and Services
The information required by this item is contained in the section entitled “Independent Public Accountants” of the Proxy Statement and is incorporated herein by reference.
111
Table of Contents
PART IV
Item 15. Exhibits and Financial Statement Schedules
(a) Documents Filed as Part of this Report
| (1) | Financial Statements: See Part II Item 8 “Financial Statements and Supplementary Data” |
| (2) | Financial Statement Schedules: See Part II Item 8 “Financial Statements and Supplementary Data” |
| (3) | Exhibits: The following exhibits are filed herein as part of this Form 10-K: |
| Exhibit Number |
Exhibit Description | Incorporated by Reference | ||||||||
| Form | SEC File Number |
Exhibit | Filing Date | |||||||
| 2.1 * | Agreement and Plan of Merger dated as of November 1, 1999 by and among IBC, ICNY Acquisition Corporation and Intervest Corporation of New York |
DEFS- 14A |
000-23377 | Annex A | 02/10/00 | |||||
| 2.2 * | Stock Purchase Agreement dated as of December 18, 2002, by and between IBC and Jean Dansker regarding the purchase and sale of the issued and outstanding shares of Intervest Securities Corporation |
S-1 | 333-26493 | 2.2 | 07/08/05 | |||||
| 3.1 * | Restated Certificate of Incorporation of IBC |
10-Q | 000-23377 | 3.0 | 08/07/06 | |||||
| 3.2 * | Certificate of Amendment to Restated Certificate of Incorporation of IBC |
S-1 | 333-167911 | 3.1 | 06/30/10 | |||||
| 3.3 * | Bylaws of IBC as amended |
8-K | 000-23377 | 3.1 | 12/17/07 | |||||
| 3.3 * | Certificate of designation of IBC preferred stock issued to U.S. Treasury dated as of December 18, 2008 |
8-K | 000-23377 | 3.1 | 12/23/08 | |||||
| 4.1 * | Form of Certificate for Shares of Class A Common Stock of IBC |
SB-2 | 033-82246 | 4.1 | 09/15/04 | |||||
| 4.2 * | Form of Certificate for Shares of Class B Common Stock of IBC |
SB-2 | 033-82246 | 4.1 | 09/15/04 | |||||
| 4.3 * | Form of Warrant for Class B Common Stock issued to Mr. Jerome Dansker |
10-KSB | 033-82246 | 4.2 | 03/21/96 | |||||
| 4.4 * | Form of Warrant for Class A Common Stock |
SB-2 | 033-82246 | 4.3 | 09/15/04 | |||||
| 4.5 * | Form of Warrant between IBC and the Bank of New York |
SB-2 | 033-82246 | 4.4 | 09/15/04 | |||||
| 4.6 * | Warrant issued to U.S. Treasury to purchase Class A Common Stock |
8-K | 000-23377 | 4.1 | 12/23/08 | |||||
| 4.7 * | Form of Indenture between IBC and U.S Bank National Association dated as of September 17, 2003 |
10-K | 000-23377 | 4.9 | 03/19/04 | |||||
| 4.8 * | Form of Indenture between IBC and U.S Bank National Association dated as of March 17, 2004 |
10-Q | 000-23377 | 4.10 | 11/12/04 | |||||
| 4.9 * | Form of Indenture between IBC and Wilmington Trust Company dated as of September 20, 2004 |
10-Q | 000-23377 | 4.11 | 11/12/04 | |||||
| 4.10 * | Form of Indenture between IBC and Wilmington Trust Company dated as of September 21, 2006 |
10-Q | 000-23377 | 4.1 | 11/02/06 | |||||
| 10.1 +* | Employment and Supplemental Benefits Agreement between IBC and Jerome Dansker dated as of July 1, 2004 |
10-Q | 000-23377 | 10.0 | 11/12/04 | |||||
| 10.2 +* | Employment and Supplemental Benefits Agreement IBC and Lowell S. Dansker dated as of July 1, 2004 |
10-Q | 000-23377 | 10.1 | 11/12/04 | |||||
| 10.3 * | Mortgage Servicing Agreement dated as of April 1, 2002, as supplemented on October 21, 2004 for the purpose of clarification of the intent of the original agreement between IBC’ subsidiaries, INB and IMC |
10-Q | 033-27404 | 10.1 | 11/15/04 | |||||
| 10.4 +* | Employment Agreement between IMC and Jerome Dansker dated as of July 1, 1995 |
S-11 | 033-96662 | 10.2 | 09/07/95 | |||||
| 10.5 +* | Amendment to Employment Agreement between IMC and Jerome Dansker dated as of August 3, 1998 |
10-K | 033-27404 | 10.1 | 03/31/99 | |||||
| 10.6 +* | Amendment to Employment Agreement between IMC and Jerome Dansker dated as of July 1, 2004 |
10-Q | 033-27404 | 10.0 | 11/10/05 | |||||
| 10.7 +* | Letter Agreement between IBC and Jean Dansker dated as of October 4, 2006 |
8-K | 000-23377 | 99.1 | 10/06/06 | |||||
| 10.8 +* | IBC Long Term Incentive Plan |
S-8 | 333-138651 | 4.4 | 11/13/06 | |||||
| 10.9 +* | Form of Non-Qualified Option Agreement |
10-K | 000-23377 | 10.11 | 03/02/10 | |||||
112
Table of Contents
| Incorporated by Reference | ||||||||||
| Exhibit Number |
Exhibit Description | Form | File Number |
Exhibit | Filing Date | |||||
| 10.10+* |
Form of Restricted Stock Award Agreement (Named Executive Officer) |
8-K | 000-23377 | 10.1 | 12/15/10 | |||||
| 10.11+* |
Form of Restricted Stock Award Agreement (Non-Employee Directors) |
8-K | 000-23377 | 10.2 | 12/15/10 | |||||
| 10.12+* |
Employment Agreement between IMC and Jerome Dansker, dated as of July 1, 1995 |
S-11 | 033-96662 | 10.2 | 11/15/04 | |||||
| 10.13+ |
Form of Employment Agreement between INB and certain executive officers |
10-K | 000-23377 | 10.13 | 03/02/10 | |||||
| 10.14+* |
Amendment to Employment Agreement between IBC and Lowell Dansker dated as of June 21, 2007 |
8-K | 000-23377 | 10.1 | 6/25/07 | |||||
| 10.15 * |
Securities purchase agreement letter between IBC and U.S. Treasury dated as of December 23, 2008 |
8-K | 000-23377 | 10.1 | 12/23/08 | |||||
| 10.16 * |
Form of waiver dated as of December 23, 2008 |
8-K | 000-23377 | 10.2 | 12/23/08 | |||||
| 10.17 * |
Asset Purchase Agreement, dated May 25, 2010, by and among INB, IMC and VFC Partners 4 LLC. |
8-K | 000-23377 | 10.1 | 5/27/10 | |||||
| 10.18 * |
Investment Agreement, dated May 25, 2010, by and among IBC, Varde Investment Partners, L.P. and FC Highway 6 Holdings LLC. |
8-K | 000-23377 | 10.2 | 5/27/10 | |||||
| 10.19 * |
Registration Rights Agreement, dated May 25, 2010, by and among IBC, Varde Investment Partners, L.P. and FC Highway 6 LLC. |
8-K | 000-23377 | 10.2 | 5/27/10 | |||||
| 10.20 * |
Letter Agreement, dated May 25, 2010, by and between INB and VFI Partners 4 LLC. |
8-K | 000-23377 | 10.2 | 5/27/10 | |||||
| 10.21 * |
Agreement to Convert, dated August 25, 2010, by and among IBC, Lowell S. Dansker, Jean Dansker and Helene Bergman. |
8-K | 000-23377 | 1.1 | 8/26/10 | |||||
| 10.22* |
Underwriting agreement dated October 14, 2010 between IBC and Sandler O’Neill & Partners, L.P. |
8-K | 000-23377 | 1.1 | 10/15/10 | |||||
| 10.23* |
Agreement between INB and The Comptroller of the Currency |
8-K | 000-23377 | 10.1 | 12/10/10 | |||||
| 10.24* |
Agreement between IBC and Federal Reserve bank of New York |
8-K | 000-23377 | 10.1 | 01/20/11 | |||||
| 12.0 |
Computation of ratios of earnings to fixed charges |
Filed herewith | ||||||||
| 14.1 * |
Code of Business Conduct |
10-K | 000-23377 | 14.1 | 03/28/05 | |||||
| 14.2 * |
Code of Ethics |
10-K | 000-23377 | 14.2 | 03/28/05 | |||||
| 14.3 * |
Procedures for Submissions Regarding Questionable Accounting, Internal Accounting Controls and Auditing Matters |
10-K | 000-23377 | 14.3 | 3/12/07 | |||||
| 21.0 |
Subsidiaries |
Filed herewith | ||||||||
| 23.0 |
Consent of Independent Registered Public Accounting Firm |
Filed herewith | ||||||||
| 31.0 |
Certification of the principal executive officer pursuant to Section 302 of The Sarbanes-Oxley Act of 2002 |
Filed herewith | ||||||||
| 31.1 |
Certification of the principal financial officer pursuant to Section 302 of The Sarbanes-Oxley Act of 2002 |
Filed herewith | ||||||||
| 32.0 |
Certification of the principal executive and financial officers pursuant to Section 906 of The Sarbanes-Oxley Act of 2002 |
Filed herewith | ||||||||
| 99.1 |
Certification of the principal executive officer pursuant to Section 11 of The Emergency Economic Stabilization Act of 2008 |
Filed herewith | ||||||||
| 99.2 |
Certification of the principal financial officer pursuant to Section 11 of The Emergency Economic Stabilization Act of 2008 |
Filed herewith | ||||||||
| * | Previously filed. + Denotes management contract or compensatory plan or arrangement. |
113
Table of Contents
Pursuant to the requirements of Section 13 or 15(d) of the Securities Exchange Act of 1934, the Company has duly caused this report to be signed on its behalf by the undersigned, thereunto duly authorized, on the date indicated.
INTERVEST BANCSHARES CORPORATION
(Registrant)
| By: |
/s/ Lowell S. Dansker |
Date: March 10, 2011 |
||||||
| Lowell S. Dansker, |
||||||||
| Chairman and Chief Executive Officer (Principal Executive Officer) |
||||||||
Pursuant to the requirements of the Securities Exchange Act of 1934, this report has been signed below by the following persons on behalf of the registrant and in the capacities and on the date indicated.
Chairman and Chief Executive Officer:
(Principal Executive Officer):
| By: |
/s/ Lowell S. Dansker |
Date: March 10, 2011 |
||||||
| Lowell S. Dansker |
||||||||
| Chief Financial and Accounting Officer: | ||||||||
| (Principal Financial Officer): | ||||||||
| By: |
/s/ John J. Arvonio |
Date: March 10, 2011 |
||||||
| John J. Arvonio |
||||||||
| Vice President, Secretary and Director: | ||||||||
| By: |
/s/ Stephen A. Helman |
Date: March 10, 2011 |
||||||
| Stephen A. Helman |
||||||||
| Directors: | ||||||||
| By: |
/s/ Michael A. Callen |
Date: March 10, 2011 |
||||||
| Michael A. Callen |
||||||||
| By: |
/s/ Paul R. DeRosa |
Date: March 10, 2011 |
||||||
| Paul R. DeRosa |
||||||||
| By: |
/s/ Wayne F. Holly |
Date: March 10, 2011 |
||||||
| Wayne F. Holly |
||||||||
| By: |
/s/ Lawton Swan, III |
Date: March 10, 2011 |
||||||
| Lawton Swan, III |
||||||||
| By: |
/s/ Thomas E. Willett |
Date: March 10, 2011 |
||||||
| Thomas E. Willett |
||||||||
| By: |
/s/ Wesley T. Wood |
Date: March 10, 2011 |
||||||
| Wesley T. Wood |
||||||||
114