Attached files
| file | filename |
|---|---|
| 8-K - FORM 8-K - FURMANITE CORP | d80508e8vk.htm |
| EX-99.1 - EX-99.1 - FURMANITE CORP | d80508exv99w1.htm |
Exhibit 99.2

| Furmanite Corporation QUARTER AND YEAR ENDED DECEMBER 31, 2010 Charles R. Cox, Chairman & CEO Joseph E. Milliron, President & COO Robert S. Muff, Principal Financial Officer |

| Certain of the Company's statements in this presentation are not purely historical, and as such are "forward-looking statements" within the meaning of the Private Securities Litigation Reform Act of 1995. These include statements regarding management's plans, beliefs, expectations, intentions or projections of the future. Forward-looking statements involve risks and uncertainties, including without limitation, the various risks inherent in the Company's business, and other risks and uncertainties detailed most recently in this presentation and the Company's Form 10-K as of December 31, 2010 filed with the Securities and Exchange Commission. One or more of these factors could affect the Company's business and financial results in future periods, and could cause actual results to differ materially from plans and projections. There can be no assurance that the forward-looking statements made in this document will prove to be accurate, and issuance of such forward-looking statements should not be regarded as a representation by the Company, or any other person, that the objectives and plans of the Company will be achieved. All forward-looking statements made in this presentation are based on information presently available to management, and the Company assumes no obligation to update any forward-looking statements. Safe Harbor Statement 03/10/2011 2 |

| Furmanite Corporation QUARTER AND YEAR ENDED DECEMBER 31, 2010 Charles R. Cox, Chairman & CEO 3 03/10/2011 |

| Mission Our Mission: To safely and cost-effectively provide World Class solutions for the full range of each Customer's unique local needs - from routine to the most challenging - and to make Furmanite their most trusted Global provider of every Specialty Service we offer. "Delivering World Class Solutions Locally" 4 |

| Furmanite's Orange Code: Safety above all else Integrity and Ethical conduct Customer Responsiveness Perfect Service and Products Global Teamwork and Collaboration 5 Leadership Innovation and Differentiation Continuous Improvement and Growth Urgency, Passion and Commitment Professional and Positive Make Furmanite the company our customers trust and a place we all have Fun Succeeding Together! |

| Furmanite Corporation QUARTER AND YEAR ENDED DECEMBER 31, 2010 Financial Review Robert S. Muff, Principal Financial Officer 6 03/10/2011 |

| Consolidated Statements of Operations ($ in 000s except per share amounts) (Unaudited)' 7 For the Three Months Ended For the Three Months Ended For the Three Months Ended For the Three Months Ended For the Three Months Ended For the Three Months Ended For the Three Months Ended December 31, December 31, December 31, December 31, December 31, December 31, December 31, 2010 % of Rev 2009 % of Rev Change Revenues $ 75,070 100.0% $ 72,425 100.0% $ 2,645 Operating costs 51,115 68.1% 50,838 70.2% 277 Depreciation and amortization expense 1,723 2.3% 1,642 2.3% 81 Selling, general and administrative expense 16,268 21.7% 21,370 29.5% (5,102) Operating income (loss) excluding restructuring costs 5,964 7.9% (1,425) -2.0% 7,389 Restructuring costs 997 1.3% 1,073 1.5% (76) Operating income (loss) 4,967 6.6% (2,498) -3.4% 7,465 Interest and other income (expense), net (208) (239) 31 Income (loss) before income taxes 4,759 (2,737) 7,496 Income tax expense (1,035) (1,407) 372 Net income (loss) $ 3,724 $ (4,144) $ 7,868 Diluted EPS $ 0.10 $ (0.12) $ 0.22 Diluted EPS, excluding restructuring, net of tax $ 0.13 $ (0.09) $ 0.22 03/10/2011 |

| Consolidated Statements of Operations ($ in 000s except per share amounts) 8 For the Year Ended For the Year Ended For the Year Ended For the Year Ended For the Year Ended For the Year Ended For the Year Ended December 31, December 31, December 31, December 31, December 31, December 31, December 31, 2010 % of Rev 2009 % of Rev Change Revenues $ 285,953 100.0% $ 275,940 100.0% $ 10,013 Operating costs 192,595 67.4% 187,269 67.9% 5,326 Depreciation and amortization expense 6,490 2.3% 5,995 2.2% 495 Selling, general and administrative expense 67,495 23.6% 80,069 29.0% (12,574) Operating income excluding restructuring costs 19,373 6.8% 2,607 0.9% 16,766 Restructuring costs 5,713 2.0% 1,073 0.4% 4,640 Operating income 13,660 4.8% 1,534 0.6% 12,126 Interest and other income (expense), net (394) (945) 551 Income before income taxes 13,266 589 12,677 Income tax expense (3,780) (3,419) (361) Net income (loss) $ 9,486 $ (2,830) $ 12,316 Diluted EPS $ 0.26 $ (0.08) $ 0.34 Diluted EPS, excluding restructuring, net of tax $ 0.40 $ (0.05) $ 0.45 03/10/2011 |

| Adjustments for Currency Rates ($ in 000s) (Unaudited) 9 For the Three Months Ended For the Three Months Ended For the Three Months Ended For the Three Months Ended For the Three Months Ended For the Year Ended For the Year Ended For the Year Ended For the Year Ended For the Year Ended December 31, December 31, December 31, December 31, December 31, December 31, December 31, December 31, December 31, December 31, 2010 2009 Change 2010 2009 Change Revenues $ 75,070 $ 72,425 $ 2,645 $ 285,953 $ 275,940 $ 10,013 Currency adjusted revenues $ 75,457 $ 72,425 $ 3,032 $ 284,165 $ 275,940 $ 8,225 Operating income (loss) $ 4,967 $ (2,498) $ 7,465 $ 13,660 $ 1,534 $ 12,126 Currency adjusted operating income (loss) $ 4,609 $ (2,498) $ 7,107 $ 12,563 $ 1,534 $ 11,029 Net income (loss) $ 3,724 $ (4,144) $ 7,868 $ 9,486 $ (2,830) $ 12,316 Currency adjusted net income (loss) $ 3,260 $ (4,144) $ 7,404 $ 8,477 $ (2,830) $ 11,307 03/10/2011 |

| Revenues Adjusted for Currency Rates ($ in 000s except percentages) (Unaudited) 10 For the Year Ended For the Year Ended For the Year Ended For the Year Ended For the Year Ended December 31, December 31, December 31, December 31, December 31, 2010 2009 Change Revenues Americas $ 135,174 $ 121,642 11% EMEA 109,373 119,211 -8% Asia-Pacific 41,406 35,087 18% Total revenues $ 285,953 $ 275,940 4% Currency adjusted revenues: Americas $ 134,937 $ 121,642 11% EMEA 112,039 119,211 -6% Asia-Pacific 37,189 35,087 6% Total currency adjusted revenues $ 284,165 $ 275,940 3% 03/10/2011 |

| Operating Income Adjusted for Currency Rates ($ in 000s except percentages) (Unaudited) 11 For the Year Ended For the Year Ended For the Year Ended For the Year Ended For the Year Ended December 31, December 31, December 31, December 31, December 31, 2010 2009 Change Operating income (loss) after allocation of headquarter costs: Americas $ 8,980 $ (2,584) $ 11,564 EMEA (4,013) (969) (3,044) Asia-Pacific 8,693 5,087 3,606 Total operating income (loss) after allocation of headquarter costs $ 13,660 $ 1,534 $ 12,126 Currency adjusted operating income (loss) after allocation of headquarter costs: Americas $ 8,981 $ (2,584) $ 11,565 EMEA (4,240) (969) (3,271) Asia-Pacific 7,822 5,087 2,735 Total Currency adjusted operating income (loss) after allocation of headquarter costs $ 12,563 $ 1,534 $ 11,029 03/10/2011 |

| Condensed Consolidated Balance Sheets ($ in 000s) 12 December 31, December 31, 2010 2009 Change Cash $ 37,170 $ 36,117 $ 1,053 Trade receivables, net 63,630 52,021 11,609 Inventories 24,366 26,827 (2,461) Other current assets 5,951 9,085 (3,134) Total current assets 131,117 124,050 7,067 Property and equipment, net 30,720 30,168 552 Other assets 20,264 20,771 (507) Total assets $ 182,101 $ 174,989 $ 7,112 Total current liabilities $ 42,936 $ 44,439 $ (1,503) Total long-term debt 30,085 30,139 (54) Other liabilities 10,992 15,081 (4,089) Total stockholders' equity 98,088 85,330 12,758 Total liabilities and stockholders' equity $ 182,101 $ 174,989 $ 7,112 03/10/2011 |

| Condensed Consolidated Cash Flows ($ in 000s) 13 For the Year Ended For the Year Ended For the Year Ended For the Year Ended For the Year Ended December 31, December 31, December 31, December 31, December 31, 2010 2009 Change Net income (loss) $ 9,486 $ (2,830) $ 12,316 Depreciation, amortization and other non-cash items 7,661 6,524 1,137 Working capital changes (9,311) 14,263 (23,574) Net cash provided by operating activities 7,836 17,957 (10,121) Capital expenditures (7,312) (6,541) (771) Payments on debt (237) (40,435) 40,198 Proceeds on issuance of debt 78 35,049 (34,971) Debt issuance costs - (658) 658 Other, net 802 (328) 1,130 Effect of exchange rate changes on cash (114) 280 (394) Increase in cash and cash equivalents 1,053 5,324 (4,271) Cash and cash equivalents at beginning of year 36,117 30,793 5,324 Cash and cash equivalents at end of year $ 37,170 $ 36,117 $ 1,053 03/10/2011 |

| Furmanite Corporation Q4 and Year End 2010 Operations Review Joseph E. Milliron, President and Chief Operating Officer 14 03/10/2011 |

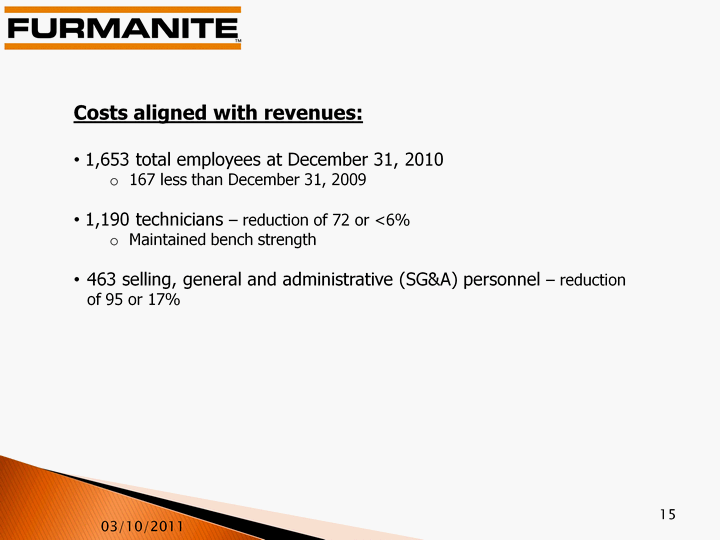
| 15 1,653 total employees at December 31, 2010 167 less than December 31, 2009 1,190 technicians - reduction of 72 or <6% Maintained bench strength 463 selling, general and administrative (SG&A) personnel - reduction of 95 or 17% Costs aligned with revenues: 03/10/2011 |

| 16 Total Americas2 EMEA3 APAC On-line Services 4th Qtr. 2010 $ 29,052 $ 15,240 $ 10,457 $ 3,355 On-line Services 4th Qtr 2009 25,423 12,022 9,411 3,990 Variance $ 3,629 $ 3,218 $ 1,046 $ (635) On-line Services YTD 2010 $ 104,651 $ 51,076 $ 37,051 $ 16,524 On-line Services YTD 2009 98,524 44,268 38,891 15,365 Variance $ 6,127 $ 6,808 $ (1,840) $ 1,159 Business and Geographic Data - On-line1 Services Revenues ($ in 000's) (Unaudited) 1 Formerly referred to as under-pressure services 2 U.S. and Canada 3 Europe, Middle East and Africa 03/10/2011 |

| Business and Geographic Data - Off-line1 Services Revenues ($ in 000's) (Unaudited) 17 1 Formerly referred to as turnaround services 2 U.S. and Canada 3 Europe, Middle East and Africa Total Americas2 EMEA3 APAC Off-line Services 4th Qtr. 2010 $ 35,218 $ 18,625 $ 11,520 $ 5,073 Off-line Services 4th Qtr 2009 35,624 15,174 15,119 5,331 Variance $ (406) $ 3,451 $ (3,599) $ (258) Off-line Services YTD 2010 $ 132,171 $ 61,601 $ 50,674 $ 19,896 Off-line Services YTD 2009 127,277 57,073 54,084 16,120 Variance $ 4,894 $ 4,528 $ (3,410) $ 3,776 03/10/2011 |

| 18 Market Conditions APAC - continues to be strong AMERICAS - strong 4th quarter continuing into 2011 EMEA - slower than prior years in the 4th quarter and the indicators are not as strong as compared to the Americas and APAC 03/10/2011 |

| 19 03/10/2011 Acquisition of Self Leveling Machines The world leader in machining of very large circular and irregular shaped surfaces in excess of 100 ft in the following industries: Mining Power - hydro, fossil, nuclear Steel Partnerships in INDIA and SINGAPORE Recently won a $5.5 million USD hydro refurbishment project in Guri, Venezula |

| Furmanite Corporation Review of 2010 www.furmanite.com 20 |
