Attached files
Table of Contents
UNITED STATES
SECURITIES AND EXCHANGE COMMISSION
Washington, D.C. 20549
FORM 10-K
| þ | ANNUAL REPORT PURSUANT TO THE SECTION 13 OR 15(D) OF THE SECURITIES EXCHANGE ACT OF 1934 |
For the fiscal year ended December 31, 2010
or
| ¨ | TRANSITION REPORT PURSUANT TO SECTION 13 OR 15(D) OF THE SECURITIES EXCHANGE ACT OF 1934 |
For the transition period from to
Commission File No. 001-34698
EXCEL TRUST, INC.
(Exact name of registrant as specified in its charter)
| Maryland | 27-1493212 | |
| (State or other jurisdiction of incorporation or organization) |
(I.R.S. Employer Identification Number) |
17140 Bernardo Center Drive, Suite 300,
San Diego, California 92128
(Address of principal executive office, including zip code)
(858) 613-1800
(Registrant’s telephone number, including area code)
Securities registered pursuant to Section 12(b) of the Act:
| Title of each class |
Name of each exchange of which registered | |
| Common Stock, $0.01 Par Value | New York Stock Exchange |
Securities registered pursuant to Section 12(g) of the Act:
None.
Indicate by check mark if the registrant is a well-known seasoned issuer, as defined in Rule 405 of the Securities Act. YES ¨ NO x
Indicate by check mark if the registrant is not required to file reports pursuant to Section 13 or Section 15(d) of the Act. YES ¨ NO x
Indicate by check mark whether the registrant (1) has filed all reports required to be filed by Section 13 or 15(d) of the Securities Exchange Act of 1934 during the preceding 12 months (or for such shorter period that the registrant was required to file such reports), and (2) has been subject to such filing requirements for the past 90 days. YES x NO ¨
Indicate by check mark whether the registrant has submitted electronically and posted on its corporate web site, if any, every Interactive Data File required to be submitted and posted pursuant to Rule 405 of Regulation S-T during the preceding 12 months (or for such shorter period that the registrant was required to submit and post such files). YES ¨ NO ¨
Indicate by check mark if disclosure of delinquent filers pursuant to Item 405 of Regulation S-K is not contained herein, and will not be contained, to the best of registrant’s knowledge, in definitive proxy or information statements incorporated by reference in Part III of this Form 10-K or any amendment to this Form 10-K. x
Indicate by check mark whether the registrant is a large accelerated filer, an accelerated filer, a non-accelerated filer or a smaller reporting company. See definitions of “large accelerated filer,” “accelerated filer” and “smaller reporting company” in Rule 12b-2 of the Exchange Act.
| Large accelerated filer | ¨ | Accelerated filer | ¨ | |||||
| Non-accelerated filer | x (Do not check if a smaller reporting company) | Smaller reporting company | ¨ | |||||
Indicate by check mark whether the registrant is a shell company (as defined in Rule 12b-2 of the Exchange Act). YES ¨ NO x
The aggregate market value of the voting stock held by non-affiliates of the registrant was approximately $179.9 million based upon the closing price on the New York Stock Exchange for such stock on June 30, 2010, the last business day of the registrant’s most recently completed second quarter.
Number of shares outstanding as of March 9, 2011 of the registrant’s common stock, par value $0.01 per share: 15,663,331 shares
DOCUMENTS INCORPORATED BY REFERENCE
Portions of Excel Trust, Inc.’s Proxy Statement with respect to its May 9, 2011 Annual Meeting of Stockholders to be filed not later than 120 days after the end of the registrant’s fiscal year are incorporated by reference into Part III hereof.
Table of Contents
EXCEL TRUST, INC.
ANNUAL REPORT ON FORM 10-K
FOR THE YEAR ENDED DECEMBER 31, 2010
2
Table of Contents
PART I
| ITEM 1. | BUSINESS |
Forward-Looking Statements
We make statements in this report that are “forward-looking statements” within the meaning of the Private Securities Litigation Reform Act of 1995 (set forth in Section 27A of the Securities Act of 1933, as amended, or the Securities Act, and Section 21E of the Securities Exchange Act of 1934, as amended, or the Exchange Act). In particular, statements pertaining to our capital resources, portfolio performance and results of operations contain forward-looking statements. Likewise, our statements regarding anticipated growth in our funds from operations, or FFO, and anticipated market conditions, demographics and results of operations are forward-looking statements. Forward-looking statements involve numerous risks and uncertainties, and you should not rely on them as predictions of future events. Forward-looking statements depend on assumptions, data or methods which may be incorrect or imprecise, and we may not be able to realize them. We do not guarantee that the transactions and events described will happen as described (or that they will happen at all). You can identify forward-looking statements by the use of forward-looking terminology such as “believes,” “expects,” “may,” “will,” “should,” “seeks,” “approximately,” “intends,” “plans,” “estimates” or “anticipates” or the negative of these words and phrases or similar words or phrases. You can also identify forward-looking statements by discussions of strategy, plans or intentions. The following factors, among others, could cause actual results and future events to differ materially from those set forth or contemplated in the forward-looking statements:
| • | adverse economic or real estate developments in the retail industry or the markets in which we operate, |
| • | changes in local, regional and national economic conditions, |
| • | our inability to compete effectively, |
| • | our inability to collect rent from tenants, |
| • | defaults on or non-renewal of leases by tenants, |
| • | increased interest rates and operating costs, |
| • | decreased rental rates or increased vacancy rates, |
| • | our failure to obtain necessary outside financing on favorable terms or at all, |
| • | changes in the availability of additional acquisition opportunities, |
| • | our inability to successfully complete real estate acquisitions, |
| • | our failure to successfully operate acquired properties and operations, |
| • | our failure to qualify or maintain our status as a real estate investment trust, or REIT, |
| • | government approvals, actions and initiatives, including the need for compliance with environmental requirements, |
| • | financial market fluctuations, |
| • | changes in real estate and zoning laws and increases in real property tax rates, |
| • | the effects of earthquakes and other natural disasters, and |
| • | lack of or insufficient amounts of insurance. |
While forward-looking statements reflect our good faith beliefs, they are not guarantees of future performance. We disclaim any obligation to update or revise any forward-looking statements, whether as a result of new information, future events or otherwise. For a further discussion of these and other factors that could impact our future results, performance or transactions, see the section below entitled “Item 1A. Risk Factors.”
3
Table of Contents
General
References to “we,” “our,” “us,” and “our company” refer to Excel Trust, Inc., a Maryland corporation, together with our consolidated subsidiaries, including Excel Trust, L.P., a Delaware limited partnership, of which we are the sole general partner and which we refer to in this report as our operating partnership.
We are a vertically integrated, self-administered, self-managed real estate firm with the principal objective of acquiring, financing, developing, leasing, owning and managing value oriented community and power centers, grocery anchored neighborhood centers and freestanding retail properties. Our strategy is to acquire high quality, well-located, dominant retail properties that generate attractive risk-adjusted returns. We target competitively protected properties in communities that have stable demographics and have historically exhibited favorable trends, such as strong population and income growth. We consider competitively protected properties to be located in the most prominent shopping districts in their respective markets, ideally situated at major “Main and Main” intersections. We seek investment opportunities throughout the United States, but focus on the Northeast, Northwest and Sunbelt regions. We generally lease our properties to national and regional supermarket chains, big-box retailers and select national retailers that offer necessity and value oriented items and generate regular consumer traffic. Our tenants carry goods that are less impacted by fluctuations in the broader U.S. economy and consumers’ disposable income, which we believe generates more predictable property-level cash flows.
We completed an initial public offering, or IPO, of our common stock in April 2010 and raised net proceeds of approximately $194.6 million. In connection with our IPO, we engaged in certain formation transactions in which four properties were contributed to us by related parties in exchange for cash, shares of our common stock and operating partnership units. As of December 31, 2010, we owned a portfolio consisting of 20 retail properties totaling approximately 2.5 million square feet of gross leasable area, which were approximately 93% leased and had a weighted average age of approximately five years, based on gross leasable area. In addition, we own one commercial office property totaling 82,157 square feet of gross leasable area, which was 100% leased as of December 31, 2010. We utilize a portion of this commercial building as our headquarters. We also own two land parcels comprising approximately 31 acres slated for retail development; a 50% interest in Northside Plaza, which is a 243,000 square foot property located in Dothan, Alabama, that is currently being redeveloped; and one mortgage note receivable.
On January 28, 2011, we issued 2,000,000 shares of 7.00% Series A Cumulative Convertible Perpetual Preferred Stock, par value $0.01 per share, with a liquidation preference of $25.00 per share (the Series A preferred stock). We will pay cumulative dividends on the Series A preferred stock from the date of original issue at a rate of 7.00% per annum, subject to adjustment in certain circumstances. The annual dividend on each share of Series A preferred stock is $1.75, payable quarterly in arrears on the 15th calendar day of January, April, July and October of each year, commencing on April 15, 2011, as and if declared by our board of directors. The Series A preferred stock will be convertible, at the holders’ option, at any time and from time to time, into shares of our common stock at an initial conversion rate of 1.6667 shares of common stock per share of Series A preferred stock, which is equivalent to an initial conversion price of $15.00 per share. Net proceeds from this offering were approximately $47.7 million. We used the net proceeds of this offering to repay a portion of the outstanding indebtedness under our revolving credit facility.
We were organized as a Maryland corporation on December 15, 2009 and intend to elect to be taxed as a REIT beginning with our taxable year ended December 31, 2010. We conduct substantially all of our business through Excel Trust, L.P., a Delaware limited partnership. We are the sole general partner of our operating partnership. As of March 8, 2011 we had 31 employees. Our primary offices are located in San Diego, California and Salt Lake City, Utah. Our headquarters is located at 17140 Bernardo Center Drive, Suite 300, San Diego, California 92128. Our telephone number at that location is (858) 613-1800. Our internet address is www.ExcelTrust.com. On our internet website, you can obtain our annual report on Form 10-K, quarterly reports on Form 10-Q, current reports on Form 8-K and amendments to those reports filed or furnished pursuant to Section 13(a) or 15(d) of the Exchange Act, as soon as reasonably practicable after we file such material
4
Table of Contents
electronically with, or furnish it to, the Securities and Exchange Commission (the SEC). You can also access on our website our Code of Business Conduct and Ethics, Corporate Governance Guidelines, Audit Committee Charter, Compensation Committee Charter, and Nominating and Corporate Governance Committee Charter.
Business Objective and Growth Strategies
Our objective is to maximize total returns to our stockholders through the pursuit of the following business and growth strategies:
Pursue value oriented investment strategy targeting core retail properties. Our strategy is to acquire high quality, well-located, dominant retail properties that generate attractive risk-adjusted returns. We acquire retail properties based on identified market and property characteristics, including:
| • | Property type. We focus our investment strategy on value oriented community and power centers, grocery anchored neighborhood centers and freestanding retail properties. We target a leasing mix where anchor tenants consist of 50 to 70% of our portfolio’s gross leasable area. |
| • | Neighborhood centers. A neighborhood center is designed to provide convenience shopping for the day-to-day needs of consumers in the immediate neighborhood. Neighborhood centers are often anchored by a supermarket or drugstore. |
| • | Community centers. A community center typically offers a wider range of apparel and other soft goods relative to a neighborhood center and in addition to supermarkets and drugstores, can include discount department stores as anchor tenants. |
| • | Power centers. A power center is dominated by several large anchors, including discount department stores, warehouse clubs or other large box retailers that offer tremendous selection in a particular merchandise category at low prices. |
| • | Freestanding retail properties. A freestanding retail property constitutes any retail building that is typically occupied by a single tenant. |
| • | Anchor tenant type. We target properties with anchor tenants that offer necessity and value oriented items that are less impacted by fluctuations in consumers’ disposable income. We believe nationally and regionally recognized anchor tenants that offer necessity and value oriented items provide more predictable property-level cash flows as they are typically higher credit quality tenants that generate stable revenues. |
| • | Lease terms. In the near term, we intend to acquire properties that feature one or more of the following characteristics in their tenants’ lease structure: properties with long-term leases for anchor tenants; properties under triple-net leases, which are leases where the tenant agrees to pay rent as well as all taxes, insurance and maintenance expenses that arise from the use of the property thereby minimizing our expenses; and properties with leases that incorporate percentage rent and/or rental escalations that act as an inflation hedge while maximizing operating cash flows. As a longer-term strategy, we will look to acquire properties with shorter-term lease structures for in-line tenants, which are tenants that rent smaller spaces around the anchor tenants within a property, that have below market rents that can be renewed at higher market rates. |
| • | Geographic markets and demographics. We seek investment opportunities throughout the United States but we focus on the Northeast, Northwest and Sunbelt regions, which are characterized by attractive demographic and property fundamental trends. We target competitively protected properties in communities that have stable demographics and have historically exhibited favorable trends, such as strong population and income growth. |
Capitalize on network of relationships to pursue off-market transactions. We have pursued and will continue to pursue off-market transactions in our target markets through the long-term relationships we have
5
Table of Contents
developed over the past three decades. We believe the current dislocation in the real estate capital markets will allow us to supplement this strategy in the near term by targeting opportunities resulting from both troubled owners and distressed real estate. We target overleveraged property owners facing liquidity constraints or solvency issues. We also intend to target properties that, although well-located, are challenged by tenant bankruptcies, mismanagement or neglect. We believe these sellers will provide us the opportunity to obtain high quality, well-located, dominant retail properties at attractive valuations.
Maximize value through proactive asset management. We believe our market expertise, targeted leasing strategies and proactive approach to asset management enable us to maximize the operating performance of our portfolio. We will continue to implement an active asset management program to increase the long-term value of each of our properties. This may include expanding existing tenants, re-entitling site plans to allow for additional outparcels, which are small tracts of land used for freestanding development not attached to the main buildings, and repositioning tenant mixes to maximize traffic, tenant sales and percentage rents. As we grow our portfolio, we will seek to maintain a diverse pool of assets with respect to both geographic distribution and tenant mix, helping to minimize our portfolio risk. We continually monitor our markets for opportunities to selectively dispose of properties where returns appear to have been maximized and redeploy proceeds into new acquisitions that have greater return prospects.
Leverage our experienced property management platform. Our management team has an extensive track record of managing, operating and leasing retail properties. We believe tenants value our commitment to maintaining the high standards of our properties through our handling of many property management functions in-house. Furthermore, we consider ourselves to be in the best position to oversee the day-to-day operations of our properties, which in turn helps us service our tenants. We feel this generates higher renewal and occupancy rates, minimizes rent interruptions, reduces renewal costs and helps us achieve stronger operating results. Along with this, a major component of our leasing strategy is to cultivate long-term relationships through consistent tenant dialogue in conjunction with a proactive approach to meeting the space requirements of our tenants.
Grow our platform through a comprehensive financing strategy. Our capital structure provides us with significant financial capacity and flexibility to fund future growth. As a well-capitalized public company, we believe we will have access to multiple sources of financing that are currently unavailable to many of our private market peers or overleveraged public competitors, which provides us with a competitive advantage. Over time, these financing alternatives may include follow-on offerings of our common stock, unsecured corporate level debt, preferred equity and credit facilities.
Regulation
General
Our properties are subject to various laws, ordinances and regulations, including regulations relating to common areas. We believe that we have the necessary permits and approvals to operate each of our properties.
Americans with Disabilities Act
Our properties must comply with Title III of the Americans with Disabilities Act, or ADA, to the extent that such properties are “public accommodations” as defined by the ADA. The ADA may require removal of structural barriers to access by persons with disabilities in certain public areas of our properties where such removal is readily achievable. We believe that the contribution properties were built in substantial conformance with the building codes of their respective cities, including in substantial compliance with the applicable ADA requirements at the time of construction. Although we believe that the acquisition properties substantially comply with present requirements of the ADA, we have not conducted an audit of all such properties to determine compliance. The tenants are generally responsible for any additional amounts required to conform their construction projects to the ADA. Non-compliance could result in imposition of fines by the U.S. government or
6
Table of Contents
an award of damages and/or attorneys’ fees to private litigants, or both. The obligation to make readily achievable accommodations is an ongoing one, and we will continue to assess our properties and to make alterations as appropriate in this respect.
Environmental Matters
Under various federal, state and local environmental laws and regulations, a current or previous owner, operator or tenant of real estate may be required to investigate and remove hazardous or toxic substances or petroleum product releases or threats of releases at such property, and may be held liable for property damage and for investigation, clean-up and monitoring costs incurred in connection with the actual or threatened contamination. Such laws typically impose clean-up responsibility and liability without regard to fault, or whether the owner, or tenant knew of or caused the presence of the contamination. The liability under such laws may be joint and several for the full amount of the investigation, clean-up and monitoring costs incurred or to be incurred or actions to be undertaken, although a party held jointly and severally liable may obtain contributions from the other identified, solvent, responsible parties of their fair share toward these costs. These costs may be substantial, and can exceed the value of the property. Some of the properties in our portfolio contain, may have contained or are adjacent to or near other properties that have contained or currently contain underground storage tanks for the storage of petroleum products or other hazardous or toxic substances. These operations may have released, or have the potential to release, such substances into the environment. The presence of contamination, or the failure to properly remediate contamination, on a property may adversely affect the ability of the owner, operator or tenant to sell or rent that property or to borrow using such property as collateral, and may adversely impact our investment on that property.
Federal regulations require building owners and those exercising control over a building’s management to identify and warn, via signs and labels, of potential hazards posed by workplace exposure to installed asbestos-containing materials, or ACMs, and potential ACMs in their building. The regulations also set forth employee training, record-keeping and due diligence requirements pertaining to ACMs and potential ACMs. Significant fines can be assessed for violating these regulations. Building owners and those exercising control over a building’s management may be subject to an increased risk of personal injury lawsuits by workers and others exposed to ACMs and potential ACMs as a result of these regulations. The regulations may affect the value of a building containing ACMs and potential ACMs in which we have invested. Federal, state and local laws and regulations also govern the removal, encapsulation, disturbance, handling and/or disposal of ACMs and potential ACMs when such materials are in poor condition or in the event of construction, remodeling, renovation or demolition of a building. Such laws may impose liability for improper handling or a release to the environment of ACMs and potential ACMs and may provide for fines to, and for third parties to seek recovery from, owners or operators of real properties for personal injury or improper work exposure associated with ACMs and potential ACMs.
When excessive moisture accumulates in buildings or on building materials, mold growth may occur, particularly if the moisture problem remains undiscovered or is not addressed over a period of time. Some molds may produce airborne toxins or irritants. Concern about indoor exposure to mold has been increasing because exposure to mold may cause a variety of adverse health effects and symptoms, including allergic or other reactions. The presence of significant mold at any of our properties could require us to undertake a costly remediation program to contain or remove the mold from the affected property. In addition, the presence of significant mold could expose us to liability to our tenants, their or our employees, and others if property damage or health concerns arise.
Federal, state and local laws and regulations also require removing or upgrading certain underground storage tanks and regulate the discharge of storm water, wastewater and any water pollutants; the emission of air pollutants; the generation, management and disposal of hazardous or toxic chemicals, substances or wastes; and workplace health and safety. Some of our properties have tenants which may use hazardous or toxic substances in the routine course of their businesses. Although we believe that the tenants’ activities involving such materials
7
Table of Contents
comply in all material respects with applicable laws and regulations, the risk of contamination or injury from these materials cannot be completely eliminated. In the event of such contamination or injury, we could be held liable for any damages that result, and any such liability could exceed our resources and our environmental remediation insurance coverage. See “Risk Factors — Risks Related to the Real Estate Industry — We could incur significant costs related to government regulation and private litigation over environmental matters involving the presence, discharge or threat of discharge of hazardous or toxic substances, which could adversely affect our operations, the value of our properties, and our ability to make distributions to you” under Item 1A. below.
In addition, our leases generally provide that (1) the tenant is responsible for all environmental liabilities relating to the tenant’s operations, (2) we are indemnified for such liabilities and (3) the tenant must comply with all environmental laws and regulations. Such a contractual arrangement, however, does not eliminate our statutory liability or preclude claims against us by governmental authorities or persons who are not parties to such an arrangement. Noncompliance with environmental or health and safety requirements may also result in the need to cease or alter operations at a property, which could affect the financial health of a tenant and its ability to make lease payments. In addition, if there is a violation of such a requirement in connection with a tenant’s operations, it is possible that we, as the owner of the property, could be held accountable by governmental authorities for such violation and could be required to correct the violation and pay related fines.
Prior to closing any property acquisition, we obtain environmental assessments in a manner we believe prudent in order to attempt to identify potential environment concerns at such properties. These assessments are carried out in accordance with an appropriate level of due diligence and generally include a physical site inspection, a review of relevant federal, state and local environmental and health agency database records, one or more interviews with appropriate site-related personnel, review of the property’s chain of title and review of historic aerial photographs and other information on past uses of the property. We may also conduct limited subsurface investigations and test for substances of concern where the results of the first phase of the environmental assessments or other information indicates possible contamination or where our consultants recommend such procedures.
While we may purchase our properties on an “as is” basis, all of our purchase contracts contain an environmental contingency clause, which permits us to reject a property because of any environmental hazard at such property. We receive Phase I reports on all prospective properties.
We believe that our properties comply in all material respects with all federal and state regulations regarding hazardous or toxic substances and other environmental matters. However, there can be no assurance that we will not be subject to any liabilities or costs relating to hazardous or toxic substances or other environmental matters. Any substantial unexpected costs or liabilities that we may incur could significantly harm our financial condition and results of operations.
Insurance
We carry comprehensive general liability, fire and extended coverage and loss of rental insurance covering all of the contribution properties under a blanket portfolio policy. We believe the policy specifications and insured limits are adequate given the relative risk of loss, cost of the coverage and standard industry practice. We intend to carry similar insurance with respect to future acquisitions as appropriate. Our headquarters is one of the contribution properties and is located in San Diego, California, which is an area that is more likely to be subject to earthquakes. We presently do not carry earthquake insurance on our headquarters. See “Risk Factors — Risks Related to the Real Estate Industry — Uninsured and underinsured losses could adversely affect our operating results and our ability to make distributions to our stockholders” under Item 1A. below.
8
Table of Contents
Competition
We believe that competition for the acquisition, operation and development of retail shopping centers is highly fragmented. We compete with numerous owners, operators and developers for acquisitions and development of retail shopping centers, including institutional investors, other REITs and other owner-operators of community and neighborhood shopping centers, some of which own or may in the future own properties similar to ours in the same markets in which our properties are located. We also face significant competition in leasing available space to prospective tenants at our operating and development properties. Recent economic conditions have caused a greater than normal amount of space to be available for lease generally and in the markets in which our properties are located. The actual competition for tenants varies depending upon the characteristics of each local market (including current economic conditions) in which we own and manage property. We believe that the principal competitive factors in attracting tenants in our market areas are location, demographics, price, the presence of anchor stores and the appearance of properties.
Our competitors may have substantially greater financial resources than we do and may be able to accept more risk than we can prudently manage. In the future, competition from these entities may reduce the number of suitable investment opportunities offered to us or increase the bargaining power of property owners seeking to sell. Further, as a result of their greater resources, such entities may have more flexibility than we do in their ability to offer rental concessions to attract tenants. If our competitors offer space at rental rates below current market rates, or below the rental rates we currently charge our tenants, we may lose potential tenants and we may be pressured to reduce our rental rates below those we currently charge in order to retain tenants when our tenants’ leases expire.
Foreign Operations
We do not engage in any foreign operations or derive any revenue from foreign sources.
Segment Financial Information
Financial information by segment is presented in Note 15 to the financial statements in Item 8 of this report.
| ITEM 1A. | RISK FACTORS |
Risks Related to Our Properties, Our Business and Our Growth Strategy
Current challenging economic conditions facing us and our tenants may have a material adverse effect on our financial condition and results of operations.
We and our tenants are susceptible to adverse economic developments in the United States. The United States has been in a recession and this challenging economic environment may continue into the future. There can be no assurance that government responses to disruptions in the economy and in the financial markets will restore consumer confidence. General economic factors that are beyond our control, including, but not limited to, the current recession, decreases in consumer confidence, reductions in consumer credit availability, increasing consumer debt levels, rising energy costs, tax rates, increasing business layoffs, downsizing and industry slowdowns, and/or rising inflation, could have a negative impact on the business of our tenants. In turn, this could have a material adverse effect on our business because current or prospective tenants may, among other things (1) have difficulty paying us rent as they struggle to sell goods and services to consumers, (2) be unwilling to enter into or renew leases with us on favorable terms or at all, (3) seek to terminate their existing leases with us or seek downward rental adjustment to such leases or (4) be forced to curtail operations or declare bankruptcy. If this downturn in the national economy were to continue or worsen, the value of our properties, as well as the income we receive from our properties, could be adversely affected. This may have a material adverse effect on our financial condition and results of operations.
9
Table of Contents
The decrease in demand for retail space may have a material adverse effect on our financial condition and results of operations.
Our portfolio of properties consists primarily of retail properties and because we seek to acquire similar properties, a decrease in the demand for retail space may have a greater adverse effect on our business and financial condition than if we owned a more diversified real estate portfolio. The market for retail space has been, and could continue to be, adversely affected by weakness in the national, regional and local economies, the adverse financial condition of some large retailing companies, the ongoing consolidation in the retail sector, the excess amount of retail space in a number of markets and increasing consumer purchases through catalogues or the Internet. Although we will take current economic conditions into account in acquiring properties in the future, our long-term success depends in part on improving economic conditions and the eventual return of a stable and dependable financing market for retail real estate. To the extent that these conditions continue, they are likely to negatively affect market rents for retail space and could materially and adversely affect our financial condition, results of operations, cash flow, the value of our common stock and preferred stock, our ability to satisfy our debt service obligations and our ability to pay distributions on our common stock and preferred stock.
Our expansion strategy may not yield the returns expected, may result in disruptions to our business, may strain our management resources and may adversely affect our operations.
As of December 31, 2010, we had under contract to acquire two properties and were actively negotiating additional potential property acquisitions from our pipeline. This anticipated growth will require substantial attention from our existing management team, which may divert management’s attention from our current properties and impair our relationships with our current tenants and employees. Implementing our growth plan also will require that we expand our management and staff with qualified and experienced personnel and that we implement administrative, accounting and operational systems sufficient to integrate new properties into our portfolio. We also must manage future property acquisitions without incurring unanticipated costs or disrupting the operations at our existing properties. Managing new properties requires a focus on leasing and retaining tenants. If we fail to successfully integrate future acquisitions into our portfolio, or if newly acquired properties fail to perform as we expect, our results of operations, financial condition and ability to pay distributions could suffer.
We may be unable to identify, acquire, develop or operate properties successfully, which could harm our financial condition and ability to pay distributions.
We continue to evaluate the market for available properties and may acquire additional properties when attractive opportunities exist. We may also develop or substantially renovate other properties. Acquisition, development and renovation activities are subject to significant risks, including:
| • | we may be unable to obtain financing on favorable terms, or at all, |
| • | changing market conditions, including competition from others, may diminish our opportunities for acquiring a desired property on favorable terms, or at all. Even if we enter into agreements for the acquisition of properties, these agreements are likely to be subject to customary conditions to closing, including completion of due diligence investigations to our satisfaction, |
| • | we may spend more time or money than we budget to improve or renovate acquired properties or to develop properties, |
| • | we may abandon development activities after expending significant resources, |
| • | we may be unable to quickly and efficiently integrate new properties, particularly if we acquire portfolios of properties, into our existing operations, |
| • | we may fail to obtain the financial results expected from the properties we acquire or develop, making them unprofitable or less profitable than we had expected, |
10
Table of Contents
| • | market and economic conditions may result in higher than expected vacancy rates and lower than expected rental rates, |
| • | when we develop properties, we may encounter delays or refusals in obtaining all necessary zoning, land use, building, occupancy and other required governmental permits and authorizations, |
| • | we may experience difficulty in obtaining any required consents of third parties such as tenants and mortgage lenders, |
| • | acquired and developed properties may have defects we do not discover through our inspection processes, including latent defects that may not reveal themselves until many years after we put a property in service, and |
| • | we may acquire land, properties or entities owning properties which are subject to liabilities and for which, in the case of unknown liabilities, we may have limited or no recourse. |
The realization of any of the above risks could significantly and adversely affect our financial condition, results of operations, cash flow, the value of our common stock and preferred stock, ability to satisfy our debt service obligations and ability to pay distributions.
We may fail to obtain the financial results expected from the properties we acquire or develop, making them unprofitable or less profitable than we had expected.
We expect to acquire and/or develop a number of properties in the near future. In deciding whether to acquire or develop a particular property, we make certain assumptions regarding the expected future performance of that property. If a number of these properties do not perform as expected, such properties may be unprofitable or less profitable than we expected and our financial performance may be adversely affected.
We may not be successful in identifying acquisitions or development projects that meet our investment criteria, which may impede our growth.
Part of our business strategy is expansion through acquisitions and development projects, which requires us to identify acquisition and development candidates that satisfy our investment criteria and are compatible with our growth strategy. We may not be successful in identifying real estate properties or other assets that meet our acquisition or development criteria or in completing acquisitions or developments on satisfactory terms. Failure to identify or complete acquisitions or developments may slow our growth, which may materially adversely affect our operations.
We may suffer economic harm as a result of allocating resources to unprofitable efforts to enter new markets.
Our properties are located in 15 states, and as we grow our business we may expand our operations into markets where we do not currently operate. We may fail to accurately gauge conditions in a new market prior to entering it, and therefore may not achieve our anticipated results in the new market. If this occurs, our cash flow from operations may be adversely affected.
Failure by any major tenant to make rental payments to us, because of a deterioration of its financial condition or otherwise, could seriously harm our performance.
As of December 31, 2010, our two largest retail tenants were Lowe’s Home Centers and Walgreen Co., the scheduled annualized base rents for which represented 7.1% and 6.0%, respectively, of our total retail annualized base rent. As of December 31, 2010, our two largest office tenants were Kaiser Permanente and Swinerton, Inc., the scheduled annualized base rents for which represented 41.6% and 17.6%, respectively, of our total office annualized base rent. Our performance depends on our ability to collect rent from these and other tenants. At any time, our tenants may experience a downturn in their business that may significantly weaken their financial condition, whether as a result of general economic conditions or otherwise. As a result, our tenants may fail to
11
Table of Contents
make rental payments when due under a number of leases, delay a number of lease commencements, decline to extend or renew a number of leases upon expiration, close a number of stores or declare bankruptcy. Any of these actions could result in the termination of the tenant’s leases and the loss of rental income attributable to the terminated leases. In addition, lease terminations by a major tenant or non-owned anchor or a failure by that major tenant or non-owned anchor to occupy the premises could result in lease terminations or reductions in rent by other tenants in the same shopping centers under the terms of some leases. In that event, we may be unable to re-lease the vacated space at attractive rents or at all. Furthermore, because many of our leases are triple-net, the failure of a tenant to make payments could result not only in lost rental income, but also in an increase in our operating expenses. The occurrence of any of the situations described above, particularly if it involves a substantial tenant or non-owned anchor with leases in multiple locations, could seriously harm our performance.
The bankruptcy of a tenant may adversely affect the income produced by and the value of our properties.
The bankruptcy or insolvency of a tenant may adversely affect the income produced by our properties. For example, in January 2009, the anchor tenant of Newport Towne Center, Goody’s Family Clothing, declared bankruptcy, defaulted on its lease and vacated its space. We did not re-lease this vacated space until March 2010. We cannot assure you that any tenant that files for bankruptcy protection will continue to pay rent. If any tenant becomes a debtor in a case under the Bankruptcy Code, we cannot evict the tenant solely because of the bankruptcy. The bankruptcy court also might authorize the tenant to reject and terminate its lease with us, which would generally result in any unpaid, pre-bankruptcy rent being treated as an unsecured claim. An unsecured claim may be paid only to the extent that funds are available and only in the same percentage as is paid to all other holders of unsecured claims. In addition, our claim against the tenant for unpaid, future rent would be subject to a statutory cap equal to the greater of (1) one year of rent or (2) 15% of the remaining rent on the lease (not to exceed three years of rent). This cap might be substantially less than the remaining rent actually owed under the lease. Additionally, a bankruptcy court may require us to turn over to the estate all or a portion of any deposits, amounts in escrow, or prepaid rents. Our claim for unpaid, pre-bankruptcy rent, our lease termination damages and claims relating to damages for which we hold deposits or other amounts that we were forced to repay would likely not be paid in full.
Properties that we acquire may be subject to unknown liabilities that affect the value and profitability of these properties.
As of December 31, 2010, we had under contract to acquire two properties and were actively negotiating additional potential property acquisitions from our pipeline. These properties may be subject to existing liabilities that are unknown at the time we complete this offering or acquire the properties, which could affect such properties’ valuation or revenue potential. Unknown liabilities might include liabilities for cleanup or remediation of undisclosed environmental conditions; claims of tenants, vendors or other persons dealing with the entities prior to this offering (that had not been asserted or threatened prior to this offering); tax liabilities and accrued but unpaid liabilities incurred in the ordinary course of business. The existence of such liabilities could significantly adversely affect the value of the property subject to such liability and our ability to pay distributions on our common stock and preferred stock.
Inflation may adversely affect our financial condition and results of operations.
Many of our leases require the tenant to pay its share of operating expenses, including common area maintenance, real estate taxes and insurance. However, increased inflation may have a more pronounced negative impact on our mortgage and debt interest and general and administrative expenses because these costs could increase at a rate higher than our rents. Also, inflation may adversely affect tenant leases with stated rent increases or limits on such tenant’s obligation to pay its share of operating expenses, which could be lower than the increase in inflation at any given time. For example, certain of our triple-net and bond leases for freestanding retail properties do not include rent escalation clauses and therefore tenants under such leases pay a flat rental rate throughout the life of their lease. Inflation could also have an adverse effect on consumer spending, which may impact our tenants’ sales and, in turn, our average rents.
12
Table of Contents
Our property taxes could increase due to property tax rate changes or reassessment, which may adversely impact our cash flows.
Even if we qualify as a REIT for United States federal income tax purposes, we will be required to pay certain taxes, including state and local taxes on our properties. The real property taxes on our properties may increase as property tax rates change or as our properties are assessed or reassessed by taxing authorities. Therefore, the amount of property taxes we pay in the future may increase substantially. If the property taxes we pay increase, our cash flow would be impacted, and our ability to pay expected dividends to our stockholders may be adversely affected.
Our success depends on key personnel with extensive experience dealing with the commercial real estate industry, and the loss of these key personnel could threaten our ability to operate our business successfully.
Our future success depends, to a significant extent, on the continued services of our management team. In particular, we depend on the efforts of Gary Sabin, our Chairman and Chief Executive Officer, Spencer Plumb, our President and Chief Operating Officer, James Nakagawa, our Chief Financial Officer, Mark Burton, our Chief Investment Officer and Senior Vice President of Acquisitions, and Eric Ottesen, our Senior Vice President and General Counsel. Among the reasons that Messrs. Sabin, Plumb, Nakagawa, Burton and Ottesen are important to our success is that each has a national or regional reputation in the commercial real estate industry based on their extensive experience in running public and private companies, including REITs, devoted to real estate investment, management and development. Each member of our management team has developed informal relationships through past business dealings with numerous members of the commercial real estate community, including current and prospective tenants, lenders, real estate brokers, developers and managers. We expect that their reputations will attract business and investment opportunities before the active marketing of properties and will assist us in negotiations with lenders, existing and potential tenants, and industry personnel. If we lost their services, our relationships with such lenders, existing and prospective tenants, and industry personnel could suffer. We have entered into employment agreements with each of our executive officers, but we cannot guarantee that they will not terminate their employment prior to the end of the term.
Risks Related to the Real Estate Industry
Significant competition may decrease or prevent increases in our properties’ occupancy and rental rates and may reduce our investment opportunities.
We compete with numerous owners, operators and developers for acquisitions and development of retail shopping centers, including institutional investors, other REITs and other owner-operators of community and neighborhood shopping centers, some of which own or may in the future own properties similar to ours in the same submarkets in which our properties are located. We also face significant competition in leasing available space to prospective tenants at our operating properties. Recent economic conditions have caused a greater than normal amount of space to be available for lease generally and in the markets in which our properties are located due to increased tenant delinquencies and/or defaults under leases, generally lower demand for rentable space, as well as potential oversupply of rentable space. In addition, business failures and downsizings have led to reduced consumer demand for retail products and services, which in turn has led to retail business failures or downsizings and reduced demand for retail space. The actual competition for tenants varies depending upon the characteristics of each local market (including current economic conditions) in which we own and manage property. We believe that the principal competitive factors in attracting tenants in our market areas are location, demographics, price, the presence of anchor stores and appearance of properties. Increased competition for tenants may require us to make unbudgeted capital improvements, while decreased occupancy could lower our revenues and cause us to incur expenses on vacant spaces, both of which may reduce cash available to pay distributions on our common stock and preferred stock. Our competitors may have substantially greater financial resources than we do and may be able to accept more risk than we can prudently manage. In the future, competition from these entities may reduce the number of suitable investment opportunities offered to us or increase the bargaining power of property owners seeking to sell. Further, as a result of their greater resources, those entities may have more
13
Table of Contents
flexibility than we do in their ability to offer rental concessions to attract tenants. If our competitors offer space at rental rates below current market rates, or below the rental rates we currently charge our tenants, we may lose potential tenants and we may be pressured to reduce our rental rates below those we currently charge in order to retain tenants when our tenants’ leases expire. As a result, our financial condition, results of operations, cash flow, the value of our common stock and preferred stock, ability to satisfy our debt service obligations and ability to pay distributions on our common stock and preferred stock may be adversely affected. As of December 31, 2010, leases were scheduled to expire in 2011, 2012 and 2013 on a total of approximately 7.3%, 3.6% and 4.9%, respectively, of the gross leasable area of our operating properties.
Uninsured and underinsured losses could adversely affect our operating results and our ability to pay distributions.
We carry comprehensive general liability, fire and extended coverage and loss of rental insurance covering all of our properties under a blanket portfolio policy. We believe the policy specifications and insured limits are adequate given the relative risk of loss, cost of the coverage and standard industry practice. We intend to carry similar insurance with respect to future acquisitions, as appropriate. Our headquarters is located in San Diego, California, which is an area that is more likely to be subject to earthquakes. We presently do not carry earthquake insurance on our headquarters. In the future, we may be unable to renew or duplicate our current insurance coverage in adequate amounts or at reasonable prices. Insurance companies may no longer offer coverage against certain types of losses, such as losses due to terrorist acts, environmental liabilities, or other catastrophic events, or, if offered, the expense of obtaining these types of insurance may not be justified.
If we experience a loss that is uninsured or that exceeds policy limits, we could lose the capital invested in the damaged properties as well as the anticipated future cash flows from those properties. We may choose not to use insurance proceeds to replace a property after it has been damaged or destroyed, if inflation, changes in building codes and ordinances, environmental considerations and other factors make it impractical or undesirable. In addition, if the damaged properties are subject to recourse indebtedness, we would continue to be liable for the indebtedness, even if these properties were irreparably damaged. If any of our properties were to experience a catastrophic loss, it could seriously disrupt our operations, delay revenue and result in large expenses to repair or rebuild the property. Events such as these could adversely affect our results of operations, our ability to meet our obligations and our ability to pay distributions on our common stock and preferred stock.
While we evaluate the credit ratings of each of our insurance companies at the time we enter into or renew our policies, the financial condition of one or more of these insurance companies could significantly deteriorate to the point that they may be unable to pay future insurance claims. This risk has increased as a result of the current economic environment and ongoing disruptions in the financial markets. The inability of any of these insurance companies to pay future claims under our policies may adversely affect our financial condition and results of operations.
Our properties depend on anchor stores or major tenants to attract shoppers and could be adversely affected by the loss of, or a store closure by, one or more of these tenants.
Regional shopping centers are typically anchored by large, nationally recognized tenants. The value of our retail properties with anchor tenants, as well as the value of retail properties we may seek to acquire, could be adversely affected if these tenants fail to comply with their contractual obligations, seek concessions in order to continue operations or cease their operations. Consolidations among large retail establishments typically result in the closure of existing stores or duplicate or geographically overlapping store locations. We will not be able to control the disposition of those large retail establishments following a consolidation, nor will we control the vacant space that is not re-leased to closed stores. Some of our tenants are entitled to modify the terms of their existing leases in the event of such closures. The modification could be unfavorable to us as the lessor and could decrease rents or expense recovery charges. Additionally, major tenant closures may result in decreased customer traffic which could lead to decreased sales at other stores. If the sales of stores operating in our properties were to
14
Table of Contents
decline significantly due to closing of anchors, economic conditions or other reasons, tenants may be unable to pay their minimum rents or expense recovery charges. In the event of default by a tenant or anchor store, we may experience delays and costs in enforcing our rights as landlord to recover amounts due to us under the terms of our agreements with those parties.
Illiquidity of real estate investments may make it difficult for us to sell properties in response to market conditions and could harm our financial condition and ability to make distributions.
Equity real estate investments are relatively illiquid and therefore will tend to limit our ability to vary our portfolio promptly in response to changing economic or other conditions. To the extent the properties are not subject to triple-net leases, some significant expenditures such as real estate taxes and maintenance costs are generally not reduced when circumstances cause a reduction in income from the investment. Should these events occur, our income and funds available for distribution could be adversely affected. Properties subject to triple-net leases may, in certain circumstances, be more illiquid than other properties as they may have been developed to suit the needs of a particular tenant. In addition, as a REIT, we may be subject to a 100% tax on net income derived from the sale of property considered to be held primarily for sale to customers in the ordinary course of our business. We may seek to avoid this tax by complying with certain safe harbor rules that generally limit the number of properties we may sell in a given year, the aggregate expenditures made on such properties prior to their disposition, and how long we retain such properties before disposing of them. However, we can provide no assurance that we will always be able to comply with these safe harbors. If compliance is possible, the safe harbor rules may restrict our ability to sell assets in the future and achieve liquidity that may be necessary to fund distributions. In addition, some of our tenants, including Kaiser Permanente, Lowe’s Home Centers, Publix Supermarkets and Walgreens, have rights of first refusal or rights of first offer to purchase the properties, or portions thereof, in which they lease space in the event that we seek to dispose of such properties, or portions thereof. Bed, Bath & Beyond Inc., a tenant at Gilroy Crossing, has rights of first offer to lease any space in the property that is contiguous with its currently leased space. The presence of these rights of first refusal and rights of first offer could make it more difficult for us to sell these properties, or portions thereof, in response to market conditions.
We may be unable to renew leases, lease vacant space or re-lease space as leases expire, which could adversely affect our business and our ability to pay distributions on our common stock and preferred stock.
If we cannot renew leases, we may be unable to re-lease our properties at rates equal to or above the current rate. Even if we can renew leases, tenants may be able to negotiate lower rates as a result of market conditions. Our properties currently are located in 15 states. The economic condition of each of our markets may be dependent on one or more industries. An economic downturn in one of these industry sectors or in the markets in which our properties are located may result in an increase in tenant bankruptcies, which may harm our performance in the affected market. Economic and market conditions also may affect the ability of our tenants to make lease payments. Market conditions may also hinder our ability to lease vacant space in newly developed properties. In addition, we may enter into or acquire leases for properties with spaces that are uniquely suited to the needs of a particular tenant. Such properties may require renovations, tenant improvements or other concessions in order to lease them to other tenants if the initial leases terminate. Any of these factors could adversely impact our financial condition, results of operations, cash flow, the value of our common stock and preferred stock, our ability to satisfy our debt service obligations and our ability to pay distributions.
We may be unable to secure funds for future tenant or other capital improvements, which could limit our ability to attract or replace tenants and adversely impact our ability to make cash distributions to our stockholders.
When tenants do not renew their leases or otherwise vacate their space, it is common that, in order to attract replacement tenants, we will be required to expend funds for tenant improvements and other concessions related to the vacated space. Such tenant improvements may require us to incur substantial capital expenditures. We may
15
Table of Contents
not be able to fund capital expenditures solely from cash provided from our operating activities because we must distribute at least 90% of our REIT taxable income excluding net capital gains each year to maintain our status as a REIT for United States federal income tax purposes. As a result, our ability to fund tenant and other capital improvements through retained earnings may be limited. If we have insufficient capital reserves, we will have to obtain financing from other sources. We may also have future financing needs for other capital improvements to refurbish or renovate our properties. If we are unable to secure financing on terms we feel are acceptable or at all, we may be unable to make tenant and other capital improvements or we may be required to defer such improvements. If this happens, it may cause one or more of our properties to suffer from a greater risk of obsolescence or a decline in value, as a result of fewer potential tenants being attracted to the property or existing tenants not renewing their leases. If we do not have access to sufficient funding in the future, we may not be able to make necessary capital improvements to our properties, pay other expenses or pay distributions to our stockholders.
We could incur significant costs related to government regulation and private litigation over environmental matters involving the presence, discharge or threat of discharge of hazardous or toxic substances, which could adversely affect our operations, the value of our properties, and our ability to make distributions to you.
Our properties may be subject to environmental liabilities. Under various federal, state and local laws, a current or previous owner, operator or tenant of real estate can face liability for environmental contamination created by the presence, discharge or threat of discharge of hazardous or toxic substances. Liabilities can include the cost to investigate, clean up and monitor the actual or threatened contamination and damages caused by the contamination (or threatened contamination).
The liability under such laws may be strict, joint and several, meaning that we may be liable regardless of whether we knew of, or were responsible for, the presence of the contaminants, and the government entity or private party may seek recovery of the entire amount from us even if there are other responsible parties. Liabilities associated with environmental conditions may be significant and can sometimes exceed the value of the affected property. The presence of hazardous substances on a property may adversely affect our ability to sell or rent that property or to borrow using that property as collateral.
Environmental laws also:
| • | may require the removal or upgrade of underground storage tanks, |
| • | regulate the discharge of storm water, wastewater and other pollutants, |
| • | regulate air pollutant emissions, |
| • | regulate hazardous materials’ generation, management and disposal, and |
| • | regulate workplace health and safety. |
We are unaware of any of our existing tenants or any of the tenants in the properties we intend to acquire violating applicable laws and regulations, but we and our tenants cannot completely eliminate the risk of contamination or injury from these materials. If our properties become contaminated, or if a party is injured, we could be held liable for any damages that result. Such liability could exceed our resources and any environmental remediation insurance coverage we have, which could adversely affect our operations, the value of our properties, and our ability to pay distributions.
Existing conditions at some of our properties may expose us to liability related to environmental matters.
Independent environmental consultants have conducted Phase I or similar environmental site assessments on all of the properties in our portfolio. Each of the site assessments has been completed as part of the due diligence in the acquisition process. Site assessments are intended to discover and evaluate information regarding the
16
Table of Contents
environmental condition of the surveyed property and surrounding properties. These assessments do not generally include subsurface investigations or mold or asbestos surveys. None of the recent site assessments revealed any past or present environmental liability that we believe would have a material adverse effect on our business, assets or results of operations. However, the assessments may have failed to reveal all environmental conditions, liabilities or compliance concerns. Material environmental conditions, liabilities or compliance concerns may have arisen after the review was completed or may arise in the future; and future laws, ordinances or regulations may impose material additional environmental liability.
We cannot assure you that costs of future environmental compliance will not affect our ability to pay distributions or that such costs or other remedial measures will not have a material adverse effect on our business, assets or results of operations.
Our properties may contain asbestos or develop harmful mold, which could lead to liability for adverse health effects and costs of remediating the problem, which could adversely affect the value of the affected property and our ability to pay distributions on our common stock and preferred stock.
We are required by federal regulations with respect to our properties to identify and warn, via signs and labels, of potential hazards posed by workplace exposure to installed asbestos-containing materials, or ACMs, and potential ACMs. We may be subject to an increased risk of personal injury lawsuits by workers and others exposed to ACMs and potential ACMs at our properties as a result of these regulations. The regulations may affect the value of any of our properties containing ACMs and potential ACMs. Federal, state and local laws and regulations also govern the removal, encapsulation, disturbance, handling and/or disposal of ACMs and potential ACMs when such materials are in poor condition or in the event of construction, remodeling, renovation or demolition of a property.
When excessive moisture accumulates in buildings or on building materials, mold growth may occur, particularly if the moisture problem remains undiscovered or is not addressed over a period of time. Some molds may produce airborne toxins or irritants. Concern about indoor exposure to mold has been increasing because exposure to mold may cause a variety of adverse health effects and symptoms, including allergic or other reactions.
The presence of ACMs or significant mold at any of our properties could require us to undertake a costly remediation program to contain or remove the ACMs or mold from the affected property. In addition, the presence of ACMs or significant mold could expose us to liability to our tenants, their or our employees, and others if property damage or health concerns arise.
Compliance with the Americans with Disabilities Act and similar laws may require us to make significant unanticipated expenditures.
Our properties are required to comply with the Americans with Disabilities Act of 1990, or the ADA. The ADA requires that all public accommodations must meet federal requirements related to access and use by disabled persons. We believe that our properties were built in substantial conformance with the building codes of their respective cities, including in substantial compliance with the applicable ADA requirements at the time of construction. If one or more properties is not in compliance with the ADA, then we would be required to bring the non-compliant properties into compliance. Compliance with the ADA could require removing access barriers. Non-compliance could result in imposition of fines by the U.S. government or an award of damages and/or attorneys’ fees to private litigants, or both. Additional federal, state and local laws also may require us to modify properties or could restrict our ability to renovate properties. Complying with the ADA or other legislation at non-compliant properties could be very expensive. If we incur substantial costs to comply with such laws, our financial condition, results of operations, cash flow, the value of our common stock and preferred stock, our ability to satisfy our debt service obligations and our ability to pay distributions on our common stock and preferred stock could be adversely affected.
17
Table of Contents
We may incur significant unexpected costs to comply with fire, safety and other regulations, which could adversely impact our financial condition, results of operations, and ability to pay distributions on our common stock and preferred stock.
Our properties are subject to various federal, state and local regulatory requirements, such as state and local fire and safety requirements, building codes and land use regulations. If we fail to comply with these requirements, we could be subject to governmental fines or private damage awards. We believe that our properties are currently in material compliance with all applicable regulatory requirements. However, we do not know whether existing requirements will change or whether future requirements, including any requirements that may emerge from pending or future climate change legislation, will require us to make significant unanticipated expenditures that will adversely impact our financial condition, results of operations, cash flow, the value of our common stock and preferred stock, our ability to satisfy our debt service obligations and our ability to pay distributions.
Litigation may result in unfavorable outcomes.
Like many real estate operators, we may be involved in lawsuits involving premises liability claims and alleged violations of landlord-tenant laws, which may give rise to class action litigation or governmental investigations. Any material litigation not covered by insurance, such as a class action, could result in us incurring substantial costs, harm our financial condition, results of operations, cash flow and ability to pay distributions.
Risks Related to Our Organizational Structure
Conflicts of interest could result in our management acting other than in our stockholders’ best interests.
Conflicts of interest exist or could arise in the future as a result of the relationships between us and our affiliates, on the one hand, and our operating partnership or any partner thereof, on the other. Our directors and officers have duties under applicable Maryland law to manage us in a manner consistent with the best interests of our stockholders. At the same time, we, as the general partner of our operating partnership, have fiduciary duties to manage our operating partnership in a manner beneficial to our operating partnership and its partners. Our duties, as general partner to our operating partnership and its limited partners, therefore, may come into conflict with the duties of our directors and officers to our stockholders. We are under no obligation to give priority to the separate interests of the limited partners of our operating partnership or our stockholders in deciding whether to cause the operating partnership to take or decline to take any actions. The limited partners of our operating partnership expressly acknowledge that, as the general partner of our operating partnership, we are acting for the benefit of the operating partnership, the limited partners and our stockholders collectively.
We may choose not to enforce, or to enforce less vigorously, our rights under contribution and other agreements because of conflicts of interest with certain of our directors and officers. Messrs. Sabin, Plumb, Nakagawa, Burton, Ottesen and Romney and other individuals and entities not affiliated with us or our management had ownership interests in the properties contributed to our operating partnership in our formation transactions. Under the agreements relating to the contribution of those interests, we are entitled to indemnification and damages in the event of breaches of representations or warranties made by the members of our management and other contributors. In addition, certain members of senior management have entered into employment agreements with us pursuant to which they have agreed to devote substantially all of their business time to our affairs. None of these contribution and employment agreements were negotiated on an arm’s length basis. We may choose not to enforce, or to enforce less vigorously, our rights under these contribution and employment agreements because of our desire to maintain our ongoing relationships with the individuals involved.
Members of our executive management team have outside business interests that could require time and attention. Members of our executive management team own interests in properties that have not been contributed to us. In some cases, one or more of these individuals or their affiliates will have
18
Table of Contents
management and fiduciary obligations that may conflict with that person’s responsibilities as an officer of our company and may adversely affect our operations. For example, Mr. Sabin and certain of our senior management team own and manage various properties that have not been contributed to us.
Certain of our directors and officers may face adverse tax consequences that could prevent the repayment of indebtedness. The repayment of indebtedness relating to our Excel Centre property will have different effects on holders of operating partnership units than on our stockholders. The parties that contributed this property to our operating partnership would incur adverse tax consequences upon the repayment of related debt that differ from the tax consequences to us and our stockholders. Consequently, these holders of operating partnership units, including Messrs. Sabin, Nakagawa, Burton and Ottesen, may have different objectives regarding the appropriate timing of any such repayment of debt. Certain of our directors and officers could exercise their influence in a manner inconsistent with the interests of some, or a majority, of our stockholders, including in a manner which could delay or prevent the repayment of indebtedness.
Our charter, bylaws and Maryland law contain provisions that may delay, defer or prevent a change of control transaction and may prevent our stockholders from receiving a premium for their shares.
Our charter contains ownership limits that may delay, defer or prevent a change of control transaction. Our charter, with certain exceptions, authorizes our directors to take such actions as are necessary and desirable to preserve our qualification as a REIT. In addition, our charter contains certain restrictions on ownership and transfer of our capital stock which prohibit any person, unless exempted by our board of directors, from, among other things, acquiring or holding, directly or indirectly, (1) in excess of 9.8% in value of the aggregate of our outstanding shares of capital stock, (2) common stock in excess of 9.8% (in value or in number of shares, whichever is more restrictive) of our outstanding shares of common stock or (3) Series A preferred stock in excess of 9.8% (in value or in number of shares, whichever is more restrictive) of our outstanding shares of Series A preferred stock. Among other restrictions, the board may not grant such an exemption to any proposed transferee whose ownership of in excess of the applicable ownership limit would result in us failing to qualify as a REIT. These restrictions on transferability and ownership will not apply if our board of directors determines that it is no longer in our best interests to attempt to qualify as a REIT. The ownership limits may delay or impede a transaction or a change of control that might involve a premium price for our common stock or otherwise be in the best interests of our stockholders.
We could authorize and issue stock without stockholder approval that may delay, defer or prevent a change of control transaction. Our charter authorizes us to issue additional authorized but unissued shares of our common stock or preferred stock. In addition, our board of directors may classify or reclassify any unissued shares of our common stock or preferred stock and may set the preferences, rights and other terms of the classified or reclassified shares. Our board of directors may also, without stockholder approval, amend our charter to increase the authorized number of shares of our common stock or preferred stock that we may issue. The board of directors could establish a series of common stock or preferred stock that could, depending on the terms of such series, delay, defer or prevent a transaction or a change of control that might involve a premium price for our common stock or otherwise be in the best interests of our stockholders.
Certain provisions of Maryland law could delay, defer or prevent a change of control transaction. Certain provisions of the Maryland General Corporation Law, or MGCL, may have the effect of inhibiting a third party from making a proposal to acquire us or of impeding a change of control. In some cases, such an acquisition or change of control could provide you with the opportunity to realize a premium over the then-prevailing market price of your shares. These MGCL provisions include:
| • | “business combination” provisions that, subject to limitations, prohibit certain business combinations between us and an “interested stockholder” for certain periods. An “interested |
19
Table of Contents
| stockholder” is generally any person who beneficially owns 10% or more of the voting power of our shares or an affiliate or associate of ours who, at any time within the two-year period prior to the date in question, was the beneficial owner of 10% or more of the voting power of our then outstanding voting stock. A person is not an interested stockholder under the statute if our board of directors approved in advance the transaction by which he otherwise would have become an interested stockholder. Business combinations with an interested stockholder are prohibited for five years after the most recent date on which the stockholder becomes an interested stockholder. After that period, the MGCL imposes two super-majority voting requirements on such combinations, and |
| • | “control share” provisions that provide that “control shares” of our company acquired in a “control share acquisition” have no voting rights unless holders of two-thirds of our voting stock (excluding interested shares) consent. “Control shares” are shares that, when aggregated with other shares controlled by the stockholder, entitle the stockholder to exercise one of three increasing ranges of voting power in electing directors. A “control share acquisition” is the direct or indirect acquisition of ownership or control of “control shares” from a party other than the issuer. |
In the case of the business combination provisions of the MGCL, we opted out by resolution of our board of directors. In the case of the control share provisions of the MGCL, we opted out pursuant to a provision in our bylaws. However, our board of directors may by resolution elect to opt in to the business combination provisions of the MGCL. Further, we may opt in to the control share provisions of the MGCL in the future by amending our bylaws, which our board of directors can do without stockholder approval.
Maryland law, and our charter and bylaws also contain other provisions that may delay, defer or prevent a transaction or a change of control that might involve a premium price for our common stock or otherwise be in the best interest of our stockholders. See “Restrictions on Ownership and Transfer” and “Certain Provisions of Maryland Law and of Our Charter and Bylaws.”
The ability of our board of directors to revoke our REIT status without stockholder approval may cause adverse consequences to our stockholders.
Our charter provides that our board of directors may revoke or otherwise terminate our REIT election, without the approval of our stockholders, if it determines that it is no longer in our best interest to continue to qualify as a REIT. If we cease to be a REIT, we would become subject to United States federal income tax on our taxable income and would no longer be required to distribute most of our taxable income to our stockholders, which may have adverse consequences on our total return to our stockholders.
Our board of directors may amend our investing and financing guidelines without stockholder approval, and, accordingly, you would have limited control over changes in our policies that could increase the risk we default under our debt obligations or that could harm our business, results of operations and share price.
Although we are not required to maintain any particular leverage ratio, we intend, when appropriate, to employ prudent amounts of leverage and to use debt as a means of providing additional funds for the acquisition of our target assets and the diversification of our portfolio. Our board of directors has adopted long-term guidelines of limiting our indebtedness to 40% of our gross undepreciated asset value. However, our organizational documents do not limit the amount or percentage of debt that we may incur, nor do they limit the types of properties we may acquire or develop. The amount of leverage we will deploy for particular investments in our target assets will depend upon our management team’s assessment of a variety of factors, which may include the anticipated liquidity and price volatility of the target assets in our investment portfolio, the potential for losses, the availability and cost of financing the assets, our opinion of the creditworthiness of our financing counterparties, the health of the U.S. economy and commercial mortgage markets, our outlook for the level,
20
Table of Contents
slope and volatility of interest rates, the credit quality of our target assets and the collateral underlying our target assets. Our board of directors may alter or eliminate our current guidelines on borrowing or investing at any time without stockholder approval. Changes in our strategy or in our investment or leverage guidelines could expose us to greater credit risk and interest rate risk and could also result in a more leveraged balance sheet. These factors could result in an increase in our debt service and could adversely affect our cash flow and our ability to make expected distributions to you. Higher leverage also increases the risk we would default on our debt.
Our rights and the rights of our stockholders to take action against our directors and officers are limited.
Maryland law provides that a director or officer has no liability in that capacity if he or she performs his or her duties in good faith, in a manner he or she reasonably believes to be in our best interests and with the care that an ordinarily prudent person in a like position would use under similar circumstances. As permitted by the MGCL, our charter limits the liability of our directors and officers to us and our stockholders for money damages, except for liability resulting from:
| • | actual receipt of an improper benefit or profit in money, property or services, or |
| • | active and deliberate dishonesty established by a final judgment and which is material to the cause of action. |
In addition, our charter authorizes us to obligate our company, and our bylaws will require us, to indemnify and pay or reimburse our present and former directors and officers for actions taken by them in those capacities to the maximum extent permitted by Maryland law. As a result, we and our stockholders may have more limited rights against our directors and officers than might otherwise exist under common law. Accordingly, in the event that actions taken in good faith by any of our directors or officers impede the performance of our company, your ability to recover damages from such director or officer will be limited.
We may invest in properties with other entities, and our lack of sole decision-making authority or reliance on a co-venturer’s financial condition could make these joint venture investments risky.
We may co-invest in the future with third parties through partnerships, joint ventures or other entities. We may acquire non-controlling interests or share responsibility for managing the affairs of a property, partnership, joint venture or other entity. In such events, we would not be in a position to exercise sole decision-making authority regarding the property or entity. Investments in entities may, under certain circumstances, involve risks not present were a third party not involved. These risks include the possibility that partners or co-venturers:
| • | might become bankrupt or fail to fund their share of required capital contributions, |
| • | may have economic or other business interests or goals that are inconsistent with our business interests or goals, and |
| • | may be in a position to take actions contrary to our policies or objectives. |
Such investments may also have the potential risk of impasses on decisions, such as a sale, because neither we nor the partner or co-venturer would have full control over the partnership or joint venture. Disputes between us and partners or co-venturers may result in litigation or arbitration that would increase our expenses and prevent our officers and/or directors from focusing their time and effort on our business. Actions of partners or co-venturers may cause losses to our investments and adversely affect our ability to qualify as a REIT. In addition, we may in certain circumstances be liable for the actions of our third-party partners or co-venturers if:
| • | we structure a joint venture or conduct business in a manner that is deemed to be a general partnership with a third party, in which case we could be liable for the acts of that third party, |
| • | third-party managers incur debt or other liabilities on behalf of a joint venture which the joint venture is unable to pay, and the joint venture agreement provides for capital calls, in which case we could be liable to make contributions as set forth in any such joint venture agreement, or |
21
Table of Contents
| • | we agree to cross-default provisions or to cross-collateralize our properties with the properties in a joint venture, in which case we could face liability if there is a default relating to those properties in the joint venture or the obligations relating to those properties. |
Risks Related to Our Capital Structure
Debt obligations expose us to increased risk of property losses and default under our debt obligations, which could have adverse consequences on our business operations and our ability to pay distributions.
As of December 31, 2010, our outstanding mortgage indebtedness was approximately $137.0 million, and we may incur significant additional debt to finance future acquisition and development activities. We also had $94.1 million outstanding or committed under our $125.0 million unsecured revolving credit facility, which includes a $12.1 letter of credit issued under the facility. The capacity of the credit facility may be increased by up to an additional $275.0 million to $400.0 million, subject to receipt of lender commitments and other conditions precedent.
Although our organizational documents do not require us to maintain any particular leverage ratio, we intend, when appropriate, to employ prudent amounts of leverage and to use debt as a means of providing additional funds for the acquisition of our target assets and the diversification of our portfolio. Our board of directors has adopted long-term guidelines of limiting our indebtedness to 40% of our gross undepreciated asset value. However, our organizational documents do not limit the amount or percentage of debt that we may incur, nor do they limit the types of properties we may acquire or develop. The amount of leverage we will deploy for particular investments in our target assets will depend upon our management team’s assessment of a variety of factors, which may include the anticipated liquidity and price volatility of the target assets in our investment portfolio, the potential for losses, the availability and cost of financing the assets, our opinion of the creditworthiness of our financing counterparties, the health of the U.S. economy and commercial mortgage markets, our outlook for the level, slope and volatility of interest rates, the credit quality of our target assets and the collateral underlying our target assets. Our board of directors may alter or eliminate our current guidelines on borrowing or investing at any time without stockholder approval. Changes in our strategy or in our investment or leverage guidelines could expose us to greater credit risk and interest rate risk and could also result in a more leveraged balance sheet. These factors could result in an increase in our debt service and could adversely affect our cash flow and our ability to make expected distributions to you. Higher leverage also increases the risk we would default on our debt.
We have used and will continue to use debt to finance property acquisitions. Our use of debt may have adverse consequences, including the following:
| • | Required payments of principal and interest may be greater than our cash flow from operations. |
| • | We may be forced to dispose of one or more of our properties, possibly on disadvantageous terms, to make payments on our debt. |
| • | If we default on our debt obligations, the lenders or mortgagees may foreclose on our properties that secure those loans. Further, if we default under a mortgage loan, we will automatically be in default on any other loan that has cross-default provisions, and we may lose the properties securing all of these loans. |
| • | A foreclosure on one of our properties will be treated as a sale of the property for a purchase price equal to the outstanding balance of the secured debt. If the outstanding balance of the secured debt exceeds our tax basis in the property, we would recognize taxable income on foreclosure without realizing any accompanying cash proceeds to pay the tax (or to make distributions based on REIT taxable income). |
| • | We may not be able to refinance or extend our existing debt. If we cannot repay, refinance or extend our debt at maturity, in addition to our failure to repay our debt, we may be unable to pay distributions on our common stock and preferred stock at expected levels or at all. |
22
Table of Contents
| • | Even if we are able to refinance or extend our existing debt, the terms of any refinancing or extension may not be as favorable as the terms of our existing debt. If the refinancing involves a higher interest rate, it could adversely affect our cash flow and ability to pay distributions on our common stock and preferred stock. |
If any one of the above were to occur, our financial condition, results of operations, cash flow, cash available for distribution to you, the value of our common stock and preferred stock and our ability to satisfy our debt service obligations could be materially adversely affected.
Our unsecured revolving credit facility contains restrictive covenants relating to our operations, which could limit our ability to respond to changing market conditions and our ability to pay distributions.
Our unsecured revolving credit facility imposes restrictions on us that affect our distribution and operating policies and our ability to incur additional debt. For example, we are subject to a maximum leverage ratio (defined as total liabilities to total asset value) of (1) 0.60 : 1.00, until the earlier of (a) an equity issuance of common stock or preferred stock by us with gross proceeds of at least $75.0 million to $125.0 million, depending on our property holdings, and (b) December 31, 2011, and (2) 0.55 : 1.00 at any time thereafter during the term of the loan, which could have the effect of reducing our ability to incur additional debt and consequently reduce our ability to pay distributions. The unsecured revolving credit facility also contains limitations on our ability to pay distributions. Specifically, our cash dividends may not exceed the greater of (1)(a) during the period from October 1, 2010 to June 30, 2011, 110% of our funds from operations, and (b) beginning on July 1, 2011, 95% of our funds from operations, and (2) the amount required for us to qualify and maintain our REIT status. If an event of default exists, we may only make distributions sufficient to qualify and maintain our REIT status. In addition, the revolving credit facility contains customary restrictive covenants requiring us to maintain a minimum fixed charge coverage ratio, a maximum secured indebtedness ratio, a maximum unencumbered leverage ratio, a minimum unencumbered interest coverage ratio and a minimum tangible net worth. These or other limitations may adversely affect our flexibility and our ability to achieve our operating plans and could result in us being limited in the amount of dividends we would be permitted to pay on our common stock and preferred stock.
Recent disruptions in the financial markets and the downturn of the broader U.S. economy could affect our ability to obtain debt financing on reasonable terms or at all and have other adverse effects on us.
The U.S. credit markets in particular continue to experience significant dislocations and liquidity disruptions which have caused the spreads on prospective debt financings to widen considerably. These circumstances have materially impacted liquidity in the debt markets, making financing terms for borrowers less attractive, and in certain cases have resulted in the unavailability of certain types of debt financing. Continued uncertainty in the credit markets may negatively impact our ability to access additional debt financing or to refinance existing debt maturities on reasonable terms (or at all), which may negatively affect our ability to conduct operations, make acquisitions and fund current and future development and redevelopment projects. In addition, the financial position of the lenders under our credit facilities may worsen to the point that they default on their obligations to make available to us the funds under those facilities. A prolonged downturn in the credit markets may cause us to seek alternative sources of potentially less attractive financing, and may require us to adjust our business plan accordingly. In addition, these factors may make it more difficult for us to sell properties or may adversely affect the price we receive for properties that we do sell, as prospective buyers may experience increased costs of debt financing or difficulties in obtaining debt financing. These events in the credit markets have also had an adverse effect on other financial markets in the United States and globally, including the stock markets, which may make it more difficult or costly for us to raise capital through the issuance of common stock, preferred stock or other equity securities.
23
Table of Contents
We may engage in hedging transactions, which can limit our gains and increase exposure to losses.
Subject to the requirements for maintaining our qualification as a REIT, we may enter into hedging transactions to protect us from the effects of interest rate fluctuations on floating rate debt. Our hedging transactions may include entering into interest rate swap agreements or interest rate cap or floor agreements, or other interest rate exchange contracts. Hedging activities may not have the desired beneficial impact on our results of operations or financial condition. No hedging activity can completely insulate us from the risks associated with changes in interest rates. Moreover, interest rate hedging could fail to protect us or adversely affect us because, among other things:
| • | available interest rate hedging may not correspond directly with the interest rate risk for which we seek protection, |
| • | the duration of the hedge may not match the duration of the related liability, |
| • | the party owing money in the hedging transaction may default on its obligation to pay, |
| • | the credit quality of the party owing money on the hedge may be downgraded to such an extent that it impairs our ability to sell or assign our side of the hedging transaction, and |
| • | the value of derivatives used for hedging may be adjusted from time to time in accordance with accounting rules to reflect changes in fair value, such downward adjustments, or “mark-to-market losses,” which would reduce our stockholders’ equity. |
Hedging involves risk and typically involves costs, including transaction costs, that may reduce our overall returns on our investments. These costs increase as the period covered by the hedging increases and during periods of rising and volatile interest rates. These costs will also limit the amount of cash available for distribution to stockholders. We generally intend to hedge as much of the interest rate risk as management determines is in our best interests given the cost of such hedging transactions. The REIT qualification rules may limit our ability to enter into hedging transactions by requiring us to limit our income from non-qualifying hedges. If we are unable to hedge effectively because of the REIT rules, we will face greater interest rate exposure than may be commercially prudent.
Increases in interest rates could increase the amount of our debt payments and adversely affect our ability to pay distributions to our stockholders.
Interest we pay could reduce cash available for distributions. As of December 31, 2010, we had $12.0 million of variable rate mortgage debt outstanding and $94.1 million of debt and commitments outstanding under our revolving credit facility, which includes a $12.1 million letter of credit issued under the facility. Our revolving credit facility bears interest at the rate of LIBOR plus a margin of 275 basis points to 400 basis points, depending on our leverage ratio, provided that in no event will LIBOR be deemed to be less than 1.5%. We may incur variable rate debt in the future, including mortgage debt and amounts under our revolving credit facility. Any increase in interest rates would increase our interest costs with respect to our variable rate debt. These increased interest costs would reduce our cash flows and our ability to make distributions to you. In addition, if we need to repay existing debt during a period of rising interest rates, we could be required to liquidate one or more of our investments in properties at times that may not permit realization of the maximum return on such investments.
If we fail to obtain external sources of capital, which is outside of our control, we may be unable to pay distributions to our stockholders, maintain our REIT status, or fund growth.
In order to maintain our status as a REIT and to avoid incurring a nondeductible excise tax, we are required, among other things, to distribute annually at least 90% of our REIT taxable income, excluding any net capital gain. In addition, we will be subject to income tax at regular corporate rates to the extent that we distribute less than 100% of our REIT taxable income, including any net capital gains. Because of these distribution
24
Table of Contents
requirements, we may not be able to fund future capital needs, including any necessary acquisition financing, from operating cash flow. Consequently, we rely on third-party sources to fund our capital needs. We may not be able to obtain financings on favorable terms or at all. Our access to third-party sources of capital depends, in part, on:
| • | general market conditions, |
| • | the market’s perception of our growth potential, |
| • | with respect to acquisition financing, the market’s perception of the value of the properties to be acquired, |
| • | our current debt levels, |
| • | our current and expected future earnings, |
| • | our cash flow and cash distributions, and |
| • | the market price per share of our common stock. |
It will adversely affect our business and limit our growth if we are unable to obtain capital from third-party sources. Without sufficient capital, we may not be able to acquire or develop properties when strategic opportunities exist, satisfy our debt service obligations or make the cash distributions to our stockholders necessary to maintain our qualification as a REIT.
Risks Related to Our REIT Status
Our failure to qualify as a REIT under the Code would result in significant adverse tax consequences to us and would adversely affect our business and the value of our common stock and preferred stock.
We believe that we have operated and intend to continue operating in a manner that will allow us to qualify as a REIT for United States federal income tax purposes under the Internal Revenue Code of 1986, as amended, or the Code, commencing with our taxable year ended December 31, 2010. Qualification as a REIT involves the application of highly technical and complex Code provisions, for which there are only limited judicial and administrative interpretations. The fact that we hold substantially all of our assets through a partnership further complicates the application of the REIT requirements. Even a seemingly minor technical or inadvertent mistake could jeopardize our REIT status. Our REIT status depends upon various factual matters and circumstances that may not be entirely within our control. For example, in order to qualify as a REIT, at least 95% of our gross income in any year must be derived from qualifying sources, such as rents from real property, and we must satisfy a number of requirements regarding the composition of our assets. Also, we must make distributions to stockholders aggregating annually at least 90% of our REIT taxable income, excluding net capital gains. In addition, new legislation, regulations, administrative interpretations or court decisions, each of which could have retroactive effect, may make it more difficult or impossible for us to qualify as a REIT, or could reduce the desirability of an investment in a REIT relative to other investments. We have not requested and do not plan to request a ruling from the Internal Revenue Service, or IRS, that we qualify as a REIT, and the statements in this offering memorandum are not binding on the IRS or any court. Accordingly, we cannot be certain that we will be successful in qualifying as a REIT.
If we fail to qualify as a REIT in any taxable year, we will face serious adverse tax consequences that would substantially reduce the funds available to distribute to you. If we fail to qualify as a REIT:
| • | we would not be allowed to deduct distributions to stockholders in computing our taxable income and would be subject to United States federal income tax at regular corporate rates, |
| • | we could also be subject to the United States federal alternative minimum tax and possibly increased state and local taxes, and |
| • | unless we are entitled to relief under applicable statutory provisions, we could not elect to be taxed as a REIT for four taxable years following the year in which we were disqualified. |
25
Table of Contents
In addition, if we fail to qualify as a REIT, we will not be required to make distributions to stockholders. As a result of all these factors, our failure to qualify as a REIT could impair our ability to expand our business and raise capital and would adversely affect the value of our common stock and preferred stock.
To maintain our REIT status, we may be forced to borrow funds during unfavorable market conditions to pay distributions to our stockholders.
To qualify as a REIT, we must distribute to our stockholders at least 90% of our REIT taxable income each year, excluding any net capital gain, and we will be subject to regular corporate income taxes to the extent that we distribute less than 100% of our REIT taxable income each year. In addition, we will be subject to a 4% nondeductible excise tax on the amount, if any, by which distributions paid by us in any calendar year are less than the sum of 85% of our ordinary income, 95% of our capital gain net income and 100% of our undistributed income from prior years. To maintain our REIT status and avoid the payment of income and excise taxes we may need to borrow funds to meet the REIT distribution requirements. These borrowing needs could result from:
| • | differences in timing between the actual receipt of cash and inclusion of income for United States federal income tax purposes, |
| • | the effect of non-deductible capital expenditures, |
| • | the creation of reserves, or |
| • | required debt or amortization payments. |
We may need to borrow funds at times when the then-prevailing market conditions are not favorable for borrowing. These borrowings could increase our costs or reduce our equity and adversely affect the value of our common stock and preferred stock.
Dividends payable by REITs do not qualify for the reduced tax rates available for some dividends.
The maximum tax rate applicable to income from “qualified dividends” payable to U.S. stockholders that are individuals, trusts and estates is 15% through the end of 2012. Dividends payable by REITs, however, generally are not eligible for this 15% rate. Although these rules do not adversely affect the taxation of REITs or dividends payable by REITs, the more favorable rates applicable to regular corporate qualified dividends could cause investors who are individuals, trusts and estates to perceive investments in REITs to be relatively less attractive than investments in the stocks of non-REIT corporations that pay dividends, which could adversely affect the value of the shares of REITs, including the value of our common stock and preferred stock.
Complying with REIT requirements may limit our ability to hedge effectively and may cause us to incur tax liabilities.
The REIT provisions of the Code limit our ability to hedge our liabilities. Any income from a hedging transaction we enter into to manage risk of interest rate changes, price changes or currency fluctuations with respect to borrowings made or to be made to acquire or carry real estate assets does not constitute “gross income” for purposes of the 75% or 95% gross income tests applicable to REITs . In addition, such hedging transactions must be properly identified as provided in the Treasury regulations. If we enter into other types of hedging transactions, the income from those transactions is likely to be treated as non-qualifying income for purposes of the gross income tests applicable to REITs. As a result of these rules, we may need to limit our use of advantageous hedging techniques or implement those hedges through a taxable REIT subsidiary, or TRS. This could increase the cost of our hedging activities because our TRS would be subject to tax on gains or expose us to greater risks associated with changes in interest rates than we would otherwise want to bear.
26
Table of Contents
The tax imposed on REITs engaging in “prohibited transactions” may limit our ability to engage in transactions which would be treated as sales for United States federal income tax purposes.
A REIT’s net income from prohibited transactions is subject to a 100% penalty tax. In general, prohibited transactions are sales or other dispositions of property, other than foreclosure property held in inventory primarily for sale to customers in the ordinary course of business. Although we do not intend to hold any properties that would be characterized as inventory held for sale to customers in the ordinary course of our business, unless the sale or disposition of a property qualifies under certain statutory safe harbors, such characterization is a factual determination and no guarantee can be given that the IRS would agree with our characterization of our properties or that we will always be able to make use of the available safe harbors.
To maintain our REIT status, we may be forced to forego otherwise attractive opportunities.
To qualify as a REIT, we must satisfy tests concerning, among other things, the sources of our income, the nature and diversification of our assets, the amounts we distribute to our stockholders and the ownership of our stock. We may be required to make distributions to stockholders at times when it would be more advantageous to reinvest cash in our business or when we do not have funds readily available for distribution. Thus, compliance with the REIT requirements may hinder our ability to operate solely on the basis of maximizing profits.
In particular, we must ensure that at the end of each calendar quarter, at least 75% of the value of our assets consists of cash, cash items, government securities and qualified real estate assets. The remainder of our investment in securities (other than government securities, securities of any TRS or qualified REIT subsidiary of ours and securities that are qualified real estate assets) generally may not include more than 10% of the outstanding voting securities of any one issuer or more than 10% of the total value of the outstanding securities of any one issuer. In addition, in general, no more than 5% of the value of our assets (other than government securities, securities of any TRS or qualified REIT subsidiary of ours and securities that are qualified real estate assets) may consist of the securities of any one issuer. If we fail to comply with these requirements at the end of any calendar quarter, we must remedy the failure within 30 days or qualify for certain limited statutory relief provisions to avoid losing status as a REIT. As a result, we may be required to liquidate otherwise attractive investments. These actions could have the effect of reducing our income and amounts available for distribution to our stockholders.
We may be subject to adverse legislative or regulatory tax changes that could increase our tax liability, reduce our operating flexibility and reduce the market price of our common shares.
At any time, the United States federal income tax laws governing REITs may be amended or the administrative and judicial interpretations of those laws may be changed. We cannot predict when or if any new United States federal income tax law, regulation, or administrative and judicial interpretation, or any amendment to any existing United States federal income tax law, regulation or administrative or judicial interpretation, will be adopted, promulgated or become effective, and any such law, regulation, or interpretation may be effective retroactively. We and our stockholders could be adversely affected by any such change in, or any new, United States federal income tax law, regulation or administrative and judicial interpretation.
Risks Related to Our Mortgage Receivable
We may not be able to recover our investment in our mortgage receivable which may result in a significant loss to us.
From time to time, we may invest in mortgage receivables. At December 31, 2010, we had one investment in a $2.0 million mortgage receivable. Our investments in mortgage receivables normally are not insured or otherwise guaranteed by any institution or agency. In the event of default by a borrower, it may be necessary for us to foreclose our mortgage or engage in costly negotiations. Delays in liquidating defaulted mortgage loans and repossessing and selling the underlying properties could reduce our investment returns. Furthermore, in the event
27
Table of Contents
of default, the actual value of the property securing the mortgage may decrease. A decline in real estate values will adversely affect the value of our loans and the value of the mortgages securing our loans.
Our mortgage receivables may be or become subordinated to mechanics’ or materialmen’s liens or property tax liens. In these instances, we may need to protect a particular investment by making payments to maintain the current status of a prior lien or discharge it entirely. In these cases, the total amount we recover may be less than our total investment, resulting in a loss and our mortgage receivables may be materially and adversely affected.
| ITEM 1B. | UNRESOLVED STAFF COMMENTS |
None.
| ITEM 2. | PROPERTIES |
Our Properties
As of December 31, 2010, we owned a portfolio consisting of 20 retail properties totaling approximately 2.5 million square feet of gross leasable area, which were approximately 93.3% leased and had a weighted average age of approximately five years, based on gross leasable area. In addition, we own one commercial office property totaling 82,157 square feet of gross leasable area, which was 100% leased as of December 31, 2010. We utilize a portion of this commercial building as our headquarters. We also own two land parcels comprising approximately 31 acres slated for retail development and a 50% consolidated joint venture in a property currently being redeveloped. In addition, as of March 7, 2011, we had under contract to acquire two properties from our pipeline having an aggregate purchase price of approximately $92.1 million.
Operating Properties
The table below sets forth relevant information with respect to the operating properties in our portfolio as of December 31, 2010.
| Property/Location |
Year Built(1) |
Total GLA(2) |
Percent Leased |
Number of Tenants |
Major |
Major Lease Expiration Date |
Annualized Base Rent(4) ($ in 000s) |
|||||||||||||||||||
| Retail Properties |
||||||||||||||||||||||||||
| Park West Place, Stockton, CA |
2005 | 597,787 | (5) | 99.7 | % | 53 | Lowe’s* | 2026 | $ | 7,203 | ||||||||||||||||
| Vestavia Hills City Center, Vestavia Hills, AL |
2002 | 378,805 | 76.6 | 52 | Rave Motion Pictures* | 2022 | 3,806 | |||||||||||||||||||
| Plaza at Rockwall Phase I, Rockwall, TX |
2007 | 332,989 | (6) | 96.3 | 15 | Dick’s Sporting Goods* | 2018 | 3,005 | (7) | |||||||||||||||||
| Brandywine Crossing, Brandywine, MD |
2009 | 198,330 | (8) | 96.3 | 29 | Safeway* | 2028 | 3,470 | ||||||||||||||||||
| Lowe’s, Shippensburg, PA |
2008 | 171,069 | 100.0 | 1 | Lowe’s Home Centers* | 2031 | 1,475 | |||||||||||||||||||
| Grant Creek Town Center, Missoula, MT |
1998 | 164,166 | 90.9 | 27 | REI* | 2020 | 1,946 | |||||||||||||||||||
| Rosewick Crossing, La Plata, MD |
2008 | 116,095 | (9) | 84.6 | 16 | Giant Food* | 1,838 | |||||||||||||||||||
| 5000 South Hulen, Fort Worth, TX |
2005 | 86,838 | 92.4 | 18 | Barnes & Noble* | 2015 | 1,886 | |||||||||||||||||||
| Shops at Foxwood, Ocala, FL |
2010 | 78,660 | 86.2 | 10 | Publix* | 2030 | 808 | |||||||||||||||||||
| Five Forks Place, Simpsonville, SC |
2002 | 61,191 | 96.6 | 11 | Publix* | 2022 | 720 | |||||||||||||||||||
| Newport Towne Center, Newport, TN |
2006 | 60,100 | 90.8 | 13 | Dollar Tree Stores, Inc. Specialty Retailers |
|
2011
2021 |
|
465 | |||||||||||||||||
28
Table of Contents
| Property/Location |
Year Built(1) |
Total GLA(2) |
Percent Leased |
Number of Tenants |
Major |
Major Lease Expiration Date |
Annualized Base Rent(4) ($ in 000s) |
|||||||||||||||||||
| Shop ‘n Save, Ballwin, MO |
2007 | 53,411 | 100.0 | 1 | Shop ‘n Save* | 2027 | 736 | (10) | ||||||||||||||||||
| Jewel-Osco, Morris, IL |
1999 | (11) | 51,762 | 100.0 | 1 | Jewel-Osco* | 2024 | 660 | ||||||||||||||||||
| Mariner’s Point, St. Marys, GA |
2001 | 45,215 | 100.0 | 17 | Shoe Show(12) | 2011 | 640 | |||||||||||||||||||
| Merchant Central, Milledgeville, GA |
2004 | 45,013 | 96.4 | 17 | Dollar Tree(13) | 2014 | 581 | |||||||||||||||||||
| Walgreens, Beckley, WV |
2008 | 14,820 | 100.0 | 1 | Walgreens* | 2033 | (14) | 575 | ||||||||||||||||||
| Walgreens, Princeton, WV |
2008 | 14,550 | 100.0 | 1 | Walgreens* | 2033 | (14) | 323 | ||||||||||||||||||
| Walgreens, Barbourville, KY |
2008 | 13,650 | 100.0 | 1 | Walgreens* | 2034 | (14) | 337 | ||||||||||||||||||
| Walgreens, Corbin, KY — South |
2009 | 13,650 | 100.0 | 1 | Walgreens* | 2034 | (14) | 335 | ||||||||||||||||||
| Walgreens, Corbin, KY — North |
2009 | 13,650 | 100.0 | 1 | Walgreens* | 2034 | (14) | 282 | ||||||||||||||||||
| Subtotal/Weighted Average Retail Properties |
2,511,751 | 93.0 | % | 286 | $ | 31,091 | ||||||||||||||||||||
| Office Property |
||||||||||||||||||||||||||
| Excel Centre, San Diego, CA |
1999 | 82,157 | 100.0 | 13 | Kaiser Permanente | 2019 | 2,929 | |||||||||||||||||||
| Total/Weighted Average |
2,593,908 | 93.3 | % | 299 | $ | 34,020 | ||||||||||||||||||||
| Non-Operating Properties |
||||||||||||||||||||||||||
| Red Rock Commons, St. George, UT |
N/A | N/A | N/A | N/A | N/A | N/A | N/A | |||||||||||||||||||
| Plaza at Rockwall Phase II, Rockwall, TX |
N/A | N/A | N/A | N/A | N/A | N/A | N/A | |||||||||||||||||||
| Northside Plaza, Dothan, AL |
N/A | N/A | N/A | N/A | N/A | N/A | N/A | |||||||||||||||||||
| * | Denotes anchor tenant. |
| (1) | Year built represents the year in which construction was completed. |
| (2) | Total GLA represents total gross leasable area owned by us at the property. |
| (3) | Major tenant represents the tenant in each property that has the highest annualized base rent. |
| (4) | Annualized base rent means the annualized fixed base rental amount in effect under existing leases as of December 31, 2010. In the case of triple-net leases, annualized base rent does not include real estate taxes and insurance, common area and other operating expenses, substantially all of which are borne by the tenants. Does not reflect amounts attributable to percentage rent increases, where applicable. |
| (5) | Of the total GLA for Park West Place, 154,794 square feet, 88,248 square feet and 31,629 square feet is leased under a ground lease to Lowe’s, Kohl’s and Babies R’ Us, respectively. |
| (6) | Of the total GLA for Plaza at Rockwall Phase I, 103,256 square feet and 75,524 square feet are leased under ground leases to J.C. Penney and Belk Department Store, respectively. |
| (7) | Amount includes rent attributable to ground leases to J.C. Penney and Belk Department Store. |
| (8) | Of the total GLA for Brandywine Crossing, 59,678 square feet is leased under a ground lease to Safeway. |
| (9) | Of the total GLA for Rosewick Crossing, 58,432 square feet is leased under a ground lease to Giant Food. |
| (10) | Amount includes $15.9 related to a cell tower lease. |
| (11) | Jewel-Osco was originally constructed in 1999 and was completely renovated in 2008. |
| (12) | Shoe Show is not the anchor tenant of this property. Mariner’s Point is anchored by a non-owned Super Wal-Mart. |
| (13) | Dollar Tree is not the anchor tenant of this property. Merchant Central is anchored by a non-owned Super Wal-Mart. |
| (14) | Represents the earliest date these leases can be terminated by the tenant. Without early termination, the leases for Walgreens, Corbin, KY — North Walgreens, Barbourville, KY, and Walgreens, Corbin, KY — South will expire in 2084, while, Walgreens, Beckley, WV and Walgreens, Princeton, WV will expire in 2083. |
29
Table of Contents
Non-Operating Properties
Red Rock Commons: Red Rock Commons is a 18.5 acre land parcel located in St. George, Utah on which we intend to develop into a shopping center.
Plaza at Rockwall Phase II: Plaza at Rockwall Phase II is a 12.6 acre land parcel located adjacent to Plaza at Rockwall Phase I in Rockwall, Texas, on which we have commenced construction of 100,000 square feet of gross leasable area.
Northside Plaza: Northside Plaza is a 243,000 square foot property located in Dothan, Alabama, which is currently being redeveloped. When complete, the project is expected to be comprised of approximately 243,000 square feet and to include Publix and Hobby Lobby as anchor tenants. We entered into a joint venture to acquire a 50% interest in Northside Plaza in November 2010.
Properties under Contract
Gilroy Crossing: On December 9, 2010, we, through our operating partnership, entered into an agreement to acquire Gilroy Crossing, a 473,640 square foot shopping center (of which 325,431 square feet are owned) located in Gilroy, California. The purchase price for Gilroy Crossing, excluding closing costs, is approximately $68.5 million, of which $48.4 million will be assumed debt. Gilroy Crossing is occupied by 32 tenants operating in various businesses including retail and services. Major tenants include Target (not owned), Kohl’s, Sports Authority, Ross Dress For Less, Bed Bath & Beyond, Michael’s and PetSmart. The acquisition of this property is subject to lender consent, due diligence and other customary closing conditions. Although we believe that we will consummate this acquisition, we cannot guarantee that it will close on the terms described herein, or at all.
Edwards Theatres: On January 10, 2011, we, through our operating partnership, entered into an agreement to acquire Edwards Theatres, a 100,511 square foot freestanding building located in San Marcos, California that is currently 100% leased by one tenant. The purchase price for Edwards Theatres, excluding closing costs, is approximately $23.6 million, of which $12.5 million will be assumed debt. The purchase price, excluding assumed debt, will be payable primarily in the form of units of our operating partnership valued at $14.00 per unit. The units will be redeemable after a period of twelve months following the closing for cash or, at our option, an equivalent number of shares of our common stock. The acquisition of this property is subject to due diligence and other customary closing conditions. Although we believe that we will consummate this acquisition, we cannot guarantee that it will close on the terms described herein, or at all.
Major Tenants
We have leases with numerous nationally recognized retailers. The following table sets forth information regarding the ten largest tenants in our operating portfolio based on annualized base rent as of December 31, 2010.
30
Table of Contents
| Retail Tenants |
Total GLA | Percent of Total Retail GLA |
Annualized Base Rent ($ in 000s) |
Percent of Total Retail Annualized Base Rent |
Base Rent per leased square foot |
|||||||||||||||
| Lowe’s Home Centers, Inc. |
325,863 | 13.0 | % | $ | 2,195 | 7.1 | % | $ | 6.74 | |||||||||||
| Walgreen Co. |
70,320 | 2.8 | 1,852 | 6.0 | 26.34 | |||||||||||||||
| Publix Supermarkets, Inc. |
154,151 | 6.1 | 1,692 | 5.4 | 10.98 | |||||||||||||||
| SuperValu(1) |
105,173 | 4.2 | 1,381 | 4.4 | 13.13 | |||||||||||||||
| Dick’s Sporting Goods |
50,000 | 2.0 | 815 | 2.6 | 16.30 | |||||||||||||||
| Jo Ann |
60,619 | 2.4 | 784 | 2.5 | 12.93 | |||||||||||||||
| Rave Motion Pictures |
42,287 | 1.7 | 766 | 2.5 | 18.11 | |||||||||||||||
| Giant Foods. |
61,932 | 2.5 | 761 | 2.4 | 12.29 | |||||||||||||||
| Ross Dress For Less |
60,161 | 2.4 | 673 | 2.2 | 11.19 | |||||||||||||||
| Safeway |
59,678 | 2.4 | 677 | 2.2 | 11.34 | |||||||||||||||
| Total Top Ten Tenants/Weighted Average |
990,184 | 39.4 | % | $ | 11,596 | 37.3 | % | $ | 11.71 | |||||||||||
| (1) | SuperValu is the parent for Shop ‘n Save and Jewel-Osco, tenants of ours. |
We have leases with 13 distinct office tenants. The following table sets forth information regarding our three largest office tenants in our operating portfolio based on annualized base rent as of December 31, 2010. As of December 31, 2010, 8,274 square feet were leased by the Company for our corporate offices.
| Office Tenants |
Total GLA | Percent of Total Office GLA |
Annualized Base Rent ($ in 000s) |
Percent of Total Office Annualized Base Rent |
Base Rent per leased square foot |
|||||||||||||||
| Kaiser Permanente |
30,052 | 36.6 | % | $ | 1,217 | 41.6 | % | $ | 40.50 | |||||||||||
| Swinerton, Inc. |
13,503 | 16.4 | 515 | 17.6 | 38.14 | |||||||||||||||
| UBS Financial Services |
10,251 | 12.5 | 329 | 11.2 | 32.09 | |||||||||||||||
| Total Top Tenants/Weighted Average |
53,806 | 65.5 | % | $ | 2,061 | 70.4 | % | $ | 38.30 | |||||||||||
Lease Expirations
The following table sets forth information with respect to the lease expirations of our retail and office properties as of December 31, 2010.
| Lease Expiration Year |
Total Expiring GLA |
Percent of Total GLA Expiring |
Expiring Base Rent ($ in 000s) |
Percent of Total Base Rent |
Expiring Base Rent per leased square foot |
|||||||||||||||
| Available |
174,165 | 6.7 | % | $ | — | — | % | $ | — | |||||||||||
| 2011 |
189,092 | 7.3 | 3,110 | 9.1 | 16.45 | |||||||||||||||
| 2012 |
93,066 | 3.6 | 1,544 | 4.5 | 16.59 | |||||||||||||||
| 2013 |
127,500 | 4.9 | 2,090 | 6.2 | 16.39 | |||||||||||||||
| 2014 |
109,784 | 4.2 | 2,097 | 6.2 | 19.11 | |||||||||||||||
| 2015 |
269,023 | 10.4 | 4,414 | 13.0 | 16.41 | |||||||||||||||
| 2016 |
107,365 | 4.1 | 1,772 | 5.2 | 16.51 | |||||||||||||||
| 2017 |
29,730 | 1.2 | 830 | 2.4 | 27.93 | |||||||||||||||
| 2018 |
135,911 | 5.2 | 2,380 | 7.0 | 17.51 | |||||||||||||||
| 2019 |
129,729 | 5.0 | 2,847 | 8.4 | 21.94 | |||||||||||||||
| 2020 and thereafter |
1,228,543 | 47.4 | 12,936 | 38.0 | 10.53 | |||||||||||||||
| Total/Weighted Average |
2,593,908 | 100.0 | % | $ | 34,020 | 100.0 | % | $ | 13.12 | |||||||||||
31
Table of Contents
Property Management and Leasing Strategy
Our property management and substantially all of our leasing activities and operating and administrative functions (including leasing, legal, acquisitions, development, data processing, finance and accounting) are administered or coordinated by our personnel. On-site functions such as maintenance, landscaping, sweeping, plumbing and electrical are subcontracted out at each location and, to the extent permitted by their respective leases, the cost of these functions is passed on to the tenants.
We believe that focused property management, leasing and customer retention are essential to maximizing the sales per square foot, operating cash flow and value of our properties. Our primary goal in property management is to maintain an attractive shopping environment on a cost effective basis for our tenants.
The majority of our property management and leasing functions are supervised and administered by personnel at our San Diego, California office. Our property managers maintain regular contact with our tenants and frequently visit each asset to ensure the proper implementation and execution of our market strategies. As part of our ongoing property management, we conduct regular physical property reviews to improve our properties, react to changing market conditions and ensure proper maintenance.
Our leasing representatives have become experienced in the markets in which we operate by becoming familiar with current tenants as well as potential local, regional and national tenants that would complement our current tenant base. We study demographics, customer sales and merchandising mix to optimize the sales performance of our centers and thereby increase rents. We believe this hands-on approach maximizes the value of our shopping centers.
| ITEM 3. | LEGAL PROCEEDINGS |
Although we are involved in legal proceedings arising in the ordinary course of business, we are not currently a party to any legal proceedings nor is any legal proceeding threatened against us that we believe would have a material adverse effect on our financial position, results of operations or liquidity.
| ITEM 4. | (REMOVED AND RESERVED) |
32
Table of Contents
PART II
| ITEM 5. | MARKET FOR REGISTRANT’S COMMON EQUITY, RELATED STOCKHOLDER MATTERS AND ISSUER PURCHASES OF EQUITY SECURITIES |
Market Information
Our common stock has been listed on the New York Stock Exchange, or the NYSE, under the symbol “EXL” since April 23, 2010. On March 8, 2011, the reported closing sale price per share for our common stock on the NYSE was $12.30 and there were approximately 11 holders of record. Certain shares of our company are held in “Street” name and accordingly, the number of beneficial owners of such shares is not known or included in the foregoing numbers. The following table sets forth, for the periods indicated, the high and low sale prices in dollars on the NYSE for our common stock and the distributions we declared per share with respect to the periods indicated.
| Range | ||||||||||||||||
| Year |
Quarter | High | Low | Cash Dividend per Common Share |
||||||||||||
| 2010 |
2 | nd | $ | 13.72 | $ | 10.77 | — | |||||||||
| 3 | rd | $ | 12.82 | $ | 10.87 | $ | 0.08 | |||||||||
| 4 | th | $ | 12.90 | $ | 11.11 | $ | 0.12 | |||||||||
Information about our equity compensation plans is incorporated by reference in Item 12 of Part III of this annual report on Form 10-K.
We intend to continue to declare quarterly distributions on our common stock. The actual amount and timing of distributions, however, will be at the discretion of our board of directors and will depend upon our financial condition in addition to the requirements of the Code, and no assurance can be given as to the amounts or timing of future distributions. In addition, our revolving credit facility contains limitations on our ability to pay distributions on our common stock and Series A preferred stock. Specifically, our cash dividends may not exceed the greater of (1)(a) during the period from October 1, 2010 to June 30, 2011, 110% of our FFO, and (b) beginning on July 1, 2011, 95% of our FFO, and (2) the amount required for us to qualify and maintain our REIT status. If an event of default exists, we may only make distributions sufficient to qualify and maintain our REIT status.
Recent Sales of Unregistered Equity Securities; Use of Proceeds from Registered Securities
On January 28, 2011, we issued 2,000,000 shares of 7.00% Series A Cumulative Convertible Perpetual Preferred Stock, par value $0.01 per share, with a liquidation preference of $25.00 per share, to the initial purchasers Stifel, Nicolaus & Company, Incorporated and Raymond James & Associates, Inc. We will pay cumulative dividends on the Series A preferred stock from the date of original issue at a rate of 7.00% per annum, subject to adjustment in certain circumstances. The annual dividend on each share of Series A preferred stock is $1.75, payable quarterly in arrears on the 15th calendar day of January, April, July and October of each year, commencing on April 15, 2011, as and if declared by our board of directors. The Series A preferred stock will be convertible, at the holders’ option, at any time and from time to time, into shares of our common stock at an initial conversion rate of 1.6667 shares of common stock per share of Series A preferred stock, which is equivalent to an initial conversion price of $15.00 per share. Net proceeds from this offering were approximately $47.7 million. We used the net proceeds of this offering to repay a portion of the outstanding indebtedness under our revolving credit facility. We issued the Series A preferred stock in a private placement in reliance on the exemption from registration provided by Section 4(2) of the Securities Act.
33
Table of Contents
Total Stockholder Return Performance
The following graph shows a comparison from April 23, 2010 to December 31, 2010 of cumulative total stockholder return, calculated on a dividend reinvested basis, for Excel Trust, Inc., the S&P 500 Stock Index, or the S&P 500, and the National Association of Real Estate Investment Trusts, Inc. Equity REIT Total Return Index, or the Industry Index, which includes all tax-qualified equity REITs listed on the NYSE. The graph assumes $100 was invested in each of Excel Trust, Inc.’s common stock, the S&P 500 and the Industry Index on April 23, 2010. Data points on the graph are quarterly. Note that historic stock price performance is not necessarily indicative of future stock price performance.
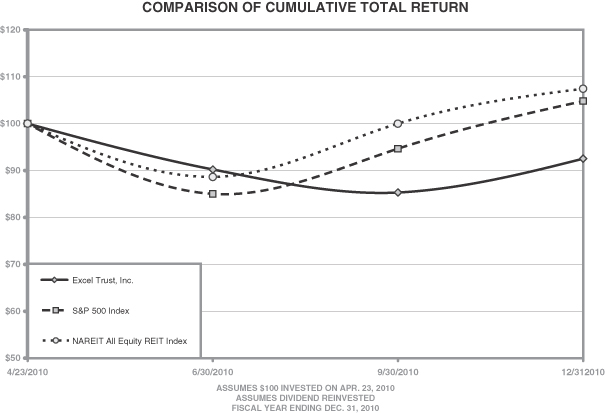
This graph and the accompanying text are not “soliciting material,” are not deemed filed with the SEC and are not to be incorporated by reference in any filing by us under the Securities Act or the Exchange Act, whether made before or after the date hereof and irrespective of any general incorporation language in any such filing.
| ITEM 6. | SELECTED FINANCIAL DATA |
The following table sets forth selected financial and operating data on a historical basis for Excel Trust, Inc. and our Predecessor. Our Predecessor is not a legal entity, but rather a combination of real estate entities and operations invested in four properties that were contributed to us in connection with our IPO. We have not presented historical information for Excel Trust, Inc. prior to April 28, 2010, the date on which we consummated our IPO, because during the period from our formation until our IPO, we did not have any material corporate activity and because we believe that a discussion of the results of Excel Trust, Inc. during that period would not be meaningful.
The following table sets forth selected consolidated and combined financial and operating information which is derived from our audited consolidated and combined financial statements. The following historical
34
Table of Contents
information should be read in conjunction with our consolidated and combined financial statements and notes included in Item 8 of this report and “Management’s Discussion and Analysis of Financial Condition and Results of Operations” included in Item 7 of this report.
| The Company | The Predecessor | |||||||||||||||||||||||
| (Dollars in thousands) | Period from April 28, 2010 to December 31, 2010 |
Period January 1, 2010 to April 27, 2010 |
2009 | 2008 | 2007(1) | 2006 | ||||||||||||||||||
| Operating Data |
||||||||||||||||||||||||
| Total revenues |
$ | 15,918 | $ | 1,568 | $ | 4,990 | $ | 3,832 | $ | 4,533 | $ | 3,365 | ||||||||||||
| Expenses: |
||||||||||||||||||||||||
| Property operating expenses |
3,364 | 379 | 1,229 | 1,148 | 1,002 | 845 | ||||||||||||||||||
| Administrative and miscellaneous |
7,152 | 8 | 45 | 43 | 15 | 14 | ||||||||||||||||||
| Depreciation and amortization |
6,727 | 542 | 2,045 | 1,403 | 1,575 | 1,092 | ||||||||||||||||||
| Total expenses |
17,243 | 929 | 3,319 | 2,594 | 2,592 | 1,951 | ||||||||||||||||||
| Net operating (loss) income |
(1,325 | ) | 639 | 1,671 | 1,238 | 1,941 | 1,414 | |||||||||||||||||
| Interest expense |
(3,692 | ) | (483 | ) | (1,359 | ) | (1,593 | ) | (1,593 | ) | (1,201 | ) | ||||||||||||
| Interest income |
166 | — | 6 | 29 | 35 | 27 | ||||||||||||||||||
| Gain on acquisition of joint venture equity interest |
978 | — | — | — | — | — | ||||||||||||||||||
| Net (loss) income |
(3,873 | ) | 156 | 318 | (326 | ) | 383 | 240 | ||||||||||||||||
| Non-controlling interests |
(148 | ) | 290 | 75 | 56 | 272 | 205 | |||||||||||||||||
| Net (loss) income attributable to the common stockholders and controlling interests of the Predecessor |
$ | (3,725 | ) | $ | (134 | ) | $ |
243 |
|
$ | (382 | ) | $ | 111 | $ | 35 | ||||||||
| Basic and diluted loss per share |
$ | (0.24 | ) | |||||||||||||||||||||
| Weighted-average common shares outstanding — basic and diluted |
15,510 | |||||||||||||||||||||||
| Dividends declared per common share |
$ | 0.20 | ||||||||||||||||||||||
| Other Data |
||||||||||||||||||||||||
| Funds from operations(1) |
$ | 1,876 | $ | 698 | $ | 2,363 | $ | 1,077 | $ | 1,958 | $ | 1,332 | ||||||||||||
| Cash flow provided by operations |
$ | 3,920 | $ | 301 | $ | 5,615 | $ | 1,078 | $ | 1,878 | $ | 1,240 | ||||||||||||
| Cash flow used by investing activities |
$ | (327,284 | ) | $ | (238 | ) | $ | (5,248 | ) | $ | (678 | ) | $ | (19,872 | ) | $ | (301 | ) | ||||||
| Cash flow provided (used) by financing activities |
$ | 329,889 | $ | (724 | ) | $ | (244 | ) | $ | (568 | ) | $ | 706 | $ | (1,044 | ) | ||||||||
35
Table of Contents
| The Company | The Predecessor | |||||||||||||||||||
| As of December 31, | ||||||||||||||||||||
| (Dollars in thousands) | 2010 | 2009 | 2008 | 2007 | 2006 | |||||||||||||||
| Balance Sheet Data |
||||||||||||||||||||
| Properties, net |
$ | 365,112 | $ | 41,869 | $ | 37,642 | $ | 37,688 | $ | 19,414 | ||||||||||
| Cash and cash equivalents |
6,525 | 661 | 538 | 706 | 258 | |||||||||||||||
| Total assets |
441,088 | 45,456 | 42,131 | 43,112 | 23,941 | |||||||||||||||
| Mortgage and notes payable |
222,427 | 30,190 | 31,182 | 32,899 | 19,442 | |||||||||||||||
| Total liabilities |
244,478 | 35,934 | 33,445 | 34,328 | 20,432 | |||||||||||||||
| Stockholders’ equity and owner’s equity |
187,511 | 8,622 | 7,930 | 8,132 | 3,415 | |||||||||||||||
| Non-controlling interests |
9,099 | 900 | 756 | 652 | — | |||||||||||||||
| Total liabilities and equity |
441,088 | 45,456 | 42,131 | 43,112 | 23,941 | |||||||||||||||
| Other Data |
||||||||||||||||||||
| Operating properties |
||||||||||||||||||||
| Number |
21 | 3 | 3 | 3 | 2 | |||||||||||||||
| Total owned gross leasable area |
2,593,908 | 203,448 | 203,448 | 203,448 | 143,348 | |||||||||||||||
| Other properties (land) |
3 | 1 | 1 | 1 | — | |||||||||||||||
| (1) | We present FFO because we consider FFO an important supplemental measure of our operating performance and believe it is frequently used by securities analysts, investors and other interested parties in the evaluation of REITs, many of which present FFO when reporting their results. See ITEM 7 for a further discussion of FFO. |
The following table presents a reconciliation of FFO for the periods presented (in thousands):
| The Company | The Predecessor | |||||||||||||||||||||||
| Period from April 28, 2010 to December 31, 2010 |
Period January 1, 2010 to April 27, 2010 |
2009 | 2008 | 2007(1) | 2006 | |||||||||||||||||||
| Net (loss) income |
$ | (3,873 | ) | $ | 156 | $ | 318 | $ | (326 | ) | $ | 383 | $ | 240 | ||||||||||
| Depreciation and amortization |
6,727 | 542 | 2,045 | 1,403 | 1,575 | 1,092 | ||||||||||||||||||
| Gain on acquisition of joint venture equity interest |
(978 | ) | — | — | — | — | — | |||||||||||||||||
| Funds from operations |
$ | 1,876 | $ | 698 | $ | 2,363 | $ | 1,077 | $ | 1,958 | $ | 1,332 | ||||||||||||
| ITEM 7. | MANAGEMENT’S DISCUSSION AND ANALYSIS OF FINANCIAL CONDITION AND RESULTS OF OPERATIONS |
The following discussion should be read in conjunction with the financial statements and notes thereto appearing elsewhere in this report. We make statements in this section that are forward-looking statements within the meaning of the federal securities laws. For a complete discussion of forward-looking statements, see the section above entitled “Item 1. Business — Forward-Looking Statements.” Certain risk factors may cause our actual results performance or achievements to differ materially from those expressed or implied by the following discussion. For a discussion of such risk factors, see the section above entitled “Item 1A. Risk Factors.” References to “we,” “us,” “our” and the “company” refer to Excel Trust, Inc., any of our subsidiaries or to our Predecessor, as applicable. Our Predecessor is not a legal entity, but rather a combination of real estate entities and operations invested in four properties that were contributed to us in connection with our IPO.
Overview
We are a vertically integrated, self-administered, self-managed real estate firm with the principal objective of acquiring, financing, developing, leasing, owning and managing value oriented community and power centers,
36
Table of Contents
grocery anchored neighborhood centers and freestanding retail properties. Our strategy is to acquire high quality, well-located, dominant retail properties that generate attractive risk-adjusted returns. We target competitively protected properties in communities that have stable demographics and have historically exhibited favorable trends, such as strong population and income growth. We generally lease our properties to national and regional supermarket chains, big-box retailers and select national retailers that offer necessity and value oriented items and generate regular consumer traffic. Our tenants carry goods that are less impacted by fluctuations in the broader U.S. economy and consumers’ disposable income, which we believe generates more predictable property-level cash flows.
On April 28, 2010, we completed our IPO. In connection with the IPO, we and our operating partnership, for which we are the sole general partner, then engaged in certain formation transactions. The formation transactions were designed to (1) continue the operations of four properties that were contributed by related parties, (2) enable us to raise the necessary capital to acquire increased interests in certain of the properties, (3) provide capital for future acquisitions, (4) fund certain development costs at our development property, (5) establish a capital reserve for general corporate purposes and (6) fund future joint venture capital commitments. The exchange of entities or interests therein for shares of our common stock and operating partnership units has been accounted for as a reorganization of entities under common control, and accordingly, the related assets and liabilities were reflected at their historical cost basis. We were organized as a Maryland corporation on December 15, 2009 and intend to elect to be taxed as a REIT beginning with our taxable year ended December 31, 2010.
As of December 31, 2010, we owned a portfolio consisting of 20 retail operating properties totaling approximately 2.5 million square feet of gross leasable area, which were approximately 93.3% leased and had a weighted average age of approximately five years, based on gross leasable area. In addition, we own one commercial office property totaling 82,157 square feet of gross leasable area, which was 100% leased as of December 31, 2010. We utilize a portion of this commercial building as our headquarters. We also own two land parcels comprising approximately 31 acres slated for retail development and a 50% interest in a property currently being redeveloped.
Our operations are carried on primarily through our operating partnership. Pursuant to contribution agreements, we and our operating partnership received a contribution of interests in four properties as well as the property management, leasing and real estate development operations of the properties in exchange for the issuance of shares of our common stock or operating partnership units and/or the payment of cash to the contributors and the assumption of debt and other specified liabilities in connection with our IPO.
We receive income primarily from rents and reimbursement payments received from tenants under existing leases at each of our properties. Potential impacts to our income include unanticipated tenant vacancies, vacancy of space that takes longer to re-lease and, for non triple-net leases, operating costs that cannot be recovered from our tenants through contractual reimbursement formulas in our leases. Our operating results therefore depend materially on the ability of our tenants to make required payments and overall real estate market conditions.
Factors That May Influence Future Results of Operations
Rental Revenue and Tenant Recoveries. The amount of rental revenue and tenant recoveries generated by our portfolio depends principally on our ability to maintain the occupancy rates of currently leased space and to lease currently available space and space available from lease terminations. As of December 31, 2010, our retail properties were approximately 93.3% leased and our office property was 100.0% leased. The amount of rental revenue generated by us also depends on our ability to maintain or increase rental rates at our properties. Positive or negative trends in our geographic areas or the retail market could adversely affect our rental revenue and tenant recoveries in future periods. In addition, growth in rental income will partially depend on our ability to acquire additional retail properties that meet our investment criteria.
37
Table of Contents
Lease Expirations. Our ability to re-lease space subject to expiring leases will impact our results of operations and is affected by economic and competitive conditions in our markets as well as the desirability of our individual properties. The leases scheduled to expire in the twelve months ending December 31, 2011 and December 31, 2012 represent 7.3% and 3.6%, respectively, of our total gross leasable area and 9.1% and 4.5%, respectively, of our annualized base rental revenue.
Market Conditions. We seek investment opportunities throughout the United States; however, we focus on the Northeast, Northwest and Sunbelt regions. Positive or negative changes in conditions in these markets will impact our overall performance. Future economic downturns or regional downturns affecting our target markets or downturns in the retail industry that impair our ability to renew or re-lease space as well as the ability of our tenants to fulfill their lease commitments, as such in the case of tenant bankruptcies, could adversely affect our ability to maintain or increase rental rates at our properties. Despite weakness in retail real estate throughout the United States over the past two years, we believe that our target markets are characterized by attractive demographics and property fundamental trends which could lead to outperformance as the sector rebounds.
Operating Expenses. Our operating expenses generally consist of maintenance and repair expenses, real estate taxes, management fees and other operating expenses. For select properties, our operating expenses are controlled, in part, by negotiating expense pass-through provisions in tenant leases for most operating expenses. Most of the leases of our properties require tenants to pay all of their direct operating expenses as well as their pro rata share of substantially all of their indirect operating expenses, including common area maintenance, real estate taxes and insurance. Tenants in the office building pay for their direct operating expenses as well as their pro rata share of indirect operating expenses, including real estate taxes and insurance to the extent those expenses increase above the initial year of their respective lease. Increases or decreases in such operating expenses will impact our overall performance.
General and Administrative Expenses. We incur general and administrative expenses, including legal, accounting and other expenses related to corporate governance, public reporting, and compliance with various provisions of the Sarbanes-Oxley Act of 2002. We anticipate that our staffing levels will increase as we acquire additional assets and, as a result, our general and administrative expenses will increase.
Critical Accounting Policies
Our discussion and analysis of our financial condition and results of operations are based upon our consolidated and combined financial statements, which have been prepared in accordance with generally accepted accounting principles, or GAAP. Our significant accounting policies are described in the notes to our consolidated and combined financial statements. The preparation of these financial statements in conformity with GAAP requires us to make estimates, judgments and assumptions that affect the reported amounts of assets, liabilities, revenues and expenses. We base these estimates, judgments and assumptions on historical experience and on various other factors that we believe to be reasonable under the circumstances. Actual results may differ from these estimates under different assumptions or conditions, as described below. We believe our critical accounting policies are as follows:
Investments in Real Estate
Investments in real estate are carried at depreciated cost. Depreciation and amortization are recorded on a straight-line basis over the estimated useful lives of the assets as follows:
| Buildings and improvements |
15 to 40 years | |
| Tenant improvements |
Shorter of the useful lives or the terms of the related leases | |
| Acquired in-place leases |
Non-cancelable term of the related lease |
38
Table of Contents
Our estimates of useful lives have a direct impact on our net income. If expected useful lives of our investments in real estate were shortened, we would depreciate the assets over a shorter time period, resulting in an increase to depreciation expense and a corresponding decrease to net income on an annual basis.
Management must make significant assumptions in determining the value of assets and liabilities acquired. The use of different assumptions in the allocation of the purchase cost of the acquired properties would affect the timing of recognition of the related revenue and expenses. The fair value of tangible assets of an acquired property (which includes land, buildings, and improvements) is determined by valuing the property as if it were vacant, and the “as-if-vacant” value is then allocated to land, buildings and improvements based on management’s determination of the relative fair value of these assets. Factors considered by us in performing these analyses include an estimate of the carrying costs during the expected lease-up periods, current market conditions and costs to execute similar leases. In estimating carrying costs, we include real estate taxes, insurance and other operating expenses, and estimates of lost rental revenue during the expected lease-up periods based on current market demand.
The value allocable to the above or below market component of the acquired in-place leases is determined based upon the present value (using a discount rate which reflects the risks associated with the acquired leases) of the difference between: (1) the contractual amounts to be paid pursuant to the lease over its remaining term, and (2) our estimate of the amounts that would be paid using fair market rates over the remaining term of the lease. The amounts allocated to above market leases are included in lease intangible assets, net in our accompanying combined balance sheets and amortized to rental income over the remaining non-cancelable lease term of the acquired leases with each property. The amounts allocated to below market lease values are included in lease intangible liabilities, net in our accompanying combined balance sheets and amortized to rental income over the remaining non-cancelable lease term plus any below market renewal options of the acquired leases with each property.
The total amount of other intangible assets acquired is further allocated to in-place lease costs and the value of tenant relationships based on our evaluation of the specific characteristics of each tenant’s lease and our overall relationship with that respective tenant. Characteristics considered in allocating these values include the nature and extent of the credit quality and expectations of lease renewals, among other factors. The amounts allocated to in-place lease costs are included in lease intangible assets, net in the accompanying combined balance sheets and will be amortized over the average remaining non-cancelable lease term of the acquired leases with each property. The amounts allocated to the value of tenant relationships are included in lease intangible assets, net in our accompanying consolidated and combined balance sheets and are amortized over the average remaining non-cancelable lease term of the acquired leases plus a market lease term.
The value allocable to above or below market debt is determined based upon the present value of the difference between the cash flow stream of the assumed mortgage and the cash flow stream of a market rate mortgage. The amounts allocated to above or below market debt are included in mortgage loan payables, net on our accompanying combined balance sheets and are amortized to interest expense over the remaining term of the assumed mortgage.
Costs incurred in connection with the acquisition, development or construction of properties and improvements are capitalized. Capitalized costs include pre-construction costs essential to the development of the property, development costs, construction costs, interest costs, real estate taxes, salaries and related costs and other direct costs incurred during the period of development. We capitalize costs on land and buildings under development until construction is substantially complete and the property is held available for occupancy. The determination of when a development project is substantially complete and when capitalization must cease involves a degree of judgment. We consider a construction project as substantially complete and held available for occupancy upon the completion of landlord-owned tenant improvements or when the lessee takes possession of the unimproved space for construction of its own improvements, but no later than one year from cessation of major construction activity. We cease capitalization on the portion substantially completed and occupied or held
39
Table of Contents
available for occupancy, and capitalize only those costs associated with any remaining portion under construction. Capitalized costs associated with unsuccessful acquisitions are charged to expense when an acquisition is no longer considered probable.
Repair and maintenance costs are charged to expense as incurred and significant replacements and betterments are capitalized. Repair and maintenance costs include all costs that do not extend the useful life of an asset or increase its operating efficiency. Significant replacements and betterments represent costs that extend an asset’s useful life or increase its operating efficiency.
We assess whether there has been impairment in the value of a long-lived asset by considering expected future operating income, trends and prospects, as well as the effects of demand, competition and other economic factors. Such factors include the tenants’ ability to perform their duties and pay rent under the terms of the leases. The determination of recoverability is made based upon the estimated undiscounted future net cash flows, excluding interest expense. The amount of impairment loss, if any, is determined by comparing the fair value, as determined by a discounted cash flows analysis, with the carrying value of the related assets. These cash flows consider factors such as expected future operating income, trends and prospects, as well as the effects of leasing demand, competition and other factors. Long-lived assets classified as held for sale are measured at the lower of the carrying amount or fair value less cost to sell.
Revenue Recognition
We commence revenue recognition on our leases based on a number of factors. In most cases, revenue recognition under a lease begins when the lessee takes possession of or controls the physical use of the leased asset. Generally, this occurs on the lease commencement date. In determining what constitutes the leased asset, we evaluate whether we or the lessee is the owner, for accounting purposes, of the tenant improvements. If we are the owner, for accounting purposes, of the tenant improvements, then the leased asset is the finished space and revenue recognition begins when the lessee takes possession of the finished space, typically when the improvements are substantially complete. If we conclude that we are not the owner, for accounting purposes, of the tenant improvements (the lessee is the owner), then the leased asset is the unimproved space and any tenant improvement allowances funded under the lease are treated as lease incentives, which reduce revenue recognized on a straight-line basis over the remaining non-cancelable term of the respective lease. In these circumstances, we begin revenue recognition when the lessee takes possession of the unimproved space for the lessee to construct improvements. The determination of who is the owner, for accounting purposes, of the tenant improvements determines the nature of the leased asset and when revenue recognition under a lease begins. We consider a number of different factors to evaluate whether we or the lessee is the owner of the tenant improvements for accounting purposes. These factors include:
| • | whether the lease stipulates how and on what a tenant improvement allowance may be spent, |
| • | whether the tenant or landlord retains legal title to the improvements, |
| • | the uniqueness of the improvements, |
| • | the expected economic life of the tenant improvements relative to the length of the lease, |
| • | the responsible party for construction cost overruns, and |
| • | who constructs or directs the construction of the improvements. |
The determination of who owns the tenant improvements, for accounting purposes, is subject to significant judgment. In making that determination we consider all of the above factors. However, no one factor is determinative in reaching a conclusion.
All leases are classified as operating leases and minimum rents are recognized on a straight-line basis over the term of the related lease. The excess of rents recognized over amounts contractually due pursuant to the
40
Table of Contents
underlying leases is included in deferred rent receivable on the accompanying combined balance sheets and contractually due but unpaid rents are included in accounts receivable. If a lease were to be terminated or if termination were determined to be likely (e.g., in the case of a tenant bankruptcy) prior to its contractual expiration, amortization of the related unamortized above or below market lease intangible would be accelerated and such amounts would be written off.
Substantially all of our retail rental operations expenses, consisting of real estate taxes, insurance and common area maintenance costs are recoverable from tenants under the terms of our lease agreements. Amounts recovered are dependent on several factors, including occupancy and lease terms. Revenues are recognized in the period the expenses are incurred. The reimbursements are recognized in revenues as tenant recoveries, and the expenses are recorded in rental operations expenses, as we are generally the primary obligor with respect to purchasing goods and services from third-party suppliers, have discretion in selecting the supplier and bear the credit risk.
Lease termination fees are recognized when the related leases are canceled, the amounts to be received are fixed and determinable and collectability is assured, and we have no continuing obligation to provide space to former tenants. Percentage rent is income arising from retail tenant leases that is contingent upon tenant sales exceeding defined thresholds. These rents are recognized only after the contingency has been removed (i.e., when tenant sales thresholds have been achieved).
We maintain an allowance for doubtful accounts for estimated losses resulting from the inability of tenants to make required rent and tenant recovery payments or defaults. We may also maintain an allowance for accrued straight-line rents and amounts due from lease terminations based on our assessment of the collectability of the balance.
Results of Operations
We operate through two reportable business segments: retail properties and office properties. The office segment consists of one property, Excel Centre, with a total of 82,157 leasable square feet. Our Predecessor has owned and operated Excel Centre since 2004. All of our other properties are reported in the retail segment. At December 31, 2010, we owned 20 retail operating properties with a total of approximately 2.5 million of leasable square feet.
We evaluate the performance of our segments based upon property net operating income. “Property Net Operating Income” is defined as total revenues (rental revenue and tenant recoveries) less property operating expenses (maintenance and repairs, real estate taxes, management fees, and other operating expenses) and general and administrative expenses. We also evaluate interest expense, interest income and depreciation and amortization by segment.
You should read the following discussion in conjunction with the segment information disclosed in Note 14 to our consolidated and combined financial statements in accordance with ASC 280, Segment Reporting. Our results of operations include the combination of the Predecessor properties for the period prior to the IPO. Management believes this information provides for the most meaningful comparison as the historical cost of the Predecessor properties were carried over by the company at historical cost subsequent to the IPO and therefore, results of operations for such properties would be comparable for those periods. However, our results of operations may not be indicative of our future results of operations.
Retail Properties
In the year ended December 31, 2010, we acquired 18 retail operating properties for a total of approximately $319.8 million, consisting of $268.1 million of cash and the assumption of $51.7 million of debt. We used cash from the proceeds of the IPO to acquire these properties and borrowings from new mortgage debt and our credit
41
Table of Contents
facility. The following is a comparison, for the years ended December 31, 2010 and 2009 and for the years ended December 31, 2009 and 2008, of the retail property segment operating results of our Predecessor.
Comparison of the Year Ended December 31, 2010 to the Year Ended December 31, 2009
Total revenues, which include rental revenues and tenant recoveries including insurance, property taxes and other operating expenses paid by tenants, increased by $12.3 million to $14.1 million (comprised of $13.6 million for the company and $0.5 million for the Predecessor) for the year ended December 31, 2010 compared to $1.8 million for the year ended December 31, 2009. The increase was directly related to our acquisition of 18 retail operating properties since the completion of the IPO.
Property operating expenses, which include maintenance and repair expenses, real estate taxes, management fees and other operating expenses including bad debts, increased by $2.5 million, or 417%, to $3.1 million (comprised of $2.9 million for the company and $0.2 million for the Predecessor) for the year ended December 31, 2010 compared to $0.6 million for the year ended December 31, 2009. Eight of the properties we acquired are under triple-net leases whereby the tenant pays for all the operating expenses. The increase primarily related to the nine operating retail properties we acquired since the completion of the IPO that are not under triple-net leases.
General and administrative expenses were $7.2 million ($3,000 was for the Predecessor) for the year ended December 31, 2010 compared to $23,000 for the year ended December 31, 2009. General and administrative expenses in the year ended December 31, 2010 primarily relate to our operations since the completion of the IPO, and include salaries and other costs incurred to operate as a public company. They also include approximately $1.6 million in costs related to our property acquisitions. Furthermore, related to the preparation of the IPO, we incurred approximately $1.0 million related to the audits, legal and other various costs that were recognized at the IPO date. Prior to the IPO, there were no general and administrative expenses included in the Predecessor’s results of operations other than those that were directly related to the properties contributed to us by the Predecessor.
Depreciation and amortization expense increased $5.2 million or 473% to $6.3 million (comprised of $6.1 million for the company and $0.2 million for the Predecessor) for the year ended December 31, 2010 compared to $1.1 million for the year ended December 31, 2009. The increase was directly related to our acquisition of the 18 retail properties since the completion of the IPO.
Interest expense increased $2.9 million, or 580%, to $3.4 million (comprised of $3.2 million for the company and $0.2 million for the Predecessor) for the year ended December 31, 2010 compared to $0.5 million for the year ended December 31, 2009. The increase was primarily due to the $108.7 million of mortgage debt we assumed or obtained as part of our acquisitions and $82.0 million in borrowings from our credit facility which was more than the decrease in interest expense from mortgages repaid as part of the Formation Transactions.
Comparison of the Year Ended December 31, 2009 to the Year Ended December 31, 2008
Total revenues, which include rental revenues and tenant recoveries including insurance, property taxes and other operating expenses paid by tenants, decreased by $0.1 million, or 5.3%, to $1.8 million for the year ended December 31, 2009 compared to $1.9 million for the year ended December 31, 2008. The decrease resulted from a vacancy at Newport Towne Center. In January 2009, Goody’s Family Clothing declared bankruptcy and vacated 20,020 square feet of gross leasable area at the property. The vacancy resulted in a decrease in both rental revenues and tenant recoveries at the property.
Property operating expenses, which include maintenance and repair expenses, real estate taxes, management fees and other operating expenses including bad debts, increased by $0.1 million, or 20.0%, to $0.6 million for the year ended December 31, 2009 compared to $0.5 million for the year ended December 31, 2008. The increase resulted from bad debt reserves at Five Forks Place and Newport Towne Center for delinquent tenants over the prior year.
42
Table of Contents
Administrative and miscellaneous expenses increased $5,000, or 27.8%, to $23,000 for the year ended December 31, 2009 compared to $18,000 for the year ended December 31, 2008. The increase resulted from legal expenses related to collection efforts for delinquent tenants.
Depreciation and amortization expense increased $0.3 million, or 37.5%, to $1.1 million for the year ended December 31, 2009 compared to $0.8 million for the year ended December 31, 2008. The increase resulted from Goody’s Family Clothing vacating their space at Newport Towne Center which caused us to depreciate the remaining tangible and intangible assets related to this tenant.
Interest expense decreased $0.3 million, or 37.5%, to $0.5 million for the year ended December 31, 2009 compared to $0.8 million for the year ended December 31, 2008. The decrease was primarily attributable to our variable rate mortgage at Newport Towne Center which incurred interest at a 30-day LIBOR rate in 2009 compared to a twelve-month LIBOR rate in 2008, with the 30-day LIBOR rate in 2009 being lower than the twelve-month LIBOR rate in 2008.
Commercial Office Properties
The following is a comparison, for the years ended December 31, 2010 and 2009 and for the years ended December 31, 2009 and 2008, of the commercial office property segment operating results of our Predecessor.
Comparison of the Year Ended December 31, 2010 to the Year Ended December 31, 2009
Total revenues increased by $0.2 million, or 6.3% to $3.4 million (comprised of $2.4 million for the company and $1.0 million for the Predecessor) for the year ended December 31, 2010 compared to $3.2 million for the year ended December 31, 2009. The increase primarily resulted from the leasing of a vacant space at Excel Centre in March 2009 to Kaiser Permanente.
Property operating expenses did not change significantly (approximately $0.6 million for both the years ended December 31, 2010 and 2009) as there were no significant changes in operations. For the year ended December 31, 2010, the $0.6 million of property operating expenses was comprised of $0.4 million for the company and $0.2 million for the Predecessor.
General and administrative expenses were $5,000 (all from the Predecessor) for the year ended December 31, 2010 compared to $22,000 in the year ended December 31, 2009 as there were expenses incurred in 2009 relating to Kaiser Permanente’s occupancy at Excel Centre that were not incurred in 2010.
Depreciation and amortization expense did not change significantly and was $1.0 million in both the year ended December 31, 2010 ($0.7 million for the company and $0.3 million for the Predecessor) and in the year ended December 31, 2009.
Interest expense did not change significantly (approximately $0.8 million in both the year ended December 31, 2010 and 2009) as there was no significant change in the mortgage balance outstanding other than scheduled principal amortization from monthly debt payments. For the year ended December 31, 2010, the $0.8 million of interest expense was comprised of $0.5 million for the company and $0.3 million for the Predecessor.
Comparison of Year Ended December 31, 2009 to Year Ended December 31, 2008
Total revenues increased by $1.3 million, or 68.4%, to $3.2 million for the year ended December 31, 2009 compared to $1.9 million for the year ended December 31, 2008. The increase resulted from the leasing of vacant space at Excel Centre. In March 2009, vacant space was leased to a tenant, Kaiser Permanente, which resulted in an increase of rental revenue in 2009.
43
Table of Contents
Property operating expenses did not change significantly and was approximately $0.7 million in both the year ended December 31, 2009 and the year ended December 31, 2008.
Administrative and miscellaneous expenses decreased $3,000, or 12.0%, to $22,000 for the year ended December 31, 2009 compared to $25,000 for the year ended December 31, 2008. In 2008, there were general and administrative costs related to a tenant that vacated the property. These were greater than new costs in 2009 relating to Kaiser Permanente which replaced this tenant.
Depreciation and amortization expense increased $0.4 million, or 66.7%, to $1.0 million for the year ended December 31, 2009 compared to $0.6 million for the year ended December 31, 2008. The increase resulted from additional depreciation of tenant improvements added in 2009.
Interest expense did not change significantly (approximately $0.8 million in both the year ended December 31, 2009 and 2008) as there was no significant change in the mortgage balance outstanding other than scheduled principal amortization from monthly debt payments.
Cash Flows
The following is a comparison, for the years ended December 31, 2010 and 2009 and for the years ended December 31, 2009 and 2008, of the combined cash flows of the company and our Predecessor.
Comparison of the Year Ended December 31, 2010 to the Year Ended December 31, 2009
Cash and cash equivalents were $6.5 million and $0.6 million, respectively, at December 31, 2010 and December 31, 2009.
Net cash provided by operating activities decreased $1.4 million to $4.2 million (comprised of $3.9 million for the company and $0.3 million for the Predecessor) for the year ended December 31, 2010 compared to $5.6 million for the year ended December 31, 2009. The decrease was primarily due to a net loss of $3.9 million in 2010 compared to net income of $0.2 million in 2009. Of the net loss in 2010, depreciation and amortization was $6.7 million. Also included in 2010 net loss was a gain of $1.0 million resulting from a business combination. In 2009, depreciation was $2.0 million. Additionally, accounts payable and other liabilities increased $0.7 million and accounts receivable and other assets increased $2.8 million. The changes in liabilities and assets are primarily due from the operations related to the properties acquired since the completion of the IPO.
Net cash used in investing activities increased $322.2 million to $327.5 million (comprised of $327.3 million for the company and $0.2 million for the Predecessor) for the year ended December 31, 2010 compared to $5.3 million for the year ended December 31, 2009. The increase was primarily the result of $320.4 million of cash used for property acquisitions, development and property improvements in 2010, $5.3 million increase in restricted cash deposits, and $2.0 million advanced for a note receivable.
Net cash provided by financing activities increased by $329.4 million to $329.2 million (comprised of $329.9 million provided by the company and $0.7 million used by the Predecessor) for the year ended December 31, 2010 from ($0.2 million) of cash used in the year ended December 31, 2009. The increase was primarily due to $194.6 million in net proceeds raised from the IPO. Additionally, the company borrowed $153.2 million in mortgage and notes payable, primarily for property acquisitions. These were partially offset by $13.0 million in mortgage debt repayments, $1.3 million repaid in owner advances to our Predecessor and $1.8 million paid to buy certain non-controlling interests in the Excel Centre office building
Comparison of the Years Ended December 31, 2009 to the Years Ended December 31, 2008
Cash and cash equivalents were $0.5 million and $0.7 million, respectively, at December 31, 2009 and 2008.
44
Table of Contents
Net cash provided by operating activities increased $4.5 million to $5.6 million for the year ended December 31, 2009 compared to $1.1 million for the year ended December 31, 2008. The increase was due to an increase in deferred rents related to Kaiser Permanente. In addition, there was $0.6 million of additional depreciation and amortization primarily related to tenant improvements added in 2009.
Net cash used in investing activities increased $4.5 million to $5.2 million for the year ended December 31, 2009 compared to $0.7 million for the year ended December 31, 2008. The increase was the result of $4.8 million of additional cash used for tenant improvements in 2009 for new tenants, primarily Kaiser Permanente. There was also $0.5 million of additional deferred leasing costs related to these new tenants. These increases were offset by $0.8 million of additional cash flows provided by utilization of restricted cash for the tenant improvements in the year ended December 31, 2009 over the year ended December 31, 2008.
Net cash used in financing activities decreased $0.4 million to $0.2 million for the year ended December 31, 2009 compared to $0.6 million for the year ended December 31, 2008. The decrease in 2009 was due to a $0.7 million reduction in cash used to repay mortgages payable primarily related to the repayment of the mortgage debt for Red Rock Commons in 2008. There was also an increase in cash used for tenant security deposits of $0.6 million primarily related to deposits for a new tenant at Excel Centre that were applied to rents in 2009.
Funds From Operations
We present FFO because we consider FFO an important supplemental measure of our operating performance and believe it is frequently used by securities analysts, investors and other interested parties in the evaluation of REITs, many of which present FFO when reporting their results. FFO is intended to exclude GAAP historical cost depreciation and amortization of real estate and related assets, which assumes that the value of real estate assets diminishes ratably over time. Historically, however, real estate values have risen or fallen with market conditions. Because FFO excludes depreciation and amortization unique to real estate, gains and losses from property dispositions and extraordinary items, it provides a performance measure that, when compared year-over-year, reflects the impact to operations from trends in occupancy rates, rental rates, operating costs, development activities and interest costs, providing perspective not immediately apparent from net income. We compute FFO in accordance with standards established by the Board of Governors of NAREIT in its March 1995 White Paper (as amended in November 1999 and April 2002). As defined by NAREIT, FFO represents net income (computed in accordance with GAAP), excluding gains (or losses) from sales of property, plus real estate related depreciation and amortization (excluding amortization of loan origination costs) and after adjustments for unconsolidated partnerships and joint ventures. Our computation may differ from the methodology for calculating FFO utilized by other equity REITs and, accordingly, may not be comparable to such other REITs. Further, FFO does not represent amounts available for management’s discretionary use because of needed capital replacement or expansion, debt service obligations, or other commitments and uncertainties. FFO should not be considered as an alternative to net income (loss) (computed in accordance with GAAP) as an indicator of our financial performance or to cash flow from operating activities (computed in accordance with GAAP) as an indicator of our liquidity, nor is it indicative of funds available to fund our cash needs, including our ability to pay dividends or make distributions.
The following table presents a reconciliation of FFO for the periods presented (in thousands):
| The Company | The Predecessor | |||||||||||||||
| Period from April 28, 2010 to December 31, 2010 |
Period January 1, 2010 to April 27, 2010 |
2009 | 2008 | |||||||||||||
| Net (loss) income |
$ | (3,873 | ) | $ | 156 | $ | 318 | $ | (326 | ) | ||||||
| Depreciation and amortization |
6,727 | 542 | 2,045 | 1,403 | ||||||||||||
| Gain on acquisition of joint venture equity interest |
(978 | ) | — | — | — | |||||||||||
| Funds from operations |
$ | 1,876 | $ | 698 | $ | 2,363 | $ | 1,077 | ||||||||
45
Table of Contents
Liquidity and Capital Resources
On April 28, 2010, we completed our IPO. Net proceeds for the operating partnership were approximately $194.6 million, which were partially used to acquire real estate, pay for the formation transactions and for general corporate and working capital purposes. At December 31, 2010, we had $6.5 million of cash and cash equivalents on hand.
Our short-term liquidity requirements consist primarily of funds to pay for operating expenses and other expenditures directly associated with our properties, including:
| • | interest expense and scheduled principal payments on outstanding indebtedness, |
| • | general and administrative expenses, |
| • | future distributions expected to be paid to our stockholders and limited partners of our operating partnership, |
| • | anticipated and unanticipated capital expenditures, tenant improvements and leasing commissions and |
| • | construction of our three non-operating properties |
Our long term liquidity requirements consist primarily of funds to pay for property acquisitions, scheduled debt maturities, renovations, expansions, capital commitments, construction obligations and other non-recurring capital expenditures that need to be made periodically, and the costs associated with acquisitions and developments of new properties that we pursue.
We intend to satisfy our short-term liquidity requirements through our existing working capital and cash provided by our operations. We believe our rental revenue net of operating expenses will generally provide cash inflows to meet our debt service obligations, pay general and administrative expenses and fund regular distributions. We expect to incur approximately $37.6 million of additional construction costs on our three non-operating properties. Funds for these costs are expected to come from new mortgage financing, borrowings from our credit facility and existing cash. We intend to satisfy our other long-term liquidity requirements through our existing working capital, cash provided by indebtedness, long-term secured and unsecured indebtedness and the use of net proceeds from the disposition of non-strategic assets. In addition, we may, from time to time, offer and sell additional shares of preferred stock, as well as debt securities, common stock, warrants, rights and other securities to the extent necessary or advisable to meet our liquidity needs.
As of December 31, 2010, our mortgage indebtedness consisted of the following:
| Property Pledged as Collateral |
Principal Balance |
Interest Rate |
Monthly Payment(1) |
Maturity Date |
||||||||||||
| Excel Centre |
$ | 12,768 | 6.08 | % | 85 | 2014 | ||||||||||
| Five Forks Place |
5,242 | 5.50 | % | 39 | 2013 | |||||||||||
| 5000 South Hulen |
14,086 | 5.60 | % | 83 | 2017 | |||||||||||
| Lowe’s, Shippensburg |
14,147 | 7.20 | % | 110 | 2031 | |||||||||||
| Merchant Central |
4,647 | 5.94 | % | 30 | 2014 | |||||||||||
| Grant Creek Town Center |
16,029 | 5.75 | % | 105 | 2013 | |||||||||||
| Mariner’s Point |
3,482 | 7.10 | % | 25 | 2011 | |||||||||||
| Park West Place |
55,800 | 3.91 | % | 182 | 2013 | |||||||||||
| Northside Plaza |
12,000 | 0.36 | % | 4 | 2035 | |||||||||||
| $ | 138,201 | |||||||||||||||
| Less: discount |
(1,158 | ) | ||||||||||||||
| Mortgage notes payable, net |
$ | 137,043 | ||||||||||||||
| (1) | This represents the monthly payment of principal and interest at December 31, 2010. |
46
Table of Contents
We have one mortgage with a balance of $3.5 million maturing in 2011. We anticipate that we will either refinance this mortgage with a new loan or repay the debt with available cash or borrowings from our credit facility.
On July 8, 2010, we entered into an unsecured revolving credit facility with Wells Fargo Securities, LLC and KeyBanc Capital Markets, as joint lead arrangers and bookrunners, and certain other lenders, as amended from time to time. The credit agreement provides for a revolving credit facility of up to $125.0 million. We have the ability from time to time to increase the size of the revolving credit facility by up to an additional $275.0 million to a total of $400.0 million, subject to receipt of lender commitments and other conditions precedent. The maturity date is July 7, 2013 and can be extended for one year at our option. The outstanding balance on our revolving credit facility at December 31, 2010 was $82.0 million which was primarily used to acquire properties. Additionally, we issued a $12.1 million letter of credit under the facility. In January 2011, we repaid $47.7 million on the credit facility from proceeds from the offering of the Series A preferred stock .
The revolving credit facility bears interest at the rate of LIBOR plus a margin of 275 basis points to 400 basis points, depending on our leverage ratio, provided that in no event shall LIBOR be deemed to be less than 1.50% (interest rate at December 31, 2010 was 4.25%). We also pay a 0.45% fee for any unused portion of the revolving credit facility.
Our ability to borrow funds under the credit agreement, as amended, and the amount of funds available under the credit agreement at any particular time, are subject to our meeting borrowing base requirements. The amount of funds we can borrow is determined by the net operating income of our unencumbered assets that will comprise the borrowing base. We are also subject to ongoing compliance with a number of customary restrictive covenants, including:
| • | a maximum leverage ratio (defined as total liabilities to total asset value) of (1) 0.60 : 1.00, until the earlier of (a) an equity issuance of common stock or preferred stock by us with gross proceeds of at least $75.0 million to $125.0 million, depending on our property holdings (a Follow-On Offering), and (b) December 31, 2011, and (2) 0.55 : 1.00 at any time thereafter, |
| • | a minimum fixed charge coverage ratio (defined as adjusted earnings before interest, taxes, depreciation and amortization to fixed charges) of (1) 1.50 : 1.00 as of the end of each fiscal quarter ending prior to December 31, 2011 and (2) 1.75 : 1.00 as of the fiscal quarter ending December 31, 2011, and as of each fiscal quarter ending thereafter, |
| • | a maximum secured indebtedness ratio (defined as secured indebtedness to total asset value) of 0.35 : 1.00, |
| • | a maximum unencumbered leverage ratio (defined as unsecured indebtedness to unencumbered asset value) of (1) 0.60 : 1.00 until the earlier of (a) a Follow-On Offering and (b) December 31, 2011, and (2) 0.55 : 1.00 at any time thereafter, |
| • | a minimum unencumbered interest coverage ratio (defined as unencumbered net operating income to unsecured interest expense) of 2.00 : 1.00, and |
| • | a minimum tangible net worth equal to approximately $169.0 million plus 80% of the net proceeds of any additional equity issuances. |
Under the credit agreement, cash dividends on our common stock, as well as our preferred stock, may not exceed the greater of (1)(a) during the period from October 1, 2010 to June 30, 2011, 110% of our FFO, and (b) beginning on July 1, 2011, 95% of our FFO, and (2) the amount required for us to qualify and maintain our REIT status. If an event of default exists, we may only make distributions sufficient to qualify and maintain our REIT status. As of December 31, 2010, we were in compliance with all of the covenants under the credit agreement.
47
Table of Contents
On January 28, 2011, we issued 2,000,000 shares of 7.00% Series A Cumulative Convertible Perpetual Preferred Stock, par value $0.01 per share, with a liquidation preference of $25.00 per share. We will pay cumulative dividends on the Series A preferred stock from the date of original issue at a rate of 7.00% per annum, subject to adjustment in certain circumstances. The annual dividend on each share of Series A preferred stock is $1.75, payable quarterly in arrears on the 15th calendar day of January, April, July and October of each year, commencing on April 15, 2011, as and if declared by our board of directors. Net proceeds from this offering was approximately $47.7 million in cash. We used the net proceeds of this offering to repay a portion of the outstanding indebtedness under the revolving credit facility.
As of December 31, 2010, our ratio of debt-to-gross undepreciated asset value was approximately 54.4%. Our organizational documents do not limit the amount or percentage of debt that we may incur, nor do they limit the types of properties we may acquire or develop, and our board of directors may modify our debt policy from time to time. The amount of leverage we will deploy for particular investments in our target assets will depend upon our management team’s assessment of a variety of factors, which may include the anticipated liquidity and price volatility of the target assets in our investment portfolio, the potential for losses, the availability and cost of financing the assets, our opinion of the creditworthiness of our financing counterparties, the health of the U.S. economy and commercial mortgage markets, our outlook for the level, slope and volatility of interest rates, the credit quality of our target assets and the collateral underlying our target assets. Accordingly, the ratio of debt-to-gross undepreciated asset value may increase or decrease beyond the current amount.
Commitments and Contingencies
The following table outlines the timing of our required payments (dollars in thousands) related to our mortgage and note indebtedness as of December 31, 2010:
| Payments by Period | ||||||||||||||||||||
| 2011 | 2012-2013 | 2014-2015 | Thereafter | Total | ||||||||||||||||
| Principal payments — fixed rate debt |
$ | 4,835 | $ | 81,757 | $ | 17,646 | $ | 25,347 | $ | 129,585 | ||||||||||
| Principal payments — variable rate debt |
— | 82,000 | — | 12,000 | 94,000 | |||||||||||||||
| Interest payments — fixed rate debt |
6,653 | 11,561 | 3,801 | 9,252 | 31,267 | |||||||||||||||
| Interest payments — variable rate debt |
3,917 | 6,158 | 864 | 8,586 | 19,525 | |||||||||||||||
| $ | 15,405 | $ | 181,476 | $ | 22,311 | $ | 55,185 | $ | 274,377 | |||||||||||
Off-Balance Sheet Arrangements
As of December 31, 2010, we had one $2 million note receivable related to a mezzanine loan to PC Retail, LLC to facilitate the land acquisition and development of a shopping center anchored by Publix in Brandon, Florida. The loan is secured with a second mortgage trust deed on the property and is personally guaranteed by members of PC Retail, LLC. We have also entered into a Purchase and Sale Agreement with PC Retail, LLC to acquire the property upon completion. The purchase price will be based on the income from leasing of the center.
We do not have any other relationships with unconsolidated entities or financial partnerships, such as entities often referred to as structured finance or special purposes entities, which typically are established for the purpose of facilitating off-balance sheet arrangements or other contractually narrow or limited purposes. Further, we have not guaranteed any obligations of unconsolidated entities nor do we have any commitments or intent to provide funding to any such entities. Accordingly, we are not materially exposed to any other financing, liquidity, market or credit risk that could arise if we had engaged in these relationships, than as described above.
48
Table of Contents
Distribution Policy
We intend to elect to be taxed as a REIT under the Code commencing with our taxable year ended December 31, 2010. To qualify as a REIT, we must meet a number of organizational and operational requirements, including the requirement that we distribute currently at least 90% of our REIT taxable income to our stockholders. It is our intention to comply with these requirements and maintain our REIT status. As a REIT, we generally will not be subject to corporate United States federal, state or local income taxes on income we distribute currently (in accordance with the Code and applicable regulations) to our stockholders. If we fail to qualify as a REIT in any taxable year, we will be subject to United States federal, state and local income taxes at regular corporate rates and may not be able to qualify as a REIT for subsequent tax years. Even if we qualify for United States federal taxation as a REIT, we may be subject to certain state and local taxes on our income properties and operations and to United States federal income and excise taxes on our taxable income not distributed in the amounts and in the time frames prescribed by the Code and applicable regulations thereunder.
Inflation
Some of our leases contain provisions designed to mitigate the adverse impact of inflation. These provisions generally increase rental rates during the terms of the leases either at fixed rates or indexed escalations (based on the Consumer Price Index or other measures). We may be adversely impacted by inflation on our leases that do not contain indexed escalation provisions. In addition, most of our leases require the tenant to pay its share of operating expenses, including common area maintenance costs, real estate taxes and insurance. This may reduce our exposure to increases in costs and operating expenses resulting from inflation, assuming our properties remain leased and tenants fulfill their obligations to reimburse us for such expenses.
New Accounting Pronouncements
Effective January 1, 2010, our Predecessor adopted the requirements of Accounting Standards Update No. 2009-17, Consolidations (Topic 810): Improvements to Financial Reporting by Enterprises Involved with Variable Interest Entities (ASU No. 2009-17). Update No. 2009-17 requires enterprises to perform a qualitative approach to determining whether or not a variable interest entity will need to be consolidated on a continuous basis. This evaluation is based on an enterprise’s ability to direct and influence the activities of a variable interest entity that most significantly impact that entity’s economic performance. On the date of adoption, ASU No. 2009-17 did not have an effect on our Predecessor’s combined financial statements.
In January 2010, the Financial Accounting Standards Board (FASB) issued Accounting Standards Update No. 2010-06, Fair Value Measurements and Disclosures (Topic 820): Improving Disclosures about Fair Value Measurements (ASU No. 2010-06). The amendments in this update require, among other things, new disclosures and clarifications of existing disclosures related to transfers in and out of Level 1 and Level 2 fair value measurements, further disaggregation of fair value measurement disclosures for each class of assets and liabilities, and additional details of valuation techniques and inputs utilized. Additionally, the guidance requires a roll forward of activities on purchases, sales, issuance, and settlements of the assets and liabilities measured using significant unobservable inputs (Level 3 fair value measurements). The guidance became effective for our Predecessor on January 1, 2010, except for the disclosure on the roll forward activities for any Level 3 fair value measurements, which will become effective with the reporting period beginning January 1, 2011. Adoption of this new guidance requires additional disclosures of fair value measurements but did not have a material impact on our Predecessor’s footnote disclosure.
In July 2010, the FASB issued Accounting Standards Update No. 2010-20, Receivables (Topic 310): Disclosures about the Credit Quality of Financing Receivables and the Allowance for Credit Losses. The amendments in this update require additional disclosure about the credit quality of financing receivables, such as aging information and credit quality indicators. Both new and existing disclosures must be disaggregated by portfolio segment or class. The disaggregation of information is based on how allowances for credit losses are
49
Table of Contents
developed and how credit exposure is managed. This update is effective for interim periods and fiscal years ending after December 15, 2010. The adoption of these requirements on December 31, 2010 did not have a material impact on our consolidated financial position or results of operations.
In December 2010, the FASB issued ASU No. 2010-29, Disclosure of Supplementary Pro Forma Information for Business Combinations (ASU 2010-29), which amended ASC Topic 805, Business Combinations (ASC 805). The objective of this guidance is to eliminate diversity in the interpretation of pro forma revenue and earnings disclosure requirements for business combinations. The guidance specifies that if a public entity presents comparative financial statements, the entity should disclose revenue and earnings of the combined entity as though the business combination(s) that occurred during the current year had occurred as of the beginning of the comparable prior annual reporting period only. The guidance also expands the supplemental pro forma disclosures under ASC 805 to include a description of the nature and amount of material, nonrecurring pro forma adjustments directly attributable to the business combination(s) included in the reported pro forma revenue and earnings. ASU 2010-29 is effective for business combinations for which the acquisition date occurs following the first annual reporting period which commences after December 15, 2010. The guidance is required in interim and annual reporting periods. Early adoption is permitted. Our adoption of this guidance effective January 1, 2011 is not expected to have a material effect on our consolidated financial statements.
| ITEM 7A. | Quantitative and Qualitative Disclosures About Market Risk |
Our future income, cash flows and fair values relevant to financial instruments depend upon prevailing market interest rates. Market risk is the exposure to loss resulting from changes in interest rates, foreign currency exchange rates, commodity prices and equity prices. The primary market risk to which we believe we are exposed is interest rate risk. Many factors, including governmental monetary and tax policies, domestic and international economic and political considerations and other factors that are beyond our control contribute to interest rate risk.
The fair value of mortgages payable at December 31, 2010 was approximately $139.1 million compared to the face value of $138.2 million. A 100 basis point increase in market interest rates would result in a decrease in the fair value of our fixed-rate debt by approximately $2.8 million at December 31, 2010. A 100 basis point decrease in market interest rates would result in an increase in the fair market value of our fixed-rate debt by approximately $3.0 million at December 31, 2010.
On July 8, 2010, we entered into a $125.0 million revolving credit facility. The revolving credit facility bears interest at the rate of LIBOR plus a margin of 275 basis points to 400 basis points, depending on our leverage ratio, provided that in no event shall LIBOR be deemed to be less than 1.50% (interest rate at December 31, 2010 was 4.25%). As of December 31, 2010, due to this LIBOR floor, an increase of LIBOR of 100 basis points would not result in a change to the interest rate of our revolving credit facility. Any increase in LIBOR above 1.50% would increase the interest we incur for amounts drawn under this revolving credit facility, if any, and would reduce our cash flows. As of December 31, 2010, we had $94.1 million of debt and commitments outstanding under our revolving credit facility, which includes a $12.1 million letter of credit issued under the facility.
In order to modify and manage the interest rate characteristics of our outstanding debt and to limit the effects of interest rate risks on our operations, we may utilize a variety of financial instruments, including interest rate swaps, caps, floors and other interest rate exchange contracts. The use of these types of instruments to hedge our exposure to changes in interest rates carries additional risks, including counterparty credit risk, the enforceability of hedging contracts and the risk that unanticipated and significant changes in interest rates will cause a significant loss of basis in the contract. To limit counterparty credit risk we will seek to enter into such agreements with major financial institutions with high credit ratings. There can be no assurance that we will be able to adequately protect against the foregoing risks and that we will ultimately realize an economic benefit that exceeds the related amounts incurred in connection with engaging in such hedging activities. We do not enter into such contracts for speculative or trading purposes.
50
Table of Contents
As of December 31, 2010, the Company had two interest rate derivatives that were designated as cash flow hedges of interest rate risk. Both derivatives were interest rate swaps and the notional amount totaled $55,800. The interest rate swap contracts fixed LIBOR at an average of 1.41% for the term of a mortgage loan which expires in December 2013. The fair value of these derivative financial instruments classified as liability derivatives was $388.
| ITEM 8. | Financial Statements and Supplemental Data |
INDEX TO FINANCIAL STATEMENTS
AND
FINANCIAL STATEMENT SECHEDULES
| Page | ||||
| 52 | ||||
| 53 | ||||
| 54 | ||||
| 55 | ||||
| 56 | ||||
| 58 | ||||
| Financial Statements Schedules — |
||||
| 79 | ||||
| 80 | ||||
| 81 | ||||
51
Table of Contents
REPORT OF INDEPENDENT REGISTERED PUBLIC ACCOUNTING FIRM
To the Board of Directors and Stockholders of Excel Trust, Inc. and the Owners of Excel Trust, Inc. Predecessor:
We have audited the accompanying consolidated and combined balance sheets of Excel Trust, Inc. as of December 31, 2010 (the “Company”) and Excel Trust, Inc. Predecessor (the “Predecessor”) as of December 31, 2009, and the related consolidated and combined statements of operations, equity and cash flows for the period from April 28, 2010 to December 31, 2010 of the Company and for the period from January 1, 2010 to April 27, 2010 and each of the two years in the period ended December 31, 2009 of the Predecessor. Our audits also included the consolidated and combined financial statement schedules listed in the Index to the Financial Statements. These financial statements and the financial statement schedules are the responsibility of the Company’s management. Our responsibility is to express an opinion on these financial statements based on our audits.
We conducted our audits in accordance with the standards of the Public Company Accounting Oversight Board (United States). Those standards require that we plan and perform the audit to obtain reasonable assurance about whether the financial statements are free of material misstatement. The Company is not required to have, nor were we engaged to perform, an audit of its internal control over financial reporting. Our audits included consideration of internal control over financial reporting as a basis for designing audit procedures that are appropriate in the circumstances, but not for the purpose of expressing an opinion on the effectiveness of the Company’s internal control over financial reporting. Accordingly, we express no such opinion. An audit also includes examining, on a test basis, evidence supporting the amounts and disclosures in the financial statements, assessing the accounting principles used and significant estimates made by management, as well as evaluating the overall financial statement presentation. We believe that our audits provide a reasonable basis for our opinion.
In our opinion, such consolidated and combined financial statements present fairly, in all material respects, the financial position of the Company as of December 31, 2010 and the Predecessor as of December 31, 2009, and the results of their operations and their cash flows for the period from April 28, 2010 to December 31, 2010 of the Company and the period from January 1, 2010 to April 27, 2010 and each of the two years in the period ended December 31, 2009 of the Predecessor in conformity with accounting principles generally accepted in the United States of America. Also, in our opinion, such consolidated and combined financial statement schedules, when considered in relation to the basic consolidated and combined financial statements taken as a whole, present fairly in all material respects, the information set forth therein.
/s/ DELOITTE & TOUCHE LLP
Los Angeles, California
March 9, 2011
52
Table of Contents
EXCEL TRUST, INC. PREDECESSOR
CONSOLIDATED AND COMBINED BALANCE SHEETS
(Dollars in thousands)
| The Company | The Predecessor | |||||||
| December 31, 2010 |
December 31, 2009 |
|||||||
| ASSETS: |
||||||||
| Property: |
||||||||
| Land |
$ | 153,601 | $ | 15,300 | ||||
| Buildings |
178,374 | 20,538 | ||||||
| Site improvements |
18,832 | 2,445 | ||||||
| Tenant improvements |
18,242 | 6,629 | ||||||
| Construction in progress |
4,423 | 1,438 | ||||||
| Less accumulated depreciation |
(8,360 | ) | (4,481 | ) | ||||
| Property, net |
365,112 | 41,869 | ||||||
| Cash and cash equivalents |
6,525 | 661 | ||||||
| Restricted cash |
5,870 | 524 | ||||||
| Tenant receivables, net |
1,945 | 97 | ||||||
| Lease intangibles, net |
53,024 | 1,118 | ||||||
| Mortgage loan receivable |
2,000 | — | ||||||
| Deferred rent receivable |
1,148 | 583 | ||||||
| Other assets |
5,464 | 604 | ||||||
| Total assets |
$ | 441,088 | $ | 45,456 | ||||
| LIABILITIES AND EQUITY: |
||||||||
| Liabilities: |
||||||||
| Mortgages payable, net |
$ | 137,043 | $ | 30,190 | ||||
| Notes payable |
85,384 | — | ||||||
| Accounts payable and other liabilities |
12,944 | 3,973 | ||||||
| Lease intangibles, net |
7,150 | 555 | ||||||
| Dividends/distributions payable |
1,957 | — | ||||||
| Due to owner |
— | 1,216 | ||||||
| Total liabilities |
244,478 | 35,934 | ||||||
| Commitments and contingencies |
||||||||
| Equity: |
||||||||
| Stockholders’ equity and owner’s equity |
||||||||
| Common stock, $.01 par value, 200,000,000 shares authorized; 15,663,331 shares issued and outstanding |
156 | — | ||||||
| Additional paid-in capital |
191,453 | — | ||||||
| Cumulative distributions in excess of net income |
(3,725 | ) | — | |||||
| 187,884 | — | |||||||
| Accumulated other comprehensive loss |
(373 | ) | — | |||||
| Total stockholders’ equity |
187,511 | — | ||||||
| Owner’s equity |
— | 8,622 | ||||||
| Non-controlling interests |
9,099 | 900 | ||||||
| Total equity |
196,610 | 9,522 | ||||||
| Total liabilities and equity |
$ | 441,088 | $ | 45,456 | ||||
The accompanying notes are an integral part of these consolidated and combined financial statements.
53
Table of Contents
EXCEL TRUST, INC. PREDECESSOR
CONSOLIDATED AND COMBINED STATEMENTS OF OPERATIONS
(Dollars in thousands)
| The Company | The Predecessor | The Predecessor | The Predecessor | |||||||||||||
| Period from April 28, 2010 to December 31, 2010 |
Period January 1, 2010 to April 27, 2010 |
Year Ended December 31, 2009 |
Year Ended December 31, 2008 |
|||||||||||||
| Revenues: |
||||||||||||||||
| Rental revenue |
$ | 13,641 | $ | 1,455 | $ | 4,731 | $ | 3,540 | ||||||||
| Tenant recoveries |
2,134 | 113 | 259 | 292 | ||||||||||||
| Other income |
143 | — | — | — | ||||||||||||
| Total revenues |
15,918 | 1,568 | 4,990 | 3,832 | ||||||||||||
| Expenses: |
||||||||||||||||
| Maintenance and repairs |
707 | 98 | 245 | 210 | ||||||||||||
| Real estate taxes |
1,685 | 140 | 399 | 404 | ||||||||||||
| Management fees |
119 | 43 | 134 | 118 | ||||||||||||
| Other operating expenses |
853 | 98 | 451 | 416 | ||||||||||||
| General and administrative |
7,152 | 8 | 45 | 43 | ||||||||||||
| Depreciation and amortization |
6,727 | 542 | 2,045 | 1,403 | ||||||||||||
| Total expenses |
17,243 | 929 | 3,319 | 2,594 | ||||||||||||
| Net operating (loss) income |
(1,325 | ) | 639 | 1,671 | 1,238 | |||||||||||
| Interest expense |
(3,692 | ) | (483 | ) | (1,359 | ) | (1,593 | ) | ||||||||
| Interest income |
166 | — | 6 | 29 | ||||||||||||
| Gain on acquisition of real estate |
978 | — | — | — | ||||||||||||
| Net (loss) income |
(3,873 | ) | 156 | 318 | (326 | ) | ||||||||||
| Non-controlling interests |
(148 | ) | 290 | 75 | 56 | |||||||||||
| Net (loss) income attributable to the common stockholders and controlling interest of Predecessor |
$ | (3,725 | ) | $ | (134 | ) | $ | 243 | $ | (382 | ) | |||||
| Basic and diluted loss per share |
$ | (0.24 | ) | |||||||||||||
| Weighted-average common shares outstanding — basic and diluted |
15,510 | |||||||||||||||
| Net (loss) income |
$ | (3,873 | ) | $ | 156 | $ | 318 | $ | (326 | ) | ||||||
| Other comprehensive income: |
||||||||||||||||
| Change in unrealized loss on interest rate swaps |
(388 | ) | — | — | — | |||||||||||
| Comprehensive (loss) income |
(4,261 | ) | 156 | 318 | (326 | ) | ||||||||||
| Comprehensive loss attributable to non-controlling interests |
(163 | ) | 290 | 75 | 56 | |||||||||||
| Comprehensive (loss) income attributable to the common stockholders and controlling interest of Predecessor |
$ | (4,098 | ) | $ | (134 | ) | $ | 243 | $ | (382 | ) | |||||
The accompanying notes are an integral part of these consolidated and combined financial statements.
54
Table of Contents
EXCEL TRUST, INC. PREDECESSOR
CONSOLIDATED AND COMBINED STATEMENTS OF EQUITY
(Dollars in thousands)
The Predecessor
| Total Owner’s Equity |
Non-controlling Interests |
Total Equity |
||||||||||
| Balance January 1, 2008 |
$ | 8,132 | $ | 652 | $ | 8,784 | ||||||
| Contributions |
572 | 104 | 676 | |||||||||
| Distributions |
(392 | ) | (56 | ) | (448 | ) | ||||||
| Net (loss) income |
(382 | ) | 56 | (326 | ) | |||||||
| Balance December 31, 2008 |
7,930 | 756 | 8,686 | |||||||||
| Contributions |
674 | 144 | 818 | |||||||||
| Distributions |
(225 | ) | (75 | ) | (300 | ) | ||||||
| Net income |
243 | 75 | 318 | |||||||||
| Balance December 31, 2009 |
$ | 8,622 | $ | 900 | $ | 9,522 | ||||||
| Contributions |
316 | 63 | 379 | |||||||||
| Distributions |
(707 | ) | (290 | ) | (997 | ) | ||||||
| Net (loss) income |
(134 | ) | 290 | 156 | ||||||||
| Balance April 27, 2010 |
$ | 8,097 | $ | 963 | $ | 9,060 | ||||||
The Company
| Number of Shares |
Common Stock |
Additional Paid-in Capital |
Accumulated Deficit |
Accumulated other Compre- hensive Loss |
Total Stockholders’ Equity |
Non- controlling Interests |
Owner’s Equity |
Total Equity |
Compre- hensive Loss |
|||||||||||||||||||||||||||||||
| Balance at April 28, 2010 |
— | $ | — | $ | — | $ | — | $ | — | $ | — | $ | 963 | $ | 8,097 | $ | 9,060 | $ | — | |||||||||||||||||||||
| Issuance of common stock |
15,000,000 | 150 | 209,850 | — | — | 210,000 | — | 210,000 | ||||||||||||||||||||||||||||||||
| Offering costs |
— | — | (15,398 | ) | — | — | (15,398 | ) | — | — | (15,398 | ) | — | |||||||||||||||||||||||||||
| Initial contribution and acquisition of Predecessor interests: |
||||||||||||||||||||||||||||||||||||||||
| Exchange of Predecessor equity for Company common stock |
454,008 | 4 | 8,507 | — | — | 8,511 | — | (8,097 | ) | 414 | — | |||||||||||||||||||||||||||||
| Exchange of Predecessor non-controlling interest for Company common stock |
53,985 | — | 1,049 | — | — | 1,049 | (963 | ) | — | 86 | — | |||||||||||||||||||||||||||||
| Predecessor non-controlling interests purchased |
— | — | (1,812 | ) | — | — | (1,812 | ) | — | — | (1,812 | ) | — | |||||||||||||||||||||||||||
| Adjustment for non-controlling interest |
— | — | (7,965 | ) | — | — | (7,965 | ) | 7,965 | — | — | — | ||||||||||||||||||||||||||||
| Issuance of restricted common stock awards |
155,338 | 2 | (2 | ) | — | — | — | — | — | — | — | |||||||||||||||||||||||||||||
| Noncash amortization of share-based compensation |
— | — | 357 | — | — | 357 | — | — | 357 | — | ||||||||||||||||||||||||||||||
| Dividends/distributions |
— | — | (3,133 | ) | — | — | (3,133 | ) | (128 | ) | (3,261 | ) | ||||||||||||||||||||||||||||
| Contributions from non-controlling interests |
1,425 | 1,425 | — | |||||||||||||||||||||||||||||||||||||
| Comprehensive Loss: |
||||||||||||||||||||||||||||||||||||||||
| Net loss |
— | — | — | (3,725 | ) | — | (3,725 | ) | (148 | ) | — | (3,873 | ) | (3,873 | ) | |||||||||||||||||||||||||
| Change in unrealized loss on interest rate swaps |
— | — | — | — | (373 | ) | (373 | ) | (15 | ) | — | (388 | ) | (388 | ) | |||||||||||||||||||||||||
| Balance at December 31, 2010 |
15,663,331 | $ | 156 | $ | 191,453 | $ | (3,725 | ) | $ | (373 | ) | $ | 187,511 | $ | 9,099 | $ | — | $ | 196,610 | $ | (4,261 | ) | ||||||||||||||||||
The accompanying notes are an integral part of these consolidated and combined financial statements.
55
Table of Contents
EXCEL TRUST, INC. PREDECESSOR
CONSOLIDATED AND COMBINED STATEMENTS OF CASH FLOWS
(Dollars in thousands)
| The Company | The Predecessor | The Predecessor | The Predecessor | |||||||||||||
| Period from April 28, 2010 to December 31, 2010 |
Period from January 1, 2010 to April 27, 2010 |
Year Ended December 31, 2009 |
Year Ended December 31, 2008 |
|||||||||||||
| Cash flows from operating activities: |
||||||||||||||||
| Net (loss) income |
$ | (3,873 | ) | $ | 156 | $ | 318 | $ | (326 | ) | ||||||
| Adjustments to reconcile net (loss) income to net cash provided by operating activities: |
||||||||||||||||
| Depreciation and amortization |
6,727 | 542 | 2,045 | 1,403 | ||||||||||||
| Gain on acquisition of joint venture interest |
(978 | ) | — | — | — | |||||||||||
| Deferred rent receivable |
(499 | ) | (66 | ) | (183 | ) | 37 | |||||||||
| Amortization of above and below market leases |
(113 | ) | (20 | ) | (167 | ) | (85 | ) | ||||||||
| Amortization of deferred financing costs |
295 | 22 | — | — | ||||||||||||
| Bad debt expense |
348 | 16 | 189 | 175 | ||||||||||||
| Amortization of share-based compensation |
357 | — | — | — | ||||||||||||
| Change in assets and liabilities: |
||||||||||||||||
| Tenant and other receivables |
(2,276 | ) | 64 | (72 | ) | (190 | ) | |||||||||
| Other assets |
(562 | ) | (86 | ) | (3 | ) | (12 | ) | ||||||||
| Accounts payable and other liabilities |
4,494 | (327 | ) | 3,488 | 76 | |||||||||||
| Net cash provided by operating activities |
3,920 | 301 | 5,615 | 1,078 | ||||||||||||
| Cash flows from investing activities: |
||||||||||||||||
| Acquisitions of property, development and property improvements |
(320,223 | ) | (132 | ) | (5,609 | ) | (833 | ) | ||||||||
| Advance for mortgage loan receivable |
(2,000 | ) | — | — | — | |||||||||||
| Capitalized leasing costs |
(432 | ) | (94 | ) | (439 | ) | 38 | |||||||||
| Due from owner |
— | — | — | 161 | ||||||||||||
| Restricted cash |
(4,629 | ) | (12 | ) | 800 | (44 | ) | |||||||||
| Net cash used in investing activities |
(327,284 | ) | (238 | ) | (5,248 | ) | (678 | ) | ||||||||
56
Table of Contents
| The Company | The Predecessor | The Predecessor | The Predecessor | |||||||||||||
| Period from April 28, 2010 to December 31, 2010 |
Period from January 1, 2010 to April 27, 2010 |
Year Ended December 31, 2009 |
Year Ended December 31, 2008 |
|||||||||||||
| Cash flows from financing activities: |
||||||||||||||||
| Issuance of common stock |
210,000 | — | — | — | ||||||||||||
| Offering costs |
(15,398 | ) | — | — | — | |||||||||||
| Purchase of Predecessor non-controlling interests |
(1,812 | ) | — | — | — | |||||||||||
| Payments on mortgages payable |
(11,969 | ) | (227 | ) | (992 | ) | (1,718 | ) | ||||||||
| Proceeds from mortgages payable |
67,800 | — | — | — | ||||||||||||
| Net proceeds from parent advances |
— | — | 568 | 649 | ||||||||||||
| Issuance of notes payable |
85,384 | — | — | — | ||||||||||||
| (Payments) and proceeds from Predecessor controlling interests |
(1,337 | ) | 121 | — | — | |||||||||||
| Contributions from Predecessor controlling interests |
— | 316 | 674 | 572 | ||||||||||||
| Contributions from Predecessor non-controlling interests |
— | 63 | 144 | 104 | ||||||||||||
| Distributions to Predecessor controlling interests |
— | (707 | ) | (225 | ) | (392 | ) | |||||||||
| Distributions to Predecessor non-controlling interests |
— | (290 | ) | (75 | ) | (56 | ) | |||||||||
| Contributions from Company non-controlling interests |
1,425 | — | — | — | ||||||||||||
| Dividends/distributions |
(1,304 | ) | — | — | — | |||||||||||
| Deferred financing costs |
(3,014 | ) | — | — | — | |||||||||||
| Tenant security deposits |
114 | — | (338 | ) | 273 | |||||||||||
| Net cash provided (used) by financing activities |
329,889 | (724 | ) | (244 | ) | (568 | ) | |||||||||
| Net increase (decrease) |
6,525 | (661 | ) | 123 | (168 | ) | ||||||||||
| Cash and cash equivalents, beginning of period |
— | 661 | 538 | 706 | ||||||||||||
| Cash and cash equivalents, end of period |
$ | 6,525 | $ | — | $ | 661 | $ | 538 | ||||||||
| Supplemental cash flow information: |
||||||||||||||||
| Cash payments for interest, net of amounts capitalized |
$ | 2,664 | $ | 480 | $ | 1,293 | $ | 1,540 | ||||||||
| Non-cash investing and financing activity: |
||||||||||||||||
| Contribution of properties for common shares and operating partnership units |
$ | 9,060 | $ | — | $ | — | $ | — | ||||||||
| Assumption of net mortgage debt in connection with property acquisitions |
$ | 51,748 | $ | — | $ | — | $ | — | ||||||||
| Assets received in connection with property acquisitions |
$ | 705 | $ | — | $ | — | $ | — | ||||||||
| Liabilities assumed in connection with property acquisitions |
$ | 3,530 | $ | — | $ | — | $ | — | ||||||||
| Dividends/distributions payable |
$ | 1,957 | $ | — | $ | — | $ | — | ||||||||
| Accrued additions to development |
$ | 773 | $ | — | $ | 56 | $ | — | ||||||||
| Exchange of notes receivable for real estate |
$ | 33,400 | $ | — | $ | — | $ | — | ||||||||
The accompanying notes are an integral part of these consolidated and combined financial statements.
57
Table of Contents
EXCEL TRUST, INC. PREDECESSOR
NOTES TO CONSOLIDATED AND COMBINED FINANCIAL STATEMENTS
(Dollars in thousands, except per share amounts)
1. Organization:
Excel Trust, Inc. (the “Company”) was incorporated in the State of Maryland on December 15, 2009. On April 28, 2010, the Company completed an initial public offering (the “Offering”) of 15,000,000 shares of its common stock at an aggregate public offering price of $210,000. In connection with the Offering, the Company and its operating partnership subsidiary, Excel Trust, L.P. (the “Operating Partnership”), for which the Company is the sole general partner, together with the partners and members of the affiliated partnerships and limited liability companies of Excel Trust, Inc. Predecessor (“ETP” or the “Predecessor”) and other parties which hold direct or indirect ownership interests in the Properties (defined below) engaged in certain formation transactions (the “Formation Transactions”). The Formation Transactions were designed to (1) continue the operations of ETP, (2) enable the Company to raise the necessary capital to acquire increased interests in certain of the Properties, (3) provide capital for future acquisitions, (4) fund certain development costs at the Company’s development property, (5) establish a capital reserve for general corporate purposes, and (6) fund future joint venture capital commitments.
Following the Offering, ETP was contributed to the Company and the Operating Partnership in exchange for 507,993 shares of the Company’s common stock and 641,062 partnership interests (the “OP Units”). The exchange of entities or interests therein for shares of common stock of the Company and OP Units has been accounted for as a reorganization of entities under common control, and accordingly, the related assets and liabilities of ETP have been reflected at their historical cost basis. The Company intends to elect to be taxed as a real estate investment trust (“REIT”) under the Internal Revenue Code of 1986, as amended (the “Code”), beginning with its taxable year ending December 31, 2010.
ETP, which was not a legal entity but rather a combination of real estate entities and operations as described below, was engaged in the business of owning, managing, leasing, acquiring and developing commercial real estate, consisting of retail properties, an office property and undeveloped land (the “Properties”). The Properties are located in South Carolina, Tennessee, California and Utah. During the periods presented in the accompanying combined financial statements prior to the Offering, ETP was the general partner or managing member of the real estate entities that directly or indirectly own the Properties, and ETP had responsibility for the day-to-day operations of such entities. The ultimate owners of ETP were Mr. Gary B. Sabin and certain others who had non-controlling interests.
The accompanying combined financial statements of the Predecessor do not include certain investments in real estate entities owned by Mr. Sabin that were not contributed to the Operating Partnership. Prior to the Formation Transactions, ETP was invested in the following real estate properties:
| Acquisition Date |
Property |
Type |
Location | |||
| May 2004 | Excel Centre | Office Building | San Diego, California | |||
| July 2005 | Five Forks Place | Retail Shopping Center | Simpsonville, South Carolina | |||
| January 2007 | Newport Towne Center | Retail Shopping Center | Newport, Tennessee | |||
| October 2007 | Red Rock Commons | Undeveloped Land | St. George, Utah |
Prior to their contribution to the Operating Partnership, Five Forks Place and Newport Towne Center were directly or indirectly 100% owned by Mr. Sabin. Prior to their contribution to the Operating Partnership, Excel Centre and Red Rock Commons were directly or indirectly 62.5% and 82.8% owned, respectively, by Mr. Sabin.
58
Table of Contents
The remaining ownership interests of Excel Centre and Red Rock Commons are reflected in the Predecessor financial statements as non-controlling interests.
2. Summary of Significant Accounting Policies
Basis of Presentation:
The accompanying consolidated financial statements of the Company include all the accounts of the Company, the Operating Partnership, the wholly-owned subsidiaries of the Operating Partnership, and all entities in which the Company has a controlling interest. The exchange of Predecessor controlling and non-controlling interests for shares of the Company’s common stock and OP Units has been reflected on the Predecessor historical cost basis as a reorganization of entities under common control. The Predecessor’s combined financial statements reflect presentation of properties on a combined historical cost basis because of their common ownership. All significant intercompany balances and transactions have been eliminated in consolidation and combination.
The Company is required to continually evaluate its variable interest entity (“VIE”) relationships and consolidate investments in these entities when it is determined to be the primary beneficiary of their operations. A VIE is broadly defined as an entity where either (i) the equity investors as a group, if any, lack the power through voting or similar rights to direct the activities of an entity that most significantly impact the entity’s economic performance or (ii) the equity investment at risk is insufficient to finance that entity’s activities without additional subordinated financial support.
A variable interest holder is considered to be the primary beneficiary of a VIE if it has the power to direct the activities of a variable interest entity that most significantly impact the entity’s economic performance and has the obligation to absorb losses of, or the right to receive benefits from, the entity that could potentially be significant to the VIE. The Company qualitatively assesses whether it is (or is not) the primary beneficiary of a VIE. Consideration of various factors includes, but is not limited to, the Company’s ability to direct the activities that most significantly impact the entity’s economic performance, its form of ownership interest, its representation on the entity’s governing body, the size and seniority of its investment, its ability and the rights of other investors to participate in policy making decisions and to replace the manager of and/or liquidate the entity.
The significant accounting policies discussed as follows are consistent between the Company and the Predecessor.
Cash and Cash Equivalents:
The Company and ETP consider all highly liquid investments with an original maturity of three months or less when purchased to be cash equivalents, for which cost approximates fair value, due to their short term maturities.
Restricted Cash:
Restricted cash comprises impound reserve accounts for property taxes, insurance, capital improvements and tenant improvements.
Accounts Payable and Other Liabilities:
Included in accounts payable and other liabilities is deferred rent in the amount of $3,082 and $3,427 at December 31, 2010 and December 31, 2009, respectively.
59
Table of Contents
Revenues:
Minimum rental revenues are recognized on a straight-line basis over the terms of the related lease. The difference between the amount of rent due in a year and the amount recorded as rental income is referred to as the “straight-line rent adjustment.” Rental income was increased by $407 in the period from April 28, 2010 to December 31, 2010 and $173 for the period from January 1, 2010 to April 27, 2010 and $181 and ($31) in the years ended December 31, 2010, 2009 and 2008 respectively, due to the straight-line rent adjustment.
Estimated recoveries from certain tenants for their pro rata share of real estate taxes, insurance and other operating expenses are recognized as revenues in the period the applicable expenses are incurred or as specified in the leases. Other tenants pay a fixed rate and these tenant recoveries are recognized as revenue on a straight-line basis over the term of the related leases.
Property:
Costs incurred in connection with the development or construction of properties and improvements are capitalized. Capitalized costs include pre-construction costs essential to the development of the property, development costs, construction costs, interest costs, real estate taxes and related costs and other direct costs incurred during the period of development. The Company capitalizes costs on land and buildings under development until construction is substantially complete and the property is held available for occupancy. The determination of when a development project is substantially complete and when capitalization must cease involves a degree of judgment. The Company considers a construction project as substantially complete and held available for occupancy upon the completion of landlord-owned tenant improvements or when the lessee takes possession of the unimproved space for construction of its own improvements, but no later than one year from cessation of major construction activity. The Company ceases capitalization on the portion substantially completed and occupied or held available for occupancy, and capitalizes only those costs associated with any remaining portion under construction.
Maintenance and repairs expenses are charged to operations as incurred. Costs for major replacements and betterments, which includes HVAC equipment, roofs, parking lots, etc., are capitalized and depreciated over their estimated useful lives. Gains and losses are recognized upon disposal or retirement of the related assets and are reflected in earnings.
Property is recorded at cost and is depreciated using the straight-line method over the estimated lives of the assets as follows:
| Building and improvements |
15 to 40 years | |
| Tenant improvements |
Shorter of the useful lives or the terms of the related leases |
The Company assesses whether there has been impairment in the value of its long-lived assets by considering expected future operating income, trends and prospects, as well as the effects of demand, competition and other economic factors. Such factors include the tenants’ ability to perform their duties and pay rent under the terms of the leases. The determination of recoverability is made based upon the estimated undiscounted future net cash flows, excluding interest expense. The amount of impairment loss, if any, is determined by comparing the fair value, as determined by a discounted cash flows analysis, with the carrying value of the related assets. Long-lived assets classified as held for sale are measured at the lower of the carrying amount or fair value less cost to sell. There was no impairment charge recorded for the periods ended December 31, 2010, 2009 or 2008.
Mortgage Loan Receivables:
Mortgage loan receivable consists of loans originated by the Company. Mortgage loan receivables are recorded at stated principal amounts net of any discount or premium or deferred loan origination costs or fees. The related discounts or premiums on mortgage loan receivables are amortized or accreted over the life of the
60
Table of Contents
related loan receivable. The Company defers certain loan origination and commitment fees, net of certain origination costs and amortizes them as an adjustment of the loan’s yield over the term of the related loan. The Company evaluates the collectability of both interest and principal on each loan to determine whether it is impaired. A loan is considered to be impaired, when based upon current information and events, it is probable that the Company will be unable to collect all amounts due according to the existing contractual terms. When a loan is considered to be impaired, the amount of loss is calculated by comparing the recorded investment to the value determined by discounting the expected future cash flows at the loan’s effective interest rate or to the value of the underlying collateral if the loan is collateralized. Interest income on performing loans is accrued as earned. Interest income on impaired loans is recognized on a cash basis.
Purchase Accounting:
The Company, with the assistance of independent valuation specialists, allocates the purchase price of acquired properties to tangible and identified intangible assets and liabilities based on their respective fair values. The allocation to tangible assets (building and land) is based upon the Company’s determination of the value of the property as if it were vacant using discounted cash flow models similar to those used by independent appraisers. Factors considered include an estimate of carrying costs during the expected lease-up periods taking into account current market conditions and costs to execute similar leases. Additionally, the purchase price of the applicable property is allocated to the above or below market value of in place leases, the value of in place leases and above or below market value of debt assumed.
The value allocable to the above or below market component of the acquired in place leases is determined based upon the present value (using a discount rate which reflects the risks associated with the acquired leases) of the difference between: (1) the contractual amounts to be paid pursuant to the lease over its remaining term, and (2) our estimate of the amounts that would be paid using fair market rates over the remaining term of the lease. The amounts allocated to above market leases are included in lease intangible assets, net in our accompanying consolidated and combined balance sheets and amortized to rental income over the remaining non-cancelable lease term of the acquired leases with each property. The amounts allocated to below market lease values are included in lease intangible liabilities, net in the Company’s accompanying consolidated and combined balance sheets and amortized to rental income over the remaining non-cancelable lease term plus any below market renewal options of the acquired leases with each property.
The value allocable to above or below market debt is determined based upon the present value of the difference between the cash flow stream of the assumed mortgage and the cash flow stream of a market rate mortgage. The amounts allocated to above or below market debt are included in mortgage payables, net on the accompanying consolidated balance sheets and are amortized to interest expense over the remaining term of the assumed mortgage.
Tenant receivables:
Tenant receivables and deferred rent are carried net of the allowances for uncollectible current tenant receivables and deferred rent. An allowance is maintained for estimated losses resulting from the inability of certain tenants to meet the contractual obligations under their lease agreements. The Company maintains an allowance for deferred rent receivable arising from the straight-lining of rents. Such allowance is charged to bad debt expense which is included in other operating expenses on the accompanying consolidated and combined statement of operations. The Company’s determination of the adequacy of these allowances is based primarily upon evaluations of historical loss experience, the tenant’s financial condition, security deposits, letters of credit, lease guarantees, current economic conditions and other relevant factors. At December 30, 2010 and 2009, the Company and the Predecessor had $605 and $58, respectively, in allowances for uncollectible accounts as determined to be necessary to reduce receivables to the estimate of the amount recoverable. During the period from April 28, 2010 to December 31, 2010, the period from January 1, 2010 to April 27, 2010 and for years ended December 31, 2009 and 2008, $348, $16, $189 and $175, respectively, of receivables were charged to bad debt expense.
61
Table of Contents
Non-controlling Interests
At December 31, 2010, non-controlling interest represented the portion of equity that the Company did not own in those entities it consolidates. Non-controlling interests also include OP Units not held by the Company. Non-controlling interests of the Predecessor as of December 31, 2009 represents equity interest of the Predecessor not owned by the controlling interest of the Predecessor.
In conjunction with the Formation Transactions, certain interests in the Predecessor were contributed in exchange for OP Units. OP Units not held by the Company are reflected as non-controlling interest in the Company’s consolidated financial statements. OP Units not held by the Company have redemption provisions that permit the issuer to settle in either cash or common stock at the option of the Company. As a result of the redemption provisions, the OP Units are classified outside of permanent equity within our Consolidated Balance Sheet.
Concentration of Risk:
The Company maintains its cash accounts in a number of commercial banks. Accounts at these banks are guaranteed by the Federal Deposit Insurance Corporation (“FDIC”) up to $250. At various times during the periods, the Company and ETP had deposits in excess of the FDIC insurance limit.
In the period from April 28, 2010 to December 31, 2010, no tenant accounted for more than 10% of the Company’s revenues. In the period from January 1, 2010 to April 27, 2010, one tenant accounted for 29.1% of the Predecessor’s revenues. In the years ended December 31, 2009 and 2008, there were two tenants who each accounted for more than 10% of revenues. In 2009, the two tenants accounted for 25.9% and 11.8% of total revenues, respectively. In 2008, the two tenants accounted for 15.3% and 11.3% of total revenues, respectively.
Derivative/Financial Instruments:
The Company measures its derivative instruments at fair value and records them in the Consolidated Balance Sheet as an asset or liability, depending on the Company’s rights or obligations under the applicable derivative contract. The accounting for changes in the fair value of the derivatives depends on the intended use of the derivative, whether the Company has elected to designate a derivative in a hedging relationship and apply hedge accounting and whether the hedging relationship has satisfied the criteria necessary to apply hedge accounting. Derivatives designated and qualifying as a hedge of the exposure to changes in the fair value of an asset, liability, or firm commitment attributable to a particular risk, such as interest rate risk are considered fair value hedges. Derivatives used to hedge the exposure to variability in expected future cash flows, or other types of forecasted transactions, are considered cash flow hedges.
For derivatives designated as fair value hedges, changes in the fair value of the derivative and the hedged item related to the hedged risk are recognized in earnings. For derivatives designated as cash flow hedges, the effective portion of changes in the fair value of the derivative is initially reported in other comprehensive income (loss) (outside of earnings) and subsequently reclassified to earnings when the hedged transaction affects earnings, and the ineffective portion of changes in the fair value of the derivative is recognized directly in earnings. We assess the effectiveness of each hedging relationship by comparing the changes in fair value or cash flows of the derivative hedging instrument with the changes in fair value or cash flows of the designated hedged item or transaction. For derivatives not designated as hedges, changes in fair value are recognized in earnings.
Management Estimates:
The preparation of financial statements in conformity with GAAP requires management to make estimates and assumptions that affect the reported amounts of assets and liabilities and disclosure of contingent assets and liabilities at the date of the financial statements and the reported amounts of revenues and expenses during the reporting period. Actual results could differ from those estimates.
62
Table of Contents
Earnings per Share:
Basic earnings (loss) per share is computed by dividing income (loss) from continuing operations attributable to common stockholders by the weighted average common shares outstanding. Income (loss) from continuing operations attributable to common stockholders is calculated by deducting amounts attributable to non-controlling interests, and dividends declared on participating securities from income (loss) from continuing operations.
The Company’s unvested restricted share awards contain non-forfeitable rights to dividends or dividend equivalents. The impact of the unvested restricted share awards on earnings (loss) per share has been calculated using the two-class method whereby earnings are allocated to the unvested restricted share awards based on dividends declared and the unvested restricted shares’ participation rights in undistributed earnings (losses).
Computations of basic and diluted earnings per share (in thousands, except share data) were as follows:
| Period from April 28 to December 31, 2010 |
||||
| Basic and diluted earnings per share: |
||||
| Net loss attributable to common stockholders |
$ | (3,725 | ) | |
| Less dividends paid to participating securities |
(31 | ) | ||
| Undistributed loss |
$ | (3,756 | ) | |
| Weighted-average common shares outstanding: |
||||
| Basic and diluted |
15,510,200 | |||
| Basic and diluted earnings per share: |
||||
| Net loss per share available to common stockholders, basic and diluted |
$ | (0.24 | ) | |
Fair Value of Financial Instruments:
On January 1, 2008, ETP adopted Financial Accounting Standard Board (“FASB”) ASC 820-10, Fair Value Measurements and Disclosures. ASC 820-10 defines fair value, establishes a framework for measuring fair value and expands disclosures about fair value measurements. The fair value hierarchy distinguishes between market participant assumptions based on market data obtained from sources independent of the reporting entity and the reporting entity’s own assumptions about market participant assumptions.
Level 1 inputs utilize quoted prices in active markets for identical assets or liabilities that the Company has the ability to access. Level 2 inputs are inputs other than quoted prices included in Level 1 that are observable for the asset or liability, either directly or indirectly. Level 2 inputs may include quoted prices for similar assets and liabilities in active markets, as well as inputs that are observable for the asset or liability (other than quoted prices), such as interest rates, foreign exchange rates and yield curves that are observable at commonly quoted intervals. Level 3 inputs are unobservable inputs for the asset or liability, which are typically based on an entity’s own assumptions, as there is little, if any, related market activity. In instances where the determination of the fair value measurement is based on inputs from different levels of the fair value hierarchy, the level in the fair value hierarchy within which the entire fair value measurement falls is based on the lowest level input that is significant to the fair value measurement in its entirety. The Company’s assessment of the significance of a particular input to the fair value measurement in its entirety requires judgment, and considers factors specific to the asset or liability.
The Company and ETP calculate the fair value of financial instruments and includes this additional information in the notes to the consolidated and combined financial statements when the fair value is different than the carrying value of those financial instruments.
63
Table of Contents
Recent Accounting Pronouncements:
Effective January 1, 2010, ETP adopted the requirements of Accounting Standards Update No. 2009-17, Consolidations (Topic 810): Improvements to Financial Reporting by Enterprises Involved with Variable Interest Entities (“ASU No. 2009-17”). Update No. 2009-17 requires enterprises to perform a qualitative approach to determining whether or not a variable interest entity (“VIE”) will need to be consolidated on a continuous basis. This evaluation is based on an enterprise’s ability to direct and influence the activities of a variable interest entity that most significantly impact that entity’s economic performance. On the date of adoption, ASU No. 2009-17 did not have an effect on ETP’s combined financial statements.
In January 2010, the FASB issued Accounting Standards Update No. 2010-06, Fair Value Measurements and Disclosures (Topic 820): Improving Disclosures about Fair Value Measurements (“ASU No. 2010-06”). The amendments in this update require, among other things, new disclosures and clarifications of existing disclosures related to transfers in and out of Level 1 and Level 2 fair value measurements, further disaggregation of fair value measurement disclosures for each class of assets and liabilities, and additional details of valuation techniques and inputs utilized. Additionally, the guidance requires a roll forward of activities on purchases, sales, issuance, and settlements of the assets and liabilities measured using significant unobservable inputs (Level 3 fair value measurements). The guidance became effective for ETP on January 1, 2010, except for the disclosure on the roll forward activities for any Level 3 fair value measurements, which will become effective with the reporting period beginning January 1, 2011. Adoption of this new guidance requires additional disclosures of fair value measurements but did not have a material impact on the ETP’s footnote disclosure.
In July 2010, the FASB issued Accounting Standards Update No. 2010-20, Receivables (Topic 310): Disclosures about the Credit Quality of Financing Receivables and the Allowance for Credit Losses. The amendments in this update require additional disclosure about the credit quality of financing receivables, such as aging information and credit quality indicators. Both new and existing disclosures must be disaggregated by portfolio segment or class. The disaggregation of information is based on how allowances for credit losses are developed and how credit exposure is managed. This update is effective for interim periods and fiscal years ending after December 15, 2010. The adoption of these requirements on December 31, 2010 did not have a material impact on the Company’s consolidated financial position or results of operations.
In December 2010, the FASB issued ASU No. 2010-29, Disclosure of Supplementary Pro Forma Information for Business Combinations (“ASU 2010-29”), which amended ASC Topic 805, Business Combinations (“ASC 805”). The objective of this guidance is to eliminate diversity in the interpretation of pro forma revenue and earnings disclosure requirements for business combinations. The guidance specifies that if a public entity presents comparative financial statements, the entity should disclose revenue and earnings of the combined entity as though the business combination(s) that occurred during the current year had occurred as of the beginning of the comparable prior annual reporting period only. The guidance also expands the supplemental pro forma disclosures under ASC 805 to include a description of the nature and amount of material, nonrecurring pro forma adjustments directly attributable to the business combination(s) included in the reported pro forma revenue and earnings. ASU 2010-29 is effective for business combinations for which the acquisition date occurs following the first annual reporting period which commences after December 15, 2010. The guidance is required in interim and annual reporting periods. Early adoption is permitted. The Company’s adoption of this guidance effective January 1, 2011 is not expected to have a material effect on the Company’s consolidated financial statements.
64
Table of Contents
3. Acquisitions
In addition to the real estate properties contributed by the Predecessor, the Company completed the following acquisitions through December 31, 2010 which were funded with proceeds of the Offering, borrowings from the Company’s credit facility and the assumption of mortgage payables:
On May 12, 2010, the Company, through the Operating Partnership, completed the acquisition of 5000 South Hulen, an 86,838 square foot community shopping center located in Fort Worth, Texas, from Corrigan Hulen Joint Venture. The Operating Partnership acquired the property through its wholly owned subsidiary, Excel Hulen LLC. The purchase price was $21,900 and consisted of approximately $7,700 in cash and the assumption of approximately $14,200 of debt (fair value of approximately $12,900).
On May 14, 2010, the Company, through the Operating Partnership, completed the acquisition of a 51,762 square foot single tenant grocery store leased to Jewel Food Stores, Inc. located in Morris, Illinois from Morris (EP ALEX), LLC. The Operating Partnership acquired the property through its wholly owned subsidiary, Excel Jewel LLC. The purchase price was $8,200 and consisted of all cash.
On May 24, 2010, the Company, through the Operating Partnership, completed the acquisition of three 13,650 square feet single tenant properties leased to Walgreens. Two of these properties are located in Corbin, Kentucky and one is located in Barbourville, Kentucky and were acquired from MG&P Development Partnership. The Operating Partnership acquired these properties through its wholly owned subsidiaries, Excel North Corbin, LLC, Excel South Corbin, LLC and Excel Barbourville, LLC. The aggregate purchase price of these properties was approximately $12,000 and consisted of all cash.
On May 28, 2010, the Company, through the Operating Partnership, completed the acquisition of a 53,411 square foot single tenant grocery store leased to Shop ‘n Save (SuperValu) located in Ballwin, Missouri from Twin Oaks-SNS, LLC. The Operating Partnership acquired the property through its wholly owned subsidiary, Excel Twin Oaks, LLC. The purchase price was approximately $8,500 and consisted of all cash.
On June 17, 2010, the Company, through the Operating Partnership, completed the acquisition of a 14,820 square feet single tenant property leased to Walgreens located in Beckley, West Virginia from MG&P Development Partnership. The Operating Partnership acquired the property through its wholly owned subsidiary, Excel Beckley, LLC. The aggregate purchase price was approximately $7,200 and consisted of all cash.
On June 22, 2010, the Company, through the Operating Partnership, completed the acquisition of a 171,069 square foot single tenant building leased to Lowe’s Home Centers, Inc. located in Shippensburg, Pennsylvania from Shippensburg Development, LLC. The Operating Partnership acquired the property through its wholly owned subsidiary, Excel Shippensburg, LLC. The purchase price was approximately $17,600 and consisted of $3,300 of cash and the assumption of approximately $14,300 of debt, which approximated fair value.
On June 29, 2010, the Company, through the Operating Partnership, completed the acquisition of Plaza at Rockwall Phase I, a 332,989 square foot community shopping center located in Rockwall, Texas, from CNLRS Rockwall, L.P. Also acquired was Plaza at Rockwall Phase II, which is a 12.7 acre land parcel located adjacent to Plaza at Rockwall Phase I that is available for future development. The Operating Partnership acquired the properties through its wholly owned subsidiary, Excel Rockwall, LLC. The aggregate purchase price for Plaza at Rockwall Phase I and Phase II was approximately $40,800 and consisted of all cash.
On June 30, 2010, the Company, through the Operating Partnership, completed the acquisition of Merchant Central, a 45,013 square foot community shopping center located in Milledgeville, Georgia, from Milledgeville Fiddling Company, LLC. The Operating Partnership acquired the property through its wholly owned subsidiary, Excel Milledgeville, LLC. The purchase price was approximately $6,100 and consisted of $1,400 of cash and the assumption of approximately $4,700 of debt (fair value of approximately $4,600).
65
Table of Contents
On July 20, 2010, the Company, through the Operating Partnership, completed the acquisition of Mariner’s Point, a 45,215 square foot shopping center located in St. Marys, Georgia from FWB, LLC and RFK, LLC. The Operating Partnership acquired the property through its wholly owned subsidiary, Excel St. Marys LLC. The purchase price was approximately $6,600 and consisted of $3,100 in cash and the assumption of an existing loan of $3,500, which approximates fair value.
On August 27, 2010, the Company, through the Operating Partnership, completed the acquisition of Grant Creek Town Center, a 164,166 square foot shopping center located in Missoula, Montana from Woodmont Missoula. The Operating Partnership acquired the property through its wholly owned subsidiary, Excel Missoula LLC. The purchase price was approximately $21,300 and consisted of $5,100 in cash and the assumption of an existing loan of $16,200. Excluded from the purchase price is $1,800 for an estimate of contingent consideration that may be paid to the seller after closing for additional lease-up of vacant space through December 31, 2011. This amount is included in accounts payable and other liabilities in the accompanying Consolidated Balance Sheet. The total cost including the contingent consideration is $23,100.
On August 30, 2010, the Company, through the Operating Partnership completed the acquisition of Vestavia Hills City Center, a 378,805 square foot shopping center located in Vestavia Hills (Birmingham), Alabama. The Company acquired the mortgage loan that was secured by the property for approximately $33,400 of cash. Concurrently with the acquisition of the mortgage loan, the original borrower under the mortgage loan, AIG Baker Vestavia, L.L.C. (the “Borrower”), granted the Company a deed in lieu on the property. Vestavia Holdings, LLC, an affiliate of Borrower, was granted a 30% subordinate profits participation in the property as follows: (1) net cash from operations, after the Company receives an 11% return on its cash invested in the property; and (2) net cash from a capital event, after the Company receives an 11% return on its cash invested as well as its unreimbursed capital invested in the property. Based on an assessment of current plans for the property and future operational cash flows, the Company believes there is no value for this interest at the time the property was acquired, and accordingly, has not recognized a non-controlling interest in connection with this acquisition.
On October 1, 2010, the Company, through the Operating Partnership, completed the acquisition of Brandywine Crossing, a 198,330 square foot shopping center located in Brandywine, Maryland from Faison-Brandywine, LLC. The purchase price was approximately $44,500 and consisted of all cash. Also on October 1, 2010, the Company, through the Operating Partnership, completed the acquisition of Rosewick Crossing, a 116,095 square foot shopping center located in La Plata, Maryland from Faison-Rosewick, LLC. The purchase price was approximately $24,900 and consisted of all cash.
On October 19, 2010 the Company, through the Operating Partnership, completed the acquisition of Shops at Foxwood, a 78,660 square foot shopping center located in Ocala, Florida from Shops at Foxwood, LLC. The purchase price was approximately $12,600 and consisted of all cash. Excluded from the purchase price is $700 for an estimate of contingent consideration that may be paid to the seller after closing for additional lease-up of vacant space through October 18, 2011. This amount is included in accounts payable and other liabilities in the accompanying Consolidated Balance Sheet. The total cost including the contingent consideration is $13,300.
On October 28, 2010 the Company, through the Operating Partnership, completed the acquisition of a 14,550 square foot building leased to Walgreens located in Princeton, West Virginia from M&M West Town, L.P. The purchase price was approximately $4,100 and consisted of all cash.
On November 15, 2010, the Company entered into a joint venture with AB Dothan, LLC, to develop and own Northside Plaza, a retail property located in Dothan, Alabama. When complete, the property is expected to be comprised of approximately 243,000 square feet of gross leasable area. The property is currently being redeveloped. Total costs are expected to be approximately $14,800, $12,000 of which will be funded by Dothan Downtown Redevelopment Authority Revenue Bonds. The Bonds are secured by a letter of credit in the amount of $12,100 issued by the Company. The Company recognized a gain of $978 when entering into the joint
66
Table of Contents
venture. This gain was the result of its valuation of the property, with the assistance of independent valuation specialists, which was more than the consideration paid for its 50% ownership.
On December 14, 2010, the Company, through the Operating Partnership, completed the acquisition of Park West Place, a 597,787 square foot shopping center located in Stockton, California from Levine Investments, L.P. The purchase price was approximately $92,500. The Company acquired this property with a $55,800 mortgage loan and cash of $36,700.
Business Combinations
The following summary provides an allocation of purchase price for the above acquisitions.
| Plaza at Rockwall |
Vestavia Hills City Center |
Brandywine Crossing |
Park West Place |
Other Property Acquisitions |
2010 Acquisitions Total |
|||||||||||||||||||
| Land |
$ | 14,941 | $ | 7,806 | $ | 20,047 | $ | 41,287 | $ | 54,220 | $ | 138,301 | ||||||||||||
| Building |
18,171 | 17,954 | 15,071 | 33,131 | 73,510 | 157,837 | ||||||||||||||||||
| Site improvements |
2,198 | 462 | 2,911 | 2,630 | 8,186 | 16,387 | ||||||||||||||||||
| Tenant improvements |
878 | 539 | 639 | 2,230 | 6,368 | 10,654 | ||||||||||||||||||
| Lease intangible assets |
6,869 | 7,263 | 6,284 | 14,200 | 20,854 | 55,470 | ||||||||||||||||||
| Mortgage payable, net |
— | — | — | — | (51,748 | ) | (51,748 | ) | ||||||||||||||||
| Lease intangible liabilities |
(2,306 | ) | (635 | ) | (518 | ) | (978 | ) | (2,666 | ) | (7,103 | ) | ||||||||||||
| Real estate acquisitions |
$ | 40,751 | $ | 33,389 | $ | 44,434 | $ | 92,500 | $ | 108,724 | $ | 319,798 | ||||||||||||
The following unaudited pro forma information for the year ended December 31, 2009 has been prepared to reflect the incremental effect of the 2010 Acquisitions as if such acquisitions had occurred on January 1, 2009. Pro forma information for the periods from January 1, 2010 to April 27, 2010 and April 28, 2010 to December 31, 2010 is impractical to determine as information for the properties is not available for these specific periods.
| Year Ended December 31, 2009 |
||||
| Revenues |
$ | 37,161 | ||
| Net income |
$ | 3,683 | ||
4. Lease Intangible Assets, Net
Lease intangible assets, net consisted of the following at December 31, 2010 and 2009:
| December 31, 2010 |
December 31, 2009 |
|||||||
| In-place leases, net of accumulated amortization of $4,703 and $2,245 as of December 31, 2010 and December 31, 2009, respectively (with a weighted average remaining life of 101 and 41 months as of December 31, 2010 and 2009, respectively) |
$ | 32,328 | $ | 578 | ||||
| Above market leases, net of accumulated amortization of $1,212 and $850 as of December 31, 2010 and December 31, 2009, respectively (with a weighted average remaining life of 97 and 10 months as of December 31, 2010 and 2009, respectively) |
7,803 | 57 | ||||||
| Leasing commissions, net of accumulated amortization of $1,568 and $944 as of December 31, 2010 and December 31, 2009, respectively (with a weighted average remaining life of 151 and 57 months as of December 31, 2010 and December 31, 2009, respectively) |
12,893 | 483 | ||||||
| $ | 53,024 | $ | 1,118 | |||||
67
Table of Contents
Estimated amortization of lease intangible assets as of December 31, 2010 and for each of the next five years and thereafter is as follows:
| Year |
Amount | |||
| 2011 |
$ | 9,153 | ||
| 2012 |
7,783 | |||
| 2013 |
6,455 | |||
| 2014 |
5,362 | |||
| 2015 |
4,023 | |||
| Thereafter |
20,248 | |||
| Total |
$ | 53,024 | ||
Amortization expense recorded on the lease intangible assets for the period from April 28, 2010 to December 31, 2010 was $3,280, for the period from January 1, 2010 to April 27, 2010 was $152 and for years ended December 31, 2009 and 2008 were $677 and $545, respectively. Included in these amounts are $353, $17, $70 and $161, respectively, of amortization recorded against rental income in the Company and ETP’s combined statements of operations for above market leases.
5. Lease Intangible Liabilities, Net
Lease intangible liabilities, net consisted of the following at December 31, 2010 and 2009:
| December 31, 2010 |
December 31, 2009 |
|||||||
| Below market leases, net of accumulated amortization of $1,173 and $678 as of December 31, 2010 and December 31, 2009, respectively (with a weighted average remaining life of 121 and 67 months as of December 31, 2010 and December 31, 2009, respectively) |
$ | 7,150 | $ | 555 | ||||
Amortization recorded on the lease intangible liabilities for the period from April 28, 2010 to December 31, 2010 was $495, for the period from January 1, 2010 to April 27, 2010 was $38 and for the years ended December 31, 2009 and 2008 was $237 and $121, respectively. These amounts were recorded to rental income in the Company and ETP’s combined statements of operations.
Estimated amortization of lease intangible liabilities as of December 31, 2010 and for each of the next five years and thereafter is as follows:
| Year |
Amount | |||
| 2011 |
$ | 1,076 | ||
| 2012 |
910 | |||
| 2013 |
797 | |||
| 2014 |
716 | |||
| 2015 |
593 | |||
| Thereafter |
3,058 | |||
| Total |
$ | 7,150 | ||
6. Variable Interest Entities
The Company analyzes joint ventures in accordance with ASC 810-10 to determine whether they are VIEs and, if so, whether the Company is the primary beneficiary. The Company’s judgment with respect to the level of influence or control over an entity and whether the Company is the primary beneficiary of a VIE involves consideration of various factors including the form of ownership interest, voting interest, the size of investment
68
Table of Contents
(including loans) and ability to participate in major policy-making decisions. The ability to correctly assess influence or control over an entity affects the presentation of these investments in the consolidated financial statements.
Consolidated Variable Interest Entities
Included within the consolidated financial statement is the 50% joint venture with AB Dothan, LLC, that is deemed a VIE, and for which the Company is the primary beneficiary as it has the power to direct activities that most significantly impact the economic performance of the VIE.
As of December 31, 2010, total carrying amount of assets was approximately $18,600, which includes approximately $8,300 of real estate assets and total carrying amount of liabilities was approximately $15,900.
Unconsolidated Variable Interest Entities
On December 9, 2010, the Company loaned $2,000 to an unaffiliated borrower which has been identified as a VIE. The Company does not consolidate the VIE because it does not have the ability to control the activities that most significantly impact the VIE’s economic performance.
See Note 3 and 7 for additional description of the nature, purpose and activities of the Company’s VIEs and interests therein.
7. Mortgage Loan Receivable
On December 9, 2010, the Company loaned $2,000 to an unaffiliated borrower. The proceeds were used to facilitate the land acquisition and development of a shopping center anchored by Publix in Brandon, Florida. The loan is secured with a second mortgage trust deed on the property and is personally guaranteed by members of the borrower. The loan bears interest at 8% per annum. In connection with the loan, the Company also entered into a purchase and sale agreement to acquire this property upon maturity. The purchase and sale agreement could have been terminated for any reason by the Company within 30 days of the date of the agreement. The loan matures on the earlier of April 2012 or the acquisition of the property. We estimate the fair value of the mortgage loan receivable by using discounted cash flow analyses based on an appropriate market rate for a similar type of instrument.
8. Mortgages Payable, net
Mortgages payable at December 31, 2010 and December 31, 2009 consist of the following:
| Carrying Amount of Mortgage Notes |
||||||||||||||||||||
| Property Pledged as Collateral |
December 31, 2010 |
December 31, 2009 |
Interest Rate |
Monthly Payment(1) |
Maturity Date |
|||||||||||||||
| Excel Centre(2) |
$ | 12,768 | $ | 12,989 | 6.08 | % | $ | 85 | 2014 | |||||||||||
| Five Forks Place |
5,242 | 5,408 | 5.50 | % | 39 | 2013 | ||||||||||||||
| Newport Towne Centre(3) |
— | 6,198 | 4.75 | % | 35 | 2010 | ||||||||||||||
| Red Rock Commons(4) |
— | 5,595 | 5.50 | % | 56 | 2010 | ||||||||||||||
| 5000 South Hulen |
14,086 | — | 5.60 | % | 83 | 2017 | ||||||||||||||
| Lowe’s, Shippensburg |
14,147 | — | 7.20 | % | 110 | 2031 | ||||||||||||||
| Merchant Central |
4,647 | — | 5.94 | % | 30 | 2014 | ||||||||||||||
| Grant Creek Town Center |
16,029 | — | 5.75 | % | 105 | 2013 | ||||||||||||||
| Mariner’s Point |
3,482 | — | 7.10 | % | 25 | 2011 | ||||||||||||||
| Park West Place(5) |
55,800 | — | 3.91 | % | 182 | 2013 | ||||||||||||||
| Northside Mall(6) |
12,000 | — | 0.36 | % | 4 | 2035 | ||||||||||||||
| $ | 138,201 | $ | 30,190 | |||||||||||||||||
| Less: discount(7) |
(1,158 | ) | — | |||||||||||||||||
| Mortgage notes payable, net |
$ | 137,043 | $ | 30,190 | ||||||||||||||||
69
Table of Contents
| (1) | This represents the monthly payment of principal and interest at December 31, 2010. |
| (2) | Mr. Sabin’s interests in Excel Centre were pledged as collateral in connection with debt of affiliated entities. As part of the Formation Transactions. Mr. Sabin’s interests were exchanged for OP Units of the Operating Partnership which are subject to a security agreement relating to a personal loan. The lender has agreed to waive Mr. Sabin’s obligation to pledge his OP Units as security for this loan until the expiration of the twelve-month lock-up period contained in his contribution agreement. Upon the expiration of such twelve-month lock-up period, Mr. Sabin will be obligated to pledge his OP Units as security for this loan. |
| (3) | The loan was guaranteed by Mr. Sabin. The loan bore interest at a rate of LIBOR plus 3.25% at December 31, 2009 with a floor of 4.75% beginning February 1, 2010. The total interest rate was 3.50%, at December 31, 2009. The loan was repaid in conjunction with the Formation Transactions. |
| (4) | The acquisition of this land was financed with two loans: One was a $6,175 mortgage payable secured by the property and the other was a $1,192 unsecured loan guaranteed by Mr. Sabin. Both loans bore interest at a rate of LIBOR plus 1.60% and matured November 1, 2008. Upon maturity, an affiliate of Mr. Sabin advanced $1,128 to ETP to repay the unsecured loan. The new note matured in November 2009. It was guaranteed by Mr. Sabin. In 2009, this loan was paid down by $200 and the loan was extended to July 1, 2010. The new interest rate was the greater of prime + 1.0% or 5.5% (5.5% at December 31, 2009). This loan was repaid in connection with the Formation Transactions. In conjunction with the repayment, the lender discounted the loan by $500. |
| (5) | The loan bears interest at a rate of LIBOR plus 2.50%. In December 2010, the Company entered into interest rate swap contracts which fixed LIBOR at an average of 1.41% for the term of the loan. |
| (6) | The debt represents redevelopment revenue bonds to be used for the redevelopment of this property. Interest is reset weekly and determined by the bond remarketing agent based on the market value of the bonds. The interest rate on the bonds is currently priced off of the Securities Industry and Financial Markets Association, or SIFMA, index but could change based on the credit. The bonds are secured by a $12.1 million letter of credit issued by the Company from the Company’s credit facility |
| (7) | Represents a) fair value adjustment on assumed debt on acquired properties of $1,039 and b) underwriter’s discount of $119 for the issuance of redevelopment bonds. |
Total interest cost capitalized for the years ended December 31, 2010 (all related to the Predecessor), 2009 and 2008 was $106, $282 and $354, respectively.
The fair value of mortgage notes payable at December 31, 2010 and December 31, 2009 was $139,141 and $29,833, respectively, based on current interest rates for comparable loans. The method for computing fair value was determined using a present value model and an interest rate that included a credit value adjustment based on the estimated value of the property that serves as collateral for the underlying debt.
The Company’s mortgage debt matures as of December 31, 2010 and during the next five years is as follows:
| Year Ending December 31, |
Amount | |||
| 2011 |
$ | 4,835 | ||
| 2012 |
1,434 | |||
| 2013 |
76,939 | |||
| 2014 |
16,990 | |||
| 2015 |
657 | |||
| Thereafter |
37,346 | |||
| $ | 138,201 | |||
9. Notes Payable
On July 8, 2010, the Company and the Operating Partnership entered into an unsecured revolving credit facility (the “Credit Agreement”). The Credit Agreement provides for a revolving credit facility of up to
70
Table of Contents
$125,000. The Company has the ability from time to time to increase the size of the revolving credit facility by up to an additional $275,000 to a total of $400,000, subject to receipt of lender commitments and other conditions precedent. The maturity date is July 7, 2013 and can be extended for one year at the Company’s option. The Company, among other things is subject to covenants requiring the maintenance of (1) maximum leverage ratios on unsecured, secured and overall debt, and (2) minimum fixed coverage ratios. At December 31, 2010, the Company is in compliance with all the covenants of the Credit Agreement.
The revolving credit facility bears interest at the rate of LIBOR plus a margin of 275 basis points to 400 basis points, depending on the Company’s leverage ratio, provided that in no event shall LIBOR be deemed to be less than 1.50%. The Company will also pay a 0.45% fee for any unused portion of the revolving credit facility. Borrowings from the credit facility were $82,000 at December 31, 2010. These proceeds were primarily used to acquire properties. The interest rate at December 31, 2010 was 4.25%. In addition, the Company issued a $12,100 letter of credit that was issued from the revolving credit facility which secures an outstanding $12.0 million bond payable for the Northside Mall. This bond is included with the Mortgages Payable on the Company’s Consolidated Balance Sheet. At December 31, 2010, there was $27,900 available for borrowing under the facility.
At December 31, 2010, the Company had a note payable from a consolidated joint venture to the Company’s partner in the amount of $3,384. The note bears interest at 6% and is due the earlier of May 1, 2012 or when Publix and Hobby Lobby, two new tenants in the property owned by the joint venture, commence their lease and are opened for business.
We determine the fair value of the Company’s unsecured line of credit and note payable by performing discounted cash flow analyses using an appropriate market discount rate for similar types of instruments. At December 31, 2010, the fair value approximated $87.2 million.
10. Derivatives and Hedging Activities
Risk Management Objective of Using Derivatives
The Company is exposed to certain risk arising from both its business operations and economic conditions. The Company principally manages its exposures to a wide variety of business and operational risks through management of its core business activities. The Company manages economic risks, including interest rate, liquidity, and credit risk primarily by managing the amount, sources, and duration of its debt funding and the use of derivative financial instruments. Specifically, the Company enters into derivative financial instruments to manage exposures that arise from business activities that result in the receipt or payment of future known and uncertain cash amounts, the value of which are determined by interest rates. The Company’s derivative financial instruments are used to manage differences in the amount, timing, and duration of the Company’s known or expected cash receipts and its known or expected cash payments principally related to the Company’s investments and borrowings.
Cash Flow Hedges of Interest Rate Risk
The Company’s objectives in using interest rate derivatives are to add stability to interest expense and to manage its exposure to interest rate movements. To accomplish this objective, the Company primarily uses interest rate swaps as part of its interest rate risk management strategy. Interest rate swaps designated as cash flow hedges involve the receipt of variable amounts from a counterparty in exchange for the Company making fixed-rate payments over the life of the agreements without exchange of the underlying notional amount.
The effective portion of changes in the fair value of derivatives designated and that qualify as cash flow hedges is recorded in Accumulated Other Comprehensive Income and is subsequently reclassified into earnings in the period that the hedged forecasted transaction affects earnings. In December 2010, the Company executed two pay-fixed interest rate swaps to hedge the variable cash flows associated with one of the Company’s mortgage payables. The Company had no derivative financial instruments prior to prior to the execution of the
71
Table of Contents
two swaps. The ineffective portion of the change in fair value of the derivatives is recognized directly in earnings. During the year ended December 31, 2010, the Company recorded no amounts in earnings attributable to hedge ineffectiveness.
Amounts reported in accumulated other comprehensive income related to derivatives will be reclassified to interest expense as interest payments are made on the Company’s hedged variable-rate debt. During 2010, the Company estimates that an additional $586,738 will be reclassified as an increase to interest expense.
As of December 31, 2010, the Company had the following outstanding interest rate derivatives that were designated as cash flow hedges of interest rate risk:
| Cash Flow Hedge Derivative Summary |
||||||||
| As of December 31, 2010 | ||||||||
| Number of Instruments | Notional | |||||||
| Derivative Type |
||||||||
| Interest Rate Swaps |
2 | $ | 55,800 | |||||
| Total |
2 | $ | 55,800 | |||||
Tabular Disclosure of Fair Values of Derivative Instruments on the Balance Sheet
The table below presents the fair value of the Company’s derivative financial instruments as well as their classification on the Balance Sheet as of December 31, 2010.
| Fair Values of Derivative Instruments Designated as Cash Flow Hedges |
||||||||
| As of December 31, 2010 | ||||||||
| Derivatives Asset | Derivative Liabilities | |||||||
| Interest rate derivatives |
||||||||
| Balance Sheet Location |
Other assets | |
Accounts payable and other liabilities |
| ||||
| Pay-Fixed Swaps |
$ | 0 | $ | 388 | ||||
| Total |
$ | 0 | $ | 388 | ||||
Tabular Disclosure of the Effect of Derivative Instruments on the Income Statement
The tables below present the effect of the Company’s derivative financial instruments on the Income Statement as of December 31, 2010.
| Income Statement Impact of Derivatives in Cash Flow Hedging Relationships For the Year Ended December 31, 2010 |
||||||||||||||||||||
| Amount of Gain/(loss) Recognized in OCI on Derivative (Effective Portion) |
Location of Loss Reclassified from Accumulated OCI into Income (Effective Portion) |
Amount of Gain/(loss) Reclassified from Accumulated OCI into Income (Effective Portion) |
Location of Gain/ (loss) Recognized in Income on Derivative (Ineffective Portion and Amount Excluded from Effectiveness Testing) |
Amount of Gain/(loss) Recognized in Income on Derivative (Ineffective Portion and Amount Excluded from Effectiveness Testing) |
||||||||||||||||
| Interest rate derivatives |
||||||||||||||||||||
| Pay-Fixed Swaps |
$ | 415 | Interest expense | $ | 26 | Other income/expense | $ | 0 | ||||||||||||
| Total |
$ | 415 | $ | 26 | $ | 0 | ||||||||||||||
72
Table of Contents
Credit-risk-related Contingent Features
The Company’s agreement with its derivative counterparty related to the two existing interest rate swaps detailed above contains a provision where if the Company defaults on any of its indebtedness, including default where repayment of the indebtedness has not been accelerated by the lender, then the company could also be declared in default on its derivative obligations. Additionally, because the Company’s derivative counterparty is also the lender for the hedged floating rate credit agreement, the swap agreements incorporate the loan covenant provisions of the Company’s indebtedness. Failure to comply with the loan covenant provisions would result in the Company being in default on any derivative instrument obligations covered by the agreement.
If the Company had breached any of these provisions at December 31, 2010, it could have been required to settle its obligations under the agreements at their termination value. As of December 31, 2010, the termination value defined as the fair value of derivatives in a net liability position, which includes accrued interest but excludes any adjustment for nonperformance risk, ($414,871). As of December 31, 2010, the Company has not posted any collateral related to these agreements.
Although the Company’s derivative contracts are subject to a master netting arrangement, the Company does not net its derivative fair values or any existing rights or obligations to cash collateral on the consolidated balance sheet.
11. Equity
The Company issued 15,000,000 shares in conjunction with the Offering resulting in net proceeds of approximately $194,600 after deducting the underwriters’ discount and commissions and offering expenses. In conjunction with the Formation transaction, the Company also issued 507,993 shares of common stock and 641,062 OP Units. In 2010, the Company issued restricted stock awards to senior executives and directors totaling 155,338 shares of common stock which are included in the total shares of common stock outstanding as of December 31, 2010.
Consolidated net income is reported in the Company’s consolidated financial statements at amounts that include the amounts attributable to both the common stockholders and the non-controlling interests. In conjunction with the Formation Transactions, certain interests in the Predecessor were contributed in exchange for OP Units. OP Units not held by the Company are reflected as non-controlling interest in the Company’s consolidated financial statements. OP Units not held by the Company have redemption provisions that permit the issuer to settle in either cash or common stock at the option of the Company. As a result of the redemption provisions, the OP Units are classified outside of permanent equity within our Consolidated Balance Sheet. The following table shows the ownership interests in the Operating Partnership:
| December 31, 2010 | ||||||||
| Partnership Units |
Percentage of Total |
|||||||
| Excel Trust, Inc. |
15,663,331 | 96.1 | % | |||||
| Noncontrolling interest consisting of: |
||||||||
| OP Units |
641,062 | 3.9 | % | |||||
| Total |
16,304,393 | 100.0 | % | |||||
A charge is recorded each period in the consolidated statements of income for the non-controlling interests’ proportionate share of the Company’s net income (loss).
On December 31, 2010, the Company accrued for a dividend of $1,880 to the common stockholders of record as of December 31, 2010 and a distribution of $77 to the holders of OP Units, each of which was paid in January 2011.
2010 Equity Incentive Award Plan
The Company has established the 2010 Equity Incentive Award Plan of Excel Trust, Inc. and Excel Trust, L.P. (the “2010 Plan”), pursuant to which the Company’s Board of Directors or a committee of its independent
73
Table of Contents
directors may make grants of stock options, restricted stock, stock appreciation rights and other stock-based awards to its non-employee directors, employees and consultants. The maximum number of shares of the Company’s common stock that may be issued pursuant to the 2010 Plan is 1,350,000.
On April 23, 2010, 126,766 shares of restricted common stock were issued to certain of the Company’s senior management. These shares vest over four years with 25% vesting on the first anniversary of the grant date and the remainder vesting in equal quarterly installments thereafter. On April 23, 2010, 28,572 shares of restricted common stock were issued to members of the Company’s Board of Directors. These shares vest pro-rata over four years in monthly installments.
Shares of the Company’s restricted common stock generally may not be sold, pledged, assigned or transferred in any manner other than by will or the laws of descent and distribution or, subject to the consent of the administrator of the 2010 Plan, a domestic relations order, unless and until all restrictions applicable to such shares have lapsed. Such restrictions expire upon vesting. Shares of the Company’s restricted common stock have full voting rights and rights to dividends. During the period from April 28, 2010 to December 31, 2010, the Company recognized compensation expense of $357 related to the restricted common stock grants ultimately expected to vest. ASC Topic 718, Compensation — Stock Compensation, requires forfeitures to be estimated at the time of grant and revised, if necessary, in subsequent periods if actual forfeitures differ from those estimates. The Company has estimated $0 in forfeitures in 2010. Stock compensation expense is included in general and administrative in the Company’s accompanying consolidated statements of operations.
As of December 31, 2010, there was $1,709 of total unrecognized compensation expense related to the non-vested shares of the Company’s restricted common stock. As of December 31, 2010, this expense was expected to be recognized over a remaining period of 3.3 years.
| Number of Nonvested Shares of Restricted Common Stock |
Weighted Average Grant Date Fair Value |
|||||||
| Balance — January 1, 2010 |
— | $ | — | |||||
| Granted — April 23, 2010 |
155,338 | $ | 13.30 | |||||
| Vested |
4,762 | $ | 13.30 | |||||
| Balance — December 31, 2010 |
150,576 | $ | 13.30 | |||||
| Expected to vest — December 31, 2010 |
150,576 | $ | 13.30 | |||||
12. Related Party Transactions
Prior to the Offering, Excel Realty Holdings, LLC, a company wholly-owned by Mr. Sabin (“ERH”), managed operations of ETP under various management agreements. Fees paid to ERH for property management services were $43 from January 1, 2010 to April 27, 2010 and $134 and $118 in the years ended December 31, 2009 and 2008, respectively.
At December 31, 2009, there were $1,216 of net payables due to Mr. Sabin’s affiliates for net advances made to ETP for certain mortgage debt repayments and other capital items. This balance was included in due to owner in the accompanying consolidated and combined balance sheet. In conjunction with the Formation Transactions, this payable was repaid.
Subsequent to the Offering, many of the employees of ERH became employees of the Company. ERH reimburses the Company for estimated time the Company employees spend on ERH related matters. For the period from April 28, 2010 to December 31, 2010, $118 was reimbursed to the Company from ERH and included in other income in the consolidated statements of operations.
74
Table of Contents
13. Income Taxes
The Company intends to elect to be taxed as a REIT under the Code commencing with its taxable year ending December 31, 2010. To qualify as a REIT, the Company must meet a number of organizational and operational requirements, including the requirement that it distribute currently at least 90% of its REIT taxable income to its stockholders. It is the Company’s intention to comply with these requirements and maintain the Company’s REIT status. As a REIT, the Company generally will not be subject to corporate federal, state or local income taxes on income it distributes currently (in accordance with the Code and applicable regulations) to its stockholders. If the Company fails to qualify as a REIT in any taxable year, then it will be subject to federal, state and local income taxes at regular corporate rates and may not be able to qualify as a REIT for subsequent tax years. Even if the Company qualifies for taxation as a REIT, the Company may be subject to certain state and local taxes on its income, properties and operations and to federal income and excise taxes on its taxable income not distributed in the amounts and in the time frames prescribed by the Code and applicable regulations thereunder. The income tax treatment for dividends was as follows:
| Record Date |
Payable Date | Total Distribution per Share |
2010 Taxable Ordinary Dividend |
|||||||||
| 9/30/2010 |
10/15/2010 | $ | .080000 | $ | .080000 | |||||||
| 12/31/2010 |
01/17/2011 | .050622 | .050622 | |||||||||
Of the dividend distributions made to holders of record as of December 31, 2010 paid on January 17, 2011, $.069378 was considered 2011 dividend distributions for federal income tax purposes.
ETP’s real estate entities were partnerships and limited liability companies. Under applicable federal and state income tax rules, the allocated share of net income or loss from partnerships and limited liability companies is reportable in the income tax returns of the partners and members. Accordingly, no income tax provision is included in the accompanying combined financial statements of the Predecessor.
14. Commitments and Contingencies
Litigation:
The Company is not presently subject to any material litigation nor, to its knowledge, is any material litigation threatened against it which if determined unfavorably, would have a material adverse effect on its consolidated and combined financial position, results of operations or cash flows.
Environmental Matters:
The Company follows the policy of monitoring its properties for the presence of hazardous or toxic substances. While there can be no assurance that a material environmental liability does not exist at its properties, the Company is not currently aware of any environmental liability with respect to its properties that would have a material effect on its consolidated and combined financial position, results of operations or cash flows. Further, the Company is not aware of any environmental liability or any unasserted claim or assessment with respect to an environmental liability that it believes would require additional disclosure or the recording of a loss contingency.
Other
The Company’s other commitments and contingencies include the usual obligations of real estate owners and operators in the normal course of business. In management’s opinion, these matters are not expected to have a material adverse effect on its consolidated and combined financial position, results of operations or cash flows.
75
Table of Contents
15. Segment Disclosure
The Company and ETP’s reportable segments consist of the two types of commercial real estate properties for which management internally evaluates operating performance and financial results: Office Properties and Retail Properties. The Company was formed for the primary purpose of owning and operating Retail Properties. As such, administrative costs after the Offering are shown under the Retail Property segment. Retail Properties also includes undeveloped land which the Company may develop into a retail property.
The Company and ETP evaluate the performance of the segments based upon property net operating income. “Property Net Operating Income” is defined as operating revenues (rental revenue and tenant recoveries) less property operating expenses (maintenance and repairs, real estate taxes, management fees, and other operating expenses) and general and administrative expenses and excludes other non-property income, interest expense, depreciation and amortization. There is no intersegment activity.
The following table reconciles the Company and ETP’s segment activity to their combined results of operations for the periods from January 1, 2010 to April 27, 2010, April 28, 2010 to December 31, 2010 and the years ended December 31, 2009 and 2008.
| For the Period from April 28, 2010 to December 31, 2010 |
For the Period from January 1, 2010 to April 27, 2010 |
For the Year Ended December 31, 2009 |
For the Year Ended December 31, 2008 |
|||||||||||||
| Office Properties: |
||||||||||||||||
| Total revenues |
$ | 2,349 | $ | 1,021 | $ | 3,196 | $ | 1,913 | ||||||||
| Property operating expenses |
437 | 212 | 656 | 673 | ||||||||||||
| General and administrative costs |
— | 5 | 22 | 25 | ||||||||||||
| Property net operating income, as defined |
1,912 | 804 | 2,518 | 1,215 | ||||||||||||
| Depreciation and amortization |
687 | 326 | 961 | 575 | ||||||||||||
| Interest expense |
545 | 269 | 814 | 842 | ||||||||||||
| Interest income |
— | — | 4 | 27 | ||||||||||||
| Net income (loss) |
$ | 680 | $ | 209 | $ | 747 | $ | (175 | ) | |||||||
| Retail Properties: |
||||||||||||||||
| Total revenues |
$ | 13,569 | $ | 547 | $ | 1,794 | $ | 1,919 | ||||||||
| Property operating expenses |
2,927 | 167 | 573 | 475 | ||||||||||||
| General and administrative costs |
7,152 | 3 | 23 | 18 | ||||||||||||
| Property net operating income, as defined |
3,490 | 377 | 1,198 | 1,426 | ||||||||||||
| Depreciation and amortization |
6,040 | 216 | 1,084 | 828 | ||||||||||||
| Interest expense |
3,147 | 214 | 545 | 751 | ||||||||||||
| Interest income |
166 | — | 2 | 2 | ||||||||||||
| Gain on acquisition of real estate |
978 | — | — | — | ||||||||||||
| Net loss |
$ | (4,553 | ) | $ | (53 | ) | $ | (429 | ) | $ | (151 | ) | ||||
76
Table of Contents
| For the Period from April 28, 2010 to December 31, 2010 |
For the Period from January 1, 2010 to April 27, 2010 |
For the Year Ended December 31, 2009 |
For the Year Ended December 31, 2008 |
|||||||||||||
| Total Reportable Segments: |
||||||||||||||||
| Total revenues |
$ | 15,918 | $ | 1,568 | $ | 4,990 | $ | 3,832 | ||||||||
| Property operating expenses |
3,364 | 379 | 1,229 | 1,148 | ||||||||||||
| General and administrative expenses |
7,152 | 8 | 45 | 43 | ||||||||||||
| Property net operating (loss) income, as defined |
5,402 | 1,181 | 3,716 | 2,641 | ||||||||||||
| Depreciation and amortization |
6,727 | 542 | 2,045 | 1,403 | ||||||||||||
| Interest expense |
3,692 | 483 | 1,359 | 1,593 | ||||||||||||
| Interest income |
166 | — | 6 | 29 | ||||||||||||
| Gain on acquisition of real estate |
978 | — | — | — | ||||||||||||
| Net (loss) income |
(3,873 | ) | 156 | 318 | (326 | ) | ||||||||||
| Reconciliation to Consolidated and Combined Net Income Attributable to the Common Stockholders and Controlling Interest of the Predecessor: |
||||||||||||||||
| Total net (loss) income for reportable segments |
(3,873 | ) | 156 | 318 | (326 | ) | ||||||||||
| Net (loss) income attributable to non-controlling interests |
(148 | ) | 290 | 75 | 56 | |||||||||||
| Net (loss) income attributable to the common stockholders or controlling interest of the Predecessor |
$ | (3,725 | ) | $ | (134 | ) | $ | 243 | $ | (382 | ) | |||||
The following table shows the Company and ETP’s consolidated and combined total assets by segment activity at December 31, 2010 and 2009.
| December 31, | December 31, | |||||||
| 2010 | 2009 | |||||||
| Assets: |
||||||||
| Office Properties: |
||||||||
| Total assets |
$ | 16,081 | $ | 17,163 | ||||
| Retail Properties: |
||||||||
| Total assets |
425,007 | 28,293 | ||||||
| Total Reportable Segments and Consolidated and Combined Assets: |
||||||||
| Total assets |
$ | 441,088 | $ | 45,456 | ||||
16. Subsequent Events
On January 28, 2011, the Company issued 2,000,000 shares of 7.00% Series A Cumulative Convertible Perpetual Preferred Stock, par value $0.01 per share, with a liquidation preference of $25.00 per share (the “Preferred Stock”). The Company will pay cumulative dividends on the Preferred Stock from the date of original issue at a rate of 7.00% per annum, subject to adjustment in certain circumstances. The annual dividend on each share of Preferred Stock is $1.75, payable quarterly in arrears on the 15th calendar day of each January, April, July and October of each year, commencing on April 15, 2011, as and if declared by Excel Trust’s board of directors.
77
Table of Contents
The Preferred Stock will be convertible, at the holders’ option, at any time and from time to time, into common stock of Excel Trust at an initial conversion rate of 1.6667 shares of common stock per share of Preferred Stock, which is equivalent to an initial conversion price of $15.00 per share. The conversion price will be subject to customary adjustments in certain circumstances. On or after April 1, 2014, Excel Trust may, at its option, convert some or all of the Preferred Stock if the closing price of the common stock equals or exceeds 140% of the conversion price for at least 20 of the 30 consecutive trading days ending the day before the notice of exercise of conversion is sent and Excel Trust has either declared and paid, or declared and set apart for payment, any unpaid dividends that are in arrears on the Preferred Stock.
Net proceeds from this offering was approximately $47.7 million. The Company used the net proceeds of this offering to repay a portion of the outstanding indebtedness under the revolving credit facility.
On March 7, 2011, long-term equity incentive awards were approved for certain executive officers and employees. These awards consist of both time-based and performance-based restricted stock awards. The performance-based awards for a total of 532,500 shares, may be vested over a three-year period based upon achievement of certain total stockholder return targets. The time-based awards for a total of 245,000 shares, vest over four years with 25% of the shares subject to vesting on the first anniversary of the grant date and the remainder vesting in equal quarterly installments thereafter.
17. Supplemental Financial Information
The following represents the results of operations, expressed in thousands, except per share amounts for each quarter during the years ended 2010 and 2009 (unaudited):
| Period from | ||||||||||||||||||||
| 2010 |
Mar. 31* | Apr. 1 to Apr. 27* |
Apr. 28 to Jun. 30 |
Sep. 30 | Dec. 31 | |||||||||||||||
| Revenues |
$ | 1,220 | $ | 348 | $ | 1,579 | $ | 5,271 | $ | 9,068 | ||||||||||
| Gain on acquisition of real estate (see note 3) |
— | — | — | — | 978 | |||||||||||||||
| Net income/(loss) attributable to the Predecessor or Company |
12 | (145 | ) | (1,752 | ) | (1,100 | ) | (873 | ) | |||||||||||
| Net income/(loss) per common share: |
||||||||||||||||||||
| Basic and diluted |
$ | (0.11 | ) | $ | (0.07 | ) | $ | (0.06 | ) | |||||||||||
| 2009* |
Mar. 31 | Jun. 30 | Sep. 30 | Dec. 31 | ||||||||||||||||
| Revenues |
$ | 1,130 | $ | 1,267 | $ | 1,347 | $ | 1,246 | ||||||||||||
| Net (loss)/income attributable to the Predecessor |
(236 | ) | 190 | 147 | 142 | |||||||||||||||
| * | — Represents results of the Predecessor. |
78
Table of Contents
EXCEL TRUST INC. PREDECESSOR
SCHEDULE II — VALUATION AND QUALIFYING ACCOUNTS
(Dollars in thousands)
| Additions | Deductions | Adjustments | ||||||||||||||||||
| Balance at Beginning of Year |
Charged to Bad Debt Expense |
Accounts Receivable Written-off’ |
Accounts Receivable Assumed |
Balance at End of Year |
||||||||||||||||
| Allowance for bad debts: |
||||||||||||||||||||
| Period from April 28, 2010 to December 31, 2010 |
$ | 69 | $ | 348 | $ | (88 | ) | $ | 276 | $ | 605 | |||||||||
| Period from January 1, 2010 to April 27, 2010 |
$ | 58 | $ | 16 | $ | (5 | ) | $ | — | $ | 69 | |||||||||
| Year ended December 31, 2009 |
$ | 175 | $ | 189 | $ | (306 | ) | $ | — | $ | 58 | |||||||||
| Year ended December 31, 2008 |
$ | — | $ | 175 | $ | — | $ | — | $ | 175 | ||||||||||
79
Table of Contents
EXCEL TRUST INC. PREDECESSOR
SCHEDULE III — REAL ESTATE AND ACCUMULATED DEPRECIATION
December 31, 2010
(Dollars in thousands)
| Initial Cost | Cost Capitalized Subsequent to Acquisition |
Carrying Amount as of the Close of Period |
||||||||||||||||||||||||||||||||||||||||||
| Properties |
Encum- braces |
Land | Building & Improve- ments |
Land | Building & Improve- ments |
Land | Building & Improve- ments |
TOTAL | Accumlated Depre- ciation |
Total Cost Net of Depre- ciation |
Year Acquired |
|||||||||||||||||||||||||||||||||
| Brandywine Crossing |
$ | — | $ | 20,047 | $ | 18,620 | $ | — | $ | 177 | $ | 20,047 | $ | 18,797 | $ | 38,844 | $ | (179 | ) | $ | 38,665 | 2010 | ||||||||||||||||||||||
| Dothan |
12,000 | 6,477 | 893 | — | 1,075 | 6,477 | 1,968 | 8,445 | (5 | ) | 8,440 | 2010 | ||||||||||||||||||||||||||||||||
| Five Forks Crossing |
5,242 | 1,796 | 6,874 | — | — | 1,796 | 6,874 | 8,670 | (1,344 | ) | 7,326 | 2005 | ||||||||||||||||||||||||||||||||
| Shops at Foxwood |
— | 4,680 | 6,889 | — | — | 4,680 | 6,889 | 11,569 | (38 | ) | 11,531 | 2010 | ||||||||||||||||||||||||||||||||
| Grant Creek |
16,029 | 6,805 | 13,116 | — | — | 6,805 | 13,116 | 19,921 | (243 | ) | 19,678 | 2010 | ||||||||||||||||||||||||||||||||
| Hulen |
14,085 | 2,230 | 16,514 | — | 22 | 2,230 | 16,536 | 18,766 | (412 | ) | 18,354 | 2010 | ||||||||||||||||||||||||||||||||
| St. Mariners Point |
3,483 | 1,950 | 4,220 | — | — | 1,950 | 4,220 | 6,170 | (80 | ) | 6,090 | 2010 | ||||||||||||||||||||||||||||||||
| Merchant Central |
4,647 | 1,059 | 4,298 | — | — | 1,059 | 4,298 | 5,357 | (90 | ) | 5,267 | 2010 | ||||||||||||||||||||||||||||||||
| Newport Town Center |
— | 1,586 | 6,571 | — | 102 | 1,586 | 6,673 | 8,259 | (1,218 | ) | 7,041 | 2007 | ||||||||||||||||||||||||||||||||
| Park West Place |
55,800 | 41,287 | 37,991 | — | — | 41,287 | 37,991 | 79,278 | (111 | ) | 79,167 | 2010 | ||||||||||||||||||||||||||||||||
| Plaza at Rockwall |
— | 14,941 | 21,247 | — | 1,719 | 14,941 | 22,966 | 37,907 | (490 | ) | 37,417 | 2010 | ||||||||||||||||||||||||||||||||
| Rosewick |
— | 12,024 | 10,499 | — | — | 12,024 | 10,499 | 22,523 | (125 | ) | 22,398 | 2010 | ||||||||||||||||||||||||||||||||
| Vestavia |
— | 7,806 | 18,955 | — | 14 | 7,806 | 18,969 | 26,775 | (279 | ) | 26,496 | 2010 | ||||||||||||||||||||||||||||||||
| Red Rock Commons |
— | 10,823 | — | — | 2,295 | 10,823 | 2,295 | 13,118 | — | 13,118 | 2007 | |||||||||||||||||||||||||||||||||
| Jewel |
— | 1,815 | 5,631 | — | — | 1,815 | 5,631 | 7,446 | (105 | ) | 7,341 | 2010 | ||||||||||||||||||||||||||||||||
| Shippensburg |
14,147 | 6,774 | 8,986 | — | — | 6,774 | 8,986 | 15,760 | (173 | ) | 15,587 | 2010 | ||||||||||||||||||||||||||||||||
| Twin Oaks |
— | 2,572 | 4,397 | — | — | 2,572 | 4,397 | 6,969 | (79 | ) | 6,890 | 2010 | ||||||||||||||||||||||||||||||||
| Barbourville |
— | 1,915 | 1,792 | — | — | 1,915 | 1,792 | 3,707 | (40 | ) | 3,667 | 2010 | ||||||||||||||||||||||||||||||||
| North Corbin |
— | 710 | 2,383 | — | — | 710 | 2,383 | 3,093 | (48 | ) | 3,045 | 2010 | ||||||||||||||||||||||||||||||||
| South Corbin |
— | 1,909 | 1,815 | — | — | 1,909 | 1,815 | 3,724 | (41 | ) | 3,683 | 2010 | ||||||||||||||||||||||||||||||||
| Beckley |
— | 2,133 | 4,178 | — | — | 2,133 | 4,178 | 6,311 | (69 | ) | 6,242 | 2010 | ||||||||||||||||||||||||||||||||
| Princeton |
— | 1,167 | 2,471 | — | — | 1,167 | 2,471 | 3,638 | (14 | ) | 3,624 | 2010 | ||||||||||||||||||||||||||||||||
| Excel Centre |
12,768 | 1,095 | 10,716 | — | 5,411 | 1,095 | 16,127 | 17,222 | (3,177 | ) | 14,045 | 2004 | ||||||||||||||||||||||||||||||||
| $ | 138,201 | $ | 153,601 | $ | 209,056 | $ | — | $ | 10,815 | $ | 153,601 | $ | 219,871 | $ | 373,472 | $ | (8,360 | ) | $ | 365,112 | ||||||||||||||||||||||||
The following is a reconciliation of total real estate carrying value and related accumulated depreciation for the years ended December 31:
| 2010 | 2009 | 2008 | ||||||||||
| Real Estate: |
||||||||||||
| Balance, beginning of period |
$ | 46,350 | $ | 40,740 | $ | 39,963 | ||||||
| Acquisitions and additions |
327,122 | 5,610 | 777 | |||||||||
| Balance, end of period |
$ | 373,472 | $ | 46,350 | $ | 40,740 | ||||||
| Accumulated Depreciation: |
||||||||||||
| Balance, beginning of period |
$ | (4,481 | ) | $ | (3,098 | ) | $ | (2,275 | ) | |||
| Acquisitions and additions |
(3,879 | ) | (1,383 | ) | (823 | ) | ||||||
| Balance, end of period |
$ | (8,360 | ) | $ | (4,481 | ) | $ | (3,098 | ) | |||
The Company’s Federal Tax Basis at December 31, 2010 was approximately $411,008.
80
Table of Contents
SCHEDULE IV — MORTGAGE LOANS ON REAL ESTATE
December 31, 2010
(Dollars in thousands)
| Type |
Description | Location | Interest Rate |
Final Maturity Date |
Periodic Payment Term |
Face Amount of Mortgage |
Carrying Amount of Mortgage |
|||||||||||||||||||||
| Mortgage loan |
Retail | Brandon, FL | 8 | % | April 2012 | Interest only | $ | 2,000 | $ | 2,000 | ||||||||||||||||||
| $ | 2,000 | $ | 2,000 | |||||||||||||||||||||||||
81
Table of Contents
| ITEM 9. | Changes In and Disagreements with Accountants on Accounting and Financial Disclosure |
None.
| ITEM 9A. | Controls and Procedures |
We maintain disclosure controls and procedures that are designed to ensure that information required to be disclosed in our reports under the Exchange Act, is recorded, processed, summarized and reported within the time periods specified in the Securities and Exchange Commission’s rules and forms and that such information is accumulated and communicated to our management, including our Chief Executive Officer and Chief Financial Officer, as appropriate, to allow for timely decisions regarding required disclosure. In designing and evaluating the disclosure controls and procedures, management recognizes that any controls and procedures, no matter how well designed and operated, can provide only reasonable assurance of achieving the desired control objectives, and management is required to apply its judgment in evaluating the cost-benefit relationship of possible controls and procedures.
As required by Rule 13a-15(b) under the Exchange Act, management carried out an evaluation, under the supervision and with the participation of our Chief Executive Officer and Chief Financial Officer, of the effectiveness of our disclosure controls and procedures as of the end of the period covered by this annual report on Form 10-K. Based on their evaluation as of December 31, 2010, our Chief Executive Officer and Chief Financial Officer have concluded that our disclosure controls and procedures (as defined in Rules 13a-15(e) and 15d-15(e) under the Exchange Act) were effective at the reasonable assurance level.
Management is responsible for establishing and maintaining adequate internal control over financial reporting, as defined in Rule 13a -15(f) of the Exchange Act.
This annual report does not include a report of management’s assessment regarding internal control over financial reporting or an attestation report of our registered public accounting firm due to rules established by the SEC, which do not require these reports in our first annual report on Form 10-K filed with the SEC.
In addition, there has been no change in our internal control over financial reporting (as such term is defined in Rules 13a-15(f) and 15(d)-15(f) under the Exchange Act) that occurred during our last fiscal quarter that has materially affected, or is reasonably likely to materially affect, our internal control over financial reporting.
| ITEM 9B. | OTHER INFORMATION |
2011 Annual Incentive Program
On March 7, 2011, the compensation committee of our board of directors established our 2011 annual incentive program. The annual incentive program represents a cash bonus program under our 2010 Equity Incentive Award Plan. In determining the respective annual bonuses for 2011 for each of our named executive officers, Messrs. Sabin, Plumb, Nakagawa, Burton and Ottesen, the compensation committee will consider the corporate performance of our company, while also taking into consideration the respective individual performances of each of the executive officers and the respective business unit performances for each of Messrs. Plumb, Nakagawa, Burton and Ottesen. For the named executive officers other than Mr. Sabin, 40% of the total bonus will be tied to corporate performance, 35% will be based on business unit performance and 25% will be based on individual performance. Mr. Sabin’s bonus will be based 75% on corporate performance and 25% on individual performance as his responsibilities relate to the entire company and not one specific business unit. We believe that the division of our cash incentive bonus program into corporate, business unit and individual components enables us to provide appropriate incentives for the achievement of milestones critical to our business and is specifically designed to be part of a balanced overall compensation program. Our named executive officers’ target bonuses will remain unchanged for 2011, with Mr. Sabin’s target bonus equal to 100% of his annual base salary and the other named executive officers’ target bonuses equal to 75% of their respective annual base salaries.
82
Table of Contents
Our corporate and business unit performance will be primarily assessed through the evaluation of our adjusted funds from operations, execution of our acquisition strategy and other financial/business unit related objectives. The actual bonuses awarded in any year, if any, may be more or less than the target, depending on individual and business unit performance and the achievement of corporate objectives and may vary based on other factors at the discretion of the compensation committee. Threshold, target and high achievement levels were established for each corporate objective and each named executive officer will have varying bonus opportunities based on performance relative to these objectives. The named executive officers’ maximum bonus for performance at or above the high achievement levels of each component will be 100% of his annual base salary (or 150% with respect to Mr. Sabin).
We expect to adopt a similar bonus program for future fiscal years, which will reward achievement at specified levels of corporate, business unit and individual performance and will contain target and maximum bonuses consistent with those disclosed above. Such financial performance will be measured against the corporate performance criteria discussed above.
2011 Long-Term Equity Incentive Awards
Also on March 7, 2011, the compensation committee approved performance-based long-term equity incentive awards for each of our named executive officers designed to provide the named executive officers with the potential to earn equity awards subject to our company creating stockholder value over a three-year performance period commencing January 1, 2011. The inclusion of performance-based awards in our annual equity award program reflects the compensation committee’s desire to have a higher portion of each named executive officer’s compensation tied to increasing stockholder value. It also supports our pay for performance philosophy by placing more emphasis on the incentive components of pay.
These 2011 performance-based restricted stock awards utilize total stockholder return targets over a three-year measurement period, which targets will be set forth in the applicable award agreements. Threshold, target and maximum achievement levels were established and each named executive officer will vest in the shares based on performance relative to these objectives. Full vesting credit will be given for achievement at or above the maximum targeted level and no vesting credit will be given for achievement below the threshold level. To achieve full vesting of this stock, we would need to achieve total stockholder returns of 14% annually. Vesting will be calculated on a linear basis for performance between the threshold and maximum performance target levels.
For each fiscal year during the three-year performance period, up to one-third of the shares subject to the restricted stock award may vest based on performance relative to the total stockholder return objectives. Following the completion of each fiscal year during the three-year performance period, our compensation committee will determine the number of shares to which each named executive officer will be entitled based on our performance relative to the total stockholder return objectives. If the threshold performance hurdle is not met for any of the fiscal years, none of the shares will vest at that time. Any unvested shares remaining at the end of the three-year performance period may vest if the threshold total stockholder return objective is achieved for the full three-year performance period, although the number of shares that will vest will depend on performance relative to the targets. In general, each named executive officer must be employed on a vesting date in order to be eligible to vest in these performance-based awards. However, in the event of the occurrence of a change in control transaction during the three-year performance period, the vesting of the awards will accelerate upon a named executive officer’s termination without cause or resignation for good reason within 18 months following the occurrence of the change in control.
Mr. Sabin was granted 225,000 shares of performance-based restricted stock and each of our other named executive officers was granted 52,500 shares of performance-based restricted stock.
83
Table of Contents
In addition to the performance-based restricted stock awards described above, each of our named executive officers was also granted a time-based restricted stock award. Mr. Sabin was granted 100,000 shares of time-based restricted stock and each of our other named executive officers was granted 20,000 shares of time-based restricted stock. Consistent with the time-based restricted stock awards previously awarded to our named executive officers, these awards will vest over four years, with 25% of the shares subject to each award vesting on the first anniversary of the grant date and the remainder vesting in equal quarterly installments thereafter. In general, each named executive officer must be employed on a vesting date in order to be eligible to vest in these time-based awards. However, upon a named executive officer’s termination without cause or resignation for good reason, such number of shares subject to each award as would have vested during the 12 month period following the date of termination will vest on the date of termination. In addition, the vesting of these awards will accelerate in full upon a named executive officer’s termination without cause or resignation for good reason within 18 months following the occurrence of a change in control transaction.
84
Table of Contents
PART III
| ITEM 10. | Directors, Executive Officers and Corporate Governance |
The information concerning our directors, executive officers and corporate governance required by Item 10 will be included in the Proxy Statement to be filed relating to Excel Trust, Inc.’s 2011 Annual Meeting of Stockholders and is incorporated herein by reference.
Pursuant to instruction G(3) to Form 10-K, information concerning audit committee financial expert disclosure set forth under the heading “Information Regarding the Board — Committees of the Board — Audit Committee” will be included in the Proxy Statement to be filed relating to Excel Trust, Inc.’s 2011 Annual Meeting of Stockholders and is incorporated herein by reference.
Pursuant to instruction G(3) to Form 10-K, information concerning compliance with Section 16(a) of the Exchange Act concerning our directors and executive officers set forth under the heading entitled “General — Section 16(a) Beneficial Ownership Reporting Compliance” will be included in the Proxy Statement to be filed relating to Excel Trust, Inc.’s 2011 Annual Meeting of Stockholders and is incorporated herein by reference.
| ITEM 11. | Executive Compensation |
The information concerning our executive compensation required by Item 11 will be included in the Proxy Statement to be filed relating to Excel Trust, Inc.’s 2011 Annual Meeting of Stockholders and is incorporated herein by reference.
| ITEM 12. | Security Ownership of Certain Beneficial Owners and Management and Related Stockholder Matters |
The information concerning the security ownership of certain beneficial owners and management and related stockholder matters required by Item 12 will be included in the Proxy Statement to be filed relating to Excel Trust, Inc.’s 2011 Annual Meeting of Stockholders and is incorporated herein by reference.
| ITEM 13. | Certain Relationships and Related Transactions, and Director Independence |
The information concerning certain relationships and related transactions and director independence required by Item 13 will be included in the Proxy Statement to be filed relating to Excel Trust, Inc.’s 2011 Annual Meeting of Stockholders and is incorporated herein by reference.
| ITEM 14. | Principal Accountant Fees and Services |
The information concerning our principal accountant fees and services required by Item 14 will be included in the Proxy Statement to be filed relating to Excel Trust, Inc.’s 2011 Annual Meeting of Stockholders and is incorporated herein by reference.
85
Table of Contents
| Exhibit Number |
Description | |
| 3.1 | Articles of Amendment and Restatement of Excel Trust, Inc. (1) | |
| 3.2 | Amended and Restated Bylaws of Excel Trust, Inc. (1) | |
| 3.3 | Articles Supplementary Classifying 7.00% Series A Cumulative Convertible Perpetual Preferred Stock of Excel Trust, Inc. (2) | |
| 4.1 | Form of Certificate for Common Stock of Excel Trust, Inc. (1) | |
| 4.2 | Specimen Certificate for 7.00% Series A Cumulative Convertible Perpetual Preferred Stock of Excel Trust, Inc. (2) | |
| 10.1 | Amended and Restated Agreement of Limited Partnership of Excel Trust, L.P. (2) | |
| 10.2 | Registration Rights Agreement, dated May 4, 2010, by and among Excel Trust, Inc., Excel Trust, L.P. and the persons named therein. (3) | |
| 10.3 | Registration Rights Agreement, dated as of January 28, 2011, by and among Excel Trust, Inc., Stifel, Nicolaus & Company, Incorporated and Raymond James & Associates, Inc. (2) | |
| 10.4 | Contribution Agreement (common stock) between Excel Trust, Inc. and Gary B. Sabin dated as of December 24, 2009. (1) | |
| 10.5 | Contribution Agreement (common stock) between Excel Trust, Inc. and additional contributors dated as of December 24, 2009. (1) | |
| 10.6 | Contribution Agreement (operating partnership units) between Excel Trust, L.P. and Gary B. Sabin dated as of December 24, 2009. (1) | |
| 10.7 | Contribution Agreement (operating partnership units) between Excel Trust, L.P. and James Y. Nakagawa dated as of December 24, 2009. (1) | |
| 10.8 | Contribution Agreement (operating partnership units) between Excel Trust, L.P. and S. Eric Ottesen dated as of December 24, 2009. (1) | |
| 10.9 | Contribution Agreement (operating partnership units) between Excel Trust, L.P. and Mark T. Burton dated as of December 24, 2009. (1) | |
| 10.10 | Form of Contribution Agreement (operating partnership units) between Excel Trust, L.P. and additional contributors dated as of December 24, 2009. (1) | |
| 10.11 | First Amendment to Contribution Agreement (common stock) between Excel Trust, Inc. and Gary B. Sabin dated as of April 21, 2010. (1) | |
| 10.12 | First Amendment to Contribution Agreement (common stock) between Excel Trust, Inc. and additional contributor dated as of April 21, 2010. (1) | |
| 10.13 | First Amendment to Contribution Agreement (operating partnership units) between Excel Trust, L.P. and Gary B. Sabin dated as of April 21, 2010. (1) | |
| 10.14 | First Amendment to Contribution Agreement (operating partnership units) between Excel Trust, L.P. and James Y. Nakagawa dated as of April 21, 2010. (1) | |
| 10.15 | First Amendment to Contribution Agreement (operating partnership units) between Excel Trust, L.P. and S. Eric Ottesen dated as of April 21, 2010. (1) | |
| 10.16 | First Amendment to Contribution Agreement (operating partnership units) between Excel Trust, L.P. and Mark T. Burton dated as of April 21, 2010. (1) | |
86
Table of Contents
| Exhibit Number |
Description | |
| 10.17 | First Amendment to Contribution Agreement (operating partnership units) between Excel Trust, L.P. and additional contributor dated as of April 21, 2010. (1) | |
| 10.18 | 2010 Equity Incentive Award Plan. (4) | |
| 10.19 | Excel Trust, Inc. and Excel Trust, L.P. Incentive Bonus Plan. (3) | |
| 10.20 | Form of Restricted Stock Award Agreement under the 2010 Equity Incentive Award Plan. (1) | |
| 10.21 | Form of Indemnification Agreement between Excel Trust, Inc. and each of its directors and officers. (1) | |
| 10.22 | Employment Agreement among Excel Trust, Inc., Excel Trust, L.P. and Gary B. Sabin. (5) | |
| 10.23 | Employment Agreement among Excel Trust, Inc., Excel Trust, L.P. and Spencer G. Plumb. (5) | |
| 10.24 | Employment Agreement among Excel Trust, Inc., Excel Trust, L.P. and James Y. Nakagawa. (5) | |
| 10.25 | Employment Agreement among Excel Trust, Inc., Excel Trust, L.P. and Mark T. Burton. (5) | |
| 10.26 | Employment Agreement among Excel Trust, Inc., Excel Trust, L.P. and S. Eric Ottesen. (5) | |
| 10.27 | Credit Agreement, dated July 8, 2010, by and among Excel Trust, L.P., as Borrower, Excel Trust, Inc. , as Parent, Wells Fargo Securities, LLC and KeyBanc Capital Markets, as Joint Lead Arrangers and Joint Bookrunners, Wells Fargo Bank, National Association, as Administrative Agent, KeyBank National Association, as Syndication Agent, PNC Capital Markets, LLC and U.S. Bank National Association as Documentation Agents, and certain other lenders party thereto. (6) | |
| 10.28 | First Amendment to Credit Agreement, dated September 8, 2010, by and among Excel Trust, L.P., as Borrower, Excel Trust, Inc. , as Parent, each of the Lenders party thereto, and Wells Fargo Bank, National Association, as Administrative Agent. (7) | |
| 10.29 | Second Amendment to Credit Agreement, dated December 3, 2010, by and among Excel Trust, L.P., as Borrower, Excel Trust, Inc. , as Parent, each of the Lenders party thereto, and Wells Fargo Bank, National Association, as Administrative Agent. (7) | |
| 10.30 | Purchase and Sale Agreement and Joint Escrow Instructions, dated May 6, 2010, between CNLRS Rockwall, L.P. and Excel Trust, L.P. (3) | |
| 10.31 | First Amendment to Purchase and Sale Agreement and Joint Escrow Instructions, dated May 19, 2010, between CNLRS Rockwall, L.P. and Excel Trust, L.P. (3) | |
| 10.32 | Loan Purchase Agreement dated August 30, 2010 between Propst Vestavia LLC and Excel Vestavia LLC. (Vestavia Hills City Center) (8) | |
| 10.33 | Release Agreement and Covenant Not to Sue dated August 30, 2010 among AIG Baker Vestavia, L.L.C., AIG/Baker Partnership and Excel Vestavia LLC.(Vestavia Hills City Center) (8) | |
| 10.34 | Purchase and Sale Agreement and Joint Escrow Instructions dated September 3, 2010 between Faison-Brandywine, LLC and Excel Trust, L.P.(Brandywine Crossing) (9) | |
| 10.35 | Purchase and Sale Agreement and Joint Escrow Instructions dated September 3, 2010 between Faison-Rosewick, LLC and Excel Trust, L.P.(Rosewick Crossing) (9) | |
| 10.36 | Purchase and Sale Agreement and Joint Escrow Instructions dated September 23, 2010.(Park West Place) (10) | |
| 10.37 | Purchase and Sale Agreement and Joint Escrow Instructions between Lakha Properties — Gilroy LLC and Excel Trust, L.P. dated December 9, 2010. (Gilroy Crossing) (11) | |
87
Table of Contents
| Exhibit Number |
Description | |
| 21.1* | List of Subsidiaries of Excel Trust, Inc. | |
| 23.1* | Consent of Deloitte & Touche LLP. | |
| 31.1* | Certifications of Chief Executive Officer pursuant to Section 302 of the Sarbanes-Oxley Act of 2002. | |
| 31.2* | Certifications of Chief Financial Officer pursuant to Section 302 of the Sarbanes-Oxley Act of 2002. | |
| 32.1* | Certifications of Chief Executive Officer and Chief Financial Officer pursuant to 18 U.S.C. Section 1350, as adopted pursuant to Section 906 of the Sarbanes-Oxley Act of 2002. | |
| * | Filed herewith. |
| (1) | Incorporated herein by reference to Excel Trust, Inc.’s Registration Statement on Form S-11, as amended (File No. 333-164031), filed with the Securities and Exchange Commission on December 24, 2009. |
| (2) | Incorporated herein by reference to Excel Trust, Inc.’s Current Report on Form 8-K filed with the Securities and Exchange Commission on January 31, 2011. |
| (3) | Incorporated herein by reference to Excel Trust, Inc. Quarterly Report on Form 10-Q filed with the Securities and Exchange Commission on June 4, 2010. |
| (4) | Incorporated herein by reference to Excel Trust, Inc.’s Registration Statement on Form S-8 (File No. 333-166267) filed with the Securities and Exchange Commission on April 23, 2010. |
| (5) | Incorporated herein by reference to Excel Trust, Inc’s Current Report on Form 8-K filed with the Securities and Exchange Commission on April 28, 2010. |
| (6) | Incorporated herein by reference to Excel Trust, Inc.’s Current Report on Form 8-K filed with the Securities and Exchange Commission on July 13, 2010. |
| (7) | Incorporated herein by reference to Excel Trust, Inc.’s Current Report on Form 8-K filed with the Securities and Exchange Commission on December 8, 2010. |
| (8) | Incorporated herein by reference to Excel Trust, Inc.’s Current Report on Form 8-K filed with the Securities and Exchange Commission on September 3, 2010. |
| (9) | Incorporated herein by reference to Excel Trust, Inc.’s Current Report on Form 8-K filed with the Securities and Exchange Commission on September 9, 2010. |
| (10) | Incorporated herein by reference to Excel Trust, Inc.’s Current Report on Form 8-K filed with the Securities and Exchange Commission on September 28, 2010. |
| (11) | Incorporated herein by reference to Excel Trust, Inc.’s Current Report on Form 8-K filed with the Securities and Exchange Commission on December 15, 2010. |
88
Table of Contents
SIGNATURES
Pursuant to the requirements of Section 13 or 15(d) of the Securities Exchange Act of 1934, the registrants have duly caused this report to be signed on their behalf by the undersigned, thereunto duly authorized.
| EXCEL TRUST, INC. |
| /S/ GARY B. SABIN |
| Gary B. Sabin |
| Chief Executive Officer (Principal Executive Officer) |
| /S/ JAMES Y. NAKAGAWA |
| James Y. Nakagawa |
| Chief Financial Officer and Treasurer (Principal Financial Officer) |
Dated: March 9, 2011
Pursuant to the requirements of the Securities Exchange Act of 1934, this report has been signed below by the following persons on behalf of the registrants and in the capacities and on the dates indicated.
| Signature |
Title |
Date | ||
| /S/ GARY B. SABIN Gary B. Sabin |
Chairman of the Board of Directors |
March 9, 2011 | ||
| /S/ SPENCER G. PLUMB Spencer G. Plumb |
Director |
March 9, 2011 | ||
| /S/ MARK T. BURTON Mark T. Burton |
Director |
March 9, 2011 | ||
| /S/ BRUCE G. BLAKLEY Bruce G. Blakley |
Director |
March 9, 2011 | ||
| /S/ BURLAND B. EAST III Burland B. East III |
Director |
March 9, 2011 | ||
| /S/ ROBERT E. PARSONS, JR. Robert E. Parsons, Jr. |
Director |
March 9, 2011 | ||
| /S/ WARREN R. STALEY Warren R. Staley |
Director |
March 9, 2011 | ||
89