Attached files
| file | filename |
|---|---|
| EX-99.1 - EX-99.1 - DORAL FINANCIAL CORP | g26420exv99w1.htm |
| 8-K - FORM 8-K - DORAL FINANCIAL CORP | g26420e8vk.htm |
EXHIBIT 99.2
| Doral Financial Corporation Q4 Investor Presentation March 2011 |
| Disclaimer 2 This presentation may include forward-looking statements as defined in the Private Securities Litigation Reform Act of 1995 (the "PSLRA"). These include comments with respect to our objectives and strategies, and the results of our operations and our business. Forward-looking statements can be identified by the fact that they do not relate strictly to historical or current facts. They often include words such as "expects," "anticipates," "intends," "plans," "believes," "seeks," "estimates," or words of similar meaning, or future or conditional verbs such as "will," "would," "should," "could" or "may." We intend these forward-looking statements to be covered by the safe harbor provisions of the PSLRA. Forward-looking statements provide our expectations or predictions of future conditions, events or results. They are, by their nature, subject to risks and uncertainties. They are not guarantees of future performance, and actual results may differ materially. By their nature, these forward-looking statements involve numerous assumptions and uncertainties, both general and specific, including those discussed in Doral Financial Corporation's 2010 Annual Report on Form 10-K and other filings we make with the Securities and Exchange Commission. Risk factors and uncertainties that could cause the Company's actual results to differ materially from those described in forward-looking statements can be found in the Company's 2010 Annual Report on Form, which is available in the Company's website at www.doralfinancial.com. The statements in this presentation speak only as of the date they are made. We do not undertake to update forward-looking statements to reflect the impact of circumstances or events that arise after the date the forward-looking statements were made. |
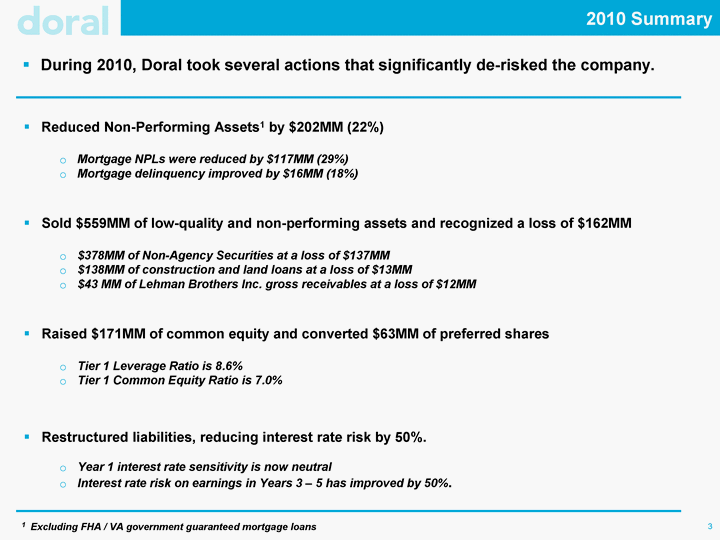
| 2010 Summary 3 Reduced Non-Performing Assets1 by $202MM (22%) Mortgage NPLs were reduced by $117MM (29%) Mortgage delinquency improved by $16MM (18%) Sold $559MM of low-quality and non-performing assets and recognized a loss of $162MM $378MM of Non-Agency Securities at a loss of $137MM $138MM of construction and land loans at a loss of $13MM $43 MM of Lehman Brothers Inc. gross receivables at a loss of $12MM Raised $171MM of common equity and converted $63MM of preferred shares Tier 1 Leverage Ratio is 8.6% Tier 1 Common Equity Ratio is 7.0% Restructured liabilities, reducing interest rate risk by 50%. Year 1 interest rate sensitivity is now neutral Interest rate risk on earnings in Years 3 - 5 has improved by 50%. During 2010, Doral took several actions that significantly de-risked the company. 1 Excluding FHA / VA government guaranteed mortgage loans |
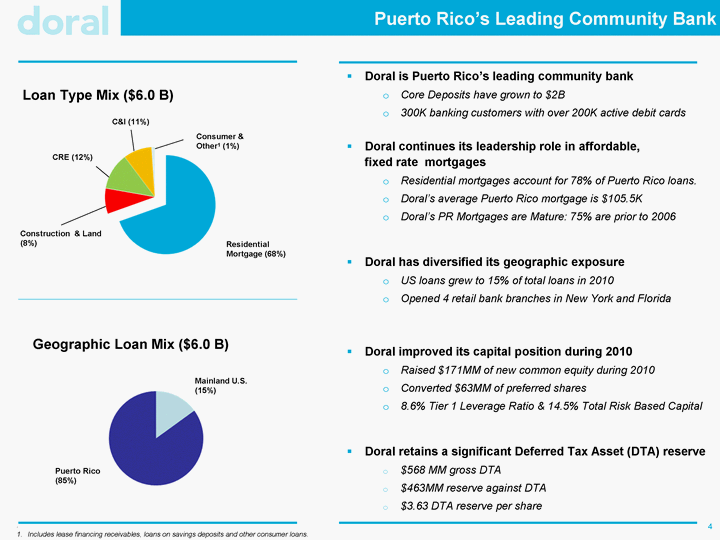
| Puerto Rico's Leading Community Bank 4 . Includes lease financing receivables, loans on savings deposits and other consumer loans. Residential Mortgage (68%) Consumer & Other1 (1%) C&I (11%) Construction & Land (8%) CRE (12%) Loan Type Mix ($6.0 B) Doral is Puerto Rico's leading community bank Core Deposits have grown to $2B 300K banking customers with over 200K active debit cards Doral continues its leadership role in affordable, fixed rate mortgages Residential mortgages account for 78% of Puerto Rico loans. Doral's average Puerto Rico mortgage is $105.5K Doral's PR Mortgages are Mature: 75% are prior to 2006 Doral has diversified its geographic exposure US loans grew to 15% of total loans in 2010 Opened 4 retail bank branches in New York and Florida Doral improved its capital position during 2010 Raised $171MM of new common equity during 2010 Converted $63MM of preferred shares 8.6% Tier 1 Leverage Ratio & 14.5% Total Risk Based Capital Doral retains a significant Deferred Tax Asset (DTA) reserve $568 MM gross DTA $463MM reserve against DTA $3.63 DTA reserve per share Puerto Rico (85%) Mainland U.S. (15%) Geographic Loan Mix ($6.0 B) |
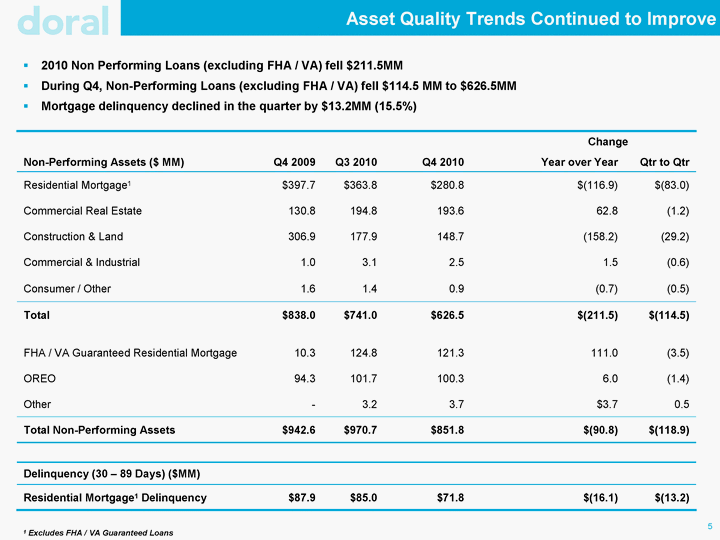
| Asset Quality Trends Continued to Improve 5 2010 Non Performing Loans (excluding FHA / VA) fell $211.5MM During Q4, Non-Performing Loans (excluding FHA / VA) fell $114.5 MM to $626.5MM Mortgage delinquency declined in the quarter by $13.2MM (15.5%) Change Change Non-Performing Assets ($ MM) Q4 2009 Q3 2010 Q4 2010 Year over Year Qtr to Qtr Residential Mortgage1 $397.7 $363.8 $280.8 $(116.9) $(83.0) Commercial Real Estate 130.8 194.8 193.6 62.8 (1.2) Construction & Land 306.9 177.9 148.7 (158.2) (29.2) Commercial & Industrial 1.0 3.1 2.5 1.5 (0.6) Consumer / Other 1.6 1.4 0.9 (0.7) (0.5) Total $838.0 $741.0 $626.5 $(211.5) $(114.5) FHA / VA Guaranteed Residential Mortgage 10.3 124.8 121.3 111.0 (3.5) OREO 94.3 101.7 100.3 6.0 (1.4) Other - 3.2 3.7 $3.7 0.5 Total Non-Performing Assets $942.6 $970.7 $851.8 $(90.8) $(118.9) Delinquency (30 - 89 Days) ($MM) Residential Mortgage1 Delinquency $87.9 $85.0 $71.8 $(16.1) $(13.2) 1 Excludes FHA / VA Guaranteed Loans |
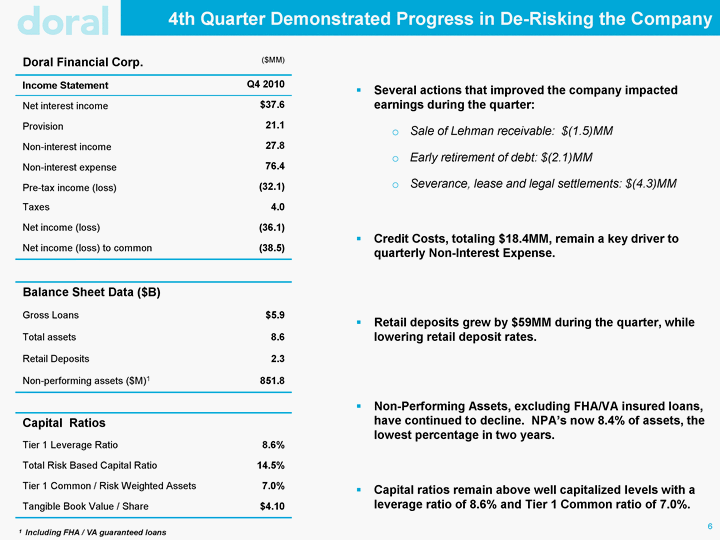
| 6 4th Quarter Demonstrated Progress in De-Risking the Company Doral Financial Corp. ($MM) Income Statement Q4 2010 Net interest income $37.6 Provision 21.1 Non-interest income 27.8 Non-interest expense 76.4 Pre-tax income (loss) (32.1) Taxes 4.0 Net income (loss) (36.1) Net income (loss) to common (38.5) Balance Sheet Data ($B) Gross Loans $5.9 Total assets 8.6 Retail Deposits 2.3 Non-performing assets ($M)1 851.8 Capital Ratios Tier 1 Leverage Ratio 8.6% Total Risk Based Capital Ratio 14.5% Tier 1 Common / Risk Weighted Assets 7.0% Tangible Book Value / Share $4.10 Several actions that improved the company impacted earnings during the quarter: Sale of Lehman receivable: $(1.5)MM Early retirement of debt: $(2.1)MM Severance, lease and legal settlements: $(4.3)MM Credit Costs, totaling $18.4MM, remain a key driver to quarterly Non-Interest Expense. Retail deposits grew by $59MM during the quarter, while lowering retail deposit rates. Non-Performing Assets, excluding FHA/VA insured loans, have continued to decline. NPA's now 8.4% of assets, the lowest percentage in two years. Capital ratios remain above well capitalized levels with a leverage ratio of 8.6% and Tier 1 Common ratio of 7.0%. 1 Including FHA / VA guaranteed loans |
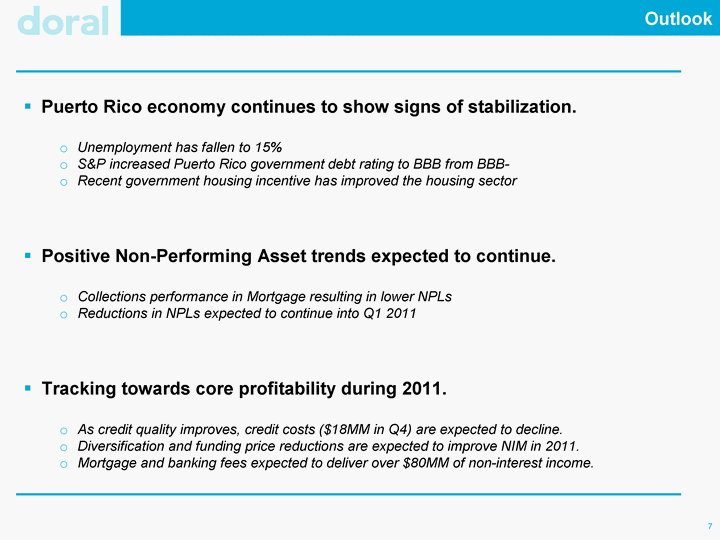
| Outlook 7 Puerto Rico economy continues to show signs of stabilization. Unemployment has fallen to 15% S&P increased Puerto Rico government debt rating to BBB from BBB- Recent government housing incentive has improved the housing sector Positive Non-Performing Asset trends expected to continue. Collections performance in Mortgage resulting in lower NPLs Reductions in NPLs expected to continue into Q1 2011 Tracking towards core profitability during 2011. As credit quality improves, credit costs ($18MM in Q4) are expected to decline. Diversification and funding price reductions are expected to improve NIM in 2011. Mortgage and banking fees expected to deliver over $80MM of non-interest income. |
