Attached files
| file | filename |
|---|---|
| 8-K - FORM 8-K - PNC FINANCIAL SERVICES GROUP, INC. | d8k.htm |
 The PNC
Financial Services Group, Inc. Citigroup Financial Services Conference
March 9, 2011
Exhibit 99.1 |
 2
Cautionary Statement Regarding Forward-Looking
Information and Adjusted Information
This
presentation
includes
“snapshot”
information
about
PNC
used
by
way
of
illustration.
It
is
not
intended
as
a
full
business
or
financial
review
and
should
be
viewed
in
the
context
of
all
of
the
information
made
available
by
PNC
in
its
SEC
filings.
The
presentation
also
contains
forward-looking
statements
regarding
our
outlook
or
expectations
for
earnings,
revenues,
expenses,
capital
levels,
liquidity
levels,
asset
quality
and/or
other
matters
regarding
or
affecting
PNC
and
its
future
business
and
operations.
Forward-looking
statements
are
necessarily
subject
to
numerous
assumptions,
risks
and
uncertainties,
which
change
over
time.
The
forward-looking
statements
in
this
presentation
are
qualified
by
the
factors
affecting
forward-looking
statements
identified
in
the
more
detailed
Cautionary
Statement
included
in
the
Appendix,
which
is
included
in
the
version
of
the
presentation
materials
posted
on
our
corporate
website
at
www.pnc.com/investorevents.
We
provide
greater
detail
regarding
some
of
these
factors
in
our
2010
Form
10-K,
including
in
the
Risk
Factors
and
Risk
Management
sections
of
that
report,
and
in
our
subsequent
SEC
filings
(accessible
on
the
SEC’s
website
at
www.sec.gov
and
on
or
through
our
corporate
website
at
www.pnc.com/secfilings).
We
have
included
web
addresses
here
and
elsewhere
in
this
presentation
as
inactive
textual
references
only.
Information
on
these
websites
is
not
part
of
this
presentation.
Future
events
or
circumstances
may
change
our
outlook
or
expectations
and
may
also
affect
the
nature
of
the
assumptions,
risks
and
uncertainties
to
which
our
forward-looking
statements
are
subject.
The
forward-looking
statements
in
this
presentation
speak
only
as
of
the
date
of
this
presentation.
We
do
not
assume
any
duty
and
do
not
undertake
to
update
those
statements.
In
this
presentation,
we
will
sometimes
refer
to
adjusted
results
to
help
illustrate
the
impact
of
certain
types
of
items,
such
as
our
third
quarter
2010
gain
related
to
the
sale
of
PNC
Global
Investment
Servicing
Inc.
(“GIS”),
the
acceleration
of
accretion
of
the
remaining
issuance
discount
on
our
TARP
preferred
stock
in
connection
with
the
first
quarter
2010
redemption
of
such
stock,
our
fourth
quarter
2009
gain
related
to
BlackRock’s
acquisition
of
Barclays
Global
Investors
(the
“BLK/BGI
gain”),
our
fourth
quarter
2008
conforming
provision
for
credit
losses
for
National
City,
and
integration
costs
in
the
2010
and
2009
periods.
This
information
supplements
our
results
as
reported
in
accordance
with
GAAP
and
should
not
be
viewed
in
isolation
from,
or
a
substitute
for,
our
GAAP
results.
We
believe
that
this
additional
information
and
the
reconciliations
we
provide
may
be
useful
to
investors,
analysts,
regulators
and
others
as
they
evaluate
the
impact
of
these
respective
items
on
our
results
for
the
periods
presented
due
to
the
extent
to
which
the
items
are
not
indicative
of
our
ongoing
operations.
We
may
also
provide
information
on
pretax
pre-provision
earnings
(total
revenue
less
noninterest
expense),
as
we
believe
that
pretax
pre-provision
earnings,
a
non-GAAP
measure,
is
useful
as
a
tool
to
help
evaluate
the
ability
to
provide
for
credit
costs
through
operations.
Where
applicable,
we
provide
GAAP
reconciliations
for
such
additional
information.
In
certain
discussions,
we
may
also
provide
information
on
yields
and
margins
for
all
interest-earning
assets
calculated
using
net
interest
income
on
a
taxable-equivalent
basis
by
increasing
the
interest
income
earned
on
tax-exempt
assets
to
make
it
fully
equivalent
to
interest
income
earned
on
taxable investments. We believe this adjustment may be useful when comparing yields and
margins for all earning assets. We may also use annualized,
proforma,
estimated
or
third
party
numbers
for
illustrative
or
comparative
purposes
only.
These
may
not
reflect
actual
results.
This
presentation
may
also
include
discussion
of
other
non-GAAP
financial
measures,
which,
to
the
extent
not
so
qualified
therein
or
in
the
Appendix,
is
qualified
by
GAAP
reconciliation
information
available
on
our
corporate
website
at
www.pnc.com
under
“About
PNC–Investor
Relations.” |
 3
Today’s Discussion
PNC’s powerful franchise and ability to execute
delivered record results in 2010
PNC’s business model is designed to deliver
strong results and long-term value
PNC has momentum and is positioned to
achieve even greater shareholder value
PNC Continues to Build a Great Company.
PNC Continues to Build a Great Company. |
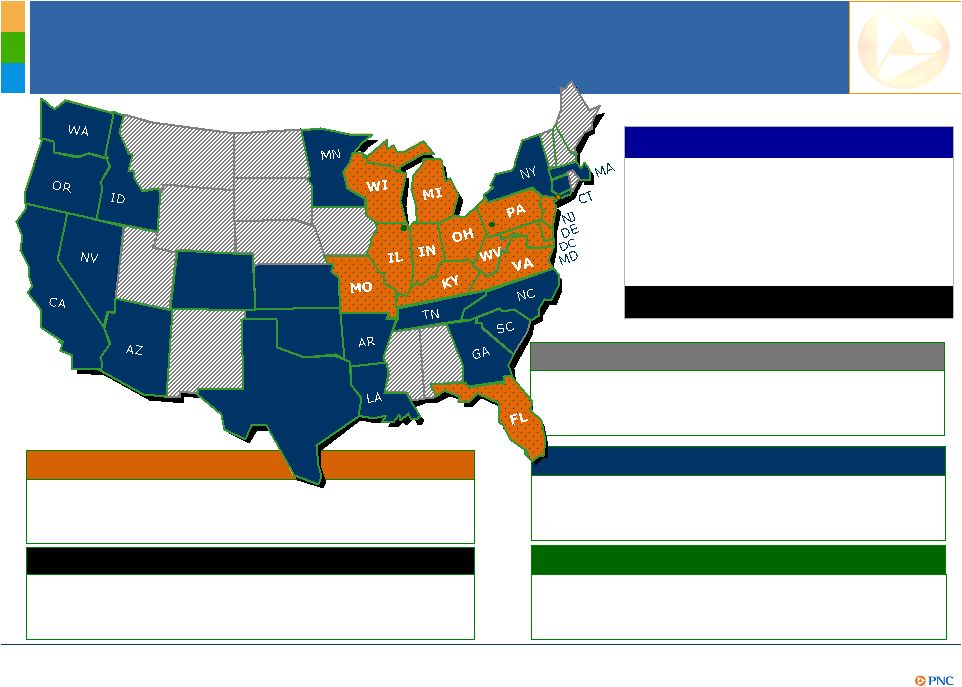 4
Footprint covering nearly 1/3 of the U.S.
population
Retail
Corporate & Institutional
A leader in serving middle-market
customers and government entities
One of the largest bank-held asset
managers in the U.S.
Asset Management
Residential Mortgage
National distribution capabilities
PNC’s Powerful Franchise
Dec. 31, 2010
U.S. Rank1
Deposits
$183B
6
Assets
$264B
6
Branches
2,470
5
ATMs
6,673
5
Record 2010 net income of $3.4B
(1)
Rankings
source:
SNL
DataSource;
Banks
headquartered
in
U.S.
Assets
rank
excludes
Morgan
Stanley
and
Goldman
Sachs.
CO
TX
KS
OK
BlackRock
A leader in investment management, risk
management and advisory services worldwide
A Powerful
Franchise
and Record
Results
th
th
th
th |
 5
PNC’s Successful Business Model
Designed to
Deliver
Strong
Results
Staying core funded and disciplined in our deposit pricing
Returning to a moderate risk profile
Leveraging customer relationships and our strong brand to
grow high quality, diverse revenue streams
Creating positive operating leverage
1
while investing in
innovation
Remaining disciplined with our capital
Executing on our strategies
(1) A period to period dollar or percentage change when revenue growth exceeds expense
growth. |
 6
PNC’s Higher Quality,
Differentiated Balance Sheet
Category (billions)
Dec. 31,
2010
Change from Dec. 31,
2008
Investment securities
$64
$21
48%
Core loans
1
136
(13)
(9%)
Distressed loans
2
15
(12)
(43%)
Other assets
49
(23)
(31%)
Total assets
$264
($27)
(9%)
Transaction deposits
$134
$23
21%
Retail CDs, time, savings
49
(33)
(40%)
Total deposits
$183
($10)
(5%)
Borrowed funds, other
$50
($22)
(30%)
Preferred equity
1
(7)
(92%)
Common equity
30
12
69%
Total liabilities and equity
$264
($27)
(9%)
Improving environment for
corporate loan demand
Slower pace of CRE decline
Relatively stable consumer
portfolio, opportunities for
credit card growth
Continued run-off of distressed
loans
2
when appropriate
Further low cost deposit
gathering
Additional run-off of higher cost
deposits
Possible shift from capital
accumulation to optimization
4
2011 expectations
3
(1)
Excludes
loans
assigned
to
the
Distressed
Assets
Portfolio
business
segment.
(2)
Represents
loans
assigned
to
the
Distressed
Assets
Portfolio
business
segment.
(3)
Refer
to
the
economic
assumptions
in
the
Cautionary
Statement
in
the
Appendix.
(4)
Subject
to
regulatory
approvals.
Designed to
Deliver
Strong
Results |
 7
Returning to a Moderate Risk Profile
Nonperforming
loans³
to total
loans
Nonperforming
assets²
to total
assets
Net charge-
offs to average
loans
Allowance for
loan and lease
losses
4
to
loans
2010 reserves / NCOs
2.6
1.7
1.6
1.4
1.3
1.3
1.3
1.2
1.1
1.1
1.0
1.0
0.8
MTB
PNC
CMA
JPM
WFC
FITB
USB
BAC
RF
BBT
STI
KEY
COF
X
2010 key metrics
1
2.01%
2.55%
2.97%
3.68%
1.91%
2.65%
3.25%
3.27%
(1) As of or for the year ended December 31, 2010. Peers represents average of banks
identified in the Appendix. Sources: SNL DataSource. (2) Does not include
purchased impaired loans due to purchase accounting. Also does not include loans held for sale. (3) Nonperforming loans do not
include foreclosed and other assets. (4) Includes impairment reserves attributable to
purchased impaired loans. Loans PNC acquired from National City that were impaired are
purchased impaired loans. Designed to
Deliver
Strong
Results |
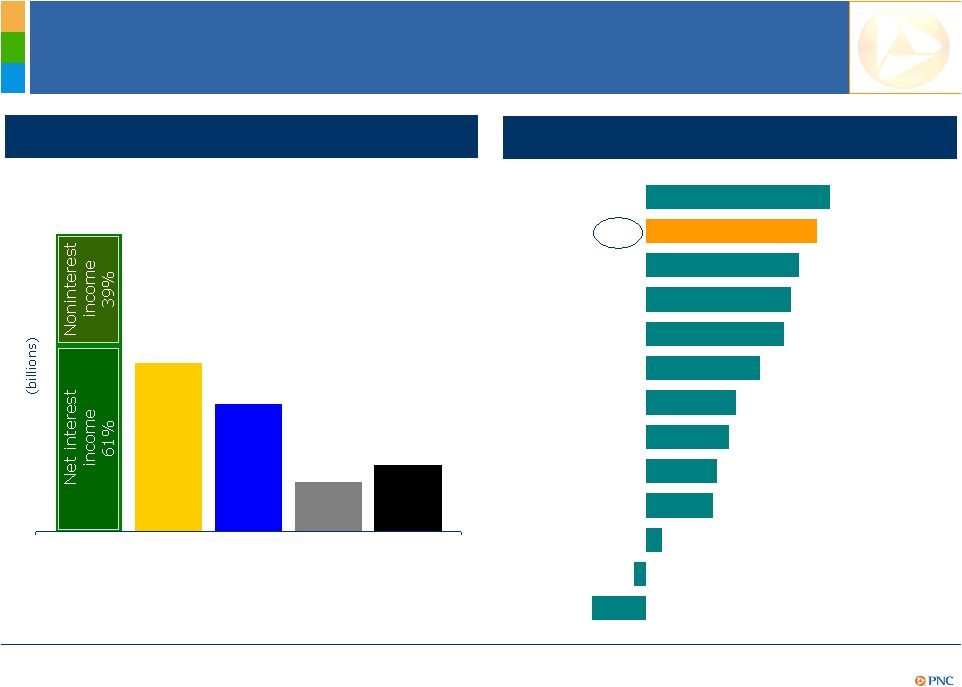 8
Strong Pretax Pre-Provision Earnings
1
and
Well-Controlled Expenses Drive Strong ROAA
Peer Source: SNL DataSource. (1) Total revenue less noninterest expense. PNC believes that
pre-tax, pre-provision earnings, a non-GAAP measure, is useful as a tool to
help evaluate our ability to provide for credit costs through operations. Total revenue and noninterest expense are
both from continuing operations on our consolidated income statement.
$15.2
$8.6
$6.6
Total
revenue
Noninterest
expense
Pretax
pre-
provision
earnings¹
Provision
Year ended December 31, 2010
Net
income
$2.5
$3.4
2010 return on average assets
1.37%
1.28%
1.14%
1.08%
1.03%
0.85%
0.67%
0.62%
0.53%
0.50%
0.12%
-0.09%
-0.40%
COF
PNC
USB
MTB
WFC
JPM
FITB
KEY
BBT
CMA
STI
BAC
RF
Designed to
Deliver
Strong
Results |
 9
3.96%
4.35%
3.93%
4.24%
3.32%
3.38%
3.39%
3.45%
2.88%
3.15%
3.10%
2.90%
1Q10
2Q10
3Q10
4Q10
Net interest
margin
Provision-
adjusted NIM
4
Expect Core
1
and Provision-Adjusted
2
Net
Interest Income to Improve in 2011
(1) Core net interest income is total net interest income, as reported, less related purchase
accounting accretion. (2) Provision-adjusted net interest income is total net
interest income, as reported, less provision. (3) Net interest margin less (annualized purchase accounting
accretion/average interest-earning assets).
(4)
Net interest margin less (annualized provision/average interest-earnings assets). (5)
Refer to the economic assumptions in the Cautionary Statement in the Appendix. Further
information on (3) and (4) is provided in the Appendix. Positioned to
Achieve
Greater
Shareholder
Value
Although lower NII and NIM is
expected, core net interest
income
1
and core NIM
3
are
expected to increase
-
Balance sheet is positioned for
rising interest rates
-
Further opportunity to lower
deposit costs
Purchase accounting accretion
expected to decrease up to $700
million, resulting in lower net
interest income and NIM
Provision expected to decrease by
over $800 million, resulting in
higher provision-adjusted net
interest income
2
Full year provision-adjusted NIM
4
expected to improve
2011
expectations
5
(billions)
1Q10
2Q10
3Q10
4Q10
FY10
Core NII
1
$1.9
$1.9
$1.9
$1.9
$7.6
Purchase accounting
accretion
$.4
$.5
$.3
$.3
$1.6
Total NII
$2.4
$2.4
$2.2
$2.2
$9.2
Provision
.8
.8
.5
.4
2.5
Provision-adjusted NII
2
$1.6
$1.6
$1.7
$1.8
$6.7
Core NIM
3 |
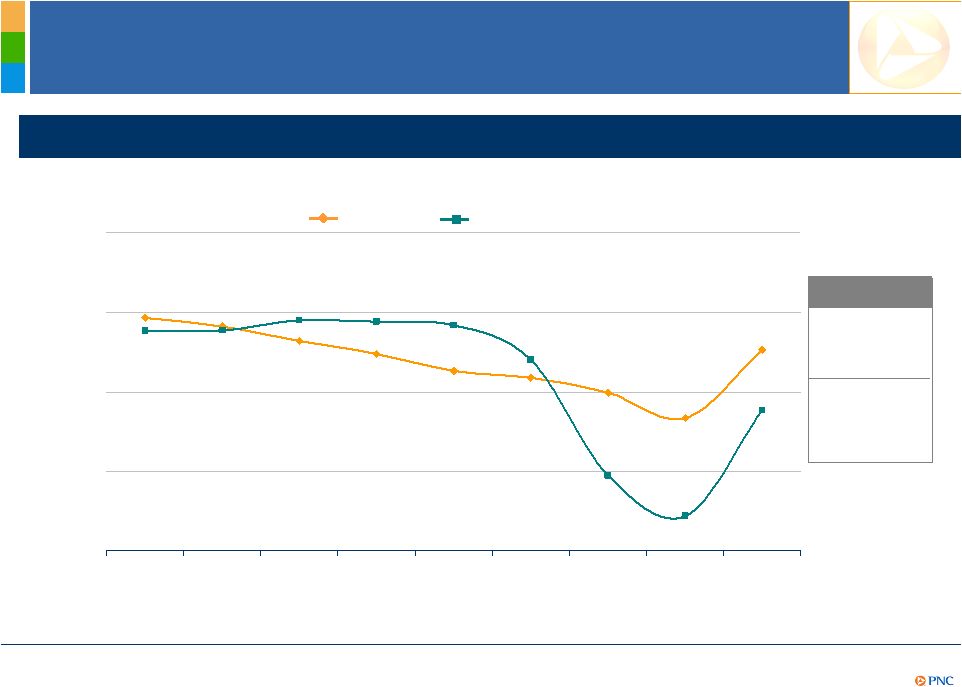 10
Provision-Adjusted Net Interest Margin
1
Trend
3.43%
3.32%
3.14%
2.97%
2.76%
2.68%
3.03%
2.17%
2.49%3
3.26%
3.27%
3.40%
3.38%
3.33%
2.90%
1.45%
2.27%
0.94%
0.50%
1.50%
2.50%
3.50%
4.50%
2002
2003
2004
2005
2006
2007
2008
2009
2010
PNC provision-adjusted margin
1
vs. Peers
2
PNC
Peers
2
(1) Net interest margin less (provision/average interest-earning assets). (2) Peers
represents average of banks identified in the Appendix. Peer source: SNL DataSource.
(3) Excludes the 4Q08 conforming provision for credit losses of $504 million related to the National City acquisition as
average interest-earning assets do not reflect the National City acquisition because the
acquisition closed on December 31, 2008. Other acquisitions did not similarly impact
the ratio. Including the National City conforming provision, the provision-adjusted net interest margin was
2.04%. Further information on (1) and (3) is provided in the Appendix.
PNC
2.89%
Average
Peers²
2.69%
Positioned to
Achieve
Greater
Shareholder
Value |
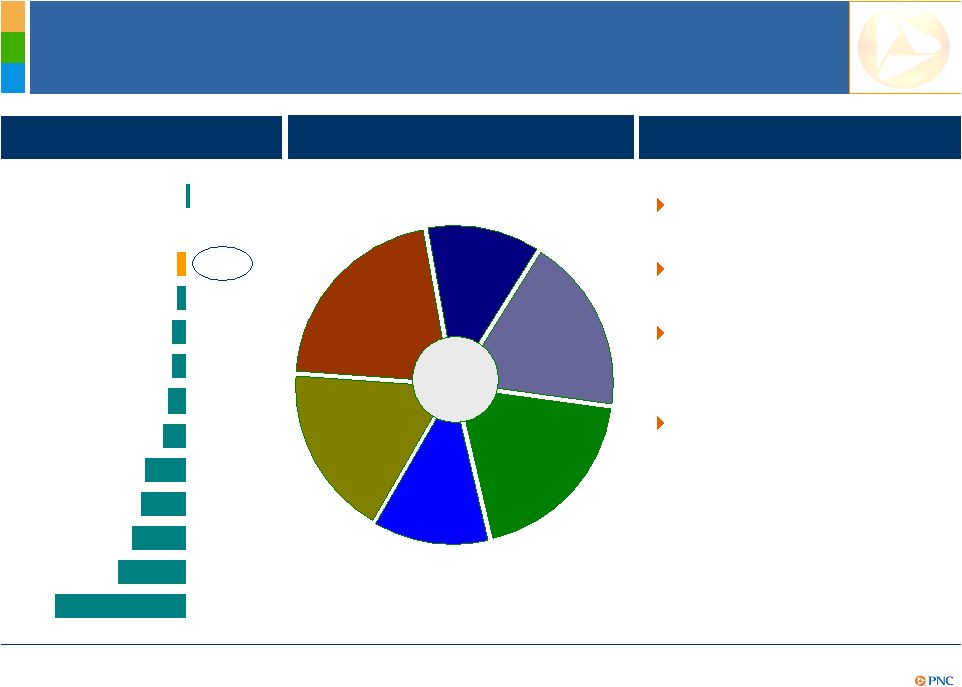 11
Diversified Sources of Fee Income
YoY change in noninterest
income
1%
0%
-2%
-2%
-3%
-3%
-4%
-5%
-9%
-10%
-12%
-15%
-29%
PNC¹
STI
JPM
KEY
CMA
WFC
BBT
FITB
2
BAC
RF
COF
MTB
USB
Noninterest income
Year ended December 31, 2010
Diversified fee sources
Sales and service model
Customer growth
momentum
Regulatory headwinds
$5.9B
Asset
management
Consumer
services
Corporate
services
Deposit
service
charges
18%
21%
12%
18%
12%
Other³
19%
Residential
Mortgage
Peer
source:
SNL
DataSource.
Noninterest
income
is
from
continuing
operations.
(1)
Excludes
the
2009
$1,076
million
BLK/BGI
gain
recorded
in
noninterest
income.
The
year
over
year
change
including
the
gain
was
-17%.
Further
information
is
provided
in
the
Appendix.
(2)
Excludes
the
impact of the 2009 gain related to the sale of a business. (3) Other in this chart includes
net gains on sales of securities, net OTTI, gains on BlackRock transactions, and
other. 2011 drivers
Positioned to
Achieve
Greater
Shareholder
Value |
 12
Disciplined Expense Management
2010 noninterest expense highlights
Expenses of $8.6 billion decreased 5% YoY
Integration costs totaled $387 million in 2010
Achieved acquisition cost savings of $1.8 billion annualized in 4Q10
Expenses
expected
to
be
down
in
2011,
but
magnitude
depends
on
investments
1
Aggressively adding talent in key markets across businesses
-
Asset Management Group
-
Corporate & Institutional Banking
-
Residential Mortgage Banking
Investing in products and services
-
Consumer payments model
-
Healthcare
Building out infrastructure
Positioned to
Achieve
Greater
Shareholder
Value
2011 outlook
(1) Subject to legal and regulatory contingencies. See Note 22 Legal Proceedings
included in Item 8 of PNC’s Form 10-K. Also refer to the economic assumptions
in the Cautionary Statement in the Appendix. |
 13
Strong Momentum –
Retail Banking
Retail Banking
4Q09
4Q10
Checking relationships
Online bill payment active customers
5,390
5,465
4Q09
4Q10
780
977
Most of 2010 client growth occurred in
2H10 following conversions
4Q10 checking relationships up 27,000 in a
typically flat seasonal quarter
Customer engagement scores higher in
2H10 than 1H10
Workplace and University Banking channel
client acquisition up 20% in 2H10 vs. 2H09
Reached definitive agreement to acquire 19
branches in Tampa, FL in January 2011
Positioned to
Achieve
Greater
Shareholder
Value |
 14
Regulatory changes are impacting revenue streams
Some competitors have chosen to increase fees and/or reduce customer choices
Products Designed to Accelerate
Retail Market Share Expansion
Positioned to
Achieve
Greater
Shareholder
Value
Industry challenge
PNC strategy
Expand market share and share of wallet by providing customers with more choices and
rewards
Announced new accounts to help customers save, manage money and avoid fees
-
Connects checking, credit, debit, and rewards
-
Expands Virtual Wallet features to reach a broader group of customers
-
An integrated view of your money that you cannot get anywhere else
-
The more business the customer does with PNC, the more they get in return
-
Free checking remains available with no balance requirement and free access to
PNC’s 6,673 ATM’s |
 15
Strong Momentum –
Corporate & Institutional Banking
2009
2010
$1,137
$1,225
Treasury management revenue
1
(1) Consolidated PNC amounts.
Capital markets revenue
1
Corporate & Institutional Banking
2009
2010
85% of Corporate Banking relationship
managers sold to a new name in 2010, with
many bringing in five or more
All relationship managers cross-sold in
2010
Strong TM pipeline including healthcare
providers, gov’t agencies and middle
market companies
In terms of capital markets deals
-#2 middle market
deal bookrunner -#4 U.S. real estate bookrunner
-#4 U.S.
asset-based credit lead arranger
Harris Williams revenue increased $80
million in 2010 vs. 2009
$533
$618
Positioned to
Achieve
Greater
Shareholder
Value |
  16
Strong Momentum –
Asset Management Group
Channel sales
1
+60%
$103B
2009 2010
Asset Management Group
Record sales year in 2010, including
60% YoY increase in channel sales, a
strategic focus for PNC
Total assets under administration of
$212 billion, discretionary assets under
management of $108 billion
Net asset flows up $3 billion in 2H10
versus 1H10
Significantly increased frontline talent
with 500 new hires in 2010,
approximately double prior year
2010 vs. 2009
Assets under management
$108B
Equity
Fixed income
Liquidity/other
+$6B
+$2B
($3B)
Positioned to
Achieve
Greater
Shareholder
Value
(1) Channel sales are new sales to clients who were referred to AMG by Retail Banking or
Corporate and Institutional Banking. |
 17
Remaining Disciplined With Our Capital
4Q10 Tier 1 common ratio
2010
return
on
Tier
1
common
capital
1
10.1%
9.8%
9.8%
9.3%
9.1%
8.8%
8.6%
8.3%
8.1%
7.9%
7.8%
7.5%
6.6%
CMA
PNC
JPM
KEY
BBT
COF
BAC
WFC
STI
RF
USB
FITB
MTB
24.6%
17.8%
16.9%
16.0%
15.6%
15.1%
10.0%
8.0%
8.0%
4.6%
1.9%
-1.8%
-7.2%
COF
MTB
USB
PNC
WFC
JPM
FITB
KEY
BBT
CMA
STI
BAC
RF
Peer Source: SNL DataSource and company reports. MTB is estimated. Ratios as of year end. (1)
Return on tier 1 common capital calculated as net
income
divided
by
tier
1
common
capital.
Further
information
is
provided
in
the
Appendix.
Positioned to
Achieve
Greater
Shareholder
Value |
 18
Possible Impact of Basel III
Tier 1 common ratio
9.8%
Under
current
rules
10.0%
(1)
Proforma
assumptions
may
change.
Proforma
assumes
current
common
stock
dividend
of
$.10
per
share
per
quarter
and
no
common
stock
repurchases.
Assumed
2011
net
income
of
$3.0
billion
and
2012
net
income
of
$3.4
billion
from
First
Call
mean
estimate
as
of
February
24,
2011.
The
First
Call
mean
estimate
is
used
for
illustrative
purposes
only
and
does
not
necessarily
reflect
management’s
expectations
and
may
not
reflect
actual
results.
Proforma
estimates
are
subject
to
change
depending
on
final
Basel
III
rules
and
final
regulatory
implementation.
Basel
III
proforma
assumptions
are
based
on
rules
in
current
form
and
also
include
lower
deferred
tax
assets
and
subinvestment
grade
securities
at
the
end
of
2012
and
the
impact
of
mortgage
servicing
rights
and
the
after-tax
treatment
of
our
BlackRock
investment.
PNC’s capital management priorities
12.6%
4Q10
Assumes full
Basel III
implementation
and without
benefit of multi-
year phase-in
Proforma
4Q12
1
Positioned to
Achieve
Greater
Shareholder
Value
Increase the return of capital to shareholders
via dividends and share repurchases; subject
to regulatory approval
Maintain ample capacity to meet the needs of
our clients and support organic business
growth
Continue to invest in innovative products and
services
Deploy capital for acquisitions that meet our
strategic criteria
Ensure capital adequacy in times of
uncertainty and regulatory compliance |
 19
A Demonstrated Ability to Achieve
Greater Shareholder Value
Achieving greater shareholder value
As of quarter end. (1) Tangible book value per share calculated as book value per share less
total intangible assets per share. PNC believes that tangible book value, a
non-GAAP measure, is useful as a tool to help evaluate the amount, on a per share basis, of intangible assets
included in book value per common share. Further information is provided in the
Appendix. 4Q08
4Q10
4Q08
4Q10
Book value per share
Tangible book value per share
1
$39.44
$56.29
$13.10
$35.82
Positioned to
Achieve
Greater
Shareholder
Value
4Q08
4Q10
Stock price
$49.00
$60.72 |
 20
Summary
PNC Continues to Build a Great Company.
PNC Continues to Build a Great Company.
PNC’s powerful franchise and ability to execute
delivered record results in 2010
PNC’s business model is designed to deliver
strong results and long-term value
PNC has momentum and is positioned to
achieve even greater shareholder value |
 21
Cautionary Statement Regarding Forward-Looking
Information
Appendix
This
presentation
includes
“snapshot”
information
about
PNC
used
by
way
of
illustration
and
is
not
intended
as
a
full
business
or
financial
review.
It
should not be viewed in isolation but rather in the context of all of the information made
available by PNC in its SEC filings. We also make statements in this presentation, and
we may from time to time make other statements, regarding our outlook or expectations for
earnings, revenues, expenses, capital levels, liquidity levels, asset quality and/or other
matters regarding or affecting PNC and its future business and operations that are
forward-looking statements within the meaning of the Private Securities Litigation Reform Act. Forward-looking statements are
typically
identified
by
words
such
as
“believe,”
“plan,”
“expect,”
“anticipate,”
“intend,”
“outlook,”
“estimate,”
“forecast,”
“will,”
“should,”
“project,”
“goal”
and other similar words and expressions. Forward-looking statements are subject to
numerous assumptions, risks and uncertainties, which change over time.
Forward-looking statements speak only as of the date they are made. We do not assume any
duty and do not undertake to update our forward- looking statements. Actual
results or future events could differ, possibly materially, from those that we anticipated in our forward-looking statements,
and future results could differ materially from our historical performance.
Our forward-looking statements are subject to the following principal risks and
uncertainties. We provide greater detail regarding some of these factors
in
our
2010
Form
10-K,
including
in
the
Risk
Factors
and
Risk
Management
sections
of
that
report,
and
in
our
subsequent
SEC
filings.
Our
forward-looking statements may also be subject to other risks and uncertainties, including
those that we may discuss elsewhere in this presentation or in
our
filings
with
the
SEC,
accessible
on
the
SEC’s
website
at
www.sec.gov
and
on
or
through
our
corporate
website
at
www.pnc.com/secfilings.
We
have
included
these
web
addresses
as
inactive
textual
references
only.
Information
on
these
websites
is
not
part
of
this
document.
•Our businesses and financial results are affected by business and economic conditions,
both generally and specifically in the principal markets in which we operate. In
particular, our businesses and financial results may be impacted by: o
Changes
in
interest
rates
and
valuations
in
the
debt,
equity
and
other
financial
markets.
o
Disruptions in the liquidity and other functioning of financial markets, including such
disruptions in the markets for real estate and other assets commonly securing financial
products. o
Actions by the Federal Reserve and other government agencies, including those that impact
money supply and market interest rates. o
Changes in our customers’, suppliers’
and other counterparties’
performance in general and their creditworthiness in particular.
o
A slowing or failure of the moderate economic recovery that began in mid-2009 and
continued throughout 2010. o
Continued effects of the aftermath of recessionary conditions and the uneven spread of the
positive impacts of the recovery on the economy in general and our customers in
particular, including adverse impact on loan utilization rates as well as delinquencies, defaults and customer ability
to meet credit obligations.
o
Changes in levels of unemployment.
o
Changes in customer preferences and behavior, whether as a result of changing business and
economic conditions, climate-related physical changes or legislative and regulatory
initiatives, or other factors. •Turbulence in significant portions of the US and
global financial markets could impact our performance, both directly by affecting our revenues and
the value of our assets and liabilities and indirectly by affecting our counterparties and the
economy generally. |
 22
Cautionary Statement Regarding Forward-Looking
Information (continued)
Appendix
•We
will
be
impacted
by
the
extensive
reforms
provided
for
in
the
Dodd-Frank
Wall
Street
Reform
and
Consumer
Protection
Act
(“Dodd-Frank
Act”)
and ongoing reforms impacting the financial institutions industry generally. Further, as
much of the Dodd-Frank Act will require the adoption of implementing regulations by
a number of different regulatory bodies, the precise nature, extent and timing of many of these reforms and the impact
on us is still uncertain.
•Financial
industry
restructuring
in
the
current
environment
could
also
impact
our
business
and
financial
performance
as
a
result
of
changes
in
the
creditworthiness and performance of our counterparties and by changes in the competitive and
regulatory landscape. •Our results depend on our ability to manage current elevated
levels of impaired assets. •Given current economic and financial market conditions,
our forward-looking financial statements are subject to the risk that these conditions will be
substantially different than we are currently expecting. These statements are based on our
current view that the moderate economic recovery that began in mid-2009 and
continued throughout 2010 will slowly gather enough momentum in 2011 to lower the unemployment rate amidst continued
low interest rates.
•Legal and regulatory developments could have an impact on our ability to operate our
businesses or our financial condition or results of operations or our competitive
position or reputation. Reputational impacts, in turn, could affect matters such as business generation and retention, our ability to
attract and retain management, liquidity, and funding. These legal and regulatory
developments could include: o
Changes resulting from legislative and regulatory responses to the current economic and
financial industry environment. o
Other legislative and regulatory reforms, including broad-based restructuring of financial
industry regulation (such as those under the Dodd- Frank
Act)
as
well
as
changes
to
laws
and
regulations
involving
tax,
pension,
bankruptcy,
consumer
protection,
and
other
aspects
of
the
financial institution industry.
o
Unfavorable resolution of legal proceedings or other claims and regulatory and other
governmental investigations or other inquiries. In addition to matters relating
to PNC’s business and activities, such matters may also include proceedings, claims, investigations, or inquiries relating to
pre-acquisition business and activities of acquired companies, such as National
City. o
The results of the regulatory examination and supervision process, including our failure to
satisfy the requirements of agreements with governmental agencies.
o
Changes in accounting policies and principles.
o
Changes
resulting
from
legislative
and
regulatory
initiatives
relating
to
climate
change
that
have
or
may
have
a
negative
impact
on
our
customers’
demand for or use of our products and services in general and their creditworthiness in
particular. o
Changes
to
regulations
governing
bank
capital,
including
as
a
result
of
the
Dodd-Frank
Act
and
of
the
so-called
“Basel
III”
initiatives.
•Our business and operating results are affected by our ability to identify and
effectively manage risks inherent in our businesses, including, where
appropriate,
through
the
effective
use
of
third-party
insurance,
derivatives,
and
capital
management
techniques,
and
by
our
ability
to
meet
evolving
regulatory capital standards.
•The adequacy of our intellectual property protection, and the extent of any costs
associated with obtaining rights in intellectual property claimed by others, can impact
our business and operating results. •Our ability to anticipate and respond to
technological changes can have an impact on our ability to respond to customer needs and to meet
competitive demands.
•Our ability to implement our business initiatives and strategies
could affect our financial performance over the next several years.
•Competition can have an impact on customer acquisition, growth and retention, as well as
on our credit spreads and product pricing, which can affect market share, deposits and
revenues. |
 23
Cautionary Statement Regarding Forward-Looking
Information (continued)
Appendix
•Our business and operating results can also be affected by widespread disasters,
terrorist activities or international hostilities, either as a result of the impact on
the economy and capital and other financial markets generally or on us or on our customers, suppliers or other counterparties
specifically.
•Also, risks and uncertainties that could affect the results anticipated in
forward-looking statements or from historical performance relating to our equity
interest in BlackRock, Inc. are discussed in more detail in BlackRock’s filings with the SEC, including in the Risk Factors sections of
BlackRock’s reports. BlackRock’s SEC filings are accessible on the SEC’s
website and on or through BlackRock’s website at www.blackrock.com. This material
is referenced for informational purposes only and should not be deemed to constitute a part of this document.
We grow our business in part by acquiring from time to time other financial services
companies, financial services assets and related deposits. Acquisitions present
us with risks in addition to those presented by the nature of the business acquired. These include risks and uncertainties
related
both
to
the
acquisition
transactions
themselves
and
to
the
integration
of
the
acquired
businesses
into
PNC
after
closing.
Acquisitions may be substantially more expensive to complete (including unanticipated costs
incurred in connection with the integration of the acquired company) and the
anticipated benefits (including anticipated cost savings and strategic gains) may be significantly harder or take longer to
achieve than expected. Acquisitions may involve our entry into new businesses or new
geographic or other markets, and these situations also present risks resulting from our
inexperience in those new areas. As a regulated financial institution, our pursuit of
attractive acquisition opportunities could be negatively impacted due to regulatory delays or other
regulatory issues. In addition, regulatory and/or legal issues relating to the
pre-acquisition operations of an acquired business may cause reputational harm to
PNC following the acquisition and integration of the acquired business into ours and may result in additional future costs or
regulatory limitations arising as a result of those issues.
Any annualized, proforma, estimated, third party or consensus numbers in this presentation are
used for illustrative or comparative purposes only and may not reflect actual
results. Any consensus earnings estimates are calculated based on the earnings projections made by analysts who cover
that
company.
The
analysts’
opinions,
estimates
or
forecasts
(and
therefore
the
consensus
earnings
estimates)
are
theirs
alone,
are
not
those
of
PNC or its management, and may not reflect PNC’s or other company’s actual or
anticipated results. |
 24
Non-GAAP to GAAP Reconcilement
Appendix
For the three months ended
$ in millions
Dec. 31, 2010
Sept. 30, 2010
June 30, 2010
Mar. 31, 2010
Net interest margin, as reported
3.93%
3.96%
4.35%
4.24%
Provision for credit losses
$442
$486
$823
$751
Avg. interest earning assets
$223,795
$223,677
$224,580
$226,992
Annualized provision/Avg. interest earning assets
0.78%
0.86%
1.47%
1.34%
Provision-adjusted net interest margin (1)
3.15%
3.10%
2.88%
2.90%
$ in millions
2002
2003
2004
2005
2006
2007
2008
2009
2010
Net interest margin, as reported
3.99%
3.64%
3.22%
3.00%
2.92%
3.00%
3.37%
3.82%
4.14%
Provision for credit losses
$309
$177
$52
$21
$124
$315
$1,517
$3,930
$2,502
Avg. interest-earning assets
$55,345
$55,172
$61,821
$73,001
$77,692
$98,010
$114,484
$238,487
$224,749
Provision/Avg. interest-earning assets
0.56%
0.32%
0.08%
0.03%
0.16%
0.32%
1.33%
1.65%
1.11%
Provision-adjusted net interest margin (1)
3.43%
3.32%
3.14%
2.97%
2.76%
2.68%
2.04%
2.17%
3.03%
$504
Adjusted provision for credit losses
$1,013
Avg. interest-earning assets
$114,484
Adjusted provision/Avg. interest-earning assets
0.88%
Adjusted provision-adjusted net interest margin (2)
2.49%
(2)
The
adjustment
represents
provision
for
credit
losses
adjusted
for
the
4Q08
conforming
provision
related
to
the
National
City
acquisition
(as
average
interest-
earnings
assets
for
2008
do
not
reflect
the
National
City
acquisition
because
it
closed
on
December
31,
2008),
divided
by
average
interest-earning
assets.
Other
acquisitions did not similarly impact the ratio.
(1) The adjustment represents annual or annualized, as applicable, provision for credit losses
divided by average interest-earning assets. For the year ended
Conforming provision - National City
PNC
believes
that
provision-adjusted
net
interest
margin,
a
non-GAAP
measure,
is
useful
as
a
tool
to
help
evaluate
the
amount
of
credit
related
risk
associated
with
interest-earning assets. |
 25
Non-GAAP to GAAP Reconcilement
Appendix
In millions except per share data
As of Dec. 31, 2008
As of Dec. 31, 2010
Common shareholders' equity
$17,490
$29,596
Common shares outstanding
443
526
Book value per
common share $39.44
$56.29
Intangible assets
$11,688
$10,753
Common shareholders' equity less intangible assets
$5,802
$18,843
Common shares outstanding
443
526
Tangible book
value per common share $13.10
$35.82
PNC
believes
that
tangible
book
value
per
common
share,
a
non-GAAP
measure,
is
useful
as
a
tool
to
help
evaluate
the
amount, on a per share basis, of intangible assets included in book value per common
share. $ in millions
Dec. 31, 2010
Sept. 30, 2010
June 30, 2010
Mar. 31, 2010
Net interest margin, as reported
3.93%
3.96%
4.35%
4.24%
Purchase accounting accretion
$344
$325
$540
$440
Purchase accounting accretion, if annualized
$1,365
$1,289
$2,166
$1,784
Avg. interest earning assets
$223,795
$223,677
$224,580
$226,992
Annualized purchase accounting accretion/Avg. interest earning assets
0.61%
0.58%
0.96%
0.79%
Core net interest margin (1)
3.32%
3.38%
3.39%
3.45%
(1)
PNC
believes
that
core
net
interest
margin,
a
non-GAAP
measure,
is
useful
as
a
tool
to
help
evaluate
the
impact
of
purchase
accounting
accretion
on net interest margin. The adjustment represents annualized purchase accounting
accretion divided by average interest-earning assets. For the three months
ended In millions
Dec. 31, 2009
Dec. 31, 2010
Noninterest income, as reported
$7,145
$5,946
-17%
Adjustment:
Gain on BlackRock/BGI transaction
1,076
-
-
Noninterest income, as adjusted
$6,069
$5,946
-2%
For the year ended
Year over Year
Change |
 26
Non-GAAP to GAAP Reconcilement
Appendix
As of or for the three months ended
In millions
Dec. 31, 2010
Sept. 30, 2010
June 30, 2010
Mar. 31, 2010
Tier 1 common capital
$21,188
$20,437
$18,173
$17,562
Reported net income
820
1,103
803
671
Reported net income,
if annualized 3,253
4,376
3,221
2,721
Adjustments:
After-tax gain on sale of GIS
-
(328)
After-tax
impact of integration costs 51
62
65
73
Adjusted
net income $871
$837
$868
$744
Adjusted net income, if annualized
3,454
3,321
3,482
3,017
Return on tier 1 common capital
15.4%
21.4%
17.7%
15.5%
Adjusted return on tier 1 common capital
16.3%
16.2%
19.2%
17.2%
As of or for the year ended
In millions
Dec. 31, 2010
Dec. 31, 2009
Tier 1 common capital
$21,188
$13,941
Reported net income
3,397
2,403
Adjustments:
After-tax gain on BlackRock/BGI transaction
-
(687)
After-tax
gain on sale of GIS (328)
-
After-tax impact of integration costs 251
274
Adjusted net
income $3,320
$1,990
Return on tier 1 common capital
16.0%
17.2%
Adjusted return on tier 1 common capital
15.7%
14.3%
PNC believes that return on tier 1 common capital is useful as a tool to help measure and
assess a company's use of common equity, and that such information adjusted for the
impact of the BLK/BGI and GIS gains and integration costs may be useful due to the extent to which those items are not indicative of our
ongoing operations. After-tax adjustments are calculated using a marginal federal
income tax rate of 35% and include applicable income tax adjustments. The
after-tax gain on the sale of GIS and the after-tax BLK/BGI gain also reflect the
impact of state income taxes. Pretax amounts and tax benefit for adjustments are as
follows: (1) gain on sale of GIS for 3Q and full year 2010 is $639 million pretax with tax benefit of $311 million; (2) gain on BlackRock/BGI transaction
for full year 2009 is $1,076 million pretax with tax benefit of $389 million; (3)
integration costs for 1Q, 2Q, 3Q and 4Q 2010, respectively, are $113 million, $100
million, $96 million, and $78 million pretax with tax benefit of $40 million, $35 million, $34 million, and $27 million, respectively; and (4) integration costs
for full years 2010 and 2009, respectively, are $387 million and $421 million pretax with tax
benefit of $136 million and $147 million, respectively. |
 27
Peer Group of Banks
Appendix
The PNC Financial Services Group, Inc.
PNC
BB&T Corporation
BBT
Bank of America Corporation
BAC
Capital One Financial, Inc.
COF
Comerica Inc.
CMA
Fifth Third Bancorp
FITB
JPMorgan Chase
JPM
KeyCorp
KEY
M&T Bank
MTB
Regions Financial Corporation
RF
SunTrust Banks, Inc.
STI
U.S. Bancorp
USB
Wells Fargo & Co.
WFC
Ticker |