Attached files
Table of Contents
UNITED STATES
SECURITIES AND EXCHANGE COMMISSION
Washington, D.C. 20549
FORM 10-K
(Mark One)
| x | ANNUAL REPORT PURSUANT TO SECTION 13 OR 15(d) OF THE SECURITIES EXCHANGE ACT OF 1934 |
For the fiscal year ended December 31, 2010
OR
| ¨ | TRANSITION REPORT PURSUANT TO SECTION 13 OR 15(d) OF THE SECURITIES EXCHANGE ACT OF 1934 |
For the transition period from to
Commission file number 0-27512
CSG SYSTEMS INTERNATIONAL, INC.
(Exact name of registrant as specified in its charter)
| Delaware | 47-0783182 | |
| (State or other jurisdiction of incorporation or organization) |
(I.R.S. Employer Identification No.) |
9555 Maroon Circle
Englewood, Colorado 80112
(Address of principal executive offices, including zip code)
(303) 200-2000
(Registrant’s telephone number, including area code)
Securities Registered Pursuant to Section 12(b) of the Act:
| Title of Each Class |
Name of Each Exchange on Which Registered | |
| Common Stock, Par Value $0.01 Per Share | NASDAQ Stock Market LLC |
Securities Registered Pursuant to Section 12(g) of the Act: None.
Indicate by check mark if the registrant is a well-known seasoned issuer, as defined in Rule 405 of the Securities Act. Yes ¨ No x
Indicate by check mark if the registrant is not required to file reports pursuant to Section 13 or Section 15(d) of the Act. Yes ¨ No x
Indicate by check mark whether the registrant (1) has filed all reports required to be filed by Section 13 or 15(d) of the Securities Exchange Act of 1934 during the preceding 12 months (or for such shorter period that the registrant was required to file such reports), and (2) has been subject to such filing requirements for the past 90 days. Yes x No ¨
Indicate by check mark whether the registrant has submitted electronically and posted on its corporate Website, if any, every Interactive Data File required to be submitted and posted pursuant to Rule 405 of Regulation S-T during the preceding 12 months (or for such shorter period that the registrant was required to submit and post such files).
YES ¨ NO ¨
Indicate by a check mark if disclosure of delinquent filers pursuant to Item 405 of Regulation S-K is not contained herein, and will not be contained, to the best of registrant’s knowledge, in definitive proxy or information statements incorporated by reference in Part III of this Form 10-K or any amendment to this Form 10-K.
Indicate by check mark whether the registrant is a large accelerated filer, an accelerated filer, a non-accelerated filer, or a smaller reporting company. See the definitions of “large accelerated filer”, “accelerated filer” and “smaller reporting company” in Rule 12b-2 of the Exchange Act.
| Large accelerated filer ¨ | Accelerated filer x | Non-accelerated filer ¨ | Smaller reporting company ¨ |
Indicate by check mark whether the registrant is a shell company (as defined in Rule 12b-2 of the Act). Yes ¨ No x
The aggregate market value of the voting and non-voting common equity held by non-affiliates of the registrant, computed by reference to the last sales price of such stock, as of the close of trading on June 30, 2010, was $623,735,953.
Shares of common stock outstanding at March 4, 2011: 34,628,449
DOCUMENTS INCORPORATED BY REFERENCE
Portions of the Registrant’s Proxy Statement for its 2011 Annual Meeting of Stockholders to be filed on or prior to April 30, 2011, are incorporated by reference into Part III of the Form 10-K.
Table of Contents
CSG SYSTEMS INTERNATIONAL, INC.
2010 FORM 10-K
TABLE OF CONTENTS
| Page | ||||||
| PART I |
||||||
| Item 1. | 3 | |||||
| Item 1A. | 11 | |||||
| Item 1B. | 19 | |||||
| Item 2. | 19 | |||||
| Item 3. | 19 | |||||
| Item 4. | 19 | |||||
| PART II |
||||||
| Item 5. | 24 | |||||
| Item 6. | 27 | |||||
| Item 7. | Management’s Discussion and Analysis (“MD&A”) of Financial Condition and Results of Operations |
29 | ||||
| Item 7A. | 51 | |||||
| Item 8. | 53 | |||||
| Item 9. | Changes in and Disagreements With Accountants on Accounting and Financial Disclosure |
90 | ||||
| Item 9A. | 90 | |||||
| Item 9B. | 90 | |||||
| PART III |
||||||
| Item 10. | 90 | |||||
| Item 11. | 91 | |||||
| Item 12. | Security Ownership of Certain Beneficial Owners and Management and Related Stockholder Matters |
91 | ||||
| Item 13. | Certain Relationships and Related Transactions, and Director Independence |
91 | ||||
| Item 14. | 91 | |||||
| PART IV |
||||||
| Item 15. | 91 | |||||
| 92 | ||||||
Table of Contents
PART I
| Item 1. | Business |
Overview
CSG Systems International, Inc. (the “Company”, “CSG”, or forms of the pronoun “we”) was formed in October 1994 and acquired all of the outstanding stock of CSG Systems, Inc. (formerly Cable Services Group, Inc.) from First Data Corporation (“FDC”) in November 1994. CSG Systems, Inc. had been a subsidiary or division of FDC from 1982 until this acquisition.
Our heritage is providing outsourced customer care and billing solutions to the North American cable and direct broadcast satellite (“DBS”) markets. Our proven approach and solutions are based on our experience in serving clients in the communications industry as their businesses have evolved from a single product offering to a highly complex, highly competitive, multi-product service offering. Our approach has centered on using the best technology for the various functions required to provide world-class solutions.
Our solutions help service providers manage the customer experience from acquisition through the billing of their customers. Our broad suite of solutions help our clients improve their business operations by creating more compelling product offerings and an enhanced customer experience through more relevant and targeted interactions, while at the same time, managing the service provider’s cost structure.
Most recently, our business was focused on the North American market, with approximately 85% of our revenues coming from the cable and satellite markets and the remaining 15% from a variety of other verticals. However, on November 30, 2010, we completed our acquisition of U.K.-based Intec Telecom Systems PLC (“Intec”). Intec is a recognized global Business Support Systems (“BSS”) leader for retail billing, mediation, and wholesale business management, serving the majority of the world’s top 100 communications service providers.
With the acquisition, we believe we are well-positioned to: (i) evolve our offerings; (ii) expand the markets we serve; and (iii) reach greater economic scale.
Evolve our Offerings. The combined capabilities of the two companies provide a broad portfolio of products and services that address the ever-expanding needs of communications service providers to manage and maximize customer interactions in real time, and provide a compelling combination of domain expertise in video, voice, and content. In addition to an expanded portfolio of products and services, Intec also allows us to expand our overall delivery model capabilities. CSG’s historical business was predominantly focused on a very successful outsourced processing business, with less than 10% of its revenues coming from software license, professional services, and software maintenance fees. Intec’s business adds greater software and professional service delivery capabilities to our mix. We now expect that approximately 80% of our revenues will be generated from our outsourced processing solutions, managed services, and software maintenance revenue streams (which are all highly recurring in nature), with the remaining 20% comprised of software license and professional services revenues. This expanded product and solution portfolio and diversification in our delivery model, provides us with additional means to help our clients solve their business problems.
Expand the Markets We Serve. The combined entity will have a diverse customer base serving customers around the world in cable, DBS, telecommunications, and a variety of other industries where highly scaleable customer care and billing solutions are needed. This will allow us to reduce our geographic, market, and customer concentration risk, summarized as follows:
| • | While we still expect to generate a significant portion of our revenues from the North and South American regions (approximately 85%), we now have a more diversified global presence, with approximately 10% of our revenues expected to come from the Europe, Middle East and Africa (“EMEA”) region and the remaining amount expected to come from the Asia Pacific (“APAC”) region. |
3
Table of Contents
| • | We expect to generate approximately 60% of our total revenues from the North American cable and DBS market, 30% from the global wireline and wireless telecommunications market, and the balance of our revenues in other growing industries, including financial services, healthcare, utilities, entertainment, and content distribution. |
| • | With the addition of revenues from over 400 Intec clients, our four largest clients are now expected to make up approximately 45% of our total revenues, down from approximately two-thirds of our total revenues in our most recent past years. |
Reach Greater Economic Scale. The combined entity creates a global leader in the BSS market, with over 3,500 employees in 24 countries and over 1,000 clients worldwide, providing us greater scale to grow our business and achieve economic benefits from operating a larger, more diverse business.
Our principal executive offices are located at 9555 Maroon Circle, Englewood, Colorado 80112, and the telephone number at that address is (303) 200-2000. Our common stock is listed on the NASDAQ Stock Market LLC (“NASDAQ”) under the symbol “CSGS”. We are a S&P SmallCap 600 company.
Industry Overview
Background. We provide BSS solutions to clients in several complex and highly competitive industries. Our solutions coordinate and manage many aspects of a service provider’s customer interactions, from the initial activation of customer accounts, to the support of various service activities, and through the presentment, collection, and accounts receivables management of monthly customer statements. While our heritage is in serving the North American communications markets, through acquisition and organic growth, we have broadened and enhanced our solutions to extend our business both globally and to a growing number of other industries including communications, financial services, healthcare, utilities, entertainment, and content distribution.
Market Conditions of the Communications Industry. Over the past few years, the global marketplace has experienced a significant economic downturn and difficulties within the financial and credit markets, which has negatively impacted a broad number of industries, including the global communications industry that we serve. While it is too early to say that an economic recovery is underway in the global markets, there have been reports of economic improvement in both emerging markets with new subscriber acquisitions, and in more mature markets where providers are focused on rolling out differentiated product offerings to retain and up-sell their existing customer base. However, the timing, duration, and degree of a sustained, meaningful economic turnaround are uncertain and will likely vary by region.
We believe that our recurring revenue and predictable cash flow business model, our sufficient sources of liquidity, and our stable capital structure lessen the risk of a significant negative impact to our business if the current economic conditions linger into future periods. However, these market conditions could result in continued tight client spending and/or extended sales cycles which could impact our revenues related to our clients’ discretionary spending for such things as special project work, marketing activities, new product sales, and software and professional services projects, and thus, hinder our ability to grow our revenues and earnings.
Market Trends of Communications Industry. The communications industry is undergoing a dramatic transformation. Consumers have more choices for content, devices, and providers than ever before. Operators continue to invest heavily in networks to handle the exponential increase of data and content that is being distributed and consumed over their networks. Mobile data traffic is estimated to increase seven- to tenfold in the coming years, while the revenues that operators generate from that network traffic are currently not expected to increase at a commensurate rate. As a result, it is expected that service providers will need to evolve their business models in order to better monetize the traffic that goes across their plant.
In addition, new content providers like Netflix, Hulu, and YouTube, as well as new devices such as the iPad, the iPhone, and GoogleTV, have created an increased sense of urgency for traditional service providers to be more
4
Table of Contents
creative in their approaches to rolling out new products and services, and enhancing the customer experience. These new competitors and new technologies have created a disintermediation in the marketplace, enabling the consumer to now receive content on a variety of different devices, over different networks at anytime. While this development poses challenges to traditional service providers, it also provides us with an opportunity to service the customer needs of this evolving market. We believe that in order to continue to be the primary source for information, content, and entertainment, service providers’ investments will turn more towards acquiring new customers, rolling out new and differentiated product offerings, and reducing and managing their overall costs of operations.
As the lines of distinction between services and providers continue to blur, and competition for the same consumer increases between the traditional cable, wireless, and telecom provider, more emphasis is being placed on providing a superior customer experience. This experience includes the types of content and products operators offer as well as how every interaction between the operator and the consumer is handled. Our ability to facilitate our clients’ offerings of world-class products and services is dependent upon our continuous enhancement of our existing solutions and the introduction of new solutions that meet their business needs. As a result, we historically have invested a significant amount of our revenues in research and development (“R&D”) annually and have acquired companies that have enabled us to expand our offerings in a more timely and efficient manner.
Overall, these market trends drive the demand for scalable, flexible, and cost-efficient customer interaction management solutions, which we believe will provide us with revenue opportunities. While we recognize that operators may choose to develop their own internal solutions or utilize a competitor’s solution, we believe that our scalable, modular, and flexible solutions provide the industry with proven solutions to improve their profitability and customer experiences.
Business Strategy
Our business strategy is designed to achieve growth of revenues and profitability. The key elements of our business strategy include the following items:
Grow Our Business Within Our Core Communications Industry. The communications industry is going through a dramatic change, as discussed directly above. Consumers are demanding more choice, while communications service providers are being asked to provide content, voice, and data to the end consumer at any time and on any device and in any location. Services, technology, and networks are converging and increasing the complexity involved in meeting the end consumers’ needs and, consumers are demanding a more simplified, reliable and personalized customer experience. Communications service providers are looking for new ways to leverage and monetize their networks and infrastructure. With our broad solution offering, we believe that we are well positioned to help operators meet these demands today, and in the future.
Our goal is to increase the penetration of our solutions within our current clients by enabling our clients to achieve both their short-term and long-term business objectives. As our clients continue to introduce new products and services to their consumers, we benefit by helping our clients monetize those services and interactions. With the explosion of content and devices, service providers need to be able to provide a more immersive, interactive, and intelligent interaction with the end consumer. Our extensive solution suite provides operators with the tools to build a cost-efficient operation that can respond quickly and manage very large amounts of data. While the end consumer does not care what it takes to deliver content to any device at any time, our solutions help service providers simplify and standardize the customer experience. As our clients’ businesses evolve, our opportunities to provide additional solutions to our clients increases as well.
As our clients deploy more of our business critical products and services into their operations, we develop a greater understanding of their businesses and the tools necessary for them to remain competitive and profitable. This approach has led to us establishing and maintaining very long-term relationships with our clients.
5
Table of Contents
Grow Our Relationships with Providers in New Vertical Markets. Prior to the Intec acquisition, we received approximately 85% of our revenues from the North American cable and DBS markets. With over 400 new relationships in the wireline, wireless, financial services, retail, and content industries, we plan to leverage our solution sets and international infrastructure to strengthen our relationships with these service providers through our extensive suite of solutions.
Similar to the cable and DBS markets, numerous other industries, such as communications, utilities, healthcare, home security, financial services, and content distribution markets have specific business needs directed towards improving interactions and monetizing transactions with customers. We believe that by continuing to pursue the development of our customer interaction management solutions, we have the opportunity to further expand our solution footprint and increase our addressable markets and revenue opportunities.
In order to grow our relationships with our core communications clients or clients in new markets, two key strategies are required:
| • | Continue Technology Leadership. We believe that our product technology and pre-integrated suite of software solutions gives communications service providers a competitive advantage. Our continuing investment in R&D is designed to position us to meet the growing and evolving needs of existing and potential clients. Over the last five years, we have invested approximately $320 million, or approximately 14% of our total revenues, into R&D. |
| • | Enhance Growth Through Focused Acquisitions. We follow a disciplined approach in acquiring assets and businesses which provide the technology and technical personnel to expedite our product development efforts and provide complementary products and services to our North American communications clients, and/or provide access to new markets and clients. Our acquisition strategy focuses on extending our solution capabilities that have relevance to our core communications market, while also providing us opportunities to extend our solution capabilities and penetration with new clients, and within new markets. The Intec acquisition is consistent with our philosophy and was undertaken as a way to help our existing North American communications clients more effectively and efficiently manage the explosion of traffic on their network, roll out new product offerings that require more real-time data collection, monetization and customer interaction and expand their offerings into large-scale commercial enterprises. |
Improve Profitability. Finally, we continue to seek new ways to grow our profitability, and believe that various initiatives underway will help us expand our operating margins over time, such as the scale benefits from adding new subscribers to our solutions, increasing the utilization of new solutions, expanding our footprint within our client base, improving operational performance of recently acquired businesses, and various cost savings and efficiency efforts, such as integrating and improving our development and delivery methodologies between the acquired Intec and CSG historical organizations.
In summary, our R&D initiatives and recent acquisitions have enhanced our capabilities to assist our clients to grow and improve their business operations, enabling us to grow our business with new and existing clients. We have continually demonstrated our commitment to deliver solutions and services to our clients with the highest level of performance and functionality; and with our continued investment in R&D and acquisition activities, we believe we will continue to find ways to solve our clients’ business challenges and provide them with a competitive advantage. While continuing to strive to provide superior solutions and services to our existing clients, we will also continue to focus on growing and diversifying our business and finding new ways to further expand our footprint in new vertical markets we have entered with our recent acquisitions.
6
Table of Contents
Description of Business
Key Clients. We work with the leading communication providers located around the world. A partial list of those service providers as of December 31, 2010 is included below:
| AT&T |
Orange | |
| Charter Communications, Inc. (“Charter”) |
T-Mobile | |
| Comcast Corporation (“Comcast”) |
Telefonica, | |
| Cox Communications |
Time Warner, Inc. (“Time Warner”) | |
| China Unicom |
Vodafone | |
| DISH Network Corporation (“DISH”) |
Vivo | |
| France Telecom |
Verizon | |
| Mediacom Communications |
The North American communications industry has experienced significant consolidation over the past decade, resulting in a large percentage of the market being served by a limited number of service providers with greater size and scale. Consistent with this market concentration, a large percentage of our historical revenues have been generated from our four largest clients, which are Comcast, DISH, Time Warner, and Charter. Revenues from these clients represented the following percentages of our total revenues for 2010 and 2009:
| 2010 | 2009 | |||||||
| Comcast |
24 | % | 24 | % | ||||
| DISH |
18 | % | 18 | % | ||||
| Time Warner |
12 | % | 13 | % | ||||
| Charter |
10 | % | 9 | % | ||||
See the Significant Client Relationships section of our MD&A for additional information regarding our business relationships with these key clients.
Research and Development. Our clients around the world are facing competition from new entrants, and at the same time, are deploying new services at a rapid pace, dramatically increasing the complexity of their business operations. Therefore, we continue to invest heavily in R&D to ensure that we stay ahead of our clients’ needs and advance our clients’ businesses as well as our own. We recognize these challenges and believe our value proposition is to provide solutions that help our clients ensure that each customer interaction is an opportunity to create value and deepen the business relationship. As a result of our R&D efforts, we have not only broadened our footprint within our client base with many new innovative product offerings, but have also found traction in penetrating new markets with portions of our suite of customer interaction management solutions.
Our total R&D expenses were $78.1 million and $70.1 million, respectively, for 2010 and 2009, or approximately 14% of total revenues in each year. In the near term, we expect that the percentage of our total revenues to be spent on R&D to increase slightly going into 2011, with the level of our R&D spend highly dependent upon the opportunities that we see in our markets.
There are certain inherent risks associated with significant technological innovations. Some of these risks are described in this report in our Risk Factors section below.
Products and Services. Our historical primary product offerings include our core customer care and billing solution, ACP, and related services and software products, to include our Intelligent Customer Communications solutions. However, with the acquisition of Intec in November of 2010, we have added leading solutions in retail billing, mediation, and wholesale business management to our product offerings.
In addition, we have expanded the delivery models by which we can help our clients execute on their business objectives. Today, we now offer high-volume transaction processing and statement production, complemented
7
Table of Contents
with world-class applications software, as well as customized software solutions, allowing us to offer one of the most comprehensive, flexible, pre-integrated products and services solutions to the communications market.
We believe this pre-integrated approach and multiple delivery models allows our clients to bring new product offerings to market quickly and provide high-quality customer service in a cost effective manner. While our primary value proposition to our clients is the breadth and depth of this integrated offering, we are evolving many of our product solutions to be more modular-based to allow clients to utilize certain of our products as independent point solutions.
We license certain software products (e.g., Wholesale Business Management Solutions, Total Service Mediation, Singl.eView, Workforce Express, etc.) and provide our professional services to implement these software products, increase the efficiency and productivity of our clients’ operations, and allow clients to effectively roll out new products as well as attract and retain customers.
Historically, a substantial percentage of our total revenues have been generated from our ACP processing solution, Intelligent Customer Communications, and related software products. These products and services are expected to provide a large percentage of our total revenues in the foreseeable future as well.
Business Acquisitions. As noted above, our strategy includes acquiring assets and businesses which provide the technology and technical personnel to expedite our product development efforts, provide complementary products and services, increase market share, and/or provide access to new markets and clients. Consistent with this strategy, we have acquired the following businesses over the last five years:
Intec. In November of 2010, we acquired Intec to expand our BSS footprint and capabilities. With this acquisition, we added the leading mediation and wholesale billing solution to our product suite, as well as a pre-paid/post-paid convergent customer care and billing solution. In addition, the acquisition increased our presence, as well as our domain expertise, in the wireless and wireline industries worldwide. The addition of Intec enables us to support flexible delivery models, from on-site software delivery to outsourced processing models, supported by complementary services offerings.
Quaero. In December of 2008, we acquired Quaero Corporation, a marketing services provider with expertise in customer strategy, analytics, and marketing performance management. This acquisition broadened our solution suite with powerful customer intelligence capabilities that further assist our clients in maximizing the value of their customer interactions. The Quaero acquisition has also allowed us to further diversify our revenue base and extend our reach into new industry verticals including financial services, pharmaceutical/healthcare, media/publishing, travel/hospitality, consumer, and high tech.
DataProse. In April of 2008, we acquired DataProse, Inc., (“DataProse”) to further our objective of helping our clients maximize every customer interaction by both strengthening and broadening our portfolio of print solutions capabilities. Additionally, this acquisition has allowed us to diversify our client base into the utilities, financial services, and telecommunications markets, and add clients in the non-profit sectors of healthcare and higher education.
Prairie. In August of 2007, we acquired Prairie Voice Services, Inc. (“Prairie”) to extend our suite of products and solutions that help our clients maximize the value of their interactions with their customers. Prairie provides inbound and outbound automated voice, text/SMS, email, and fax messaging services to manage workforce communications, collections, lead generation, automated order capture, service outage notifications, and other key business functions. We acquired Prairie to extend our capabilities within our core cable and DBS markets, while also providing an established customer base in new industry verticals such as financial services and telecommunications.
ComTec. In July of 2007, we acquired ComTec, Inc. (“ComTec”), to expand our Intelligent Customer Communications footprint and capabilities. With this acquisition, we added enhanced statement production
8
Table of Contents
and electronic statement presentation hardware and software technologies. In addition, the acquisition increased our presence in our core cable and DBS markets, while also providing an established customer base in new industry verticals such as utilities, healthcare, home security, and financial services markets.
Telution. As part of our product evolution strategy, we acquired Telution, Inc. (“Telution”) in March of 2006 to further expand the capabilities around our ACP platform. Our recent R&D efforts include the integration of these acquired technologies into our solution set. In particular, the acquired software assets are an integral part of the new functionality that has been added to our ACP platform since the acquisition.
Data Center Processing Facilities. We have historically outsourced to FDC the data processing and related computer services required for the operation of our outsourced ACP processing solution. Our proprietary software applications were run in FDC’s facility to obtain the necessary enterprise server computer capacity and other computer support services without us having to make the substantial capital and infrastructure investments that would be necessary for us to provide these services internally. Our clients were connected to the FDC facility through a combination of private and commercially-provided networks. Our contract with FDC went through December 31, 2010.
In December 2008, we entered into an agreement with Infocrossing LLC (“Infocrossing”), a Wipro Limited company, to transition these outsourced data center services to Infocrossing. Infocrossing has been in the business of providing end-to-end information technology management solutions for over 25 years and operates world-class data centers throughout the U.S. for multiple computing environments and platforms. As part of the transition, we setup and replicated the computing environment at the new Infocrossing data center location to mitigate the risk of service disruption. We started to transition certain systems during 2009, with the transition of services to Infocrossing from FDC completed in the third quarter of 2010. We changed data center providers to partner with a global provider that focuses on data center operations in greater scale, and as their core business focus. This allows us to further improve the delivery of our solutions while benefiting from an improved cost structure.
Client and Product Support. Our clients typically rely on us for ongoing support and training needs related to our products. We have a multi-level support environment for our clients, which include account management teams to support the business, operational, and functional requirements of each client. These account teams help clients resolve strategic and business issues and are supported by our Solution Support Center (“SSC”) and Customer Support Services (“CSS”), which we operate 24 hours a day, seven days a week. Clients call a telephone number, and through an automated voice response unit, have their calls directed to the appropriate SSC or CSS personnel to answer their questions. We have a full-time training staff and conduct ongoing training sessions both in the field and at our training facilities.
Sales and Marketing. We organize our sales efforts to existing clients primarily within our geographically dispersed, dedicated account teams, with senior level account managers who are responsible for new revenues and renewal of existing contracts within a client account. The account teams are supported by sales support personnel who are experienced in the various products and services that we provide. In addition, we have dedicated staff engaged in selling our products and services to prospective clients.
Competition. The market for customer interaction management products and services in the converging communications industry, as well as in other industries we serve, is highly competitive. We compete with both independent outsourced providers and in-house developers of customer management systems. We believe that our most significant competitors in our primary markets are Amdocs Limited, Convergys Corporation, Oracle Corporation, and internally-developed systems. Some of our actual and potential competitors have substantially greater financial, marketing, and technological resources than us.
We believe service providers in our industry use the following criteria when selecting a vendor to provide customer care and billing products and services: (i) functionality, scalability, flexibility, interoperability, and
9
Table of Contents
architecture of the software assets; (ii) the breadth and depth of pre-integrated product solutions; (iii) product quality, client service, and support; (iv) quality of R&D efforts; and (v) price. We believe that our products and services allow us to compete effectively in these areas.
Proprietary Rights and Licenses
We rely on a combination of trade secret, copyright, trademark, and patent laws in the United States and similar laws in other countries, and non-disclosure, confidentiality, and other types of contractual arrangements to establish, maintain, and enforce our intellectual property rights in our solutions. Despite these measures, any of our intellectual property rights could be challenged, invalidated, circumvented, or misappropriated. Although we hold a limited number of patents and patent applications on some of our newer solutions, we do not rely upon patents as a primary means of protecting our rights in our intellectual property. In any event, there can be no assurance that our patent applications will be approved, that any issued patents will adequately protect our intellectual property, or that such patents will not be challenged by third parties. Also, much of our business and many of our solutions rely on key technologies developed or licensed by third parties, and we may not be able to obtain or continue to obtain licenses and technologies from these third parties at all or on reasonable terms. Our failure to adequately establish, maintain, and protect our intellectual property rights could have a material adverse impact on our business, financial condition, and results of operations. For a description of the risks associated with our intellectual property rights, see “Item 1A—Risk Factors—Failure to Protect Our Intellectual Property Rights or Claims by Others That We Infringe Their Intellectual Property Rights Could Substantially Harm Our Business, Financial Condition and Results of Operations.”
Employees
As of December 31, 2010, we had a total of 3,512 employees, an increase of 1,451 employees when compared to the number of employees we had as of December 31, 2009, with the increase attributed primarily to the Intec acquisition. Our success is dependent upon our ability to attract and retain qualified employees. None of our employees are subject to a collective bargaining agreement. We believe that our relations with our employees are good.
Available Information
Our annual reports on Form 10-K, quarterly reports on Form 10-Q, current reports on Form 8-K, proxy materials, and amendments to those reports filed or furnished pursuant to Section 13(a) or 15(d) of the Securities Exchange Act are available free of charge on our website at www.csgsystems.com. Additionally, these reports are available at the SEC’s Public Reference Room at 100 F Street, NE., Washington, D.C. 20549 or on the SEC’s website at www.sec.gov. Information on the operation of the Public Reference Room can be obtained by calling the SEC at 1-800-SEC-0330.
Code of Business Conduct and Ethics
A copy of our Code of Business Conduct and Ethics (the “Code of Conduct”) is maintained on our website. Any future amendments to the Code of Conduct, or any future waiver of a provision of our Code of Conduct, will be timely posted to our website upon their occurrence. Historically, we have had minimal changes to our Code of Conduct, and have had no waivers of a provision of our Code of Conduct.
10
Table of Contents
| Item 1A. | Risk Factors |
We or our representatives from time-to-time may make or may have made certain forward-looking statements, whether orally or in writing, including without limitation, any such statements made or to be made in MD&A contained in our various SEC filings or orally in conferences or teleconferences. We wish to ensure that such statements are accompanied by meaningful cautionary statements, so as to ensure, to the fullest extent possible, the protections of the safe harbor established in the Private Securities Litigation Reform Act of 1995.
Accordingly, the forward-looking statements are qualified in their entirety by reference to and are accompanied by the following meaningful cautionary statements identifying certain important risk factors that could cause actual results to differ materially from those in such forward-looking statements. This list of risk factors is likely not exhaustive. We operate in rapidly changing and evolving markets throughout the world addressing the complex needs of communication service providers, financial institutions, healthcare providers and many others, and new risk factors will likely emerge. Further, as we enter new market sectors such as healthcare and financial services, as well as new geographic markets, we are subject to new regulatory requirements that increase the risk of non-compliance and the potential for economic harm to us and our clients. Management cannot predict all of the important risk factors, nor can it assess the impact, if any, of such risk factors on our business or the extent to which any risk factor, or combination of risk factors, may cause actual results to differ materially from those in any forward-looking statements. Accordingly, there can be no assurance that forward-looking statements will be accurate indicators of future actual results, and it is likely that actual results will differ from results projected in forward-looking statements and that such differences may be material.
We Derive a Significant Portion of Our Revenues From a Limited Number of Clients, and the Loss of the Business of a Significant Client Could Have a Material Adverse Effect on Our Financial Position and Results of Operations.
Over the past decade, the North American communications industry has experienced significant consolidation, resulting in a large percentage of the market being served by a limited number of service providers with greater size and scale. Consistent with this market concentration, approximately two-thirds of our current revenues are generated from our four largest clients, which are (in order of size) Comcast, DISH, Time Warner, and Charter. Although we expect this percentage to decrease to approximately 45% as a result of the Intec Acquisition, we still expect to generate a significant percentage of our revenues from these four clients in the future. See the Significant Client Relationships section of MD&A for key renewal dates and a brief summary of our business relationship with these clients.
There are inherent risks whenever a large percentage of total revenues are concentrated with a limited number of clients. One such risk is that a significant client could: (i) undergo a formalized process to evaluate alternative providers for services we provide; (ii) terminate or fail to renew their contracts with us, in whole or in part for any reason; (iii) significantly reduce the number of customer accounts processed on our solutions, the price paid for our services, or the scope of services that we provide; or (iv) experience significant financial or operating difficulties. Any such development could have a material adverse effect on our financial position and results of operations and/or trading price of our common stock.
Our industry is highly competitive, and while we recently have succeeded in gaining customers at the expense of competitors and entered into a long term renewal with our second largest customer, there is no guarantee that this success will continue. It is possible that a competitor could increase its footprint and share of customers processed at our expense or a provider could develop their own internal solutions. While our clients may incur some costs in switching to our competitors or their own internally-developed solutions, they may do so for a variety of reasons, including: (i) price; (ii) if we do not provide satisfactory solutions; or (iii) if we do not maintain favorable relationships.
11
Table of Contents
We May Not Be Successful in the Integration of Our Acquisitions.
As part of our growth strategy, we seek to acquire assets, technology, and businesses which will provide the technology and technical personnel to expedite our product development efforts, provide complementary solutions, or provide access to new markets and clients.
Our recent acquisition of Intec provides us with many opportunities and challenges. Intec represents an approximate 40% increase in revenue, adds approximately 1,500 employees, and gives us operations in 24 countries where we did not previously have operations. Integrating this many people, processes, and operations presents new risks to the business that must be managed carefully. If not, it could have a material impact on operations and cause results to differ significantly from expectations.
Acquisitions involve a number of risks and difficulties, including: (i) expansion into new markets and business ventures; (ii) the requirement to understand local business practices; (iii) the diversion of management’s attention to the assimilation of acquired operations and personnel; (iv) being bound by client or vendor contracts with unfavorable terms; and (v) potential adverse effects on a company’s operating results for various reasons, including, but not limited to, the following items: (a) the inability to achieve financial targets; (b) the inability to achieve certain operating goals and synergies; (c) costs incurred to exit current or acquired contracts or activities; (d) costs incurred to service any acquisition debt; and (e) the amortization or impairment of intangible assets.
Due to the multiple risks and difficulties associated with any acquisition, there can be no assurance that we will be successful in achieving our expected strategic, operating, and financial goals for any such acquisition.
Variability of Our Quarterly Revenues and Our Failure to Meet Revenue and Earnings Expectations Would Negatively Affect the Market Price for Our Common Stock.
Variability in quarterly revenues and operating results are inherent characteristics of the software and professional services industries. Common causes of a failure to meet revenue and operating expectations in these industries include, among others:
| • | The inability to close and/or recognize revenue on one or more material software transactions that may have been anticipated by management in any particular period; |
| • | The inability to renew timely one or more material software maintenance agreements, or renewing such agreements at lower rates than anticipated; and |
| • | The inability to complete timely and successfully an implementation project and meet client expectations, due to factors discussed in greater detail below. |
We expect software license, software maintenance services, and professional services revenues to become an increasingly larger percentage of our total revenues in the future. As our total revenues grow, so too does the risk associated with meeting financial expectations for revenues derived from our software licenses, software maintenance services, and professional services offerings. As a result, there is a proportionately increased likelihood that we may fail to meet revenue and earnings expectations of the analyst community. Should we fail to meet analyst expectations, by even a relatively small amount, it would most likely have a disproportionately negative impact upon the market price of our common stock.
The Delivery of Our Solutions is Dependent on a Variety of Computing Environments and Communications Networks Which May Not Be Available or May Be Subject to Security Attacks.
Our solutions are generally delivered through a variety of computing environments operated by us, which we will collectively refer to herein as “Systems.” We provide such computing environments through both outsourced arrangements, such as our current data processing arrangement with Infocrossing, as well as internally operating numerous distributed servers in geographically dispersed environments. The end users are connected to our
12
Table of Contents
Systems through a variety of public and private communications networks, which we will collectively refer to herein as “Networks.” Our solutions are generally considered to be mission critical customer management systems by our clients. As a result, our clients are highly dependent upon the high availability and uncompromised security of our Networks and Systems to conduct their business operations.
Our Networks and Systems are subject to the risk of an extended interruption or outage due to many factors such as: (i) planned changes to our Systems and Networks for such things as scheduled maintenance and technology upgrades, or migrations to other technologies, service providers, or physical location of hardware; (ii) human and machine error; (iii) acts of nature; and (iv) intentional, unauthorized attacks from computer “hackers.”
In addition, we continue to expand our use of the Internet with our product offerings thereby permitting, for example, our clients’ customers to use the Internet to review account balances, order services or execute similar account management functions. Allowing access to our Networks and Systems via the Internet has the potential to increase their vulnerability to unauthorized access and corruption, as well as increasing the dependency of our Systems’ reliability on the availability and performance of the Internet and end users’ infrastructure they obtain through other third party providers.
The method, manner, cause and timing of an extended interruption or outage in our Networks or Systems are impossible to predict. As a result, there can be no assurances that our Networks and Systems will not fail, or that our business continuity plans will adequately mitigate the negative effects of a disruption to our Networks or Systems. Further, our property and business interruption insurance may not adequately compensate us for losses that we incur as a result of such interruptions. Should our Networks or Systems: (i) experience an extended interruption or outage, (ii) have their security breached, or (iii) have their data lost, corrupted or otherwise compromised, it would impede our ability to meet product and service delivery obligations, and likely have an immediate impact to the business operations of our clients. This would most likely result in an immediate loss to us of revenue or increase in expense, as well as damaging our reputation. An information breach in our Systems or Networks and loss of confidential information such as credit card numbers and related information could have a longer and more significant impact on our business operations than a hardware-related failure. The loss of confidential information could result in losing the customers’ confidence, as well as imposition of fines and damages. Any of these events could have both an immediate, negative impact upon our financial position and our short-term revenue and profit expectations, as well as our long-term ability to attract and retain new clients.
The Occurrence or Perception of a Security Breach or Disclosure of Confidential Personally Identifiable Information Could Harm Our Business.
In providing solutions to our customers, we process, transmit, and store confidential and personally identifiable information, including social security numbers and financial and health information. Our treatment of such information is subject to contractual restrictions and federal, state, and foreign data privacy laws and regulations. While we take measures to protect against unauthorized access to such information and comply with these laws and regulations, these measures may be inadequate, and any failure on our part to protect the privacy of personally identifiable information or comply with data privacy laws and regulations may subject us to contractual liability and damages, loss of business, damages from individual claimants, fines, penalties, criminal prosecution, and unfavorable publicity. Even the mere perception of a security breach or inadvertent disclosure of personally identifiable information could inhibit market acceptance of our solutions. In addition, third party vendors that we engage to perform services for us may unintentionally release personally identifiable information or otherwise fail to comply with applicable laws and regulations. The occurrence of any of these events could have an adverse effect on our business, financial position, and results of operations.
We May Not Be Able to Respond to Rapid Technological Changes.
The market for customer interaction management solutions, such as customer care and billing solutions, is characterized by rapid changes in technology and is highly competitive with respect to the need for timely
13
Table of Contents
product innovations and new product introductions. As a result, we believe that our future success in sustaining and growing our revenues depends upon: (i) our ability to continuously adapt, modify, maintain, and operate our solutions to address the increasingly complex and evolving needs of our clients, without sacrificing the reliability or quality of the solutions; (ii) the integration of the Intec assets and its widely distributed, complex worldwide operations; and (iii) the integration of other acquired technologies such as rating, wholesale billing, customer intelligence with ACP, as well as creating an integrated suite of customer care and billing solutions, which are portable to new verticals such as utilities, healthcare, home security, financial services, and content distribution. In addition, the market is demanding that our solutions have greater architectural flexibility and interoperability, and that we are able to meet the demands for technological advancements to our solutions at a greater pace. Attempts to meet these demands subjects our R&D efforts to greater risks.
As a result, substantial R&D will be required to maintain the competitiveness of our solutions in the market. Technical problems may arise in developing, maintaining and operating our solutions as the complexities are increased. Development projects can be lengthy and costly, and may be subject to changing requirements, programming difficulties, a shortage of qualified personnel, and/or unforeseen factors which can result in delays. In addition, we may be responsible for the implementation of new solutions and/or the migration of clients to new solutions, and depending upon the specific solution, we may also be responsible for operations of the solution.
There is an inherent risk in the successful development, implementation, migration, and operations of our solutions as the technological complexities, and the pace at which we must deliver these solutions to market, continue to increase. The risk of making an error that causes significant operational disruption to a client, or results in incorrect customer or vendor billing calculations we perform on behalf of our clients, increases proportionately with the frequency and complexity of changes to our solutions and new delivery models. There can be no assurance: (i) of continued market acceptance of our solutions; (ii) that we will be successful in the development of enhancements or new solutions that respond to technological advances or changing client needs at the pace the market demands; or (iii) that we will be successful in supporting the implementation, migration and/or operations of enhancements or new solutions.
Our International Operations Subject Us to Additional Risks.
We maintain development facilities in South Africa, Ireland, Malaysia, India, Australia, and the United States, and have operations in North America, Europe, Latin America, and the Asia-Pacific region. Although a substantial percentage of our revenue is derived from customers in North America and Europe, we obtain significant revenue from customers in the Asia-Pacific, African, and Latin America regions. Our strategy is to continue to broaden our presence in those geographies with the greatest growth potential, which will likely result in an increase in business outside of the United States. We are subject to certain risks associated with operating internationally including the following:
| • | Difficulties with product development meeting local requirements; |
| • | Fluctuations in foreign currency exchange rates for which a natural or purchased hedge does not exist or is ineffective; |
| • | Difficulties in staffing and managing foreign operations; |
| • | Longer sales cycles for new contracts; |
| • | Longer collection cycles for client billings or accounts receivable, as well as heightened client collection risks, especially in countries with highly inflationary economies and/or with restrictions on the movement of cash out of the country; |
| • | Trade barriers; |
| • | Difficulties in complying with varied legal and regulatory requirements across jurisdictions; |
14
Table of Contents
| • | Reduced protection for intellectual property rights in some countries; |
| • | Inability to recover value added taxes and/or goods and services taxes in foreign jurisdictions; |
| • | Political instability and threats of terrorism; and |
| • | A potential adverse impact to our overall effective income tax rate resulting from, among other things: |
| • | Operations in foreign countries with higher tax rates than the United States; |
| • | The inability to utilize certain foreign tax credits; and |
| • | The inability to utilize some or all of losses generated in one or more foreign countries. |
One or more of these factors could have a material adverse effect on our international operations, which could adversely impact our results of operations and financial position.
Our Use of Open Source Software May Subject Us to Certain Intellectual Property-Related Claims or Require Us to Re-Engineer Our Software, Which Could Harm Our Business.
We use open source software in connection with our solutions, processes, and technology. Companies that use or incorporate open source software into their products have, from time to time, faced claims challenging their use, ownership and/or licensing rights associated with that open source software. As a result, we could be subject to suits by parties claiming certain rights to what we believe to be open source software. Some open source software licenses require users who distribute open source software as part of their software to publicly disclose all or part of the source code in their software and make any derivative works of the open source code available on unfavorable terms or at no cost. In addition to risks related to license requirements, use of open source software can lead to greater risks than use of third party commercial software, as open source licensors generally do not provide warranties or controls with respect to origin of the software. While we take measures to protect our use of open source software in our solutions, open source license terms may be ambiguous, and many of the risks associated with usage of open source software cannot be eliminated. If we were found to have inappropriately used open source software, we may be required to release our proprietary source code, re-engineer our software, discontinue the sale of certain solutions in the event re-engineering cannot be accomplished on a timely basis, or take other remedial action that may divert resources away from our development efforts, any of which could adversely affect our business, financial position, and results of operations.
The Current Macroeconomic Environment Could Adversely Impact Our Business.
Over the past few years, major economies where we operate have experienced significant economic stress and difficulties within the financial and credit markets. The timing, duration, and degree of an economic turnaround are uncertain and thus, these adverse economic conditions may continue into the foreseeable future. The possible adverse impacts to companies during these times include a reduction in revenues, decreasing profits and cash flows, distressed or default debt conditions, and/or difficulties in obtaining necessary operating capital. All companies are likely to be impacted by the current economic downturn to a certain degree, including CSG, our clients, and/or key vendors in our supply chain. There can be no assurances regarding the performance of our business, and the potential impact to our clients and key vendors, resulting from the current economic conditions.
A Reduction in Demand for Our Key Customer Care and Billing Solutions Could Have a Material Adverse Effect on Our Financial Position and Results of Operations.
Historically, a substantial percentage of our total revenues have been generated from our core outsourced processing product, ACP, and related solutions. These solutions are expected to continue to provide a large percentage of our total revenues in the foreseeable future. Any significant reduction in demand for ACP and related solutions could have a material adverse effect on our financial position and results of operations.
15
Table of Contents
Likewise, a large percentage of revenues derived from the Intec business have been derived from wholesale billing, retail billing and mediation products which are typically associated with large implementation projects. A sudden downward shift in demand for these products or for our professional services engagements for these products could have a material adverse effect on our financial position and results of operations.
We May Not Be Able to Efficiently and Effectively Implement New Solutions or Convert Clients onto Our Solutions.
Our continued growth plans include the implementation of new solutions, as well as converting both new and existing clients to our solutions. Such implementations or conversions, whether they involve new solutions or new customers, have become increasingly more difficult because of the sophistication, complexity and interdependencies of the various computing and network environments impacted, combined with the increasing complexity of the underlying business processes. For these reasons, there is a risk that we may experience delays or unexpected costs associated with a particular implementation or conversion, and our inability to complete implementation or conversion projects in an efficient and effective manner could have a material adverse effect on our results of operations.
Our Business is Dependent Upon the Economic and Market Condition of the Global Communications Industry.
Since the majority of our clients operate within this industry sector, the economic state of this industry directly impacts our business. The global communications industry has undergone significant fluctuations in growth rates and capital investment cycles in the past decade. Current economic indices suggest a slow stabilization of the industry, but it is impossible to predict whether this stabilization will persist or be subject to future instability. In addition, consolidation amongst providers continues as service providers look for ways to expand their markets and increase their revenues.
Continued consolidation, a significant retrenchment in investment by communications providers, or even a material slowing in growth (whether caused by economic, competitive or consolidation factors) could cause delays or cancellations of sales and services currently included in our forecasts. This could cause us to either fall short of revenue expectations or have a cost model that is misaligned with revenues, either or both of which could have a material adverse effect on operations and financial results.
More specific, approximately 60% of our future revenues are expected to be generated from our North American cable and DBS operations. These clients operate in a highly competitive environment. Competitors range from traditional wireline and wireless providers to new entrants like new content aggregators such as Hulu, YouTube, and Netflix. Should these competitors be successful in their video strategies, it could threaten our clients’ market share, and thus our source of revenues, as generally speaking these companies do not use our core solutions and there can be no assurance that new entrants will become our clients. In addition, demand for spectrum, network bandwidth and content continues to increase and any changes in the regulatory environment could have a significant impact to not only our clients’ businesses, but in our ability to help our clients be successful.
We Face Significant Competition in Our Industry.
The market for our solutions is highly competitive. We directly compete with both independent providers and in-house solutions developed by existing and potential clients. In addition, some independent providers are entering into strategic alliances with other independent providers, resulting in either new competitors, or competitors with greater resources. Many of our current and potential competitors have significantly greater financial, marketing, technical, and other competitive resources than our company, many with significant and well-established domestic and international operations. There can be no assurance that we will be able to compete successfully with our existing competitors or with new competitors.
16
Table of Contents
Failure to Protect Our Intellectual Property Rights or Claims by Others That We Infringe Their Intellectual Property Rights Could Substantially Harm Our Business, Financial Position and Results of Operations.
We rely on a combination of trade secret, copyright, trademark, and patent laws in the United States and similar laws in other countries, and non-disclosure, confidentiality, and other types of contractual arrangements to establish, maintain, and enforce our intellectual property rights in our solutions. Despite these measures, any of our intellectual property rights could be challenged, invalidated, circumvented, or misappropriated. Further, our contractual arrangements may not effectively prevent disclosure of our confidential information or provide an adequate remedy in the event of unauthorized disclosure of our confidential information. Others may independently discover trade secrets and proprietary information, and in such cases we could not assert any trade secret rights against such parties. Costly and time consuming litigation could be necessary to enforce and determine the scope of our proprietary rights, and failure to obtain or maintain trade secret protection could adversely affect our competitive business position. In addition, the laws of certain countries do not protect proprietary rights to the same extent as the laws of the United States. Therefore, in certain jurisdictions, we may be unable to protect our proprietary technology adequately against unauthorized third party copying or use, which could adversely affect our competitive position.
Although we hold a limited number of patents and patent applications on some of our newer solutions, we do not rely upon patents as a primary means of protecting our rights in our intellectual property. In any event, there can be no assurance that our patent applications will be approved, that any issued patents will adequately protect our intellectual property, or that such patents will not be challenged by third parties. Also, much of our business and many of our solutions rely on key technologies developed or licensed by third parties, and we may not be able to obtain or continue to obtain licenses and technologies from these third parties at all or on reasonable terms.
Finally, third parties may claim that we, our customers, licensees or other parties indemnified by us are infringing upon their intellectual property rights. Even if we believe that such claims are without merit, they can be time consuming and costly to defend and distract management’s and technical staff’s attention and resources. Claims of intellectual property infringement also might require us to redesign affected solutions, enter into costly settlement or license agreements or pay costly damage awards, or face a temporary or permanent injunction prohibiting us from marketing or selling certain of our solutions. Even if we have an agreement to indemnify us against such costs, the indemnifying party may be unable to uphold its contractual obligations. If we cannot or do not license the infringed technology on reasonable pricing terms or at all, or substitute similar technology from another source, our business, financial position, and results of operations could be adversely impacted. Our failure to adequately establish, maintain, and protect our intellectual property rights could have a material adverse impact on our business, financial position, and results of operations.
Client Bankruptcies Could Adversely Affect Our Business.
In the past, certain of our clients have filed for bankruptcy protection. As a result of the current economic conditions and the additional financial stress this may place on companies, the risk of client bankruptcies is significantly heightened. Companies involved in bankruptcy proceedings pose greater financial risks to us, consisting principally of the following: (i) a financial loss related to possible claims of preferential payments for certain amounts paid to us prior to the bankruptcy filing date, as well as increased risk of collection for accounts receivable, particularly those accounts receivable that relate to periods prior to the bankruptcy filing date; and/or (ii) the possibility of a contract being unilaterally rejected as part of the bankruptcy proceedings, or a client in bankruptcy may attempt to renegotiate more favorable terms as a result of their deteriorated financial condition, thus, negatively impacting our rights to future revenues subsequent to the bankruptcy filing. We consider these risks in assessing our revenue recognition and our ability to collect accounts receivable related to our clients that have filed for bankruptcy protection, and for those clients that are seriously threatened with a possible bankruptcy filing. We establish accounting reserves for our estimated exposure on these items which can materially impact the results of our operations in the period such reserves are established. There can be no assurance that our accounting reserves related to this exposure will be adequate. Should any of the factors
17
Table of Contents
considered in determining the adequacy of the overall reserves change adversely, an adjustment to the accounting reserves may be necessary. Because of the potential significance of this exposure, such an adjustment could be material.
We May Incur Material Restructuring Charges in the Future.
In the past, we have recorded restructuring charges related to involuntary employee terminations, various facility abandonments, and various other restructuring activities. We continually evaluate ways to reduce our operating expenses through new restructuring opportunities, including more effective utilization of our assets, workforce, and operating facilities. As a result, there is a risk, which is increased during economic downturns and with expanded global operations, that we may incur material restructuring charges in the future.
Substantial Impairment of Goodwill and Other Long-lived Assets in the Future May Be Possible.
As a result of various acquisitions and the growth of our company over the last several years, we have approximately $209 million of goodwill, and $200 million of long-lived assets other than goodwill (principally, property and equipment, software, and client contracts). These long-lived assets are subject to ongoing assessment of possible impairment summarized as follows:
| • | Goodwill is required to be tested for impairment on an annual basis. We have elected to do our annual test for possible impairment as of July 31 of each year. In addition to this annual requirement, goodwill is required to be evaluated for possible impairment on a periodic basis (e.g., quarterly) if events occur or circumstances change that could indicate a possible impairment may have occurred. |
| • | Long-lived assets other than goodwill are required to be evaluated for possible impairment whenever events or changes in circumstances indicate that the carrying amount of these assets may not be recoverable. |
We utilize cash flow models as the primary basis to estimate the fair value amounts used in our goodwill and other long-lived asset impairment valuations. Our estimates of fair value are based upon various key modeling assumptions such as: (i) projected future sales, which include assumptions around market penetration and growth, and the success of any new product and service offerings; (ii) the profitability of future operations; and (iii) the appropriate discount rate. If we do not achieve our near-term or long-term financial or operating goals for a variety of reasons (e.g., a significant adverse change in the legal environment or in the business climate, unanticipated or increased competition, an unexpected change in strategic direction towards product solutions, or target markets, and/or loss of key personnel), it may require us to modify our assumptions in future periods such that the estimated fair value of one or more of our long-lived assets is materially changed, which may result in an impairment loss. If an impairment was to be recorded in the future, it would likely materially impact our results of operations in the period such impairment is recognized, but such an impairment charge would be a non-cash expense, and therefore would have no impact on our cash flows, or on the financial position of our company.
Failure to Attract and Retain Our Key Management and Other Highly Skilled Personnel Could Have a Material Adverse Effect on Our Business.
Our future success depends in large part on the continued service of our key management, sales, product development, professional services, and operational personnel. We believe that our future success also depends on our ability to attract and retain highly skilled technical, managerial, operational, and marketing personnel, including, in particular, personnel in the areas of R&D, professional services, and technical support. Competition for qualified personnel at times can be intense, particularly in the areas of R&D, conversions, software implementations, and technical support. This risk is heightened with a widely dispersed customer base and employee populations. For these reasons, we may not be successful in attracting and retaining the personnel we require, which could have a material adverse effect on our ability to meet our commitments and new product delivery objectives.
18
Table of Contents
| Item 1B. | Unresolved Staff Comments |
None.
| Item 2. | Properties |
As of December 31, 2010 we were operating from over 30 leased sites around the world, representing approximately 640,000 square feet.
Our corporate headquarters is located in Englewood, Colorado. In addition, we lease office space in the United States in Atlanta, Georgia; Broomfield, New Jersey; Burlington, Massachusetts; Charlotte, North Carolina; Chicago, Illinois; Dallas County, Texas; Fairfield, Connecticut; New York, New York; Omaha, Nebraska; and San Antonio, Texas. The leases for these office facilities expire in the years 2011 through 2020. We also maintain leased facilities internationally in Australia, Brazil, Canada, China, France, India, Ireland, Malaysia, Poland, Singapore, South Africa, United Arab Emirates, and the United Kingdom (“U.K.”). The leases for these international office facilities expire in the years 2011 through 2019. We utilize these office facilities primarily for the following: (i) client services, training, and support; (ii) product and operations support; (iii) systems and programming activities; (iv) professional services staff; (v) R&D activities; (vi) sales and marketing activities; and (vii) general and administrative functions.
Additionally, we lease four statement production and mailing facilities totaling approximately 245,000 square feet. These facilities are located in: (i) Omaha, Nebraska; (ii) Wakulla County, Florida; (iii) Coppell, Texas; and (iv) Oxnard, California. The leases for these facilities expire in the years 2011 through 2019.
We believe that our facilities are adequate for our current needs and that additional suitable space will be available as required. We also believe that we will be able to either: (i) extend our current leases as they terminate; or (ii) find alternative space without experiencing a significant increase in cost. See Note 9 to our Consolidated Financial Statements for information regarding our obligations under our facility leases.
| Item 3. | Legal Proceedings |
From time-to-time, we are involved in litigation relating to claims arising out of our operations in the normal course of business. In the opinion of our management, we are not presently a party to any material pending or threatened legal proceedings.
| Item 4. | (Removed and Reserved). |
*******************************************************************************************
Executive Officers of the Registrant
As of December 31, 2010, our executive officers were Peter E. Kalan (Chief Executive Officer and President), Randy R. Wiese (Executive Vice President and Chief Financial Officer), Joseph T. Ruble (Executive Vice President, General Counsel, Corporate Secretary and Chief Administrative Officer), Bret C. Griess (Executive Vice President and Chief Operating Officer), and Michael J. Henderson (Executive Vice President-Sales and Marketing).
We have employment agreements with each of the executive officers.
Peter E. Kalan
Chief Executive Officer and President
Mr. Kalan, 51, joined the Company in January 1997, was appointed as Chief Financial Officer in October 2000, and named an Executive Vice President in 2004. In April 2006, he became Executive Vice President of Business
19
Table of Contents
and Corporate Development. In December 2007, Mr. Kalan was appointed Chief Executive Officer and President, and elected to the Board. Prior to joining the Company, he was Chief Financial Officer at Bank One, Chicago, and he also held various other financial management positions with Bank One in Texas and Illinois from 1985 through 1996. Mr. Kalan holds a BA degree in Business Administration from the University of Texas at Arlington. Mr. Kalan is a member of The Cable Center board of directors and is also a member of the Board of Pensions of the Presbyterian Church USA.
Randy R. Wiese
Executive Vice President and Chief Financial Officer
Mr. Wiese, 51, joined CSG in 1995 as Controller and later served as Chief Accounting Officer. He was named Executive Vice President and Chief Financial Officer in April 2006. Prior to joining CSG, he was manager of audit and business advisory services and held other accounting-related positions at Arthur Andersen & Co. Mr. Wiese is a member of the AICPA and the Nebraska Society of Certified Public Accountants, and serves as a board member for the Habitat for Humanity Board – Omaha Chapter. He holds a BS degree in Accounting from the University of Nebraska-Omaha.
Joseph T. Ruble
Executive Vice President, General Counsel, Corporate Secretary and Chief Administrative Officer
Mr. Ruble, 50, joined CSG in 1997 as Vice President and General Counsel. In November 2000, he was appointed Senior Vice President of Corporate Development, General Counsel and Corporate Secretary. In February 2007, he was named Executive Vice President. Prior to joining CSG, Mr. Ruble served from 1991 to 1997 as Vice President, General Counsel and Corporate Secretary for Intersolv, Inc., and as counsel to Pansophic Systems, Inc. for its international operations from 1988 to 1991. Prior to that, he represented the software industry in Washington, D.C. on legislative matters. Mr. Ruble holds a JD from Catholic University of America and a BS degree from Ohio University.
Bret C. Griess
Executive Vice President and Chief Operating Officer
Mr. Griess, 42, joined CSG in 1996 as a project manager and held a variety of positions in Operations and Information Technology, until being appointed Executive Vice President of Operations in February 2009 and Chief Operating Officer in March 2011. Prior to joining CSG, Mr. Griess was Genesis Product Manager with Chief Automotive Systems from 1995 to 1996, and an information systems analyst with the Air Force from 1990 to 1995. Mr. Griess holds a Master of Arts in Management degree and a BS degree from Bellevue University in Nebraska, an Associate of Applied Science degree from the Community College of the Air Force, and an Associate of Science in Business Administration degree from Brevard Community College in Florida.
Michael J. Henderson
Executive Vice President-Sales and Marketing
Mr. Henderson, 53, joined CSG in 2010 as Executive Vice President of Sales and Marketing to oversee all new business development, marketing, and management of account relationships for CSG. Prior to joining CSG, he served as Chief Sales Officer with Call Genie from 2008 to 2010, and as a partner with BVM Consulting, LLC from 2007 until 2008. Mr. Henderson was President for Telcordia Technologies’ Global Solutions division from 2004 to 2007, and was at ADC’s Software Systems division as Executive Vice President of Global Sales and Marketing from 1999 until 2004. He also was co-founder and CEO of PCI, a venture-backed software company, and held senior executive positions with Nortel, Frontier Corporation, and Volt Delta Resources. Mr. Henderson earned an MBA in Marketing and Finance from the University of Rochester and a BS in Management Information Systems from the University of Arizona
20
Table of Contents
Board of Directors of the Registrant
Information related to our Board of Directors as of December 31, 2010, is provided below.
Donald B. Reed
Former Chief Executive Officer
Cable & Wireless Global
Mr. Reed, 66, was elected to the Board in May 2005 and presently serves as the Company’s non-executive Chairman of the Board. He currently is retired, having served as Chief Executive Officer of Cable & Wireless Global from May 2000 to January 2003. Cable & Wireless Global, Cable & Wireless PLC’s wholly-owned operations in the United States, United Kingdom, Europe and Japan, is a provider of internet protocol (IP) and data services to business customers. From June 1998 until May 2000, Mr. Reed served Cable & Wireless in various other executive positions. Mr. Reed’s career includes 30 years at NYNEX Corporation (now part of Verizon), a regional telephone operating company. From 1995 to 1997, Mr. Reed served NYNEX Corporation as President and Group Executive with responsibility for directing the company’s regional, national and international government affairs, public policy initiatives, legislative and regulatory matters, and public relations. Mr. Reed currently is a director of Oceus Networks. Mr. Reed has also previously served as a director of Intervoice, Inc., Idearc Media (formerly Verizon Yellow Pages), Bell Atlantic, St. Lawrence Cement, and Aggregate Industries in London, England.
Peter E. Kalan
Chief Executive Officer and President
CSG Systems International, Inc.
Mr. Kalan’s biographical information in included in “Executive Officers of the Registrant” section shown directly above.
Ronald H. Cooper
President and Chief Executive Officer
Clear Channel Outdoor Americas, Inc.
Mr. Cooper, 54, was elected to the Board in November 2006. Mr. Cooper is currently the President and Chief Executive Officer of Clear Channel Outdoor Americas, Inc. He previously spent nearly 25 years in the cable and telecommunications industry, most recently at Adelphia Communications where he served as President and Chief Operating Officer from 2003 to 2006. Prior to Adelphia, Mr. Cooper held a series of executive positions at AT&T Broadband, RELERA Data Centers & Solutions, and MediaOne and its predecessor Continental Cablevision, Inc. He has held various board and committee seats with the National Cable Television Association, California Cable & Telecommunications Association, Cable Television Association for Marketing and the New England Cable Television Association. In addition, Mr. Cooper is a director of the Outdoor Advertising Association of America, a trustee at the Denver Art Museum and a director for Colorado Public Radio.
Edward C. Nafus
Former Chief Executive Officer and President
CSG Systems International, Inc.
Mr. Nafus, 70, was elected to the Board in March 2005. Mr. Nafus joined CSG in August 1998 as Executive Vice President and became the President of our Convergent Services and Solutions Division in January 2002. In April 2005, Mr. Nafus assumed the position of Chief Executive Officer and President of CSG and held that position until his retirement in December 2007. Prior to joining CSG, Mr. Nafus held numerous management positions within First Data Corporation from 1978 to 1998. From 1992 to 1998, he served as Executive Vice President of First Data Corporation; from 1989 to 1992, he served as President of First Data International; and Executive Vice President of First Data Resources from 1984 to 1989. From 1971 to 1978, Mr. Nafus worked in sales management, training and sales for Xerox Corporation. From 1966 to 1971, Mr. Nafus was a pilot and division officer in the United States Navy. Mr. Nafus holds a BS degree from Jamestown College. Mr. Nafus currently is a director of a privately held company, WageWorks, Inc.
21
Table of Contents
Janice I. Obuchowski
President
Freedom Technologies, Inc.
Ms. Obuchowski, 59, was elected to the Board in November 1997. She is the founder and has been President of Freedom Technologies, Inc., a business that provides public policy and strategic advice to a wide range of companies in the communications sector, to the United States Department of Defense, and to the international agencies of government, since 1992. In 2003, Ms. Obuchowski was appointed by President George W. Bush to serve as Ambassador and Head of the U.S. Delegation to the World Radio Communication Conference. She has served as Assistant Secretary for Communications and Information at the Department of Commerce and as Administrator for the National Telecommunications and Information Administration. Ms. Obuchowski currently is a director of Orbital Sciences Corporation and Inmarsat. Ms. Obuchowski was also a director for Stratos Global Corporation and Qualcomm. Ms. Obuchowski also serves on several non-profit boards, including as a trustee of the Federal Communications Bar Association.
Bernard W. Reznicek
Consultant
The Premier Group
Mr. Reznicek, 74, was elected to the Board in January 1997 and served as the Company’s non-executive Chairman of the Board from 2005 until 2009. He currently provides consulting services as President of Premier Enterprises, and is Chairman of Erra, Inc., a startup clean technology company. Mr. Reznicek previously was an Executive with Central States Indemnity Company of Omaha, a Berkshire Hathaway company, from 1997 to 2003. He has 40 years of experience in the electric utility industry, having served as Chairman, President and Chief Executive Officer of Boston Edison Company, and President and Chief Executive Officer of Omaha Public Power District. Mr. Reznicek currently is a director of Pulte Homes, Inc. (NYSE) and CSI. Mr. Reznicek has previously been a director of State Street Corporation, Stone and Webster, Guarantee Life, infoGROUP Inc. and Central States Indemnity.
Frank V. Sica
Managing Partner
Tailwind Capital
Mr. Sica, 60, has served as a director of the Company since its formation in 1994. He is currently a Managing Partner of Tailwind Capital. From 2004 to 2005, Mr. Sica was a Senior Advisor to Soros Private Funds Management. From 2000 until 2003, he was President of Soros Private Funds Management which oversaw the direct real estate and private equity investment activities of Soros. In 1998, he joined Soros Fund Management where he was a Managing Director responsible for Soros’ private equity investments. Mr. Sica was previously Managing Director for Morgan Stanley Merchant Banking Division. Mr. Sica currently is a director of JetBlue Airways, Kohl’s Corporation, Oceus Networks, and Safe Bulkers. Mr. Sica has previously been a director for NorthStar Realty Finance Corporation and Emmis Communications.
Donald V. Smith
Former Senior Managing Director
Houlihan Lokey Howard & Zukin, Inc.
Mr. Smith, 68, was elected to the Board in January 2002. He is presently retired and providing financial consulting services through Donald V. Smith LLC. Previously he served as Senior Managing Director of Houlihan Lokey Howard & Zukin, Inc., an international investment banking firm with whom he had been associated from 1988 through 2009, and where he served on the board of directors of the firm. From 1978 to 1988, he served as Principal with Morgan Stanley & Co. Inc., where he headed their valuation and reorganization services. Mr. Smith is director of the Princeton (NJ) Health Care System Foundation and on the board of directors and executive committee of Business Executives for National Security.
22
Table of Contents
James A. Unruh
Managing Principal
Alerion Capital Group
Mr. Unruh, 70, was elected to the Board in June 2005. He became a founding principal of Alerion Capital Group, LLC (a private equity investment company) in 1998 and currently holds such position. Mr. Unruh was an executive with Unisys Corporation from 1987 to 1997 and served as its Chairman and Chief Executive Officer from 1990 to 1997. From 1982 to 1986, Mr. Unruh held various executive positions, including Senior Vice President—Finance and Chief Financial Officer, with Burroughs Corporation, a predecessor of Unisys Corporation. Mr. Unruh currently is a director of Prudential Financial, Inc., Tenet Healthcare Corporation, and Qwest Communications International Inc. Mr. Unruh has also previously served as a director of LumenIQ, as well as non-executive Chairman of Apex Microtechnology and Tiros Corporation.
23
Table of Contents
PART II
| Item 5. | Market for Registrant’s Common Equity, Related Stockholder Matters and Issuer Purchases of Equity Securities |
Our common stock is listed on NASDAQ under the symbol “CSGS”. The following table sets forth, for the fiscal quarters indicated, the high and low sale prices of our common stock as reported by NASDAQ.
| High | Low | |||||||
| 2010 |
||||||||
| First quarter |
$ | 22.29 | $ | 17.29 | ||||
| Second quarter |
23.85 | 18.28 | ||||||
| Third quarter |
21.39 | 17.22 | ||||||
| Fourth quarter |
20.34 | 17.69 | ||||||
| High | Low | |||||||
| 2009 |
||||||||
| First quarter |
$ | 17.82 | $ | 12.27 | ||||
| Second quarter |
15.45 | 12.83 | ||||||
| Third quarter |
17.28 | 13.14 | ||||||
| Fourth quarter |
19.66 | 15.65 | ||||||
On March 4, 2011, the last sale price of our common stock as reported by NASDAQ was $19.79 per share. On January 31, 2011, the number of holders of record of common stock was 222.
Dividends
We have not declared or paid cash dividends on our common stock since our incorporation. We intend to retain any earnings to finance the growth and development of our business, and at this time, we do not plan to pay cash dividends in the foreseeable future.
The payment of dividends has certain impacts to our senior subordinated convertible contingent debt (the 2004 Convertible Debt Securities and the 2010 Convertible Notes) and our Credit Agreement. See Note 6 to our Consolidated Financial Statements for additional discussion of our long-term debt and the impact the payment of dividends may have on these items.
24
Table of Contents
Stock Price Performance
The following graph compares the cumulative total stockholder return on our common stock, the S&P 500 Index, and our Standard Industrial Classification (“SIC”) Code Index: Computer Processing and Data Preparation and Processing Services during the indicated five-year period. The graph assumes that $100 was invested on December 31, 2005, in our common stock and in each of the two indexes and that all dividends, if any, were reinvested.
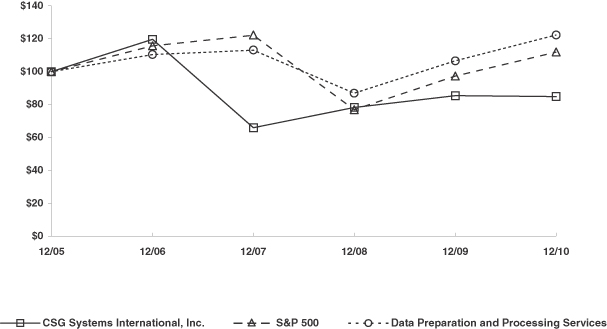
| As of December 31, | ||||||||||||||||||||||||
| 2005 | 2006 | 2007 | 2008 | 2009 | 2010 | |||||||||||||||||||
| CSG Systems International, Inc. |
$ | 100.00 | $ | 119.76 | $ | 65.95 | $ | 78.27 | $ | 85.53 | $ | 84.86 | ||||||||||||
| S&P 500 Index |
100.00 | 115.80 | 122.16 | 76.96 | 97.33 | 111.99 | ||||||||||||||||||
| Data Preparation & Processing Services |
100.00 | 110.40 | 113.11 | 86.91 | 106.71 | 122.29 | ||||||||||||||||||
25
Table of Contents
Equity Compensation Plan Information
The following table summarizes certain information about our equity compensation plans as of December 31, 2010:
| Plan Category |
Number of securities to be issued upon exercise of outstanding options, warrants, and rights |
Weighted-average exercise price of outstanding options, warrants, and rights |
Number of securities remaining available for future issuance |
|||||||||
| Equity compensation plans approved by security holders |
120,533 | $ | 32.45 | 5,461,763 | ||||||||
| Equity compensation plan not approved by security holders |
48,067 | 25.25 | 952 | |||||||||
| Total |
168,600 | $ | 30.40 | 5,462,715 | ||||||||
Of the total number of securities remaining available for future issuance, 5,387,230 shares can be used for various types of stock-based awards, as specified in the individual plans, with the remaining 75,485 shares to be used for our employee stock purchase plan. See Note 11 to our Consolidated Financial Statements for additional discussion of our equity compensation plans.
Issuer Repurchases of Equity Securities
The following table presents information with respect to purchases of our common stock made during the three months ended December 31, 2010 by CSG Systems International, Inc. or any “affiliated purchaser” of CSG Systems International, Inc., as defined in Rule 10b-18(a)(3) under the Exchange Act.
| Period |
Total Number of Shares Purchased(1) |
Average Price Paid Per Share |
Total Number of Shares Purchased as Part of Publicly Announced Plans or Programs |
Maximum Number of Shares that May Yet Be Purchased Under the Plan or Programs |
||||||||||||
| October 1—October 31 |
1,349 | $ | 18.45 | — | 4,204,096 | |||||||||||
| November 1—November 30 |
1,897 | 19.10 | — | 4,204,096 | ||||||||||||
| December 1—December 31 |
1,342 | 18.79 | — | 4,204,096 | ||||||||||||
| Total |
4,588 | $ | 18.82 | — | ||||||||||||
| (1) | The total number of shares purchased that are not part of the Stock Repurchase Program represents shares purchased and cancelled in connection with stock incentive plans. |
26
Table of Contents
| Item 6. | Selected Financial Data |
The following selected financial data have been derived from our audited financial statements. The selected financial data presented below should be read in conjunction with, and is qualified by reference to, our MD&A and our Consolidated Financial Statements. The information below is not necessarily indicative of the results of future operations.
| Year Ended December 31, | ||||||||||||||||||||
| 2010(1) | 2009 | 2008 | 2007 | 2006 | ||||||||||||||||
| (in thousands, except per share amounts) | ||||||||||||||||||||
| Statements of Income Data: |
||||||||||||||||||||
| Revenues(2): |
||||||||||||||||||||
| Processing and related services |
$ | 497,775 | $ | 464,970 | $ | 439,975 | $ | 382,070 | $ | 351,764 | ||||||||||
| Software, maintenance and services |
51,604 | 35,747 | 32,082 | 37,191 | 31,342 | |||||||||||||||
| Total revenues |
549,379 | 500,717 | 472,057 | 419,261 | 383,106 | |||||||||||||||
| Cost of revenues (exclusive of depreciation, shown separately below): |
||||||||||||||||||||
| Processing and related services(3) |
258,638 | 249,335 | 226,343 | 193,135 | 173,536 | |||||||||||||||
| Software, maintenance and services |
31,166 | 26,344 | 19,007 | 24,674 | 20,975 | |||||||||||||||
| Total cost of revenues |
289,804 | 275,679 | 245,350 | 217,809 | 194,511 | |||||||||||||||
| Other operating expenses: |
||||||||||||||||||||
| Research and development |
78,050 | 70,113 | 67,278 | 58,342 | 46,191 | |||||||||||||||
| Selling, general and administrative(1) |
82,586 | 59,510 | 53,857 | 45,743 | 43,127 | |||||||||||||||
| Depreciation(3) |
22,428 | 20,069 | 16,194 | 12,900 | 10,438 | |||||||||||||||
| Restructuring charges(1)(6) |
2,169 | 599 | 79 | 630 | 2,368 | |||||||||||||||
| Total operating expenses |
475,037 | 425,970 | 382,758 | 335,424 | 296,635 | |||||||||||||||
| Operating income(2) |
74,342 | 74,747 | 89,299 | 83,837 | 86,471 | |||||||||||||||
| Other income (expense): |
||||||||||||||||||||
| Interest expense |
(6,976 | ) | (5,660 | ) | (7,132 | ) | (6,797 | ) | (7,103 | ) | ||||||||||
| Amortization of original issue discount |
(6,893 | ) | (8,382 | ) | (9,767 | ) | (9,198 | ) | (8,493 | ) | ||||||||||
| Gain (loss) on repurchase of convertible debt securities(5) |
(12,714 | ) | 1,468 | 3,351 | — | — | ||||||||||||||
| Interest and investment income, net(6) |
754 | 1,194 | 4,998 | 16,529 | 21,984 | |||||||||||||||
| Loss on foreign currency transactions(1) |
(14,023 | ) | — | — | — | — | ||||||||||||||
| Other, net |
(817 | ) | 2 | 15 | 221 | (21 | ) | |||||||||||||
| Total other |
(40,669 | ) | (11,378 | ) | (8,535 | ) | 755 | 6,367 | ||||||||||||
| Income from continuing operations before income taxes |
33,673 | 63,369 | 80,764 | 84,592 | 92,838 | |||||||||||||||
| Income tax provision |
(11,244 | ) | (21,507 | ) | (27,514 | ) | (29,942 | ) | (35,331 | ) | ||||||||||
| Income from continuing operations |
22,429 | 41,862 | 53,250 | 54,650 | 57,507 | |||||||||||||||
| Discontinued operations(6): |
||||||||||||||||||||
| Income (loss) from discontinued operations |
— | — | — | 547 | (6,555 | ) | ||||||||||||||
| Income tax benefit |
— | 1,471 | 323 | 61 | 3,764 | |||||||||||||||
| Discontinued operations, net of tax |
— | 1,471 | 323 | 608 | (2,791 | ) | ||||||||||||||
| Net income |
$ | 22,429 | $ | 43,333 | $ | 53,573 | $ | 55,258 | $ | 54,716 | ||||||||||
| Diluted net income (loss) per common share: |
||||||||||||||||||||
| Income from continuing operations |
$ | 0.67 | $ | 1.22 | $ | 1.53 | $ | 1.33 | $ | 1.19 | ||||||||||
| Discontinued operations, net of tax |
— | 0.04 | 0.01 | 0.01 | (0.06 | ) | ||||||||||||||
| Net income |
$ | 0.67 | $ | 1.26 | $ | 1.54 | $ | 1.34 | $ | 1.13 | ||||||||||
| Weighted-average diluted shares outstanding: |
||||||||||||||||||||
| Common stock |
32,822 | 33,352 | 33,240 | 39,743 | 46,730 | |||||||||||||||
| Participating restricted stock |
543 | 1,097 | 1,602 | 1,334 | 1,247 | |||||||||||||||
| Total |
33,365 | 34,449 | 34,842 | 41,077 | 47,977 | |||||||||||||||
| Other Data (at Period End): |
||||||||||||||||||||
| Number of ACP clients’ customers processed |
48,913 | 48,645 | 45,312 | 45,104 | 45,354 | |||||||||||||||
| Balance Sheet Data (at Period End): |
||||||||||||||||||||
| Cash, cash equivalents and short-term investments(6) |
$ | 215,550 | $ | 198,377 | $ | 141,217 | $ | 132,832 | $ | 415,490 | ||||||||||
| Working capital(1) |
171,085 | 224,281 | 184,675 | 180,983 | 454,117 | |||||||||||||||
| Goodwill(1) |
209,164 | 107,052 | 103,971 | 60,745 | 14,228 | |||||||||||||||
| Total assets(1) |
879,698 | 561,714 | 484,771 | 412,128 | 634,887 | |||||||||||||||
| Total debt(1)(4)(5) |
374,687 | 157,447 | 175,788 | 191,892 | 182,694 | |||||||||||||||
| Total treasury stock(7) |
704,963 | 675,623 | 671,841 | 667,858 | 360,259 | |||||||||||||||
| Total stockholders’ equity |
237,078 | 212,110 | 164,687 | 105,708 | 346,431 | |||||||||||||||
| Cash Flow Data: |
||||||||||||||||||||
| Cash flows from operating activities |
$ | 121,309 | $ | 153,059 | $ | 114,647 | $ | 115,379 | $ | 118,150 | ||||||||||
27
Table of Contents
| (1) | On November 30, 2010, we completed the Intec Acquisition, and as a result, one month of Intec’s operations are included in our 2010 results. See Note 2 to our Consolidated Financial Statements and MD&A for a discussion of the Intec Acquisition and its impact on our Consolidated Financial Statements as of and for the year ended December 31, 2010. The overall cost of the acquisition was approximately $400 million, which includes the purchase price of approximately $364 million, (or approximately $255 million, net of cash acquired of $109 million) acquisition-related expenses of $26.2 million, and debt issuance costs of $10.2 million. The $26.2 million of acquisition-related charges consist of: (i) $10.2 million of investment banking, legal, accounting and other professionals services, and are reflected in selling, general and administrative costs; (ii) $2.0 million of restructuring charges related primarily to changes in senior management of Intec after the closing of the transaction; and (iii) $14.0 million of non-operating losses related primarily to foreign currency financial instrument transactions, which are reflected in other income (expense). We financed the Intec Acquisition by borrowing against the Credit Agreement, which consists of a $200 million, five-year term loan and a $100 million, five-year revolving loan facility, with the remaining purchase price satisfied by using our existing cash. As of December 31, 2010, we had outstanding the entire $200 million term loan and $35 million of the revolving loan facility. See Note 6 to our Consolidated Financial Statements for additional discussion of our Credit Agreement. |
| (2) | During 2010, 2008, and 2007 we acquired several businesses as part of our growth and diversification strategy which resulted in top line revenue growth for 2010, 2009, 2008, and 2007 of 9.7%, 6.1%, 12.6% and 9.4%, respectively, of which approximately 37% of the 2010 growth rate, 57% of the 2009 growth rate, 75% of the 2008 growth rate, and 45% of the 2007 growth rate can be attributed to these acquired entities, with the remaining growth in each year attributed to organic growth factors. These acquired businesses have historically operated at a lower operating margin percentage than our legacy business, thus, have had a slightly dilutive impact to our operating income margin percentage. Refer to the Business Section for additional discussion regarding these acquisitions. |
| (3) | In the first quarter of 2009, we began to transition our outsourced data center processing services from FDC to Infocrossing. As a result, during 2010 and 2009, we incurred $20.5 million and $15.5 million of expense, respectively, related to these efforts, of which $18.3 million and $13.6 million, respectively, are included in cost of processing and related services and $2.2 million and $1.9 million, respectively, are included in depreciation in our Consolidated Statements of Income. See the Data Center Transition section included in MD&A for additional discussion of this matter. |
| (4) | In March 2010, we completed an offering of $150 million of 3.0% senior subordinated convertible notes due March 1, 2017 to qualified institutional buyers pursuant to Rule 144A under the Securities Act of 1933, as amended. We used the proceeds, along with available cash, cash equivalents and short-term investments to: (i) repurchase $119.9 million (par value) of our 2004 Convertible Debt Securities for $125.0 million (see Note 5 below); and (ii) repurchase 1.5 million shares of our common stock for $29.3 million under our existing Stock Repurchase Program (see Note 7 below). See Note 6 to our Consolidated Financial Statements for additional discussion of our long-term debt. |
| (5) | In 2010, 2009, and 2008, we repurchased $145.2 million (par value), $30.0 million (par value) and $29.7 million (par value) of our 2004 Convertible Debt Securities for $151.0 million, $26.7 million, and $22.4 million, respectively, and recognized a gain (loss) on the repurchases of $(12.7) million, $1.5 million, and $3.4 million, respectively, after the write-off of deferred financing costs. See Note 6 to our Consolidated Financial Statements for additional discussion of our long-term debt. |
| (6) | We sold our GSS business in 2005, and any subsequent activity related to the GSS business is reflected as discontinued operations for all periods presented in our Consolidated Statements of Income. We received approximately $233 million in net cash proceeds from the sale of this business, which is the primary reason for the large cash balance as of December 31, 2006, and the higher interest and investment income in 2006 and 2007. Additionally, the large restructuring expense in 2006 was almost entirely related to the changes we made in our business as a result of the sale of the GSS business. |
| (7) | In August 1999, our Board of Directors approved our Stock Repurchase Program which authorized us to purchase shares of our common stock from time-to-time as business conditions warrant. During 2010, 2009, 2008, 2007, and 2006, we repurchased 1.5 million, 0.3 million, 0.3 million, 13.2 million, and 2.5 million shares, respectively, for $29.3 million, $3.8 million, $4.0 million, $307.6 million, and $63.3 million, respectively. The significant stock repurchases made during 2007 was the primary reason for the decrease in our cash balance between 2006 and 2007. As of December 31, 2010, 4.2 million shares of the 35.0 million shares authorized under the Stock Repurchase Program remain available for repurchase. See Note 10 to our Consolidated Financial Statements for additional discussion of the Stock Repurchase Program. |
28
Table of Contents
| Item 7. | Management’s Discussion and Analysis of Financial Condition and Results of Operations |
Forward-Looking Statements
This report contains a number of forward-looking statements relative to our future plans and our expectations concerning our business and the industries we serve. These forward-looking statements are based on assumptions about a number of important factors, and involve risks and uncertainties that could cause actual results to differ materially from estimates contained in the forward-looking statements. Some of the risks that are foreseen by management are outlined above within Item 1A., “Risk Factors”. Item 1A. constitutes an integral part of this report, and readers are strongly encouraged to review this section closely in conjunction with MD&A.
Intec Acquisition
Acquisition. On September 24, 2010, we issued an announcement pursuant to Rule 2.5 of the U.K. City Code on Takeovers and Mergers, announcing our intention to make an offer to acquire 100% of the issued and to be issued shares of U.K.-based Intec in an all-cash transaction of 72 pence per Intec share (the “Intec Acquisition”).
Intec is a leading provider of mediation, wholesale, and retail billing solutions, serving 60 of the world’s top 100 telecom providers and over 400 clients worldwide. Over 90% of Intec’s revenues are generated from telecommunications providers. Intec provides product software, associated professional services and software maintenance services to its clients.
On November 3, 2010, Intec’s Board of Directors announced that, at the court meeting and general meeting of eligible Intec shareholders, Intec shareholders voted to approve, by the necessary majorities, the transaction and other associated matters to implement the acquisition of Intec. On November 29, 2010, the transaction was sanctioned and the capital reduction was confirmed by the court. On November 30, 2010, the documents to finalize the transaction were filed and the transaction became effective.
We acquired Intec to: (i) evolve our offerings; (ii) expand the markets we serve; and (iii) reach greater economic scale, as discussed earlier in the Overview section of Item 1., “Business”.
Purchase Price. The purchase price for the Intec Acquisition was approximately £234 million, or approximately $364 million, based upon the an exchange rate of 1.56:1.00 between the U.S. dollar and the pound sterling as of November 30, 2010.
In September 2010, we entered into a pound sterling call/U.S. dollar put (the “Currency Option”) at a strike price of 1.62 in conjunction with the Intec Acquisition to limit our exposure to adverse movements in the exchange rate between the two currencies leading up to the expected closing date. Upon the approval of the acquisition by Intec’s shareholders in November 2010, we sold the Currency Option, and entered into a forward contract for the delivery of approximately 240 million pounds sterling (which included estimated Intec Acquisition costs at that time) at an exchange rate of approximately 1.61 (the “Currency Forward”). During December 2010, as part of the payment process for the pound sterling purchase price, we closed out our position in the Currency Forward at an average rate of 1.58. Under U.S. GAAP, the costs and proceeds (including gains and losses) from financial instruments that are used to reduce the risks of a change in the value of the acquiree’s net assets or the consideration to be issued by the acquirer before the date of acquisition, are not part of the consideration transferred, or purchase price, and should be recorded currently in earnings. As a result, for the year ended December 31, 2010, we recorded net expense of $14.0 million related to these financial instrument transactions, and the foreign currency impact of intercompany notes established to structure the Intec Acquisition, which we reflected in Other income (expense) in our Consolidated Statement of Income.
Acquisition Financing. We financed the Intec Acquisition by borrowing against a new credit agreement that consists of a $200 million, five-year term loan and a $100 million, five-year revolving loan facility that we entered into on September 24, 2010 and amended on November 24, 2010 (collectively, the “Credit Agreement”) as part of this transaction. See Note 6 to our Financial Statements for further information regarding our Credit Agreement.
29
Table of Contents
Financing and Other Acquisition-Related Expenses. In conjunction with the Credit Agreement, we incurred debt issuance costs of approximately $10 million. These costs are being amortized to interest expense over the lives of the term loan and revolving loan facility components of the Credit Agreement.
In addition to the loss on foreign currency transactions of $14.0 million discussed above, through December 31, 2010, we incurred certain direct and incremental acquisition-related costs, totaling $12.2 million related to the following:
| • | $10.2 million attributed primarily to investment banking, legal, accounting, and other professional services, which have been reflected in the Selling, general and administrative expenses in our Consolidated Statement of Income; and |
| • | $2.0 million of restructuring charges primarily related to changes in senior management of Intec after the closing of the transaction, which have been reflected in Restructuring charges in our Consolidated Statement of Income. |
MD&A Basis of Discussion. Our Consolidated Statement of Income for the year ended December 31, 2010, reflects the results of operations for Intec for the period from December 1, 2010 through December 31, 2010. As a result, amounts presented for prior years may not be comparable to the 2010 amounts. Such comparable differences have been described below where relevant or significant.
Management Overview
Results of Operations. A summary of our results of operations for 2010 and 2009, and other key performance metrics are as follows (in thousands, except percentages and per share amounts):
| Year Ended December 31, |
||||||||
| 2010 | 2009 | |||||||
| Revenues |
$ | 549,379 | $ | 500,717 | ||||
| ACP Customer Accounts (end of period) |
48,913 | 48,645 | ||||||
| Operating Results: |
||||||||
| Operating Income |
$ | 74,342 | $ | 74,747 | ||||
| Operating Income Margin |
13.5 | % | 14.9 | % | ||||
| Diluted earnings per share from continuing operations (“EPS”) |
$ | 0.67 | $ | 1.22 | ||||
| Supplemental Data: |
||||||||
| Data center transition expenses |
$ | 20,480 | $ | 15,486 | ||||
| Intec acquisition-related charges: |
||||||||
| Operating acquisition-related expenses |
12,242 | — | ||||||
| Non-operating loss on foreign currency transactions |
14,023 | — | ||||||
| Stock-based compensation |
12,338 | 12,632 | ||||||
| Amortization of acquired intangible assets |
6,206 | 6,104 | ||||||
| Amortization of OID |
6,893 | 8,382 | ||||||
| (Gain) loss on repurchase of convertible debt securities |
12,714 | (1,468 | ) | |||||
Revenues. Our revenues for 2010 were $549.4 million, an increase of 9.7% when compared to $500.7 million for 2009. Totals revenues consisted of $17.8 million coming from the one month of Intec’s operations under our ownership, and $531.6 million coming from our historical operations. The increases in total revenues are reflective of the success we have experienced in our plan to grow top-line revenues and achieve market diversification through both acquisitions and organic growth, as discussed in further detail below.
30
Table of Contents
Operating Results. Operating income for 2010 was $74.3 million, or a 13.5% operating income margin percentage, compared to $74.7 million, or a 14.9% operating income margin percentage, for 2009. Our operating results were impacted by the following key items:
| • | the data center transition expenses reduced operating income by $20.5 million for 2010, compared to $15.5 million for 2009; and |
| • | Intec acquisition-related expenses reduced operating income by $12.2 million for 2010, which consist of $10.2 million of costs related primarily to investment banking, legal, accounting, and other professional services, and $2.0 million of restructuring costs. |
EPS. EPS for 2010 was $0.67 per diluted share, which compares to $1.22 per diluted share for 2009. EPS for 2010, when compared to EPS for 2009, was impacted by the following items:
| • | a negative EPS impact of $0.11 related to the $5.0 million increase in the data center transition expenses between years; |
| • | a negative EPS impact of $0.52 related to the $26.2 million of Intec acquisition-related charges incurred during 2010 (which includes the $12.2 million of operating expenses and the $14.0 million losses related to foreign currency transactions, discussed earlier); and |
| • | a negative EPS impact of $0.28 related to a $12.7 million loss, or $0.25 per diluted share impact, on the repurchase of our convertible debt securities in 2010, as compared to a $1.5 million gain, or $0.03 per diluted share impact, that occurred in 2009 for similar debt repurchases. |
Balance Sheet and Cash Flows. As of December 31, 2010, we had cash, cash equivalents, and short-term investments of $215.6 million, as compared to $198.4 million as of December 31, 2009. We continue to generate strong cash flows from operations. Cash flows from operating activities for 2010 were $121.3 million, compared to $153.1 million for 2009, with the fluctuations between periods primarily attributed to changes in operating assets and liabilities, discussed in further detail in the Liquidity section.
Significant Client Relationships
Comcast. Comcast continues to be our largest client. For 2010 and 2009, revenues from Comcast represented approximately 24% of our total revenues. Our processing agreement with Comcast, which runs through December 31, 2012, contains certain financial commitments associated with the number of Comcast customer accounts that are processed on our solutions, with such commitments decreasing over the life of the agreement. The Comcast processing agreement and related material amendments, with confidential information redacted, are included in the exhibits to our periodic filings with the SEC.
DISH. DISH is our second largest client. For 2010 and 2009, DISH represented approximately 18% of our total revenues.
On November 24, 2009, we entered into a multi-year, non-exclusive processing agreement with DISH (the “Current Agreement”), which became effective January 1, 2010, and extended our contractual relationship with DISH through December 31, 2012 for processing and related services, and through December 31, 2014 for print and mail services. The Current Agreement was consistent with the structure of the previous DISH contract in that the fees for processing and related services generated under the agreement were based on a fixed monthly amount, while the fees for print and mail services were based on the number of statements produced and the usage of ancillary print services, with annual guaranteed minimums, both subject to certain inflationary protections. The Current Agreement also provided DISH an option (hereafter referred to as Schedule L) to extend the processing and related services portion for an additional three years, and the print and mail services portion for an additional one year, such that each would run to December 31, 2015. The Schedule L option terms included pricing incentives for DISH in exchange for an extension of the term of the agreement, and other contractual rights and obligations for both DISH and CSG.
31
Table of Contents
On January 15, 2011, DISH executed an amended version of Schedule L of the Current Agreement (the “Amended Schedule L”). The key terms of the Amended Schedule L are summarized as follows:
| • | The Amended Schedule L extends our contractual relationship with DISH for processing and related services, and for print and mail services, through December 31, 2017. DISH intends to migrate to ACP in the 2012 time frame, otherwise, the expected scope of the products and services to be utilized by DISH under the Amended Schedule L is consistent with those that we have provided under the Current Agreement. DISH is the last of our customers to migrate to the ACP platform from an older version of our processing application, which will allow us to cease support and development on this older platform after the intended migration is complete. The migration to ACP will also allow DISH greater access to many of our newer products and services. Consistent with past migrations by our clients to ACP, the costs of the migration to ACP is our responsibility. However, we do not expect these migration costs to significantly increase our total current expense levels. |
| • | We will be the exclusive provider of processing and related services for DISH’s DBS customer accounts with financial minimum commitments through 2017. As a result of DISH executing the Amended Schedule L, we will begin invoicing DISH for processing and related services on a per-customer-account basis (rather than based on a fixed monthly amount as outlined in the Current Agreement) in February 2011, and will provide DISH with volume-based tiered pricing, subject to certain inflationary protections. |
| • | We will also be the exclusive provider of print and mail services for DISH’s DBS customer accounts with guaranteed minimum fees through 2017. Consistent with the Current Agreement, the fees for print and mail services will be based on the number of statements produced and the usage of ancillary print services, with the per-unit fees subject to certain inflationary protections. |
| • | The expected annual fees that we will generate under the Amended Schedule L will decrease in exchange for the extended term of the contract and the migration to the ACP platform. The Amended Schedule L provides us with visibility into the revenues expected to be generated from DISH over the next seven years. During the initial years under the Amended Schedule L pricing, annual revenues generated could be approximately 10% to 15% less than those generated in 2010, depending upon the level of products and services that DISH decides to purchase from us under the Current Agreement; however, the total fees expected to be generated during the extended term of the Current Agreement as a result of the Amended Schedule L option exercise would increase significantly, when compared to the previous terms of the Current Agreement prior to the exercise of the Amended Schedule L option. |
| • | We have also provided DISH with two, 2-year renewal options, that if both were exercised, would extend the term for processing and related services and print and mail services through December 31, 2021. |
| • | Under the Amended Schedule L, the timing of certain advance deposits and monthly invoicing terms were also modified. The previous terms of the Current Agreement required certain advance deposits and allowed for invoicing of monthly fees in advance of such services. These advanced payment terms, which were put in place in November 2009 when the Current Agreement became effective, resulted in favorable timing of payments from DISH at that time, which caused a $20 million increase in deferred revenues and cash flows provided by operating activities for the quarter ended December 31, 2009. Upon the execution of the Amended Schedule L, DISH is allowed to apply certain of those advance payments to its first quarter 2011 invoices, and the invoicing of monthly services will revert back to our normal practice of invoicing one month in arrears. As a result, our 2011 cash flows from operating activities will be negatively impacted by approximately $20 million to bring the advance payments and invoicing terms in-line with the terms of the Amended Schedule L. These payment adjustments are one-time in nature and we do not anticipate that this will have a significant impact on our liquidity. |
The Current Agreement and related material amendments, with confidential information redacted, is included in the exhibits to our periodic filings with the SEC. A copy of the Amended Schedule L, with confidential information redacted, will be filed as an exhibit to CSG’s Form 10-Q for the quarter ended March 31, 2011.
32
Table of Contents
Time Warner. Time Warner is our third largest client. For 2010 and 2009, revenues from Time Warner represented approximately 12% and 13%, respectively, of our total revenues. Our processing agreement with Time Warner runs through March 31, 2013. The Time Warner processing agreement contains provisions establishing annual minimum customer account levels that have to be processed on our solutions, which we expect Time Warner to exceed based on the number of Time Warner customers currently on our solutions. The Time Warner processing agreement and related material amendments, with confidential information redacted, are included in the exhibits to our periodic filings with the SEC.
Charter. Charter is our fourth largest client. For 2010 and 2009, revenues from Charter represented approximately 10% and 9%, respectively, of our total revenues. Our processing agreement with Charter runs through December 31, 2014, and contains minimum financial commitments over the life of the agreement.
2011 Client Concentration Expectations. The total percentage of our 2010 revenues generated from our four largest clients mentioned above was approximately 64%. Primarily because of the additional revenues anticipated from the Intec business in 2011, we anticipate that the total concentration of our 2011 revenues from these same four clients will fall below 50%, and that revenues from Time Warner and Charter are expected to each individually fall below 10% of our total revenues. Revenues from Comcast and DISH in 2011 are anticipated to be approximately 17% and 11%, respectively, but could vary slightly from these amounts based on their buying decisions with us in 2011.
Data Center Transition
Prior to 2010, we utilized First Data Corporation (“FDC”) to provide the data center computing environment for the delivery of our outsourced ACP customer care and billing services and related solutions under a contract that expired on December 31, 2010. FDC had provided these data center services to us since the inception of our company in 1994. In December 2008, we entered into an agreement with Infocrossing LLC (“Infocrossing”), a Wipro Limited company, to transition these outsourced data center services from FDC to Infocrossing. The term of the Infocrossing agreement runs through May 2015. We changed data center providers to partner with a global provider that focuses on data center operations in greater scale, and as their core business focus. This allowed us to further improve the delivery of our solutions while benefiting from an improved cost structure.
We began our transition efforts to the new Infocrossing data center in the first quarter of 2009, and migrated various computer systems and communication networks to the new data center using a multi-year, phased approach. We finished our transition efforts to the Infocrossing data center during the third quarter of 2010.
We have tracked the expenses attributable to our decision to change data center service providers separately, as these expenses are not considered reflective of our recurring core business operating results. These costs related primarily to our efforts to set-up, replicate, transition, and operate the computing environment at Infocrossing, while maintaining and operating the computing environment at the FDC data center. The network and computing environment were transitioned from FDC to Infocrossing in various planned stages over the project period, requiring us to incur certain costs to operate two separate data centers. This staged and replicated data center approach was designed to mitigate the risk of disruption to our clients during the transition period, but did result in certain cost inefficiencies during the transition period due to such things as redundant data processing costs, accelerated and redundant hardware- and software-related purchases, and costs incurred to maintain communications and data integrity between the two data center locations.
33
Table of Contents
During 2010 and 2009, we incurred the following expenses related to our data center transition efforts that are included in the following captions in the Consolidated Statements of Income (in thousands, except per share amounts):
| 2010 | 2009 | |||||||
| Cost of processing and related services. |
$ | 18,272 | $ | 13,570 | ||||
| Depreciation |
2,208 | 1,916 | ||||||
| Total data center transition expenses |
$ | 20,480 | $ | 15,486 | ||||
| Estimated per diluted share impact(1) |
$ | 0.40 | $ | 0.29 | ||||
| (1) | This represents the after-tax impact to net income on a per diluted share basis using an assumed effective income tax rate of approximately 35% and 34%, respectively, for the years ended December 31, 2010 and 2009. |
These costs included such things as the following: (i) equipment- and software-related costs; (ii) data communications and data processing costs; and (iii) labor and third-party consulting fees for the transition team. Since we have completed our migration to the Infocrossing data center during 2010, we do not anticipate any further data center transition expenses going forward into 2011.
Additionally, during 2010 and 2009, we spent approximately $14 million and $16 million, respectively, on capital expenditures related to network and computer equipment needed to set-up and replicate the computing environment at the new Infocrossing data center location.
The Infocrossing agreement, with confidential information redacted, is included in the exhibits to our periodic filings with the SEC.
Stock-Based Compensation Expense
Stock-based compensation expense is included in the following captions in the Consolidated Statements of Income (in thousands):
| 2010 | 2009 | 2008 | ||||||||||
| Cost of processing and related services |
$ | 3,137 | $ | 3,650 | $ | 3,451 | ||||||
| Cost of software, maintenance and services |
791 | 907 | 611 | |||||||||
| Research and development |
1,639 | 1,635 | 1,664 | |||||||||
| Selling, general and administrative |
6,771 | 6,440 | 5,879 | |||||||||
| Total stock-based compensation expense |
$ | 12,338 | $ | 12,632 | $ | 11,605 | ||||||
See Notes 3 and 11 to our Consolidated Financial Statements for additional discussion of our stock-based compensation expense.
Critical Accounting Policies
The preparation of our financial statements in conformity with accounting principles generally accepted in the U.S. requires us to select appropriate accounting policies, and to make judgments and estimates affecting the application of those accounting policies. In applying our accounting policies, different business conditions or the use of different assumptions may result in materially different amounts reported in our Consolidated Financial Statements.
We have identified the most critical accounting policies that affect our financial position and the results of our operations. These critical accounting policies were determined by considering our accounting policies that involve the most complex or subjective decisions or assessments. The most critical accounting policies identified
34
Table of Contents
relate to: (i) revenue recognition; (ii) allowance for doubtful accounts receivable; (iii) impairment assessments of goodwill and other long-lived assets; (iv) income taxes; and (v) business combinations and asset purchases. These critical accounting policies, as well as our other significant accounting policies, are disclosed in the notes to our Consolidated Financial Statements.
Revenue Recognition. The revenue recognition policy that involves the most complex or subjective decisions or assessments that may have a material impact on our business’ operations relates to the accounting for multiple-element arrangements when determining a revenue arrangement’s separate units of accounting.
Processing and Related Services. For multiple-element revenue arrangements that do not fall within the scope of specific authoritative accounting literature, such as our processing and related services agreements, we evaluate all deliverables in the arrangement to determine whether they represent separate units of accounting. Deliverables are generally accounted for as separate units of accounting if the following criteria are met: (i) the delivered item(s) have standalone value to the customer; and (ii) there is objective and reliable evidence of fair value of the undelivered items(s). The best evidence of objective and reliable evidence of fair value is entity-specific or vendor-specific evidence (“VSOE”) of fair value, or third-party evidence (“TPE”) of fair value. If the deliverables qualify as separate units of accounting, the arrangement consideration is allocated among the separate units of accounting based upon their relative fair values, and applicable revenue recognition criteria are considered for the separate units of accounting. If the deliverables do not qualify as separate units of accounting, the consideration allocable to delivered items is combined with the consideration allocable to the undelivered items, and the appropriate recognition of revenue is then determined for those combined deliverables as a single unit of accounting. The determination of separate units of accounting, and the determination of objective and reliable evidence of fair value of the undelivered items, if applicable, both require judgments to be made by us.
For our processing and related services, we have generally concluded that the multiple deliverables present in the agreements do not qualify as separate units of accounting, and thus have treated the deliverables as a single unit of accounting, with the revenue recognized somewhat ratably over the term of the processing agreement.
Effective January 1, 2011, the criteria that must be met to separate deliverables in multiple element arrangements changed. The requirement to have either VSOE or TPE of fair value for undelivered items to account for deliverables as separate units of accounting has been eliminated. If VSOE or TPE of fair value does not exist for the undelivered items, we must use estimated selling price. We do not expect this rule change to have a material impact in the timing of our processing and related services revenue recognition.
Software Licenses and Related Maintenance and Professional Services. Software arrangements fall within the scope of specific authoritative accounting literature. The accounting for software arrangements, especially when software is sold in a multiple-element arrangement, can be complex and requires considerable judgment. Key factors considered in accounting for software and related services include the following criteria: (i) the identification of the separate elements of the arrangement; (ii) the determination of whether any undelivered elements are essential to the functionality of the delivered elements; (iii) the assessment of whether the software, if hosted, should be accounted for as a services arrangement and thus outside the scope of the software revenue recognition literature; (iv) the determination of VSOE of fair value for the undelivered element(s) of the arrangement; (v) the assessment of whether the software fees are fixed or determinable; (vi) the determination as to whether the fees are considered collectible; and (vii) the assessment of whether services included in the arrangement represent significant production, customization or modification of the software. The evaluation of these factors, and the ultimate revenue recognition decision, requires significant judgments to be made by us. The judgments made in this area could have a significant effect on revenues recognized in any period by changing the amount and/or the timing of the revenue recognized. In addition, because software licenses typically have little or no direct, incremental costs related to the recognition of the revenue, these judgments could also have a significant effect on our results of operations.
Our more recent historical professional services revenues have generally consisted of software implementation projects with a relatively short duration period, and business consulting services related to
35
Table of Contents
the use of our solutions. These revenues were generally recognized as the installation or consulting work was performed. As a result of the Intec Acquisition, we expect that a large percentage of our professional services engagements will now include software implementation services of a greater project length and complexity that will represent significant production, customization or modification of the software, and/or will be considered essential to the functionality of the software being licensed, and thus will be accounted for using the percentage of completion (“POC”) method of accounting. Under the POC method of accounting, software license and professional services revenues are typically recognized as the professional services related to the software implementation project are performed. We are using hours performed on the project as the measure to determine the percentage of the work completed.
A portion of our professional services revenues do not include an element of software delivery (e.g., business consulting services, etc.), and thus, do not fall within the scope of specific authoritative accounting literature for software arrangements. In these cases, revenues from fixed-price, professional service contracts are recognized using a method consistent with the proportional performance method, which is relatively consistent with our POC methodology mentioned directly above. Under a proportional performance model, revenue is recognized by allocating revenue between reporting periods based on relative service provided in each reporting period, and costs are generally recognized as incurred. We utilize an input-based approach (i.e., hours worked) for purposes of measuring performance on these types of contracts. Our input measure is considered a reasonable surrogate for an output measure. In instances when the work performed on fixed price agreements is of relatively short duration, or if we are unable to make reasonably dependable estimates at the outset of the arrangement, we use the completed contract method of accounting whereby revenue is recognized when the work is completed.
Our use of the POC and proportional performance methods of accounting on professional services engagements requires estimates of the total project revenues, total project costs and the expected hours necessary to complete a project. Changes in estimates as a result of additional information or experience on a project as work progresses are inherent characteristics of the POC and proportional performance methods of accounting as we are exposed to various business risks in completing these engagements. The estimation process to support these methods of accounting is more difficult for projects of greater length and/or complexity. The judgments and estimates made in this area could: (i) have a significant effect on revenues recognized in any period by changing the amount and/or the timing of the revenue recognized; and/or (ii) impact the expected profitability of a project, including whether an overall loss on an arrangement has occurred. To mitigate the inherent risks in using the POC and proportional performance methods of accounting, we track our performance on projects and reevaluate the appropriateness of our estimates as part of our monthly accounting cycle.
Software maintenance services revenues are recognized ratably over the service period. Our software maintenance services consist primarily of client and product support, technical updates (e.g., bug fixes, etc.), and unspecified upgrades or enhancements. If specified upgrades or enhancements are offered in an arrangement, which is rare, they are accounted for as a separate element of the arrangement.
Revenues are recognized only if we determine that the collection of the fees included in an arrangement is considered probable (i.e., we expect the client to pay all amounts in full when invoiced). In making our determination of collectibility for revenue recognition purposes, we consider a number of factors depending upon the specific aspects of an arrangement, which may include, but is not limited to, the following items: (i) an assessment of the client’s specific credit worthiness, evidenced by its current financial position and/or recent operating results, credit ratings, and/or a bankruptcy filing status (as applicable); (ii) the client’s current accounts receivable status and/or its historical payment patterns with us (as applicable); (iii) the economic condition of the industry in which the client conducts the majority of its business; and/or (iv) the economic conditions and/or political stability of the country or region in which the client is domiciled and/or conducts the majority of its business. The evaluation of these factors, and the ultimate determination of collectibility, requires significant judgments to be made by us. The judgments made in this area could have a significant effect on revenues recognized in any period by changing the amount and/or the timing of the revenue recognized.
36
Table of Contents
Allowance for Doubtful Accounts Receivable. We maintain an allowance for doubtful accounts receivable based on client-specific allowances, as well as a general allowance. Specific allowances are maintained for clients which are determined to have a high degree of collectibility risk based on such factors, among others, as: (i) the aging of the accounts receivable balance; (ii) the client’s past payment experience; (iii) the economic condition of the industry in which the client conducts the majority of its business; and (iv) a deterioration in a client’s financial condition, evidenced by weak financial position and/or continued poor operating results, reduced credit ratings, and/or a bankruptcy filing. In addition to the specific allowance, we maintain a general allowance for all our accounts receivable which are not covered by a specific allowance. The general allowance is established based on such factors, among others, as: (i) the total balance of the outstanding accounts receivable, including considerations of the aging categories of those accounts receivable; (ii) past history of uncollectible accounts receivable write-offs; and (iii) the overall creditworthiness of the client base. Our credit risk is heightened due to our concentration of clients within the global communications industry, and the fact that a large percentage of our outstanding accounts receivable are further concentrated with our four largest clients. A considerable amount of judgment is required in assessing the realizability of accounts receivable. Should any of the factors considered in determining the adequacy of the overall allowance change significantly, an adjustment to the provision for doubtful account receivables may be necessary. Because of the overall significance of our gross billed account receivables balance ($156.8 million as of December 31, 2010), such an adjustment could be material.
Impairment Assessments of Goodwill and Other Long-Lived Assets.
Goodwill. Goodwill is required to be tested for impairment on an annual basis. We have elected to do our annual test for possible impairment as of July 31 of each year. In addition to this annual requirement, goodwill is required to be evaluated for possible impairment on a periodic basis (e.g., quarterly) if events occur or circumstances change that could indicate a possible impairment may have occurred. Goodwill is considered impaired if the carrying value of the reporting unit which includes the goodwill is greater than the estimated fair value of the reporting unit. If it is determined that an impairment has occurred, an impairment loss (equal to the excess of the carrying value of the goodwill over its estimated fair value) is recorded. As of July 31, 2010, we had goodwill of approximately $108 million, which was assigned to two different reporting units. In each case, the fair value of each reporting unit significantly exceeded its carrying value, and therefore, we concluded there was no impairment of goodwill.
We utilize discounted cash flow models as the primary basis to estimate the fair value amounts used in our goodwill impairment valuation. Our estimates of fair value are based upon various key modeling assumptions such as: (i) projected future sales, which include assumptions around market penetration and growth, and the success of any new product and service offerings; (ii) the profitability of future operations; and (iii) the appropriate discount rate. These assumptions, by their nature, are subject to significant judgments by management of the company, and the subjectivity in determining such assumptions increases as cash flows are modeled further into the future, especially during times of economic uncertainties. The outcome of a discounted cash flow model can be highly sensitive to small changes in one or more of these key assumptions. As a result, small changes to one or more of these assumptions due to such factors as: (i) a significant adverse change in the legal environment or in the business climate; (ii) unanticipated or increased competition; (iii) an unexpected change in strategic direction towards product solutions, or target markets, and (iv) loss of key personnel, could materially affect the determination of fair value which could result in a future impairment of goodwill.
We believe that the assumptions utilized in our discounted cash flow models are reasonable. However, if we do not achieve our near-term or long-term financial or operating goals, and/or the economic downturn becomes more severe, or recovers at a slower pace than anticipated, resulting in additional tightening of client spending and/or further lengthening of client sales cycles, it may require us to modify our assumptions in future periods such that the estimated fair value of one or more of the reporting units is materially changed, which may result in an impairment loss. If a goodwill impairment was to be recorded in the future, it would likely materially impact our results of operations in the period such impairment is recognized, but such an impairment charge would be a non-cash expense, and therefore would have no impact on our cash flows, or on the financial position of our company.
37
Table of Contents
Other Long-lived Assets. Long-lived assets other than goodwill, which for us relates primarily to property and equipment, software, and client contracts, are required to be evaluated for possible impairment whenever events or changes in circumstances indicate that the carrying amount of these assets may not be recoverable. A long-lived asset is impaired if estimated future undiscounted cash flows associated with that asset, without consideration of interest, are insufficient to recover the carrying amount of the long-lived asset. Once deemed impaired, even if by $1, the long-lived asset is written down to its fair value which could be considerably less than the carrying amount or future undiscounted cash flows. The determination of estimated future cash flows and, if required, the determination of the fair value of a long-lived asset, are by their nature, highly subjective judgments. Changes to one or more of the assumptions utilized in such an analysis could materially affect our impairment conclusions for long-lived assets.
We added approximately $101 million of goodwill, $19 million of software intangible assets, and $78 million of customer contracts as part of our allocation of the purchase price to these intangible assets acquired in the Intec Acquisition, which are reflected in our December 31, 2010 Consolidated Balance Sheet. As a result, the criticality of our accounting policy related to impairment assessments of goodwill and other long-lived assets, and the related estimates and judgments utilized in applying that policy, will increase because of the additional complexity and risks in estimating the fair value of these assets going forward into 2011.
Income Taxes. We are required to estimate our income tax liability in each jurisdiction in which we operate, which includes the U.S. (including both Federal and state income taxes) and numerous foreign countries. The criticality of our accounting policies related to income taxes, and the related estimates and judgments utilized in applying those policies, will increase as we expand our operations on a more global basis as a result of the Intec Acquisition.
Various judgments are required in evaluating our income tax positions and determining our provisions for income taxes. During the ordinary course of our business, there are certain transactions and calculations for which the ultimate income tax determination may be uncertain. In addition, we may be subject to examination of our income tax returns by various tax authorities which could result in adverse outcomes. For these reasons, we establish a liability associated with unrecognized tax benefits based on estimates of whether additional taxes and interest may be due. We adjust this liability based upon changing facts and circumstances, such as the closing of a tax audit, the closing of a tax year upon the expiration of a statute of limitations, or the refinement of an estimate. Should any of the factors considered in determining the adequacy of this liability change significantly, an adjustment to the liability may be necessary. Because of the potential significance of these issues, such an adjustment could be material.
Business Combinations and Asset Purchases. Accounting for business combinations and asset purchases, including the allocation of the purchase price to acquired assets and assumed liabilities based on their estimated fair values, requires us in certain circumstances to estimate fair values for items that have no ready market or for which no independent market exists. Under such circumstances, we use our best judgment to determine a fair value based upon inference to other transactions and other data. As a result, the amounts determined by us for such items as accounts receivable, identifiable intangible assets, goodwill, and deferred revenue are not individually the result of an arm’s length transaction, but are the result of management estimates of the fair value and the allocation of the purchase price. Accordingly, revenue recognized by us related to fulfillment of assumed contractual obligations under revenue arrangements is based on fair value estimates made by us.
For larger and/or more complex acquisitions, the assignment of value to individual assets and liabilities generally requires the use of a specialist, such as an appraiser or valuation expert. The assumptions we use in the appraisal or valuation process are forward-looking, and thus are subject to significant judgments and interpretations by us. Because individual assets and liabilities may be: (i) amortized over their estimated useful life (e.g., acquired software); (ii) not amortized at all (e.g., goodwill); and (iii) re-measured to fair value at a future reporting date until the acquisition accounting is finalized and/or a contingency is resolved (e.g., contingent consideration, preliminary measurements of assets or liabilities, etc.), the assigned values could have a material impact on our results of operations in current and future periods.
38
Table of Contents
Detailed Discussion of Results of Operations
Total Revenues. Total revenues for: (i) 2010 increased 9.7% to $549.4 million, from $500.7 million for 2009; and (ii) 2009 increased 6.1% to $500.7 million, from $472.1 million for 2008.
| • | Total revenues for 2010 consisted of $17.8 million coming from the one month of Intec’s operations under our ownership, discussed earlier, and $531.6 million coming from our historical operations. Of the 9.7% year-over-year increase between 2010 and 2009, approximately 6 percentage points can be attributed to the organic growth experienced from our historical operations and approximately 4 percentage points can be attributed to the one month impact of the acquired Intec operations. |
| • | The 6.1% year-over-year increase between 2009 and 2008 can be attributed almost equally between organic growth and growth from acquisitions. |
The components of total revenues are discussed in more detail below.
Processing and Related Services Revenues. Processing and related services revenues for: (i) 2010 increased 7.1% to $497.8 million, from $465.0 million for 2009; and (ii) 2009 increased 5.7% to $465.0 million, from $440.0 million for 2008.
| • | The increase in processing and related services revenues between 2010 and 2009 can almost entirely be attributed to organic growth resulting from the continued adoption and use of our solutions, and conversions of customer accounts onto our solutions during the second half of 2009. Intec’s managed services business provided approximately $3 million of revenue for 2010. |
| • | Approximately 40% of the increase in processing revenues between 2009 and 2008 is related to the year-over-year impact of the acquired DataProse and Quaero businesses (acquired on April 30, 2008, and December 31, 2008, respectively), with the remaining portion attributed to organic growth resulting from continued adoption and use of our solutions, and conversions of customer accounts onto our solutions during the second half of 2009. |
Additional information related to processing revenues is as follows:
| • | Total customer accounts on our outsourced processing solutions as of December 31, 2010, 2009, and 2008, were 48.9 million, 48.6 million, and 45.3 million, respectively. During 2009, we converted approximately 3 million customer accounts onto our solutions from competitor solutions. |
| • | Amortization of the client contracts intangible asset (reflected as a reduction of processing revenues) for 2010, 2009, and 2008, was $6.7 million, $4.5 million, and $9.2 million, respectively. The decrease in amortization from 2008 to 2009 is due to the change in the life of the Comcast client contract intangible asset as a result of the extension of the contractual arrangement with Comcast effective July 1, 2008. |
Software, Maintenance and Services Revenues. Software, maintenance and services revenues for: (i) 2010 increased 44.4% to $51.6 million, from $35.7 million for 2009; and (ii) 2009 increased 11.4% to $35.7 million, from $32.1 million for 2008.
| • | The increase in software, maintenance and services revenue can be almost entirely attributed to the one month of Intec operations included in our 2010 results, as Intec’s business generated approximately $15 million of software, maintenance and services revenues during December 2010. |
| • | The increase in software, maintenance and services revenue between 2009 and 2008 is due to the additional revenues generated in 2009 from the Quaero acquisition (as a portion of Quaero’s revenues fall within the professional services revenues classification). This increase is partially offset by lower professional services in other areas of our business, as a result of the timing and type of work our professional services team have been engaged in (e.g., set-up/implementation efforts which require the fees be deferred upfront and recognized over the life of the services agreement). |
39
Table of Contents
Prior to the Intec acquisition, we generated over 90% of our revenues from processing and related services, with the balance of our total revenues coming from software, maintenance, and professional services. Going forward into 2011, as a result of the Intec Acquisition, we anticipate approximately 70% of our revenues will come from processing and related services (to include Intec’s managed services offerings), and the balance of our revenues coming from software, maintenance and professional services.
Total Operating Expenses. Our operating expenses for: (i) 2010 increased 11.5% to $475.0 million, from $426.0 million for 2009; and (ii) 2009 were $426.0 million, up 11.3% when compared to $382.8 million for 2008.
| • | The $49.0 million increase in total expenses between 2010 and 2009 can be mainly attributed to the following items: |
| • | Total operating expenses for 2010 include one month of Intec operations, or approximately $20 million of expense, which includes $2.0 million of restructuring charges associated with the acquisition. |
| • | During 2010, we incurred $10.2 million of operating expenses related to the Intec Acquisition, which is made up of investment banking, legal, accounting, and other professional services incurred as part of the acquisition. |
| • | During 2010, we incurred $20.5 million of costs related to our data center transition efforts, as compared to $15.5 million during 2009 (a $5.0 million increase). |
| • | The remaining balance of the increase relates primarily to the additional operating expenses needed to support the growth in revenues. |
| • | The $43.2 million increase in total expenses between 2009 and 2008 can be mainly attributed to the following items: |
| • | During 2009, we incurred $15.5 million of costs related to our data center transition efforts, with no comparable amounts in 2008. |
| • | Total operating expense for 2009 include a full year of DataProse and Quaero operations, resulting in an approximately $18 million year-over-year impact. |
| • | The remaining balance of the increase relates primarily to the additional operating expenses needed to support the growth in revenues. |
The components of total expenses are discussed in more detail below.
Cost of Processing and Related Services (Exclusive of Depreciation). The cost of processing and related services revenues consists principally of the following: (i) data processing and network communications costs; (ii) statement production costs (e.g., labor, paper, envelopes, equipment, equipment maintenance, etc.); (iii) client support organizations (e.g., our client support call center, account management, etc.); (iv) various product support organizations (e.g., product management and delivery, product maintenance, etc.); (v) facilities and infrastructure costs related to the statement production and support organizations; and (vi) amortization of acquired client contracts. The costs related to new product development (including significant enhancements to existing products and services) are included in R&D expenses.
The cost of processing and related services for: (i) 2010 increased 3.7% to $258.6 million, from $249.3 million for 2009; and (ii) 2009 increased 10.2% to $249.3 million, from $226.3 million for 2008. Total processing and related services cost of revenues as a percentage of our processing and related services revenues for 2010, 2009, and 2008 were 52.0%, 53.6%, and 51.4%, respectively.
40
Table of Contents
Processing and related services cost, and processing and related services cost as a percentage of our processing and related services revenues, were significantly impacted by our data center transition expenses, which had the following effect (in thousands, except percentages):
| 2010 | 2009 | 2008 | ||||||||||||||||||||||
| Amount | % of Revenues |
Amount | % of Revenues |
Amount | % of Revenues |
|||||||||||||||||||
| Cost of processing and related services revenues, all other |
$ | 240,366 | 48.3 | % | $ | 235,765 | 50.7 | % | $ | 226,343 | 51.4 | % | ||||||||||||
| Data center transition expenses (exclusive of depreciation) |
18,272 | 3.7 | % | 13,570 | 2.9 | % | — | — | ||||||||||||||||
| Cost of processing and related services revenues |
$ | 258,638 | 52.0 | % | $ | 249,335 | 53.6 | % | $ | 226,343 | 51.4 | % | ||||||||||||
Absent the impact of the data center transition expenses, processing and related services cost of revenues as a percentage of our processing and related services revenues would have decreased between years. This decrease is reflective of the scale benefits we have been able to achieve from the increased number of customer accounts on our systems and is also due to the operational and financial benefits that we began to experience during the second quarter of 2010, following the substantial completion of our migration efforts to the new data center location.
Cost of Software, Maintenance and Services (Exclusive of Depreciation). The cost of software, maintenance and services revenues consists principally of the following: (i) client support organizations (e.g., our client support call center, account management, etc.); (ii) various product support organizations (e.g., product management and delivery, product maintenance, etc.); (iii) professional services organization; (iv) facilities and infrastructure costs related to these organizations; (v) third-party software costs and/or royalties related to certain software products; and (vi) amortization of acquired software and acquired client contracts. The costs related to new product development (including significant enhancements to existing products and services) are included in R&D expenses.
The cost of software, maintenance and services for: (i) 2010 increased 18.3% to $31.2 million, from $26.3 million for 2009; and (ii) 2009 increased 38.6% to $26.3 million, from $19.0 million for 2008.
| • | The increase between 2010 and 2009 can be entirely attributed to the one month of Intec operations under our ownership, which contributed approximately $8 million of expense. Excluding the Intec amounts, cost of software maintenance and services for 2010 would have decreased between years as a result of a reallocation of personnel and related costs assigned internally to software maintenance and consulting projects to other projects. |
| • | The increase between 2009 and 2008 is almost entirely attributed to increases in employee-related costs, primarily as a result of the Quaero acquisition. |
Total cost of software, maintenance and services as a percentage of our software, maintenance and services revenues for 2010, 2009, and 2008 were 60.4%, 73.7%, and 59.2%, respectively. As a result of the Intec Acquisition, we expect revenues from software and professional services to increase and become a larger percentage of total revenues. Variability in quarterly revenues and operating results are inherent characteristics of companies that sell software licenses and perform professional services. Our quarterly revenues for software licenses and professional services may fluctuate, depending on various factors, including the timing of executed contracts and revenue recognition, and the delivery of contracted services or products. However, the costs associated with software and professional services revenues are not subject to the same degree of variability (i.e., these costs are generally fixed in nature within a relatively short period of time), and thus, fluctuations in our cost of software, maintenance and services as a percentage of our software, maintenance and services revenues will likely occur between periods.
41
Table of Contents
R&D Expense (Exclusive of Depreciation). R&D expense for: (i) 2010 increased 11.3% to $78.1 million, from $70.1 million for 2009; and (ii) 2009 increased 4.2% to $70.1 million, from $67.3 million for 2008. The increases in R&D expense between years was the result of: (i) an increase in personnel and related costs on R&D projects, as more employees were redirected to R&D efforts during 2010 and 2009, reflective of our increased focus on product development and enhancement efforts; and (ii) one month of Intec development efforts being included in our 2010 amounts. We did not capitalize any software development costs related to our client solutions in 2010, 2009, or 2008.
Over the past few years, our R&D efforts have been focused on the continued evolution of our solutions, both functionally and architecturally, in response to market demands that our solutions have certain functional features and capabilities, as well as architectural flexibilities (such as service oriented architecture, or SOA). This evolution will result in the modularization of certain functionality that historically has been tightly integrated within our solution suite, which will allow us to respond more quickly to required changes to our solutions and provide greater interoperability with other computer systems. Additionally, our R&D efforts include creating an integrated suite of customer interaction management solutions that provide additional customer insight, communications channels, and an enhanced customer experience across all delivery vehicles, whether that be more traditional methods like print or more interactive means like electronic and digital communications. Our customer interaction management solutions are aimed at both of our core cable/DBS market as well as new verticals such as communications, financial services, healthcare, utilities, healthcare, entertainment, content distribution and more.
As a percentage of total revenues, R&D expense for 2010, 2009, and 2008, was 14.2%, 14.0%, and 14.3%, respectively. At this time, we see significant opportunities for investment, in both CSG and Intec assets, to include some near-term product integration efforts to bring Intec’s real-time billing and charging capabilities to our core cable and DBS clients. As a result, we expect our R&D expense as a percentage of our total revenues to increase slightly going into 2011.
Selling, General and Administrative Expense (Exclusive of Depreciation) (“SG&A”). SG&A expense for: (i) 2010 increased 38.8% to $82.6 million, from $59.5 million for 2009; and (ii) 2009 increased 10.5% to $59.5 million, from $53.9 million for 2008.
| • | The increase in SG&A between 2010 and 2009 can be attributed to 2010 amounts including $10.2 million of Intec acquisition-related charges and one month of Intec operations’ SG&A expense. The remainder of the year-over-year increase reflects our increased sales and marketing efforts to expand into other vertical markets. |
| • | The increase in SG&A between 2008 and 2009 reflects the impact of the sales and marketing costs of the acquired Quaero and Dataprose businesses. |
As a percentage of total revenues, SG&A expense for 2010, 2009, and 2008, was 15.0%, of which 1.9% relates to the Intec acquisition-related charges, 11.9%, and 11.4%, respectively. We anticipate our SG&A costs as a percentage of our revenues to increase going into 2011 as a result of the Intec acquisition, as is typical with many global software companies, Intec’s SG&A expenses as a percentage of total revenues are greater than CSG’s historical levels as a domestic outsourced processing company.
Depreciation Expense. Depreciation expense for all property and equipment is reflected separately in the aggregate and is not included in the cost of revenues or the other components of operating expenses. Depreciation expense for 2010, 2009, and 2008, was $22.4 million, $20.1 million, and $16.2 million, respectively. Included in the 2010 and 2009 amounts are $2.2 million and $1.9 million, respectively, of depreciation expense related to our data center transition efforts, discussed earlier. The sequential increases in depreciation expense is reflective of the increased capital expenditures we have made over the last several years (mainly related to statement production equipment, to include our investments in new color print technologies, and computer hardware, software, and related equipment) and the acquired property and equipment from our acquisition activities.
42
Table of Contents
Operating Income. Operating income and operating income margin for: (i) 2010 was $74.3 million, or 13.5% of total revenues, compared to $74.7 million, or 14.9% of total revenues for 2009; and (ii) 2009 was $74.7 million, or 14.9% of total revenues, compared to $89.3 million, or 18.9% of total revenues for 2008. Operating income and operating income margin between years were significantly impacted by the data center transition expenses and Intec acquisition-related charges, which had the following effect on our operating income and operating income margins (in thousands, except percentages):
| 2010 | 2009 | 2008 | ||||||||||||||||||||||
| Amount | % of Revenues |
Amount | % of Revenues |
Amount | % of Revenues |
|||||||||||||||||||
| Operating income, all other |
$ | 107,064 | 19.5 | % | $ | 90,233 | 18.0 | % | $ | 89,299 | 18.9 | % | ||||||||||||
| Data center transition expenses |
20,480 | 3.7 | % | 15,486 | 3.1 | % | — | — | ||||||||||||||||
| Intec acquisition-related charges(1) |
12,242 | 2.2 | % | — | — | — | — | |||||||||||||||||
| Operating income |
$ | 74,342 | 13.5 | % | $ | 74,747 | 14.9 | % | $ | 89,299 | 18.9 | % | ||||||||||||
| (1) | The Intec acquisition-related charges include $10.2 million of costs related primarily to investment banking, legal, accounting, and other professional services and $2.0 million of restructuring costs related to the Intec Acquisition. |
| • | Operating income and operating income margin, absent the impact of the data center transition expenses and the Intec acquisition-related charges, improved between 2010 and 2009 as a result of: |
| • | strong revenue growth; |
| • | the scale benefits that we were able to achieve from the increased number of customer accounts on our systems; |
| • | the operational and financial benefits that we began to experienced following our migration efforts to the new data center location; and |
| • | our continued good expense management. |
| • | Operating income, absent the impact of the data center transition expenses, increased slightly from 2009 to 2008, however, operating income margin decreased 0.9% as a result of the dilutive impact of the acquired DataProse and Quaero businesses. |
Interest Expense and Amortization of Original Issue Discount (“OID”). Our interest expense relates primarily to our 2004 Convertible Debt Securities, our 2010 Convertible Notes, and our Credit Agreement. See Note 6 to our Consolidated Financial Statements for additional discussion of our long-term debt to include the non-cash interest expense related to the amortization of the OID related to our convertible debt.
Gain (Loss) on Repurchase of Convertible Debt Securities. During 2010, we repurchased $145.2 million (par value) of our 2004 Convertible Debt Securities for a total purchase price of $151.0 million. As a result of this transaction, we recognized a non-cash loss on the repurchase of $12.7 million (pretax impact). During 2009, we repurchased $30.0 million (par value) of our 2004 Convertible Debt Securities for a total purchase price of $26.7 million and recognized a non-cash gain of $1.5 million (pretax impact).
Loss on Foreign Currency Transactions. During 2010, we recorded net expense of $14.0 million related to financial instrument transactions and the foreign currency impact of intercompany notes established to structure the Intec Acquisition, discussed earlier in the Intec Acquisition section.
Income Tax Provision. Our effective income tax rates for 2010, 2009, and 2008 were as follows:
| 2010 |
2009 |
2008 | ||
| 33% |
34% | 34% |
43
Table of Contents
Our historical effective tax rate has been at or below the statutory Federal income tax rate due to our consistent generation of research and experimentation credits.
During 2010, we had two unusual income tax matters impact our effective income tax rate.
| • | The Internal Revenue Service (“IRS”) completed their examination of our 2006, 2007, and 2008 Federal income tax returns in the second quarter of 2010. Under current accounting rules, we were required to establish a liability for unrecognized income tax benefits (i.e., income tax reserves) related to the uncertainty in the realization of certain tax credits and incentives over the last several years. The realization uncertainty was due to the complexity of the income tax regulations associated with the tax credits and incentives, and the judgments and estimates involved in calculating the tax credits and incentives claimed. The completion of the IRS examination essentially validated our calculation methodology and assumptions utilized in determining our credit and incentive amounts. Therefore, favorable adjustments to our income tax reserves of approximately $4 million were necessary in accordance with our accounting policies. |
| • | During the fourth quarter, we incurred additional income tax expense of approximately $4 million related to the difference in the book and income tax treatments of certain Intec acquisition-related charges and the loss on foreign currency transactions. |
These two matters essentially offset each other such that the net impact left the overall effective income tax rate for 2010 relatively in-line with the 2009 rate. Going forward into 2011, we expect that our effective income tax rate will increase from our historic levels as a result of the complexities associated with our expanded international operations due to the Intec Acquisition. Additionally, as we work to implement our longer term global tax planning strategy during 2011, we may see some volatility in our quarterly effective income tax rate.
Liquidity
Cash and Liquidity. As of December 31, 2010, our principal sources of liquidity included cash, cash equivalents, and short-term investments of $215.6 million, compared to $198.4 million as of December 31, 2009. We generally invest our excess cash balances in low-risk, short-term investments to limit our exposure to market and credit risks.
As part of the Credit Agreement, we have a five-year, $100 million senior secured revolving loan facility with a syndicate of financial institutions that expires in December 2015 (See Note 6 to the Consolidated Financial Statements). In December 2010, we borrowed $35 million against the revolving loan facility as part of the funding sources for the Intec Acquisition, leaving $65 million of available to us at December 31, 2010. In January 2011, we repaid the $35 million outstanding balance, and as of the date of this filing, there were no borrowings outstanding. The Credit Agreement contains customary affirmative covenants and financial covenants. As of the date of this filing, we believe that we are in compliance with the provisions of the Credit Agreement.
Our cash, cash equivalents, and short-term investment balances as of the end of the indicated periods were located in the following geographical regions (in thousands):
| December 31, 2010 |
December 31, 2009 |
|||||||
| Americas (principally the U.S.) |
$ | 153,674 | $ | 198,377 | ||||
| Europe, Middle East and Africa (principally Europe) |
58,595 | — | ||||||
| Asia Pacific |
3,281 | — | ||||||
| Total cash, equivalents and short-term investments |
$ | 215,550 | $ | 198,377 | ||||
44
Table of Contents
We generally have ready access to substantially all of our cash, cash equivalents, and short-term investment balances, but may face limitations on moving cash out of certain foreign jurisdictions due to currency controls. As of December 31, 2010, the cash and short-term investments subject to such limitations were not significant.
Cash Flows From Operating Activities. We calculate our cash flows from operating activities beginning with net income, adding back the impact of non-cash items or non-operating activity (e.g., depreciation, amortization, amortization of OID, deferred income taxes, stock-based compensation, etc.), and then factoring in the impact of changes in operating assets and liabilities.
Our primary source of cash is from our operating activities. Our current business model consists of a significant amount of recurring revenue sources related to our long-term processing arrangements (mostly billed monthly), and software maintenance agreements (billed monthly, quarterly, or annually). This recurring revenue base provides us with a reliable and predictable source of cash. In addition, software license fees and professional services revenues are sources of cash, but the payment streams for these items are not as predictable.
The primary use of our cash is to fund our operating activities. Slightly over half of our total operating costs relate to labor costs (both employees and contracted labor) for the following: (i) compensation; (ii) related fringe benefits; and (iii) reimbursements for travel and entertainment expenses. The other primary cash requirements for our operating expenses consist of: (i) postage; (ii) data processing and related services and communication lines for our outsourced processing business; (iii) paper, envelopes, and related supplies for our statement processing solutions; (v) hardware and software; and (v) rent and related facility costs. These items are purchased under a variety of both short-term and long-term contractual commitments. A summary of our material contractual obligations is provided below.
See “Cash Flows From Investing Activities” and “Cash Flows From Financing Activities” below for the other primary sources and uses of our cash.
Our 2009 and 2010 consolidated net cash flows from operating activities, broken out between operations and changes in operating assets and liabilities, for the indicated periods are as follows (in thousands):
| Operations | Changes in Operating Assets and Liabilities |
Net Cash Provided by Operating Activities—Totals |
||||||||||
| Cash Flows from Operating Activities: |
||||||||||||
| 2009: |
||||||||||||
| March 31 |
$ | 30,449 | $ | (14,436 | ) | $ | 16,013 | |||||
| June 30 |
29,658 | 13,895 | 43,553 | |||||||||
| September 30 |
30,593 | 7,289 | 37,882 | |||||||||
| December 31 |
24,320 | 31,291 | 55,611 | |||||||||
| Year-to-date total |
$ | 115,020 | $ | 38,039 | $ | 153,059 | ||||||
| 2010: |
||||||||||||
| March 31 |
$ | 27,376 | $ | 3,948 | $ | 31,324 | ||||||
| June 30 |
25,052 | (641 | ) | 24,411 | ||||||||
| September 30 |
27,305 | (8,805 | ) | 18,500 | ||||||||
| December 31 |
32,529 | 14,545 | 47,074 | |||||||||
| Year-to-date total |
$ | 112,262 | $ | 9,047 | $ | 121,309 | ||||||
Our cash flows from operating activities include a negative impact of approximately $11 million for 2010, and approximately $8 million for 2009, related to the costs incurred for our data center transition efforts. As discussed earlier, upon the execution of the Amended Schedule L, DISH is allowed to apply certain of those
45
Table of Contents
advance payments to its first quarter 2011 invoices, and the invoicing of monthly services will revert back to our normal practice of invoicing one month in arrears. As a result, our 2011 cash flows from operating activities will be negatively impacted by approximately $20 million to bring the advance payments and invoicing terms in-line with the terms of the Amended Schedule L.
We believe the above table illustrates our ability to consistently generate strong quarterly and annual cash flows, and the importance of managing our working capital items. As the table above illustrates, the operations portion of our cash flows from operating activities remains relatively consistent between periods. The variations in our net cash provided by operating activities are related mostly to the changes in our operating assets and liabilities related to our operations (related mostly to normal fluctuations in timing at quarter-end for such things as client payments and changes in accrued expenses), and generally over longer periods of time, do not significantly impact our cash flows from operations.
Significant fluctuations in key operating assets and liabilities between 2010 and 2009 that impacted our cash flows from operating activities are as follows:
Billed Trade Accounts Receivable
Management of our billed accounts receivable is one of the primary factors in maintaining strong quarterly cash flows from operating activities. In our legacy customer care and billing operations, our billed trade accounts receivable balance includes billings for several non-revenue items (primarily postage, sales tax, and deferred revenue items). As a result, we evaluate our performance in collecting our accounts receivable through our calculation of days billings outstanding (“DBO”) rather than a typical days sales outstanding (“DSO”) calculation. DBO is calculated based on the billings for the period (including non-revenue items) divided by the average monthly net trade accounts receivable balance for the period. Although the Intec operations do not have all of these non-revenue items, we will continue to use DBO to evaluate our performance in collecting our accounts receivable as we believe this is the appropriate metric in which to evaluate the combined performance.
Our gross and net billed trade accounts receivable and related allowance for doubtful accounts receivable (“Allowance”) as of the end of the indicated quarterly periods, and the related DBOs for the quarters then ended, are as follows (in thousands, except DBOs):
| Quarter Ended |
Gross | Allowance | Net Billed | DBOs | ||||||||||||
| 2009: |
||||||||||||||||
| March 31 |
$ | 133,041 | $ | (2,831 | ) | $ | 130,210 | 58 | ||||||||
| June 30 |
112,612 | (2,148 | ) | 110,464 | 58 | |||||||||||
| September 30 |
114,403 | (2,079 | ) | 112,324 | 54 | |||||||||||
| December 31 |
109,846 | (2,036 | ) | 107,810 | 50 | |||||||||||
| 2010: |
||||||||||||||||
| March 31 |
109,456 | (2,289 | ) | 107,167 | 51 | |||||||||||
| June 30 |
102,523 | (2,130 | ) | 100,393 | 51 | |||||||||||
| September 30 |
115,674 | (2,355 | ) | 113,319 | 50 | |||||||||||
| December 31 |
156,842 | (1,837 | ) | 155,005 | 48 | |||||||||||
The increase in gross and net billed accounts receivable in the fourth quarter of 2010 is due to the Intec acquisition. The other changes in our gross and net billed trade accounts receivable shown in the table above reflect the normal fluctuations in the timing of client payments made at quarter-end, evidenced by our consistent DBO metric over the past several quarters.
As a result of the Intec Acquisition, a greater percentage of our accounts receivable balance as of December 31, 2010, relates to clients outside the U.S. This greater diversity in the geographic composition of our client base is expected to impact our DBO (when compared to our historical experience prior to the Intec Acquisition) as longer billing cycles (i.e., billing terms and cash collection cycles) are an inherent
46
Table of Contents
characteristic of international software and professional services transactions. For example, our ability to bill (i.e., send an invoice) and collect arrangement fees may be dependent upon, among other things: (i) the completion of various client administrative matters, local country billing protocols and processes (including local cultural differences), and/or non-client administrative matters; (ii) us meeting certain contractual invoicing milestones; or (iii) the overall project status in certain situations in which we act as a subcontractor to another vendor on a project.
Income Taxes Payable /Receivable
The $10.0 million of cash flows used in operating activities related to income taxes payable/receivable for 2010, is primarily due to the timing of our estimated Federal and state income tax payments.
Trade Accounts Payable and Accrued Liabilities
Trade accounts payable and accrued liabilities provided $22.3 million of cash flows from operating activities due to increases in: (i) accrued employee compensation; and (ii) other current liabilities, primarily related to accruals related to Intec acquisition-related charges.
Cash Flows From Investing Activities. Our typical investing activities consist of purchases/sales of short-term investments, purchases of property and equipment, and investments in client contracts, which are discussed below. However, as discussed above, during the years presented, we made the following acquisitions, which are included in our cash flows from investing activities: (i) Intec on November 30, 2010; (ii) Quaero on December 31, 2008; and (iii) DataProse on April 30, 2008.
Purchases/Sales of Short-term Investments.
During 2010, 2009, and 2008, we purchased $64.6 million, $57.0 million, and $83.1 million, respectively, and sold or had mature $81.9 million, $79.7 million, and $36.2 million, respectively, of short-term investments. We continually evaluate the possible uses of our excess cash balances and will likely purchase additional short-term investments in the future.
Property and Equipment/Client Contracts.
Our annual capital expenditures for property and equipment, and investments in client contracts were as follows (in thousands):
| 2010 | 2009 | 2008 | ||||||||||
| Property and equipment |
$ | 14,277 | $ | 40,313 | $ | 21,577 | ||||||
| Client contracts |
4,797 | 16,423 | 4,000 | |||||||||
Of the $14 million and $40 million spent on property and equipment during 2010 and 2009, approximately $2 million and $16 million, respectively, were related to various network and computing equipment related to our data center transition efforts. The remaining expenditures consisted principally of: (i) statement production equipment to include our investments in new color print technologies; and (ii) computer hardware, software, and related equipment.
Our investments in client contracts for 2010, 2009, and 2008, relate primarily to: (i) cash incentives provided to clients to convert their customer accounts to, or retain their customer’s accounts on, our customer care and billing systems; and (ii) direct and incremental costs incurred for conversion/set-up services related to long-term processing arrangements where we are required to defer conversion/set-up services fees and recognize those fees as the related processing services are performed. For 2010, 2009, and 2008, our: (i) investments in client contracts related to cash incentives were $2.4 million, $11.5 million, and $2.4 million, respectively; and (ii) the deferral of costs related to conversion/set-up services provided under long-term processing contracts were $2.4 million, $4.9 million, and $1.6 million, respectively.
47
Table of Contents
Cash Flows From Financing Activities. Our financing activities typically consist of various debt-related transactions and activities with our common stock, which are discussed below.
Issuance of Common Stock.
Proceeds from the issuance of common stock for 2010, 2009, and 2008, were $1.4 million, $1.5 million, and $1.2 million, respectively, and relates primarily to employee stock purchase plan purchases.
Repurchase of Common Stock.
During 2010, 2009, and 2008, we repurchased 1.5 million, 250,000 shares and 250,000 shares of our common stock under the guidelines of our Stock Repurchase Program for $29.3 million, $3.8 million, and $4.0 million, respectively. In addition, outside of our Stock Repurchase Program, during 2010, 2009, and 2008, we repurchased from our employees and then cancelled approximately 232,000 shares, 195,000 shares, and 136,000 shares, of our common stock for $4.7 million, $2.8 million, and $1.8 million, respectively, in connection with minimum tax withholding requirements resulting from the vesting of restricted stock under our stock incentive plans.
Long-term debt.
In March 2010, we completed an offering of $150 million of our 2010 Convertible Notes. In connection with the issuance of the convertible notes, we paid deferred financing costs of $5.0 million. We used a portion of the $145 million net proceeds from the offering to repurchase $119.9 million (par value) of our 2004 Convertible Debt Securities for $125.0 million. Additionally, during the remainder of 2010, we repurchased $25.3 million (par value) of our 2004 Convertible Debt Securities for $26.0 million. In 2009, we repurchased $30.0 million (par value) of our 2004 Convertible Debt Securities for $26.7 million.
In December 2010, in conjunction with the closing of the Intec Acquisition, we fully borrowed against the $200 million principal five-year term loan and borrowed $35 million of the $100 million, five-year revolving loan facility. We used the proceeds of the Credit Agreement, along with available corporate funds, to: (i) fund the Intec Acquisition; (ii) pay deferred financing costs of $10.0 million; and (iii) pay $14.0 million for foreign currency transactions related to the Intec Acquisition.
See Note 6 to our Consolidated Financial Statements for additional discussion of our long-term debt.
Contractual Obligations and Other Commercial Commitments and Contingencies
We have various contractual obligations that are recorded as liabilities in our Consolidated Balance Sheet. Other items, such as certain purchase commitments and other executory contracts are not recognized as liabilities in our Consolidated Balance Sheet, but are required to be disclosed.
The following table summarizes our significant contractual obligations and commercial commitments as of December 31, 2010, and the future periods in which such obligations are expected to be settled in cash (in thousands).
| Total | Less than 1 year |
Years 2– 3 | Years 4-5 | More than 5 Years |
||||||||||||||||
| Long-term debt |
$ | 474,414 | $ | 85,837 | $ | 74,564 | $ | 158,763 | $ | 155,250 | ||||||||||
| Capital and operating leases |
66,463 | 21,106 | 23,418 | 11,981 | 9,958 | |||||||||||||||
| Purchase obligations |
186,563 | 52,396 | 76,047 | 58,021 | 99 | |||||||||||||||
| Total |
$ | 727,440 | $ | 159,339 | $ | 174,029 | $ | 228,765 | $ | 165,307 | ||||||||||
48
Table of Contents
Our long-term debt obligations are discussed in more detail in Note 6 to our Consolidated Financial Statements. The contractual obligation amounts reflected for our long-term debt is based upon the following assumptions:
| (i) | our 2004 Convertible Debt Securities are put back to us by the holders at the first put date of June 15, 2011; upon settlement, our cash obligation will not exceed their principal amount; and interest paid through their life is at a rate of 2.5% per annum; |
| (ii) | our 2010 Convertible Notes are outstanding through their maturity date of March 1, 2017; upon settlement, our cash obligation will not exceed their principal amount; and interest paid through their life is at a rate of 3.0% per annum; |
| (iii) | as it relates to our Credit Agreement, we repaid the outstanding balance of $35 million on the revolving loan facility in the first quarter of 2011; we make no more than the mandatory quarterly amortization payments on the term loan; there are no mandatory prepayments required on the term loan; and the interest paid throughout the life of the term loan is based upon the rate applicable as of December 31, 2010. |
The operating leases are discussed in Note 9 to our Consolidated Financial Statements. Our purchase obligations consist primarily of our expected minimum base fees under the Infocrossing service agreement (discussed in Note 9 to our Consolidated Financial Statements), and data communication and business continuity planning services.
Of the total contractual obligations and commercial commitments above, approximately $419 million is reflected on our Consolidated Balance Sheet and approximately $309 million is not.
Off-Balance Sheet Arrangements
None
Capital Resources
The following are the key items to consider in assessing our sources and uses of capital resources:
Current Sources of Capital Resources.
| • | Cash, Cash Equivalents and Short-term Investments. As of December 31, 2010, we had cash, cash equivalents, and short-term investments of $215.6 million. Of the approximately $198 million of cash and cash equivalents as of December 31, 2010, 72%, 14% and 10%, respectively, were denominated in U.S Dollars, Euros and Pounds Sterling, and approximately $5 million was restricted as to use to collateralize outstanding letters of credit. |
| • | Operating Cash Flows. As described in the “Liquidity” section above, we believe we have the ability to consistently generate strong cash flows to fund our operating activities. |
| • | Revolving Loan Facility. We have a five-year, $100 million senior secured revolving loan facility with a syndicate of financial institutions that expires in December 2015. In December 2010, we borrowed $35 million against the revolving loan facility as part of the Intec Acquisition, and in January 2011, we repaid the $35 million outstanding balance. |
Uses of Capital Resources. Below are the key items to consider in assessing our uses of capital resources:
| • | Common Stock Repurchases. We have made significant repurchases of our common stock in the past under our Stock Repurchase Program. During 2010, we repurchased 1.5 million shares of our common stock for $29.3 million (weighted-average price of $19.56 per share). As of December 31, 2010, we have 4.2 million shares authorized for repurchase remaining under our Stock Repurchase Program. Our Credit Agreement places certain limitations on our ability to repurchase our common stock. We continue to evaluate the best use of our capital going forward, which from time-to-time, may include additional share repurchases as market and business conditions warrant. |
49
Table of Contents
| • | Acquisitions. We have made six acquisitions in the last five years. The most recent acquisition, and the only acquisition in 2010, was the Intec Acquisition on November 30, 2010 where we paid cash of approximately $364 million (or $255 million, net of cash acquired), as well as approximately $14 million for foreign currency transaction losses related to the Intec Acquisition, as discussed in Note 2 to our Consolidated Financial Statements. In addition, during 2010, we paid contingent purchase price payments of $4.3 million related to prior year acquisitions. As of December 31, 2010, there were no contingent purchase price payments remaining to be paid. |
| • | Capital Expenditures. In 2010, we spent $14.3 million on capital expenditures, of which approximately $2 million related to the data center transition to Infocrossing. At this time, we expect our 2011 capital expenditures to be approximately $20 to $25 million, which will consist principally of: (i) hardware and software infrastructure to support our clients’ expanding business needs around the world; (ii) statement production equipment to continue to offer enhanced functionalities to our U.S. clients; and (iii) internal use systems to support the integration of Intec. As of December 31, 2010, we have made no significant capital expenditure commitments. |
| • | Investments in Client Contracts. In the past, we have provided incentives to new or existing U.S. processing clients to convert their customer accounts to, or retain their customer’s accounts on, our customer care and billing solutions. During 2010, we made client incentive payments of $2.4 million. In addition, during 2010, we capitalized costs related to the deferral of conversion/set-up services revenue of $2.4 million. As of December 31, 2010, we did not have any material commitments for investments in client contracts which are payable by us only upon the successful conversion of certain additional customer accounts to our processing solutions. |
Long-Term Debt. As of December 31, 2010, our long-term debt consisted of: (i) convertible debt, which is made up of our 2004 Convertible Debt Securities with a par value of $25.1 million, and our 2010 Convertible Notes with a par value of $150.0 million; and (ii) the Credit Agreement borrowings, which are made up of a five-year, $200 million term loan which was fully borrowed as of December 31, 2010, and a five-year $100 million revolving loan facility discussed above, whose $35.0 million outstanding balance as of December 31, 2010 was repaid in January 2011.
During 2010, we voluntarily repurchased a total of $145.2 (par value) of our 2004 Convertible Debt Securities for $151.0 million. As a result of these repurchases, beginning in 2014, we will have to pay cash of approximately $30 million ratably over five years related to the deferred income tax liabilities associated with the repurchased securities.
Our 2004 Convertible Debt Securities are callable by us for cash on or after June 20, 2011, at a redemption price equal to 100% of par value, plus accrued interest. Our 2004 Convertible Debt Securities can be put back to us by the holders for cash at June 15, 2011, at a redemption price equal to 100% of par value, plus accrued interest. Our debt service cash outlay related to the 2004 Convertible Debt Securities during the next twelve months could equal the remaining par value of $25.1 million, plus interest payments of $0.3 million. In addition, if the remaining 2004 Convertible Debt Securities are put back to us on June 15, 2011, we will have to pay in cash during 2011 approximately $6 million of deferred tax liabilities associated with the outstanding securities.
During the next twelve months, there are no scheduled conversion triggers on our 2010 Convertible Notes. As a result, at this time, we expect our required debt service cash outlay during the next twelve months related to the 2010 Convertible Notes to be limited to interest payments of $4.5 million.
Under the Credit Agreement term loan, we will make mandatory annual amortization payments (payable quarterly) equal to $10 million, $20 million, $30 million, $40 million, and $50 million, respectively, in 2011, 2012, 2013, 2014, and 2015, with the remaining principal balance due at the maturity date. Under certain circumstances, mandatory prepayments are required (e.g., as a result of defined excess cash flow, asset sale or casualty proceeds, or proceeds of debt issuances). We have the right to voluntarily prepay any of the borrowings under the Credit Agreement without significant penalty.
Refer to Note 6 to our Financial Statements for further details of our long-term debt.
50
Table of Contents
In summary, we expect to continue to make material investments in client contracts, capital equipment, and R&D, and we expect to continue to evaluate the possibility of early debt repayments and equity repurchases in the future. In addition, as part of our growth strategy, we are continually evaluating potential business and/or asset acquisitions and investments in market share expansion with our existing and potential new clients. We believe that our current cash, cash equivalents and short-term investments balances and our revolving loan facility, together with cash expected to be generated in the future from our current operating activities, will be sufficient to meet our anticipated cash requirements for at least the next 12 months. We also believe we could obtain additional capital through other debt sources which may be available to us if deemed appropriate.
| Item 7A. | Quantitative and Qualitative Disclosures About Market Risk |
Market risk is the potential loss arising from adverse changes in market rates and prices. As of December 31, 2010, we are exposed to various market risks, including changes in interest rates, foreign currency exchange rates, and fluctuations and changes in the market value of our cash equivalents and short-term investments. We have not historically entered into derivatives or other financial instruments for trading or speculative purposes.
Interest Rate Risk.
Market Risk Related to Long-Term Debt. The interest rates on our convertible debt are fixed, and thus, as it relates to our convertible debt borrowings, we are not exposed to changes in interest rates.
The interest rates under the Credit Agreement are based upon an adjusted LIBOR rate plus an applicable margin, or an alternate base rate plus an applicable margin. The Eurocurrency applicable margin for the Term Loan is 3.75% throughout the term of the Credit Agreement and the applicable margin for the Revolver is based on our then-current leverage ratio, which at December 31, 2010 was 3.75%. We have the option of selecting the length of time (ranging from one to six months) that we lock in the LIBOR contract rate, and initially entered into a 3-month LIBOR contract rate of 0.31% per annum (for a combined rate for the Term Loan of 4.06%) that is effective through March 14, 2011. We expect to enter into similar length LIBOR contracts during 2011 as a means to manage our interest rate risk on long-term debt. See Note 6 to our Consolidated Financial Statements for additional information related to our long-term debt.
We are currently evaluating whether we should enter into derivative financial instruments for the purposes of managing our interest rate risk related to our Credit Agreement, but as of the date of this filing, we have not entered into such instruments.
Market Risk Related to Cash Equivalents and Short-term Investments. Our cash and cash equivalents as of December 31, 2010 and 2009 were $197.9 million and $163.5 million, respectively. Certain of our cash balances are “swept” into overnight money market accounts on a daily basis, and at times, any excess funds are invested in low-risk, somewhat longer term, cash equivalent instruments and short-term investments. Our cash equivalents are invested primarily in institutional money market funds, commercial paper, and time deposits held at major banks. We have minimal market risk for our cash and cash equivalents due to the relatively short maturities of the instruments.
Our short-term investments as of December 31, 2010 and 2009 were $17.7 million and $34.9 million, respectively. Currently, we utilize short-term investments as a means to invest our excess cash only in the U.S. The day-to-day management of our short-term investments is performed by a large financial institution in the U.S., using strict and formal investment guidelines approved by our Board of Directors. Under these guidelines, short-term investments are limited to certain acceptable investments with: (i) a maximum maturity, (ii) a maximum concentration and diversification; and (iii) a minimum acceptable credit quality. At this time, we believe we have minimal liquidity risk associated with the short-term investments included in our portfolio.
51
Table of Contents
Foreign Currency Exchange Rate Risk.
As the result of the Intec Acquisition, we are exposed to the impact of the changes in foreign currency exchange rates.
Due to foreign operations around the world, our balance sheet and income statement are exposed to foreign currency exchange risk due to the fluctuations in the value of currencies in which we conduct business. While we attempt to maximize natural hedges by incurring expenses in the same currency in which we contract revenue, the related expenses for that revenue could be in one or more differing currencies than the revenue stream.
Our percentage of total revenues generated outside the U.S. for the year ended December 31, 2010, as determined by contracting legal entity, was approximately 2%. We expect that in the foreseeable future, the percentage of our total revenues to be generated outside the U.S. will grow significantly.
As of December 31, 2010, the carrying amounts of our monetary assets and monetary liabilities on the books of our non-U.S. subsidiaries in currencies denominated in a currency other than the functional currency of those non-U.S. subsidiaries are as follows (in thousands):
| Monetary Liabilities |
Monetary Assets |
|||||||
| Pounds sterling |
$ | — | $ | 481 | ||||
| Euro |
(41 | ) | 5,607 | |||||
| U.S. Dollar |
(472 | ) | 19,061 | |||||
| New Zealand Dollar |
— | 488 | ||||||
| Other |
(13 | ) | 345 | |||||
| Totals |
$ | (526 | ) | $ | 25,982 | |||
We are evaluating whether we should enter into derivative financial instruments for the purposes of managing our foreign currency exchange rate risk, but as of the date of this filing, we have not entered into such instruments. A hypothetical adverse change of 10% in the December 2010 exchange rates would not have had a material impact upon our results of operations.
52
Table of Contents
| Item 8. | Financial Statements and Supplementary Data |
CSG SYSTEMS INTERNATIONAL, INC.
CONSOLIDATED FINANCIAL STATEMENTS
INDEX
53
Table of Contents
Management’s Report on Internal Control Over Financial Reporting
Management of CSG Systems International, Inc. and subsidiaries (the “Company”) is responsible for establishing and maintaining adequate internal control over financial reporting as defined in Rule 13a-15(f) or 15d-15(f) under the Securities Exchange Act of 1934, as amended. The Company’s internal control over financial reporting is designed to provide reasonable assurance regarding the reliability of financial reporting and the preparation of financial statements for external purposes in accordance with U.S. generally accepted accounting principles. The Company’s internal control over financial reporting includes those policies and procedures that:
| (i) | Pertain to the maintenance of records that, in reasonable detail, accurately and fairly reflect the transactions and dispositions of the assets of the Company; |
| (ii) | Provide reasonable assurance that transactions are recorded as necessary to permit preparation of financial statements in accordance with U.S. generally accepted accounting principles, and that receipts and expenditures of the Company are being made only in accordance with authorizations of management and directors of the Company; and |
| (iii) | Provide reasonable assurance regarding prevention or timely detection of unauthorized acquisition, use or disposition of the Company’s assets that could have a material effect on the financial statements. |
Because of its inherent limitations, internal control over financial reporting may not prevent or detect misstatements. Also, projections of any evaluation of effectiveness to future periods are subject to the risk that controls may become inadequate because of changes in conditions, or that the degree of compliance with the policies and procedures may deteriorate.
Management assessed the effectiveness of the Company’s internal control over financial reporting as of December 31, 2010. In making this assessment, management used the criteria set forth by the Committee of Sponsoring Organizations of the Treadway Commission (COSO) in Internal Control-Integrated Framework. We have excluded from our evaluation the internal control over financial reporting of Intec Telecom Systems PLC (Intec), which we acquired on November 30, 2010, as discussed in Note 2 to our Consolidated Financial Statements. At December 31, 2010, Intec had $439.0 million and $332.2 million of total assets and net assets, respectively. For the year ended December 31, 2010, our Consolidated Statement of Income included total revenue associated with Intec of $17.8 million. In accordance with guidance issued by the Securities and Exchange Commission, companies are allowed to exclude acquisitions from their assessment of internal controls over financial reporting during the first year subsequent to the acquisition while integrating the acquired operations.
Based on our assessment, and the exclusion noted in the previous paragraph, management believes that the Company maintained effective internal control over financial reporting as of December 31, 2010.
The Company’s independent registered public accounting firm, KPMG LLP, has issued an attestation report on the effectiveness of the Company’s internal control over financial reporting as of December 31, 2010. That report appears immediately following.
54
Table of Contents
Report of Independent Registered Public Accounting Firm
The Board of Directors and Stockholders
CSG Systems International, Inc.:
We have audited CSG Systems International, Inc.’s internal control over financial reporting as of December 31, 2010, based on criteria established in Internal Control —Integrated Framework issued by the Committee of Sponsoring Organizations of the Treadway Commission (COSO). CSG Systems International Inc.’s management is responsible for maintaining effective internal control over financial reporting and for its assessment of the effectiveness of internal control over financial reporting, included in the accompanying Management’s Report on Internal Control Over Financial Reporting. Our responsibility is to express an opinion on the Company’s internal control over financial reporting based on our audit.
We conducted our audit in accordance with the standards of the Public Company Accounting Oversight Board (United States). Those standards require that we plan and perform the audit to obtain reasonable assurance about whether effective internal control over financial reporting was maintained in all material respects. Our audit included obtaining an understanding of internal control over financial reporting, assessing the risk that a material weakness exists, and testing and evaluating the design and operating effectiveness of internal control based on the assessed risk. Our audit also included performing such other procedures as we considered necessary in the circumstances. We believe that our audit provides a reasonable basis for our opinion.
A company’s internal control over financial reporting is a process designed to provide reasonable assurance regarding the reliability of financial reporting and the preparation of financial statements for external purposes in accordance with generally accepted accounting principles. A company’s internal control over financial reporting includes those policies and procedures that (1) pertain to the maintenance of records that, in reasonable detail, accurately and fairly reflect the transactions and dispositions of the assets of the company; (2) provide reasonable assurance that transactions are recorded as necessary to permit preparation of financial statements in accordance with generally accepted accounting principles, and that receipts and expenditures of the company are being made only in accordance with authorizations of management and directors of the company; and (3) provide reasonable assurance regarding prevention or timely detection of unauthorized acquisition, use, or disposition of the company’s assets that could have a material effect on the financial statements.
Because of its inherent limitations, internal control over financial reporting may not prevent or detect misstatements. Also, projections of any evaluation of effectiveness to future periods are subject to the risk that controls may become inadequate because of changes in conditions, or that the degree of compliance with the policies or procedures may deteriorate.
In our opinion, CSG Systems International, Inc. maintained, in all material respects, effective internal control over financial reporting as of December 31, 2010, based on criteria established in Internal Control —Integrated Framework issued by the Committee of Sponsoring Organizations of the Treadway Commission.
CSG Systems International, Inc. acquired Intec Telecom Systems PLC on November 30, 2010, and management excluded from its assessment of the effectiveness of CSG Systems International, Inc.’s internal control over financial reporting as of December 31, 2010, Intec Telecom Systems PLC’s internal control over financial reporting associated with $439.0 million and $332.2 million of total assets and net assets, respectively, and total revenues of $17.8 million included in the consolidated financial statements of CSG Systems International, Inc. and subsidiaries as of and for the year ended December 31, 2010. Our audit of internal control over financial reporting of CSG Systems International, Inc. also excluded an evaluation of the internal control over financial reporting of Intec Telecom Systems PLC.
We also have audited, in accordance with the standards of the Public Company Accounting Oversight Board (United States), the consolidated balance sheets of CSG Systems International, Inc. and subsidiaries as of December 31, 2010 and 2009, and the related consolidated statements of income, stockholders’ equity and cash flows for each of the years in the three-year period ended December 31, 2010, and our report dated March 8, 2011 expressed an unqualified opinion on those consolidated financial statements.
/s/ KPMG LLP
Denver, Colorado
March 8, 2011
55
Table of Contents
Report of Independent Registered Public Accounting Firm
The Board of Directors and Stockholders
CSG Systems International, Inc.:
We have audited the accompanying consolidated balance sheets of CSG Systems International, Inc. and subsidiaries as of December 31, 2010 and 2009, and the related consolidated statements of income, stockholders’ equity, and cash flows for each of the years in the three-year period ended December 31, 2010. These consolidated financial statements are the responsibility of the Company’s management. Our responsibility is to express an opinion on these consolidated financial statements based on our audits.
We conducted our audits in accordance with the standards of the Public Company Accounting Oversight Board (United States). Those standards require that we plan and perform the audit to obtain reasonable assurance about whether the financial statements are free of material misstatement. An audit includes examining, on a test basis, evidence supporting the amounts and disclosures in the financial statements. An audit also includes assessing the accounting principles used and significant estimates made by management, as well as evaluating the overall financial statement presentation. We believe that our audits provide a reasonable basis for our opinion.
In our opinion, the consolidated financial statements referred to above present fairly, in all material respects, the financial position of CSG Systems International, Inc. and subsidiaries as of December 31, 2010 and 2009, and the results of their operations and their cash flows for each of the years in the three-year period ended December 31, 2010, in conformity with U.S. generally accepted accounting principles.
We also have audited, in accordance with the standards of the Public Company Accounting Oversight Board (United States), CSG Systems International, Inc.’s internal control over financial reporting as of December 31, 2010, based on criteria established in Internal Control—Integrated Framework issued by the Committee of Sponsoring Organizations of the Treadway Commission (COSO), and our report dated March 8, 2011 expressed an unqualified opinion on the effectiveness of the Company’s internal control over financial reporting.
/s/ KPMG LLP
Denver, Colorado
March 8, 2011
56
Table of Contents
CSG SYSTEMS INTERNATIONAL, INC.
CONSOLIDATED BALANCE SHEETS
(in thousands, except share and per share amounts)
| December
31, 2010 |
December
31, 2009 |
|||||||
| ASSETS | ||||||||
| Current assets: |
||||||||
| Cash and cash equivalents |
$ | 197,858 | $ | 163,489 | ||||
| Short-term investments |
17,692 | 34,888 | ||||||
| Total cash, cash equivalents and short-term investments |
215,550 | 198,377 | ||||||
| Trade accounts receivable- |
||||||||
| Billed, net of allowance of $1,837 and $2,036 |
155,005 | 107,810 | ||||||
| Unbilled and other |
30,803 | 9,140 | ||||||
| Deferred income taxes |
13,852 | 16,826 | ||||||
| Income taxes receivable |
9,043 | 2,114 | ||||||
| Other current assets |
17,241 | 9,575 | ||||||
| Total current assets |
441,494 | 343,842 | ||||||
| Property and equipment, net of depreciation of $94,236 and $88,195 |
52,257 | 56,799 | ||||||
| Software, net of amortization of $45,579 and $40,266 |
31,118 | 12,157 | ||||||
| Goodwill |
209,164 | 107,052 | ||||||
| Client contracts, net of amortization of $133,218 and $122,666 |
116,328 | 41,407 | ||||||
| Deferred income taxes |
9,677 | — | ||||||
| Other assets |
19,660 | 4,920 | ||||||
| Total assets |
$ | 879,698 | $ | 566,177 | ||||
| LIABILITIES AND STOCKHOLDERS’ EQUITY | ||||||||
| Current liabilities: |
||||||||
| Current maturities of long-term debt, net of unamortized original issue discount of $621 and zero |
$ | 69,528 | $ | — | ||||
| Client deposits |
31,897 | 29,906 | ||||||
| Trade accounts payable |
25,381 | 26,856 | ||||||
| Accrued employee compensation |
53,372 | 26,598 | ||||||
| Deferred revenue |
56,184 | 26,307 | ||||||
| Income taxes payable |
2,028 | — | ||||||
| Other current liabilities |
32,019 | 9,894 | ||||||
| Total current liabilities |
270,409 | 119,561 | ||||||
| Non-current liabilities: |
||||||||
| Long-term debt, net of unamortized original issue discount of $34,841 and $12,853 |
305,159 | 157,447 | ||||||
| Deferred revenue |
16,103 | 20,498 | ||||||
| Income taxes payable |
954 | 5,889 | ||||||
| Deferred income taxes |
33,247 | 42,198 | ||||||
| Other non-current liabilities |
16,748 | 8,474 | ||||||
| Total non-current liabilities |
372,211 | 234,506 | ||||||
| Total liabilities |
642,620 | 354,067 | ||||||
| Stockholders’ equity: |
||||||||
| Preferred stock, par value $.01 per share; 10,000,000 shares authorized; zero shares issued and outstanding |
— | — | ||||||
| Common stock, par value $.01 per share; 100,000,000 shares authorized; 5,892,315 and 7,566,384 shares reserved for employee stock purchase plan and stock incentive plans; 34,120,789 and 35,125,943 shares outstanding |
641 | 636 | ||||||
| Additional paid-in capital |
439,712 | 408,722 | ||||||
| Treasury stock, at cost, 29,956,808 and 28,456,808 shares |
(704,963 | ) | (675,623 | ) | ||||
| Accumulated other comprehensive income (loss): |
||||||||
| Unrealized gain on short-term investments, net of tax |
4 | 10 | ||||||
| Unrecognized pension plan losses and prior service costs, net of tax |
(897 | ) | (919 | ) | ||||
| Cumulative translation adjustment |
868 | — | ||||||
| Accumulated earnings |
501,713 | 479,284 | ||||||
| Total stockholders’ equity |
237,078 | 212,110 | ||||||
| Total liabilities and stockholders’ equity |
$ | 879,698 | $ | 566,177 | ||||
The accompanying notes are an integral part of these consolidated financial statements.
57
Table of Contents
CSG SYSTEMS INTERNATIONAL, INC.
CONSOLIDATED STATEMENTS OF INCOME
(in thousands, except per share amounts)
| Year Ended December 31, | ||||||||||||
| 2010 | 2009 | 2008 | ||||||||||
| Revenues: |
||||||||||||
| Processing and related services |
$ | 497,775 | $ | 464,970 | $ | 439,975 | ||||||
| Software, maintenance and services |
51,604 | 35,747 | 32,082 | |||||||||
| Total revenues |
549,379 | 500,717 | 472,057 | |||||||||
| Cost of revenues (exclusive of depreciation, shown separately below): |
||||||||||||
| Processing and related services |
258,638 | 249,335 | 226,343 | |||||||||
| Software, maintenance and services |
31,166 | 26,344 | 19,007 | |||||||||
| Total cost of revenues |
289,804 | 275,679 | 245,350 | |||||||||
| Other operating expenses: |
||||||||||||
| Research and development |
78,050 | 70,113 | 67,278 | |||||||||
| Selling, general and administrative |
82,586 | 59,510 | 53,857 | |||||||||
| Depreciation |
22,428 | 20,069 | 16,194 | |||||||||
| Restructuring charges |
2,169 | 599 | 79 | |||||||||
| Total operating expenses |
475,037 | 425,970 | 382,758 | |||||||||
| Operating income |
74,342 | 74,747 | 89,299 | |||||||||
| Other income (expense): |
||||||||||||
| Interest expense |
(6,976 | ) | (5,660 | ) | (7,132 | ) | ||||||
| Amortization of original issue discount |
(6,893 | ) | (8,382 | ) | (9,767 | ) | ||||||
| Interest and investment income, net |
754 | 1,194 | 4,998 | |||||||||
| Gain (loss) on repurchase of convertible debt securities |
(12,714 | ) | 1,468 | 3,351 | ||||||||
| Loss on foreign currency transactions |
(14,023 | ) | — | — | ||||||||
| Other, net |
(817 | ) | 2 | 15 | ||||||||
| Total other |
(40,669 | ) | (11,378 | ) | (8,535 | ) | ||||||
| Income from continuing operations before income taxes |
33,673 | 63,369 | 80,764 | |||||||||
| Income tax provision |
(11,244 | ) | (21,507 | ) | (27,514 | ) | ||||||
| Income from continuing operations |
22,429 | 41,862 | 53,250 | |||||||||
| Discontinued operations: |
||||||||||||
| Income from discontinued operations |
— | — | — | |||||||||
| Income tax benefit |
— | 1,471 | 323 | |||||||||
| Discontinued operations, net of tax |
— | 1,471 | 323 | |||||||||
| Net income |
$ | 22,429 | $ | 43,333 | $ | 53,573 | ||||||
| Basic earnings per common share: |
||||||||||||
| Income from continuing operations |
$ | 0.68 | $ | 1.22 | $ | 1.53 | ||||||
| Discontinued operations, net of tax |
— | 0.04 | 0.01 | |||||||||
| Net income |
$ | 0.68 | $ | 1.26 | $ | 1.54 | ||||||
| Diluted earnings per common share: |
||||||||||||
| Income from continuing operations |
$ | 0.67 | $ | 1.22 | $ | 1.53 | ||||||
| Discontinued operations, net of tax |
— | 0.04 | 0.01 | |||||||||
| Net income |
$ | 0.67 | $ | 1.26 | $ | 1.54 | ||||||
| Weighted-average shares outstanding—Basic: |
||||||||||||
| Common stock |
32,537 | 33,228 | 33,207 | |||||||||
| Participating restricted stock |
543 | 1,097 | 1,602 | |||||||||
| Total |
33,080 | 34,325 | 34,809 | |||||||||
| Weighted-average shares outstanding—Diluted: |
||||||||||||
| Common stock |
32,822 | 33,352 | 33,240 | |||||||||
| Participating restricted stock |
543 | 1,097 | 1,602 | |||||||||
| Total |
33,365 | 34,449 | 34,842 | |||||||||
The accompanying notes are an integral part of these consolidated financial statements.
58
Table of Contents
CSG SYSTEMS INTERNATIONAL, INC.
CONSOLIDATED STATEMENTS OF STOCKHOLDERS’ EQUITY
For the Years Ended December 31, 2010, 2009 and 2008
(in thousands)
| Shares of Common Stock Outstanding |
Common Stock |
Additional Paid-in Capital |
Treasury Stock |
Unrealized Gain (Loss) on Short-Term Investments |
Unrecognized Pension Plan Losses and Prior Service Costs |
Foreign Currency Translation |
Accumulated Earnings |
Total Stockholders’ Equity |
||||||||||||||||||||||||||||
| BALANCE, December 31, 2007 |
34,275 | $ | 622 | $ | 390,986 | $ | (667,858 | ) | $ | 15 | $ | (435 | ) | $ | — | $ | 382,378 | $ | 105,708 | |||||||||||||||||
| Comprehensive income: |
||||||||||||||||||||||||||||||||||||
| Net income |
— | — | — | — | — | — | — | 53,573 | ||||||||||||||||||||||||||||
| Unrealized gain on short-term investments, net of tax |
— | — | — | — | 226 | — | — | — | ||||||||||||||||||||||||||||
| Change in unrecognized pension plan losses, transition amount and prior service costs, net of tax |
— | — | — | — | — | (484 | ) | — | — | |||||||||||||||||||||||||||
| Comprehensive income |
— | — | — | — | — | — | — | — | 53,315 | |||||||||||||||||||||||||||
| Repurchase of common stock pursuant to Board-approved stock repurchase program |
(250 | ) | — | — | (3,983 | ) | — | — | — | — | (3,983 | ) | ||||||||||||||||||||||||
| Issuance of common stock pursuant to employee stock purchase plan |
90 | 1 | 1,101 | — | — | — | — | — | 1,102 | |||||||||||||||||||||||||||
| Exercise of stock options |
5 | — | 74 | — | — | — | — | — | 74 | |||||||||||||||||||||||||||
| Tax benefit of employee stock-based compensation plans |
— | — | (1,274 | ) | — | — | — | — | — | (1,274 | ) | |||||||||||||||||||||||||
| Issuance of restricted common stock pursuant to employee stock-based compensation plans |
815 | 8 | (8 | ) | — | — | — | — | — | — | ||||||||||||||||||||||||||
| Cancellation of restricted common stock issued pursuant to employee stock-based compensation plans |
(79 | ) | (1 | ) | 1 | — | — | — | — | — | — | |||||||||||||||||||||||||
| Repurchase and cancellation of common stock issued pursuant to employee stock-based compensation plans |
(136 | ) | (1 | ) | (1,794 | ) | — | — | — | — | — | (1,795 | ) | |||||||||||||||||||||||
| Repurchase of Convertible Debt Securities |
— | — | (65 | ) | — | — | — | — | — | (65 | ) | |||||||||||||||||||||||||
| Stock-based employee compensation expense |
— | — | 11,605 | — | — | — | — | — | 11,605 | |||||||||||||||||||||||||||
| BALANCE, December 31, 2008 |
34,720 | 629 | 400,626 | (671,841 | ) | 241 | (919 | ) | — | 435,951 | 164,687 | |||||||||||||||||||||||||
| Comprehensive income: |
||||||||||||||||||||||||||||||||||||
| Net income |
— | — | — | — | — | — | — | 43,333 | ||||||||||||||||||||||||||||
| Unrealized loss on short-term investments, net of tax |
— | — | — | — | (231 | ) | — | — | — | |||||||||||||||||||||||||||
| Comprehensive income |
— | — | — | — | — | — | — | — | 43,102 | |||||||||||||||||||||||||||
| Repurchase of common stock pursuant to Board-approved stock repurchase program |
(250 | ) | — | — | (3,782 | ) | — | — | — | — | (3,782 | ) | ||||||||||||||||||||||||
| Issuance of common stock pursuant to employee stock purchase plan |
88 | — | 1,145 | — | — | — | — | — | 1,145 | |||||||||||||||||||||||||||
| Exercise of stock options |
47 | — | 332 | — | — | — | — | — | 332 | |||||||||||||||||||||||||||
| Tax benefit of employee stock-based compensation plans |
— | — | (2,329 | ) | — | — | — | — | — | (2,329 | ) | |||||||||||||||||||||||||
| Issuance of restricted common stock pursuant to employee stock-based compensation plans |
847 | 8 | (8 | ) | — | — | — | — | — | — | ||||||||||||||||||||||||||
| Cancellation of restricted common stock issued pursuant to employee stock-based compensation plans |
(131 | ) | — | — | — | — | — | — | — | — | ||||||||||||||||||||||||||
| Repurchase and cancellation of common stock issued pursuant to employee stock-based compensation plans |
(195 | ) | (1 | ) | (2,779 | ) | — | — | — | — | — | (2,780 | ) | |||||||||||||||||||||||
| Repurchase of Convertible Debt Securities |
— | — | (897 | ) | — | — | — | — | — | (897 | ) | |||||||||||||||||||||||||
| Stock-based employee compensation expense |
— | — | 12,632 | — | — | — | — | — | 12,632 | |||||||||||||||||||||||||||
| BALANCE, December 31, 2009 |
35,126 | 636 | 408,722 | (675,623 | ) | 10 | (919 | ) | — | 479,284 | 212,110 | |||||||||||||||||||||||||
59
Table of Contents
CSG SYSTEMS INTERNATIONAL, INC.
CONSOLIDATED STATEMENTS OF STOCKHOLDERS’ EQUITY—(Continued)
For the Years Ended December 31, 2010, 2009 and 2008
(in thousands)
| Shares of Common Stock Outstanding |
Common Stock |
Additional Paid-in Capital |
Treasury Stock |
Unrealized Gain (Loss) on Short-Term Investments |
Unrecognized Pension Plan Losses and Prior Service Costs |
Foreign Currency Translation |
Accumulated Earnings |
Total Stockholders’ Equity |
||||||||||||||||||||||||||||
| Comprehensive income: |
||||||||||||||||||||||||||||||||||||
| Net income |
— | — | — | — | — | — | — | 22,429 | ||||||||||||||||||||||||||||
| Unrealized loss on short-term investments, net of tax |
— | — | — | — | (6 | ) | — | — | — | |||||||||||||||||||||||||||
| Unrealized pension plan gains and prior service costs, net of tax |
— | — | — | — | — | 22 | — | — | ||||||||||||||||||||||||||||
| Foreign currency translation adjustments |
— | — | — | — | — | — | 868 | — | ||||||||||||||||||||||||||||
| Comprehensive income |
— | — | — | — | — | — | — | — | 23,313 | |||||||||||||||||||||||||||
| Repurchase of common stock pursuant to Board-approved stock repurchase program |
(1,500 | ) | — | — | (29,340 | ) | — | — | — | — | (29,340 | ) | ||||||||||||||||||||||||
| Issuance of common stock pursuant to employee stock purchase plan |
70 | — | 1,172 | — | — | — | — | — | 1,172 | |||||||||||||||||||||||||||
| Exercise of stock options |
19 | — | 233 | — | — | — | — | — | 233 | |||||||||||||||||||||||||||
| Tax benefit of employee stock-based compensation plans |
— | — | 627 | — | — | — | — | — | 627 | |||||||||||||||||||||||||||
| Issuance of restricted common stock pursuant to employee stock-based compensation plans |
748 | 8 | (8 | ) | — | — | — | — | — | — | ||||||||||||||||||||||||||
| Cancellation of restricted common stock issued pursuant to employee stock-based compensation plans |
(109 | ) | (2 | ) | 2 | — | — | — | — | — | — | |||||||||||||||||||||||||
| Repurchase and cancellation of common stock issued pursuant to employee stock-based compensation plans |
(233 | ) | (1 | ) | (4,689 | ) | — | — | — | — | — | (4,690 | ) | |||||||||||||||||||||||
| Repurchase of Convertible Debt Securities |
— | — | (1,613 | ) | — | — | — | — | — | (1,613 | ) | |||||||||||||||||||||||||
| Issuance of 2010 Convertible Notes, net of tax |
— | — | 22,928 | — | — | — | — | — | 22,928 | |||||||||||||||||||||||||||
| Stock-based employee compensation expense |
— | — | 12,338 | — | — | — | — | — | 12,338 | |||||||||||||||||||||||||||
| BALANCE, December 31, 2010 |
34,121 | $ | 641 | $ | 439,712 | $ | (704,963 | ) | $ | 4 | $ | (897 | ) | $ | 868 | $ | 501,713 | $ | 237,078 | |||||||||||||||||
The accompanying notes are an integral part of these consolidated financial statements.
60
Table of Contents
CSG SYSTEMS INTERNATIONAL, INC.
CONSOLIDATED STATEMENTS OF CASH FLOWS
(in thousands)
| Year Ended December 31, | ||||||||||||
| 2010 | 2009 | 2008 | ||||||||||
| Cash flows from operating activities: |
||||||||||||
| Net income |
$ | 22,429 | $ | 43,333 | $ | 53,573 | ||||||
| Adjustments to reconcile net income to net cash provided by operating activities- |
||||||||||||
| Depreciation |
22,428 | 20,069 | 16,194 | |||||||||
| Amortization |
19,438 | 14,325 | 16,544 | |||||||||
| Amortization of original issue discount |
6,893 | 8,382 | 9,767 | |||||||||
| Gain on short-term investments and other |
(129 | ) | (600 | ) | (1,813 | ) | ||||||
| (Gain) loss on repurchase of convertible debt securities |
12,714 | (1,468 | ) | (3,351 | ) | |||||||
| Loss on foreign currency transactions |
14,023 | — | — | |||||||||
| Deferred income taxes |
3,275 | 18,492 | 12,480 | |||||||||
| Excess tax benefit of stock-based compensation awards |
(1,147 | ) | (145 | ) | (238 | ) | ||||||
| Stock-based employee compensation |
12,338 | 12,632 | 11,605 | |||||||||
| Changes in operating assets and liabilities, net of acquired amounts: |
||||||||||||
| Trade accounts and other receivables, net |
(4,295 | ) | 12,550 | (1,772 | ) | |||||||
| Other current and non-current assets |
(509 | ) | (1,053 | ) | 1,729 | |||||||
| Income taxes payable/receivable |
(9,971 | ) | (7,927 | ) | 5,369 | |||||||
| Trade accounts payable and accrued liabilities |
22,288 | 9,311 | 934 | |||||||||
| Deferred revenue |
1,534 | 25,158 | (6,374 | ) | ||||||||
| Net cash provided by operating activities |
121,309 | 153,059 | 114,647 | |||||||||
| Cash flows from investing activities: |
||||||||||||
| Purchases of property and equipment |
(14,277 | ) | (40,313 | ) | (21,577 | ) | ||||||
| Purchases of short-term investments |
(64,583 | ) | (57,036 | ) | (83,093 | ) | ||||||
| Proceeds from sale/maturity of short-term investments |
81,900 | 79,700 | 36,245 | |||||||||
| Net proceeds from foreign currency option |
582 | — | — | |||||||||
| Payments for acquisition-related foreign currency transactions |
(14,605 | ) | — | — | ||||||||
| Acquisition of businesses, net of cash acquired |
(259,502 | ) | (6,738 | ) | (54,446 | ) | ||||||
| Acquisition of and investments in client contracts |
(4,797 | ) | (16,423 | ) | (4,000 | ) | ||||||
| Net cash used in investing activities |
(275,282 | ) | (40,810 | ) | (126,871 | ) | ||||||
| Cash flows from financing activities: |
||||||||||||
| Proceeds from issuance of common stock |
1,405 | 1,477 | 1,175 | |||||||||
| Repurchase of common stock |
(34,030 | ) | (6,562 | ) | (5,777 | ) | ||||||
| Payments on acquired equipment financing |
(1,157 | ) | (992 | ) | (589 | ) | ||||||
| Proceeds from long-term debt |
385,000 | — | — | |||||||||
| Repurchase of convertible debt securities |
(150,958 | ) | (26,714 | ) | (22,353 | ) | ||||||
| Payments of deferred financing costs |
(14,999 | ) | — | — | ||||||||
| Excess tax benefit of stock-based compensation awards |
1,147 | 145 | 238 | |||||||||
| Net cash provided by (used in) financing activities |
186,408 | (32,646 | ) | (27,306 | ) | |||||||
| Effect of exchange rate fluctuations on cash |
1,934 | — | — | |||||||||
| Net increase (decrease) in cash and cash equivalents |
34,369 | 79,603 | (39,530 | ) | ||||||||
| Cash and cash equivalents, beginning of period |
163,489 | 83,886 | 123,416 | |||||||||
| Cash and cash equivalents, end of period |
$ | 197,858 | $ | 163,489 | $ | 83,886 | ||||||
| Supplemental disclosures of cash flow information: |
||||||||||||
| Cash paid during the period for- |
||||||||||||
| Interest |
$ | 4,345 | $ | 4,715 | $ | 6,231 | ||||||
| Income taxes |
17,869 | 9,463 | 9,483 | |||||||||
The accompanying notes are an integral part of these consolidated financial statements.
61
Table of Contents
NOTES TO CONSOLIDATED FINANCIAL STATEMENTS
1. General
CSG Systems International, Inc. (the “Company”, “CSG”, or forms of the pronoun “we”), a Delaware corporation, was formed in October 1994 and is based in Englewood, Colorado. Our heritage is in providing outsourced customer care and billing solutions to the North American cable and direct broadcast satellite (“DBS”) markets. Our solutions help service providers manage the customer experience from acquisition through the billing of their customers. Our broad suite of solutions help our clients improve their profitability by creating more compelling product offerings and an enhanced customer experience through more relevant and targeted interactions, while at the same time, minimizing the service provider’s cost structure.
Most recently, our business was focused on the North American market, however, on November 30, 2010, we completed our acquisition of U.K.-based Intec Telecom Systems PLC (“Intec”). Intec is a recognized global business support systems (“BSS”) leader for retail billing, mediation, and wholesale business management, serving the majority of the world’s top 100 communications service providers. With the acquisition, we believe we are well-positioned to: (i) evolve our offerings; (ii) expand the markets we serve; and (iii) reach greater economic scale. We are a S&P SmallCap 600 company.
The accompanying Consolidated Financial Statements are prepared in conformity with accounting principles generally accepted in the United States (“U.S.”).
2. Intec Acquisition
Description of the Acquisition. On September 24, 2010, we issued an announcement pursuant to Rule 2.5 of the U.K. City Code on Takeovers and Mergers, announcing our intention to make an offer to acquire 100% of the issued and to be issued shares of Intec in an all-cash transaction of 72 pence per Intec share (the “Intec Acquisition”).
Intec is a leading provider of mediation, wholesale, and retail billing solutions, serving 60 of the world’s top 100 telecom providers and over 400 clients worldwide. Over 90% of Intec’s revenues are generated from telecommunications providers. Intec provides product software, associated professional services and maintenance services to its clients.
On November 3, 2010, Intec’s Board of Directors announced that, at the court meeting and general meeting of eligible Intec shareholders, Intec shareholders voted to approve, by the necessary majorities, the transaction and other associated matters to implement the acquisition of Intec. On November 29, 2010, the transaction was sanctioned and the capital reduction was confirmed by the court. On November 30, 2010, the documents to finalize the transaction were filed and the transaction became effective.
We acquired Intec to: (i) evolve our offerings; (ii) expand the markets we serve; and (iii) reach greater economic scale.
Purchase Price. The purchase price for the Intec Acquisition was approximately £234 million, or approximately $364 million, based upon the average exchange rate of 1.56:1.00 between the U.S. dollar and the pound sterling as of November 30, 2010, the date the total purchase price was established under U.S. GAAP.
In September 2010, we entered into a pound sterling call/U.S. dollar put (the “Currency Option”) at a strike price of 1.62 in conjunction with the Intec Acquisition to limit our exposure to adverse movements in the exchange rate between the two currencies leading up to the expected closing date. Upon the approval of the acquisition by Intec’s shareholders in November 2010, we sold the Currency Option, and entered into a forward contract for the delivery of approximately 240 million pounds sterling (which included estimated Intec Acquisition costs at that time) at an exchange rate of approximately 1.61 (the “Currency Forward”). During December 2010, as part of the
62
Table of Contents
NOTES TO CONSOLIDATED FINANCIAL STATEMENTS—(Continued)
payment process for the pound sterling purchase price, we closed out our position in the Currency Forward at an average rate of 1.58. Under U.S. GAAP, the costs and proceeds (including gains and losses) from financial instruments that are used to reduce the risks of a change in the value of the acquiree’s net assets or the consideration to be issued by the acquirer before the date of acquisition, are not part of the consideration transferred, or purchase price, and should be recorded currently in earnings. As a result, for the year ended December 31, 2010, we recorded net expense of approximately $14 million related to these financial instrument transactions, and the foreign currency impact of intercompany notes established to structure the Intec Acquisition, which we reflected in Other income (expense) in our Consolidated Statement of Income.
Allocation of Purchase Price. The Intec Acquisition purchase price was $364.1 million, or $255.2 million net of $108.9 million of cash and cash equivalents Intec had on hand at the close of the transaction. The application of the acquisition method of accounting for business combinations requires the use of significant estimates and assumptions in the determination of the fair value of assets acquired and liabilities assumed. The following table summarizes the estimated fair values of the assets acquired and liabilities assumed at the date of acquisition for Intec (in thousands):
| Trade accounts receivable |
$ | 64,397 | ||
| Other current assets |
6,179 | |||
| Property and equipment |
9,968 | |||
| Acquired software |
19,184 | |||
| Acquired client contracts |
77,979 | |||
| Acquired other intangible assets |
6,395 | |||
| Goodwill |
101,095 | |||
| Net deferred income tax assets |
31,764 | |||
| Other non-current assets |
2,552 | |||
| Total assets acquired |
319,513 | |||
| Trade accounts payable |
3,611 | |||
| Accrued employee compensation |
18,105 | |||
| Deferred revenue |
23,784 | |||
| Other current liabilities |
9,366 | |||
| Non-current liabilities |
9,409 | |||
| Total liabilities assumed |
64,275 | |||
| Net assets acquired (excluding acquired cash) |
$ | 255,238 | ||
The above estimated fair values of assets acquired and liabilities assumed are considered provisional and are based on the information that was available as of the date of the Intec Acquisition to estimate the fair value of assets acquired and liabilities assumed. We believe that information provides a reasonable basis for estimating the fair values of assets acquired and liabilities assumed, but we are waiting for additional information, primarily related to estimated values of certain items within trade accounts receivable, deferred revenue, and to estimated values of certain net deferred income tax assets, necessary to finalize those fair values. Thus the provisional measurements of fair value set forth above are subject to change. Such changes could be significant. We expect to finalize the valuation and complete the purchase price allocation as soon as practicable, but not later than one-year from the acquisition date.
Trade accounts receivable consists of billed and unbilled accounts receivable, which are reduced to reflect an estimate for uncollectible amounts. Property and equipment consists primarily of computer equipment, furniture and equipment, and leasehold improvements. The property and equipment are being depreciated on a straight-line basis, over periods ranging from 3 to 7 years.
63
Table of Contents
NOTES TO CONSOLIDATED FINANCIAL STATEMENTS—(Continued)
The acquired software intangible assets represent the estimated value of the three primary technology products of Intec: Singl.eView, TSM Solution and InterconnecT. The acquired client contracts intangible assets represent the estimated value of the customer relationships related to three of Intec’s main sources of revenue: maintenance, software licenses and managed services. Acquired other intangible assets represent the estimated fair value of the Intec trademark and the trademarks for Singl.eView, TSM Solution and InterconnecT. The acquired software intangible assets and the acquired client contract intangible assets are being amortized over 10 years based on the approximate pattern in which the economic benefits of the acquired intangible assets are expected to be realized. The acquired other intangible assets are being amortized over five years based on the approximate pattern in which the economic benefits of the acquired intangible assets are expected to be realized.
Goodwill, representing the excess of the purchase price for Intec over the net amounts assigned to identifiable assets acquired and liabilities assumed and consisting largely of the benefits from combining our operations and Intec’s operations, has been assigned to our one reportable segment. The Intec goodwill and acquired intangible assets are not deductible for income tax purposes. In accordance with generally accepted accounting principles, we have recognized deferred tax liabilities of $31.6 million for the difference between the assigned book values and the tax bases of the acquired intangible assets, but have not recognized deferred tax liabilities for the difference between the assigned book value and the tax basis of goodwill. Included in Intec’s net assets acquired are deferred income tax assets of $14.2 million related to Federal net operating loss (“NOL”) carryforwards of $40.7 million, which we believe are more likely than not to be realized. The Intec Federal NOL carryforward begins to expire in 2019.
The accrued employee compensation amount represents employee-related liabilities, which includes payroll tax, accrued vacation and bonus accruals. The deferred revenue amounts represent the estimated fair value of the obligations we assumed at the acquisition date to complete contracts related to professional services, software maintenance, and managed services.
Acquisition Financing. We financed the Intec Acquisition by borrowing against a new credit agreement that consists of a $200 million, five-year term loan and a $100 million, five-year revolving loan facility that we entered into on September 24, 2010 and amended on November 24, 2010 as part of this transaction; with the remaining purchase price satisfied by using our existing cash. See Note 6 for further information regarding our new credit agreement.
Financing and Other Acquisition-Related Expenses. In conjunction with our new credit agreement, we incurred debt issuance costs of approximately $10 million. These costs are being amortized to interest expense over the lives of the term loan and revolving loan facility components of the new credit agreement. The unamortized deferred financing costs balance is reflected in Other assets in our Consolidated Balance Sheet.
In addition to the loss on foreign currency transactions of approximately $14 million discussed above, through December 31, 2010, we incurred certain direct and incremental acquisition-related costs, totaling approximately $10 million, related primarily to investment banking, legal, accounting, and other professional services. We have reflected these costs in the Selling, general and administrative expenses in our Consolidated Statement of Income.
Unaudited Pro Forma Information. From December 1, 2010 through December 31, 2010, Intec contributed net revenues of $17.8 million and incurred $19.6 million of operating expenses, which includes approximately $2 million of restructuring charges associated with the acquisition. The following supplemental unaudited pro forma summary presents our results of operations for the years ended December 31, 2010 and 2009, assuming the acquisition of Intec had been completed as of the beginning of each year, is presented in the table below (in thousands, except for per share amounts). These amounts were calculated after conversion to U.S. GAAP, applying our accounting policies, and adjusting Intec’s results to reflect the additional amortization expense that would have been charged assuming the fair value adjustments to the acquired intangible assets had been applied as of the beginning of each year, together with the consequential tax effects. These adjustments also reflect the
64
Table of Contents
NOTES TO CONSOLIDATED FINANCIAL STATEMENTS—(Continued)
additional interest expense incurred on the debt to finance the purchase. This supplemental pro forma information has been prepared for comparative purposes and does not purport to be indicative of what would have occurred had the Intec Acquisition been completed on January 1, 2009 or January 1, 2010, nor are they indicative of any future results.
| (Unaudited) Year Ended December 31, |
||||||||
| 2010 | 2009 | |||||||
| Total revenues |
$ | 751,175 | $ | 760,617 | ||||
| Net income |
19,373 | 80,933 | ||||||
| Diluted net income per common share: |
||||||||
| Income from continuing operations |
$ | 0.58 | $ | 2.35 | ||||
| Weighted average common shares |
33,365 | 34,449 | ||||||
The pro forma information for the year ended December 31, 2010, combines our results for the year ended December 31, 2010 (without the one month impact of Intec), and Intec’s results for the year ended September 30, 2010 (with September 30 being the last day of Intec’s fiscal year). The pro forma information for the year ended December 31, 2009, combines our results for the year ended December 31, 2009, and Intec’s results for its fiscal year ended September 30, 2009.
The Intec acquisition-related expenses of approximately $10 million and the loss on foreign currency transactions of approximately $14 million discussed above have been excluded from the pro forma results. The pro forma adjustments related to income tax expense have been recorded for the impact of the pro forma adjustments at the statutory rates in effect during the periods presented.
3. Summary of Significant Accounting Policies
Principles of Consolidation. The accompanying Consolidated Financial Statements include all of our accounts and our subsidiaries’ accounts. All material intercompany accounts and transactions have been eliminated.
Translation of Foreign Currency. Our foreign subsidiaries use as their functional currency the local currency of the countries in which they operate. Their assets and liabilities are translated into United States of America (“U.S.”) dollars at the exchange rates in effect at the balance sheet date. Revenues, expenses, and cash flows are translated at the average rates of exchange prevailing during the period. Translation gains and losses are included in comprehensive income (loss) in stockholders’ equity. Transaction gains and losses are included in the determination of net income (loss).
Use of Estimates in Preparation of Consolidated Financial Statements. The preparation of the accompanying Consolidated Financial Statements requires management to make estimates and assumptions that affect the reported amounts of assets and liabilities and disclosure of contingent assets and liabilities at the date of the financial statements and the reported amounts of revenues and expenses during the reporting period. Actual results could differ from those estimates. The more critical estimates and related assumptions that affect our financial position and results of operations are in the areas of: (i) revenue recognition; (ii) allowance for doubtful accounts receivable; (iii) impairment assessments of goodwill and other long-lived assets; (iv) income taxes; and (v) business combinations and asset purchases.
Revenue Recognition. We use various judgments and estimates in connection with the determination of the amount of revenues to be recognized in each accounting period. Our primary revenue recognition criteria include: (i) persuasive evidence of an arrangement; (ii) delivery; (iii) fixed or determinable fees; and (iv) collectibility of fees.
65
Table of Contents
NOTES TO CONSOLIDATED FINANCIAL STATEMENTS—(Continued)
Processing and Related Services.
We have historically derived a significant percentage of our total revenues from processing and related services from our outsourced customer care and billing application, called ACP, and services ancillary to ACP. About 10% of Intec’s total revenues for its fiscal year ended September 30, 2010 came from managed services contracts, which generally have delivery characteristics similar to our outsourced ACP processing services. Under managed services contracts, we operate certain of our software products on behalf of our clients: (i) out of a client’s data center; (ii) out of a data center we own and operate; or (iii) out of a third-party data center we contract with for such services. Hereafter in these Notes to Consolidated Financial Statements, we collectively refer to our historical processing and related services revenues, and Intec’s managed services revenues, as processing and related services revenues. We expect to continue to generate a significant percentage of our total revenues from processing and related services going forward, but do expect that processing and related services revenues as a percentage of our total revenues will decline in the future from our historical levels, as Intec derives a large percentage of its revenues from software licenses, professional services, and software maintenance.
For multiple-element revenue arrangements that do not fall within the scope of specific authoritative accounting literature, such as our processing and related services agreements, we evaluate all deliverables in the arrangement to determine whether they represent separate units of accounting. Deliverables are generally accounted for as separate units of accounting if the following criteria are met: (i) the delivered item(s) have standalone value to the customer; and (ii) there is objective and reliable evidence of fair value of the undelivered items(s). The best evidence of objective and reliable evidence of fair value is entity-specific or vendor-specific evidence (“VSOE”) of fair value, or third-party evidence (“TPE”) of fair value. If the deliverables qualify as separate units of accounting, the arrangement consideration is allocated among the separate units of accounting based upon their relative fair values, and applicable revenue recognition criteria are considered for the separate units of accounting. If the deliverables do not qualify as separate units of accounting, the consideration allocable to delivered items is combined with the consideration allocable to the undelivered items, and the appropriate recognition of revenue is then determined for those combined deliverables as a single unit of accounting. The determination of separate units of accounting, and the determination of objective and reliable evidence of fair value of the undelivered items, if applicable, both require judgments to be made by us.
For our processing and related services, we have generally concluded that the multiple deliverables present in the agreements do not qualify as separate units of accounting, and thus have treated the deliverables as a single unit of accounting, with the revenue recognized somewhat ratably over the term of the processing agreement. Processing fees are typically billed monthly based on the number of client customers served or on a fixed monthly fee basis; ancillary services are typically billed on a per transaction basis; and customized print and mail services and other customer interaction services are billed on a usage basis. Fees received to convert, set-up, and/or implement clients on our outsourced solutions under long-term processing contracts (as well as the costs to perform the conversion, set-up or implementation services) are deferred and recognized over the term of the client’s processing agreement.
Effective January 1, 2011, the criteria that must be met to separate deliverables in multiple element revenue arrangements changed. The requirement to have either VSOE or TPE of fair value for undelivered items to account for deliverables as separate units of accounting has been eliminated. If VSOE or TPE of fair value does not exist for the undelivered items, we must use estimated selling price. We do not expect this rule change to have a material impact in the timing of our processing and related services revenue recognition.
Software Licenses, Professional Services and Maintenance Services.
Our more recent historical revenues related to software licenses, maintenance services (also known as post-contract customer support, or PCS) and professional services have been substantially less than those generated from processing and related services. As a result of the Intec Acquisition, we expect that software, maintenance and services revenues as a percentage of our total revenues to increase going forward.
66
Table of Contents
NOTES TO CONSOLIDATED FINANCIAL STATEMENTS—(Continued)
Software arrangements fall within the scope of specific authoritative accounting literature. The accounting for software arrangements, especially when software is sold in a multiple-element revenue arrangement, is complex and requires considerable judgment. Key factors considered in accounting for software and related services include the following: (i) the identification of the separate elements of the arrangement; (ii) the determination of whether any undelivered elements are essential to the functionality of the delivered elements; (iii) the assessment of whether the software, if hosted, should be accounted for as a services arrangement and thus outside the scope of the software revenue recognition literature; (iv) the determination of VSOE of fair value for the various undelivered elements of the arrangement; (v) the assessment of whether the software fees are fixed or determinable; (vi) the determination as to whether the fees are considered collectible; and (vii) the assessment of whether services included in the arrangement represent significant production, customization or modification of the software. The evaluation of these factors, and the ultimate revenue recognition decision, requires significant judgments to be made by us. The judgments made in this area could have a significant effect on revenues recognized in any period by changing the amount and/or the timing of the revenue recognized. In addition, because software licenses typically have little or no direct, incremental costs related to the recognition of the revenue, these judgments could also have a significant effect on our results of operations.
Our more recent historical professional services revenues have generally consisted of software implementation projects with a relatively short duration period, and business consulting services related to the use of our solutions. These revenues were generally recognized as the installation or consulting work was performed. As a result of the Intec Acquisition, we expect that a large percentage of our professional services engagements will now include software implementation services of a greater project length and complexity that will represent significant production, customization or modification of the software, and/or will be considered essential to the functionality of the software being licensed, and thus will be accounted for using the percentage of completion (POC) method of accounting. Under the POC method of accounting, software license and professional services revenues are typically recognized as the professional services related to the software implementation project are performed. We are using hours performed on the project as the measure to determine the percentage of the work completed.
A portion of our professional services revenues do not include an element of software delivery (e.g., business consulting services, etc.), and thus, do not fall within the scope of specific authoritative accounting literature for software arrangements. In these cases, revenues from fixed-price, professional service contracts are recognized using a method consistent with the proportional performance method, which is relatively consistent with our POC methodology mentioned directly above. Under a proportional performance model, revenue is recognized by allocating revenue between reporting periods based on relative service provided in each reporting period, and costs are generally recognized as incurred. We utilize an input-based approach (i.e., hours worked) for purposes of measuring performance on these types of contracts. Our input measure is considered a reasonable surrogate for an output measure. In instances when the work performed on fixed price agreements is of relatively short duration, or if we are unable to make reasonably dependable estimates at the outset of the arrangement, we use the completed contract method of accounting whereby revenue is recognized when the work is completed.
Our use of the POC and proportional performance methods of accounting on professional services engagements requires estimates of the total project revenues, total project costs and the expected hours necessary to complete a project. Changes in estimates as a result of additional information or experience on a project as work progresses are inherent characteristics of the POC and proportional performance methods of accounting as we are exposed to various business risks in completing these engagements. The estimation process to support these methods of accounting is more difficult for projects of greater length and/or complexity. The judgments and estimates made in this area could: (i) have a significant effect on revenues recognized in any period by changing the amount and/or the timing of the revenue recognized; and/or (ii) impact the expected profitability of a project, including whether an overall loss on an arrangement has occurred. To mitigate the inherent risks in using the POC and proportional performance methods of accounting, we track our performance on projects and reevaluate the appropriateness of our estimates as part of our monthly accounting cycle.
67
Table of Contents
NOTES TO CONSOLIDATED FINANCIAL STATEMENTS—(Continued)
Revenues from professional services contracts billed on a time-and-materials basis are recognized as the services are performed and as amounts due from clients are deemed collectible and contractually non-refundable.
Software maintenance services revenues are recognized ratably over the service period. Our software maintenance services consist primarily of client and product support, technical updates (e.g., bug fixes, etc.), and unspecified upgrades or enhancements. If specified upgrades or enhancements are offered in an arrangement, which is rare, they are accounted for as a separate element of the arrangement.
Deferred Revenue and Unbilled Accounts Receivable. Client payments and billed amounts due from clients in excess of revenue recognized are recorded as deferred revenue. Deferred revenue amounts expected to be recognized within the next twelve months are classified as current liabilities. Revenue recognized prior to the scheduled billing date is recorded as unbilled accounts receivable. Deferred revenue and unbilled accounts receivable balances increased significantly from December 31, 2009 to December 31, 2010, as a result of the Intec Acquisition.
Postage. We pass through to our processing clients the cost of postage that is incurred on behalf of those clients, and typically require an advance payment on expected postage costs. These advance payments are included in “client deposits” in the accompanying Consolidated Balance Sheets, and are classified as current liabilities regardless of the contract period. We net the cost of postage against the postage reimbursements, and include the net amount in processing and related services revenues. The cost of postage that has been shown net of the postage reimbursements from our clients for 2010, 2009, and 2008 was $269.7 million, $264.8 million, and $251.8 million, respectively.
Cash and Cash Equivalents. We consider all highly liquid investments with original maturities of three months or less at the date of purchase to be cash equivalents. As of December 31, 2010, our cash equivalents consist primarily of institutional money market funds, commercial paper and time deposits held at major banks.
As of December 31, 2010, we had $4.9 million of restricted cash that serves to collateralize outstanding letters of credit. This restricted cash is included in Cash and cash equivalents in the accompanying Consolidated Balance Sheet.
Short-term Investments and Other Financial Instruments. Our financial instruments as of December 31, 2010 and 2009 include cash and cash equivalents, short-term investments, accounts receivable, accounts payable, and long-term debt. Because of their short maturities, the carrying amounts of cash equivalents, accounts receivable, and accounts payable approximate their fair value.
Our short-term investments are considered “available-for-sale” and are reported at fair value in our accompanying Consolidated Balance Sheets, with unrealized gains and losses, net of the related income tax effect, excluded from earnings and reported in a separate component of stockholders’ equity. Realized and unrealized gains and losses were not material in any period presented.
Our short-term investments at December 31, 2010 and 2009 consisted of the following (in thousands):
| As of December 31, | ||||||||
| 2010 | 2009 | |||||||
| Commercial paper |
$ | 17,692 | $ | 31,388 | ||||
| Certificates of deposit |
— | 3,500 | ||||||
| Total |
$ | 17,692 | $ | 34,888 | ||||
All short-term investments held by us as of December 31, 2010 and 2009 have contractual maturities of less than one year from the time of acquisition. Proceeds from the sale/maturity of short-term investments were $81.9 million, $79.7 million, and $36.2 million, in 2010, 2009, and 2008, respectively.
68
Table of Contents
NOTES TO CONSOLIDATED FINANCIAL STATEMENTS—(Continued)
The following table represents the fair value hierarchy based upon three levels of inputs, of which Levels 1 and 2 are considered observable and Level 3 is unobservable, for our investments measured at fair value (in thousands):
| December 31, 2010 | December 31, 2009 | |||||||||||||||||||||||
| Level 1 | Level 2 | Total | Level 1 | Level 2 | Total | |||||||||||||||||||
| Money market funds |
$ | 91,002 | $ | — | $ | 91,002 | $ | 122,942 | $ | — | $ | 122,942 | ||||||||||||
| Commercial paper |
— | 26,590 | 26,590 | — | 56,641 | 56,641 | ||||||||||||||||||
| Certificates of deposit |
— | — | — | — | 3,500 | 3,500 | ||||||||||||||||||
| Total |
$ | 91,002 | $ | 26,590 | $ | 117,592 | $ | 122,942 | $ | 60,141 | $ | 183,083 | ||||||||||||
| Balance sheet classification: |
||||||||||||||||||||||||
| Cash equivalents |
$ | 91,002 | $ | 8,898 | $ | 99,900 | $ | 122,942 | $ | 25,253 | $ | 148,195 | ||||||||||||
| Short term investments |
— | 17,692 | 17,692 | — | 34,888 | 34,888 | ||||||||||||||||||
| Total |
$ | 91,002 | $ | 26,590 | $ | 117,592 | $ | 122,942 | $ | 60,141 | $ | 183,083 | ||||||||||||
Valuation inputs used to measure the fair values of our money market funds were derived from quoted market prices. The fair values of all other instruments are based upon pricing provided by third-party pricing services. These prices were derived from observable market inputs.
The carrying amount of our long-term debt related to our Credit Agreement approximates fair value due to its variable interest rates. We have chosen not to measure our Convertible Debt Securities at fair value, with changes recognized in earnings each reporting period. As of December 31, 2010, the estimated fair value of our $175.1 million (par value) convertible debt, based upon quoted market prices or recent sales activity, was approximately $176.9 million.
Concentrations of Credit Risk. In the normal course of business, we are exposed to credit risk. The principal concentrations of credit risk relate to cash deposits, cash equivalents, short-term investments, and accounts receivable. We regularly monitor credit risk exposures and take steps to mitigate the likelihood of these exposures resulting in a loss. We hold our cash deposits, cash equivalents, and short-term investments with financial institutions we believe to be of sound financial condition.
We do not require collateral or other security to support accounts receivable. We evaluate the credit worthiness of our clients in conjunction with our revenue recognition processes, as well as through our ongoing collectibility assessment processes for accounts receivable. We maintain an allowance for doubtful accounts receivable based upon factors surrounding the credit risk of specific clients, historical trends, and other information. We use various judgments and estimates in determining the adequacy of the allowance for doubtful accounts receivable. See Note 4 for additional details of our concentration of accounts receivable.
The activity in our allowance for doubtful accounts receivable is as follows (in thousands):
| 2010 | 2009 | 2008 | ||||||||||
| Balance, beginning of year |
$ | 2,036 | $ | 2,999 | $ | 1,487 | ||||||
| Additions (reductions) to expense |
(58 | ) | (461 | ) | 1,527 | |||||||
| Write-offs |
(103 | ) | (507 | ) | (88 | ) | ||||||
| Other |
(38 | ) | 5 | 73 | ||||||||
| Balance, end of year |
$ | 1,837 | $ | 2,036 | $ | 2,999 | ||||||
Property and Equipment. Property and equipment are recorded at cost (or at estimated fair value if acquired in a business combination) and are depreciated over their estimated useful lives ranging from three to ten years. Leasehold improvements are depreciated over the shorter of their economic life or the lease term. Depreciation
69
Table of Contents
NOTES TO CONSOLIDATED FINANCIAL STATEMENTS—(Continued)
expense is computed using the straight-line method for financial reporting purposes, with the exception of certain statement production equipment, which is depreciated using the units-of-production method. Depreciation expense for all property and equipment is reflected in our accompanying Consolidated Statements of Income separately in the aggregate and is not included in the cost of revenues or the other components of operating expenses. Depreciation for income tax purposes is computed using accelerated methods.
Software. We expend substantial amounts on research and development (“R&D”), particularly for new products and services, or for enhancements of existing products and services. For development of software products that are to be licensed by us, we expense all costs related to the development of the software until technological feasibility is established. Once technological feasibility is established, costs are then capitalized, until the general release of the software. For development of software to be used internally (e.g., processing systems software), we expense all costs prior to the application development stage.
During 2010, 2009, and 2008, we expended $78.1 million, $70.1 million, and $67.3 million, respectively, on R&D projects. We did not capitalize any R&D costs in 2010, 2009, or 2008, as the costs subject to capitalization during these periods were not material. We did not have any capitalized R&D costs included in our December 31, 2010 or 2009 accompanying Consolidated Balance Sheets.
Realizability of Long-Lived Assets. We evaluate our long-lived assets, other than goodwill, for possible impairment whenever events or changes in circumstances indicate that the carrying value of these assets may not be recoverable. A long-lived asset is impaired if estimated future undiscounted cash flows associated with that asset are insufficient to recover the carrying amount of the long-lived asset. If deemed impaired, the long-lived asset is written down to its fair value.
Goodwill. We evaluate our goodwill for impairment on an annual basis. In addition, we evaluate our goodwill on a more periodic basis (e.g., quarterly) if events occur or circumstances change that could indicate a potential impairment may have occurred. Goodwill is considered impaired if the carrying value of the reporting unit which includes the goodwill is greater than the estimated fair value of the reporting unit.
Contingencies. We accrue for a loss contingency when: (i) it is probable that an asset has been impaired, or a liability has been incurred; and (ii) the amount of the loss can be reasonably estimated. The determination of accounting for loss contingencies is subject to various judgments and estimates. We do not record the benefit from a gain contingency until the benefit is realized.
Earnings Per Common Share (“EPS”). Basic and diluted EPS amounts are presented on the face of the accompanying Consolidated Statements of Income.
Under generally accepted accounting principles, unvested share-based payment awards that contain nonforfeitable rights to dividends or dividend equivalents (whether paid or unpaid) are participating securities and shall be included in the computation of EPS pursuant to the two-class method. Unvested restricted stock awards under our stock incentive plans, granted prior to August 2008, contain nonforfeitable rights to cash dividends. As a result, basic EPS is computed by dividing net income available to common stockholders and participating securities (the numerators) by the respective weighted average number of shares outstanding during the period (the denominators) using the two-class method. Under the two-class method, undistributed earnings are allocated among each class of common stock and participating security prior to the calculation of EPS. Diluted EPS is calculated similarly, except that the calculation includes the effect of potentially dilutive stock options and non-participating restricted stock awards.
70
Table of Contents
NOTES TO CONSOLIDATED FINANCIAL STATEMENTS—(Continued)
The amounts attributed to both common stock and participating restricted stock used as the numerators in both the basic and diluted EPS calculations are as follows (in thousands):
| 2010 | 2009 | 2008 | ||||||||||
| Income from continuing operations attributed to: |
||||||||||||
| Common stock |
$ | 22,061 | $ | 40,524 | $ | 50,800 | ||||||
| Participating restricted stock |
368 | 1,338 | 2,450 | |||||||||
| Total |
$ | 22,429 | $ | 41,862 | $ | 53,250 | ||||||
| Discontinued operations, net of tax, attributed to: |
||||||||||||
| Common stock |
$ | — | $ | 1,424 | $ | 308 | ||||||
| Participating restricted stock |
— | 47 | 15 | |||||||||
| Total |
$ | — | $ | 1,471 | $ | 323 | ||||||
| Net income attributed to: |
||||||||||||
| Common stock |
$ | 22,061 | $ | 41,948 | $ | 51,108 | ||||||
| Participating restricted stock |
368 | 1,385 | 2,465 | |||||||||
| Total |
$ | 22,429 | $ | 43,333 | $ | 53,573 | ||||||
The weighted-average shares outstanding used in the basic and diluted EPS denominators related to common stock and participating restricted stock are as follows (in thousands):
| 2010 | 2009 | 2008 | ||||||||||
| Weighted-average shares outstanding—Basic: |
||||||||||||
| Common stock |
32,537 | 33,228 | 33,207 | |||||||||
| Participating restricted stock |
543 | 1,097 | 1,602 | |||||||||
| Total |
33,080 | 34,325 | 34,809 | |||||||||
| Weighted-average shares outstanding—Diluted: |
||||||||||||
| Common stock |
32,822 | 33,352 | 33,240 | |||||||||
| Participating restricted stock |
543 | 1,097 | 1,602 | |||||||||
| Total |
33,365 | 34,449 | 34,842 | |||||||||
The reconciliation of the basic and diluted EPS denominators related to the common shares is included in the following table (in thousands):
| 2010 | 2009 | 2008 | ||||||||||
| Basic weighted-average common shares |
32,537 | 33,228 | 33,207 | |||||||||
| Dilutive effect of common stock options |
24 | 26 | 32 | |||||||||
| Dilutive effect of unvested restricted stock |
261 | 98 | 1 | |||||||||
| Dilutive effect of 2010 Convertible Notes |
— | — | — | |||||||||
| Dilutive effect of 2004 Convertible Debt Securities |
— | — | — | |||||||||
| Diluted weighted-average common shares |
32,822 | 33,352 | 33,240 | |||||||||
Potentially dilutive common shares related to stock options and non-participating unvested shares of restricted stock of 0.2 million, 0.2 million, and 0.3 million, respectively, for 2010, 2009, and 2008, were excluded from the computation of diluted EPS as their effect was antidilutive.
71
Table of Contents
NOTES TO CONSOLIDATED FINANCIAL STATEMENTS—(Continued)
The 2010 Convertible Notes have a dilutive effect only in those quarterly periods in which our average stock price exceeds the current effective conversion price of $24.45 per share. The 2004 Convertible Debt Securities have a dilutive effect only in those quarterly periods in which our average stock price exceeds the current effective conversion price of $26.77 per share.
Stock-Based Compensation. Stock-based compensation represents the cost related to stock-based awards granted to employees and non-employee directors. We measure stock-based compensation cost at the grant date of the award, based on the estimated fair value of the award and recognize the cost (net of estimated forfeitures) over the requisite service period. Benefits of tax deductions in excess of recognized compensation expense, if any, are reported as a financing cash inflow rather than as an operating cash inflow.
Income Taxes. We account for income taxes using the asset and liability method. Under this method, income tax expense is recognized for the amount of taxes payable or refundable for the current year. In addition, deferred tax assets and liabilities are recognized for expected future tax consequences of temporary differences between the financial reporting and tax bases of assets and liabilities using enacted tax rates in effect for the year in which the differences are expected to reverse. The effect of a change in tax rates on deferred tax assets and liabilities is recognized in income in the period that includes the enactment date.
Comprehensive Income. The components of comprehensive income are reflected in the accompanying Consolidated Statements of Stockholders’ Equity.
4. Segment Reporting and Significant Concentration
Segment Information. We have evaluated how our chief operating decision maker has organized our company for purposes of making operating decisions and assessing performance, and have concluded that as of December 31, 2010, we have one reportable segment.
Products and Services. Prior to the Intec Acquisition on November 30, 2010, our primary product offerings included our core outsourced customer care and billing solution, ACP, and related services and software products, which were delivered to the North American cable and DBS markets. We also licensed certain software products (e.g., ACSR, Workforce Express, etc.) and provided our professional services principally to our existing base of customer care and billing clients to enhance the core functionality of ACP, increase the efficiency and productivity of our clients’ operations, and allow clients to effectively roll out new products, such as high-speed-data, telephony, and commercial services. With the acquisition of Intec, discussed in Note 2, we have added solutions in wholesale and retail billing and mediation to our product offerings, and significantly increased our professional services capacity and capabilities.
Geographic Regions. Prior to the Intec acquisition, all revenues and long-lived assets were attributable to our operations in North America, primarily the U.S. As a result of one month of Intec operations being included in our 2010 results, over 98% of our revenues for 2010 were attributable to our operations in North America.
72
Table of Contents
NOTES TO CONSOLIDATED FINANCIAL STATEMENTS—(Continued)
We use the location of the contracting entity as the basis of attributing revenues to individual countries. Financial information relating to our operations by geographic region is as follows (in thousands):
| 2010 | 2009 | 2008 | ||||||||||
| Total Revenues: |
||||||||||||
| Americas (principally the U.S.) |
$ | 540,377 | $ | 500,717 | $ | 472,057 | ||||||
| Europe, Middle East and Africa (principally Europe) |
7,482 | — | — | |||||||||
| Asia Pacific |
1,520 | — | — | |||||||||
| Total revenues |
$ | 549,379 | $ | 500,717 | $ | 472,057 | ||||||
| As of December 31, | ||||||||||||
| 2010 | 2009 | |||||||||||
| Property and Equipment: |
||||||||||||
| Americas (principally the U.S.) |
$ | 46,953 | $ | 56,799 | ||||||||
| Europe, Middle East and Africa (principally Europe) |
2,885 | — | ||||||||||
| Asia Pacific |
2,419 | — | ||||||||||
| Total long-lived assets |
$ | 52,257 | $ | 56,799 | ||||||||
Significant Clients and Industry Concentration. A large percentage of our historical revenues have been generated from our four largest clients, which are Comcast Corporation (“Comcast”), DISH Network Corporation (“DISH”), Time Warner Inc. (“Time Warner”), and Charter Communications, Inc. (“Charter”). Revenues from these clients represented the following percentages of our total revenues for the following years:
| 2010 | 2009 | 2008 | ||||||||||
| Comcast |
24 | % | 24 | % | 27 | % | ||||||
| DISH |
18 | % | 18 | % | 18 | % | ||||||
| Time Warner |
12 | % | 13 | % | 14 | % | ||||||
| Charter |
10 | % | 9 | % | 8 | % | ||||||
As of December 31, 2010 and 2009, the percentage of net billed accounts receivable balances attributable to these clients were as follows:
| As of December 31, | ||||||||
| 2010 | 2009 | |||||||
| Comcast |
20 | % | 19 | % | ||||
| DISH |
15 | % | 26 | % | ||||
| Time Warner |
9 | % | 9 | % | ||||
| Charter |
9 | % | 13 | % | ||||
Although the Intec acquisition will reduce the percentage of our total revenues generated from these clients, we expect to continue to generate a significant percentage of our future revenues from a limited number of clients, including Comcast, DISH, Time Warner, and Charter. There are inherent risks whenever a large percentage of total revenues are concentrated with a limited number of clients. Should a significant client: (i) terminate or fail to renew their contracts with us, in whole or in part for any reason; (ii) significantly reduce the number of customer accounts processed on our solutions, the price paid for our services, or the scope of services that we provide; or (iii) experience significant financial or operating difficulties, it could have a material adverse effect on our financial position and results of operations.
73
Table of Contents
NOTES TO CONSOLIDATED FINANCIAL STATEMENTS—(Continued)
5. Long-Lived Assets
Property and Equipment. Property and equipment at December 31 consisted of the following (in thousands, except years):
| Useful Lives (years) | 2010 | 2009 | ||||||||||
| Computer equipment |
3-5 | $ | 55,597 | $ | 59,344 | |||||||
| Leasehold improvements |
5-10 | 16,240 | 14,300 | |||||||||
| Operating equipment |
3-10 | 60,138 | 59,783 | |||||||||
| Furniture and equipment |
3-8 | 13,930 | 11,549 | |||||||||
| Capital projects in process |
— | 588 | 18 | |||||||||
| 146,493 | 144,994 | |||||||||||
| Less—accumulated depreciation |
(94,236 | ) | (88,195 | ) | ||||||||
| Property and equipment, net |
$ | 52,257 | $ | 56,799 | ||||||||
Goodwill. We do not have any intangible assets with indefinite lives other than goodwill. A rollforward of goodwill in 2010 and 2009 is as follows (in thousands):
| January 1, 2009 balance |
$ | 103,971 | ||
| Adjustments related to prior acquisitions |
3,081 | |||
| December 31, 2009 balance |
107,052 | |||
| Goodwill acquired during period |
101,095 | |||
| Adjustments related to prior acquisitions |
1,940 | |||
| Effects of changes in foreign currency exchange rates |
(923 | ) | ||
| December 31, 2010 balance |
$ | 209,164 | ||
The goodwill acquired in 2010 is related to the Intec Acquisition discussed in Note 2. The adjustments related to prior acquisitions made in 2010 and 2009 are mainly due to the recording of contingent purchase price payments of $2.0 million and $3.4 million, respectively, related to the Quaero and Prairie acquisitions.
Other Intangible Assets. Our intangible assets subject to ongoing amortization consist of client contracts and software.
Client Contracts
Client contracts consist of the following: (i) investments in client contracts; (ii) direct and incremental costs that we have capitalized related to contractual arrangements where we have deferred revenues to convert or set-up client customers onto our outsourced solutions; and (iii) client contracts acquired in business combinations. As of December 31, 2010 and 2009, the carrying values of these assets were as follows (in thousands):
| 2010 | 2009 | |||||||||||||||||||||||
| Gross Carrying Amount |
Accumulated Amortization |
Net Amount |
Gross Carrying Amount |
Accumulated Amortization |
Net Amount |
|||||||||||||||||||
| Investments in client contracts(1) |
$ | 134,178 | $ | (115,747 | ) | $ | 18,431 | $ | 131,745 | $ | (109,032 | ) | $ | 22,713 | ||||||||||
| Capitalized costs(2) |
16,580 | (8,546 | ) | 8,034 | 14,371 | (5,633 | ) | 8,738 | ||||||||||||||||
| Acquired client contracts(3) |
98,788 | (8,925 | ) | 89,863 | 17,957 | (8,001 | ) | 9,956 | ||||||||||||||||
| Total client contracts |
$ | 249,546 | $ | (133,218 | ) | $ | 116,328 | $ | 164,073 | $ | (122,666 | ) | $ | 41,407 | ||||||||||
74
Table of Contents
NOTES TO CONSOLIDATED FINANCIAL STATEMENTS—(Continued)
The aggregate amortization related to client contracts included in our operations for 2010, 2009, and 2008, was as follows (in thousands):
| 2010 | 2009 | 2008 | ||||||||||
| Investments in client contracts(1) |
$ | 6,715 | $ | 4,525 | $ | 9,183 | ||||||
| Capitalized costs(2) |
2,660 | 1,077 | 2,246 | |||||||||
| Acquired client contracts(3) |
3,920 | 4,087 | 2,293 | |||||||||
| Total client contracts |
$ | 13,295 | $ | 9,689 | $ | 13,722 | ||||||
| (1) | Investments in client contracts consist principally of incentives provided to new or existing clients to convert their customer accounts to, or retain their customer’s accounts on, our customer care and billing systems. Investments in client contracts related to client incentives are amortized ratably over the lives of the respective client contracts, which as of December 31, 2010, have termination dates that range from 2011 through 2016. Amortization of the investments in client contracts related to client incentives is reflected as a reduction in processing and related services revenues in the accompanying Consolidated Statements of Income. |
| (2) | Capitalized costs related to the deferral of conversion/set-up services costs are amortized proportionately over the same period that the deferred conversion/set-up services revenues are recognized, and are primarily reflected in cost of processing and related services in the accompanying Consolidated Statements of Income. |
| (3) | Acquired client contracts represent assets acquired in the Intec, Quaero, DataProse, Prairie, and ComTec business acquisitions. Acquired client contracts are being amortized over their estimated useful lives ranging from two to fifteen years based on the approximate pattern in which the economic benefits of the intangible assets are expected to be realized. Classification of the amortization of acquired client contracts generally follows where the acquired business’ cost of revenues are categorized in the accompanying Consolidated Statements of Income. |
The weighted-average remaining amortization period of client contracts as of December 31, 2010 was approximately 94 months. Based on the December 31, 2010 net carrying value of these intangible assets, the estimated amortization for each of the five succeeding fiscal years ending December 31 will be: 2011—$25.7 million; 2012—$24.6 million; 2013—$18.1 million; 2014—$13.9 million; and 2015—$8.8 million.
Software
Software consists of: (i) software and similar intellectual property rights from various business combinations; and (ii) internal use software. As of December 31, 2010 and 2009, the carrying values of these assets were as follows (in thousands):
| 2010 | 2009 | |||||||||||||||||||||||
| Gross Carrying Amount |
Accumulated Amortization |
Net Amount |
Gross Carrying Amount |
Accumulated Amortization |
Net Amount |
|||||||||||||||||||
| Acquired software(4) |
$ | 63,102 | $ | (40,533 | ) | $ | 22,569 | $ | 44,079 | $ | (38,252 | ) | $ | 5,827 | ||||||||||
| Internal use software(5) |
13,595 | (5,046 | ) | 8,549 | 8,344 | (2,014 | ) | 6,330 | ||||||||||||||||
| Total software |
$ | 76,697 | $ | (45,579 | ) | $ | 31,118 | $ | 52,423 | $ | (40,266 | ) | $ | 12,157 | ||||||||||
The aggregate amortization related to software included in our operations for 2010, 2009, and 2008, was as follows (in thousands):
| 2010 | 2009 | 2008 | ||||||||||
| Acquired software(4) |
$ | 2,286 | $ | 2,017 | $ | 1,789 | ||||||
| Internal use software(5) |
3,101 | 1,894 | 156 | |||||||||
| Total software |
$ | 5,387 | $ | 3,911 | $ | 1,945 | ||||||
75
Table of Contents
NOTES TO CONSOLIDATED FINANCIAL STATEMENTS—(Continued)
| (4) | Acquired software represents the software intangible assets acquired in the Intec, Quaero, DataProse, Prairie, and ComTec, business acquisitions, and are being amortized over their estimated useful lives ranging from five to ten years. |
| (5) | Internal use software represents: (i) third-party software licenses; and (ii) the internal and external costs related to the implementation of the third-party software licenses. Internal use software is amortized over its estimated useful life ranging from twelve months to ten years. |
The weighted-average remaining amortization period of the software intangible assets as of December 31, 2010 was approximately 86 months. Based on the December 31, 2010 net carrying value of these intangible assets, the estimated amortization for each of the five succeeding fiscal years ending December 31 will be: 2011—$8.6 million; 2012—$7.7 million; 2013—$3.3 million; 2014—$2.4 million; and 2015—$2.0 million.
6. Debt
As of December 31, 2010 and 2009, our long-term debt was as follows (in thousands):
| 2010 | 2009 | |||||||
| Credit Agreement: |
||||||||
| Term loan, due December 2015, interest at adjusted LIBOR plus applicable margin (rate of 4.06% at December 31, 2010) |
$ | 200,000 | $ | — | ||||
| $100 million revolving loan facility, due December 2015, interest at adjusted LIBOR plus applicable margin (rate of 4.06% at December 31, 2010) |
35,000 | — | ||||||
| Convertible Debt Securities: |
||||||||
| Liability Component: |
||||||||
| 2010 Convertible Notes—senior subordinated convertible notes; due March 1, 2017; cash interest at 3.0%; net of unamortized OID of $34,841 and zero, respectively |
115,159 | — | ||||||
| 2004 Convertible Debt Securities—senior subordinated convertible contingent debt securities; due June 15, 2024; cash interest at 2.5%; net of unamortized OID of $621 and $12,853, respectively |
24,528 | 157,447 | ||||||
| 374,687 | 157,447 | |||||||
| Current portion of long-term debt, net |
(69,528 | ) | — | |||||
| Total long-term debt, net |
$ | 305,159 | $ | 157,447 | ||||
Credit Agreement. On September 24, 2010 and in conjunction with the Intec Acquisition, we entered into a $300 million credit agreement with several financial institutions. On November 24, 2010, we entered into an amended and restated $300 million credit agreement (the “Credit Agreement”), as part of the final bank syndication process of the credit agreement.
The Credit Agreement provides for borrowings by us in the form of: (i) a $200 million aggregate principal five-year term loan (the “Term Loan”); and (ii) a $100 million aggregate principal five-year revolving loan facility (the “Revolver”). Upon closing of the Intec Acquisition, all of the $200 million aggregate principal Term Loan and $35 million of the Revolver were drawn down. The proceeds from the Credit Agreement, along with approximately $150 million of our existing cash, were used to: (i) fund the Intec Acquisition; and (ii) pay transaction-related costs. In January 2011, we repaid the $35 million outstanding balance of the Revolver.
76
Table of Contents
NOTES TO CONSOLIDATED FINANCIAL STATEMENTS—(Continued)
The interest rates under the Credit Agreement are based upon an adjusted LIBOR rate plus an applicable margin, or an alternate base rate plus an applicable margin. The Eurocurrency applicable margin for the Term Loan is 3.75% throughout the term of the Credit Agreement and the applicable margin for the Revolver is based on our then-current leverage ratio. We have the option of selecting the length of time (ranging from one to six months) that we lock in the LIBOR contract rate, and initially entered into a 3-month LIBOR contract rate of 0.31% per annum. The interest rates (LIBOR plus applicable margin) for both the Term Loan and Revolver were 4.06% per annum for the period upon drawn down through December 31, 2010.
We pay a commitment fee on the average daily unused amount of the Revolver, with the annual commitment fee ranging from 0.50% to 0.75% per annum, based upon our then-current leverage ratio. At December 31, 2010, $65 million of the Revolver was available to us.
The Credit Agreement includes mandatory repayments of the aggregate principal amount of the Term Loan (payable quarterly) for the first, second, third, fourth and fifth years, with the remaining principal balance due at maturity. The Credit Agreement has no prepayment penalties and requires mandatory prepayments under certain circumstances, including: (i) as a result of defined excess cash flow; (ii) asset sales or casualty proceeds; or (iii) proceeds of debt issuances.
The Credit Agreement contains customary affirmative covenants such as: (i) filing of quarterly and annual reports and (ii) maintenance of credit ratings. In addition, the Credit Agreement has customary negative covenants that places limits on our ability to: (i) incur additional indebtedness; (ii) create liens on its property; (iii) make investments; (iv) enter into mergers and consolidations; (v) sell assets; (vi) declare dividends or repurchase shares; (vii) engage in certain transactions with affiliates; (viii) prepay certain indebtedness, including our 2010 Convertible Notes; and (ix) issue capital stock of subsidiaries. We must also meet certain financial covenants to include: (i) a maximum total leverage ratio; (ii) a maximum secured leverage ratio; (iii) a minimum interest coverage ratio; and (iv) a limitation on capital expenditures.
On September 24, 2010, CSG entered into a security agreement in favor of a financial institution as collateral agent (the “Security Agreement”). Under the Security Agreement and Credit Agreement, all of CSG’s domestic subsidiaries have guaranteed our obligations, and CSG and such subsidiaries have pledged substantially all of our assets to secure the obligations under the Credit Agreement and such guarantees.
In conjunction with the closing of the Credit Agreement, we incurred financing costs totaling $10.2 million, which are being amortized to interest expense using the effective interest method over the related term of the Credit Agreement.
2010 Convertible Notes. On March 1, 2010, we completed an offering of $150 million of 3.0% senior subordinated convertible notes due March 1, 2017 (the “2010 Convertible Notes”) to qualified institutional buyers pursuant to Rule 144A under the Securities Act of 1933, as amended. The 2010 Convertible Notes are unsecured obligations, equal in right of payment to our 2004 Convertible Debt Securities, subordinated to any future senior indebtedness and senior to any future junior subordinated debt. The 2010 Convertible Notes were issued at a price of 100% of their par value and bear interest at a rate of 3.0% per annum, which is payable semiannually in arrears on March 1 and September 1 of each year, beginning on September 1, 2010.
The net proceeds from the sale of the 2010 Convertible Notes were approximately $145 million, after deferred financing costs. We used the net proceeds, along with available cash, cash equivalents and short-term investments, to: (i) repurchase 1.5 million shares of our common stock for $29.3 million ($19.56 per share) under our existing Stock Repurchase Program; and (ii) repurchase $119.9 million (par value) of our 2004 Convertible Debt Securities for a total purchase price of $125.8 million, which included accrued interest of $0.8 million.
The 2010 Convertible Notes are convertible into our common stock, under the specified conditions and settlement terms outlined below, at an initial conversion rate of 40.8998 shares of our common stock per $1,000
77
Table of Contents
NOTES TO CONSOLIDATED FINANCIAL STATEMENTS—(Continued)
par value of the 2010 Convertible Notes, which is equivalent to an initial conversion price of approximately $24.45 per share. The Indenture related to the 2010 Convertible Notes (“Notes Indenture”) includes anti-dilution provisions for the holders such that the conversion rate (and thus the initial conversion price) can be adjusted in the future for certain events, to include stock dividends, the issuance of rights, options or warrants to purchase our common stock at a price below the then-current market price, and certain distributions of common stock, property or rights, options or warrants to acquire our common stock to all or substantially all holders of our common stock. Additionally, the conversion rate may be adjusted prior to the maturity date in connection with the occurrence of specified corporate transactions for a “make-whole” premium as set forth in the Notes Indenture.
Prior to September 1, 2016, holders of the 2010 Convertible Notes can convert their securities: (i) at any time the price of our common stock trades over $31.79 per share (130% of the $24.45 initial conversion price) for a specified period of time; (ii) at any time the trading price of the 2010 Convertible Notes falls below 98% of the average conversion value for the 2010 Convertible Notes for a specified period of time; and (iii) at any time upon the occurrence of specified corporate transactions, to include a change of control (as defined in the Notes Indenture). On or after September 1, 2016, the holders of the 2010 Convertible Notes can elect to convert their securities at any time, with the settlement occurring on March 1, 2017. As of December 31, 2010, none of the contingent conversion features have been achieved, and thus, the 2010 Convertible Notes are not convertible by the holders.
Upon conversion of the 2010 Convertible Notes, we will settle our conversion obligation as follows: (i) we will pay cash for 100% of the par value of the 2010 Convertible Notes that are converted; and (ii) to the extent the value of our conversion obligation exceeds the par value, we will satisfy the remaining conversion obligation in our common stock, cash or any combination of our common stock and cash. As of December 31, 2010, the value of our conversion obligation did not exceed the par value of the 2010 Convertible Notes.
The OID related to the 2010 Convertible Notes of $38.4 million, as a result of an effective interest rate of the liability component of 7.75% compared to the cash interest rate of 3.0%, is being amortized to interest expense through March 1, 2017, the maturity date of the 2010 Convertible Notes.
2004 Convertible Debt Securities. The 2004 Convertible Debt Securities are unsecured obligations, subordinated to any of our future senior indebtedness, and senior to any future junior subordinated debt. The 2004 Convertible Debt Securities were issued at a price of 100% of their par value and bear interest at a rate of 2.5% per annum, which is payable semiannually in arrears on June 15 and December 15 of each year. The 2004 Convertible Debt Securities are callable by us for cash, on or after June 20, 2011, at a redemption price equal to 100% of the par value of the 2004 Convertible Debt Securities, plus accrued interest. The 2004 Convertible Debt Securities can be put back to us by the holders for cash at June 15, 2011, 2016 and 2021, or upon a change of control, as defined in the 2004 Convertible Debt Securities bond indenture (“Bonds Indenture”), at a repurchase price equal to 100% of the par value of the 2004 Convertible Debt Securities, plus any accrued interest. Therefore, we have included the 2004 Convertible Debt Securities in current maturities of long-term debt in our December 31, 2010 accompanying Consolidated Balance Sheet.
The 2004 Convertible Debt Securities are convertible into our common stock, under the specified conditions and settlement terms outlined below, at a conversion rate of 37.3552 shares per $1,000 par value of the 2004 Convertible Debt Securities, which is equal to an initial conversion price of $26.77 per share. The Bonds Indenture includes anti-dilution provisions for the holders such that the conversion rate (and thus the initial conversion price) can be adjusted in the future for certain events, to include stock dividends, stock splits/reverse splits, the issuance of warrants to purchase our stock at a price below the then-current market price, cash dividends, and certain purchases by us of our common stock pursuant to a self-tender offer or exchange offer.
Holders of the 2004 Convertible Debt Securities can convert their securities: (i) at any time the price of our common stock trades over $34.80 per share (130% of the $26.77 initial conversion price) for a specified period
78
Table of Contents
NOTES TO CONSOLIDATED FINANCIAL STATEMENTS—(Continued)
of time; (ii) at any time the trading price of the 2004 Convertible Debt Securities falls below 98% of the average conversion value for the 2004 Convertible Debt Securities for a specified period of time; (iii) upon us exercising our right to redeem the 2004 Convertible Debt Securities at any time after June 20, 2011; (iv) at any time upon the occurrence of specified corporate transactions, to include a change in control (as defined in the Bonds Indenture); and (v) if a certain level of dividends are declared, or a certain number of shares of our common stock are repurchased under a self-tender offer by us. As of December 31, 2010, none of the contingent conversion features have been achieved, and thus, the 2004 Convertible Debt Securities are not convertible by the holders.
Upon conversion of the 2004 Convertible Debt Securities, we will settle our conversion obligation as follows: (i) we will pay cash for 100% of the par value of the 2004 Convertible Debt Securities that are converted; and (ii) to the extent the value of our conversion obligation exceeds the par value, we will satisfy the remaining conversion obligation in our common stock, cash or any combination of our common stock and cash. As of December 31, 2010, the value of our conversion obligation did not exceed the par value of the 2004 Convertible Debt Securities.
The OID related to the 2004 Convertible Debt Securities is being amortized to interest expense through June 15, 2011, which is the first date that the 2004 Convertible Debt Securities can be put back to us by the holders for cash. The effective interest rate of the liability component for the 2004 Convertible Debt Securities is 8.00%.
During 2010, we repurchased $145.2 million (par value) of our 2004 Convertible Debt Securities for a total purchase price of $151.0 million and recognized a loss on the repurchase of $12.7 million after the write-off of a proportional amount of deferred financing costs. During 2009, we repurchased $30.0 million (par value) of our 2004 Convertible Debt Securities for $26.7 million, and recognized a gain on the repurchase of $1.5 million, after the write-off of a proportional amount of deferred financing costs. This debt has been considered extinguished for accounting purposes. See Note 7 for discussion of the impact on our deferred income tax liabilities associated with the 2010 and 2009 repurchases of the 2004 Convertible Debt Securities.
The estimated maturities of our long-term debt, based upon the mandatory repayment schedule for the Term Loan, the repayment of the Revolver in January 2011, and the expected remaining life of the Convertible Debt Securities, is as follows (in thousands):
| 2011 | 2012 | 2013 | 2014 | 2015 | Thereafter | |||||||||||||||||||
| Term loan |
$ | 10,000 | $ | 20,000 | $ | 30,000 | $ | 40,000 | $ | 100,000 | $ | — | ||||||||||||
| Revolving loan facility |
35,000 | — | — | — | — | — | ||||||||||||||||||
| 2010 Convertible Notes |
— | — | — | — | — | 150,000 | ||||||||||||||||||
| 2004 Convertible Debt Securities |
25,149 | — | — | — | — | — | ||||||||||||||||||
| Total long-term debt |
$ | 70,149 | $ | 20,000 | $ | 30,000 | $ | 40,000 | $ | 100,000 | $ | 150,000 | ||||||||||||
Deferred Financing Costs. As of December 31, 2010, net deferred financing costs related to the Credit Agreement were $10.0 million, and are being amortized to interest expense over the related term of the Credit Agreement (December 2015). As of December 31, 2010, net deferred financing costs related to the 2010 Convertible Notes were $3.4 million, and are being amortized to interest expense through maturity (March 2017). As of December 31, 2010, net deferred financing costs related to the 2004 Convertible Debt Securities were immaterial. The net deferred financing costs are reflected in Other Assets in the accompanying Consolidated Balance Sheets. Interest expense for 2010, 2009, and 2008 includes amortization of deferred financing costs of $0.8 million, $0.7 million, and $0.9 million, respectively. The weighted-average interest rate on our debt borrowings, including amortization of OID, amortization of deferred financing costs, and commitment fees on a revolving loan facility, for 2010, 2009, and 2008, was approximately 8%.
79
Table of Contents
NOTES TO CONSOLIDATED FINANCIAL STATEMENTS—(Continued)
7. Income Taxes
Income Tax Provision/(Benefit). The components of net income from continuing operations before income taxes are as follows (in thousands):
| 2010 | 2009 | 2008 | ||||||||||
| Domestic |
$ | 35,861 | $ | 63,369 | $ | 80,764 | ||||||
| Foreign |
(2,188 | ) | — | — | ||||||||
| Total |
$ | 33,673 | $ | 63,369 | $ | 80,764 | ||||||
The income tax provision related to continuing operations consists of the following (in thousands):
| 2010 | 2009 | 2008 | ||||||||||
| Current: |
||||||||||||
| Federal |
$ | 5,984 | $ | 1,745 | $ | 14,159 | ||||||
| State |
1,802 | 940 | 1,801 | |||||||||
| Foreign |
210 | — | — | |||||||||
| 7,996 | 2,685 | 15,960 | ||||||||||
| Deferred: |
||||||||||||
| Federal |
1,514 | 16,253 | 11,012 | |||||||||
| State |
1,926 | 2,569 | 542 | |||||||||
| Foreign |
(192 | ) | — | — | ||||||||
| 3,248 | 18,822 | 11,554 | ||||||||||
| Total income tax provision |
$ | 11,244 | $ | 21,507 | $ | 27,514 | ||||||
The difference between our income tax provision computed at the statutory Federal income tax rate and our financial statement income tax related to continuing operations is summarized as follows (in thousands):
| 2010 | 2009 | 2008 | ||||||||||
| Provision at Federal rate of 35% |
$ | 11,785 | $ | 22,179 | $ | 28,267 | ||||||
| State income taxes, net of Federal impact |
2,423 | 2,281 | 1,523 | |||||||||
| Research and experimentation credits |
(2,830 | ) | (2,152 | ) | (1,262 | ) | ||||||
| Resolution of certain tax uncertainties |
(4,198 | ) | (465 | ) | (249 | ) | ||||||
| Section 199 manufacturing deduction |
(1,248 | ) | (344 | ) | (629 | ) | ||||||
| Impact of foreign operations |
784 | — | — | |||||||||
| Loss on foreign currency transactions |
1,779 | — | — | |||||||||
| Non-deductible acquisition costs |
2,450 | — | — | |||||||||
| Other |
299 | 8 | (136 | ) | ||||||||
| Total income tax provision |
$ | 11,244 | $ | 21,507 | $ | 27,514 | ||||||
We have undistributed earnings of certain foreign subsidiaries. We intend to indefinitely reinvest these foreign earnings, therefore, a provision has not been made for income taxes that might be payable upon remittance of such earnings. Determination of the amount of unrecognized deferred tax liability on unremitted foreign earnings is not practicable.
80
Table of Contents
NOTES TO CONSOLIDATED FINANCIAL STATEMENTS—(Continued)
Deferred Income Taxes. The components of our net deferred income tax assets (liabilities) as of December 31, 2010 and 2009 are as follows (in thousands):
| 2010 | 2009 | |||||||
| Current deferred income tax assets: |
||||||||
| Accrued expenses and reserves Convertible debt securities |
$
|
17,180 (5,777 |
) |
$
|
12,525 — |
| ||
| Stock-based compensation |
3,978 | 4,301 | ||||||
| Total current deferred income tax assets |
15,381 | 16,826 | ||||||
| Less: valuation allowance |
(1,529 | ) | — | |||||
| Net current deferred income tax assets |
$ | 13,852 | $ | 16,826 | ||||
| Non-current deferred income tax assets: |
||||||||
| Client contracts and related intangibles |
$ | (1,189 | ) | $ | — | |||
| Net operating loss (NOL) carryforwards |
6,352 | — | ||||||
| Property and equipment |
4,126 | — | ||||||
| Deferred revenue |
571 | — | ||||||
| Facility abandonment |
906 | — | ||||||
| Other |
286 | — | ||||||
| Total non-current deferred income tax assets |
11,052 | — | ||||||
| Less: valuation allowance |
(1,375 | ) | — | |||||
| Net non-current deferred income tax assets |
$ | 9,677 | $ | — | ||||
| Non-current deferred income tax liabilities: |
||||||||
| Purchased research and development |
$ | 4,532 | $ | 7,254 | ||||
| Software |
(654 | ) | (1,200 | ) | ||||
| Client contracts and related intangibles |
(2,028 | ) | (3,949 | ) | ||||
| Goodwill |
(2,481 | ) | (1,456 | ) | ||||
| Net operating loss (NOL) carryforwards |
28,814 | 3,213 | ||||||
| Property and equipment |
(6,797 | ) | (14,946 | ) | ||||
| Convertible debt securities |
(43,193 | ) | (40,689 | ) | ||||
| Deferred revenue |
5,933 | 8,014 | ||||||
| Contingent payments |
891 | 891 | ||||||
| Facility abandonment |
1,337 | — | ||||||
| Other |
600 | 670 | ||||||
| Total non-current deferred income tax liabilities |
(13,046 | ) | (42,198 | ) | ||||
| Less: valuation allowance |
(20,201 | ) | — | |||||
| Net non-current deferred income tax liabilities |
$ | (33,247 | ) | $ | (42,198 | ) | ||
We regularly assess the likelihood of the future realization of our deferred income tax assets. To the extent we believe that it is more likely than not that a deferred income tax asset will not be realized, a valuation allowance is established. As of December 31, 2010, we believe that between: (i) carryback opportunities to past periods with taxable income; and (ii) sufficient taxable income to be generated in the future, we will realize 100% of the benefit of our U.S. federal deferred income tax assets, thus no valuation allowance has been established. As of December 31, 2010, we have deferred income tax assets related to state and foreign income tax jurisdictions of $2.9 million and $34.3 million, respectively, and have established valuation allowances against those deferred income tax assets of $2.0 million and $21.1 million, respectively.
81
Table of Contents
NOTES TO CONSOLIDATED FINANCIAL STATEMENTS—(Continued)
As of December 31, 2010 we have an acquired U.S. Federal NOL carryforward of $42 million, which will begin to expire in 2019 and can be utilized through 2030. The acquired U.S. Federal NOL carryforward is attributable to the pre-acquisition periods of acquired subsidiaries. The annual utilization of this U.S. Federal NOL carryforward is limited pursuant to Section 382 of the Internal Revenue Code of 1986, as amended. In addition, as of December 31, 2010, we have: (i) state NOL carryforwards of $59 million, which will expire beginning in 2011 and ending in 2029; and (ii) foreign subsidiary NOL carryforwards of $69 million, which will expire beginning in 2015, with a portion of the losses available over an indefinite period of time.
Our 2004 Convertible Debt Securities are subject to special U.S. Treasury regulations governing contingent payment debt instruments. These regulations allow us to take a tax deduction for interest expense on our U.S. Federal income tax return at a constant rate of 9.09% (subject to certain adjustments), compounded semi-annually, which represents the estimated yield on comparable non-contingent, non-convertible, fixed-rate debt instruments with terms and conditions otherwise similar to the 2004 Convertible Debt Securities. This interest expense tax deduction is greater than the interest expense reflected in the accompanying Consolidated Statements of Income. This is considered a temporary difference, and thus does not impact our overall effective income tax rate. As a result, we will be building a deferred tax liability until the 2004 Convertible Debt Securities are settled. Upon settlement, if the holders are able to achieve or exceed the 9.09% target yield on the 2004 Convertible Debt Securities, the cumulative deferred tax liability will be reclassified to stockholders’ equity. If the holders are not able to achieve the 9.09% target yield, we will be required to pay the portion of the cumulative deferred tax liability to the U.S. tax authorities (without interest or penalties) determined by comparing the actual yield and the target yield, with the amount of the cumulative deferred tax liability not paid to the U.S. tax authorities reclassified to stockholders’ equity.
As a result of the repurchases of our 2004 Convertible Debt Securities in 2009 and 2010, beginning in 2014, we will have to pay cash of approximately $30 million ratably over five years related to the deferred tax liabilities associated with the repurchased securities. In addition, if the remaining 2004 Convertible Debt Securities are put back to us on June 15, 2011, in 2011, we will have to settle in cash approximately $6 million of deferred tax liabilities associated with the outstanding securities.
Accounting for Uncertainty in Income Taxes. We are required to estimate our income tax liability in each jurisdiction in which we operate, including U.S. Federal, state and foreign income tax jurisdictions. Various judgments and estimates are required in evaluating our tax positions and determining our provisions for income taxes. During the ordinary course of business, there are certain transactions and calculations for which the ultimate income tax determination may be uncertain. In addition, we may be subject to examination of our income tax returns by various tax authorities, which could result in adverse outcomes. For these reasons, we establish a liability associated with unrecognized tax benefits based on estimates of whether additional taxes and interest may be due. This liability is adjusted based upon changing facts and circumstances, such as the closing of a tax audit, the expiration of a statute of limitations or the refinement of an estimate.
A reconciliation of the beginning and ending balances of our liability for unrecognized tax benefits is as follows (in thousands):
| 2010 | 2009 | |||||||
| Balance, beginning of year |
$ | 4,131 | $ | 4,672 | ||||
| Additions based on tax positions related to current year |
— | 1,289 | ||||||
| Additions for tax positions of prior years |
954 | 365 | ||||||
| Reductions for tax positions of prior years |
(4,131 | ) | — | |||||
| Lapse of statute of limitations |
— | (2,195 | ) | |||||
| Balance, end of year |
$ | 954 | $ | 4,131 | ||||
82
Table of Contents
NOTES TO CONSOLIDATED FINANCIAL STATEMENTS—(Continued)
We recognize interest and penalty expense associated with our liability for unrecognized tax benefits as a component of income tax expense in our Consolidated Statements of Income. In addition to the $1.0 million and $4.1 million of liability for unrecognized tax benefits as of December 31, 2010 and 2009, respectively, we had $0.1 million and $0.4 million, respectively of income tax-related accrued interest. If recognized, the $1.0 million of unrecognized tax benefits as of December 31, 2010, would favorably impact our effective tax rate in future periods.
We file income tax returns in the U.S. Federal jurisdiction, various state and local jurisdictions, and many foreign jurisdictions. The U.S., U.K., and Ireland are the main taxing jurisdictions in which we operate. The years open for audit vary depending on the taxing jurisdiction. As of December 31, 2010, the U.S. Internal Revenue Service had completed audits, closing years 2006 through 2008, and the statute of limitations has expired in our major state jurisdictions of Nebraska, Colorado and Florida for years prior to 1999, 2006, and 2007, respectively. We are currently under audit in the U.K. for the accounting period ending December 31, 2007. We have not been audited in Ireland and are subject to record retention requirements back to 2005.
8. Employee Retirement Benefit Plans
Defined Contribution-Type Plans. We sponsor defined contribution plans covering substantially all our U.S.-based employees. Participants may contribute up to 100% of their annual wages, subject to certain limitations, as pretax, salary deferral contributions. We make certain matching, and at our discretion, service-based contributions to the plan. The expense related to matching and service-related contributions for 2010, 2009, and 2008 was $7.4 million, $6.4 million, and $6.2 million, respectively. We also sponsor defined contribution-type plans for certain of our non-U.S.-based employees. The voluntary contributions associated with those plans were immaterial for 2010.
9. Commitments, Guarantees and Contingencies
Operating Leases. We lease certain office and production facilities under operating leases that run through 2020. The leases generally are renewable and provide for the payment of real estate taxes and certain other occupancy expenses. In addition, we lease certain operating equipment under operating leases that run through 2014. Future aggregate minimum lease payments under these facilities and operating equipment agreements are as follows: 2011—$20.2 million, 2012—$13.2 million, 2013—$10.0 million, 2014—$7.3 million, 2015—$4.7 and thereafter—$10.0 million. We sublease portions of certain office facilities that we have abandoned. The total minimum lease payments to be received in the future under signed noncancelable subleases as of December 31, 2010 totaled $1.7 million. Total rent expense for 2010, 2009, and 2008, was $12.2 million, $12.5 million, and $11.3 million, respectively.
Service Agreements. In December 2008, we entered into an agreement with Infocrossing LLC (“Infocrossing”), a Wipro Limited company, to transition our outsourced data center services from First Data Corporation (“FDC”) to Infocrossing. The term of the Infocrossing agreement runs through May 2015. We changed data center providers to partner with a global provider that focuses on data center operations in greater scale, and as their core business focus. This allowed us to further improve the delivery of our solutions while benefiting from an improved cost structure.
We outsource the data processing and related computer services required for the operation of our outsourced ACP processing services. Our ACP proprietary software and other software applications are run in an outsourced data center environment in order to obtain the necessary enterprise server computer capacity and other computer support services without us having to make the substantial capital and infrastructure investments that would be necessary for us to provide these services internally. Our clients are connected to the outsourced data center environment through a combination of private and commercially-provided networks. The total amount paid under our outsourced data center services agreements during 2010, 2009, and 2008 was $49.6 million, $53.9 million, and $48.3 million, respectively.
83
Table of Contents
NOTES TO CONSOLIDATED FINANCIAL STATEMENTS—(Continued)
Warranties. We generally warrant that our solutions and related offerings will conform to published specifications, or to specifications provided in an individual client arrangement, as applicable. The typical warranty period is 90 days from delivery of the solution or offering. For certain service offerings we provide a limited warranty for the duration of the services provided. We generally warrant that services will be performed in a professional and workmanlike manner. When we are required to supply hardware together with our solutions to our clients, we generally pass through or otherwise provide the same warranty for the hardware which is agreed upon by the hardware vendor concerned, and these warranties are typically 12 months in duration in line with standard practice. The typical remedy for breach of warranty is to correct or replace any defective deliverable, and if not possible or practical, we will accept the return of the defective deliverable and refund the amount paid under the client arrangement that is allocable to the defective deliverable. Our contracts also generally contain limitation of damages provisions in an effort to reduce our exposure to monetary damages arising from breach of warranty claims. Historically, we have incurred minimal warranty costs, and as a result, do not maintain a warranty reserve.
Product and Services Indemnifications. Our arrangements with our clients generally include an indemnification provision that will indemnify and defend a client in actions brought against the client that claim our products and/or services infringe upon a copyright, trade secret, or valid patent. Historically, we have not incurred any significant costs related to such indemnification claims, and as a result, do not maintain a reserve for such exposure.
Claims for Company Non-performance. Our arrangements with our clients typically cap our liability for breach to a specified amount of the direct damages incurred by the client resulting from the breach. From time-to-time, these arrangements may also include provisions for possible liquidated damages or other financial remedies for our non-performance, or provisions for damages related to service level performance requirements. The service level performance requirements typically relate to system availability and timeliness of service delivery. As of December 31, 2010, we believe we have adequate reserves, based on our historical experience, to cover any reasonably anticipated exposure as a result of our nonperformance for any past or current arrangements with our clients.
Indemnifications Related to Sold Businesses. In conjunction with the sale of the GSS business in December 2005, we provided certain indemnifications to the buyer of this business which are considered routine in nature (such as employee, tax, or litigation matters that occurred while these businesses were under our ownership). Under the provisions of this indemnification agreement, payment by us is conditioned on the other party making a claim pursuant to the procedures in the indemnification agreement, and we are typically allowed to challenge the other party’s claims. In addition, certain of our obligations under this indemnification agreement are limited in terms of time and/or amounts, and in some cases, we may have recourse against a third party if we are required to make certain indemnification payments.
We estimated the fair value of these indemnifications at $2.8 million as of the closing date for the sale of the GSS business. Since the sale of the GSS business, we have made an indemnification payment of $0.1 million, and as of December 31, 2010, the indemnification liability was $2.3 million and related principally to indemnifications related to income tax matters. It is not possible to predict the maximum potential amount of future payments we may be required to make under this indemnification agreement due to the conditional nature of our obligations and the unique facts and circumstances associated with each indemnification provision. We believe that if we were required to make payments in excess of the indemnification liability we have recorded, the resulting loss would not have a material effect on our financial position or results of operations. If any amounts required to be paid by us would differ from the amounts initially recorded as indemnification liabilities as of the closing dates for the sale of the GSS business, the difference would be reflected in the discontinued operations section of our Consolidated Statements of Income.
Indemnifications Related to Officers and the Board of Directors. We have agreed to indemnify certain of our officers and members of our Board of Directors if they are named or threatened to be named as a party to any
84
Table of Contents
NOTES TO CONSOLIDATED FINANCIAL STATEMENTS—(Continued)
proceeding by reason of the fact that they acted in such capacity. We maintain directors’ and officers’ (D&O) insurance coverage to protect against such losses. We have not historically incurred any losses related to these types of indemnifications, and are not aware of any pending or threatened actions or claims against any officer or member of our Board of Directors. As a result, we have not recorded any liabilities related to such indemnifications as of December 31, 2010. In addition, as a result of the insurance policy coverage, we believe these indemnification agreements are not significant to our results of operations.
Legal Proceedings. From time-to-time, we are involved in litigation relating to claims arising out of our operations in the normal course of business. We are not presently a party to any material pending or threatened legal proceedings.
10. Stockholders’ Equity
Stock Repurchase Program. We currently have a stock repurchase program, approved by our Board of Directors, authorizing us to repurchase shares of our common stock from time-to-time as market and business conditions warrant (the “Stock Repurchase Program”).
As of December 31, 2010, a summary of the shares repurchased under the Stock Repurchase Program is as follows (in thousands, except per share amounts):
| 2010 | 2009 | 2008 | 2007 | 1999-2006 | Total | |||||||||||||||||||
| Shares repurchased |
1,500 | 250 | 250 | 13,181 | 15,615 | 30,796 | ||||||||||||||||||
| Total amount paid |
$ | 29,340 | $ | 3,782 | $ | 3,983 | $ | 307,599 | $ | 388,858 | $ | 733,562 | ||||||||||||
| Weighted-average price per share |
$ | 19.56 | $ | 15.13 | $ | 15.93 | $ | 23.34 | $ | 24.90 | $ | 23.82 | ||||||||||||
As of December 31, 2010, the total remaining number of shares available for repurchase under the Stock Repurchase Program totaled approximately 4.2 million shares.
In addition to the above mentioned stock repurchases, during 2010, 2009, and 2008, we repurchased and then cancelled approximately 232,000 shares, 195,000 shares, and 136,000 shares for $4.7 million, $2.8 million, and $1.8 million, respectively, of common stock from our employees in connection with minimum tax withholding requirements resulting from the vesting of restricted stock under our stock incentive plans.
Convertible Debt Securities. Under generally accepted accounting principles, convertible debt securities that may be settled in cash upon conversion (including partial cash settlement), which would include our 2010 Convertible Notes and our 2004 Convertible Debt Securities, must be separated into their liability and equity components at initial recognition by: (i) recording the liability component at the fair value of a similar liability that does not have an associated equity component; and (ii) attributing the remaining proceeds from the issuance to the equity component. A reconciliation of the beginning and ending balances of the equity component related to our convertible debt, included within additional paid-in capital, net of tax, is as follows (in thousands):
| 2004 Convertible Debt Securities |
2010 Convertible Debt Securities |
Totals | ||||||||||||||||||||||
| 2010 | 2009 | 2010 | 2009 | 2010 | 2009 | |||||||||||||||||||
| Balance, beginning of year |
$ | 39,752 | $ | 40,649 | $ | — | $ | — | $ | 39,752 | $ | 40,649 | ||||||||||||
| Issuances |
— | — | 22,928 | — | 22,928 | — | ||||||||||||||||||
| Repurchases |
(1,613 | ) | (897 | ) | — | — | (1,613 | ) | (897 | ) | ||||||||||||||
| Balance, end of year |
$ | 38,139 | $ | 39,752 | $ | 22,928 | $ | — | $ | 61,067 | $ | 39,752 | ||||||||||||
85
Table of Contents
NOTES TO CONSOLIDATED FINANCIAL STATEMENTS—(Continued)
11. Equity Compensation Plans
Stock Incentive Plans
Summary of Stock Incentive Plans. As of December 31, 2010, we have four stock incentive plans, as summarized below:
| Plan |
Shares Reserved For Issuance |
Shares Available For Issuance |
||||||
| 1996 Plan(1) |
— | — | ||||||
| 1997 Director Plan(2) |
— | — | ||||||
| 2005 Plan(1) |
12,400,000 | 5,386,278 | ||||||
| Total stockholder approved |
12,400,000 | 5,386,278 | ||||||
| 2001 Plan(3) |
3,000,000 | 952 | ||||||
| Total |
15,400,000 | 5,387,230 | ||||||
| (1) | The 2005 Stock Incentive Plan (the “2005 Plan”) was adopted upon stockholder approval. The 2005 Plan replaced the 1996 Stock Incentive Plan (the “1996 Plan”). No further grants may be made under the 1996 Plan, but any stock awards outstanding under the 1996 Plan remain in effect in accordance with their respective terms. The shares available under the 2005 Plan have been reserved for issuance to officers and other key employees of our company and its subsidiaries and to non-employee directors of our company in the form of stock options, stock appreciation rights, performance unit awards, restricted stock awards, or stock bonus awards. Shares granted under the 2005 Plan in the form of a performance unit award, restricted stock award or stock bonus award are counted toward the aggregate number of shares of common stock available for issuance under the 2005 Plan as two shares for every one share granted or issued in payment of such award. |
| (2) | The Stock Option Plan for Non-Employee Directors (the “1997 Director Plan”) was adopted upon stockholder approval. During 2006, the 1997 Director Plan terminated with respect to future grants, but any stock awards outstanding under the 1997 Director Plan remain in effect in accordance with their respective terms. |
| (3) | The 2001 Stock Incentive Plan (the “2001 Plan”) was adopted without stockholder approval. The shares available under the 2001 Plan have been reserved for issuance to eligible employees of our company in the form of stock options, stock appreciation rights, performance unit awards, restricted stock awards, or stock bonus awards. Shares available under the 2001 Plan may be granted to key employees of our company or its subsidiaries who are not: (i) officers or directors; (ii) “covered employees” for purposes of Section 162(m) of the Internal Revenue Code; or (iii) persons subject to Section 16 of the Securities Exchange Act of 1934. |
Restricted Stock. We generally issue new shares (versus treasury shares) to fulfill restricted stock award grants. Restricted stock awards are granted at no cost to the recipient. Historically, our restricted stock awards have vested annually over four years with no restrictions other than the passage of time (i.e., the shares are released upon calendar vesting with no further restrictions) (“Time-Based Awards”). Unvested Time-Based Awards are typically forfeited and cancelled upon termination of employment with our company. Certain Time-Based Awards become fully vested upon a change in control, as defined, and the subsequent involuntary termination of employment. The fair value of the Time-Based Awards (determined by using the closing market price of our common stock on the grant date) is charged to expense on a straight-line basis over the requisite service period for the entire award.
Beginning in 2007, we began issuing restricted stock shares to key members of management that vest in equal installments over three years upon meeting either pre-established financial performance objectives or pre-established stock price objectives (“Performance-Based Awards”). The structure of the performance goals for the Performance-Based Awards has been approved by our stockholders. The Performance-Based Awards become
86
Table of Contents
NOTES TO CONSOLIDATED FINANCIAL STATEMENTS—(Continued)
fully vested upon a change in control, as defined, and the subsequent involuntary termination of employment. The fair value of the Performance-Based Awards (determined by using the closing market price of our common stock on the grant date) is charged to expense on a straight-line basis over the requisite service period for each separately vesting portion of the award as if the award is, in-substance, multiple awards.
A summary of our unvested restricted stock activity during 2010 is as follows:
| 2010 | ||||||||
| Shares | Weighted- Average Grant Date Fair Value |
|||||||
| Unvested awards, January 1, 2010 |
1,751,717 | $ | 16.12 | |||||
| Awards granted |
877,250 | 19.73 | ||||||
| Awards forfeited/cancelled |
(109,358 | ) | 16.26 | |||||
| Awards vested |
(715,638 | ) | 17.81 | |||||
| Unvested awards, December 31, 2010 |
1,803,971 | $ | 17.19 | |||||
The weighted-average grant date fair value of restricted stock shares granted during 2010, 2009, and 2008, was $19.73 per share, $14.48 per share, and $12.22 per share, respectively. The total market value of restricted stock shares vesting during 2010, 2009, and 2008 was $14.4 million, $8.5 million, and $5.7 million, respectively.
Stock Options. In 2003, we began primarily granting restricted stock awards instead of stock options to employees and non-employee directors under our equity compensation plans. Historically, stock option awards were granted with an exercise price equal to the fair value of our common stock as of the date of grant and typically vested over four years, with a maximum term of ten years. No stock options were awarded during 2010, 2009, or 2008.
1996 Employee Stock Purchase Plan
As of December 31, 2010, we had an employee stock purchase plan whereby 958,043 shares of our common stock have been reserved for sale to our employees through payroll deductions. The price for shares purchased under the plan is 85% of market value on the last day of the purchase period. Purchases are made at the end of each month. During 2010, 2009, and 2008, 70,595, 88,368, and 90,728 shares, respectively, were purchased under the plan for $1.2 million ($15.50 to $19.31 per share), $1.1 million, ($11.25 to $16.46 per share), and $1.1 million, ($9.37 to $16.07 per share), respectively. As of December 31, 2010, 75,485 shares remain eligible for purchase under the plan.
Stock-Based Compensation Expense
We recorded stock-based compensation expense of $12.3 million, $12.6 million, and $11.6 million, respectively, for 2010, 2009, and 2008. As of December 31, 2010, there was $21.0 million of total compensation cost related to unvested awards not yet recognized. That cost, excluding the impact of forfeitures, is expected to be recognized over a weighted-average period of 2.7 years.
We recorded a deferred income tax benefit related to stock-based compensation expense during 2010, 2009, and 2008, of $4.6 million, $4.9 million, and $4.4 million, respectively. The actual income tax benefit realized for the tax deductions from stock option exercises and vesting of restricted stock for 2010, 2009, and 2008, totaled $5.5 million, $3.4 million, and $2.2 million, respectively.
87
Table of Contents
NOTES TO CONSOLIDATED FINANCIAL STATEMENTS—(Continued)
12. Unaudited Quarterly Financial Data
| Quarter Ended | ||||||||||||||||
| March 31 | June 30 | September 30 | December 31 | |||||||||||||
| (in thousands, except per share amounts) | ||||||||||||||||
| 2010: |
||||||||||||||||
| Total revenues(1) |
$ | 130,263 | $ | 131,346 | $ | 133,691 | $ | 154,079 | ||||||||
| Operating income(1)(2) |
16,402 | 14,757 | 22,522 | 20,661 | ||||||||||||
| Income before income taxes(1)(2)(3)(4) |
1,716 | 11,700 | 17,985 | 2,272 | ||||||||||||
| Income tax provision(5) |
(652 | ) | (234 | ) | (6,295 | ) | (4,063 | ) | ||||||||
| Net income (loss)(1)(2)(3)(4)(5) |
1,064 | 11,466 | 11,690 | (1,791 | ) | |||||||||||
| Basic earnings (loss) per common share(1)(2)(3)(4)(5) |
$ | 0.03 | $ | 0.35 | $ | 0.36 | $ | (0.05 | ) | |||||||
| Diluted earnings (loss) per common share(1)(2)(3)(4)(5) |
0.03 | 0.35 | 0.35 | (0.05 | ) | |||||||||||
| 2009: |
||||||||||||||||
| Total revenues |
$ | 123,546 | $ | 124,836 | $ | 124,548 | $ | 127,787 | ||||||||
| Operating income(6) |
21,579 | 19,587 | 17,307 | 16,274 | ||||||||||||
| Income from continuing operations before income taxes(6)(7) |
19,731 | 16,466 | 14,097 | 13,075 | ||||||||||||
| Income tax provision |
(6,906 | ) | (5,763 | ) | (4,229 | ) | (4,609 | ) | ||||||||
| Income from continuing operations(6)(7) |
12,825 | 10,703 | 9,868 | 8,466 | ||||||||||||
| Discontinued operations, net of tax |
— | — | 1,471 | — | ||||||||||||
| Net income(6)(7) |
12,825 | 10,703 | 11,339 | 8,466 | ||||||||||||
| Basic earnings per common share: |
||||||||||||||||
| Income from continuing operations(6)(7) |
$ | 0.37 | $ | 0.31 | $ | 0.29 | $ | 0.25 | ||||||||
| Discontinued operations, net of tax |
— | — | 0.04 | — | ||||||||||||
| Net income |
$ | 0.37 | $ | 0.31 | $ | 0.33 | $ | 0.25 | ||||||||
| Diluted earnings per common share: |
||||||||||||||||
| Income from continuing operations(6)(7) |
$ | 0.37 | $ | 0.31 | $ | 0.29 | $ | 0.24 | ||||||||
| Discontinued operations, net of tax |
— | — | 0.04 | — | ||||||||||||
| Net income |
$ | 0.37 | $ | 0.31 | $ | 0.33 | $ | 0.24 | ||||||||
| (1) | During the fourth quarter of 2010, we completed the Intec Acquisition, and as a result, one month of Intec operations are included in the fourth quarter 2010 results (see Note 2). Additionally, in conjunction with the Intec Acquisition, during the third and fourth quarters of 2010, we incurred $2.6 million and $9.6 million, respectively, or $0.05 and $0.20 per diluted share impact, of Intec acquisition-related charges. |
| (2) | In 2010, we completed the transition of our data processing and related computer services from FDC to Infocrossing, (see Note 9). As a result, during the first, second, third, and fourth quarters of 2010, we incurred expenses of $7.7 million, $10.6 million, $1.8 million, and $0.3 million, respectively, or $0.14, $0.20, $0.04, and $0.01 per diluted share impact, related to these transition efforts. |
| (3) | The first, third, and fourth quarters of 2010 results of operations includes losses of $11.0 million, $1.7 million, and $0.1 million, respectively, or $0.20, $0.03, and $0.00 per diluted share impact, related to the repurchase of $119.9 million, $23.2 million and $2.1 million of our 2004 Convertible Debt Securities (see Note 6). |
| (4) | During the fourth quarter of 2010, we incurred a loss of $14.0 million, or $0.30 per diluted share impact, related to foreign currency transactions in conjunction with the Intec Acquisition (see Note 2). |
| (5) | Our income tax provision for 2010 was impacted by the following items: (i) during the second quarter of 2010, the IRS completed an examination with respect to our 2006, 2007, and 2008 Federal income tax |
88
Table of Contents
NOTES TO CONSOLIDATED FINANCIAL STATEMENTS—(Continued)
| returns, which resulted in favorable adjustments to our liability for unrecognized income tax benefits of approximately $4 million; and (ii) differences in book and tax treatment of approximately $4 million, for certain expenses incurred during the fourth quarter in conjunction with the Intec Acquisition (see Note 7). These two matters essentially offset each other such that the net impact left the overall effective income tax rate for 2010 relatively in-line with the 2009 rate. |
| (6) | In 2009, we began to transition our data processing and related computer services from FDC to Infocrossing (see Note 9). As a result, during the first, second, third, and fourth quarters of 2009, we incurred expenses of $1.4 million, $2.7 million, $5.1 million, and $6.3 million, respectively, or $0.03, $0.05, $0.10, and $0.12 per diluted share impact, related to these transition efforts. |
| (7) | The first quarter of 2009 results of operations include a gain of $1.5 million, or $0.03 per diluted share, related to the repurchase of $15.0 million of our 2004 Convertible Debt Securities (see Note 6). |
89
Table of Contents
| Item 9. | Changes in and Disagreements With Accountants on Accounting and Financial Disclosure |
None.
| Item 9A. | Controls and Procedures |
(a) Evaluation of Disclosure Controls and Procedures
As required by Rule 13a-15(b), our management, including the Chief Executive Officer (“CEO”) and Chief Financial Officer (“CFO”), conducted an evaluation as of the end of the period covered by this report of the effectiveness of our disclosure controls and procedures as defined in Rule 13a-15(e). Based on that evaluation, the CEO and CFO concluded that our disclosure controls and procedures were effective as of the end of the period covered by this report.
(b) Management’s Annual Report on Internal Control over Financial Reporting
As required by Rule 13a-15(d), our management, including the CEO and CFO, also conducted an evaluation of our internal control over financial reporting, as defined by Rule 13a-15(f). Management’s Report on Internal Control over Financial Reporting is located at the front of Part II, Item 8 of this report.
Our management’s evaluation excluded Intec Telecom Systems PLC (“Intec”), which we acquired on November 30, 2010. At December 31, 2010, Intec had $439.0 million and $332.2 million of total assets and net assets, respectively. For the year ended December 31, 2010, our Consolidated Statement of Income included total revenue associated with Intec of $17.8 million. In accordance with guidance issued by the SEC, companies are allowed to exclude acquisitions from their assessment of internal controls over financial reporting during the first year subsequent to the acquisition while integrating the acquired operations.
(c) Attestation Report of the Independent Registered Public Accounting Firm
Our independent registered public accounting firm issued an attestation report on the effectiveness of our internal control over financial reporting as of December 31, 2010. KPMG LLP’s report is located immediately following Management’s Report on Internal Control over Financial Reporting at the front of Part II, Item 8 of this report.
(d) Changes in Internal Control over Financial Reporting
Except as described above under 9A.(b) with respect to the Intec Acquisition, there were no changes in our internal control over financial reporting identified in connection with the evaluation required by paragraph (d) of Exchange Act Rules 13a-15 or 15d-15 that occurred during the fourth quarter of 2010 that have materially affected, or are reasonably likely to materially affect, our internal control over financial reporting.
| Item 9B. | Other Information |
None.
PART III
| Item 10. | Directors, Executive Officers and Corporate Governance |
See the Proxy Statement for our 2011 Annual Meeting of Stockholders, from which information regarding directors is incorporated herein by reference. Information regarding our executive officers will be omitted from such proxy statement and is furnished in a separate item captioned “Executive Officers of the Registrant” included at the end of Part I of this Form 10-K.
90
Table of Contents
| Item 11. | Executive Compensation |
See the Proxy Statement for our 2011 Annual Meeting of Stockholders, from which information in response to this Item is incorporated herein by reference.
| Item 12. | Security Ownership of Certain Beneficial Owners and Management and Related Stockholder Matters |
See the Proxy Statement for our 2011 Annual Meeting of Stockholders, from which information required by this Item is incorporated herein by reference, with the exception of the equity compensation plan information which is presented in Item 5, “Market for Registrant’s Common Equity, Related Stockholder Matters and Issuer Purchases of Equity Securities”, and is incorporated herein by reference.
| Item 13. | Certain Relationships and Related Transactions, and Director Independence |
See the Proxy Statement for our 2011 Annual Meeting of Stockholders, from which information in response to this Item is incorporated herein by reference.
| Item 14. | Principal Accounting Fees and Services |
See the Proxy Statement for our 2011 Annual Meeting of Stockholders, from which information in response to this Item is incorporated herein by reference.
PART IV
| Item 15. | Exhibits, Financial Statement Schedules |
| (a) | Financial Statements, Financial Statement Schedules, and Exhibits: |
| (1) | Financial Statements |
The financial statements filed as part of this report are listed on the Index to Consolidated Financial Statements on page 53.
| (2) | Financial Statement Schedules: |
None. Any information required in the Financial Statement Schedules is provided in sufficient detail in our Consolidated Financial Statements and notes thereto.
| (3) | Exhibits |
Exhibits are listed in the Exhibit Index on page 93.
The Exhibits include management contracts, compensatory plans and arrangements required to be filed as exhibits to the Form 10-K by Item 601 of Regulation S-K.
| (b) | Exhibits |
The Exhibits filed or incorporated by reference herewith are as specified in the Exhibit Index.
91
Table of Contents
Pursuant to the requirements of Section 13 or 15(d) of the Securities Exchange Act of 1934, the registrant has duly caused this report to be signed on its behalf by the undersigned, thereunto duly authorized.
| CSG SYSTEMS INTERNATIONAL, INC. | ||
| By: |
/s/ PETER E. KALAN | |
| Peter E. Kalan | ||
| Chief Executive Officer | ||
| (Principal Executive Officer) | ||
Date: March 8, 2011
Pursuant to the requirements of the Securities Exchange Act of 1934, this report has been signed below by the following persons on behalf of the registrant and in capacities and on the dates indicated.
| Signature |
Title |
Date | ||
| /s/ DONALD B. REED Donald B. Reed |
Chairman of the Board of Directors |
March 8, 2011 | ||
| /s/ PETER E. KALAN Peter E. Kalan |
Director, Chief Executive Officer, and President |
March 8, 2011 | ||
| /s/ RANDY R. WIESE Randy R. Wiese |
Executive Vice President, Chief Financial Officer, and Chief Accounting Officer (Principal Financial Officer and Principal Accounting Officer) |
March 8, 2011 | ||
| /s/ RONALD COOPER Ronald Cooper |
Director |
March 8, 2011 | ||
| /s/ EDWARD C. NAFUS Edward C. Nafus |
Director |
March 8, 2011 | ||
| /s/ JANICE I. OBUCHOWSKI Janice I. Obuchowski |
Director |
March 8, 2011 | ||
| /s/ BERNARD W. REZNICEK Bernard W. Reznicek |
Director |
March 8, 2011 | ||
| /s/ FRANK V. SICA Frank V. Sica |
Director |
March 8, 2011 | ||
| /s/ DONALD V. SMITH Donald V. Smith |
Director |
March 8, 2011 | ||
| /s/ JAMES A. UNRUH James A. Unruh |
Director |
March 8, 2011 | ||
92
Table of Contents
EXHIBIT INDEX
| Exhibit Number |
Description | |
| 2.10(29) | Implementation Agreement between CSG Systems International, Inc. and Intec | |
| 3.01(1) | Restated Certificate of Incorporation of the Company | |
| 3.02(8) | Revised Bylaws of CSG Systems International, Inc. | |
| 3.03(2) | Certificate of Amendment of Restated Certificate of Incorporation of CSG Systems International, Inc. | |
| 4.01(1) | Form of Common Stock Certificate | |
| 4.10(6) | Indenture dated as of June 2, 2004 between the Registrant and Deutsche Bank Trust Company Americas relating to the CODES | |
| 4.20(6) | Registration Rights Agreement dated as of June 2, 2004 between the Registrant and Lehman Brothers Inc. | |
| 4.25(25) | Letter agreement dated March 18, 2010 by and between CSG Systems International, Inc. and Quantum Partners Ltd. regarding $119,896,000 aggregate principal amount of CSG’s 2.5% Senior Subordinated Convertible Contingent Debt Securities due 2024 | |
| 4.30(26) | Purchase Agreement dated February 24, 2010, by and between CSG Systems International, Inc., and Barclays Capital Inc., J.P. Morgan Securities Inc., and UBS Securities LLC | |
| 4.40(26) | Indenture dated March 1, 2010 between CSG Systems International, Inc. and The Bank of New York Mellon Trust Company, N.A., as trustee | |
| 4.50 | $300,000,000 Amended and Restated Credit Agreement dated as of September 24, 2010, as Amended and Restated as of November 24, 2010, among CSG Systems International, Inc., as Borrower, The Guarantors Party Hereto, The Lenders Party Hereto, UBS Securities LLC and RBC Capital Markets as Joint Lead Arrangers and Joint Bookmanagers, RBC Capital Markets, as Syndication Agent, J.P. Morgan Chase Bank, N.A., Keybank National Association, Fifth Third Bank, BBVA Compass, U.S. Bank National Association, Wells Fargo Bank, National Association and HSBC Bank USA, National Association, as Co-Documentation Agents, UBS AG, Stamford Branch, as Issuing Bank, Administrative Agent and Collateral Agent, and UBS Loan Finance LLC, as Swingline Lender | |
| 10.01(1) | CSG Systems International, Inc. 1995 Incentive Stock Plan | |
| 10.02(24) | Amended and Restated 1996 Employee Stock Purchase Plan, as adopted on November 19, 2009 | |
| 10.03(15) | CSG Systems International, Inc. 1996 Stock Incentive Plan, as amended August 14, 2007 | |
| 10.04(15) | CSG Systems International, Inc. 2005 Stock Incentive Plan, as amended August 14, 2007 | |
| 10.05(15) | CSG Systems International, Inc. Performance Bonus Program, as amended August 14, 2007 | |
| 10.06(15) | CSG Systems International, Inc. 2001 Stock Incentive Plan, as amended August 14, 2007 | |
| 10.15(27) | Form of Indemnification Agreement between CSG Systems International, Inc. and Directors and Executive Officers | |
| 10.16(11) | Indemnification Agreement between CSG Systems International, Inc. and Mr. Ronald Cooper, dated November 16, 2006 | |
| 10.21*(19) | CSG Master Subscriber Management System Agreement Between CSG Systems, Inc. and Comcast Cable Communications Management, LLC | |
| 10.21A* | Fifth Amendment to the Restated and Amended CSG Master Subscriber Management System Agreement Between CSG Systems, Inc. and Comcast Cable Communications Management, LLC | |
| 10.22*(10) | CSG Master Subscriber Management System Agreement between CSG Systems, Inc. and EchoStar Satellite L.L.C. effective November 1, 2005 | |
Table of Contents
| Exhibit Number |
Description | |
| 10.22A*(12) | First and Second Amendment to CSG Master Subscriber Management System Agreement between CSG Systems, Inc. and EchoStar Satellite L.L.C. | |
| 10.22B*(16) | Third Amendment to CSG Master Subscriber Management System Agreement between CSG Systems, Inc. and EchoStar Satellite L.L.C. | |
| 10.22C*(17) | Fourth Amendment to CSG Master Subscriber Management System Agreement between CSG Systems, Inc. and EchoStar Satellite L.L.C. | |
| 10.22D*(19) | Ninth Amendment to CSG Master Subscriber Management System Agreement between CSG Systems, Inc. and DISH Network L.L.C. | |
| 10.22E(20) | Seventeenth Amendment to CSG Master Subscriber Management System Agreement between CSG Systems, Inc. and DISH Network L.L.C. | |
| 10.22F*(21) | Tenth and Eleventh Amendment to CSG Master Subscriber Management System Agreement between CSG Systems, Inc. and DISH Network L.L.C. | |
| 10.23*(24) | CSG Master Subscriber Management System Agreement between CSG Systems, Inc. and Dish Network L.L.C. | |
| 10.23A*(27) | Third Amendment to the CSG Master Subscriber Management System Agreement between CSG Systems, Inc. and Dish Network, L.L.C. | |
| 10.23B* | Fourth Amendment to the CSG Master Subscriber Management System Agreement between CSG Systems, Inc. and Dish Network, L.L.C. | |
| 10.24*(23) | CSG Master Subscriber Management System Agreement between CSG Systems, Inc. and Time Warner Cable dated March 13, 2003 | |
| 10.24A*(23) | ComTec Processing and Production Services Agreement | |
| 10.24B*(23) | Second Amendment to the Processing and Production Services Agreement between CSG Systems, Inc. and Time Warner Cable Inc. | |
| 10.24C* | Forty-ninth Amendment of the CSG Master Subscriber Management System Agreement between CSG Systems, Inc. and Time Warner Cable Inc. | |
| 10.39(19) | CSG Systems, Inc. Wealth Accumulation Plan, as amended August 15, 2008 | |
| 10.40*(5) | Third Amended and Restated Services Agreement between First Data Technologies, Inc. and CSG Systems, Inc. dated August 1, 2003 | |
| 10.40A*(9) | First Amendment to Third Amended and Restated Services Agreement between First Data Technologies, Inc. and CSG Systems, Inc. dated June 28, 2005 | |
| 10.40B(24) | Second Amendment to Third Amended and Restated Services Agreement between First Data Technologies, Inc. and CSG Systems, Inc. dated February 21, 2010 | |
| 10.40C(24) | Fifth Amendment to Services Agreement between First Data Technologies, Inc. and CSG Systems, Inc. dated February 21, 2010 | |
| 10.41A*(23) | Work Order for Mainframe Computer Service between Infocrossing, LLC and CSG Systems, Inc. dated December 15, 2008 | |
| 10.41B*(23) | Work Order for Open Systems Computer Service between Infocrossing, LLC and CSG Systems, Inc. dated December 15, 2008 | |
| 10.44(3) | CSG Systems International, Inc. Stock Option Plan for Non-Employee Directors | |
| 10.46(18) | Restated Employment Agreement with Robert M. Scott, dated May 29, 2008 | |
Table of Contents
| Exhibit Number |
Description | |
| 10.46A(19) | First Amendment to Restated Employment Agreement with Robert M. Scott, dated August 19, 2008 | |
| 10.46B(22) | Second Amendment to Restated Employment Agreement with Robert M. Scott dated February 19, 2009 | |
| 10.47(18) | Restated Employment Agreement with Randy R. Wiese, dated May 29, 2008 | |
| 10.47A(19) | First Amendment to Restated Employment Agreement with Randy R. Wiese, dated August 19, 2008 | |
| 10.48(18) | Restated Employment Agreement with Peter E. Kalan, dated May 29, 2008 | |
| 10.48A(19) | First Amendment to Restated Employment Agreement with Peter E. Kalan, dated August 19, 2008 | |
| 10.49(18) | Restated Employment Agreement with Joseph T. Ruble, dated May 29, 2008 | |
| 10.49A(19) | First Amendment to Restated Employment Agreement with Joseph T. Ruble, dated August 19, 2008 | |
| 10.50(4) | CSG Systems International, Inc. 2001 Stock Incentive Plan | |
| 10.51(22) | Employment Agreement with Bret C. Griess dated February 19, 2009 | |
| 10.52(28) | Employment Agreement with Michael J. Henderson, dated July 1, 2010 | |
| 10.80(7) | Forms of Agreement for Equity Compensation | |
| 10.80A(14) | Forms of Agreement for Equity Compensation | |
| 10.80B(13) | Forms of Agreement for Equity Compensation | |
| 10.80C(15) | Forms of Agreement for Equity Compensation | |
| 10.81(19) | Forms of Agreement for Equity Compensation | |
| 21.01 | Subsidiaries of the Registrant | |
| 23.01 | Consent of KPMG LLP | |
| 31.01 | Certifications Pursuant to Section 302 of the Sarbanes-Oxley Act of 2002 | |
| 31.02 | Certifications Pursuant to Section 302 of the Sarbanes-Oxley Act of 2002 | |
| 32.01 | Certification pursuant to 18 U.S.C. Section 1350, as Adopted Pursuant to Section 906 of the Sarbanes-Oxley Act of 2002 | |
| (1) | Incorporated by reference to the exhibit of the same number to the Registration Statement No. 333-244 on Form S-1. |
| (2) | Incorporated by reference to the exhibit of the same number to the Registrant’s Quarterly Report on Form 10-Q for the period ended June 30, 1997. |
| (3) | Incorporated by reference to the exhibit of the same number to the Registrant’s Quarterly Report on Form 10-Q for the period ended June 30, 2001. |
| (4) | Incorporated by reference to the exhibit of the same number to the Registrant’s Quarterly Report on Form 10-Q for the period ended June 30, 2002. |
| (5) | Incorporated by reference to the exhibit of the same number to the Registrant’s Quarterly Report on Form 10-Q for the period ended September 30, 2003. |
| (6) | Incorporated by reference to the exhibit of the same number to the Registrant’s Registration Statement No. 333-117427 on Form S-3. |
| (7) | Incorporated by reference to the exhibit of the same number to the Registrant’s Quarterly Report on Form 10-Q for the period ended September 30, 2004. |
Table of Contents
| (8) | Incorporated by reference to the exhibit of the same number to the Registrant’s Current Report on Form 8-K for the event dated May 26, 2005. |
| (9) | Incorporated by reference to the exhibit of the same number to the Registrant’s Quarterly Report on Form 10-Q for the period ended June 30, 2005. |
| (10) | Incorporated by reference to the exhibit of the same number to the Registrant’s Annual Report on Form 10-K for the year ended December 31, 2005. |
| (11) | Incorporated by reference to the exhibit of the same number to the Registrant’s Current Report on Form 8-K for the event dated November 16, 2006. |
| (12) | Incorporated by reference to the exhibit of the same number to the Registrant’s Annual Report on Form 10-K for the year ended December 31, 2006. |
| (13) | Incorporated by reference to the exhibit of the same number to the Registrant’s Quarterly Report on Form 10-Q for the period ended March 31, 2007. |
| (14) | Incorporated by reference to the exhibit of the same number to the Registrant’s Quarterly Report on Form 10-Q for the period ended June 30, 2007. |
| (15) | Incorporated by reference to the exhibit of the same number to the Registrant’s Quarterly Report on Form 10-Q for the period ended September 31, 2007. |
| (16) | Incorporated by reference to the exhibit of the same number to the Registrant’s Annual Report on Form 10-K for the year ended December 31, 2007. |
| (17) | Incorporated by reference to the exhibit of the same number to the Registrant’s Quarterly Report on Form 10-Q for the period ended March 31, 2008. |
| (18) | Incorporated by reference to the exhibit of the same number to the Registrant’s Quarterly Report on Form 10-Q for the period ended June 30, 2008. |
| (19) | Incorporated by reference to the exhibit of the same number to the Registrant’s Quarterly Report on Form 10-Q for the period ended September 30, 2008. |
| (20) | Incorporated by reference to the exhibit of the same number to the Registrant’s Current Report on Form 8-K for the event dated December 31, 2008. |
| (21) | Incorporated by reference to the exhibit of the same number to the Registrant’s Annual Report on Form 10-K for the year ended December 31, 2008. |
| (22) | Incorporated by reference to the exhibit of the same number to the Registrant’s Quarterly Report on Form 10-Q for the period ended March 31, 2009. |
| (23) | Incorporated by reference to the exhibit of the same number to the Registrant’s Annual Report on Form 10-K/A for the year ended December 31, 2008, filed on September 8, 2009. |
| (24) | Incorporated by reference to the exhibit of the same number to the Registrant’s Annual Report on Form 10-K for the year ended December 31, 2009. |
| (25) | Incorporated by reference to the exhibit of the same number to the Registrant’s Current Report on Form 8-K for the event dated March 18, 2010. |
| (26) | Incorporated by reference to the exhibit of the same number to the Registrant’s Current Report on Form 8-K for the event dated February 24, 2010. |
| (27) | Incorporated by reference to the exhibit of the same number to the Registrant’s Quarterly Report on Form 10-Q for the period ended March 31, 2010. |
| (28) | Incorporated by reference to the exhibit of the same number to the Registrant’s Current Report on Form 8-K for the event dated July 13, 2010. |
| (29) | Incorporated by reference to the exhibit of the same number to the Registrant’s Quarterly Report on Form 10-Q for the period ended September 30, 2010. |
| * | Portions of the exhibit have been omitted pursuant to an application for confidential treatment, and the omitted portions have been filed separately with the Commission. |