Attached files
| file | filename |
|---|---|
| EX-31.1 - Breitburn Energy Partners LP | v213936_ex31-1.htm |
| EX-32.1 - Breitburn Energy Partners LP | v213936_ex32-1.htm |
| EX-23.1 - Breitburn Energy Partners LP | v213936_ex23-1.htm |
| EX-23.2 - Breitburn Energy Partners LP | v213936_ex23-2.htm |
| EX-99.2 - Breitburn Energy Partners LP | v213936_ex99-2.htm |
| EX-99.1 - Breitburn Energy Partners LP | v213936_ex99-1.htm |
| EX-21.1 - Breitburn Energy Partners LP | v213936_ex21-1.htm |
| EX-31.2 - Breitburn Energy Partners LP | v213936_ex31-2.htm |
| EX-23.3 - Breitburn Energy Partners LP | v213936_ex23-3.htm |
| EX-32.2 - Breitburn Energy Partners LP | v213936_ex32-2.htm |
| EX-10.21 - Breitburn Energy Partners LP | v213936_ex10-21.htm |
| EX-10.24 - Breitburn Energy Partners LP | v213936_ex10-24.htm |
| EX-10.22 - Breitburn Energy Partners LP | v213936_ex10-22.htm |
| EX-10.25 - Breitburn Energy Partners LP | v213936_ex10-25.htm |
| EX-10.23 - Breitburn Energy Partners LP | v213936_ex10-23.htm |
UNITED STATES SECURITIES AND EXCHANGE COMMISSION
Washington, D.C. 20549
FORM 10-K
|
þ
|
Annual Report Pursuant to Section 13 or 15(d) of the Securities Exchange Act of 1934
|
For the fiscal year ended December 31, 2010
or
|
¨
|
Transition Report Pursuant to Section 13 or 15(d) of the Securities Exchange Act of 1934
|
For the transition period from ___ to ___
Commission file number 001-33055
BreitBurn Energy Partners L.P.
(Exact name of registrant as specified in its charter)
|
Delaware
|
74-3169953
|
|
(State or other jurisdiction of
|
(I.R.S. Employer
|
|
incorporation or organization)
|
Identification No.)
|
|
515 South Flower Street, Suite 4800
|
|
|
Los Angeles, California
|
90071
|
|
(Address of principal executive offices)
|
(Zip Code)
|
Registrant’s telephone number, including area code: (213) 225-5900
Securities registered pursuant to Section 12(b) of the Act:
|
Title of each class
|
Name of each exchange on which registered
|
|
|
Common Units Representing Limited Partner Interests
|
The NASDAQ Stock Market LLC
|
Securities registered pursuant to section 12(g) of the Act: None
Indicate by check mark if the registrant is a well-known seasoned issuer, as defined in Rule 405 of the Securities Act. Yes þ No ¨
Indicate by check mark if the registrant is not required to file reports pursuant to Section 13 or Section 15(d) of the Act. Yes ¨ No þ
Indicate by check mark whether registrant (1) has filed all reports required to be filed by Section 13 or 15(d) of the Securities Exchange Act of 1934 during the preceding 12 months (or for such shorter period that the registrant was required to file such reports), and (2) has been subject to such filing requirements for the past 90 days. Yes þ No ¨
Indicate by check mark whether the registrant has submitted electronically and posted on its corporate Web site, if any, every Interactive Data File required to be submitted and posted pursuant to Rule 405 of Regulation S-T (§232.405 of this chapter) during the preceding 12 months (or for such shorter period that the registrant was required to submit and post such files). Yes ¨ No ¨
Indicate by check mark if disclosure of delinquent filers pursuant to Item 405 of Regulation S-K (§229.405 of this chapter) is not contained herein, and will not be contained, to the best of registrant’s knowledge, in definitive proxy or information statements incorporated by reference in Part III of this Form 10-K or any amendment to this Form 10-K. ¨
Indicate by check mark whether the registrant is a large accelerated filer, an accelerated filer, a non-accelerated filer, or a smaller reporting company. See the definitions of “large accelerated filer,” “accelerated filer” and “smaller reporting company” in Rule 12b-2 of the Exchange Act. Large accelerated filer ¨ Accelerated filer þ Non-accelerated filer ¨ (Do not check if a smaller reporting company)
Smaller reporting company ¨
Indicate by check-mark whether the registrant is a shell company (as defined in Rule 12b-2 of the Act). Yes ¨ No þ
The aggregate market value of the Common Units held by non-affiliates was approximately $520,687,000 on June 30, 2010, the last business day of the registrant’s most recently completed second fiscal quarter, based on $14.93 per unit, the last reported sales price on such date. For purposes of this calculation, Quicksilver Resources Inc., which owned 17,728,071 Common Units on such date, is considered an affiliate of the registrant.
As of March 9, 2011, there were 59,039,933 Common Units outstanding.
Documents Incorporated By Reference: Certain information called for in Items 10, 11, 12, 13 and 14 of Part III are incorporated by reference from the registrant’s definitive proxy statement for the 2011 annual meeting of unitholders to be held on June 23, 2011.
TABLE OF CONTENTS
The following is a description of the meanings of some of the oil and gas industry terms that may be used in this report. The definitions of proved developed reserves, proved reserves and proved undeveloped reserves have been abbreviated from the applicable definitions contained in Rule 4-10(a)(2-4) of Regulation S-X.
API gravity scale: A gravity scale devised by the American Petroleum Institute.
Bbl: One stock tank barrel, or 42 U.S. gallons of liquid volume, of crude oil or other liquid hydrocarbons.
Bbl/d: Bbl per day.
Bcf: One billion cubic feet of natural gas.
Bcfe: One billion cubic feet equivalent, determined using the ratio of one Bbl of crude oil to six Mcf of natural gas.
Boe: One barrel of oil equivalent, determined using the ratio of six Mcf of natural gas to one Bbl of crude oil.
Boe/d: Boe per day.
Btu: British thermal unit, which is the quantity of heat required to raise the temperature of a one-pound mass of water by one degree Fahrenheit.
development well: A well drilled within the proved area of a natural gas or oil reservoir to the depth of a stratigraphic horizon known to be productive.
dry hole or well: A well found to be incapable of producing either oil or gas in sufficient quantities to justify completion as an oil or gas well.
economically producible: A resource which generates revenue that exceeds, or is reasonably expected to exceed, the costs of the operation.
exploitation: A drilling or other project which may target proven or unproven reserves (such as probable or possible reserves), but which generally has a lower risk than that associated with exploration projects.
exploratory well: A well drilled to find a new field or to find a new reservoir in a field previously found to be productive of oil or gas in another reservoir. Generally, an exploratory well is not a development well.
field: An area consisting of a single reservoir or multiple reservoirs all grouped on or related to the same individual geological structural feature and/or stratigraphic condition.
gross acres or gross wells: The total acres or wells, as the case may be, in which a working interest is owned.
LIBOR: London Interbank Offered Rate.
MBbls: One thousand barrels of crude oil or other liquid hydrocarbons.
MBoe: One thousand barrels of oil equivalent.
MBoe/d: One thousand barrels of oil equivalent per day.
Mcf: One thousand cubic feet of natural gas.
Mcf/d: One thousand cubic feet of natural gas per day.
Mcfe: One thousand cubic feet of natural gas equivalent, determined using the ratio of one Bbl of crude oil to six Mcf of natural gas.
MichCon: Michigan Consolidated Gas Company.
1
MMBoe: One million barrels of oil equivalent.
MMBtu: One million British thermal units.
MMBtu/d: One million British thermal units per day.
MMcf: One million cubic feet of natural gas.
MMcfe: One million cubic feet of natural gas equivalent, determined using the ratio of one Bbl of crude oil to six Mcf of natural gas.
MMcfe/d: One million cubic feet of natural gas equivalent per day, determined using the ratio of one Bbl of crude oil to six Mcf of natural gas.
net acres or net wells: The sum of the fractional working interests owned in gross acres or gross wells, as the case may be.
NGLs: The combination of ethane, propane, butane and natural gasolines that when removed from natural gas become liquid under various levels of higher pressure and lower temperature.
NYMEX: New York Mercantile Exchange.
oil: Crude oil, condensate and natural gas liquids.
productive well: A well that is producing or that is mechanically capable of production.
proved developed reserves: Proved reserves that can be expected to be recovered (i) through existing wells with existing equipment and operating methods or in which the cost of the required equipment is relatively minor compared to the cost of a new well, and (ii) through installed extraction equipment and infrastructure operational at the time of the reserves estimate.
proved reserves: The estimated quantities of crude oil, natural gas and natural gas liquids that geological and engineering data demonstrate with reasonable certainty to be economically producible in future years from known reservoirs under existing economic and operating conditions and government regulations. The project to extract the hydrocarbons must have commenced or the operator must be reasonably certain that it will commence the project within a reasonable time. This definition of proved reserves has been abbreviated from the applicable definitions contained in Rule 4-10(a)(2-4) of Regulation S-X.
proved undeveloped reserves or PUDs: Proved reserves that are expected to be recovered from new wells on undrilled acreage or from existing wells where a relatively major expenditure is required for recompletion. This definition of proved undeveloped reserves has been abbreviated from the applicable definitions contained in Rule 4-10(a)(2-4) of Regulation S-X.
recompletion: The completion for production of an existing wellbore in another formation from that which the well has been previously completed.
reserve: Estimated remaining quantities of mineral deposits anticipated to be economically producible, as of a given date, by application of development projects to known accumulations.
reservoir: A porous and permeable underground formation containing a natural accumulation of producible oil and/or natural gas that is confined by impermeable rock or water barriers and is individual and separate from other reservoirs.
standardized measure: The present value of estimated future net revenue to be generated from the production of proved reserves, determined in accordance with the rules and regulations of the SEC (using prices and costs in effect as of the date of estimation), less future development, production and income tax expenses, and discounted at 10% per annum to reflect the timing of future net revenue. Standardized measure does not give effect to derivative transactions.
2
undeveloped acreage: Lease acreage on which wells have not been drilled or completed to a point that would permit the production of economic quantities of natural gas and oil regardless of whether such acreage contains proved reserves.
West Texas Intermediate (“WTI”): Light, sweet crude oil with high API gravity and low sulfur content used as the benchmark for U.S. crude oil refining and trading. WTI is deliverable at Cushing, Oklahoma to fill NYMEX futures contracts for light, sweet crude oil.
working interest: The operating interest that gives the owner the right to drill, produce and conduct operating activities on the property and to receive a share of production.
workover: Operations on a producing well to restore or increase production.
References in this filing to “the Partnership,” “we,” “our,” “us” or like terms refer to BreitBurn Energy Partners L.P. and its subsidiaries. References in this filing to “BEC” or the “Predecessor” refer to BreitBurn Energy Company L.P., our predecessor, and its predecessors and subsidiaries. References in this filing to “BreitBurn GP” or the “General Partner” refer to BreitBurn GP, LLC, our general partner and our wholly owned subsidiary as of June 17, 2008. References in this filing to “Provident” refer to Provident Energy Trust. References in this filing to “Pro GP” refer to Pro GP Corp., BEC’s former general partner up to August 26, 2008 and indirect subsidiary of Provident Energy Trust.
References in this fili ng to “Pro LP” refer to Pro LP Corp., BEC’s former limited partner and indirect subsidiary of Provident Energy Trust. References in this filing to “BreitBurn Corporation” refer to BreitBurn Energy Corporation, a corporation owned by Randall Breitenbach and Halbert Washburn, the President and Chief Executive Officer, respectively, of our general partner. References in this filing to “BreitBurn Management” refer to BreitBurn Management Company, LLC, our administrative manager, and wholly owned subsidiary as of June 17, 2008. References in this filing to “BOLP” or “BreitBurn Operating” refer to BreitBurn Operating L.P., our wholly owned operating subsidiary. References in this filing to “BOGP” refer to BreitBurn Operating GP, LLC, the general partner of BOLP. References in this filing to “Quicksilver” refer to Quicksilver Resources Inc. from whom we acquired oil and gas
properties and facilities in Michigan, Indiana and Ke ntucky on November 1, 2007. References in this filing to “BEPI” refer to BreitBurn Energy Partners I, L.P. References in this filing to “TIFD” refer to TIFD X-III LLC, from whom we acquired a 99% limited partner interest in BEPI on May 25, 2007, which owns interests in the Sawtelle and East Coyote oil fields located in California. References in this filing to “Utica” refer to BreitBurn Collingwood Utica LLC, our wholly owned subsidiary formed September 17, 2010.
3
Cautionary Statement Regarding Forward-Looking Information
Certain statements and information in this Annual Report on Form 10-K (“this report”) may constitute “forward-looking statements.” The words “believe,” “expect,” “anticipate,” “plan,” “intend,” “foresee,” “should,” “would,” “could” or other similar expressions are intended to identify forward-looking statements, which are generally not historical in nature. These forward-looking statements are based on our current expectations and beliefs concerning future developments and their potential effect on us. While management believes that these forward-looking statements are reasonable as and when made, there can be no assurance that future developments affecting us will be those that we
anticipate. All comments c oncerning our expectations for future revenues and operating results are based on our forecasts for our existing operations and do not include the potential impact of any future acquisitions. Our forward-looking statements involve significant risks and uncertainties (some of which are beyond our control) and assumptions that could cause actual results to differ materially from our historical experience and our present expectations or projections. Important factors that could cause actual results to differ materially from those in the forward-looking statements include, but are not limited to, those described in (1) Part I—Item 1A “—Risk Factors” and elsewhere in this report, and (2) our Quarterly Reports on Form 10-Q and Current Reports on Form 8-K filed with the Securities and Exchange Commission (“SEC”).
Readers are cautioned not to place undue reliance on forward-looking statements, which speak only as of the date hereof. We undertake no obligation to publicly update or revise any forward-looking statements after the date they are made, whether as a result of new information, future events or otherwise.
Overview
We are an independent oil and gas partnership focused on the acquisition, exploitation and development of oil and gas properties in the United States. Our objective is to manage our oil and gas producing properties for the purpose of generating cash flow and making distributions to our unitholders. Our assets consist primarily of producing and non-producing crude oil and natural gas reserves located primarily in:
|
|
·
|
the Antrim Shale and other non-Antrim formations in Michigan,
|
|
|
·
|
the Los Angeles Basin in California,
|
|
|
·
|
the Wind River and Big Horn Basins in central Wyoming,
|
|
|
·
|
the Sunniland Trend in Florida, and
|
|
|
·
|
the New Albany Shale in Indiana and Kentucky.
|
Our assets are characterized by stable, long-lived production and proved reserve life indexes averaging greater than 17 years. Our fields generally have long production histories, with some fields producing for over 100 years. We have high net revenue interests in our properties.
We are a Delaware limited partnership formed on March 23, 2006. We completed our initial public offering in October 2006. Our general partner is BreitBurn GP, a Delaware limited liability company, also formed on March 23, 2006, and our wholly owned subsidiary since June 17, 2008. The board of directors of our General Partner (the “Board”) has sole responsibility for conducting our business and managing our operations. We conduct our operations through a wholly owned subsidiary, BreitBurn Operating L.P (“BOLP”), and BOLP’s general partner, BreitBurn Operating GP, LLC (“BOGP”). We own all of the ownership interests in BOLP and BOGP.
Our wholly owned subsidiary, BreitBurn Management, manages our assets and performs other administrative services for us such as accounting, corporate development, finance, land administration, legal and engineering. See Note 6 to the consolidated financial statements in this report for more information regarding our relationship with BreitBurn Management.
4
Available Information
Our internet website address is www.breitburn.com. We make available, free of charge at the “Investor Relations” portion of our website, our Annual Report on Form 10-K, Quarterly Reports on Form 10-Q, Current Reports on Form 8-K and all amendments to those reports filed or furnished pursuant to Section 13(a) or 15(d) of the Securities Exchange Acts of 1934, as amended, as soon as reasonably practicable after such reports are electronically filed with, or furnished to, the SEC. The information contained on our website does not constitute part of this report.
Structure
The following diagram depicts our organizational structure as of December 31, 2010:

(1) BreitBurn GP, LLC holds the general partner interest in the Partnership.
In January 2011, we issued 118,771 Common Units to employees under our 2006 Long-Term Incentive Plan and 18,811 Common Units to outside directors for phantom units and distribution equivalent rights that were granted in 2008 and vested in January 2011. In February 2011, 4,945,000 Common Units were issued pursuant to a public equity offering. These issuances increased our outstanding Common Units to 59,039,933.
On February 11, 2011, we sold approximately 4.9 million Common Units at a price to the public of $21.25, resulting in proceeds net of underwriting discount of $100.5 million, which we used to repay outstanding debt under our credit facility.
5
Long-Term Business Strategy
Our long-term goals are to manage our oil and gas producing properties for the purpose of generating cash flow and making distributions to our unitholders. In order to meet these objectives, we plan to continue to follow our core investment strategy, which includes the following principles:
|
·
|
Acquire long-lived assets with low-risk exploitation and development opportunities;
|
|
|
·
|
Use our technical expertise and state-of-the-art technologies to identify and implement successful exploitation techniques to optimize reserve recovery;
|
|
·
|
Reduce cash flow volatility through commodity price and interest rate derivatives; and
|
|
|
·
|
Maximize asset value and cash flow stability through our operating and technical expertise.
|
2011 Outlook
In 2011, our crude oil and natural gas capital spending program is expected to be in the range of $70 million to $74 million, compared with approximately $70 million in 2010. We anticipate spending approximately 70% in California, Florida and Wyoming and approximately 30% in Michigan, Indiana and Kentucky. We expect to drill or re-drill approximately 40 wells, with 75% of our total capital spending focused on drilling and rate generating projects that are designed to increase or add to production or revenues. Without considering potential acquisitions, we expect production to be in the range of 6.5 MMBoe to 6.9 MMBoe in 2011.
Commodity hedging remains an important part of our strategy to reduce cash flow volatility. We use swaps, collars and options for managing risk relating to commodity prices. As of February 28, 2011, we had hedged approximately 84% of our 2011 expected production. In 2011, we had 8,506 Bbl/d of oil and 41,971 MMBtu/d of natural gas hedged at average prices of approximately $80.20 and $7.92, respectively. In 2012, we had 7,516 Bbl/d of oil and 38,257 MMBtu/d of natural gas hedged at average prices of approximately $87.97 and $8.05, respectively. In 2013, we had 6,980 Bbl/d of oil and 37,000 MMBtu/d of natural gas hedged at average prices of approximately $81.06 and $6.50, respectively. In 2014, we had 5,000 Bbl/d of oil and 7,500 MMBtu/d of natural gas hedged at average prices of approximately $88.60 and $6.00,
respectively. In 2015, we ha d 2,000 Bbl/d of oil hedged at an average price of $99.00.
Consistent with our long-term business strategy, we will continue to actively pursue oil and natural gas acquisition opportunities in 2011.
Properties
Our properties include natural gas, oil and midstream assets in Michigan, Indiana and Kentucky, including fields in the Antrim Shale in Michigan and the New Albany Shale in Indiana and Kentucky, transmission and gathering pipelines, three gas processing plants and four NGL recovery plants. Our properties also include fields in the Los Angeles Basin in California, including a limited partnership interest in a partnership that owns the East Coyote and Sawtelle fields in the Los Angeles Basin, fields in the Wind River and Big Horn Basins in central Wyoming and five fields in Florida’s Sunniland Trend.
In connection with our initial public offering, BEC contributed to our wholly owned subsidiaries certain fields in the Los Angeles Basin in California, including its interests in the Santa Fe Springs, Rosecrans and Brea Olinda Fields, substantially all of its oil and gas assets, liabilities and operations located in the Wind River and Big Horn Basins in central Wyoming and certain other assets and liabilities. In 2007, we completed seven acquisitions totaling approximately $1.7 billion, the largest of which was the acquisition of assets in Michigan, Indiana and Kentucky from Quicksilver Resources Inc. (“Quicksilver”) for approximately $1.46 billion. In 2008, we acquired Provident’s interest in BreitBurn Management, BreitBurn Corporation contributed its interest in BreitBurn Management to us, and
BreitBurn Management con tributed its interest in the General Partner to us, resulting in BreitBurn Management and the General Partner becoming our wholly owned subsidiaries. In 2009, we completed the sale of the Lazy JL field for $23 million in cash.
BreitBurn Management manages all of our properties and employs production and reservoir engineers, geologists and other specialists, as well as field personnel. On a net production basis, we operate approximately 85% of our production. As operator, we design and manage the development of wells and supervise operation and maintenance activities on a day-to-day basis. We do not own drilling rigs or other oil field services equipment used for drilling or maintaining wells on properties we operate. We engage independent contractors to provide all the equipment and personnel associated with these activities.
6
As of December 31, 2010, our total estimated proved reserves were 118.9 MMBoe, of which approximately 65% was natural gas and 35% was crude oil. As of December 31, 2009, our total estimated proved reserves were 111.3 MMBoe, of which approximately 65% was natural gas and 35% was crude oil. The total estimated reserve additions in 2010 of 14.3 MMBoe were partially offset by the 6.7 MMBoe of production resulting in a net gain of 7.6 MMBoe over 2009. The increase in 2010 was the result of drilling, recompletions, workovers, reserve acquisitions, addition of new drilling locations, economic factors, and revised estimates of existing reserves. The primary economic factor was an increase in commodity prices. Un-weighted average first-day-of-the-month crude oil and natural gas prices used to determine our total estimated
proved reserves as of De cember 31, 2010 were $79.40 per Bbl for crude oil (except Wyoming properties for which $65.36 per Bbl was used) and $4.38 per MMBtu for natural gas compared to $61.18 per Bbl for crude oil (except Wyoming properties for which $51.29 per Bbl was used) and $3.87 per MMBtu for natural gas in 2009.
See “Results of Operations” in Part II—Item 7 “—Management’s Discussion and Analysis of Financial Condition and Results of Operations” in this report for oil, NGL and natural gas production, average sales price per Boe and per Mcf and average production cost per Boe for 2010, 2009 and 2008.
The following table summarizes estimated proved developed and undeveloped oil and gas reserves based on average fiscal-year prices:
|
Summary of Oil and Gas Reserves
as of December 31, 2010
|
||||||||||||
|
Total
(MMBoe)
|
Oil
(MMBbl)
|
Gas
(Bcf)
|
||||||||||
|
Proved
|
||||||||||||
|
Developed
|
108.3 | 38.7 | 417.4 | |||||||||
|
Undeveloped
|
10.6 | 2.9 | 46.1 | |||||||||
|
Total proved
|
118.9 | 41.6 | 463.5 | |||||||||
During 2010, we incurred $32.6 million in capital expenditures and drilled 16 wells to convert 2.8 MMBbl of oil and 2.7 Bcf of natural gas from proved undeveloped to proved developed reserves. As of December 31, 2010, we had no material proved undeveloped reserves that have remained undeveloped for more than five years. As of December 31, 2010, proved undeveloped reserves were 10.6 MMBoe compared to 10.3 MMBoe as of December 31, 2009.
As of December 31, 2010, the total standardized measure of discounted future net cash flows was $1.06 billion. During 2010, we filed estimates of oil and gas reserves as of December 31, 2009 with the U.S. Department of Energy, which were consistent with the reserve data as of December 31, 2009 as reported in Note A in the supplemental information to the consolidated financial statements in this report.
7
The following table summarizes estimated proved reserves and production for our properties by state:
|
As of December 31, 2010
|
2010
|
|||||||||||||||||||
|
Estimated
|
Estimated
|
Average
|
||||||||||||||||||
|
Proved
|
Percent of Total
|
Proved Developed
|
Daily
|
|||||||||||||||||
|
Reserves (a)
|
Estimated Proved
|
Reserves
|
Production
|
Production
|
||||||||||||||||
|
(MMBoe)
|
Reserves
|
(MMBoe)
|
(MBoe)
|
(Boe/d)
|
||||||||||||||||
|
Michigan
|
80.3 | 67.5 | % | 71.2 | 3,899 | 10,683 | ||||||||||||||
|
California
|
14.6 | 12.3 | % | 14.0 | 1,165 | 3,190 | ||||||||||||||
|
Wyoming
|
12.3 | 10.4 | % | 11.4 | 800 | 2,192 | ||||||||||||||
|
Florida
|
9.3 | 7.8 | % | 9.3 | 621 | 1,702 | ||||||||||||||
|
Indiana
|
1.5 | 1.2 | % | 1.5 | 141 | 386 | ||||||||||||||
|
Kentucky
|
0.9 | 0.8 | % | 0.9 | 73 | 201 | ||||||||||||||
|
Total
|
118.9 | 100 | % | 108.3 | 6,699 | 18,354 | ||||||||||||||
(a) Our estimated proved reserves were determined using $4.38 per MMBtu for gas, $79.40 per Bbl of oil for Michigan, California and Florida and $65.36 per Bbl of oil for Wyoming.
Uncertainties are inherent in estimating quantities of proved reserves, including many factors beyond our control. Reserve engineering is a subjective process of estimating subsurface accumulations of oil and gas that cannot be measured in an exact manner, and the accuracy of any reserve estimate is a function of the quality of available data and its interpretation. As a result, estimates by different engineers often vary, sometimes significantly. In addition, physical factors such as the results of drilling, testing and production subsequent to the date of an estimate, as well as economic factors such as changes in product prices or development and production expenses, may require revision of such estimates. Accordingly, oil and gas quantities ultimately recovered
will vary from reserve es timates. See Part I—Item 1A “—Risk Factors” in this report, for a description of some of the risks and uncertainties associated with our business and reserves.
The information in this report relating to our estimated oil and gas proved reserves is based upon reserve reports prepared as of December 31, 2010. Estimates of our proved reserves were prepared by Netherland, Sewell & Associates, Inc. and Schlumberger Data & Consulting Services, independent petroleum engineering firms. Netherland, Sewell & Associates, Inc. provides reserve data for our California, Wyoming and Florida properties, and Schlumberger Data & Consulting Services provides reserve data for our Michigan, Kentucky and Indiana properties. The reserve estimates are reviewed and approved by members of our senior engineering staff and
management. The process performed by Netherland, Sewell & Associates, Inc. and Schlumberger Data & Consulting Services to prepare reserve amounts included their estimation of reserve quantities, future producing rates, future net revenue and the present value of such future net revenue. Netherland, Sewell & Associates, Inc. and Schlumberger Data & Consulting Services also prepared estimates with respect to reserve categorization, using the definitions for proved reserves set forth in Regulation S-X Rule 4-10(a)(2-4) and subsequent SEC staff interpretations and guidance. In the conduct of their preparation of the reserve estimates, Netherland, Sewell & Associates, Inc. and Schlumberger Data & Consulting
Services did not independently verify the accuracy and complet eness of information and data furnished by us with respect to ownership interests, oil and gas production, well test data, historical costs of operation and development, product prices or any agreements relating to current and future operations of the properties and sales of production. However, if in the course of their work, something came to their attention which brought into question the validity or sufficiency of any such information or data, they did not rely on such information or data until they had satisfactorily resolved their questions relating thereto.
Our Manager of Reserves and Acquisition Evaluation, who reports directly to our Chief Operating Officer, maintains our reserves databases, provides reserve reports to accounting based on SEC guidance and updates production forecasts. He provides access to our reserves databases to Netherland, Sewell & Associates, Inc. and Schlumberger Data & Consulting Services and oversees the compilation of and reviews their reserve reports. He has a B.S. degree in Petroleum Engineering and 32 years of oil and gas experience with major integrated and independent companies. His experience encompasses most basins across the U.S.
8
See exhibits 99.1 and 99.2 to this report for the estimates of proved reserves provided by Netherland, Sewell & Associates, Inc. and Schlumberger Data & Consulting Services, respectively. We only employ large, widely known, highly regarded, and reputable engineering consulting firms. Not only the firms, but the technical persons that sign and seal the reports are licensed and certify that they meet all professional requirements. Licensing requirements formally require mandatory continuing education and professional qualifications.
Michigan
As of December 31, 2010, our Michigan operations comprised approximately 68% of our total estimated proved reserves. For the year ended December 31, 2010, our average production was 10.7 MBoe/d or 64.1 MMcfe/d. Estimated proved reserves attributable to our Michigan properties as of December 31, 2010 were 80.3 MMBoe. Our integrated midstream assets enhance the value of our Michigan properties as gas is sold at MichCon prices, and we have no significant reliance on third party transportation. We have interests in 3,545 productive wells in Michigan.
In 2010, we drilled 16 wells, completed 28 well optimization projects (fracture stimulations, recompletions and workovers) and completed eight line twinning and/or compression optimization projects. The line twinning and compression optimization projects targeted casing pressure reduction in the pressure sensitive Antrim Shale. Line twinning converts a single line gathering system, where natural gas and water are transported from the well to the central processing facility in one line, to a dual line system where the water and gas each have their own line to the central processing facility. As a result, the casing pressure at the well can be lowered thus increasing production. Our capital spending in Michigan for the year ended December 31, 2010 was
approximately $24 mill ion.
|
As of December 31, 2010
|
||||||||||||
|
Estimated
|
||||||||||||
|
Proved Reserves
|
% Proved
|
|||||||||||
|
(MMBoe)
|
% Gas
|
Developed
|
||||||||||
|
Antrim Shale
|
66.8 | 100 | % | 94 | % | |||||||
|
Non-Antrim Fields
|
13.5 | 58 | % | 61 | % | |||||||
|
All Michigan formations
|
80.3 | 93 | % | 89 | % | |||||||
Antrim Shale
The Antrim Shale underlies a large percentage of our Michigan acreage; wells tend to produce relatively predictable amounts of natural gas in this reservoir. On average, Antrim Shale wells have a proved reserve life of more than 20 years. Since reserve quantities and production levels over a large number of wells are fairly predictable, maximizing per well recoveries and minimizing per unit production costs through a sizeable well-engineered drilling program are the keys to profitable Antrim development. Growth opportunities include infill drilling and recompletions, horizontal drilling and bolt-on acquisitions. In 2010, our average production from the Antrim Shale was 44.5 MMcf/d or 7.4 MBoe/d. Our estimated proved reserves attributable to our Antrim Shale interests as of December 31, 2010 were 66.8 MMBoe or 401
Bcfe, of which 94% was p roved developed. In 2010, we drilled 13 wells and eight recompletions, and completed eight line twinning and/or compression optimization projects. We have interests in 3,266 productive wells in the Antrim Shale.
Non-Antrim Fields
Our non-Antrim interests are located in several reservoirs including the Prairie du Chien (“PdC”), Richfield (“RCFD”), Detroit River Zone III (“DRRV”) and Niagaran (“NGRN”) pinnacle reefs. In 2010, our average production from our non-Antrim interests was 19.6 MMcf/d or 3.3 MBoe/d. Our estimated proved reserves attributable to our non-Antrim interests as of December 31, 2010 were 13.5 MMBoe or 81 Bcfe.
The PdC produces dry gas, gas and condensate or oil with associated gas, depending upon the area and the particular zone. There are some proved non-producing zones in existing well bores that provide recompletion opportunities, allowing us to maintain or, in some cases, increase production from our PdC wells as currently producing reservoirs deplete.
9
The vast majority of our RCFD/DRRV wells are located in Kalkaska and Crawford counties in the Garfield and Beaver Creek fields. Potential exploitation of the Garfield RCFD/DRRV reservoirs either by secondary waterflood and/or improved oil recovery with CO2 injection is under evaluation; however, because this concept has not been proved, there are no recorded reserves related to these techniques. Production from the Beaver Creek RCFD/DRRV reservoirs consists of oil with associated natural gas.
Our NGRN wells produce from numerous Silurian-age Niagaran pinnacle reefs located in the northern part of the lower peninsula of Michigan. Depending upon the location of the specific reef in the pinnacle reef belt of the northern shelf area, the NGRN pinnacle reefs produce dry natural gas, natural gas and condensate or oil with associated natural gas.
In 2010, we drilled three wells and completed 20 well optimization projects (fracture stimulations, recompletions and workovers).
California
Los Angeles Basin, California
Our operations in California are concentrated in several large, complex oil fields within the Los Angeles Basin. For the year ended December 31, 2010, our average California production was approximately 3.2 MBoe/d. Estimated proved reserves attributable to our California properties as of December 31, 2010 were 14.6 MMBoe. Our four largest fields, Santa Fe Springs, East Coyote, Sawtelle and Rosecrans, made up approximately 90% of our California production in 2010 and 87% of our estimated proved reserves as of December 31, 2010. Our capital spending in California for the year ended December 31, 2010 was approximately $12 million.
Santa Fe Springs Field – Our largest property in the Los Angeles Basin, measured by estimated proved reserves, is the Santa Fe Springs Field. We operate 100 productive wells in the Santa Fe Springs Field and own a 99.5% working interest. Santa Fe Springs has produced to date from up to ten productive zones ranging in depth from 3,000 feet to more than 9,000 feet. The five largest producing zones are the Bell, Meyer, O'Connell, Clark and Hathaway. In 2010, our average production from the Santa Fe Springs Field was approximately 1.6 MBoe/d, and our estimated proved reserves as of December 31, 2010 were 7.2 MMBoe, of which 91% was proved developed. In 2010, we drilled two productive development wells and one re-drill in the Santa Fe Springs field.
East Coyote Field – Our interest in this field is held through our ownership interest in BEPI. The East Coyote Field has 47 productive wells, operated by BEC. We own a 95% working interest. The East Coyote Field has producing zones ranging in depth from 2,500 feet to 4,000 feet. Our average production from the East Coyote Field for the year ended December 31, 2010 was approximately 536 Boe/d, and our estimated proved reserves as of December 31, 2010 were 2.7 MMBoe.
Sawtelle Field – Our interest in this field is held through our ownership interest in BEPI. The Sawtelle Field has 10 productive wells, operated by BEC. We own a 95% working interest in most of the field, with a lesser interest in certain areas. The Sawtelle Field has produced from several productive sands ranging in depth from 9,000 feet to 10,500 feet. Our average production from the Sawtelle Field was approximately 353 Boe/d, and our estimated proved reserves as of December 31, 2010 were 1.4 MMBoe.
Rosecrans Field – We operate 41 productive wells in the Rosecrans Field and own a 100% working interest. The Rosecrans Field has produced from several productive sands ranging in depth from 4,000 feet to 8,000 feet. The producing zones are the Padelford, Maxwell, Hoge, Zins and the O’Dea. In 2010, our average production from the Rosecrans Field was approximately 345 Boe/d, and our estimated proved reserves as of December 31, 2010 were 1.3 MMBoe.
Other California Fields – Our other fields include the Brea Olinda Field, which has 72 productive wells. Brea Olinda produced approximately 191 Boe/d on average in 2010 and had estimated proved reserves as of December 31, 2010 of 1.2 MMBoe; the Alamitos lease of the Seal Beach Field, which has eight productive wells, produced approximately 79 Boe/d on average in 2010 from the McGrath and Wasem zones at approximately 7,000 feet and had estimated proved reserves as of December 31, 2010 of less than 0.1 MMBoe; and the Recreation Park lease of the Long Beach Field, which has eight productive wells, produced approximately 51 Boe/d on average in 2010 from the same zones as the Alamitos lease, but approximately 1,000 feet deeper, and had estimated proved
reserves as of December 31, 2010 of 0.7 MMBoe. We have a 100% working interest in Brea Olinda and Alamitos and a 60% working interest in Recreation Park.
10
Wind River and Big Horn Basins, Wyoming
For the year ended December 31, 2010, our average production from our Wyoming fields was approximately 2.2 MBoe/d, and estimated proved reserves as of December 31, 2010 totaled 12.3 MMBoe. Four fields, Gebo, North Sunshine, Black Mountain and Hidden Dome, made up 88% of our Wyoming production in 2010 and 91% of our 2010 estimated proved reserves in Wyoming. In 2010, we drilled nine new productive development wells, one re-drill and two recompletions of existing productive wells in Wyoming. Additionally, a total of five workovers, resulting in an incremental 78 Boe/d of production, were performed in Wyoming during 2010. Our capital spending in Wyoming for the year ended December 31, 2010 was approximately $9 million.
We hold a 100% working interest in all Wyoming fields except Black Mountain, Sheldon Dome and Lost Dome where we hold a 98%, 90% and 50% working interest, respectively.
Gebo Field – We operate 46 productive wells in the Gebo Field. Production is from the Phosphoria and Tensleep formations with producing zones as shallow as 4,500 feet and as deep as 5,300 feet. In 2010, our average production from the Gebo Field was 614 Boe/d, and our estimated proved reserves as of December 31, 2010 were 3.0 MMBoe, of which 87% was proved developed.
North Sunshine Field – We operate 34 productive wells in the North Sunshine Field. Production is from the Phosphoria at 3,000 feet and the Tensleep at about 3,900 feet. In 2010, our average production from the North Sunshine Field was 491 Boe/d, and our estimated proved reserves as of December 31, 2010 were 3.1 MMBoe, of which 85% was proved developed. In 2010, we drilled four successful crude oil wells and one recompletion in this field.
Black Mountain Field – We operate 47 productive wells in the Black Mountain Field. Production is from the Tensleep formation with producing zones as shallow as 2,500 feet and as deep as 3,900 feet. Our average production from the Black Mountain Field was 420 Boe/d in 2010, and our estimated proved reserves as of December 31, 2010 were 2.9 MMBoe, all of which was proved developed.
Hidden Dome Field – We operate 18 productive wells in the Hidden Dome Field. Production is from the Frontier, Tensleep and Darwin formations with the producing zones as shallow as 1,200 feet and as deep as 5,000 feet. In 2010, our average production from the Hidden Dome Field was 394 Boe/d, and our estimated proved reserves as of December 31, 2010 were 2.1 MMBoe, of which 95% was proved developed.
Other Wyoming Fields – Our other fields include the Sheldon Dome Field and Rolff Lake Field in Fremont County, where we operate 21 productive wells in the Frontier to the Tensleep formations at depths up to 7,300 feet. In 2010, our Sheldon Dome and Rolff Lake fields produced on average 103 Boe/d and 64 Boe/d, respectively. We also operate six productive wells in the Lost Dome Field in Natrona County (outside the Wind River and Big Horn Basin) producing from the Tensleep formation at approximately 5,000 feet. In 2010, our average production from the Lost Dome Field was 48 Boe/d. The other two fields that we operate are the West Oregon Basin and Half Moon fields in Park County, where we operate eight productive wells. In 2010, we produced on average 58
Boe/d between the two Par k County fields from the Frontier and Phosphoria formations at depths from 1,200 to 4,000 feet. Rolff Lake Field and Sheldon Dome Field had estimated proved reserves as of December 31, 2010 of 0.4 MMBoe and 0.4 MMBoe, respectively, which were all proved developed and Lost Dome Field, West Oregon Basin and Half Moon Fields together had approximately 0.4 MMBoe, which were all proved developed.
Florida
We operate five Florida fields with 15 wells capable of production, of which 12 were producing as of December 31, 2010. Production is from the Cretaceous Sunniland Trend of the South Florida Basin at approximately 11,500 feet. Our fields are 100% oil and oil quality averaged 24 degrees API. As of December 31, 2010, we had estimated proved reserves of approximately 9.3 MMBbls. In 2010, our average production from our Florida fields was approximately 1.7 MBbl/d. Production from the Raccoon Point field currently accounts for more than half of our Florida production. We hold a 100% working interest in our Florida fields. Our first horizontal well in the Raccoon Point Field, came on production in May 2010 and our second well came on production in early January 2011. In February 2011, the combined production from both
wells was approximately 625 Bbl/d. A third well in the field was spud in late December and we expect it to come on production in the second quarter of 2011. Our capital spending in Florida for the year ended December 31, 2010 was approximately $24 million.
11
Indiana/Kentucky
Our operations in the New Albany Shale of southern Indiana and northern Kentucky include 21 miles of high pressure gas pipeline that interconnects with the Texas Gas Transmission interstate pipeline. The New Albany Shale has over 100 years of production history.
We operate 201 producing wells in Indiana and Kentucky and hold a 100% working interest. In 2010, our production for our Indiana and Kentucky operations was 386 Boe/d and 201 Boe/d, respectively, or 2,317 Mcf/d and 1,204 Mcf/d, respectively. Our estimated proved reserves in Indiana and Kentucky as of December 31, 2010 were 1.5 MMBoe and 0.9 MMBoe, respectively, or 8.9 Bcf and 5.4 Bcf, respectively. Our capital spending in Indiana and Kentucky for the year ended December 31, 2010 was approximately $1 million.
Productive Wells
The following table sets forth information for our properties as of December 31, 2010 relating to the productive wells in which we owned a working interest. Productive wells consist of producing wells and wells capable of production. Gross wells are the total number of productive wells in which we have an interest, and net wells are the sum of our fractional working interests owned in the gross wells. None of our productive wells have multiple completions.
|
Oil Wells
|
Gas Wells
|
|||||||||||||||
|
Gross
|
Net
|
Gross
|
Net
|
|||||||||||||
|
Operated
|
624 | 603 | 1,756 | 1,229 | ||||||||||||
|
Non-operated
|
84 | 59 | 1,763 | 646 | ||||||||||||
| 708 | 662 | 3,519 | 1,875 | |||||||||||||
Developed and Undeveloped Acreage
The following table sets forth information for our properties as of December 31, 2010 relating to our leasehold acreage. Developed acres are acres spaced or assigned to productive wells. Undeveloped acres are acres on which wells have not been drilled or completed to a point that would permit the production of commercial quantities of gas or oil, regardless of whether such acreage contains proved reserves. Gross acres are the total number of acres in which a working interest is owned. Net acres are the sum of the fractional working interests owned in gross acres expressed as whole numbers and fractions thereof.
|
Developed Acreage
|
Undeveloped Acreage
|
Total Acreage
|
||||||||||||||||||||||
|
Gross
|
Net
|
Gross
|
Net
|
Gross
|
Net
|
|||||||||||||||||||
|
Michigan
|
396,907 | 216,246 | 33,521 | 30,738 | 430,428 | 246,984 | ||||||||||||||||||
|
California
|
2,711 | 2,513 | - | - | 2,711 | 2,513 | ||||||||||||||||||
|
Wyoming
|
13,650 | 12,054 | 400 | 400 | 14,050 | 12,454 | ||||||||||||||||||
|
Florida
|
34,402 | 33,322 | - | - | 34,402 | 33,322 | ||||||||||||||||||
|
Indiana
|
49,973 | 45,560 | 69,829 | 68,729 | 119,802 | 114,289 | ||||||||||||||||||
|
Kentucky
|
3,152 | 3,151 | 19,959 | 19,154 | 23,111 | 22,305 | ||||||||||||||||||
| 500,795 | 312,846 | 123,709 | 119,021 | 624,504 | 431,867 | |||||||||||||||||||
12
The following table lists the net undeveloped acres as of December 31, 2010, the net acres expiring in 2011, 2012 and 2013, and, where applicable, the net acres expiring that are subject to extension options.
|
2011 Expirations
|
2012 Expirations
|
2013 Expirations
|
||||||||||||||||||||||||||
|
Net Undeveloped
Acreage |
Net
Acreage |
Net Acreage
with Ext. Opt. |
Net
Acreage |
Net Acreage
with Ext. Opt. |
Net
Acreage |
Net Acreage
with Ext. Opt. |
||||||||||||||||||||||
|
Michigan
|
30,738 | 531 | - | 2,568 | - | 5,154 | - | |||||||||||||||||||||
|
Wyoming
|
400 | - | - | - | - | - | - | |||||||||||||||||||||
|
Indiana
|
68,729 | 21,276 | - | 2,767 | - | 40,901 | - | |||||||||||||||||||||
|
Kentucky
|
19,154 | 12,360 | - | 3,190 | - | 3,357 | - | |||||||||||||||||||||
| 119,021 | 34,167 | - | 8,525 | - | 49,412 | - | ||||||||||||||||||||||
We hold more than 120,000 net acres in the developing Collingwood-Utica shale play in Michigan. Substantially all of this acreage is held by production.
Drilling Activity
Drilling activity and production optimization projects are on lower risk, development properties. The following table sets forth information for our properties with respect to wells completed during the years ended December 31, 2010, 2009 and 2008. Productive wells are those that produce commercial quantities of oil and gas, regardless of whether they produce a reasonable rate of return. No exploratory wells were drilled during the periods presented.
|
2010
|
2009
|
2008
|
||||||||||
|
Gross development wells:
|
||||||||||||
|
Productive
|
50 | 23 | 129 | |||||||||
|
Dry
|
2 | 3 | 2 | |||||||||
| 52 | 26 | 131 | ||||||||||
|
Net development wells:
|
||||||||||||
|
Productive
|
48 | 21 | 116 | |||||||||
|
Dry
|
2 | 3 | 2 | |||||||||
| 50 | 24 | 118 | ||||||||||
Included in the table above are 16 recompletions in Michigan, two recompletions and one re-drill in Wyoming and one re-drill in California. We drilled one dry development well in California and one dry development well in Wyoming during 2010. We had no wells in progress as of December 31, 2010.
Delivery Commitments
As of December 31, 2010, we had no delivery commitments.
Sales Contracts
We have a portfolio of crude oil and natural gas sales contracts with large, established refiners and utilities. Our sales contracts are sold at market-sensitive or spot prices. Because commodity products are sold primarily on the basis of price and availability, we are not dependent upon one purchaser or a small group of purchasers. During 2010, our largest purchasers were ConocoPhillips in California and Michigan, which accounted for approximately 30% of net sales revenues, Marathon Oil Company in Wyoming, which accounted for approximately 16% of net sales revenues, Plains Marketing, L.P. in Florida, which accounted for approximately 12% of net sales revenues, and Sunoco Partners Marketing and Terminals L.P in Michigan, which accounted for approximately 10% of net sales revenues.
Crude Oil and Natural Gas Prices
We analyze the prices we realize from sales of our oil and gas production and the impact on those prices of differences in market-based index prices and the effects of our derivative activities. We market our oil and natural gas production to a variety of purchasers based on regional pricing. The WTI price of crude oil is a widely used benchmark in the pricing of domestic and imported oil in the United States. The relative value of crude oil is mainly determined by its quality and location. In the case of WTI pricing, the crude oil is light and sweet, meaning that it has a higher specific gravity (lightness) measured in degrees API (a scale devised by the American Petroleum Institute) and low sulfur content, and is priced for delivery at Cushing, Oklahoma. In general, higher quality crude oils (lighter and sweeter)
with fewer transportat ion requirements result in higher realized pricing for producers.
13
Our Los Angeles Basin crude oil is generally medium gravity crude. Because of its proximity to the extensive Los Angeles refining market, it trades at only a minor discount to NYMEX WTI. Our Wyoming crude oil, while generally of similar quality to our Los Angeles Basin crude oil, trades at a significant discount to NYMEX WTI because of its distance from a major refining market and the fact that it is priced relative to the Bow River benchmark for Canadian heavy sour crude oil, which has historically traded at a significant discount to NYMEX WTI. Our Florida crude oil also trades at a significant discount to NYMEX primarily because of its low gravity and other characteristics as well as its distance from a major refining market.
In 2010, the NYMEX WTI spot price averaged approximately $79 per barrel, compared with about $62 a year earlier. Monthly average crude oil prices during 2010, ranged from a low of $74 per barrel for May to a high of $89 per barrel for December. During 2010, the average discounts per barrel to NYMEX WTI benchmark prices were $0.25 for our California-based production, $13.24 for our Wyoming-based production and $16.15 for our Florida-based production, including approximately $7.50 in transportation costs.
Our Michigan properties have favorable natural gas supply/demand characteristics as the state has been importing an increasing percentage of its natural gas. We have entered into derivative contracts for approximately 72% of our expected 2011 natural gas production. To the extent our production is not hedged, we anticipate that this supply/demand situation will allow us to sell our future natural gas production at little or no discount to industry benchmark prices. Prices for natural gas have historically fluctuated widely and in many regional markets are aligned with supply and demand conditions in regional markets and with the overall U.S. market. Fluctuations in the price for natural gas in the United States are closely associated with the volumes produced in North America and the inventory in underground
storage relative to customer demand. U.S. natural gas prices are also typically higher during the winter period when demand for heating is greatest. During 2010, the average NYMEX wholesale natural gas price ranged from a low of $3.60 per MMBtu for October to a high of $5.60 per MMBtu for January. During 2010, the average discount per Mcf we received for our natural gas production in Michigan relative to MichCon City-Gate benchmark prices was $0.03. See Part I—Item 1A “—Risk Factors” — “Risks Related to Our Business — A deterioration of the economy and continued depressed natural gas prices could limit our ability to obtain funding in the capital and credit markets on terms we find acceptable, obtain additional or continued funding under our current credit facility or obtain funding at all” in this report.
Our operating expenses are responsive to changes in commodity prices. We experience pressure on operating expenses that is highly correlated to oil prices for specific expenditures such as lease fuel, electricity, drilling services and severance and property taxes.
Derivative Activity
Our revenues and net income are sensitive to oil and natural gas prices. We enter into various derivative contracts intended to achieve more predictable cash flow and to reduce our exposure to adverse fluctuations in the prices of oil and natural gas. We currently maintain derivative arrangements for a significant portion of our oil and gas production. Currently, we use a combination of fixed price swap and option arrangements to economically hedge NYMEX crude oil and natural gas prices. By removing the price volatility from a significant portion of our crude oil and natural gas production, we have mitigated, but not eliminated, the potential effects of changing crude oil and natural gas prices on our cash flow from operations for those periods. While our commodity price risk management program is intended to
reduce our exposure to commo dity prices and assist with stabilizing cash flow and distributions, to the extent we have hedged a significant portion of our expected production and the cost for goods and services increases, our margins would be adversely affected. For a more detailed discussion of our derivative activities, see Part II—Item 7A “—Quantitative and Qualitative Disclosures About Market Risk” and Note 5 to the consolidated financial statements included in this report.
14
Competition
The oil and gas industry is highly competitive. We encounter strong competition from other independent operators and from major oil companies in all aspects of our business, including acquiring properties and oil and gas leases, marketing oil and gas, contracting for drilling rigs and other equipment necessary for drilling and completing wells and securing trained personnel. Many of these competitors have financial and technical resources and staffs substantially larger than ours. As a result, our competitors may be able to pay more for desirable leases, or to evaluate, bid for and purchase a greater number of properties or prospects than our financial or personnel resources permit.
In regards to the competition we face for drilling rigs and the availability of related equipment, the oil and gas industry has experienced shortages of drilling rigs, equipment, pipe and personnel in the past, which has delayed development drilling and other exploitation activities and has caused significant price increases. We are unable to predict when, or if, such shortages may occur or how they would affect our development and exploitation program. Competition is also strong for attractive oil and gas producing properties, undeveloped leases and drilling rights, which may affect our ability to compete satisfactorily when attempting to make further acquisitions. See Item 1A “—Risk Factors” — “Risks Related
to Our Business — We may be unable to compete effectively with other companies in the oil and gas industry, which may adversely affect our ability to generate sufficient revenue to allow us to pay distributions to our unitholders” in this report.
Title to Properties
As is customary in the oil and gas industry, we initially conduct only a cursory review of the title to our properties on which we do not have proved reserves. Prior to the commencement of drilling operations on those properties, we conduct a thorough title examination and perform curative work with respect to significant defects. To the extent title opinions or other investigations reflect title defects on those properties, we are typically responsible for curing any title defects at our expense. We generally will not commence drilling operations on a property until we have cured any material title defects on such property. Prior to completing an acquisition of producing oil leases, we perform title reviews on the most significant leases and, depending on the materiality of properties, we may obtain a title
opinion or review previously obtained title opinions. As a result, we believe that we have satisfactory title to our producing properties in accordance with standards generally accepted in the oil and gas industry. Under our credit facility, we have granted the lenders a lien on substantially all of our oil and gas properties. Our properties are also subject to customary royalty and other interests, liens for current taxes and other burdens which we believe do not materially interfere with the use of or affect our carrying value of the properties.
Some of our oil and gas leases, easements, rights-of-way, permits, licenses and franchise ordinances require the consent of the current landowner to transfer these rights, which in some instances is a governmental entity. We believe that we have obtained sufficient third-party consents, permits and authorizations for us to operate our business in all material respects. With respect to any consents, permits or authorizations that have not been obtained, we believe that the failure to obtain these consents, permits or authorizations have no material adverse effect on the operation of our business.
Seasonal Nature of Business
Seasonal weather conditions, especially freezing conditions in Michigan, and lease stipulations can limit our drilling activities and other operations in certain of the areas in which we operate and, as a result, we seek to perform the majority of our drilling during the summer months. These seasonal anomalies can pose challenges for meeting our well drilling objectives and increase competition for equipment, supplies and personnel during the spring and summer months, which could lead to shortages and increase costs or delay our operations.
Environmental Matters and Regulation
General. Our operations are subject to stringent and complex federal, state and local laws and regulations governing environmental protection as well as the discharge of materials into the environment. These laws and regulations may, among other things:
|
|
·
|
require the acquisition of various permits before exploration, drilling or production activities commence;
|
|
|
·
|
prohibit some or all of the operations of facilities deemed in non-compliance with regulatory requirements;
|
15
|
|
·
|
restrict the types, quantities and concentration of various substances that can be released into the environment in connection with oil and natural gas drilling, production and transportation activities;
|
|
|
·
|
limit or prohibit drilling activities on certain lands lying within wilderness, wetlands and other protected areas; and
|
|
|
·
|
require remedial measures to mitigate pollution from former and ongoing operations, such as requirements to close pits, plug abandoned wells, and restore drilling sites.
|
These laws, rules and regulations may also restrict the rate of oil and natural gas production below the rate that would otherwise be possible. The regulatory burden on the oil and gas industry increases the cost of doing business in the industry and consequently affects profitability. Additionally, the United States Congress (“Congress”) and federal and state agencies frequently revise environmental laws and regulations, and the clear trend in environmental regulation is to place more restrictions and limitations on activities that may affect the environment. Any changes that result in more stringent and costly waste handling, disposal and cleanup requirements for the oil and gas industry could have a significant impact on our operating costs.
The following is a summary of some of the existing laws, rules and regulations to which our business operations are subject.
Waste Handling. The Resource Conservation and Recovery Act, or RCRA, and comparable state statutes, regulate the generation, transportation, treatment, storage, disposal and cleanup of hazardous and non-hazardous wastes. Under the auspices of the U.S. Environmental Protection Agency (“EPA”), the individual states administer some or all of the provisions of RCRA, sometimes in conjunction with their own, more stringent requirements. Drilling fluids, produced waters, and most of the other wastes associated with the exploration, development, and production of crude oil or natural gas are currently regulated under RCRA’s non-hazardous waste provisions. However, it is possible that certain oil and natural gas exploration and production wastes now
classified as non-hazar dous could be classified as hazardous wastes in the future. Any such change could result in an increase in our costs to manage and dispose of wastes, which could have a material adverse effect on our results of operations and financial position. Also, in the course of our operations, we generate some amounts of ordinary industrial wastes, such as paint wastes, waste solvents, and waste oils that may be regulated as hazardous wastes.
Hazardous Substances. The Comprehensive Environmental Response, Compensation and Liability Act, or CERCLA, also known as the Superfund law, imposes joint and several liability, without regard to fault or legality of conduct, on classes of persons who are considered to be responsible for the release of a hazardous substance into the environment. These persons include the current and past owner or operator of the site where the release occurred, and anyone who disposed or arranged for the disposal of a hazardous substance released at the site. Under CERCLA, such persons may be subject to joint and several liability for the costs of cleaning up the hazardous substances that have been released into the environment, for damages to natural resources and for the
costs of certain health st udies. In addition, it is not uncommon for neighboring landowners and other third-parties to file claims for personal injury and property damage allegedly caused by the hazardous substances released into the environment.
We currently own, lease, or operate numerous properties that have been used for oil and natural gas exploration and production for many years. Although we believe that we have utilized operating and waste disposal practices that were standard in the industry at the time, hazardous substances, wastes, or hydrocarbons may have been released on or under the properties owned or leased by us, or on or under other locations, including off-site locations, where such substances have been taken for disposal. In addition, some of our properties have been operated by third parties or by previous owners or operators whose treatment and disposal of hazardous substances, wastes, or hydrocarbons was not under our control. In fact, there is evidence that petroleum spills or releases have occurred in the past at some of the
properties owned or leased by us. These properties and the substances disposed or released on them may be subject to CERCLA, RCRA, and analogous state laws. Under such laws, we could be required to remove previously disposed substances and wastes, remediate contaminated property, or perform remedial plugging or pit closure operations to prevent future contamination.
Water Discharges. The Federal Water Pollution Control Act, or the Clean Water Act, and analogous state laws, impose restrictions and strict controls with respect to the discharge of pollutants, including spills and leaks of oil and other substances, into waters of the United States. The discharge of pollutants into regulated waters is prohibited, except in accordance with the terms of a permit issued by the EPA or an analogous state agency. The Clean Water Act also imposes spill prevention, control, and countermeasure requirements, including requirements for appropriate containment berms and similar structures, to help prevent the contamination of navigable waters in the event of a petroleum hydrocarbon tank spill, rupture, or leak. Federal and state
regulatory agencies can impose administrative, civil and criminal penalties for non-compliance with discharge permits or other requirements of the Clean Water Act and analogous state laws and regulations.
16
The primary federal law for oil spill liability is the Oil Pollution Act, or OPA, which establishes a variety of requirements pertaining to oil spill prevention, containment, and cleanup. OPA applies to vessels, offshore facilities, and onshore facilities, including exploration and production facilities that may affect waters of the United States. Under OPA, responsible parties, including owners and operators of onshore facilities, are required to develop and implement plans for preventing and responding to oil spills and, if a spill occurs, may be subject to oil cleanup costs and natural resource damages as well as a variety of public and private damages that may result from the spill.
Air Emissions. The Clean Air Act, and comparable state laws, regulate emissions of various air pollutants through air emissions permitting programs and the imposition of other requirements. In addition, the EPA has developed, and continues to develop, stringent regulations governing emissions of toxic air pollutants at specified sources. States can impose air emissions limitations that are more stringent than the federal standards imposed by the EPA, and California air quality laws and regulations are in many instances more stringent than comparable federal laws and regulations. Federal and state regulatory agencies can impose administrative, civil and criminal penalties for non-compliance with air permits or other requirements of the federal Clean Air Act
and associated state laws and regulations. Regulatory requirements relating to air emissions are particularly stringent in Southern California.
Global Warming and Climate Change. In December 2009, the EPA determined that emissions of carbon dioxide, methane and other “greenhouse gases” present an endangerment to public health and the environment because emissions of such gases are, according to the EPA, contributing to warming of the earth’s atmosphere and other climatic changes. Based on these findings, the EPA has begun adopting and implementing regulations to restrict emissions of greenhouse gases under existing provisions of the federal Clean Air Act. The EPA recently adopted two sets of rules regulating greenhouse gas emissions under the Clean Air Act, one of which requires a reduction in emissions of greenhouse gases from motor vehicles and the other of which regulates
emissions of greenhouse gases from certain large stationary sources, effective January 2, 2011. The EPA’s rules relating to emissions of greenhouse gases from large stationary sources of emissions are currently subject to a number of legal challenges, but the federal courts have thus far declined to issue any injunctions to prevent the EPA from implementing, or requiring state environmental agencies to implement, the rules. The EPA has also adopted rules requiring the reporting of greenhouse gas emissions from specified large greenhouse gas emission sources in the United States, including petroleum refineries, on an annual basis, beginning in 2011 for emissions occurring after January 1, 2010, as well as certain onshore oil and natural gas production facilities, on an annual basis, beginning in 2012 for emissions occurring in 2011.
In addition, Congress has from time to time considered adopting legislation to reduce emissions of greenhouse gases and almost one-half of the states have already taken legal measures to reduce emissions of greenhouse gases primarily through the planned development of greenhouse gas emission inventories and/or regional greenhouse gas cap and trade programs. Most of these cap and trade programs work by requiring major sources of emissions, such as electric power plants, or major producers of fuels, such as refineries and gas processing plants, to acquire and surrender emission allowances. The number of allowances available for purchase is reduced each year in an effort to achieve the overall greenhouse gas emission reduction goal. California has been one of the leading states in adopting greenhouse gas emission
reduction requirements, and California’s initial cap and trade program will begin in 2012. Producers and distributors of liquid fuels and natural gas are not subject to emission limits until 2015.
The adoption of legislation or regulatory programs to reduce emissions of greenhouse gases could require us to incur increased operating costs, such as costs to purchase and operate emissions control systems, to acquire emissions allowances or comply with new regulatory or reporting requirements. Any such legislation or regulatory programs could also increase the cost of consuming, and thereby reduce demand for, the oil and natural gas we produced. Consequently, legislation and regulatory programs to reduce emissions of greenhouse gases could have an adverse effect on our business, financial condition and results of operations. Finally, it should be noted that some scientists have concluded that increasing concentrations of greenhouse gases in the Earth’s atmosphere may produce climate changes that have
significant physical effects , such as increased frequency and severity of storms, droughts, and floods and other climatic events. If any such effects were to occur, they could have an adverse effect on our financial condition and results of operations.
17
Pipeline Safety. Some of our pipelines are subject to regulation by the U.S. Department of Transportation (“DOT”) under the Pipeline Safety Improvement Act of 2002, which was reauthorized and amended by the Pipeline Inspection, Protection, Enforcement and Safety Act of 2006. The DOT, through the Pipeline and Hazardous Materials Safety Administration (“PHMSA”), has established a series of rules that require pipeline operators to develop and implement integrity management programs for gas, NGL and condensate transmission pipelines as well as certain low stress pipelines and gathering lines transporting hazardous liquids, such as oil, that, in the event of a failure, could affect “high consequence areas.” “High
consequence areas” are cur rently defined to include areas with specified population densities, buildings containing populations with limited mobility, areas where people may gather along the route of a pipeline (such as athletic fields or campgrounds), environmentally sensitive areas, and commercially navigable waterways. Under the DOT’s regulations, integrity management programs are required to include baseline assessments to identify potential threats to each pipeline segment, implementation of mitigation measures to reduce the risk of pipeline failure, periodic reassessments, reporting and recordkeeping. In two steps taken in 2008 and 2010, PHMSA extended its integrity management program requirements to hazardous liquid gathering lines located in “unusually sensitive areas,” such as locations containing sole-source drinking water aquifers, endangered species, or other protected ecological resources. Fines and penalties may be imposed on pipeline operators
that fail to comply with PHMSA requirements, and such oper ators may also become subject to orders or injunctions restricting pipeline operations. We have had fines and penalties imposed or threatened based on claimed paperwork and documentation omissions.
OSHA and Other Laws and Regulation. We are subject to the requirements of the federal Occupational Safety and Health Act, or OSHA, and comparable state statutes. These laws and the implementing regulations strictly govern the protection of the health and safety of employees. The OSHA hazard communication standard, the EPA community right-to-know regulations under the Title III of CERCLA and similar state statutes require that we organize and/or disclose information about hazardous materials used or produced in our operations. We believe that we are in substantial compliance with these applicable requirements and with other OSHA and comparable requirements.
We believe that we are in substantial compliance with all existing environmental laws and regulations applicable to our current operations and that our continued compliance with existing requirements will not have a material adverse impact on our financial condition and results of operations. For instance, we did not incur any material capital expenditures for remediation or pollution control activities for the year ended December 31, 2010. Additionally, we are not aware of any environmental issues or claims that will require material capital expenditures during 2011. However, accidental spills or releases may occur in the course of our operations, and we cannot assure you that we will not incur substantial costs and liabilities as a result of such spills or releases, including those relating to claims for damage
to property and persons. In addition, we expect to be required to incur remediation costs for property, wells and facilities at the end of their useful lives. Moreover, we cannot assure you that the passage of more stringent laws or regulations in the future will not have a negative impact on our business, financial condition, and results of operations or ability to make distributions to our unitholders.
Other Regulation of the Oil and Gas Industry
The oil and gas industry is extensively regulated by numerous federal, state and local authorities. Legislation affecting the oil and gas industry is under constant review for amendment or expansion, frequently increasing the regulatory burden. Also, numerous departments and agencies, both federal and state, are authorized by statute to issue rules and regulations binding on the oil and gas industry and its individual members, some of which carry substantial penalties for failure to comply. Although the regulatory burden on the oil and gas industry increases our cost of doing business and, consequently, affects our profitability, these burdens generally do not affect us any differently or to any greater or lesser extent than they affect other companies in the industry with similar types, quantities and locations of
production.
Legislation continues to be introduced in Congress and development of regulations continues in the Department of Homeland Security and other agencies concerning the security of industrial facilities, including oil and gas facilities. Our operations may be subject to such laws and regulations. Presently, it is not possible to accurately estimate the costs we could incur to comply with any such facility security laws or regulations, but such expenditures could be substantial.
Production Regulation. Our operations are subject to various types of regulation at federal, state and local levels. These types of regulation include requiring permits for the drilling of wells, drilling bonds and reports concerning operations. Most states, and some counties and municipalities, in which we operate, also regulate one or more of the following:
18
|
|
·
|
the location of wells;
|
|
|
·
|
the method of drilling and casing wells;
|
|
|
·
|
the surface use and restoration of properties upon which wells are drilled;
|
|
|
·
|
the plugging and abandoning of wells; and
|
|
|
·
|
notice to surface owners and other third parties.
|
The various states regulate the drilling for, and the production of, oil and natural gas, including imposing severance taxes and requirements for obtaining drilling permits. Wyoming currently imposes a severance tax on oil and gas producers at the rate of 6% of the value of the gross product extracted. Wyoming wells that reside on Indian or Federal land are subject to an additional tax of 8.5%. Florida currently imposes a severance tax on oil producers of up to 8% and Michigan currently imposes a severance tax on oil producers at the rate of 7.6% and on gas producers at the rate of 6.0%. In Wyoming, Florida and Michigan, reduced rates may apply to certain types of wells and production methods, such as new wells, renewed wells, stripper production and tertiary production. California does not currently impose a
severance tax but attempts t o impose a similar tax have been introduced in the past.
States also regulate the method of developing new fields, the spacing and operation of wells and the prevention of waste of oil and natural gas resources. States may regulate rates of production and may establish maximum daily production allowances from oil and gas wells based on market demand or resource conservation, or both. States do not regulate wellhead prices or engage in other similar direct economic regulation, but there can be no assurance that they will not do so in the future. The effect of these regulations may be to limit the amounts of oil and natural gas that may be produced from our wells, and to limit the number of wells or locations we can drill. Our Los Angeles Basin properties are located in urbanized areas, and certain drilling and development activities within these fields require local
zoning and land use permits obtained from individual cities or counties. These permits are discretionary and, when issued, usually include mitigation measures which may impose significant additional costs or otherwise limit development opportunities.
Gathering Pipeline Regulation. Section 1(b) of the NGA exempts natural gas gathering facilities from regulation by FERC as a natural gas company under the NGA. We believe that the natural gas pipelines in our gathering systems meet the traditional tests FERC has used to establish a pipeline’s status as a gatherer not subject to regulation as a natural gas company. However, the distinction between FERC-regulated transmission services and federally unregulated gathering services is the subject of substantial, on-going litigation, so the classification and regulation of our gathering facilities are subject to change based on future determinations by FERC, the courts, or Congress. Natural gas gathering may receive greater regulatory scrutiny at both the
state and federal levels. Our natural gas gathering operations could be adversely affected should they be subject to more stringent application of state or federal regulation of rates and services. Our natural gas gathering operations also may be or become subject to additional safety and operational regulations relating to the design, installation, testing, construction, operation, replacement and management of gathering facilities. Additional rules and legislation pertaining to these matters are considered or adopted from time to time. We cannot predict what effect, if any, such changes might have on our operations, but the industry could be required to incur additional capital expenditures and increased costs depending on future legislative and regulatory changes.
Though our natural gas gathering facilities are not subject to regulation by FERC as natural gas companies under the NGA, our gathering facilities may be subject to certain FERC annual natural gas transaction reporting requirements and daily scheduled flow and capacity posting requirements depending on the volume of natural gas transactions and flows in a given period. See the discussion below of “FERC Market Transparency Rules.”
Our natural gas gathering operations are subject to regulation in the various states in which we operate. The level of such regulation varies by state. Failure to comply with state regulations can result in the imposition of administrative, civil and criminal penalties.
Transportation Pipeline Regulation. Our sole interstate pipeline is an 8.3 mile pipeline in Kentucky that connects with the Texas Gas Transmission interstate pipeline. That pipeline is subject to a limited jurisdiction FERC certificate, and we are not currently required to maintain a tariff at FERC. Our intrastate natural gas transportation pipelines are subject to regulation by applicable state regulatory commissions. The level of such regulation varies by state. Failure to comply with state regulations can result in the imposition of administrative, civil and criminal penalties.
19
Though our natural gas intrastate pipelines are not subject to regulation by FERC as natural gas companies under the NGA, our intrastate pipelines may be subject to certain FERC annual natural gas transaction reporting requirements and daily scheduled flow and capacity posting requirements depending on the volume of natural gas transactions and flows in a given period. See below the discussion of “FERC Market Transparency Rules.”
Natural Gas Processing Regulation. Our natural gas processing operations are not presently subject to FERC regulation. However, pursuant to Order No. 704, we are required to annually report to FERC information regarding natural gas sale and purchase transactions transacted by some of our processing operations. See below the discussion of “FERC Market Transparency Rules.” There can be no assurance that our processing operations will continue to be exempt from other FERC regulation in the future.
Our processing facilities are affected by the availability, terms and cost of pipeline transportation. The price and terms of access to pipeline transportation can be subject to extensive federal and in state regulation. FERC is continually proposing and implementing new rules and regulations affecting the interstate transportation of natural gas, and to a lesser extent, the interstate transportation of NGLs. These initiatives also may indirectly affect the intrastate transportation of natural gas and NGLs under certain circumstances. We cannot predict the ultimate impact of these regulatory changes to our processing operations.
The ability of our processing facilities and pipelines to deliver natural gas into third party natural gas pipeline facilities is directly impacted by the gas quality specifications required by those pipelines. On June 15, 2006, FERC issued a policy statement on provisions governing gas quality and interchangeability in the tariffs of interstate gas pipeline companies and a separate order declining to set generic prescriptive national standards. FERC strongly encouraged all natural gas pipelines subject to its jurisdiction to adopt, as needed, gas quality and interchangeability standards in their FERC gas tariffs modeled on the interim guidelines issued by a group of industry representatives, headed by the Natural Gas Council (the “NGC+ Work Group”), or to explain how and why their tariff provisions
differ. We do not believe that the adoption of the NGC+ Work Group’s gas quality interim guidelines by a pipeline that either directly or indirectly interconnects with our facilities would materially affect our operations. We have no way to predict, however, whether FERC will approve of gas quality specifications that materially differ from the NGC+ Work Group’s interim guidelines for such an interconnecting pipeline.
Regulation of Sales of Natural Gas and NGLs. The price at which we buy and sell natural gas and NGLs is currently not subject to federal rate regulation and, for the most part, is not subject to state regulation. However, with regard to our physical purchases and sales of these energy commodities, and any related hedging activities that we undertake, we are required to observe anti-market manipulation laws and related regulations enforced by FERC and/or the Commodity Futures Trading Commission (“CFTC”). See below the discussion of “Energy Policy Act of 2005.” Should we violate the anti-market manipulation laws and regulations, we could also be subject to related third party damage claims by, among others, market participants, sellers,
royalty owners and taxi ng authorities.
Our sales of natural gas and NGLs are affected by the availability, terms and cost of pipeline transportation. As noted above, the price and terms of access to pipeline transportation can be subject to extensive federal and state regulation. FERC is continually proposing and implementing new rules and regulations affecting the interstate transportation of natural gas, and to a lesser extent, the interstate transportation of NGLs. These initiatives also may indirectly affect the intrastate transportation of natural gas and NGLs under certain circumstances. We cannot predict the ultimate impact of these regulatory changes to our natural gas and NGL marketing operations, and we do not believe that we would be affected by any such FERC action materially differently than other natural gas and NGL marketers with whom we
compete.
Energy Policy Act of 2005. On August 8, 2005, President Bush signed into law the Domenici-Barton Energy Policy Act of 2005, or (“EPAct 2005”). EPAct 2005 is a comprehensive compilation of tax incentives, authorized appropriations for grants and guaranteed loans, and significant changes to the statutory policy that affects all segments of the energy industry. With respect to regulation of natural gas transportation, EPAct 2005 amended the NGA and the NGPA by increasing the criminal penalties available for violations of each Act. EPAct 2005 also added a new section to the NGA, which provides FERC with the power to assess civil penalties of up to $1,000,000 per day for each violation of the NGA and increased FERC’s civil penalty authority under
the NGPA from $5,000 p er violation per day to $1,000,000 per violation per day. The civil penalty provisions are applicable to entities that engage in FERC-jurisdictional transportation and the sale for resale of natural gas in interstate commerce. EPAct 2005 also amended the NGA to add an anti-market manipulation provision which makes it unlawful for any entity to engage in prohibited behavior in contravention of rules and regulations to be prescribed by FERC. On January 19, 2006, FERC issued Order No. 670, a rule implementing the anti-market manipulation provision of EPAct 2005, and subsequently denied rehearing. The rules make it unlawful to: (1) in connection with the purchase or sale of natural gas subject to the jurisdiction of FERC, or the purchase or sale of transportation services subject to the jurisdiction of FERC, for any entity, directly or indirectly, to use or employ any device, scheme or artifice to defraud; (2) to make any untrue statement of material fact or omit to
state a material fact necessary to make the st atements made, in light of the circumstances under which they were made, not misleading; or (3) to engage in any act, practice or course of business that operates or would operate as a fraud or deceit upon any entity. The new anti-market manipulation rule does not apply to activities that relate only to non-jurisdictional sales or gathering, but does apply to activities of gas pipelines and storage companies that provide interstate services, as well as otherwise non-jurisdictional entities to the extent the activities are conducted “in connection with” gas sales, purchases or transportation subject to FERC jurisdiction, including the annual reporting requirements under Order No. 704 and the daily scheduled flow and capacity posting requirements under Order No. 720. The anti-market manipulation rule and enhanced civil penalty authority reflect an expansion of FERC’s enforcement authority. Additional proposals and
proceedings that might affect the natural gas industry are pending before Congr ess, FERC and the courts. The natural gas industry historically has been heavily regulated. Accordingly, we cannot assure you that present policies pursued by FERC and Congress will continue.
20
FERC Market Transparency Rules. On December 26, 2007, FERC issued a final rule on the annual natural gas transaction reporting requirements, as amended by subsequent orders on rehearing (“Order No. 704”). Under Order No. 704, wholesale buyers and sellers of more than 2.2 million MMBtu of physical natural gas in the previous calendar year, including interstate and intrastate natural gas pipelines, natural gas gatherers, natural gas processors, natural gas marketers, and natural gas producers, are now required to report, on May 1 of each year, beginning in 2009, aggregate volumes of natural gas purchased or sold at wholesale in the prior calendar year. It is the responsibility of the reporting entity to determine which individual transactions should
be reported based on t he guidance of Order No. 704. Order No. 704 also requires market participants to indicate whether they report prices to any index publishers, and if so, whether their reporting complies with FERC’s policy statement on price reporting.
On November 20, 2008, FERC issued a final rule on the daily scheduled flow and capacity posting requirements (“Order No. 720”), which was modified on January 21, 2010 (“Order No. 720-A”). Under Order Nos. 720 and 720-A, major non-interstate pipelines, defined as certain non-interstate pipelines delivering, on an annual basis, more than an average of 50 million MMBtu of natural gas over the previous three calendar years, are required to post daily certain information regarding the pipeline’s capacity and scheduled flows for each receipt and delivery point that has a design capacity equal to or greater than 15,000 MMBtu/d. Requests for clarification and rehearing of Order No. 720-A have been filed at FERC and a decision on those requests is pending.
Employees
BreitBurn Management, our wholly owned subsidiary, operates our assets and performs other administrative services for us such as accounting, corporate development, finance, land administration, legal and engineering. All of our employees, including our executives, are employees of BreitBurn Management. As of December 31, 2010, BreitBurn Management had 379 full time employees. BreitBurn Management provides services to us as well as to our Predecessor, BEC. None of our employees are represented by labor unions or covered by any collective bargaining agreement. We believe that relations with our employees are satisfactory.
Offices
BreitBurn Management Company’s principal executive offices are located at 515 S. Flower St., Suite 4800, Los Angeles, California 90071, where our principal offices are located. BreitBurn Management leases office space located on the 48th floor of the JP Morgan Chase Tower at 600 Travis Street, Houston, Texas, where our regional office is located. In addition to the offices in Los Angeles and Houston, BreitBurn Management maintains field offices in Gaylord, Michigan and Cody, Wyoming.
Financial Information
We operate our business as a single segment. Additionally, all of our properties are located in the United States and all of the related revenues are derived from purchasers located in the United States. Our financial information is included in the consolidated financial statements and the related notes beginning on page F-1.
21
An investment in our securities is subject to certain risks described below. We also face other risks and uncertainties beyond what we have described below. If any of these risks were actually to occur, our business, financial condition or results of operations could be materially adversely affected. In that case, we might not be able to pay the distributions on our Common Units, the trading price of our Common Units could decline and you could lose part or all of your investment.
Risks Related to Our Business
Even if we are able to pay quarterly distributions on our Common Units under the terms of our credit facility, we may not elect to pay quarterly distributions on our Common Units because we do not have sufficient cash flow from operations following establishment of cash reserves, reduction of debt and payment of fees and expenses.
Our credit facility limits the amounts we can borrow to a borrowing base amount, which is determined by the lenders in their sole discretion based on their valuation of our proved reserves and their internal criteria. For example, in April 2009, our borrowing base was decreased from $900 million to $760 million as a result of a scheduled borrowing base redetermination; in June 2009, it was decreased to $735 million as a result of the monetization of $25 million in crude oil and natural gas derivative contracts; and in July 2009, it was decreased to $732 million as a result of our sale of the Lazy JL Field. Our borrowing base was increased to $735 million in May 2010, in connection with an amendment to our credit
facility. In October 2010, we issued $305 million in aggregate principal amount of unsecured 8.625% senior notes maturing October 15, 2020 (the “Senior Notes”). As a result of our Senior Notes offering, our borrowing base was automatically reduced from $735 million to $658.8 million. As a result of the reduction in our borrowing base in April 2009, we were restricted from declaring a distribution on our Common Units and did not pay a distribution from February 2009 until May 2010. While we currently are not restricted by our credit facility from declaring a distribution as we were in April 2009 and reinstated distributions in May 2010, we may again be restricted from paying a distribution in the future. Our credit facility restricts our ability to make distributions to unitholders or repurchase units unless after giving effect to such distribution or repurchase, the availability to borrow under the facility is at least the lesser of (i) 10% of the borrowing base and (ii)
the greater of (a) $50 million and (b) twice the am ount of the proposed distribution, while remaining in compliance with all terms and conditions of our credit facility, including the leverage ratio not exceeding 3.75 to 1.00 (which is total indebtedness to EBITDAX, as such term is defined in the credit facility).
Even if we are able to pay quarterly distributions on our Common Units under the terms of our credit facility, we may not have sufficient available cash each quarter to pay quarterly distributions on our Common Units. Under the terms of our partnership agreement, the amount of cash otherwise available for distribution will be reduced by our operating expenses, debt reduction and the amount of any cash reserve amounts that our General Partner establishes to provide for future operations, future capital expenditures, future debt service requirements and future cash distributions to our unitholders. In the future, we may reserve a substantial portion of our cash generated from operations to develop our oil and natural gas properties and to acquire additional oil and natural gas properties in order to maintain and grow
our level of oil and n atural gas reserves.
The amount of cash we actually generate will depend upon numerous factors related to our business that may be beyond our control, including among other things:
|
|
·
|
the amount of oil and natural gas we produce;
|
|
|
·
|
demand for and prices at which we sell our oil and natural gas;
|
|
|
·
|
the effectiveness of our commodity price derivatives;
|
|
|
·
|
the level of our operating costs;
|
|
|
·
|
prevailing economic conditions;
|
|
|
·
|
our ability to replace declining reserves;
|
|
|
·
|
continued development of oil and natural gas wells and proved undeveloped reserves;
|
|
|
·
|
our ability to acquire oil and gas properties from third parties in a competitive market and at an attractive price;
|
|
|
·
|
the level of competition we face;
|
|
|
·
|
fuel conservation measures;
|
22
|
|
·
|
alternate fuel requirements;
|
|
|
·
|
government regulation and taxation; and
|
|
|
·
|
technical advances in fuel economy and energy generation devices.
|
In addition, the actual amount of cash that we will have available for distribution will depend on other factors, including:
|
|
·
|
our ability to borrow under our credit facility to pay distributions;
|
|
|
·
|
debt service requirements and restrictions on distributions contained in our credit facility or future debt agreements;
|
|
|
·
|
the level of our capital expenditures;
|
|
|
·
|
sources of cash used to fund acquisitions;
|
|
|
·
|
fluctuations in our working capital needs;
|
|
|
·
|
general and administrative expenses;
|
|
|
·
|
cash settlement of hedging positions;
|
|
|
·
|
timing and collectability of receivables; and
|
|
|
·
|
the amount of cash reserves established for the proper conduct of our business.
|
For a description of additional restrictions and factors that may affect our ability to make cash distributions, please read Part II—Item 7 “—Management's Discussion and Analysis of Financial Condition and Results of Operations—Liquidity and Capital Resources.”
Oil and natural gas prices and differentials are highly volatile. In the past, declines in commodity prices have adversely affected, and in the future will adversely affect, our financial condition and results of operations, cash flow, access to the capital markets and ability to grow. A decline in our cash flow from operations forced us to cease paying distributions altogether in 2009, and although distributions were reinstated in May 2010, a decline in our cash flow may force us to reduce our distributions or cease paying distributions altogether in the future.
The oil and natural gas markets are highly volatile, and we cannot predict future oil and natural gas prices. Prices for oil and natural gas may fluctuate widely in response to relatively minor changes in the supply of and demand for oil and natural gas, market uncertainty and a variety of additional factors that are beyond our control, such as:
|
|
·
|
domestic and foreign supply of and demand for oil and natural gas;
|
|
|
·
|
market prices of oil and natural gas;
|
|
|
·
|
level of consumer product demand;
|
|
|
·
|
weather conditions;
|
|
|
·
|
overall domestic and global political and economic conditions;
|
|
|
·
|
political and economic conditions in oil and natural gas producing countries, including those in the Middle East, Russia, South America and Africa;
|
|
|
·
|
actions of the Organization of Petroleum Exporting Countries and other state-controlled oil companies relating to oil price and production controls;
|
|
|
·
|
impact of the U.S. dollar exchange rates on oil and natural gas prices;
|
|
|
·
|
technological advances affecting energy consumption and energy supply;
|
|
|
·
|
domestic and foreign governmental regulations and taxation;
|
|
|
·
|
the impact of energy conservation efforts;
|
|
|
·
|
the capacity, cost and availability of oil and natural gas pipelines, processing, gathering and other transportation facilities, and the proximity of these facilities to our wells;
|
|
|
·
|
an increase in imports of liquid natural gas in the United States; and
|
|
|
·
|
the price and availability of alternative fuels.
|
Oil prices and natural gas prices do not necessarily fluctuate in direct relationship to each other. Because natural gas accounted for approximately 65% of our estimated proved reserves as of December 31, 2010 and is a substantial portion of our current production on a Mcfe basis, our financial results will be more sensitive to movements in natural gas prices.
23
In the past, prices of oil and natural gas have been extremely volatile, and we expect this volatility to continue. For example, during the year ended December 31, 2010, the monthly average NYMEX WTI price ranged from a high of $89 per barrel for December to a low of $74 per barrel for May while the monthly average Henry Hub natural gas price ranged from a high of $5.60 per MMBtu for January to a low of $3.60 per MMBtu for October.
Price discounts or differentials between NYMEX WTI prices and what we actually receive are also historically very volatile. For instance, during calendar year 2010, the average quarterly price discount from NYMEX WTI for our Wyoming production varied from $7.96 to $17.02 per barrel, with the discount percentage of the total price per barrel ranging from 10% to 20%. For California crude oil, our average quarterly differential from NYMEX WTI varied from a premium of $0.87 to a premium of $1.38, with the differential percentage ranging from a 1% premium to a 2% premium of the total price per barrel. Our crude oil produced from our Florida properties also trades at a significant discount to NYMEX WTI primarily because of its low gravity and other characteristics as well as its distance from a major refining market. For
Florida crude oil, our average quarterly discount to NYMEX WTI varied from $15.61 to $16.87 including transportation expenses of approximately $7.50 per barrel, with the discount percentage ranging from 18% to 22% of the total price per barrel.
Our revenue, profitability and cash flow depend upon the prices and demand for oil and natural gas, and a drop in prices could significantly affect our financial results and impede our growth. In particular, declines in commodity prices will negatively impact:
|
|
·
|
our ability to pay distributions;
|
|
|
·
|
the value of our reserves, because declines in oil and natural gas prices would reduce the amount of oil and natural gas that we can produce economically;
|
|
|
·
|
the amount of cash flow available for capital expenditures;
|
|
|
·
|
our ability to replace our production and future rate of growth;
|
|
|
·
|
our ability to borrow money or raise additional capital and our cost of such capital;
|
|
|
·
|
our ability to meet our financial obligations; and
|
|
|
·
|
the amount that we are allowed to borrow under our credit facilities.
|
Historically, higher oil and natural gas prices generally stimulate increased demand and result in increased prices for drilling equipment, crews and associated supplies, equipment and services. Accordingly, continued high costs could adversely affect our ability to pursue our drilling program and our results of operations.
In the past, we have raised our distribution levels on our Common Units in response to increased cash flow during periods of relatively high commodity prices. However, we were not able to sustain those distribution levels during subsequent periods of lower commodity prices. For example, our initial distribution rate was $1.65 on an annual basis for the fourth quarter of 2006. The distribution made to our unitholders on February 13, 2009 for the fourth quarter of 2008 was $2.08 on an annual basis. As a result of the reduction in our borrowing base in April 2009, we were restricted from declaring a distribution on our Common Units and did not pay a distribution from February 2009 until May 2010. Although distributions were reinstated in 2010, a decline in our cash flow may force us to reduce our distributions or
cease paying distributions again altogether in the future.
If we do not make acquisitions on economically acceptable terms, our future growth and ability to pay or increase distributions will be limited.
Our ability to grow and to increase distributions to unitholders depends in part on our ability to make acquisitions that result in an increase in pro forma available cash per unit. We may be unable to make such acquisitions because:
|
|
·
|
we cannot identify attractive acquisition candidates or negotiate acceptable purchase contracts with them;
|
|
|
·
|
we cannot obtain financing for these acquisitions on economically acceptable terms;
|
|
|
·
|
we are outbid by competitors; or
|
|
|
·
|
our Common Units are not trading at a price that would make the acquisition accretive.
|
If we are unable to acquire properties containing proved reserves, our total level of estimated proved reserves may decline as a result of our production, and we may be limited in our ability to increase or maintain our level of cash distributions.
24
Any acquisitions that we complete are subject to substantial risks that could reduce our ability to make distributions to unitholders. The integration of the oil and natural gas properties that we acquire may be difficult, and could divert our management’s attention away from our other operations.
If we do make acquisitions that we believe will increase available cash per unit, these acquisitions may nevertheless result in a decrease in available cash per unit. Any acquisition involves potential risks, including, among other things:
|
|
·
|
the validity of our assumptions about reserves, future production, revenues and costs, including synergies;
|
|
|
·
|
an inability to integrate successfully the businesses we acquire;
|
|
|
·
|
a decrease in our liquidity by using a significant portion of our available cash or borrowing capacity to finance acquisitions;
|
|
|
·
|
a significant increase in our interest expense or financial leverage if we incur additional debt to finance acquisitions;
|
|
|
·
|
the assumption of unknown liabilities, losses or costs for which we are not indemnified or for which our indemnity is inadequate;
|
|
|
·
|
the diversion of management's attention from other business concerns;
|
|
|
·
|
an inability to hire, train or retain qualified personnel to manage and operate our growing business and assets;
|
|
|
·
|
the incurrence of other significant charges, such as impairment of goodwill or other intangible assets, asset devaluation or restructuring charges;
|
|
|
·
|
unforeseen difficulties encountered in operating in new geographic areas; and
|
|
|
·
|
customer or key employee losses at the acquired businesses.
|
Our decision to acquire a property will depend in part on the evaluation of data obtained from production reports and engineering studies, geophysical and geological analyses and seismic and other information, the results of which are often inconclusive and subject to various interpretations.
Also, our reviews of acquired properties are inherently incomplete because it generally is not feasible to perform an in-depth review of the individual properties involved in each acquisition. Even a detailed review of records and properties may not necessarily reveal existing or potential problems, nor will it permit a buyer to become sufficiently familiar with the properties to assess fully their deficiencies and potential. Inspections may not always be performed on every well, and environmental problems, such as ground water contamination, are not necessarily observable even when an inspection is undertaken.
Drilling for and producing oil and natural gas are costly and high-risk activities with many uncertainties that could adversely affect our financial condition or results of operations and, as a result, our ability to pay distributions to our unitholders.
The cost of drilling, completing and operating a well is often uncertain, and cost factors can adversely affect the economics of a well. Our efforts will be uneconomical if we drill dry holes or wells that are productive but do not produce enough oil and natural gas to be commercially viable after drilling, operating and other costs. Furthermore, our drilling and producing operations may be curtailed, delayed or canceled as a result of other factors, including:
|
|
·
|
high costs, shortages or delivery delays of drilling rigs, equipment, labor or other services;
|
|
|
·
|
unexpected operational events and drilling conditions;
|
|
|
·
|
reductions in oil and natural gas prices;
|
|
|
·
|
limitations in the market for oil and natural gas;
|
|
|
·
|
problems in the delivery of oil and natural gas to market;
|
|
|
·
|
adverse weather conditions;
|
|
|
·
|
facility or equipment malfunctions;
|
|
|
·
|
equipment failures or accidents;
|
|
|
·
|
title problems;
|
|
|
·
|
pipe or cement failures;
|
|
|
·
|
casing collapses;
|
|
|
·
|
compliance with environmental and other governmental requirements;
|
|
|
·
|
environmental hazards, such as natural gas leaks, oil spills, pipeline ruptures and discharges of toxic gases;
|
|
|
·
|
lost or damaged oilfield drilling and service tools;
|
25
|
|
·
|
unusual or unexpected geological formations;
|
|
|
·
|
loss of drilling fluid circulation;
|
|
|
·
|
pressure or irregularities in formations;
|
|
|
·
|
fires, blowouts, surface craterings and explosions;
|
|
|
·
|
natural disasters; and
|
|
|
·
|
uncontrollable flows of oil, natural gas or well fluids.
|
If any of these factors were to occur with respect to a particular field, we could lose all or a part of our investment in the field, or we could fail to realize the expected benefits from the field, either of which could materially and adversely affect our revenue and profitability. For example, on November 15, 2008, there was a brush fire at our Brea Olinda field in California that destroyed the electrical infrastructure there and resulted in an estimated loss of production of 5,000 Bbl for the fourth quarter of 2008. Also, on December 1, 2008, there was a fire at our Seal Beach Field in California, which resulted in a brief shutdown of the field and the gas plant located there.
We may be unable to compete effectively with other companies in the oil and gas industry, which may adversely affect our ability to generate sufficient revenue to allow us to pay distributions to our unitholders.
The oil and gas industry is intensely competitive with respect to acquiring prospects and productive properties, marketing oil and natural gas and securing equipment and trained personnel, and we compete with other companies that have greater resources. Many of our competitors are major independent oil and gas companies, and possess and employ financial, technical and personnel resources substantially greater than ours. Those companies may be able to develop and acquire more prospects and productive properties than our financial or personnel resources permit. Our ability to acquire additional properties and to discover reserves in the future will depend on our ability to evaluate and select suitable properties and to consummate transactions in a highly competitive environment. Factors that affect our ability to
acquire properties include availability of desirable acquisition targets, staff and resources to identify and evaluate properties and available funds. Many of our larger competitors not only drill for and produce oil and gas but also carry on refining operations and market petroleum and other products on a regional, national or worldwide basis. These companies may be able to pay more for oil and gas properties and evaluate, bid for and purchase a greater number of properties than our financial or human resources permit. In addition, there is substantial competition for investment capital in the oil and gas industry. Other companies may have a greater ability to continue drilling activities during periods of low oil and gas prices and to absorb the burden of present and future federal, state, local and other laws and regulations. Our inability to compete effectively with other companies could have a material adverse effect on our business activities, financial condition and results of
operations.
A deterioration of the economy and continued depressed natural gas prices could limit our ability to obtain funding in the capital and credit markets on terms we find acceptable, obtain additional or continued funding under our current credit facility or obtain funding at all.
Following the 2008 economic downturn, global financial markets and economic conditions were disrupted and volatile. In addition, the debt and equity capital markets were slow to recover. Global economic issues, along with continued depressed natural gas prices could make it challenging to obtain funding in the capital and credit markets in the future. During 2010 and the first quarter of 2011, access to the debt and equity capital markets improved. However, as a result of concerns about the stability of financial markets generally and the solvency of counterparties specifically, the cost of obtaining money from the credit markets was higher than historical levels as many lenders and institutional investors increased interest rates, enacted tighter lending standards, and limited the amount of funding available to
borrowers.
Historically, we have used our cash flow from operations, borrowings under our credit facility and issuance of additional partnership units to fund our capital expenditures and acquisitions. While the worldwide economic outlook has improved, concerns about global economic growth could have a significant adverse effect on global financial markets and commodity prices. If the economic climate were to deteriorate, demand for oil and natural gas could diminish, which could depress the prices for oil and natural gas and ultimately decrease our net revenue and profitability. The recent natural gas price declines have negatively impacted our revenues and cash flows.
26
These events affect our ability to access capital in a number of ways, which include the following:
|
|
·
|
Our ability to access new debt or credit markets on acceptable terms may be limited and this condition may last for an unknown period of time.
|
|
|
·
|
Our current credit facility limits the amounts we can borrow to a borrowing base amount, determined by the lenders in their sole discretion based on their valuation of our proved reserves and their internal criteria.
|
|
|
·
|
We may be unable to obtain adequate funding under our current credit facility because our lenders may simply be unwilling or unable to meet their funding obligations.
|
|
|
·
|
The operating and financial restrictions and covenants in our credit facility limit (and any future financing agreements likely will limit) our ability to finance future operations or capital needs or to engage, expand or pursue our business activities or to pay distributions.
|
Due to these factors, we cannot be certain that funding will be available if needed and to the extent required, on acceptable terms. If funding is not available when needed, or if funding is available only on unfavorable terms, we may be unable to meet our obligations as they come due or be required to post collateral to support our obligations, or we may be unable to implement our development plans, enhance our existing business, complete acquisitions or otherwise take advantage of business opportunities or respond to competitive pressures, any of which could have a material adverse effect on our production, revenues, results of operations, financial condition or ability to pay distributions. Moreover, if we are unable to obtain funding to make acquisitions of additional properties containing proved oil or natural
gas reserves, our tota l level of proved reserves may decline as a result of our production, and we may be limited in our ability to maintain our level of cash distributions.
Our credit facility has substantial restrictions and financial covenants that may restrict our business and financing activities and our ability to pay distributions.
As of February 28, 2011, we had approximately $122.0 million in borrowings outstanding under our credit facility. Our credit facility limits the amounts we can borrow to a borrowing base amount, determined by the lenders in their sole discretion based on their valuation of our proved reserves and their internal criteria. The borrowing base is redetermined semi-annually and the available borrowing amount could be further decreased as a result of such redeterminations. Decreases in the available borrowing amount could result from declines in oil and natural gas prices, operating difficulties or increased costs, declines in reserves, lending requirements or regulations or certain other circumstances. Our borrowing base was increased to $735 million in May 2010, in connection with an amendment to our credit
facility. In October 2010, as a result of our senior notes offering, our borrowing base was automatically reduced from $735 million to $658.8 million. Our next borrowing base redetermination will be in April 2011. A future decrease in our borrowing base could be substantial and could be to a level below our outstanding borrowings. Outstanding borrowings in excess of the borrowing base are required to be repaid in five equal monthly payments, or we are required to pledge other oil and natural gas properties as additional collateral, within 30 days following notice from the administrative agent of the new or adjusted borrowing base. If we do not have sufficient funds on hand for repayment, we may be required to seek a waiver or amendment from our lenders, refinance our credit facility or sell assets or debt or common units. We may not be able to obtain such financing or complete such transactions on terms acceptable to us, or at all. Failure to make the required repayment could result in
a default under our credit facility, which could ad versely affect our business, financial condition and results of operations.
The operating and financial restrictions and covenants in our credit facility restrict, and any future financing agreements likely will restrict, our ability to finance future operations or capital needs or to engage, expand or pursue our business activities or to pay distributions. Our credit facility restricts, and any future credit facility likely will restrict, our ability to:
|
|
•
|
incur indebtedness;
|
|
|
•
|
grant liens;
|
|
|
•
|
make certain acquisitions and investments;
|
|
|
•
|
lease equipment;
|
|
|
•
|
make capital expenditures above specified amounts;
|
|
|
•
|
redeem or prepay other debt;
|
|
|
•
|
make distributions to unitholders or repurchase units;
|
|
|
•
|
enter into transactions with affiliates; and
|
|
|
•
|
enter into a merger, consolidation, or sale of assets.
|
27
Our credit facility restricts our ability to make distributions to unitholders or repurchase units unless after giving effect to such distribution or repurchase, the availability to borrow under the facility is at least the lesser of (i) 10% of the borrowing base and (ii) the greater of (a) $50 million and (b) twice the amount of the proposed distribution, while remaining in compliance with all terms and conditions of our credit facility, including the leverage ratio not exceeding 3.75 to 1.00 (which is total indebtedness to EBITDAX, as such term is defined in the credit facility). While we currently are not restricted by our credit facility from declaring a distribution as we were in April 2009, we may again be restricted from paying a distribution in the future.
We also are required to comply with certain financial covenants and ratios under the credit facility. Our ability to comply with these restrictions and covenants in the future is uncertain and will be affected by the levels of cash flow from our operations and events or circumstances beyond our control. In light of persistent weak economic conditions and the deterioration of natural gas prices, our ability to comply with these covenants may be impaired. If we violate any of the restrictions, covenants, ratios or tests in our credit facility, a significant portion of our indebtedness may become immediately due and payable, our ability to make distributions will be inhibited and our lenders’ commitment to make further loans to us may terminate. We might not have, or be able to obtain, sufficient funds to
make these accelerated p ayments. In addition, our obligations under our credit facility are secured by substantially all of our assets, and if we are unable to repay our indebtedness under our credit facility, the lenders can seek to foreclose on our assets.
See Part II—Item 7 “—Management's Discussion and Analysis of Financial Condition and Results of Operations—Liquidity and Capital Resources” for a discussion of our credit facility covenants.
Restrictive covenants under our indenture governing our senior notes may adversely affect our operations.
The indenture governing our Senior Notes contains, and any future indebtedness we incur may contain, a number of restrictive covenants that will impose significant operating and financial restrictions on us, including restrictions on our ability to, among other things:
|
•
|
sell assets, including equity interests in our restricted subsidiaries;
|
|
•
|
pay distributions on, redeem or repurchase our units or redeem or repurchase our subordinated debt;
|
|
•
|
make investments;
|
|
•
|
incur or guarantee additional indebtedness or issue preferred units;
|
|
•
|
create or incur certain liens;
|
|
•
|
enter into agreements that restrict distributions or other payments from our restricted subsidiaries to us;
|
|
•
|
consolidate, merge or transfer all or substantially all of our assets;
|
|
•
|
engage in transactions with affiliates;
|
|
•
|
create unrestricted subsidiaries; and
|
|
•
|
engage in certain business activities.
|
As a result of these covenants, we are limited in the manner in which we conduct our business, and we may be unable to engage in favorable business activities or finance future operations or capital needs.
A failure to comply with the covenants in the indenture governing our senior notes or any future indebtedness could result in an event of default under the indenture governing the Senior Notes or the future indebtedness, which, if not cured or waived, could have a material adverse affect on our business, financial condition and results of operations. In addition, complying with these covenants may also cause us to take actions that are not favorable to holders of the notes and may make it more difficult for us to successfully execute our business strategy and compete against companies who are not subject to such restrictions.
Our debt levels may limit our flexibility to obtain additional financing and pursue other business opportunities.
As of February 28, 2011, our long-term debt totaled $427.0 million. Our existing and future indebtedness could have important consequences to us, including:
|
|
·
|
our ability to obtain additional financing, if necessary, for working capital, capital expenditures, acquisitions or other purposes may be impaired or such financing may not be available on terms acceptable to us;
|
28
|
|
·
|
covenants in our existing and future credit and debt arrangements will require us to meet financial tests that may affect our flexibility in planning for and reacting to changes in our business, including possible acquisition opportunities;
|
|
|
·
|
our access to the capital markets may be limited;
|
|
|
·
|
our borrowing costs may increase;
|
|
|
·
|
we will need a substantial portion of our cash flow to make principal and interest payments on our indebtedness, reducing the funds that would otherwise be available for operations, future business opportunities and distributions to unitholders; and
|
|
|
·
|
our debt level will make us more vulnerable than our competitors with less debt to competitive pressures or a downturn in our business or the economy generally.
|
Our ability to service our indebtedness will depend upon, among other things, our future financial and operating performance, which will be affected by prevailing economic conditions and financial, business, regulatory and other factors, some of which are beyond our control. If our operating results are not sufficient to service our current or future indebtedness, we will be forced to take actions such as reducing distributions, reducing or delaying business activities, acquisitions, investments and/or capital expenditures, selling assets, restructuring or refinancing our indebtedness, or seeking additional equity capital or bankruptcy protection. We may not be able to effect any of these remedies on satisfactory terms or at all.
We will require substantial capital expenditures to replace our production and reserves, which will reduce our cash available for distribution. We may be unable to obtain needed capital due to our financial condition, which could adversely affect our ability to replace our production and estimated proved reserves.
To fund our capital expenditures, we will be required to use cash generated from our operations, additional borrowings or the issuance of additional partnership interests, or some combination thereof. In 2011, our oil and gas capital spending program is expected to be in the range of $70 million to $74 million, compared to approximately $70 million in 2010 and approximately $29 million in 2009. We expect to use cash generated from operations to fund future capital expenditures, which will reduce cash available for distribution to our unitholders. Our ability to obtain bank financing or to access the capital markets for future equity or debt offerings to fund future capital expenditures was limited in 2009 because of the credit crisis and turmoil in the financial markets. In the future, our ability to borrow and to
access the capital mark ets may be limited by our financial condition at the time of any such financing or offering and the covenants in our debt agreements, as well as by oil and natural gas prices, the value and performance of our equity securities, and adverse market conditions resulting from, among other things, general economic conditions and contingencies and uncertainties that are beyond our control. Our failure to obtain the funds for necessary future capital expenditures could have a material adverse effect on our business, results of operations, financial condition and ability to pay distributions. Even if we are successful in obtaining the necessary funds, the terms of such financings could limit our ability to pay distributions to our unitholders. In addition, incurring additional debt may significantly increase our interest expense and financial leverage, and issuing additional partnership interests may result in significant unitholder dilution, thereby increasing the
aggregate amount of cash required to maintain the t hen-current distribution rate, which could have a material adverse effect on our ability to pay distributions at the then-current distribution rate.
Our inability to replace our reserves could result in a material decline in our reserves and production, which could adversely affect our financial condition. We are unlikely to be able to sustain or increase distributions without making accretive acquisitions or capital expenditures that maintain or grow our asset base.
Producing oil and natural gas reservoirs are characterized by declining production rates that vary based on reservoir characteristics and other factors. The rate of decline of our reserves and production included in our reserve report at December 31, 2010 will change if production from our existing wells declines in a different manner than we have estimated and may change when we drill additional wells, make acquisitions and under other circumstances. Our future oil and natural gas reserves and production and our cash flow and ability to make distributions depend on our success in developing and exploiting our current reserves efficiently and finding or acquiring additional recoverable reserves economically. We may not be able to develop, find or acquire additional reserves to replace our current and future
production at acceptable costs , which would adversely affect our business, financial condition and results of operations and reduce cash available for distribution.
We are unlikely to be able to sustain or increase distributions without making accretive acquisitions or capital expenditures that maintain or grow our asset base. We will need to make substantial capital expenditures to maintain and grow our asset base, which will reduce our cash available for distribution. Because the timing and amount of these capital expenditures fluctuate each quarter, we expect to reserve cash each quarter to finance these expenditures over time. We may use the reserved cash to reduce indebtedness until we make the capital expenditures.
29
Over a longer period of time, if we do not set aside sufficient cash reserves or make sufficient expenditures to maintain our asset base, we will be unable to pay distributions at the current level from cash generated from operations and would therefore expect to reduce our distributions. If we do not make sufficient growth capital expenditures, we will be unable to sustain our business operations and therefore will be unable to maintain our current level of distributions. With our reserves decreasing, if we do not reduce our distributions, then a portion of the distributions may be considered a return of part of your investment in us as opposed to a return on your investment. Also, if we do not make sufficient growth capital expenditures, we will be unable to expand our business operations and will therefore be
unable to raise the level of future distributions.
Future oil and natural gas price declines may result in a write-down of our asset carrying values.
Declines in oil and natural gas prices in 2008 resulted in us having to make substantial downward adjustments to our estimated proved reserves resulting in increased depletion and depreciation charges. Accounting rules require us to write down, as a non-cash charge to earnings, the carrying value of our oil and natural gas properties for impairments. We are required to perform impairment tests on our assets periodically and whenever events or changes in circumstances warrant a review of our assets. To the extent such tests indicate a reduction of the estimated useful life or estimated future cash flows of our assets, the carrying value may not be recoverable and therefore requires a write-down. For example, as a result of the dramatic declines in oil and gas prices in the second half of 2008 and related reserve reductions, we recorded non-cash charges of $51.9 million for total impairments and $34.5 million for price related adjustments to depletion and depreciation expense for the year ended December 31, 2008. We also may incur impairment charges in the future, which could have a material adverse effect on our results of operations in the period incurred and on our ability to borrow funds under our credit facility, which in turn may adversely affect our ability to make cash distributions to our unitholders.
Our derivative activities could result in financial losses or could reduce our income, which may adversely affect our ability to pay distributions to our unitholders. To the extent we have hedged a significant portion of our expected production and actual production is lower than expected or the costs of goods and services increase, our profitability would be adversely affected.
To achieve more predictable cash flow and to reduce our exposure to adverse fluctuations in the prices of oil and natural gas, we currently and may in the future enter into derivative arrangements for a significant portion of our expected oil and natural gas production that could result in both realized and unrealized hedging losses. As of February 28, 2011, we had hedged, through swaps, options (including collar instruments) and physical contracts, approximately 84% of our 2011 production.
The extent of our commodity price exposure is related largely to the effectiveness and scope of our derivative activities. For example, the derivative instruments we utilize are primarily based on NYMEX WTI and MichCon City-Gate-Inside FERC prices, which may differ significantly from the actual crude oil and natural gas prices we realize in our operations. Furthermore, we have adopted a policy that requires, and our credit facility also mandates, that we enter into derivative transactions related to only a portion of our expected production volumes and, as a result, we will continue to have direct commodity price exposure on the portion of our production volumes not covered by these derivative transactions.
Our actual future production may be significantly higher or lower than we estimate at the time we enter into derivative transactions for such period. If the actual amount is higher than we estimate, we will have greater commodity price exposure than we intended. If the actual amount is lower than the nominal amount that is subject to our derivative financial instruments, we might be forced to satisfy all or a portion of our derivative transactions without the benefit of the cash flow from our sale or purchase of the underlying physical commodity, resulting in a substantial diminution in our profitability and liquidity. As a result of these factors, our derivative activities may not be as effective as we intend in reducing the volatility of our cash flows, and in certain circumstances may actually increase the
volatility of our cash flows .
30
In addition, our derivative activities are subject to the following risks:
|
|
·
|
we may be limited in receiving the full benefit of increases in oil and natural gas prices as a result of these transactions;
|
|
|
·
|
a counterparty may not perform its obligation under the applicable derivative instrument or seek bankruptcy protection;
|
|
|
·
|
there may be a change in the expected differential between the underlying commodity price in the derivative instrument and the actual price received; and
|
|
|
·
|
the steps we take to monitor our derivative financial instruments may not detect and prevent violations of our risk management policies and procedures, particularly if deception or other intentional misconduct is involved.
|
As of February 28, 2011, our derivative counterparties were Barclays Bank PLC, Bank of Montreal, Citibank, N.A, Credit Suisse Energy LLC, Union Bank N.A, Wells Fargo Bank National Association, JP Morgan Chase Bank N.A., The Royal Bank of Scotland plc, The Bank of Nova Scotia, BNP Paribas, U.S Bank National Association and Toronto-Dominion Bank. We periodically obtain credit default swap information on our counterparties. As of December 31, 2010 and February 28, 2011, each of these financial institutions had an investment grade credit rating. Although we currently do not believe that we have a specific counterparty risk with any party, our loss could be substantial if any of these parties were to default. As of December 31, 2010, our largest derivative asset balances were with JP Morgan Chase Bank N.A. and Credit
Suisse Energy LLC, who ac counted for approximately 70% and 13% of our derivative asset balances, respectively. As of December 31, 2010, our largest derivative liability balances were with Wells Fargo Bank National Association, BNP Paribas, Citibank, N.A and The Royal Bank of Scotland plc, who accounted for approximately 67%, 11%, 9% and 9% of our derivative liability balances, respectively.
The recent adoption of derivatives legislation by the United States Congress could have an adverse effect on our ability to use derivative instruments to reduce the effect of commodity price, interest rate and other risks associated with our business.
Congress recently adopted comprehensive financial reform legislation known as the Dodd-Frank Wall Street Reform and Consumer Protection Act (“Dodd-Frank”) that establishes federal oversight and regulation of the over-the-counter derivatives market and entities, such as the Partnership, that participate in that market. Dodd-Frank was signed into law by the President on July 21, 2010 and requires the Commodities Futures Trading Commission (the “CFTC”) and the SEC to promulgate rules and regulations implementing the new legislation within 360 days from the date of enactment. The CFTC has also proposed regulations to set position limits for certain futures and option contracts in the major energy markets and for swaps that are their economic equivalents. Certain bona fide
hedging transactions or positions would be exempt from these position limits. It is not possible at this time to predict when the CFTC will finalize these regulations. Dodd-Frank may also require us to comply with margin requirements and with certain clearing and trade-execution requirements in connection with our derivative activities, although the application of those provisions to us is uncertain at this time. Dodd-Frank may also require the counterparties to our derivative instruments to spin off some of their derivatives activities to a separate entity, which may not be as creditworthy as the current counterparty. Dodd-Frank and any new regulations could significantly increase the cost of derivative contracts (including through requirements to post collateral which could adversely affect our available liquidity), materially alter the terms of derivative contracts, reduce the availability of derivatives to protect against
risks that we encounter, reduce our ability to monetize or restructure our existing derivative contracts, and increase our exposure to less creditworthy counterparties. If we reduce our use of derivatives as a result of the legislation and regulations, our results of operations may become more volatile and our cash flows may be less predictable, which could adversely affect our ability to plan for and fund capital expenditures and make distributions to our unitholders. Finally, this legislation was intended, in part, to reduce the volatility of oil and natural gas prices, which some legislators attributed to speculative trading in derivatives and commodity instruments related to oil and natural gas. Our revenues could therefore be adversely affected if a consequence of Dodd-Frank and any new regulations is to lower commodity prices. Any of these consequences could have a material, adverse effect on us, our financial condition, our results of
operations and our ability to make distributions to un itholders.
31
Our estimated proved reserves are based on many assumptions that may prove to be inaccurate. Any material inaccuracies in these reserve estimates or underlying assumptions could materially affect the quantities and present value of our reserves.
It is not possible to measure underground accumulations of oil or natural gas in an exact way. Oil and gas reserve engineering requires subjective estimates of underground accumulations of oil and natural gas and assumptions concerning future oil and natural gas prices, production levels, and operating and development costs. Our independent reserve engineers do not independently verify the accuracy and completeness of information and data furnished by us. In estimating our level of oil and natural gas reserves, we and our independent reserve engineers make certain assumptions that may prove to be incorrect, including assumptions relating to:
|
|
·
|
future oil and natural gas prices;
|
|
|
·
|
production levels;
|
|
|
·
|
capital expenditures;
|
|
|
·
|
operating and development costs;
|
|
|
·
|
the effects of regulation;
|
|
|
·
|
the accuracy and reliability of the underlying engineering and geologic data; and
|
|
|
·
|
the availability of funds.
|
If these assumptions prove to be incorrect, our estimates of reserves, the economically recoverable quantities of oil and natural gas attributable to any particular group of properties, the classifications of reserves based on risk of recovery and our estimates of the future net cash flows from our reserves could change significantly. For example, if the SEC prices used for our December 31, 2010 reserve report had been $10.00 less per Bbl and $1.00 less per MMBtu, respectively, then the standardized measure of our estimated proved reserves as of December 31, 2010 would have decreased by $325.5 million, from $1,064.9 million to $739.4 million.
Our standardized measure is calculated using unhedged oil prices and is determined in accordance with SEC rules and regulations. Over time, we may make material changes to reserve estimates to take into account changes in our assumptions and the results of actual drilling and production.
The reserve estimates we make for fields that do not have a lengthy production history are less reliable than estimates for fields with lengthy production histories. A lack of production history may contribute to inaccuracy in our estimates of proved reserves, future production rates and the timing of development expenditures.
The present value of future net cash flows from our estimated proved reserves is not necessarily the same as the current market value of our estimated proved oil and natural gas reserves. We base the estimated discounted future net cash flows from our estimated proved reserves on prices and costs in effect on the day of the estimate. However, actual future net cash flows from our oil and natural gas properties also will be affected by factors such as:
|
|
·
|
the actual prices we receive for oil and natural gas;
|
|
|
·
|
our actual operating costs in producing oil and natural gas;
|
|
|
·
|
the amount and timing of actual production;
|
|
|
·
|
the amount and timing of our capital expenditures;
|
|
|
·
|
supply of and demand for oil and natural gas; and
|
|
|
·
|
changes in governmental regulations or taxation.
|
The timing of both our production and our incurrence of expenses in connection with the development and production of oil and natural gas properties will affect the timing of actual future net cash flows from proved reserves, and thus their actual present value. In addition, the 10% discount factor we use when calculating discounted future net cash flows in compliance with the FASB Accounting Standards may not be the most appropriate discount factor based on interest rates in effect from time to time and risks associated with us or the oil and gas industry in general.
32
Our actual production could differ materially from our forecasts.
From time to time, we provide forecasts of expected quantities of future oil and gas production. These forecasts are based on a number of estimates, including expectations of production from existing wells. In addition, our forecasts assume that none of the risks associated with our oil and gas operations summarized in this Item 1A occur, such as facility or equipment malfunctions, adverse weather effects, or significant declines in commodity prices or material increases in costs, which could make certain production uneconomical.
In 2010, we depended on four customers for a substantial amount of our sales. If these customers reduce the volumes of oil and natural gas that they purchase from us, our revenue and cash available for distribution will decline to the extent we are not able to find new customers for our production. In addition, if the parties to our purchase contracts default on these contracts, we could be materially and adversely affected.
In 2010, four customers accounted for approximately 68% of our net sales revenues. If these customers reduce the volumes of oil and natural gas that they purchase from us and we are not able to find new customers for our production, our revenue and cash available for distribution will decline. In 2010, ConocoPhillips in California and Michigan accounted for approximately 30% of our net sales revenues, Marathon Oil Company in Wyoming accounted for approximately 16% of our net sales revenues, Plains Marketing, L.P. in Florida accounted for approximately 12% of our net sales revenues and Sunoco Partners Marketing and Terminals L.P in Michigan accounted for approximately 10% of our net sales revenues. For the year ended December 31, 2009, Conoco Philips accounted for approximately
30% of our net sales re venues, Marathon Oil Company accounted for approximately 16% of our net sales revenues and Plains Marketing, L.P. accounted for approximately 11% of our net sales revenues.
Natural gas purchase contracts account for a significant portion of revenues relating to our Michigan, Indiana and Kentucky properties. We cannot assure you that the other parties to these contracts will continue to perform under the contracts. If the other parties were to default after taking delivery of our natural gas, it could have a material adverse effect on our cash flows for the period in which the default occurred. A default by the other parties prior to taking delivery of our natural gas could also have a material adverse effect on our cash flows for the period in which the default occurred depending on the prevailing market prices of natural gas at the time compared to the contractual prices.
We have limited control over the activities on properties we do not operate.
On a net production basis, we operate approximately 85% of our production as of December 31, 2010. We have limited ability to influence or control the operation or future development of the non-operated properties in which we have interests or the amount of capital expenditures that we are required to fund for their operation. The success and timing of drilling development or production activities on properties operated by others depend upon a number of factors that are outside of our control, including the timing and amount of capital expenditures, the operator's expertise and financial resources, approval of other participants, and selection of technology. Our dependence on the operator and other working interest owners for these projects and our limited ability to
influence or control th e operation and future development of these properties could have a material adverse effect on the realization of our targeted returns on capital or lead to unexpected future costs.
Our operations are subject to operational hazards and unforeseen interruptions for which we may not be adequately insured.
There are a variety of operating risks inherent in our wells, gathering systems, pipelines and other facilities, such as leaks, explosions, fires, mechanical problems and natural disasters including earthquakes and tsunamis, all of which could cause substantial financial losses. Any of these or other similar occurrences could result in the disruption of our operations, substantial repair costs, personal injury or loss of human life, significant damage to property, environmental pollution, impairment of our operations and substantial revenue losses. The location of our wells, gathering systems, pipelines and other facilities near populated areas, including residential areas, commercial business centers and industrial sites, could significantly increase the level of damages resulting from these
risks.
We currently possess property and general liability insurance at levels that we believe are appropriate; however, we are not fully insured for these items and insurance against all operational risk is not available to us. We are not fully insured against all risks, including drilling and completion risks that are generally not recoverable from third parties or insurance. In addition, pollution and environmental risks generally are not fully insurable. Additionally, we may elect not to obtain insurance if we believe that the cost of available insurance is excessive relative to the perceived risks presented. Losses could, therefore, occur for uninsurable or uninsured risks or in amounts in excess of existing insurance coverage. Moreover, insurance may not be
available in the future at commercially reasonable costs and on commercially reasonable terms. Changes in the insurance markets subsequent to the terrorist attacks on September 11, 2001 and the hurricanes in 2005 have made it more difficult for us to obtain certain types of coverage. There can be no assurance that we will be able to obtain the levels or types of insurance we would otherwise have obtained prior to these market changes or that the insurance coverage we do obtain will not contain large deductibles or fail to cover certain hazards or cover all potential losses. Losses and liabilities from uninsured and underinsured events and delay in the payment of insurance proceeds could have a material adverse effect on our business, financial condition, results of operations and ability to make distributions to you.
33
If third-party pipelines and other facilities interconnected to our wells and gathering and processing facilities become partially or fully unavailable to transport natural gas, oil or NGLs, our revenues and cash available for distribution could be adversely affected.
We depend upon third party pipelines and other facilities that provide delivery options to and from some of our wells and gathering and processing facilities. Since we do not own or operate these pipelines or other facilities, their continuing operation in their current manner is not within our control. If any of these third-party pipelines and other facilities become partially or fully unavailable to transport natural gas, oil or NGLs, or if the gas quality specifications for the natural gas gathering or transportation pipelines or facilities change so as to restrict our ability to transport natural gas on those pipelines or facilities, our revenues and cash available for distribution could be adversely affected.
For example, in Florida, there are a limited number of alternative methods of transportation for our production, and substantially all of our oil production is transported by pipelines, trucks and barges owned by third parties. The inability or unwillingness of these parties to provide transportation services for a reasonable fee could result in us having to find transportation alternatives, increased transportation costs, or involuntary curtailment of our oil production in Florida, which could have a negative impact on our future consolidated financial position, results of operations or cash flows.
We are subject to complex federal, state, local and other laws and regulations that could adversely affect the cost, manner or feasibility of conducting our operations.
Our oil and natural gas exploration, production, gathering and transportation operations are subject to complex and stringent laws and regulations. In order to conduct our operations in compliance with these laws and regulations, we must obtain and maintain numerous permits, approvals and certificates from various federal, state and local governmental authorities. We may incur substantial costs in order to maintain compliance with these existing laws and regulations. In addition, our costs of compliance may increase if existing laws, including tax laws, and regulations are revised or reinterpreted, or if new laws and regulations become applicable to our operations. For example, in California, there have been proposals at the legislative and executive levels over the past two years for tax increases which have
included a severance ta x as high as 12.5% on all oil production in California. Although the proposals have not passed the California Legislature, the financial crisis in the State of California could lead to a severance tax on oil being imposed in the future. We have significant oil production in California and while we cannot predict the impact of such a tax without having more specifics, the imposition of such a tax could have severe negative impacts on both our willingness and ability to incur capital expenditures in California to increase production, could severely reduce or completely eliminate our California profit margins and would result in lower oil production in our California properties due to the need to shut-in wells and facilities made uneconomic either immediately or at an earlier time than would have previously been the case. On the local level, the City of Los Angeles currently has placed an initiative on the March 2011 ballot proposing to increase the city’s
tax on oil production in the City of Los Angeles to $1.44 per barrel. There also is currently proposed federal legislation in three areas (tax legislation, climate change and hydraulic fracturing) that if adopted could significantly affect our operations. The following are brief descriptions of the proposed laws:
|
|
•
|
Tax Legislation. The Fiscal Year 2012 Budget proposed by the President recommends the elimination of certain key U.S. federal income tax incentives currently available to oil and natural gas exploration and production companies. Legislation has been proposed that would, if enacted into law, make significant changes to U.S. federal income tax laws, including the elimination of such U.S. federal income tax incentives currently available to oil and natural gas exploration and production companies. These changes include, but are not limited to, (i) the repeal of the percentage depletion allowance for oil and natural gas properties, (ii) the elimination of current deductions for intangible drilling and development costs, (iii) the elimination of the deduction for certain domestic production activities, and (iv) an extension of the
amortization period for certain g eological and geophysical expenditures. It is unclear whether these or similar changes will be enacted and, if enacted, how soon any such changes could become effective. The passage of this legislation or any other similar changes in U.S. federal income tax laws could eliminate or postpone certain tax deductions that are currently available with respect to oil and natural gas exploration and development, and any such change could increase the taxable income allocable to our unitholders and negatively impact the value of an investment in our common units.
|
34
|
|
•
|
Climate Change Legislation and Regulation. In December 2009, the EPA determined that emissions of carbon dioxide, methane and other “greenhouse gases” present an endangerment to public health and the environment because emissions of such gases are, according to the EPA, contributing to warming of the earth’s atmosphere and other climatic changes. Based on these findings, the EPA has begun adopting and implementing regulations to restrict emissions of greenhouse gases under existing provisions of the federal Clean Air Act. The EPA recently adopted two sets of rules regulating greenhouse gas emissions under the Clean Air Act, one of which requires a reduction in emissions of greenhouse gases from motor vehicles and the other of which regulates emissions of greenhouse gases from certain large stationary sources, effective
January 2, 2011. The E PA’s rules relating to emissions of greenhouse gases from large stationary sources of emissions are currently subject to a number of legal challenges, but the federal courts have thus far declined to issue any injunctions to prevent EPA from implementing, or requiring state environmental agencies to implement, the rules. The EPA has also adopted rules requiring the reporting of greenhouse gas emissions from specified large greenhouse gas emission sources in the United States, including petroleum refineries, on an annual basis, beginning in 2011 for emissions occurring after January 1, 2010, as well as certain onshore oil and natural gas production facilities, on an annual basis, beginning in 2012 for emissions occurring in 2011.
|
In addition, Congress has from time to time considered adopting legislation to reduce emissions of greenhouse gases and almost one-half of the states have already taken legal measures to reduce emissions of greenhouse gases primarily through the planned development of greenhouse gas emission inventories and/or regional greenhouse gas cap and trade programs. Most of these cap and trade programs work by requiring major sources of emissions, such as electric power plants, or major producers of fuels, such as refineries and gas processing plants, to acquire and surrender emission allowances. The number of allowances available for purchase is reduced each year in an effort to achieve the overall greenhouse gas emission reduction goal. California has been one of the leading states in adopting greenhouse gas emission
reduction requirements, and California’s initial cap and trade program will begin in 2012. Producers and distributors of liquid fuels and natural gas are not subject to emission limits until 2015.
The adoption of legislation or regulatory programs to reduce emissions of greenhouse gases could require us to incur increased operating costs, such as costs to purchase and operate emissions control systems, to acquire emissions allowances or comply with new regulatory or reporting requirements. Any such legislation or regulatory programs could also increase the cost of consuming, and thereby reduce demand for, the oil and natural gas we produced. Consequently, legislation and regulatory programs to reduce emissions of greenhouse gases could have an adverse effect on our business, financial condition and results of operations. Finally, it should be noted that some scientists have concluded that increasing concentrations of greenhouse gases in the Earth’s atmosphere may produce climate changes that have
significant physical effects , such as increased frequency and severity of storms, droughts, and floods and other climatic events. If any such effects were to occur, they could have an adverse effect on our financial condition and results of operations.
|
|
•
|
Hydraulic Fracturing. Hydraulic fracturing is an important and common practice that is used to stimulate production of hydrocarbons, particularly natural gas, from tight formations. We routinely utilize hydraulic fracturing techniques in many of our natural gas well drilling and completion programs. The process involves the injection of water, sand and chemicals under pressure into the formation to fracture the surrounding rock and stimulate production. The process is typically regulated by state oil and gas commissions. However, the U.S. Environmental Protection Agency, or the EPA, recently asserted federal regulatory authority over hydraulic fracturing involving diesel additives under the Safe Drinking Water Act’s Underground Injection Control Program. While the EPA has yet to take any action to enforce or implement this newly
asserted regulatory auth ority, industry groups have filed suit challenging the EPA’s recent decision. At the same time, the EPA has commenced a study of the potential environmental impacts of hydraulic fracturing activities, and a committee of the U.S. House of Representatives is also conducting an investigation of hydraulic fracturing practices. Legislation has been introduced before Congress to provide for federal regulation of hydraulic fracturing and to require disclosure of the chemicals used in the fracturing process. In addition, some states have adopted, and other states are considering adopting, regulations that could impose more stringent permitting, disclosure and well construction requirements on hydraulic fracturing operations. For example, Pennsylvania, Colorado, and Wyoming have each adopted a variety of well construction, set back, and disclosure regulations limiting how fracturing can be performed and requiring various degrees of chemical disclosure. If new laws
or regulations that significantly restrict hydr aulic fracturing are adopted, such laws could make it more difficult or costly for us to perform fracturing to stimulate production from tight formations. In addition, if hydraulic fracturing becomes regulated at the federal level as a result of federal legislation or regulatory initiatives by the EPA, our fracturing activities could become subject to additional permitting requirements, and also to attendant permitting delays and potential increases in costs. Restrictions on hydraulic fracturing could also reduce the amount of oil and natural gas that we are ultimately able to produce from our reserves.
|
35
|
|
•
|
A change in the jurisdictional characterization of our gathering assets by federal, state or local regulatory agencies or a change in policy by those agencies with respect to those assets may result in increased regulation of those assets.
|
Failure to comply with federal, state and local laws and regulations as interpreted and enforced by governmental authorities possessing jurisdiction over various aspects of the exploration for, and production of, oil and natural gas could have a material adverse effect on our business, financial condition, results of operations and ability to make distributions to you. Please read Part I—Item 1 of our Annual Report “—Business—Operations—Environmental Matters and Regulation” and “—Business—Operations—Other Regulation of the Oil and Gas Industry” for a description of the laws and regulations that affect us.
Our operations expose us to significant costs and liabilities with respect to environmental and operational safety matters.
We may incur significant costs and liabilities as a result of environmental and safety requirements applicable to our oil and natural gas exploration and production activities. These costs and liabilities could arise under a wide range of federal, state and local environmental and safety laws and regulations, including regulations and enforcement policies, which have tended to become increasingly strict over time. Failure to comply with these laws and regulations may result in the assessment of administrative, civil and criminal penalties, imposition of cleanup and site restoration costs and liens, and to a lesser extent, issuance of injunctions to limit or cease operations. In addition, claims for damages to persons or property may result from environmental and other impacts of our operations.
Strict, joint and several liability may be imposed under certain environmental laws, which could cause us to become liable for the conduct of others or for consequences of our own actions that were in compliance with all applicable laws at the time those actions were taken. New laws, regulations or enforcement policies could be more stringent and impose unforeseen liabilities or significantly increase compliance costs. If we are not able to recover the resulting costs through insurance or increased revenues, our ability to make distributions to you could be adversely affected. Please read Part I—Item 1 “Business—Operations—Environmental Matters and Regulation” for more information.
We depend on our General Partner's executive officers, who would be difficult to replace.
We depend on the performance of our General Partner's executive officers, Randall Breitenbach and Halbert Washburn. We do not maintain key person insurance for Mr. Breitenbach or Mr. Washburn. The loss of either or both of Mr. Breitenbach or Mr. Washburn could negatively impact our ability to execute our strategy and our results of operations.
Risks Related to Our Structure
We may issue additional Common Units without your approval, which would dilute your existing ownership interests.
We may issue an unlimited number of limited partner interests of any type, including Common Units, without the approval of our unitholders, including in connection with potential acquisitions of oil and gas properties or the reduction of debt. For example, in 2007, we issued a total of 45 million Common Units (or 67% of our outstanding Common Units) in connection with our acquisitions of oil and natural gas properties, and in February 2011, we issued 4.9 million Common Units (or approximately 9% of our outstanding Common Units at issuance).
36
The issuance of additional Common Units or other equity securities may have the following effects:
|
|
·
|
your proportionate ownership interest in us may decrease;
|
|
|
·
|
the amount of cash distributed on each Common Unit may decrease;
|
|
|
·
|
the relative voting strength of each previously outstanding Common Unit may be diminished;
|
|
|
·
|
the market price of the Common Units may decline; and
|
|
|
·
|
the ratio of taxable income to distributions may increase.
|
Our partnership agreement limits our General Partner's fiduciary duties to unitholders and restricts the remedies available to unitholders for actions taken by our General Partner that might otherwise constitute breaches of fiduciary duty.
Our partnership agreement contains provisions that reduce the standards to which our General Partner would otherwise be held by state fiduciary duty law. For example, our partnership agreement:
|
|
·
|
provides that our General Partner shall not have any liability to us or our unitholders for decisions made in its capacity as general partner so long as it acted in good faith, meaning it believed that the decisions were in the best interests of the Partnership;
|
|
|
·
|
generally provides that affiliate transactions and resolutions of conflicts of interest not approved by the conflicts committee of the board of directors of our General Partner and not involving a vote of unitholders will not constitute a breach of our partnership agreement or of any fiduciary duty if they are on terms no less favorable to us than those generally provided to or available from unrelated third parties or are “fair and reasonable” to us and that, in determining whether a transaction or resolution is “fair and reasonable,” our General Partner may consider the totality of the relationships between the parties involved, including other transactions that may be particularly advantageous or beneficial to us;
|
|
|
·
|
provides that in resolving conflicts of interest where approval of the conflicts committee of the Board is not sought, it will be presumed that in making its decision the Board acted in good faith, and in any proceeding brought by or on behalf of any limited partner or us challenging such approval, the person bringing or prosecuting such proceeding will have the burden of overcoming such presumption; and
|
|
|
·
|
provides that our General Partner and its officers and directors will not be liable for monetary damages to us, our limited partners or assignees for any acts or omissions unless there has been a final and non-appealable judgment entered by a court of competent jurisdiction determining that the General Partner or those other persons acted in bad faith or engaged in fraud or willful misconduct.
|
Unitholders are bound by the provisions of our partnership agreement, including the provisions described above.
Certain of the directors and officers of our General Partner, including our Chief Executive Officer, our President and other members of our senior management, own interests in BEC, which is managed by our subsidiary, BreitBurn Management. Conflicts of interest may arise between BEC, on the one hand, and us and our unitholders, on the other hand. Our partnership agreement limits the remedies available to you in the event you have a claim relating to conflicts of interest.
Certain of the directors and officers of our General Partner, including our Chief Executive Officer and President, own interests in BEC, which is managed by our subsidiary, BreitBurn Management. Conflicts of interest may arise between BEC, on the one hand, and us and our unitholders, on the other hand. We have entered into an Omnibus Agreement with BEC to address certain of these conflicts. However, these persons may face other conflicts between their interests in BEC and their positions with us. These potential conflicts include, among others, the following situations:
|
|
·
|
Our General Partner determines the amount and timing of asset purchases and sales, capital expenditures, borrowings, repayments of indebtedness, issuances of additional partnership securities, cash reserves and expenses. Although we have entered into a new Omnibus Agreement with BEC, which addresses the rights of the parties relating to potential business opportunities, conflicts of interest may still arise with respect to the pursuit of such business opportunities. We have agreed in the Omnibus Agreement that BEC and its affiliates will have a preferential right to acquire any third party upstream oil and natural gas properties that are estimated to contain less than 70% proved developed reserves.
|
37
|
|
·
|
Currently and historically some officers of our General Partner and many employees of BreitBurn Management have also devoted time to the management of BEC. This arrangement will continue under the Second Amended and Restated Administrative Services Agreement and this will continue to result in material competition for the time and effort of the officers of our General Partner and employees of BreitBurn Management who provide services to BEC and who are officers and directors of the sole member of the general partner of BEC. If the officers of our General Partner and the employees of BreitBurn Management do not devote sufficient attention to the management and operation of our business, our financial results could suffer and our ability to make distributions to our unitholders could be reduced.
|
Our partnership agreement limits the liability and reduces the fiduciary duties of our General Partner and its directors and officers, while also restricting the remedies available to our unitholders for actions that, without these limitations, might constitute breaches of fiduciary duty. By purchasing Common Units, unitholders will be deemed to have consented to some actions and conflicts of interest that might otherwise constitute a breach of fiduciary or other duties under applicable law.
Our partnership agreement restricts the voting rights of unitholders owning 20% or more of our Common Units.
Our partnership agreement restricts unitholders’ voting rights by providing that any units held by a person that owns 20% or more of any class of units then outstanding, other than our General Partner, its affiliates, their transferees and persons who acquired such units with the prior approval of the board of directors of our General Partner, cannot vote on any matter. In addition, solely with respect to the election of directors, our partnership agreement provides that (x) our General Partner and the Partnership will not be entitled to vote their units, if any, and (y) if at any time any person or group beneficially owns 20% or more of the outstanding Partnership securities of any class then outstanding and otherwise entitled to vote, then all Partnership securities owned by such person or group in excess
of 20% of the outstandin g Partnership securities of the applicable class may not be voted, and in each case, the foregoing units will not be counted when calculating the required votes for such matter and will not be deemed to be outstanding for purposes of determining a quorum for such meeting. Such common units will not be treated as a separate class of Partnership securities for purposes of our partnership agreement. Notwithstanding the foregoing, the board of directors of our General Partner may, by action specifically referencing votes for the election of directors, determine that the limitation set forth in clause (y) above will not apply to a specific person or group. For example, as part of the Quicksilver Settlement, our board of directors agreed that such voting limitation for the election of directors will not apply to Quicksilver with respect to the Common Units it currently owns. Our partnership agreement also contains provisions limiting the ability of unitholders to
call meetings or to acquire information about our o perations, as well as other provisions limiting unitholders’ ability to influence the manner or direction of management.
Our partnership agreement and unitholder rights plan have provisions that discourage takeovers.
Certain provisions of our partnership agreement may have the effect of delaying or preventing a change in control. Our directors are elected to staggered terms. The vote of the holders of at least 66 2/3% of all outstanding units voting together as a single class is required to remove our General Partner. The board of directors of our General Partner has adopted a unitholder rights plan. If activated, this plan would cause extreme dilution to any person or group that attempts to acquire a 20% or greater interest in the Partnership without advance approval of our General Partner’s board of directors. The provisions contained in our partnership agreement, alone or in combination with each other and with the unitholder rights plan, may discourage transactions involving actual or potential changes of
control.
Unitholders who are not “Eligible Holders” will not be entitled to receive distributions on or allocations of income or loss on their Common Units and their Common Units will be subject to redemption.
In order to comply with U.S. laws with respect to the ownership of interests in oil and gas leases on federal lands, we have adopted certain requirements regarding those investors who may own our Common Units. As used herein, an Eligible Holder means a person or entity qualified to hold an interest in oil and gas leases on federal lands. As of the date hereof, Eligible Holder means: (1) a citizen of the United States; (2) a corporation organized under the laws of the United States or of any state thereof; or (3) an association of United States citizens, such as a partnership or limited liability company, organized under the laws of the United States or of any state thereof, but only if such association does not have any direct or indirect foreign ownership, other than foreign ownership of stock in a parent
corporation organized under the laws of the United States or of any state thereof. For the avoidance of doubt, onshore mineral leases or any direct or indirect interest therein may be acquired and held by aliens only through stock ownership, holding or control in a corporation organized under the laws of the United States or of any state thereof and only for so long as the alien is not from a country that the United States federal government regards as denying similar privileges to citizens or corporations of the United States. Unitholders who are not persons or entities who meet the requirements to be an Eligible Holder will not be entitled to receive distributions or allocations of income and loss on their units and they run the risk of having their units redeemed by us at the lower of their purchase price cost or the then-current market price. The redemption price will be paid in cash or by delivery of a promissory note, as
determined by our General Partner.
38
We have a holding company structure in which our subsidiaries conduct our operations and own our operating assets, which may affect our ability to make distributions to you.
We are a partnership holding company and our operating subsidiaries conduct all of our operations and own all of our operating assets. We have no significant assets other than the ownership interests in our subsidiaries. As a result, our ability to make distributions to our unitholders depends on the performance of our subsidiaries and their ability to distribute funds to us. The ability of our subsidiaries to make distributions to us may be restricted by, among other things, the provisions of existing and future indebtedness, applicable state partnership and limited liability company laws and other laws and regulations.
Unitholders may not have limited liability if a court finds that unitholder action constitutes participation in control of our business.
The limitations on the liability of holders of limited partner interests for the obligations of a limited partnership have not been clearly established in some of the states in which we do business. You could have unlimited liability for our obligations if a court or government agency determined that:
|
|
·
|
we were conducting business in a state but had not complied with that particular state’s partnership statute; or
|
|
|
·
|
your right to act with other unitholders to elect the directors of our General Partner, to remove or replace our General Partner, to approve some amendments to our partnership agreement or to take other actions under our partnership agreement constituted participation in “control” of our business.
|
Unitholders may have liability to repay distributions.
Under certain circumstances, unitholders may have to repay amounts wrongfully returned or distributed to them. Under Section 17-607 of the Delaware Revised Uniform Limited Partnership Act (the “Delaware Act”), we may not make a distribution to you if the distribution would cause our liabilities to exceed the fair value of our assets. Liabilities to partners on account of their partnership interests and liabilities that are non-recourse to the partnership are not counted for purposes of determining whether a distribution is permitted.
Delaware law provides that for a period of three years from the date of an impermissible distribution, limited partners who received the distribution and who knew at the time of the distribution that it violated Delaware law will be liable to the limited partnership for the distribution amount. A purchaser of Common Units who becomes a limited partner is liable for the obligations of the transferring limited partner to make contributions to the partnership that are known to such purchaser of units at the time it became a limited partner and for unknown obligations if the liabilities could be determined from our partnership agreement.
The market price of our Common Units could be adversely affected by sales of substantial amounts of our Common Units, including sales by our existing unitholders.
As of March 9, 2011, we had 59,039,933 Common Units outstanding.
As partial consideration for the Quicksilver Acquisition, we issued 21,347,972 Common Units to Quicksilver in a private placement on November 1, 2007. A registration statement covering the resale of those Common Units has been filed with the SEC and declared effective. Currently, Quicksilver may resell the Common Units that it holds (15,613,021 as of February 28, 2011) in the open market pursuant to the registration statement. In October 2010, Quicksilver sold 650,000 Common Units to MTP Energy Infrastructure Finance Master Fund, Ltd. (“MTP”) in a private placement, which Common Units may be resold by MTP in the open market pursuant to an effective registration statement. As of February 11, 2011, The Baupost Group, L.L.C. (“Baupost”) owned 4,350,000 Common Units, representing 7.37 % of our
Common Units, which may be resold by Baupost in the open market.
39
Sales by any of our existing unitholders of a substantial number of our Common Units, or the perception that such sales might occur, could have a material adverse effect on the price of our Common Units or could impair our ability to obtain capital through an offering of equity securities.
In recent years, the securities market has experienced extreme price and volume fluctuations. This volatility has had a significant effect on the market price of securities issued by many companies for reasons unrelated to the operating performance of these companies. Future market fluctuations may result in a lower price of our Common Units.
Tax Risks to Unitholders
Our tax treatment depends on our status as a partnership for federal income tax purposes, as well as our not being subject to entity-level taxation by individual states. If we were to be treated as a corporation for federal income tax purposes or we were to become subject to entity-level taxation for state tax purposes, taxes paid, if any, would reduce the amount of cash available for distribution.
The anticipated after-tax economic benefit of an investment in our Common Units depends largely on us being treated as a partnership for federal income tax purposes. We have not requested, and do not plan to request, a ruling from the IRS on this or any other tax matter that affects us.
Despite the fact that we are a limited partnership under Delaware law, it is possible in certain circumstances for a partnership such as ours to be treated as a corporation for federal income tax purposes. Although we do not believe based upon our current operations that we are so treated, a change in our business (or a change in current law) could cause us to be treated as a corporation for federal income tax purposes or otherwise subject us to taxation as an entity.
If we were treated as a corporation for federal income tax purposes, we would pay federal income tax on our taxable income at the corporate tax rates, currently at a maximum rate of 35%, and would likely pay state income tax at varying rates. Distributions to you would generally be taxed again as corporate distributions, and no income, gain, loss, deduction or credit would flow through to you. Because a tax would be imposed on us as a corporation, our cash available for distribution to our unitholders could be reduced. Therefore, treatment of us as a corporation could result in a material reduction in the anticipated cash flow and after-tax return to our unitholders and, therefore, result in a substantial reduction in the value of our units.
Current law or our business may change so as to cause us to be treated as a corporation for federal income tax purposes or otherwise subject us to entity-level taxation. In addition, because of widespread state budget deficits, several states are evaluating ways to subject partnerships and limited liability companies to entity-level taxation through the imposition of state income, franchise or other forms of taxation. Imposition of such a tax on us by any such state will reduce the cash available for distribution to our unitholders.
The tax treatment of publicly traded partnerships or an investment in our Common Units could be subject to potential legislative, judicial or administrative changes and differing interpretations, possibly on a retroactive basis.
The present U.S. federal income tax treatment of publicly traded partnerships, including us, or an investment in our Common Units may be modified by administrative, legislative or judicial interpretation at any time. For example, members of Congress have considered substantive changes to the existing U.S. federal income tax laws that would affect publicly traded partnerships. Any modification to the U.S. federal income tax laws and interpretations thereof may or may not be applied retroactively. Although the legislation considered would not appear to affect our tax treatment as a partnership, we are unable to predict whether any of these changes, or other proposals, will ultimately be enacted. Any such changes could negatively impact the value of an investment in our Common Units.
40
If the IRS contests the federal income tax positions we take, the market for our Common Units may be adversely impacted and the cost of any IRS contest will reduce our cash available for distribution to you.
We have not requested a ruling from the IRS with respect to our treatment as a partnership for federal income tax purposes or any other matter affecting us. The IRS may adopt positions that differ from the positions we take. It may be necessary to resort to administrative or court proceedings to sustain some or all of the positions we take. A court may not agree with some or all of the positions we take. Any contest with the IRS may materially and adversely impact the market for our Common Units and the price at which they trade. In addition, our costs of any contest with the IRS will be borne indirectly by our unitholders and our General Partner because the costs will reduce our cash available for distribution.
You may be required to pay taxes on income from us even if you do not receive any cash distributions from us.
You will be required to pay federal income taxes and, in some cases, state and local income taxes on your share of our taxable income, whether or not you receive cash distributions from us. You may not receive cash distributions from us equal to your share of our taxable income or even equal to the actual tax liability that results from your share of our taxable income.
Tax gain or loss on the disposition of our Common Units could be more or less than expected because prior distributions in excess of allocations of income will decrease your tax basis in your Common Units.
If you sell any of your Common Units, you will recognize gain or loss equal to the difference between the amount realized and your tax basis in those Common Units. Prior distributions to you in excess of the total net taxable income you were allocated for a Common Unit, which decreased your tax basis in that Common Unit, will, in effect, become taxable income to you if the Common Unit is sold at a price greater than your tax basis in that Common Unit, even if the price you receive is less than your original cost. A substantial portion of the amount realized, whether or not representing gain, may be ordinary income to you. In addition, if you sell your units, you may incur a tax liability in excess of the amount of cash you receive from the sale.
Tax-exempt entities and non-U.S. persons face unique tax issues from owning our Common Units that may result in adverse tax consequences to them.
Investment in units by tax-exempt entities, including employee benefit plans and individual retirement accounts (known as IRAs), and non-U.S. persons raises issues unique to them. For example, virtually all of our income allocated to organizations exempt from federal income tax, including individual retirement accounts and other retirement plans, will be unrelated business taxable income and will be taxable to such a unitholder. Our partnership agreement generally prohibits non-U.S. persons from owning our units. However, if non-U.S. persons own our units, distributions to such non-U.S. persons will be reduced by withholding taxes imposed at the highest effective applicable tax rate, and such non-U.S. persons will be required to file United States federal income tax returns and pay tax on their share of our taxable
income. If you are a t ax exempt entity or a non-U.S. person, you should consult your tax advisor before investing in our common units.
We will treat each purchaser of our units as having the same tax benefits without regard to the Common Units purchased. The IRS may challenge this treatment, which could adversely affect the value of the Common Units.
Due to a number of factors including our inability to match transferors and transferees of Common Units, we will adopt depreciation and amortization positions that may not conform with all aspects of existing Treasury Regulations. A successful IRS challenge to those positions could adversely affect the amount of tax benefits available to our unitholders. It also could affect the timing of these tax benefits or the amount of gain on the sale of Common Units and could have a negative impact on the value of our Common Units or result in audits of and adjustments to our unitholders’ tax returns.
We prorate our items of income, gain, loss and deduction between transferors and transferees of our Common Units each month based upon the ownership of our Common Units on the first day of each month, instead of on the basis of the date a particular Common Unit is transferred. The IRS may challenge this treatment, and, if successful, we would be required to change the allocation of items of income, gain, loss and deduction among our unitholders.
We prorate our items of income, gain, loss and deduction between transferors and transferees of our Common Units each month based upon the ownership of our Common Units on the first day of each month, instead of on the basis of the date a particular Common Unit is transferred. The use of this proration method may not be permitted under existing Treasury regulations. If the Internal Revenue Service, or IRS, were to successfully challenge this method or new Treasury Regulations were issued, we could be required to change the allocation of items of income, gain, loss and deduction among our unitholders. Recently, however, the Department of the Treasury and the IRS issued proposed Treasury Regulations that provide a safe harbor pursuant to which a publicly traded partnership may use a similar monthly simplifying
convention to allocate tax it ems among transferor and transferee unitholders. Although existing publicly traded partnerships are entitled to rely on these proposed Treasury Regulations, they are not binding on the IRS and are subject to change until final Treasury Regulations are issued.
41
A unitholder whose units are loaned to a “short seller” to cover a short sale of units may be considered as having disposed of those units. If so, he would no longer be treated for tax purposes as a partner with respect to those units during the period of the loan and may recognize gain or loss from the disposition.
Because a unitholder whose units are loaned to a “short seller” to cover a short sale of units may be considered as having disposed of the loaned units, he may no longer be treated for tax purposes as a partner with respect to those units during the period of the loan to the short seller and the unitholder may recognize gain or loss from such disposition. Moreover, during the period of the loan to the short seller, any of our income, gain, loss or deduction with respect to those units may not be reportable by the unitholder and any cash distributions received by the unitholder as to those units could be fully taxable as ordinary income. Unitholders desiring to assure their status as partners and avoid the risk of gain recognition from a loan to a short seller are urged to modify any applicable brokerage
account agreements to prohibit their brokers from borrowing their units.
We may adopt certain valuation methodologies that could result in a shift of income, gain, loss and deduction between the General Partner and the unitholders. The IRS may successfully challenge this treatment, which could adversely affect the value of the Common Units.
When we issue additional units or engage in certain other transactions, we will determine the fair market value of our assets and allocate any unrealized gain or loss attributable to our assets to the capital accounts of our unitholders and our General Partner. Our methodology may be viewed as understating the value of our assets. In that case, there may be a shift of income, gain, loss and deduction between certain unitholders and the General Partner, which may be unfavorable to such unitholders. Moreover, under our valuation methods, subsequent purchasers of Common Units may have a greater portion of their Internal Revenue Code Section 743(b) adjustment allocated to our tangible assets and a lesser portion allocated to our intangible assets. The IRS may challenge our valuation methods, or our allocation of the
Section 743(b) adjustment attributable to our tangible and intangible assets, and allocations of income, gain, loss and deduction between the General Partner and certain of our unitholders.
A successful IRS challenge to these methods or allocations could adversely affect the amount of taxable income or loss being allocated to our unitholders. It also could affect the amount of gain from our unitholders’ sale of Common Units and could have a negative impact on the value of the Common Units or result in audit adjustments to our unitholders’ tax returns without the benefit of additional deductions.
The sale or exchange of 50% or more of our capital and profits interests during any twelve-month period will result in the termination of our partnership for federal income tax purposes.
We will be considered terminated for federal income tax purposes if there is a sale or exchange of 50% or more of the total interests in our capital and profits within a twelve-month period. For purposes of determining whether the 50% threshold has been met, multiple sales of the same interest are counted only once. Our termination would, among other things, result in the closing of our taxable year for all unitholders, which would result in us filing two tax returns for one fiscal year and could result in a significant deferral of depreciation deductions allowable in computing our taxable income. In the case of a unitholder reporting on a taxable year other than a calendar year, the closing of our taxable year may also result in more than twelve months of our taxable income or loss being includable in such
unitholder’s taxable inc ome for the year of termination. Our termination currently would not affect our classification as a partnership for federal income tax purposes, but instead, we would be treated as a new partnership for tax purposes. If treated as a new partnership, we must make new tax elections and could be subject to penalties if we are unable to determine that a termination occurred.
42
Certain U.S. federal income tax deductions currently available with respect to oil and gas exploration and development may be eliminated as a result of future legislation.
The Fiscal Year 2012 Budget proposed by the President recommends the elimination of certain key U.S. federal income tax incentives currently available to oil and gas exploration and production companies, and legislation has been introduced in Congress which would implement many of these proposals. These changes include, but are not limited to, (i) the repeal of the percentage depletion allowance for oil and gas properties, (ii) the elimination of current deductions for intangible drilling and development costs, (iii) the elimination of the deduction for certain domestic production activities, and (iv) an extension of the amortization period for certain geological and geophysical expenditures. It is unclear whether these or similar changes will be enacted and, if enacted, how
soon any such changes could become effective. The passage of any legislation as a result of these proposals or any other similar changes in U.S. federal income tax laws could eliminate or postpone certain tax deductions that are currently available with respect to oil and gas exploration and development, and any such change could increase the taxable income allocable to our unitholders and negatively impact the value of an investment in our Common Units.
You may be subject to state and local taxes and return filing requirements.
In addition to federal income taxes, you will likely be subject to other taxes, including state and local taxes, unincorporated business taxes and estate, inheritance or intangible taxes that are imposed by the various jurisdictions in which we conduct business or own property now or in the future, even if you do not reside in any of those jurisdictions. You will likely be required to file foreign, state and local income tax returns and pay state and local income taxes in some or all of these jurisdictions. Further, you may be subject to penalties for failure to comply with those requirements. We currently conduct business and own property in California, Florida, Indiana, Kentucky, Michigan, and Wyoming. Each of these states other than Wyoming and Florida currently
imposes a personal income tax on individuals, and all of these states impose an income tax on corporations and other entities. As we make acquisitions or expand our business, we may do business or own assets in other states in the future. Some of the states may require us, or we may elect, to withhold a percentage of income from amounts to be distributed to a common unitholder who is not a resident of the state. Withholding, the amount of which may be greater or less than a particular common unitholder's income tax liability to the state, generally does not relieve a nonresident common unitholder from the obligation to file an income tax return. Amounts withheld may be treated as if distributed to common unitholders for purposes of determining the amounts distributed by us. It is the responsibility of each unitholder to file all United States federal, foreign, state and local tax returns that may be required of such unitholder.
None.
The information required to be disclosed in this Item 2 is incorporated herein by reference to Part I—Item 1 “—Business.”
Although we may, from time to time, be involved in litigation and claims arising out of our operations in the normal course of business, we are not currently a party to any material legal proceedings. In addition, we are not aware of any material legal or governmental proceedings against us, or contemplated to be brought against us, under the various environmental protection statues to which we are subject.
43
Our Common Units trade on the NASDAQ Global Select Market under the symbol “BBEP.” At December 31, 2010, based upon information received from our transfer agent and brokers and nominees, we had approximately 23,000 common unitholders of record.
The following table sets forth high and low sales prices per Common Unit and cash distributions to common unitholders for the periods indicated. The last reported sales price for our Common Units on the NASDAQ on March 7, 2011 was $22.15 per unit.
|
Price Range
|
Cash Distribution
|
Date
|
|||||||||||||
|
Period
|
High
|
Low
|
Per Common Unit
|
Paid
|
|||||||||||
|
First Quarter, 2008
|
$ | 29.70 | $ | 17.13 | $ | 0.5000 |
5/15/2008
|
||||||||
|
Second Quarter, 2008
|
23.73 | 18.60 | $ | 0.5200 |
8/14/2008
|
||||||||||
|
Third Quarter, 2008
|
21.87 | 12.51 | $ | 0.5200 |
11/14/2008
|
||||||||||
|
Fourth Quarter, 2008
|
16.30 | 5.25 | $ | 0.5200 |
2/13/2009
|
||||||||||
|
First Quarter, 2009
|
9.80 | 5.76 | $ | 0.0000 | - | ||||||||||
|
Second Quarter, 2009
|
9.35 | 5.53 | $ | 0.0000 | - | ||||||||||
|
Third Quarter, 2009
|
11.42 | 6.85 | $ | 0.0000 | - | ||||||||||
|
Fourth Quarter, 2009
|
13.19 | 9.85 | $ | 0.0000 | - | ||||||||||
|
First Quarter, 2010
|
15.98 | 10.80 | $ | 0.3750 |
5/14/2010
|
||||||||||
|
Second Quarter, 2010
|
15.94 | 13.12 | $ | 0.3825 |
8/13/2010
|
||||||||||
|
Third Quarter, 2010
|
18.31 | 14.25 | $ | 0.3900 |
11/12/2010
|
||||||||||
|
Fourth Quarter, 2010
|
20.89 | 18.20 | $ | 0.4125 |
2/11/2011
|
||||||||||
In 2008, we made cash distributions to unitholders on a quarterly basis. Prior to May 7, 2010, our Amended and Restated Credit agreement restricted us from paying distributions under our credit facility unless, after giving effect to such distribution, our outstanding debt was less than 90% of the borrowing base and we had the ability to borrow at least 10% of the borrowing base while remaining in compliance with all terms and conditions of our credit facility, including the leverage ratio not exceeding 3.50 to 1.00 (which is total indebtedness to EBITDAX). In April 2009, as a result of a redetermination of our credit facility borrowing base from $900 million to $760 million and the terms of our credit facility then in effect, we were restricted from making distributions to our unitholders and suspended
distributions for the first quarte r of 2009.
Although we were not restricted from making distributions under the terms of our credit facility for the second, third and fourth quarters of 2009, we elected not to declare distributions in light of total leverage levels and other factors. We began reducing our outstanding bank debt in 2009 by applying the proceeds from monetization of derivative contracts, a portion of the cash flow from operations for 2009 and the proceeds from the July 2009 sale of the Lazy JL Field. In total, we reduced our outstanding borrowings under our credit facility by approximately $177 million in 2009.
In 2010, we reinstated quarterly cash distributions to our unitholders, beginning with the first quarter of 2010. On May 7, 2010, BOLP, as borrower, and we and our wholly-owned subsidiaries, as guarantors, entered into the Second Amended and Restated Credit Agreement. The Second Amended and Restated Credit Agreement restricts us from making distributions to our unitholders unless after giving effect to such distribution, the availability to borrow under the facility is the lesser of (i) 10% of the borrowing base and (ii) the greater of (a) $50 million and (b) twice the amount of the proposed distribution), while remaining in compliance with all terms and conditions of our credit facility, including the leverage ratio not exceeding 3.75 to 1.00.
For quarters for which we declare a distribution, distributions of available cash are made within 45 days after the end of the quarter to unitholders of record on the applicable record date. Available cash, as defined in our partnership agreement, generally is all cash on hand, including cash from borrowings, at the end of the quarter after the payment of our expenses and the establishment of reserves for future capital expenditures and operational needs.
44
Equity Compensation Plan Information
See Part III—Item 12 “—Security Ownership of Certain Beneficial Owners and Management and Related Unitholder Matters” for information regarding securities authorized for issuance under equity compensation plans.
Unregistered Sales of Equity Securities and Use of Proceeds
Purchases of Equity Securities by the Issuer and Affiliated Purchasers
There were no purchases of our Common Units by us or any affiliated purchasers during the fourth quarter of 2010.
Common Unit Performance Graph
The graph below compares our cumulative total unitholder return on their Common Units from the period October 4, 2006, our first trading day, to December 31, 2010, with the cumulative total returns over the same period of the Russell 2000 index and a customized peer group that includes: Encore Energy Partners LP, EV Energy Partners, L.P., Legacy Reserves LP, Linn Energy, LLC, Pioneer Southwest Energy Partners L.P., and Vanguard Natural Resources, LLC. The graph assumes that the value of the investment in our Common Units, in the Russell 2000 index, and in the peer group index was $100 on October 4, 2006. Cumulative return is computed assuming reinvestment of dividends.
Comparison of Cumulative Total Return among the Partnership, the Russell 2000 Index and a Peer Group
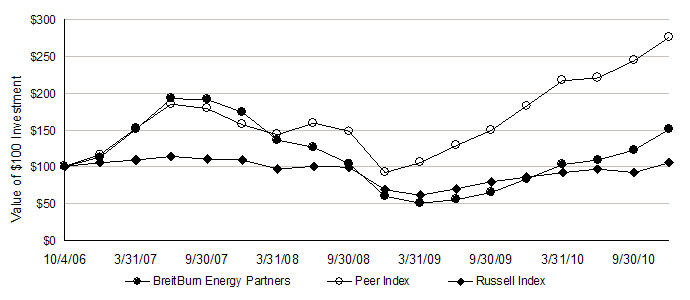
The information in this report appearing under the heading “Common Unit Performance Graph” is being furnished pursuant to Item 2.01(e) of Regulation S-K and shall not be deemed to be “soliciting material” or to be “filed” with the SEC or subject to Regulation 14A or 14C, other than as provided in Item 2.01(e) of Regulation S-K, or to the liabilities of Section 18 of the Securities Exchange Act of 1934, as amended.
45
Set forth below is summary historical consolidated financial data for us and BEC, the predecessor of BreitBurn Energy Partners L.P., as of the dates and for the periods indicated.
The selected consolidated financial data presented as of and for the years ended December 31, 2010, 2009, 2008 and 2007 and the period from October 10, 2006 to December 31, 2006 is from our audited financial statements. The selected historical consolidated financial data presented as of and for the period from January 1, 2006 to October 9, 2006, is from the audited consolidated financial statements of BEC. In connection with our initial public offering, BEC contributed to our wholly owned subsidiaries certain fields in the Los Angeles Basin in California, including its interests in the Santa Fe Springs, Rosecrans and Brea Olinda Fields, substantially all of its oil and gas assets, liabilities and operations located in the Wind River and Big Horn Basins in central Wyoming and certain other assets and liabilities. We
conduct our operations through our wholly owned subsidiaries BreitBurn Operating L.P. (“BOLP”) and BOLP’s general partner BreitBurn Operating GP, LLC (“BOGP”). BEC’s historical results of operations include combined information for us and BEC, and thus may not be indicative of our future results. In 2007, we completed seven acquisitions totaling approximately $1.7 billion, the largest of which was the Quicksilver Acquisition for approximately $1.46 billion. In 2008, we acquired Provident’s interest in BreitBurn Management, BreitBurn Corporation contributed its interest in BreitBurn Management to us, and BreitBurn Management contributed its interest in the General Partner to us, resulting in BreitBurn Management and the General Partner becoming our wholly owned subsidiaries. In 2009, we completed the sale of the Lazy JL field for $23 million in cash.
You should read the following summary financial data in conjunction with Part II—Item 7 “—Management’s Discussion and Analysis of Financial Condition and Results of Operations” and our consolidated financial statements and related notes appearing elsewhere in this report.
The selected financial data table presents a non-GAAP financial measure, “Adjusted EBITDA,” which we use in our business. This measure is not calculated or presented in accordance with generally accepted accounting principles, or GAAP. We explain this measure below and reconcile it to the most directly comparable financial measure calculated and presented in accordance with GAAP.
We believe the presentation of Adjusted EBITDA provides useful information to investors to evaluate the operations of our business excluding certain items and for the reasons set forth below. Adjusted EBITDA should not be considered an alternative to net income, operating income, cash flow from operating activities or any other measure of financial performance presented in accordance with GAAP. Our Adjusted EBITDA may not be comparable to similarly titled measures of another company because all companies may not calculate Adjusted EBITDA in the same manner.
We use Adjusted EBITDA to assess:
|
|
·
|
the financial performance of our assets without regard to financing methods, capital structure or historical cost basis;
|
|
|
·
|
our operating performance and return on capital as compared to those of other companies in our industry, without regard to financing or capital structure;
|
|
|
·
|
the viability of acquisitions and capital expenditure projects and the overall rates of return on alternative investment opportunities; and
|
|
|
·
|
the ability of our assets to generate cash sufficient to pay interest costs and support our indebtedness.
|
46
Selected Financial Data
|
Successor
|
Predecessor
|
|||||||||||||||||||||||
|
BreitBurn Energy Partners L.P.
|
BreitBurn
Energy
Company
L.P.
|
|||||||||||||||||||||||
|
October 10 to
|
January 1 to
|
|||||||||||||||||||||||
|
Year Ended December 31,
|
December 31,
|
October 9,
|
||||||||||||||||||||||
|
Thousands of dollars, except per unit amounts
|
2010
|
2009
|
2008
|
2007
|
2006
|
2006
|
||||||||||||||||||
|
Statement of Operations Data:
|
||||||||||||||||||||||||
|
Revenues and other income items (a)
|
$ | 355,348 | $ | 204,862 | $ | 802,403 | $ | 74,991 | $ | 19,504 | $ | 113,543 | ||||||||||||
|
Operating income (loss)
|
63,743 | (82,811 | ) | 429,354 | (55,348 | ) | 1,901 | 48,898 | ||||||||||||||||
|
Income (loss) before cumulative change in accounting principles
|
34,913 | (107,257 | ) | 378,424 | (60,266 | ) | 1,871 | 46,432 | ||||||||||||||||
|
Cumulative effect of change in accounting principles
|
- | - | - | - | - | 577 | ||||||||||||||||||
|
Net income (loss)
|
34,913 | (107,257 | ) | 378,424 | (60,266 | ) | 1,871 | 47,009 | ||||||||||||||||
|
Less: Net (income) loss attributable to noncontrolling interest
|
(162 | ) | (33 | ) | (188 | ) | (91 | ) | - | 1,039 | ||||||||||||||
|
Net income (loss) attributable to the partnership
|
34,751 | (107,290 | ) | 378,236 | (60,357 | ) | 1,871 | 48,048 | ||||||||||||||||
|
Basic net income (loss) per unit
|
$ | 0.61 | $ | (2.03 | ) | $ | 6.29 | $ | (1.83 | ) | $ | 0.08 | $ | 0.27 | ||||||||||
|
Diluted net income (loss) per unit
|
$ | 0.61 | $ | (2.03 | ) | $ | 6.28 | $ | (1.83 | ) | $ | 0.08 | $ | 0.27 | ||||||||||
|
Cash Flow Data:
|
||||||||||||||||||||||||
|
Net cash provided by (used in) operating activities
|
$ | 182,022 | $ | 224,358 | $ | 226,696 | $ | 60,102 | $ | (1,256 | ) | $ | 47,580 | |||||||||||
|
Net cash used in investing activities
|
(68,286 | ) | (6,229 | ) | (141,039 | ) | (1,020,110 | ) | (1,248 | ) | (35,268 | ) | ||||||||||||
|
Net cash provided by (used in) financing activities
|
(115,872 | ) | (214,909 | ) | (89,040 | ) | 965,844 | 2,581 | (13,693 | ) | ||||||||||||||
|
Balance Sheet Data (at period end):
|
||||||||||||||||||||||||
|
Cash
|
$ | 3,630 | $ | 5,766 | $ | 2,546 | $ | 5,929 | $ | 93 | $ | 1,359 | ||||||||||||
|
Other current assets
|
126,387 | 136,675 | 138,020 | 91,834 | 19,522 | 29,527 | ||||||||||||||||||
|
Net property, plant and equipment
|
1,722,295 | 1,741,089 | 1,840,341 | 1,864,487 | 185,870 | 340,654 | ||||||||||||||||||
|
Other assets
|
77,855 | 87,499 | 235,927 | 24,306 | 418 | 3,057 | ||||||||||||||||||
|
Total assets
|
$ | 1,930,167 | $ | 1,971,029 | $ | 2,216,834 | $ | 1,986,556 | $ | 205,903 | $ | 374,597 | ||||||||||||
|
Current liabilities
|
101,317 | 91,890 | 79,990 | 90,684 | 12,117 | 44,376 | ||||||||||||||||||
|
Long-term debt
|
528,116 | 559,000 | 736,000 | 370,400 | 1,500 | 56,000 | ||||||||||||||||||
|
Other long-term liabilities
|
91,477 | 91,338 | 47,413 | 100,120 | 15,078 | 21,180 | ||||||||||||||||||
|
Partners' capital
|
1,208,803 | 1,228,373 | 1,352,892 | 1,424,808 | 177,208 | 251,680 | ||||||||||||||||||
|
Non-controlling interest
|
454 | 428 | 539 | 544 | - | 1,361 | ||||||||||||||||||
|
Total liabilities and partners' capital
|
$ | 1,930,167 | $ | 1,971,029 | $ | 2,216,834 | $ | 1,986,556 | $ | 205,903 | $ | 374,597 | ||||||||||||
|
Cash dividends declared per unit outstanding:
|
$ | 1.1475 | $ | 0.5200 | $ | 1.9925 | $ | 1.6765 | $ | - | $ | 0.2022 | ||||||||||||
(a) includes unrealized gain (loss) on derivative instruments
47
The following table presents a reconciliation of Adjusted EBITDA to net income (loss), our most directly comparable GAAP financial performance measure, for each of the periods indicated.
|
|
Successor
|
Predecessor
|
||||||||||||||||||||||
|
BreitBurn Energy Partners L.P.
|
BreitBurn
Energy
Company L.P.
|
|||||||||||||||||||||||
|
October 10 to
|
January 1 to
|
|||||||||||||||||||||||
|
Year Ended December 31,
|
December 31,
|
October 9,
|
||||||||||||||||||||||
|
Thousands of dollars
|
2010
|
2009
|
2008
|
2007
|
2006
|
2006
|
||||||||||||||||||
|
Reconciliation of consolidated net income (loss) to Adjusted EBITDA:
|
||||||||||||||||||||||||
|
Net income (loss) attributable to the partnership
|
$ | 34,751 | $ | (107,290 | ) | $ | 378,236 | $ | (60,357 | ) | $ | 1,871 | $ | 48,048 | ||||||||||
|
Unrealized loss (gain) on commodity derivative instruments
|
39,713 | 219,120 | (388,048 | ) | 103,862 | 1,299 | (5,983 | ) | ||||||||||||||||
|
Depletion, depreciation and amortization expense (a)
|
102,758 | 106,843 | 179,933 | 29,422 | 2,506 | 10,903 | ||||||||||||||||||
|
Write-down of crude oil inventory
|
- | - | 1,172 | - | - | - | ||||||||||||||||||
|
Interest expense and other financing costs
|
35,639 | 31,942 | 31,868 | 6,258 | 72 | 2,651 | ||||||||||||||||||
|
Unrealized (gain) loss on interest rate derivatives
|
(6,597 | ) | (5,869 | ) | 17,314 | - | - | - | ||||||||||||||||
|
Gain on sale of commodity derivative instruments
|
- | (70,587 | ) | - | - | - | - | |||||||||||||||||
|
Loss on sale of assets
|
14 | 5,965 | - | - | - | - | ||||||||||||||||||
|
Income tax expense (benefit)
|
(204 | ) | (1,528 | ) | 1,939 | (1,229 | ) | (40 | ) | 90 | ||||||||||||||
|
Amortization of intangibles
|
495 | 2,771 | 3,131 | 2,174 | - | - | ||||||||||||||||||
|
Non-cash unit based compensation
|
20,331 | 13,619 | 7,481 | 5,133 | - | - | ||||||||||||||||||
|
Cumulative effect of change in accounting principles
|
- | - | - | - | - | (577 | ) | |||||||||||||||||
|
Adjusted EBITDA
|
$ | 226,900 | $ | 194,986 | $ | 233,026 | $ | 85,263 | $ | 5,708 | $ | 55,132 | ||||||||||||
(a) 2010 includes impairments of approximately $6.3 million related to Eastern region properties. 2008 includes impairments and price related depletion, depreciation and amortization expense adjustments of $86.4 million.
48
The following discussion and analysis should be read in conjunction with the “Selected Financial Data” and the financial statements and related notes included elsewhere in this report. The following discussion contains forward-looking statements that reflect our future plans, estimates, beliefs and expected performance. The forward-looking statements are dependent upon events, risks and uncertainties that may be outside our control. Our actual results could differ materially from those discussed in these forward-looking statements. Factors that could cause or contribute to such differences are discussed in “Risk Factors” contained in Part I—Item 1A of this report. In light of these risks, uncertainties and assumptions, the forward-looking events discussed may not
occur. See “Caution ary Statement Regarding Forward-Looking Information” in the front of this report.
Executive Overview
We are an independent oil and gas partnership focused on the acquisition, exploitation and development of oil and gas properties in the United States. Our objective is to manage our oil and gas producing properties for the purpose of generating cash flow and making distributions to our unitholders. Our assets consist primarily of producing and non-producing crude oil and natural gas reserves located primarily in the Antrim Shale and other formations in Northern Michigan, the Los Angeles Basin in California, the Wind River and Big Horn Basins in central Wyoming, the Sunniland Trend in Florida and the New Albany Shale in Indiana and Kentucky.
In 2006, we completed our initial public offering. In 2007, we acquired certain interests in oil leases and related assets in Florida for $110 million, and we acquired a 99% limited partner interest in BEPI, a partnership that holds interests in two fields in the Los Angeles Basin, and terminated existing hedges related to future production from BEPI for approximately $92 million. In 2007, we also acquired from Quicksilver its interests in Michigan, Indiana and Kentucky for $750 million in cash and 21,347,972 Common Units.
Our business core investment strategies include:
|
|
·
|
Acquire long-lived assets with low-risk exploitation and development opportunities;
|
|
|
·
|
Use our technical expertise and state-of-the-art technologies to identify and implement successful exploitation techniques to optimize reserve recovery;
|
|
|
·
|
Reduce cash flow volatility through commodity price and interest rate derivatives; and
|
|
|
·
|
Maximize asset value and cash flow stability through operating and technical expertise.
|
Highlights
In 2010, we reinstated quarterly cash distributions to our unitholders, beginning with the first quarter of 2010. We paid cash distributions totaling approximately $61.2 million in 2010. On February 11, 2011 we paid a cash distribution of $22.3 million for the fourth quarter of 2010.
In April 2010, we settled all claims with respect to the litigation filed by Quicksilver in October 2008. With the settlement of this lawsuit, we were able to focus on growth strategies consistent with our long-term goals.
In October 2010, we completed a private offering to eligible purchasers of senior unsecured notes (the “Senior Notes”). We issued $305 million in aggregate principal amount of 8.625% Senior Notes due 2020 at a price of 98.358%. We received net proceeds of approximately $291.2 million after deducting estimated fees and offering expenses and we used $290 million of the net proceeds to repay amounts outstanding under our credit facility. As a result of the completion of the Senior Notes offering, our borrowing base was automatically reduced from approximately $735 million to $658.8 million. We reduced long-term debt under our credit facility by $331 million during 2010, from $559 million at December 31, 2009 to $228 at December 31, 2010, by applying $290 million of the net proceeds from the issuance of the
Senior Notes and using cash flow from operating activities to repay amounts outstanding under our credit facility.
In 2010, our oil and natural gas capital expenditures totaled approximately $70 million, compared with approximately $29 million in 2009. We spent approximately $25 million in Michigan, Indiana and Kentucky, $24 million in Florida, $12 million in California and $9 million in Wyoming. We drilled and completed 13 new wells, and completed two re-drills, two recompletions and eight optimization projects in Florida, California and Wyoming. We drilled and completed 17 new wells and completed 42 optimization projects in Michigan, Indiana and Kentucky. As a result of our accelerated capital spending, our 2010 production was 6.7 MMBoe, which was 3% higher than 2009.
49
Our first horizontal well in the Raccoon Point Field in Florida, came on production in May 2010 and our second well in the same field, came on production in early January 2011. In February 2011, the combined production from both wells was approximately 625 Bbl/d. A third well in the field was spud in late December and we anticipate it coming on production in the second quarter of 2011.
On February 11, 2011, we sold approximately 4.9 million Common Units at a price to the public of $21.25, resulting in proceeds net of underwriting discount of $100.5 million, which we used to repay outstanding debt under our credit facility. As of February 28, 2011, we had approximately $122.0 million in borrowings outstanding under our credit facility and our borrowing base was $658.8 million.
2011 Outlook
In 2011, our crude oil and natural gas capital spending program excluding acquisitions is expected to be in the range of $70 million to $74 million, compared with approximately $70 million in 2010. We anticipate spending approximately 70% in California, Florida and Wyoming and approximately 30% in Michigan, Indiana and Kentucky. We expect to drill or re-drill approximately 40 wells, with 75% of our total capital spending focused on drilling and rate generating projects that are designed to increase or add to production or revenues. Excluding acquisitions, we expect production to be approximately 6.5 MMBoe to 6.9 MMBoe in 2011.
Commodity hedging remains an important part of our strategy to reduce cash flow volatility. We use swaps, collars and options for managing risk relating to commodity prices. As of February 28, 2011, we had hedged approximately 84% of our 2011 expected production. In 2011, we had 8,506 Bbl/d of oil and 41,971 MMBtu/d of natural gas hedged at average prices of approximately $80.20 and $7.92, respectively. In 2012, we had 7,516 Bbl/d of oil and 38,257 MMBtu/d of natural gas hedged at average prices of approximately $87.97 and $8.05, respectively. In 2013, we had 6,980 Bbl/d of oil and 37,000 MMBtu/d of natural gas hedged at average prices of approximately $81.06 and $6.50, respectively. In 2014, we had 5,000 Bbl/d of oil and 7,500 MMBtu/d of natural gas hedged at average prices of approximately $88.60 and $6.00,
respectively. In 2015, we ha d 2,000 Bbl/d of oil hedged at an average price of $99.00.
Consistent with our long-term business strategy, we will continue to actively pursue oil and natural gas acquisition opportunities in 2011.
Operational Focus
We use a variety of financial and operational measures to assess our performance. Among these measures are the following: volumes of oil and natural gas produced; reserve replacement; realized prices and operating and general and administrative expenses.
As of December 31, 2010, our total estimated proved reserves were 118.9 MMBoe, of which approximately 65% was natural gas and 35% was crude oil. As of December 31, 2009, our total estimated proved reserves were 111.3 MMBoe, of which approximately 65% was natural gas and 35% was crude oil.
We had estimated reserves revisions and purchase additions of 14.3 MMBoe in 2010, which were partially offset by 6.7 MMBoe of production. The net overall increase in 2010 estimated reserves was the result of drilling, recompletions, workovers, reserve acquisitions, addition of new drilling locations, economic factors, and revised estimates of existing reserves. The primary economic factor causing the increase in estimated reserves was higher commodity prices. The un-weighted average first-day-of-the-month prices used to determine our total estimated proved reserves as of December 31, 2010 were $79.40 per Bbl for crude oil (except Wyoming properties for which $65.36 per Bbl was used) and $4.38 per MMBtu for natural gas compared to prices during 2009 of $61.18 per Bbl for crude oil (except Wyoming properties for
which $51.29 per Bbl was us ed) and $3.87 per MMBtu for natural gas.
Of our total estimated proved reserves as of December 31, 2010, 68% were located in Michigan, 12% in California, 10% in Wyoming and 8% in Florida, with the remaining 2% in Indiana and Kentucky. On a net production basis, we operate approximately 85% of our production.
50
Our revenues and net income are sensitive to oil and natural gas prices. Our operating expenses are highly correlated to oil prices, and as oil prices rise and fall, our operating expenses will directionally rise and fall. Significant factors that will impact near-term commodity prices include global demand for oil and natural gas, political developments in oil producing countries, including, without limitation, the extent to which members of the OPEC and other oil exporting nations are able to manage oil supply through export quotas and variations in key North American natural gas and refined products supply and demand indicators.
In 2010, the NYMEX WTI spot price averaged approximately $79 per barrel, compared with approximately $62 per barrel a year earlier. In the first two months of 2011, the WTI spot price averaged approximately $89 per barrel. In 2009, prices were volatile, and ranged from a monthly average low of $39 per barrel for February to a monthly average high of $78 per barrel for November. Crude oil prices were less volatile in 2010, and ranged from a monthly average low of $74 per barrel for May to a monthly average high of $89 per barrel for December.
Prices for natural gas have historically fluctuated widely and in many markets are aligned both with supply and demand conditions in their respective regional markets and with the overall U.S. market. U.S. natural gas prices are also typically higher during the winter period when demand for heating is greatest. Since January 2008, NYMEX monthly average futures prices for natural gas at Henry Hub ranged from a low of $3.31 per MMBtu for August 2009 to a high of $12.78 per MMBtu for June 2008. During 2010, the NYMEX wholesale natural gas price ranged from a low of $3.29 per MMBtu to a high of $6.01 per MMBtu, with the monthly average ranging from a low of $3.60 per MMBtu for October to a high of $5.60 per MMBtu for January, and averaged approximately $4.38 per MMBtu for the year. During 2009, the NYMEX wholesale
natural gas price from a lo w of $2.51 per MMBtu to a high of $6.07 per MMBtu, and averaged approximately $4.16 per MMBtu. In the first two months of 2011, the NYMEX wholesale natural gas price averaged $4.27 per MMBtu.
Our realized average oil and NGL price for 2010 increased $13.91 per Boe to $70.71 per Boe as compared to $56.80 per Boe in 2009. Including the effects of derivative instruments, but excluding the effects of the 2009 hedge monetizations, our realized average oil and NGL price increased $8.04 per Boe to $74.31 per Boe as compared to $66.27 per Boe in 2009, primarily due to the increase in crude oil prices and our higher average crude oil hedge price in 2010 compared to 2009. Our realized natural gas price for 2010 increased $0.36 per Mcf to $4.57 per Mcf as compared to $4.21 per Mcf in 2009. Including the effects of derivative instruments, but excluding the effects of the 2009 hedge monetizations, our realized natural gas price increased $0.09 per Mcf to $7.57 per Mcf as compared to $7.48 per Mcf in 2009, primarily
due to the increase in natural gas prices from 2009 to 2010.
While our commodity price risk management program is intended to reduce our exposure to commodity prices and assist with stabilizing cash flow and distributions, to the extent we have hedged a significant portion of our expected production and the cost for goods and services increases, our margins would be adversely affected.
In evaluating our production operations, we frequently monitor and assess our operating and general and administrative expenses per Boe produced. These measures allow us to better evaluate our operating efficiency and are used in reviewing the economic feasibility of a potential acquisition or development project.
Operating expenses are the costs incurred in the operation of producing properties. Expenses for utilities, direct labor, water injection and disposal, production taxes and materials and supplies comprise the most significant portion of our operating expenses. A majority of our operating cost components are variable and increase or decrease along with our levels of production. For example, we incur power costs in connection with various production related activities such as pumping to recover oil and gas, separation and treatment of water produced in connection with our oil and gas production, and re-injection of water produced into the oil producing formation to maintain reservoir pressure. Although these costs typically vary with production volumes, they are driven not only by volumes of oil and gas produced but
also volumes of water p roduced. Consequently, fields that have a high percentage of water production relative to oil and gas production, also known as a high water cut, will experience higher levels of power costs for each Boe produced. Certain items, however, such as direct labor and materials and supplies, generally remain relatively fixed across broad production volume ranges, but can fluctuate depending on activities performed during a specific period. For instance, repairs to our pumping equipment or surface facilities result in increased expenses in periods during which they are performed. Our operating expenses are highly correlated to oil prices and we experience upward or downward pressure on material and service costs depending on how oil prices change. These costs include specific expenditures such as lease fuel, electricity, drilling services and severance and property taxes. Lease operating expenses including processing fees were $17.68 per Boe in 2010 and $17.90 per Boe
in 2009. The decrease in per Boe lease operatin g expense was primarily due to higher production volumes during 2010 compared to 2009.
51
Production taxes vary by state. All states in which we operate impose ad valorem taxes on our oil and gas properties. Various states regulate the drilling for, and the production, gathering and sale of, oil and natural gas, including imposing severance taxes and requirements for obtaining drilling permits. Currently, Wyoming, Michigan, Indiana, Kentucky and Florida impose severance taxes on oil and gas producers at rates ranging from 1% to 8% of the value of the gross product extracted. Wyoming wells that reside on Indian or Federal land are subject to an additional tax of 8.5%. California does not currently impose a severance tax; rather it imposes an ad valorem tax based in large part on the value of the mineral interests in place. See
Part I—Item 1A R 20;—Risk Factors” — “Risks Related to Our Business — We are subject to complex federal, state, local and other laws and regulations that could adversely affect the cost, manner or feasibility of conducting our operations” in this report.
General and administrative expenses (“G&A”), excluding unit based compensation, were $3.65 per Boe in 2010 and $3.64 per Boe in 2009. The slight increase in per Boe G&A, excluding unit based compensation, was primarily due to an increase in our short-term incentive compensation expense.
BreitBurn Management
BreitBurn Management operates our assets and performs other administrative services for us such as accounting, corporate development, finance, land administration, legal and engineering. All of our employees, including our executives, are employees of BreitBurn Management. Prior to June 17, 2008, BreitBurn Management provided services to us and to BEC, and allocated its expenses between the two entities. On June 17, 2008, we purchased Provident’s 95.55% limited liability company interest in BreitBurn Management, which owned the General Partner, for a purchase price of approximately $10 million Also on June 17, 2008, we entered into a contribution agreement with the General Partner, BreitBurn Management and BreitBurn Energy Corporation (“BreitBurn Corporation”), which is wholly owned by the Chief
Executive Officer of the General Partner, Halbert S. Washburn, and the President of the General Partner, Randall H. Breitenbach, pursuant to which BreitBurn Corporation contributed its 4.45% limited liability company interest in BreitBurn Management to us in exchange for 19,955 Common Units, the economic value of which was equivalent to the value of their combined 4.45% interest in BreitBurn Management, and BreitBurn Management contributed its 100% limited liability company interest in the General Partner to us. As a result of these transactions (collectively, the “Purchase, Contribution and Partnership Transactions”), the General Partner and BreitBurn Management became our wholly owned subsidiaries. In connection with the Purchase, Contribution and Partnership Transactions, BreitBurn Management also entered into an Amended and Restated Administrative Services Agreement with BEC, pursuant to which BreitBurn Management agreed to continue to provide administrative services to
BEC, in exchange for a monthly fee for indirec t expenses. Beginning on June 17, 2008, all costs not charged to BEC are consolidated with our results.
On August 26, 2008, members of our senior management, in their individual capacities, together with Metalmark, Greenhill and a third-party institutional investor, completed the acquisition of BEC, our Predecessor. This transaction included the acquisition of a 96.02% indirect interest in BEC previously owned by Provident and the remaining indirect interests in BEC previously owned by Randall H. Breitenbach, Halbert S. Washburn and other members of our senior management. BEC was an indirectly owned subsidiary of Provident. The indirect interests in BEC previously owned by Randall H. Breitenbach, Halbert S. Washburn and other members of our senior management were exchanged in a non-cash transaction for interests in a newly formed limited liability company that now controls BEC. In connection with the acquisition of
Provident’s owners hip in BEC by members of senior management, Metalmark, Greenhill and a third party institutional investor, BreitBurn Management entered into a five year Administrative Services Agreement to manage BEC's properties. On August 26, 2008, we also entered into an Omnibus Agreement with BEC detailing rights with respect to business opportunities and providing us with a right of first offer with respect to the sale of assets by BEC.
The monthly fee charged to BEC was $775,000 for indirect expenses through December 31, 2008. In addition to the monthly fee, BreitBurn Management charges BEC for all direct expenses including incentive plan costs and direct payroll and administrative costs related to BEC properties and operations.
52
The monthly fee is contractually based on an annual projection of anticipated time spent by each employee who provides services to both us and BEC during the ensuing year and is subject to renegotiation annually by the parties during the term of the agreement. Each BreitBurn Management employee estimates his or her time allocation independently. These estimates are reviewed and approved by each employee’s manager or supervisor. We provide the results of this process to both the audit committee of the board of directors of our General Partner (composed entirely of independent directors) (the “audit committee”) and the board of representatives of BEC’s parent (the “BEC board”). The audit committee and the non-management members of the BEC board then agree on the monthly fee as
provided in the Administrat ive Services Agreement. Due to the change in ownership of BEC in 2008, we also considered that, as a privately held company, BEC requires fewer administrative and compliance related services than were previously provided.
The monthly fee in effect for 2009 was determined to be $500,000. The monthly fee in effect for 2010 was determined to be $456,000. In 2011, the monthly fee for indirect costs charged to BEC will be approximately $481,000. The changes in the monthly fee for indirect expenses in 2010 and in 2011 were primarily due to the shift of certain indirect expenses to direct expenses and changes in the time allocated to BEC in each year.
53
Results of Operations
The table below summarizes certain of the results of operations and period-to-period comparisons attributable to our operations for the periods indicated. These results are presented for illustrative purposes only and are not indicative of our future results. The data reflect our results as they are presented in our consolidated financial statements.
Starting in 2009, we shifted regional operation management costs from general and administrative expenses to lease operating expenses to better align our operating and management costs with our organization structure and to be more consistent with industry practice. For comparability, the results for the year ended December 31, 2008 have been reclassified to reflect this shift.
|
Year Ended December 31,
|
Increase / decrease %
|
|||||||||||||||||||
|
Thousands of dollars, except as indicated
|
2010
|
2009
|
2008
|
2010-2009 | 2009-2008 | |||||||||||||||
|
Total production (MBoe)
|
6,699 | 6,517 | 6,809 | 3 | % | -4 | % | |||||||||||||
|
Oil and NGL (MBoe)
|
3,157 | 2,990 | 3,078 | 6 | % | -3 | % | |||||||||||||
|
Natural gas (MMcf) (a)
|
21,251 | 21,161 | 22,384 | 0 | % | -5 | % | |||||||||||||
|
Average daily production (Boe/d)
|
18,354 | 17,856 | 18,605 | 3 | % | -4 | % | |||||||||||||
|
Sales volumes (MBoe)
|
6,663 | 6,465 | 6,857 | 3 | % | -6 | % | |||||||||||||
|
Average realized sales price (per Boe) (b) (c)
|
||||||||||||||||||||
|
- Including realized gain (loss) on derivative instruments
|
$ | 58.94 | $ | 54.60 | $ | 60.11 | 8 | % | -9 | % | ||||||||||
|
Oil and NGL (per Boe) (b) (c)
|
74.31 | 66.27 | 72.86 | 12 | % | -9 | % | |||||||||||||
|
Natural gas (per Mcf) (b)
|
7.57 | 7.48 | 8.24 | 1 | % | -9 | % | |||||||||||||
|
- Excluding realized gain (loss) on derivative instruments (c)
|
$ | 47.71 | $ | 39.58 | $ | 68.26 | 21 | % | -42 | % | ||||||||||
|
Oil and NGL (per Boe) (c)
|
70.71 | 56.80 | 84.10 | 24 | % | -32 | % | |||||||||||||
|
Natural gas (per Mcf) (d)
|
4.57 | 4.21 | 9.17 | 9 | % | -54 | % | |||||||||||||
|
Oil, natural gas and NGL sales (e)
|
$ | 317,738 | $ | 254,917 | $ | 467,381 | 25 | % | -45 | % | ||||||||||
|
Realized gain (loss) on derivative instruments (f)
|
74,825 | 167,683 | (55,946 | ) | -55 | % | n/a | |||||||||||||
|
Unrealized gain (loss) on derivative instruments (f)
|
(39,713 | ) | (219,120 | ) | 388,048 | n/a | -156 | % | ||||||||||||
|
Other revenues, net
|
2,498 | 1,382 | 2,920 | 81 | % | -53 | % | |||||||||||||
|
Total revenues
|
$ | 355,348 | $ | 204,862 | $ | 802,403 | 73 | % | -74 | % | ||||||||||
|
Lease operating expenses including processing fees (g)
|
$ | 118,454 | $ | 118,405 | $ | 122,915 | 0 | % | -4 | % | ||||||||||
|
Production and property taxes (h)
|
20,510 | 19,433 | 31,311 | 6 | % | -38 | % | |||||||||||||
|
Total lease operating expenses
|
$ | 138,964 | $ | 137,838 | $ | 154,226 | 1 | % | -11 | % | ||||||||||
|
Transportation expenses
|
4,058 | 3,825 | 4,206 | 6 | % | -9 | % | |||||||||||||
|
Purchases
|
328 | 72 | 343 | n/a | -79 | % | ||||||||||||||
|
Change in inventory
|
(825 | ) | (3,337 | ) | 3,130 | n/a | n/a | |||||||||||||
|
Uninsured loss
|
- | 100 | 100 | -100 | % | 0 | % | |||||||||||||
|
Total operating costs
|
$ | 142,525 | $ | 138,498 | $ | 162,005 | 3 | % | -15 | % | ||||||||||
|
Lease operating expenses pre taxes per Boe (i)
|
$ | 17.68 | $ | 17.90 | $ | 17.75 | -1 | % | 1 | % | ||||||||||
|
Production and property taxes per Boe
|
3.06 | 2.98 | 4.60 | 3 | % | -35 | % | |||||||||||||
|
Total lease operating expenses per Boe
|
20.74 | 20.88 | 22.35 | -1 | % | -7 | % | |||||||||||||
|
Depletion, depreciation and amortization (DD&A)
|
$ | 102,758 | $ | 106,843 | $ | 179,933 | -4 | % | -41 | % | ||||||||||
(a) Antrim Shale natural gas production was 76%, 81% and 80% of total natural gas production for 2010, 2009 and 2008, respectively.
(b) Excludes the effect of the early termination of oil and natural gas hedge contracts monetized in January 2009 for $45,632 and June 2009 for $24,955.
(c) 2010, 2009 and 2008 exclude the per Boe price effect of amortization of an intangible asset related to crude oil sales contracts. Includes the per Boe price effect of crude oil purchases.
(d) Realized prices per Mcf for our Antrim Shale natural gas were $4.58, $4.23 and $9.18 for 2010, 2009 and 2008, respectively.
(e) 2010, 2009 and 2008 include $495, $1,040 and $1,055, respectively, of amortization of an intangible asset related to crude oil sales contracts.
(f) Includes the effects of the early terminations of hedge contracts monetized in January 2009 for $45,632 and June 2009 for $24,955.
(g) Lease operating expenses per Mcf for Antrim Shale production were $1.46, $1.55 and $1.64 for 2010, 2009 and 2008, respectively.
(h) Includes ad valorem and severance taxes.
(i) Includes lease operating expenses, district expenses and processing fees. 2009 and 2008 exclude amortization of intangible asset related to the Quicksilver Acquisition.
54
Comparison of Results of Operations for the Years Ended December 31, 2010, 2009 and 2008
The variances in our results of operations were due to the following components:
Production
For the year ended December 31, 2010 compared to the year ended December 31, 2009, production volumes increased by 182 MBoe, or 3%, primarily due to 118 MBoe higher Florida production from the new Raccoon Point well, 100 MBoe higher Eastern region production from the capital work program and 13 MBoe higher California crude oil production, partially offset by the sale of the Lazy JL Field effective July 1, 2009, which produced 44 MBoe in 2009. In 2010, natural gas, crude oil and natural gas liquids accounted for 53%, 45% and 2% of our production, respectively.
For the year ended December 31, 2009 as compared to the year ended December 31, 2008, production volumes decreased by 292 MBoe, or 4%, primarily due to natural field declines in Michigan, Indiana and Kentucky, which decreased by 142 MBoe (850 MMcfe), in Florida, which decreased by 98 MBbl, and in California, which decreased by 23 MBoe. In addition, 2009 reflected only six months of Lazy JL production (44 MBoe) compared to a full year of production in 2008 (82 MBoe), as the Lazy JL Field was sold effective July 1, 2009. In 2009, natural gas, crude oil and natural gas liquids accounted for 54%, 44% and 2% of our production, respectively.
Revenues
Total revenues increased by $150.5 million for the year ended December 31, 2010 compared to the year ended December 31, 2009. Realized gains from commodity derivative instruments were $74.8 million in 2010 compared to realized gains of $167.7 million in 2009. Unrealized losses from commodity derivative instruments for the year ended December 31, 2010 were $39.7 million reflecting an increase in crude oil prices partially offset by a decrease in natural gas futures prices during 2010. Unrealized losses from commodity derivative instruments for the year ended December 31, 2009 were $219.1 million reflecting the increase in both crude oil and natural gas futures prices during 2009. The effect of net proceeds of $45.6 million in hedge contracts monetized in January 2009 and $25.0 million in June 2009 are reflected in
realized and unrealized gains and losses on commodity derivative instruments for the year ended December 31, 2009. For 2010 compared to 2009, higher commodity prices increased total sales revenues by approximately $55.0 million and higher sales volumes increased total sales revenues by approximately $7.8 million.
Total revenues decreased by $597.5 million for the year ended December 31, 2009 compared to the year ended December 31, 2008. Realized gains from commodity derivative instruments were $167.7 million in 2009 compared to realized losses of $55.9 million in 2008. Unrealized losses from commodity derivative instruments for the year ended December 31, 2009 were $219.1 million compared to unrealized gains of $388.0 million for the year ended December 31, 2008, reflecting an overall increase in commodity prices during 2009 compared to an overall decrease in commodity prices during 2008. The effect of net proceeds of $45.6 million in hedge contracts monetized in January 2009 and $25.0 million in June 2009 are reflected in realized and unrealized gains and losses on commodity derivative instruments for the year ended
December 31, 2009. For 2009 c ompared to 2008, lower commodity prices decreased total sales revenues by approximately $186 million and lower sales volumes decreased total sales revenue by approximately $26 million.
Lease operating expenses
Pre-tax lease operating expenses, including processing fees, for the year ended December 31, 2010 totaled $118.5 million or $17.68 per Boe, which was 1% lower per Boe than 2009. The decrease was primarily due to higher production volumes during 2010 compared to 2009. For the year ended December 31, 2010, $12.9 million or $1.93 per Boe of regional management costs were included in lease operating expenses compared to $10.9 million or $1.68 per Boe for the year ended December 31, 2009. The increase in regional management costs was primarily due to an increase in our short-term incentive compensation expense.
Production and property taxes for the year ended December 2010 totaled $20.5 million, or $3.06 per Boe, which was 3% higher per Boe than the year ended December 31, 2009. The per Boe increase in production and property taxes compared to 2009 was primarily due to higher commodity prices in 2010.
55
Pre-tax lease operating expenses, including processing fees, for the year ended December 31, 2009 totaled $118.4 million, including $1.8 million in amortization expense of an intangible asset that was capitalized as part of the Quicksilver Acquisition. Pre-tax lease operating expenses, including processing fees, for the year ended December 31, 2009 were $4.5 million lower than the year ended December 31, 2008, primarily attributable to our cost cutting efforts, including the consolidation of operating divisions, and the lower commodity price environment in 2009. On a per Boe basis, excluding amortization of the intangible asset, pre-tax lease operating expenses were $17.90 compared to $17.75 in 2008. For the year ended December 31, 2009, $10.9 million or $1.68 per Boe of regional management costs were included in
lease operating expenses compared to $12.3 million or $1.81 per Boe for the year ended December 31, 2008. The decrease in regional management costs as compared to 2008 was primarily due to the consolidation of operating divisions in early 2009.
Production and property taxes for the year ended December 2009 totaled $19.4 million, or $2.98 per Boe, which was 35% lower per Boe than the year ended December 31, 2008. The per Boe decrease in production and property taxes compared to 2008 was primarily due to lower commodity prices.
Transportation expenses
In Florida, our crude oil is transported from the field by trucks and pipelines and then transported by barge to the sales point. Transportation costs incurred in connection with such operations are reflected in operating costs on the consolidated statements of operations. Transportation expenses for the years ended December 31, 2010 and 2009 were $4.1 million and $3.8 million, respectively. The increase in transportation expenses was primarily due to higher Florida sales volumes in 2010 as compared to 2009.
Transportation expenses for the year ended December 31, 2009 and the year ended December 31, 2008 were $3.8 million and $4.2 million, respectively. The decrease in transportation expenses was primarily due to lower sales volumes.
Change in inventory
In Florida, our crude oil sales are a function of the number and size of crude oil shipments in each year and thus crude oil sales do not always coincide with volumes produced in a given year. Sales occur on average every six to eight weeks. We match production expenses with crude oil sales. Production expenses associated with unsold crude oil inventory are credited to operating costs through the change in inventory account. Production expenses are charged to operating costs through the change in inventory account when they are sold. In 2010, the change in inventory account amounted to a credit of $0.8 million, compared to a credit of $3.3 million in 2009. The credits to inventory reflected the higher amount of barrels produced than sold during the periods.
Depletion, depreciation and amortization
Depletion, depreciation and amortization (“DD&A”) expense totaled $102.8 million, or $15.34 per Boe, for the year ended December 31, 2010, a decrease of approximately 6% per Boe from the year ended December 31, 2009. The decrease in DD&A compared to 2009 was primarily due to the effect higher 2010 commodity prices had on DD&A rates. Included in DD&A for the year ended December 31, 2010 are impairments of approximately $6.3 million related to our Eastern region properties, including a $4.2 million write-down of uneconomic proved properties and a $2.1 million write-down of expired unproved lease properties. Excluding the impact of the impairments for 2010, DD&A per Boe for 2010 was $14.40 or 12% lower than 2009.
DD&A expense totaled $106.8 million, or $16.39 per Boe, for the year ended December 31, 2009, a decrease of approximately 38% per Boe from the year ended December 31, 2008. The decrease in DD&A compared to last year was primarily due to price related reserve reductions at year end 2008. Excluding the impact of price related reserve reductions on 2008 DD&A, DD&A per Boe for 2009 was 19% higher than for 2008 due to higher DD&A rates attributable to the 2008 price related reserve reductions.
General and administrative expenses
Our general and administrative (“G&A”) expenses totaled $44.9 million and $36.4 million in 2010 and 2009, respectively. This included $20.4 million and $12.7 million, respectively, in unit-based compensation expense related to employee incentive plans. The increase in non-cash unit-based compensation expense was primarily due to new equity awards granted in the first quarter of 2010. For 2010, G&A expenses, excluding unit-based compensation, were $24.5 million, which was $0.8 million higher than 2009. The increase was primarily due to higher short-term incentive compensation expense.
56
Our G&A expenses totaled $36.4 million and $30.6 million in 2009 and 2008, respectively. This included $12.7 million and $6.5 million, respectively, in unit-based compensation expense related to employee incentive plans. The increase in unit-based compensation expense related to employee incentive plans was primarily due to new equity awards granted in the first quarter of 2009. For 2009, G&A expenses, excluding unit-based compensation, were $23.7 million, which was $0.4 million lower than 2008.
Unreimbursed litigation costs
In 2010, we recorded $1.4 million for unreimbursed litigation costs and legal fees related to the Quicksilver lawsuit that we do not expect to get reimbursed from our insurance companies. In 2008, we recorded $0.5 million in legal expenses representing the amount of our insurance deductible.
Loss on sale of assets
There was no material gain or loss on sale of assets for the year ended December 31, 2010. The loss on sale of assets of $6.0 million for the year ended December 31, 2009 primarily reflected the $5.5 million loss on sale of the Lazy JL Field in Texas which was sold in July 2009.
Interest expense, net of amounts capitalized
Our interest expense totaled $24.6 million for the year ended December 31, 2010, net of $0.3 million of capitalized interest, an increase of $5.8 million from 2009. This increase in interest expense was primarily attributable to $6.3 million related to the Senior Notes issued in October 2010 and the write-off of $1.5 million of debt issuance costs related to the borrowing base reduction of our credit facility resulting from the issuance of the Senior Notes. These increases were partially offset by lower interest rates and lower debt balance under our credit facility.
We are subject to interest rate risk associated with loans under our credit facility that bear interest based on floating rates. See Part II—Item 7A “—Quantitative and Qualitative Disclosures About Market Risk” within this report for a discussion of our interest rate swaps. We had realized losses of $11.1 million for the year ended December 31, 2010, compared to realized losses of $13.1 million for the year ended December 31, 2009 and unrealized gains of $6.6 million for the year ended December 31, 2010 compared to unrealized gains of $5.9 million for the year ended December 31, 2009, relating to our interest rate swaps. Interest expense, including realized losses on
interest rate derivative c ontracts and excluding debt amortization and unrealized gains or losses on interest rate derivative contracts, totaled $30.2 million and $28.6 million for the years ended December 31, 2010 and 2009, respectively.
Our interest and financing costs totaled $18.8 million for the year ended December 31, 2009, a decrease of $10.3 million from 2008. The decrease in 2009 was primarily attributable to lower interest rates. We had realized losses of $13.1 million for the year ended December 31, 2009, compared to realized losses of $2.7 million for the year ended December 31, 2008 and unrealized gains of $5.9 million for the year ended December 31, 2009, compared to unrealized losses of $17.3 million for the year ended December 31, 2008, relating to our interest rate swaps. Interest expense, including realized losses on interest rate derivative contracts and excluding debt amortization and unrealized gains or losses on interest rate derivative contracts, totaled $28.6 million and $29.3 million for the years ended December 31, 2009 and
2008, respectively.
57
Liquidity and Capital Resources
Our primary sources of liquidity are cash generated from operations, amounts available under our revolving credit facility and cash from the issuance of unsecured long-term debt and from equity. Historically, our primary uses of cash have been for our operating expenses, capital expenditures, cash distributions to unitholders and unit repurchase transactions. To fund certain acquisition transactions, we have also sourced the private placement markets and have issued equity as partial consideration for the acquisition of oil and gas properties. As market conditions have permitted, we have also engaged in asset sale transactions.
Senior Notes Due 2020
On October 6, 2010, we and BreitBurn Finance Corporation (the “Issuers”), and certain of our subsidiaries, as guarantors (the “Guarantors”), issued $305 million in aggregate principal amount of 8.625% Senior Notes due 2020 at a price of 98.358%. We received net proceeds of approximately $291.2 million (after deducting estimated fees and offering expenses) and used $290 million of the net proceeds to repay amounts outstanding under our credit facility. The use of proceeds from the issuance of Senior Notes to repay amounts outstanding under our credit facility increased the borrowing availability under our credit facility, which gives us additional flexibility to finance future acquisitions.
Equity Offering
On February 11, 2011, we sold approximately 4.9 million Common Units at a price to the public of $21.25, resulting in proceeds net of underwriting discount of $100.5 million, which we used to repay outstanding debt under our credit facility.
Credit Facility
On November 1, 2007, BOLP, as borrower, and we and our wholly owned subsidiaries, as guarantors, entered into the four year, $1.5 billion Amended and Restated Credit Agreement. The initial borrowing base under the Amended and Restated Credit Agreement was $700 million. On June 17, 2008, in connection with the Purchase, Contribution and Partnership Transactions, we and our wholly owned subsidiaries entered into Amendment No. 1 to the Credit Agreement, with Wells Fargo Bank, National Association, as administrative agent. Amendment No. 1 to the Credit Agreement increased the borrowing base available under the Amended and Restated Credit Agreement dated November 1, 2007 from $750 million to $900 million. In April 2009, our borrowing base under
our Amended and Restated Credit Agreement was redetermined at $760 million, primarily as a result o f the steep decline in oil and natural gas prices. The redetermination was completed with no modifications to the terms of the facility, including no additional fees and no increase in borrowing rates.
On May 7, 2010, BOLP, as borrower, and we and our wholly owned subsidiaries, as guarantors, Wells Fargo Bank National Association, as administrative agent, and the lenders party thereto, entered into a Second Amended and Restated Credit Agreement, which set our borrowing base at $735 million. As amended, the credit facility will mature on May 7, 2014. On September 17, 2010, we entered into the First Amendment to the Second Amended and Restated Credit Agreement, which classified BreitBurn Collingwood Utica LLC, our indirectly wholly owned subsidiary (“Utica”), as an unrestricted subsidiary under our credit facility, consented to its formation and consented to the transfer of certain non-producing oil and gas zones in the
Collingwood-Utica shale play in Michigan into Utica. On October 5, 2010, our borrowing base was reaffirmed at $735 million, and, as a result of the completion of the Senior Notes offering, our borrowing base was automatically reduced to $658.8 million on October 6, 2010. Our next semi-annual borrowing base redetermination is scheduled for April 2011.
We had outstanding borrowings under our credit facility of $228.0 million as of December 31, 2010 and $122.0 million as of February 28, 2011.
As of December 31, 2010, the lending group under the Second Amended and Restated Credit Agreement included 15 banks. Of the $658.8 million in total commitments under the credit facility, Wells Fargo Bank National Association held approximately 12.4 % of the commitments. Eleven banks held between 5% and 7.5% of the commitments, including Union Bank, N.A., Bank of Montreal, The Bank of Nova Scotia, Houston Branch, BNP Paribas, Citibank, N.A., Royal Bank of Canada, U.S. Bank National Association, Bank of Scotland plc, Barclays Bank PLC, The Royal Bank of Scotland plc and Credit Suisse AG, Cayman Islands Branch, with each of the remaining lenders holding less than 5% of the commitments. In addition to our relationships with these institutions
under the credit facility, from time to time we engage in other transactions with a number of these institutions. Such institutions or their affiliates may serve as underwriter or initial purchaser of our debt and equity securities and/or serve as counterparties to our commodity and interest rate derivative agreements.
58
The Second Amended and Restated Credit Agreement contains customary covenants, including restrictions on our ability to: incur additional indebtedness; make certain investments, loans or advances; make distributions to our unitholders or repurchase units; make dispositions or enter into sales and leasebacks; or enter into a merger or sale of our property or assets, including the sale or transfer of interests in our subsidiaries.
The Second Amended and Restated Credit Agreement no longer requires that in order to make a distribution to our unitholders, we also must have the ability to borrow 10% of our borrowing base after giving effect to such distribution, and remain in compliance with all terms and conditions of our credit facility. The Second Amended and Restated Credit Agreement now includes the restriction on our ability to make distributions unless after giving effect to such distribution, the availability to borrow under the facility is the lesser of (i) 10% of the borrowing base and (ii) the greater of (a) $50 million and (b) twice the amount of the proposed distribution), while remaining in compliance with all terms and conditions of our credit facility.
In addition, the requirement that we maintain a leverage ratio (defined as the ratio of total debt t o EBITDAX) as of the last day of each quarter, on a last twelve month basis of no more than 3.50 to 1.00 was increased to 3.75 to 1.00. The Second Amended and Restated Credit Agreement continues to require us to maintain a current ratio as of the last day of each quarter, of not less than 1.00 to 1.00 and to maintain an interest coverage ratio (defined as the ratio of EBITDAX to consolidated interest expense) as of the last day of each quarter, of not less than 2.75 to 1.00. As of December 31, 2010, we were in compliance with these covenants.
EBITDAX is not a defined GAAP measure. The Second Amended and Restated Credit Agreement defines EBITDAX as consolidated net income plus exploration expense, interest expense, income tax provision, depletion, depreciation and amortization, unrealized loss or gain on derivative instruments, non-cash charges, including non-cash unit based compensation expense, loss or gain on sale of assets (excluding gain or loss on monetization of derivative instruments), cumulative effect of changes in accounting principles, cash distributions received from our unrestricted entities (as defined in the Second Amended and Restated Credit Agreement) and BEPI and excluding income from our unrestricted entities and BEPI.
The pricing grid was adjusted by increasing the applicable margins (as defined in the Second Amended and Restated Credit Agreement) between 75 and 100 basis points, depending on the percentage of the borrowing base borrowed, in line with the current credit market for similar facilities. At our debt level as of December 31, 2010, the applicable margin for our LIBOR based borrowings was 225 basis points. The Second Amended and Restated Credit Agreement is less restrictive than the First Amended and Restated Credit Facility in that, as of September 30, 2010, it also permitted us to incur or guaranty additional debt up to $350 million in senior unsecured notes, and required that our borrowing base be reduced by 25% of the original stated
principal amount of such senior unsecured notes when we incur such additional indebtedness. See “Se nior Notes Due 2020” above for a discussion of the Senior Notes issued on October 6, 2010.
The Second Amended and Restated Credit Agreement also permits us to terminate derivative contracts without obtaining the consent of the lenders in the facility, provided that the net effect of such termination plus the aggregate value of all dispositions of oil and gas properties made during such period, together, does not exceed 5% of the borrowing base, and the borrowing base will be automatically reduced by an amount equal to the net effect of the termination.
The events that constitute an Event of Default (as defined in the Second Amended and Restated Credit Agreement) include: payment defaults; misrepresentations; breaches of covenants; cross-default and cross-acceleration to certain other indebtedness; adverse judgments against us in excess of a specified amount; changes in management or control; loss of permits; certain insolvency events; and assertion of certain environmental claims.
Please see Part I—Item 1A “—Risk Factors”— “Risks Related to Our Business — Our credit facility has substantial restrictions and financial covenants that may restrict our business and financing activities and our ability to pay distributions” in this report, for more information on the effect of an event of default under the Second Amended and Restated Credit Facility.
59
Distributions
Our credit facility limits the amounts we can borrow to a borrowing base amount determined by the lenders in their sole discretion based on their evaluation of our proved reserves and their internal criteria. In April 2009, as a result of a redetermination of our credit facility borrowing base from $900 million to $760 million and the terms of our credit facility then in effect, we were restricted from making distributions to our unitholders and suspended distributions for the first quarter of 2009.
Although we were not restricted from making distributions under the terms of our credit facility for the second, third and fourth quarters of 2009, we elected not to declare distributions in light of total leverage levels and other factors. We began reducing our outstanding bank debt in 2009 by applying the proceeds from monetization of derivative contracts, a portion of the cash flow from operations for 2009 and the proceeds from the July 2009 sale of the Lazy JL Field. In total, we reduced our outstanding borrowings under our credit facility by approximately $177 million in 2009.
In May 2010, we reinstated quarterly cash distributions to our unitholders, by paying a distribution for the first quarter of 2010. On May 14, 2010, we paid a cash distribution for the first quarter totaling $20.0 million, which was $0.375 per Common Unit, to our common unitholders of record as of the close of business on May 10, 2010. On August 13, 2010, we paid a cash distribution for the second quarter totaling $20.4 million, which was $0.3825 per Common Unit, to our common unitholders of record as of the close of business on August 9, 2010. On November 12, 2010, we paid a cash distribution for the third quarter totaling $20.8 million, which was $0.39 per Common Unit, to our common unitholders of record as of the close of business on
November 9, 2010. On February 11, 2011, we paid a cash distribution for the fourth quarter totaling $2 2.3 million, which was $0.4125 per Common Unit, to our common unitholders of record as of the close of business on February 8, 2011.
Cash Flows
Operating activities. Our cash flow from operating activities for 2010 was $182.0 million compared to $224.4 million in 2009. Included in cash flow from operating activities for 2009 were net proceeds of $70.6 million from the monetization of commodity derivative contracts. Excluding the monetization of commodity derivative contracts from our 2009 results, cash flow from operating activities in 2010 was higher than 2009 reflecting the net effect of higher commodity prices and slightly higher sales volumes.
Our cash flow from operating activities for 2009 was $224.4 million compared to $226.7 million in 2008. The 2009 results include $70.6 million from the monetization of commodity derivative contracts. Excluding the net proceeds from the monetization of commodity derivative contracts from 2009 results, cash flow from operating activities in 2009 was lower than 2008 reflecting the net effect of lower commodity prices.
Investing activities. Net cash used in investing activities for the year ended December 31, 2010 was $68.3 million, which was predominantly spent on drilling and completions, including drilling of the Raccoon Point wells in Florida. Property acquisitions of $1.7 million primarily related to a property acquisition in Michigan. Net cash used by investing activities for the year ended December 31, 2009 was $6.2 million, which included capital expenditures of $29.5 million spent primarily on facility and infrastructure projects and well recompletions. The capital expenditures were partially offset by $23 million in proceeds from the sale of the Lazy JL Field in
Texas.
Net cash used in investing activities for the year ended December 31, 2008 was $141.0 million, which reflected $131 million in capital expenditures primarily related to drilling and completion and $10 million on property acquisitions. We elected to reduce our capital spending and drilling activity in 2009 partially due to the substantial decline in oil and natural gas prices during 2008.
Financing activities. Net cash used in financing activities for the year ended December 31, 2010 was $115.9 million compared to $214.9 million for the year ended December 31, 2009. We reduced our long-term debt by approximately $26.0 million in 2010 compared to $177.0 million in 2009. The decrease in our debt reduction in 2010 compared with 2009 is primarily due to higher capital expenditures in 2010 compared to the hedge contract monetizations and sale of the Lazy JL field in 2009. In addition, for the year ended December 31, 2010, we made cash distributions of $65.2 million compared to $28.0 million in 2009. For the year ended December 31, 2010, we paid $11.9
million in debt issuance costs in connection with the Second Amended and Restated Credit Agreement (See “Credit Facility” above) and $8.8 million in connection with the Senior Notes.
60
For the year ended December 31, 2008, we purchased $336.2 million in Common Units, made cash distributions of $121.3 million, borrowed $803.0 million and repaid $437.4 million.
Contractual Obligations
In addition to the credit facility and the Senior Notes described above, on August 26, 2008, BreitBurn Management entered into a five-year Administrative Services Agreement with BEC that terminates on August 26, 2013. See “BreitBurn Management” under “Executive Overview” above for a discussion of this agreement.
Off-Balance Sheet Arrangements
We did not have any off-balance sheet arrangements as of December 31, 2010.
Commitments
The following table summarizes our financial contractual obligations as of December 31, 2010. Some of these contractual obligations are reflected in the balance sheet, while others are disclosed as future obligations under accounting principles generally accepted in the United States.
|
Payments Due by Year
|
||||||||||||||||||||||||||||
|
Thousands of dollars
|
2011
|
2012
|
2013
|
2014
|
2015
|
after 2015
|
Total
|
|||||||||||||||||||||
|
Credit facility (a)
|
$ | - | $ | - | $ | - | $ | 228,000 | $ | - | $ | - | $ | 228,000 | ||||||||||||||
|
Credit facility commitment fees
|
2,184 | 2,184 | 2,184 | 760 | - | - | 7,312 | |||||||||||||||||||||
|
Senior Notes (b)
|
- | - | - | - | - | 305,000 | 305,000 | |||||||||||||||||||||
|
Estimated interest payments (c) (d)
|
35,882 | 34,107 | 32,990 | 28,734 | 26,672 | 127,731 | 286,116 | |||||||||||||||||||||
|
Operating lease obligations
|
3,118 | 2,759 | 1,258 | 840 | 845 | 189 | 9,009 | |||||||||||||||||||||
|
Asset retirement obligations
|
1,091 | 7 | - | - | - | 46,331 | 47,429 | |||||||||||||||||||||
|
Purchase obligations
|
1,084 | 183 | 183 | - | - | - | 1,450 | |||||||||||||||||||||
|
Total
|
$ | 43,359 | $ | 39,240 | $ | 36,615 | $ | 258,334 | $ | 27,517 | $ | 479,251 | $ | 884,316 | ||||||||||||||
(a) Credit facility matures on May 7, 2014.
(b) Represents 8.625% senior notes due 2020 with a face value of $305,000.
(c) Based on debt balance and interest rates in effect at December 31, 2010. Includes the impact of interest rate swaps.
(d) Includes interest expense on Senior Notes.
Surety Bonds and Letters of Credit
In the normal course of business, we have performance obligations that are secured, in whole or in part, by surety bonds or letters of credit. These obligations primarily cover self-insurance and other programs where governmental organizations require such support. These surety bonds and letters of credit are issued by financial institutions and are required to be reimbursed by us if drawn upon. At December 31, 2010, we had obtained various surety bonds for $15.1 million and $0.3 million in letters of credit outstanding. At December 31, 2009, we had $10.6 million in surety bonds and $0.3 million in letters of credit outstanding.
61
Credit and Counterparty Risk
Financial instruments that potentially subject us to concentrations of credit risk consist principally of derivatives and accounts receivable. Our derivatives are exposed to credit risk from counterparties. As of December 31, 2010 and February 28, 2011, our derivative counterparties were Barclays Bank PLC, Bank of Montreal, Citibank, N.A, Credit Suisse Energy LLC, Union Bank N.A, Wells Fargo Bank National Association, JP Morgan Chase Bank N.A., The Royal Bank of Scotland plc, The Bank of Nova Scotia, BNP Paribas, U.S Bank National Association and Toronto-Dominion Bank. Our counterparties are all lenders who participate in our Amended and Restated Credit Agreement. During 2008 and 2009, there was
extreme volatility and disruption in the capital and credit markets. While the market has become more s table in 2010, future volatility could adversely affect the financial condition of our derivative counterparties. On all transactions where we are exposed to counterparty risk, we analyze the counterparty's financial condition prior to entering into an agreement, establish limits, and monitor the appropriateness of these limits on an ongoing basis. We periodically obtain credit default swap information on our counterparties. As of December 31, 2010 and February 28, 2011, each of these financial institutions had an investment grade credit rating. Although we currently do not believe we have a specific counterparty risk with any party, our loss could be substantial if any of these parties were to default. As of December 31, 2010, our largest derivative asset balances were with JP Morgan Chase Bank N.A. and Credit Suisse Energy LLC, who accounted for approximately 70% and 13% of our
derivative asset balances, respectively. As of December 31, 2010, our largest derivative liability balances were with Wells Fargo Bank National Association, BNP Paribas, Citibank, N.A and The Royal Bank of Scotland plc, who accounted for approximately 67%, 11%, 9% and 9% of our derivative liability balances, respectively.
Accounts receivable are primarily from purchasers of oil and natural gas products. We have a portfolio of crude oil and natural gas sales contracts with large, established refiners and utilities. Because our products are commodity products sold primarily on the basis of price and availability, we are not dependent upon one purchaser or a small group of purchasers. During the year ended December 31, 2010, our largest purchasers were ConocoPhillips, Marathon Oil Company, Plains Marketing, L.P. and Sunoco Partners Marketing and Terminals L.P which accounted for approximately 30%, 16%, 12% and 10% of net sales revenues, respectively. ConocoPhilips, Marathon Oil Company, Lundy Thagard Company and Sunoco Partners Marketing and Terminals L.P each
comprised 10% or more of our outstanding trade receivables, and together comprised approximately 68 % of our outstanding trade receivables as of December 31, 2010.
Critical Accounting Policies and Estimates
The discussion and analysis of our financial condition and results of operations is based upon our consolidated financial statements, which have been prepared in accordance with accounting principles generally accepted in the United States. The preparation of these financial statements requires us to make estimates and assumptions that affect the reported amounts of assets, liabilities, revenue and expenses, and related disclosure of contingent assets and liabilities. Certain accounting policies involve judgments and uncertainties to such an extent that there is reasonable likelihood that materially different amounts could have been reported under different conditions, or if different assumptions had been used. We evaluate our estimates
and assumptions on a regular basis. We base our estimates on historical experience and various other a ssumptions that are believed to be reasonable under the circumstances, the results of which form the basis for making judgments about the carrying values of assets and liabilities that are not readily apparent from other sources. Actual results may differ from these estimates and assumptions used in preparation of our financial statements. Below, we have provided expanded discussion of the more significant accounting policies, estimates and judgments. The development, selection and disclosure of each of these policies is reviewed by our audit committee. We believe these accounting policies reflect the more significant estimates and assumptions used in preparation of our financial statements. See Note 2 to the consolidated financial statements in this report for a discussion of additional accounting policies and estimates made by management.
Successful Efforts Method of Accounting
We account for oil and gas properties using the successful efforts method. Under this method of accounting, leasehold acquisition costs are capitalized. Subsequently, if proved reserves are found on unproved property, the leasehold costs are transferred to proved properties. Under this method of accounting, costs relating to the development of proved areas are capitalized when incurred.
Depletion, depreciation and amortization of producing oil and gas properties is recorded based on units of production. Unit rates are computed for unamortized drilling and development costs using proved developed reserves and for unamortized leasehold costs using all proved reserves. FASB accounting standards require that acquisition costs of proved properties be amortized on the basis of all proved reserves, developed and undeveloped, and that capitalized development costs (wells and related equipment and facilities) be amortized on the basis of proved developed reserves.
Geological, geophysical and dry hole costs on oil and gas properties relating to unsuccessful exploratory wells are charged to expense as incurred.
62
Oil and gas properties are reviewed for impairment when facts and circumstances indicate that their carrying value may not be recoverable. We assess impairment of capitalized costs of proved oil and gas properties by comparing net capitalized costs to estimated undiscounted future net cash flows using expected prices. If net capitalized costs exceed estimated undiscounted future net cash flows, the measurement of impairment is based on estimated fair value, which would consider estimated future discounted cash flows. For purposes of performing an impairment test, the undiscounted cash flows are forecast using five-year NYMEX forward strip prices at the end of the period and escalated thereafter at 2.5%. For impairment charges, the
associated proved properties’ expected future net cash flows are discounted using a rate of approximat ely 10%. Unproven properties are assessed for impairment and if considered impaired are charged to expense when such impairment is deemed to have occurred. During the year ended December 31, 2010 we recorded impairments of approximately $6.3 million related to our Eastern region properties, including a $4.2 million write-down of uneconomic proved properties and a $2.1 million write-down of expired unproved lease properties. In 2009, we had no impairments. As a result of the declines in oil and gas prices in the second half of 2008 and related reserve reductions, we recorded non-cash charges of approximately $51.9 million for total impairments and $34.5 million for price related adjustments to DD&A expense for the year ended December
31, 2008. Price declines may in the future result in additional impairment charges, which could have a material adverse effect on our results of operations in the period incurred.
Property acquisition costs are capitalized when incurred.
We capitalize interest costs to oil and gas properties on expenditures made in connection with certain projects such as drilling and completion of new oil and natural gas wells and major facility installations. Interest is capitalized only for the period that such activities are in progress. Interest is capitalized using a weighted average interest rate based on our outstanding borrowings. These capitalized costs are included with intangible drilling costs and amortized using the units of production method. During 2010, interest of $0.3 million was capitalized and included in our capital expenditures. We had no capitalized interest for 2009 and 2008.
Oil and Gas Reserve Quantities
The estimates of our proved reserves are based on the quantities of oil and gas that engineering and geological analyses demonstrate, with reasonable certainty, to be recoverable from established reservoirs in the future under current operating and economic parameters. Annually, Netherland, Sewell & Associates, Inc. and Schlumberger Data & Consulting Services prepare reserve and economic evaluations of all our properties on a well-by-well basis.
Estimated proved reserves and their relation to estimated future net cash flows impact our depletion and impairment calculations. As a result, adjustments to depletion and impairment are made concurrently with changes to reserve estimates. We use quarter-end reserves to calculate quarterly DD&A and, as such, adoption of SEC Release No. 33-8995 had an impact on fourth quarter 2009 DD&A expense. See Note A in the supplemental information to the consolidated financial statements in this report. We prepare our disclosures for reserve estimates, and the projected cash flows derived from these reserve estimates, in accordance with SEC guidelines. The independent engineering firms
described above adhere to the same guidelines when preparing their reserve reports. The accuracy of t he reserve estimates is a function of many factors including the following: the quality and quantity of available data, the interpretation of that data, the accuracy of various mandated economic assumptions and the judgments of the individuals preparing the estimates.
Because these estimates depend on many assumptions, all of which may substantially differ from future actual results, reserve estimates will be different from the quantities of oil and natural gas that are ultimately recovered. In addition, results of drilling, testing and production after the date of an estimate may justify, positively or negatively, material revisions to the estimate of proved reserves.
Our estimates of proved reserves materially impact depletion expense. If the estimates of proved reserves decline, the rate at which we record depletion expense will increase, reducing future net income. Such a decline may result from lower market prices, which may make it uneconomical to drill for and produce higher cost fields. In addition, a decline in proved reserve estimates may impact the outcome of our assessment of oil and gas producing properties for impairment. For example, if the SEC prices used for our December 31, 2010 reserve report had been $10.00 less per Bbl and $1.00 less per MMBtu, respectively, then the standardized measure of our estimated proved reserves as of December 31, 2010 would have decreased by approximately
$325.5 million, from $1,064.9 million to $739.4 million.
63
Please see Part I—Item 1A —“Risk Factors” — “Risks Related to Our Business — Our estimated proved reserves are based on many assumptions that may prove to be inaccurate. Any material inaccuracies in these reserve estimates or underlying assumptions could materially affect the quantities and present value of our reserves.”
Asset Retirement Obligations
Estimated asset retirement obligation (“ARO”) costs are recognized when the asset is placed in service and are amortized over proved reserves using the units of production method. The engineers of BreitBurn Management estimate asset retirement costs using existing regulatory requirements and anticipated future inflation rates. Projecting future ARO cost estimates is difficult as it involves the estimation of many variables such as economic recoveries of future oil and gas reserves, future labor and equipment rates, future inflation rates, and our credit adjusted risk free interest rate. Because of the intrinsic uncertainties present when estimating asset retirement costs as well as asset retirement settlement dates, our ARO
estimates are subject to ongoing volatility.
Environmental Expenditures
We review, on an annual basis, our estimates of the cleanup costs of various sites. When it is probable that obligations have been incurred and where a reasonable estimate of the cost of compliance or remediation can be determined, the applicable amount is accrued. For other potential liabilities, the timing of accruals coincides with the related ongoing site assessments. We do not discount these liabilities. At December 31, 2010, we had a $2.1 million environmental liability accrued that included cost estimates related to the maintenance of ground water monitoring wells associated with certain former well sites in Michigan that are no longer producing.
Derivative Instruments
We periodically use derivative financial instruments to achieve more predictable cash flow from our oil and natural gas production by reducing their exposure to price fluctuations. Currently, these instruments include swaps, collars and options. Additionally, we may use derivative financial instruments in the form of interest rate swaps to mitigate interest rate exposure. We account for these activities pursuant to FASB accounting standards that require derivative instruments (including certain derivative instruments embedded in other contracts) be recorded at fair market value and be included in the balance sheet as assets or liabilities. The accounting for changes in the fair market value of a derivative instrument depends on the
intended use of the derivative instrument and the resulting designation, which is established at the incept ion of a derivative instrument. We are required to formally document, at the inception of a hedge, the hedging relationship and our risk management objective and strategy for undertaking the hedge, including identification of the hedging instrument, the hedged item or transaction, the nature of the risk being hedged, the method that will be used to assess effectiveness and the method that will be used to measure hedge ineffectiveness of derivative instruments that receive hedge accounting treatment. We do not account for our derivative instruments as cash flow hedges for financial accounting purposes and are recognizing changes in the fair value of our derivative instruments immediately in net income. See Part II—Item 7A “—Quantitative and Qualitative Disclosures About Market Risk” and Note
5 to the consolidated financial statements in this report for additional information related to our financial instruments. < /div>
New Accounting Pronouncements
See Note 3 to the consolidated financial statements in this report for a discussion of new accounting pronouncements.
64
The primary objective of the following information is to provide forward-looking quantitative and qualitative information about our potential exposure to market risks. The term “market risk” refers to the risk of loss arising from adverse changes in oil and natural gas prices and interest rates. The disclosures are not meant to be precise indicators of expected future losses, but rather indicators of reasonably possible losses. This forward-looking information provides indicators of how we view and manage our ongoing market risk exposures. All of our market risk sensitive instruments were entered into for purposes other than speculative trading. See “Cautionary Statement
Regarding Forward-Looking Information” in Part I—Item 1 “—BusinessR 21; in this report.
See Note 5 to the consolidated financial statements in this report for additional information related to our financial instruments, including summaries of our commodity and interest rate derivative contracts at December 31, 2010 and a discussion of credit and counterparty risk.
Commodity Price Risk
Due to the historical volatility of crude oil and natural gas prices, we have entered into various derivative instruments to manage exposure to volatility in the market price of crude oil and natural gas to achieve more predictable cash flows. We use swaps, collars and options for managing risk relating to commodity prices. All contracts are settled with cash and do not require the delivery of physical volumes to satisfy settlement. While this strategy may result in us having lower revenues than we would otherwise have if we had not utilized these instruments in times of higher oil and natural gas prices, management believes that the resulting reduced volatility of prices and cash flow is beneficial. While our commodity price risk
management program is intended to reduce our exposure to commodity prices and assist with stabilizing cash f low and distributions, to the extent we have hedged a significant portion of our expected production and the cost for goods and services increases, our margins would be adversely affected. Please see Part I—Item 1A —“Risk Factors” — “Risks Related to Our Business — Our derivative activities could result in financial losses or could reduce our income, which may adversely affect our ability to pay distributions to our unitholders. To the extent we have hedged a significant portion of our expected production and actual production is lower than expected or the costs of goods and services increase, our profitability would be adversely affected.” The use of derivatives also involves the risk that the counterparties to such instruments will be unable to meet the financial terms of such contracts.
Our commodity derivative instruments provide for monthly settlement based on the differential between the agreement price and the actual NYMEX WTI crude oil price or MichCon City-Gate natural gas price.
We do not currently designate any of our derivative instruments as hedges for financial accounting purposes. In order to qualify for hedge accounting, the relationship between the hedging instrument and the hedged item must be highly effective in achieving the offset of changes in cash flows attributable to the hedged risk both at the inception of the contract and on an ongoing basis. Hedge effectiveness must be measured, at minimum, on a quarterly basis. Hedge accounting must be discontinued prospectively when a hedge instrument is no longer considered to be highly effective. Many of our commodity derivative instruments would not qualify for hedge accounting due to the ineffectiveness created by variability in our price discounts or
differentials.
Our Los Angeles Basin crude oil is generally medium gravity crude. Because of its proximity to the extensive Los Angeles refinery market, it trades at only a minor discount to NYMEX WTI. Our Wyoming crude oil, while generally of similar quality to our Los Angeles Basin crude oil, trades at a significant discount to NYMEX WTI because of its distance from a major refining market and the fact that it is priced relative to the Bow River benchmark for Canadian heavy sour crude oil, which has historically traded at a significant discount to NYMEX WTI. Our Florida crude oil also trades at a significant discount to NYMEX WTI primarily because of its low gravity and other quality characteristics as well as its distance from a major refining
market.
Our Michigan properties have favorable natural gas supply/demand characteristics as the state has been importing an increasing percentage of its natural gas. To the extent our production is not hedged, the supply/demand situation has allowed us to sell our natural gas production with little or no discount to industry benchmark prices.
65
During 2010, the average discounts we received for our crude oil production relative to NYMEX WTI benchmark prices per barrel were $0.25 for California-based production, $13.24 for Wyoming-based production, and $16.15 for Florida-based production, including approximately $7.50 in transportation costs. During 2010, the average discount we received for our natural gas production relative to MichCon City-Gate benchmark prices per Mcf was $0.03 for our Michigan-based production. During 2009, the average discounts we received for our crude oil production relative to NYMEX WTI benchmark prices per barrel were $0.53 and $8.08 for our California and Wyoming-based production, respectively, and $18.71 for our Florida-based production, including
approximately $7.50 in transportation costs. During 2009, the average discount we received for our natur al gas production relative to MichCon City-Gate benchmark prices per Mcf was $0.02 for our Michigan-based production.
All derivative instruments are recorded on the balance sheet at fair value. Fair value is generally determined based on the difference between the fixed contract price and the underlying market price at the determination date, and/or confirmed by the counterparty. Changes in the fair value of our commodity derivatives that were not designated as a hedge were recorded in gain (loss) on commodity derivative instruments, net on the consolidated statements of operations, as a loss of $39.7 million for 2010 compared to a loss of $219.1 million for 2009.
Interest Rate Risk
We are subject to interest rate risk associated with loans under our credit facility that bear interest based on floating rates. We currently do not designate any of our interest rate derivatives as hedges for financial accounting purposes. As of December 31, 2010, long-term debt outstanding under our credit facility was $228.0 million and as of February 28, 2011, was $122.0 million. As of December 31, 2010, our LIBOR based debt was $221.0 million and our prime based debt was $7.0 million. In order to mitigate our interest rate exposure, we have entered into various interest rate swaps to fix a portion of floating LIBOR based debt under our credit facility. As of December 31, 2010, our interest rate swaps covered $200 million of our LIBOR
based debt. As of December 31, 2010, if interest rates on the variable interest portion of our LIBOR and prime based debt of $28.0 million increased or decreased by 1%, our annual interest cost would have increased or decreased by approximately $0.3 million.
Changes in Fair Value
The fair value of our outstanding oil and gas commodity derivative instruments at December 31, 2010 was a net asset of approximately $33.5 million. The fair value of our outstanding oil and gas commodity derivative instruments at December 31, 2009 was a net asset of approximately $73.2 million.
As of December 31, 2010, with a $5 per barrel increase or decrease in the price of oil, and a corresponding $1 per Mcf change in the natural gas price, the fair value of our outstanding oil and gas commodity derivative instruments would have decreased or increased our net assets by approximately $90 million.
Price risk sensitivities were calculated by assuming across-the-board increases in price of $5 per barrel for oil and $1 per Mcf for natural gas regardless of term or historical relationships between the contractual price of the instruments and the underlying commodity price. In the event of actual changes in prompt month prices equal to the assumptions, the fair value of our derivative portfolio would typically change by less than the amounts given due to lower volatility in out-month prices.
The fair value of our outstanding interest rate derivative instruments was a net liability of approximately $4.8 million at December 31, 2010 and $11.4 million at December 31, 2009. With a 1% increase in the LIBOR rate, the net liability of our outstanding interest rate derivative instruments at December 31, 2010, would have decreased by approximately $5 million. With a 1% decrease in the LIBOR rate to a minimum rate of zero, our net liability at December 31, 2010 would have increased by approximately $3 million.
Changes in derivative instruments since December 31, 2010
On February 4, 2011, we entered into crude oil fixed price swap contracts for 1,000 Bbl/d for the period from October 1, 2014 to December 31, 2014 at $98.00 per Bbl, 1,000 Bbl/d for the period from January 1, 2015 to June 2015 at $98.80 per Bbl and 1,000 Bbl/d for the period July 1, 2015 to December 31, 2015 at $98.50 per Bbl. On February 28, 2011, we entered into crude oil fixed price swap contracts for 1,000 Bbl/d for the year 2015 at $99.35 per Bbl. On March 2, 2011, we entered into crude oil collar contracts for 1,000 Bbl/d for the years 2014 and 2015 with floor prices of $90.00 per Bbl for each year and ceiling prices of $112.00 per Bbl for 2014 and $113.50 per Bbl for 2015.
66
The information required by this Item 8 is incorporated herein by reference from the consolidated financial statements beginning on page F-1.
None.
Evaluation of Disclosure Controls and Procedures
We maintain disclosure controls and procedures (as defined in Rules 13a-15(e) and 15d-15(e) under the Securities Exchange Act of 1934, as amended (the “Exchange Act”)), that are designed to ensure that information required to be disclosed in the reports that we file or submit under the Exchange Act is recorded, processed, summarized and reported within the time periods specified in the SEC's rules and forms, and that such information is accumulated and communicated to management, including our General Partner’s principal executive officer and principal financial officer, as appropriate, to allow timely decisions regarding required disclosures.
Our management, with the participation of our General Partner’s Chief Executive Officer and Chief Financial Officer, have evaluated the effectiveness of our disclosure controls and procedures as of December 31, 2010. Based upon that evaluation, our General Partner’s Chief Executive Officer and Chief Financial Officer concluded that our disclosure controls and procedures were effective as of December 31, 2010.
Management’s Report on Internal Control Over Financial Reporting
The information required by this Item is incorporated by reference from “Management’s Report on Internal Control Over Financial Reporting” located on page F-2.
Changes in Internal Control Over Financial Reporting
There were no changes in our internal control over financial reporting that occurred during the quarter ended December 31, 2010 that materially affected, or are reasonably likely to materially affect, our internal control over financial reporting.
There was no information required to be disclosed in a report on Form 8-K during the fourth quarter of 2010 that has not previously been reported.
67
PART III
Information concerning our directors, executive officers and corporate governance required by this item is incorporated by reference to the material appearing in our Proxy Statement for the 2011 Annual Meeting of Unitholders (“2011 Proxy Statement”). The 2011 Annual Meeting of Unitholders is to be held on June 23, 2011.
The board of directors of our general partner has established an audit committee and determined which members are our “audit committee financial experts.” Information concerning our audit committee required by this item is incorporated by reference to the material appearing in our 2011 Proxy Statement.
We have adopted a Code of Ethics for Chief Executive Officers and Senior Officers. It is available on our website at http://ir.breitburn.com/documentdisplay.cfm?DocumentID=804.
Directors and Executive Officers of BreitBurn GP, LLC
The following table sets forth certain information with respect to the members of the board of directors and the executive officers of our General Partner. Executive officers and directors will serve until their successors are duly appointed or elected.
|
Name
|
Age
|
Position with BreitBurn GP, LLC
|
||
|
Halbert S. Washburn
|
50
|
Chief Executive Officer
|
||
|
Randall H. Breitenbach
|
50
|
President
|
||
|
Mark L. Pease
|
54
|
Executive Vice President and Chief Operating Officer
|
||
|
James G. Jackson
|
46
|
Executive Vice President and Chief Financial Officer
|
||
|
Gregory C. Brown
|
59
|
Executive Vice President and General Counsel
|
||
|
Chris E. Williamson
|
53
|
Senior Vice President –Western Region
|
||
|
W. Jackson Washburn
|
48
|
Senior Vice President – Business Development
|
||
|
David D. Baker
|
38
|
Vice President – Eastern Division
|
||
|
Bruce D. McFarland
|
54
|
Vice President and Treasurer
|
||
|
Lawrence C. Smith
|
57
|
Vice President and Controller
|
||
|
John R. Butler, Jr.*
|
72
|
Chairman of the Board
|
||
|
Walker C. Friedman*
|
58
|
Director
|
||
|
David B. Kilpatrick*
|
61
|
Director
|
||
|
Gregory J. Moroney*
|
59
|
Director
|
||
|
W. Yandell Rogers, III*
|
48
|
Director
|
||
|
Charles S. Weiss*
|
58
|
Director
|
* Independent Directors
Section 16(a) Beneficial Ownership Reporting Compliance
Section 16(a) of the Securities Exchange Act of 1934, as amended, requires the directors and executive officers of our general partner, and persons who own more than 10% of a registered class of our equity securities (collectively, “Insiders”), to file reports of beneficial ownership on Form 3 and reports of changes in beneficial ownership on Form 4 or Form 5 with the SEC. Based solely on our review of the reporting forms and written representations provided to us from the individuals required to file reports, we believe that each of our executive officers and directors has complied with the applicable reporting requirements for transactions in our securities during the fiscal year ended December 31, 2010, except as
follows: Messrs. Butler, Kilpatrick, Moroney and Weiss each reported one day late their respec tive grants of phantom units on January 29, 2010.
68
Information required by this item is incorporated by reference to the material appearing in our 2011 Proxy Statement.
Information required by this item is incorporated by reference to the material appearing in our 2011 Proxy Statement.
Securities Authorized for Issuance Under Equity Compensation Plans
The following table sets forth certain information with respect to our equity compensation plans as of December 31, 2010.
|
Plan category
|
Number of securities
to be issued upon
exercise of
outstanding options,
warrants and rights
|
Weighted-
average exercise
price of
outstanding
options, warrants
and rights
|
Number of securities
remaining available for
future issuance under equity
compensation plans
(excluding securities
reflected in column (a))
|
|||||||||
|
(a)
|
(b)
|
(c)
|
||||||||||
|
Equity compensation plans approved by security holders
|
- | - | - | |||||||||
|
Equity compensation plans not approved by security holders Partnership LTIP
|
2,576,504 | (1) | N/A | (2) | 2,801,779 | (3) | ||||||
|
Total
|
2,576,504 | N/A | 2,801,779 | |||||||||
(1) Represents the number of units issued under the Partnership First Amended and Restated 2006 Long-Term Incentive Plan (“Partnership LTIP”).
(2) Unit awards under the Partnership LTIP and the BreitBurn Management LTIP vest without payment by recipients.
(3) The Partnership LTIP provides that the board of directors or a committee of the board of our General Partner may award restricted units, performance units, unit appreciation rights or other unit-based awards and unit awards.
Information required by this item is incorporated by reference to the material appearing in our 2011 Proxy Statement.
Information required by this item is incorporated by reference to the material appearing in our 2011 Proxy Statement.
69
PART IV
(a) (1) Financial Statements
See “Index to the Consolidated Financial Statements” set forth on Page F-1.
(2) Financial Statement Schedules
All schedules are omitted because they are not applicable or the required information is presented in the financial statements or notes thereto.
(3) Exhibits
|
NUMBER
|
DOCUMENT
|
|
|
3.1
|
Certificate of Limited Partnership of BreitBurn Energy Partners L.P. (incorporated herein by reference to Exhibit 3.1 to Amendment No. 1 to Form S-1 (File No. 333-134049) filed on July 13, 2006).
|
|
|
3.2
|
First Amended and Restated Agreement of Limited Partnership of BreitBurn Energy Partners L.P. (incorporated herein by reference to Exhibit 3.1 to the Current Report on Form 8-K (File No. 001-33055) filed on October 16, 2006).
|
|
|
3.3
|
Amendment No. 1 to the First Amended and Restated Agreement of Limited Partnership of BreitBurn Energy Partners L.P. (incorporated herein by reference to Exhibit 3.1 to the Current Report on Form 8-K (File No. 001-33055) filed on June 23, 2008).
|
|
|
3.4
|
Amendment No. 2 to the First Amended and Restated Agreement of Limited Partnership of BreitBurn Energy Partners L.P. (incorporated herein by reference to Exhibit 3.1 to the Current Report on Form 8-K (File No. 001-33055) filed April 9, 2009).
|
|
|
3.5
|
Amendment No. 3 to the First Amended and Restated Agreement of Limited Partnership of BreitBurn Energy Partners L.P. (incorporated herein by reference to Exhibit 3.1 to the Current Report on Form 8-K (File No. 001-33055) filed September 1, 2009).
|
|
|
3.6
|
Amendment No.4 to the First Amended and Restated Agreement of Limited Partnership of BreitBurn Energy Partners L.P. (incorporated herein by reference to Exhibit 3.1 to the Current Report on Form 8-K (File No. 001-33055) filed on April 9, 2010).
|
|
|
3.7
|
Fourth Amended and Restated Limited Liability Company Agreement of BreitBurn GP, LLC dated as of April 5, 2010 (incorporated herein by reference to Exhibit 3.2 to the Current Report on Form 8-K (File No. 001-33055) filed on April 9, 2011).
|
|
|
3.8
|
Amendment No. 1 to the Fourth Amended and Restated Limited Liability Company Agreement of BreitBurn GP, LLC dated as of December 30, 2010 (incorporated herein by reference to Exhibit 3.1 to the Current Report on Form 8-K (File No. 001-33055) filed on January 6, 2011).
|
|
|
4.1
|
Registration Rights Agreement, dated as of November 1, 2007, by and among BreitBurn Energy Partners L.P. and Quicksilver Resources Inc. (incorporated herein by reference to Exhibit 4.2 to the Current Report on Form 8-K (File No. 001-33055) filed on November 6, 2007).
|
|
|
4.2
|
First Amendment to the Registration Rights Agreement, dated as of April 5, 2010, by and among BreitBurn Energy Partners L.P. and Quicksilver Resources Inc. (incorporated herein by reference to Exhibit 4.1 to the Current Report on Form 8-K (File No. 001-33055) filed on April 9, 2010).
|
|
|
4.3
|
Unit Purchase Rights Agreement, dated as of December 22, 2008, between BreitBurn Energy Partners L.P. and American Stock Transfer & Trust Company LLC as Rights Agreement (incorporated herein by reference to Exhibit 4.1 to the Current Report on Form 8-K (File No. 001-33055) filed on December 23, 2008).
|
|
|
4.4
|
Indenture, dated as of October 6, 2010, by and among BreitBurn Energy Partners L.P., BreitBurn Finance Corporation, the Guarantors named therein and U.S. Bank National Association (incorporated herein by reference to Exhibit 4.1 to the Current Report on Form 8-K (File No. 001-33055) filed on October 7, 2010).
|
70
|
NUMBER
|
DOCUMENT
|
|
|
4.5
|
Registration Rights Agreement, dated as of October 6, 2010, by and among BreitBurn Energy Partners L.P., BreitBurn Finance Corporation, the Guarantors named therein and the Initial Purchasers named therein (incorporated herein by reference to Exhibit 4.2 to the Current Report on Form 8-K (File No. 001-33055) filed on October 7, 2010).
|
|
|
10.1
|
Amended and Restated Agreement of Limited Partnership of BreitBurn Energy Partners I, L.P. dated May 5, 2003 (incorporated herein by reference to Exhibit 10.2 to the Current Report on Form 8-K (File No. 001-33055) filed on May 29, 2007).
|
|
|
10.2
|
Contribution, Conveyance and Assumption Agreement, dated as of October 10, 2006, by and among Pro GP Corp., Pro LP Corp., BreitBurn Energy Corporation, BreitBurn Energy Company L.P., BreitBurn Management Company, LLC, BreitBurn GP, LLC, BreitBurn Energy Partners L.P., BreitBurn Operating GP, LLC and BreitBurn Operating L.P. (incorporated herein by reference to Exhibit 10.2 to the Current Report on Form 8-K (File No. 001-33055) filed on October 16, 2006).
|
|
|
10.3
|
Administrative Services Agreement, dated as of October 10, 2006, by and among BreitBurn GP, LLC, BreitBurn Energy Partners L.P., BreitBurn Operating L.P. and BreitBurn Management Company, LLC (incorporated herein by reference to Exhibit 10.4 to the Current Report on Form 8-K (File No. 001-33055) filed on October16, 2006).
|
|
|
10.4†
|
BreitBurn Energy Company L.P. Unit Appreciation Plan for Officers and Key Individuals (incorporated herein by reference to Exhibit 10.6 to Amendment No. 3 to Form S-1 (File No. 333-13409) for BreitBurn Energy Partners L.P. filed on September 19, 2006).
|
|
|
10.5†
|
Amendment No. 1 to the BreitBurn Energy Company L.P. Unit Appreciation Plan for Officers and Key Individuals (incorporated herein by reference to Exhibit 10.14 to Amendment No. 5 to Form S-1 (File No. 333-13409) for BreitBurn Energy Partners L.P. filed on October 2, 2006).
|
|
|
10.6
|
Contribution Agreement, dated as of September 11, 2007, between Quicksilver Resources Inc. and BreitBurn Operating L.P. (incorporated herein by reference to Exhibit 10.4 to the Current Report on Form 8-K (File No. 001-33055) filed on November 6, 2007).
|
|
|
10.7
|
Amendment to Contribution Agreement, dated effective as of November 1, 2007, between Quicksilver Resources Inc. and BreitBurn Operating L.P. (incorporated herein by reference to Exhibit 10.5 to the Current Report on Form 8-K (File No. 001-33055) filed on November 6, 2007).
|
|
|
10.8†
|
Form of BreitBurn Energy Partners L.P. 2006 Long-Term Incentive Plan Restricted Phantom Unit Agreement (Executive Form) (incorporated herein by reference to Exhibit 10.1 to the Current Report on Form 8-K (File No. 001-33055) filed on March 11, 2008).
|
|
|
10.9†
|
Form of BreitBurn Energy Partners L.P. 2006 Long-Term Incentive Plan Restricted Phantom Unit Agreement (Non-Executive Form) (incorporated herein by reference to Exhibit 10.2 to the Current Report on Form 8-K (File No. 001-33055) filed on March 11, 2008).
|
|
|
10.10†
|
Form of BreitBurn Energy Partners L.P. 2006 Long-Term Incentive Plan Restricted Phantom Units Directors’ Award Agreement (incorporated herein by reference to Exhibit 10.35 to the Annual Report on Form 10-K for the year ended December 31, 2007 (File No. 001-33055) and filed on March 17, 2008).
|
|
|
10.11
|
Amendment No. 1 to the Operations and Proceeds Agreement, relating to the Dominguez Field and dated October 10, 2006 entered into on June 17, 2008 by and between BreitBurn Energy Company L.P. and BreitBurn Operating L.P. (incorporated herein by reference to Exhibit 10.6 to the Current Report on Form 8-K (File No. 001-33055) filed on June 23, 2008).
|
|
|
10.12
|
Amendment No. 1 to the Surface Operating Agreement dated October 10, 2006 entered into on June 17, 2008 by and between BreitBurn Energy Company L.P. and its predecessor BreitBurn Energy Corporation and BreitBurn Operating L.P. (incorporated herein by reference to Exhibit 10.7 to the Current Report on Form 8-K (File No. 001-33055) filed on June 23, 2008).
|
|
|
10.13†
|
Form of BreitBurn Energy Partners L.P. 2006 Long-Term Incentive Plan Convertible Phantom Unit Agreement (Employment Agreement Form) (incorporated herein by reference to Exhibit 10.9 to the Quarterly Report on Form 10-Q for the period ended June 30, 2008 (File No. 001-33055) and filed on August 11, 2008).
|
71
|
NUMBER
|
DOCUMENT
|
|
|
10.14†
|
Form of BreitBurn Energy Partners L.P. 2006 Long-Term Incentive Plan Convertible Phantom Unit Agreement (Non-Employment Agreement Form) (incorporated herein by reference to Exhibit 10.10 to the Quarterly Report on Form 10-Q for the period ended June 30, 2008 and (File No. 001-33055) filed on August 11, 2008).
|
|
|
10.15
|
Second Amended and Restated Administrative Services Agreement dated August 26, 2008 by and between BreitBurn Energy Company L.P. and BreitBurn Management Company, LLC (incorporated herein by reference to Exhibit 10.1 to the Current Report on Form 8-K (File No. 001-33055) filed on September 02, 2008).
|
|
|
10.16
|
Omnibus Agreement, dated August 26, 2008, by and among BreitBurn Energy Holdings LLC, BEC (GP) LLC, BreitBurn Energy Company L.P, BreitBurn GP, LLC, BreitBurn Management Company, LLC and BreitBurn Energy Partners L.P. (incorporated herein by reference to Exhibit 10.2 to the Current Report on Form 8-K (File No. 001-33055) filed on September 02, 2008).
|
|
|
10.17
|
Indemnity Agreement between BreitBurn Energy Partners L.P., BreitBurn GP, LLC and Halbert S. Washburn, together with a schedule identifying other substantially identical agreements between BreitBurn Energy Partners L.P., BreitBurn GP, LLC and each of its executive officers and non-employee directors identified on the schedule (incorporated herein by reference to Exhibit 10.1 to the Current Report on form 8-K (File No. 001-33055) filed on November 4, 2009).
|
|
|
10.18†
|
First Amendment to the BreitBurn Energy Partners L.P. 2006 Long-Term Incentive Plan Convertible Phantom Unit Agreements (incorporated herein by reference to Exhibit 10.2 to the Current Report on form 8-K (File No. 001-33055) filed on November 4, 2009).
|
|
|
10.19†
|
First Amended and Restated BreitBurn Energy Partners L.P. 2006 Long-Term Incentive Plan effective as of October 29, 2009 (incorporated herein by reference to Exhibit 10.3 to the Quarterly Report on Form 10-Q for the period ended September 30, 2009 ((File No. 001-33055) filed on November 6, 2009).
|
|
|
10.20
|
Settlement Agreement as of April 5, 2010 by and among Quicksilver Resources Inc., BreitBurn Energy Partners L.P., BreitBurn GP LLC, Provident Energy Trust, Randall H. Breitenbach and Halbert S. Washburn (incorporated herein by reference to Exhibit 10.1 to the Current Report on Form 8-K filed on April 9, 2010).
|
|
|
Form of BreitBurn Energy Partners L.P. 2006 Long-Term Incentive Plan Restricted Phantom Unit Agreement (Executive Form).
|
||
|
Form of BreitBurn Energy Partners L.P. 2006 Long-Term Incentive Plan Restricted Phantom Unit Agreement (Non-Executive Form).
|
||
|
Form of BreitBurn Energy Partners L.P. 2006 Long-Term Incentive Plan Restricted Phantom Unit Agreement (Director Form).
|
||
|
Form of Second Amendment to the BreitBurn Energy Partners L.P. 2006 Long-Term Incentive Plan Convertible Phantom Unit Agreements.
|
||
|
Form of Third Amendment to the BreitBurn Energy Partners L.P. 2006 Long-Term Incentive Plan Convertible Phantom Unit Agreements.
|
||
|
10.26
|
Third Amended and Restated Employment Agreement dated December 30, 2010 among BreitBurn Management Company, LLC, BreitBurn GP, LLC, BreitBurn Energy Partners L.P. and Halbert S. Washburn (incorporated herein by reference to Exhibit 10.1 to the Current Report on Form 8-K (File No. 001-33055) filed on January 6, 2011).
|
|
|
10.27
|
Third Amended and Restated Employment Agreement dated December 30, 2010 among BreitBurn Management Company, LLC, BreitBurn GP, LLC, BreitBurn Energy Partners L.P. and Randall H. Breitenbach (incorporated herein by reference to Exhibit 10.2 to the Current Report on Form 8-K (File No. 001-33055) filed on January 6, 2011).
|
|
|
10.28
|
Amended and Restated Employment Agreement dated December 30, 2010 among BreitBurn Management Company, LLC, BreitBurn GP, LLC, BreitBurn Energy Partners L.P. and Mark L. Pease (incorporated herein by reference to Exhibit 10.3 to the Current Report on Form 8-K (File No. 001-33055) filed on January 6, 2011).
|
72
|
NUMBER
|
DOCUMENT
|
|
|
10.29
|
Second Amended and Restated Employment Agreement dated December 30, 2010 among BreitBurn Management Company, LLC, BreitBurn GP, LLC, BreitBurn Energy Partners L.P. and James G. Jackson (incorporated herein by reference to Exhibit 10.4 to the Current Report on Form 8-K (File No. 001-33055) filed on January 6, 2011).
|
|
|
10.30
|
Amended and Restated Employment Agreement dated December 30, 2010 among BreitBurn Management Company, LLC, BreitBurn GP, LLC, BreitBurn Energy Partners L.P. and Gregory C. Brown (incorporated herein by reference to Exhibit 10.5 to the Current Report on Form 8-K (File No. 001-33055) filed on January 6, 2011).
|
|
|
10.31
|
Second Amended and Restated Credit Agreement, dated May 7, 2010, by and among BreitBurn Operating L.P, as borrower, BreitBurn Energy Partners L.P., as parent guarantor, and Wells Fargo Bank, N.A., as administrative agent (incorporated herein by reference to Exhibit 10.1 to the Quarterly Report on Form 10-Q for the period ended March 31, 2010 (File No. 001-33055) filed on May 10, 2010).
|
|
|
10.32
|
First Amendment dated September 17, 2010 to the Second Amended and Restated Credit Agreement dated May 7, 2010, by and among BreitBurn Operating L.P, as borrower, BreitBurn Energy Partners L.P., as parent guarantor, and Wells Fargo Bank, N.A., as administrative agent (incorporated herein by reference to Exhibit 10.1 to the Current Report on Form 8-K (File No. 001-33055) filed on September 23, 2010).
|
|
|
14.1
|
BreitBurn Energy Partners L.P. and BreitBurn GP, LLC Code of Ethics for Chief Executive Officers and Senior Officers (as amended and restated on February 28, 2007) (incorporated herein by reference to Exhibit 14.1 to the Current Report on Form 8-K filed on March 5, 2007).
|
|
|
List of subsidiaries of BreitBurn Energy Partners L.P.
|
||
|
Consent of PricewaterhouseCoopers LLP.
|
||
|
Consent of Netherland, Sewell & Associates, Inc.
|
||
|
Consent of Schlumberger Data and Consulting Services.
|
||
|
Certification of Registrant’s Chief Executive Officer pursuant to Rule 13a-14(a) of the Securities Exchange Act of 1934 and Section 302 of the Sarbanes-Oxley Act of 2002.
|
||
|
Certification of Registrant’s Chief Financial Officer pursuant to Rule 13a-14(a) of the Securities Exchange Act of 1934 and Section 302 of the Sarbanes-Oxley Act of 2002.
|
||
|
Certification of Registrant’s Chief Executive Officer pursuant to Rule 13a-14(b) of the Securities Exchange Act of 1934 and 18 U.S.C. Section 1350, as created by Section 906 of the Sarbanes-Oxley Act of 2002.
|
||
|
Certification of Registrant’s Chief Financial Officer pursuant to Rule 13a-14(b) of the Securities Exchange Act of 1934 and 18 U.S.C. Section 1350, as created by Section 906 of the Sarbanes-Oxley Act of 2002.
|
||
|
Report of Netherland, Sewell & Associates, Inc.
|
||
|
Report of Schlumberger Technology Corporation.
|
|
*
|
Filed herewith.
|
|
**
|
Furnished herewith.
|
|
†
|
Management contract or compensatory plan or arrangement.
|
73
Pursuant to the requirements of Section 13 or 15(d) of the Securities Exchange Act of 1934, the registrant has duly caused this report to be signed on its behalf by the undersigned, thereunto duly authorized.
|
BREITBURN ENERGY PARTNERS L.P.
|
||
|
By:
|
BREITBURN GP, LLC,
|
|
|
its General Partner
|
||
|
Dated: March 9, 2011
|
By:
|
/s/ Halbert S. Washburn
|
|
Halbert S. Washburn
|
||
|
Chief Executive Officer
|
||
Pursuant to the requirements of the Securities Exchange Act of 1934, this report has been signed below by the following persons on behalf of the registrant and in the capacities and on the dates indicated.
|
Name
|
Title
|
Date
|
||
|
/s/ Halbert S. Washburn
|
Chief Executive Officer
|
March 9, 2011
|
||
|
Halbert S. Washburn
|
BreitBurn GP, LLC
|
|||
|
(Principal Executive Officer)
|
||||
|
/s/ James G. Jackson
|
Chief Financial Officer of
|
March 9, 2011
|
||
|
James G. Jackson
|
BreitBurn GP, LLC
|
|||
|
(Principal Financial Officer)
|
||||
|
/s/ Lawrence C. Smith
|
Vice President and Controller of
|
March 9, 2011
|
||
|
Lawrence C. Smith
|
BreitBurn GP, LLC
|
|||
|
(Principal Accounting Officer)
|
||||
|
/s/ John R. Butler, Jr.
|
Chairman of the Board of
|
March 9, 2011
|
||
|
John R. Butler, Jr.
|
BreitBurn GP, LLC
|
|||
|
/s/ Walker C. Friedman
|
Director of
|
March 9, 2011
|
||
|
Walker C. Friedman
|
BreitBurn GP, LLC
|
74
|
Name
|
Title
|
Date
|
||
|
/s/ David B. Kilpatrick
|
Director of
|
March 9, 2011
|
||
|
David B. Kilpatrick
|
BreitBurn GP, LLC
|
|||
|
/s/ Gregory J. Moroney
|
Director of
|
March 9, 2011
|
||
|
Gregory J. Moroney
|
BreitBurn GP, LLC
|
|||
|
/s/ W.Yandell Rogers, III
|
Director of
|
March 9, 2011
|
||
|
W. Yandell Rogers, III
|
BreitBurn GP, LLC
|
|||
|
/s/ Charles S. Weiss
|
Director of
|
March 9, 2011
|
||
|
Charles S. Weiss
|
BreitBurn GP, LLC
|
75
BREITBURN ENERGY PARTNERS L.P. AND SUBSIDIARIES
INDEX TO THE CONSOLIDATED FINANCIAL STATEMENTS
|
Management's Report on Internal Control Over Financial Reporting
|
F-2
|
|
Report of Independent Registered Public Accounting Firm
|
F-3
|
|
Consolidated Balance Sheets
|
F-4
|
|
Consolidated Statements of Operations
|
F-5
|
|
Consolidated Statements of Cash Flows
|
F-6
|
|
Consolidated Statements of Partners’ Equity
|
F-7
|
|
Notes to Consolidated Financial Statements
|
F-8
|
|
Supplemental Information
|
F-46
|
|
Exhibit Index
|
F-51
|
F-1
The management of BreitBurn Energy Partners, L.P. (the “Partnership”) is responsible for establishing and maintaining adequate internal control over financial reporting, as defined in Rules 13a-15(f) and 15d-15(f) of the Securities Exchange Act of 1934, as amended. The term “internal control over financial reporting” is defined as a process designed by, or under the supervision of, the Partnership's principal executive and principal financial officers, or persons performing similar functions, and effected by the Partnership’s board of directors, management and other personnel, to provide reasonable assurance regarding the reliability of financial reporting and the preparation of financial statements for
external purposes in accordance with generally accepted accounting principles and includes those policies and procedures that: (i) pertain to the maintenance of records that in reasonable detail accurately and fairly reflect the transactions and dispositions of the assets of the Partnership; (ii) provide reasonable assurance that transactions are recorded as necessary to permit preparation of financial statements in accordance with generally accepted accounting principles, and that receipts and expenditures of the Partnership are being made only in accordance with authorizations of management and directors of the Partnership; and (iii) provide reasonable assurance regarding prevention or timely detection of unauthorized acquisition, use or disposition of the Partnership's assets that could have a material effect on the financial statements.
Internal control over financial reporting, no matter how well designed, has inherent limitations. Because of its inherent limitations, internal control over financial reporting may not prevent or detect misstatements.
As required by Rule 13a-15(c) under the Exchange Act, the Partnership’s management, with the participation of the general partner’s principal executive officers and principal financial officer, assessed the effectiveness of the Partnership’s internal control over financial reporting as of December 31, 2010. In making this assessment, the Partnership’s management used the criteria set forth by the Committee of Sponsoring Organizations of the Treadway Commission (COSO) in Internal Control Integrated Framework. Based on this assessment, the Partnership’s management, including the general partner’s principal executive officers and principal financial
officer, concluded that, as of December 31, 2010, the Partnership’s internal control over finan cial reporting was effective based on those criteria.
PricewaterhouseCoopers LLP, the independent registered public accounting firm who audited the consolidated financial statements included in this Annual Report on Form 10-K, has issued a report on the Partnership’s internal control over financial reporting as of December 31, 2010, which appears on page F-3.
|
/s/ Halbert S. Washburn
|
/s/ James G. Jackson
|
|
|
Halbert S. Washburn
|
James G. Jackson
|
|
|
Chief Executive Officer of BreitBurn GP, LLC
|
Chief Financial Officer of BreitBurn GP, LLC
|
F-2
Report of Independent Registered Public Accounting Firm
In our opinion, the accompanying consolidated balance sheets and the related consolidated statements of operations, partners' equity and cash flows present fairly, in all material respects, the financial position of BreitBurn Energy Partners L.P. and its subsidiaries ("the Partnership") at December 31, 2010 and 2009, and the results of their operations and their cash flows for each of the three years in the period ended December 31, 2010, in conformity with accounting principles generally accepted in the United States of America. Also in our opinion, the Partnership maintained, in all material respects, effective internal control over financial reporting as of December 31, 2010, based on criteria established in Internal Control - Integrated Framework issued by the Committee of Spon soring Organizations of the Treadway Commission (COSO). The Partnership's management is responsible for these financial statements, for maintaining effective internal control over financial reporting and for its assessment of the effectiveness of internal control over financial reporting, included in the accompanying Management's Report to Unitholders on Internal Control Over Financial Reporting. Our responsibility is to express opinions on these financial statements and on the Partnership's internal control over financial reporting based on our integrated audits. We conducted our audits in accordance with the standards of the Public Company Accounting Oversight Board (United States). Those standards require that we plan and perform the audits to obtain reasonable assurance about whether the financial statements are free of material misstatement and whether effective internal
control over financial reporting was maintained in all material respects. Our audits of the financial statements included examining, o n a test basis, evidence supporting the amounts and disclosures in the financial statements, assessing the accounting principles used and significant estimates made by management, and evaluating the overall financial statement presentation. Our audit of internal control over financial reporting included obtaining an understanding of internal control over financial reporting, assessing the risk that a material weakness exists, and testing and evaluating the design and operating effectiveness of internal control based on the assessed risk. Our audits also included performing such other procedures as we considered necessary in the circumstances. We believe that our audits provide a reasonable basis for our opinions.
A partnership’s internal control over financial reporting is a process designed to provide reasonable assurance regarding the reliability of financial reporting and the preparation of financial statements for external purposes in accordance with generally accepted accounting principles. A partnership's internal control over financial reporting includes those policies and procedures that (i) pertain to the maintenance of records that, in reasonable detail, accurately and fairly reflect the transactions and dispositions of the assets of the partnership; (ii) provide reasonable assurance that transactions are recorded as necessary to permit preparation of financial statements in accordance with generally accepted accounting principles,
and that receipts and expenditures of the partnership are being made only in accordance with authori zations of management and directors of the partnership; and (iii) provide reasonable assurance regarding prevention or timely detection of unauthorized acquisition, use, or disposition of the partnership’s assets that could have a material effect on the financial statements.
Because of its inherent limitations, internal control over financial reporting may not prevent or detect misstatements. Also, projections of any evaluation of effectiveness to future periods are subject to the risk that controls may become inadequate because of changes in conditions, or that the degree of compliance with the policies or procedures may deteriorate.
| /s/ PricewaterhouseCoopers LLP |
|
PricewaterhouseCoopers LLP
|
|
Los Angeles, California
|
|
March 9, 2011
|
F-3
BreitBurn Energy Partners L.P. and Subsidiaries
Consolidated Balance Sheets
|
December 31,
|
||||||||
|
Thousands
|
2010
|
2009
|
||||||
|
ASSETS
|
||||||||
|
Current assets:
|
||||||||
|
Cash
|
$ | 3,630 | $ | 5,766 | ||||
|
Accounts and other receivables, net (note 2)
|
53,520 | 65,209 | ||||||
|
Derivative instruments (note 5)
|
54,752 | 57,133 | ||||||
|
Related party receivables (note 6)
|
4,345 | 2,127 | ||||||
|
Inventory (note 7)
|
7,321 | 5,823 | ||||||
|
Prepaid expenses
|
6,449 | 5,888 | ||||||
|
Intangibles (note 8)
|
- | 495 | ||||||
|
Total current assets
|
130,017 | 142,441 | ||||||
|
Equity investments (note 9)
|
7,700 | 8,150 | ||||||
|
Property, plant and equipment
|
||||||||
|
Oil and gas properties
|
2,133,099 | 2,058,968 | ||||||
|
Other assets
|
10,832 | 7,717 | ||||||
| 2,143,931 | 2,066,685 | |||||||
|
Accumulated depletion and depreciation (note 10)
|
(421,636 | ) | (325,596 | ) | ||||
|
Net property, plant and equipment
|
1,722,295 | 1,741,089 | ||||||
|
Other long-term assets
|
||||||||
|
Derivative instruments (note 5)
|
50,652 | 74,759 | ||||||
|
Other long-term assets
|
19,503 | 4,590 | ||||||
|
Total assets
|
$ | 1,930,167 | $ | 1,971,029 | ||||
|
LIABILITIES AND EQUITY
|
||||||||
|
Current liabilities:
|
||||||||
|
Accounts payable
|
$ | 26,808 | $ | 21,314 | ||||
|
Derivative instruments (note 5)
|
37,071 | 20,057 | ||||||
|
Related party payables (note 6)
|
- | 13,000 | ||||||
|
Revenue and royalties payable
|
16,427 | 18,224 | ||||||
|
Salaries and wages payable
|
12,594 | 10,244 | ||||||
|
Accrued liabilities
|
8,417 | 9,051 | ||||||
|
Total current liabilities
|
101,317 | 91,890 | ||||||
|
Credit facility (note 11)
|
228,000 | 559,000 | ||||||
|
Senior notes, net (note 11)
|
300,116 | - | ||||||
|
Deferred income taxes (note 13)
|
2,089 | 2,492 | ||||||
|
Asset retirement obligation (note 14)
|
47,429 | 36,635 | ||||||
|
Derivative instruments (note 5)
|
39,722 | 50,109 | ||||||
|
Other long-term liabilities
|
2,237 | 2,102 | ||||||
|
Total liabilities
|
720,910 | 742,228 | ||||||
|
Equity:
|
||||||||
|
Partners' equity (note 16)
|
1,208,803 | 1,228,373 | ||||||
|
Noncontrolling interest (note 17)
|
454 | 428 | ||||||
|
Total equity
|
1,209,257 | 1,228,801 | ||||||
|
Total liabilities and equity
|
$ | 1,930,167 | $ | 1,971,029 | ||||
|
Limited partner units issued and outstanding
|
53,957 | 52,784 | ||||||
The accompanying notes are an integral part of these consolidated financial statements.
F-4
BreitBurn Energy Partners L.P. and Subsidiaries
Consolidated Statements of Operations
|
Year Ended December 31,
|
||||||||||||
|
Thousands of dollars, except per unit amounts
|
2010
|
2009
|
2008
|
|||||||||
|
Revenues and other income items:
|
||||||||||||
|
Oil, natural gas and natural gas liquid sales
|
$ | 317,738 | $ | 254,917 | $ | 467,381 | ||||||
|
Gain (loss) on commodity derivative instruments, net (note 5)
|
35,112 | (51,437 | ) | 332,102 | ||||||||
|
Other revenue, net (note 9)
|
2,498 | 1,382 | 2,920 | |||||||||
|
Total revenues and other income items
|
355,348 | 204,862 | 802,403 | |||||||||
|
Operating costs and expenses:
|
||||||||||||
|
Operating costs
|
142,525 | 138,498 | 162,005 | |||||||||
|
Depletion, depreciation and amortization (note 10)
|
102,758 | 106,843 | 179,933 | |||||||||
|
General and administrative expenses
|
44,907 | 36,367 | 30,611 | |||||||||
|
Loss on sale of assets
|
14 | 5,965 | - | |||||||||
|
Unreimbursed litigation costs
|
1,401 | - | 500 | |||||||||
|
Total operating costs and expenses
|
291,605 | 287,673 | 373,049 | |||||||||
|
Operating income (loss)
|
63,743 | (82,811 | ) | 429,354 | ||||||||
|
Interest expense, net of capitalized interest (note 11)
|
24,552 | 18,827 | 29,147 | |||||||||
|
Loss on interest rate swaps (note 5)
|
4,490 | 7,246 | 20,035 | |||||||||
|
Other income, net
|
(8 | ) | (99 | ) | (191 | ) | ||||||
|
Income (loss) before taxes
|
34,709 | (108,785 | ) | 380,363 | ||||||||
|
Income tax expense (benefit) (note 13)
|
(204 | ) | (1,528 | ) | 1,939 | |||||||
|
Net income (loss)
|
34,913 | (107,257 | ) | 378,424 | ||||||||
|
Less: Net income attributable to noncontrolling interest
|
(162 | ) | (33 | ) | (188 | ) | ||||||
|
Net income (loss) attributable to the partnership
|
34,751 | (107,290 | ) | 378,236 | ||||||||
|
General Partner's interest in net loss
|
- | - | (2,019 | ) | ||||||||
|
Net income (loss) attributable to limited partners
|
$ | 34,751 | $ | (107,290 | ) | $ | 380,255 | |||||
|
Basic net income (loss) per unit (note 16)
|
$ | 0.61 | $ | (2.03 | ) | $ | 6.29 | |||||
|
Diluted net income (loss) per unit (note 16)
|
$ | 0.61 | $ | (2.03 | ) | $ | 6.28 | |||||
The accompanying notes are an integral part of these consolidated financial statements.
F-5
Consolidated Statements of Cash Flows
|
Year Ended December 31,
|
||||||||||||
|
Thousands of dollars
|
2010
|
2009
|
2008
|
|||||||||
|
Cash flows from operating activities
|
||||||||||||
|
Net income (loss)
|
$ | 34,913 | $ | (107,257 | ) | $ | 378,424 | |||||
|
Adjustments to reconcile net income (loss) to cash flows from operating activities:
|
||||||||||||
|
Depletion, depreciation and amortization
|
102,758 | 106,843 | 179,933 | |||||||||
|
Unit-based compensation expense
|
20,422 | 12,661 | 6,907 | |||||||||
|
Unrealized (gain) loss on derivative instruments
|
33,116 | 213,251 | (370,734 | ) | ||||||||
|
Income from equity affiliates, net
|
450 | 1,302 | 1,198 | |||||||||
|
Deferred income taxes
|
(403 | ) | (1,790 | ) | 1,207 | |||||||
|
Amortization of intangibles
|
495 | 2,771 | 3,131 | |||||||||
|
Loss on sale of assets
|
14 | 5,965 | - | |||||||||
|
Other
|
3,528 | 3,294 | 2,643 | |||||||||
|
Changes in net assets and liabilities:
|
||||||||||||
|
Accounts receivable and other assets
|
11,552 | (6,313 | ) | 258 | ||||||||
|
Inventory
|
(1,498 | ) | (4,573 | ) | 4,454 | |||||||
|
Net change in related party receivables and payables
|
(15,218 | ) | 2,957 | 32,688 | ||||||||
|
Accounts payable and other liabilities
|
(8,107 | ) | (4,753 | ) | (13,413 | ) | ||||||
|
Net cash provided by operating activities
|
182,022 | 224,358 | 226,696 | |||||||||
|
Cash flows from investing activities
|
||||||||||||
|
Capital expenditures
|
(66,947 | ) | (29,513 | ) | (131,082 | ) | ||||||
|
Proceeds from sale of assets, net
|
337 | 23,284 | - | |||||||||
|
Property acquisitions
|
(1,676 | ) | - | (9,957 | ) | |||||||
|
Net cash used in investing activities
|
(68,286 | ) | (6,229 | ) | (141,039 | ) | ||||||
|
Cash flows from financing activities
|
||||||||||||
|
Purchase of common units
|
- | - | (336,216 | ) | ||||||||
|
Distributions (a)
|
(65,197 | ) | (28,038 | ) | (121,349 | ) | ||||||
|
Proceeds from the issuance of long-term debt
|
1,047,992 | 249,975 | 803,002 | |||||||||
|
Repayments of long-term debt
|
(1,079,000 | ) | (426,975 | ) | (437,402 | ) | ||||||
|
Book overdraft
|
1,025 | (9,871 | ) | 7,951 | ||||||||
|
Long-term debt issuance costs
|
(20,692 | ) | - | (5,026 | ) | |||||||
|
Net cash used in financing activities
|
(115,872 | ) | (214,909 | ) | (89,040 | ) | ||||||
|
Increase (decrease) in cash
|
(2,136 | ) | 3,220 | (3,383 | ) | |||||||
|
Cash beginning of period
|
5,766 | 2,546 | 5,929 | |||||||||
|
Cash end of period
|
$ | 3,630 | $ | 5,766 | $ | 2,546 | ||||||
(a) 2010, 2009 and 2008 include distributions on equivalent units of $4.0 million, $0.7 million and $2.3 million, respectively.
The accompanying notes are an integral part of these consolidated financial statements.
F-6
Consolidated Statements of Partners' Equity
|
Thousands
|
Common Units
|
Limited
Partners
|
General
Partner
|
Total
|
||||||||||||
|
Balance, December 31, 2007
|
67,021 | $ | 1,423,418 | $ | 1,390 | $ | 1,424,808 | |||||||||
|
Redemption of common units from predecessors (a)
|
(14,405 | ) | (336,216 | ) | - | (336,216 | ) | |||||||||
|
Distributions
|
- | (118,580 | ) | (427 | ) | (119,007 | ) | |||||||||
|
Distributions paid on unissued units under incentive plans
|
- | (2,335 | ) | (7 | ) | (2,342 | ) | |||||||||
|
Unit-based compensation
|
- | 7,383 | - | 7,383 | ||||||||||||
|
Net income (loss)
|
- | 380,255 | (2,019 | ) | 378,236 | |||||||||||
|
Contribution of general partner interest to the Partnership (b)
|
- | (1,063 | ) | 1,063 | - | |||||||||||
|
BreitBurn Management purchase (c)
|
20 | - | - | - | ||||||||||||
|
Other
|
- | 30 | - | 30 | ||||||||||||
|
Balance, December 31, 2008
|
52,636 | $ | 1,352,892 | $ | - | $ | 1,352,892 | |||||||||
|
Distributions
|
- | (27,371 | ) | - | (27,371 | ) | ||||||||||
|
Distributions paid on unissued units under incentive plans
|
- | (667 | ) | - | (667 | ) | ||||||||||
|
Units issued under incentive plans
|
148 | 7,488 | 7,488 | |||||||||||||
|
Unit-based compensation
|
3,322 | - | 3,322 | |||||||||||||
|
Net loss attributable to the partnership
|
- | (107,290 | ) | - | (107,290 | ) | ||||||||||
|
Other
|
- | (1 | ) | - | (1 | ) | ||||||||||
|
Balance, December 31, 2009
|
52,784 | $ | 1,228,373 | $ | - | $ | 1,228,373 | |||||||||
|
Distributions
|
- | (61,161 | ) | - | (61,161 | ) | ||||||||||
|
Distributions paid on unissued units under incentive plans
|
- | (4,020 | ) | - | (4,020 | ) | ||||||||||
|
Units issued under incentive plans
|
1,173 | 7,677 | - | 7,677 | ||||||||||||
|
Unit-based compensation
|
- | 3,183 | - | 3,183 | ||||||||||||
|
Net income attributable to the partnership
|
- | 34,751 | - | 34,751 | ||||||||||||
|
Balance, December 31, 2010
|
53,957 | $ | 1,208,803 | $ | - | $ | 1,208,803 | |||||||||
(a) Reflects the purchase of Common Units from subsidiaries of Provident.
(b) General partner interests were purchased as of June 17, 2008.
(c) Reflects issuance of Common Units to Co-CEOs in exchange for their interest in BreitBurn Management.
The accompanying notes are an integral part of these consolidated financial statements.
F-7
Notes to Consolidated Financial Statements
Note 1. Organization
We are a Delaware limited partnership formed on March 23, 2006. In connection with our initial public offering in October 2006, BreitBurn Energy Company L.P. (“BEC”), our Predecessor, contributed to us certain properties, which included fields in the Los Angeles Basin in California and the Wind River and Big Horn Basins in central Wyoming. In 2007, we acquired certain interests in oil leases and related assets located in Florida for approximately $110 million, assets located in California for approximately $93 million and properties located in Michigan, Indiana and Kentucky from Quicksilver Resources Inc. (“Quicksilver”) for approximately $1.46 billion (the “Quicksilver Acquisition”).
Our general partner is BreitBurn GP, a Delaware limited liability company, also formed on March 23, 2006. The board of directors of our General Partner has sole responsibility for conducting our business and managing our operations. We conduct our operations through a wholly owned subsidiary, BOLP and BOLP’s general partner BOGP. We own all of the ownership interests in BOLP and BOGP.
Our wholly owned subsidiary, BreitBurn Management, manages our assets and performs other administrative services for us such as accounting, corporate development, finance, land administration, legal and engineering. See Note 6 for information regarding our relationship with BreitBurn Management.
Our wholly owned subsidiary, BreitBurn Finance Corporation, was incorporated on June 1, 2009 under the laws of the State of Delaware. BreitBurn Finance Corporation has no assets or liabilities. Its activities are limited to co-issuing debt securities and engaging in other activities incidental thereto.
In September 2010, we formed a wholly owned subsidiary, BreitBurn Collingwood Utica LLC (“Utica”), and certain oil and gas properties were transferred to it from two of our other wholly owned subsidiaries.
As of December 31, 2010, the public unitholders owned 69.6% of our Common Units and Quicksilver owned 29.1% of our Common Units. BreitBurn Corporation owned 690,751 Common Units, representing a 1.3% limited partner interest. We own 100% of the General Partner, BreitBurn Management, BOLP, BreitBurn Finance Corporation and Utica.
2. Summary of Significant Accounting Policies
Principles of consolidation
The consolidated financial statements include our accounts and the accounts of our wholly owned subsidiaries and our predecessor. Investments in affiliated companies with a 20% or greater ownership interest, and in which we do not have control, are accounted for on the equity basis. Investments in affiliated companies with less than a 20% ownership interest, and in which we do not have control, are accounted for on the cost basis. Investments in which we own greater than 50% interest are consolidated. Investments in which we own less than a 50% interest but are deemed to have control or where we have a variable interest in an entity where we will absorb a majority of the entity’s expected losses or receive a majority of the
entity’s expected residual returns or both, however, are consolidated. The effects of all intercompany transactions have been eliminated.
Basis of Presentation
Our financial statements are prepared in conformity with U.S. generally accepted accounting principles. Certain items included in the prior year financial statements were reclassified to conform to the 2010 presentation.
F-8
In the first quarter of 2009, we began classifying regional operation management expenses as operating costs rather than general and administrative (“G&A”) expenses to better align our operating and management costs with our organizational structure and to be more consistent with industry practices. As such, we have revised the classification of these expenses for the year ended December 31, 2008. In 2008, we included in G&A $0.5 million of legal expenses reflecting the amount of our insurance deductible in connection with the Quicksilver lawsuit. In 2010, we are reflecting the estimated costs incurred in connection with the lawsuit which we believe will not be recovered from the insurance companies in a new line titled
“unreimbursed litigation costs.” As such, we are classifying the 2008 amount from G& ;A to the new line. The reclassifications did not affect previously reported total revenues, net income or net cash provided by operating activities. The following table reflects the classification changes for the year ended December 31, 2008:
|
Thousands of dollars
|
Year Ended
December 31,
2008
|
|||
|
Operating costs
|
||||
|
As previously reported
|
$ | 149,681 | ||
|
District expense reclass from G&A
|
12,324 | |||
|
As revised
|
$ | 162,005 | ||
|
G&A expenses
|
||||
|
As previously reported
|
$ | 43,435 | ||
|
District expense reclass to operating costs
|
(12,324 | ) | ||
|
Unreimbursed litigation costs
|
(500 | ) | ||
|
As revised
|
$ | 30,611 | ||
Use of estimates
The preparation of financial statements in conformity with accounting principles generally accepted in the United States of America requires management to make estimates and assumptions that affect the reported amounts of assets and liabilities and disclosure of contingent assets and liabilities at the date of the financial statements and the reported amounts of revenues and expenses during the reporting period. Actual results could differ from those estimates. The financial statements are based on a number of significant estimates including oil and gas reserve quantities, which are the basis for the calculation of depletion, depreciation, amortization, asset retirement obligations and impairment of oil and gas properties.
We account for business combinations using the purchase method, in accordance with Financial Accounting Standards Board (“FASB”) Accounting Standards. We use estimates to record the assets and liabilities acquired. All purchase price allocations are finalized within one year from the acquisition date.
Business segment information
FASB Accounting Standards require reporting information about operating segments. We report in one segment because our oil and gas operating areas have similar economic characteristics. We acquire, exploit, develop and produce oil and natural gas in the United States. Corporate management administers all properties as a whole rather than as discrete operating segments. Operational data is tracked by area; however, financial performance is measured as a single enterprise and not on an area-by-area basis. Allocation of capital resources is employed on a project-by-project basis across our entire asset base to maximize profitability without regard to individual areas.
Revenue recognition
Revenues associated with sales of our crude oil and natural gas are recognized when title passes from us to our customer. Revenues from properties in which we have an interest with other partners are recognized on the basis of our working interest (“entitlement” method of accounting). We generally market most of our natural gas production from our operated properties and pay our partners for their working interest shares of natural gas production sold. As a result, we have no material natural gas producer imbalance positions.
F-9
Cash and cash equivalents
We consider all investments with original maturities of three months or less to be cash equivalents. At December 31, 2010 and 2009, we had no such investments.
Accounts Receivable
Our accounts receivable are primarily from purchasers of crude oil and natural gas and counterparties to our financial instruments. Crude oil receivables are generally collected within 30 days after the end of the month. Natural gas receivables are generally collected within 60 days after the end of the month. We review all outstanding accounts receivable balances and record a reserve for amounts that we expect will not be fully recovered. Actual balances are not applied against the reserve until substantially all collection efforts have been exhausted. As of December 31, 2010 and 2009, we did not carry an allowance for doubtful accounts receivable.
At December 31, 2010, accounts receivable included a $10.3 million receivable from our insurance companies related to the Quicksilver lawsuit. The settlement costs of the lawsuit and the associated legal expenses were $13.0 million and approximately $8.7 million, respectively, of which we collected approximately $10.0 million from our insurance companies during the year ended December 31, 2010. Of the costs incurred in connection with the lawsuit, $1.4 million was estimated to be not recoverable from the insurance companies and is reflected as an expense in the unreimbursed litigation costs line on the consolidated statement of operations for the year ended December 31, 2010. In 2008, we
expensed $0.5 million in legal expenses representing the amount of our insurance deductible.
At December 31, 2009, accounts receivable included a $4.3 million receivable from our insurance companies related to legal costs incurred during the lawsuit with Quicksilver and a $13.0 million receivable from our insurance companies related to the settlement of the lawsuit.
During 2008 we terminated our crude oil derivative instruments with Lehman Brothers due to their bankruptcy. On October 21, 2009, we completed the transfer and sale of our claims in the bankruptcy cases filed by Lehman Brothers Commodity Services Inc. and Lehman Brothers Holdings Inc. (together referred to as Lehman Brothers), to a third party. We recognized a $1.9 million gain reflected in gain (loss) on commodity derivative instruments, net on the consolidated statements of operations.
Inventory
Oil inventories are carried at the lower of cost to produce or market price. We match production expenses with crude oil sales. Production expenses associated with unsold crude oil inventory are recorded as inventory.
Investments in Equity Affiliates
Income from equity affiliates is included as a component of operating income, as the operations of these affiliates are associated with the processing and transportation of our natural gas production.
Property, plant and equipment
Oil and gas properties
We follow the successful efforts method of accounting. Lease acquisition and development costs (tangible and intangible) incurred relating to proved oil and gas properties are capitalized. Delay and surface rentals are charged to expense as incurred. Dry hole costs incurred on exploratory wells are expensed. Dry hole costs associated with developing proved fields are capitalized. Geological and geophysical costs related to exploratory operations are expensed as incurred.
Upon sale or retirement of proved properties, the cost thereof and the accumulated depletion, depreciation and amortization (“DD&A”) are removed from the accounts and any gain or loss is recognized in the statement of operations. Maintenance and repairs are charged to operating expenses. DD&A of proved oil and gas properties, including the estimated cost of future abandonment and restoration of well sites and associated facilities, are generally computed on a field-by-field basis where applicable and recognized using the units-of-production method net of any anticipated proceeds from equipment salvage and sale of surface rights. Other gathering and processing facilities are recorded at cost and are depreciated using
straight line, generally over 20 years.
F-10
We capitalize interest costs to oil and gas properties on expenditures made in connection with drilling and completion of new oil and natural gas wells. Interest is capitalized only for the period that such activities are in progress. Interest is capitalized using a weighted average interest rate based on our outstanding borrowings. These capitalized costs are included with intangible drilling costs and amortized using the units of production method. During 2010, interest of $0.3 million was capitalized and included in our capital expenditures. We had no capitalized interest for 2009 and 2008.
Non-oil and gas assets
Buildings and non-oil and gas assets are recorded at cost and depreciated using the straight-line method over their estimated useful lives, which range from three to 20 years.
Oil and natural gas reserve quantities
Reserves and their relation to estimated future net cash flows impact our depletion and impairment calculations. As a result, adjustments to depletion are made concurrently with changes to reserve estimates. We disclose reserve estimates, and the projected cash flows derived from these reserve estimates, in accordance with SEC guidelines. In 2010 and 2009, our reserves disclosures were in accordance with Release No. 33-8995, “Modernization of Oil and Gas Reporting” (“Release 33-8995”), issued by the SEC in December 2008 as well as FASB Accounting Standards. The independent engineering firms adhere to the
SEC definitions when preparing their reserve reports.
Asset retirement obligations
We have significant obligations to plug and abandon oil and natural gas wells and related equipment at the end of oil and natural gas production operations. The computation of our asset retirement obligations (“ARO”) is prepared in accordance with FASB Accounting Standards. The fair value of a liability for an asset retirement obligation is recorded when there is a legal obligation associated with the retirement of a tangible long-lived asset and the liability can be reasonably estimated. Over time, changes in the present value of the liability are accreted and expensed. The capitalized asset costs are depreciated over the useful lives of the corresponding asset. Recognized liability amounts are based upon future retirement
cost estimates and incorporate many assumptions such as: (1) expected economic recoveries of crude oil and natural gas, (2) time to abandonment, (3) future inflation rates and (4) the risk free rate of interest adjusted for our credit costs. Future revisions to ARO estimates will impact the present value of existing ARO liabilities and corresponding adjustments will be made to the capitalized asset retirement costs balance.
Impairment of assets
Long-lived assets with recorded values that are not expected to be recovered through future cash flows are written-down to estimated fair value in accordance with FASB Accounting Standards. A long-lived asset is tested for impairment when events or circumstances indicate that its carrying value may not be recoverable. The carrying value of a long-lived asset is not recoverable if it exceeds the sum of the undiscounted cash flows expected to result from the use and eventual disposition of the asset. If the carrying value exceeds the sum of the undiscounted cash flows, an impairment loss equal to the amount by which the carrying value exceeds the fair value of the asset is recognized. Fair value is generally determined from estimated
discounted future net cash flows. For purposes of performing an impairment test, the undiscounted future ca sh flows are based on total proved and risk-adjusted probable and possible reserves and are forecast using five-year NYMEX forward strip prices at the end of the period and escalated along with expenses and capital starting year six and thereafter at 2.5% per year. For impairment charges, the associated property’s expected future net cash flows are discounted using a rate of approximately 10%. Reserves are calculated based upon reports from third-party engineers adjusted for acquisitions or other changes occurring during the year as determined to be appropriate in the good faith judgment of management. Unproven properties are assessed for impairment and if considered impaired are charged to expense when such impairment is deemed to have occurred.
F-11
We assess our long-lived assets for impairment generally on a field-by-field basis where applicable. During the year ended December 31, 2010, we recorded impairments of approximately $6.3 million to DD&A related to our Eastern region properties, including a $4.2 million write-down of uneconomic proved properties and a $2.1 million write-down of expired unproved lease properties. We did not record an impairment charge in 2009. Because of the low commodity prices that existed at year end 2008, we recorded $51.9 million in impairments and $34.5 million in price related depletion and depreciation adjustments. Price related adjustments to depletion and depreciation in 2010 and 2009 were immaterial. See Note 10 for a discussion of our
impairments and price related depletion and depreciation adjustments.
Debt issuance costs
The costs incurred to obtain financing have been capitalized. Debt issuance costs are amortized using the straight-line method over the term of the related debt. Use of the straight-line method does not differ materially from the “effective interest” method of amortization. Amortization of debt issuance costs for the year ended December 31, 2010 included $1.5 million of write-off of debt issuance costs as a result of the reduced borrowing base under our credit facility.
Equity-based compensation
FASB Accounting Standards establish standards for charging compensation expenses based on fair value provisions. BreitBurn Management has various forms of equity-based compensation outstanding under employee compensation plans that are described more fully in Note 18. Awards classified as equity are valued on the grant date and are recognized as compensation expense over the vesting period. We recognize equity-based compensation costs on a straight line basis over the annual vesting periods. Awards classified as liabilities were revalued at each reporting period and changes in the fair value of the options were recognized as
compensation expense over the vesting schedules of the awards.
Fair market value of financial instruments
The carrying amount of our cash, accounts receivable, accounts payable, related party receivables and payables, and accrued expenses, approximate their respective fair value due to the relatively short term of the related instruments. The carrying amount of long-term debt under our credit facility approximates fair value; however, changes in the credit markets may impact our ability to enter into future credit facilities at similar terms. See Note 11 for the fair value of our Senior Notes.
Accounting for business combinations
We have accounted for all business combinations using the purchase method, in accordance with FASB Accounting Standards. Under the purchase method of accounting, a business combination is accounted for at a purchase price based upon the fair value of the consideration given, whether in the form of cash, assets, equity or the assumption of liabilities. The assets and liabilities acquired are measured at their fair values, and the purchase price is allocated to the assets and liabilities based upon these fair values. The excess of the fair value of assets acquired and liabilities assumed over the cost of an acquired entity, if any, is allocated as a pro rata reduction of the amounts that otherwise would have been assigned to certain acquired
assets. We have not recognized any goodwill from any business combinations.
Concentration of credit risk
We maintain our cash accounts primarily with a single bank and invest cash in money market accounts, which we believe to have minimal risk. At times, such balances may be in excess of the Federal Insurance Corporation insurance limit. As operator of jointly owned oil and gas properties, we sell oil and gas production to U.S. oil and gas purchasers and pay vendors on behalf of joint owners for oil and gas services. We periodically monitor our major purchasers’ credit ratings. We enter into commodity and interest rate derivative instruments. Our derivative counterparties are all lenders under our credit facility and we periodically monitor their credit ratings.
Derivatives
FASB Accounting Standards establish accounting and reporting requirements for derivative instruments, including certain derivative instruments embedded in other contracts, and hedging activities. These standards require recognition of all derivative instruments as assets or liabilities on our balance sheet and measurement of those instruments at fair value. The accounting treatment of changes in fair value is dependent upon whether or not a derivative instrument is designated as a hedge and if so, the type of hedge. For derivatives designated as cash flow hedges, changes in fair value are recognized in other comprehensive income, to the extent the hedge is effective, until the hedged item is recognized in earnings. Hedge effectiveness is
measured based on the relative changes in fair value between the derivative contract and the hedged i tem over time. Any change in fair value resulting from ineffectiveness, as defined by FASB Accounting Standards, is recognized immediately in earnings. Gains and losses on derivative instruments not designated as hedges are currently included in earnings. The resulting cash flows are reported as cash from operating activities. We currently do not designate any of our derivatives as hedges for financial accounting purposes.
F-12
In September 2006, authoritative guidance was issued that defines fair value, establishes a framework for measuring fair value and expands disclosures about fair value measurements. We adopted this guidance effective January 1, 2008. Fair value measurement is based upon a hypothetical transaction to sell an asset or transfer a liability at the measurement date, considered from the perspective of a market participant that holds the asset or owes the liability. The objective of fair value measurement is to determine the price that would be received in selling the asset or transferring the liability in an orderly transaction between market participants at the measurement date. If there is an active market for the asset or liability, the fair
value measurement shall represent the price in that market whether the price is directly observable or otherwise obtained using a valuation technique.
Income taxes
Our subsidiaries are mostly partnerships or limited liability companies treated as partnerships for federal tax purposes with essentially all taxable income or loss being passed through to the members. As such, no federal income tax for these entities has been provided.
We have three wholly owned subsidiaries, which are subject to corporate income taxes. We account for the taxes associated with one entity in accordance with FASB Accounting Standards. Deferred income taxes are recorded under the asset and liability method. Where material, deferred income tax assets and liabilities are computed for differences between the financial statement and income tax bases of assets and liabilities that will result in taxable or deductible amounts in the future. Such deferred income tax asset and liability computations are based on enacted tax laws and rates applicable to periods in which the differences are expected to affect taxable income. Income tax expense is the tax payable or refundable for the period plus or
minus the change during the period in deferred income tax assets and liabilities.
FASB Accounting Standards clarify the accounting for uncertainty in income taxes recognized in a company’s financial statements. A company can only recognize the tax position in the financial statements if the position is more-likely-than-not to be upheld on audit based only on the technical merits of the tax position. This accounting standard also provides guidance on thresholds, measurement, derecognition, classification, interest and penalties, accounting in interim periods, disclosure, and transition that is intended to provide better financial-statement comparability among different companies.
We performed evaluations as of December 31, 2010, 2009 and 2008 and concluded that there were no uncertain tax positions requiring recognition in our financial statements.
Net Income or loss per unit
FASB Accounting Standards require use of the “two-class” method of computing earnings per unit for all periods presented. The “two-class” method is an earnings allocation formula that determines earnings per unit for each class of Common Unit and participating security as if all earnings for the period had been distributed. Unvested restricted unit awards that earn non-forfeitable dividend rights qualify as participating securities and, accordingly, are included in the basic computation. Our unvested restricted phantom units (“RPUs”) and convertible phantom units (“CPUs”) participate in dividends on an equal basis with Common Units;
therefore, there is no difference in undistributed earnings allocated to each participating security. A ccordingly, our calculation is prepared on a combined basis and is presented as earnings per Common Unit. See Note 16 for our earnings per Common Unit calculation.
F-13
Environmental expenditures
We review, on an annual basis, our estimates of the cleanup costs of various sites. When it is probable that obligations have been incurred and where a reasonable estimate of the cost of compliance or remediation can be determined, the applicable amount is accrued. For other potential liabilities, the timing of accruals coincides with the related ongoing site assessments. We do not discount these liabilities. At December 31, 2010, we had a $2.1 million environmental liability accrued that included cost estimates related to the maintenance of ground water monitoring wells associated with certain former well sites in Michigan that are no longer producing. At December 31, 2009 we had a $2.0 million environmental liability that included cost
estimates related to the closure of a drilling pit in Michigan, which we assumed in the Quicksilver A cquisition. That drilling pit has been closed.
3. Accounting Pronouncements
Effective January 1, 2010, we adopted guidance issued by the FASB in June 2009 related to the consolidation of variable interest entities with no impact on our financial position, results of operations or cash flows.
In January 2010, the FASB issued an Accounting Standards Update (“ASU”) that required two additional fair value measurement disclosures and clarifies two existing fair value measurement disclosures. The new disclosures require details of significant transfers in and out of level 1 and level 2 measurements and the reasons for the transfers, and a gross presentation of activity within the level 3 roll forward that presents separately, information about purchases, sales, issuances and settlements. The ASU clarified the existing disclosures with regard to the level of disaggregation of fair value measurements by class of assets and liabilities rather than major category where the reporting entities would need to apply judgment to
determine the appropriate classes of other assets and liabilities. The second clarification related t o disclosures of valuation techniques and inputs for recurring and non recurring fair value measurements using significant other observable inputs and significant unobservable inputs for level 2 and level 3 measurements, respectively. We adopted the ASU effective for our financial statements issued for interim or annual periods beginning after December 15, 2009, except for the disclosures about purchases, sales, issuances, and settlements in the roll forward of activity in Level 3 fair value measurements which are effective for fiscal years beginning after December 15, 2010 and for interim periods within those fiscal years. The adoption of the ASU has not had an impact on our financial position, results of operations or cash flows.
4. Dispositions
On July 17, 2009, we sold the Lazy JL Field located in the Permian Basin of West Texas to a private buyer for $23 million in cash. This transaction was effective July 1, 2009. The proceeds from this transaction were used to reduce our outstanding borrowings under our credit facility. In connection with the sale, the borrowing base under our credit facility was reduced by $3 million to $732 million.
The Lazy JL Field properties produced approximately 245 Boe per day during the first six months of 2009, of which 96% was crude oil. The net carrying value at the date of sale was $28.5 million, of which $28.7 million was reflected in net property, plant and equipment on the balance sheet and $0.2 million was reflected in asset retirement obligation on the balance sheet. We recognized a loss of $5.5 million in 2009 related to the sale of the field.
5. Financial Instruments
Our risk management programs are intended to reduce our exposure to commodity prices and interest rates and to assist with stabilizing cash flows. Routinely, we utilize derivative financial instruments to reduce this volatility. To the extent we have hedged prices for a significant portion of our expected production through commodity derivative instruments and the cost for goods and services increase, our margins would be adversely affected.
Commodity Activities
The derivative instruments we utilize are based on index prices that may and often do differ from the actual crude oil and natural gas prices realized in our operations. These variations often result in a lack of adequate correlation to enable these derivative instruments to qualify for cash flow hedges under FASB Accounting Standards. Accordingly, we do not attempt to account for our derivative instruments as cash flow hedges for financial accounting purposes and instead recognize changes in the fair value immediately in earnings.
F-14
We had the following contracts in place at December 31, 2010:
|
Year
|
||||||||||||||||
|
2011
|
2012
|
2013
|
2014
|
|||||||||||||
|
Oil Positions:
|
||||||||||||||||
|
Fixed Price Swaps:
|
||||||||||||||||
|
Hedged Volume (Bbls/d)
|
5,019 | 5,039 | 6,480 | 4,748 | ||||||||||||
|
Average Price ($/Bbl)
|
$ | 76.14 | $ | 77.15 | $ | 81.37 | $ | 88.10 | ||||||||
|
Participating Swaps: (a)
|
||||||||||||||||
|
Hedged Volume (Bbls/d)
|
1,439 | - | - | - | ||||||||||||
|
Average Price ($/Bbl)
|
$ | 61.29 | $ | - | $ | - | $ | - | ||||||||
|
Average Participation %
|
53.2 | % | - | - | - | |||||||||||
|
Collars:
|
||||||||||||||||
|
Hedged Volume (Bbls/d)
|
2,048 | 2,477 | 500 | - | ||||||||||||
|
Average Floor Price ($/Bbl)
|
$ | 103.42 | $ | 110.00 | $ | 77.00 | $ | - | ||||||||
|
Average Ceiling Price ($/Bbl)
|
$ | 152.61 | $ | 145.39 | $ | 103.10 | $ | - | ||||||||
|
Floors:
|
||||||||||||||||
|
Hedged Volume (Bbls/d)
|
- | - | - | - | ||||||||||||
|
Average Floor Price ($/Bbl)
|
$ | - | $ | - | $ | - | $ | - | ||||||||
|
Total:
|
||||||||||||||||
|
Hedged Volume (Bbls/d)
|
8,506 | 7,516 | 6,980 | 4,748 | ||||||||||||
|
Average Price ($/Bbl)
|
$ | 80.20 | $ | 87.97 | $ | 81.06 | $ | 88.10 | ||||||||
|
Gas Positions:
|
||||||||||||||||
|
Fixed Price Swaps:
|
||||||||||||||||
|
Hedged Volume (MMBtu/d)
|
25,955 | 19,128 | 37,000 | 7,500 | ||||||||||||
|
Average Price ($/MMBtu)
|
$ | 7.26 | $ | 7.10 | $ | 6.50 | $ | 6.00 | ||||||||
|
Collars:
|
||||||||||||||||
|
Hedged Volume (MMBtu/d)
|
16,016 | 19,129 | - | - | ||||||||||||
|
Average Floor Price ($/MMBtu)
|
$ | 9.00 | $ | 9.00 | $ | - | $ | - | ||||||||
|
Average Ceiling Price ($/MMBtu)
|
$ | 11.28 | $ | 11.89 | $ | - | $ | - | ||||||||
|
Total:
|
||||||||||||||||
|
Hedged Volume (MMBtu/d)
|
41,971 | 38,257 | 37,000 | 7,500 | ||||||||||||
|
Average Price ($/MMBtu)
|
$ | 7.92 | $ | 8.05 | $ | 6.50 | $ | 6.00 | ||||||||
(a) A participating swap combines a swap and a call option with the same strike price.
Interest Rate Activities
We are subject to interest rate risk associated with loans under our credit facility that bear interest based on floating rates. As of December 31, 2010, our total debt outstanding under our credit facility was $228 million. In order to mitigate our interest rate exposure, we had the following interest rate swaps in place at December 31, 2010, to fix a portion of floating LIBOR-base debt under our credit facility:
|
Notional amounts in thousands of dollars
|
Notional Amount
|
Fixed Rate
|
||||||
|
Period Covered
|
||||||||
|
January 1, 2011 to October 20, 2011
|
100,000 | 1.6200 | % | |||||
|
January 1, 2011 to October 20, 2011
|
100,000 | 2.9900 | % | |||||
|
November 21, 2011 to December 20, 2012
|
100,000 | 1.1550 | % | |||||
|
January 20, 2012 to January 20, 2014
|
100,000 | 2.4800 | % | |||||
We do not currently designate any of our interest rate derivatives as hedges for financial accounting purposes.
F-15
Fair Value of Financial Instruments
FASB Accounting Standards require disclosures about how and why an entity uses derivative instruments, how derivative instruments and related hedge items are accounted for, and how derivative instruments and related hedged items affect an entity’s financial position, financial performance, and cash flows. The required disclosures are detailed below.
Fair value of derivative instruments not designated as hedging instruments:
|
Balance sheet location, thousands of dollars
|
Oil
Commodity
Derivatives
|
Natural Gas
Commodity
Derivatives
|
Interest
Rate
Derivatives
|
Commodity
derivative
netting (a)
|
Total
Financial
Instruments
|
|||||||||||||||
|
December 31, 2010
|
||||||||||||||||||||
|
Assets
|
||||||||||||||||||||
|
Current assets - derivative instruments
|
$ | 9,438 | $ | 48,972 | $ | - | $ | (3,658 | ) | $ | 54,752 | |||||||||
|
Other long-term assets - derivative instruments
|
15,785 | 55,806 | - | (20,939 | ) | 50,652 | ||||||||||||||
|
Total assets
|
25,223 | 104,778 | - | (24,597 | ) | 105,404 | ||||||||||||||
|
Liabilities
|
||||||||||||||||||||
|
Current liabilities - derivative instruments
|
(37,610 | ) | - | (3,119 | ) | 3,658 | (37,071 | ) | ||||||||||||
|
Long-term liabilities - derivative instruments
|
(58,766 | ) | (166 | ) | (1,729 | ) | 20,939 | (39,722 | ) | |||||||||||
|
Total liabilities
|
(96,376 | ) | (166 | ) | (4,848 | ) | 24,597 | (76,793 | ) | |||||||||||
|
Net assets (liabilities)
|
$ | (71,153 | ) | $ | 104,612 | $ | (4,848 | ) | $ | - | $ | 28,611 | ||||||||
|
December 31, 2009
|
||||||||||||||||||||
|
Assets
|
||||||||||||||||||||
|
Current assets - derivative instruments
|
$ | 17,666 | $ | 39,467 | $ | - | $ | - | $ | 57,133 | ||||||||||
|
Other long-term assets - derivative instruments
|
35,382 | 42,620 | - | (3,243 | ) | 74,759 | ||||||||||||||
|
Total assets
|
53,048 | 82,087 | - | (3,243 | ) | 131,892 | ||||||||||||||
|
Liabilities
|
||||||||||||||||||||
|
Current liabilities - derivative instruments
|
(10,234 | ) | - | (9,823 | ) | - | (20,057 | ) | ||||||||||||
|
Long-term liabilities - derivative instruments
|
(51,730 | ) | - | (1,622 | ) | 3,243 | (50,109 | ) | ||||||||||||
|
Total liabilities
|
(61,964 | ) | - | (11,445 | ) | 3,243 | (70,166 | ) | ||||||||||||
|
Net assets (liabilities)
|
$ | (8,916 | ) | $ | 82,087 | $ | (11,445 | ) | $ | - | $ | 61,726 | ||||||||
(a) Represents counterparty netting under derivative netting agreements - these contracts are reflected net on the balance sheet.
F-16
Gains and losses on derivative instruments not designated as hedging instruments:
|
Location of gain/loss, thousands of dollars
|
Oil
Commodity
Derivatives (a)
|
Natural Gas
Commodity
Derivatives (a)
|
Interest Rate
Derivatives (b)
|
Total
Financial
Instruments
|
||||||||||||
|
Year Ended December 31, 2010
|
||||||||||||||||
|
Realized gain (loss)
|
$ | 11,252 | $ | 63,573 | $ | (11,087 | ) | $ | 63,738 | |||||||
|
Unrealized gain (loss)
|
(62,239 | ) | 22,526 | 6,597 | (33,116 | ) | ||||||||||
|
Net gain (loss)
|
$ | (50,987 | ) | $ | 86,099 | $ | (4,490 | ) | $ | 30,622 | ||||||
|
Year Ended December 31, 2009
|
||||||||||||||||
|
Realized gain (loss)
|
$ | 66,176 | $ | 101,507 | $ | (13,115 | ) | $ | 154,568 | |||||||
|
Unrealized gain (loss)
|
(195,127 | ) | (23,993 | ) | 5,869 | (213,251 | ) | |||||||||
|
Net gain (loss)
|
$ | (128,951 | ) | $ | 77,514 | $ | (7,246 | ) | $ | (58,683 | ) | |||||
|
Year Ended December 31, 2008
|
||||||||||||||||
|
Realized loss
|
$ | (35,146 | ) | $ | (20,800 | ) | $ | (2,721 | ) | $ | (58,667 | ) | ||||
|
Unrealized gain (loss)
|
293,720 | 94,328 | (17,314 | ) | 370,734 | |||||||||||
|
Net gain (loss)
|
$ | 258,574 | $ | 73,528 | $ | (20,035 | ) | $ | 312,067 | |||||||
(a) Included in gain (loss) on commodity derivative instruments, net on the consolidated statements of operations.
(b) Included in loss on interest rate swaps on the consolidated statements of operations.
In January 2009, we terminated a portion of our 2011 and 2012 crude oil and natural gas derivative contracts and replaced them with new contracts with the same counterparty for the same volumes at market prices. We realized $32.3 million from the termination of crude oil contracts and $13.3 million from the termination of natural gas contracts. Proceeds from these contracts were used to pay down outstanding borrowings under our credit facility.
In June 2009, we terminated an additional portion of our 2011 and 2012 crude oil and natural gas derivative contracts and replaced them with new contracts for the same volumes at market prices. We realized $6.1 million from the termination of crude oil contracts and $18.9 million from the termination of natural gas derivative contracts. Proceeds from these contracts were used to pay down outstanding borrowings under our credit facility.
FASB Accounting Standards define fair value, establish a framework for measuring fair value and establish required disclosures about fair value measurements. They also establish a fair value hierarchy that prioritizes the inputs to valuation techniques into three broad levels based upon how observable those inputs are. We use valuation techniques that maximize the use of observable inputs and obtain the majority of our inputs from published objective sources or third party market participants. We incorporate the impact of nonperformance risk, including credit risk, into our fair value measurements. The fair value hierarchy gives the highest priority of Level 1 to unadjusted quoted prices in active markets for identical assets or
liabilities and the lowest priority of Level 3 to unobservable inputs. We categorize our fair value financial instruments based upon the objectivity of the inputs and how observable those inputs are. The three levels of inputs are described further as follows:
Level 1 – Unadjusted quoted prices in active markets for identical assets or liabilities as of the reporting date. Level 2 – Inputs other than quoted prices that are included in Level 1. Level 2 includes financial instruments that are actively traded but are valued using models or other valuation methodologies. We consider the over the counter (“OTC”) commodity and interest rate swaps in our portfolio to be Level 2. Level 3 – Inputs that are not directly observable for the asset or liability and are significant to the fair value of the asset or liability. Level 3 includes financial instruments that are not actively traded and have little or no observable data for input into industry standard models. Certain
OTC derivatives that trade in less liquid markets or contain limited observable model inputs are curre ntly included in Level 3. As of December 31, 2010 and 2009, our Level 3 derivative assets and liabilities consisted entirely of OTC commodity put and call options.
F-17
Financial assets and liabilities that are categorized in Level 3 may later be reclassified to the Level 2 category at the point we are able to obtain sufficient binding market data or the interpretation of Level 2 criteria is modified in practice to include non-binding market corroborated data. Effective January 1, 2010, we adopted an ASU that requires detailed disclosures of significant transfers in and out of Level 1 and Level 2 categories and the reasons for those transfers. We had no such transfers during the year ended December 31, 2010. We also had no transfers in or out of Level 3.
Our Treasury/Risk Management group calculates the fair value of our commodity and interest rate swaps and options. We compare these fair value amounts to the fair value amounts that we receive from the counterparties on a monthly basis. Any differences are resolved and any required changes are recorded prior to the issuance of our financial statements.
The model we utilize to calculate the fair value of our commodity derivative instruments is a standard option pricing model. Inputs to the option pricing models include fixed monthly commodity strike prices and volumes from each specific contract, commodity prices from commodity forward price curves, volatility and interest rate factors and time to expiry. Model inputs are obtained from our counterparties and third party data providers and are verified to published data where available (e.g., NYMEX). Additional inputs to our Level 3 derivatives include option volatility, forward commodity prices and risk-free interest rates for present value discounting. We use the standard swap contract valuation method to value our interest rate
derivatives, and inputs include LIBOR forward interest rates, one-month LIBOR rates and risk-free interest r ates for present value discounting.
Our assessment of the significance of an input to its fair value measurement requires judgment and can affect the valuation of the assets and liabilities as well as the category within which they are classified. Financial assets and liabilities carried at fair value on a recurring basis are presented in the following table:
|
As of December 31, 2010
|
||||||||||||||||
|
Thousands of dollars
|
Level 1
|
Level 2
|
Level 3
|
Total
|
||||||||||||
|
Assets (Liabilities):
|
||||||||||||||||
|
Commodity Derivatives (swaps, put and call options)
|
$ | - | $ | (52,794 | ) | $ | 86,253 | $ | 33,459 | |||||||
|
Other Derivatives (interest rate swaps)
|
- | (4,848 | ) | - | (4,848 | ) | ||||||||||
|
Total
|
$ | - | $ | (57,642 | ) | $ | 86,253 | $ | 28,611 | |||||||
|
As of December 31, 2009
|
||||||||||||||||
|
Thousands of dollars
|
Level 1
|
Level 2
|
Level 3
|
Total
|
||||||||||||
|
Assets (Liabilities):
|
||||||||||||||||
|
Commodity Derivatives (swaps, put and call options)
|
$ | - | $ | (29,303 | ) | $ | 102,475 | $ | 73,172 | |||||||
|
Other Derivatives (interest rate swaps)
|
- | (11,446 | ) | - | (11,446 | ) | ||||||||||
|
Total
|
$ | - | $ | (40,749 | ) | $ | 102,475 | $ | 61,726 | |||||||
The following table sets forth a reconciliation of changes in fair value of our derivative instruments classified as Level 3:
|
Year Ended December 31,
|
||||||||||||
|
Thousands of dollars
|
2010
|
2009
|
2008
|
|||||||||
|
Assets (Liabilities):
|
||||||||||||
|
Beginning balance
|
$ | 102,475 | $ | 153,218 | $ | 44,236 | ||||||
|
Realized gain (loss) (a)
|
26,732 | 19,062 | (6,026 | ) | ||||||||
|
Unrealized gain (loss) (a)
|
(42,954 | ) | (63,775 | ) | 112,180 | |||||||
|
Purchases and issuances
|
- | - | 7,452 | |||||||||
|
Settlements (b)
|
- | (6,030 | ) | (4,624 | ) | |||||||
|
Ending balance
|
$ | 86,253 | $ | 102,475 | $ | 153,218 | ||||||
|
(a) Included in gain (loss) on commodity derivative instruments, net on the consolidated statements of operations.
(b) Settlements reflect the monetization of oil collar contracts in June 2009 and the termination of derivative contracts with Lehman in September 2008 due to the Lehman bankruptcy.
|
||||||||||||
F-18
Credit and Counterparty Risk
Financial instruments which potentially subject us to concentrations of credit risk consist principally of derivatives and accounts receivable. Our derivatives expose us to credit risk from counterparties. As of December 31, 2010, our derivative counterparties were Barclays Bank PLC, Bank of Montreal, Citibank, N.A, Credit Suisse Energy LLC, Union Bank N.A, Wells Fargo Bank National Association, JP Morgan Chase Bank N.A., The Royal Bank of Scotland plc, The Bank of Nova Scotia, BNP Paribas, U.S Bank National Association and Toronto-Dominion Bank. Our counterparties are all lenders under our Amended and Restated Credit Agreement. On all transactions where we are exposed to counterparty risk, we analyze the counterparty's financial condition
prior to entering into an agreement, establish limits, and monitor the appropriateness of these lim its on an ongoing basis. We periodically obtain credit default swap information on our counterparties. Although we currently do not believe we have a specific counterparty risk with any party, our loss could be substantial if any of these parties were to fail to perform in accordance with the terms of the contract. This risk is managed by diversifying the derivative portfolio. As of December 31, 2010, each of these financial institutions had an investment grade credit rating. As of December 31, 2010, our largest derivative asset balances were with JP Morgan Chase Bank N.A. and Credit Suisse Energy LLC, who accounted for approximately 70% and 13% of our derivative asset balances, respectively. As of December 31, 2010, our largest derivative liability balances were with Wells Fargo Bank National Association, BNP Paribas, Citibank, N.A and The Royal Bank of Scotland plc, who accounted for
approximately 67%, 11%, 9% and 9% of our derivative liability balances, respectively.
6. Related Party Transactions
BreitBurn Management operates our assets and performs other administrative services for us such as accounting, corporate development, finance, land administration, legal and engineering. All of our employees, including our executives, are employees of BreitBurn Management. Prior to June 17, 2008, BreitBurn Management provided services to us and to BEC, and allocated its expenses between the two entities. On June 17, 2008, BreitBurn Management became our wholly-owned subsidiary and entered into an Amended and Restated Administrative Services Agreement with BEC, pursuant to which BreitBurn Management agreed to continue to provide administrative services to BEC, in exchange for a monthly fee for indirect expenses that was set at $775,000 for
2008.
On August 26, 2008, members of our senior management, in their individual capacities, together with Metalmark Capital Partners (“Metalmark”), Greenhill Capital Partners (“Greenhill”) and a third-party institutional investor, completed the acquisition of BEC. This transaction included the acquisition of a 96.02% indirect interest in BEC, previously owned by Provident Energy Trust (“Provident”), and the remaining indirect interests in BEC, previously owned by Randall H. Breitenbach, Halbert S. Washburn and other members of our senior management. BEC is a separate Delaware oil and gas partnership with operations in California, was a separate U.S. subsidiary of Provident and was our Predecessor.
In connection with the acquisition of Provident’s ownership in BEC by members of senior management, Metalmark, Greenhill and a third party institutional investor, BreitBurn Management entered into the Second Amended and Restated Administrative Services Agreement (the “Administrative Services Agreement”) to manage BEC's properties for a term of five years. In addition to the monthly fee, BreitBurn Management charges BEC for all direct expenses including incentive plan costs and direct payroll and administrative costs related to BEC properties and operations. The monthly fee is contractually based on an annual projection of anticipated time spent by each employee who provides services to both us and BEC during the ensuing
year and is subject to renegotiation annually by the parties during the term of the agreement. For 20 09 and 2010, each BreitBurn Management employee estimated his or her time allocation independently. These estimates were then reviewed and approved by each employee’s manager or supervisor. The results of this process were provided to both the audit committee of the board of directors of our General Partner (composed entirely of independent directors) (the “audit committee”) and the board of representatives of BEC’s parent (the “BEC board”). The audit committee and the non-management members of the BEC board agreed on the 2009 and 2010 monthly fee as provided in the Administrative Services Agreement. The monthly fee for 2009 and 2010 was set at $500,000 and $456,000, respectively. The reduction in the monthly fee from 2008 to 2009 is attributable to the overall reduction in general and administrative expenses, excluding unit-based compensation, for
BreitBurn Management in 2009, the new time allocation study described above and the fact that additional costs are being charg ed directly to us and BEC compared to prior years. The reduction in the monthly fee for indirect expenses in 2010 was primarily due to the shift of certain indirect expenses to direct expenses and a slight reduction in the time allocated to BEC.
F-19
In addition, we entered into an Omnibus Agreement with BEC detailing rights with respect to business opportunities and providing us with a right of first offer with respect to the sale of assets by BEC.
At December 31, 2010 and December 31, 2009, we had current receivables of $3.2 million and $1.4 million, respectively, due from BEC related to the Administrative Services Agreement, outstanding liabilities for employee related costs and oil and gas sales made by BEC on our behalf from certain properties. During 2010, the monthly charges to BEC for indirect expenses totaled $5.4 million and charges for direct expenses including direct payroll and administrative costs totaled $6.2 million. For the year ended December 31, 2010, total oil and gas sales made by BEC on our behalf were approximately $1.8 million. During 2009, the monthly charges to BEC for indirect expenses totaled $6.5 million and charges for direct expenses including direct
payroll and administrative costs totaled $6.1 million. For the year ended December 31, 2009, total oil and gas sales made by BEC on our behalf were approximately $1.3 million.
At December 31, 2010 and December 31, 2009, we had receivables of $0.4 and $0.3 million due from certain of our other affiliates, primarily representing investments in natural gas processing facilities, for management fees due from them and operational expenses incurred on their behalf.
Pursuant to a transition services agreement through March 2008, Quicksilver provided to us services for accounting, land administration, and marketing and charged us $0.9 million for the first quarter of 2008. These charges were included in general and administrative expenses on the consolidated statements of operations. Quicksilver also buys natural gas from us in Michigan. For the year ended December 31, 2010, total net gas sales to Quicksilver were approximately $3.4 million and the related receivable as of December 31, 2010 was $0.7 million. For the year ended December 31, 2009, total net gas sales to Quicksilver were approximately $2.8 million and the related receivable as of December 31, 2009 was $0.4 million.
On October 31, 2008, Quicksilver instituted a lawsuit (the “Litigation”) against us and certain of our subsidiaries and directors in the 48th District Court in Tarrant County, Texas (the “Court”). In February 2010, we agreed to settle all claims with respect to the Litigation. A final settlement agreement was executed in April 2010. Pursuant to the Settlement Agreement, the parties agreed to dismiss all pending claims before the Court and mutually released each party, its affiliates, agents, officers, directors and attorneys from any and all claims arising from the subject matter of the Litigation. At December 31, 2009, we had a $13.0 million payable to Quicksilver in connection with the monetary portion of the
settlement, which was paid in April 2010 after the Settlement Agreement was executed. On April 6, 2010, an order dismissing all claims in the Litigation was entered by the Court. See Note 2 for a discussion of the related receivables due from our insurance companies.
Mr. Greg L. Armstrong is the Chairman of the Board and Chief Executive Officer of Plains All American GP LLC (“PAA”). Mr. Armstrong was a director of our General Partner until March 26, 2008 when his resignation became effective. We sell all of the crude oil produced from our Florida properties to Plains Marketing, L.P. (“Plains Marketing”), a wholly owned subsidiary of PAA. In 2008, prior to Mr. Armstrong’s resignation on March 26, 2008, we sold $19.3 million of our crude oil to Plains Marketing.
7. Inventory
In Florida, crude oil inventory was $7.3 million and $5.8 million at December 31, 2010 and 2009, respectively. For the year ended December 31, 2010, we sold 689 MBbls of crude oil and produced 734 MBbls from our Florida operations. For the year ended December 31, 2009, we sold 529 MBbls of crude oil and produced 590 MBbls from our Florida operations. Crude oil sales are a function of the number and size of crude oil shipments in each quarter and thus crude oil sales do not always coincide with volumes produced in a given quarter. Crude oil inventory additions are at cost and represent our production costs. We match production expenses with crude oil sales. Production expenses associated with unsold crude oil inventory are recorded to
inventory.
We carry inventory at the lower of cost or market. When using lower of cost or market to value inventory, market should not exceed the net realizable value or the estimated selling price less costs of completion and disposal. We assessed our crude-oil inventory at December 31, 2010 and December 31, 2009 and determined that the carrying value of our inventory was below market value and, therefore, no write-down was necessary.
F-20
For our properties in Florida, there are a limited number of alternative methods of transportation for our production. Substantially all of our oil production is transported by pipelines, trucks and barges owned by third parties. The inability or unwillingness of these parties to provide transportation services for a reasonable fee could result in our having to find transportation alternatives, increased transportation costs, or involuntary curtailment of our oil production, which could have a negative impact on our future consolidated financial position, results of operations and cash flows.
8. Intangibles
In May 2007, we acquired certain interests in oil leases and related assets through the acquisition of a limited liability company from Calumet Florida, L.L.C. As part of this acquisition, we assumed certain crude oil sales contracts for the remainder of 2007 and for 2008 through 2010. A $3.4 million intangible asset was established to value the portion of the crude oil contracts that were above market at closing in the purchase price allocation. Realized gains or losses from these contracts are recognized as part of oil sales and the intangible asset will be amortized over the life of the contracts. Amortization expense of $0.5 million and $1.0 million for the years ended December 31, 2010 and 2009, respectively, is included in the oil,
natural gas and natural gas liquid sales on the consolidated statements of operations. As of December 31, 2010 our intangible asset related to these crude oil sales contracts was fully amortized and as of December 31, 2009, it was $0.5 million.
In November 2007, we acquired oil and gas properties and facilities from Quicksilver. Included in the Quicksilver purchase price was a $5.2 million intangible asset related to retention bonuses. In connection with the acquisition, we entered into an agreement with Quicksilver which provides for Quicksilver to fund retention bonuses payable to 139 former Quicksilver employees in the event these employees remain continuously employed by BreitBurn Management from November 1, 2007 through November 1, 2009 or in the event of termination without cause, disability or death. Amortization expense of $1.8 million and $2.1 million for 2009 and 2008, respectively, is included in operating costs on the consolidated statements of operations. As of
December 31, 2009, the intangible asset related to these retention bonuses was fully amortized.
9. Equity Investments
We had equity investments at December 31, 2010 and December 31, 2009 of $7.7 million and $8.2 million, respectively which primarily represent investments in natural gas processing facilities. For the years ended December 31, 2010 and 2009, we recorded $0.7 million and less than $0.1 million, respectively, in earnings from equity investments and $1.2 million and $1.4 million, respectively, in dividends. Earnings from equity investments are reported in the other revenue, net line on the consolidated statements of operations.
At December 31, 2010, our equity investments consisted primarily of a 24.5% limited partner interest and a 25.5% general partner interest in Wilderness Energy Services LP, with a combined carrying value of $6.5 million. The remaining $1.2 million consists of smaller interests in several other investments.
10. Impairments and Price Related Depletion and Depreciation Adjustments
We assess our developed and undeveloped oil and gas properties and other long-lived assets for possible impairment whenever events or changes in circumstances indicate that the carrying value of the assets may not be recoverable. Such indicators include changes in business plans, changes in commodity prices and, for crude oil and natural gas properties, significant downward revisions of estimated proved-reserve quantities. If the carrying value of an asset exceeds the future undiscounted cash flows expected from the asset, an impairment charge is recorded for the excess of carrying value of the asset over its estimated fair value.
Determination as to whether and how much an asset is impaired involves management estimates on highly uncertain matters such as future commodity prices, the effects of inflation and technology improvements on operating expenses, production profiles, and the outlook for market supply and demand conditions for crude oil and natural gas. The impairment reviews and calculations are based on assumptions that are consistent with our business plans. During the year ended December 31, 2010 we recorded impairments of approximately $6.3 million related to our Eastern region properties, including a $4.2 million write-down of uneconomic proved properties and a $2.1 million write-down of expired unproved lease properties.
For the year ended December 31 2009, we reviewed our long-lived oil and gas assets and did not record any material impairments or price related adjustments to depletion and depreciation expense.
F-21
The low commodity price environment that existed at December 31, 2008 influenced our future commodity price projections. As a result, the expected discounted cash flows for many of our fields (i.e., fair values) were negatively impacted resulting in a charge to depletion and depreciation expense of approximately $51.9 million for oil and gas property impairments for the year ended December 31, 2008. Lower commodity prices during 2008, also negatively impacted our oil and gas reserves, resulting in significant price related adjustments to our depletion and depreciation expense. These price related reserve reductions resulted in additional depletion and depreciation charges of approximately
$34.5 million for the year ended December 31, 2008.
An estimate as to the sensitivity to earnings for these periods if other assumptions had been used in impairment reviews and calculations is not practicable, given the number of assumptions involved in the estimates. That is, favorable changes to some assumptions might have avoided the need to impair any assets in these periods, whereas unfavorable changes might have caused an additional unknown number of other assets to become impaired.
11. Long-Term Debt
Senior Notes Due 2020
On October 6, 2010, we and BreitBurn Finance Corporation (the “Issuers”), and certain of our subsidiaries, as guarantors (the “Guarantors”), issued $305 million in aggregate principal amount of 8.625% Senior Notes due 2020 (the “Senior Notes”). The Senior Notes were not registered under the Securities Act of 1933, as amended (the “Securities Act”), or any state securities laws, and unless so registered, the Senior Notes may not be offered or sold in the United States except pursuant to an exemption from, or in a transaction not subject to, the Securities Act and applicable state securities laws. The Senior Notes were sold pursuant to a private placement exemption from the Securities Act to a
group of initial purchasers (“Initial Purchasers”) and then resold to qualified institut ional buyers pursuant to Rule 144A under the Securities Act and to persons outside the United States pursuant to Regulation 5 under the Securities Act. We received net proceeds of approximately $291.2 million (after deducting estimated fees and offering expenses). We used $290 million of the net proceeds to repay amounts outstanding under our credit facility. In connection with the Senior Notes, we incurred financing fees and expenses of approximately $8.8 million, which will be amortized over the life of the Senior Notes. The Senior Notes were offered at a discount price of 98.358%, or $300 million. The $5 million discount will be amortized over the life of the Senior Notes.
In connection with the issuance of the Senior Notes, we entered into a Registration Rights Agreement (the “Registration Rights Agreement”) with the Guarantors and Initial Purchasers. Under the Registration Rights Agreement, the Issuers and the Guarantors agreed to cause to be filed with the Securities and Exchange Commission (the “SEC”) a registration statement with respect to an offer to exchange the Senior Notes for substantially identical notes that are registered under the Securities Act. The Issuers and the Guarantors agreed to use their commercially reasonable efforts to cause such exchange offer registration statement to become effective under the Securities Act. In addition, the Issuers and the Guarantors
agreed to use their commercially reasonable efforts to cause the exchange offer to be consummated not later than 400 days after October 6, 2010. See Note 21 for a discussion of the registration statement on Form S-4 filed on January 19, 2011.
As of December 31, 2010, the Senior Notes had a carrying value of $300.1 million, net of unamortized discount of $4.9 million. As of December 31, 2010, the fair value of our Senior Notes was estimated to be $306.5 million, based on prices quoted from third-party financial institutions.
Credit Facility
On November 1, 2007, in connection with the Quicksilver Acquisition, BOLP, as borrower, and we and our wholly owned subsidiaries, as guarantors, entered into a four year, $1.5 billion amended and restated revolving credit facility with Wells Fargo Bank, N.A., Credit Suisse Securities (USA) LLC and a syndicate of banks (the “Amended and Restated Credit Agreement”).
The initial borrowing base of the Amended and Restated Credit Agreement was $700 million and was increased to $750 million on April 10, 2008. On June 17, 2008, we and our wholly owned subsidiaries entered into Amendment No. 1 to the Amended and Restated Credit Agreement, with Wells Fargo Bank, National Association, as administrative agent (the “Agent”). Amendment No. 1 to the Credit Agreement increased the borrowing base available under the Amended and Restated Credit Agreement, from $750 million to $900 million.
F-22
In April 2009, our borrowing base under our Amended and Restated Credit Agreement was redetermined at $760 million, primarily as a result of the steep decline in oil and natural gas prices. During January and June 2009, we monetized certain in-the-money commodity hedges for approximately $46 million and $25 million, respectively, the net proceeds of which were used to reduce outstanding borrowings under our credit facility. As a result of the monetization, our borrowing base was reset at $735 million. On July 17, 2009, we sold the Lazy JL Field for $23 million in cash. The proceeds from this transaction were used to reduce outstanding borrowings under our credit facility and our borrowing base was reduced by $3 million to $732 million. In
October 2009, in connection with our semi-annual borrowing base redetermination, our borrowing base was reaffirmed at $732 million.
On May 7, 2010, BOLP, as borrower, and we and our wholly-owned subsidiaries, as guarantors, entered into the Second Amended and Restated Credit Agreement, a four-year, $1.5 billion revolving credit facility with Wells Fargo Bank, National Association, as Administrative Agent, Swing Line Lender and Issuing Lender, and a syndicate of banks (the “Second Amended and Restated Credit Agreement”). The Second Amended and Restated Credit Agreement increased our borrowing base from $732 to $735 million and will mature on May 7, 2014.
On September 17, 2010, we entered into the First Amendment to the Second Amended and Restated Credit Agreement, which included a consent to the formation of a new wholly owned subsidiary, Utica, and its designation as an unrestricted subsidiary under our credit facility. Utica is not a guarantor of indebtedness under our credit facility.
On October 5, 2010, our borrowing base was reaffirmed at $735 million, and, as a result of the issuance of the Senior Notes on October 6, 2010, our borrowing base was automatically reduced to $658.8 million. Our next semi-annual borrowing base redetermination is scheduled for April 2011.
As of December 31, 2010 and December 31, 2009, we had $228.0 million and $559.0 million, respectively, in indebtedness outstanding under the credit facility. At December 31, 2010, the 1-month LIBOR interest rate plus an applicable spread was 2.520% on the 1-month LIBOR portion of $221.0 million and the prime rate plus an applicable spread was 4.500% on the prime debt portion of $7.0 million. The amounts reported on our consolidated balance sheets for long-term debt approximate fair value due to the variable nature of our interest rates.
Borrowings under the Second Amended and Restated Credit Agreement are secured by first-priority liens on and security interests in substantially all of our and certain of our subsidiaries’ assets, representing not less than 80% of the total value of our oil and gas properties.
The Second Amended and Restated Credit Agreement contains customary covenants, including restrictions on our ability to: incur additional indebtedness; make certain investments, loans or advances; make distributions to our unitholders or repurchase units (including the restriction on our ability to make distributions unless after giving effect to such distribution, the availability to borrow under the facility is the lesser of (i) 10% of the borrowing base and (ii) the greater of (a) $50 million and (b) twice the amount of the proposed distribution), while remaining in compliance with all terms and conditions of our credit facility, including the leverage ratio not exceeding 3.75 to 1.00 (which is total indebtedness to EBITDAX); make
dispositions or enter into sales and leasebacks; or enter into a merger or sale of our property or assets , including the sale or transfer of interests in our subsidiaries.
EBITDAX is not a defined GAAP measure. The Second Amended and Restated Credit Agreement defines EBITDAX as consolidated net income plus exploration expense, interest expense, income tax provision, depletion, depreciation and amortization, unrealized loss or gain on derivative instruments, non-cash charges, including non-cash unit based compensation expense, loss or gain on sale of assets (excluding gain or loss on monetization of derivative instruments), cumulative effect of changes in accounting principles, cash distributions received from our unrestricted entities (as defined in the Second Amended and Restated Credit Agreement) and BEPI and excluding income from our unrestricted entities and BEPI.
The Second Amended and Restated Credit Agreement no longer requires that in order to make a distribution to our unitholders, we also must have the ability to borrow 10% of our borrowing base after giving effect to such distribution, and remain in compliance with all terms and conditions of our credit facility. In addition, the requirement that we maintain a leverage ratio (defined as the ratio of total debt to EBITDAX) as of the last day of each quarter, on a last twelve month basis of no more than 3.50 to 1.00 was increased to 3.75 to 1.00. The Second Amended and Restated Credit Agreement continues to require us to maintain a current ratio as of the last day of each quarter, of not less than 1.00 to 1.00 and to maintain an interest
coverage ratio (defined as the ratio of EBITDAX to consolidated interest expense) as of the last day of ea ch quarter, of not less than 2.75 to 1.00. As of December 31, 2010 and December 31, 2009, we were in compliance with the credit facility’s covenants.
F-23
The pricing grid was adjusted by increasing the applicable margins (as defined in the Second Amended and Restated Credit Agreement) between 75 and 100 basis points, depending on the percentage of the borrowing base borrowed, in line with the current credit market for similar facilities. Prior to the issuance of the Senior Notes on October 6, 2010, the Second Amended and Restated Credit Agreement permitted us to incur or guaranty additional debt up to $350 million in senior unsecured notes, and required that our borrowing base be reduced by 25% of the original stated principal amount of such senior unsecured notes when we incur such additional indebtedness. As a result of the issuance of the Senior Notes on October 6, 2010, our borrowing
base was automatically reduced to $658.8 million.
The Second Amended and Restated Credit Agreement also permits us to terminate derivative contracts without obtaining the consent of the lenders in the facility, provided that the net effect of such termination plus the aggregate value of all dispositions of oil and gas properties made during such period, together, does not exceed 5% of the borrowing base, and the borrowing base will be automatically reduced by an amount equal to the net effect of the termination.
The events that constitute an Event of Default (as defined in the Second Amended and Restated Credit Agreement) include: payment defaults; misrepresentations; breaches of covenants; cross-default and cross-acceleration to certain other indebtedness; adverse judgments against us in excess of a specified amount; changes in management or control; loss of permits; certain insolvency events; and assertion of certain environmental claims.
Interest Expense
Our interest expense is detailed in the following table:
|
Year Ended December 31,
|
||||||||||||
|
Thousands of dollars
|
2010
|
2009
|
2008
|
|||||||||
|
Credit facility (including commitment fees)
|
$ | 13,060 | $ | 15,532 | $ | 26,534 | ||||||
|
Senior notes
|
6,284 | - | - | |||||||||
|
Amortization of discount and deferred issuance costs
|
5,478 | 3,295 | 2,613 | |||||||||
|
Capitalized interest
|
(270 | ) | - | - | ||||||||
|
Total
|
$ | 24,552 | $ | 18,827 | $ | 29,147 | ||||||
|
Cash paid for interest
|
$ | 23,755 | $ | 28,350 | $ | 29,767 | ||||||
F-24
12. Condensed Consolidating Financial Statements
Given that certain, but not all, of our subsidiaries have issued full, unconditional and joint and several guarantees of our Senior Notes, in accordance with Rule 3-10(d) of Regulation S-X, the following presents condensed consolidating financial information as of December 31, 2010 and 2009, and for the years ended December 31, 2010, 2009 and 2008 on a parent/co-issuer, guarantor subsidiaries, non-guarantor subsidiaries, eliminating entries, and consolidated basis. Eliminating entries presented are necessary to combine the parent/co-issuer, guarantor subsidiaries and non-guarantor subsidiaries. For purposes of the following tables, we and BreitBurn Finance Corporation are referred to as “Parent/Co-Issuer” and the
“Guarantor Subsidiaries” are all of our subsidiaries other than BEPI and Utica (together the “No n-Guarantor Subsidiaries”).
Condensed Consolidating Statements of Operations
|
Year Ended December 31, 2010
|
||||||||||||||||||||
|
Thousands of dollars
|
Parent/
Co-Issuer
|
Combined
Guarantor
Subsidiaries
|
Combined
Non-Guarantor
Subsidiaries
|
Eliminations
|
Consolidated
|
|||||||||||||||
|
Revenues and other income items:
|
||||||||||||||||||||
|
Oil, natural gas and natural gas liquid sales
|
$ | - | $ | 293,432 | $ | 24,306 | $ | - | $ | 317,738 | ||||||||||
|
Loss on commodity derivative instruments, net
|
- | 35,112 | - | - | 35,112 | |||||||||||||||
|
Other revenue, net
|
- | 2,498 | - | - | 2,498 | |||||||||||||||
|
Total revenues and other income items
|
- | 331,042 | 24,306 | - | 355,348 | |||||||||||||||
|
Operating costs and expenses:
|
||||||||||||||||||||
|
Operating costs
|
- | 132,701 | 9,824 | - | 142,525 | |||||||||||||||
|
Depletion, depreciation and amortization
|
416 | 99,874 | 2,468 | - | 102,758 | |||||||||||||||
|
General and administrative expenses
|
443 | 44,448 | 16 | - | 44,907 | |||||||||||||||
|
Loss on sale of assets
|
- | 14 | - | - | 14 | |||||||||||||||
|
Unreimbursed litigation costs
|
- | 1,401 | - | - | 1,401 | |||||||||||||||
|
Total operating costs and expenses
|
859 | 278,438 | 12,308 | - | 291,605 | |||||||||||||||
|
Operating income (loss)
|
(859 | ) | 52,604 | 11,998 | - | 63,743 | ||||||||||||||
|
Interest expense, net
|
6,628 | 17,924 | - | - | 24,552 | |||||||||||||||
|
Loss on interest rate swaps
|
- | 4,490 | - | - | 4,490 | |||||||||||||||
|
Other income, net
|
- | (6 | ) | (2 | ) | - | (8 | ) | ||||||||||||
|
Income (loss) before taxes
|
(7,487 | ) | 30,196 | 12,000 | - | 34,709 | ||||||||||||||
|
Income tax expense (benefit)
|
(27 | ) | (178 | ) | 1 | - | (204 | ) | ||||||||||||
|
Equity in earnings of subsidiaries
|
42,253 | 11,879 | - | (54,132 | ) | - | ||||||||||||||
|
Net income
|
34,793 | 42,253 | 11,999 | (54,132 | ) | 34,913 | ||||||||||||||
|
Less: Net income attributable to noncontrolling interest
|
- | - | - | (162 | ) | (162 | ) | |||||||||||||
|
Net income attributable to the partnership
|
$ | 34,793 | $ | 42,253 | $ | 11,999 | $ | (54,294 | ) | $ | 34,751 | |||||||||
F-25
Condensed Consolidating Statements of Operations
|
Year Ended December 31, 2009
|
||||||||||||||||||||
|
Thousands of dollars
|
Parent/
Co-Issuer
|
Combined
Guarantor
Subsidiaries
|
Non-
Guarantor
Subsidiary
|
Eliminations
|
Consolidated
|
|||||||||||||||
|
Revenues and other income items:
|
||||||||||||||||||||
|
Oil, natural gas and natural gas liquid sales
|
$ | - | $ | 236,266 | $ | 18,651 | $ | - | $ | 254,917 | ||||||||||
|
Loss on commodity derivative instruments, net
|
- | (51,437 | ) | - | - | (51,437 | ) | |||||||||||||
|
Other revenue, net
|
- | 1,382 | - | - | 1,382 | |||||||||||||||
|
Total revenues and other income items
|
- | 186,211 | 18,651 | - | 204,862 | |||||||||||||||
|
Operating costs and expenses:
|
||||||||||||||||||||
|
Operating costs
|
11 | 129,542 | 8,945 | - | 138,498 | |||||||||||||||
|
Depletion, depreciation and amortization
|
387 | 104,274 | 2,182 | - | 106,843 | |||||||||||||||
|
General and administrative expenses
|
482 | 35,890 | (5 | ) | - | 36,367 | ||||||||||||||
|
Loss on sale of assets
|
- | 5,965 | - | - | 5,965 | |||||||||||||||
|
Total operating costs and expenses
|
880 | 275,671 | 11,122 | - | 287,673 | |||||||||||||||
|
Operating income (loss)
|
(880 | ) | (89,460 | ) | 7,529 | - | (82,811 | ) | ||||||||||||
|
Interest expense, net
|
- | 18,827 | - | - | 18,827 | |||||||||||||||
|
Loss on interest rate swaps
|
- | 7,246 | - | - | 7,246 | |||||||||||||||
|
Other income, net
|
- | (98 | ) | (1 | ) | - | (99 | ) | ||||||||||||
|
Income (loss) before taxes
|
(880 | ) | (115,435 | ) | 7,530 | - | (108,785 | ) | ||||||||||||
|
Income tax expense (benefit)
|
61 | (1,590 | ) | 1 | - | (1,528 | ) | |||||||||||||
|
Equity in earnings (losses) of subsidiaries
|
(106,391 | ) | 7,454 | - | 98,937 | - | ||||||||||||||
|
Net income (loss)
|
(107,332 | ) | (106,391 | ) | 7,529 | 98,937 | (107,257 | ) | ||||||||||||
|
Less: Net income attributable to noncontrolling interest
|
- | - | - | (33 | ) | (33 | ) | |||||||||||||
|
Net income (loss) attributable to the partnership
|
$ | (107,332 | ) | $ | (106,391 | ) | $ | 7,529 | $ | 98,904 | $ | (107,290 | ) | |||||||
F-26
Condensed Consolidating Statements of Operations
|
Year Ended December 31, 2008
|
||||||||||||||||||||
|
Thousands of dollars
|
Parent/
Co-Issuer
|
Combined
Guarantor
Subsidiaries
|
Non-
Guarantor
Subsidiary
|
Eliminations
|
Consolidated
|
|||||||||||||||
|
Revenues and other income items:
|
||||||||||||||||||||
|
Oil, natural gas and natural gas liquid sales
|
$ | - | $ | 437,883 | $ | 29,498 | $ | - | $ | 467,381 | ||||||||||
|
Gain on commodity derivative instruments, net
|
- | 332,102 | - | - | 332,102 | |||||||||||||||
|
Other revenue, net
|
- | 3,439 | (519 | ) | - | 2,920 | ||||||||||||||
|
Total revenues and other income items
|
- | 773,424 | 28,979 | - | 802,403 | |||||||||||||||
|
Operating costs and expenses:
|
||||||||||||||||||||
|
Operating costs
|
- | 152,673 | 9,332 | - | 162,005 | |||||||||||||||
|
Depletion, depreciation and amortization
|
211 | 177,641 | 2,081 | - | 179,933 | |||||||||||||||
|
General and administrative expenses
|
767 | 29,862 | (18 | ) | - | 30,611 | ||||||||||||||
|
Unreimbursed litigation costs
|
- | 500 | - | - | 500 | |||||||||||||||
|
Total operating costs and expenses
|
978 | 360,676 | 11,395 | - | 373,049 | |||||||||||||||
|
Operating income (loss)
|
(978 | ) | 412,748 | 17,584 | - | 429,354 | ||||||||||||||
|
Interest expense, net
|
- | 29,147 | - | - | 29,147 | |||||||||||||||
|
Loss on interest rate swaps
|
- | 20,035 | - | - | 20,035 | |||||||||||||||
|
Other income, net
|
- | (100 | ) | (91 | ) | - | (191 | ) | ||||||||||||
|
Income (loss) before taxes
|
(978 | ) | 363,666 | 17,675 | - | 380,363 | ||||||||||||||
|
Income tax expense
|
1 | 1,936 | 2 | - | 1,939 | |||||||||||||||
|
Equity in earnings of subsidiaries
|
379,226 | 17,496 | - | (396,722 | ) | - | ||||||||||||||
|
Net income
|
378,247 | 379,226 | 17,673 | (396,722 | ) | 378,424 | ||||||||||||||
|
Less: Net income attributable to noncontrolling interest
|
- | - | - | (188 | ) | (188 | ) | |||||||||||||
|
Net income attributable to the partnership
|
378,247 | 379,226 | 17,673 | (396,910 | ) | 378,236 | ||||||||||||||
|
General Partner's interest in net loss
|
(2,019 | ) | - | - | - | (2,019 | ) | |||||||||||||
|
Net income attributable to limited partners
|
$ | 380,266 | $ | 379,226 | $ | 17,673 | $ | (396,910 | ) | $ | 380,255 | |||||||||
F-27
Condensed Consolidating Balance Sheets
|
As of December 31, 2010
|
||||||||||||||||||||
|
Thousands of dollars
|
Parent/
Co-Issuer
|
Combined
Guarantor
Subsidiaries
|
Combined
Non-Guarantor
Subsidiaries
|
Eliminations
|
Consolidated
|
|||||||||||||||
|
ASSETS
|
||||||||||||||||||||
|
Current assets:
|
||||||||||||||||||||
|
Cash
|
$ | 70 | $ | 1,836 | $ | 1,724 | $ | - | $ | 3,630 | ||||||||||
|
Accounts and other receivables, net
|
10,000 | 41,945 | 1,575 | - | 53,520 | |||||||||||||||
|
Derivative instruments
|
- | 54,752 | - | - | 54,752 | |||||||||||||||
|
Related party receivables
|
- | 4,345 | - | - | 4,345 | |||||||||||||||
|
Inventory
|
- | 7,321 | - | - | 7,321 | |||||||||||||||
|
Prepaid expenses
|
877 | 5,572 | - | - | 6,449 | |||||||||||||||
|
Total current assets
|
10,947 | 115,771 | 3,299 | - | 130,017 | |||||||||||||||
|
Investments in subsidiaries
|
1,243,910 | 30,647 | - | (1,274,557 | ) | - | ||||||||||||||
|
Intercompany receivables (payables)
|
245,323 | (242,011 | ) | (3,312 | ) | - | - | |||||||||||||
|
Equity investments
|
- | 7,700 | - | - | 7,700 | |||||||||||||||
|
Property, plant and equipment
|
||||||||||||||||||||
|
Oil and gas properties
|
8,467 | 2,076,074 | 48,558 | - | 2,133,099 | |||||||||||||||
|
Other assets
|
- | 10,832 | - | - | 10,832 | |||||||||||||||
| 8,467 | 2,086,906 | 48,558 | - | 2,143,931 | ||||||||||||||||
|
Accumulated depletion and depreciation
|
(1,014 | ) | (408,850 | ) | (11,772 | ) | - | (421,636 | ) | |||||||||||
|
Net property, plant and equipment
|
7,453 | 1,678,056 | 36,786 | - | 1,722,295 | |||||||||||||||
|
Other long-term assets
|
||||||||||||||||||||
|
Derivative instruments
|
- | 50,652 | - | - | 50,652 | |||||||||||||||
|
Other long-term assets
|
7,746 | 11,681 | 76 | - | 19,503 | |||||||||||||||
|
Total assets
|
$ | 1,515,379 | $ | 1,652,496 | $ | 36,849 | $ | (1,274,557 | ) | $ | 1,930,167 | |||||||||
|
LIABILITIES AND EQUITY
|
||||||||||||||||||||
|
Current liabilities:
|
||||||||||||||||||||
|
Accounts payable
|
$ | 6,300 | $ | 19,566 | $ | 942 | $ | - | $ | 26,808 | ||||||||||
|
Derivative instruments
|
- | 37,071 | - | - | 37,071 | |||||||||||||||
|
Related party payables
|
- | - | - | - | - | |||||||||||||||
|
Revenue and royalties payable
|
- | 15,016 | 1,411 | - | 16,427 | |||||||||||||||
|
Salaries and wages payable
|
- | 12,594 | - | - | 12,594 | |||||||||||||||
|
Accrued liabilities
|
- | 7,912 | 505 | - | 8,417 | |||||||||||||||
|
Total current liabilities
|
6,300 | 92,159 | 2,858 | - | 101,317 | |||||||||||||||
|
Credit facility
|
- | 228,000 | - | - | 228,000 | |||||||||||||||
|
Senior notes, net
|
300,116 | - | - | - | 300,116 | |||||||||||||||
|
Deferred income taxes
|
- | 2,089 | - | - | 2,089 | |||||||||||||||
|
Asset retirement obligation
|
- | 44,379 | 3,050 | - | 47,429 | |||||||||||||||
|
Derivative instruments
|
- | 39,722 | - | - | 39,722 | |||||||||||||||
|
Other long-term liabilities
|
- | 2,237 | - | - | 2,237 | |||||||||||||||
|
Total liabilities
|
306,416 | 408,586 | 5,908 | - | 720,910 | |||||||||||||||
|
Equity:
|
||||||||||||||||||||
|
Partners' equity
|
1,208,963 | 1,243,910 | 30,941 | (1,275,011 | ) | 1,208,803 | ||||||||||||||
|
Noncontrolling interest
|
- | - | - | 454 | 454 | |||||||||||||||
|
Total equity
|
1,208,963 | 1,243,910 | 30,941 | (1,274,557 | ) | 1,209,257 | ||||||||||||||
|
Total liabilities and equity
|
$ | 1,515,379 | $ | 1,652,496 | $ | 36,849 | $ | (1,274,557 | ) | $ | 1,930,167 | |||||||||
F-28
Condensed Consolidating Balance Sheets
|
As of December 31, 2009
|
||||||||||||||||||||
|
Thousands of dollars
|
Parent/
Co-Issuer
|
Combined
Guarantor
Subsidiaries
|
Non-
Guarantor
Subsidiary
|
Eliminations
|
Consolidated
|
|||||||||||||||
|
ASSETS
|
||||||||||||||||||||
|
Current assets:
|
||||||||||||||||||||
|
Cash
|
$ | 149 | $ | 4,917 | $ | 700 | $ | - | $ | 5,766 | ||||||||||
|
Accounts and other receivables, net
|
13,000 | 50,196 | 2,013 | - | 65,209 | |||||||||||||||
|
Derivative instruments
|
- | 57,133 | - | - | 57,133 | |||||||||||||||
|
Related party receivables
|
- | 2,127 | - | - | 2,127 | |||||||||||||||
|
Inventory
|
- | 5,823 | - | - | 5,823 | |||||||||||||||
|
Prepaid expenses
|
- | 5,888 | - | - | 5,888 | |||||||||||||||
|
Intangibles
|
- | 495 | - | - | 495 | |||||||||||||||
|
Total current assets
|
13,149 | 126,579 | 2,713 | - | 142,441 | |||||||||||||||
|
Investments in subsidiaries
|
1,201,492 | 47,074 | - | (1,248,566 | ) | - | ||||||||||||||
|
Intercompany receivables (payables)
|
18,743 | (32,209 | ) | 13,466 | - | - | ||||||||||||||
|
Equity investments
|
- | 8,150 | - | - | 8,150 | |||||||||||||||
|
Property, plant and equipment
|
||||||||||||||||||||
|
Oil and gas properties
|
8,467 | 2,005,619 | 44,882 | - | 2,058,968 | |||||||||||||||
|
Non-oil and gas assets
|
- | 7,717 | - | - | 7,717 | |||||||||||||||
| 8,467 | 2,013,336 | 44,882 | - | 2,066,685 | ||||||||||||||||
|
Accumulated depletion and depreciation
|
(597 | ) | (315,567 | ) | (9,432 | ) | - | (325,596 | ) | |||||||||||
|
Net property, plant and equipment
|
7,870 | 1,697,769 | 35,450 | - | 1,741,089 | |||||||||||||||
|
Other long-term assets
|
||||||||||||||||||||
|
Derivative instruments
|
- | 74,759 | - | - | 74,759 | |||||||||||||||
|
Other long-term assets
|
74 | 4,459 | 57 | - | 4,590 | |||||||||||||||
|
Total assets
|
$ | 1,241,328 | $ | 1,926,581 | $ | 51,686 | $ | (1,248,566 | ) | $ | 1,971,029 | |||||||||
|
LIABILITIES AND EQUITY
|
||||||||||||||||||||
|
Current liabilities:
|
||||||||||||||||||||
|
Accounts payable
|
$ | 2 | $ | 20,386 | $ | 926 | $ | - | $ | 21,314 | ||||||||||
|
Derivative instruments
|
- | 20,057 | - | - | 20,057 | |||||||||||||||
|
Related party payables
|
13,000 | - | - | - | 13,000 | |||||||||||||||
|
Revenue and royalties payable
|
- | 16,888 | 1,336 | - | 18,224 | |||||||||||||||
|
Salaries and wages payable
|
- | 10,244 | - | - | 10,244 | |||||||||||||||
|
Accrued liabilities
|
- | 8,531 | 520 | - | 9,051 | |||||||||||||||
|
Total current liabilities
|
13,002 | 76,106 | 2,782 | - | 91,890 | |||||||||||||||
|
Long-term debt
|
- | 559,000 | - | - | 559,000 | |||||||||||||||
|
Deferred income taxes
|
- | 2,492 | - | - | 2,492 | |||||||||||||||
|
Asset retirement obligation
|
- | 35,280 | 1,355 | - | 36,635 | |||||||||||||||
|
Derivative instruments
|
- | 50,109 | - | - | 50,109 | |||||||||||||||
|
Other long-term liabilities
|
- | 2,102 | - | - | 2,102 | |||||||||||||||
|
Total liabilities
|
13,002 | 725,089 | 4,137 | - | 742,228 | |||||||||||||||
|
Equity:
|
||||||||||||||||||||
|
Partners' equity
|
1,228,326 | 1,201,492 | 47,549 | (1,248,994 | ) | 1,228,373 | ||||||||||||||
|
Noncontrolling interest
|
- | - | - | 428 | 428 | |||||||||||||||
|
Total equity
|
1,228,326 | 1,201,492 | 47,549 | (1,248,566 | ) | 1,228,801 | ||||||||||||||
|
Total liabilities and equity
|
$ | 1,241,328 | $ | 1,926,581 | $ | 51,686 | $ | (1,248,566 | ) | $ | 1,971,029 | |||||||||
F-29
Condensed Consolidating Statements of Cash Flows
|
Year Ended December 31, 2010
|
||||||||||||||||||||
|
Thousands of dollars
|
Parent/
Co-Issuer
|
Combined
Guarantor
Subsidiaries
|
Combined
Non-Guarantor
Subsidiaries
|
Eliminations
|
Consolidated
|
|||||||||||||||
|
Cash flows from operating activities
|
||||||||||||||||||||
|
Net income
|
$ | 34,793 | $ | 42,253 | $ | 11,999 | $ | (54,132 | ) | $ | 34,913 | |||||||||
|
Adjustments to reconcile net income to cash flow from operating activities:
|
||||||||||||||||||||
|
Depletion, depreciation and amortization
|
416 | 99,874 | 2,468 | - | 102,758 | |||||||||||||||
|
Unit-based compensation expense
|
- | 20,422 | - | - | 20,422 | |||||||||||||||
|
Unrealized loss on derivative instruments
|
- | 33,116 | - | - | 33,116 | |||||||||||||||
|
Income from equity affiliates, net
|
- | 450 | - | - | 450 | |||||||||||||||
|
Equity in earnings of subsidiaries
|
(42,253 | ) | (11,879 | ) | - | 54,132 | - | |||||||||||||
|
Deferred income taxes
|
- | (403 | ) | - | - | (403 | ) | |||||||||||||
|
Amortization of intangibles
|
- | 495 | - | - | 495 | |||||||||||||||
|
Loss on sale of assets
|
- | 14 | - | - | 14 | |||||||||||||||
|
Other
|
343 | 3,185 | - | - | 3,528 | |||||||||||||||
|
Changes in net assets and liabilities:
|
- | |||||||||||||||||||
|
Accounts receivable and other assets
|
3,000 | 8,133 | 419 | - | 11,552 | |||||||||||||||
|
Inventory
|
- | (1,498 | ) | - | - | (1,498 | ) | |||||||||||||
|
Net change in related party receivables and payables
|
(13,000 | ) | (2,218 | ) | - | - | (15,218 | ) | ||||||||||||
|
Accounts payable and other liabilities
|
6,299 | (14,525 | ) | 119 | - | (8,107 | ) | |||||||||||||
|
Net cash provided by operating activities
|
(10,402 | ) | 177,419 | 15,005 | - | 182,022 | ||||||||||||||
|
Cash flows from investing activities
|
||||||||||||||||||||
|
Capital expenditures
|
- | (64,795 | ) | (2,152 | ) | - | (66,947 | ) | ||||||||||||
|
Proceeds from sale of assets, net
|
- | 337 | - | - | 337 | |||||||||||||||
|
Property acquisitions
|
- | (1,676 | ) | - | - | (1,676 | ) | |||||||||||||
|
Net cash used in investing activities
|
- | (66,134 | ) | (2,152 | ) | - | (68,286 | ) | ||||||||||||
|
Cash flows from financing activities
|
||||||||||||||||||||
|
Distributions
|
(65,197 | ) | - | - | - | (65,197 | ) | |||||||||||||
|
Proceeds from the issuance of long-term debt
|
299,992 | 748,000 | - | - | 1,047,992 | |||||||||||||||
|
Repayments of long-term debt
|
- | (1,079,000 | ) | - | - | (1,079,000 | ) | |||||||||||||
|
Book overdraft
|
- | 1,025 | - | - | 1,025 | |||||||||||||||
|
Long-term debt issuance costs
|
(8,767 | ) | (11,925 | ) | - | - | (20,692 | ) | ||||||||||||
|
Intercompany activity
|
(215,705 | ) | 227,534 | (11,829 | ) | - | - | |||||||||||||
|
Net cash used in financing activities
|
10,323 | (114,366 | ) | (11,829 | ) | - | (115,872 | ) | ||||||||||||
|
Increase (decrease) in cash
|
(79 | ) | (3,081 | ) | 1,024 | - | (2,136 | ) | ||||||||||||
|
Cash beginning of period
|
149 | 4,917 | 700 | - | 5,766 | |||||||||||||||
|
Cash end of period
|
$ | 70 | $ | 1,836 | $ | 1,724 | $ | - | $ | 3,630 | ||||||||||
F-30
Condensed Consolidating Statements of Cash Flows
|
Year Ended December 31, 2009
|
||||||||||||||||||||
|
Thousands of dollars
|
Parent/
Co-Issuer
|
Combined
Guarantor
Subsidiaries
|
Non-
Guarantor
Subsidiary
|
Eliminations
|
Consolidated
|
|||||||||||||||
|
Cash flows from operating activities
|
||||||||||||||||||||
|
Net income (loss)
|
$ | (107,332 | ) | $ | (106,391 | ) | $ | 7,529 | $ | 98,937 | $ | (107,257 | ) | |||||||
|
Adjustments to reconcile net income (loss) to cash flow from operating activities:
|
||||||||||||||||||||
|
Depletion, depreciation and amortization
|
387 | 104,274 | 2,182 | - | 106,843 | |||||||||||||||
|
Unit-based compensation expense
|
- | 12,661 | - | - | 12,661 | |||||||||||||||
|
Unrealized loss on derivative instruments
|
- | 213,251 | - | - | 213,251 | |||||||||||||||
|
Income from equity affiliates, net
|
- | 1,302 | - | - | 1,302 | |||||||||||||||
|
Equity in (earnings) losses of subsidiaries
|
106,391 | (7,454 | ) | - | (98,937 | ) | - | |||||||||||||
|
Deferred income taxes
|
- | (1,790 | ) | - | - | (1,790 | ) | |||||||||||||
|
Amortization of intangibles
|
- | 2,771 | - | - | 2,771 | |||||||||||||||
|
Loss on sale of assets
|
- | 5,965 | - | - | 5,965 | |||||||||||||||
|
Other
|
- | 3,294 | - | - | 3,294 | |||||||||||||||
|
Changes in net assets and liabilities:
|
- | |||||||||||||||||||
|
Accounts receivable and other assets
|
- | (5,013 | ) | (1,300 | ) | - | (6,313 | ) | ||||||||||||
|
Inventory
|
- | (4,573 | ) | - | - | (4,573 | ) | |||||||||||||
|
Net change in related party receivables and payables
|
- | 2,957 | - | - | 2,957 | |||||||||||||||
|
Accounts payable and other liabilities
|
- | (5,078 | ) | 325 | - | (4,753 | ) | |||||||||||||
|
Net cash provided by (used in) operating activities
|
(554 | ) | 216,176 | 8,736 | - | 224,358 | ||||||||||||||
|
Cash flows from investing activities
|
||||||||||||||||||||
|
Capital expenditures
|
- | (28,828 | ) | (685 | ) | - | (29,513 | ) | ||||||||||||
|
Proceeds from sale of assets, net
|
- | 23,284 | - | - | 23,284 | |||||||||||||||
|
Net cash used in investing activities
|
- | (5,544 | ) | (685 | ) | - | (6,229 | ) | ||||||||||||
|
Cash flows from financing activities
|
||||||||||||||||||||
|
Distributions
|
(28,038 | ) | - | - | - | (28,038 | ) | |||||||||||||
|
Proceeds from the issuance of long-term debt
|
- | 249,975 | - | - | 249,975 | |||||||||||||||
|
Repayments of long-term debt
|
- | (426,975 | ) | - | - | (426,975 | ) | |||||||||||||
|
Book overdraft
|
- | (9,871 | ) | - | - | (9,871 | ) | |||||||||||||
|
Intercompany activity
|
28,739 | (19,575 | ) | (9,164 | ) | - | - | |||||||||||||
|
Net cash provided by (used in) financing activities
|
701 | (206,446 | ) | (9,164 | ) | - | (214,909 | ) | ||||||||||||
|
Increase (decrease) in cash
|
147 | 4,186 | (1,113 | ) | - | 3,220 | ||||||||||||||
|
Cash beginning of period
|
2 | 731 | 1,813 | - | 2,546 | |||||||||||||||
|
Cash end of period
|
$ | 149 | $ | 4,917 | $ | 700 | $ | - | $ | 5,766 | ||||||||||
F-31
Condensed Consolidating Statements of Cash Flows
|
Year Ended December 31, 2008
|
||||||||||||||||||||
|
Thousands of dollars
|
Parent/
Co-Issuer
|
Combined
Guarantor
Subsidiaries
|
Non-
Guarantor
Subsidiary
|
Eliminations
|
Consolidated
|
|||||||||||||||
|
Cash flows from operating activities
|
||||||||||||||||||||
|
Net income
|
$ | 378,247 | $ | 379,226 | $ | 17,673 | $ | (396,722 | ) | $ | 378,424 | |||||||||
|
Adjustments to reconcile net income to cash flow from operating activities:
|
||||||||||||||||||||
|
Depletion, depreciation and amortization
|
211 | 177,641 | 2,081 | - | 179,933 | |||||||||||||||
|
Unit-based compensation expense
|
- | 6,907 | - | - | 6,907 | |||||||||||||||
|
Unrealized gain on derivative instruments
|
- | (370,734 | ) | - | - | (370,734 | ) | |||||||||||||
|
Income from equity affiliates, net
|
- | 1,198 | - | - | 1,198 | |||||||||||||||
|
Equity in earnings of subsidiaries
|
(379,226 | ) | (17,496 | ) | - | 396,722 | - | |||||||||||||
|
Deferred income taxes
|
- | 1,207 | - | - | 1,207 | |||||||||||||||
|
Amortization of intangibles
|
- | 3,131 | - | - | 3,131 | |||||||||||||||
|
Other
|
- | 2,643 | - | - | 2,643 | |||||||||||||||
|
Changes in net assets and liabilities:
|
- | |||||||||||||||||||
|
Accounts receivable and other assets
|
(71 | ) | (547 | ) | 876 | - | 258 | |||||||||||||
|
Inventory
|
- | 4,454 | - | - | 4,454 | |||||||||||||||
|
Net change in related party receivables and payables
|
- | 32,688 | - | - | 32,688 | |||||||||||||||
|
Accounts payable and other liabilities
|
1 | (13,663 | ) | 249 | - | (13,413 | ) | |||||||||||||
|
Net cash provided by (used in) operating activities
|
(838 | ) | 206,655 | 20,879 | - | 226,696 | ||||||||||||||
|
Cash flows from investing activities
|
||||||||||||||||||||
|
Capital expenditures
|
- | (130,002 | ) | (1,080 | ) | - | (131,082 | ) | ||||||||||||
|
Property acquisitions
|
(8,467 | ) | (1,490 | ) | - | - | (9,957 | ) | ||||||||||||
|
Net cash used in investing activities
|
(8,467 | ) | (131,492 | ) | (1,080 | ) | - | (141,039 | ) | |||||||||||
|
Cash flows from financing activities
|
||||||||||||||||||||
|
Purchase of common units
|
(336,216 | ) | - | - | - | (336,216 | ) | |||||||||||||
|
Distributions
|
(121,349 | ) | - | - | - | (121,349 | ) | |||||||||||||
|
Proceeds from the issuance of long-term debt
|
- | 803,002 | - | - | 803,002 | |||||||||||||||
|
Repayments of long-term debt
|
- | (437,402 | ) | - | - | (437,402 | ) | |||||||||||||
|
Book overdraft
|
- | 7,951 | - | - | 7,951 | |||||||||||||||
|
Long-term debt issuance costs
|
- | (5,026 | ) | - | - | (5,026 | ) | |||||||||||||
|
Intercompany activity
|
466,870 | (443,157 | ) | (23,713 | ) | - | - | |||||||||||||
|
Net cash provided by (used in) financing activities
|
9,305 | (74,632 | ) | (23,713 | ) | - | (89,040 | ) | ||||||||||||
|
Increase (decrease) in cash
|
- | 531 | (3,914 | ) | - | (3,383 | ) | |||||||||||||
|
Cash beginning of period
|
2 | 200 | 5,727 | - | 5,929 | |||||||||||||||
|
Cash end of period
|
$ | 2 | $ | 731 | $ | 1,813 | $ | - | $ | 2,546 | ||||||||||
F-32
13. Income Taxes
We, and all of our subsidiaries, with the exception of Phoenix Production Company (“Phoenix”), Alamitos Company, BreitBurn Management and BreitBurn Finance Corporation, are partnerships or limited liability companies treated as partnerships for federal and state income tax purposes. Essentially all of our taxable income or loss, which may differ considerably from the net income or loss reported for financial reporting purposes, is passed through to the federal income tax returns of our partners. As such, we have not recorded any federal income tax expense for those pass-through entities.
The consolidated income tax expense (benefit) attributable to our tax-paying entities consisted of the following:
|
Year Ended December 31,
|
||||||||||||
|
Thousands of dollars
|
2010
|
2009
|
2008
|
|||||||||
|
Federal income tax expense (benefit)
|
||||||||||||
|
Current
|
$ | 347 | $ | 247 | $ | 257 | ||||||
|
Deferred (a)
|
(403 | ) | (1,790 | ) | 1,207 | |||||||
|
State income tax expense (benefit) (b)
|
(148 | ) | 15 | 475 | ||||||||
|
Total
|
$ | (204 | ) | $ | (1,528 | ) | $ | 1,939 | ||||
(a) Related to Phoenix Production Company, our wholly owned subsidiary.
(b) Primarily in Michigan, California and Texas.
We record income tax expense for Phoenix, a tax-paying corporation, in accordance with FASB Accounting Standards. The following is a reconciliation of federal income taxes at the statutory rates to federal income tax expense (benefit) for Phoenix:
|
Year Ended December 31,
|
||||||||||||
|
Thousands of dollars
|
2010
|
2009
|
2008
|
|||||||||
|
Income (loss) subject to federal income tax
|
$ | (565 | ) | $ | (4,052 | ) | $ | 3,904 | ||||
|
Federal income tax rate
|
34 | % | 34 | % | 34 | % | ||||||
|
Income tax at statutory rate
|
(192 | ) | (1,378 | ) | 1,327 | |||||||
|
Other
|
(13 | ) | (299 | ) | - | |||||||
|
Income tax expense (benefit)
|
$ | (205 | ) | $ | (1,677 | ) | $ | 1,327 | ||||
At December 31, 2010 and 2009, a net deferred federal income tax liability of $2.1 million and $2.5 million, respectively, were reported in our consolidated balance sheet for Phoenix. Deferred income taxes reflect the net tax effect of temporary differences between the carrying amounts of assets and liabilities for financial reporting and the amount used for income tax purposes. Significant components of our net deferred tax liabilities are presented in the following table:
|
December 31,
|
||||||||
|
Thousands of dollars
|
2010
|
2009
|
||||||
|
Deferred tax assets:
|
||||||||
|
Net operating loss carryforwards
|
$ | 154 | $ | 422 | ||||
|
Asset retirement obligation
|
394 | 358 | ||||||
|
Unrealized hedge loss
|
673 | 85 | ||||||
|
Other
|
445 | 276 | ||||||
|
Deferred tax liabilities:
|
||||||||
|
Depreciation, depletion and intangible drilling costs
|
(3,223 | ) | (3,101 | ) | ||||
|
Deferred realized hedge gain
|
(532 | ) | (532 | ) | ||||
|
Net deferred tax liability
|
$ | (2,089 | ) | $ | (2,492 | ) | ||
F-33
At December 31, 2010 and 2009, we had $0.5 million and $1.2 million, respectively, of estimated unused operating loss carry forwards. We did not provide a valuation allowance against this deferred tax asset as we expect sufficient future taxable income to offset the unused operating loss carry forwards.
On a consolidated basis, cash paid for federal and state income taxes totaled $0.2 million in 2010, $0.6 million in 2009 and $0.6 million in 2008.
FASB Accounting Standards clarify the accounting for uncertainty in income taxes recognized in a company’s financial statements. A company can only recognize the tax position in the financial statements if the position is more-likely-than-not to be upheld on audit based only on the technical merits of the tax position. FASB Accounting Standards also provide guidance on thresholds, measurement, derecognition, classification, interest and penalties, accounting in interim periods, disclosure, and transition that is intended to provide better financial statement comparability among different companies.
We performed evaluations as of December 31, 2010 and 2009 and concluded that there were no uncertain tax positions requiring recognition in our financial statements.
14. Asset Retirement Obligation
Our asset retirement obligation is based on our net ownership in wells and facilities and our estimate of the costs to abandon and remediate those wells and facilities as well as our estimate of the future timing of the costs to be incurred. The total undiscounted amount of future cash flows required to settle our asset retirement obligations is estimated to be $264.0 million at December 31, 2010 and was $257.4 million at December 31, 2009. Payments to settle asset retirement obligations occur over the operating lives of the assets, estimated to be from less than one year to 50 years. We expect our cash settlements to be approximately $1.1 million and less than $0.1 million, for the years 2011 and 2012, respectively. Cash settlements for
the years after 2015 are expected to be $46.3 million. Estimated cash flows have been discounted at o ur credit adjusted risk free rate of 7% and adjusted for inflation using a rate of 2%. Our credit adjusted risk free rate is calculated based on our cost of borrowing adjusted for the effect of our credit standing and specific industry and business risk. Each year we review and, to the extent necessary, revise our asset retirement obligation estimates. During 2010, we obtained new estimates to evaluate the cost of abandoning our properties. As a result, we increased our ARO estimates by $9.6 million to reflect recent costs incurred for plugging and abandonment activities primarily in California.
FASB Accounting Standards establish a fair value hierarchy that prioritizes the inputs to valuation techniques into three broad levels based upon how observable those inputs are. The highest priority of Level 1 is given to unadjusted quoted prices in active markets for identical assets or liabilities. Level 2 includes inputs other than quoted prices that are included in Level 1, and can be derived from observable data, including third party data providers. These inputs may also include observable transactions in the market place. Level 3 is given to unobservable inputs. We consider the inputs to our asset retirement obligation valuation to be Level 3 as fair value is determined using discounted cash flow methodologies based on standardized
inputs that are not readily observable in public markets.
Changes in the asset retirement obligation are presented in the following table:
|
Year Ended December 31,
|
||||||||
|
Thousands of dollars
|
2010
|
2009
|
||||||
|
Carrying amount, beginning of period
|
$ | 36,635 | $ | 30,086 | ||||
|
Additions
|
509 | - | ||||||
|
Liabilities settled
|
(1,952 | ) | (470 | ) | ||||
|
Revisions (a)
|
9,611 | 4,883 | ||||||
|
Dispositions (b)
|
- | (252 | ) | |||||
|
Accretion expense
|
2,626 | 2,388 | ||||||
|
Carrying amount, end of period
|
$ | 47,429 | $ | 36,635 | ||||
| (a) Increased cost estimates and revisions to reserve life. | ||||||||
| (b) Relates to disposition of the Lazy JL Field. | ||||||||
F-34
15. Commitments and Contingencies
Lease Rental and Purchase Obligations
We had operating leases for office space and other property and equipment having initial or remaining non-cancelable lease terms in excess of one year. Our future minimum rental payments for operating leases at December 31, 2010 are presented below:
|
Payments Due by Year
|
||||||||||||||||||||||||||||
|
Thousands of dollars
|
2011
|
2012
|
2013
|
2014
|
2015
|
after 2015
|
Total
|
|||||||||||||||||||||
|
Operating leases
|
$ | 3,118 | $ | 2,759 | $ | 1,258 | $ | 840 | $ | 845 | $ | 189 | $ | 9,009 | ||||||||||||||
Net rental payments made under non-cancelable operating leases were $3.0 million, $2.6 million and $2.8 million in 2010, 2009 and 2008, respectively.
As of December 31, 2010, we had purchase obligations of $1.1 million for 2011 and $0.2 million each for the years 2012 and 2013.
Surety Bonds and Letters of Credit
In the normal course of business, we have performance obligations that are secured, in whole or in part, by surety bonds or letters of credit. These obligations primarily cover self-insurance and other programs where governmental organizations require such support. These surety bonds and letters of credit are issued by financial institutions and are required to be reimbursed by us if drawn upon. At December 31, 2010, we had $15.1 million in surety bonds and $0.3 million in letters of credit outstanding. At December 31, 2009, we had $10.6 million in surety bonds and $0.3 million in letters of credit outstanding.
Legal Proceedings
Although we may, from time to time, be involved in litigation and claims arising out of our operations in the normal course of business, we are not currently a party to any material legal proceedings. In addition, we are not aware of any material legal or governmental proceedings against us, or contemplated to be brought against us, under the various environmental protection statues to which we are subject.
16. Partners’ Equity
At December 31, 2010 and 2009, we had 53,957,351 and 52,784,201 Common Units outstanding, respectively.
At December 31, 2010 and December 31, 2009, we had 6,700,000 units authorized for issuance under our long-term incentive compensation plans and there were 2,576,504 and 2,961,659, respectively, of units outstanding under grants that are eligible to be paid in Common Units upon vesting.
During the year ended December 31, 2010, 1,159,533 Common Units were issued to employees pursuant to vested grants under our long-term incentive compensation plan, and 13,617 Common Units were issued to outside directors for phantom units and distribution equivalent rights that were granted in 2007 and vested in January 2010.
On June 17, 2008, we purchased 14,404,962 Common Units from subsidiaries of Provident at $23.26 per unit, for a purchase price of approximately $335 million. These units have been cancelled and are no longer outstanding. This transaction was accounted for as a repurchase of issued Common Units and a cancellation of those Common Units. This transaction decreased equity by $336.2 million, including $1.2 million in capitalized transaction costs. We also purchased Provident’s 95.55% limited liability company interest in BreitBurn Management, which owned the General Partner. Also on June 17, 2008, we entered into a contribution agreement with the General Partner, BreitBurn Management and BreitBurn Corporation, pursuant to which BreitBurn
Corporation contributed its 4.45% limited liability company interest in BreitBurn Management to us i n exchange for 19,955 Common Units and BreitBurn Management contributed its 100% limited liability company interest in the General Partner to us. On the same date, we entered into Amendment No. 1 to the First Amended and Restated Agreement of Limited Partnership of the Partnership, pursuant to which the economic portion of the General Partner’s 0.66473% general partner interest in us was eliminated. As a result of these transactions, the General Partner and BreitBurn Management became our wholly owned subsidiaries.
F-35
On December 22, 2008, we entered into a Unit Purchase Rights Agreement, dated as of December 22, 2008 (the “Rights Agreement”), between us and American Stock Transfer & Trust Company LLC, as Rights Agent. Under the Rights Agreement, each holder of Common Units at the close of business on December 31, 2008 automatically received a distribution of one unit purchase right (a “Right”), which entitles the registered holder to purchase from us one additional Common Unit at a price of $40.00 per Common Unit, subject to adjustment. We entered into the Rights agreement to increase the likelihood that our unitholders receive fair and equal treatment in the event of a takeover proposal.
The issuance of the Rights was not taxable to the holders of the Common Units, had no dilutive effect, will not affect our reported earnings per Common Unit, and will not change the method of trading the Common Units. The Rights will not trade separately from the Common Units unless the Rights become exercisable. The Rights will become exercisable if a person or group acquires beneficial ownership of 20% or more of the outstanding Common Units or commences, or announces its intention to commence, a tender offer that could result in beneficial ownership of 20% or more of the outstanding Common Units. If the Rights become exercisable, each Right will entitle holders, other than the acquiring party, to purchase a number of Common Units having
a market value of twice the then-current exercise price of the Right. Such provision will not apply to any person who, prior to the adoption of the Rights Agreement, beneficially owns 20% or more of the outstanding Common Units until such person acquires beneficial ownership of any additional Common Units.
The Rights Agreement has a term of three years and will expire on December 22, 2011, unless the term is extended, the Rights are earlier redeemed or we terminate the Rights Agreement.
On November 1, 2007, we sold 16,666,667 Common Units, at a negotiated purchase price of $27.00 per unit, to certain investors in a third private placement. We used the proceeds from such sale to fund a portion of the cash consideration for the Quicksilver Acquisition. Also on November 1, 2007, we issued 21,347,972 Common Units to Quicksilver as partial consideration for the Quicksilver Acquisition as a private placement.
In connection with the private placements of Common Units to finance the Quicksilver Acquisition, we entered into registration rights agreements with the institutional investors in our private placements and Quicksilver to file shelf registration statements to register the resale of the Common Units sold or issued in the Private Placements and to use our commercially reasonable efforts to cause the registration statements to become effective with respect to the Common Units sold to the institutional investors not later than August 2, 2008 and, with respect to the Common Units issued to Quicksilver, within one year from November 1, 2007. Quicksilver was prohibited from selling any of the Common Units issued to it prior to the first
anniversary of November 1, 2007 or more than 50% of such Common Units prior to 18 months after November 1, 2 007. In addition, the agreements gave the institutional investors and Quicksilver piggyback registration rights under certain circumstances. These registration rights are transferable to affiliates of the institutional investors and Quicksilver and, in certain circumstances, to third parties.
On July 31, 2008, the registration statement relating to the resale of the Common Units issued in the private placement to the institutional investors was declared effective. On October 28, 2008, the registration statement relating to the resale of the Common Units issued in the private placement to Quicksilver was declared effective.
Earnings per common unit
FASB Accounting Standards require use of the “two-class” method of computing earnings per unit for all periods presented. The “two-class” method is an earnings allocation formula that determines earnings per unit for each class of common unit and participating security as if all earnings for the period had been distributed. Unvested restricted unit awards that earn non-forfeitable distribution rights qualify as participating securities and, accordingly, are included in the basic computation. Our unvested RPUs and CPUs participate in distributions on an equal basis with Common Units; therefore, there is no difference in undistributed earnings allocated to each
participating security. Accordingly, the presentation below is prepared on a combined basis and is p resented as earnings per common unit.
F-36
The following is a reconciliation of net earnings and weighted average units for calculating basic net earnings per common unit and diluted net earnings per common unit. For the year ended December 31, 2009, RPUs and CPUs have been excluded from the calculation of basic earnings per unit, as we were in a net loss position.
|
Year Ended December 31,
|
||||||||||||
|
Thousands, except per unit amounts
|
2010
|
2009
|
2008
|
|||||||||
|
Net income (loss) attributable to limited partners
|
$ | 34,751 | $ | (107,290 | ) | $ | 380,255 | |||||
|
Distributions on participating units not expected to vest
|
15 | - | 22 | |||||||||
|
Net income (loss) attributable to common unitholders and participating securities
|
$ | 34,766 | $ | (107,290 | ) | $ | 380,277 | |||||
|
Weighted average number of units used to calculate basic and diluted net income (loss) per unit:
|
||||||||||||
|
Common Units
|
53,302 | 52,757 | 59,239 | |||||||||
|
Participating securities (a)
|
3,454 | - | 1,184 | |||||||||
|
Denominator for basic earnings per common unit
|
56,756 | 52,757 | 60,423 | |||||||||
|
Dilutive units (b)
|
137 | - | 142 | |||||||||
|
Denominator for diluted earnings per common unit
|
56,893 | 52,757 | 60,565 | |||||||||
|
Net income (loss) per common unit
|
||||||||||||
|
Basic
|
$ | 0.61 | $ | (2.03 | ) | $ | 6.29 | |||||
|
Diluted
|
$ | 0.61 | $ | (2.03 | ) | $ | 6.28 | |||||
(a) For the years ended December 31, 2010 and 2008, basic earnings per unit is based upon the weighted average number of common units outstanding plus the weighted average number of potentially issuable RPUs and CPUs. The year ended December 31, 2009 excludes 2,637 of potentially issuable weighted average RPUs and CPUs from participating securities, as we were in a loss position.
(b) Weighted average dilutive units for the years ended December 31, 2010 and 2008 include units potentially issuable under compensation plans that do not qualify as participating securities. The year ended December 31, 2009 excludes 102 of weighted average anti-dilutive units from the calculation of the denominator for diluted earnings per common unit.
Cash Distributions
The partnership agreement requires us to distribute all of our available cash quarterly. Available cash is cash on hand, including cash from borrowings, at the end of a quarter after the payment of expenses and the establishment of reserves for future capital expenditures and operational needs. We may fund a portion of capital expenditures with additional borrowings or issuances of additional units. We may also borrow to make distributions to unitholders, for example, in circumstances where we believe that the distribution level is sustainable over the long term, but short-term factors have caused available cash from operations to be insufficient to pay the distribution at the current level. The partnership agreement does not restrict our
ability to borrow to pay distributions. The cash distribution policy reflects a basic judgment that unitholders will be better served by us distributing our available cash, after expenses and reserves, rather than retaining it.
Distributions are not cumulative. Consequently, if distributions on Common Units are not paid with respect to any fiscal quarter at the initial distribution rate, our unitholders will not be entitled to receive such payments in the future.
Distributions are paid within 45 days of the end of each fiscal quarter to holders of record on or about the first or second week of each such month. If the distribution date does not fall on a business day, the distribution will be made on the business day immediately preceding the indicated distribution date.
F-37
We do not have a legal obligation to pay distributions at any rate except as provided in the partnership agreement. Our distribution policy is consistent with the terms of our partnership agreement, which requires that we distribute all of our available cash quarterly. Under the partnership agreement, available cash is defined to generally mean, for each fiscal quarter, cash generated from our business in excess of the amount of reserves the General Partner determines is necessary or appropriate to provide for the conduct of the business, to comply with applicable law, any of its debt instruments or other agreements or to provide for future distributions to its unitholders for any one or more of the upcoming four quarters. The partnership
agreement provides that any determination made by the General Partner in its capacity as general par tner must be made in good faith and that any such determination will not be subject to any other standard imposed by the partnership agreement, the Delaware limited partnership statute or any other law, rule or regulation or at equity.
With the borrowing base redetermination in April 2009 (see Note 11), our borrowings exceeded 90% of the reset borrowing base and, therefore, under the terms of our credit facility we were restricted from making a distribution for the first quarter of 2009. Although we were not restricted from making distributions under the terms of our credit facility for the second, third and fourth quarters of 2009, we elected not to declare distributions in light of total leverage levels and other factors. In February 2010, we announced our intention to reinstate quarterly cash distributions to our unitholders, beginning with the first quarter of 2010.
On May 14, 2010, we paid a cash distribution of approximately $20.0 million to our common unitholders of record as of the close of business on May 10, 2010. The distribution that was paid to unitholders was $0.375 per Common Unit. We also paid cash equivalent to the distribution paid to our unitholders of $1.3 million to holders of outstanding Restricted Phantom Units and Convertible Phantom Units issued under our Long-Term Incentive Plans.
On August 13, 2010, we paid a cash distribution of approximately $20.4 million to our common unitholders of record as of the close of business on August 9, 2010. The distribution that was paid to unitholders was $0.3825 per Common Unit. We also paid cash equivalent to the distribution paid to our unitholders of $1.3 million to holders of outstanding Restricted Phantom Units and Convertible Phantom Units issued under our Long-Term Incentive Plans.
On November 12, 2010, we paid a cash distribution of approximately $20.8 million to our common unitholders of record as of the close of business on November 9, 2010. The distribution that was paid to unitholders was $0.3900 per Common Unit. We also paid cash equivalent to the distribution paid to our unitholders of $1.4 million to holders of outstanding Restricted Phantom Units and Convertible Phantom Units issued under our Long-Term Incentive Plans.
17. Noncontrolling interest
FASB Accounting Standards require that noncontrolling interests be classified as a component of equity and establishes reporting requirements that provide sufficient disclosures that clearly identify and distinguish between the interests of the parent and the interests of the noncontrolling owners.
On May 25, 2007, we acquired the limited partner interest (99%) of BEPI from TIFD. As such, we are fully consolidating the results of BEPI and thus are recognizing a noncontrolling interest representing the book value of the general partner’s interests. BEPI’s general partner interest is held by a wholly owned subsidiary of BEC. At December 31, 2010 and December 31, 2009, the amount of this noncontrolling interest was $0.5 million and $0.4 million, respectively. For the years ended December 31, 2010 and 2009, we recorded net income attributable to the noncontrolling interest of $0.2 million and less than $0.1 million, respectively, and $0.1 million and $0.1 million, respectively, in dividends.
The general partner of BEPI holds a 35% reversionary interest under the existing limited partnership agreement applicable to the properties. This reversionary interest is expected to occur at a defined payout, which is estimated to occur in 2013 based on year-end price and cost projections.
18. Unit and Other Valuation-Based Compensation Plans
BreitBurn Management operates our assets and performs other administrative services for us such as accounting, corporate development, finance, land administration, legal and engineering. All of our employees, including our executives, are employees of BreitBurn Management. On June 17, 2008 BreitBurn Management became our wholly owned subsidiary and entered into an Amended and Restated Administrative Services Agreement with BEC, pursuant to which BreitBurn Management agreed to continue to provide administrative services to BEC. In addition, BreitBurn Management agreed to continue to charge BEC for direct expenses, including incentive plan costs and direct payroll and administrative costs. Beginning on June 17, 2008, all of BreitBurn
Management’s costs that are not charged to BEC are consolidated with our results.
F-38
Prior to June 17, 2008, BreitBurn Management provided services to us and to BEC, and allocated its expenses between the two entities. We were managed by our General Partner, the executive officers of which were and are employees of BreitBurn Management. We had entered into an Administrative Services Agreement with BreitBurn Management. Under the Administrative Services Agreement, we reimbursed BreitBurn Management for all direct and indirect expenses it incurred in connection with the services it performed on our behalf (including salary, bonus, certain incentive compensation and other amounts paid to executive officers and other employees).
Effective on the initial public offering date of October 10, 2006, BreitBurn Management adopted the existing Long-Term Incentive Plan (“BreitBurn Management LTIP”) and the Unit Appreciation Rights Plan (“UAR plan”) of the predecessor as previously amended. The predecessor’s Executive Phantom Option Plan, Unit Appreciation Plan for Officers and Key Individuals (Founders Plan), and the Performance Trust Units awarded to the Chief Financial Officer during 2006 under the BreitBurn Management LTIP, were adopted by BreitBurn Management with amendments at the initial public offering date as described in the subject plan discussions below.
We may terminate or amend the long-term incentive plan at any time with respect to any units for which a grant has not yet been made. We also have the right to alter or amend the long-term incentive plan or any part of the plan from time to time, including increasing the number of units that may be granted subject to the requirements of the exchange upon which the Common Units are listed at that time. However, no change in any outstanding grant may be made that would materially reduce the rights or benefits of the participant without the consent of the participant. The plan will expire when units are no longer available under the plan for grants or, if earlier, it is terminated by us.
Unit Based Compensation
FASB Accounting Standards establish requirements for charging compensation expenses based on fair value provisions. At December 31, 2010, the Restricted Phantom Units (“RPUs”) and the Convertible Phantom Units (“CPUs”) granted under the BreitBurn Management LTIP as well as the outstanding Directors RPUs discussed below were all classified as equity awards in accordance with FASB Accounting Standards. These awards are being recognized as compensation expense on a straight line basis over the annual vesting periods as prescribed in the award agreements.
Prior year awards classified as liabilities were revalued at each reporting period using the Black-Scholes option pricing model and changes in the fair value of the options were recognized as compensation expense over the vesting schedules of the awards. These awards were settled in cash or had the option of being settled in cash or units at the choice of the holder, and were indexed to either our Common Units or to Provident Trust Units. The liability-classified option awards were distribution-protected awards through either an Adjustment Ratio as defined in the plan or the holders received cumulative distribution amounts upon vesting equal to the actual distribution amounts per Common Unit of the underlying notional Units.
We recognized $20.4 million, $12.7 million and $6.5 million of compensation expense related to our various plans for the years ended December 31, 2010, 2009 and 2008, respectively.
Restricted Phantom Units
RPUs are phantom equity awards that, to the extent vested, represent the right to receive actual partnership units upon specified payment events. Certain employees of BreitBurn Management including its executives are eligible to receive RPU awards. We believe that RPUs properly incentivize holders of these awards to grow stable distributions for our common unitholders. RPUs generally vest in three equal annual installments on each anniversary of the vesting commencement date of the award. In addition, each RPU is granted in tandem with a distribution equivalent right that will remain outstanding from the grant of the RPU until the earlier to occur of its forfeiture or the payment of the underlying unit, and which entitles the grantee to
receive payment of amounts equal to distributions paid to each holder of an actual partnership unit du ring such period. RPUs that do not vest for any reason are forfeited upon a grantee’s termination of employment.
F-39
RPU awards were granted to BreitBurn Management employees during the years ended December 31, 2010, 2009 and 2008 as shown in the table below. We recorded compensation expense of $15.6 million in 2010, $9.1 million in 2009 and $3.4 million in 2008 related to the amortization of outstanding RPUs over their related vesting periods. As of December 31, 2010, there was $18.1 million of total unrecognized compensation cost remaining for the unvested RPUs. This amount is expected to be recognized over the next two years.
The following table summarizes information about RPUs:
|
Year Ended December 31,
|
||||||||||||||||||||||||
|
2010
|
2009
|
2008
|
||||||||||||||||||||||
|
Number of
|
Weighted
|
Number of
|
Weighted
|
Number of
|
Weighted
|
|||||||||||||||||||
|
RPU
|
Average
|
RPU
|
Average
|
RPU
|
Average
|
|||||||||||||||||||
|
Units
|
Fair Value *
|
Units
|
Fair Value *
|
Units
|
Fair Value *
|
|||||||||||||||||||
|
Outstanding , beginning of period
|
1,574,750 | $ | 12.82 | 607,263 | $ | 26.91 | 372,945 | $ | 30.98 | |||||||||||||||
|
Granted
|
1,482,550 | 13.77 | 1,790,589 | 8.17 | 245,290 | 20.44 | ||||||||||||||||||
|
Exercised
|
(1,289,016 | ) | 13.13 | (808,700 | ) | 13.08 | - | - | ||||||||||||||||
|
Cancelled
|
(21,073 | ) | 12.80 | (14,402 | ) | 14.45 | (10,972 | ) | 20.83 | |||||||||||||||
|
Outstanding, end of period
|
1,747,211 | $ | 13.40 | 1,574,750 | $ | 12.82 | 607,263 | $ | 26.91 | |||||||||||||||
|
Exercisable, end of period
|
- | $ | - | - | $ | - | - | $ | - | |||||||||||||||
* At grant date
Convertible Phantom Units
In December 2007, seven executives, Messrs. Halbert Washburn, Randall Breitenbach, Mark Pease, James Jackson, Gregory Brown, Thurmon Andress and Jackson Washburn, received 681,500 units of CPUs at a grant price of $30.29 per Common Unit. Each of the awards has the vesting commencement date of January 1, 2008. CPUs are significantly tied to the amount of distributions we make to holders of our Common Units. As discussed further below, the number of CPUs ultimately awarded to each of these senior executives will be based upon the level of distributions to common unitholders achieved during the term of the CPUs. The CPU grants vest over a longer-term period of up to five years. Therefore, these grants will not be made on an annual basis. New
grants could be made at the Board’s discretion at a future date after the present CPU grants h ave vested.
CPUs vest on the earliest to occur of (i) January 1, 2013, (ii) the date on which the aggregate amount of distributions paid to common unitholders for any four consecutive quarters during the term of the award is greater than or equal to $3.10 per Common Unit and (iii) upon the occurrence of the death or “disability” of the grantee or his or her termination without “cause” or for “good reason” (as defined in the holder’s employment agreement, if applicable). Unvested CPUs are forfeited in the event that the grantee ceases to remain in the service of BreitBurn Management. Prior to vesting, a holder of a CPU is entitled to receive payments equal to the amount of distributions made by us with
respect to each of the Common Units multiplied by the number of Common Unit equivalents underlying the CPUs at the time of the distribution.
Under the original CPU Agreements, one Common Unit Equivalent (CUE) underlies each CPU at the time it was awarded to the grantee. However, the number of CUEs underlying the CPUs would increase at a compounded rate of 25% upon the achievement of each 5% compounded increase in the distributions paid by us to our common unitholders. Conversely, the number of CUEs underlying the CPUs would decrease at a compounded rate of 25% if the distributions paid by us to our common unitholders decreases at a compounded rate of 5%.
On October 29, 2009, the Compensation and Governance Committee approved an amendment to each of the existing CPU Agreements entered into with each named executive. Originally under the CPU Agreements, the number of CUEs per CPU could be reduced over the five year life of the agreement to a minimum of zero, or be multiplied by a maximum of 4.768 times, based on our distribution levels. We suspended the payment of distributions in April 2009; therefore, holders of CPU’s did not receive any distributions under the CPU Agreements as long as distributions were suspended. Under the original chart, if the CPU’s were to vest currently – for instance in the case of the death or disability of a holder – zero units would vest
to that holder. The Committee determined that the elimination of multipliers between zero and one be st represented the original incentive and retention purpose of the CPU Agreements. With this modification to the CPU Agreements, the number of CUEs per CPU can no longer be less than one, regardless of Common Unit distribution levels.
F-40
On January 29, 2010, the Committee approved an amendment to each of the existing CPU Agreements entered into with each named executive. Under these agreements, each CPU entitles its holder to receive (i) a number of our Common Units at the time of vesting equal to the number of “common unit equivalents” (“CUEs”) underlying the CPU at vesting, and (ii) current distributions on Common Units during the vesting period based on the number of CUEs underlying the CPU at the time of such distribution. The number of CUEs underlying each CPU is determined by reference to Common Unit distribution levels during the applicable vesting period, generally calculated based upon
the aggregate amount of distributions made per Common Unit for the four quarters preceding vesting. The amendment to the CPU agreements now limits the multiplier for 20% of the total number of CPUs and related CUEs granted in each award to “1.”
On January 28, 2011, the Committee approved an amendment to each of the existing CPU Agreements entered into with each of named executives. This amendment to the CPU agreements now limits the multiplier for 40% of the total number of CPUs and related CUEs granted in each award to "1" instead of 20% in the prior amendment approved on January 29, 2010. As a result at vesting, CPUs for 40% of each award will convert to Common Units on a 1:1 basis, and with respect to that portion of the award, holders will lose the ability to earn additional Common Units based on increased distributions on Common Units. No other modification was made to the CPU Agreements under this amendment. The Committee determined that this cap on 40% of the CPUs was
appropriate in light of the overall long-term incentive grants made to BreitBurn's executive officers in 2011. Because we were accruing compensation expense assuming a CUE multiplier of one, all these amendments had no impact on compensation expense recorded. Compensation expense will be adjusted upon such time it deems probable that the CUE would increase due to increased distributions.
In the event that the CPUs vest on January 1, 2013 or if the aggregate amount of distributions paid to common unitholders for any four consecutive quarters during the term of the award is greater than $3.10 per Common Unit, the CPUs would convert into a number of Common Units equal to the number of Common Unit equivalents underlying the CPUs at such time (calculated based upon the aggregate amount of distributions made per Common Unit for the preceding four quarters subject to the 60% limitation put in place on January 28, 2011 as noted above). After January 1, 2011, under the terms of the CPU Agreements, all unvested CPUs would fully vest in the event of a termination without cause or good reason and upon death or disability.
We recorded compensation expense for the CPUs of $4.1 million in 2010, $4.1 million in 2009 and $4.1 million in 2008. At December 31, 2010, there was $8.3 million of total unrecognized compensation cost related to the unvested CPUs remaining. This amount is expected to be recognized over the next two years.
Founders Plan Awards
Under the Founders Plan, participants received unit appreciation rights which provide cash compensation in relation to the appreciation in the value of a specified number of underlying notional phantom units. The value of the unit appreciation rights was determined on the basis of a valuation of the predecessor at the end of the fiscal period plus distributions during the period less the value of the predecessor at the beginning of the period. The base price and vesting terms were determined by BreitBurn Management at the time of the grant. Outstanding unit appreciation rights vest in the following manner: one-third vest three years after the grant date, one-third vest four years after the grant date and one-third vest five years after the
grant date and are subject to specified service requirements.
Effective on the initial public offering date of October 10, 2006, all outstanding unit appreciation rights under the Founders Plan were adopted by BreitBurn Management and converted into three separate awards. The first and second awards became the obligations of our predecessor. The third award represented 309,570 Partnership unit appreciation rights at a base price of $18.50 per unit with respect to the operations of the properties that were transferred to us for the period beginning on the initial public offering date of October 10, 2006. The award is liability-classified and is being charged to us as compensation expense over the remaining vesting schedule. The value of the outstanding Partnership unit appreciation rights is
remeasured each period using a Black-Scholes option pricing model. Market prices of $20.14, $10.59 and $7.05 were used in the model for the periods ending December 31, 2010, 2009 and 2008, respectively. Expected volatility ranged from 9% to 21% and had a weighted average volatility of 9.8%. The average risk free rate used was approximately 3.3%. The expected option terms ranged from one half year to two and one half years.
F-41
We recorded less than $0.1 million, $(0.4) million and $(0.3) million for compensation expense/(income) under the plan for the years ended December 31, 2010, December 31, 2009 and December 31, 2008, respectively. The aggregate value of the vested and unvested unit appreciation rights was less than $0.1 million at December 31, 2010 and the unvested portion was an immaterial amount.
The following table summarizes information about Appreciation Rights Units issued under the Founders Plan:
|
Year Ended December 31,
|
||||||||||||||||||||||||
|
2010
|
2009
|
2008
|
||||||||||||||||||||||
|
Number of
|
Weighted
|
Number of
|
Weighted
|
Number of
|
Weighted
|
|||||||||||||||||||
|
Appreciation
|
Average
|
Appreciation
|
Average
|
Appreciation
|
Average
|
|||||||||||||||||||
|
Rights Units
|
Exercise Price
|
Rights Units
|
Exercise Price
|
Rights Units
|
Exercise Price
|
|||||||||||||||||||
|
Outstanding , beginning of period
|
20,788 | $ | 18.50 | 122,644 | $ | 18.50 | 214,107 | $ | 18.50 | |||||||||||||||
|
Exercised
|
(10,393 | ) | 18.50 | - | - | (91,463 | ) | 18.50 | ||||||||||||||||
|
Cancelled (a)
|
- | - | (101,856 | ) | 18.50 | - | - | |||||||||||||||||
|
Outstanding, end of period (a)
|
10,395 | $ | 18.50 | 20,788 | $ | 18.50 | 122,644 | $ | 18.50 | |||||||||||||||
|
Exercisable, end of period
|
- | $ | - | - | $ | - | - | $ | - | |||||||||||||||
(a) These units expired out of the money and the remaining units outstanding at year end will vest in 2011.
BreitBurn Management Long-Term Incentive Plan (LTIP) and the Partnership LTIP
BreitBurn Management LTIP
In September 2005, certain employees other than the Co-Chief Executive Officers of the predecessor were granted restricted units (“RTUs”) and/or performance units (“PTUs”), both of which entitle the employee to receive cash compensation in relation to the value of a specified number of underlying notional trust units indexed to Provident Energy Trust Units. The grants are based on personal performance objectives. This plan replaced the Unit Appreciation Right Plan for Employees and Consultants for the period after September 2005 and subsequent years. RTUs vest one third at the end of year one, one third at the end of year two and one third at the end of year three after grant. In general, cash payments equal to the
value of the underlying notional units were made on the anniversary dates of the RTU to the employee s entitled to receive them. PTUs vest three years from the end of the third year after grant and the payout can range from zero to 200% of the initial grant depending on the total return of the underlying notional units as compared to the returns of selected peer companies. The total return of the Provident Energy Trust unit is compared with the return of 25 selected Canadian trusts and funds. The Provident indexed PTUs granted in 2005 and 2006 entitle employees to receive cash payments equal to the market price of the underlying notional units. Under our LTIP, Partnership indexed PTUs were granted in 2007 and are payable in cash or may be paid in Common Units if elected at least 60 days prior to vesting by the grantees. The total return of the Partnership unit is compared with the return of 49 companies in the Alerian MLP Index for the payout multiplier. All of the grants are
liability-classified. Underlying notional units are established based on target salary LTIP threshold for each employee. The awarded notional units are adjusted cumulatively thereafter for distribution payments through the use of an adjustment ratio. The estimated fair value associated with RTUs and PTUs is expensed in the statement of income over the vesting period.
On June 17, 2008, we entered into the BreitBurn Management Purchase agreement with Pro LP and Pro GP. The BreitBurn Management Purchase Agreement contains certain covenants of the parties relating to the allocation of responsibility for liabilities and obligations under certain pre-existing equity-based compensation plans adopted by BreitBurn Management, BEC and us. The pre-existing compensation plans include the outstanding 2005 and 2006 LTIP grants which are indexed to the Provident Trust Units. As a result, we paid $0.9 million for our share of the 2005 LTIP grants that vested in June 2008 in accordance with the agreed allocation of liability.
In September 2008, BreitBurn Management made an offer to holders of the 2006 LTIP grants to cash out their Provident-indexed units at $10.32 per share before the normal vesting date of December 31, 2008. By the end of September 2008, the offer was accepted by all employees who had outstanding 2006 LTIP grants. Consequently, compensation expense was recognized for the full amount of the remaining unvested liability during 2008. BreitBurn Management paid employees $0.6 million in 2008 for its share of the 2006 LTIP grants in accordance with the agreed allocation of liability.
F-42
We did not recognize any expense for the years ended December 31, 2010 and 2009, and recognized $0.9 million of compensation expense for the year ended December 31, 2008. The following table summarizes information about the restricted/performance units granted in 2005 and 2006:
|
PVE indexed units
|
||||||||
|
Year Ended December 31, 2008
|
||||||||
|
Weighted
|
||||||||
|
Number of
|
Average
|
|||||||
|
Units
|
Grant Price
|
|||||||
|
Outstanding , beginning of period
|
267,702 | $ | 10.77 | |||||
|
Granted
|
- | - | ||||||
|
Exercised
|
(267,351 | ) | 10.77 | |||||
|
Cancelled
|
(351 | ) | 10.73 | |||||
|
Outstanding, end of period
|
- | $ | 10.77 | |||||
|
Exercisable, end of period
|
- | $ | - | |||||
Partnership LTIP
Under our LTIP, Partnership-indexed restricted units (RTUs) and/or performance units (PTUs) were granted in 2007 to certain individuals other than the Co-Chief Executive Officers. Partnership-indexed RTUs vest one third at the end of year one, one third at the end of year two and one third at the end of year three after grant. In general, cash payments equal to the value of the underlying notional units were made on the anniversary dates of the RTUs. Partnership-indexed PTUs vest three years from the end of third year after grant and are payable in cash or in Common Units of the Partnership if elected by the grantee at least 60 days prior to the vesting date. Partnership-indexed PTU payouts are further determined by a performance
multiplier which can range from zero to 200% of the initial grant depending on the total return of the underl ying notional units as compared to the returns of a selected peer group of companies. The multiplier is determined by comparing our total return to the returns of 49 companies in the Alerian MLP Index. Underlying notional units are established based on target salary LTIP threshold for each employee. The awarded notional units are adjusted cumulatively thereafter for distribution payments through the use of an adjustment ratio. The estimated fair value associated with the Partnership-indexed RTUs and PTUs is expensed in the statement of income over the vesting period.
Due to the suspension of our distribution in April 2009, the multiplier as calculated at the end of 2009 was below that required to generate a payout. As a result, all outstanding Partnership-indexed PTUs vested and expired January 1, 2010 and no payout was made. The remaining Partnership-indexed RTUs had a value of approximately less than $0.1 million at December 31, 2009 which were paid in cash in January 2010.
We recognized credits of $0.5 million and $1.4 million of compensation expense for the years ended December 31, 2009 and 2008, respectively.
F-43
The following table summarizes information about the restricted/performance units granted in 2007. Market prices of $10.59 and $7.05 were used in the model for the periods ending December 31, 2009 and 2008, respectively.
|
Partnership-indexed PTUs and RTUs
|
||||||||||||||||||||||||
|
Year Ended December 31,
|
||||||||||||||||||||||||
|
2010
|
2009
|
2008
|
||||||||||||||||||||||
|
Weighted
|
Weighted
|
Weighted
|
||||||||||||||||||||||
|
Number of
|
Average
|
Number of
|
Average
|
Number of
|
Average
|
|||||||||||||||||||
|
Units
|
Grant Price
|
Units
|
Grant Price
|
Units
|
Grant Price
|
|||||||||||||||||||
|
Outstanding , beginning of period
|
5,601 | $ | 24.10 | 86,992 | $ | 24.10 | 108,717 | $ | 23.64 | |||||||||||||||
|
Granted
|
- | - | - | - | ||||||||||||||||||||
|
Exercised
|
(5,601 | ) | 24.10 | (6,357 | ) | 24.10 | (20,645 | ) | 20.39 | |||||||||||||||
|
Cancelled
|
(75,034 | ) | 24.10 | (1,080 | ) | 24.10 | ||||||||||||||||||
|
Outstanding, end of period
|
- | $ | - | 5,601 | $ | 24.10 | 86,992 | $ | 24.10 | |||||||||||||||
|
Exercisable, end of period
|
- | $ | - | - | $ | - | - | $ | - | |||||||||||||||
Unit Appreciation Right Plan Awards
In 2004, the predecessor adopted the Unit Appreciation Right Plan for Employees and Consultants (the ‘‘UAR Plan’’). Under the UAR Plan, certain employees of the predecessor were granted unit appreciation rights (‘‘UARs’’). The UARs entitle the employee to receive cash compensation in relation to the value of a specified number of underlying notional trust units of Provident (‘‘Phantom Units’’). The exercise price and the vesting terms of the UARs were determined at the sole discretion of the Plan Administrator at the time of the grant. The UAR Plan was replaced with the BreitBurn Management LTIP at the end of September 2005. The grants issued prior to the replacement
of the UAR Plan fully vested in 2008.
UARs vest one third at the end of year one, one third at the end of year two and one third at the end of year three after grant. Upon vesting, the employee is entitled to receive a cash payment equal to the excess of the market price of Provident’s units over the exercise price of the Phantom Units at the grant date, adjusted for an additional amount equal to any Excess Distributions, as defined in the plan. The predecessor settles rights earned under the plan in cash. All of the outstanding UAR units at December 31, 2008 expired during 2009.
The total compensation expense for the UAR plan is allocated between us and our predecessor. Our share of expense was an immaterial amount in 2009 and 2008.
Director Restricted Phantom Units
Effective with the initial public offering, we also made grants of Restricted Phantom Units in the Partnership to the non-employee directors of our General Partner. Each phantom unit is accompanied by a distribution equivalent unit right entitling the holder to an additional number of phantom units with a value equal to the amount of distributions paid on each of our Common Units until settlement. Upon vesting, the majority of the phantom units will be paid in Common Units, except for certain directors’ awards which will be settled in cash. The unit-settled awards are classified as equity and the cash-settled awards are classified as liabilities. The estimated fair value associated with these phantom units is expensed in the
statement of income over the vesting period. The accumulated compensation expense for unit-settled awards is reported in equity, and for cash-settled grants, it is reflected as a liability on the consolidated balance sheet.
We recorded compensation expense for the director’s phantom units of approximately $0.6 million in 2010, $0.4 million in 2009 and $0.1 million in 2008. As of December 31, 2010, there was $0.7 million of total unrecognized compensation cost for the unvested Director Performance Units and such cost is expected to be recognized over the next two years. The total fair value of units vested in 2010 and 2009 was $0.2 million for each year.
F-44
The following table summarizes information about the Director Restricted Phantom Units:
|
Year Ended December 31,
|
||||||||||||||||||||||||
|
2010
|
2009
|
2008
|
||||||||||||||||||||||
|
Number of
|
Weighted
|
Number of
|
Weighted
|
Number of
|
Weighted
|
|||||||||||||||||||
|
Performance
|
Average
|
Performance
|
Average
|
Performance
|
Average
|
|||||||||||||||||||
|
Units
|
Fair Value *
|
Units
|
Fair Value *
|
Units
|
Fair Value *
|
|||||||||||||||||||
|
Outstanding , beginning of period
|
81,355 | $ | 13.80 | 35,429 | $ | 22.60 | 37,473 | $ | 21.11 | |||||||||||||||
|
Granted
|
59,784 | 13.94 | 56,736 | 9.20 | 20,146 | 25.02 | ||||||||||||||||||
|
Exercised
|
(10,373 | ) | 24.10 | (10,810 | ) | 18.50 | (22,190 | ) | 22.28 | |||||||||||||||
|
Outstanding, end of period
|
130,766 | $ | 13.05 | 81,355 | $ | 13.80 | 35,429 | $ | 22.60 | |||||||||||||||
|
Exercisable, end of period
|
- | $ | - | - | $ | - | - | $ | - | |||||||||||||||
* At grant date
19. Retirement Plan
BreitBurn Management operates our assets and performs other administrative services for us such as accounting, corporate development, finance, land administration, legal and engineering. All of our employees, including our executives, are employees of BreitBurn Management. BreitBurn Management has a defined contribution retirement plan, which covers substantially all of its employees on the first day of the month following the month of hire. The plan provides for BreitBurn Management to make regular contributions based on employee contributions as provided for in the plan agreement. Employees fully vest in BreitBurn Management’s contributions after five years of service. BEC is charged for a portion of the matching contributions made
by BreitBurn Management. For the years ended December 31, 2010, 2009 and 2008, the matching contrib ution paid by us were $1.0 million, $1.0 million and $0.4 million, respectively.
20. Significant Customers
We sell oil, natural gas and natural gas liquids primarily to large domestic refiners. For the year ended December 31, 2010, purchasers that accounted for 10% or more of our net sales were ConocoPhillips which accounted for 30% of net sales, Marathon Oil Company, which accounted for 16% of net sales, Plains Marketing & Transportation LLC, which accounted for 12% of net sales, and Sunoco Partners Marketing and Terminals L.P., which accounted for 10% of net sales. For the years ended December 31, 2009 and 2008, ConocoPhillips purchased approximately 30% and 25% of our production, respectively, and Marathon Oil Company purchased approximately 16% and 13% of our production, respectively. Plains Marketing & Transportation LLC accounted
for 11% and less than 10% of our total production for the years ended December 31, 2009 and 2008, re spectively.
21. Subsequent Events
On January 19, 2011, we filed a registration statement on Form S-4, which became effective on February 17, 2011, to exchange our Senior Notes due 2020 issued on October 6, 2010 for notes with materially identical terms that have been registered under the Securities Act of 1933 and are freely tradable. We also commenced the exchange offer on February 17, 2011, which expires on March 21, 2011, unless extended.
On January 31, 2011, we announced a cash distribution to unitholders for the fourth quarter of 2010 at the rate of $0.4125 per Common Unit, which was paid on February 11, 2011 to the record holders of common units at the close of business on February 8, 2011.
On February 4, 2011, we entered into crude oil fixed price swap contracts for 1,000 Bbl/d for the period October 1, 2014 to December 31, 2014 at $98.00 per Bbl, 1,000 Bbl/d for the period January 1, 2015 to June 30, 2015 at $98.80 per Bbl and 1,000 Bbl/d for the period July 1, 2015 to December 31, 2015 at $98.50 per Bbl. On February 28, 2011, we entered into crude oil fixed price swap contracts for 1,000 Bbl/d for the year 2015 at $99.35 per Bbl. On March 2, 2011, we entered into crude oil collar contracts for 1,000 Bbl/d for the years 2014 and 2015 with floor prices of $90.00 per Bbl for each year and ceiling prices of $112.00 per Bbl for 2014 and $113.50 per Bbl for 2015.
F-45
On February 11, 2011, we sold approximately 4.9 million Common Units at a price to the public of $21.25, resulting in proceeds net of underwriting discount of $100.5 million, which we used to repay outstanding debt under our credit facility.
Supplemental Information
|
A.
|
Oil and Natural Gas Activities (Unaudited)
|
In December 2008, the SEC issued Release 33-8995 adopting new rules for reserves estimate calculations and related disclosures. We calculate total estimated proved reserves and disclose our oil and natural gas activities in accordance with FASB Accounting Standards and Release No. 33-8995. Beginning with fiscal years ending on or after December 31, 2009, Release 33-8995 replaced the end-of-the-year oil and gas reserve pricing with an unweighted average first-of-the-month pricing for the past 12 fiscal months. The definition of proved reserves incorporates a definition of “reasonable certainty” using the PRMS (Petroleum Resource Management System) standard of “high
degree of confidence” for deterministic method estimates, or a 90% recovery probability for pro babilistic methods used in estimating proved reserves. While Release No. 33-8995 permits a company to establish undeveloped reserves as proved with appropriate degrees of reasonable certainty established absent actual production tests and without artificially limiting such reserves to spacing units adjacent to a producing well, we have elected not to add such undeveloped reserves as proved. For reserve reporting purposes we use unweighted average first-day-of-the-month pricing for the 12 calendar months ended December 31, 2010. Costs associated with reserves are measured on the last day of the fiscal year.
Costs incurred
Our oil and natural gas activities are conducted in the United States. The following table summarizes our costs incurred for the past three years:
|
Year Ended December 31,
|
||||||||||||
|
Thousands of dollars
|
2010
|
2009
|
2008
|
|||||||||
|
Property acquisition costs
|
||||||||||||
|
Proved
|
$ | 1,676 | $ | - | $ | - | ||||||
|
Unproved
|
2,877 | - | - | |||||||||
|
Development costs
|
64,951 | 28,669 | 129,503 | |||||||||
|
Asset retirement costs
|
10,120 | 4,883 | 1,363 | |||||||||
| Total costs incurred | $ | 79,624 | $ | 33,552 | $ | 130,866 | ||||||
Capitalized costs
The following table presents the aggregate capitalized costs subject to depreciation, depletion and amortization relating to oil and gas activities, and the aggregate related accumulated allowance:
|
At December 31,
|
||||||||
|
Thousands of dollars
|
2010
|
2009
|
||||||
|
Proved properties and related producing assets
|
$ | 1,873,398 | $ | 1,726,722 | ||||
|
Pipelines and processing facilities
|
146,630 | 136,556 | ||||||
|
Unproved properties
|
113,071 | 195,690 | ||||||
|
Accumulated depreciation, depletion and amortization
|
(415,372 | ) | (321,851 | ) | ||||
|
Net capitalized costs
|
$ | 1,717,727 | $ | 1,737,117 | ||||
The average DD&A rate per equivalent unit of production for the year ended December 31, 2010, excluding non-oil and gas related DD&A, was $14.95 per Boe. The average DD&A rate per equivalent unit of production for the year ended December 31, 2009, excluding non-oil and gas related DD&A, was $16.00 per Boe. The decrease in our 2010 DD&A rates compared to 2009 was primarily due to the increase in our reserves reflecting higher 2010 commodity prices.
F-46
Results of operations for oil and gas producing activities
The results of operations from oil and gas producing activities below exclude general and administrative expenses, interest expenses and interest income:
|
Year Ended December 31,
|
||||||||||||
|
Thousands of dollars
|
2010
|
2009
|
2008
|
|||||||||
|
Oil, natural gas and NGL sales
|
$ | 317,738 | $ | 254,917 | $ | 467,381 | ||||||
|
Gain (loss) on commodity derivative instruments, net
|
35,112 | (51,437 | ) | 332,102 | ||||||||
|
Operating costs
|
(142,525 | ) | (138,498 | ) | (162,005 | ) | ||||||
|
Depreciation, depletion, and amortization
|
(100,183 | ) | (104,299 | ) | (178,657 | ) | ||||||
|
Income tax (expense) benefit
|
204 | 1,528 | (1,939 | ) | ||||||||
|
Results of operations from producing activities (a)
|
$ | 110,346 | $ | (37,789 | ) | $ | 456,882 | |||||
(a) Excludes loss on sale of assets of $14 and $5,965 for 2010 and 2009, respectively.
Supplemental reserve information
The following information summarizes our estimated proved reserves of oil (including condensate and natural gas liquids) and natural gas and the present values thereof for the years ended December 31, 2010, 2009 and 2008. The following reserve information is based upon reports by Netherland, Sewell & Associates, Inc. and Schlumberger Data & Consulting Services, independent petroleum engineering firms. Netherland, Sewell & Associates, Inc. provides reserve data for our California, Wyoming and Florida properties, and Schlumberger Data & Consulting Services
provides reserve data for our Michigan, Kentucky and Indiana properties. The estimates are prepared in accordance with SEC regulations. We only utilize large, widely known, highly regarded, and reputable engineering consulting firms. Not only the firms, but the technical persons that sign and seal the reports are licensed and certify that they meet all professional requirements. Licensing requirements formally require mandatory continuing education and professional qualifications. They are independent petroleum engineers, geologists, geophysicists and petrophysicists.
Our reserve estimation process involves petroleum engineers and geoscientists. As part of this process, all reserves volumes are estimated using a forecast of production rates, current operating costs and projected capital expenditures. As specified by the SEC, 2008 reserves are based upon oil and gas prices in effect as of the end of the year, while 2009 and 2010 reserves are based upon the unweighted average first-day-of-the-month prices for each year. Price differentials are then applied to adjust these prices to the expected realized field price. Specifics of each operating agreement are then used to estimate the net reserves. Production rate forecasts are derived by a number of
methods, including decline curve analyses, volumetrics, material balance or computer simulation of th e reservoir performance. Operating costs and capital costs are forecast using current costs combined with expectations of future costs for specific reservoirs. In many cases, activity-based cost models for a reservoir are utilized to project operating costs as production rates and the number of wells for production and injection vary.
Our Manager of Reserves and Acquisition Evaluation, who reports directly to our Chief Operating Officer, maintains our reserves databases, provides reserve reports to accounting based on SEC guidance and updates production forecasts. He provides access to our reserves databases to Netherland, Sewell & Associates, Inc. and Schlumberger Data & Consulting Services and oversees the compilation of and reviews their reserve reports. He has a B.S. degree in Petroleum Engineering and 32 years of oil and gas experience with major integrated and independent companies. His experience encompasses most Basins across the U.S.
F-47
Management believes the reserve estimates presented herein, in accordance with generally accepted engineering and evaluation methods and procedures consistently applied, are reasonable. However, there are numerous uncertainties inherent in estimating quantities and values of the estimated proved reserves and in projecting future rates of production and timing of development expenditures, including many factors beyond our control. Reserve engineering is a subjective process of estimating the recovery from underground accumulations of oil and gas that cannot be measured in an exact manner and the accuracy of any reserve estimate is a function of the quality of available data and of engineering and geological interpretation and judgment.
Because all reserve estimates are to some degree speculative, the quantities of oil and gas that are ult imately recovered, production and operating costs, the amount and timing of future development expenditures and future oil and gas sales prices may all differ from those assumed in these estimates. In addition, different reserve engineers may make different estimates of reserve quantities and cash flows based upon the same available data. Therefore, the standardized measure of discounted net future cash flows shown below represents estimates only and should not be construed as the current market value of the estimated oil and gas reserves attributable to our properties. In this regard, the information set forth in the following tables includes revisions of reserve estimates attributable to proved properties included in the preceding year’s estimates. Such revisions reflect additional information from subsequent exploitation and development activities, production history of the
properties involved and any adjustments in the projected economic life of such properties resulting from changes in product pri ces. Decreases in the prices of oil and natural gas and increases in operating expenses have had, and could have in the future, an adverse effect on the carrying value of our proved reserves and revenues, profitability and cash flow.
The following table sets forth certain data pertaining to our estimated proved and proved developed reserves for the years ended December 31, 2010, 2009 and 2008:
|
Year Ended December 31,
|
||||||||||||||||||||||||||||
|
2010
|
2009
|
2008
|
||||||||||||||||||||||||||
|
Total
|
Oil
|
Gas
|
Total
|
Oil
|
Gas
|
Total
|
Oil
|
Gas
|
||||||||||||||||||||
|
(MBoe)
|
(MBbl)
|
(MMcf)
|
(MBoe)
|
(MBbl)
|
(MMcf)
|
(MBoe)
|
(MBbl)
|
(MMcf)
|
||||||||||||||||||||
|
Proved Reserves
|
||||||||||||||||||||||||||||
|
Beginning balance
|
111,301 | 38,846 | 434,730 | 103,649 | 25,910 | 466,434 | 142,273 | 58,095 | 505,069 | |||||||||||||||||||
|
Revision of previous estimates
|
12,819 | 5,900 | 41,510 | 15,303 | 17,034 | (10,389 | ) | (31,815 | ) | (29,106 | ) | (16,251 | ) | |||||||||||||||
|
Purchase of reserves in-place
|
1,487 | 70 | 8,502 | - | - | - | - | - | - | |||||||||||||||||||
|
Sale of reserves in-place
|
- | - | - | (1,135 | ) | (1,109 | ) | (154 | ) | - | - | - | ||||||||||||||||
|
Production
|
(6,699 | ) | (3,157 | ) | (21,251 | ) | (6,516 | ) | (2,989 | ) | (21,161 | ) | (6,810 | ) | (3,079 | ) | (22,384 | ) | ||||||||||
|
Ending balance
|
118,908 | 41,659 | 463,491 | 111,301 | 38,846 | 434,730 | 103,649 | 25,910 | 466,434 | |||||||||||||||||||
|
Proved Developed Reserves (a)
|
||||||||||||||||||||||||||||
|
Beginning balance
|
100,968 | 34,436 | 399,190 | 95,643 | 23,346 | 433,780 | 128,344 | 52,103 | 457,444 | |||||||||||||||||||
|
Ending balance
|
108,283 | 38,719 | 417,381 | 100,968 | 34,436 | 399,190 | 95,643 | 23,346 | 433,780 | |||||||||||||||||||
|
Proved Undeveloped Reserves (a) (b)
|
||||||||||||||||||||||||||||
|
Beginning balance
|
10,333 | 4,410 | 35,540 | 8,006 | 2,564 | 32,654 | 13,930 | 5,992 | 47,625 | |||||||||||||||||||
|
Ending balance
|
10,625 | 2,940 | 46,110 | 10,333 | 4,410 | 35,540 | 8,006 | 2,564 | 32,654 | |||||||||||||||||||
(a) During the year ended December 31, 2010, we incurred $32.6 million in capital expenditures and drilled 16 wells to convert 2,769 MBbl of oil and 2,664 MMcf of natural gas from proved undeveloped to proved developed. During the year ended December 31, 2009, we incurred $5.8 million in capital expenditures and drilled 11 wells to convert 568 MBbl of oil and 484 MMcf of natural gas from proved undeveloped to proved developed.
(b) As of December 31, 2010 and 2009, we had no material proved undeveloped reserves that have remained undeveloped for more than five years.
The increase in proved undeveloped reserves during the year ended December 31, 2010 was not material. The increase in proved undeveloped reserves during the year ended December 31, 2009 was primarily due to the economic effect of higher 2009 SEC pricing on properties previously deemed uneconomical as well as revisions of estimates, partially offset by the conversion of proved undeveloped reserves to proved developed.
F-48
Standardized measure of discounted future net cash flows
The standardized measure of discounted future net cash flows relating to our estimated proved crude oil and natural gas reserves as of December 31, 2010, 2009 and 2008 is presented below:
|
Year Ended December 31,
|
||||||||||||
|
Thousands of dollars
|
2010
|
2009
|
2008
|
|||||||||
|
Future cash inflows
|
$ | 5,097,644 | $ | 3,837,605 | $ | 3,523,524 | ||||||
|
Future development costs
|
(251,181 | ) | (197,709 | ) | (212,951 | ) | ||||||
|
Future production expense
|
(2,618,470 | ) | (2,103,381 | ) | (1,843,986 | ) | ||||||
|
Future net cash flows
|
2,227,993 | 1,536,515 | 1,466,587 | |||||||||
|
Discounted at 10% per year
|
(1,163,069 | ) | (776,893 | ) | (874,327 | ) | ||||||
|
Standardized measure of discounted future net cash flows
|
$ | 1,064,924 | $ | 759,622 | $ | 592,260 | ||||||
The standardized measure of discounted future net cash flows discounted at 10% from production of proved reserves was developed as follows:
|
|
1.
|
An estimate was made of the quantity of proved reserves and the future periods in which they are expected to be produced based on year-end economic conditions.
|
|
|
2.
|
In accordance with SEC guidelines, the reserve engineers’ estimates of future net revenues from our estimated proved properties and the present value thereof for 2010 and 2009 are made using unweighted average first-day-of-the-month oil and gas sales prices and are held constant throughout the life of the properties, except where such guidelines permit alternate treatment, including the use of fixed and determinable contractual price escalations. We have entered into various derivative instruments to fix or limit the prices relating to a portion of our oil and gas production. Derivative instruments in effect at December 31, 2010 are discussed in Note 5. Such derivative instruments are not reflected in the reserve reports. Representative unweighted average first-day-of-the-month market prices for the reserve reports for the year ended December 31, 2010 were $79.40 ($65.36 for Wyoming)
per barrel of oil and $4. 38 per MMBtu of gas. Representative unweighted average first-day-of-the-month market prices for the reserve reports for the year ended December 31, 2009 were $61.18 ($51.29 for Wyoming) per barrel of oil and $3.87 per MMBtu of gas.
|
|
|
3.
|
In accordance with SEC guidelines for 2008, the reserve engineers’ estimates of future net revenues from our estimated proved properties and the present value thereof are made using oil and gas prices in effect as of the dates of such estimates and are held constant throughout the life of the properties, except where such guidelines permit alternate treatment, including the use of fixed and determinable contractual price escalations. Representative market prices at the as-of date for the reserve reports as of December 31, 2008 were $44.60 ($20.12 for Wyoming) per barrel of oil, and $5.71 per MMBtu of gas.
|
|
|
4.
|
The future gross revenue streams were reduced by estimated future operating costs (including production and ad valorem taxes) and future development and abandonment costs, all of which were based on current costs. Future net cash flows assume no future income tax expense as we are essentially a non-taxable entity except for four tax-paying corporations whose future income tax liabilities on a discounted basis are insignificant.
|
The principal sources of changes in the standardized measure of the future net cash flows for the years ended December 31, 2010, 2009 and 2008 are presented below:
|
Year Ended December 31,
|
||||||||||||
|
Thousands of dollars
|
2010
|
2009
|
2008
|
|||||||||
|
Beginning balance
|
$ | 759,622 | $ | 592,260 | $ | 1,912,467 | ||||||
|
Sales, net of production expense
|
(175,213 | ) | (116,419 | ) | (305,376 | ) | ||||||
|
Net change in sales and transfer prices, net of production expense
|
306,311 | 217,756 | (1,306,752 | ) | ||||||||
|
Previously estimated development costs incurred during year
|
47,732 | 29,041 | 57,694 | |||||||||
|
Changes in estimated future development costs
|
(105,207 | ) | (37,002 | ) | (98,064 | ) | ||||||
|
Purchase of reserves in place
|
1,676 | - | - | |||||||||
|
Sale of reserves in-place
|
- | (4,001 | ) | - | ||||||||
|
Revision of quantity estimates and timing of estimated production
|
154,041 | 18,761 | 141,044 | |||||||||
|
Accretion of discount
|
75,962 | 59,226 | 191,247 | |||||||||
|
Ending balance
|
$ | 1,064,924 | $ | 759,622 | $ | 592,260 | ||||||
F-49
B. Quarterly Financial Data (Unaudited)
|
Year Ended December 31, 2010
|
||||||||||||||||
|
First
|
Second
|
Third
|
Fourth
|
|||||||||||||
|
Thousands of dollars except per unit amounts
|
Quarter
|
Quarter
|
Quarter
|
Quarter
|
||||||||||||
|
Oil, natural gas and natural gas liquid sales
|
$ | 80,469 | $ | 82,079 | $ | 77,055 | $ | 78,135 | ||||||||
|
Gain (loss) on derivative instruments, net
|
52,065 | 51,650 | (7,973 | ) | (60,630 | ) | ||||||||||
|
Other revenue, net
|
632 | 487 | 719 | 660 | ||||||||||||
|
Total revenue
|
133,166 | 134,216 | 69,801 | 18,165 | ||||||||||||
|
Operating income (loss)
|
63,889 | 60,595 | 577 | (61,318 | ) | |||||||||||
|
Net income (loss)
|
$ | 57,910 | $ | 53,597 | $ | (5,726 | ) | $ | (70,868 | ) | ||||||
|
Basic net income (loss) per limited partner unit (a)
|
$ | 1.02 | $ | 0.94 | $ | (0.11 | ) | $ | (1.25 | ) | ||||||
|
Diluted net income (loss) per limited partner unit (a)
|
$ | 1.02 | $ | 0.94 | $ | (0.11 | ) | $ | (1.25 | ) | ||||||
|
Year Ended December 31, 2009
|
||||||||||||||||
|
First
|
Second
|
Third
|
Fourth
|
|||||||||||||
|
Thousands of dollars except per unit amounts
|
Quarter
|
Quarter
|
Quarter
|
Quarter
|
||||||||||||
|
Oil, natural gas and natural gas liquid sales
|
$ | 57,643 | $ | 59,872 | $ | 62,674 | $ | 74,728 | ||||||||
|
Gain (loss) on derivative instruments, net
|
70,020 | (97,259 | ) | 12,719 | (36,917 | ) | ||||||||||
|
Other revenue, net
|
276 | 393 | 261 | 452 | ||||||||||||
|
Total revenue
|
127,939 | (36,994 | ) | 75,654 | 38,263 | |||||||||||
|
Operating income (loss)
|
53,696 | (104,346 | ) | 2,848 | (35,009 | ) | ||||||||||
|
Net income (loss)
|
$ | 46,357 | $ | (108,525 | ) | $ | (5,396 | ) | $ | (39,693 | ) | |||||
|
Basic net income (loss) per limited partner unit (a)
|
$ | 0.85 | $ | (2.06 | ) | $ | (0.10 | ) | $ | (0.75 | ) | |||||
|
Diluted net income (loss) per limited partner unit (a)
|
$ | 0.84 | $ | (2.06 | ) | $ | (0.10 | ) | $ | (0.75 | ) | |||||
(a) Due to changes in the number of weighted average common units outstanding that may occur each quarter, the earnings per unit amounts for certain quarters may not be additive.
(b) Fourth quarter 2010 includes $6.3 million for impairments related to proved and unproved properties.
F-50
EXHIBIT INDEX
|
NUMBER
|
DOCUMENT
|
|
|
3.1
|
Certificate of Limited Partnership of BreitBurn Energy Partners L.P. (incorporated herein by reference to Exhibit 3.1 to Amendment No. 1 to Form S-1 (File No. 333-134049) filed on July 13, 2006).
|
|
|
3.2
|
First Amended and Restated Agreement of Limited Partnership of BreitBurn Energy Partners L.P. (incorporated herein by reference to Exhibit 3.1 to the Current Report on Form 8-K (File No. 001-33055) filed on October 16, 2006).
|
|
|
3.3
|
Amendment No. 1 to the First Amended and Restated Agreement of Limited Partnership of BreitBurn Energy Partners L.P. (incorporated herein by reference to Exhibit 3.1 to the Current Report on Form 8-K (File No. 001-33055) filed on June 23, 2008).
|
|
|
3.4
|
Amendment No. 2 to the First Amended and Restated Agreement of Limited Partnership of BreitBurn Energy Partners L.P. (incorporated herein by reference to Exhibit 3.1 to the Current Report on Form 8-K (File No. 001-33055) filed April 9, 2009).
|
|
|
3.5
|
Amendment No. 3 to the First Amended and Restated Agreement of Limited Partnership of BreitBurn Energy Partners L.P. (incorporated herein by reference to Exhibit 3.1 to the Current Report on Form 8-K (File No. 001-33055) filed September 1, 2009).
|
|
|
3.6
|
Amendment No.4 to the First Amended and Restated Agreement of Limited Partnership of BreitBurn Energy Partners L.P. (incorporated herein by reference to Exhibit 3.1 to the Current Report on Form 8-K (File No. 001-33055) filed on April 9, 2010).
|
|
|
3.7
|
Fourth Amended and Restated Limited Liability Company Agreement of BreitBurn GP, LLC dated as of April 5, 2010 (incorporated herein by reference to Exhibit 3.2 to the Current Report on Form 8-K (File No. 001-33055) filed on April 9, 2011).
|
|
|
3.8
|
Amendment No. 1 to the Fourth Amended and Restated Limited Liability Company Agreement of BreitBurn GP, LLC dated as of December 30, 2010 (incorporated herein by reference to Exhibit 3.1 to the Current Report on Form 8-K (File No. 001-33055) filed on January 6, 2011).
|
|
|
4.1
|
Registration Rights Agreement, dated as of November 1, 2007, by and among BreitBurn Energy Partners L.P. and Quicksilver Resources Inc. (incorporated herein by reference to Exhibit 4.2 to the Current Report on Form 8-K (File No. 001-33055) filed on November 6, 2007).
|
|
|
4.2
|
First Amendment to the Registration Rights Agreement, dated as of April 5, 2010, by and among BreitBurn Energy Partners L.P. and Quicksilver Resources Inc. (incorporated herein by reference to Exhibit 4.1 to the Current Report on Form 8-K (File No. 001-33055) filed on April 9, 2010).
|
|
|
4.3
|
Unit Purchase Rights Agreement, dated as of December 22, 2008, between BreitBurn Energy Partners L.P. and American Stock Transfer & Trust Company LLC as Rights Agreement (incorporated herein by reference to Exhibit 4.1 to the Current Report on Form 8-K (File No. 001-33055) filed on December 23, 2008).
|
|
|
4.4
|
Indenture, dated as of October 6, 2010, by and among BreitBurn Energy Partners L.P., BreitBurn Finance Corporation, the Guarantors named therein and U.S. Bank National Association (incorporated herein by reference to Exhibit 4.1 to the Current Report on Form 8-K (File No. 001-33055) filed on October 7, 2010).
|
|
|
4.5
|
Registration Rights Agreement, dated as of October 6, 2010, by and among BreitBurn Energy Partners L.P., BreitBurn Finance Corporation, the Guarantors named therein and the Initial Purchasers named therein (incorporated herein by reference to Exhibit 4.2 to the Current Report on Form 8-K (File No. 001-33055) filed on October 7, 2010).
|
|
|
10.1
|
Amended and Restated Agreement of Limited Partnership of BreitBurn Energy Partners I, L.P. dated May 5, 2003 (incorporated herein by reference to Exhibit 10.2 to the Current Report on Form 8-K (File No. 001-33055) filed on May 29, 2007).
|
|
|
10.2
|
Contribution, Conveyance and Assumption Agreement, dated as of October 10, 2006, by and among Pro GP Corp., Pro LP Corp., BreitBurn Energy Corporation, BreitBurn Energy Company L.P., BreitBurn Management Company, LLC, BreitBurn GP, LLC, BreitBurn Energy Partners L.P., BreitBurn Operating GP, LLC and BreitBurn Operating L.P. (incorporated herein by reference to Exhibit 10.2 to the Current Report on Form 8-K (File No. 001-33055) filed on October 16, 2006).
|
F-51
|
NUMBER
|
DOCUMENT
|
|
|
10.3
|
Administrative Services Agreement, dated as of October 10, 2006, by and among BreitBurn GP, LLC, BreitBurn Energy Partners L.P., BreitBurn Operating L.P. and BreitBurn Management Company, LLC (incorporated herein by reference to Exhibit 10.4 to the Current Report on Form 8-K (File No. 001-33055) filed on October16, 2006).
|
|
|
10.4†
|
BreitBurn Energy Company L.P. Unit Appreciation Plan for Officers and Key Individuals (incorporated herein by reference to Exhibit 10.6 to Amendment No. 3 to Form S-1 (File No. 333-13409) for BreitBurn Energy Partners L.P. filed on September 19, 2006).
|
|
|
10.5†
|
Amendment No. 1 to the BreitBurn Energy Company L.P. Unit Appreciation Plan for Officers and Key Individuals (incorporated herein by reference to Exhibit 10.14 to Amendment No. 5 to Form S-1 (File No. 333-13409) for BreitBurn Energy Partners L.P. filed on October 2, 2006).
|
|
|
10.6
|
Contribution Agreement, dated as of September 11, 2007, between Quicksilver Resources Inc. and BreitBurn Operating L.P. (incorporated herein by reference to Exhibit 10.4 to the Current Report on Form 8-K (File No. 001-33055) filed on November 6, 2007).
|
|
|
10.7
|
Amendment to Contribution Agreement, dated effective as of November 1, 2007, between Quicksilver Resources Inc. and BreitBurn Operating L.P. (incorporated herein by reference to Exhibit 10.5 to the Current Report on Form 8-K (File No. 001-33055) filed on November 6, 2007).
|
|
|
10.8†
|
Form of BreitBurn Energy Partners L.P. 2006 Long-Term Incentive Plan Restricted Phantom Unit Agreement (Executive Form) (incorporated herein by reference to Exhibit 10.1 to the Current Report on Form 8-K (File No. 001-33055) filed on March 11, 2008).
|
|
|
10.9†
|
Form of BreitBurn Energy Partners L.P. 2006 Long-Term Incentive Plan Restricted Phantom Unit Agreement (Non-Executive Form) (incorporated herein by reference to Exhibit 10.2 to the Current Report on Form 8-K (File No. 001-33055) filed on March 11, 2008).
|
|
|
10.10†
|
Form of BreitBurn Energy Partners L.P. 2006 Long-Term Incentive Plan Restricted Phantom Units Directors’ Award Agreement (incorporated herein by reference to Exhibit 10.35 to the Annual Report on Form 10-K for the year ended December 31, 2007 (File No. 001-33055) and filed on March 17, 2008).
|
|
|
10.11
|
Amendment No. 1 to the Operations and Proceeds Agreement, relating to the Dominguez Field and dated October 10, 2006 entered into on June 17, 2008 by and between BreitBurn Energy Company L.P. and BreitBurn Operating L.P. (incorporated herein by reference to Exhibit 10.6 to the Current Report on Form 8-K (File No. 001-33055) filed on June 23, 2008).
|
|
|
10.12
|
Amendment No. 1 to the Surface Operating Agreement dated October 10, 2006 entered into on June 17, 2008 by and between BreitBurn Energy Company L.P. and its predecessor BreitBurn Energy Corporation and BreitBurn Operating L.P. (incorporated herein by reference to Exhibit 10.7 to the Current Report on Form 8-K (File No. 001-33055) filed on June 23, 2008).
|
|
|
10.13†
|
Form of BreitBurn Energy Partners L.P. 2006 Long-Term Incentive Plan Convertible Phantom Unit Agreement (Employment Agreement Form) (incorporated herein by reference to Exhibit 10.9 to the Quarterly Report on Form 10-Q for the period ended June 30, 2008 (File No. 001-33055) and filed on August 11, 2008).
|
|
|
10.14†
|
Form of BreitBurn Energy Partners L.P. 2006 Long-Term Incentive Plan Convertible Phantom Unit Agreement (Non-Employment Agreement Form) (incorporated herein by reference to Exhibit 10.10 to the Quarterly Report on Form 10-Q for the period ended June 30, 2008 and (File No. 001-33055) filed on August 11, 2008).
|
|
|
10.15
|
Second Amended and Restated Administrative Services Agreement dated August 26, 2008 by and between BreitBurn Energy Company L.P. and BreitBurn Management Company, LLC (incorporated herein by reference to Exhibit 10.1 to the Current Report on Form 8-K (File No. 001-33055) filed on September 02, 2008).
|
|
|
10.16
|
Omnibus Agreement, dated August 26, 2008, by and among BreitBurn Energy Holdings LLC, BEC (GP) LLC, BreitBurn Energy Company L.P, BreitBurn GP, LLC, BreitBurn Management Company, LLC and BreitBurn Energy Partners L.P. (incorporated herein by reference to Exhibit 10.2 to the Current Report on Form 8-K (File No. 001-33055) filed on September 02, 2008).
|
F-52
|
NUMBER
|
DOCUMENT
|
|
|
10.17
|
Indemnity Agreement between BreitBurn Energy Partners L.P., BreitBurn GP, LLC and Halbert S. Washburn, together with a schedule identifying other substantially identical agreements between BreitBurn Energy Partners L.P., BreitBurn GP, LLC and each of its executive officers and non-employee directors identified on the schedule (incorporated herein by reference to Exhibit 10.1 to the Current Report on form 8-K (File No. 001-33055) filed on November 4, 2009).
|
|
|
10.18†
|
First Amendment to the BreitBurn Energy Partners L.P. 2006 Long-Term Incentive Plan Convertible Phantom Unit Agreements (incorporated herein by reference to Exhibit 10.2 to the Current Report on form 8-K (File No. 001-33055) filed on November 4, 2009).
|
|
|
10.19†
|
First Amended and Restated BreitBurn Energy Partners L.P. 2006 Long-Term Incentive Plan effective as of October 29, 2009 (incorporated herein by reference to Exhibit 10.3 to the Quarterly Report on Form 10-Q for the period ended September 30, 2009 ((File No. 001-33055) filed on November 6, 2009).
|
|
|
10.20
|
Settlement Agreement as of April 5, 2010 by and among Quicksilver Resources Inc., BreitBurn Energy Partners L.P., BreitBurn GP LLC, Provident Energy Trust, Randall H. Breitenbach and Halbert S. Washburn (incorporated herein by reference to Exhibit 10.1 to the Current Report on Form 8-K filed on April 9, 2010).
|
|
|
10.26
|
Third Amended and Restated Employment Agreement dated December 30, 2010 among BreitBurn Management Company, LLC, BreitBurn GP, LLC, BreitBurn Energy Partners L.P. and Halbert S. Washburn (incorporated herein by reference to Exhibit 10.1 to the Current Report on Form 8-K (File No. 001-33055) filed on January 6, 2011).
|
|
|
10.27
|
Third Amended and Restated Employment Agreement dated December 30, 2010 among BreitBurn Management Company, LLC, BreitBurn GP, LLC, BreitBurn Energy Partners L.P. and Randall H. Breitenbach (incorporated herein by reference to Exhibit 10.2 to the Current Report on Form 8-K (File No. 001-33055) filed on January 6, 2011).
|
|
|
10.28
|
Amended and Restated Employment Agreement dated December 30, 2010 among BreitBurn Management Company, LLC, BreitBurn GP, LLC, BreitBurn Energy Partners L.P. and Mark L. Pease (incorporated herein by reference to Exhibit 10.3 to the Current Report on Form 8-K (File No. 001-33055) filed on January 6, 2011).
|
|
|
10.29
|
Second Amended and Restated Employment Agreement dated December 30, 2010 among BreitBurn Management Company, LLC, BreitBurn GP, LLC, BreitBurn Energy Partners L.P. and James G. Jackson (incorporated herein by reference to Exhibit 10.4 to the Current Report on Form 8-K (File No. 001-33055) filed on January 6, 2011).
|
|
|
10.30
|
Amended and Restated Employment Agreement dated December 30, 2010 among BreitBurn Management Company, LLC, BreitBurn GP, LLC, BreitBurn Energy Partners L.P. and Gregory C. Brown (incorporated herein by reference to Exhibit 10.5 to the Current Report on Form 8-K (File No. 001-33055) filed on January 6, 2011).
|
|
|
10.31
|
Second Amended and Restated Credit Agreement, dated May 7, 2010, by and among BreitBurn Operating L.P, as borrower, BreitBurn Energy Partners L.P., as parent guarantor, and Wells Fargo Bank, N.A., as administrative agent (incorporated herein by reference to Exhibit 10.1 to the Quarterly Report on Form 10-Q for the period ended March 31, 2010 (File No. 001-33055) filed on May 10, 2010).
|
F-53
|
NUMBER
|
DOCUMENT
|
|
|
10.32
|
First Amendment dated September 17, 2010 to the Second Amended and Restated Credit Agreement dated May 7, 2010, by and among BreitBurn Operating L.P, as borrower, BreitBurn Energy Partners L.P., as parent guarantor, and Wells Fargo Bank, N.A., as administrative agent (incorporated herein by reference to Exhibit 10.1 to the Current Report on Form 8-K (File No. 001-33055) filed on September 23, 2010).
|
|
|
14.1
|
BreitBurn Energy Partners L.P. and BreitBurn GP, LLC Code of Ethics for Chief Executive Officers and Senior Officers (as amended and restated on February 28, 2007) (incorporated herein by reference to Exhibit 14.1 to the Current Report on Form 8-K filed on March 5, 2007).
|
|
|
*
|
Filed herewith.
|
|
**
|
Furnished herewith.
|
|
†
|
Management contract or compensatory plan or arrangement.
|
F-54