Attached files
| file | filename |
|---|---|
| EX-31.2 - EX-31.2 - SYKES ENTERPRISES INC | b84685exv31w2.htm |
| EX-21.1 - EX-21.1 - SYKES ENTERPRISES INC | b84685exv21w1.htm |
| EX-23.1 - EX-23.1 - SYKES ENTERPRISES INC | b84685exv23w1.htm |
| EX-32.2 - EX-32.2 - SYKES ENTERPRISES INC | b84685exv32w2.htm |
| EX-32.1 - EX-32.1 - SYKES ENTERPRISES INC | b84685exv32w1.htm |
| EX-31.1 - EX-31.1 - SYKES ENTERPRISES INC | b84685exv31w1.htm |
Table of Contents
UNITED STATES SECURITIES AND EXCHANGE COMMISSION
Washington, D.C. 20549
FORM 10-K
Washington, D.C. 20549
FORM 10-K
[X] Annual Report Pursuant To Section 13 Or 15(d) Of The Securities Exchange Act Of 1934
For the fiscal year ended December 31, 2010
Or
[ ] Transition Report Pursuant To Section 13 Or 15(d) Of The Securities Exchange Act Of 1934
For The Transition Period From To
For the fiscal year ended December 31, 2010
Or
[ ] Transition Report Pursuant To Section 13 Or 15(d) Of The Securities Exchange Act Of 1934
For The Transition Period From To
Commission File Number 0-28274
Sykes Enterprises, Incorporated
(Exact name of registrant as specified in its charter)
Sykes Enterprises, Incorporated
(Exact name of registrant as specified in its charter)
| Florida | 56-1383460 | |
| (State or other jurisdiction of | (IRS Employer | |
| incorporation or organization) | Identification No.) |
| 400 N. Ashley Drive, Suite 2800, Tampa, Florida | 33602 | |
| (Address of principal executive offices) | (Zip Code) |
(813) 274-1000
(Registrant’s telephone number, including area code)
(Registrant’s telephone number, including area code)
Securities registered pursuant to Section 12(b) of the Act:
| Title of Each Class | Name of each exchange on which registered | |
| Common Stock $.01 Par Value | NASDAQ Stock Market, LLC |
Securities registered pursuant to Section 12(g) of the Act: None
Indicate by check mark if the registrant is a well-known seasoned issuer, as defined in Rule 405 of the Securities Act.
Yes [ ] No [X]
Indicate
by check mark if the registrant is not required to file reports pursuant to Section 13 or Section 15(d) of the Exchange Act.
Yes [ ] No [X]
Yes [ ] No [X]
Indicate by check mark whether the registrant (1) has filed all reports required to be filed by
Section 13 or 15 (d) of the Securities Exchange Act of 1934 during the preceding 12 months (or for
such shorter period that the registrant was required to file such reports), and (2) has been
subject to such filing requirements for the past 90 days.
Yes [X] No [ ]
Indicate by check mark whether the registrant has submitted electronically and posted on its
corporate Web site, if any, every Interactive Data File required to be submitted and posted
pursuant to Rule 405 of Regulation S-T during the preceding 12 months (or for such shorter period
that the registrant was required to submit and post such files).
Yes [ ] No [ ]
Indicate by check mark if disclosure of delinquent filers pursuant to Item 405 of Regulation S-K is
not contained herein, and will not be contained, to the best of registrant’s knowledge, in
definitive proxy or information statements incorporated by reference in Part III of this Form 10-K
or any amendment to this Form 10-K. [X]
Indicate by check mark whether the registrant is a large accelerated filer, an accelerated filer, a
non-accelerated filer or a smaller reporting company. See the definitions of “accelerated filer,”
“large accelerated filer” and “smaller reporting company” in Rule 12b-2 of the Exchange Act (Check
one):
| Large accelerated filer [ ] | Accelerated filer [X] | Non-accelerated filer [ ] (Do not check if a smaller reporting company) |
Smaller reporting company [ ] |
Indicate by check mark whether the registrant is a shell company (as defined in Rule 12b-2 of the
Exchange Act).
Yes [ ] No [X]
The aggregate market value of the shares of voting common stock held by non-affiliates of the
Registrant computed by reference to the closing sales price of such shares on the NASDAQ Global
Select Market on June 30, 2010, the last business day of the Registrant’s most recently completed
second fiscal quarter, was $580,104,317.
As of February 28, 2011, there were 47,075,251 outstanding shares of common stock.
DOCUMENTS INCORPORATED BY REFERENCE:
Documents
|
Form 10-K Reference | |
Portions of the Proxy Statement for the year 2011
Annual Meeting of Shareholders
|
Part III Items 10–14 |
TABLE OF CONTENTS
2
Table of Contents
PART I
Item 1. Business
General
Sykes Enterprises, Incorporated and consolidated subsidiaries (“SYKES,” “our,” “us” or “we”) is a
global leader in providing outsourced customer contact management solutions and services in the
business process outsourcing (“BPO”) arena. We provide an array of sophisticated customer contact
management solutions to a wide range of clients including Fortune 1000 companies, medium-sized
businesses, and public institutions around the world, primarily in the communications, financial
services, technology/consumer, transportation and leisure, healthcare and other verticals. We serve
our clients through two geographic operating regions: the Americas (United States, Canada, Latin
America, India and the Asia Pacific Rim) and EMEA (Europe, the Middle East and Africa). Our
Americas and EMEA groups primarily provide customer contact management services (with an emphasis
on inbound technical support and customer service), which includes customer assistance, healthcare
and roadside assistance, technical support and product sales to our client’s customers. These
services are delivered through multiple communication channels including phone, e-mail, Internet,
text messaging and chat. We also provide various enterprise support services in the United States
that include services for our client’s internal support operations, from technical staffing
services to outsourced corporate help desk services. In Europe, we also provide fulfillment
services including multilingual sales order processing via the Internet and phone, inventory
control, product delivery and product returns handling. (See Note 26, Segments and Geographic
Information, of “Notes to Consolidated Financial Statements” for further information on our
segments.) Our complete service offering helps our clients acquire, retain and increase the
lifetime value of their customer relationships. We have developed an extensive global reach with
customer contact management centers across six continents, including North America, South America,
Europe, Asia, Australia and Africa. We deliver cost-effective solutions that enhance the customer
service experience, promote stronger brand loyalty, and bring about high levels of performance and
profitability.
SYKES was founded in 1977 in North Carolina and we moved our headquarters to Florida in 1993. In
March 1996, we changed our state of incorporation from North Carolina to Florida. Our headquarters
are located at 400 North Ashley Drive, Suite 2800, Tampa, Florida 33602, and our telephone number
is (813) 274-1000.
On February 2, 2010, the Company completed the acquisition of ICT Group Inc. (“ICT”), a
Pennsylvania corporation and a leading global provider of outsourced customer management and BPO
solutions, pursuant to the Agreement and Plan of Merger, dated October 5, 2009. We refer to such
acquisition herein as the “ICT acquisition.” The Company has reflected the operating results in
the Consolidated Statement of Operations for the period from February 2, 2010 to December 31, 2010.
See Note 2, Acquisition of ICT, of “Notes to Consolidated Financial Statements” for additional
information on the acquisition of this business.
In December 2010, we committed to a plan and completed the sale of our Argentine operations,
pursuant to stock purchase agreements, dated December 16, 2010 and December 29, 2010. We have
reflected the operating results related to the Argentine operations as discontinued operations in
the Consolidated Statements of Operations for all periods presented. See Note 3, Discontinued
Operations, of “Notes to Consolidated Financial Statements” for additional information on the sale
of the Argentine operations.
Our Annual Report on Form 10-K, Quarterly Reports on Form 10-Q, Current Reports on Form 8-K, and
amendments to those reports, as well as our proxy statements and other materials which are filed
with, or furnished to, the Securities and Exchange Commission (“SEC”) are made available, free of
charge, on or through our Internet website at www.sykes.com (click on “Investor Relations” and then
“SEC Filings” under the heading “Financial Information”) as soon as reasonably practicable after
they are filed with, or furnished to, the SEC.
Industry Overview
We believe that growth for outsourced customer contact management solutions and services will be
fueled by the trend of global Fortune 1000 companies and medium-sized businesses turning to
outsourcers to provide high-quality, cost-effective, value-added customer contact management
solutions. Businesses continue to move toward integrated solutions that consist of a combination
of support from our onshore markets in the United States, Canada, Africa and Europe and offshore
markets in the Asia Pacific Rim and Latin America.
3
Table of Contents
In today’s ever-changing marketplace, companies require innovative customer contact management
solutions that allow them to enhance the end user’s experience with their products and services,
strengthen and enhance their company brands, maximize the lifetime value of their customers,
efficiently and effectively deliver human interaction when customers value it most, and deploy
best-in-class customer management strategies, processes and technologies.
Global competition, pricing pressures, softness in the global economy and rapid changes in
technology continue to make it difficult for companies to cost effectively maintain the in-house
personnel necessary to handle all of their customer contact management needs. As a result,
companies are increasingly turning to outsourcers to perform specialized functions and services in
the customer contact management arena. By working in partnership with outsourcers, companies can
ensure that the crucial task of retaining and growing their customer base is addressed.
Companies outsource customer contact management solutions for various reasons, including the need
to focus on core competencies, to drive service excellence and execution, to achieve cost savings,
to scale and grow geographies and niche markets, and to efficiently allocate capital within their
organizations.
To address these needs, we offer global customer contact management solutions that focus on
proactively identifying and solving our clients’ business challenges. We provide consistent
high-value support for our clients’ customers across the globe in a multitude of languages,
leveraging our dynamic, secure communications infrastructure and our global footprint that reaches
across 24 countries. This global footprint includes established operations in both onshore and
offshore geographic markets where companies have access to high-quality customer contact management
solutions at lower costs compared to other markets.
Business Strategy
Our goal is to proactively provide enhanced and value-added customer contact management solutions
and services, acting as a partner in our client’s business. We anticipate trends and deliver new
ways of growing our clients’ customer satisfaction and retention rates, and thus profit, through
timely, insightful and proven solutions.
Our business strategy encompasses building long-term client relationships, capitalizing on our
expert worldwide response team, leveraging our depth of relevant experience and expanding both
organically and through acquisitions. The principles of this strategy include the following:
Build Long-Term Client Relationships Through Operational Excellence. We believe that providing
high-value, high-quality service is critical in our clients’ decisions to outsource and in building
long-term relationships with our clients. To ensure service excellence and consistency across each
of our centers globally, we leverage a portfolio of techniques including SYKES Science of Service®.
This standard is a compilation of more than 30 years of experience and best practices. Every
customer contact management center strives to meet or exceed the standard, which addresses
leadership, hiring and training, performance management down to the agent level, forecasting and
scheduling, and the client relationship including continuous improvement, disaster recovery plans
and feedback.
Capitalize on Our Worldwide Response Team. Companies are demanding a customer contact management
solution that is global in nature — one of our key strengths. In addition to our network of
customer contact management centers throughout North America and Europe, we continue to develop our
global delivery model with operations in the Philippines, The Peoples Republic of China, Costa
Rica, El Salvador, Egypt, Romania, Norway and Brazil, offering our clients a secure, high-quality
solution tailored to the needs of their diverse and global markets. With the acquisition of ICT,
we expanded our global delivery model with operations in Mexico, India and Australia.
Maintain a Competitive Advantage Through Technology Solutions. For more than 30 years, we have been
an innovative pioneer in delivering customer contact management solutions. We seek to maintain a
competitive advantage and differentiation by utilizing technology to consistently deliver
innovative service solutions, ultimately enhancing the client’s relationship with its customers and
generating revenue growth. This includes knowledge solutions for agents and end customers,
automatic call distributors, interactive voice response systems, intelligent call routing and
workforce management capabilities based on agent skill and availability, call tracking software,
quality management systems and computer-telephony integration (“CTI”). CTI enables our customer
contact management centers to serve as transparent extensions for our clients, receive telephone
calls and data directly from our clients’ systems, and report detailed information concerning the
status and results of our services on a daily basis.
4
Table of Contents
Through strategic technology relationships, we are able to provide fully integrated communication
services encompassing e-mail, chat, text messaging and Internet self-service platforms. In
addition, we utilize Global Direct, our customer relationship management (“CRM”)/e-commerce
application for our European fulfillment operations. Global Direct establishes a platform whereby
our clients can manage all customer profile and contact information from every communication
channel, making it a viable customer-facing infrastructure solution to support their CRM
initiatives.
We are also continuing to capitalize on sophisticated technological capabilities, including our
current digital private network that provides us the ability to manage call volumes more
efficiently by load balancing calls and data between customer contact management centers over the
same network. Our converged voice and data digital communications network provides a high-quality,
fault tolerant global network for the transport of Voice Over Internet Protocol communications and
fully integrates with emergent Internet Protocol telephony systems as well as traditional Time
Domain Multiplexing telephony systems. Our flexible, secure and scalable network infrastructure
allows us to rapidly respond to changes in client voice and data traffic and quickly establish
support operations for new and existing clients.
Continue to Grow Our Business Organically and through Acquisitions. We have grown our customer
contact management outsourcing operations utilizing a strategy of both internal organic growth and
external acquisitions.
On February 2, 2010, we completed the ICT acquisition. The strategic rationale behind the
acquisition was as follows:
| • | Expanded Client Portfolio. We doubled the number of
new clients in the financial services and
communication verticals, thus deepening our expertise
within those verticals. |
||
| • | Accelerated Entry into New Verticals. ICT has
clients in the healthcare vertical in the United
States (“U.S.”), along with clients in the utilities
vertical, which are new to us. Accordingly, the ICT
acquisition provided an entry into those verticals on
an accelerated basis. |
||
| • | Extended Delivery Footprint. The ICT acquisition
extends our geographic footprint into India, Mexico
and Australia, providing us with additional delivery
capabilities for our existing clients. |
||
| • | Sustainable Revenue Growth and Margin Expansion. The
addition of ICT’s clients to our portfolio, together
with ICT’s expertise in certain verticals, provides us
with the ability to provide a greater depth of
services to existing clients, thereby creating revenue
growth rates that are expected to be more consistent
and sustainable than can be achieved by growth solely
from a new client sales pipeline. Additionally, the
increase in annual revenues permits the leverage of
our infrastructure to improve and sustain margins. |
||
| • | Revenue Scale. The increase in revenues resulting from the ICT
acquisition allows us to pursue client acquisition opportunities that
are larger and more complex in scope. |
||
| • | Reduced Client Concentration. The addition of new clients in new
verticals to our existing client portfolio further reduces our client
concentration, thereby further mitigating our risk profile. |
||
| • | ICT Acquisition Consideration Mix. The terms of the ICT acquisition
providing for each of ICT’s 16.364 million outstanding shares of
common stock to be converted into $7.69 in cash and 0.3423 of a share
of SYKES stock allowed us to achieve the benefits of the ICT
acquisition without depleting our cash reserves, thereby maintaining a
strong balance sheet. |
||
| • | Realization of Synergies. In 2010, we realized synergies of
approximately $28 million as a result of the ICT acquisition. These
synergies were realized primarily through the elimination of
duplicative general and administrative expenses, operational synergies
and implementation of our lower cost structure. |
5
Table of Contents
Our organic growth strategy is to target markets, clients, verticals, delivery geographies and
service mix that will expand our addressable market opportunity, and thus drive our organic growth.
Entry into Brazil, Romania, Egypt and El Salvador are examples of how we leveraged these new
delivery geographies to further penetrate our base of both existing and new clients, verticals and
service mix in order to drive organic growth.
Growth Strategy
Applying the key principles of our business strategy, we execute our growth strategy by focusing on
the following levers.
Maximizing Capacity Utilization Rates and Strategically Adding Seat Capacity. The key driver of our
revenues is increasing the capacity utilization rate in conjunction with seat capacity additions.
With the acquisition of ICT and our organic expansion, net of the sale of our Argentine operations,
our seats increased to 42,700 from 32,700 in 2010. We plan to sustain our focus on increasing the
capacity utilization rate by further penetrating existing clients, adding new clients and
rationalizing seat capacity as deemed necessary.
Broadening Global Delivery Footprint. Just as increased capacity utilization rates and increased
seat capacity are key drivers of our revenues, where we deploy the seat capacity geographically is
also important. By broadening and continuously strengthening our global delivery footprint, we are
able to meet both our existing and new clients’ customer contact management needs globally as they
enter new markets. As a result of the ICT acquisition and our organic expansion, net of the sale of
our Argentine operations, our footprint increased to 24 countries from 20 countries in 2010.
Increasing Share of Seats Within Existing Clients and Winning New Clients. We provide customer
contact management support to over 100 multinational companies. With this client list, we have the
opportunity to grow our client base. We strive to achieve this by winning a greater share of our
clients’ in-house seats as well as gain share from our competitors by providing consistently
high-quality service. In addition, as we further leverage our knowledge of verticals and business
lines, we plan to win new clients as a way to broaden our base of growth.
Diversifying Verticals and Expanding Service Lines. To mitigate the impact of economic and product
cycles on our growth rate, we continue to seek ways to diversify into verticals and service lines
that have countercyclical features and healthy growth rates. We are targeting the following
verticals for growth: communications, financial services, technology/consumer, healthcare and
transportation and leisure. These verticals cover various business lines, including wireless
services, broadband, retail banking, credit card/consumer fraud protection, content moderation,
telemedicine and travel portals. The ICT acquisition expanded our presence in the utilities
vertical, in addition to our target verticals.
Creating Value-Added Service Enhancements. To improve both revenue and margin expansion, we will
continue to introduce new service offerings and add-on enhancements. Bilingual customer support
and back office services are examples of horizontal service offerings, while data analytics and
process improvement products are examples of add-on enhancements.
Continuing to Focus on Expanding the Addressable Market Opportunities. As part of our growth
strategy, we continually seek to expand the number of markets we serve. The United States, Canada
and Germany, for instance, are markets, which are served by either in-country or from offshore
regions, or a combination thereof. We continually seek ways to broaden the addressable market for
our customer contact management services. We expanded our market presence to 18 from 17 in 2010
with the addition of Australia through the ICT acquisition and Norway, offset by the sale of our
Argentine operations.
Services
We specialize in providing inbound outsourced customer contact management solutions in the BPO
arena on a global basis. Our customer contact management services are provided through two
operating segments — the Americas and EMEA. The Americas region, representing 81% of consolidated
revenues in 2010, includes the United States, Canada, Latin America, India and the Asia Pacific
Rim. The sites within Latin America, India and the Asia Pacific Rim are included in the Americas
region as they provide a significant service delivery vehicle for U.S. based companies that are
utilizing our customer contact management solutions in these locations to support their customer
care needs. The EMEA region, representing 19% of consolidated revenues in 2010, includes Europe,
the Middle East and Africa. See Note 26, Segments and Geographic Information, of “Notes to
Consolidated Financial Statements” for further information on our segments. The following is a
description of our customer contact management solutions:
6
Table of Contents
Outsourced Customer Contact Management Services. Our outsourced customer contact management
services represented approximately 98% of total 2010 consolidated revenues. Each year we handle
over 250 million customer contacts including phone, e-mail, Internet, text messaging and chat
throughout the Americas and EMEA regions. We provide these services utilizing our advanced
technology infrastructure, human resource management skills and industry experience. These services
include:
| § | Customer care — Customer care contacts primarily include product information requests,
describing product features, activating customer accounts, resolving complaints,
cross-selling/up-selling, handling billing inquiries, changing addresses, claims handling,
ordering/reservations, prequalification and warranty management, providing health information
and roadside assistance; |
|
| § | Technical support — Technical support contacts primarily include handling inquiries
regarding hardware, software, communications services, communications equipment, Internet
access technology and Internet portal usage; and |
|
| § | Acquisition — Our acquisition services are primarily focused on inbound up-selling of our
client’s products and services. |
We provide these services, primarily inbound customer calls, through our extensive global network
of customer contact management centers in a multitude of languages. Our technology infrastructure
and managed service solutions allow for effective distribution of calls to one or more centers.
These technology offerings provide our clients and us with the leading edge tools needed to
maximize quality and customer satisfaction while controlling and minimizing costs.
Fulfillment Services. In Europe, we offer fulfillment services that are integrated with our
customer care and technical support services. Our fulfillment solutions include multilingual sales
order processing via the Internet and phone, payment processing, inventory control, product
delivery and product returns handling.
Enterprise Support Services. In the United States, we provide a range of enterprise support
services including technical staffing services and outsourced corporate help desk solutions.
Operations
Customer Contact Management Centers. At the end of 2010, we operated across 24 countries in 83
customer contact management centers, which breakdown as follows: 23 centers across Europe, Egypt
and South Africa, 27 centers in the United States, 10 centers in Canada, 3 centers in Australia and
20 centers offshore, including The Peoples Republic of China, the Philippines, Costa Rica, El
Salvador, India, Mexico and Brazil.
In an effort to stay ahead of industry off-shoring trends, we opened our first offshore customer
contact management centers in the Philippines and Costa Rica over ten years ago. Since then, we
have expanded into centers in The People’s Republic of China, El Salvador, Egypt, India, Mexico and
Brazil.
We utilize a sophisticated workforce management system to provide efficient scheduling of
personnel. Our internally developed digital private communications network complements our
workforce by allowing for effective call volume management and disaster recovery backup. Through
this network and our dynamic intelligent call routing capabilities, we can rapidly respond to
changes in client call volumes and move call volume traffic based on agent availability and skill
throughout our network of centers, improving the responsiveness and productivity of our agents. We
also can offer cost competitive solutions for taking calls to our offshore locations.
Our sophisticated data warehouse captures and downloads customer contact information for reporting
on a daily, real-time and historical basis. This data provides our clients with direct visibility
into the services that we are providing for them. The data warehouse supplies information for our
performance management systems such as our agent scorecarding application, which provides
management with the information required for effective management of our operations.
Our customer contact management centers are protected by a fire extinguishing system, backup
generators with significant capacity and 24 hour refueling contracts and short-term battery backups
in the event of a power outage, reduced voltage or a power surge. Rerouting of call volumes to
other customer contact management centers is also
7
Table of Contents
available in the event of a telecommunications failure, natural disaster or other emergency.
Security measures are imposed to prevent unauthorized physical access. Software and related data
files are backed up daily and stored off site at multiple locations. We carry business interruption
insurance covering interruptions that might occur as a result of certain types of damage to our
business.
Fulfillment Centers. We currently have two fulfillment centers located in Europe. We provide our
fulfillment services primarily to certain clients operating in Europe who desire this complementary
service in connection with outsourced customer contact management services.
Enterprise Support Services Offices. Our two enterprise support services offices are located in
metropolitan areas in the United States to provide a recruiting platform for high-end knowledge
workers and to establish a local presence to service major accounts.
Quality Assurance
We believe that providing consistent high-quality service is critical in our clients’ decision to
outsource and in building long-term relationships with our clients. It is also our belief and
commitment that quality is the responsibility of each individual at every level of the
organization. To ensure service excellence and continuity across our organization, we have
developed an integrated Quality Assurance program consisting of three major components:
| § | The certification of client accounts and customer contact management centers to the SYKES
Science of Service® and Site of Excellence programs; |
|
| § | The application of continuous improvement through application of our Data Analytics and Six
Sigma techniques; and |
|
| § | The application of process audits to all work procedures. |
The SYKES Science of Service® is a standard that was developed based on our more than 30 years of
experience, and best practices from industry standards such as the Malcolm Baldrige National
Quality Award and Customer Operations Performance Center. It specifies the requirements that must
be met in each of our customer contact management centers including measured performance against
our standard operating procedures. It has a well-defined auditing process that ensures compliance
with the SYKES’ standards. Our focus is on quality, predictability and consistency over time, not
just point in time certification.
The application of continuous improvement is based upon the five-step Six Sigma cycle, which we
have fine-tuned to apply specifically to our service industry. All managers are responsible for
continuous improvement in their operations.
Process audits are used to verify that processes and procedures are consistently executed as
required by established documentation. Process audits are applicable to services being provided for
the client and internal procedures.
Sales and Marketing
Our sales and marketing objective is to leverage our expertise and global presence to develop
long-term relationships with existing and future clients. Our customer contact management solutions
have been developed to help our clients acquire, retain and increase the value of their customer
relationships. Our plans for increasing our visibility include market-focused advertising,
consultative personal visits, participation in market-specific trade shows and seminars, speaking
engagements, articles and white papers, and our website.
Our sales force is composed of business development managers who pursue new business opportunities
and strategic account managers who manage and grow relationships with existing accounts. We
emphasize account development to strengthen relationships with existing clients. Business
development management and strategic account managers are assigned to markets in their area of
expertise in order to develop a complete understanding of each client’s particular needs, to form
strong client relationships and encourage cross-selling of our other service offerings. We have
inside customer sales representatives who receive customer inquiries and who provide outbound lead
generation for the business development managers. We also have relationships with channel partners
including systems integrators, software and hardware vendors and value-added resellers, where we
pair our solutions and services with their product offering or focus. We plan to maintain and
expand these relationships as part of our sales and marketing strategy.
8
Table of Contents
As part of our marketing efforts, we invite existing and potential clients to visit our customer
contact management centers, where we can demonstrate the expertise of our skilled staff in
partnering to deliver new ways of growing clients’ customer satisfaction and retention rates, and
thus profit, through timely, insightful and proven solutions. During these visits, we demonstrate
our ability to quickly and effectively support a new client or scale business from an existing
client by emphasizing our systematic approach to implementing customer contact solutions throughout
the world.
Clients
In 2010, we provided service to clients from our locations in the United States, Canada, Latin
America, Europe, the Philippines, The Peoples Republic of China, India and Africa. These clients
are Fortune 1000 corporations, medium-sized businesses and public institutions, which span the
communications, financial services, technology/consumer, transportation and leisure, healthcare and
other industries. Revenue by vertical market for 2010, as a percentage of our consolidated
revenues, was 33% for communications, 25% for financial services, 21% for technology/consumer, 7%
for transportation and leisure, 7% for healthcare, and 7% for all other vertical markets, including
government, retail and utilities. We believe our globally recognized client base presents
opportunities for further cross marketing of our services.
Total consolidated revenues included $154.1 million, or 13.3%, of consolidated revenues for 2010
from AT&T Corporation, a major provider of communication services for which we provide various
customer support services, compared to $111.3 million, or 13.7% for 2009. This included $147.6
million in revenues from the Americas and $6.5 million in revenues from EMEA for 2010 and $102.1
million in revenues from the Americas and $9.2 million in revenues from EMEA for 2009. Our top ten
clients accounted for approximately 41% of our consolidated revenues in 2010, a decrease from 48%
in 2009. Our broader base of clients in 2010, primarily due to the ICT acquisition, resulted in a
reduction in client concentration; therefore, a lower percentage of consolidated revenues
originated from our top ten clients. The loss of (or the failure to retain a significant amount of
business with) any of our key clients could have a material adverse effect on our performance. Many
of our contracts contain penalty provisions for failure to meet minimum service levels and are
cancelable by the client at any time or on short notice. Also, clients may unilaterally reduce
their use of our services under our contracts without penalty.
Competition
The industry in which we operate is global and, therefore, highly fragmented and extremely
competitive. While many companies provide customer contact management solutions and services, we
believe no one company is dominant in the industry.
In most cases, our principal competition stems from our existing and potential clients’ in-house
customer contact management operations. When it is not the in-house operations of a client, our
public and private direct competition includes TeleTech, Sitel, APAC Customer Services, Convergys,
West Corporation, Stream, Aegis BPO, Sutherland, 24/7 Customer, vCustomer, StarTek, Atento,
Teleperformance, and NCO Group as well as the customer care arm of such companies as Accenture,
Wipro, Infosys and IBM. There are other numerous and varied providers of such services, including
firms specializing in various CRM consulting, other customer management solutions providers, niche
or large market companies, as well as product distribution companies that provide fulfillment
services. Some of these companies possess substantially greater resources, greater name recognition
and a more established customer base than we do.
We believe that the most significant competitive factors in the sale of outsourced customer contact
management services include service quality, tailored value-added service offerings, industry
experience, advanced technological capabilities, global coverage, reliability, scalability,
security, price and financial strength. As a result of intense competition, outsourced customer
contact management solutions and services frequently are subject to pricing pressure. Clients also
require outsourcers to be able to provide services in multiple locations. Competition for
contracts for many of our services takes the form of competitive bidding in response to requests
for proposal.
Intellectual Property
We own and/or have applied to register numerous trademarks and service marks in the United States
and/or in many additional countries throughout the world. Our registered trademarks and service
marks include SYKES®, REAL PEOPLE. REAL SOLUTIONS®, SCIENCE OF
SERVICE®, CLEARCALL®, I AM SYKES. HOW FAR WILL
9
Table of Contents
YOU LET ME TAKE YOU?
®, and ICT®. The duration of trademark registrations varies from country to
country, but may generally be renewed indefinitely as long as they are in use and/or their
registrations are properly maintained.
Employees
As of January 31, 2011, we had approximately 43,400 employees worldwide, including 40,400 customer
contact agents handling technical and customer support inquiries at our centers, 2,800 in
management, administration, information technology, finance, sales and marketing roles, 100 in
enterprise support services, and 100 in fulfillment services.
We have never suffered a material interruption of business as a result of a labor dispute. Due to
laws in their respective countries, Brazil and Spain require that wages are collectively bargained
for certain non-management employees. The negotiations are conducted irrespective of the
individual employee’s member status relative to the union. In the two countries, approximately
1,600 employees are governed by laws whereby their wages are determined by collective bargaining:
200 in Brazil and 1,400 in Spain. We consider our relations with our employees worldwide to be
satisfactory.
We employ personnel through a continually updated recruiting network. This network includes a
seasoned team of recruiters, competency-based selection standards and the sharing of global best
practices in order to advertise and source qualified candidates through proven recruiting
techniques. Nonetheless, demand for qualified professionals with the required language and
technical skills may still exceed supply at times as new skills are needed to keep pace with the
requirements of customer engagements. As such, competition for such personnel is intense and
employee turnover in our industry is high.
Executive Officers
The following table provides the names and ages of our executive officers, and the positions and
offices currently held by each of them:
Name |
Age | Principal Position | |||||
Charles E. Sykes
|
48 | President and Chief Executive Officer and Director | |||||
W. Michael Kipphut
|
57 | Executive Vice President and Chief Financial Officer | |||||
James C. Hobby
|
60 | Executive Vice President, Global Operations | |||||
Jenna R. Nelson
|
47 | Executive Vice President, Global Human Resources | |||||
Daniel L. Hernandez
|
44 | Executive Vice President, Global Strategy | |||||
David L. Pearson
|
52 | Executive Vice President and Chief Information Officer | |||||
Lawrence R. Zingale
|
55 | Executive Vice President, Global Sales and Client Management | |||||
James T. Holder
|
52 | Executive Vice President, General Counsel and Corporate Secretary | |||||
William N. Rocktoff
|
48 | Global Vice President and Corporate Controller | |||||
Charles E. Sykes joined SYKES in 1986 and was named President and Chief Executive Officer and
Director in August 2004. From July 2003 to August 2004, Mr. Sykes was the Chief Operating Officer.
From March 2000 to June 2001, Mr. Sykes was Senior Vice President, Marketing, and in June 2001, he
was appointed to the position of General Manager, Senior Vice President — the Americas. From
December 1996 to March 2000, he served as Vice President, Sales, and held the position of Regional
Manager of the Midwest Region for Professional Services from 1992 until 1996.
W. Michael Kipphut, C.P.A., joined SYKES in March 2000 as Vice President and Chief Financial
Officer and was named Senior Vice President and Chief Financial Officer in June 2001. In May 2010,
he was named Executive Vice President and Chief Financial Officer. From September 1998 to February
2000, Mr. Kipphut held the position of Vice President and Chief Financial Officer for USA Floral
Products, Inc., a publicly-held, worldwide, perishable products distributor. From September 1994
until September 1998, Mr. Kipphut held the position of Vice President and Treasurer for Spalding &
Evenflo Companies, Inc., a global manufacturer of consumer products. Previously, Mr. Kipphut held
various financial positions, including Vice President and Treasurer, in his 17 years at Tyler
Corporation, a publicly-held, diversified holding company.
James C. Hobby joined SYKES in August 2003 as Senior Vice President, the Americas, overseeing the
daily operations, administration and development of SYKES’ customer care and enterprise support
operations throughout
10
Table of Contents
North America, Latin America, the Asia Pacific Rim and India, and was named
Senior Vice President, Global Operations, in January 2005. In May 2010, he was named Executive Vice
President, Global Operations. Prior to joining SYKES, Mr. Hobby held several positions at Gateway,
Inc., most recently serving as President of Consumer Customer Care since August 1999. From January
1999 to August 1999, Mr. Hobby served as Vice President of European Customer Care for Gateway, Inc.
From January 1996 to January 1999, Mr. Hobby served as the Vice President of European Customer
Service Centers at American Express. Prior to January 1996, Mr. Hobby held various senior
management positions in customer care at FedEx Corporation since 1983, mostly recently serving as
Managing Director, European Customer Service Operations.
Jenna R. Nelson joined SYKES in August 1993 and was named Senior Vice President, Human Resources,
in July 2001. In May 2010, she was named Executive Vice President, Global Human Resources. From
January 2001 until July 2001, Ms. Nelson held the position of Vice President, Human Resources. In
August 1998, Ms. Nelson was appointed Vice President, Human Resources, and held the position of
Director, Human Resources and Administration, from August 1996 to July 1998. From August 1993 until
July 1996, Ms. Nelson served in various management positions within SYKES, including Director of
Administration.
Daniel L. Hernandez joined SYKES in October 2003 as Senior Vice President, Global Strategy
overseeing marketing, public relations, operational strategy and corporate development efforts
worldwide. In May 2010, he was named Executive Vice President, Global Strategy. Prior to joining
SYKES, Mr. Hernandez served as President and Chief Executive Officer of SBC Internet Services, a
division of SBC Communications Inc., since March 2000. From February 1998 to March 2000, Mr.
Hernandez held the position of Vice President/General Manager, Internet and System Operations, at
Ameritech Interactive Media Services. Prior to February 1998, Mr. Hernandez held various management
positions at US West Communications since joining the telecommunications provider in 1990.
David L. Pearson joined SYKES in February 1997 as Vice President, Engineering, and was named Vice
President, Technology Systems Management, in 2000 and Senior Vice President and Chief Information
Officer in August 2004. In May 2010, he was named Executive Vice President and Chief Information
Officer. Prior to SYKES, Mr. Pearson held various engineering and technical management roles over a
fifteen year period, including eight years at Compaq Computer Corporation and five years at Texas
Instruments.
Lawrence R. Zingale joined SYKES in January 2006 as Senior Vice President, Global Sales and Client
Management. In May 2010, he was named Executive Vice President, Global Sales and Client Management.
Prior to joining SYKES, Mr. Zingale served as Executive Vice President and Chief Operating Officer
of StarTek, Inc. since 2002. From December 1999 until November 2001, Mr. Zingale served as
President of the Americas at Stonehenge Telecom, Inc. From May 1997 until November 1999, Mr.
Zingale served as President and Chief Operating Officer of International Community Marketing. From
February 1980 until May 1997, Mr. Zingale held various senior level positions at AT&T.
James T. Holder, J.D., C.P.A joined SYKES in December 2000 as General Counsel and was named
Corporate Secretary in January 2001, Vice President in January 2004 and Senior Vice President in
December 2006. In May 2010, he was named Executive Vice President. From November 1999 until
November 2000, Mr. Holder served in a consulting capacity as Special Counsel to Checkers Drive-In
Restaurants, Inc., a publicly held restaurant operator and franchisor. From November 1993 until
November 1999, Mr. Holder served in various capacities at Checkers including Corporate Secretary,
Chief Financial Officer and Senior Vice President and General Counsel.
William N. Rocktoff, C.P.A., joined SYKES in August 1997 as Corporate Controller and was named
Treasurer and Corporate Controller in December 1999 and Vice President and Corporate Controller in
March 2002. In January 2011, he was named Global Vice President and Corporate Controller. From
November 1989 to August 1997, Mr. Rocktoff held various financial positions, including Corporate
Controller, at Kimmins Corporation, a publicly-held contracting company.
Item 1A. Risk Factors
Factors Influencing Future Results and Accuracy of Forward-Looking Statements
This Annual Report on Form 10-K contains forward-looking statements (within the meaning of the
Private Securities Litigation Reform Act of 1995) that are based on current expectations,
estimates, forecasts, and projections about us, our beliefs, and assumptions made by us. In
addition, we may make other written or oral statements, which constitute forward-looking
statements, from time to time. Words such as “may,” “expects,”
11
Table of Contents
“projects,” “anticipates,”
“intends,” “plans,” “believes,” “seeks,” “estimates,” variations of such words, and similar
expressions are intended to identify such forward-looking statements. Similarly, statements that
describe our future plans, objectives or goals also are forward-looking statements. These
statements are not guarantees of future performance and are subject to a number of risks and
uncertainties, including those discussed below and elsewhere in this Annual Report on Form 10-K.
Our actual results may differ materially from what is expressed or forecasted in such
forward-looking statements, and undue reliance should not be placed on such statements. All
forward-looking statements are made as of the date hereof, and we undertake no obligation to update
any forward-looking statements, whether as a result of new information, future events or otherwise.
Factors that could cause actual results to differ materially from what is expressed or forecasted
in such forward-looking statements include, but are not limited to: the marketplace’s continued
receptivity to our terms and elements of services offered under our standardized contract for
future bundled service offerings; our ability to continue the growth of our service revenues
through additional customer contact management centers; our ability to further penetrate into
vertically integrated markets; our ability to expand revenues within the global markets; our
ability to continue to establish a competitive advantage through sophisticated technological
capabilities, and the following risk factors:
Risks Related to Our Business and Industry
Unfavorable general economic conditions could negatively impact our operating results and financial
condition.
Unfavorable general economic conditions could negatively affect our business. While it is often
difficult to predict the impact of general economic conditions on our business, these conditions
could adversely affect the demand for some of our client’s products and services and, in turn,
could cause a decline in the demand for our services. Also, our clients may not be able to obtain
adequate access to credit, which could affect their ability to make timely payments to us. If that
were to occur, we could be required to increase our allowance for doubtful accounts, and the number
of days outstanding for our accounts receivable could increase. In addition, we may not be able to
renew our revolving credit facility at terms that are as favorable as those terms available under
our current credit facility. Also, the group of lenders under our credit facility may not be able
to fulfill their funding obligations, which could adversely impact our liquidity. For these
reasons, among others, if the current economic conditions persist or decline, this could adversely
affect our revenues, operating results and financial condition, as well as our ability to access
debt under comparable terms and conditions.
Our business is dependent on key clients, and the loss of a key client could adversely affect our
business and
results of operations.
We derive a substantial portion of our revenues from a few key clients. Our top ten clients
accounted for approximately 41% of our consolidated revenues in 2010. The loss of (or the failure
to retain a significant amount of business with) any of our key clients could have a material
adverse effect on our business, financial condition and results of operations. Many of our
contracts contain penalty provisions for failure to meet minimum service levels and are cancelable
by the client at any time or on short-term notice. Also, clients may unilaterally reduce their use
of our services under these contracts without penalty. Thus, our contracts with our clients do not
ensure that we will generate a minimum level of revenues.
Improper disclosure or control of personal information could result in liability and harm our
reputation, which could adversely affect our business and results of operations.
Our business involves the use, storage and transmission of information about our employees, our
clients and customers of our clients. While we take measures to protect the security and privacy of
this information and to prevent unauthorized access, it is possible that our security controls over
personal data and other practices we follow may not prevent the improper access to or disclosure of
personally identifiable information. Such disclosure could harm our reputation and subject us to
liability under our contracts and laws that protect personal data, resulting in increased costs or
loss of revenue. Further, data privacy is subject to frequently changing rules and regulations,
which sometimes conflict among the various jurisdictions and countries in which we provide
services. Our failure to adhere to or successfully implement processes in response to changing
regulatory requirements in this area could result in legal liability or impairment to our
reputation in the marketplace, which could have a material adverse effect on our business,
financial condition and results of operations.
12
Table of Contents
Our business is subject to substantial competition.
The markets for many of our services operate on a commoditized basis and are highly competitive and
subject to rapid change. While many companies provide outsourced customer contact management
services, we believe no one company is dominant in the industry. There are numerous and varied
providers of our services, including firms specializing in call center operations, temporary
staffing and personnel placement, consulting and integration firms, and niche providers of
outsourced customer contact management services, many of whom compete in only certain markets. Our
competitors include both companies who possess greater resources and name recognition than we do,
as well as small niche providers that have few assets and regionalized (local) name recognition
instead of global name recognition. In addition to our competitors, many companies who might
utilize our services or the services of one of our competitors may utilize in-house personnel to
perform such services. Increased competition, our failure to compete successfully, pricing
pressures, loss of market share and loss of clients could have a material adverse effect on our
business, financial condition and results of operations.
Many of our large clients purchase outsourced customer contact management services from multiple
preferred vendors. We have experienced and continue to anticipate significant pricing pressure from
these clients in order to remain a preferred vendor. These companies also require vendors to be
able to provide services in multiple locations. Although we believe we can effectively meet our
clients’ demands, there can be no assurance that we will be able to compete effectively with other
outsourced customer contact management services companies on price. We believe that the most
significant competitive factors in the sale of our core services include the standard requirements
of service quality, tailored value-added service offerings, industry experience, advanced
technological capabilities, global coverage, reliability, scalability, security, price and
financial strength.
Our business is dependent on the trend toward outsourcing.
Our business and growth depend in large part on the industry trend toward outsourced customer
contact management services. Outsourcing means that an entity contracts with a third party, such as
us, to provide customer contact services rather than perform such services in-house. There can be
no assurance that this trend will continue, as organizations may elect to perform such services
themselves. A significant change in this trend could have a material adverse effect on our
business, financial condition and results of operations. Additionally, there can be no assurance
that our cross-selling efforts will cause clients to purchase additional services from us or adopt
a single-source outsourcing approach.
We are subject to various uncertainties relating to future litigation.
We cannot predict whether any material suits, claims, or investigations may arise in the future.
Regardless of the outcome of any future actions, claims, or investigations, we may incur
substantial defense costs and such actions may cause a diversion of management time and attention.
Also, it is possible that we may be required to pay substantial damages or settlement costs which
could have a material adverse effect on our financial condition and results of operations.
Our industry is subject to rapid technological change which could affect our business and results
of operations.
Rapid technological advances, frequent new product introductions and enhancements, and changes in
client requirements characterize the market for outsourced customer contact management services.
Technological advancements in voice recognition software, as well as self-provisioning and
self-help software, along with call avoidance technologies, have the potential to adversely impact
call volume growth and, therefore, revenues. Our future success will depend in large part on our
ability to service new products, platforms and rapidly changing technology. These factors will
require us to provide adequately trained personnel to address the increasingly sophisticated,
complex and evolving needs of our clients. In addition, our ability to capitalize on our
acquisitions will depend on our ability to continually enhance software and services and adapt such
software to new hardware and operating system requirements. Any failure by us to anticipate or
respond rapidly to technological advances, new products and enhancements, or changes in client
requirements could have a material adverse effect on our business, financial condition and results
of operations.
Our business relies heavily on technology and computer systems, which subjects us to various
uncertainties.
We have invested significantly in sophisticated and specialized communications and computer
technology and have focused on the application of this technology to meet our clients’ needs. We
anticipate that it will be necessary to
13
Table of Contents
continue to invest in and develop new and enhanced
technology on a timely basis to maintain our competitiveness. Significant capital expenditures may
be required to keep our technology up-to-date. There can be no assurance that any of our
information systems will be adequate to meet our future needs or that we will be able to
incorporate new technology to enhance and develop our existing services. Moreover, investments in
technology, including future investments in upgrades and enhancements to software, may not
necessarily maintain our competitiveness. Our future success will also depend in part on our
ability to anticipate and develop information technology solutions that keep pace with evolving
industry standards and changing client demands.
Emergency interruption of customer contact management center operations could affect our business
and results of operations.
Our operations are dependent upon our ability to protect our customer contact management centers
and our information databases against damage that may be caused by fire, earthquakes, severe
weather and other disasters, power failure, telecommunications failures, unauthorized intrusion,
computer viruses and other emergencies. The temporary or permanent loss of such systems could have
a material adverse effect on our business, financial condition and results of operations.
Notwithstanding precautions taken to protect us and our clients from events that could interrupt
delivery of services, there can be no assurance that a fire, natural disaster, human error,
equipment malfunction or inadequacy, or other event would not result in a prolonged interruption in
our ability to provide services to our clients. Such an event could have a material adverse effect
on our business, financial condition and results of operations.
Our operating results will be adversely affected if we are unable to maximize our facility capacity
utilization.
Our profitability is significantly influenced by our ability to effectively manage our contact
center capacity utilization. The majority of our business involves technical support and customer
care services initiated by our clients’ customers, and as a result, our capacity utilization varies
and demands on our capacity are, to some degree, beyond our control. In order to create the
additional capacity necessary to accommodate new or expanded outsourcing projects, we may need to
open new contact centers. The opening or expansion of a contact center may result, at least in the
short term, in idle capacity until we fully implement the new or expanded program. Additionally,
the occasional need to open customer contact centers fully, or primarily, dedicated to a single
client, instead of spreading the work among existing facilities with idle capacity, negatively
affects capacity utilization. We periodically assess the expected long-term capacity utilization of
our contact centers. As a result, we may, if deemed necessary, consolidate, close or partially
close under-performing contact centers to maintain or improve targeted utilization and margins.
There can be no guarantee that we will be able to achieve or maintain optimal utilization of our
contact center capacity.
As part of our effort to consolidate our facilities, we may seek to sell or sublease a portion of
our surplus contact center space, if any, and recover certain costs associated with it. Failure to
sell or sublease such surplus space will negatively impact results of operations.
Increases in the cost of telephone and data services or significant interruptions in such services
could adversely affect our business.
Our business is significantly dependent on telephone and data service provided by various local and
long distance telephone companies. Accordingly, any disruption of these services could adversely
affect our business. We have taken steps to mitigate our exposure to service disruptions by
investing in redundant circuits, although there is no assurance that the redundant circuits would
not also suffer disruption. Any inability to obtain telephone or data services at favorable rates
could negatively affect our business results. Where possible, we have entered into long-term
contracts with various providers to mitigate short term rate increases and fluctuations. There is
no obligation, however, for the vendors to renew their contracts with us, or to offer the same or
lower rates in the future, and such contracts are subject to termination or modification for
various reasons outside of our control. A significant increase in the cost of telephone services
that is not recoverable through an increase in the price of our services could adversely affect our
business.
14
Table of Contents
Our profitability may be adversely affected if we are unable to maintain and find new locations for
customer contact centers in countries with stable wage rates.
Our business is labor-intensive and therefore wages, employee benefits and employment taxes
constitute the largest component of our operating expenses. As a result, expansion of our business
is dependent upon our ability to find cost-effective locations in which to operate, both
domestically and internationally. Some of our customer contact centers are located in countries
that have experienced inflation and rising standards of living, which requires us to increase
employee wages. In addition, collective bargaining is being utilized in an increasing number of
countries in which we currently, or may in the future, desire to operate. Collective bargaining
may result in material wage and benefit increases. If wage rates and benefits increase
significantly in a country where we deliver offshore services, we may not be able to pass those
increased labor costs on to our clients, requiring us to search for other cost effective delivery
locations. There is no assurance that we will be able to find such cost-effective locations, and
even if we do, the costs of closing delivery locations and opening new customer contact centers can
adversely affect our financial results.
Risks Related to Our International Operations
Our international operations and expansion involve various risks.
We intend to continue to pursue growth opportunities in markets outside the United States. At
December 31, 2010, our international operations in EMEA, India and the Asia Pacific Rim were
conducted from 39 customer contact management centers located in Sweden, the Netherlands, Finland,
Germany, Egypt, South Africa, Scotland, Ireland, Denmark, Norway, Hungary, Romania, Slovakia,
Spain, India, The Peoples Republic of China, Australia and the Philippines. Revenues from these
international operations for the years ended December 31, 2010, 2009, and 2008, were 44%, 55%, and
60% of consolidated revenues, respectively. We also conduct business from 17 customer contact
management centers located in Canada, Costa Rica, El Salvador, Mexico and Brazil. International
operations are subject to certain risks common to international activities, such as changes in
foreign governmental regulations, tariffs and taxes, import/export license requirements, the
imposition of trade barriers, difficulties in staffing and managing international operations,
political uncertainties, longer payment cycles, possible greater difficulties in accounts
receivable collection, economic instability as well as political and country-specific risks.
Additionally, we have been granted tax holidays in the Philippines, Costa Rica, El Salvador and
India which expire at varying dates from 2011 through 2018. In some cases, the tax holidays expire
without possibility of renewal. In other cases, we expect to renew these tax holidays, but there
are no assurances from the respective foreign governments that they will renew them. This could
potentially result in adverse tax consequences. Any one or more of these factors could have an
adverse effect on our international operations and, consequently, on our business, financial
condition and results of operations.
As of December 31, 2010, we had cash balances of approximately $173.9 million (excluding restricted
cash of $0.5 million) held in international operations, some of which would be subject to
additional taxes if repatriated to the United States.
The U.S. Department of the Treasury released the “General Explanations of the Administration’s
Fiscal Year 2012 Revenue Proposals” in February 2011. These proposals represent a significant
shift in international tax policy, which may materially impact U.S. taxation of international
earnings. We continue to monitor these proposals and are currently evaluating their potential
impact on our financial condition, results of operations, and cash flows. Determination of any
unrecognized deferred tax liability for temporary differences related to investments in foreign
subsidiaries that are essentially permanent in nature is not practicable.
We conduct business in various foreign currencies and are therefore exposed to market risk from
changes in foreign currency exchange rates and interest rates, which could impact our results of
operations and financial condition. We are also subject to certain exposures arising from the
translation and consolidation of the financial results of our foreign subsidiaries. We have, from
time to time, taken limited actions, such as using foreign currency forward contracts, to attempt
to mitigate our currency exchange exposure. However, there can be no assurance that we will take
any actions to mitigate such exposure in the future, and if taken, that such actions will be
successful or that future changes in currency exchange rates will not have a material adverse
impact on our future operating results. A
significant change in the value of the U.S. Dollar against the currency of one or more countries
where we operate may have a material adverse effect on our financial condition and results of
operations.
15
Table of Contents
The fundamental shift in our industry toward global service delivery markets presents various risks
to our business.
Clients continue to require blended delivery models using a combination of onshore and offshore
support. Our offshore delivery locations include The Peoples Republic of China, Australia, the
Philippines, India, Mexico, Costa Rica, El Salvador and Brazil, and while we have operated in
global delivery markets since 1996, there can be no assurance that we will be able to successfully
conduct and expand such operations, and a failure to do so could have a material adverse effect on
our business, financial condition, and results of operations. The success of our offshore
operations will be subject to numerous contingencies, some of which are beyond our control,
including general and regional economic conditions, prices for our services, competition, changes
in regulation and other risks. In addition, as with all of our operations outside of the United
States, we are subject to various additional political, economic and market uncertainties (see “Our
international operations and expansion involve various risks”). Additionally, a change in the
political environment in the United States or the adoption and enforcement of legislation and
regulations curbing the use of offshore customer contact management solutions and services could
effectively have a material adverse effect on our business, financial condition and results of
operations.
Our global operations expose us to numerous legal and regulatory requirements.
We provide services to our clients’ customers in 24 countries around the world. Accordingly, we
are subject to numerous legal regimes on matters such as taxation, government sanctions, content
requirements, licensing, tariffs, government affairs, data privacy and immigration as well as
internal and disclosure control obligations. In the U.S., as well as several of the other countries
in which we operate, some of our services must comply with various laws and regulations regarding
the method and timing of placing outbound telephone calls. Violations of these various laws and
regulations could result in liability for monetary damages, fines and/or criminal prosecution and
unfavorable publicity. Changes in U.S. federal, state and international laws and regulations,
specifically those relating to the outsourcing of jobs to foreign countries, may adversely affect
our ability to perform our services at our overseas facilities or could result in additional taxes
on such services, thereby threatening our ability to continue to serve certain markets at offshore
locations.
Risks Related to Our Employees
Our operations are substantially dependent on our senior management.
Our success is largely dependent upon the efforts, direction and guidance of our senior management.
Our growth and success also depend in part on our ability to attract and retain skilled employees
and managers and on the ability of our executive officers and key employees to manage our
operations successfully. We have entered into employment and non-competition agreements with our
executive officers. The loss of any of our senior management or key personnel, or the inability to
attract, retain or replace key management personnel in the future, could have a material adverse
effect on our business, financial condition and results of operations.
Our inability to attract and retain experienced personnel may adversely impact our business.
Our business is labor intensive and places significant importance on our ability to recruit, train,
and retain qualified technical and consultative professional personnel. We generally experience
high turnover of our personnel and are continuously required to recruit and train replacement
personnel as a result of a changing and expanding work force. Additionally, demand for qualified
technical professionals conversant in multiple languages, including English, and/or certain
technologies may exceed supply, as new and additional skills are required to keep pace with
evolving computer technology. Our ability to locate and train employees is critical to achieving
our growth objective. Our inability to attract and retain qualified personnel or an increase in
wages or other costs of attracting, training, or retaining qualified personnel could have a
material adverse effect on our business, financial condition and results of operations.
Health epidemics could disrupt our business and adversely affect our financial results.
Our customer contact centers typically seat hundreds of employees in one location. Accordingly, an
outbreak of a contagious infection in one or more of the markets in which we do business may result
in significant worker absenteeism, lower asset utilization rates, voluntary or mandatory closure of
our offices and delivery centers, travel restrictions on our employees, and other disruptions to
our business. Any prolonged or widespread health epidemic
16
Table of Contents
could severely disrupt our business
operations and have a material adverse effect on our business, financial condition and results of
operations.
Risks Related to Our Growth Strategy
Our strategy of growing through selective acquisitions and mergers involves potential risks.
We evaluate opportunities to expand the scope of our services through acquisitions and mergers. We
may be unable to identify companies that complement our strategies, and even if we identify a
company that complements our strategies, we may be unable to acquire or merge with the company. In
addition, a decrease in the price of our common stock could hinder our growth strategy by limiting
growth through acquisitions funded with SYKES’ stock.
Our acquisition strategy involves other potential risks. These risks include:
| § | The inability to obtain the capital required to finance potential acquisitions on
satisfactory terms; |
|
| § | The diversion of our attention to the integration of the businesses to be acquired; |
|
| § | The risk that the acquired businesses will fail to maintain the quality of services that we
have historically provided; |
|
| § | The need to implement financial and other systems and add management resources; |
|
| § | The risk that key employees of the acquired business will leave after the acquisition; |
|
| § | Potential liabilities of the acquired business; |
|
| § | Unforeseen difficulties in the acquired operations; |
|
| § | Adverse short-term effects on our operating results; |
|
| § | Lack of success in assimilating or integrating the operations of acquired businesses within
our business; |
|
| § | The dilutive effect of the issuance of additional equity securities; |
|
| § | The impairment of goodwill and other intangible assets involved in any acquisitions; |
|
| § | The businesses we acquire not proving profitable; and |
|
| § | Potentially incurring additional indebtedness. |
We may not succeed in our continued efforts to fully integrate the operations of ICT into our own,
which may adversely affect the value of our common stock.
It is possible that the integration of the operations of ICT into our own could result in the
disruption of ongoing businesses or identify inconsistencies in standards, controls, procedures and
policies that adversely affect our ability to maintain relationships with customers, suppliers,
distributors, creditors and lessors, or to achieve the full level of anticipated benefits of the
acquisition.
Specifically, issues addressed in completing the integration of the operations of ICT into our own
operations in order to realize the anticipated benefits of the acquisition include, among other
things:
| § | integrating our information technology systems with those of ICT; |
|
| § | conforming standards, controls, procedures and policies, business cultures and compensation
structures between the companies; |
|
| § | consolidating corporate and administrative infrastructures; |
|
| § | retaining existing customers and attracting new customers; |
|
| § | identifying and eliminating redundant and underperforming operations and assets; |
|
| § | coordinating geographically dispersed organizations; |
|
| § | managing tax costs or inefficiencies associated with integrating the operations of the
combined company; and |
|
| § | making any necessary modifications to operating control standards to comply with the
Sarbanes-Oxley Act of 2002 and the rules and regulations promulgated thereunder. |
Integration efforts between the two companies at times may divert management attention and
resources. An inability to realize the full extent of, or any of, the anticipated benefits of the
acquisition, as well as any delays encountered in the integration process, could have an adverse
effect on our business and results of operations, which may affect the value of the shares of our
common stock.
In addition, the actual integration may result in additional and unforeseen expenses, and the full
amount of anticipated benefits of the integration plan may not be realized. If we are not able to
adequately address these
17
Table of Contents
challenges, we may be unable to fully integrate ICT’s operations into our
own, or to realize the full amount of anticipated benefits of the integration of the two companies.
We may incur significant cash and non-cash costs in connection with the continued rationalization
of assets resulting from the ICT acquisition.
We may incur a number of non-recurring cash and non-cash costs associated with the continued
rationalization of assets resulting from the ICT acquisition relating to the closing of facilities
and disposition of assets.
The ICT acquisition resulted in substantial goodwill. If the goodwill becomes impaired, then our
profits would be significantly reduced or eliminated and shareholders’ equity would be reduced.
We recorded $97.8 million in goodwill as a result of the ICT acquisition. On at least an annual
basis, we assess whether there has been an impairment in the value of goodwill. If the carrying
value of goodwill exceeds its estimated fair value, impairment is deemed to have occurred and the
carrying value of goodwill is written down to fair value. This would result in a charge to the
combined company’s operating earnings.
Risks Related to Our Common Stock
Our organizational documents contain provisions that could impede a change in control.
Our Board of Directors is divided into three classes serving staggered three-year terms. The
staggered Board of Directors and the anti-takeover effects of certain provisions contained in the
Florida Business Corporation Act and in our Articles of Incorporation and Bylaws, including the
ability of the Board of Directors to issue shares of preferred stock and to fix the rights and
preferences of those shares without shareholder approval, may have the effect of delaying,
deferring or preventing an unsolicited change in control. This may adversely affect the market
price of our common stock or the ability of shareholders to participate in a transaction in which
they might otherwise receive a premium for their shares.
The volatility of our stock price may result in loss of investment.
The trading price of our common stock has been and may continue to be subject to wide fluctuations
over short and long periods of time. We believe that market prices of outsourced customer contact
management services stocks in general have experienced volatility, which could affect the market
price of our common stock regardless of our financial results or performance. We further believe
that various factors such as general economic conditions, changes or volatility in the financial
markets, changing market conditions in the outsourced customer contact management services
industry, quarterly variations in our financial results, the announcement of acquisitions,
strategic partnerships, or new product offerings, and changes in financial estimates and
recommendations by securities analysts could cause the market price of our common stock to
fluctuate substantially in the future.
Failure to adhere to laws, rules and regulations applicable to public companies operating in the
U.S. may have an adverse effect on our stock price.
Because we are a publicly traded company, we are subject to certain evolving and expensive federal,
state and other rules and regulations relating to, among other things, assessment and maintenance
of internal controls and corporate governance. Section 404 of the Sarbanes-Oxley Act of 2002,
together with rules and regulations issued by the Securities and Exchange Commission (“SEC”)
require us to furnish, on an annual basis, a report by our management (included elsewhere in this
Annual Report on Form 10-K) regarding the effectiveness of our internal control over financial
reporting. The report includes, among other things, an assessment of the effectiveness of our
internal
controls over financial reporting as of the end of our fiscal year and a statement as to whether or
not our internal controls over financial reporting are effective. We must include a disclosure of
any material weaknesses in our internal control over financial reporting identified by management
during the annual assessment. We have in the past discovered, and may potentially in the future
discover, areas of internal control over financial reporting which may require improvement. If at
any time we are unable to assert that our internal controls over financial reporting are effective,
or if our auditors are unable to express an opinion on the effectiveness of our internal controls,
our investors could lose confidence in the accuracy and/or completeness of our financial reports,
which could have an adverse effect on our stock price.
18
Table of Contents
Additionally, the recently enacted Dodd-Frank Wall Street Reform and Consumer Protection Act (the
“Dodd-Frank Act”) will subject us to significant additional executive compensation and corporate
governance requirements and disclosures, some of which have yet to be implemented by the SEC.
Compliance with their requirements may be costly and adversely affect our business. The Dodd-Frank
Act also anticipates the enactment of regulations that may affect the ability of financial
institutions to offer credit and hedging instruments without significant additional capital or
other costs to them. This may make it more difficult for us to have access to foreign exchange
hedging transactions on favorable terms, which may limit the predictability of cash flows from
operations and result in increased operating expenses.
Item 1B. Unresolved Staff Comments
There are no material unresolved written comments that were received from the SEC staff 180 days or
more before the year ended December 31, 2010 relating to our periodic or current reports filed
under the Securities Exchange Act of 1934.
19
Table of Contents
Item 2. Properties
Our principal executive offices are located in Tampa, Florida. This facility currently serves as
the headquarters for senior management and the financial, information technology and administrative
departments. We believe our existing facilities are adequate to meet current requirements, and that
suitable additional or substitute space will be available as needed to accommodate any physical
expansion or any space required due to expiring leases not renewed. We operate from time to time in
temporary facilities to accommodate growth before new customer contact management centers are
available. During 2010, our customer contact management centers, taken as a whole, were utilized at
average capacities of approximately 77% and were capable of supporting a higher level of market
demand. The following table sets forth additional information concerning our facilities:
| Lease Expiration/ | ||||||||
| Properties | General Usage | Square Feet | Company Owned | |||||
AMERICAS LOCATIONS |
||||||||
Tampa, Florida
|
Corporate headquarters | 67,645 | June 2016 | |||||
Nogales, Arizona
|
Customer contact management center | 44,402 | January 2015 | |||||
Conway, Arkansas
|
Customer contact management center | 14,785 | March 2012 | |||||
Fort Smith, Arkansas
|
Customer contact management center | 40,622 | April 2021 | |||||
Malvern, Arkansas
|
Customer contact management center | 32,287 | May 2019 | |||||
Morrilton, Arkansas
|
Customer contact management center | 23,850 | July 2011 | |||||
Sterling, Colorado
|
Customer contact management center | 34,000 | Company owned | |||||
Lakeland, Florida
|
Customer contact management center | 50,000 | July 2014 | |||||
Louisville, Kentucky
|
Customer contact management center | 36,860 | May 2012 | |||||
Morganfield, Kentucky
|
Customer contact management center | 42,000 | Company owned | |||||
Perry County, Kentucky
|
Customer contact management center | 42,000 | Company owned | |||||
Wilton, Maine
|
Customer contact management center | 30,000 | October 2011 | |||||
Amherst, New York
|
Customer contact management center | 26,296 | May 2013 | |||||
Bismarck, North Dakota
|
Customer contact management center | 42,000 | Company owned | |||||
Minot, North Dakota
|
Customer contact management center (1) | 42,000 | Company owned | |||||
Ponca City, Oklahoma
|
Customer contact management center | 42,000 | Company owned | |||||
Milton-Freewater, Oregon
|
Customer contact management center | 42,000 | Company owned | |||||
Allentown, Pennsylvania
|
Customer contact management center | 21,115 | February 2013 | |||||
Bloomburg, Pennsylvania
|
Customer contact management center | 21,800 | July 2014 | |||||
Langhorn, Pennsylvania
|
Customer contact management center | 21,641 | March 2012 | |||||
Langhorn, Pennsylvania
|
Customer contact management center | 14,060 | September 2012 | |||||
Langhorn, Pennsylvania
|
Customer contact management center | 1,396 | June 2012 | |||||
Lockhaven, Pennsylvania
|
Customer contact management center | 23,610 | August 2011 | |||||
Newtown, Pennsylvania
|
Customer contact management center | 102,000 | February 2017 | |||||
Bardstown, South Carolina
|
Customer contact management center | 35,813 | September 2019 | |||||
Greenwood, South Carolina
|
Customer contact management center | 25,000 | December 2012 | |||||
Greenwood, South Carolina
|
Customer contact management center | 15,000 | October 2011 | |||||
Kingstree, South Carolina
|
Customer contact management center | 35,000 | March 2028 | |||||
Sumter, South Carolina
|
Customer contact management center | 25,000 | April 2014 | |||||
Sumter, South Carolina
|
Customer contact management center | 10,993 | September 2013 | |||||
Sumter, South Carolina
|
Customer contact management center | 2,141 | April 2011 | |||||
Buchanan County, Virginia
|
Customer contact management center | 42,700 | Company owned | |||||
Wise, Virginia
|
Customer contact management center | 42,000 | Company owned | |||||
Spokane, Washington
|
Customer contact management center | 50,000 | July 2013 | |||||
Maitland, Australia
|
Customer contact management center | 10,613 | September 2012 | |||||
| (1) | Closed in May, 2009. |
20
Table of Contents
| Lease Expiration/ | ||||||||
| Properties | General Usage | Square Feet | Company Owned | |||||
AMERICAS LOCATIONS (continued) |
||||||||
Rhodes (Sydney), Australia
|
Customer contact management center | 9,363 | September 2012 | |||||
Robina, Australia
|
Customer contact management center | 4,757 | February 2012 | |||||
Curitiba, Brazil
|
Customer contact management center | 25,658 | July 2012 | |||||
London, Ontario, Canada
|
Headquarters | 50,000 | Company owned | |||||
Bathurst, New Brunswick, Canada
|
Customer contact management center (2) | 1,856 | December 2012 | |||||
Moncton, New Brunswick, Canada
|
Customer contact management center (2) | 12,714 | December 2011 | |||||
North Bay, Ontario, Canada
|
Customer contact management center (2) | 5,371 | May 2012 | |||||
Sudbury, Ontario, Canada
|
Customer contact management center (2) | 3,514 | December 2015 | |||||
Toronto, Ontario, Canada
|
Customer contact management center (2) | 14,600 | June 2012 | |||||
Cornerbrook, New Foundland Labrador, Canada
|
Customer contact management center | 25,032 | June 2011 | |||||
Lindsay, Ontario, Canada
|
Customer contact management center | 15,338 | February 2012 | |||||
Miramichi, New Brunswick, Canada
|
Customer contact management center | 30,000 | May 2012 | |||||
Peterborough, Ontario, Canada
|
Customer contact management center | 17,000 | January 2016 | |||||
Riverview, New Brunswick, Canada
|
Customer contact management center | 49,017 | June 2012 | |||||
Sherebrook, Quebec, Canada
|
Customer contact management center | 32,500 | January 2012 | |||||
St. John, New Brunswick, Canada
|
Customer contact management center | 25,000 | February 2015 | |||||
St. John’s, New Foundland Labrador, Canada
|
Customer contact management center | 49,000 | August 2011 | |||||
Sydney, Nova Scotia, Canada
|
Customer contact management center | 27,200 | February 2016 | |||||
LaAurora, Heredia, Costa Rica
|
Customer contact management center | 33,635 | August 2011 | |||||
LaAurora, Heredia, Costa Rica (three)
|
Customer contact management centers | 131,912 | September 2023 | |||||
Moravia, San Jose, Costa Rica
|
Customer contact management center | 38,480 | July 2027 | |||||
San Salvador, El Salvador
|
Customer contact management center | 119,836 | November 2024 | |||||
Hyderabad, India
|
Customer contact management center | 16,000 | June 2014 | |||||
Mexico City, Mexico
|
Customer contact management center | 59,503 | November 2014 | |||||
Guangzhou, The Peoples Republic of China
|
Customer contact management center | 12,970 | March 2012 | |||||
Shanghai, The Peoples Republic of China
|
Customer contact management center | 70,474 | February 2016 | |||||
Cabanatuan, The Philippines
|
Customer contact management center | 43,055 | June 2011 | |||||
Cebu City, The Philippines
|
Customer contact management center | 149,402 | December 2026 | |||||
Makati City, The Philippines
|
Customer contact management center | 68,610 | March 2023 | |||||
Makati City, The Philippines
|
Customer contact management center | 68,268 | September 2011 | |||||
Mandaluyong, The Philippines
|
Customer contact management center | 104,299 | April 2012 | |||||
Marikina City, The Philippines
|
Customer contact management center | 74,525 | March 2012 | |||||
Marikina City, The Philippines
|
Customer contact management center | 87,273 | June 2012 | |||||
Pasig City, The Philippines
|
Customer contact management center | 127,449 | November 2023 | |||||
Pasig City, The Philippines
|
Customer contact management center | 73,872 | September 2012 | |||||
Pasig City, The Philippines
|
Customer contact management center | 1,917 | August 2011 | |||||
Quezon City, The Philippines
|
Customer contact management center | 84,250 | May 2024 | |||||
Wilmington, Delaware
|
Office | 4,344 | January 2014 | |||||
Chesterfield, Missouri
|
Office (3) | 3,600 | January 2016 | |||||
Cary, North Carolina
|
Office (3) | 1,200 | March 2011 | |||||
Arlington, Virginia
|
Office | 200 | March 2012 | |||||
Ajax, Ontario, Canada
|
Office | 200 | April 2011 | |||||
Calgary, Alberta, Canada
|
Office | 7,782 | July 2012 | |||||
Halifax, Nova Scotia, Canada
|
Office | 2,818 | January 2013 | |||||
Bangalore, India
|
Office | 1,500 | January 2014 | |||||
| (2) | Considered part of the Toronto, Ontario, Canada customer contact management center. |
|
| (3) | Enterprise support services location. |
21
Table of Contents
| Lease Expiration/ | ||||||||
| Properties | General Usage | Square Feet | Company Owned | |||||
EMEA LOCATIONS |
||||||||
Odense, Denmark
|
Customer contact management center | 13,605 | January 2016 | |||||
Cairo, Egypt
|
Customer contact management center | 27,935 | January 2013 | |||||
Uxbridge, England
|
Customer contact management center (4) | 26,155 | January 2012 | |||||
Turku, Finland
|
Customer contact management center | 12,507 | February 2012 | |||||
Berlin, Germany
|
Customer contact management center | 60,278 | February 2020 | |||||
Bochum, Germany
|
Customer contact management center | 41,334 | December 2011 | |||||
Pasewalk, Germany
|
Customer contact management center | 46,069 | February 2012 | |||||
Wilhelmshaven, Germany
|
Customer contact management center | 46,000 | November 2011 | |||||
Wilhelmshaven, Germany
|
Customer contact management center | 14,300 | August 2011 | |||||
Budapest, Hungary
|
Customer contact management center | 22,819 | July 2023 | |||||
Dublin, Ireland
|
Customer contact management center (4) | 9,845 | May 2024 | |||||
Shannon, Ireland
|
Customer contact management center | 66,000 | March 2013 | |||||
Bergen, Norway
|
Customer contact management center | 8,654 | August 2015 | |||||
Bodo, Norway
|
Customer contact management center | 3,203 | February 2012 | |||||
Cluj, Romania
|
Customer contact management center | 32,055 | April 2030 | |||||
Edinburgh, Scotland
|
Customer contact management center/ Office/Headquarters |
35,870 | September 2019 | |||||
Edinburgh, Scotland
|
Customer contact management center | 8,998 | February 2012 | |||||
Kosice, Slovakia
|
Customer contact management center | 40,028 | December 2024 | |||||
Johannesburg, South Africa
|
Customer contact management center | 21,692 | March 2025 | |||||
La Coruña, Spain
|
Customer contact management center | 10,314 | December 2011 | |||||
Lugo, Spain
|
Customer contact management center | 21,441 | June 2011 | |||||
Ponferrada, Spain
|
Customer contact management center | 16,146 | December 2028 | |||||
Ed, Sweden
|
Customer contact management center | 44,060 | September 2019 | |||||
Sveg, Sweden
|
Customer contact management center | 34,974 | June 2012 | |||||
Amsterdam, The Netherlands
|
Customer contact management center | 33,088 | September 2012 | |||||
Galashiels, Scotland
|
Fulfillment center | 126,700 | Company owned | |||||
Rosersberg, Sweden
|
Fulfillment center and Sales office | 43,056 | February 2012 | |||||
Frankfurt, Germany
|
Sales office | 1,700 | September 2011 | |||||
Madrid, Spain
|
Office | 127 | February 2012 | |||||
| (4) | Closed in December, 2010. |
22
Table of Contents
Item 3. Legal Proceedings
From time to time, we are involved in legal actions arising in the ordinary course of business.
With respect to these matters, we believe that we have adequate legal defenses and/or when possible
and appropriate, have provided adequate accruals related to those matters such that the ultimate
outcome will not have a material adverse effect on our future financial position or results of
operations.
We have previously disclosed three pending matters involving regulatory sanctions assessed against
our Spanish subsidiary. All three matters relate to the alleged inappropriate acquisition of
personal information in connection with two outbound client contracts. In connection with the
appeal of one of these claims, we issued a bank guarantee, which is included as restricted cash of
$0.4 million and $0.5 million in “Deferred charges and other assets” in the accompanying
Consolidated Balance Sheets as of December 31, 2010 and 2009, respectively. Based upon the opinion
of legal counsel regarding the likely outcome of these three matters, we accrued a liability in the
amount of $1.3 million in accordance with the Financial Accounting Standards Board’s Accounting
Standards Codification 450 “Contingencies” because we believed that a loss was probable and the
amount of the loss could be reasonably estimated. In the quarter ended December 31, 2010, the
Spanish Supreme Court ruled in our favor in one of the three subject claims. Accordingly, we have
reversed the accrual in the amount of $0.5 million related to that particular claim. The accrued
liability included in “Other accrued expenses and current liabilities” in the accompanying
Consolidated Balance Sheets was $0.8 million and $1.3 million as of December 31, 2010 and 2009,
respectively. One of the other two claims has been finally decided against the Company on
procedural grounds, and the final claim remains on appeal to the Spanish Supreme Court.
Item 4. Reserved
23
Table of Contents
PART II
Item 5. Market for the Registrant’s Common Equity, Related Shareholder Matters and Issuer Purchases
of Securities
Our common stock is quoted on the NASDAQ Global Select Market under the symbol SYKE. The following
table sets forth, for the periods indicated, certain information as to the high and low sale prices
per share of our common stock as quoted on the NASDAQ Global Select Market.
| High | Low | |||||||
Year Ended December 31, 2010: |
||||||||
Fourth Quarter |
$ | 21.68 | $ | 13.49 | ||||
Third Quarter |
16.70 | 10.85 | ||||||
Second Quarter |
23.46 | 14.21 | ||||||
First Quarter |
26.26 | 22.59 | ||||||
Year Ended December 31, 2009: |
||||||||
Fourth Quarter |
$ | 26.91 | $ | 20.00 | ||||
Third Quarter |
22.17 | 17.50 | ||||||
Second Quarter |
20.45 | 15.84 | ||||||
First Quarter |
19.98 | 13.16 | ||||||
Holders of our common stock are entitled to receive dividends out of the funds legally available
when and if declared by the Board of Directors. We have not declared or paid any cash dividends on
our common stock in the past and do not anticipate paying any cash dividends in the foreseeable
future.
As of February 28, 2011, there were 1,012 holders of record of the common stock. We estimate there
were approximately 4,848 beneficial owners of our common stock.
Below is a summary of stock repurchases for the quarter ended December 31, 2010 (in thousands,
except average price per share.) See Note 22, Earnings Per Share, of “Notes to Consolidated
Financial Statements” for further information regarding our stock repurchase program.
| Total Number of | Maximum Number | |||||||||||||||
| Total | Average | Shares Purchased | of Shares That May | |||||||||||||
| Number of | Price | as Part of Publicly | Yet Be Purchased | |||||||||||||
| Shares | Paid Per | Announced Plans | Under Plans or | |||||||||||||
| Period | Purchased(1) | Share | or Programs | Programs | ||||||||||||
October 1, 2010 - October 31, 2010 |
- | - | - | 798 | ||||||||||||
November 1, 2010 - November 30, 2010 |
- | - | - | 798 | ||||||||||||
December 1, 2010 - December 31, 2010 |
- | - | - | 798 | ||||||||||||
Total |
- | - | 798 | |||||||||||||
| (1) | All shares purchased as part of a repurchase plan publicly announced on August 5, 2002. Total number of shares
approved for repurchase under the plan was 3.0 million with no expiration date. |
Five-Year Stock Performance Graph
The following graph presents a comparison of the cumulative shareholder return on the common stock
with the cumulative total return on the NASDAQ Computer and Data Processing Services Index, the
NASDAQ Telecommunications Index, the Russell 2000 Index, the S&P Small Cap 600 and the SYKES Peer
Group (as defined below). The SYKES Peer Group is comprised of publicly traded companies that
derive a substantial portion of their revenues from call center, customer care business, have
similar business models to SYKES, and are those most commonly compared to SYKES by industry
analysts following SYKES. This graph assumes that $100 was invested on December 31, 2005 in SYKES
common stock, the NASDAQ Computer and Data Processing Services Index, the
NASDAQ Telecommunications Index, the Russell 2000 Index, the S&P Small Cap 600 and SYKES Peer
Group, including reinvestment of dividends.
24
Table of Contents
Comparison of Five-Year Cumulative Total Return
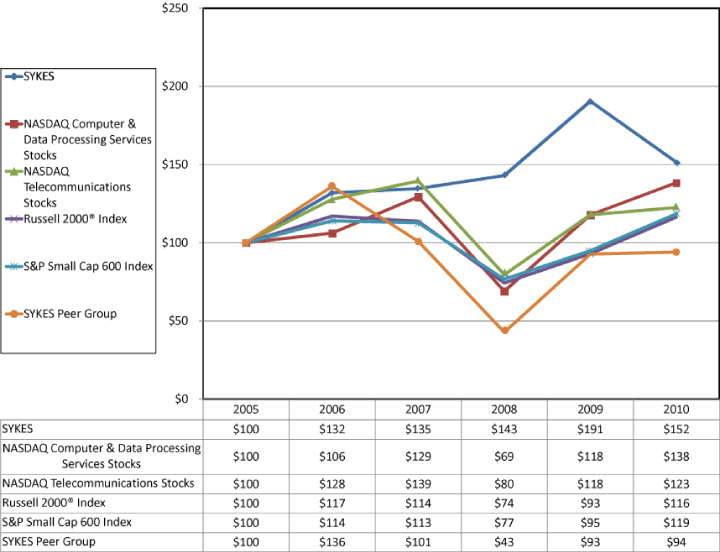
| SYKES Peer Group | Ticker Symbol | ||
APAC Customer Service, Inc.
|
APAC | ||
Convergys Corp.
|
CVG | ||
StarTek, Inc.
|
SRT | ||
TeleTech Holdings, Inc.
|
TTEC | ||
There was a change to the SYKES Peer Group with respect to ICT in 2010. With the acquisition of ICT
on February 2, 2010, by SYKES, the Peer Group excludes the share price performance of ICT for the
past 5 years as ICT shares no longer trade on NASDAQ.
There can be no assurance that SYKES’ stock performance will continue into the future with the same
or similar trends depicted in the graph above. SYKES does not make or endorse any predictions as to
the future stock performance.
The information contained in the Stock Performance Graph section shall not be deemed to be
“soliciting material” or “filed” or incorporated by reference in future filings with the SEC, or
subject to the liabilities of Section 18 of the Securities Exchange Act of 1934, except to the
extent that we specifically incorporate it by reference into a document filed under the Securities
Exchange Act of 1934.
25
Table of Contents
Item 6. Selected Financial Data
Selected Financial Data
The following selected financial data has been derived from our Consolidated Financial Statements.
During the year ended December 31, 2010, we sold our Argentine operations; this transaction was
accounted for in accordance with Accounting Standards Codification 205-20 “Discontinued
Operations”. We have reclassified the selected financial data for all periods presented to reflect
the operations of our Argentine operations as discontinued operations. See Note 3, Discontinued
Operations, of “Notes to Consolidated Financial Statements” for more information.
The information below should be read in conjunction with “Management’s Discussion and Analysis of
Financial Condition and Results of Operations,” and our Consolidated Financial Statements and
related notes thereto.
| Years Ended December 31, | ||||||||||||||||||||
| (in thousands, except per share data) | 2010 | 2009 | 2008 | 2007 | 2006 | |||||||||||||||
Income Statement Data: (1,3) |
||||||||||||||||||||
Revenues |
$ | 1,158,718 | $ | 813,574 | $ | 782,295 | $ | 683,189 | $ | 559,106 | ||||||||||
Income from continuing operations (2,4,6,7) |
32,223 | 73,018 | 67,511 | 53,164 | 44,336 | |||||||||||||||
Income from continuing operations, net of taxes (2,4,5,6,7) |
19,698 | 46,142 | 62,651 | 41,757 | 41,804 | |||||||||||||||
Income (loss) from discontinued operations, net of taxes (3) |
(29,971 | ) | (2,931 | ) | (2,090 | ) | (1,898 | ) | 519 | |||||||||||
Net income (loss) |
(10,273 | ) | 43,211 | 60,561 | 39,859 | 42,323 | ||||||||||||||
Net Income (Loss) Per Common Share: (1,2,4,5,6,7) |
||||||||||||||||||||
Basic: |
||||||||||||||||||||
Continuing operations |
$ | 0.43 | $ | 1.13 | $ | 1.54 | $ | 1.03 | $ | 1.05 | ||||||||||
Discontinued operations (3) |
(0.65 | ) | (0.07 | ) | (0.05 | ) | (0.04 | ) | 0.01 | |||||||||||
Net income (loss) per common share |
$ | (0.22 | ) | $ | 1.06 | $ | 1.49 | $ | 0.99 | $ | 1.06 | |||||||||
Diluted: |
||||||||||||||||||||
Continuing operations |
$ | 0.43 | $ | 1.12 | $ | 1.53 | $ | 1.03 | $ | 1.04 | ||||||||||
Discontinued operations (3) |
(0.65 | ) | (0.07 | ) | (0.05 | ) | (0.05 | ) | 0.01 | |||||||||||
Net income (loss) per common share |
$ | (0.22 | ) | $ | 1.05 | $ | 1.48 | $ | 0.98 | $ | 1.05 | |||||||||
Weighted Average Shares: (1) |
||||||||||||||||||||
Basic |
46,030 | 40,707 | 40,618 | 40,387 | 39,829 | |||||||||||||||
Diluted |
46,133 | 41,026 | 40,961 | 40,699 | 40,219 | |||||||||||||||
Balance Sheet Data: (1,8) |
||||||||||||||||||||
Total assets |
$ | 794,600 | $ | 672,471 | $ | 529,542 | $ | 505,475 | $ | 415,573 | ||||||||||
Shareholders’ equity |
583,195 | 450,674 | 384,030 | 365,321 | 291,473 | |||||||||||||||
| (1) | The amounts for 2010 include the ICT acquisition completed on February 2, 2010. |
||
| (2) | The amounts for 2010 include $46.3 million in ICT acquisition-related costs, a $3.6
million impairment of goodwill, intangibles and long- lived assets, a $2.0 million net gain
on insurance settlement and a $0.4 million recovery of regulatory penalties . |
||
| (3) | The 2010 loss from discontinued operations net of taxes, includes the Argentine
operations, which were sold in December 2010. The amount for 2010 also includes the loss on
sale of $29.9 million, or $23.5 million net of taxes. |
||
| (4) | The amounts for 2009 include $3.3 million in transaction costs related to the ICT
acquisition and a $1.9 million impairment of goodwill and intangibles. |
||
| (5) | The amounts for 2009 include a $14.7 million charge to provision for income taxes
related to our change of intent in the fourth quarter of 2009 regarding the permanent
reinvestment of foreign subsidiaries’ accumulated and undistributed earnings and a $2.1
million impairment loss on our investment in SHPS. |
||
| (6) | The amounts for 2007 include a $1.3 million provision for regulatory penalties related
to privacy claims associated with the alleged inappropriate acquisition of personal bank
account information in one of our European subsidiaries. |
||
| (7) | The amounts for 2006 include a $13.9 million net gain on the sale of facilities and a
$0.4 million impairment of long-lived assets. |
||
| (8) | SYKES has not declared cash dividends per common share for any of the five years
presented. |
26
Table of Contents
Item 7. Management’s Discussion and Analysis of Financial Condition and Results of Operations
This discussion should be read in conjunction with the Consolidated Financial Statements and the
notes thereto that appear elsewhere in this Annual Report on Form 10-K. The following discussion
and analysis compares the year ended December 31, 2010 (“2010”) to the year ended December 31, 2009
(“2009”), and 2009 to the year ended December 31, 2008 (“2008”).
The following discussion and analysis and other sections of this document contain forward-looking
statements that involve risks and uncertainties. Words such as “may,” “expects,” “projects,”
“anticipates,” “intends,” “plans,” “believes,” “seeks,” “estimates,” variations of such words, and
similar expressions are intended to identify such forward-looking statements. Similarly, statements
that describe our future plans, objectives, or goals also are forward-looking statements. Future
events and actual results could differ materially from the results reflected in these
forward-looking statements, as a result of certain of the factors set forth below and elsewhere in
this analysis and in this Annual Report on Form 10-K for the year ended December 31, 2010 in Item
1.A., “Risk Factors.”
Overview
We provide an array of sophisticated customer contact management solutions to a wide range of
clients including Fortune 1000 companies, medium-sized businesses, and public institutions around
the world, primarily in the communications, financial services, technology/consumer, transportation
and leisure, healthcare and other industries. We serve our clients through two geographic operating
regions: the Americas (United States, Canada, Latin America, India and the Asia Pacific Rim) and
EMEA (Europe, the Middle East and Africa). Our Americas and EMEA groups primarily provide customer
contact management services (with an emphasis on inbound technical support and customer service),
which include customer assistance, healthcare and roadside assistance, technical support and
product sales to our client’s customers. These services, which represented 98% of consolidated
revenues in 2010, are delivered through multiple communication channels encompassing phone, e-mail,
Internet, text messaging and chat. We also provide various enterprise support services in the
United States (“U.S.”) that include services for our client’s internal support operations, from
technical staffing services to outsourced corporate help desk services. In Europe, we also provide
fulfillment services including multilingual sales order processing via the Internet and phone,
payment processing, inventory control, product delivery, and product returns handling. Our complete
service offering helps our clients acquire, retain and increase the lifetime value of their
customer relationships. We have developed an extensive global reach with customer contact
management centers throughout the United States, Canada, Europe, Latin America, Asia, India and
Africa. With the acquisition of ICT and our organic growth, net of the sale of our Argentine
operations, we added 34 customer contact management centers and increased our footprint by three
countries, with the addition of Mexico, Australia and India, in 2010.
Revenues from these services is recognized as the services are performed, which is based on either
a per minute, per hour, per call or per transaction basis, under a fully executed contractual
agreement, and we record reductions to revenues for contractual penalties and holdbacks for a
failure to meet specified minimum service levels and other performance based contingencies. Revenue
recognition is limited to the amount that is not contingent upon delivery of any future product or
service or meeting other specified performance conditions. Product sales, accounted for within our
fulfillment services, are recognized upon shipment to the customer and satisfaction of all
obligations.
Recognition of income associated with grants from local or state governments of land and the
acquisition of property, buildings and equipment is deferred and recognized as a reduction of
depreciation expense included within general and administrative costs over the corresponding useful
lives of the related assets. Amounts received in excess of the cost of the building are allocated
to equipment and, only after the grants are released from escrow, recognized as a reduction of
depreciation expense over the weighted average useful life of the related equipment, which
approximates five years. Deferred property and equipment grants, net of amortization, totaled $10.8
million and $11.0 million at December 31, 2010 and 2009, respectively, a decrease of $0.2 million.
Direct salaries and related costs include direct personnel compensation, severance, statutory and
other benefits associated with such personnel and other direct costs associated with providing
services to customers. General and administrative costs include administrative, sales and
marketing, occupancy, depreciation and amortization, and other costs.
In 2010, we reversed an accrual related to the provision for regulatory penalties, which is related
to one of three privacy claims associated with the alleged inappropriate acquisition of personal
bank account information by our Spanish subsidiary, as a result of a favorable ruling by the
Spanish Supreme Court. The remaining accrued liability
is $0.8 million as of December 31, 2010.
27
Table of Contents
The net gain on insurance settlement in 2010 includes the insurance proceeds received for storm
damage to one of our customer contact management centers in the Philippines.
The impairment of goodwill and intangibles in 2010 is primarily related to customer relationships
in the ICT-acquired United Kingdom operations. The impairment of goodwill and intangibles in 2009
is related to the March 2005 acquisition of Kelly, Luthmer & Associates Limited (“KLA”), our
Employee Assistance and Occupational Health operations in Calgary, Alberta Canada.
The impairment of long-lived assets in the Americas segment in 2010, including the Philippines and
the United States, is primarily related to leasehold improvements. The impairment of long-lived
assets in the EMEA segment, including the United Kingdom and Ireland, is primarily related to
leasehold improvements and equipment.
Interest income primarily relates to interest earned on cash and cash equivalents and foreign tax
refunds. Interest expense primarily includes commitment fees charged on the unused portion of our
revolving credit facility and interest on the outstanding $75 million Bermuda Credit Agreement
beginning December 11, 2009 and the $75 million Term Loan beginning February 2, 2010 as more fully
described in this Item 7, under “Liquidity and Capital Resources.”
Impairment (loss) on investment in SHPS represents the estimated fair value adjustment and
subsequent liquidation of our noncontrolling interest in SHPS by converting our SHPS common stock
into cash for $0.000001 per share.
Foreign currency transaction gains and losses generally result from exchange rate fluctuations on
intercompany transactions and the revaluation of cash and other assets and liabilities that are
settled in a currency other than functional currency.
Our effective tax rate for the periods presented includes the effects of our change of intent
during the quarter ended December 31, 2009 regarding the permanent reinvestment of foreign
subsidiaries’ accumulated and undistributed earnings (see Note 21, Income Taxes, of “Notes to
Consolidated Financial Statements”), state income taxes, net of federal tax benefit, tax holidays,
valuation allowance changes, foreign rate differentials, foreign withholding and other taxes, and
other permanent differences.
Acquisition of ICT
On February 2, 2010, we completed the acquisition of ICT Group Inc. (“ICT”), a Pennsylvania
corporation and a leading global provider of outsourced customer management and BPO solutions. We
refer to such acquisition herein as the “ICT acquisition.”
As a result of the ICT acquisition on February 2, 2010,
| • | each outstanding share of ICT’s common stock, par value $0.01 per share, was
converted into the right to receive $7.69 in cash, without interest, and 0.3423 of a
share of SYKES common stock, par value $0.01 per share; |
||
| • | each outstanding ICT stock option, whether or not then vested and exercisable,
became fully vested and exercisable immediately prior to, and then was canceled at, the
effective time of the acquisition, and the holder of such option became entitled to
receive an amount in cash, without interest and less any applicable taxes to be
withheld, equal to (i) the excess, if any, of (1) $15.38 over (2) the exercise price
per share of ICT common stock subject to such ICT stock option, multiplied by (ii) the
total number of shares of ICT common stock underlying such ICT stock option, with the
aggregate amount of such payment rounded up to the nearest cent. If the exercise price
was equal to or greater than $15.38, then the stock option was canceled without any
payment to the stock option holder; and |
||
| • | each outstanding ICT restricted stock unit (“RSU”) became fully vested and then was
canceled and the holder of such vested awards became entitled to receive $15.38 in
cash, without interest and less any applicable taxes to be withheld, in respect of each
share of ICT common stock into which the RSU would otherwise have been convertible. |
28
Table of Contents
The total aggregate purchase price of the transaction of $277.8 million was comprised of $141.1
million in cash and 5.6 million shares of SYKES common stock valued at $136.7 million. The
transaction was funded through borrowings consisting of a $75 million short-term loan from KeyBank
National Association (“KeyBank”) in December, 2009, due March 31, 2010, and a $75 million term loan
from a syndicate of banks due in varying installments through February 1, 2013 (the “Term Loan”).
The entire $75 million Term Loan was repaid during the quarter ended September 30, 2010 and is no
longer available for borrowings. See “Liquidity & Capital Resources” later in this Item 7 and Note
19, Borrowings, of “Notes to Consolidated Financial Statements” for further information.
The results of operations of ICT have been reflected in our Consolidated Statement of Operations
for the period from February 2, 2010 to December 31, 2010.
Discontinued Operations
In December 2010, we committed to a plan and completed the sale of our Argentine operations,
pursuant to stock purchase agreements, dated December 16, 2010 and December 29, 2010. We have
reflected the operating results related to the Argentine operations as discontinued operations in
the Consolidated Statements of Operations for all periods presented. This business was historically
reported as part of the Americas segment. See Note 3, Discontinued Operations, of “Notes to
Consolidated Financial Statements” for additional information on the sale of the Argentine
operations.
See
“Results of Operations – Discontinued Operations” later in this Item 7 for more information.
Unless otherwise noted, discussions below pertain only to our continuing operations.
Results of Operations
The following table sets forth, for the periods indicated, the percentage of revenues represented
by certain items reflected in our Consolidated Statements of Operations:
| Years Ended December 31, | ||||||||||||
| 2010 | 2009 | 2008 | ||||||||||
Percentage of Revenue: |
||||||||||||
Revenues |
100.0 | % | 100.0 | % | 100.0 | % | ||||||
Direct salaries and related costs |
64.8 | 63.5 | 63.7 | |||||||||
General and administrative |
32.3 | 27.3 | 27.7 | |||||||||
(Recovery) of regulatory penalties |
(0.0 | ) | - | - | ||||||||
Net (gain) on insurance settlement |
(0.2 | ) | - | - | ||||||||
Impairment of goodwill and intangibles |
0.0 | 0.2 | - | |||||||||
Impairment of long-lived assets |
0.3 | - | - | |||||||||
Income from continuing operations |
2.8 | 9.0 | 8.6 | |||||||||
Interest income |
0.1 | 0.3 | 0.7 | |||||||||
Interest (expense) |
(0.5 | ) | (0.1 | ) | (0.0 | ) | ||||||
Impairment (loss) on investment in SHPS |
— | (0.3 | ) | - | ||||||||
Other income (expense) |
(0.5 | ) | (0.0 | ) | 1.4 | |||||||
Income from continuing operations before income taxes |
1.9 | 8.9 | 10.7 | |||||||||
Income taxes |
0.2 | 3.2 | 2.7 | |||||||||
Income from continuing operations, net of taxes |
1.7 | 5.7 | 8.0 | |||||||||
(Loss) from discontinued operations, net of taxes |
(2.6 | ) | (0.4 | ) | (0.3 | ) | ||||||
Net income (loss) |
(0.9 | )% | 5.3 | % | 7.7 | % | ||||||
29
Table of Contents
The following table sets forth, for the periods indicated, certain data derived from
our Consolidated Statements of Operations (in thousands):
| Years Ended December 31, | ||||||||||||
| 2010 | 2009 | 2008 | ||||||||||
Revenues |
$ | 1,158,718 | $ | 813,574 | $ | 782,295 | ||||||
Direct salaries and related costs |
751,490 | 516,456 | 497,913 | |||||||||
General and administrative |
373,772 | 222,192 | 216,871 | |||||||||
(Recovery) of regulatory penalties |
(418 | ) | - | - | ||||||||
Net (gain) on insurance settlement |
(1,991 | ) | - | - | ||||||||
Impairment of goodwill and intangibles |
362 | 1,908 | - | |||||||||
Impairment of long-lived assets |
3,280 | - | - | |||||||||
Income from continuing operations |
32,223 | 73,018 | 67,511 | |||||||||
Interest income |
1,205 | 2,295 | 5,441 | |||||||||
Interest (expense) |
(5,627 | ) | (707 | ) | (178 | ) | ||||||
Impairment (loss) on investment in SHPS |
— | (2,089 | ) | - | ||||||||
Other income (expense) |
(5,906 | ) | (257 | ) | 11,298 | |||||||
Income from continuing operations before income taxes |
21,895 | 72,260 | 84,072 | |||||||||
Income taxes |
2,197 | 26,118 | 21,421 | |||||||||
Income from continuing operations, net of taxes |
19,698 | 46,142 | 62,651 | |||||||||
(Loss) from discontinued operations, net of taxes |
(29,971 | ) | (2,931 | ) | (2,090 | ) | ||||||
Net income (loss) |
$ | (10,273 | ) | $ | 43,211 | $ | 60,561 | |||||
The following table summarizes our revenues for the periods indicated, by reporting segment (in
thousands):
| Years Ended December 31, | ||||||||||||||||||||||||
| 2010 | 2009 | 2008 | ||||||||||||||||||||||
Americas |
$ | 934,329 | 80.6 | % | $ | 565,023 | 69.4 | % | $ | 514,866 | 65.8 | % | ||||||||||||
EMEA |
224,389 | 19.4 | % | 248,551 | 30.6 | % | 267,429 | 34.2 | % | |||||||||||||||
Consolidated |
$ | 1,158,718 | 100.0 | % | $ | 813,574 | 100.0 | % | $ | 782,295 | 100.0 | % | ||||||||||||
30
Table of Contents
The following table summarizes the amounts and percentage of revenues for direct salaries and
related costs, general and administrative costs, impairment of goodwill and intangibles and
impairment of long-lived assets for the periods indicated, by reporting segment (in thousands):
| Years Ended December 31, | ||||||||||||||||||||||||
| 2010 | 2009 | 2008 | ||||||||||||||||||||||
Direct salaries and related costs: |
||||||||||||||||||||||||
Americas |
$ | 580,740 | 62.2 | % | $ | 341,681 | 60.5 | % | $ | 316,068 | 61.4 | % | ||||||||||||
EMEA |
170,750 | 76.1 | % | 174,775 | 70.3 | % | 181,845 | 68.0 | % | |||||||||||||||
Consolidated |
$ | 751,490 | 64.9 | % | $ | 516,456 | 63.5 | % | $ | 497,913 | 63.6 | % | ||||||||||||
General and administrative: |
||||||||||||||||||||||||
Americas |
$ | 244,291 | 26.1 | % | $ | 120,045 | 21.2 | % | $ | 111,612 | 21.7 | % | ||||||||||||
EMEA |
64,843 | 28.9 | % | 58,646 | 23.6 | % | 64,406 | 24.1 | % | |||||||||||||||
Corporate |
64,638 | - | 43,501 | - | 40,853 | - | ||||||||||||||||||
Consolidated |
$ | 373,772 | 32.3 | % | $ | 222,192 | 27.3 | % | $ | 216,871 | 27.7 | % | ||||||||||||
(Recovery) of regulatory penalties: |
||||||||||||||||||||||||
Americas |
$ | - | 0.0 | % | $ | - | 0.0 | % | $ | - | 0.0 | % | ||||||||||||
EMEA |
(418 | ) | (0.2 | )% | - | 0.0 | % | - | 0.0 | % | ||||||||||||||
Consolidated |
$ | (418 | ) | 0.0 | % | $ | - | 0.0 | % | $ | - | 0.0 | % | |||||||||||
Net (gain) on insurance settlement: |
||||||||||||||||||||||||
Americas |
$ | (1,991 | ) | (0.2 | )% | $ | - | 0.0 | % | $ | - | 0.0 | % | |||||||||||
EMEA |
- | 0.0 | % | - | 0.0 | % | - | 0.0 | % | |||||||||||||||
Consolidated |
$ | (1,991 | ) | (0.2 | )% | $ | - | 0.0 | % | $ | - | 0.0 | % | |||||||||||
Impairment of goodwill and
intangibles: |
||||||||||||||||||||||||
Americas |
$ | - | 0.0 | % | $ | 1,908 | 0.3 | % | $ | - | 0.0 | % | ||||||||||||
EMEA |
362 | 0.2 | % | - | 0.0 | % | - | 0.0 | % | |||||||||||||||
Consolidated |
$ | 362 | 0.0 | % | $ | 1,908 | 0.2 | % | $ | - | 0.0 | % | ||||||||||||
Impairment of long-lived assets: |
||||||||||||||||||||||||
Americas |
$ | 3,121 | 0.3 | % | $ | - | 0.0 | % | $ | - | 0.0 | % | ||||||||||||
EMEA |
159 | 0.1 | % | - | 0.0 | % | - | 0.0 | % | |||||||||||||||
Consolidated |
$ | 3,280 | 0.3 | % | $ | - | 0.0 | % | $ | - | 0.0 | % | ||||||||||||
2010 Compared to 2009
Revenues
During 2010, we recognized consolidated revenues of $1,158.7 million, an increase of $345.1 million
or 42.4%, from $813.6 million of consolidated revenues for 2009. Excluding the ICT revenues of
$362.7 million, revenues decreased $17.6 million for 2010 compared to 2009.
On a geographic segment basis, revenues from the Americas region, including the United States,
Canada, Latin
31
Table of Contents
America,
India and the Asia Pacific Rim, represented 80.6%, or $934.3 million, for
2010 compared to 69.4%, or $565.0 million, for 2009. Revenues from the EMEA region, including
Europe, the Middle East and Africa
represented 19.4%, or $224.4 million, for 2010 compared to 30.6%, or $248.6 million, for 2009.
The increase in the Americas’ revenues was $369.3 million, or 65.4%, for 2010, compared to 2009.
Excluding the ICT revenues of $362.7 million, the Americas’ revenues for 2010, compared to 2009
increased $6.6 million. The $6.6 million increase consists of a positive foreign currency
translation impact of $24.9 million and a favorable foreign currency hedging fluctuation of $14.4
million, partially offset by a $32.7 million decrease in revenues principally due to expiration of
certain client programs and lower than forecasted demand within certain clients. Revenues from our
offshore operations represented 47.7%, or 54.6% excluding ICT revenues, of Americas’ revenues,
compared to 57.5% for 2009. While operating margins generated offshore are generally comparable to
those in the United States, our ability to maintain these offshore operating margins longer term is
difficult to predict due to potential increased competition for the available workforce, the trend
of higher occupancy costs and costs of functional currency fluctuations in offshore markets. We
weight these factors in our focus to re-price or replace certain sub-profitable target client
programs.
The decrease in EMEA revenues of $24.2 million, or 9.7%, for 2010, compared to 2009, reflects a
decrease of $20.7 million due largely to client program expirations, near-shore migration to lower
cost geographies in Egypt, Romania and Germany and sustained weakness within the technology and
communication verticals and a $4.7 million negative foreign currency translation impact, partially
offset by a $1.2 million contribution in revenues from ICT. Excluding the $4.7 million negative
foreign currency translation impact, EMEA’s revenues decreased 7.8% for 2010 compared to 2009.
Direct Salaries and Related Costs
Direct salaries and related costs increased $235.0 million, or 45.5%, to $751.5 million for 2010
from $516.5 million in 2009. This increase includes ICT direct salaries and related costs of
$230.1 million for 2010.
On a reporting segment basis, direct salaries and related costs from the Americas segment increased
$239.0 million, or 70.0%, to $580.7 million for 2010 from $341.7 million in 2009. Direct salaries
and related costs from the EMEA segment decreased $4.0 million, or 2.3%, to $170.8 million for 2010
from $174.8 million in 2009. While changes in foreign currency exchange rates positively impacted
revenues in the Americas, they negatively impacted direct salaries and related costs in 2010
compared to 2009 by $15.4 million. Conversely, while changes in foreign currency exchange rates
negatively impacted revenues in EMEA, they positively impacted direct salaries and related costs in
2010 compared to 2009 by $4.3 million.
In the Americas segment, as a percentage of revenues, direct salaries and related costs increased
to 62.2% for 2010 from 60.5% in 2009. This increase of 1.7%, as a percentage of revenues, was
primarily attributable to higher compensation costs of 2.8% (primarily related to lower than
forecasted demand within certain clients without a commensurate reduction in labor costs and wage
increases in certain geographies), higher communication costs of 0.6% and higher billable supply
costs of 0.3%, partially offset by lower auto tow claim costs of 1.4%, lower travel costs of 0.2%,
lower bonus award costs of 0.1% and lower other costs of 0.3%.
In the EMEA segment, as a percentage of revenues, direct salaries and related costs increased to
76.1% for 2010 from 70.3% in 2009. This increase of 5.8%, as a percentage of revenues, was
primarily attributable to higher compensation costs of 3.4% (primarily related to near-shore
migration to new facilities in Egypt, Romania and Germany and the corresponding termination and
duplicative costs), higher severance costs of 1.6%, higher travel costs of 0.2%, higher billable
supply costs of 0.2%, higher recruiting costs of 0.2% and higher other costs of 0.2%.
General and Administrative
General and administrative expenses increased $151.6 million, or 68.2%, to $373.8 million for 2010
from $222.2 million in 2009. This increase includes ICT general and administrative costs of $139.6
million for 2010.
On a reporting segment basis, general and administrative expenses from the Americas segment
increased $124.3 million, or 103.6%, to $244.3 million for 2010 from $120.0 million in 2009.
General and administrative expenses from the EMEA segment increased $6.2 million, or 10.6%, to
$64.8 million for 2010 from $58.6 million in 2009. While changes in foreign currency exchange
rates positively impacted revenues in the Americas, they negatively impacted general and
administrative expenses in 2010 compared to 2009 by
$4.5 million. Conversely, while changes
32
Table of Contents
in foreign currency exchange rates negatively impacted revenues in EMEA, they positively impacted
general and administrative expenses in 2010 compared to 2009 by $1.3 million. Corporate general and
administrative expenses
increased $21.1 million, or 48.6%, to $64.7 million for 2010 from $43.6 million in 2009. This
increase of $21.1 million was primarily attributable to ICT acquisition-related costs (comprised of
$14.9 million in severance costs and other costs and $6.0 million in transaction and integration
costs), higher compensation costs of $0.9 million, higher travel costs of $0.4 million, higher dues
and subscriptions of $0.3 million and higher training costs of $0.3 million, partially offset by
lower legal and professional fees of $0.9 million, lower business development costs of $0.4 million
and lower other costs of $0.4 million.
In the Americas segment, as a percentage of revenues, general and administrative expenses increased
to 26.2% for 2010 from 21.2% in 2009. This increase of 5.0%, as a percentage of revenues, was
primarily attributable to higher facility-related costs of 1.4%, higher depreciation and
amortization costs of 1.9%, higher equipment and maintenance costs of 0.7%, higher ICT
acquisition-related costs of 1.1% (primarily severance and lease termination costs) and higher
compensation costs of 0.3%, partially offset by lower bad debt expense of 0.2% and lower other
costs of 0.2%.
In the EMEA segment, as a percentage of revenues, general and administrative expenses increased to
28.9% for 2010 from 23.6% in 2009. This increase of 5.3%, as a percentage of revenues, was
primarily attributable to higher facility-related costs of 2.5%, higher compensation costs of 1.0%
(primarily related to near-shore migration to new facilities in Egypt, Romania and Germany and the
corresponding termination and duplicative costs), higher travel costs of 0.4%, higher depreciation
and amortization costs of 0.3%, higher legal and professional fees of 0.5%, higher equipment and
maintenance costs of 0.2%, higher communications costs of 0.2% and higher other costs of 0.2%.
(Recovery) of Regulatory Penalties
During 2010, we reversed an accrual of $0.4 million related to the provision for regulatory
penalties, which is related to one of three privacy claims associated with the alleged
inappropriate acquisition of personal bank account information by our Spanish subsidiary, as a
result of a favorable ruling by the Spanish Supreme Court (none in 2009). The provision was
initially recorded in 2007.
Net (Gain) on Insurance Settlement
In September 2009, the building and contents of one of our customer contact management centers
located in Marikina City, the Philippines (acquired as part of the ICT acquisition) was severely
damaged by flooding from Typhoon Ondoy. Upon settlement with the insurer in November 2010, we
recognized a net gain of $2.0 million (none in 2009). The damaged property and equipment had been
written down by ICT prior to the ICT acquisition in February 2010.
Impairment of Goodwill and Intangibles
We make certain estimates and assumptions, including, among other things, an assessment of market
conditions and projections of cash flows, investment rates and cost of capital and growth rates
when estimating the value of our intangibles. Based on actual and forecasted operating results and
deterioration of the related customer base in our ICT-acquired United Kingdom operations, the EMEA
segment recorded an impairment charge of $0.4 million on goodwill and intangibles (primarily
customer relationships) during 2010. The Americas segment recorded an impairment charge of $1.9
million on goodwill and intangibles during 2009 related to the March 2005 acquisition of KLA.
Impairment of Long-Lived Assets
During 2010, we recorded a $3.1 million impairment charge for long-lived assets, primarily
leasehold improvements, in the Americas segment, including the Philippines and the United States
(none in 2009). Additionally, we recorded a $0.2 million impairment charge for long-lived assets,
primarily leasehold improvements and equipment in the EMEA segment, including the United Kingdom
and Ireland (none in 2009). The impairment charge represented the amount by which the carrying
value of the assets exceeded the estimated fair value of those assets which cannot be redeployed to
other locations.
Interest Income
Interest income was $1.2 million for 2010, compared to $2.3 million in 2009, reflecting lower
average rates earned
on lower average balances of interest bearing investments in cash and cash
equivalents.
33
Table of Contents
Interest (Expense)
Interest expense was $5.6 million for 2010 compared to $0.7 million in 2009, an increase of $4.9
million reflecting interest and fees on higher average levels of borrowings related to the
acquisition of ICT. We expect interest expense to decrease in 2011 as a result of the payoff of
the $75 million Bermuda Credit Agreement and the $75 million Term Loan, drawn down in 2010 in
connection with the acquisition of ICT.
Impairment (Loss) on Investment in SHPS
In the Americas segment, we recorded an impairment loss of $2.1 million on our entire investment in
SHPS during 2009 (none in 2010).
Other Income (Expense)
Other expense, net, was $5.9 million for 2010 compared to $0.3 million in 2009. The net increase in
other expenses, net, of $5.6 million was primarily attributable to an increase of $2.7 million in
realized and unrealized foreign currency transaction losses, net of gains, an increase of $2.6
million in forward currency contract losses (which were not designated as hedging instruments) and
an increase of $0.3 million in other miscellaneous expenses, net. Other income (expense) excludes
the cumulative translation effects and unrealized gains (losses) on financial derivatives that are
included in “Accumulated other comprehensive income” in shareholders’ equity in the accompanying
Consolidated Balance Sheets.
Income Taxes
The provision for income taxes of $2.2 million for 2010 was based upon pre-tax income of $21.9
million, compared to the provision for income taxes of $26.1 million for 2009 based upon pre-tax
income of $72.3 million. The effective tax rate was 10.0% for 2010 compared to an effective tax
rate of 36.1% for 2009.
The decrease in the effective tax rate of 26.1% resulted primarily from the proportionately higher
income under tax holiday jurisdictions, the foreign tax rate differential, a favorable change in
uncertain tax positions due to a favorable settlement of a tax audit, expiring statutes of
limitation and tax benefits related to the ICT legal entity reorganization, and the absence of an
unfavorable impact related to the $85.0 million change of intent to repatriate foreign earnings in
2009, partially offset by the lack of a release of valuation allowances and a higher proportion of
withholding taxes in 2010.
On December 17, 2010 the Tax Relief, Unemployment Insurance Reauthorization, and Job Creation Act
of 2010 (the “Tax Relief Act”) was enacted. Included in the Tax Relief Act is the extension until
December 31, 2011 of Internal Revenue Code Section 954(c)(6). As a result of this extension, we
changed our intent to distribute current earnings from various foreign operations to their foreign
parents. These tax provisions permit continued tax deferral on such distributions that would
otherwise be taxable immediately in the United States. While the distributions are not taxable in
the United States, related withholding taxes of $1.7 million are included in the provision for
income taxes in the Consolidated Statement of Operations for 2010.
Prior to the passage of the Tax Relief Act, we determined that we intended to distribute all of the
current year and future years’ earnings of a non-U.S. subsidiary to its foreign parent.
Withholding taxes of $0.9 million related to this distribution are included in the provision for
income taxes in the Consolidated Statement of Operations for 2010.
(Loss) from Discontinued Operations
During December 2010, we committed to a plan and sold our Argentine operations. We accounted for
this transaction in accordance with ASC 205-20 (“ASC 205-20”) “Discontinued Operations”, and,
accordingly, we have reclassified the results of operations and any losses resulting from the sale
for all periods presented to reflect them as such. The loss from discontinued operations, net of
tax, totaled $6.5 million and $2.9 million for 2010 and 2009, respectively. This increase of $3.6
million includes $3.3 million from the ICT Argentine operations acquired in February 2010.
Excluding the loss from discontinued ICT Argentine operations of $3.3 million, the loss from
discontinued operations increased $0.3 million for 2010 compared to 2009, primarily due to the
impairment of long-lived assets. The loss on sale of discontinued operations, net of tax, was
$23.5 million for 2010.
34
Table of Contents
Net Income (Loss)
As a result of the foregoing, we reported income from continuing operations for 2010 of $32.2
million, a decrease of $40.8 million from 2009. This decrease was principally attributable to a
$235.0 million increase in direct salaries and related costs, a $151.6 million increase in general
and administrative costs and a $3.3 million impairment of long-lived assets, partially offset by a
$345.1 million increase in revenues, a $2.0 million net gain on insurance settlement, a decrease in
impairment of goodwill and intangibles of $1.6 million and a $0.4 million reversal of the provision
for regulatory penalties. In addition to the $40.8 million decrease in income from continuing
operations, we experienced a $5.6 million increase in other expense, net, an increase in interest
expense of $4.9 million, a $1.1 million decrease in interest income, an increase of $3.6 million of
loss from discontinued operations and a $23.5 million loss on sale of discontinued operations,
partially offset by a decrease of $2.1 million due to the impairment loss on investment in SHPS in
2009 and a $23.9 million lower tax provision, resulting in a net loss of $10.3 million for 2010, a
decrease of $53.5 million compared to 2009.
2009 Compared to 2008
Revenues
During 2009, we recognized consolidated revenues of $813.6 million, an increase of $31.3 million or
4.0%, from $782.3 million of consolidated revenues for 2008. Revenues increased in 2009, despite
the rapid and sharp deterioration in the economy, due to increased demand from our new and existing
client relationships.
On a geographic segment basis, revenues from the Americas region, including the United States,
Canada, Latin America, India and the Asia Pacific Rim, represented 69.4%, or $565.0 million, for
2009 compared to 65.8%, or $514.9 million, for 2008. Revenues from the EMEA region, including
Europe, the Middle East and Africa represented 30.6%, or $248.6 million, for 2009 compared to
34.2%, or $267.4 million, for 2008.
The increase in the Americas’ revenues of $50.1 million, or 9.7%, for 2009 compared to 2008,
reflects a broad-based growth in client demand, including new and existing client relationships,
partially offset by certain program expirations and a negative foreign currency impact of $13.8
million. Excluding this $13.8 million foreign currency impact, Americas’ revenue increased $63.9
million, or 12.4% in 2009 compared to 2008. The $63.9 million increase includes new and existing
client relationships, primarily due to a combination of new programs with existing clients,
expansion of existing programs and new client relationships. Revenues from our offshore operations
represented 57.5% of Americas’ revenues, compared to 59.0% for 2008. Americas’ revenues for 2009
and 2008 also included a $9.3 million and a $2.4 million net loss on foreign currency hedges,
respectively. Excluding the effect of this $6.9 million foreign currency hedging fluctuation, the
Americas’ revenues increased $57.0 million, or 11.1%, for 2009 compared to 2008.
The decrease in EMEA’s revenues of $18.8 million, or 7.1%, for 2009 compared to 2008, reflects a
$22.4 million negative foreign currency impact partially offset by an increase of $3.6 million in
client demand. This $3.6 million increase in client demand includes a $3.0 million increase in
existing client programs as well as a $0.6 million increase in new client relationships. Excluding
the $22.4 million foreign currency impact, EMEA’s revenues increased 1.3% for 2009 compared to
2008.
Direct Salaries and Related Costs
Direct salaries and related costs increased $18.6 million, or 3.7%, to $516.5 million for 2009 from
$497.9 million in 2008.
On a reporting segment basis, direct salaries and related costs from the Americas segment increased
$25.6 million, or 8.1%, to $341.7 million 2009 from $316.1 million for 2008. Direct salaries and
related costs from the EMEA segment decreased $7.0 million, or 3.9%, to $174.8 million for 2009
from $181.8 million in 2008. Changes in foreign currency exchange rates positively impacted
revenues in the Americas, they also positively impacted direct salaries and related costs in 2009
compared to 2008 by $17.3 million. While changes in foreign currency exchange rates negatively
impacted revenues in EMEA, they positively impacted direct salaries and related costs in 2009
compared to 2008 by $15.1 million.
35
Table of Contents
In the Americas segment, as a percentage of revenues, direct salaries and related costs decreased
to 60.5% for 2009 from 61.4% in 2008. This decrease of 0.9%, as a percentage of revenues, was
primarily attributable to lower auto
tow claim costs of 0.7%, lower other costs of 0.4%, lower travel costs of 0.1% and lower recruiting
costs of 0.1%, partially offset by higher bonus award costs of 0.2%, higher compensation costs of
0.1%, and higher communication costs of 0.1%.
In the EMEA segment, as a percentage of revenues, direct salaries and related costs increased to
70.3% for 2009 from 68.0% in 2008. This increase of 2.3%, as a percentage of revenues, was
primarily attributable to higher compensation costs of 1.8%, higher fulfillment material costs of
0.3%, higher billable supply costs of 0.2%, higher communication costs of 0.1%, higher seminar
costs of 0.1% and higher other costs of 0.3%, partially offset by lower recruiting costs of 0.5%.
General and Administrative
General and administrative expenses increased $5.3 million, or 2.4%, to $222.2 million for 2009
from $216.9 million in 2008.
On a reporting segment basis, general and administrative expenses from the Americas segment
increased $8.4 million, or 7.5%, to $120.0 million for 2009 from $111.6 million in 2008. General
and administrative expenses from the EMEA segment decreased $5.8 million, or 8.9%, to $58.6 million
for 2009 from $64.4 million in 2008. While changes in foreign currency exchange rates negatively
impacted revenues in the Americas and EMEA, they positively impacted general and administrative
expenses in 2009 compared to the same period in 2008 by approximately $4.2 million and $6.0
million, respectively. Corporate general and administrative expenses increased $2.7 million, or
6.5%, to $43.6 million for 2009 from $40.9 million in 2008. This increase of $2.7 million was
primarily attributable to higher compensation costs of $3.6 million, higher software maintenance
costs of $0.5 million, higher legal and professional fees of $2.6 million, higher business
development costs of $0.4 million and higher depreciation and amortization costs of $0.2 million,
partially offset by lower travel costs of $1.3 million, lower facility-related costs of $0.2
million, lower consulting costs of $0.6 million, lower training costs of $0.7 million, lower
insurance costs of $0.4 million, lower bad debt expense of $0.8 million and lower other costs of
$0.6 million.
In the Americas segment, as a percentage of revenues, general and administrative expenses decreased
to 21.2% for 2009 from 21.7% in 2008. This decrease of 0.5%, as a percentage of revenues, was
primarily attributable to lower software maintenance costs of 0.2%, recruiting costs of 0.2% and
lower depreciation and amortization costs of 0.2%, partially offset by higher other costs of 0.1%.
In the EMEA segment, as a percentage of revenues, general and administrative expenses decreased to
23.6% for 2009 from 24.1% in 2008. This decrease of 0.5%, as a percentage of revenues, was
primarily attributable to lower travel costs of 0.3%, lower recruiting costs of 0.2%, lower
facility-related costs of 0.1%, lower supply costs of 0.1%, lower communications costs of 0.1%,
lower training costs of 0.1% and lower other costs of 0.3%, partially offset by higher compensation
costs of 0.3%, higher bad debt expense of 0.2% and higher depreciation and amortization costs of
0.2%.
Impairment of Goodwill and Intangibles
We make certain estimates and assumptions, including, among other things, an assessment of market
conditions and projections of cash flows, investment rates and cost of capital and growth rates
when estimating the value of our intangibles. Based on actual and forecasted operating results,
deterioration of the related customer base and loss of key employees, the Americas segment recorded
an impairment charge of $1.9 million on goodwill and intangibles during 2009 related to the March
2005 acquisition of KLA (none in 2008).
Interest Income
Interest income was $2.3 million in 2009, compared to $5.4 million in 2008. Interest income
decreased $3.1 million reflecting lower average rates earned on higher average balances of interest
bearing investments in cash and cash equivalents.
36
Table of Contents
Interest (Expense)
Interest expense was $0.7 million for 2009 compared to $0.2 million for 2008, an increase of $0.5
million reflecting higher average levels of outstanding short-term debt, primarily related to the
$75 million Bermuda Credit Agreement, higher average rates, amortization of deferred loan fees and
fees paid on our unused revolving credit facility.
Impairment (Loss) on Investment in SHPS
During 2009, we received notice from SHPS that the shareholders of SHPS had approved a merger
agreement between SHPS and SHPS Acquisition, Inc., pursuant to which the common stock of SHPS,
including the common stock owned by us, would be converted into the right to receive $0.000001 per
share in cash. SHPS informed us that it believed the estimated fair value of the SHPS common stock
to be equal to such per share amount. As a result of this transaction and careful evaluation of our
legal options, we believed it was more likely than not that we will not be able to recover the $2.1
million carrying value of the investment in SHPS. Therefore, in the Americas segment, we recorded a
non-cash impairment loss of $2.1 million during 2009. Subsequent to the recording of the
impairment loss, we liquidated our noncontrolling interest in SHPS by converting our SHPS common
stock into cash for $0.000001 per share during 2009.
Other Income (Expense)
Other expense, net, was $0.3 million in 2009 compared to other income, net, of $11.3 million in
2008. This $11.6 million net increase in other expense was primarily attributable to an increase of
$11.6 million in unrealized foreign currency transaction losses, net of gains arising from the
revaluation of nonfunctional currency assets and liabilities and an increase of $1.7 million in
forward currency contract losses (which were not designated as hedging instruments), partially
offset by a $1.7 million increase in other income. Other income excludes the effects of cumulative
translation effects and unrealized gains (losses) on financial derivatives that are included in
“Accumulated other comprehensive income (loss)” in shareholders’ equity in the accompanying
Consolidated Balance Sheets.
Income Taxes
The provision for income taxes of $26.1 million for 2009 was based upon pre-tax income of $72.3
million, compared to the provision for income taxes of $21.4 million for 2008 based upon pre-tax
income of $84.1 million. The effective tax rate was 36.1% for 2009 compared to an effective tax
rate of 25.5% for 2008.
The increase in the effective tax rate of 10.6% resulted primarily from our change of intent during
the quarter ended December 31, 2009 regarding the permanent reinvestment of $85 million of our
foreign subsidiaries’ accumulated and undistributed earnings, which came about due to our borrowing
of a $75 million Term Loan on February 2, 2010 to close the ICT acquisition and a $10 million
increase in estimated costs relating to the ICT acquisition. The proposed acquisition of ICT and
the intent to fund the transaction through committed credit facilities was announced on October 6,
2009. Under the provisions of ASC 740-30, we determined that, based upon historical results, we
could not retire the $75 million Term Loan and pay the additional $10 million in estimated costs
without depleting excess U.S. cash flows needed for future operations. Accordingly, a deferred tax
expense of $14.7 million, net of a release of a valuation allowance of $1.6 million on foreign tax
credits related to this change in intent, was required to be recorded for financial reporting
purposes during the quarter ended December 31, 2009 under ASC 740-30. The Finance Committee of our
Board of Directors approved the repatriation of $85.0 million of foreign subsidiaries’ accumulated
and undistributed earnings on February 8, 2010. All other undistributed earnings are still
permanently reinvested in accordance with ASC 740-30. Other items that increased the effective tax
rate were an additional deferred tax liability of $2.9 million, favorable foreign income tax rate
differentials of $1.6 million and the effects of the change in our permanent differences in the
amount of $1.5 million.
This increase in the effective rate was partially offset by a $6.6 million change in the
recognition of deferred tax assets primarily due to fluctuations in our valuation allowances, a
reduction of $3.5 million in foreign withholding taxes, and a $2.9 million increase in the benefits
from tax holiday jurisdictions. The reduction of $3.5 million in foreign withholding taxes was
primarily a result of a reduction in the amount of dividends distributed by our Philippine company
to its foreign parent in the Netherlands in 2009 when compared to 2008.
37
Table of Contents
Generally, earnings associated with our investments in our subsidiaries are considered to be
permanently invested
and no provision for income taxes on those earnings or translation adjustments has been provided.
The U.S. Department of the Treasury released the “General Explanations of the Administration’s
Fiscal Year 2010 Revenue Proposals” in May 2009. These proposals represent a significant shift in
international tax policy, which may materially impact U.S. taxation of international earnings,
including our position on permanent reinvestment of foreign earnings. In response to this release,
we changed our intent for 2009 with respect to the distribution of current earnings for one lower
tier subsidiary and incurred withholding tax expense of $2.5 million in 2009 with respect to this
subsidiary’s current earnings.
(Loss) from Discontinued Operations
During December 2010, we committed to a plan and sold our Argentine operations. We accounted for
this transaction in accordance with ASC 205-20, and, accordingly, have reclassified the results of
operations to reflect them as discontinued operations for all periods presented. The loss from
discontinued operations, net of tax, totaled $2.9 million and $2.1 million for 2009 and 2008,
respectively. The $0.8 million increase in loss from discontinued operations, driven by a decrease
in client demand, resulted from a $4.5 million decrease in revenues, partially offset by $1.7
million lower direct salaries and related costs, $1.4 million lower general and administrative
costs and $0.6 million lower other expenses (including asset disposals and interest expense).
Net Income
As a result of the foregoing, we reported income from continuing operations for 2009 of $73.0
million, an increase of $5.5 million from 2008. This increase was principally attributable to a
$31.3 million increase in revenues, partially offset by an $18.6 million increase in direct
salaries and related costs, a $5.3 million increase in general and administrative costs and an
impairment charge of $1.9 million. The $5.5 million increase in income from continuing operations
was offset by a $11.6 million decrease in other income, net, a $3.1 million decrease in interest
income, a $2.1 million impairment loss on investment in SHPS, an increase in interest expense of
$0.5 million, a $4.7 million higher tax provision and an increase of $0.8 million in loss from
discontinued operations, resulting in net income of $43.2 million for 2009, a decrease of $17.3
million compared to 2008.
Quarterly Results
The following information presents our unaudited quarterly operating results from continuing
operations for 2010 and 2009. The data has been prepared on a basis consistent with the
Consolidated Financial Statements included elsewhere in this Annual Report on Form 10-K, and
includes all adjustments, consisting of normal recurring accruals, that we consider necessary for a
fair presentation thereof.
38
Table of Contents
| (in thousands, except per share data) | 12/31/2010 | 9/30/2010 | 6/30/2010 | 3/31/2010 | 12/31/2009 | 9/30/2009 | 6/30/2009 | 3/31/2009 | ||||||||||||||||||||||||
Revenues (1) |
$ | 309,146 | $ | 294,455 | $ | 288,535 | $ | 266,582 | $ | 213,338 | $ | 205,311 | $ | 200,486 | $ | 194,439 | ||||||||||||||||
Operating expenses: |
||||||||||||||||||||||||||||||||
Direct salaries and related costs (1) |
200,334 | 190,813 | 188,693 | 171,650 | 136,832 | 128,323 | 127,041 | 124,260 | ||||||||||||||||||||||||
General and administrative (1,2,3) |
96,894 | 86,800 | 90,055 | 100,023 | 60,448 | 55,469 | 53,659 | 52,616 | ||||||||||||||||||||||||
(Recovery) of regulatory penalties |
(418 | ) | - | - | - | - | - | - | - | |||||||||||||||||||||||
Net (gain) on insurance settlement |
(1,991 | ) | - | - | - | - | - | - | - | |||||||||||||||||||||||
Impairment of goodwill and intangibles |
- | 362 | - | - | - | 324 | 1,584 | - | ||||||||||||||||||||||||
Impairment of long-lived assets |
177 | 3,103 | - | - | - | - | - | - | ||||||||||||||||||||||||
Total operating expenses |
294,996 | 281,078 | 278,748 | 271,673 | 197,280 | 184,116 | 182,284 | 176,876 | ||||||||||||||||||||||||
Income (loss) from continuing operations |
14,150 | 13,377 | 9,787 | (5,091 | ) | 16,058 | 21,195 | 18,202 | 17,563 | |||||||||||||||||||||||
Other income (expense): |
||||||||||||||||||||||||||||||||
Interest income |
393 | 312 | 268 | 232 | 356 | 493 | 600 | 846 | ||||||||||||||||||||||||
Interest (expense) (4,5) |
(388 | ) | (1,373 | ) | (1,520 | ) | (2,346 | ) | (410 | ) | (79 | ) | (170 | ) | (48 | ) | ||||||||||||||||
Impairment (loss) on investment in SHPS |
- | - | - | - | - | - | (2,089 | ) | - | |||||||||||||||||||||||
Other income (expense) |
(360 | ) | (527 | ) | (3,590 | ) | (1,429 | ) | (1,144 | ) | (56 | ) | 84 | 859 | ||||||||||||||||||
Total other income (expense) |
(355 | ) | (1,588 | ) | (4,842 | ) | (3,543 | ) | (1,198 | ) | 358 | (1,575 | ) | 1,657 | ||||||||||||||||||
Income (loss) from continuing operations before income
taxes |
13,795 | 11,789 | 4,945 | (8,634 | ) | 14,860 | 21,553 | 16,627 | 19,220 | |||||||||||||||||||||||
Income taxes (6) |
3,965 | (2,267 | ) | 966 | (467 | ) | 18,186 | 2,388 | 1,257 | 4,287 | ||||||||||||||||||||||
Income (loss) from continuing operations, net of taxes |
9,830 | 14,056 | 3,979 | (8,167 | ) | (3,326 | ) | 19,165 | 15,370 | 14,933 | ||||||||||||||||||||||
(Loss) from discontinued operations, net of taxes |
(3,286 | ) | (410 | ) | (1,434 | ) | (1,346 | ) | (1,363 | ) | (383 | ) | (1,022 | ) | (163 | ) | ||||||||||||||||
(Loss) on sale of discontinued operations, net of taxes |
(23,495 | ) | - | - | - | - | - | - | - | |||||||||||||||||||||||
Net income (loss) |
$ | (16,951 | ) | $ | 13,646 | $ | 2,545 | $ | (9,513 | ) | $ | (4,689 | ) | $ | 18,782 | $ | 14,348 | $ | 14,770 | |||||||||||||
Net income (loss) per common share (7) : |
||||||||||||||||||||||||||||||||
Basic: |
||||||||||||||||||||||||||||||||
Continuing operations |
$ | 0.21 | $ | 0.30 | $ | 0.09 | $ | (0.18 | ) | $ | (0.08 | ) | $ | 0.47 | $ | 0.38 | $ | 0.37 | ||||||||||||||
Discontinued operations |
(0.58 | ) | (0.01 | ) | (0.04 | ) | (0.03 | ) | (0.03 | ) | (0.01 | ) | (0.03 | ) | (0.01 | ) | ||||||||||||||||
Net income (loss) per common share |
$ | (0.37 | ) | $ | 0.29 | $ | 0.05 | $ | (0.21 | ) | $ | (0.11 | ) | $ | 0.46 | $ | 0.35 | $ | 0.36 | |||||||||||||
Diluted: |
||||||||||||||||||||||||||||||||
Continuing operations |
$ | 0.21 | $ | 0.30 | $ | 0.09 | $ | (0.18 | ) | $ | (0.08 | ) | $ | 0.47 | $ | 0.38 | $ | 0.36 | ||||||||||||||
Discontinued operations |
(0.58 | ) | (0.01 | ) | (0.04 | ) | (0.03 | ) | (0.03 | ) | (0.01 | ) | (0.03 | ) | (0.00 | ) | ||||||||||||||||
Net income (loss) per common share |
$ | (0.37 | ) | $ | 0.29 | $ | 0.05 | $ | (0.21 | ) | $ | (0.11 | ) | $ | 0.46 | $ | 0.35 | $ | 0.36 | |||||||||||||
Weighted average shares: |
||||||||||||||||||||||||||||||||
Basic |
46,451 | 46,468 | 46,601 | 44,590 | 40,827 | 40,743 | 40,654 | 40,630 | ||||||||||||||||||||||||
Diluted |
46,563 | 46,559 | 46,648 | 44,766 | 41,151 | 41,097 | 40,953 | 41,034 | ||||||||||||||||||||||||
| (1) | The amounts for each of the quarters in 2010 include the results of ICT as a result of the
acquisition completed on February 2, 2010. |
|
| (2) | The quarters ended December 31, 2010, September 30, 2010, June 30, 2010, and March 31, 2010
include $10.9 million, $6.3 million, $5.9 million and $23.2 million, respectively, in ICT
acquisition-related costs. |
|
| (3) | The quarters ended December 31, 2009 and September 30, 2009 include $2.3 million and $1.0
million, respectively, in ICT acquisition-related costs. |
|
| (4) | The quarter ended December 31, 2009 includes $0.3 million in interest and amortization of
deferred loan fees related to the $75 million Bermuda Credit Agreement. |
|
| (5) | The quarters ended September 30, 2010, June 30, 2010, and March 31, 2010 include interest and
amortization of deferred loan fees related to the $75 million Term Loan, the $75 million
revolving credit facility and the $75 million Bermuda Credit Agreement. The Term Loan and the
Bermuda Credit Agreement were paid off in September 2010 and March 2010, respectively. |
|
| (6) | The quarter ended December 31, 2009 includes additional expense of $14.7 million relating to
our deemed change of assertion in the fourth quarter of 2009
regarding the permanent reinvestment of foreign subsidiaries’ accumulated and undistributed
earnings, partially offset by a $5.8 million reversal of income tax valuation allowances. |
|
| (7) | Net income (loss) per basic and diluted common share is computed independently for each of
the quarters presented and, therefore, may not sum to the total for the year. |
39
Table of Contents
Liquidity and Capital Resources
Our primary sources of liquidity are generally cash flows generated by operating activities and
from available borrowings under our revolving credit facilities. We utilize these capital resources
to make capital expenditures associated primarily with our customer contact management services,
invest in technology applications and tools to further develop our service offerings and for
working capital and other general corporate purposes, including repurchase of our common stock in
the open market and to fund possible acquisitions. In future periods, we intend similar uses of
these funds.
On August 5, 2002, the Board of Directors authorized the Company to purchase up to 3.0 million
shares of our outstanding common stock. A total of 2.2 million shares have been repurchased under
this program since inception. The shares are purchased, from time to time, through open market
purchases or in negotiated private transactions, and the purchases are based on factors, including
but not limited to, the stock price and general market conditions. During 2010, we repurchased 0.3
million common shares under the 2002 repurchase program at prices ranging between $16.92 and $17.60
per share for a total cost of $5.2 million. During 2009, we repurchased 0.2 million common shares
under the 2002 repurchase program at prices ranging between $13.72 and $14.75 per share for a total
cost of $3.2 million. During 2008, we repurchased less than 0.1 million common shares under the
2002 repurchase program at a price of $14.83 per share for a total cost of $0.5 million. We may
make additional discretionary stock repurchases under this program in 2011 depending upon economic
and market conditions.
During 2010, cash increased $80.0 million upon the lapse of restrictions on our cash balances as a
result of our repayment of short-term debt, we received $75.0 million in proceeds from the issuance
of long term debt, $45.1 million from operating activities, $2.0 million from an insurance
settlement, $0.4 million in excess tax benefits from stock-based compensation and $0.2 million in
cash from grant proceeds. Further, we used $85.0 million to repay short-term debt, $77.2 million
for the ICT acquisition (net of ICT cash acquired), $75.0 million to repay long-term debt, $28.5
million for capital expenditures, $14.5 million of cash divested as part of the sale of the
Argentine operations, $5.2 million on the repurchase of the Company’s stock, $1.3 million to
repurchase stock for minimum tax withholding on equity awards, invested $0.2 million in restricted
cash and paid $3.0 million for loan fees related to the debt financing resulting in a $90.0 million
decrease in available cash (including the unfavorable effects of international currency exchange
rates on cash of $2.8 million).
Net cash flows provided by operating activities for 2010 were $45.1 million, compared to $87.6
million provided by operating activities for 2009. The $42.5 million decrease in net cash flows
from operating activities was due to a $53.5 million decrease in net income and a net decrease of
$16.7 million in cash flows from assets and liabilities, partially offset by a $27.7 million
increase in non-cash reconciling items such as the loss on sale of discontinued operations,
impairment charges, depreciation and amortization, deferred income taxes, stock-based compensation
and unrealized gains on financial instruments. The $16.7 million decrease in cash flows from
assets and liabilities was principally a result of a $12.6 million decrease in income taxes
payable, an $7.6 million decrease in other liabilities and a $1.5 million increase in receivables,
partially offset by a $4.1 million decrease in other assets and a $0.9 million increase in deferred
revenue.
During 2010, we committed to a plan and sold our Argentine operations. Cash flows from
discontinued operations were as follows (in millions):
| Years Ended December 31, | ||||||||||||
| 2010 | 2009 | 2008 | ||||||||||
Cash provided by (used for) operating activities of
discontinued operations |
$ | (2.1 | ) | $ | 0.3 | $ | 2.7 | |||||
Cash (used for) investing activities of discontinued
operations |
$ | (13.2 | ) | $ | (0.3 | ) | $ | (2.4 | ) | |||
Cash provided by (used for) operating activities of discontinued operations represents the cash
provided by (used for) the Argentine operations in 2010, 2009 and 2008. Cash (used for) investing
activities of discontinued operations in 2010 primarily represents the cash on the balance sheet of
the Argentine operations at the time of the sale. Cash (used for) investing activities of
discontinued operations in 2009 and 2008 primarily represents capital expenditures. The sale of
the Argentine operations resulted in a pre-tax loss of $29.9 million, or a $23.5 million loss, net
of tax. We do not expect the sale of our Argentine operations to negatively affect our future
liquidity and capital resources.
40
Table of Contents
Capital expenditures, which are generally funded by cash generated from operating activities,
available cash
balances and borrowings available under our credit facilities, were $28.5 million for 2010,
compared to $30.3 million for 2009, a decrease of $1.8 million. During 2010, approximately 12% of
the capital expenditures were the result of investing in new and existing customer contact
management centers, primarily in near-shore and offshore locations, and 88% was expended primarily
for maintenance and systems infrastructure. In 2011, we anticipate capital expenditures in the
range of $38.0 million to $42.0 million.
On February 2, 2010, we entered into a Credit Agreement (the “Credit Agreement”) with a group of
lenders and KeyBank, as Lead Arranger, Sole Book Runner and Administrative Agent. The Credit
Agreement provides for a $75 million Term Loan and a $75 million revolving credit facility, which
is subject to certain borrowing limitations and includes certain customary financial and
restrictive covenants. We drew down the full $75 million Term Loan on February 2, 2010 in
connection with the acquisition of ICT on such date. As of December 31, 2010, the entire $75
million Term Loan has been repaid and is no longer available for borrowings. See Note 2,
Acquisition of ICT, of “Notes to Consolidated Financial Statements” for further information. At
December 31, 2010, we were in compliance with all loan requirements of the Credit Agreement dated
February 2, 2010.
The $75 million revolving credit facility provided under the Credit Agreement replaces the previous
senior revolving credit facility under a credit agreement, dated March 30, 2009, which agreement
was terminated simultaneous with entering into the Credit Agreement. The $75 million revolving
credit facility, which includes a $40 million multi-currency sub-facility, a $10 million swingline
sub-facility and a $5 million letter of credit sub-facility, may be used for general corporate
purposes including strategic acquisitions, share repurchases, working capital support, and letters
of credit, subject to certain limitations. We are not currently aware of any inability of our
lenders to provide access to the full commitment of funds that exist under the revolving credit
facility, if necessary. However, due to recent economic conditions and the volatile business
climate facing financial institutions, there can be no assurance that such facility will be
available to us, even though it is a binding commitment. The revolving credit facility will mature
on February 1, 2013.
Borrowings under the Credit Agreement bear interest at either LIBOR or the base rate plus, in each
case, an applicable margin based on our leverage ratio. The applicable interest rate is determined
quarterly based on our leverage ratio at such time. The base rate is a rate per annum equal to the
greatest of (i) the rate of interest established by KeyBank, from time to time, as its “prime
rate”; (ii) the Federal Funds effective rate in effect from time to time, plus 1/2 of 1% per annum;
and (iii) the then-applicable LIBOR rate for one month interest periods, plus 1.00%. Swingline
loans bear interest only at the base rate plus the base rate margin. In addition, we are required
to pay certain customary fees, including a commitment fee of up to 0.75%, which is due quarterly in
arrears and calculated on the average unused amount of the revolving credit facility.
We paid an underwriting fee of $3.0 million for the Credit Agreement, which is deferred and
amortized over the term of the loan. The related interest expense and amortization of deferred loan
fees on the Credit Agreement of $3.6 million are included in “Interest expense” in the accompanying
Consolidated Statement of Operations for the year ended December 31, 2010 (none in 2009). The $75
million Term Loan had a weighted average interest rate of 3.93% for the year ended December 31,
2010.
The Credit Agreement is guaranteed by all of our existing and future direct and indirect material
U.S. subsidiaries and secured by a pledge of 100% of the non-voting and 65% of the voting capital
stock of all of our direct foreign subsidiaries and those of the guarantors. As of December 31,
2010, we were in compliance with all loan requirements of the Credit Agreement dated February 2,
2010.
On December 11, 2009, Sykes (Bermuda) Holdings Limited, a Bermuda exempted company (“Sykes
Bermuda”) which is an indirect wholly-owned subsidiary of SYKES, entered into a credit agreement
with KeyBank (the “Bermuda Credit Agreement”). The Bermuda Credit Agreement provided for a $75
million short-term loan to Sykes Bermuda with a maturity date of March 31, 2010. Sykes Bermuda
drew down the full $75 million on December 11, 2009, which is included in “Short-term debt” in the
accompanying Consolidated Balance Sheet as of December 31, 2009. The Bermuda Credit Agreement
required that Sykes Bermuda and its direct subsidiaries maintain cash and cash equivalents of at
least $80 million at all times, which amount is included in “Restricted cash” in the accompanying
Consolidated Balance Sheet as of December 31, 2009. Interest was charged on the outstanding
amounts, at the option of Sykes Bermuda, at either a Eurodollar Rate (as defined in the Bermuda
Credit Agreement) or a Base Rate (as defined in the Bermuda Credit Agreement) plus, in each case,
an applicable margin specified in the Bermuda Credit Agreement. The underwriting fee paid of $0.8
million was deferred and amortized over the term of the loan. Sykes Bermuda repaid the entire
outstanding amount plus accrued interest on March 31, 2010. The
41
Table of Contents
related interest expense and amortization of deferred loan fees of $1.4 million are included in
“Interest expense” in the accompanying Consolidated Statements of Operations for 2010 (none in
2009).
Simultaneous with the execution and delivery of the Bermuda Credit Agreement, we entered into a
Guaranty of Payment agreement with KeyBank, pursuant to which the obligations of Sykes Bermuda
under the Bermuda Credit Agreement were guaranteed by SYKES.
Also, simultaneous with the execution and delivery of the Bermuda Credit Agreement, SYKES, KeyBank
and the other lenders that are a party thereto entered into a First Amendment Agreement, amending
the credit agreement, dated March 30, 2009, between SYKES, KeyBank and the other lenders that are a
party thereto. The First Amendment Agreement amended the terms of the credit agreement to permit
the loan to Sykes Bermuda and SYKES’ guaranty of that loan. As of December 31, 2009, there were no
outstanding balances and no borrowings in either 2010 or 2009 under the credit agreement dated
March 30, 2009, as amended. As previously mentioned, this credit agreement was terminated on
February 2, 2010 simultaneous with entering into the Credit Agreement and unamortized deferred loan
fees of $0.2 million were written off during 2010. Interest expense for 2009 includes $0.1 million
related to this terminated credit agreement.
At December 31, 2010, we had $189.8 million in cash and cash equivalents (excluding restricted cash
of $0.5 million), of which approximately 91.6% or $173.9 million was held in international
operations, of which $113.9 million may be subject to additional taxes if repatriated to the United
States, including withholding tax applied by the country of origin and repatriation tax on the
foreign-source income. Of the remaining $60.0 million in cash and cash equivalents held in
international operations, we repatriated approximately $35.0 million in January 2011 (the remaining
balance of the $85.0 million 2009 change of intent) and in the future expect to repatriate $25.0
million (the remaining balance of the $50.0 million 2010 determination of intent to distribute the
majority of the accumulated and undistributed earnings of an ICT foreign subsidiary). There are
circumstances where we may be unable to repatriate some of the cash and cash equivalents held by
our international operations due to country restrictions.
We believe that our current cash levels, accessible funds under our credit facilities and cash
flows generated from future operations will be adequate to meet anticipated working capital needs,
future debt repayment requirements, continued expansion objectives, funding of potential
acquisitions, anticipated levels of capital expenditures and contractual obligations for the next
twelve months and any stock repurchases. Our cash resources could also be affected by various risks
and uncertainties, including, but not limited to the risks detailed in Item 1A, Risk Factors.
Off-Balance Sheet Arrangements and Other
At December 31, 2010, we did not have any material commercial commitments, including guarantees or
standby repurchase obligations, or any relationships with unconsolidated entities or financial
partnerships, including entities often referred to as structured finance or special purpose
entities or variable interest entities, which would have been established for the purpose of
facilitating off-balance sheet arrangements or other contractually narrow or limited purposes.
From time to time, during the normal course of business, we may make certain indemnities,
commitments and guarantees under which we may be required to make payments in relation to certain
transactions. These include, but are not limited to: (i) indemnities to clients, vendors and
service providers pertaining to claims based on negligence or willful misconduct and (ii)
indemnities involving breach of contract, the accuracy of representations and warranties, or other
liabilities assumed by us in certain contracts. In addition, we have agreements whereby we will
indemnify certain officers and directors for certain events or occurrences while the officer or
director is, or was, serving at our request in such capacity. The indemnification period covers all
pertinent events and occurrences during the officer’s or director’s lifetime. The maximum potential
amount of future payments we could be required to make under these indemnification agreements is
unlimited; however, we have director and officer insurance coverage that limits our exposure and
enables us to recover a portion of any future amounts paid. We believe the applicable insurance
coverage is generally adequate to cover any estimated potential liability under these
indemnification agreements. The majority of these indemnities, commitments and guarantees do not
provide for any limitation of the maximum potential for future payments we could be obligated to
make. We have not recorded any liability for these indemnities, commitments and other guarantees in
the accompanying Consolidated Balance Sheets. In addition, we have some client contracts that do
not contain contractual provisions for the limitation of liability, and other client contracts that
contain agreed upon exceptions to limitation of liability. We have not recorded any liability in
the accompanying Consolidated Balance Sheets with respect to any client contracts under
which we have or may have unlimited liability.
42
Table of Contents
Contractual Obligations
The following table summarizes our contractual cash obligations at December 31, 2010, and the
effect these obligations are expected to have on liquidity and cash flow in future periods (in
thousands):
| Payments Due By Period | |||||||||||||||||||||||||
| Less Than | After 5 | ||||||||||||||||||||||||
| Total | 1 Year | 1 - 3 Years | 3 - 5 Years | Years | Other | ||||||||||||||||||||
Operating leases (1) |
$ | 60,310 | $ | 29,274 | $ | 17,493 | $ | 7,800 | $ | 5,743 | $ | — | |||||||||||||
Purchase obligations and other (2) |
31,059 | 15,145 | 15,914 | — | — | — | |||||||||||||||||||
Accounts payable (3) |
30,635 | 30,635 | — | — | — | — | |||||||||||||||||||
Accrued employee compensation and benefits (3) |
65,234 | 65,234 | — | — | — | — | |||||||||||||||||||
Other accrued expenses and current liabilities (4) |
23,970 | 23,970 | — | — | — | — | |||||||||||||||||||
Long-term tax liabilities (5) |
28,876 | — | — | — | — | 28,876 | |||||||||||||||||||
Other long-term liabilities (6) |
6,497 | 14 | 2,943 | 1,402 | 2,138 | — | |||||||||||||||||||
| $ | 246,581 | $ | 164,272 | $ | 36,350 | $ | 9,202 | $ | 7,881 | $ | 28,876 | ||||||||||||||
| (1) | Amounts represent the expected cash payments of our operating leases as discussed in
Note 23 to the accompanying Consolidated Financial Statements. |
|
| (2) | Purchase obligations include agreements to purchase goods or services that are
enforceable and legally binding on us and that specify all significant terms, including:
fixed or minimum quantities to be purchased; fixed, minimum or variable price provisions;
and the approximate timing of the transaction. Purchase obligations exclude agreements that
are cancelable without penalty. |
|
| (3) | Accounts payable and accrued employee compensation and benefits (See Note 16 to the
accompanying Consolidated Financial Statements), which exclude other non-cash accrued
employee compensation and benefits, represent amounts due vendors and employees payable
within one year. |
|
| (4) | Other accrued expenses and current liabilities, which exclude deferred grants, include
amounts as disclosed in Note 18 to the accompanying Consolidated Financial Statements,
primarily related to restructuring costs, legal and professional fees, telephone charges,
rent, derivative contracts and other accruals. |
|
| (5) | Long-term tax liabilities include uncertain tax positions and related penalties and
interest as discussed in Note 21 to the accompanying Consolidated Financial Statements. We
cannot make reasonably reliable estimates of the cash settlement of these long-term
liabilities with the taxing authority; therefore, amounts have been excluded from payments
due by period. |
|
| (6) | Other long-term liabilities, which exclude deferred income taxes and other non-cash
long-term liabilities, represent the expected cash payments due under pension obligations
and restructuring accruals (primarily lease obligations). See Notes 4 and 24 to the
accompanying Consolidated Financial Statements. |
Critical Accounting Policies and Estimates
The preparation of consolidated financial statements in conformity with accounting principles
generally accepted in the United States requires estimations and assumptions that affect the
reported amounts of assets and liabilities and the disclosure of contingent assets and liabilities
at the date of the financial statements and the reported amounts of revenues and expenses during
the reporting period. These estimates and assumptions are based on historical experience and
various other factors that are believed to be reasonable under the circumstances. Actual results
could differ from these estimates under different assumptions or conditions.
We believe the following accounting policies are the most critical since these policies require
significant judgment or involve complex estimations that are important to the portrayal of our
financial condition and operating results:
Recognition of Revenue
We recognize revenue in accordance with ASC 605 “Revenue Recognition”.
We primarily recognize revenues from services as the services are performed, which is based on
either a per minute,
per call or per transaction basis, under a fully executed contractual agreement and record
reductions to revenues for contractual penalties and holdbacks for failure to meet specified
minimum service levels and other performance based contingencies. Revenue recognition is limited to
the amount that is not contingent upon delivery of any future product or service or meeting other
specified performance conditions.
43
Table of Contents
Product sales, accounted for within our fulfillment services, are recognized upon shipment to the
customer and satisfaction of all obligations.
Revenues from contracts with multiple-deliverables is allocated to separate units of accounting
based on their relative fair value, if the deliverables in the contract(s) meet the criteria for
such treatment. Certain fulfillment services contracts contain multiple-deliverables. Separation
criteria included whether a delivered item has value to the customer on a stand-alone basis,
whether there is objective and reliable evidence of the fair value of the undelivered items and, if
the arrangement includes a general right of return related to a delivered item, whether delivery of
the undelivered item is considered probable and in our control. Fair value is the price of a
deliverable when it is regularly sold on a stand-alone basis, which generally consists of
vendor-specific objective evidence of fair value. If there is no evidence of the fair value for a
delivered product or service, revenue is allocated first to the fair value of the undelivered
product or service and then the residual revenue is allocated to the delivered product or service.
If there is no evidence of the fair value for an undelivered product or service, the contract(s) is
accounted for as a single unit of accounting, resulting in delay of revenue recognition for the
delivered product or service until the undelivered product or service portion of the contract is
complete. We recognize revenues for delivered elements only when the fair values of undelivered
elements are known, uncertainties regarding client acceptance are resolved, and there are no
client-negotiated refund or return rights affecting the revenue recognized for delivered elements.
Once we determine the allocation of revenues between deliverable elements, there are no further
changes in the revenue allocation. If the separation criteria are met, revenues from these
services is recognized as the services are performed under a fully executed contractual agreement.
If the separation criteria are not met because there is insufficient evidence to determine fair
value of one of the deliverables, all of the services are accounted for as a single combined unit
of accounting. For these deliverables with insufficient evidence to determine fair value, revenue
is recognized on the proportional performance method using the straight-line basis over the
contract period, or the actual number of operational seats used to serve the client, as
appropriate. As of December 31, 2010, the Company has no contracts containing
multiple-deliverables for customer contact management services and fulfillment services.
Allowance for Doubtful Accounts
We maintain allowances for doubtful accounts, $3.9 million as of December 31, 2010 or 1.6% of trade
account receivables, for estimated losses arising from the inability of our customers to make
required payments. Our estimate is based on factors surrounding the credit risk of certain clients,
historical collection experience and a review of the current status of trade accounts receivable.
It is reasonably possible that our estimate of the allowance for doubtful accounts will change if
the financial condition of our customers were to deteriorate, resulting in a reduced ability to
make payments.
Income Taxes
We reduce deferred tax assets by a valuation allowance if, based on the weight of available
evidence, both positive and negative, for each respective tax jurisdiction, it is more likely than
not that some portion or all of such deferred tax assets will not be realized. The valuation
allowance for a particular tax jurisdiction is allocated between current and noncurrent deferred
tax assets for that jurisdiction on a pro rata basis. Available evidence which is considered in
determining the amount of valuation allowance required includes, but is not limited to, our
estimate of future taxable income and any applicable tax-planning strategies.
At December 31, 2010, we determined that a total valuation allowance of $60.1 million was necessary
to reduce U.S. deferred tax assets by $6.2 million and foreign deferred tax assets by $53.9
million, where it was more likely than not that some portion or all of such deferred tax assets
will not be realized. The recoverability of the remaining net deferred tax asset of $18.3 million
at December 31, 2010 is dependent upon future profitability within each tax jurisdiction. As of
December 31, 2010, based on our estimates of future taxable income and any applicable tax-planning
strategies within various tax jurisdictions, we believe that it is more likely than not that the
remaining net deferred tax assets will be realized.
A provision for income taxes has not been made for the undistributed earnings of foreign
subsidiaries of approximately $302.8 million at December 31, 2010, as the earnings are permanently
reinvested in foreign business operations. Determination of any unrecognized deferred tax
liability for temporary differences related to
investments in foreign subsidiaries that are essentially permanent in nature is not practicable.
The U.S. Department of the Treasury released the “General Explanations of the Administration’s
Fiscal Year 2012 Revenue Proposals” in February 2011. These proposals represent a significant
shift in international tax policy, which may materially impact U.S. taxation of international
earnings. We continue to monitor these proposals and
44
Table of Contents
are currently evaluating their potential
impact on our financial condition, results of operations, and cash flows. Determination of any
unrecognized deferred tax liability for temporary differences related to investments in foreign
subsidiaries that are essentially permanent in nature is not practicable.
We evaluate tax positions that have been taken or are expected to be taken in our tax returns, and
record a liability for uncertain tax positions in accordance with ASC 740. The calculation of our
tax liabilities involves dealing with uncertainties in the application of complex tax regulations.
ASC 740 contains a two-step approach to recognizing and measuring uncertain tax positions. First,
tax positions are recognized if the weight of available evidence indicates that it is more likely
than not that the position will be sustained upon examination, including resolution of related
appeals or litigation processes, if any. Second, the tax position is measured as the largest
amount of tax benefit that has a greater than 50% likelihood of being realized upon settlement. We
reevaluate these uncertain tax positions on a quarterly basis. This evaluation is based on factors
including, but not limited to, changes in facts or circumstances, changes in tax law, effectively
settled issues under audit, and new audit activity. Such a change in recognition or measurement
would result in the recognition of a tax benefit or an additional charge to the tax provision.
As of December 31, 2010, we had $21.0 million of unrecognized tax benefits, a net increase of $17.2
million from $3.8 million as of December 31, 2009. This increase results primarily from to the
acquisition of ICT, partially offset by the expiration of statutes of limitations on certain
foreign subsidiaries and for the resolution of a tax audit in 2010. Had we recognized these tax
benefits, approximately $21.0 million and $3.1 million and the related interest and penalties would
favorably impact the effective tax rate in 2010 and 2009, respectively. We believe it is reasonably
possible that our unrecognized tax benefits will decrease or be recognized in the next twelve
months by up to $2.9 million due to expiration of statutes of limitations, audit or appeal
resolution in various tax jurisdictions.
Impairment of Goodwill, Intangibles and Other Long-Lived Assets
We review long-lived assets, which had a carrying value of $288.8 million as of December 31, 2010,
including goodwill, intangibles and property and equipment for impairment whenever events or
changes in circumstances indicate that the carrying value of an asset may not be recoverable and at
least annually for impairment testing of goodwill. An asset is considered to be impaired when the
carrying amount exceeds the fair value. Upon determination that the carrying value of the asset is
impaired, we would record an impairment charge, or loss, to reduce the asset to its fair value.
Future adverse changes in market conditions or poor operating results of the underlying investment
could result in losses or an inability to recover the carrying value of the investment and,
therefore, might require an impairment charge in the future.
New Accounting Standard Not Yet Adopted
In October 2009, the Financial Accounting Standards Board issued ASU No. 2009-13 which amended the
accounting for multiple-deliverable revenue arrangements. The amended guidance will make it easier
for companies to account for each deliverable in multiple-deliverable arrangements separately. The
amended guidance will require the allocation of the overall consideration to each deliverable based
upon its estimated selling price in absence of other objective evidence of selling prices. The
amendment is effective prospectively for revenue arrangements entered into or materially modified
in fiscal years beginning on or after June 15, 2010, and was adopted for applicable transactions as
of January 1, 2011. We do not expect the adoption of this amendment to materially impact our
financial condition, results of operations and cash flows.
U.S. Healthcare Reform Acts
In March 2010, the President of the United States signed into law comprehensive health care reform
legislation under the Patient Protection and Affordable Care Act and the Health Care and Education
Reconciliation Act (the “Acts”). The Acts contain provisions that could materially impact the
Company’s healthcare costs in the future, thus adversely affecting the Company’s profitability. We
are currently evaluating the potential impact of the Acts, if any, on our financial condition,
results of operations and cash flows.
Item 7A. Quantitative and Qualitative Disclosures About Market Risk
Foreign Currency Risk
Our earnings and cash flows are subject to fluctuations due to changes in currency exchange rates.
We are exposed to foreign currency exchange rate fluctuations when subsidiaries with functional
currencies other than the U.S.
45
Table of Contents
Dollar (“USD”) are translated into the Company’s USD Consolidated Financial Statements. As exchange
rates vary, those results, when translated, may vary from expectations and adversely impact
profitability. The cumulative translation effects for subsidiaries using functional currencies
other than the U.S. Dollar are included in “Accumulated other comprehensive income (loss)” in
shareholders’ equity. Movements in non-U.S. Dollar currency exchange rates may negatively or
positively affect our competitive position, as exchange rate changes may affect business practices
and/or pricing strategies of non-U.S. based competitors.
We employ a foreign currency risk management program that periodically utilizes derivative
instruments to protect against unanticipated fluctuations in earnings and cash flows caused by
volatility in foreign exchange (“FX”) rates. Option and forward hedge contracts are used to hedge
intercompany receivables and payables, and transactions initiated in the United States that are
denominated in a foreign currency. Additionally, the Company has employed FX forward contracts to
hedge net investments in foreign operations.
We serve a number of U.S.-based clients using customer contact management center capacity in the
Philippines and Canada, which are within our Americas segment. Although the contracts with these
clients are priced in U.S. Dollars, a substantial portion of the costs incurred to render services
under these contracts are denominated in Philippine Pesos (“PHP”) and the Canadian Dollar (“CAD”),
which represent an FX exposure. As of December 31, 2010, we have hedged a portion of our exposure
related to the anticipated cash flow requirements denominated in PHP and CAD by entering into
foreign currency hedge contracts with counterparties to acquire a total of PHP 5.5 billion and CAD
7.5 million through December 2011. The fair value of these hedge contracts as of December 31, 2010
is presented in Note 12, Financial Derivatives, of “Notes to Consolidated Financial Statements”.
The potential loss in fair value at December 31, 2010, for these contracts resulting from a
hypothetical 10% adverse change in the FX rates is approximately $6.1 million. However, this loss
would be mitigated by corresponding gains on the underlying exposures.
In January 2011, to hedge intercompany forecasted cash outflows, we entered into additional forward
and option contracts that are designated as hedges, as defined under ASC 815 (“ASC 815”)
“Derivatives and Hedging”, to sell 1.4 billion Philippine Pesos versus the U.S. Dollar for
maturities through December 2011.
We also entered into forward exchange contracts that are not designated as hedges. The purpose of
these derivative instruments is to protect against FX volatility pertaining to intercompany
receivables and payables, and other assets and liabilities that are denominated in currencies other
than our subsidiaries’ functional currencies. As of December 31, 2010, the fair value of these
derivatives was a net payable of $0.4 million. The potential loss in fair value at December 31,
2010, for these contracts resulting from a hypothetical 10% adverse change in the foreign currency
exchange rates is approximately $4.8 million. However, this loss would be mitigated by
corresponding gains on the underlying exposures. Since December 31, 2010, we entered into
additional foreign currency forward contracts against the following currencies: PHP, CAD,
Eurodollar, Danish Krone, Great British Pound, Egyptian Pound,
Australian Dollar and Romanian Leu. These contracts, with notional amounts of $78.0 million, generally do not exceed 90 days
in duration. See Note 12, Financial Derivatives, of “Notes to Consolidated Financial Statements”
for further information.
We evaluate the credit quality of potential counterparties to derivative transactions and only
enter into contracts with those considered to have minimal credit risk. We periodically monitor
changes to counterparty credit quality as well as our concentration of credit exposure to
individual counterparties. We do not use derivative instruments for trading or speculative
purposes.
Interest Rate Risk
Our exposure to interest rate risk results from variable debt outstanding under the revolving
credit facility under our Credit Agreement. We pay interest on outstanding borrowings at interest
rates that fluctuate based upon changes in various base rates. During 2010, we had no debt
outstanding under the revolving credit facility.
We have not historically used derivative instruments to manage exposure to changes in interest
rates.
Item 8. Financial Statements and Supplementary Data
The financial statements and supplementary data required by this item are located beginning on page
56 and page 38 of this report, respectively.
46
Table of Contents
Item 9. Changes in and Disagreements with Accountants on Accounting and Financial Disclosure
None.
Item 9A. Controls and Procedures
Disclosure Controls and Procedures
The Company’s management, with the participation of the Company’s Chief Executive Officer and Chief
Financial Officer, has evaluated the effectiveness of the Company’s disclosure controls and
procedures, as defined in Rules 13a-15(e) and 15d-15(e) of the Securities Exchange Act of 1934, as
of December 31, 2010. Based on that evaluation, the Company’s Chief Executive Officer and Chief
Financial Officer concluded that the Company’s disclosure controls and procedures were effective as
of December 31, 2010.
Management’s Report on Internal Control Over Financial Reporting
Management is responsible for establishing and maintaining adequate internal control over financial
reporting (as defined in Rule 13a-15(f) under the Securities Exchange Act of 1934, as amended).
Because of its inherent limitations, internal control over financial reporting may not prevent or
detect misstatements. Projections of any evaluation of effectiveness to future periods are subject
to the risk that controls may become inadequate because of changes in conditions, or that the
degree of compliance with the policies or procedures may deteriorate.
We assessed the effectiveness of our internal control over financial reporting as of December 31,
2010. In making this assessment, we used the criteria established in Internal Control-Integrated
Framework issued by the Committee of Sponsoring Organizations of the Treadway Commission. Based on
our assessment, management believes that, as of December 31, 2010, our internal control over
financial reporting was effective.
Attestation Report of Independent Registered Public Accounting Firm
Our independent registered public accounting firm has issued an attestation report on our internal
control over financial reporting. This report appears on page 48.
Changes to Internal Control Over Financial Reporting
The Company acquired ICT on February 2, 2010. The Company began to integrate ICT into its internal
control over financial reporting structure subsequent to the acquisition date. As such, there have
been changes during the year ended December 31, 2010 associated with the establishment of internal
control over financial reporting with respect to ICT. ICT has been included in management’s report
of internal control over financial reporting as of December 31, 2010.
There were no other changes in the Company’s internal control over financial reporting during the
quarter ended December 31, 2010 that have materially affected, or are reasonably likely to
materially affect, the Company’s internal controls over financial reporting.
47
Table of Contents
REPORT OF INDEPENDENT REGISTERED PUBLIC ACCOUNTING FIRM
To the Board of Directors and Shareholders of
Sykes Enterprises, Incorporated
Tampa, Florida
Sykes Enterprises, Incorporated
Tampa, Florida
We have audited the internal control over financial reporting of Sykes Enterprises, Incorporated
and subsidiaries (the “Company”) as of December 31, 2010, based on criteria established in Internal
Control — Integrated Framework issued by the Committee of Sponsoring Organizations of the Treadway
Commission. The Company’s management is responsible for maintaining effective internal control
over financial reporting and for its assessment of the effectiveness of internal control over
financial reporting, included in the accompanying Management’s Report on Internal Control over
Financial Reporting. Our responsibility is to express an opinion on the Company’s internal control
over financial reporting based on our audit.
We conducted our audit in accordance with the standards of the Public Company Accounting Oversight
Board (United States). Those standards require that we plan and perform the audit to obtain
reasonable assurance about whether effective internal control over financial reporting was
maintained in all material respects. Our audit included obtaining an understanding of internal
control over financial reporting, assessing the risk that a material weakness exists, testing and
evaluating the design and operating effectiveness of internal control based on the assessed risk,
and performing such other procedures as we considered necessary in the circumstances. We believe
that our audit provides a reasonable basis for our opinion.
A company’s internal control over financial reporting is a process designed by, or under the
supervision of, the company’s principal executive and principal financial officers, or persons
performing similar functions, and effected by the company’s board of directors, management, and
other personnel to provide reasonable assurance regarding the reliability of financial reporting
and the preparation of financial statements for external purposes in accordance with generally
accepted accounting principles. A company’s internal control over financial reporting includes
those policies and procedures that (1) pertain to the maintenance of records that, in reasonable
detail, accurately and fairly reflect the transactions and dispositions of the assets of the
company; (2) provide reasonable assurance that transactions are recorded as necessary to permit
preparation of financial statements in accordance with generally accepted accounting principles,
and that receipts and expenditures of the company are being made only in accordance with
authorizations of management and directors of the company; and (3) provide reasonable assurance
regarding prevention or timely detection of unauthorized acquisition, use, or disposition of the
company’s assets that could have a material effect on the financial statements.
Because of the inherent limitations of internal control over financial reporting, including the
possibility of collusion or improper management override of controls, material misstatements due to
error or fraud may not be prevented or detected on a timely basis. Also, projections of any
evaluation of the effectiveness of the internal control over financial reporting to future periods
are subject to the risk that the controls may become inadequate because of changes in conditions,
or that the degree of compliance with the policies or procedures may deteriorate.
In our opinion, the Company maintained, in all material respects, effective internal control over
financial reporting as of December 31, 2010, based on the criteria established in Internal Control
— Integrated Framework issued by the Committee of Sponsoring Organizations of the Treadway
Commission.
We have also audited, in accordance with the standards of the Public Company Accounting Oversight
Board (United States), the consolidated financial statements and financial statement schedule as of
and for the year ended December 31, 2010 of the Company and our report dated March 8, 2011
expressed an unqualified opinion on those financial statements and financial statement schedule.
| /s/ Deloitte & Touche LLP | ||||
| Certified Public Accountants Tampa, Florida |
||||
March 8, 2011
48
Table of Contents
Item 9B. Other Information
None.
PART III
Items 10. through 14.
All information required by Items 10 through 14, with the exception of information on Executive
Officers which appears in this report in Item 1 under the caption “Executive Officers”, is
incorporated by reference to SYKES’ Proxy Statement for the 2011 Annual Meeting of Shareholders.
49
Table of Contents
PART IV
Item 15. Exhibits and Financial Statement Schedules
The following documents are filed as part of this report:
| (1) | Consolidated Financial Statements |
||
The Index to Consolidated Financial Statements is set forth on page 56 of this report. |
|||
| (2) | Financial Statements Schedule |
||
Schedule II — Valuation and Qualifying Accounts is set forth on page 109 of this report. |
|||
Other schedules have been omitted because they are not required or applicable or the
information is included in the Consolidated Financial Statements or notes thereto. |
|||
| (3) | Exhibits: |
| Exhibit | ||
| Number | Exhibit Description | |
2.1 |
Articles of Merger between Sykes Enterprises, Incorporated, a North Carolina Corporation, and Sykes Enterprises, Incorporated, a Florida Corporation, dated March 1, 1996. (1) | |
2.2 |
Articles of Merger between Sykes Enterprises, Incorporated and Sykes Realty, Inc. (1) | |
2.3 |
Shareholder Agreement dated December 11, 1997, by and among Sykes Enterprises, Incorporated and HealthPlan Services Corporation. (2) | |
2.4 |
Stock Purchase Agreement, dated September 1, 1998, between Sykes Enterprises, Incorporated and HealthPlan Services Corporation. (4) | |
2.5 |
Merger Agreement, dated as of June 9, 2000, among Sykes Enterprises, Incorporated, SHPS, Incorporated, Welsh Carson Anderson and Stowe, VIII, LP ("WCAS") and Slugger Acquisition Corp. (9) | |
2.6 |
Agreement and Plan of Merger, dated as of October 5, 2009, among ICT Group, Inc., Sykes Enterprises, Incorporated, SH Merger Subsidiary I, Inc., and SH Merger Subsidiary II, LLC (26) | |
3.1 |
Articles of Incorporation of Sykes Enterprises, Incorporated, as amended. (5) | |
3.2 |
Articles of Amendment to Articles of Incorporation of Sykes Enterprises, Incorporated, as amended. (6) | |
3.3 |
Bylaws of Sykes Enterprises, Incorporated, as amended. (17) | |
4.1 |
Specimen certificate for the Common Stock of Sykes Enterprises, Incorporated. (1) | |
10.1 |
1996 Employee Stock Option Plan. (1)* | |
10.2 |
Amended and Restated 1996 Non-Employee Director Stock Option Plan. (10)* | |
10.3 |
1996 Non-Employee Directors’ Fee Plan. (1)* | |
10.4 |
2004 Non-Employee Directors’ Fee Plan. (15)* | |
10.5 |
First Amended and Restated 2004 Non-Employee Director's Fee Plan. (23)* | |
10.6 |
Second Amended and Restated 2004 Non-Employee Director's Fee Plan. (25)* | |
10.7 |
Third Amended and Restated 2004 Non-Employee Director's Fee Plan. (27)* | |
10.8 |
Form of Split Dollar Plan Documents. (1)* |
50
Table of Contents
| Exhibit | ||
| Number | Exhibit Description | |
10.9 |
Form of Split Dollar Agreement. (1)* | |
10.10 |
Form of Indemnity Agreement between Sykes Enterprises, Incorporated and directors & executive officers. (1) | |
10.11 |
1997 Management Stock Incentive Plan. (3)* | |
10.12 |
1999 Employees’ Stock Purchase Plan. (7)* | |
10.13 |
2000 Stock Option Plan. (8)* | |
10.14 |
2001 Equity Incentive Plan. (11)* | |
10.15 |
Deferred Compensation Plan. . (17)* | |
10.16 |
2004 Non-Employee Director Stock Option Plan. (14)* | |
10.17 |
Form of Restricted Share And Stock Appreciation Right Award Agreement dated as of March 29, 2006. (18)* | |
10.18 |
Form of Restricted Share And Bonus Award Agreement dated as of March 29, 2006. (18)* | |
10.19 |
Form of Restricted Share Award Agreement dated as of May 24, 2006. (19)* | |
10.20 |
Form of Restricted Share And Stock Appreciation Right Award Agreement dated as of January 2, 2007. (21)* | |
10.21 |
Form of Restricted Share Award Agreement dated as of January 2, 2007. (21)* | |
10.22 |
Form of Restricted Share and Stock Appreciation Right Award Agreement dated as of January 2, 2008. (22)* | |
10.23 |
Founder’s Retirement and Consulting Agreement dated December 10, 2004 between Sykes Enterprises, Incorporated and John H. Sykes. (16)* | |
10.24 |
Amended and Restated Employment Agreement dated as of December 30, 2008 between Sykes Enterprises, Incorporated and Charles E. Sykes. (28)* | |
10.25 |
Stock Option Agreement dated as of March 15, 2002 between Sykes Enterprises, Incorporated and Charles E. Sykes. (13)* | |
10.26 |
Stock Option Agreement (Performance Accelerated Option) dated as of March 15, 2002 between Sykes Enterprises, Incorporated and Charles E. Sykes. (13)* | |
10.27 |
Amended and Restated Employment Agreement dated as of December 30, 2008 between Sykes Enterprises, Incorporated and W. Michael Kipphut. (28)* | |
10.28 |
Stock Option Agreement dated as of October 1, 2001, between Sykes Enterprises, Incorporated and W. Michael Kipphut. (12)* | |
10.29 |
Amended and Restated Employment Agreement dated as of December 29, 2008 between Sykes Enterprises, Incorporated and Jenna R. Nelson. (28)* | |
10.30 |
Stock Option Agreement dated as of March 11, 2002 between Sykes Enterprises, Incorporated and Jenna R. Nelson. (13)* | |
10.31 |
Stock Option Agreement dated as of October 1, 2001, between Sykes Enterprises, Incorporated and James T. Holder. (12)* | |
10.32 |
Amended and Restated Employment Agreement dated as of December 29, 2008 between Sykes Enterprises, Incorporated and James T. Holder. (28)* |
51
Table of Contents
| Exhibit | ||
| Number | Exhibit Description | |
10.33 |
Amended and Restated Employment Agreement dated as of December 29, 2008 between Sykes Enterprises, Incorporated and William N. Rocktoff. (28)* | |
10.34 |
Stock Option Agreement dated as of March 18, 2002 between Sykes Enterprises, Incorporated and William Rocktoff. (13)* | |
10.35 |
Stock Option Agreement dated as of March 18, 2002 between Sykes Enterprises, Incorporated and William Rocktoff. (13)* | |
10.36 |
Amended and Restated Employment Agreement dated as of December 29, 2008 between Sykes Enterprises, Incorporated and James Hobby, Jr. (28)* | |
10.37 |
Amended and Restated Employment Agreement dated as of December 29, 2008 between Sykes Enterprises, Incorporated and Daniel L. Hernandez. (28)* | |
10.38 |
Amended and Restated Employment Agreement dated as of December 29, 2008 between Sykes Enterprises, Incorporated and David L. Pearson. (28)* | |
10.39 |
Amended and Restated Employment Agreement, dated as of December 29, 2008 between Sykes Enterprises, Incorporated and Lawrence R. Zingale. (28)* | |
10.40 |
Credit Agreement, dated March 30, 2009, between Sykes Enterprises, Incorporated, the lenders party thereto and KeyBank National Association, as Lead Arranger, Sole Book Runner and Administrative Agent (29) | |
10.41 |
First Amendment Agreement, dated as of December 11, 2009, to Credit Agreement, dated March 30, 2009, between Sykes Enterprises, Incorporated, the lenders party thereto and KeyBank National Association, as Lead Arranger, Sole Book Runner and Administrative Agent (30) | |
10.42 |
Credit Agreement between Sykes (Bermuda) Holdings Limited and KeyBank National Association, dated December 11, 2009 (30) | |
10.43 |
Guaranty of Payment of Sykes Enterprises, Incorporated in favor of KeyBank National Association, dated December 11, 2009 (30) | |
10.44 |
Credit Agreement, dated February 2, 2010, between Sykes Enterprises, Incorporated, the lenders party thereto and KeyBank National Association, as Lead Arranger, Sole Book Runner and Administrative Agent (31) | |
10.45 |
First Amendment Agreement, dated April 23, 2010, to Credit Agreement, dated February 2, 2010, between Sykes Enterprises, Incorporated, the lenders party thereto and KeyBank National Association, as Lead Arranger, Sole Book Runner and Administrative Agent. (32) | |
10.46 |
Second Amendment Agreement, dated July 16, 2010, to Credit Agreement, dated February 2, 2010, between Sykes Enterprises, Incorporated, the lenders party thereto and KeyBank National Association, as Lead Arranger, Sole Book Runner and Administrative Agent. (32) | |
10.47 |
Lease Agreement, dated January 25, 2008, Lease Amendment Number One and Lease Amendment Number Two dated February 12, 2008 and May 28, 2008 respectively, between Sykes Enterprises, Incorporated and Kingstree Office One, LLC. (24) | |
10.48 |
Continuing Services Agreement between Sykes Enterprises, Incorporated and JHS Equity, LLC, dated May 28, 2008. (24) | |
10.49 |
Stock Purchase Agreement between Sykes Enterprises, Incorporated (not as a Seller), SEI International Services S.a.r.l. (as Seller), Sykes Enterprises Incorporated Holdings, BV (as Seller) and Antonio Marcelo Cid, Humberto Daniel Sahade as Buyers, dated December 13, 2010. (33) |
52
Table of Contents
| Exhibit | ||
| Number | Exhibit Description | |
10.50 |
Stock Purchase Agreement between Sykes Enterprises, Incorporated (not as a Seller), ICT Group Netherlands B.V. (as Seller), ICT Group Netherlands Holdings, B.V. (as Seller) and Carolina Gaito, Claudio Martin, Fernando A. Berrondo, Gustavo Rosetti as Buyers, dated December 24, 2010. (34) | |
14.1 |
Code of Ethics. (35) | |
21.1 |
List of subsidiaries of Sykes Enterprises, Incorporated. | |
23.1 |
Consent of Independent Registered Public Accounting Firm. | |
24.1 |
Power of Attorney relating to subsequent amendments (included on the signature page of this report). | |
31.1 |
Certification of Chief Executive Officer, pursuant to Rule 13a-14(a). | |
31.2 |
Certification of Chief Financial Officer, pursuant to Rule 13a-14(a). | |
32.1 |
Certification of Chief Executive Officer, pursuant to Section 1350. | |
32.2 |
Certification of Chief Financial Officer, pursuant to Section 1350. |
| * | Indicates management contract or compensatory plan or arrangement. |
|
| (1) | Filed as an Exhibit to the Registrant’s Registration Statement on
Form S-1 (Registration No. 333-2324) and incorporated herein by
reference. |
|
| (2) | Filed as Exhibit 2.12 to the Registrant’s Form 10-K filed with
the Commission on March 16, 1998, and incorporated herein by
reference. |
|
| (3) | Filed as Exhibit 10.14 to the Registrant’s Form 10-Q filed with
the Commission on July 28, 1998, and incorporated herein by
reference. |
|
| (4) | Filed as Exhibit 2.1 to the Registrant’s Current Report on Form
8-K filed with the Commission on September 25, 1998, and
incorporated herein by reference. |
|
| (5) | Filed as Exhibit 3.1 to the Registrant’s Registration Statement
on Form S-3 filed with the Commission on October 23, 1997, and
incorporated herein by reference. |
|
| (6) | Filed as Exhibit 3.2 to the Registrant’s Form 10-K filed with the
Commission on March 29, 1999, and incorporated herein by
reference. |
|
| (7) | Filed as Exhibit 10.19 to the Registrant’s Form 10-K filed with
the Commission on March 29, 1999, and incorporated herein by
reference. |
|
| (8) | Filed as Exhibit 10.23 to the Registrant’s Form 10-K filed with
the Commission on March 29, 2000, and incorporated herein by
reference. |
|
| (9) | Filed as Exhibit 2.1 to the Registrant’s Current Report on Form
8-K filed with the Commission on July 17, 2000, and incorporated
herein by reference. |
|
| (10) | Filed as Exhibit 10.12 to Registrant’s Form 10-Q filed with the
Commission on May 7, 2001, and incorporated herein by reference. |
|
| (11) | Filed as Exhibit 10.32 to Registrant’s Form 10-Q filed with the Commission on May
7, 2001, and incorporated herein by reference. |
|
| (12) | Filed as an Exhibit to Registrant’s Form 10-K filed with the Commission on March
19, 2002, and incorporated herein by reference. |
|
| (13) | Filed as an Exhibit to Registrant’s Form 10-Q filed with the Commission on May
10, 2002, and incorporated herein by reference. |
|
| (14) | Filed as an Exhibit to Registrant’s Proxy Statement for the 2004 annual meeting
of shareholders filed with the Commission April 6, 2004. |
|
| (15) | Filed as an Exhibit to Registrant’s Form 10-Q filed with the Commission on August
9, 2004, and incorporated herein by reference. |
|
| (16) | Filed as an Exhibit to Registrant’s Current Report on Form 8-K filed with the
Commission on December 16, 2004, and incorporated herein by reference. |
|
| (17) | Filed as an Exhibit to Registrant’s Form 10-K filed with the Commission on March
22, 2005, and incorporated herein by reference. |
|
| (18) | Filed as an Exhibit to the Registrant’s Current Report on Form 8-K filed with the
Commission on |
53
Table of Contents
April 4, 2006, and incorporated herein by reference. |
||
| (19) | Filed as an Exhibit to the Registrant’s Current Report on Form 8-K filed with the
Commission on May 31, 2006, and incorporated herein by reference. |
|
| (20) | Filed as an Exhibit to the Registrant’s Current Report on Form 8-K filed with the
Commission on July 10, 2006, and incorporated herein by reference. |
|
| (21) | Filed as an Exhibit to the Registrant’s Current Report on Form 8-K filed with the
Commission on December 28, 2006, and incorporated herein by reference. |
|
| (22) | Filed as an Exhibit to the Registrant’s Current Report on Form 8-K filed with the
Commission on January 8, 2008, and incorporated herein by reference. |
|
| (23) | Filed as an Exhibit to the Registrant’s Form 10-Q filed with the Commission on
May 7, 2008, and incorporated herein by reference. |
|
| (24) | Filed as an Exhibit to the Registrant’s Current Report on Form 8-K filed with the
Commission on May 29, 2008, and incorporated herein by reference. |
|
| (25) | Filed as an Exhibit to the Registrant’s Form 10-Q filed with the Commission on
November 5, 2008, and incorporated herein by reference. |
|
| (26) | Filed as an Exhibit to the Registrant’s Current Report on Form 8-K filed with the
Commission on October 9, 2009, and incorporated herein by reference. |
|
| (27) | Filed as an Exhibit to the Registrant’s Proxy Statement for the 2009 annual
meeting of shareholders filed with the Commission on April 22, 2009, and
incorporated herein by reference. |
|
| (28) | Filed as an Exhibit to the Registrant’s Annual Report on Form 10-K filed with the
Commission on March 10, 2009, and incorporated herein by reference. |
|
| (29) | Filed as an Exhibit to the Registrant’s Current Report on Form 8-K filed with the
Commission on April 1, 2009, and incorporated herein by reference. |
|
| (30) | Filed as an Exhibit to the Registrant’s Current Report on Form 8-K filed with the
Commission on December 14, 2009, and incorporated herein by reference. |
|
| (31) | Filed as an Exhibit to the Registrant’s Current Report on Form 8-K filed with the
Commission on February 2, 2010, and incorporated herein by reference. |
|
| (32) | Filed as an Exhibit to the Registrant’s Quarterly Report on Form 10-Q filed with
the Commission on August 4, 2010, and incorporated herein by reference. |
|
| (33) | Filed as an Exhibit to the Registrant’s Current Report on Form 8-K filed with the
Commission on December 22, 2010, and incorporated herein by reference. |
|
| (34) | Filed as an Exhibit to the Registrant’s Current Report on Form 8-K filed with the
Commission on December 30, 2010, and incorporated herein by reference. |
|
| (35) | Available on the Registrant’s website at www.sykes.com, by clicking on “Investor
Relations” and then “Corporate Governance” under the heading “Corporate
Governance.” |
54
Table of Contents
Signatures
Pursuant to the requirements of Section 13 or 15(d) of the Securities Exchange Act of 1934,
the Registrant has duly caused this report to be signed on its behalf by the undersigned, thereunto
duly authorized, in the City of Tampa, and State of Florida, on this 8th day of March
2011.
| SYKES ENTERPRISES, INCORPORATED (Registrant) |
||||
| By: | /s/ W. Michael Kipphut | |||
| W. Michael Kipphut, | ||||
| Executive Vice President and Chief Financial Officer (Principal Financial and Accounting Officer) | ||||
Pursuant to the requirements of the Securities Exchange Act of 1934, this report has been
signed below by the following persons on behalf of the Registrant and in the capacities and on the
dates indicated. Each person whose signature appears below constitutes and appoints W. Michael
Kipphut his true and lawful attorney-in-fact and agent, with full power of substitution and
revocation, for him and in his name, place and stead, in any and all capacities, to sign any and
all amendments to this report and to file the same, with all exhibits thereto, and other documents
in connection therewith, with the Securities and Exchange Commission, granting unto said
attorney-in-fact and agents, and each of them, full power and authority to do and perform each and
every act and thing requisite and necessary to be done in connection therewith, as fully to all
intents and purposes as he might or should do in person, thereby ratifying and confirming all that
said attorneys-in-fact and agents, or either of them, may lawfully do or cause to be done by virtue
hereof.
| Signature | Title | Date | ||
/s/ Paul L. Whiting
|
Chairman of the Board | March 8, 2011 | ||
/s/ Charles E. Sykes
|
President and Chief Executive Officer and Director (Principal Executive Officer) |
March 8, 2011 | ||
/s/ Furman P. Bodenheimer, Jr.
|
Director | March 8, 2011 | ||
/s/ Mark C. Bozek
|
Director | March 8, 2011 | ||
/s/ Lt. Gen. Michael P. Delong (Ret.)
|
Director | March 8, 2011 | ||
/s/ H. Parks Helms
|
Director | March 8, 2011 | ||
/s/ Iain A. Macdonald
|
Director | March 8, 2011 | ||
/s/ James S. MacLeod
|
Director | March 8, 2011 | ||
/s/ Linda F. McClintock-Greco M.D.
|
Director | March 8, 2011 | ||
/s/ William J. Meurer
|
Director | March 8, 2011 | ||
/s/ James K. Murray, Jr.
|
Director | March 8, 2011 | ||
/s/ W. Michael Kipphut
|
Executive Vice President and Chief Financial Officer (Principal Financial and Accounting Officer) | March 8, 2011 |
55
Table of Contents
| Page No. | ||||
| 57 | ||||
| 58 | ||||
| 59 | ||||
| 60 | ||||
| 61 | ||||
| 63 | ||||
56
Table of Contents
REPORT OF INDEPENDENT REGISTERED PUBLIC ACCOUNTING FIRM
To the Board of Directors and Shareholders of
Sykes Enterprises, Incorporated
Tampa, Florida
Sykes Enterprises, Incorporated
Tampa, Florida
We have audited the accompanying consolidated balance sheets of Sykes Enterprises, Incorporated and
subsidiaries (the “Company”) as of December 31, 2010 and 2009, and the related consolidated
statements of operations, changes in shareholders’ equity, and cash flows for each of the three
years in the period ended December 31, 2010. Our audits also included the financial statement
schedule listed in the Index at Item 15. These financial statements and financial statement
schedule are the responsibility of the Company’s management. Our responsibility is to express an
opinion on the financial statements and financial statement schedule based on our audits.
We conducted our audits in accordance with the standards of the Public Company Accounting Oversight
Board (United States). Those standards require that we plan and perform the audit to obtain
reasonable assurance about whether the financial statements are free of material misstatement. An
audit includes examining, on a test basis, evidence supporting the amounts and disclosures in the
financial statements. An audit also includes assessing the accounting principles used and
significant estimates made by management, as well as evaluating the overall financial statement
presentation. We believe that our audits provide a reasonable basis for our opinion.
In our opinion, such consolidated financial statements present fairly, in all material respects,
the financial position of Sykes Enterprises, Incorporated and subsidiaries as of December 31, 2010
and 2009, and the results of their operations and their cash flows for each of the three years in
the period ended December 31, 2010, in conformity with accounting principles generally accepted in
the United States of America. Also, in our opinion, such financial statement schedule, when
considered in relation to the basic consolidated financial statements taken as a whole, presents
fairly, in all material respects, the information set forth therein.
We have also audited, in accordance with the standards of the Public Company Accounting Oversight
Board (United States), the Company’s internal control over financial reporting as of December 31,
2010, based on the criteria established in Internal Control—Integrated Framework issued by the
Committee of Sponsoring Organizations of the Treadway Commission and our report dated March 8, 2011
expressed an unqualified opinion on the Company’s internal control over financial reporting.
| /s/ Deloitte & Touche LLP | ||||
| Certified Public Accountants Tampa, Florida |
||||
| March 8, 2011 | ||||
57
Table of Contents
SYKES ENTERPRISES, INCORPORATED AND SUBSIDIARIES
Consolidated Balance Sheets
Consolidated Balance Sheets
| (in thousands, except per share data) | December 31, 2010 | December 31, 2009 | ||||||
Assets |
||||||||
Current assets: |
||||||||
Cash and cash equivalents |
$ | 189,829 | $ | 279,853 | ||||
Restricted cash |
519 | 80,342 | ||||||
Receivables, net |
248,842 | 167,666 | ||||||
Prepaid expenses |
10,704 | 9,419 | ||||||
Other current assets |
22,394 | 10,574 | ||||||
Total current assets |
472,288 | 547,854 | ||||||
Property and equipment, net |
113,703 | 80,264 | ||||||
Goodwill |
122,303 | 21,209 | ||||||
Intangibles, net |
52,752 | 2,091 | ||||||
Deferred charges and other assets |
33,554 | 21,053 | ||||||
| $ | 794,600 | $ | 672,471 | |||||
Liabilities and Shareholders’ Equity |
||||||||
Current liabilities: |
||||||||
Short-term debt |
$ | - | $ | 75,000 | ||||
Accounts payable |
30,635 | 21,725 | ||||||
Accrued employee compensation and benefits |
65,267 | 51,127 | ||||||
Current deferred income tax liabilities |
3,347 | 6,453 | ||||||
Income taxes payable |
2,605 | 3,341 | ||||||
Deferred revenue |
31,255 | 30,083 | ||||||
Other accrued expenses and current liabilities |
25,621 | 12,689 | ||||||
Total current liabilities |
158,730 | 200,418 | ||||||
Deferred grants |
10,807 | 11,005 | ||||||
Long-term income tax liabilities |
28,876 | 5,376 | ||||||
Other long-term liabilities |
12,992 | 4,998 | ||||||
Total liabilities |
211,405 | 221,797 | ||||||
Commitments and loss contingency (Note 23) |
||||||||
Shareholders’ equity: |
||||||||
Preferred stock, $0.01 par value, 10,000 shares
authorized; no shares issued and outstanding |
- | - | ||||||
Common stock, $0.01 par value, 200,000 shares authorized;
47,066 and 41,817 shares issued, respectively |
471 | 418 | ||||||
Additional paid-in capital |
302,911 | 166,514 | ||||||
Retained earnings |
265,676 | 280,399 | ||||||
Accumulated other comprehensive income |
15,108 | 7,819 | ||||||
Treasury stock at cost: 81 shares and 329 shares, respectively |
(971 | ) | (4,476 | ) | ||||
Total shareholders’ equity |
583,195 | 450,674 | ||||||
| $ | 794,600 | $ | 672,471 | |||||
See accompanying Notes to Consolidated Financial Statements.
58
Table of Contents
SYKES ENTERPRISES, INCORPORATED AND SUBSIDIARIES
Consolidated Statements of Operations
Consolidated Statements of Operations
| Years Ended December 31, | ||||||||||||
| (in thousands, except per share data) | 2010 | 2009 | 2008 | |||||||||
Revenues |
$ | 1,158,718 | $ | 813,574 | $ | 782,295 | ||||||
Operating expenses: |
||||||||||||
Direct salaries and related costs |
751,490 | 516,456 | 497,913 | |||||||||
General and administrative |
373,772 | 222,192 | 216,871 | |||||||||
(Recovery) of regulatory penalties |
(418 | ) | - | - | ||||||||
Net (gain) on insurance settlement |
(1,991 | ) | - | - | ||||||||
Impairment of goodwill and intangibles |
362 | 1,908 | - | |||||||||
Impairment of long-lived assets |
3,280 | - | - | |||||||||
Total operating expenses |
1,126,495 | 740,556 | 714,784 | |||||||||
Income from continuing operations |
32,223 | 73,018 | 67,511 | |||||||||
Other income (expense): |
||||||||||||
Interest income |
1,205 | 2,295 | 5,441 | |||||||||
Interest (expense) |
(5,627 | ) | (707 | ) | (178 | ) | ||||||
Impairment (loss) on investment in SHPS |
- | (2,089 | ) | - | ||||||||
Other income (expense) |
(5,906 | ) | (257 | ) | 11,298 | |||||||
Total other income (expense) |
(10,328 | ) | (758 | ) | 16,561 | |||||||
Income from continuing operations before income taxes |
21,895 | 72,260 | 84,072 | |||||||||
Income taxes |
2,197 | 26,118 | 21,421 | |||||||||
Income from continuing operations, net of taxes |
19,698 | 46,142 | 62,651 | |||||||||
(Loss) from discontinued operations, net of taxes |
(6,476 | ) | (2,931 | ) | (2,090 | ) | ||||||
(Loss) on sale of discontinued operations, net of taxes |
(23,495 | ) | - | - | ||||||||
Net income (loss) |
$ | (10,273 | ) | $ | 43,211 | $ | 60,561 | |||||
Net income (loss) per share common share: |
||||||||||||
Basic: |
||||||||||||
Continuing operations |
$ | 0.43 | $ | 1.13 | $ | 1.54 | ||||||
Discontinued operations |
(0.65 | ) | (0.07 | ) | (0.05 | ) | ||||||
Net income (loss) per common share |
$ | (0.22 | ) | $ | 1.06 | $ | 1.49 | |||||
Diluted: |
||||||||||||
Continuing operations |
$ | 0.43 | $ | 1.12 | $ | 1.53 | ||||||
Discontinued operations |
(0.65 | ) | (0.07 | ) | (0.05 | ) | ||||||
Net income (loss) per common share |
$ | (0.22 | ) | $ | 1.05 | $ | 1.48 | |||||
Weighted average shares: |
||||||||||||
Basic |
46,030 | 40,707 | 40,618 | |||||||||
Diluted |
46,133 | 41,026 | 40,961 | |||||||||
See accompanying Notes to Consolidated Financial Statements.
59
Table of Contents
SYKES ENTERPRISES, INCORPORATED AND SUBSIDIARIES
Consolidated Statements of Changes in Shareholders’ Equity
Consolidated Statements of Changes in Shareholders’ Equity
| Common Stock | Accumulated | |||||||||||||||||||||||||||
| Additional | Other | |||||||||||||||||||||||||||
| Shares | Paid-in | Retained | Comprehensive | Treasury | ||||||||||||||||||||||||
| (in thousands) | Issued | Amount | Capital | Earnings | Income (Loss) | Stock | Total | |||||||||||||||||||||
Balance at January 1, 2008 |
45,537 | $ | 455 | $ | 184,184 | $ | 195,203 | $ | 37,457 | $ | (51,978 | ) | $ | 365,321 | ||||||||||||||
Adjustment upon adoption of
ASC 715-60 (Note 24) |
- | - | - | (482 | ) | - | - | (482 | ) | |||||||||||||||||||
Issuance of common stock |
105 | 1 | 1,173 | - | - | - | 1,174 | |||||||||||||||||||||
Stock-based compensation
expense |
- | - | 4,756 | - | - | - | 4,756 | |||||||||||||||||||||
Excess tax benefit from stock-
based compensation |
- | - | 712 | - | - | - | 712 | |||||||||||||||||||||
Issuance of common stock and
restricted stock under equity
award
plans |
236 | 3 | 61 | - | - | (100 | ) | (36 | ) | |||||||||||||||||||
Repurchase of common stock |
- | - | - | - | - | (512 | ) | (512 | ) | |||||||||||||||||||
Retirement of treasury stock |
(4,644 | ) | (46 | ) | (33,346 | ) | (18,094 | ) | - | 51,486 | - | |||||||||||||||||
Issuance of common stock for
business acquisition |
37 | - | 676 | - | - | - | 676 | |||||||||||||||||||||
Comprehensive income (loss) |
- | - | - | 60,561 | (48,140 | ) | - | 12,421 | ||||||||||||||||||||
Balance at December 31, 2008 |
41,271 | 413 | 158,216 | 237,188 | (10,683 | ) | (1,104 | ) | 384,030 | |||||||||||||||||||
Issuance of common stock |
291 | 2 | 3,166 | - | - | - | 3,168 | |||||||||||||||||||||
Stock-based compensation
expense |
- | - | 5,158 | - | - | - | 5,158 | |||||||||||||||||||||
Excess tax benefit from stock-
based compensation |
- | - | 878 | - | - | - | 878 | |||||||||||||||||||||
Issuance of common stock and
restricted stock under equity
award
plans |
255 | 3 | (904 | ) | - | - | (179 | ) | (1,080 | ) | ||||||||||||||||||
Repurchase of common stock |
- | - | - | - | - | (3,193 | ) | (3,193 | ) | |||||||||||||||||||
Comprehensive income |
- | - | - | 43,211 | 18,502 | - | 61,713 | |||||||||||||||||||||
Balance at December 31, 2009 |
41,817 | 418 | 166,514 | 280,399 | 7,819 | (4,476 | ) | 450,674 | ||||||||||||||||||||
Issuance of common stock |
2 | - | 37 | - | - | - | 37 | |||||||||||||||||||||
Stock-based compensation
expense |
- | - | 4,935 | - | - | - | 4,935 | |||||||||||||||||||||
Excess tax benefit from stock-
based compensation |
- | - | 354 | - | - | - | 354 | |||||||||||||||||||||
Issuance of common stock and
restricted stock under equity
award
plans |
204 | 2 | (1,083 | ) | - | - | (201 | ) | (1,282 | ) | ||||||||||||||||||
Repurchase of common stock |
- | - | - | - | - | (5,212 | ) | (5,212 | ) | |||||||||||||||||||
Retirement of treasury stock |
(558 | ) | (6 | ) | (4,462 | ) | (4,450 | ) | - | 8,918 | - | |||||||||||||||||
Issuance of common stock for
business acquisition |
5,601 | 57 | 136,616 | - | - | - | 136,673 | |||||||||||||||||||||
Comprehensive income (loss) |
- | - | - | (10,273 | ) | 7,289 | - | (2,984 | ) | |||||||||||||||||||
Balance at December 31, 2010 |
47,066 | $ | 471 | $ | 302,911 | $ | 265,676 | $ | 15,108 | $ | (971 | ) | $ | 583,195 | ||||||||||||||
See accompanying Notes to Consolidated Financial Statements.
60
Table of Contents
SYKES ENTERPRISES, INCORPORATED AND SUBSIDIARIES
Consolidated Statements of Cash Flows
Consolidated Statements of Cash Flows
| Years Ended December 31, | ||||||||||||
| (in thousands) | 2010 | 2009 | 2008 | |||||||||
Cash flows from operating activities: |
||||||||||||
Net income (loss) |
$ | (10,273 | ) | $ | 43,211 | $ | 60,561 | |||||
Adjustments to reconcile net income (loss) to net cash provided by
operating activities: |
||||||||||||
Depreciation and amortization, net |
57,932 | 28,323 | 27,965 | |||||||||
Impairment losses |
4,324 | 3,997 | - | |||||||||
Unrealized foreign currency transaction (gains) losses, net |
(4,918 | ) | 4,372 | 567 | ||||||||
Stock-based compensation expense |
4,935 | 5,158 | 4,756 | |||||||||
Excess tax benefit from stock-based compensation |
(354 | ) | (878 | ) | (712 | ) | ||||||
Deferred income tax (benefit) provision |
(17,142 | ) | 10,165 | 1,354 | ||||||||
Net loss on disposal of property and equipment |
232 | 197 | 322 | |||||||||
Bad debt expense |
170 | 1,022 | 554 | |||||||||
Write-down of value added tax receivables |
551 | 536 | 592 | |||||||||
Unrealized (gains) losses on financial instruments, net |
(1,479 | ) | (437 | ) | 1,395 | |||||||
(Recovery) of regulatory penalties |
(418 | ) | - | - | ||||||||
Amortization of discount on short-term investments |
- | - | (173 | ) | ||||||||
Amortization of actuarial (gains) on pension |
(198 | ) | (61 | ) | (66 | ) | ||||||
Foreign exchange (gain) loss on liquidation of foreign entities |
7 | (3 | ) | 4 | ||||||||
Increase (decrease) in valuation allowance on deferred tax assets |
102 | (5,807 | ) | - | ||||||||
Amortization of unrealized (gain) on postretirement obligation |
(34 | ) | (31 | ) | - | |||||||
Amortization of deferred loan fees |
2,918 | 268 | - | |||||||||
Net (gain) on insurance settlement |
(1,991 | ) | - | - | ||||||||
Loss on sale of discontinued operations |
29,901 | - | - | |||||||||
Changes in assets and liabilities, net of acquisition: |
||||||||||||
Receivables |
(10,716 | ) | (9,262 | ) | (23,705 | ) | ||||||
Prepaid expenses |
3,465 | (719 | ) | 1,360 | ||||||||
Other current assets |
(4,797 | ) | 46 | (1,035 | ) | |||||||
Deferred charges and other assets |
2,740 | (2,045 | ) | (1,671 | ) | |||||||
Accounts payable |
(2,174 | ) | (2,186 | ) | 4,396 | |||||||
Income taxes receivable / payable |
(6,180 | ) | 6,462 | (1,151 | ) | |||||||
Accrued employee compensation and benefits |
(6,601 | ) | 2,654 | 4,596 | ||||||||
Other accrued expenses and current liabilities |
9,329 | 1,336 | (456 | ) | ||||||||
Deferred revenue |
258 | (679 | ) | 925 | ||||||||
Other long-term liabilities |
(4,527 | ) | 1,973 | 479 | ||||||||
Net cash provided by operating activities |
45,062 | 87,612 | 80,857 | |||||||||
Cash flows from investing activities: |
||||||||||||
Capital expenditures |
(28,516 | ) | (30,277 | ) | (34,677 | ) | ||||||
Cash paid for business acquisition, net of cash acquired |
(77,174 | ) | - | (2,400 | ) | |||||||
Proceeds from sale of property and equipment |
49 | 216 | 170 | |||||||||
Sale of short-term investments |
- | - | 17,535 | |||||||||
Investment in restricted cash |
(187 | ) | (80,002 | ) | (997 | ) | ||||||
Release of restricted cash |
80,000 | 839 | 847 | |||||||||
Cash divested on sale of discontinued operations |
(14,462 | ) | - | - | ||||||||
Proceeds from insurance settlement |
1,991 | - | - | |||||||||
Other |
- | - | (129 | ) | ||||||||
Net cash (used for) investing activities |
(38,299 | ) | (109,224 | ) | (19,651 | ) | ||||||
61
Table of Contents
SYKES ENTERPRISES, INCORPORATED AND SUBSIDIARIES
Consolidated Statements of Cash Flows
(continued)
Consolidated Statements of Cash Flows
(continued)
| Years Ended December 31, | ||||||||||||
| (in thousands) | 2010 | 2009 | 2008 | |||||||||
Cash flows from financing activities: |
||||||||||||
Payment of long term debt |
(75,000 | ) | - | - | ||||||||
Proceeds from issuance of long term debt |
75,000 | - | - | |||||||||
Proceeds from issuance of stock |
37 | 3,168 | 1,174 | |||||||||
Excess tax benefit from stock-based compensation |
354 | 878 | 712 | |||||||||
Cash paid for repurchase of common stock |
(5,212 | ) | (3,193 | ) | (512 | ) | ||||||
Proceeds from grants |
148 | 3,491 | 123 | |||||||||
Proceeds from short-term debt |
- | 75,000 | 26 | |||||||||
Payments on short-term debt |
(85,000 | ) | - | (26 | ) | |||||||
Shares repurchased for minimum tax withholding on equity awards |
(1,282 | ) | (1,080 | ) | - | |||||||
Cash paid for loan fees related to debt |
(3,035 | ) | (1,427 | ) | - | |||||||
Net cash (used for) provided by financing activities |
(93,990 | ) | 76,837 | 1,497 | ||||||||
Effects of exchange rates on cash |
(2,797 | ) | 5,578 | (21,335 | ) | |||||||
Net increase (decrease) in cash and cash equivalents |
(90,024 | ) | 60,803 | 41,368 | ||||||||
Cash and
cash equivalents – beginning |
279,853 | 219,050 | 177,682 | |||||||||
Cash and
cash equivalents – ending |
$ | 189,829 | $ | 279,853 | $ | 219,050 | ||||||
Supplemental disclosures of cash flow information: |
||||||||||||
Cash paid during period for interest |
$ | 2,924 | $ | 1,008 | $ | 369 | ||||||
Cash paid during period for income taxes |
$ | 20,577 | $ | 14,660 | $ | 23,635 | ||||||
Non-cash transactions: |
||||||||||||
Property and equipment additions in accounts payable |
$ | 2,317 | $ | 1,612 | $ | 5,318 | ||||||
Unrealized gain on postretirement obligation in accumulated other
comprehensive income (loss) |
$ | 70 | $ | 276 | $ | - | ||||||
Issuance of
common stock for business acquisition |
$ | 136,673 | $ | - | $ | 676 | ||||||
See accompanying Notes to Consolidated Financial Statements.
62
Table of Contents
SYKES ENTERPRISES, INCORPORATED AND SUBSIDIARIES
Notes to Consolidated Financial Statements
Note 1. Business, Basis of Presentation and Summary of Significant Accounting Policies
Business — The Sykes Enterprises, Incorporated and consolidated subsidiaries (“SYKES” or the
“Company”) provides outsourced customer contact management solutions and services in the business
process outsourcing arena to companies, primarily within the communications, financial services,
technology/consumer, transportation and leisure, healthcare and other industries. SYKES provides
flexible, high-quality outsourced customer contact management services (with an emphasis on inbound
technical support and customer service), which includes customer assistance, healthcare and
roadside assistance, technical support and product sales to its clients’ customers. Utilizing
SYKES’ integrated onshore/offshore global delivery model, SYKES provides its services through
multiple communication channels encompassing phone, e-mail, Internet, text messaging and chat.
SYKES complements its outsourced customer contact management services with various enterprise
support services in the United States that encompass services for a company’s internal support
operations, from technical staffing services to outsourced corporate help desk services. In Europe,
SYKES also provides fulfillment services including multilingual sales order processing via the
Internet and phone, payment processing, inventory control, product delivery and product returns
handling. The Company has operations in two reportable segments entitled (1) the Americas, which
includes the United States, Canada, Latin America, India and the Asia Pacific Rim, in which the
client base is primarily companies in the United States that are using the Company’s services to
support their customer management needs; and (2) EMEA, which includes Europe, the Middle East and
Africa.
On February 2, 2010, the Company completed the acquisition of ICT Group, Inc., pursuant to the
Agreement and Plan of Merger, dated October 5, 2009. The Company has reflected the operating
results in the Consolidated Statement of Operations for the period from February 2, 2010 to
December 31, 2010. See Note 2, Acquisition of ICT, for additional information on the acquisition of
this business.
In December 2010, the Company committed to a plan and sold its Argentine operations, pursuant to
stock purchase agreements, dated December 16, 2010 and December 29, 2010. The Company has reflected
the operating results related to the Argentine operations as discontinued operations in the
Consolidated Statements of Operations for all periods presented. Cash flows from discontinued
operations are included in the Consolidated Statements of Cash Flows for all periods presented.
See Note 3, Discontinued Operations, for additional information on the sale of the Argentine
operations.
Principles of Consolidation — The Consolidated Financial Statements include the accounts of SYKES
and its wholly-owned subsidiaries and controlled majority-owned subsidiaries. All significant
intercompany transactions and balances have been eliminated in consolidation.
Use of Estimates — The preparation of consolidated financial statements in conformity with
accounting principles generally accepted in the United States of America requires the Company to
make estimates and assumptions that affect the reported amounts of assets and liabilities and
disclosure of contingent assets and liabilities at the date of the financial statements and the
reported amounts of revenues and expenses during the reporting period. Actual results could differ
from those estimates.
Recognition of Revenue — Revenue is recognized in accordance with the Financial Accounting
Standards Board’s Accounting Standards Codification (“ASC”) 605 “Revenue Recognition.” The Company
primarily recognizes its revenues from services as those services are performed, which is based on
either a per minute, per hour, per call or per transaction basis, under a fully executed
contractual agreement and records reductions to revenues for contractual penalties and holdbacks
for failure to meet specified minimum service levels and other performance based contingencies.
Revenue recognition is limited to the amount that is not contingent upon delivery of any future
product or service or meeting other specified performance conditions. Product sales, accounted for
within fulfillment services, are recognized upon shipment to the customer and satisfaction of all
obligations.
In accordance with ASC 605-25, “Revenue Recognition - Multiple-Element Arrangements”, revenues from
contracts with multiple-deliverables is allocated to separate units of accounting based on their
relative fair value, if
63
Table of Contents
the deliverables in the contract(s) meet the criteria for such treatment.
Certain fulfillment services contracts contain
multiple-deliverables. Additionally, the Company had a contract containing multiple-deliverables
for customer contact management services and fulfillment services that ended during 2008.
Separation criteria includes whether a delivered item has value to the customer on a stand-alone
basis, whether there is objective and reliable evidence of the fair value of the undelivered items
and, if the arrangement includes a general right of return related to a delivered item, whether
delivery of the undelivered item is considered probable and in the Company’s control. Fair value is
the price of a deliverable when it is regularly sold on a stand-alone basis, which generally
consists of vendor-specific objective evidence of fair value. If there is no evidence of the fair
value for a delivered product or service, revenue is allocated first to the fair value of the
undelivered product or service and then the residual revenue is allocated to the delivered product
or service. If there is no evidence of the fair value for an undelivered product or service, the
contract(s) is accounted for as a single unit of accounting, resulting in delay of revenue
recognition for the delivered product or service until the undelivered product or service portion
of the contract is complete. The Company recognizes revenue for delivered elements only when the
fair values of undelivered elements are known, uncertainties regarding client acceptance are
resolved, and there are no client-negotiated refund or return rights affecting the revenue
recognized for delivered elements. Once the Company determines the allocation of revenues between
deliverable elements, there are no further changes in the revenue allocation. If the separation
criteria are met, revenues from these services is recognized as the services are performed under a
fully executed contractual agreement. If the separation criteria are not met because there is
insufficient evidence to determine fair value of one of the deliverables, all of the services are
accounted for as a single combined unit of accounting. For these deliverables with insufficient
evidence to determine fair value, revenue is recognized on the proportional performance method
using the straight-line basis over the contract period, or the actual number of operational seats
used to serve the client, as appropriate. As of December 31, 2010, the Company has no contracts
containing multiple-deliverables for customer contact management services and fulfillment services.
Cash and Cash Equivalents — Cash and cash equivalents consist of cash and highly liquid short-term
investments. Cash in the amount of $189.8 million and $279.9 million at December 31, 2010 and 2009,
respectively, was primarily held in interest bearing investments, which have original maturities of
less than 90 days. Cash and cash equivalents of $173.9 million and $179.3 million at December 31,
2010 and 2009, respectively, were held in international operations and may be subject to additional
taxes if repatriated to the United States.
Restricted
Cash – Restricted cash includes cash whereby the Company’s ability to use the funds at
any time is contractually limited or is generally designated for specific purposes arising out of
certain contractual or other obligations.
Allowance for Doubtful Accounts — The Company maintains allowances for doubtful accounts on
trade account receivables for estimated losses arising from the inability of its customers to make
required payments. The Company’s estimate is based on factors surrounding the credit risk of
certain clients, historical collection experience and a review of the current status of trade
accounts receivable. It is reasonably possible that the Company’s estimate of the allowance for
doubtful accounts will change if the financial condition of the Company’s customers were to
deteriorate, resulting in a reduced ability to make payments.
Property and Equipment — Property and equipment is recorded at cost and depreciated using the
straight-line method over the estimated useful lives of the respective assets. Improvements to
leased premises are amortized over the shorter of the related lease term or the estimated useful
lives of the improvements. Cost and related accumulated depreciation on assets retired or disposed
of are removed from the accounts and any resulting gains or losses are credited or charged to
income. Depreciation expense was $48.6 million, $26.5 million and $25.1 million for 2010, 2009 and
2008, respectively. Property and equipment includes $2.3 million, $1.6 million and $5.3 million of
additions included in accounts payable at December 31, 2010, 2009 and 2008, respectively.
Accordingly, non-cash transactions have been excluded from the accompanying Consolidated Statements
of Cash Flows for 2010, 2009 and 2008, respectively.
The Company capitalizes certain costs incurred to internally develop software upon the
establishment of technological feasibility. Costs incurred prior to the establishment of
technological feasibility are expensed as incurred. Capitalized internally developed software
costs, net of accumulated amortization, were $0.1 million and $0.3 million at December 31, 2010 and
2009, respectively.
The carrying value of property and equipment to be held and used is evaluated for impairment
whenever events or changes in circumstances indicate that the carrying amount may not be
recoverable in accordance with ASC 360 “Property, Plant and Equipment.” For purposes of recognition
and measurement of an impairment loss, assets are grouped at the lowest levels for which there are
identifiable cash flows (the “reporting unit”). An asset is considered
64
Table of Contents
to be impaired when the sum
of the undiscounted future net cash flows expected to result from the use of the asset
and its eventual disposition does not exceed its carrying amount. The amount of the impairment
loss, if any, is measured as the amount by which the carrying value of the asset exceeds its
estimated fair value, which is generally determined based on appraisals or sales prices of
comparable assets. Occasionally, the Company redeploys property and equipment from under-utilized
centers to other locations to improve capacity utilization if it is determined that the related
undiscounted future cash flows in the under-utilized centers would not be sufficient to recover the
carrying amount of these assets. Except as discussed in Note 5, Fair Value, the Company determined
that its property and equipment were not impaired as of December 31, 2010.
Rent Expense —The Company has entered into several operating lease agreements, some of which
contain provisions for future rent increases, rent free periods, or periods in which rent payments
are reduced. The total amount of the rental payments due over the lease term is being charged to
rent expense on the straight-line method over the term of the lease in accordance with ASC 840
“Leases.”
Investment in SHPS — The Company held a noncontrolling interest in SHPS, Inc. (“SHPS”), which was
accounted for at cost of approximately $2.1 million as of December 31, 2008. In June 2009, the
Company received notice from SHPS that the shareholders of SHPS had approved a merger agreement
between SHPS and SHPS Acquisition, Inc., pursuant to which the common stock of SHPS, including the
common stock owned by the Company, would be converted into the right to receive $0.000001 per share
in cash. SHPS informed the Company that it believed the estimated fair value of the SHPS common
stock to be equal to such per share amount. As a result of this transaction and evaluation of the
Company’s legal options, the Company believed it was more likely than not that it would not be able
to recover the $2.1 million carrying value of the investment in SHPS. Therefore, due to the decline
in value that is other than temporary, management recorded a non-cash impairment loss of $2.1
million included in “Impairment loss on investment in SHPS” during 2009. Subsequent to the
recording of the impairment loss, the Company liquidated its noncontrolling interest in SHPS by
converting its SHPS common stock into cash for $0.000001 per share during 2009.
Investments Held in Rabbi Trust for Former ICT Chief Executive Officer —Securities held in a rabbi
trust for a nonqualified plan trust agreement dated February 1, 2010 (the “Trust Agreement”) with
respect to severance payable to John Brennan, the former chief executive officer of ICT, include
the fair market value of debt securities, primarily United States (“U.S.”) Treasury Bills. See
Note 13, Investments Held in Rabbi Trusts, for further information. The fair market value of these
debt securities, classified as trading securities in accordance with
ASC 320 “Investment – Debt
and Equity Securities”, is determined by quoted market prices and is adjusted to the current market
price at the end of each reporting period. The net realized and unrealized gains and losses on
trading securities, which are included in “Other income and expense” in the accompanying
Consolidated Statements of Operations, are not material for the year ended December 31, 2010. For
purposes of determining realized gains and losses, the cost of securities sold is based on specific
identification.
The “Accrued employee compensation and benefits” in the accompanying Consolidated Balance Sheet as
of December 31, 2010 includes a $0.1 million obligation for severance payable to the former
executive due in varying installments in accordance with the Trust Agreement, with a final payment
in January 2011.
Goodwill — The Company accounts for goodwill and other intangible assets under ASC 350 (“ASC 350”)
“Intangibles — Goodwill and Other.” The Company expects to receive future benefits from previously
acquired goodwill over an indefinite period of time. Goodwill and other intangible assets with
indefinite lives are not subject to amortization, but instead must be reviewed at least annually,
and more frequently in the presence of certain circumstances, for impairment by applying a fair
value based test. Fair value for goodwill is based on discounted cash flows, market multiples
and/or appraised values, as appropriate, and an analysis of our market capitalization. Under ASC
350, the carrying value of assets is calculated at the reporting unit. If the fair value of the
reporting unit is less than its carrying value, goodwill is considered impaired and an impairment
loss is recorded to the extent that the fair value of the goodwill within the reporting unit is
less than its carrying value.
The Company completed its annual goodwill impairment test during the quarter ended September 30,
2010, which included the consideration of certain economic factors and determined that the carrying
amount of goodwill was not impaired, except as discussed in Note 6, Goodwill and Intangible Assets.
Intangible Assets — Intangible assets, primarily customer relationships, trade names, existing
technologies and covenants not to compete, are amortized using the straight-line method over their
estimated useful lives which approximate the pattern in which the economic benefits of the assets
are consumed. The Company periodically
65
Table of Contents
evaluates the recoverability of intangible assets and takes
into account events or changes in circumstances that
warrant revised estimates of useful lives or that indicate that impairment exists. Fair value for
intangible assets is based on discounted cash flows, market multiples and/or appraised values as
appropriate. The Company does not have intangible assets with indefinite lives. See Note 6,
Goodwill and Intangible Assets, for further information regarding the impairment of intangible
assets recorded in 2010 and 2009.
Value Added Tax Receivables — The Philippine operations are subject to Value Added Tax (“VAT”),
which is usually applied to all goods and services purchased throughout the Philippines. Upon
validation and certification of the VAT receivables by the Philippine government, the VAT
receivables are held for sale through third-party brokers. The Company sells VAT credits to others
due to its current tax holiday status in the Philippines and resulting inability to fully utilize
these credits. This process through collection typically takes three to five years. The VAT
receivables balance is recorded at its net realizable value.
Income Taxes — The Company accounts for income taxes under ASC 740 (“ASC 740”) “Income Taxes”
which requires recognition of deferred tax assets and liabilities to reflect tax consequences of
differences between the tax bases of assets and liabilities and their reported amounts in the
accompanying Consolidated Financial Statements. Deferred tax assets are reduced by a valuation
allowance if, based on the weight of available evidence, both positive and negative, for each
respective tax jurisdiction, it is more likely than not that the deferred tax assets will not be
realized in accordance with the criteria of ASC 740. Valuation allowances are established against
deferred tax assets due to an uncertainty of realization. Valuation allowances are reviewed each
period on a tax jurisdiction by tax jurisdiction basis to analyze whether there is sufficient
positive or negative evidence, in accordance with criteria of ASC 740, to support a change in
judgment about the realizability of the related deferred tax assets. Uncertainties regarding
expected future income in certain jurisdictions could affect the realization of deferred tax assets
in those jurisdictions.
The Company evaluates tax positions that have been taken or are expected to be taken in its tax
returns, and records a liability for uncertain tax positions in accordance with ASC 740. ASC 740
contains a two-step approach to recognizing and measuring uncertain tax positions. First, tax
positions are recognized if the weight of available evidence indicates that it is more likely than
not that the position will be sustained upon examination, including resolution of related appeals
or litigation processes, if any. Second, the tax position is measured as the largest amount of tax
benefit that has a greater than 50% likelihood of being realized upon settlement. The Company
recognizes interest and penalties related to unrecognized tax benefits in the provision for income
taxes in the accompanying Consolidated Financial Statements.
Self-Insurance Programs — The Company self-insures for certain levels of workers’ compensation.
Estimated costs of this self-insurance program are accrued at the projected settlements for known
and anticipated claims. The self-insurance liabilities total $0.2 million and $0.3 million as of
December 31, 2010 and 2009, respectively. As of December 31, 2010 and 2009, self-insurance
liabilities of $0.1 million and $0.1 million, respectively, are included in “Accrued employee
compensation and benefits”, and $0.1 million and $0.2 million, respectively, are included in “Other
long-term liabilities” in the accompanying Consolidated Balance Sheets.
Deferred Grants — Recognition of income associated with grants for land and the acquisition of
property, buildings and equipment is deferred until after the completion and occupancy of the
building and title has passed to the Company, and the funds have been released from escrow. The
deferred amounts for both land and building are amortized and recognized as a reduction of
depreciation expense included within general and administrative costs over the corresponding useful
lives of the related assets. Amounts received in excess of the cost of the building are allocated
to the cost of equipment and, only after the grants are released from escrow, recognized as a
reduction of depreciation expense over the weighted average useful life of the related equipment,
which approximates five years. Amortization of the deferred grants that is included as a reduction
to “General and administrative” costs in the accompanying Consolidated Statements of Operations was
approximately $1.1 million, $1.2 million and $1.1 million for the years ended December 31, 2010,
2009 and 2008, respectively. Upon sale of the related facilities, any deferred grant balance is
recognized in full and is included in the gain on sale of property and equipment.
In addition, the Company received grants from a government entity in Ireland as an incentive to
create and maintain permanent employment positions for a period of five years. The grants are
repayable, under certain terms and conditions, if the Company’s relevant employment levels do not
meet or exceed the employment levels set forth in the grant agreement. Accordingly, the grant
monies received are deferred and amortized using the proportionate performance model over the
five-year employment period. Amortization of the employment deferred grants,
66
Table of Contents
recorded as a
reduction to “General and administrative” costs in the accompanying Consolidated Statements of
Operations, was $0.1 million and $0.2 million for 2009 and 2008, respectively (none in 2010).
Deferred Revenue — The Company receives up-front fees in connection with certain contracts. The
deferred revenue is earned over the service periods of the respective contracts, which range from
six months to seven years. Deferred revenue included in current liabilities in the accompanying
Consolidated Balance Sheets includes the up-front fees associated with services to be provided over
the next ensuing twelve month period and the up-front fees associated with services to be provided
over multiple years in connection with contracts that contain cancellation and refund provisions,
whereby the manufacturers or customers can terminate the contracts and demand pro-rata refunds of
the up-front fees with short notice. Deferred revenue included in current liabilities in the
accompanying Consolidated Balance Sheets also includes estimated penalties and holdbacks for
failure to meet specified minimum service levels in certain contracts and other performance based
contingencies.
Stock-Based Compensation — The Company has three stock-based compensation plans: the 2001 Equity
Incentive Plan (for employees and certain non-employees), the 2004 Non-Employee Director Fee Plan
(for non-employee directors), both approved by the shareholders, and the Deferred Compensation Plan
(for certain eligible employees). All of these plans are discussed more fully in Note 25,
Stock-Based Compensation. Stock-based awards under these plans may consist of common stock, common
stock units, stock options, cash-settled or stock-settled stock appreciation rights, restricted
stock and other stock-based awards. The Company issues common stock and treasury stock to satisfy
stock option exercises or vesting of stock awards.
In accordance with ASC 718 (“ASC 718”) “Compensation — Stock Compensation”, the Company recognizes
in its Consolidated Statements of Operations the grant-date fair value of stock options and other
equity-based compensation issued to employees and directors. Compensation expense for equity-based
awards is recognized over the requisite service period, usually the vesting period, while
compensation expense for liability-based awards (those usually settled in cash rather than stock)
is re-measured to fair value at each balance sheet date until the awards are settled.
Fair Value of Financial Instruments — The following methods and assumptions were used to estimate
the fair value of each class of financial instruments for which it is practicable to estimate that
value:
| • | Cash, Short-Term and Other Investments, Investments Held in Rabbi Trusts, Short-Term
Debt and Accounts Payable. The carrying values for cash, short-term and other investments,
investments held in rabbi trusts, short-term debt and accounts payable approximate their
fair values. |
||
| • | Forward Currency Forward Contracts and Options.
Forward currency forward contracts and
options, including premiums paid on options, are recognized at fair value based on quoted market prices of comparable
instruments or, if none are available, on pricing models or formulas using current market
and model assumptions, including adjustments for credit risk. |
||
| • | Long-Term Debt. The carrying value of long-term debt, including the current portion
thereof, approximates its estimated fair value as it re-prices at varying interest rates. |
Fair Value Measurements - Effective January 1, 2008, the Company adopted the provisions of ASC 820
(“ASC 820”) “Fair Value Measurements and Disclosures” and ASC 825 (“ASC 825”) “Financial
Instruments”. ASC 820, which defines fair value, establishes a framework for measuring fair value
in accordance with generally accepted accounting principles, and expands disclosures about fair
value measurements. ASC 820-10-20 clarifies that fair value is an exit price, representing the
amount that would be received to sell an asset or paid to transfer a liability in an orderly
transaction between market participants.
ASC 825 permits an entity to measure certain financial assets and financial liabilities at fair
value with changes in fair value recognized in earnings each period. The Company has not elected to
use the fair value option permitted under ASC 825 for any of its financial assets and financial
liabilities that are not already recorded at fair value.
A description of the Company’s policies regarding fair value measurement is summarized below.
Fair Value Hierarchy – ASC 820-10-35 requires disclosure about how fair value is
determined for assets and liabilities and establishes a hierarchy for which these assets and
liabilities must be grouped, based on significant levels of observable or unobservable inputs.
Observable inputs reflect market data obtained from independent
67
Table of Contents
sources, while unobservable inputs
reflect the Company’s market assumptions. This hierarchy requires the use of observable market data
when available. These two types of inputs have created the following fair value hierarchy:
| • | Level 1 – Quoted prices for identical instruments in active markets. |
||
| • | Level 2 – Quoted prices for similar instruments in active markets;
quoted prices for identical or similar instruments in markets that are
not active; and model-derived valuations in which all significant
inputs and significant value drivers are observable in active markets. |
||
| • | Level 3 – Valuations derived from valuation techniques in which one
or more significant inputs or significant value drivers are
unobservable. |
Determination of Fair Value - The Company generally uses quoted market prices (unadjusted)
in active markets for identical assets or liabilities that the Company has the ability to access to
determine fair value, and classifies such items in Level 1. Fair values determined by Level 2
inputs utilize inputs other than quoted market prices included in Level 1 that are observable for
the asset or liability, either directly or indirectly. Level 2 inputs include quoted market prices
in active markets for similar assets or liabilities, and inputs other than quoted market prices
that are observable for the asset or liability. Level 3 inputs are unobservable inputs for the
asset or liability, and include situations where there is little, if any, market activity for the
asset or liability.
If quoted market prices are not available, fair value is based upon internally developed valuation
techniques that use, where possible, current market-based or independently sourced market
parameters, such as interest rates, currency rates, etc. Assets or liabilities valued using such
internally generated valuation techniques are classified according to the lowest level input or
value driver that is significant to the valuation. Thus, an item may be classified in Level 3 even
though there may be some significant inputs that are readily observable.
The following section describes the valuation methodologies used by the Company to measure fair
value, including an indication of the level in the fair value hierarchy in which each asset or
liability is generally classified.
Money Market and Open-End Mutual Funds - The Company uses quoted market prices in active
markets to determine the fair value of money market and open-end mutual funds, which are classified
in Level 1 of the fair value hierarchy.
Foreign Currency Forward Contracts and Options - The Company enters into foreign currency
forward contracts and options over the counter and values such contracts using quoted market prices
of comparable instruments or, if none are available, on pricing models or formulas using current
market and model assumptions, including adjustments for credit risk. The key inputs include forward
or option foreign currency exchange rates and interest rates. These items are classified in Level 2
of the fair value hierarchy.
Investments Held in Rabbi Trusts - The investment assets of the rabbi trusts are valued
using quoted market prices in active markets, which are classified in Level 1 of the fair value
hierarchy. For additional information about the deferred compensation plan, refer to Note 13,
Investments Held in Rabbi Trusts, and Note 25, Stock-Based Compensation.
Guaranteed Investment Certificates - Guaranteed investment certificates, with variable
interest rates linked to the prime rate, approximate fair value due to the automatic ability to
re-price with changes in the market; such items are classified in Level 2 of the fair value
hierarchy.
Foreign Currency Translation — The assets and liabilities of the Company’s foreign subsidiaries,
whose functional currency is other than the U.S. Dollar, are translated at the exchange rates in
effect on the reporting date, and income and expenses are translated at the weighted average
exchange rate during the period. The net effect of translation gains and losses is not included in
determining net income, but is included in “Accumulated other comprehensive income (loss)”
(“AOCI”), which is reflected as a separate component of shareholders’ equity until the sale or
until the complete or substantially complete liquidation of the net investment in the foreign
subsidiary. Foreign currency transactional gains and losses are included in “Other income
(expense)” in the accompanying Consolidated Statements of Operations.
Foreign Currency and Derivative Instruments — The Company accounts for financial derivative
instruments under ASC 815 (“ASC 815”) “Derivatives and Hedging”. The Company generally utilizes
non-deliverable forward
68
Table of Contents
contracts and options expiring within one to 24 months to reduce its
foreign currency exposure due to exchange rate fluctuations on forecasted cash flows denominated in
non-functional foreign currencies and net investments in foreign operations. In using derivative
financial instruments to hedge exposures to changes in exchange rates, the
Company exposes itself to counterparty credit risk.
The Company designates derivatives as either (1) a hedge of a forecasted transaction or of the
variability of cash flows to be received or paid related to a recognized asset or liability (“cash
flow” hedge); (2) a hedge of a net investment in a foreign operation; or (3) a derivative that does
not qualify for hedge accounting. To qualify for hedge accounting treatment, a derivative must be
highly effective in mitigating the designated risk of the hedged item. Effectiveness of the hedge
is formally assessed at inception and throughout the life of the hedging relationship. Even if a
derivative qualifies for hedge accounting treatment, there may be an element of ineffectiveness of
the hedge.
Changes in the fair value of derivatives that are highly effective and designated as cash flow
hedges are recorded in AOCI, until the forecasted underlying transactions occur. Any realized gains
or losses resulting from the cash flow hedges are recognized together with the hedged transaction
within “Revenues”. Changes in the fair value of derivatives that are highly effective and
designated as a net investment hedge are recorded in cumulative translation adjustment in AOCI,
offsetting the change in cumulative translation adjustment attributable to the hedged portion of
the Company’s net investment in the foreign operation. Any realized gains and losses from
settlements of the net investment hedge remain in AOCI until partial or complete liquidation of the
net investment. Ineffectiveness is measured based on the change in fair value of the forward
contracts and options and the fair value of the hypothetical derivatives with terms that match the
critical terms of the risk being hedged. Hedge ineffectiveness is recognized within “Revenues” for
cash flow hedges and within “Other income (expense)” for net investment hedges. Cash flows from the
derivative contracts are classified within the operating section in the accompanying Consolidated
Statements of Cash Flows.
The Company formally documents all relationships between hedging instruments and hedged items, as
well as its risk management objective and strategy for undertaking various hedging activities. This
process includes linking all derivatives that are designated as cash flow hedges to forecasted
transactions. Hedges of a net investment in a foreign operation are linked to the specific foreign
operation. The Company also formally assesses, both at the hedge’s inception and on an ongoing
basis, whether the derivatives that are used in hedging transactions are highly effective on a
prospective and retrospective basis. When it is determined that a derivative is not highly
effective as a hedge or that it has ceased to be a highly effective hedge or if a forecasted hedge
is no longer probable of occurring, the Company discontinues hedge accounting prospectively. At
December 31, 2010, all hedges were determined to be highly effective.
The Company also periodically enters into forward contracts that are not designated as hedges as
defined under ASC 815. The purpose of these derivative instruments is to reduce the effects from
fluctuations caused by volatility in currency exchange rates on the Company’s operating results and
cash flows. All changes in the fair value of the derivative instruments are included in “Other
income (expense)”. See Note 12, Financial Derivatives, for further information on financial
derivative instruments.
New Accounting Standards Not Yet Adopted
In October 2009, the Financial Accounting Standards Board issued ASU No. 2009-13 which amended the
accounting for multiple-deliverable revenue arrangements. The amended guidance will make it easier
for companies to account for each deliverable in multiple-deliverable arrangements separately. The
amended guidance will require the allocation of the overall consideration to each deliverable based
upon its estimated selling price in absence of other objective evidence of selling prices. The
amendment is effective prospectively for revenue arrangements entered into or materially modified
in fiscal years beginning on or after June 15, 2010, and was adopted for applicable transactions as
of January 1, 2011. The Company does not expect the adoption of this amendment to materially
impact its financial condition, results of operations and cash flows.
Note 2. Acquisition of ICT
On February 2, 2010, the Company acquired 100% of the outstanding common shares and voting interest
of ICT through a merger of ICT with and into a subsidiary of the Company. ICT provides outsourced
customer management and business process outsourcing solutions with its operations located in the
United States, Canada, Europe, Latin America, India, Australia and the Philippines. The results of
ICT’s operations have been included in the Company’s Consolidated Financial Statements since its
acquisition on February 2, 2010. The Company
69
Table of Contents
acquired ICT to expand and complement its global
footprint, provide entry into additional vertical markets, and increase revenues to enhance its
ability to leverage the Company’s infrastructure to produce improved sustainable
operating margins. This resulted in the Company paying a substantial premium for ICT resulting in
recognition of goodwill.
The acquisition date fair value of the consideration transferred totaled $277.8 million, which
consisted of the following (in thousands):
| Total | ||||
Cash |
$ | 141,161 | ||
Common stock |
136,673 | |||
| $ | 277,834 | |||
The fair value of the 5.6 million common shares issued was determined based on the Company’s
closing share price of $24.40 on the acquisition date.
The cash portion of the acquisition was funded through borrowings consisting of a $75.0 million
short-term loan from KeyBank and a $75 million Term Loan. See Note 19, Borrowings, for further
information.
The Company accounted for the acquisition in accordance with ASC 805 “Business Combinations”,
whereby the purchase price paid was allocated to the tangible and identifiable intangible assets
acquired and liabilities assumed from ICT based on their estimated fair values as of the closing
date. The Company finalized its purchase price allocation during the quarter ended December 31,
2010. The following table summarizes the estimated acquisition date fair values of the assets
acquired and liabilities assumed, the measurement period adjustments that occurred during the
quarter ended December 31, 2010 and the final purchase price allocation as of December 31, 2010 (in
thousands):
| February 2, | ||||||||||||
| 2010 (As | Measurement | February 2, | ||||||||||
| initially | Period | 2010 (As | ||||||||||
| reported) | Adjustments | adjusted) | ||||||||||
Cash and cash equivalents |
$ | 63,987 | $ | - | $ | 63,987 | ||||||
Receivables |
75,890 | - | 75,890 | |||||||||
Income tax receivable |
2,844 | (1,941 | ) | 903 | ||||||||
Prepaid expenses |
4,846 | - | 4,846 | |||||||||
Other current assets |
4,950 | 149 | 5,099 | |||||||||
Total current assets |
152,517 | (1,792 | ) | 150,725 | ||||||||
Property and equipment |
57,910 | - | 57,910 | |||||||||
Goodwill |
90,123 | 7,647 | 97,770 | |||||||||
Intangibles |
60,310 | - | 60,310 | |||||||||
Deferred charges and other assets |
7,978 | (3,965 | ) | 4,013 | ||||||||
Short-term debt |
(10,000 | ) | - | (10,000 | ) | |||||||
Accounts payable |
(12,412 | ) | (168 | ) | (12,580 | ) | ||||||
Accrued employee compensation and benefits |
(23,873 | ) | (1,309 | ) | (25,182 | ) | ||||||
Income taxes payable |
(2,451 | ) | 2,013 | (438 | ) | |||||||
Other accrued expenses and current liabilities |
(10,951 | ) | (464 | ) | (11,415 | ) | ||||||
Total current liabilities |
(59,687 | ) | 72 | (59,615 | ) | |||||||
Deferred grants |
(706 | ) | - | (706 | ) | |||||||
Long-term income tax liabilities |
(5,573 | ) | (19,924 | ) | (25,497 | ) | ||||||
Other long-term liabilities (1) |
(25,038 | ) | 17,962 | (7,076 | ) | |||||||
| $ | 277,834 | $ | - | $ | 277,834 | |||||||
| (1) | Includes primarily long-term deferred tax liabilities. |
70
Table of Contents
The above fair values of assets acquired and liabilities assumed were based on the information that
was available as of the acquisition date to estimate the fair value of assets acquired and
liabilities assumed. The measurement period adjustments relate primarily to unrecognized tax
benefits and related offsets, tax liabilities relating to the determination as of the date of the
ICT acquisition that the Company intended to distribute a majority of the accumulated and
undistributed earnings of the ICT Philippine subsidiary and its direct parent, ICT Group
Netherlands B.V. to SYKES, its ultimate U.S. parent, and certain accrual adjustments related to
labor and benefit costs in Argentina. As of December 31, 2010, the measurement period adjustments
are complete.
Total net assets acquired (liabilities assumed) by operating segment as of February 2, 2010, the
acquisition date, were as follows (in thousands):
| Americas | EMEA | Other | Consolidated | |||||||||||||
Net assets (liabilities) |
$ | 278,703 | $ | (869 | ) | $ | - | $ | 277,834 | |||||||
Fair values are based on management’s estimates and assumptions including variations of the income
approach, the cost approach and the market approach. The following table presents the Company’s
purchased intangibles assets as of February 2, 2010, the acquisition date (in thousands):
| Weighted | |||||||||
| Average | |||||||||
| Amount | Amortization | ||||||||
| Assigned | Period (years) | ||||||||
Customer relationships |
$ | 57,900 | 8 | ||||||
Trade name |
1,000 | 3 | |||||||
Proprietary software |
850 | 2 | |||||||
Non-compete agreements |
560 | 1 | |||||||
| $ | 60,310 | 8 | |||||||
The $97.8 million of goodwill was assigned to the Company’s Americas and EMEA operating segments in
the amount of $97.7 million and $0.1 million, respectively. See Note 6, Goodwill and Intangible
Assets, for impairment of EMEA’s goodwill recorded during the quarter ended September 30, 2010. The
goodwill recognized is attributable primarily to synergies the Company expects to achieve as the
acquisition increases the opportunity for sustained long-term operating margin expansion by
leveraging general and administrative expenses over a larger revenue base. Pursuant to federal
income tax regulations, the ICT acquisition was considered to be a non-taxable transaction;
therefore, no amount of intangibles or goodwill from this acquisition will be deductible for tax
purposes. The fair value of receivables acquired is $75.9 million, with the gross contractual
amount being $76.4 million, of which $0.5 million was not expected to be collected.
After the ICT acquisition in February, 2010, the Company paid off the $10.0 million outstanding
balance plus accrued interest of the ICT short-term debt assumed upon acquisition. The related
interest expense included in “Interest expense” in the accompanying Consolidated Statement of
Operations for the year ended December 31, 2010 was not material.
71
Table of Contents
The amount of ICT’s revenues and net loss since the February 2, 2010 acquisition date, included in
the Company’s Consolidated Statement of Operations for the year ended December 31, 2010, are $362.7
million and $(26.9) million, respectively. The following table presents the unaudited pro forma
combined revenues and net earnings as if ICT had been included in the consolidated results of the
Company for the entire year for the years ended December 31, 2010 and 2009. The pro forma
financial information is not indicative of the results of operations that would have been achieved
if the acquisition and related borrowings had taken place on January 1, 2010 and 2009 (in
thousands):
| Years Ended December 31, | ||||||||
| 2010 | 2009 | |||||||
Revenues |
$ | 1,198,846 | $ | 1,198,737 | ||||
Income from continuing operations, net of taxes |
$ | 42,087 | $ | 46,046 | ||||
Income from continuing operations per common share: |
||||||||
Basic |
$ | 0.90 | $ | 0.99 | ||||
Diluted |
$ | 0.90 | $ | 0.99 | ||||
These amounts have been calculated to reflect the additional depreciation, amortization, and
interest expense that would have been incurred assuming the fair value adjustments and borrowings
occurred on January 1, 2010 and January 1, 2009, together with the consequential tax effects. In
addition, these amounts exclude costs incurred which are directly attributable to the acquisition,
and which do not have a continuing impact on the combined companies operating results. Included in
these costs are severance, advisory and legal costs, net of the consequential tax effects.
Acquisition-related costs of $46.3 million, comprised of $16.3 million in severance costs ($14.9
million in Corporate, $1.2 million in the Americas and $0.2 million in EMEA), $8.9 million in lease
termination and other costs ($7.2 million in Americas and $1.7 million in EMEA), $9.3 million in
transaction and integration costs (all Corporate), and $11.8 million in additional depreciation (in
Americas) related to the increase in fair values of the acquired property and equipment and
amortization of the fair values of the acquired intangibles, are included in “General and
administrative” costs in the accompanying Consolidated Statement of Operations for the year ended
December 31, 2010.
Note 3. Discontinued Operations
On December 16, 2010, the Board of Directors of SYKES, upon the recommendation of its Finance
Committee, approved a plan to sell its Argentina operations, which were operated through two
Argentine subsidiaries: Centro Interaccion Multimedia S.A. (“CIMSA”) and ICT Services of Argentina,
S.A. (“ICT Argentina”), together the “Argentine operations.” CIMSA and ICT Argentina were offshore
contact centers providing contact center services through a total of three centers in Argentina to
clients in the United States and in the Republic of Argentina. The decision to exit Argentina was
made due to surging costs, primarily chronic wage increases, which dramatically reduced the appeal
of the Argentina footprint among the Company’s existing and new global clients and thus the overall
future profitability of the Argentine operations.
On December 13, 2010, the Company entered a stock purchase agreement, and pursuant thereto, on
December 16, 2010, the Company completed the sale of all of the shares of capital stock of CIMSA to
individual purchasers for a nominal price. Pursuant to the CIMSA stock purchase agreement,
immediately prior to closing, the Company made a capital contribution of $9.5 million to CIMSA to
cover a portion of CIMSA’s liabilities. Immediately after closing, the purchasers made a capital
contribution to CIMSA of $1.0 million, and CIMSA repaid a loan of $1.0 million to one of the
Company’s subsidiaries. As this was a stock transaction, the Company has no future obligation with
regard to CIMSA and there are no material post closing obligations.
Additionally, on December 22, 2010, the Company entered into a letter of intent (the “ICT Letter of
Intent”) to sell all of the shares of capital stock of ICT Argentina to a group of individual
purchasers for a nominal purchase price. Pursuant to the ICT Letter of Intent, immediately prior to
closing, the Company funded ICT Argentina with a capital contribution of $3.5 million to cover a
portion of ICT Argentina’s liabilities. On December 24, 2010, the Company entered into the stock
purchase agreement, and pursuant thereto, on December 29, 2010, the Company completed
the sale transaction. As this was a stock transaction, the Company has no future obligation with
regard to ICT Argentina and there are no material post closing obligations.
72
Table of Contents
The loss on the sale of the Argentine operations amounted to $29.9 million pre-tax and $23.5
million after tax at December 31, 2010. The sale of Argentine operations was a taxable transaction
that resulted in a $6.4 million tax benefit. The effective tax rate on the loss on the sale of Argentina of 21.4% differs from the
expected 35.0% statutory rate due to a valuation allowance established on the foreign
deferred tax asset recognized as a result of the sale, partially
offset by a reduction in U.S. taxes related to foreign earnings distributions and the
write off of intercompany receivables resulting in tax benefits of $2.9 million and
$3.5 million, respectively. No adjustments are expected related to the disposal.
As a result of the sale of the Argentine operations, the operating results related to the Argentine
operations have been reflected as discontinued operations in the Consolidated Financial Statements
for all periods presented. This business was historically reported by the Company as part of the
Americas segment.
The results of the Argentine operations included in discontinued operations were as follows (in
thousands):
| Years Ended December 31, | ||||||||||||
| 2010 | 2009 | 2008 | ||||||||||
Revenues |
$ | 40,676 | $ | 32,467 | $ | 36,895 | ||||||
(Loss) from discontinued operations before income taxes |
$ | (6,476 | ) | $ | (2,931 | ) | $ | (2,090 | ) | |||
Income taxes (1) |
- | - | - | |||||||||
(Loss) from discontinued operations, net of income taxes |
$ | (6,476 | ) | $ | (2,931 | ) | $ | (2,090 | ) | |||
(1)
There were no income taxes on the loss from discontinued operations for 2010, 2009
or 2008 as any tax benefit from the losses would be offset by a valuation allowance. |
||
During the quarter ended September 30, 2010, in connection with its periodic review for impairment,
the Company determined that the carrying value of certain long-lived assets, primarily leasehold
improvements in one of its underutilized customer contact management centers in Argentina (a
component of the Americas segment), were no longer recoverable and recorded an impairment charge of
$0.5 million. In addition, during the quarter ended December 31, 2010, in connection with the plan
to close certain of its underutilized customer contact management centers in Argentina (a component
of the Americas segment), the Company recorded an impairment charge of $0.2 million related to
long-lived assets, primarily leasehold improvements. The impairment charges represented the amount
by which the carrying value exceeded the fair value of these assets which could not be redeployed
to other locations and are included in discontinued operations in the accompanying Consolidated
Statement of Operations for 2010.
73
Table of Contents
The following table summarizes information about the Argentine operations for CIMSA (excludes ICT
Argentina which was acquired on February 2, 2010) as of December 31, 2009 (in thousands):
Assets |
||||
Current assets: |
||||
Cash and cash equivalents |
$ | 1,389 | ||
Restricted cash |
25 | |||
Receivables, net |
9,755 | |||
Prepaid expenses |
160 | |||
Other current assets |
1,128 | |||
Total current assets |
12,457 | |||
Property and equipment, net |
3,449 | |||
Intangibles, net |
1,826 | |||
Deferred charges and other assets |
53 | |||
Total assets |
17,785 | |||
Liabilities |
||||
Current liabilities: |
||||
Accounts payable |
(5,444 | ) | ||
Accrued employee compensation and benefits |
(2,580 | ) | ||
Income taxes payable |
(45 | ) | ||
Deferred revenue |
(547 | ) | ||
Other accrued expenses and current liabilities |
(191 | ) | ||
Total current liabilities |
(8,807 | ) | ||
Other long-term liabilities |
(1,946 | ) | ||
Total liabilities |
(10,753 | ) | ||
| $ | 7,032 | |||
Note 4. Costs Associated with Exit or Disposal Activities
Third Quarter 2010 Exit Plan
During the quarter ended September 30, 2010, consistent with the Company’s long-term goals to
manage and optimize capacity utilization, the Company closed or committed to close four customer
contact management centers in the Philippines and consolidated or committed to consolidate leased
space in our Wilmington, Delaware and Newtown, Pennsylvania locations (the “Third Quarter 2010 Exit
Plan”). These actions were in response to the facilities consolidation and capacity rationalization
related to the ICT acquisition, enabling the Company to reduce operating costs by eliminating
redundant space and to optimize capacity utilization rates where overlap exists. There are no
employees affected by the Third Quarter 2010 Exit Plan. These actions were substantially completed
by January 31, 2011.
The major costs incurred as a result of these actions are impairments of long-lived assets
(primarily leasehold improvements) and facility-related costs (primarily consisting of those costs
associated with the real estate leases) estimated at $10.0 million as of December 31, 2010 ($7.2
million as of September 30, 2010), all of which are in the Americas segment. This increase of $2.8
million during the quarter ended December 31, 2010 is primarily due to the change in the sublease
estimates. The Company recorded $3.1 million of the costs associated with the Third Quarter 2010
Exit Plan as non-cash impairment charges included in “Impairment of long-lived assets” in the
accompanying Consolidated Statement of Operations for the year ended December 31, 2010 (see Note 5,
Fair Value, for further information), while approximately $6.9 million represents cash expenditures
for facility-related costs, primarily rent obligations to be paid through the remainder of the
lease terms, the last of which ends in February 2017. Since the Company ceased using certain of
these facilities during the quarter ended September 30, 2010, the Company charged $6.9 million to
“General and administrative” costs in the accompanying Consolidated Statement of Operations related
to the facility-related costs, of which $0.8 million was paid in cash.
74
Table of Contents
The following table summarizes the 2010 accrued liability associated with the Third Quarter 2010
Exit Plan’s exit or disposal activities and related charges for the year ended December 31, 2010:
| Beginning | Ending | |||||||||||||||||||||||||||
| Accrual at | Accrual at | |||||||||||||||||||||||||||
| January 1, | 2010 | Cash | December 31, | Short- | Long- | |||||||||||||||||||||||
| 2010 | Charges | Payments | 2010 | term (1) | term (2) | Total | ||||||||||||||||||||||
Lease obligations and
facility exit costs |
$ | - | $ | 6,944 | $ | (803 | ) | $ | 6,141 | $ | 2,199 | $ | 3,942 | $ | 6,141 | |||||||||||||
| $ | - | $ | 6,944 | $ | (803 | ) | $ | 6,141 | $ | 2,199 | $ | 3,942 | $ | 6,141 | ||||||||||||||
| (1) | Included in “Other accrued expenses and current liabilities” in the accompanying
Consolidated Balance Sheet. |
|
| (2) | Included in “Other long-term liabilities” in the accompanying Consolidated Balance
Sheet. |
Fourth Quarter 2010 Exit Plan
During the quarter ended December 31, 2010, in furtherance of the Company’s long-term goals to
manage and optimize capacity utilization, the Company committed to and closed a customer contact
management center in the United Kingdom and a customer contact management center in Ireland, both
components of the EMEA segment (the “Fourth Quarter 2010 Exit Plan”). These actions further enable
the Company to reduce operating costs by eliminating additional redundant space and to optimize
capacity utilization rates where overlap exists. These actions were substantially completed by
January 31, 2011. None of the revenues from the United Kingdom or Ireland facilities, which were
approximately $1.3 million on an annualized basis, were captured and migrated to other facilities
within the region. Loss from operations of the United Kingdom and Ireland for 2010 were not
material to the consolidated income (loss) from continuing operations; therefore, their results of
operations have not been presented as discontinued operations in the accompanying Consolidated
Statements of Operations.
The major costs incurred as a result of these actions are facility-related costs (primarily
consisting of those costs associated with the real estate leases), impairments of long-lived assets
(primarily leasehold improvements and equipment) and severance related costs totaling $2.1 million.
The Company recorded $0.2 million of the costs associated with the Fourth Quarter 2010 Exit Plan as
non-cash impairment charges included in “Impairment of long-lived assets” in the accompanying
Consolidated Statement of Operations for the year ended December 31, 2010 (see Note 5, Fair Value,
for further information), while approximately $1.7 million will be cash expenditures for
facility-related costs, primarily rent obligations to be paid through the remainder of the lease
terms, the last of which ends in March 2014, and $0.2 million will be cash expenditures for
severance related costs. Since the Company ceased using these facilities during the quarter ended
December 31, 2010, the Company charged $1.9 million to “General and administrative” costs in the
accompanying Consolidated Statement of Operations, of which $0.2 million was paid in cash for
severance-related costs.
The following table summarizes the 2010 accrued liability associated with the Fourth Quarter 2010
Exit Plan’s exit or disposal activities and related charges for the year ended December 31, 2010:
| Beginning | Ending | |||||||||||||||||||||||||||
| Accrual at | Accrual at | |||||||||||||||||||||||||||
| January 1, | 2010 | Cash | December 31, | Short- | Long- | |||||||||||||||||||||||
| 2010 | Charges | Payments | 2010 | term (1) | term (2) | Total | ||||||||||||||||||||||
Lease obligations and
facility exit costs |
$ | - | $ | 1,711 | $ | - | $ | 1,711 | $ | 941 | $ | 770 | $ | 1,711 | ||||||||||||||
Severance and related
costs |
- | 185 | (185 | ) | - | - | - | - | ||||||||||||||||||||
| $ | - | $ | 1,896 | $ | (185 | ) | $ | 1,711 | $ | 941 | $ | 770 | $ | 1,711 | ||||||||||||||
| (1) | Included in “Other accrued expenses and current liabilities” in the accompanying
Consolidated Balance Sheet. |
|
| (2) | Included in “Other long-term liabilities” in the accompanying Consolidated Balance Sheet. |
In accordance with the Company’s 12 to 18 month integration timeline following the ICT acquisition,
the Company expects to continue to evaluate opportunities for further such actions around
facilities consolidation and capacity optimization.
75
Table of Contents
See Note 3, Discontinued Operations, for impairment charges recorded in 2010 related to the
Company’s Argentine operations, which were sold in December 2010.
ICT Restructuring Plan
As of February 2, 2010, the Company assumed the liabilities of ICT, including restructuring
accruals in connection with ICT’s plans to reduce its overall cost structure and adapt to changing
economic conditions by closing various customer contact management centers in Europe and Canada
prior to the end of their existing lease terms (the “ICT Restructuring Plan”). These restructuring
accruals, which related to ongoing lease and other contractual obligations, are expected to be paid
by the end of December 2011.
The following table summarizes the 2010 accrued liability associated with the ICT Restructuring
Plan’s exit or disposal activities for the year ended December 31, 2010:
| Accrual | ||||||||||||||||||||||||||
| assumed | ||||||||||||||||||||||||||
| upon | ||||||||||||||||||||||||||
| Beginning | acquisition | Ending | ||||||||||||||||||||||||
| Accrual at | of ICT on | Accrual at | ||||||||||||||||||||||||
| January 1, | February 2, | Cash | December 31, | Short- | Long- | |||||||||||||||||||||
| 2010 | 2010 | Payments | 2010 | term(1) | term | Total | ||||||||||||||||||||
Lease obligations and
facility exit costs
|
$ | - | $ | 2,197 | $ | (735 | ) | $ | 1,462 | $ | 1,462 | $ | - | $ | 1,462 | |||||||||||
| $ | - | $ | 2,197 | $ | (735 | ) | $ | 1,462 | $ | 1,462 | $ | - | $ | 1,462 | ||||||||||||
| (1) | Included in “Other accrued expenses and current liabilities” in the accompanying Consolidated
Balance Sheet. |
76
Table of Contents
Note 5. Fair Value
The Company’s assets and liabilities measured at fair value on a recurring basis as of December 31,
2010 subject to the requirements of ASC 820 consist of the following (in thousands):
| Fair Value Measurements at December 31, 2010 Using: | |||||||||||||||||
| Quoted Prices | Significant | ||||||||||||||||
| in Active | Other | Significant | |||||||||||||||
| Markets For | Observable | Unobservable | |||||||||||||||
| Balance at | Identical Assets | Inputs | Inputs | ||||||||||||||
| December 31, 2010 | Level (1) | Level (2) | Level (3) | ||||||||||||||
Assets: |
|||||||||||||||||
Money market funds and open-end
mutual funds |
(1) | $ | 6,640 | $ | 6,640 | $ | - | $ | - | ||||||||
Foreign currency forward contracts |
(2) | 1,283 | - | 1,283 | - | ||||||||||||
Foreign currency option contracts |
(2) | 4,951 | - | 4,951 | - | ||||||||||||
Equity investments held in a rabbi trust
for the Deferred Compensation Plan |
(3) | 2,647 | 2,647 | - | - | ||||||||||||
Debt investments held in a rabbi trust
for the Deferred Compensation Plan |
(3) | 789 | 789 | - | - | ||||||||||||
U.S. Treasury Bills held in a rabbi trust for the
former ICT chief executive officer |
(3) | 118 | 118 | - | - | ||||||||||||
Guaranteed investment certificates |
(4) | 53 | - | 53 | - | ||||||||||||
| $ | 16,481 | $ | 10,194 | $ | 6,287 | $ | - | ||||||||||
Liabilities: |
|||||||||||||||||
Foreign currency forward contracts |
(5) | $ | 735 | $ | - | $ | 735 | $ | - | ||||||||
| $ | 735 | $ | - | $ | 735 | $ | - | ||||||||||
| (1) | Included $5.9 million in “Cash and cash equivalents” and $0.7 million in “Deferred charges and other assets” (see Note 15) in the accompanying Consolidated Balance Sheet. | |
| (2) | Included in “Other current assets” in the accompanying Consolidated Balance Sheet. See Note 12. | |
| (3) | Included in “Other current assets” in the accompanying Consolidated Balance Sheet. See Note 13. | |
| (4) | Included in “Deferred charges and other assets” in the accompanying Consolidated Balance Sheet. See Note 15. | |
| (5) | Included in “Other accrued expenses and current liabilities” in the accompanying Consolidated Balance Sheet. See Note 18. |
77
Table of Contents
The Company’s assets and liabilities measured at fair value on a recurring basis as of
December 31, 2009 subject to the requirements of ASC 820 consist of the following (in thousands):
| Fair Value Measurements at December 31, 2009 Using: | ||||||||||||||||
| Quoted Prices | Significant | |||||||||||||||
| in Active | Other | Significant | ||||||||||||||
| Markets For | Observable | Unobservable | ||||||||||||||
| Balance at | Identical Assets | Inputs | Inputs | |||||||||||||
| December 31, 2009 | Level (1) | Level (2) | Level (3) | |||||||||||||
Assets: |
||||||||||||||||
Money market funds and open-end
mutual funds |
(1) | $ | 234,659 | $ | 234,659 | $ | - | $ | - | |||||||
Foreign currency forward contracts |
(2) | 2,866 | - | 2,866 | - | |||||||||||
Equity investments held in a rabbi trust
for the Deferred Compensation Plan |
(2) | 1,677 | 1,677 | - | - | |||||||||||
Debt investments held in a rabbi trust
for the Deferred Compensation Plan |
(2) | 760 | 760 | - | - | |||||||||||
Guaranteed investment certificates |
(3) | 46 | - | 46 | - | |||||||||||
| $ | 240,008 | $ | 237,096 | $ | 2,912 | $ | - | |||||||||
Liabilities: |
||||||||||||||||
Foreign currency forward contracts |
(4) | $ | 326 | $ | - | $ | 326 | $ | - | |||||||
| $ | 326 | $ | - | $ | 326 | $ | - | |||||||||
| (1) | Included $80.3 million in “Restricted cash”, $153.7 million in “Cash and cash equivalents” and $0.7 million in “Deferred charges and other assets” (see Note 15) in the accompanying Consolidated Balance Sheet. | |
| (2) | Included in “Other current assets” in the accompanying Consolidated Balance Sheet. See Note 12. | |
| (3) | Included in “Deferred charges and other assets” in the accompanying Consolidated Balance Sheet. See Note 15. | |
| (4) | Included in “Other accrued expenses and current liabilities” in the accompanying Consolidated Balance Sheet. See Note 18. |
78
Table of Contents
Certain assets, under certain conditions, are measured at fair value on a nonrecurring basis
utilizing Level 3 inputs as described in Note 1, Business, Basis of Presentation and Summary of
Significant Accounting Policies, like those associated with acquired businesses, including goodwill
and other intangible assets and other long-lived assets. For these assets, measurement at fair
value in periods subsequent to their initial recognition would be applicable if one or more of
these assets was determined to be impaired. The Company’s assets measured at fair value on a
nonrecurring basis (no liabilities) as of December 31, 2010 and 2009 (none in 2008) subject to the
requirements of ASC 820 consist of the following (in thousands):
| For the Year | For the Year | ||||||||||||||||
| Ended | Ended | ||||||||||||||||
| December 31, | December 31, | ||||||||||||||||
| Balance at | 2010 | Balance at | 2009 | ||||||||||||||
| December 31, | Total Gains | December 31, | Total Gains | ||||||||||||||
| 2010 | (Losses) | 2009 | (Losses) | ||||||||||||||
Assets: |
|||||||||||||||||
EMEA: |
|||||||||||||||||
Goodwill (1) |
$ | - | $ | (84 | ) | $ | - | $ | - | ||||||||
Intangibles, net (1) |
- | (278 | ) | - | - | ||||||||||||
| - | (362 | ) | - | - | |||||||||||||
Property and equipment, net (1) |
14,614 | (159 | ) | - | - | ||||||||||||
Americas: |
|||||||||||||||||
Goodwill (2) |
- | - | 21,209 | (629 | ) | ||||||||||||
Intangibles, net (2) |
- | - | 2,091 | (1,279 | ) | ||||||||||||
| - | - | 23,300 | (1,908 | ) | |||||||||||||
Investment in SHPS (3) |
- | - | - | (2,089 | ) | ||||||||||||
Property and equipment, net (1) |
99,089 | (3,121 | ) | - | - | ||||||||||||
| $ | 113,703 | $ | (3,642 | ) | $ | 23,300 | $ | (3,997 | ) | ||||||||
| (1) | See Note 1 for additional information regarding the fair value measurement. | |
| (2) | See this Note 5 for additional information regarding the KLA fair value measurement. | |
| (3) | See Note 1 for additional information regarding the SHPS fair value measurement. |
Based on actual and forecasted operating results and deterioration of the related customer
base in the Company’s United Kingdom operations during the quarter ended September 30, 2010, the
EMEA segment recorded a $0.1 million impairment loss on goodwill and a $0.3 million impairment loss
on intangibles (primarily customer relationships) during 2010. In addition, during 2010 in
connection with a plan to close and consolidate facilities within the EMEA segment, as discussed
more fully in Note 4, Costs Associated with Exit or Disposal Activities, the Company recorded an
impairment charge of $0.2 million, related to the impairment of long-lived assets for leasehold
improvements and equipment in certain of its underutilized customer contact management centers in
the United Kingdom and Ireland.
During the quarter ended September 30, 2010 in connection with a plan to close and consolidate
facilities within the Americas segment, as discussed more fully in Note 4, Costs Associated with
Exit or Disposal Activities, the Company recorded an impairment charge of $3.1 million, comprised
of a $2.9 million impairment of long-lived assets for leasehold improvements in certain of its
underutilized customer contact management centers in the Philippines and a $0.2 million impairment
of long-lived assets for leasehold improvements related to a plan to consolidate corporate leased
space in the United States.
On June 30, 2009, the Company committed to a plan to sell or close its Employee Assistance and
Occupational Health operations in Calgary, Alberta, Canada, which was originally acquired on March
1, 2005 when the Company purchased the shares of Kelly, Luthmer & Associates Limited (“KLA”). As a
result of KLA’s actual and forecasted operating results for 2009, deterioration of the KLA customer
base and loss of key employees, the Company
determined to sell or close the Calgary operations on or before December 31, 2009 for less than its
current carrying value. This decline in value was other than temporary, therefore, the Company
recorded a non-cash impairment loss of $1.0 million related to intangible assets (primarily
customer relationships) and $0.6 million related to goodwill included in “Impairment loss on
goodwill and intangibles” during the three months ended June 30, 2009. Subsequently, the Company
decided to close the Calgary operations and wrote off the remaining balance of the
79
Table of Contents
intangible
assets of $0.3 million during 2009. The accompanying Consolidated Statement of Operations for 2009
includes “Impairment loss on goodwill and intangibles” of $1.9 million related to the Calgary
operations (none in 2010 or 2008). In December 2009, the Company accrued $0.7 million related to
the lease obligation net of the underlying sublease amounts, of which $0.3 million and $0.4 million
were included in “Other accrued expenses and current liabilities” and “Other long-term
liabilities”, respectively, in the accompanying Consolidated Balance Sheet as of December 31, 2009.
As of December 31, 2010, $0.3 million and $0.2 million were included in “Other accrued expenses
and current liabilities” and “Other long-term liabilities”, respectively, in the accompanying
Consolidated Balance Sheet. This lease obligation is expected to be paid through the remainder of
the lease term ending July 2012. In addition, in 2009, the Company paid $0.1 million in one-time
employee termination benefits. Income (loss) from operations for KLA for 2009 and 2008 were not
material to the consolidated income from continuing operations; therefore, the results of
operations of KLA have not been presented as discontinued operations in the accompanying
Consolidated Statement of Operations.
Additionally, during 2009 the Company recorded an impairment loss of $2.1 million on its investment
in SHPS.
Note 6. Goodwill and Intangible Assets
The following table presents the Company’s purchased intangible assets (in thousands) as of
December 31, 2010:
| Weighted | ||||||||||||||||
| Average | ||||||||||||||||
| Gross | Accumulated | Net | Amortization | |||||||||||||
| Intangibles | Amortization | Intangibles | Period (years) | |||||||||||||
Customer relationships |
$ | 58,471 | $ | (6,839 | ) | $ | 51,632 | 8 | ||||||||
Trade name |
1,000 | (306 | ) | 694 | 3 | |||||||||||
Non-compete agreements |
560 | (513 | ) | 47 | 1 | |||||||||||
Proprietary software |
850 | (471 | ) | 379 | 2 | |||||||||||
| $ | 60,881 | $ | (8,129 | ) | $ | 52,752 | 8 | |||||||||
The following table presents the Company’s purchased intangible assets (in thousands) as of
December 31, 2009:
| Weighted | ||||||||||||||||
| Average | ||||||||||||||||
| Gross | Accumulated | Net | Amortization | |||||||||||||
| Intangibles | Amortization | Intangibles | Period (years) | |||||||||||||
Customer relationships |
$ | 4,437 | $ | (2,588 | ) | $ | 1,849 | 6 | ||||||||
Trade name |
807 | (565 | ) | 242 | 5 | |||||||||||
Non-compete agreements |
161 | (161 | ) | - | 2 | |||||||||||
Other |
133 | (133 | ) | - | 3 | |||||||||||
| $ | 5,538 | $ | (3,447 | ) | $ | 2,091 | 6 | |||||||||
Amortization expense, related to the purchased intangible assets resulting from acquisitions
(other than goodwill), of
$7.9 million, $0.1 million and $0.2 million for the years
ended December 31, 2010, 2009 and 2008, respectively, is
included in “General and administrative” costs in the
accompanying Consolidated Statements of
Operations.
80
Table of Contents
The Company’s estimated future amortization expense for the five succeeding years relating to the
purchased intangible assets resulting from acquisitions completed prior to December 31, 2010, is as
follows (in thousands):
| Years Ending December 31, | Amount | |||
2011 |
$ | 7,932 | ||
2012 |
7,739 | |||
2013 |
7,341 | |||
2014 |
7,279 | |||
2015 |
7,276 | |||
2016 and thereafter |
15,185 | |||
Changes in goodwill consist of the following (in thousands):
| Accumulated | ||||||||||||
| Impairment | ||||||||||||
| Gross Amount | Losses | Net Amount | ||||||||||
Americas: |
||||||||||||
Balance at January 1, 2010 |
$ | 21,838 | $ | (629 | ) | $ | 21,209 | |||||
Acquisition of ICT (See Note 2) |
97,683 | - | 97,683 | |||||||||
Foreign currency translation |
3,411 | - | 3,411 | |||||||||
Balance at December 31, 2010 |
122,932 | (629 | ) | 122,303 | ||||||||
EMEA: |
||||||||||||
Balance at January 1, 2010 |
- | - | - | |||||||||
Acquisition of ICT (See Note 2) |
87 | (87 | ) | - | ||||||||
Foreign currency translation |
(3 | ) | 3 | - | ||||||||
Balance at December 31, 2010 |
84 | (84 | ) | - | ||||||||
| $ | 123,016 | $ | (713 | ) | $ | 122,303 | ||||||
See Note 5, Fair Value, for additional information regarding the impairment of the Americas
and EMEA goodwill.
Note 7. Concentrations of Credit Risk
Financial instruments that potentially subject the Company to concentrations of credit risk consist
principally of trade receivables. The Company’s credit concentrations are limited due to the wide
variety of customers and markets in which the Company’s services are sold. See Note 12, Financial
Derivatives, for a discussion of the Company’s credit risk relating to financial derivative
instruments, and Note 26, Segments and Geographic Information, for a discussion of the Company’s
customer concentration.
Note 8. Receivables, Net
Receivables, net consist of the following (in thousands):
| December 31, | December 31, | |||||||
| 2010 | 2009 | |||||||
Trade accounts receivable |
$ | 249,719 | $ | 169,049 | ||||
Income taxes receivable |
1,488 | 167 | ||||||
Other |
1,574 | 1,980 | ||||||
| 252,781 | 171,196 | |||||||
Less: Allowance for doubtful accounts |
3,939 | 3,530 | ||||||
| $ | 248,842 | $ | 167,666 | |||||
Allowance for doubtful accounts as a percent of trade receivables |
1.6 | % | 2.1 | % | ||||
81
Table of Contents
Note 9. Prepaid Expenses
Prepaid expenses consist of the following (in thousands):
| December 31, | December 31, | |||||||
| 2010 | 2009 | |||||||
Prepaid maintenance |
$ | 3,195 | $ | 2,688 | ||||
Prepaid rent |
1,935 | 1,470 | ||||||
Inventory, at cost |
1,706 | 1,205 | ||||||
Prepaid insurance |
1,164 | 1,112 | ||||||
Prepaid other |
2,704 | 2,944 | ||||||
| $ | 10,704 | $ | 9,419 | |||||
Note 10. Other Current Assets
Other current assets consist of the following (in thousands):
| December 31, | December 31, | |||||||
| 2010 | 2009 | |||||||
Deferred tax assets (Note 21) |
$ | 7,951 | $ | 3,126 | ||||
Financial derivatives (Note 12) |
6,234 | 2,866 | ||||||
Investments held in rabbi trust (Note 13) |
3,554 | 2,437 | ||||||
Value added tax certificates (Note 11) |
2,030 | - | ||||||
Other current assets |
2,625 | 2,145 | ||||||
| $ | 22,394 | $ | 10,574 | |||||
Note 11. Value Added Tax Receivables
The VAT receivables balance, and the respective location in the accompanying Consolidated Balance
Sheets, is presented below (in thousands):
| December 31, | December 31, | |||||||
| 2010 | 2009 | |||||||
VAT included in: |
||||||||
Receivables, net (Note 8) |
$ | - | $ | 611 | ||||
Other current assets (Note 10) |
2,030 | - | ||||||
Deferred charges and other assets (Note 15) |
5,710 | 5,644 | ||||||
| $ | 7,740 | $ | 6,255 | |||||
During the years ended December 31, 2010, 2009 and 2008, the Company wrote down the VAT receivables
balance by the following amounts, which are reflected in the accompanying Consolidated Statements
of Operations (in thousands):
| Years Ended December 31, | ||||||||||||
| 2010 | 2009 | 2008 | ||||||||||
Write-down of value added tax receivables |
$ | 551 | $ | 536 | $ | 592 | ||||||
Note 12. Financial Derivatives
Cash Flow Hedges – The Company had derivative assets and liabilities relating to outstanding
forward contracts and options, designated as cash flow hedges, as defined under ASC 815, consisting
of Philippine peso (“PHP”) contracts, maturing within 12 months with a notional value of $109.1
million and $39.4 million as of December 31, 2010 and 2009, respectively, and Canadian Dollar
contracts maturing within 12 months with a notional value of $7.2 million and $3.8 million as of
December 31, 2010 and 2009, respectively. These contracts are entered into to protect
82
Table of Contents
against the
risk that the eventual cash flows resulting from such transactions will be adversely affected by
changes in exchange rates.
The Company had a total of $2.1 million and $2.0 million of deferred gains (losses), net of taxes
of ($0.5) million and $0.8 million, on these derivative instruments as of December 31, 2010 and
2009, respectively, recorded in AOCI in the accompanying Consolidated Balance Sheets. The deferred
gains expected to be reclassified to “Revenues” from AOCI during the next twelve months is $6.0
million. However, this amount and other future reclassifications from AOCI will fluctuate with
movements in the underlying market price of the forward contracts.
Net Investment Hedges — During 2010, the Company entered into foreign exchange forward contracts to
hedge its net investment in a foreign operation, as defined under ASC 815, with an aggregate
notional value of $26.1 million. These hedges settled in 2010 and the Company recorded deferred
(losses) of $(2.6) million, net of taxes, for 2010 as a currency translation adjustment, a
component of AOCI, offsetting foreign exchange losses attributable to the translation of the net
investment. The Company did not hedge net investments in foreign operations during 2009.
Other Hedges – The Company also periodically enters into foreign currency hedge contracts that are
not designated as hedges as defined under ASC 815. The purpose of these derivative instruments is
to protect our interests against adverse foreign currency moves pertaining to intercompany
receivables and payables, and other assets and liabilities that are denominated in currencies other
than our subsidiaries functional currencies. These contracts generally do not exceed 90 days in
duration.
The Company had the following outstanding foreign currency forward contracts and options (in
thousands):
| As of December 31, 2010 | As of December 31, 2009 | |||||||||
| Settle Through | ||||||||||
| Contract Type | Foreign Currency | Currency Denomination | Date | Foreign Currency | Currency Denomination | |||||
Cash flow hedge: (1) |
||||||||||
Forwards
|
U.S. Dollars 28,000 | Philippine Pesos 1,245,215 | September 2011 | U.S. Dollars 39,400 | Philippine Pesos 1,970,189 | |||||
Options
|
U.S. Dollars 81,100 | Philippine Pesos 3,685,575 | December 2011 | |||||||
Forwards
|
U.S. Dollars 7,200 | Canadian Dollars 7,548 | December 2011 | U.S. Dollars 3,800 | Canadian Dollars 4,050 | |||||
Not designated as hedge: (2) |
||||||||||
Forwards
|
U.S. Dollars 13,193 | Euros 10,000 | February 2011 | |||||||
Forwards
|
Philippine Pesos 436,200 | U.S. Dollars 10,000 | February 2011 | |||||||
Forwards
|
British Pound 9,000 | U.S. Dollars 14,283 | February 2011 | |||||||
Forwards
|
Australian Dollar 15,500 | U.S. Dollars 15,294 | February 2011 | |||||||
Forwards
|
Danish Krone 7,457 | Euros 1,001 | February 2011 | |||||||
Forwards
|
Romanian Leu 7,547 | Euros 1,750 | January 2011 | |||||||
Forwards
|
Egyptian Pound 7,870 | Euros 1,000 | January 2011 | |||||||
Forwards
|
Canadian Dollars 12,500 | Euros 8,066 | ||||||||
| (1) | Cash flow hedge as defined under ASC 815. Purpose is to protect against the risk that
eventual cash flows resulting from such transactions will be adversely affected by changes
in exchange rates. |
|
| (2) | Foreign currency hedge contract not designated as hedges as defined under ASC 815.
Purpose is to reduce the effects on the Company’s operating results and cash flows from
fluctuations caused by volatility in currency exchange rates, primarily related to
intercompany loan payments and cash held in non-functional currencies. |
As of December 31, 2010, the maximum amount of loss due to credit risk that, based on the gross
fair value of the financial instruments, the Company would incur if parties to the financial
instruments that make up the concentration failed to perform according to the terms of the
contracts is $6.2 million.
In January 2011, to hedge intercompany forecasted cash outflows, the Company
entered into additional forward and option contracts that are designated as
hedges, as defined under ASC 815, to sell 1.4 billion Philippine Pesos versus the
U.S. Dollar for maturities through December 2011. Since December 31, 2010, the
Company entered into additional foreign currency forward contracts against the
following currencies: Philippine Peso, Canadian Dollar, Eurodollar, Danish Krone, Great British Pound,
Egyptian Pound, Australian Dollar and Romanian Leu. These contracts, with notional
amounts of $78.0 million, generally do not exceed 90 days in duration. See Note
1, Business, Basis of Presentation and Summary of Significant Accounting Policies,
for further information on the Company’s purpose for entering into these
derivatives and its overall risk management strategies.
83
Table of Contents
The following tables present the fair value of the Company’s derivative instruments as of December
31, 2010 and 2009 included in the accompanying Consolidated Balance Sheets (in thousands):
| Derivative Assets | ||||||||||||||||
| December 31, 2010 | December 31, 2009 | |||||||||||||||
| Balance Sheet | Balance Sheet | |||||||||||||||
| Location | Fair Value | Location | Fair Value | |||||||||||||
Derivatives designated as cash
flow hedging instruments under
ASC 815: |
||||||||||||||||
Foreign currency forward contracts |
Other current assets |
$ | 1,009 | Other current assets |
$ | 2,866 | ||||||||||
Foreign currency options |
Other current assets |
4,951 | - | - | ||||||||||||
| 5,960 | 2,866 | |||||||||||||||
Derivatives not designated as
hedging instruments under ASC
815: |
||||||||||||||||
Foreign currency forward contracts |
Other current assets |
274 | - | - | ||||||||||||
Total derivative assets |
$ | 6,234 | $ | 2,866 | ||||||||||||
| Derivative Liabilities | ||||||||||||||||
| December 31, 2010 | December 31, 2009 | |||||||||||||||
| Balance Sheet | Balance Sheet | |||||||||||||||
| Location | Fair Value | Location | Fair Value | |||||||||||||
Derivatives designated as cash
flow hedging instruments under
ASC 815: |
||||||||||||||||
Foreign currency forward contracts |
Other accrued expenses and current liabilities |
$ | 27 | Other accrued expenses and current liabilities |
$ | - | ||||||||||
| 27 | - | |||||||||||||||
Derivatives not designated as
hedging instruments under ASC
815: |
||||||||||||||||
Foreign currency forward contracts |
Other accrued expenses and current liabilities |
708 | Other accrued expenses and current liabilities |
326 | ||||||||||||
Total derivative liabilities |
$ | 735 | $ | 326 | ||||||||||||
84
Table of Contents
The following tables present the effect of the Company’s derivative instruments for the years ended
December 31, 2010 and 2009 in the accompanying Consolidated Financial Statements (in thousands):
| Statement of | Gain (Loss) Reclassified From | |||||||||||||||||||||||||||||||||||||||
| Gain (Loss) Recognized in AOCI | Operations | Accumulated AOCI Into Income | Gain (Loss) Recognized in Income | |||||||||||||||||||||||||||||||||||||
| on Derivatives (Effective Portion) | Location | (Effective Portion) | on Derivatives (Ineffective Portion) | |||||||||||||||||||||||||||||||||||||
| December 31, | December 31, | December 31, | ||||||||||||||||||||||||||||||||||||||
| 2010 | 2009 | 2008 | 2010 | 2009 | 2008 | 2010 | 2009 | 2008 | ||||||||||||||||||||||||||||||||
Derivatives designated as cash
flow hedging instruments under
ASC 815: |
||||||||||||||||||||||||||||||||||||||||
Foreign currency forward
contracts |
$ | 2,586 | $ | 5,082 | $ | (21,247 | ) | Revenues | $ | 4,515 | $ | (9,257 | ) | $ | (1,896 | ) | $ | - | $ | - | $ | (494 | ) | |||||||||||||||||
Foreign currency option contracts |
2,350 | - | - | Revenues | 658 | - | - | - | - | - | ||||||||||||||||||||||||||||||
Total cash flow hedges |
4,936 | 5,082 | (21,247 | ) | 5,173 | (9,257 | ) | (1,896 | ) | - | - | (494 | ) | |||||||||||||||||||||||||||
Derivatives designated as a net
investment hedge under ASC
815 - Foreign currency forward
contracts |
(3,955 | ) | - | - | - | - | - | - | - | - | ||||||||||||||||||||||||||||||
| $ | 981 | $ | 5,082 | $ | (21,247 | ) | $ | 5,173 | $ | (9,257 | ) | $ | (1,896 | ) | $ | - | $ | - | $ | (494 | ) | |||||||||||||||||||
| Gain (Loss) Recognized in Income on | ||||||||||||||||
| Statement of | Derivatives | |||||||||||||||
| Operations | December 31, | |||||||||||||||
| Location | 2010 | 2009 | 2008 | |||||||||||||
Derivatives not designated as hedging
instruments under ASC 815: |
||||||||||||||||
Foreign currency forward contracts |
Other income and (expense) |
$ | (4,717 | ) | $ | (1,928 | ) | $ | (267 | ) | ||||||
Foreign currency forward contracts |
Revenues | - | (53 | ) | 6 | |||||||||||
| $ | (4,717 | ) | $ | (1,981 | ) | $ | (261 | ) | ||||||||
Note 13. Investments Held in Rabbi Trusts
The Company’s investments held in rabbi trusts, classified as trading securities and included in
“Other current assets” in the accompanying Consolidated Balance Sheets, at fair value, consist of
the following (in thousands):
| December 31, 2010 | December 31, 2009 | |||||||||||||||
| Cost | Fair Value | Cost | Fair Value | |||||||||||||
Mutual funds |
$ | 3,058 | $ | 3,436 | $ | 2,454 | $ | 2,437 | ||||||||
U.S. Treasury Bills |
118 | 118 | - | - | ||||||||||||
| $ | 3,176 | $ | 3,554 | $ | 2,454 | $ | 2,437 | |||||||||
85
Table of Contents
The mutual funds held in the rabbi trusts were 77% equity-based and 23% debt-based at December 31,
2010. Investment income, included in “Other income (expense)” in the accompanying Consolidated
Statements of Operations for the years ended December 31, 2010, 2009 and 2008 consists of the
following (in thousands):
| Years Ended December 31, | ||||||||||||
| 2010 | 2009 | 2008 | ||||||||||
Gross realized gains from sale of trading securities |
$ | 54 | $ | 41 | $ | 2 | ||||||
Gross realized losses from sale of trading securities |
(5 | ) | (21 | ) | (13 | ) | ||||||
Dividend and interest income |
37 | 46 | 44 | |||||||||
Net unrealized holding gains (losses) |
313 | 341 | (660 | ) | ||||||||
Net investment income (losses) |
$ | 399 | $ | 407 | $ | (627 | ) | |||||
Note 14. Property and Equipment
Property and equipment consist of the following (in thousands):
| December 31, | December 31, | |||||||
| 2010 | 2009 | |||||||
Land |
$ | 4,381 | $ | 4,323 | ||||
Buildings and leasehold improvements |
79,504 | 62,832 | ||||||
Equipment, furniture and fixtures |
249,319 | 204,931 | ||||||
Capitalized software development costs |
3,005 | 3,010 | ||||||
Transportation equipment |
764 | 774 | ||||||
Construction in progress |
1,911 | 748 | ||||||
| 338,884 | 276,618 | |||||||
Less accumulated depreciation |
225,181 | 196,354 | ||||||
| $ | 113,703 | $ | 80,264 | |||||
In September 2009, the building and contents of one of the Company’s customer contact management
centers located in Marikina City, the Philippines (acquired as part of the ICT acquisition) was
severely damaged by flooding from Typhoon Ondoy. Upon settlement with the insurer in November
2010, the Company recognized a net gain of $2.0 million (none in 2009). The damaged property and
equipment had been written down by ICT prior to the ICT acquisition in February 2010.
Note 15. Deferred Charges and Other Assets
Deferred charges and other assets consist of the following (in thousands):
| December 31, | December 31, | |||||||
| 2010 | 2009 | |||||||
Non-current deferred tax assets (Note 21) |
$ | 19,564 | $ | 11,570 | ||||
Non-current value added tax certificates (Note 11) |
5,710 | 5,644 | ||||||
Deposits |
5,118 | 1,158 | ||||||
Restricted cash (Note 23) |
436 | 466 | ||||||
Other |
2,726 | 2,215 | ||||||
| $ | 33,554 | $ | 21,053 | |||||
86
Table of Contents
Note 16. Accrued Employee Compensation and Benefits
Accrued employee compensation and benefits consist of the following (in thousands):
| December 31, | December 31, | |||||||
| 2010 | 2009 | |||||||
Accrued compensation |
$ | 27,063 | $ | 18,872 | ||||
Accrued vacation |
13,700 | 11,913 | ||||||
Accrued bonus and commissions |
11,227 | 9,312 | ||||||
Accrued employment taxes |
10,061 | 8,519 | ||||||
Other |
3,216 | 2,511 | ||||||
| $ | 65,267 | $ | 51,127 | |||||
Note 17. Deferred Revenue
The components of deferred revenue consist of the following (in thousands):
| December 31, | December 31, | |||||||
| 2010 | 2009 | |||||||
Future service |
$ | 23,919 | $ | 25,027 | ||||
Estimated potential penalties and holdbacks |
7,336 | 5,056 | ||||||
| $ | 31,255 | $ | 30,083 | |||||
Note 18. Other Accrued Expenses and Current Liabilities
Other accrued expenses and current liabilities consist of the following (in thousands):
| December 31, | December 31, | |||||||
| 2010 | 2009 | |||||||
Accrued restructuring (Note 4) |
$ | 4,602 | $ | - | ||||
Accrued legal and professional fees |
3,160 | 4,304 | ||||||
Accrued telephone charges |
2,266 | 535 | ||||||
Accrued roadside assistance claim costs |
1,980 | 2,207 | ||||||
Accrued rent |
1,053 | 920 | ||||||
Forward contracts (Note 12) |
735 | 326 | ||||||
Other |
11,825 | 4,397 | ||||||
| $ | 25,621 | $ | 12,689 | |||||
Note 19. Borrowings
Borrowings consist of the following (in thousands):
| December 31, | December 31, | |||||||
| 2010 | 2009 | |||||||
Short-term loan due March 31, 2010 |
$ | - | $ | 75,000 | ||||
Term Loan due in varying installments through February 1, 2013 |
- | - | ||||||
Revolving credit facility matures on February 1, 2013 |
- | - | ||||||
Total |
- | 75,000 | ||||||
Less current portion |
- | (75,000 | ) | |||||
Total long-term debt |
$ | - | $ | - | ||||
On February 2, 2010, the Company entered into a Credit Agreement (the “Credit Agreement”) with a
group of lenders and KeyBank National Association, as Lead Arranger, Sole Book Runner and
Administrative Agent (“KeyBank”). The Credit Agreement provides for a $75 million term loan (the
“Term Loan”) and a $75 million revolving credit facility, the amount which is subject to certain
borrowing limitations and includes certain customary
87
Table of Contents
financial and restrictive covenants. The
Company drew down the full $75 million Term Loan on February 2, 2010 in connection with the
acquisition of ICT on such date. See Note 2, Acquisition of ICT, for further information. During
the three months ended September 30, 2010, the Company paid off the remaining outstanding Term Loan
balance, earlier than the scheduled maturity, in the amount of $52.5 million, plus accrued
interest. The Term Loan is no longer available for borrowings.
The $75 million revolving credit facility provided under the Credit Agreement replaces the previous
senior revolving credit facility under a credit agreement, dated March 30, 2009, which agreement
was terminated simultaneous with entering into the Credit Agreement. The $75 million revolving
credit facility, which includes a $40 million multi-currency sub-facility, a $10 million swingline
sub-facility and a $5 million letter of credit sub-facility, may be used for general corporate
purposes including strategic acquisitions, share repurchases, working capital support, and letters
of credit, subject to certain limitations. The Company is not currently aware of any inability of
its lenders to provide access to the full commitment of funds that exist under the revolving credit
facility, if necessary. However, due to recent economic conditions and the volatile business
climate facing financial institutions, there can be no assurance that such facility will be
available to the Company, even though it is a binding commitment of the financial institutions.
Borrowings under the Credit Agreement bear interest at either LIBOR or the base rate plus, in each
case, an applicable margin based on the Company’s leverage ratio. The applicable interest rate is
determined quarterly based on the Company’s leverage ratio at such time. The base rate is a rate
per annum equal to the greatest of (i) the rate of interest established by KeyBank, from time to
time, as its “prime rate”; (ii) the Federal Funds effective rate in effect from time to time, plus
1/2 of 1% per annum; and (iii) the then-applicable LIBOR rate for one month interest periods, plus
1.00%. Swingline loans bear interest only at the base rate plus the base rate margin. In addition,
the Company is required to pay certain customary fees, including a commitment fee of up to 0.75%,
which is due quarterly in arrears and calculated on the average unused amount of the revolving
credit facility.
The Company paid an underwriting fee of $3.0 million for the Credit Agreement, which is deferred
and amortized over the term of the loan. The related interest expense and amortization of deferred
loan fees on the Credit Agreement of $3.6 million are included in “Interest expense” in the
accompanying Consolidated Statement of Operations for the year ended December 31, 2010 (none in
2009). The $75 million Term Loan had a weighted average interest rate of 3.93% for the period it
was outstanding in 2010.
The Credit Agreement is guaranteed by all of the Company’s existing and future direct and indirect
material U.S. subsidiaries and secured by a pledge of 100% of the non-voting and 65% of the voting
capital stock of all the direct foreign subsidiaries of the Company and those of the guarantors.
In December, 2009, Sykes (Bermuda) Holdings Limited, a Bermuda exempted company (“Sykes Bermuda”)
which is an indirect wholly-owned subsidiary of the Company, entered into a credit agreement with
KeyBank (the “Bermuda Credit Agreement”). The Bermuda Credit Agreement provided for a $75 million
short-term loan to Sykes Bermuda with a maturity date of March 31, 2010. Sykes Bermuda drew down
the full $75 million on December 11, 2009, which is included in “Short-term debt” in the
accompanying Consolidated Balance Sheet as of December 31, 2009. The Bermuda Credit Agreement
required that Sykes Bermuda and its direct subsidiaries maintain cash and cash equivalents of at
least $80 million at all times, which amount is included in “Restricted cash” in the accompanying
Consolidated Balance Sheet as of December 31, 2009. Interest was charged on outstanding amounts,
at the option of Sykes Bermuda, at either a Eurodollar Rate (as defined in the Bermuda Credit
Agreement) or a Base Rate (as defined in the Bermuda Credit Agreement) plus, in each case, an
applicable margin specified in the Bermuda Credit Agreement. The underwriting fee paid of $0.8
million was deferred and amortized over the term of the loan. Sykes Bermuda repaid the entire
outstanding amount plus accrued interest on March 31, 2010. The related
interest expense and amortization of deferred loan fees of $1.4 million and $0.3 million are
included in “Interest expense” in the accompanying Consolidated Statement of Operations for 2010
and 2009 (none in 2008).
Simultaneous with the execution and delivery of the Bermuda Credit Agreement, the Company entered
into a Guaranty of Payment agreement with KeyBank, pursuant to which the obligations of Sykes
Bermuda under the Bermuda Credit Agreement were guaranteed by the Company.
Also, simultaneous with the execution and delivery of the Bermuda Credit Agreement, the Company,
KeyBank and the other lenders that are a party thereto entered into a First Amendment Agreement,
amending the credit agreement, dated March 30, 2009, between the Company, KeyBank and the other
lenders that are a party thereto. The First Amendment Agreement amended the terms of the credit
agreement to permit the loan to Sykes Bermuda and the
88
Table of Contents
Company’s guaranty of that loan. As of
December 31, 2009, there were no outstanding balances and there were no borrowings in either 2010
or 2009 under the credit agreement dated March 30, 2009, as amended. As previously mentioned, this
credit agreement, dated March 30, 2009, was terminated on February 2, 2010 simultaneous with
entering into the Credit Agreement. Unamortized deferred loan fees of $0.2 million were written off
during the three months ended March 31, 2010. Interest expense for 2009 includes $0.1 million
related to this terminated credit agreement.
Note 20. Accumulated Other Comprehensive Income (Loss)
The Company presents data in the Consolidated Statements of Changes in Shareholders’ Equity in
accordance with ASC 220 (“ASC 220”) “Comprehensive Income”. ASC 220 establishes rules for the
reporting of comprehensive income (loss) and its components. The components of accumulated other
comprehensive income (loss) consist of the following (in thousands):
| Unrealized | Unrealized | Unrealized | ||||||||||||||||||||||
| Foreign | Unrealized | Actuarial Gain | Gain (Loss) on | Gain (Loss) on | ||||||||||||||||||||
| Currency | (Loss) on Net | (Loss) Related | Cash Flow | Post | ||||||||||||||||||||
| Translation | Investment | to Pension | Hedging | Retirement | ||||||||||||||||||||
| Adjustment | Hedge | Liability | Instruments | Obligation | Total | |||||||||||||||||||
Balance at January 1, 2008 |
$ | 30,292 | $ | - | $ | 2,165 | $ | 5,000 | $ | - | $ | 37,457 | ||||||||||||
Pre-tax amount |
(34,451 | ) | - | 48 | (21,247 | ) | - | (55,650 | ) | |||||||||||||||
Tax (provision) benefit |
- | - | (479 | ) | 5,664 | - | 5,185 | |||||||||||||||||
Reclassification to net income |
(4 | ) | - | (61 | ) | 2,390 | - | 2,325 | ||||||||||||||||
Foreign currency translation |
(73 | ) | - | (286 | ) | 359 | - | - | ||||||||||||||||
Balance at December 31, 2008 |
(4,236 | ) | - | 1,387 | (7,834 | ) | - | (10,683 | ) | |||||||||||||||
Pre-tax amount |
8,360 | - | (279 | ) | 5,082 | 307 | 13,470 | |||||||||||||||||
Tax (provision) benefit |
- | - | 121 | (4,255 | ) | - | (4,134 | ) | ||||||||||||||||
Reclassification to net income |
3 | - | (63 | ) | 9,257 | (31 | ) | 9,166 | ||||||||||||||||
Foreign currency translation |
190 | - | 41 | (231 | ) | - | - | |||||||||||||||||
Balance at December 31, 2009 |
4,317 | - | 1,207 | 2,019 | 276 | 7,819 | ||||||||||||||||||
Pre-tax amount |
9,790 | (3,955 | ) | (31 | ) | 4,936 | 104 | 10,844 | ||||||||||||||||
Tax benefit |
- | 1,390 | - | 321 | - | 1,711 | ||||||||||||||||||
Reclassification to net loss |
(7 | ) | - | (52 | ) | (5,173 | ) | (34 | ) | (5,266 | ) | |||||||||||||
Foreign currency translation |
(108 | ) | - | 65 | 43 | - | - | |||||||||||||||||
Balance at December 31, 2010 |
$ | 13,992 | $ | (2,565 | ) | $ | 1,189 | $ | 2,146 | $ | 346 | $ | 15,108 | |||||||||||
Except as discussed in Note 21, Income Taxes, earnings associated with the Company’s investments in
its subsidiaries are considered to be permanently invested and no provision for income taxes on
those earnings or translation adjustments has been provided.
Note 21. Income Taxes
The income (loss) from continuing operations before income taxes includes the following components
(in thousands):
| Years Ended December 31, | ||||||||||||
| 2010 | 2009 | 2008 | ||||||||||
Domestic (U.S., state and local) |
$ | (24,662 | ) | $ | 439 | $ | (6,406 | ) | ||||
Foreign |
46,557 | 71,821 | 90,478 | |||||||||
Total income from continuing operations before income taxes |
$ | 21,895 | $ | 72,260 | $ | 84,072 | ||||||
89
Table of Contents
Significant components of the income tax provision are as follows (in thousands):
| Years Ended December 31, | ||||||||||||
| 2010 | 2009 | 2008 | ||||||||||
Current: |
||||||||||||
U.S. federal |
$ | 4,836 | $ | 1,406 | $ | (323 | ) | |||||
State and local |
(24 | ) | - | - | ||||||||
Foreign |
14,527 | 14,547 | 20,390 | |||||||||
Total current provision for income taxes |
19,339 | 15,953 | 20,067 | |||||||||
Deferred: |
||||||||||||
U.S. federal |
(15,160 | ) | 11,791 | 3,600 | ||||||||
State and local |
(314 | ) | 158 | 357 | ||||||||
Foreign |
(1,668 | ) | (1,784 | ) | (2,603 | ) | ||||||
Total deferred provision (benefit) for income taxes |
(17,142 | ) | 10,165 | 1,354 | ||||||||
Total provision for income taxes |
$ | 2,197 | $ | 26,118 | $ | 21,421 | ||||||
The temporary differences that give rise to significant portions of the deferred income tax provision
(benefit) are as
follows (in thousands):
| Years Ended December 31, | ||||||||||||
| 2010 | 2009 | 2008 | ||||||||||
Accrued expenses |
$ | (25,358 | ) | $ | 14,831 | $ | (932 | ) | ||||
Net operating loss and tax credit carryforwards |
9,083 | 2,188 | 4,093 | |||||||||
Depreciation and amortization |
(3,433 | ) | (863 | ) | 1,750 | |||||||
Deferred revenue |
(580 | ) | (722 | ) | (2,087 | ) | ||||||
Deferred statutory income |
- | 474 | 2,252 | |||||||||
Valuation allowance |
3,103 | (5,807 | ) | (4,087 | ) | |||||||
Other |
43 | 64 | 365 | |||||||||
Total deferred provision (benefit) for income taxes |
$ | (17,142 | ) | $ | 10,165 | $ | 1,354 | |||||
The reconciliation of the income tax provision computed at the U.S. federal statutory tax rate to
the Company’s effective income tax provision is as follows (in thousands):
| Years Ended December 31, | ||||||||||||
| 2010 | 2009 | 2008 | ||||||||||
Tax at U.S. federal statutory tax rate |
$ | 7,663 | $ | 25,271 | $ | 29,370 | ||||||
State income taxes, net of federal tax benefit |
(333 | ) | 158 | 357 | ||||||||
Tax holidays |
(6,798 | ) | (13,841 | ) | (10,895 | ) | ||||||
Change in valuation allowance, net of related adjustments |
5,253 | (5,274 | ) | 1,280 | ||||||||
Foreign rate differential |
(3,554 | ) | (7,573 | ) | (9,144 | ) | ||||||
Changes in uncertain tax positions |
(3,830 | ) | 594 | (2,261 | ) | |||||||
Permanent differences |
985 | 6,908 | 5,712 | |||||||||
Foreign withholding and other taxes |
3,207 | 4,048 | 7,545 | |||||||||
Change of assertion related to foreign earnings distribution |
(1,865 | ) | 16,281 | - | ||||||||
Tax credits |
1,469 | (454 | ) | (1,477 | ) | |||||||
Other |
- | - | 934 | |||||||||
Total provision for income taxes |
$ | 2,197 | $ | 26,118 | $ | 21,421 | ||||||
The Company changed its intent to distribute current earnings from various foreign operations to
their foreign parents to take advantage of the December 2010 extension of tax provisions of
Internal Revenue Code Section 954(c)(6). These tax provisions permit continued tax deferral on
such distributions that would otherwise be taxable immediately in the United States. While the
distributions are not taxable in the United States, related withholding taxes of $1.7 million are
included in the provision for income taxes in the Consolidated Statement of Operations for 2010.
90
Table of Contents
In addition, the Company changed its intent to distribute all of the current year and future years’
earnings of a non-U.S. subsidiary to its foreign parent. Withholding taxes of $0.9 million related
to this distribution are included in the provision for income taxes in the Consolidated Statement
of Operation for 2010.
In connection with the Company’s borrowing of a $75 million Term Loan on February 2, 2010, related
to the ICT acquisition, the Company was deemed to have changed its intent regarding the permanent
reinvestment of $85.0 million of foreign subsidiaries’ accumulated and undistributed earnings.
Accordingly, a net deferred tax provision of $14.7 million was recorded in 2009. Of the $85.0
million change of intent, $50.0 million was distributed in 2010. Of the $14.7 million net deferred
tax liability originally recorded, $6.4 million remains outstanding at December 31, 2010. The
remaining $35.0 million of the $85.0 million change of intent was distributed in January 2011.
As of February 2, 2010, the date of the ICT acquisition, the Company determined that it intended to
distribute 2.3 billion PHP (approximately $50.0 million USD) of the accumulated and undistributed
earnings of an ICT foreign subsidiary to its ultimate U.S. parent. Tax adjustments required to
reflect this intent have been recorded as part of the opening balance sheet for ICT. See Note 2,
Acquisition of ICT, for further information.
A provision for income taxes has not been made for the remaining balance of undistributed earnings
of foreign subsidiaries of approximately $302.8 million at December 31, 2010, as the earnings are
permanently reinvested in foreign business operations. Determination of any unrecognized deferred
tax liability for temporary differences related to investments in foreign subsidiaries that are
essentially permanent in nature is not practicable.
The Company has been granted tax holidays in the Philippines, Costa Rica, El Salvador and India.
The tax holidays have various expiration dates ranging from 2011 through 2018. In some cases, the
tax holidays expire without possibility of renewal. In other cases, we expect to renew these tax
holidays, but there are no assurances from the respective foreign governments that they will renew
them. This could potentially result in future adverse tax consequences. The Company’s tax holidays
decreased the provision for income taxes by $6.8 million ($0.15 per diluted share), $13.8 million
($0.34 per diluted share) and $10.9 million ($0.27 per diluted share) for the years ended December
31, 2010, 2009 and 2008, respectively.
Deferred income taxes reflect the net tax effects of temporary differences between the carrying
amount of assets and liabilities for financial reporting purposes and the amounts used for income
taxes. The temporary differences that give rise to significant portions of the deferred tax assets
and liabilities are presented below (in thousands):
| December 31, | ||||||||||
| 2010 | 2009 | |||||||||
Deferred tax assets: |
||||||||||
Accrued expenses |
$ | 22,707 | $ | 2,929 | ||||||
Net operating loss and tax credit carryforwards |
83,914 | 44,444 | ||||||||
Depreciation and amortization |
3,346 | 5,553 | ||||||||
Deferred revenue |
4,161 | 2,316 | ||||||||
Valuation allowance |
(60,091 | ) | (32,126 | ) | ||||||
Other |
— | 6 | ||||||||
| 54,037 | 23,122 | |||||||||
Deferred tax liabilities: |
||||||||||
Accrued liabilities |
(16,691 | ) | (10,178 | ) | ||||||
Depreciation and amortization |
(18,221 | ) | (5,790 | ) | ||||||
Deferred statutory income |
(836 | ) | (1,279 | ) | ||||||
Other |
(24 | ) | (452 | ) | ||||||
| (35,772 | ) | (17,699 | ) | |||||||
Net deferred tax assets |
$ | 18,265 | $ | 5,423 | ||||||
91
Table of Contents
| December 31, | ||||||||
| 2010 | 2009 | |||||||
Classified as follows: |
||||||||
Other current assets (Note 10) |
$ | 7,951 | $ | 3,126 | ||||
Deferred charges and other assets (Note 15) |
19,564 | 11,570 | ||||||
Current deferred income tax liabilities |
(3,347 | ) | (6,453 | ) | ||||
Other long-term liabilities |
(5,903 | ) | (2,820 | ) | ||||
Net deferred tax assets |
$ | 18,265 | $ | 5,423 | ||||
In 2010, the Company’s valuation allowance increased by $28.0 million, primarily related to the
acquisition of ICT and current year net operating losses where the Company recorded additional
valuation allowances on foreign subsidiaries related to the future use of their current year net
operating losses.
There are approximately $366.0 million of income tax loss carryforwards at December 31, 2010 with
varying expiration dates, approximately $200.0 million relating to foreign operations, $21.2
million relating to U.S. federal operations, and $144.8 million relating to U.S. state operations.
For U.S. federal purposes, a net operating loss carry forward of approximately $21.2 million as
well as $18.6 million of tax credits are available at December 31, 2010 for carryforward, with the
latest expiration date ending December 31, 2026. Of this $21.2 million carry forward, $10.1 million
is limited as it relates to net operating loss carryforwards of a domestic subsidiary acquired in
prior years and the remaining $11.1 million, attributable to the acquisition of ICT, is limited
under Internal Revenue Code Section 382. Regarding the U.S. state operations, of the $144.8
million, no benefit has been recognized for $91.0 million as it is more likely than not that these
losses will expire without realization of tax benefits. With respect to foreign operations, $159.0
million of the net operating loss carryforwards have an indefinite expiration date and the
remaining $41.0 million net operating loss carryforwards have varying expiration dates through
December 2019.
As of December 31, 2010, the Company had $21.0 million of unrecognized tax benefits, a net increase
of $17.2 million from $3.8 million as of December 31, 2009. This increase results primarily from
the acquisition of ICT, partially offset by the expiration of statutes of limitations on certain
foreign subsidiaries and for the resolution of a tax audit in the current year. Had the Company
recognized these tax benefits, approximately $21.0 million and $3.1 million and the related
interest and penalties would favorably impact the effective tax rate in 2010 and 2009,
respectively. The Company believes it is reasonably possible that our unrecognized tax benefits
will decrease or be recognized in the next twelve months by up to $2.9 million due to expiration of
statutes of limitations, audit or appeal resolution in various tax jurisdictions.
The Company recognizes interest and penalties related to unrecognized tax benefits in the provision
for income taxes. The Company had $10.2 million and $2.2 million accrued for interest and penalties
as of December 31, 2010 and 2009, respectively. Of the accrued interest and penalties at December
31, 2010 and 2009, $4.1 million and $1.2 million, respectively, relate to statutory penalties. The
amount of interest and penalties recognized in the accompanying Consolidated Statement of
Operations for 2010, 2009 and 2008 was ($0.4) million, $0.2 million and ($0.1) million,
respectively.
The tabular reconciliation of the amounts of unrecognized net tax benefits is presented below (in
thousands):
| Years Ended December 31, | ||||||||||||
| 2010 | 2009 | 2008 | ||||||||||
Gross unrecognized tax benefits as of January 1, |
$ | 3,810 | $ | 3,358 | $ | 5,358 | ||||||
Prior period tax position increases (decreases) (1) |
19,287 | 458 | (383 | ) | ||||||||
Decrease from settlements with tax authorities |
(1,283 | ) | - | (1,404 | ) | |||||||
Decreases due to lapse in applicable statute of limitations |
(2,104 | ) | (120 | ) | - | |||||||
Foreign currency translation |
1,326 | 114 | (213 | ) | ||||||||
Gross unrecognized tax benefits as of December 31, |
$ | 21,036 | $ | 3,810 | $ | 3,358 | ||||||
| (1) | Includes amounts assumed upon acquisition of ICT on February 2, 2010. |
The Company is currently under audit in several tax jurisdictions. In Germany, the Company is
appealing the audit decision for tax years 2005-2007. In the Philippines, the Company is being
audited by the Philippine tax authorities for tax years 2007 through
2008 and no material income tax issues have been reported to the Company by the tax
92
Table of Contents
authorities. The Indian tax authority
audited the tax years ended March 31, 2004 and 2005, which remain under appeal. In addition, the
Company is currently under examination in India for tax years ended March 31, 2008, 2007, and 2006.
The Indian tax authorities have made no additional material tax assessments for the years
currently under
audit. The Company is also under audit in Canada for tax years 2003 through 2006. The Company
believes it is adequately reserved for these audits and that resolutions of them are not expected
to have a material impact on its financial condition and results of operations.
The Company files income tax returns in the U.S. and foreign jurisdictions. The following table
presents the major tax jurisdictions and tax years that are open as of December 31, 2010 and
subject to examination by the respective tax authorities.
| Tax Jurisdiction | Tax Year Ended | ||
Canada
|
2003 to present | ||
Costa Rica
|
2006 to present | ||
China
|
2005 to present | ||
Germany
|
1996 to 2005 (1) and 2006 to present | ||
India
|
2003 to present | ||
Philippines
|
2007 to present | ||
United Kingdom
|
2006 to present | ||
United States
|
1997 to 1999 (1), 2002-2006 (1) and 2007 to present | ||
| (1) | These tax years are open to the extent of the net operating loss carryforward amount. |
Note 22. Earnings Per Share
Basic earnings per share are based on the weighted average number of common shares outstanding
during the periods. Diluted earnings per share includes the weighted average number of common
shares outstanding during the respective periods and the further dilutive effect, if any, from
stock options, stock appreciation rights, restricted stock, common stock units and shares held in a
rabbi trusts using the treasury stock method. For the years ended December 31, 2010, 2009 and 2008,
the impact of outstanding options to purchase shares of common stock and stock appreciation rights
of 0.3 million shares, 0.1 million shares and 0.1 million shares, respectively, were anti-dilutive
and were excluded from the calculation of diluted earnings per share.
The numbers of shares used in the earnings per share computation are as follows (in thousands):
| Years Ended December 31, | ||||||||||||
| 2010 | 2009 | 2008 | ||||||||||
Basic: |
||||||||||||
Weighted average common shares outstanding |
46,030 | 40,707 | 40,618 | |||||||||
Diluted: |
||||||||||||
Dilutive effect of stock options, stock appreciation
rights, restricted stock, common stock units and
shares held in a rabbi trust |
103 | 319 | 343 | |||||||||
Total weighted average diluted shares outstanding |
46,133 | 41,026 | 40,961 | |||||||||
On August 5, 2002, the Company’s Board of Directors authorized the Company to purchase up to 3.0
million shares of its outstanding common stock. A total of 2.2 million shares have been repurchased
under this program since inception. The shares are purchased, from time to time, through open
market purchases or in negotiated private transactions, and the purchases are based on factors,
including but not limited to, the stock price and general market conditions. During 2010, the
Company repurchased 0.3 million common shares under the 2002 repurchase program at prices ranging
from $16.92 to $17.60 per share for a total cost of $5.2 million. During 2009, the Company
repurchased 0.2 million common shares under the 2002 repurchase program at prices ranging from
$13.72 to $14.75 per share for a total cost of $3.2 million. During 2008, the Company repurchased
less than 0.1 million common shares under the 2002 repurchase program at a price of $14.83 per
share for a total cost of $0.5 million.
93
Table of Contents
During 2010, the Company cancelled 0.6 million shares of its Treasury stock and recorded reductions
of less than $0.1 million to “Common stock”, $4.4 million to “Additional paid-in capital”, $8.9
million to “Treasury stock” and $4.4 million to “Retained earnings”. During 2008, the Company
cancelled 4.6 million shares of its Treasury stock and recorded reductions of $0.1 million to
“Common stock”, $33.3 million to “Additional paid-in capital”, $51.5
million to “Treasury stock” and $18.1 million to “Retained earnings”. No such transaction occurred
during 2009.
Note 23. Commitments and Loss Contingency
Lease and Purchase Commitments
The Company leases certain equipment and buildings under operating leases having original terms
ranging from one to twenty-five years, some with options to cancel at varying points during the
lease. The building leases contain up to two five-year renewal options. Rental expense under
operating leases for 2010, 2009 and 2008 was approximately $51.8 million, $22.8 million, and $22.6
million, respectively.
The following is a schedule of future minimum rental payments under operating leases having a
remaining non-cancelable term in excess of one year subsequent to December 31, 2010 (in thousands):
| Total Amount | |||||
2011 |
$ | 29,274 | |||
2012 |
12,456 | ||||
2013 |
5,037 | ||||
2014 |
4,119 | ||||
2015 |
3,681 | ||||
2016 and thereafter |
5,743 | ||||
Total minimum payments required |
$ | 60,310 | |||
A lease agreement, relating to the Company’s customer contact management center in Ireland,
contains a cancellation clause which requires the Company, in the event of cancellation, to restore
the facility to its original state at an estimated cost of $0.7 million as of December 31, 2010 and
pay a cancellation fee of $0.3 million, which approximates one annual rental payment under the
lease agreement. As of December 31, 2010, the Company had no plans to cancel this lease agreement.
Therefore, the Company does not expect to make any payments under this agreement and, accordingly,
has not recorded a liability in the accompanying Consolidated Balance Sheets.
The Company enters into agreements with third-party vendors in the ordinary course of business
whereby the Company commits to purchase goods and services used in its normal operations. These
agreements, which are not cancelable, generally range from one to five year periods and contain
fixed or minimum annual commitments. Certain of these agreements allow for renegotiation of the
minimum annual commitments based on certain conditions.
The following is a schedule of future minimum purchases remaining under the agreements as of
December 31, 2010 (in thousands):
| Total Amount | |||||
2011 |
$ | 15,145 | |||
2012 |
10,444 | ||||
2013 |
5,470 | ||||
2014 |
- | ||||
2015 |
- | ||||
2016 and thereafter |
- | ||||
Total minimum payments required |
$ | 31,059 | |||
Indemnities, Commitments and Guarantees
From time to time, during the normal course of business, the Company may make certain indemnities,
commitments and guarantees under which it may be required to make payments in relation to certain
transactions. These include,
94
Table of Contents
but are
not limited to: (i) indemnities to clients, vendors and
service providers pertaining to claims based on negligence or willful misconduct of the Company and
(ii) indemnities involving breach of contract, the accuracy of representations and warranties of
the Company, or other liabilities assumed by the Company in certain contracts. In addition, the
Company has agreements whereby it will indemnify certain officers and directors for certain events
or occurrences while the officer or director is, or was, serving at the Company’s request in such
capacity. The indemnification period covers all pertinent events and occurrences during the
officer’s or director’s lifetime. The
maximum potential amount of future payments the Company could be required to make under these
indemnification agreements is unlimited; however, the Company has director and officer insurance
coverage that limits its exposure and enables it to recover a portion of any future amounts paid.
The Company believes the applicable insurance coverage is generally adequate to cover any estimated
potential liability under these indemnification agreements. The majority of these indemnities,
commitments and guarantees do not provide for any limitation of the maximum potential for future
payments the Company could be obligated to make. The Company has not recorded any liability for
these indemnities, commitments and guarantees in the accompanying Consolidated Balance Sheets. In
addition, the Company has some client contracts that do not contain contractual provisions for the
limitation of liability, and other client contracts that contain agreed upon exceptions to
limitation of liability. The Company has not recorded any liability in the accompanying
Consolidated Balance Sheets with respect to any client contracts under which the Company has or may
have unlimited liability.
Loss Contingency
The Company has previously disclosed three pending matters involving regulatory sanctions assessed
against the Company’s Spanish subsidiary. All three matters relate to the alleged inappropriate
acquisition of personal information in connection with two outbound client contracts. In connection
with the appeal of one of these claims, the Company issued a bank guarantee, which is included as
restricted cash of $0.4 million and $0.5 million in “Deferred charges and other assets” in the
accompanying Consolidated Balance Sheets as of December 31, 2010 and 2009, respectively. Based upon
the opinion of legal counsel regarding the likely outcome of these three matters, the Company
accrued a liability in the amount of $1.3 million under ASC 450 “Contingencies” because management
believed that a loss was probable and the amount of the loss could be reasonably estimated. During
the quarter ended December 31, 2010, the Spanish Supreme Court ruled in the Company’s favor in one
of the three subject claims. Accordingly, the Company has reversed the accrual in the amount of
$0.5 million related to that particular claim. The accrued liability included in “Other accrued
expenses and current liabilities” in the accompanying Consolidated Balance Sheets was $0.8 million
and $1.3 million as of December 31, 2010 and 2009, respectively. One of the other two claims has
been finally decided against the Company on procedural grounds, and the final claim remains on
appeal to the Spanish Supreme Court.
The Company from time to time is involved in other legal actions arising in the ordinary course of
business. With respect to these matters, management believes that it has adequate legal defenses
and/or when possible and appropriate, provided adequate accruals related to those matters such that
the ultimate outcome will not have a material adverse effect on the Company’s financial position or
results of operations.
Note 24. Defined Benefit Pension Plan and Postretirement Benefits
Defined Benefit Pension Plans
The Company sponsors two non-contributory defined benefit pension plans (the “Pension Plans”) for
its covered employees in the Philippines. The Pension Plans provide defined benefits based on years
of service and final salary. All permanent employees meeting the minimum service requirement are
eligible to participate in the Pension Plans. As of December 31, 2010, the Pension Plans were
unfunded. The Company expects to make cash contributions to its Pension Plans during 2011 of less
than $0.1 million.
95
Table of Contents
The following tables provide a reconciliation of the change in the benefit obligation for the
Pension Plans and the net amount recognized in the accompanying Consolidated Balance Sheets (in
thousands):
| Years Ended December 31, | ||||||||
| 2010 | 2009 | |||||||
Beginning benefit obligation |
$ | 731 | $ | 340 | ||||
Service cost |
272 | 63 | ||||||
Interest cost |
90 | 36 | ||||||
Actuarial gains |
31 | 279 | ||||||
Benefit obligation assumed with acquisition of ICT |
174 | - | ||||||
Effect of foreign currency translation |
47 | 13 | ||||||
Ending benefit obligation |
$ | 1,345 | $ | 731 | ||||
Unfunded status |
(1,345 | ) | (731 | ) | ||||
Net amount recognized |
$ | (1,345 | ) | $ | (731 | ) | ||
The net amount recognized consists of accrued benefit costs of $1.2 million and $0.7 million as of
December 31, 2010 and 2009, respectively, and is included in “Other long-term liabilities” in the
accompanying Consolidated Balance Sheets.
Weighted average actuarial assumptions used to determine the benefit obligations and net periodic
benefit cost for the Pension Plans were as follows:
| Years Ended December 31, | ||||||
| 2010 | 2009 | 2008 | ||||
Discount rate
|
8.25% | 9.13% | 10.5% | |||
| Rate of compensation increase | 3.2% | 7.0% | 5.0% – 10.0% | |||
The Company evaluates these assumptions on a periodic basis taking into consideration current
market conditions and historical market data. The discount rate is used to calculate expected
future cash flows at a present value on the measurement date, which is December 31. This rate
represents the market rate for high-quality fixed income investments. A lower discount rate would
increase the present value of benefit obligations. Other assumptions include demographic factors
such as retirement, mortality and turnover.
The following table provides information about the net periodic benefit cost and other accumulated
comprehensive income for the Pension Plans (in thousands):
| Years Ended December 31, | ||||||||||||
| 2010 | 2009 | 2008 | ||||||||||
Service cost |
$ | 272 | $ | 63 | $ | 80 | ||||||
Interest cost |
90 | 36 | 35 | |||||||||
Recognized actuarial (gains) |
(51 | ) | (61 | ) | (65 | ) | ||||||
Net periodic benefit cost |
311 | 38 | 50 | |||||||||
Unrealized net actuarial (gains), net of tax |
(1,189 | ) | (1,207 | ) | (1,387 | ) | ||||||
Total recognized in net periodic benefit cost and
other accumulated comprehensive income (loss) |
$ | (878 | ) | $ | (1,169 | ) | $ | (1,337 | ) | |||
96
Table of Contents
The estimated future benefit payments, which reflect expected future service, as appropriate, are
as follows (in thousands):
| Years Ending December 31, | Amount | |||
2011 |
$ | 14 | ||
2012 |
- | |||
2013 |
4 | |||
2014 |
11 | |||
2015 |
40 | |||
2016 - 2020 |
1,220 | |||
Total minimum payments required |
$ | 1,289 | ||
The Company expects to recognize $0.1 million of net actuarial gains as a component of net periodic
benefit cost in 2011.
Employee Retirement Savings Plans
The Company maintains a 401(k) plan covering defined employees who meet established eligibility
requirements. Under the plan provisions, the Company matches 50% of participant contributions to a
maximum matching amount of 2% of participant compensation. The Company contribution was $0.8
million, $1.0 million and $0.7 million for 2010, 2009 and 2008, respectively.
In connection with the acquisition of ICT in February 2010, the Company assumed ICT’s profit
sharing plan (Section 401(k)). Under this profit sharing plan, the Company matches 50% of employee
contributions for all qualified employees, as defined, up to a maximum of 6% of the employee’s
compensation; however, it may also make additional contributions to the plan based upon profit
levels and other factors. No such additional contributions were made during the year ended December
31, 2010. Employees are fully vested in their contributions, while full vesting in the Company’s
contributions occurs upon death, disability, retirement or completion of five years of service.
Split-Dollar Life Insurance Arrangement
In 1996, the Company entered into a split-dollar life insurance arrangement to benefit the former
Chairman and Chief Executive Officer of the Company. Under the terms of the arrangement, the
Company retained a collateral interest in the policy to the extent of the premiums paid by the
Company. Effective January 1, 2008, the Company recorded a $0.5 million liability for a
post-retirement benefit obligation related to this arrangement, which was accounted for as a
reduction to the January 1, 2008 balance of retained earnings in accordance with ASC 715-60
“Defined Benefit Plans – Other Postretirement”. The postretirement benefit obligation of $0.2
million and $0.3 million was included in “Other long-term liabilities” as of December 31, 2010 and
2009, respectively, in the accompanying Consolidated Balance Sheets. The Company has an unrealized
gain of $0.3 million and $0.3 million as of December 31, 2010 and 2009, respectively, due to
changes in discount rates related to the postretirement obligation, which was recorded in
“Accumulated other comprehensive income” in the accompanying Consolidated Balance Sheets.
Post-Retirement Defined Contribution Healthcare Plan
On January 1, 2005, the Company established a Post-Retirement Defined Contribution Healthcare Plan
for eligible employees meeting certain service and age requirements. The plan is fully funded by
the participants and accordingly, the Company does not recognize expense relating to the plan.
Note 25. Stock-Based Compensation
A detailed description of each of the Company’s stock-based compensation plans is provided below,
including the 2001 Equity Incentive Plan, the 2004 Non-Employee Director Fee Plan and the Deferred
Compensation Plan. Stock-based compensation expense related to these plans, which is included in
“General and administrative” costs primarily in the Americas in the accompanying Consolidated
Statements of Operations, was $4.9 million, $5.2 million and $4.8 million for the years ended
December 31, 2010, 2009 and 2008, respectively. The Company recognized income tax benefits in the
accompanying Consolidated Statements of Operations for the years ended December 31, 2010, 2009 and
2008 of $1.9 million, $2.0 million and $1.9 million,
respectively. In addition, the
97
Table of Contents
Company recognized benefits of tax deductions in excess of recognized tax benefits of $0.4 million, $0.9
million
and $0.7 million from the exercise of stock options in the years ended December 31, 2010, 2009 and
2008, respectively. There were no capitalized stock-based compensation costs at December 31, 2010,
2009 and 2008.
2001 Equity Incentive Plan — The Company’s 2001 Equity Incentive Plan (the “Plan”), which
is shareholder-approved, permits the grant of stock options, stock appreciation rights, restricted
stock and other stock-based awards to certain employees of the Company, and certain non-employees
who provide services to the Company, for up to 7.0 million shares of common stock in order to
encourage them to remain in the employment of or to diligently provide services to the Company and
to increase their interest in the Company’s success.
Stock
Options – Options are granted at fair market value on the date of the grant and generally
vest over one to four years. All options granted under the Plan expire if not exercised by the
tenth anniversary of their grant date. The fair value of each stock option award is estimated on
the date of grant using the Black-Scholes valuation model that uses various assumptions. The fair
value of the stock option awards is expensed on a straight-line basis over the vesting period of
the award. Expected volatility is based on historical volatility of the Company’s stock. The
risk-free rate for periods within the contractual life of the award is based on the yield curve of
a zero-coupon U.S. Treasury bond on the date the award is granted with a maturity equal to the
expected term of the award. Exercises and forfeitures are estimated within the valuation model
using employee termination and other historical data. The expected term of the stock option awards
granted is derived from historical exercise experience under the Plan and represents the period of
time that stock option awards granted are expected to be outstanding. No stock options were granted
during the years ended December 31, 2010, 2009 or 2008.
The following table summarizes stock option activity under the Plan as of December 31, 2010 and for
the year then ended:
| Weighted | ||||||||||||||||
| Average | ||||||||||||||||
| Weighted | Remaining | |||||||||||||||
| Average | Contractual | Aggregate | ||||||||||||||
| Exercise | Term (in | Intrinsic | ||||||||||||||
| Stock Options | Shares (000s) | Price | years) | Value (000s) | ||||||||||||
Outstanding at January 1, 2010 |
49 | $ | 8.05 | |||||||||||||
Granted |
- | - | ||||||||||||||
Exercised |
(3 | ) | 4.05 | |||||||||||||
Forfeited or expired |
(3 | ) | 4.05 | |||||||||||||
Outstanding at December 31, 2010 |
43 | $ | 8.54 | 1.3 | $ | 877 | ||||||||||
Vested or expected to vest at December 31, 2010 |
43 | $ | 8.54 | 1.3 | $ | 877 | ||||||||||
Exercisable at December 31, 2010 |
43 | $ | 8.54 | 1.3 | $ | 877 | ||||||||||
Options exercised in the years ended December 31, 2009 and 2008 had an intrinsic value of $2.6
million and $0.8 million, respectively (not material in 2010). All options were fully vested as of
December 31, 2006 and there is no unrecognized compensation cost as of December 31, 2010 related to
these options granted under the Plan (the effect of estimated forfeitures is not material.)
Cash received from stock options exercised under all stock-based compensation plans for 2009 and
2008 was $3.3 million and $1.2 million, respectively (not material in 2010).
Stock
Appreciation Rights – The Company’s Board of Directors, at the recommendation of the
Compensation and Human Resource Development Committee (the “Committee”), approves awards of
stock-settled stock appreciation rights (“SARs”) for eligible participants. SARs represent the
right to receive, without payment to the Company, a certain number of shares of common stock, as
determined by the Committee, equal to the amount by which the fair market value of a share of
common stock at the time of exercise exceeds the grant price.
The SARs are granted at the fair market value of the Company’s common stock on the date of the
grant and vest one-third on each of the first three anniversaries of the date of grant, provided
the participant is employed by the Company on such date. The SARs
have a term of 10 years from the date of grant. In the event of a change in
98
Table of Contents
control, the SARs will vest on the date of the change in control, provided that the participant is
employed by the Company on the date of the change in control.
The SARs are exercisable within three months after the death, disability, retirement or termination
of the participant’s employment with the Company, if and to the extent the SARs were exercisable
immediately prior to such termination. If the participant’s employment is terminated for cause, or
the participant terminates his or her own employment with the Company, any portion of the SARs not
yet exercised (whether or not vested) terminates immediately on the date of termination of
employment.
The fair value of each SAR is estimated on the date of grant using the Black-Scholes valuation
model that uses various assumptions. The fair value of the SARs is expensed on a straight-line
basis over the requisite service period. Expected volatility is based on the historical volatility
of the Company’s stock. The risk-free rate for periods within the contractual life of the award is
based on the yield curve of a zero-coupon U.S. Treasury bond on the date the award is granted with
a maturity equal to the expected term of the award. Exercises and forfeitures are estimated within
the valuation model using employee termination and other historical data. The expected term of the
SARs granted represents the period of time the SARs are expected to be outstanding.
The following table summarizes the assumptions used to estimate the fair value of SARs granted
during the years ended December 31, 2010, 2009 and 2008:
| Years Ended December 31, | ||||||||||||
| 2010 | 2009 | 2008 | ||||||||||
Expected volatility |
45.2 | % | 46.8 | % | 47.3 | % | ||||||
Weighted-average volatility |
45.2 | % | 46.8 | % | 47.3 | % | ||||||
Expected dividends |
- | - | - | |||||||||
Expected term (in years) |
4.4 | 4.0 | 4.0 | |||||||||
Risk-free rate |
2.4 | % | 1.3 | % | 3.1 | % | ||||||
The following table summarizes SARs activity under the Plan as of December 31, 2010 and for the
year then ended:
| Weighted | ||||||||||||||||
| Average | ||||||||||||||||
| Weighted | Remaining | |||||||||||||||
| Average | Contractual | Aggregate | ||||||||||||||
| Exercise | Term (in | Intrinsic | ||||||||||||||
| Stock Appreciation Rights | Shares (000s) | Price | years) | Value (000s) | ||||||||||||
Outstanding at January 1, 2010 |
421 | $ | - | |||||||||||||
Granted |
130 | - | ||||||||||||||
Exercised |
(109 | ) | - | |||||||||||||
Forfeited or expired |
- | - | ||||||||||||||
Outstanding at December 31, 2010 |
442 | $ | - | 7.8 | $ | 547 | ||||||||||
Vested or expected to vest at December 31, 2010 |
442 | $ | - | 7.8 | $ | 547 | ||||||||||
Exercisable at December 31, 2010 |
150 | $ | - | 6.8 | $ | 374 | ||||||||||
The weighted average grant-date fair value of the SARs granted during 2010, 2009 and 2008 was
$10.21, $7.42 and $7.20, respectively. The total intrinsic value of SARs exercised during 2010,
2009 and 2008 was $0.6 million, $1.1 million and $0.1 million, respectively.
99
Table of Contents
The following table summarizes the status of nonvested SARs under the Plan as of December 31, 2010
and for the year then ended:
| Weighted | ||||||||
| Average | ||||||||
| Grant-Date | ||||||||
| Nonvested Stock Appreciation Rights | Shares (000s) | Fair Value | ||||||
Nonvested at January 1, 2010 |
306 | $ | 7.40 | |||||
Granted |
130 | $ | 10.21 | |||||
Vested |
(143 | ) | $ | 7.44 | ||||
Forfeited or expired |
- | $ | - | |||||
Nonvested at December 31, 2010 |
293 | $ | 8.63 | |||||
As of December 31, 2010, there was $1.5 million of total unrecognized compensation cost, net of
estimated forfeitures, related to nonvested SARs granted under the Plan. This cost is expected to
be recognized over a weighted average period of 1.8 years. SARs that vested during 2010 and 2008
had a fair value of $0.6 million and $0.1 million, respectively, as of the vesting date (no fair
value on vested shares in 2009).
Restricted
Shares – The Company’s Board of Directors, at the recommendation of the Committee,
approves awards of performance and employment-based restricted shares (“Restricted Shares”) for
eligible participants. In some instances, where the issuance of Restricted Shares has adverse tax
consequences to the recipient, the Board of Directors (the “Board”) will instead issue restricted
stock units (“RSUs”). The Restricted Shares are shares of the Company’s common stock (or in the
case of RSUs, represent an equivalent number of shares of the Company’s common stock) which are
issued to the participant subject to (a) restrictions on transfer for a period of time and (b)
forfeiture under certain conditions. The performance goals, including revenue growth and income
from operations targets, provide a range of vesting possibilities from 0% to 100% and will be
measured at the end of the performance period. If the performance conditions are met for the
performance period, the shares will vest and all restrictions on the transfer of the Restricted
Shares will lapse (or in the case of RSUs, an equivalent number of shares of the Company’s common
stock will be issued to the recipient). The Company recognizes compensation cost, net of estimated
forfeitures based on the fair value (which approximates the current market price) of the Restricted
Shares (and RSUs) on the date of grant ratably over the requisite service period based on the
probability of achieving the performance goals.
Changes in the probability of achieving the performance goals from period to period will result in
corresponding changes in compensation expense. The employment-based restricted shares vest
one-third on each of the first three anniversaries of the date of grant, provided the participant
is employed by the Company on such date. In the event of a change in control (as defined in the
Plan) prior to the date the Restricted Shares vest, all of the Restricted Shares will vest and the
restrictions on transfer will lapse with respect to such vested shares on the date of the change in
control, provided that participant is employed by the Company on the date of the change in control.
If the participant’s employment with the Company is terminated for any reason, either by the
Company or participant, prior to the date on which the Restricted Shares have vested and the
restrictions have lapsed with respect to such vested shares, any Restricted Shares remaining
subject to the restrictions (together with any dividends paid thereon) will be forfeited, unless
there has been a change in control prior to such date.
The weighted average grant-date fair value of the Restricted Shares/RSUs granted during 2010, 2009
and 2008 was $23.88, $19.69 and $17.86, respectively.
100
Table of Contents
The following table summarizes the status of nonvested Restricted Shares/RSUs under the Plan as of
December 31, 2010 and for the year then ended:
| Weighted | ||||||||
| Average | ||||||||
| Grant-Date | ||||||||
| Nonvested Restricted Shares / RSUs | Shares (000s) | Fair Value | ||||||
Nonvested at January 1, 2010 |
581 | $ | 18.36 | |||||
Granted |
184 | $ | 23.88 | |||||
Vested |
(178 | ) | $ | 17.69 | ||||
Forfeited or expired |
- | $ | - | |||||
Nonvested at December 31, 2010 |
587 | $ | 20.30 | |||||
As of December 31, 2010, based on the probability of achieving the performance goals, there was
$7.5 million of total unrecognized compensation cost, net of estimated forfeitures, related to
nonvested Restricted Shares/RSUs granted under the Plan. This cost is expected to be recognized
over a weighted average period of 1.9 years. The Restricted Shares/RSUs that vested during the
years ended December 31, 2010, 2009 and 2008 had a fair value of $4.2 million, $3.2 million and
$1.4 million, respectively, as of the vesting date.
Other Awards — The Company’s Board of Directors, at the recommendation of the Committee, approves
awards of Common Stock Units (“CSUs”) for eligible participants. A CSU is a bookkeeping entry on
the Company’s books that records the equivalent of one share of common stock. If the performance
goals described under Restricted Shares above are met, performance-based CSUs will vest on the
third anniversary of the grant date. The Company recognizes compensation cost, net of estimated
forfeitures, based on the fair value (which approximates the current market price) of the CSUs on
the date of grant ratably over the requisite service period based on the probability of achieving
the performance goals. Changes in the probability of achieving the performance goals from period to
period will result in corresponding changes in compensation expense. The employment-based CSUs vest
one-third on each of the first three anniversaries of the date of grant, provided the participant
is employed by the Company on such date. On the date each CSU vests, the participant will become
entitled to receive a share of the Company’s common stock and the CSU will be canceled.
The weighted average grant-date fair value of the CSUs granted during 2010, 2009 and 2008 was
$23.88, $19.69 and $17.87, respectively.
The following table summarizes CSUs activity under the Plan as of December 31, 2010, and changes
during the year then ended:
| Weighted | ||||||||
| Average | ||||||||
| Grant-Date | ||||||||
| Nonvested Common Stock Units | Shares (000s) | Fair Value | ||||||
Nonvested at January 1, 2010 |
68 | $ | 18.37 | |||||
Granted |
22 | $ | 23.88 | |||||
Vested |
(24 | ) | $ | 17.71 | ||||
Forfeited or expired |
- | $ | - | |||||
Nonvested at December 31, 2010 |
66 | $ | 20.33 | |||||
As of December 31, 2010, there was $0.5 million of total unrecognized compensation costs, net of
estimated forfeitures, related to nonvested CSUs granted under the Plan. This cost is expected to
be recognized over a weighted average period of 1.8 years. The fair value of the CSUs that vested
during the years ended December 31, 2010, 2009 and 2008 were $0.5 million, $0.4 million and $0.2
million, respectively, as of the vesting dates. Until a CSU vests, the participant has none of the
rights of a shareholder with respect to the CSU or the common stock underlying the CSU. CSUs are
not transferable.
101
Table of Contents
2004 Non-Employee Director Fee Plan — The Company’s 2004 Non-Employee Director Fee Plan
(the “2004 Fee Plan”), which is shareholder-approved, replaced and superseded the 1996 Non-Employee
Director Fee Plan (the “1996 Fee Plan”) and was used in lieu of the 2004 Nonemployee Director Stock
Option Plan (the “2004 Stock Option Plan”). Prior to amendments adopted by the Board of Directors
in August 2008 which are described below, the 2004 Fee Plan provided that all new non-employee
directors joining the Board would receive an initial grant of CSUs on the date the new director is
appointed or elected, the number of which will be determined by dividing a dollar amount to be
determined from time to time by the Board ($30,000 in 2008) by an amount equal to 110% of the
average closing prices of the Company’s common stock for the five trading days prior to the date
the director is elected. A CSU is a bookkeeping entry on the Company’s books that records the
equivalent of one share of common stock. Prior to amendments to the 2004 Fee Plan adopted by the
Board of Directors in March 2008 which are described below, the initial grant of CSUs vested in
three equal installments, one-third on the date of each of the following three annual shareholders’
meetings, and all unvested and unearned CSUs automatically vested upon the termination of a
director’s service as a director, whether by reason of death, retirement, resignation, removal or
failure to be reelected at the end of his or her term.
In March 2008, the 2004 Fee Plan was amended by the Board, upon the recommendation of the
Committee, to provide that, beginning with grants in 2008, instead of an award of CSUs, a new
non-employee director would receive an award of shares of common stock. The initial grant of stock
to directors joining the Board would vest and be earned in twelve equal quarterly installments over
the following three years, and all unvested and unearned stock will lapse in the event the person
ceases to serve as a director of the Company. Until a quarterly installment of stock vests and
becomes payable, the director has none of the rights of a shareholder with respect to the unearned
stock grants. In August 2008, upon the recommendation of the Committee, the Board of Directors
amended the 2004 Fee Plan to provide that the initial grant of shares to directors joining the
Board will be the number determined by dividing $60,000 by an amount equal to the closing price of
the Company’s common stock on the day preceding the new director’s election. The increase in the
amount of the share award was approved by the shareholders at the 2009 Annual Shareholders Meeting.
The 2004 Fee Plan also provides that each non-employee director will receive, on the day after the
annual shareholders meeting, an annual retainer for service as a non-employee director, the amount
of which shall be determined from time to time by the Board. Prior to the August 2008 amendments
to the 2004 Fee Plan, the annual retainer was $50,000, which was paid 75% in CSUs ($37,500) and 25%
in cash ($12,500). The number of CSUs to be granted was determined by dividing the amount of the
annual retainer by an amount equal to 105% of the average of the closing prices for the Company’s
common stock on the five trading days preceding the award date (the day after the annual meeting).
Prior to the March 2008 amendments to the 2004 Fee Plan, the annual retainer grant of CSUs vested
in two equal installments, one-half on the date of each of the following two annual shareholders’
meetings, and all CSUs automatically vested upon the termination of a director’s service as a
director, whether by reason of death, retirement, resignation, removal or failure to be reelected
at the end of his or her term.
As part of the amendments to the 2004 Fee Plan in March 2008, the 2004 Fee Plan was amended to
provide that, beginning with grants in 2008, the annual retainer grants of stock to directors would
vest and be earned in eight equal quarterly installments, with the first installment being made on
the day following the annual meeting of shareholders, and the remaining seven installments to be
made on each third monthly anniversary of such date thereafter. In the event a person ceases to
serve as a director of the Company, the award lapses with respect to all unvested stock, and such
unvested stock is forfeited.
In August 2008, as part of the amendments to the 2004 Fee Plan, the 2004 Fee Plan was amended to
increase the amount and alter the form of the annual retainer award. The equity portion of the
award is now payable in shares of common stock, rather than CSUs, and the number of shares to be
issued is now determined by dividing the dollar amount of the annual retainer to be paid in shares
by an amount equal to the closing price of a share of the Company’s common stock on the date of the
Company’s annual meeting of shareholders. Effective retroactively to May 2008, the cash portion of
the annual retainer was increased from $12,500 to $32,500, and as approved by the shareholders at
the 2009 Annual Shareholders Meeting, the equity portion of the annual retainer award was increased
from $37,500 to $45,000. This resulted in the annual retainer award being set at $77,500,
effective as of May 22, 2008.
In addition to the annual retainer award, the 2004 Fee Plan also provides for additional annual
cash awards to non-employee directors who serve on Board committees. These annual cash awards for
committee members also were increased in August 2008, effective retroactively to May 2008. The
additional annual cash award for the Chairperson of the Audit Committee was increased from $10,000
to $20,000, and Audit Committee members’
102
Table of Contents
awards were increased from a per meeting fee of $1,250 to an annual fee award of $10,000. The
annual cash awards for the Chairpersons of the Compensation and Human Resource Development
Committee, Finance Committee and Nominating and Corporate Governance Committee were each increased
from $5,000 to $12,500, and the awards for members of such committees were increased from a per
meeting fee of $1,250 to an annual award of $7,500. The additional annual cash award in the amount
of $100,000 for a non-employee Chairman of the Board was not changed. These additional cash awards
also vest in eight equal quarterly installments, one-eighth on the day following the annual meeting
of shareholders, and one eighth on each third monthly anniversary of such date thereafter, and the
award lapses with respect to all unpaid cash in the event the non-employee director ceases to be a
director of the Company, and such unvested cash is forfeited.
The weighted average grant-date fair value of CSUs and share awards granted during 2010, 2009 and
2008 was $19.11, $16.76 and $20.11, respectively.
The following table summarizes the status of the nonvested CSUs and share awards under the 2004 Fee
Plan as of December 31, 2010 and for the year then ended:
| Weighted | ||||||||
| Average | ||||||||
| Grant-Date | ||||||||
| Nonvested Common Stock Units and Share Awards | Shares (000s) | Fair Value | ||||||
Nonvested at January 1, 2010 |
33 | $ | 16.98 | |||||
Granted |
24 | $ | 19.11 | |||||
Vested |
(39 | ) | $ | 17.48 | ||||
Forfeited or expired |
- | $ | - | |||||
Nonvested at December 31, 2010 |
18 | $ | 18.67 | |||||
As of December 31, 2010, there was $0.3 million of total unrecognized compensation costs, net of
estimated forfeitures, related to nonvested CSUs granted since March 2008 under the Plan. This cost
is expected to be recognized over a weighted average period of 1.0 year. CSUs and share awards
that vested during the years ended December 31, 2010, 2009 and 2008 had a fair value of $0.3
million, $0.3 million and $0.5 million, respectively.
Deferred Compensation Plan — The Company’s non-qualified Deferred Compensation Plan (the
“Deferred Compensation Plan”), which is not shareholder-approved, was adopted by the Board of
Directors effective December 17, 1998 and amended on March 29, 2006 and May 23, 2006. It provides
certain eligible employees the ability to defer any portion of their compensation until the
participant’s retirement, termination, disability or death, or a change in control of the Company.
Using the Company’s common stock, the Company matches 50% of the amounts deferred by certain senior
management participants on a quarterly basis up to a total of $12,000 per year for the president
and senior vice presidents and $7,500 per year for vice presidents (participants below the level of
vice president are not eligible to receive matching contributions from the Company). Matching
contributions and the associated earnings vest over a seven year service period. Deferred
compensation amounts used to pay benefits, which are held in a rabbi trust, include investments in
various mutual funds and shares of the Company’s common stock (See Note 13, Investments Held in
Rabbi Trusts.) As of December 31, 2010 and 2009, liabilities of $3.4 million and $2.4 million,
respectively, of the Deferred Compensation Plan were recorded in “Accrued employee compensation and
benefits” in the accompanying Consolidated Balance Sheets.
Additionally, the Company’s common stock match associated with the Deferred Compensation Plan, with
a carrying value of approximately $1.0 million and $0.8 million at December 31, 2010 and 2009,
respectively, is included in “Treasury stock” in the accompanying Consolidated Balance Sheets.
The weighted average grant-date fair value of common stock awarded during 2010, 2009 and 2008 was
$18.91, $17.77 and $18.33, respectively.
103
Table of Contents
The following table summarizes the status of the nonvested common stock issued under the Deferred
Compensation Plan as of December 31, 2010 and for the year then ended:
| Weighted | ||||||||
| Average | ||||||||
| Grant-Date | ||||||||
| Nonvested Common Stock | Shares (000s) | Fair Value | ||||||
Nonvested at January 1, 2010 |
6 | $ | 17.76 | |||||
Granted |
11 | $ | 18.91 | |||||
Vested |
(9 | ) | $ | 18.14 | ||||
Forfeited or expired |
- | $ | - | |||||
Nonvested at December 31, 2010 |
8 | $ | 18.00 | |||||
As of December 31, 2010, there was $0.1 million of total unrecognized compensation cost, net of
estimated forfeitures, related to nonvested common stock granted under the Deferred Compensation
Plan. This cost is expected to be recognized over a weighted average period of 3.9 years. The total
fair value of the common stock vested during 2010, 2009 and 2008 was $0.2 million, $0.2 million and
$0.2 million, respectively.
Cash used to settle the Company’s obligation under the Deferred Compensation Plan was not material
for 2010 (none in 2009 and 2008).
Note 26. Segments and Geographic Information
The Company operates within two regions, the Americas and EMEA, which represent 80.6% and 19.4%,
respectively, of consolidated revenues for 2010. The Americas and EMEA regions represented 69.4%
and 30.6%, respectively, of consolidated revenues for 2009, and 65.8% and 34.2%, respectively, of
consolidated revenues for 2008. Each region represents a reportable segment comprised of aggregated
regional operating segments, which portray similar economic characteristics. The Company aligns its
business into two segments to effectively manage the business and support the customer care needs
of every client and to respond to the demands of the Company’s global customers.
The reportable segments consist of (1) the Americas, which includes the United States, Canada,
Latin America, India and the Asia Pacific Rim, and provides outsourced customer contact management
solutions (with an emphasis on technical support and customer service) and technical staffing and
(2) EMEA, which includes Europe, the Middle East and Africa, and provides outsourced customer
contact management solutions (with an emphasis on technical support and customer service) and
fulfillment services. The sites within Latin America, India and the Asia Pacific Rim are included
in the Americas segment given the nature of the business and client profile, which is primarily
made up of U.S.-based companies that are using the Company’s services in these locations to support
their customer contact management needs.
104
Table of Contents
Information about the Company’s reportable segments for the years ended December 31, 2010, 2009 and
2008 is as follows (in thousands):
| Americas | EMEA | Other(1) | Consolidated | |||||||||||||
Year Ended December 31, 2010: |
||||||||||||||||
Revenues (2) |
$ | 934,329 | $ | 224,389 | $ | 1,158,718 | ||||||||||
Depreciation and amortization (2)
|
$ | 49,910 | $ | 5,417 | $ | 55,327 | ||||||||||
Income (loss) from continuing operations |
$ | 108,168 | $ | (11,307 | ) | $ | (64,638 | ) | $ | 32,223 | ||||||
Other (expense), net |
(10,328 | ) | (10,328 | ) | ||||||||||||
Income taxes |
(2,197 | ) | (2,197 | ) | ||||||||||||
Income from continuing operations, net of tax |
19,698 | |||||||||||||||
(Loss) from discontinued operations, net of tax |
(6,476 | ) | (23,495 | ) | (29,971 | ) | ||||||||||
Net (loss) |
$ | (10,273 | ) | |||||||||||||
Total assets as of December 31, 2010 |
$ | 1,357,709 | $ | 1,112,392 | $ | (1,675,501 | ) | $ | 794,600 | |||||||
| Americas | EMEA | Other(1) | Consolidated | |||||||||||||
Year Ended December 31, 2009: |
||||||||||||||||
Revenues (2) |
$ | 565,023 | $ | 248,551 | $ | 813,574 | ||||||||||
Depreciation and amortization (2)
|
$ | 20,290 | $ | 5,131 | $ | 25,421 | ||||||||||
Income (loss) from continuing operations |
$ | 101,389 | $ | 15,130 | $ | (43,501 | ) | $ | 73,018 | |||||||
Other (expense), net |
(758 | ) | (758 | ) | ||||||||||||
Income taxes |
(26,118 | ) | (26,118 | ) | ||||||||||||
Income from continuing operations, net of tax |
46,142 | |||||||||||||||
(Loss) from discontinued operations, net of tax |
(2,931 | ) | - | (2,931 | ) | |||||||||||
Net income |
$ | 43,211 | ||||||||||||||
Total assets as of December 31, 2009 |
$ | 711,253 | $ | 842,608 | $ | (881,390 | ) | $ | 672,471 | |||||||
| Americas | EMEA | Other(1) | Consolidated | |||||||||||||
Year Ended December 31, 2008: |
||||||||||||||||
Revenues (2) |
$ | 514,866 | $ | 267,429 | $ | 782,295 | ||||||||||
Depreciation and amortization (2)
|
$ | 19,193 | $ | 5,080 | $ | 24,273 | ||||||||||
Income (loss) from continuing operations |
$ | 87,186 | $ | 21,178 | $ | (40,853 | ) | $ | 67,511 | |||||||
Other income, net |
16,561 | 16,561 | ||||||||||||||
Income taxes |
(21,421 | ) | (21,421 | ) | ||||||||||||
Income from continuing operations, net of tax |
62,651 | |||||||||||||||
(Loss) from discontinued operations, net of tax |
(2,090 | ) | - | (2,090 | ) | |||||||||||
Net income |
$ | 60,561 | ||||||||||||||
Total assets as of December 31, 2008 |
$ | 633,818 | $ | 927,805 | $ | (1,032,081 | ) | $ | 529,542 | |||||||
| (1) | Other items (including corporate costs, provision for regulatory penalties, impairment costs, other income and expense, and income taxes) are shown for purposes of reconciling to the Company’s consolidated totals as shown in the table above for the three years in the period ended December 31, 2010. The accounting policies of the reportable segments are the same as those described in Note 1 to the accompanying Consolidated Financial Statements. Inter-segm
ent revenues are not material to the Americas and EMEA segment results. The Company evaluates the performance of its geographic segments based on revenue and income (loss) from operations, and does not include segment assets or other income and expense items for management reporting purposes. |
|
| (2) | Revenues and depreciation and amortization include results from continuing operations only. |
105
Table of Contents
During 2010, total consolidated revenues included $154.1 million, or 13.3% of consolidated
revenues for 2010, from AT&T Corporation, a major provider of communication services for which the
Company provides various customer support services, compared to $111.3 million, or 13.7% for 2009.
This included $147.6 million in revenues from the Americas and $6.5 million in revenues from EMEA
for 2010 and $102.1 million in revenues from the Americas and $9.2 million in revenues from EMEA
for 2009. The Company’s top ten clients accounted for approximately 41% of its consolidated
revenues in 2010, a decrease from 48% in 2009. The loss of (or the failure to retain a significant
amount of business with) any of the Company’s key clients could have a material adverse effect on
its performance. Many of the Company’s contracts contain penalty provisions for failure to meet
minimum service levels and are cancelable by the client at any time or on short notice. Also,
clients may unilaterally reduce their use of the Company’s services under its contracts without
penalty.
Information about the Company’s operations by geographic location is as follows (in thousands):
| Years Ended December 31, | ||||||||||||
| 2010 | 2009 | 2008 | ||||||||||
Revenues: (1) |
||||||||||||
United States |
$ | 293,179 | $ | 139,023 | $ | 107,504 | ||||||
Argentina (2) |
7,670 | 12,436 | 13,650 | |||||||||
Canada |
195,301 | 101,064 | 103,551 | |||||||||
Costa Rica |
89,830 | 77,528 | 62,147 | |||||||||
El Salvador |
35,366 | 30,770 | 29,008 | |||||||||
Philippines |
249,010 | 182,095 | 184,649 | |||||||||
Australia |
18,639 | - | - | |||||||||
Mexico |
20,514 | - | - | |||||||||
Other |
24,820 | 22,107 | 14,357 | |||||||||
Total Americas |
934,329 | 565,023 | 514,866 | |||||||||
Germany |
65,145 | 73,249 | 74,643 | |||||||||
United Kingdom |
46,791 | 49,872 | 64,943 | |||||||||
Sweden |
27,311 | 27,905 | 36,053 | |||||||||
Spain |
36,806 | 44,221 | 33,291 | |||||||||
The Netherlands |
14,026 | 21,284 | 24,250 | |||||||||
Hungary |
8,186 | 9,653 | 13,125 | |||||||||
Romania |
3,743 | - | - | |||||||||
Other |
22,381 | 22,367 | 21,124 | |||||||||
Total EMEA |
224,389 | 248,551 | 267,429 | |||||||||
| $ | 1,158,718 | $ | 813,574 | $ | 782,295 | |||||||
106
Table of Contents
| Years Ended December 31, | ||||||||
| 2010 | 2009 | |||||||
Long-Lived Assets: (3) |
||||||||
United States |
$ | 84,285 | $ | 34,365 | ||||
Argentina |
- | 5,539 | ||||||
Canada |
26,748 | 7,179 | ||||||
Costa Rica |
7,063 | 5,522 | ||||||
El Salvador |
3,823 | 3,777 | ||||||
Philippines |
21,870 | 8,717 | ||||||
Australia |
2,304 | - | ||||||
Mexico |
2,566 | - | ||||||
Other |
3,182 | 3,644 | ||||||
Total Americas |
151,841 | 68,743 | ||||||
Germany |
2,975 | 2,184 | ||||||
United Kingdom |
5,211 | 5,511 | ||||||
Sweden |
854 | 895 | ||||||
Spain |
1,183 | 1,902 | ||||||
The Netherlands |
217 | 443 | ||||||
Hungary |
415 | 729 | ||||||
Romania |
1,340 | - | ||||||
Other |
2,419 | 1,948 | ||||||
Total EMEA |
14,614 | 13,612 | ||||||
| $ | 166,455 | $ | 82,355 | |||||
| (1) | Revenues are attributed to countries based on location of customer, except for revenues for Costa Rica, Philippines, China and India which are primarily comprised of customers located in the U.S., but serviced by centers in those respective geographic locations. | |
| (2) | Revenues attributable to Argentina relate to clients retained by the Company subsequent to the sale of the Argentine operations. | |
| (3) | Long-lived assets include property and equipment, net, and intangibles, net. |
| Years Ended December 31, | ||||||||
| 2010 | 2009 | |||||||
Goodwill: |
||||||||
Americas |
$ | 122,303 | $ | 21,209 | ||||
EMEA |
- | - | ||||||
| $ | 122,303 | $ | 21,209 | |||||
Revenues for the Company’s products and services are as follows (in thousands):
| Years Ended December 31, | ||||||||||||
| 2010 | 2009 | 2008 | ||||||||||
Outsourced customer contract management services |
$ | 1,133,676 | $ | 787,062 | $ | 751,235 | ||||||
Fulfillment services |
16,934 | 17,376 | 20,556 | |||||||||
Enterprise support services |
8,108 | 9,136 | 10,504 | |||||||||
| $ | 1,158,718 | $ | 813,574 | $ | 782,295 | |||||||
Note 27. Related Party Transactions
The Company paid John H. Sykes, the founder, former Chairman and Chief Executive Officer and
current significant shareholder of the Company and the father of Charles Sykes, President and Chief
Executive Officer of the Company, $0.1 million, less than $0.1 million and $0.2 million, for the
use of his private jet in the years 2010, 2009 and 2008, respectively, which is based on two times
fuel costs and other actual costs incurred for each trip.
In January 2008, the Company entered into a lease for a customer contact management center located
in Kingstree, South Carolina. The landlord, Kingstree Office One, LLC, is an entity controlled by
John Sykes, the Company’s founder, former Chairman and Chief Executive Officer, and a current major
stockholder. The lease payments on the
107
Table of Contents
20 year lease were negotiated at or below market rates, and the lease is cancellable at the option of the Company. There are significant penalties for early
cancellation which decrease over time. The Company paid $0.4 million,
$0.4 million and $0.4 million to the landlord during the years ended December 31, 2010, 2009 and
2008, respectively, under the terms of the lease.
Additionally, during 2008 (none in 2010 and 2009), the Company paid $0.3 million for transitional
real estate consulting services provided by David Reule, the Company’s former Senior Vice President
of Real Estate who retired in December, 2007. During 2008, Mr. Reuele was employed by JHS Equity,
LLC, a company owned by John H. Sykes. Accordingly, the payments for Mr. Reule’s services were
made to JHS Equity, LLC to reimburse it for the time spent by Mr. Reule on the Company’s business.
108
Table of Contents
Schedule II — Valuation and Qualifying Accounts
Years ended December 31, 2010, 2009 and 2008
| Charged | Beginning | |||||||||||||||||||
| Balance at | (Credited) | Balance of | Balance at | |||||||||||||||||
| Beginning | to Cost and | Additions | Acquired | End of | ||||||||||||||||
| (in thousands) | of Period | Expenses | (Deductions) | Company | Period | |||||||||||||||
Allowance for doubtful accounts: |
||||||||||||||||||||
Year ended December 31, 2010 |
$ | 3,530 | $ | 170 | $ | 239 | (1) | $ | - | $ | 3,939 | |||||||||
Year ended December 31, 2009 |
3,071 | 1,022 | (563 | ) (1) | - | 3,530 | ||||||||||||||
Year ended December 31, 2008 |
2,813 | 554 | (296 | ) (1) | - | 3,071 | ||||||||||||||
Valuation allowance for net deferred tax
assets: |
||||||||||||||||||||
Year ended December 31, 2010 |
$ | 32,126 | $ | 12,256 | $ | - | $ | 15,709 | $ | 60,091 | ||||||||||
Year ended December 31, 2009 |
30,618 | 1,508 | - | - | 32,126 | |||||||||||||||
Year ended December 31, 2008 |
34,023 | (3,405 | ) | - | - | 30,618 | ||||||||||||||
Reserves for value added tax receivables: |
||||||||||||||||||||
Year ended December 31, 2010 |
$ | 1,881 | $ | 551 | $ | (94 | ) | $ | - | $ | 2,338 | |||||||||
Year ended December 31, 2009 |
1,853 | 536 | (508 | ) | - | 1,881 | ||||||||||||||
Year ended December 31, 2008 |
2,275 | 592 | (1,014 | ) | - | 1,853 | ||||||||||||||
| (1) | Net write-offs and recoveries |
109