Attached files
| file | filename |
|---|---|
| EX-10.1 - Orion Group Holdings Inc | v213549_ex10-1.htm |
| EX-99.1 - Orion Group Holdings Inc | v213549_ex99-1.htm |
| EX-32.1 - Orion Group Holdings Inc | v213549_ex32-1.htm |
| EX-21.1 - Orion Group Holdings Inc | v213549_ex21-1.htm |
| EX-31.2 - Orion Group Holdings Inc | v213549_ex31-2.htm |
| EX-31.1 - Orion Group Holdings Inc | v213549_ex31-1.htm |
| EX-23.1 - Orion Group Holdings Inc | v213549_ex23-1.htm |
UNITED STATES
SECURITIES AND EXCHANGE COMMISSION
Washington, D.C. 20549
FORM 10-K
(Mark One)
þ ANNUAL REPORT PURSUANT TO SECTION 13 OR 15(d) OF THE SECURITIES EXCHANGE ACT OF 1934
For the fiscal year ended December 31, 2010
OR
¨ TRANSITION REPORT PURSUANT TO SECTION 13 OR 15(d) OF THE SECURITIES EXCHANGE ACT OF 1934
For the transition period from ________ to_______
Commission file number: 1-33891
ORION MARINE GROUP, INC.
|
Delaware
State of Incorporation
|
26-0097459
IRS Employer Identification Number
|
|
12000 Aerospace Suite 300
Houston, Texas 77034
Address of Principal Executive Office
|
(713) 852-6500
Telephone number (including area code)
|
Securities registered pursuant to Section 12(b) of the Act:
|
Title of Each Class
|
Name of Each Exchange on Which Registered
|
|
|
Common stock, $0.01 par value per share
|
The New York Stock Exchange
|
Securities registered pursuant to Section 12(g) of the Act: None
Indicate by check mark if the Registrant is a well-known seasoned issuer, as defined in Rule 405 of the Securities Act: ¨ Yes þ No
Indicate by check mark if the Registrant is not required to file reports pursuant to Section 13 or 15(d) of the Act: ¨ Yes þ No
Indicate by check mark whether the Registrant (1) has filed all reports required to be filed by Section 13 or 15(d) of the Securities Exchange Act of 1934 during the preceding 12 months (or for such shorter period that the Registrant was required to file such reports) and (2) has been subject to such filing requirements for the past 90 days: þ Yes ¨ No
Indicate by check mark whether the registrant has submitted electronically and posted on its corporate website, if any, every interactive date file required to be submitted and posted pursuant to Rule 405 of Regulation S-T during the preceding 12 months (or for such shorter period that the registrant was required to submit and post such files
Yes ¨ No ¨
Indicate by check mark if disclosure of delinquent filers pursuant to Item 405 of Regulation S-K is not contained herein, and will not be contained, to the best of the Registrant’s knowledge, in definitive proxy or information statements incorporated by reference in Part III of this Form 10-K or any amendment to this Form 10-K ¨
Indicate by check mark whether the Registrant is a large accelerated filer, an accelerated filer, a non-accelerated filer, or a smaller reporting company. See definition of “accelerated filer and large accelerated filer” in Rule 12b-2 of the Exchange Act (Check One):
Large Accelerated Filer ¨ Accelerated Filer þ Non-accelerated filer ¨ Smaller reporting company ¨
Indicate by check mark whether the Registrant is a shell company (as defined in Rule 12b-2 of the Act) ¨ Yes þ No
There were 27,004,933 shares of common stock outstanding as of March 1, 2011. The aggregate market value of the Registrant’s common equity held by non-affiliates was approximately $379.1 million as of June 30, 2010, based upon the last reported sales price on the New York Stock Exchange on that date.
DOCUMENTS INCORPORATED BY REFERENCE
Part III – Portions of the Registrant’s definitive Proxy Statement to be issued on connection with the 2011 Annual Meeting of Stockholders to be filed on or about April 4, 2011.
ORION MARINE GROUP, INC.
2010 Annual Report on Form 10-K
Table of Contents
|
PART I
|
3
|
|
|
Item 1.
|
Business
|
3
|
|
Item 1A.
|
Risk Factors
|
13
|
|
Item 1B.
|
Unresolved Staff Comments
|
24
|
|
Item 2.
|
Properties
|
25
|
|
Item 3.
|
Legal Proceedings
|
27
|
|
Item 4.
|
Reserved
|
27
|
|
PART II
|
28
|
|
|
Item 5.
|
Market for Registrant’s Common Equity, Related Stockholder Matters and Issuer Purchases of Equity Securities
|
28
|
|
Item 6.
|
Selected Financial Data
|
31
|
|
Item 7.
|
Management’s Discussion and Analysis of Financial Condition and Results of Operations
|
34
|
|
Item 7A.
|
Quantitative and Qualitative Disclosures about Market Risk
|
45
|
|
Item 8.
|
Financial Statements and Supplementary Data
|
45
|
|
Item 9.
|
Changes In and Disagreements with Accountants on Accounting and Financial Disclosure
|
45
|
|
Item 9A.
|
Controls and Procedures
|
45
|
|
Item 9B.
|
Other Information
|
46
|
|
PART III
|
47
|
|
|
Item 10.
|
Directors, Executive Officers and Corporate Governance
|
47
|
|
Item 11.
|
Executive Compensation
|
47
|
|
Item 12.
|
Security Ownerhship of Certain Beneficial Owners and Management and Related Stockholder Matters
|
48
|
|
Item 13.
|
Certain Relationships and Related Transactions, and Director Independence
|
48
|
|
Item 14.
|
Principal Accounting Fees and Services
|
48
|
|
PART IV
|
49
|
|
|
Item 15.
|
Exhibits and Financial Statement Schedules
|
49
|
|
SIGNATURES
|
51
|
-2-
PART I
FORWARD-LOOKING STATEMENTS
In addition to historical information, this Annual Report on Form 10-K and the documents incorporated by reference herein may contain forward-looking statements that are not based on historical fact. When used in this report, words such as “expects”, “anticipates”, “believes”, “seeks”, “estimates”, “plans”, “intends” and similar words identify forward-looking statements. You should not place undue reliance on these forward-looking statements. Although such statements are based on management’s current estimates and expectations and currently available competitive, financial and economic data, forward-looking statements are inherently uncertain and involve risks and uncertainties that could
cause our actual results to differ materially from what may be inferred from the forward-looking statements. Some of the factors that could cause or contribute to such differences are listed and discussed in Item 1A “Risk Factors”, below and elsewhere in this Annual Report on Form 10-K. We undertake no obligation to release publicly any revisions or updates to any forward-looking statements that are contained in this document.
Item 1. BUSINESS
General
We are a leading marine specialty contractor serving the heavy civil marine infrastructure market. We provide a broad range of marine construction services on, over and under the water along the Gulf Coast, the Atlantic Seaboard, the West Coast, Canada, and in the Caribbean Basin. Our customers are federal, state and municipal governments as well as private commercial and industrial enterprises.
History
We were founded in 1994 as a marine construction project management business. Throughout the years, we expanded beyond the project management business, established fixed geographic operating bases and made several strategic acquisitions since 1997. The common stock of Orion Marine Group, Inc. commenced trading publicly in 2007 and is listed on the New York Stock Exchange under the symbol ORN. Unless the context otherwise requires, all references herein to “Orion”, the “Company”, the “Registrant”, “we”, “us” or “our” refer to Orion Marine Group, Inc. and its consolidated subsidiaries.
Business Strategy
General
We pursue the following business strategies in order to improve our business and prospects, increase our revenue and profitability and, ultimately, enhance stockholder value:
Expand and Fill in Our Service Territory
We grow our business by seeking opportunities in other geographic markets by establishing a physical presence in new areas through selective acquisitions or greenfield expansions.
Pursue Strategic Acquisitions
We evaluate acquisition opportunities in parallel with our greenfield expansion. Our strategy will include timely and efficient integration of such acquisitions into our culture, bidding process and internal controls. We believe that attractive acquisition candidates are available due to the highly fragmented and regional nature of the industry, high cost of capital for equipment and the desire for liquidity among an aging group of existing business owners. We believe our financial strength, industry expertise and experienced management team will be attractive to acquisition candidates. Recent key acquisitions include:
|
|
·
|
In February 2008, we expanded our dredging capabilities along the eastern Atlantic Seaboard, through the purchase of marine construction equipment, including several dredges.
|
-3-
|
|
·
|
In January 2010, we purchased T.W. LaQuay Dredging, LLC, a dredging company based in Texas which owns and operates marine construction equipment, including several large dredges.
|
|
|
·
|
In February 2010, we purchased a marine construction business and expanded our area of operations into the West Coast and Canada.
|
Continue to Capitalize on Favorable Long-Term Industry Trends
Our growth has been driven by our ability to capitalize on infrastructure spending across multiple end-markets we serve including port infrastructure, government funded projects, transportation, oil and gas, and environmental restoration markets.
Continue to Reinvest in our Core Business
Since our inception, we have focused on pursuing technically complex projects where our specialized services and equipment differentiate us from our competitors. We intend to continue to grow our fleet through the purchase and development of equipment.
Financial Information About Segments
Although we describe our business in this report in terms of the services we provide, our base of customers and the geographic areas in which we operate, we have concluded that our operations comprise a single reportable segment. In making this determination, we considered that each project has similar characteristics, includes similar services, has similar types of customers and is subject to the same regulatory environment. We organize, evaluate and manage our financial information around each project when making operating decisions and assessing our overall performance.
Services Provided
We act as a single-source, turnkey solution for our customers’ marine contracting needs. We provide a broad range of heavy civil marine construction services. In addition, we provide dredging, repair and maintenance, and other specialty services. Many of our contracts encompass multiple services within a single project.
Marine Construction Services
These services include construction of marine transportation facilities, marine pipelines, bridges and causeways, and marine environmental structures. We generally serve as the prime contractor for many of these types of projects and we have the capability of providing design-build services.
Marine transportation facility construction projects include public port facilities for container ship loading and unloading; cruise ship port facilities; private terminals; special-use Navy terminals, recreational use marinas and docks, and other marine-based facilities. These projects typically consist of steel or concrete fabrication dock or mooring structures designed for durability and longevity, and involve driving piles of concrete, pipe or sheet pile up to 90 feet below the surface to provide a foundation for the port facility that we subsequently construct on the piles. We also provide on-going maintenance and repair, inspection services, emergency repair, and demolition and salvage to such facilities.
Our marine pipeline service projects generally include the installation and removal of underwater buried pipeline transmission lines; installation of pipeline intakes and outfalls for industrial facilities; construction of pipeline outfalls for wastewater and industrial discharges; river crossing and directional drilling; creation of hot taps and tie-ins; and inspection, maintenance and repair services.
Our bridge and causeway projects include the construction, repair and maintenance of all types of bridges and causeways, as well as the development of fendering systems in marine environments, and we serve as the prime contractor for many of these projects, some of which may be design-build contracts. These projects involve fabricating steel or concrete structures designed for durability and longevity, and involve driving piles of concrete, pipe or sheet pile to create support for the concrete deck roadways that we subsequently construct on the piles. These piles can exceed 50 inches in diameter, can range up to 170 feet in overall length, and are often driven 90 feet into the sea floor. We also provide ongoing maintenance and repair, as well as emergency repair, to bridges, pile
supports, and fendering systems for bridges.
-4-
Marine environmental structure projects may include the installation of concrete mattresses to ensure erosion protection; construction of levees to contain environmental mitigation projects, and the installation of geotubes for wetlands and island creation. Such structures are used for erosion control, wetlands creation and environmental remediation.
Dredging services
Projects involving dredging generally enhance or preserve the navigability of waterways or the protection of shorelines through the removal or replenishment of soil, sand or rock. Dredging involves removing mud and silt from the channel floor by means of a mechanical backhoe, crane and bucket or cutter suction dredge and pipeline systems. Dredging is integral to capital and maintenance projects, including: maintenance for previously deepened waterways and harbors to remove silt, sand and other accumulated sediments; construction of breakwaters, jetties, canals and other marine structures; deepening ship channels and wharves to accommodate larger and deeper draft ships; containing erosion of wetlands and coastal marshes; land reclamation; and beach nourishment and creation of wildlife
refuges. Maintenance dredging projects provide a source of recurring revenue as active channels typically require dredging every one to three years due to natural sedimentation. The frequency of maintenance dredging may be accelerated by rainfall and major weather events such as hurricanes. Areas where no natural deep water ports exist, such as the Texas Gulf Coast, require substantial maintenance dredging. We maintain multiple specialty dredges of various sizes and specifications to meet customer needs.
Specialty Services
Our specialty services include salvage, demolition, surveying, towing, diving and underwater inspection, excavation and repair. Our diving services are largely performed in shallow water with little to no visibility and include inspections, salvage and pile restoration and encapsulation. Our survey services include surveying pipelines and performing hydrographic surveys which determine the configuration of the floors of bodies of water and detect and identify wrecks and obstructions. Most of these specialty services support our other construction services and provide an incremental touch-point with our customers.
Industry Overview
Our services are provided to customers in diverse end markets, including port expansion and maintenance, bridges, causeways and other marine infrastructure, the cruise industry, the Department of Defense, the oil and gas industry, coastal protection and reclamation, along with hurricane restoration and repair and environmental remediation. We believe that this diversity in our customer base will enable us to utilize our resources to lessen the negative effects of any downturn in a specific end market.
Port Expansion and Maintenance
Ports and harbors are vital to trade for the U.S. economy, help position the U.S. as a leader in global trade and are essential to national security. We anticipate that U.S. ports will need to build larger dock space and deepen their channels to accommodate larger container, dry bulk and liquid cargo ships in order to remain globally competitive.
Ports located on the Gulf Coast can also expect greater volume growth as the Panama Canal expansion projects should contribute to increased traffic of larger container ships from the Pacific Ocean bypassing Long Beach, California. As a part of our existing operations, we service most major ports across the Gulf Coast and Florida.
Bridge and Causeways
According to the American Society of Civil Engineers, as of their 2009 report, 26% of the nation’s bridges are structurally deficient or functionally obsolete. As the system ages, the infrastructure cannot support the growing traffic loads, resulting in frequent delays for repairs. At the same time, the repairs become more expensive due to long-deferred maintenance. The United States Congress and the Department of Transportation are actively working towards passage of a long term highway funding bill in fiscal 2011.
-5-
Marine Infrastructure
The U.S. Marine Transportation System (“MTS”) consists of waterways, ports and their intermodal connections, vessels, vehicles, and system users, as well as shipyards and repair facilities crucial to maritime activity. The MTS is primarily an aggregation of federal, state, local and privately owned facilities and private companies. U.S. inland and intracoastal waterways require substantial maintenance and improvement. While waterway usage is increasing, the facilities and supporting systems are aging. In addition, channels and waterways must maintain certain depths to accommodate ship and barge traffic. Natural sedimentation in these channels and waterways require maintenance dredging to maintain navigability.
Cruise Industry
An expected increase in ship size has generated a need for substantial port infrastructure development, including planning and construction of new terminals and facilities, as well as on-going maintenance and repair services. These larger vessels require development of new piers and additional dredging services to accommodate deeper drafts. Our service area includes the ports of Miami, Galveston, Tampa, New Orleans, and Canaveral, and the Caribbean Basin, which includes numerous cruise facilities and is the most popular cruise destination in the North American market.
The Department of Defense
The US Navy has the responsibility for the maintenance of 39 facilities in the United States, which includes a significant amount of marine infrastructure. In recent years, Department of Defense funding shifted away from naval base expansion, repair and maintenance. We believe that the US Navy is poised to resume a more normal flow of maintenance and upgrades to its infrastructure, including its marine facilities.
The US Coast Guard maintains more than 50,000 federal aids to navigation, which include buoys, lighthouses, day beacons and radio-navigation signals, and additionally has oversight responsibility for over 18,000 highway and railroad bridges that span navigable waterways throughout the country. As part of the Department of Homeland Security, we anticipate that US Coast Guard needs for varied marine construction services will provide opportunities for us in the future.
We anticipate that the continued implementation of the U.S. Base Realignment and Closure Program (“BRAC”), will shift emphasis towards improving domestic military infrastructure, including port and other facilities located on, or near, the water. This should result in the need for increased infrastructure at the realigned facilities where personnel and equipment will be moved from facilities targeted for closure.
Oil and Gas Industry
We construct, repair and remove underwater pipelines, and provide marine construction and on-going maintenance services for private refineries, terminal facilities and docks, and other critical near shore oil and gas infrastructure. Increased levels of capital expenditures by midstream and downstream oil and gas companies in response to higher oil and gas prices should increase demand for our services.
U.S. Coastal and Wetland Restoration and Reclamation
We believe that increases in coastal population density and demographic trends will lead to an increase in the number of coastal restoration and reclamation projects, and, as the value of waterside assets rises from a residential and recreational standpoint, citizens and municipalities will do more to protect these assets via restoration and reclamation projects.
Hurricane Restoration and Repair
Hurricanes can be very destructive to the existing marine infrastructure and natural protection barriers of the prime storm territories of the Gulf Coast, the Atlantic Seaboard and the Caribbean Basin, including bridges, ports, underwater channels and sensitive coastal areas. Typically, restoration and repair opportunities continue for several years after a major hurricane event. These events provide incremental projects to our industry that contribute to a favorable bidding environment and high capacity utilization in our markets.
-6-
Environmental Remediation
We believe there will be contingency funding for the protection of natural habitats, environmental preservation, wetlands creation and remediation for high priority projects in Louisiana and other areas in the markets we serve that will protect and restore sensitive marine and coastal areas, advance ocean science and research, and ensure sustainable use of ocean resources.
Customers
Our customers include federal, state and local governmental agencies in the Unites States, as well as private commercial and industrial enterprises in the US and the Caribbean Basin. Most projects are competitively bid, with the award going to the lowest qualified bidder. In 2010, the US Army Corps of Engineers accounted for 28% of our total revenue. Our customer base shifts from time to time depending on the mix of contracts in progress.
Backlog
Our contract backlog represents our estimate of the revenues we expect to realize under the portion of the contracts remaining to be performed. Given the typical duration of our contracts, which ranges from three to nine months, our backlog at any point in time usually represents only a portion of the revenue that we expect to realize during a twelve month period. We include projects in our backlog only when the customer has provided an executed contract, purchase order or change order. Our backlog under contract as of December 31, 2010 was approximately $194.5 million and at December 31, 2009 was approximately $252.9 million. These estimates are subject to fluctuations based upon the scope of services to be provided, as well as factors affecting the time required to complete the project. In
addition, many projects that make up our backlog may be canceled at any time without penalty; however, we can generally recover actual committed costs and profit on work performed up to the date of cancellation. Although we have not been materially adversely affected by contract cancellations or modifications in the past, we may be, especially in economically uncertain periods. Consequently, backlog is not necessarily indicative of future results. In addition to our backlog under contract, we also have a substantial number of projects in negotiation or pending award at any given time.
Competition
We compete in our service areas of the Gulf Coast, the Atlantic Seaboard, and the Caribbean Basin, and in 2010 expanded into the West Coast and Canada, with several regional marine construction services companies and a few national marine construction services companies. From time to time, we compete with certain national land-based heavy civil contractors that have greater resources than we do. Our industry is highly fragmented with competitors generally varying within the markets we serve and with few competitors competing in all of the markets we serve or for all of the services that we provide. We believe that our turnkey capability, expertise, experience and reputation for providing safe and timely quality services, safety record and programs, equipment fleet, financial strength, surety bonding capacity,
knowledge of local markets and conditions, and project management and estimating abilities allow us to compete effectively. We believe significant barriers to entry exist in the markets in which we operate, including the ability to bond large projects, maritime laws, specialized marine equipment and technical experience; however, a U.S. company that has adequate financial resources, access to technical expertise and specialized equipment may become a competitor.
Bonding
In connection with our business, we generally are required to provide various types of surety bonds that provide an additional measure of security for our performance under certain government and private sector contracts. Our ability to obtain surety bonds depends upon our capitalization, working capital, past performance, management expertise, and external factors, including the capacity of the overall surety market. Surety companies consider such factors in light of the amount of our backlog that we have currently bonded and their current underwriting standards, which may change from time to time. The capacity of the surety market is subject to market-driven fluctuations driven primarily by the level of surety industry losses and the degree of surety market consolidation. The bonds we provide typically are for
the amount of the project and have face amounts ranging from approximately $1.0 to approximately $50.0 million. As of December 31, 2010, we had approximately $130.0 million in surety bonds outstanding. On December 31, 2010, we believe our capacity under our current bonding arrangement was in excess of $400.0 million in aggregate surety bonds.
-7-
Trade Names
We operate under a number of trade names, including Orion Marine Group, King Fisher Marine Service, Orion Construction, Orion Diving & Salvage, Misener Marine Construction Misener Diving & Salvage, F. Miller Construction, Orion Dredging Services, and in 2010, began operating under the trade names of T.W. LaQuay Dredging and Northwest Marine Construction. We do not generally register our trademarks with the U.S. Patent & Trademark Office, but instead rely on state and common law protections. While we consider our trade names to be valuable assets, we do not consider any single trademark or trade name to be of such material importance that its absence would cause a material disruption of our business.
Equipment
We operate and maintain a large and diverse equipment fleet, substantially all of which we own, that includes the following:
|
|
•
|
Barges — Spud barges, material barges, deck barges, anchor barges and fuel barges are used to provide work platforms for cranes and other equipment, to transport materials to the project site and to provide support for the project at the project site.
|
|
|
•
|
Dayboats — Small pushboats, dredge tenders and skiffs are used to shift barges at the project site, to move personnel and to provide general support to the project site.
|
|
|
•
|
Tugs — Larger pushboats and tug boats are used to transport barges and other support equipment to and from project site.
|
|
|
•
|
Dredges — 24” cutter head suction dredge (diesel), 20” cutter head suction dredge (diesel/electric), 20” cutter head suction dredges (diesel), 16” cutter head suction dredges, and 12” portable cutter head suction dredges are used to provide dredging services at project sites.
|
|
|
•
|
Cranes — Crawler lattice boom cranes with lift capability from 50 tons to 400 tons and hydraulic rough terrain cranes with lift capability from 15 tons to 60 tons are used to provide lifting and pile driving capabilities on project sites, and to provide bucket work, including mechanical dredging and dragline work, to project sites.
|
We believe that our equipment generally is well maintained and suitable for our current operations. We have the ability to extend the useful life of our equipment through capital refurbishment at periodic intervals. Most of our fleet is serviced by our own mechanics who work at various maintenance sites and facilities, including our dry dock facilities. We are also capable of building, and have built, much of our highly specialized equipment. Our strategy is to move our fleet from region to region as our projects require. We have pledged our owned equipment as collateral under our credit facility.
Equipment Certification
Some of our equipment requires certification by the U.S. Coast Guard and, where required, our vessels’ permissible loading capacities require certification by the American Bureau of Shipping (“ABS”). ABS is an independent classification society which certifies that certain of our larger, seagoing vessels are “in-class,” signifying that the vessels have been built and maintained in accordance with ABS rules and applicable U.S. Coast Guard rules and regulations. Many projects, such as beach nourishment projects with offshore sand requirements, dredging projects in exposed entrance channels, and dredging projects with offshore disposal areas, are restricted by federal regulations to be performed only by dredges or scows that have U.S. Coast Guard certification
and a load line established by the ABS. All of our vessels that are required to be certified by ABS have been certified as “in-class.” These certifications indicate that the vessels are structurally capable of operating in open waters, which enhances the mobility of our fleet.
-8-
Government Regulations
Our operations are subject to compliance with regulatory requirements of federal, state and local governmental agencies and authorities including the following:
|
|
•
|
regulations concerning workplace safety, labor relations and disadvantaged businesses;
|
|
|
•
|
licensing requirements applicable to shipping and dredging; and
|
|
|
•
|
permitting and inspection requirements applicable to marine construction projects.
|
We are also subject to government regulations pursuant to the Dredging Act, the Jones Act, the Shipping Act and the Vessel Documentation Act. These statutes require vessels engaged in the transport of merchandise or passengers between two points in the U.S. or dredging in the navigable waters of the U.S. to be documented with a coastwise endorsement, to be owned and controlled by U.S. citizens, to be manned by U.S. crews, and to be built in the U.S. The U.S. citizenship ownership and control standards require the vessel-owning entity to be at least 75% U.S.-citizen owned, and prohibit the demise or bareboat chartering of the vessel to any entity that does not meet the 75% U.S. citizen ownership test. These statutes, together with similar requirements for other sectors of the
maritime industry, are collectively referred to as “cabotage” laws.
We believe that we are in material compliance with applicable regulatory requirements and have all material licenses required to conduct our operations.
Environmental Matters
General
Our marine infrastructure construction, salvage, demolition, dredging and dredge material disposal activities are subject to stringent and complex federal, state, and local laws and regulations governing environmental protection, including air emissions, water quality, solid waste management, marine and bird species and their habitats, and wetlands. Such laws and regulations may require that we or our customers obtain, and that we comply with, various environmental permits, registrations, licenses and other approvals. These laws and regulations also can restrict or impact our business activities in many ways, such as delaying the appropriation and performance of particular projects; restricting the way we handle or dispose of wastes; requiring remedial action to mitigate pollution conditions that may be caused by
our operations or that are attributable to others; and enjoining some or all of our operations deemed in non-compliance with environmental laws and regulations. Failure to comply with these laws and regulations may result in the assessment of administrative, civil and/or criminal penalties, the imposition of remedial obligations and the issuance of orders enjoining future operations.
We believe that compliance with existing federal, state and local environmental laws and regulations will not have a material adverse effect on our business, results of operations, or financial condition. Nevertheless, the trend in environmental regulation is to place more restrictions and limitations on activities that may affect the environment. In addition, we could be affected by future laws or regulations, including those imposed in response to climate change concerns. As a result, there can be no assurance as to the amount or timing of future expenditures for environmental compliance or remediation, and actual future expenditures may be different from the amounts we currently anticipate. The following is a discussion of the environmental laws and regulations that could have a material effect on
our marine construction and other activities.
Waste Management
Our operations could be subject to the federal Resource Conservation and Recovery Act (“RCRA”) and comparable state laws, which impose detailed requirements for the handling, storage, treatment and disposal of hazardous and non-hazardous solid wastes. Under the auspices of the U.S. Environmental Protection Agency (“EPA”), the individual states administer some or all of the provisions of RCRA, sometimes in conjunction with their own more stringent requirements. Generators of hazardous wastes must comply with certain standards for the accumulation and storage of hazardous wastes, as well as recordkeeping and reporting requirements applicable to hazardous waste storage and disposal activities.
-9-
Site Remediation
The Comprehensive, Environmental Response, Compensation and Liability Act (“CERCLA”), also known as “Superfund,” and comparable state laws and regulations impose liability, without regard to fault or the legality of the original conduct, on certain classes of persons responsible for the release of hazardous substances into the environment. Such classes of persons include the current and past owners or operators of sites where a hazardous substance was released, and companies that disposed or arranged for the disposal of hazardous substances at offsite locations, such as landfills. CERCLA authorizes the EPA, and in some cases third parties, to take actions in response to threats to the public health or the environment and to seek to recover from the responsible classes of persons the costs
they incur. Under CERCLA, such persons may be subject to joint and several liability for the costs of cleaning up the hazardous substances that have been released into the environment, for damages to natural resources and for the costs of certain health studies. In addition, neighboring landowners and other third parties often file claims for personal injury and property damage allegedly caused by the hazardous substances released into the environment.
We currently own or lease properties that have been used by other industries for a number of years. Although we typically have used operating and disposal practices that were standard in the industry at the time, wastes may have been disposed of or released on or under the properties owned or leased by us, on or under other locations where such substances have been taken for disposal, or on or under project sites where we perform work. In addition, some of the properties may have been operated by third parties or by previous owners whose treatment and disposal or release of wastes was not under our control. These properties and the substances disposed or released on them may be subject to CERCLA, RCRA and analogous state laws. Under such laws, we could be required to remove or remediate previously disposed wastes
or property contamination, or to perform remedial activities to prevent future contamination.
Water Discharges
The Federal Water Pollution Control Act, also known as the Clean Water Act (“CWA”), and analogous state laws impose strict controls with respect to the discharge of pollutants, including spills and leaks of oil and other substances, into waters of the U.S., including wetlands. The discharge of pollutants into regulated waters is prohibited, except in accordance with the terms of a permit issued by the EPA or an analogous state agency. The CWA also regulates the discharge of dredged or fill material into waters of the U.S., and activities that result in such discharge generally require permits issued by the Corps of Engineers. Moreover, above ground storage of petroleum products is strictly regulated under the CWA. Under the CWA, federal and state regulatory agencies may impose
administrative, civil and/or criminal penalties for non-compliance with discharge permits or other requirements of the CWA and analogous state laws and regulations.
The Oil Pollution Act of 1990 (“OPA”), which amends and augments the CWA, establishes strict liability for owners and operators of facilities that are sites of releases of oil into waters of the U.S. OPA and its associated regulations impose a variety of requirements on responsible parties related to the prevention of oil spills and liability for damages resulting from such spills. For instance, OPA requires vessel owners and operators to establish and maintain evidence of financial responsibility sufficient to cover liabilities related to an oil spill for which such parties are statutorily responsible. We believe we are in compliance with all applicable OPA financial responsibility obligations. In addition, while OPA requires that certain vessels be outfitted with double hulls by
2015, given the make up and expected make up of our fleet of vessels, we do not expect to incur material expenditures to meet these requirements.
In February 2009, regulations promulgated by the EPA covering certain previously exempt discharges to water from certain marine vessels became effective. The regulations provide for a general permit to cover such discharges and impose on marine vessel operators, including the Company, certain discharge, permitting, recordkeeping, reporting, monitoring, maintenance, and operating restrictions and requirements with respect to materials that are or may be discharged from certain vessels. Applicability of these restrictions and requirements is based on size and type of vessel, and they apply only to a minority of the Company’s vessels. The Company, nevertheless, is implementing such restrictions and requirements with respect to its vessels which are subject thereto, and the
Company does not anticipate that such regulations or the associated permit terms, restrictions and requirements will adversely impact the Company’s business and results of operations.
-10-
Air Emissions
The Clean Air Act (“CAA”) and comparable state laws restrict the emission of air pollutants from many sources, including paint booths, and may require pre-approval for the construction or modification of certain facilities expected to produce air emissions, impose stringent air permit requirements, or require the utilization of specific equipment or technologies to control emissions. We believe that our operations are in substantial compliance with the CAA.
Climate Change
The U.S. Congress is actively considering legislation to reduce emissions of greenhouse gases in response to climate change concerns. In addition, several states have declined to wait on Congress to develop and implement climate control legislation and have already taken legal measures to reduce emissions of greenhouse gases. Passage of climate control legislation or other regulatory initiatives by Congress or various states of the U.S., or the adoption of regulations by the EPA and analogous state agencies that restrict emissions of greenhouse gases in areas in which we conduct business could have an adverse affect on our operations and demand for our services.
Endangered Species
The Endangered Species Act (“ESA”) restricts activities that may affect endangered species or their habitats. We conduct activities in or near areas that may be designated as habitat for endangered or threatened species. For instance, seasonal observation of endangered or threatened West Indian Manatees adjacent to work areas may impact construction operations within our Florida market. Manatees generally congregate near warm water sources during the cooler winter months. Additionally, our dredging operations in the Florida market are impacted by limitations for placement of dredge spoil materials on designated spoil disposal islands, from April through August of each year, when the islands are inhabited by nesting colonies of protected bird species. Further, restrictions on work during the Whooping
Crane nesting period in the Aransas Pass National Wildlife Refuge from October 1 through April 15 each year and during the non-dormant grass season for sea grass in the Laguna Madre from March 1 through November 30 each year impact our construction operations in the Texas Gulf Coast market. In addition, our West Coast operations are impacted by an in water work closure affecting work during the fish spawning window from mid February until mid July. We plan our operations and bidding activity with these restrictions and limitations in mind, and they have not materially hindered our business in the past. However, these and other restrictions may affect our ability to obtain work or to complete our projects on time in the future. In addition, while we believe that we are in material compliance with the ESA, the discovery of previously unidentified endangered species could cause us to incur additional costs or become subject to operating restrictions or bans in the affected
area.
Employees
At December 31, 2010, we had approximately 1,470 employees, 303 of whom were full-time salaried personnel and most of the remainder of whom were hourly personnel. We will hire additional employees for certain large projects and, subject to local market conditions, additional crew members are generally available for hire on relatively short notice. Our employees are not currently represented by labor unions, except certain employees located in the Pacific Northwest. We consider our relations with our employees to be good.
Financial Information About Geographic Areas
The Company primarily operates in the Gulf Coast, Atlantic Seaboard, and Pacific Northwest areas of the United States. Revenues generated outside the United States, primarily in the Caribbean Basin, totaled 5.4%, 14.0% and 7.0% of total revenues for the years ended December 31, 2010, 2009 and 2008, respectively. Our long-lived assets are substantially located in the United States.
-11-
Access to the Company’s Filings
The Company maintains a website at www.orionmarinegroup.com on which we make available, free of charge, access to the various reports we file with, or furnish to, the Securities and Exchange Commission (“SEC”). The website is made available for information purposes only. It should not be relied upon for investment purposes, and none of the information on our website is incorporated into this Annual Report on Form 10-K by reference. In addition, the public may read and copy any materials we file with the SEC at the SEC’s Public Reference Room at 100 F Street, NE, Room 1580, Washington, D.C. 20549. The public may obtain information on the
operation of the Public Reference Room by calling the SEC at 1-800-732-0330. The SEC also maintains an Internet site at www.sec.gov that contains reports, proxy and information statements and other information regarding issuers that file electronically with the SEC.
-12-
Item 1A. RISK FACTORS
Risk Factors Relating to Our Business
We may be unable to obtain sufficient bonding capacity for our contracts and the need for performance and surety bonds may adversely affect our business.
We are generally required to post bonds in connection with our contracts to ensure job completion if we were to fail to finish a project. We have entered into a bonding agreement with Liberty Mutual Surety of America (“Liberty”) pursuant to which Liberty acts as surety, issues bid bonds, performance bonds and payment bonds, and obligates itself upon other contracts of guaranty required by us in the day-to-day operations of our business. However, Liberty is not obligated under the bonding agreement to issue bonds for us. We may not be able to maintain a sufficient level of bonding capacity in the future, which could preclude us from being able to bid for certain contracts and successfully contract with certain customers, or increase our letter of credit utilization in lieu of bonds, thereby reducing
availability under our credit facility. In addition, the conditions of the bonding market may change, increasing our costs of bonding or restricting our ability to get new bonding which could have a material adverse effect on our business, operating results and financial condition.
Our business depends on key customer relationships and our reputation in the heavy civil marine infrastructure market, which is developed and maintained by our executives and key project managers. Loss of any of our relationships, reputation or chief executives or key project managers would materially reduce our revenues and profits.
Our contracts are typically entered into on a project-by-project basis, so we do not have continuing contractual commitments with our customers beyond the terms of the current contract. We benefit from key customer relationships built over time and with both public and private entities that are a part of or use the MTS. We also benefit from our reputation in the heavy civil marine infrastructure market developed over years of successfully performing on projects. Both of these aspects of our business were developed and are maintained through our executives and key project managers. We do not maintain key person life insurance policies on any of our employees. Our inability to retain our executives and key project managers would have a material adverse affect on our current customer relationships and reputation.
The inability to maintain relationships with these customers or obtain new customers based on our reputation could have a material adverse effect on our business, operating results and financial condition.
To be successful, we need to attract and retain qualified personnel, and any inability to do so would adversely affect our business.
Our future success depends on our ability to attract, retain and motivate highly skilled personnel in various areas, including engineering, project management, procurement, project controls, finance, and senior management. If we do not succeed in retaining and motivating our current employees and attracting new high quality employees, our business could be adversely affected. Accordingly, our ability to increase our productivity and profitability will be limited by our ability to employ, train and retain skilled personnel necessary to meet our requirements. We may not be able to maintain an adequate skilled labor force necessary to operate efficiently. Our labor expenses may also increase as a result of a shortage in the supply of skilled personnel, or we may have to curtail our planned internal growth as a
result of labor shortages. We may also spend considerable resources training employees who may then be hired by our competitors, forcing us to spend additional funds to attract personnel to fill those positions. In addition, certain of our employees hold licenses and permits under which we operate. The loss of any such employees could result in our inability to operate under such licenses and permits, which could adversely affect our operations until replacement licenses or permits are obtained. If we are unable to hire and retain qualified personnel in the future, there could be a material adverse effect on our business, operating results and financial condition.
-13-
We could lose money if we fail to accurately estimate our costs or fail to execute within our cost estimates on fixed-price, lump-sum contracts.
Most of our net revenue is derived from fixed-price, lump-sum contracts. Under these contracts, we perform our services and execute our projects at a fixed price and, as a result, benefit from cost savings, but we may be unable to recover any cost overruns. Fixed-price contracts carry inherent risks, including risks of losses from underestimating costs, operational difficulties and other changes that may occur over the contract period. If our cost estimates for a contract are inaccurate, or if we do not execute the contract within our cost estimates, we may incur losses or the project may not be as profitable as we expected. In addition, we are sometimes required to incur costs in connection with modifications to a contract (change orders) that may be unapproved by the customer as to scope and/or price, or to
incur unanticipated costs, including costs for customer-caused delays, errors in specifications or designs, or contract suspension or termination, that we may not be able to recover. These, in turn, could have a material adverse effect on our business, operating results and financial condition. The revenue, cost and gross profit realized on such contracts can vary, sometimes substantially, from the original projections due to changes in a variety of factors, such as:
|
|
•
|
failure to properly estimate costs of engineering, design, material, equipment or labor;
|
|
|
•
|
unanticipated technical problems with the structures or services being supplied by us, which may require that we spend our own money to remedy the problem;
|
|
|
•
|
project modifications creating unanticipated costs;
|
|
|
•
|
changes in the costs of equipment, materials, labor or subcontractors;
|
|
|
•
|
our suppliers’ or subcontractors’ failure to perform;
|
|
|
•
|
difficulties in our customers obtaining required governmental permits or approvals;
|
|
|
•
|
changes in local laws and regulations;
|
|
|
•
|
delays caused by local weather conditions; and
|
|
|
•
|
exacerbation of any one or more of these factors as projects grow in size and complexity.
|
These risks increase if the duration of the project is long-term because there is an elevated risk that the circumstances upon which we based our original bid will change in a manner that increases costs. In addition, we sometimes bear the risk of delays caused by unexpected conditions or events.
We may incur higher costs to acquire, manufacture and maintain equipment necessary for our operations.
We have traditionally owned most of the equipment used in our projects, and we do not bid on contracts for which we do not have, or cannot quickly procure, whether through construction, acquisition or lease, the necessary equipment. We are capable of building much of the specialized equipment used in our projects, including dayboats, tenders and dredges. To the extent that we are unable to buy or build equipment necessary for our needs, either due to a lack of available funding or equipment shortages in the marketplace, we may be forced to rent equipment on a short-term basis, which could increase the costs of completing contracts. In addition, our equipment requires continuous maintenance, which we provide through our own repair facilities and dry docks, as well as certification by the U.S. Coast Guard. If
we are unable to continue to maintain the equipment in our fleet or are unable to obtain the requisite certifications, we may be forced to obtain third-party repair services, be unable to use our uncertified equipment or be unable to bid on contracts, which could have a material adverse effect on our business, operating results and financial condition.
In addition, our vessels may be subject to arrest/seizure by claimants as security for maritime torts committed by the vessel or us or the failure by us to pay for necessaries, including fuel and repair services, which were furnished to the vessel. Such arrest/seizure could preclude the vessel from working, thereby causing delays in marine construction projects.
-14-
The timing of new contracts may result in unpredictable fluctuations in our cash flow and profitability. These factors as well as others that may cause our actual financial results to vary from any publicly disclosed earnings guidance and forecasts are outside of our control.
A substantial portion of our revenues is derived from project-based work. It is generally very difficult to predict the timing and location of awarded contracts. The selection of, timing of or failure to obtain projects, delays in awards of projects, the rebidding or termination of projects due to budget overruns, cancellations of projects or delays in completion of contracts could result in the under-utilization of our assets and reduce our cash flows. Even if we are awarded contracts, we face additional risks that could affect whether, or when, work will begin. For example, some of our contracts are subject to financing and other contingencies that may delay or result in termination of projects. This can present difficulty in matching workforce size and equipment location with contract needs. In some cases, we
may be required to bear the cost of a ready workforce and equipment that is larger than necessary, resulting in unpredictability in our cash flow, expenses and profitability. If an expected contract award or the related work release is delayed or not received, we could incur substantial costs without receipt of any corresponding revenues. Delays by our customers in obtaining required approvals for their infrastructure projects may delay their awarding contracts for those projects and, once awarded, the ability to commence construction under those contracts. Moreover, construction projects for which our services are contracted may require significant expenditures by us prior to receipt of relevant payments by a customer and may expose us to potential credit risk if such customer should encounter financial difficulties. Such expenditures could reduce our cash flows and necessitate increased borrowings under our credit facilities. Finally, the winding down or completion of work on
significant projects that were active in previous periods will reduce our revenue and earnings if such significant projects have not been replaced in the current period. From time-to-time we may publicly provide earnings or other forms of guidance, which reflect our predictions about future revenue, operating costs and capital structure, among other factors. Any such predictions may be impacted by these factors as well as others that are beyond our control and might not turn out to be correct.
We depend on continued federal, state and local government funding for marine infrastructure. A reduction in government funding for marine construction or maintenance contracts can materially reduce our results of operations.
Our operations depend on project funding by various government agencies and are adversely affected by decreased levels of, or delays in, government funding. A future decrease in government funding in any of our geographic markets could result in intense competition and pricing pressures for projects that we bid on in the future. As a result of competitive bidding and pricing pressures, we may be awarded fewer projects, which could have a material adverse effect on our business, operating results and financial condition.
A significant portion of our business is based on government contracts. Our operating results may be adversely affected by the terms of the government contracts or our failure to comply with applicable terms.
Government contracts are subject to specific procurement regulations, contract provisions and a variety of socioeconomic requirements relating to their formation, administration, performance and accounting. Many of these contracts include express or implied certifications of compliance with applicable laws and contract provisions. As a result of our government contracting and subcontracting, claims for civil or criminal fraud may be brought by the government for violations of these regulations, requirements or statutes. We may also be subject to qui tam litigation brought by private individuals on behalf of the government under the Federal Civil False Claims Act, which could include claims for up to treble damages. Further, if we fail to comply with any of these regulations, requirements or statutes, our existing
government contracts could be terminated, we could be suspended or debarred from government contracting or subcontracting, including federally funded projects at the state level. In addition, government customers typically can terminate or modify any of their contracts with us at their convenience, and certain government agencies may claim immunity from suit to recover disputed contract amounts. If our government contracts are terminated for any reason, or if we are suspended or debarred from government work, we could suffer a significant reduction in expected revenue which could have a material adverse effect on our business, operating results and financial condition.
-15-
We derive a significant portion of our revenues from a small group of customers. The loss of one or more of these customers could negatively impact our business, operating results and financial condition.
We believe that we will continue to rely on a relatively small group of customers for a substantial portion of our revenues for the foreseeable future. We may not be able to maintain our relationships with our significant customers. The loss of, or reduction of our sales to, any of our major customers could have a material adverse effect on our business, operating results and financial condition. See “Business — Customers” for a description of our largest customers.
We may not be able to fully realize the revenue value reported in our backlog.
We had a backlog of work to be completed on contracts totaling approximately $194.5 million as of December 31, 2010. Backlog develops as a result of new awards, which represent the revenue value of new project commitments received by us during a given period. Backlog consists of projects under contract which have either (a) not yet been started or (b) are in progress but are not yet complete. In the latter case, the revenue value reported in backlog is the remaining value associated with work that has not yet been completed. We cannot guarantee that the revenue projected in our backlog will be realized, or if realized, will result in earnings. From time-to-time, projects are cancelled that appeared to have a high certainty of going forward at the time they were recorded as new awards. In the event
of a project cancellation, we may be reimbursed for certain costs but typically have no contractual right to the total revenue reflected in our backlog. In addition to being unable to recover certain direct costs, cancelled projects may also result in additional unrecoverable costs due to the resulting under-utilization of our assets.
Our business is subject to significant operating risks and hazards that could result in damage or destruction to persons or property, which could result in losses or liabilities to us.
The businesses of marine infrastructure construction, port maintenance, dredging and salvage are generally subject to a number of risks and hazards, including environmental hazards, industrial accidents, adverse weather conditions, collisions with fixed objects, cave-ins, encountering unusual or unexpected geological formations, disruption of transportation services and flooding. These risks could result in damage to or destruction of, dredges, transportation vessels, other maritime structures and buildings, and could also result in personal injury or death, environmental damage, performance delays, monetary losses or legal liability.
Our safety record is an important consideration for our customers. If serious accidents or fatalities occur or our safety record was to deteriorate, we may be ineligible to bid on certain work, and existing service arrangements could be terminated. Further, regulatory changes implemented by OSHA or the U.S. Coast Guard could impose additional costs on us. Adverse experience with hazards and claims could have a negative effect on our reputation with our existing or potential new customers and our prospects for future work.
Our current insurance coverage may not be adequate, and we may not be able to obtain insurance at acceptable rates, or at all.
We maintain various insurance policies, including general liability and workers’ compensation. We are partially self-insured under some of our policies, and our insurance does not cover all types or amounts of liabilities. We are not required to, and do not, specifically set aside funds for our self-insurance programs.
-16-
At any given time, we are subject to multiple workers’ compensation and personal injury claims. We maintain substantial loss accruals for workers’ compensation claims, and our workers’ compensation and insurance costs have been rising for several years notwithstanding our emphasis on safety. Our insurance policies may not be adequate to protect us from liabilities that we incur in our business. In addition, some of the projects that we bid on require us to maintain builder’s risk insurance at high levels. We may not be able to obtain similar levels of insurance on reasonable terms, or at all. Our inability to obtain such insurance coverage at acceptable rates or at all could have a material adverse effect on our business, operating results and financial condition.
Furthermore, due to a variety of factors such as increases in claims and projected significant increases in medical costs and wages, our insurance premiums may increase in the future and we may not be able to obtain similar levels of insurance on reasonable terms, or at all. Any such inadequacy of, or inability to obtain, insurance coverage at acceptable rates, or at all, could have a material adverse effect on our business, operating results and financial condition.
Our employees are covered by federal laws that provide seagoing employees remedies for job-related claims in addition to those provided by state laws.
Many of our employees are covered by federal maritime law, including provisions of the Jones Act (“Jones Act”), the Longshore and Harbor Workers Act, (“USL&H”) and the Seaman’s Wage Act. Jones Act laws typically operate to make liability limits established by USL&H and state workers’ compensation laws inapplicable to these employees and to permit these employees and their representatives to pursue litigation against employers for job-related injuries. Because we are not generally protected by the limits imposed by state workers’ compensation statutes, we have greater exposure for claims made by these employees as compared to employers whose employees are not covered by these provisions.
For example, in the normal course of business, we are party to various personal injury lawsuits. We maintain insurance to cover claims that arise from injuries to our hourly workforce subject to a deductible. Over the last several years, there has been an increase in suits filed in Texas due in large part to two Texas law firms aggressively pursuing personal injury claims on behalf of dredging workers residing in Texas. Aggressive medical advice is increasing the seriousness of claimed injuries and the amount demanded in settlement. During fiscal 2010, we recorded approximately $2.0 million of expense for our self-insured portion of these liabilities. We believe our recorded self insurance reserves represent our best estimate of the outcomes of these claims. Should these trends persist; we could
continue to be negatively impacted in the future.
Many of our contracts have penalties for late completion.
In many instances, including in our fixed-price contracts, we guarantee that we will complete a project by a scheduled date. If we subsequently fail to complete the project as scheduled, we may be held responsible for cost impacts resulting from any delay, generally in the form of contractually agreed-upon liquidated damages. In addition, failure to maintain a required schedule could cause us to default on our government contracts, giving rise to a variety of potential damages. To the extent that these events occur, the total costs of the project could exceed our original estimates, and we could experience reduced profits or, in some cases, a loss for that project.
We may choose, or be required, to pay our suppliers and subcontractors even if our customers do not pay, or delay paying, us for the related services.
We use suppliers to obtain necessary materials and subcontractors to perform portions of our services and to manage work flow. In some cases, we pay our suppliers and subcontractors before our customers pay us for the related services. If we choose, or are required, to pay our suppliers and subcontractors for materials purchased and work performed for customers who fail to pay, or delay paying, us for the related work, we could experience a material adverse effect on our business, operating results and financial condition.
-17-
We extend credit to customers for purchases of our services, and in the past we have had, and in the future we may have, difficulty collecting receivables from major customers that have filed bankruptcy or are otherwise experiencing financial difficulties.
We generally perform services in advance of payment for our customers, which include governmental entities, general contractors, and builders, owners and managers of marine and port facilities located primarily in the Gulf Coast, the Atlantic Seaboard, the Pacific Northwest, and the Caribbean Basin. Consequently, we are subject to potential credit risk related to changes in business and economic factors. On occasion, we have had difficulty collecting from governmental entities or customers with financial difficulties. If we cannot collect receivables for present or future services, we could experience reduced cash flows and losses beyond our established reserves.
Our strategy of growing through strategic acquisitions may not be successful.
We may pursue growth through the acquisition of companies or assets that will enable us to broaden the types of projects we execute and also expand into new markets. We have completed several acquisitions and plan to consider strategic acquisitions in the future. We may be unable to implement this growth strategy if we cannot identify suitable companies or assets or reach agreement on potential strategic acquisitions on acceptable terms. Moreover, an acquisition involves certain risks, including:
|
|
•
|
difficulties in the integration of operations, systems, policies and procedures;
|
|
|
•
|
enhancements in our controls and procedures including those necessary for a public company may make it more difficult to integrate operations and systems;
|
|
|
•
|
failure to implement proper overall business controls, including those required to support our growth, resulting in inconsistent operating and financial practices at companies we acquire or have acquired;
|
|
|
•
|
termination of relationships with the key personnel and customers of an acquired company;
|
|
|
•
|
additional financial and accounting challenges and complexities in areas such as tax planning, treasury management, financial reporting and internal controls;
|
|
|
•
|
the incurrence of environmental and other liabilities, including liabilities arising from the operation of an acquired business or asset prior to our acquisition for which we are not indemnified or for which the indemnity is inadequate;
|
|
|
•
|
disruption of or receipt of insufficient management attention to our ongoing business; and
|
|
|
•
|
inability to realize the cost savings or other financial benefits that we anticipate.
|
Future acquisitions may require us to obtain additional equity or debt financing, which may not be available on attractive terms. Moreover, to the extent an acquisition transaction financed by non-equity consideration results in additional goodwill, it will reduce our tangible net worth, which might have an adverse effect on our credit and bonding capacity.
The anticipated investment in port and marine infrastructure may not be as large as expected, which may result in periods of low demand for our services.
The demand for port construction, maintenance infrastructure services and dredging may be vulnerable to downturns in the economy generally and in the marine transportation industry specifically. The amount of capital expenditures on port facilities and marine infrastructure in our markets is affected by the actual and anticipated shipping and vessel needs of the economy in general and in our geographic markets in particular. If the general level of economic activity deteriorates, our customers may delay or cancel expansions, upgrades, maintenance and repairs to their infrastructure. A number of other factors, including the financial condition of the industry, could adversely affect our customers and their ability or willingness to fund capital expenditures in the future. During downturns in the U.S. or world
economies, the anticipated port usage in our geographic markets may decline, resulting in less port construction, upgrading and maintenance. As a result, demand for our services could substantially decline for extended periods.
-18-
Any adverse change to the economy or business environment in the regions in which we operate could significantly affect our operations, which would lead to lower revenues and reduced profitability.
Our operations are currently concentrated in the Gulf Coast, the Atlantic Seaboard and the Caribbean Basin and we recently expanded into the Pacific Northwest. Because of this concentration in a specific geographic location, we are susceptible to fluctuations in our business caused by adverse economic or other conditions in this region, including natural or other disasters.
During the ordinary course of our business, we may become subject to lawsuits or indemnity claims, which could materially and adversely affect our business, operating results and financial condition.
We have been and may from time to time be named as a defendant in legal actions claiming damages in connection with marine infrastructure projects and other matters. These are typically claims that arise in the normal course of business, including employment-related claims and contractual disputes or claims for personal injury (including asbestos-related lawsuits) or property damage which occurs in connection with services performed relating to project or construction sites. These actions may seek, among other things, compensation for alleged personal injury, workers’ compensation, employment discrimination, breach of contract, property damage, environmental damage, punitive damages, civil penalties or other losses, consequential damages or injunctive or declaratory relief. Contractual disputes normally
involve claims relating to the timely completion of projects, performance of equipment, design or other engineering services or project services. We may incur liabilities that may not be covered by insurance policies, or, if covered, the dollar amount of such liabilities may exceed our policy limits or fall below applicable deductibles. A partially or completely uninsured claim, if successful and of significant magnitude, could cause us to suffer a significant loss and reduce cash available for our operations.
Furthermore, our services are integral to the operation and performance of the marine infrastructure. As a result, we may become subject to lawsuits or claims for any failure of the infrastructure that we work on, even if our services are not the cause for such failures. In addition, we may incur civil and criminal liabilities to the extent that our services contributed to any property damage or personal injury. With respect to such lawsuits, claims, proceedings and indemnities, we have and will accrue reserves in accordance with generally accepted accounting principles (“GAAP”). In the event that such actions or indemnities are ultimately resolved unfavorably at amounts exceeding our accrued reserves, or at material amounts, the outcome could materially and adversely affect our reputation, business,
operating results and financial condition. In addition, payments of significant amounts, even if reserved, could adversely affect our liquidity position.
We are currently engaged in litigation related to claims arising from Hurricane Katrina. See “Business — Legal Proceedings.”
Our operations are subject to environmental laws and regulations that may expose us to significant costs and liabilities.
Our marine infrastructure construction, salvage, demolition, dredging and dredge material disposal activities are subject to stringent and complex federal, state and local environmental laws and regulations, including those concerning air emissions, water quality, solid waste management, and protection of certain marine and bird species, their habitats, and wetlands. We may incur substantial costs in order to conduct our operations in compliance with these laws and regulations. For instance, we may be required to obtain, maintain and comply with permits and other approvals (as well as those obtained for projects by our customers) issued by various federal, state and local governmental authorities; limit or prevent releases of materials from our operations in accordance with these permits and approvals; and
install pollution control equipment. In addition, compliance with environmental laws and regulations can delay or prevent our performance of a particular project and increase related project costs. Moreover, new, stricter environmental laws, regulations or enforcement policies, including those imposed in response to climate change, could be implemented that significantly increase our compliance costs, or require us to adopt more costly methods of operation.
-19-
Failure to comply with environmental laws and regulations, or the permits issued under them, may result in the assessment of administrative, civil and criminal penalties, the imposition of remedial obligations and the issuance of injunctions limiting or preventing some or all of our operations. In addition, strict joint and several liability may be imposed under certain environmental laws, which could cause us to become liable for the investigation or remediation of environmental contamination that resulted from the conduct of others or from our own actions that were in compliance with all applicable laws at the time those actions were taken. Further, it is possible that we may be exposed to liability due to releases of pollutants, or other environmental impacts that may arise in the course of our operations. For
instance, some of the work we perform is in underground and water environments, and if the field location maps or waterway charts supplied to us are not accurate, or if objects are present in the soil or water that are not indicated on the field location maps or waterway charts, our underground and underwater work could strike objects in the soil or the waterway bottom containing pollutants and result in a rupture and discharge of pollutants. In addition, we sometimes perform directional drilling operations below certain environmentally sensitive terrains and water bodies, and due to the inconsistent nature of the terrain and water bodies, it is possible that such directional drilling may cause a surface fracture releasing subsurface materials. These releases may contain contaminants in excess of amounts permitted by law, may expose us to remediation costs and fines and legal actions by private parties seeking damages for non-compliance with environmental laws and regulations or for
personal injury or property damage. We may not be able to recover some or any of these costs through insurance or increased revenues, which may have a material adverse effect on our business, operating results and financial condition. See “Business — Environmental Matters” for more information.
Our operations are susceptible to adverse weather conditions in our regions of operation.
Our business, operating results and financial condition could be materially and adversely affected by severe weather, particularly along the Gulf Coast, the Atlantic Seaboard and Caribbean Basin where we have concentrated operations. Repercussions of severe weather conditions may include:
|
|
•
|
evacuation of personnel and curtailment of services;
|
|
|
•
|
weather-related damage to our equipment, facilities and project work sites resulting in suspension of operations;
|
|
|
•
|
inability to deliver materials to jobsites in accordance with contract schedules; and
|
|
|
•
|
loss of productivity.
|
Our dependence on petroleum-based products increases our costs as the prices of such products increase, which could adversely affect our business, operating results and financial condition.
We use diesel fuel and other petroleum-based products to operate our equipment used in our construction contracts. Decreased supplies of those products relative to demand and other factors can cause an increase in their cost. Future increases in the costs of fuel and other petroleum-based products used in our business, particularly if a bid has been submitted for a contract and the costs of those products have been estimated at amounts less than the actual costs thereof, could result in a lower profit, or a loss, on one or more contracts.
Terrorist attacks at port facilities could negatively impact the markets in which we operate.
Terrorist attacks, like those that occurred on September 11, 2001, targeted at ports, marine facilities or shipping could affect the markets in which we operate our business and our expectations. Increased armed hostilities, terrorist attacks or responses from the U.S. may lead to further acts of terrorism and civil disturbances in the U.S. or elsewhere, which may further contribute to economic instability in the U.S. These attacks or armed conflicts may affect our operations or those of our customers or suppliers and could impact our revenues, our production capability and our ability to complete contracts in a timely manner.
-20-
We may be subject to unionization, work stoppages, slowdowns or increased labor costs.
We primarily have a non-union workforce. If our employees unionize, it could result in demands that may increase our operating expenses and adversely affect our profitability. Each of our different employee groups could unionize at any time and would require separate collective bargaining agreements. If any group of our employees were to unionize and we were unable to agree on the terms of their collective bargaining agreement or we were to experience widespread employee dissatisfaction, we could be subject to work slowdowns or stoppages. In addition, we may be subject to disruptions by organized labor groups protesting our non-union status. Any of these events would be disruptive to our operations and could have a material adverse effect on our business, operating results and financial condition.
We may be unable to sustain our historical revenue growth rate.
Our revenue has grown rapidly in recent years. However, we may be unable to sustain our recent revenue growth rate for a variety of reasons, including limits on additional growth in our current markets, less success in competitive bidding for contracts, limitations on access to necessary working capital and investment capital to sustain growth, limitations on access to bonding to support increased contracts and operations, the inability to hire and retain essential personnel and to acquire equipment to support growth, and the inability to identify acquisition candidates and successfully integrate them into our business. A decline in our revenue growth could have a material adverse effect on our business, operating results and financial condition if we are unable to reduce the growth of our operating
expenses at the same rate.
We are subject to risks related to our international operations.
Approximately 5% of our revenue in 2010 was derived from international markets. We presently conduct projects in the Caribbean Basin. International operations subject us to additional risks, including:
|
|
•
|
uncertainties concerning import and export license requirements, tariffs and other trade barriers;
|
|
|
•
|
restrictions on repatriating foreign profits back to the U.S.;
|
|
|
•
|
changes in foreign policies and regulatory requirements;
|
|
|
•
|
difficulties in staffing and managing international operations;
|
|
|
•
|
taxation issues;
|
|
|
•
|
currency fluctuations; and
|
|
|
•
|
political, cultural and economic uncertainties.
|
These risks could restrict our ability to provide services to international customers and could have a material adverse effect on our business, operating results and financial condition.
Restrictions on foreign ownership of our vessels could limit our ability to sell off any portion of our business or result in the forfeiture of our vessels or in our inability to continue our operations in U.S. navigable waters.
The Dredging Act, the Jones Act, the Shipping Act and the Vessel Documentation Act require vessels engaged in the transport of merchandise or passengers between two points in the U.S. or dredging in the navigable waters of the U.S. to be owned and controlled by U.S. citizens. The U.S. citizen ownership and control standards require the vessel-owning entity to be at least 75% U.S. citizen-owned, thus restricting foreign ownership interests in the entities that directly or indirectly own the vessels which we operate. If we were to seek to sell any portion of our business unit that owns any of these vessels, we may have fewer potential purchasers, since some potential purchasers might be unable or unwilling to satisfy the foreign ownership restrictions described above; additionally, any
sales of certain of our larger vessels to foreign buyers would be subject to approval by the U.S. Maritime Administration. As a result, the sales price for that portion of our business may not attain the amount that could be obtained in an unregulated market. Furthermore, although our certificate of incorporation contains provisions limiting ownership of our capital stock by non-U.S. citizens, foreign ownership is difficult to track and if we or any operating subsidiaries cease to be 75% controlled and owned by U.S. citizens, we would become ineligible to continue our operations in U.S. navigable waters and may become subject to penalties and risk forfeiture of our vessels.
-21-
We may be vulnerable to the cyclical nature of the markets in which our customers operate, which may be exacerbated during economic downturns.
Current global economic conditions are affecting numerous industries and companies and many states are facing difficult budget decisions which could result in reduced demand for general construction projects. This reduced demand may increase the number of potential bidders in our markets and could increase the competitive environment through pressure on pricing. Budgeting decisions and constraints due to the tight credit markets may result in diversion of governmental funding from projects we perform to other uses. A weak economy may also produce less tax revenue, thereby decreasing funds for public sector projects. Lower levels of activity may result in a corresponding decline in the demand for our services, which could have a material adverse effect on our revenue and
profitability.
Negative conditions in the credit and financial markets could impair our ability to operate our business, or implement our acquisition strategies
Due to the continuing instability of the credit markets in the United States and abroad, the availability of credit has continued to be relatively difficult or expensive to obtain in spite of government efforts to increase liquidity and hold or reduce interest rates. We may face challenges if conditions in the financial markets do not improve. While these conditions have not impaired the Company’s ability to access credit markets and finance operations, at this time, there can be no assurance that there will not be a further deterioration in financial markets and confidence in major economies. A continuing shortage of liquidity could have an impact on the lenders under our credit facility or on our customers.
Risk Factors Related to our Accounting, Financial Results and Financing Plans
Actual results could differ from the estimates and assumptions that we use to prepare our financial statements.
To prepare financial statements in conformity with GAAP, management is required to make estimates and assumptions as of the date of the financial statements, which affect the reported values of assets and liabilities, revenues and expenses, and disclosures of contingent assets and liabilities. Areas requiring significant estimates by our management include: contract costs and profits, application of percentage-of-completion accounting, and revenue recognition of contract change order claims; provisions for uncollectible receivables and customer claims and recoveries of costs from subcontractors, suppliers and others; valuation of assets acquired and liabilities assumed in connection with business combinations; accruals for estimated liabilities, including litigation and insurance reserves; and the value of our
deferred tax assets. Our actual results could differ from those estimates.
Our use of the percentage-of-completion method of accounting could result in a reduction or reversal of previously recorded revenue and profit.
In particular, as is more fully discussed in “Management’s Discussion and Analysis of Financial Condition and Results of Operations — Critical Accounting Policies,” we recognize contract revenue using the percentage-of-completion method. A significant portion of our work is performed on a fixed-price or lump-sum basis. The balance of our work is performed on variations of cost reimbursable and target price approaches. Contract revenue is accrued based on the percentage that actual costs-to-date bear to total estimated costs. We utilize this cost-to-cost approach as we believe this method is less subjective than relying on assessments of physical progress. Under the cost-to-cost approach, while the most widely recognized method used for percentage-of-completion accounting, the use of
estimated cost to complete each contract is a significant variable in the process of determining income earned and is a significant factor in the accounting for contracts. The cumulative impact of revisions in total cost estimates during the progress of work is reflected in the period in which these changes become known. Due to the various estimates inherent in our contract accounting, actual results could differ from those estimates, which may result in a reduction or reversal of previously recorded revenue and profit.
-22-
Failure to establish and maintain effective internal control over financial reporting could have a material adverse effect on our business, operating results and stock value.
Maintaining effective internal control over financial reporting is necessary for us to produce reliable financial reports and is important in helping to prevent financial fraud. If we are unable to achieve and maintain adequate internal controls, our business, operating results and financial condition could be harmed. We are required under Section 404 of the Sarbanes-Oxley Act of 2002 (“SOX”) and the related rules of the SEC to annually assess the effectiveness of our internal controls over financial reporting and our independent registered public accounting firm is required to issue a report on the effectiveness of our internal control over financial reporting. During the course of the related documentation and testing, we may identify significant deficiencies or material weaknesses that we may be
unable to remediate before the requisite deadline for those reports. If our management or our independent registered public accounting firm were to conclude in their reports that our internal control over financial reporting was not effective, this could have a material adverse effect on our ability to process and report financial information and the value of our common stock could significantly decline.
Our bonding requirements may limit our ability to incur indebtedness.
We generally are required to provide various types of surety bonds that provide an additional measure of security for our performance under certain government and private sector contracts. Our ability to obtain surety bonds depends upon various factors including our capitalization, working capital and amount of our indebtedness. In order to help ensure that we can obtain required bonds, we may be limited in our ability to incur additional indebtedness that may be needed for potential acquisitions and operations. Our inability to incur additional indebtedness could have a material adverse effect on our business, operating results and financial condition.
The downturn in economic conditions may impact our customers’ ability to pay for services and finance projects.
Our primary customers are governmental agencies in the United States, as well as a wide variety of private customers in diverse industries. It is possible that the credit crisis and current economic conditions may affect some of our customers’ ability to access sufficient capital to finance or complete projects. Our cash flows may be adversely impacted through customer delays in payment or non-payment of our accounts receivable, or through delays or cancellations of projects awarded to us. We monitor our accounts receivable balances closely and maintain contact with our customers to assess the economic viability of projects in process.
Risks related to ownership of our common stock
The price of our common stock may be volatile.
The market price of our common stock may be influenced by many factors, some of which are beyond our control, including actual or anticipated fluctuations in our operating results, or those of our competitors, public announcements by us or our competitors regarding acquisitions, strategic investments, project awards, the financial market and general economic conditions, changes in stock market analyst recommendations, sales of common stock by our executive officers, directors and/or significant stockholders, as well as reactions to those described above under “Risk Factors related to our Business”.
Certain provisions of our certificate of incorporation and bylaws and of Delaware law may make it difficult for stockholders to change the composition of our board of directors and may discourage a takeover or change of control.
-23-
We are a Delaware corporation. Various anti-takeover provisions under Delaware law impose impediments on the ability of others to acquire control of us, even if a change of control would be beneficial to our shareholders. In addition, certain provisions of our charters and bylaws may impede or discourage a takeover. For example:
• our Board of Directors is divided into three classes serving staggered three-year terms;
• vacancies on the Board of Directors can only be filled by other directors;
• there are various restrictions on the ability of a shareholder to nominate a director for election; and
• our Board of Directors can authorize the issuance of preference shares.
These types of provisions in our charters and bylaws could also make it more difficult for a third party to acquire control of us, even if the acquisition would be beneficial to our shareholders. Accordingly, shareholders may be limited in the ability to obtain a premium for their shares.
Item 1B. UNRESOLVED STAFF COMMENTS
None
-24-
Item 2. PROPERTIES
Our corporate headquarters is located at 12000 Aerospace, Suite 300, Houston, Texas 77034, with 10,983 square feet of office space that we lease, with an initial term expiring February 28, 2017 and with two five year extensions at our option. Our finance and executive offices are located at this facility. As of December 31, 2010, we owned or leased the following additional facilities:
|
Location
|
Type of Facility
|
Size
|
Leased or Owned
|
|||
|
159 Highway 316
Port Lavaca, TX
|
Waterfront maintenance and dock facilities, equipment yard and dry dock
|
17.5 acres
|
Owned
|
|||
|
17140 Market Street
Channelview, TX
|
Waterfront maintenance and dock facilities and equipment yard
|
23.7 acres
|
Owned
|
|||
|
619 Bay View Drive
Port Lavaca, TX
|
Waterfront maintenance and dock facilities and equipment yard; regional office
|
25.3 acres
|
Owned
|
|||
|
931 West Main St.
Port Lavaca, TX
|
Warehouse
|
2.1 acres
|
Owned
|
|||
|
2705 State Hwy 146
Baytown, TX
|
Waterfront property
|
10.0 acres
|
Owned
|
|||
|
5600 West Commerce Street
Tampa, FL
|
Waterfront maintenance and dock facilities; equipment yard and dry dock
|
9.1 acres
|
Owned
|
|||
|
12550 Fuqua
Houston, TX
|
Regional office
|
16,440 square feet
|
Leased
|
|||
|
1500 Main Street
Ingleside, TX
|
Regional office
|
4 acres
|
Leased
|
|||
|
City of Port Lavaca Port Commission
Port Lavaca, Texas
|
Safe harbor
|
6.6 acres
|
Leased
|
|||
|
825 Ryan Street
Lake Charles, LA
|
Regional office
|
6,500 square feet
|
Leased
|
|||
|
Dock Board Road
Sulphur, LA
|
Waterfront maintenance and dock facilities; equipment yard
|
4.37 acres
|
Leased
|
|||
|
2400 Veterans Boulevard
Kenner, LA
|
Regional office
|
2,715 square feet
|
Leased
|
|||
|
321 Great Bridge Blvd., Chesapeake, VA
|
Regional office
|
1,500 square feet
|
Leased
|
-25-
|
Location
|
Type of Facility
|
Size
|
Leased or Owned
|
|||
|
5440 W. Tyson Avenue
Tampa, FL
|
Regional office
|
6,160 square feet
|
Leased
|
|||
|
1901 Hill Street
Jacksonville, FL
|
Waterfront maintenance and dock facilities and equipment yard
|
Estimated less than 5 acres
|
Leased
|
|||
|
1110 Alexander Avenue
Tacoma, WA
|
Waterfront maintenance and dock facilities and equipment yard
|
Estimated 3.5 acres
|
Leased
|
We believe that our existing facilities are adequate for our operations. We do not believe that any single facility is material to our operations and, if necessary, we could readily obtain a replacement facility. Our real estate assets are pledged to secure our credit facility.
-26-
Item 3. LEGAL PROCEEDINGS
Although we are subject to various claims and legal actions that arise in the ordinary course of business, except as described below, we are not currently a party to any material legal proceedings or environmental claims.
The Company was named as one of a substantial number of defendants in numerous individual claims and lawsuits brought by the residents and landowners of New Orleans, Louisiana and surrounding areas in the United States District Court for the Eastern District of Louisiana. These suits have been classified as a subcategory of suits under the more expansive proceeding, In re Canal Breaches Consolidation Litigation, Civil Action No: 05-4182, (E.D. La,), which was instituted in late 2005. While not technically class actions, the individual claims and lawsuits are being prosecuted in a manner similar to that employed for federal class actions. The claims are based on flooding and related damage from Hurricane Katrina. In general, the claimants state that the
flooding and related damage resulted from the failure of certain aspects of the levee system constructed by the Corps of Engineers, and the claimants seek recovery of alleged general and special damages. The Corps of Engineers contracted with various private dredging companies, including us, to perform maintenance dredging of the waterways. On October 15, 2010, the United States Court of Appeals for the Fifth Circuit affirmed the lower court’s decision and dismissed the claimants’ suit against us and all defendant dredgers.
From time to time, we are a party to various other lawsuits, claims and other legal proceedings that arise in the ordinary course of our business. These actions typically seek, among other things, compensation for alleged personal injury, breach of contract, property damage, punitive damages, civil penalties or other losses, or injunctive or declaratory relief. With respect to such lawsuits, claims and proceedings, we accrue reserves when it is probable a liability has been incurred and the amount of loss can be reasonably estimated. We do not believe any of these proceedings, individually or in the aggregate, would be expected to have a material adverse effect on our results of operations, cash flows, or on our financial condition.
Item 4. RESERVED
-27-
PART II
|
Item 5.
|
MARKET FOR REGISTRANT’S COMMON EQUITY, RELATED STOCKHOLDER MATTERS AND ISSUER PURCHASES OF EQUITY SECURITIES
|
Market Information
Our common stock listed on the New York Stock Exchange (“NYSE”) on May 13, 2009, and trades under the symbol “ORN”. Prior to that date, we were listed on the NASDAQ Stock Market, LLC and traded under the symbol “OMGI”. We have provided to the NYSE, without qualification, the required certification regarding compliance with NYSE corporate governance listing standards.
The following table sets forth the low and high prices of a share of our common stock during each of the fiscal quarters presented, based on NYSE and NASDAQ Stock Market LLC reports:
|
Low
|
High
|
|||||||
|
2010
|
||||||||
|
Fourth quarter – December 31
|
$ | 11.08 | $ | 15.88 | ||||
|
Third quarter – September 30
|
$ | 10.75 | $ | 14.02 | ||||
|
Second quarter – June 30
|
$ | 13.69 | $ | 19.80 | ||||
|
First quarter – March 31
|
$ | 16.23 | $ | 22.37 | ||||
|
2009
|
||||||||
|
Fourth quarter – December 31
|
$ | 17.57 | $ | 24.38 | ||||
|
Third quarter – September 30
|
$ | 16.58 | $ | 24.98 | ||||
|
Second quarter – June 30
|
$ | 11.65 | $ | 22.84 | ||||
|
First quarter – March 31
|
$ | 7.93 | $ | 13.48 | ||||
Holders
As of December 31, 2010, we had approximately 6,347 stockholders of record including beneficial holders.
Dividends
For the foreseeable future, we intend to retain earnings to grow our business and do not intend to pay dividends on our common stock. We have not historically paid dividends and payments of future dividends, if any, will be at the discretion of our board of directors and will depend on many factors, including general economic and business conditions, our strategic plans, our financial results and condition, legal requirements, and other factors that our board of directors deems relevant. Our existing credit facility restricts our ability to pay cash dividends on our common stock, and we may also enter into credit agreements or other borrowing arrangements in the future that will restrict our ability to declare or pay cash dividends on our common stock.
-28-
Securities Authorized for Issuance Under Equity Compensation Plans
The following table presents certain information about our equity compensation plans as of December 31, 2010:
|
Plan category
|
Column A
|
Column B
|
Column C
|
|||||||||
|
Number of
securities to be
issued upon
exercise of
outstanding
options,
warrants and
rights
|
Weighted
average exercise
price of
outstanding
options,
warrants and
rights
|
Number of
securities
remaining
available for
future issuance
under equity
compensation
plans (excluding
securities
reflected in
Column A)
|
||||||||||
|
Equity compensation plans approved by shareholders
|
2,606,629 | $ | 7.45 | 50,329 | ||||||||
|
Equity compensation plans not approved by shareholders
|
— | — | — | |||||||||
|
Total
|
2,606,629 | $ | 7.45 | 50,329 | ||||||||
-29-
Performance Graph*
The following graph shows the changes, since our common stock began trading on the NASDAQ Global Market on December 20, 2007, in the value of $100 invested in (1) the common stock of Orion Marine Group, Inc., (2) the Standard & Poor’s 500 Index and (3) the Dow Jones Heavy Construction Group Index. The values of each investment are based on share price appreciation, with reinvestment of all dividends, assuming any were paid. For each graph, the investments are assumed to have occurred at the beginning of each period.
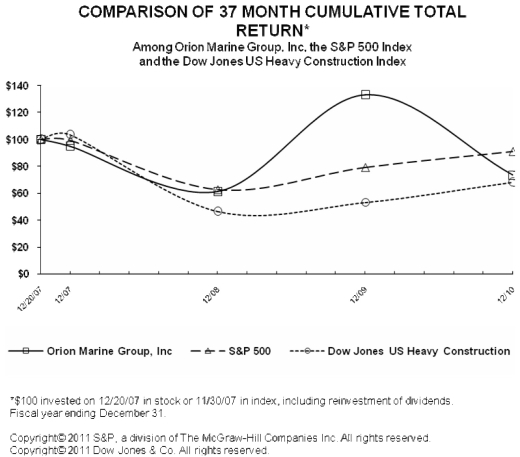
|
2007
|
2007
|
2008
|
2009
|
2010
|
||||||||||||||||
|
Orion Marine Group, Inc.
|
100.00 | 94.94 | 61.14 | 133.29 | 73.42 | |||||||||||||||
|
S&P 500
|
100.00 | 99.31 | 62.56 | 79.12 | 91.04 | |||||||||||||||
|
Dow Jones US Heavy Civil Construction
|
100.00 | 103.61 | 46.50 | 53.15 | 68.24 | |||||||||||||||
Note: The above information was provided by Research Data Group, Inc.
*This table and the information therein is being furnished but not filed.
-30-
|
Item 6.
|
SELECTED FINANCIAL DATA
|
The following table presents selected financial data for each of the last five fiscal years. This selected financial data should be read in conjunction with the Consolidated Financial Statements and related notes beginning on page F-1 of this Annual Report on Form 10-K and Item 7 “Management’s Discussion and Analysis of Financial Condition and Results of Operations”. These historical results are not necessarily indicative of the results of operations to be expected for any future period. Computations of basic and dilutes earnings per share have been adjusted retroactively for all periods presented to reflect a 2.23 for one reverse split of the Company’s common stock in 2007.
The table below includes the non-GAAP financial measure of EBITDA. For a definition of EBITDA and a reconciliation to net income calculated and presented in accordance with GAAP, please see “Non-GAAP Financial Measures” immediately below.
|
Amounts in thousands, except share and per share information
|
||||||||||||||||||||
|
2010
|
2009
|
2008
|
2007
|
2006
|
||||||||||||||||
|
Contract revenues
|
$ | 353,135 | $ | 293,494 | $ | 261,802 | $ | 210,360 | $ | 183,278 | ||||||||||
|
Gross profit
|
65,233 | 62,697 | 50,451 | 50,433 | 38,537 | |||||||||||||||
|
Selling, general and administrative expenses
|
32,646 | 30,695 | 27,730 | 22,738 | 17,247 | |||||||||||||||
|
Other (income) expense, net
|
(1,254 | ) | 438 | 964 | 118 | 1,933 | ||||||||||||||
|
Net income
|
21,882 | 20,030 | 14,475 | 17,399 | 12,403 | |||||||||||||||
|
Preferred dividends
|
— | — | — | 782 | 2,100 | |||||||||||||||
|
Income available to common shareholders
|
$ | 21,882 | $ | 20,030 | $ | 14,475 | $ | 16,617 | $ | 10,303 | ||||||||||
|
Net income per share available to common shareholders:
|
||||||||||||||||||||
|
Basic
|
$ | 0.81 | $ | 0.85 | $ | 0.67 | $ | 0.86 | $ | 0.62 | ||||||||||
|
Diluted
|
$ | 0.81 | $ | 0.84 | $ | 0.66 | $ | 0.83 | $ | 0.61 | ||||||||||
|
Weighted average shares outstanding;
|
||||||||||||||||||||
|
Basic
|
26,899,373 | 23,577,854 | 21,561,201 | 19,657,436 | 16,630,045 | |||||||||||||||
|
Diluted
|
27,165,852 | 23,979,943 | 21,979,535 | 19,976,683 | 16,958,453 | |||||||||||||||
|
Other Financial Data
|
||||||||||||||||||||
|
EBITDA
|
$ | 53,634 | $ | 50,538 | $ | 41,321 | $ | 40,079 | $ | 33,003 | ||||||||||
|
Capital expenditures
|
29,050 | 22,693 | 14,485 | 11,433 | 11,931 | |||||||||||||||
|
Cash interest expense
|
547 | 553 | 1,234 | 927 | 2,848 | |||||||||||||||
|
Depreciation and amortization*
|
19,458 | 18,536 | 18,848 | 12,592 | 11,805 | |||||||||||||||
|
Net cash provided by (used in):
|
||||||||||||||||||||
|
Operating activities
|
13,839 | 40,336 | 26,471 | 10,092 | 32,475 | |||||||||||||||
|
Investing activities
|
(95,755 | ) | (21,598 | ) | (47,337 | ) | (9,463 | ) | (11,987 | ) | ||||||||||
|
Financing activities
|
354 | 60,286 | 33,994 | (6,606 | ) | (9,572 | ) | |||||||||||||
*includes depreciation and amortization of finite lived intangible assets
|
2010
|
2009
|
2008
|
2007
|
2006
|
||||||||||||||||
|
(in thousands)
|
||||||||||||||||||||
|
Balance Sheet Data:
|
||||||||||||||||||||
|
Cash and cash equivalents
|
$ | 23,174 | $ | 104,736 | $ | 25,712 | $ | 12,584 | $ | 18,561 | ||||||||||
|
Working capital
|
76,729 | 130,760 | 47,021 | 32,452 | 12,970 | |||||||||||||||
|
Total assets
|
307,579 | 273,157 | 186,322 | 133,534 | 125,072 | |||||||||||||||
|
Total debt
|
— | — | 34,125 | — | 25,000 | |||||||||||||||
|
Total stockholders’ equity
|
246,856 | 221,666 | 105,611 | 90,084 | 53,239 | |||||||||||||||
Non-GAAP Financial Measures
We include in this Annual Report on Form 10-K the non-GAAP financial measure of EBITDA. We define EBITDA as income before interest, income taxes, depreciation and amortization. EBITDA is used as a supplemental financial measure by our management and by external users of our financial statements such as investors, commercial banks and others, to assess:
-31-
|
|
•
|
the financial performance of our assets without regard to financing methods, capital structure or historical cost basis;
|
|
|
•
|
the ability of our assets to generate cash sufficient to pay interest costs and support our indebtedness;
|
|
|
•
|
our operating performance and return on capital as compared to those of other companies in our industry, without regard to financing or capital structure; and
|
|
|
•
|
the viability of acquisitions and capital expenditure projects and the overall rates of return on alternative investment opportunities.
|
EBITDA is not a presentation made in accordance with GAAP. EBITDA should not be considered an alternative to, or more meaningful than, net income, operating income, cash flows from operating activities or any other measure of financial performance presented in accordance with GAAP as measures of operating performance, liquidity or ability to service debt obligations. Because EBITDA excludes some, but not all, items that affect net income and is defined differently by different companies in our industry, our definition of EBITDA may not be comparable to similarly titled measures of other companies. EBITDA has important limitations as an analytical tool, and you should not consider it in isolation.
The following table provides a reconciliation of EBITDA to our net income for the periods indicated as calculated and presented in accordance with GAAP:
|
2010
|
2009
|
2008
|
2007
|
2006
|
||||||||||||||||
|
Net income
|
$ | 21,882 | $ | 20,030 | $ | 14,475 | $ | 17,399 | $ | 12,403 | ||||||||||
|
Income tax expense
|
11,959 | 11,534 | 7,282 | 10,178 | 7,040 | |||||||||||||||
|
Interest expense(income), net
|
335 | 438 | 964 | 118 | 1,933 | |||||||||||||||
|
Depreciation and amortization*
|
19,458 | 18,536 | 18,600 | 12,384 | 11,627 | |||||||||||||||
|
EBITDA
|
$ | 53,634 | $ | 50,538 | $ | 41,321 | $ | 40,079 | $ | 33,003 | ||||||||||
*includes depreciation, amortization of finite-lived intangible assets and amortization of deferred financing costs
-32-
Selected Quarterly Financial Data
The following table sets forth selected unaudited financial information for the eight quarters in the two-year period ended December 31, 2010. This information has been prepared on the same basis as the audited financial statements and, in the opinion of management, contains all adjustments necessary for a fair presentation.
|
First
Quarter
|
Second
Quarter
|
Third
Quarter
|
Fourth
Quarter
|
Total
Year
|
||||||||||||||||
|
(in thousands, except per share data)
|
||||||||||||||||||||
|
2010
|
||||||||||||||||||||
|
Revenues
|
$ | 75,556 | $ | 87,126 | $ | 100,024 | $ | 90,428 | $ | 353,135 | ||||||||||
|
Operating income
|
5,471 | 11,164 | 11,481 | 4,471 | 32,587 | |||||||||||||||
|
Income before income taxes
|
7,602 | 11,008 | 11,403 | 3,828 | 33,841 | |||||||||||||||
|
Net income
|
4,781 | 7,009 | 7,098 | 2,994 | 21,882 | |||||||||||||||
|
Earnings per share:
|
||||||||||||||||||||
|
Basic
|
$ | 0.18 | $ | 0.26 | $ | 0.26 | $ | 0.11 | $ | 0.81 | ||||||||||
|
Diluted
|
$ | 0.18 | $ | 0.26 | $ | 0.26 | $ | 0.11 | $ | 0.81 | ||||||||||
|
First
Quarter
|
Second
Quarter
|
Third
Quarter
|
Fourth
Quarter
|
Total
Year
|
||||||||||||||||
|
(in thousands, except per share data)
|
||||||||||||||||||||
|
2009
|
||||||||||||||||||||
|
Revenues
|
$ | 70,040 | $ | 70,753 | $ | 81,466 | $ | 71,235 | $ | 293,494 | ||||||||||
|
Operating income
|
7,074 | 10,136 | 8,300 | 6,241 | 31,750 | |||||||||||||||
|
Income before tax
|
6,971 | 10,000 | 8,289 | 6,304 | 31,564 | |||||||||||||||
|
Net income
|
4,341 | 6,286 | 5,397 | 4,006 | 20,030 | |||||||||||||||
|
Earnings per share:
|
||||||||||||||||||||
|
Basic
|
$ | 0.20 | $ | 0.29 | $ | 0.22 | $ | 0.15 | $ | 0.85 | ||||||||||
|
Diluted
|
$ | 0.20 | $ | 0.28 | $ | 0.22 | $ | 0.15 | $ | 0.84 | ||||||||||
-33-
|
Item 7.
|
MANAGEMENT’S DISCUSSION AND ANALYSIS OF FINANCIAL CONDITION AND RESULTS OF OPERATIONS
|
The following discussion and analysis of our financial condition and results of operations is based on and should be read in conjunction with our consolidated financial statements and the accompanying notes beginning on page F-1 of this Annual Report on Form 10-K. Certain statements made in our discussion may be forward-looking. Forward-looking statements involve risks and uncertainties and a number of factors could cause actual results or outcomes to differ materially from our expectations. See “Forward-Looking Statements” at the beginning of this Annual Report on Form 10-K for additional discussion of some of these risks and uncertainties. Unless the context requires otherwise, when we refer to “we”, “us” and “our”, we
are describing Orion Marine Group, Inc. and its consolidated subsidiaries.
Overview
We are a leading marine specialty contractor serving the heavy civil marine infrastructure market. We provide a broad range of marine construction and specialty services on, over and under the water along the Gulf Coast, the Atlantic Seaboard, the Pacific Northwest and the Caribbean Basin. Our customers include federal, state and municipal governments, the combination of which accounted for approximately 64% of our revenue in the year ended December 31, 2010, as well as private commercial and industrial enterprises. We are headquartered in Houston, Texas.
2010 Recap and 2011 Outlook
In January 2010, we acquired Texas-based T.W. LaQuay Dredging, LLC (“TWLD”) for approximately $61 million in cash, utilizing proceeds raised in our August 2009 public stock offering to fund the acquisition. The acquisition provided us with additional dredging resources for deep-channel dredging capability as well as additional experienced personnel. Through its backlog, the acquisition immediately contributed to 2010 revenue.
In February 2010, we expanded our operations and established a base in the Pacific Northwest through the purchase of a marine construction business, at a total price of $7.0 million in cash. As the fair value of the business purchased exceeded the purchase price, we recognized a gain, net of the associated tax effect, of $1.6 million on this transaction.
Despite a difficult and challenging economic environment and increased competition along the Eastern Seaboard, our revenues increased 20.3% in 2010 as compared with 2009, including the liquidation of the TWLD backlog. The mix of contracts in progress and those completed during 2010 shifted more toward the public sector, with 64% of 2010 revenue generated from state agencies and local municipalities, as well as the federal government, which includes the US Army Corps of Engineers. We are not dependent upon a single sector as a source of revenue.
We continued to invest in specialized equipment to enhance our lift capabilities and expand our fleet. Our capital expenditures in 2010 totaled $29.1 million, excluding the assets acquired in our two acquisitions.
In June 2010, we entered into a larger credit facility, which provides for a revolving credit line of up to $75 million, with an additional $25 million available at the lender’s discretion. Our credit facility extends to June 30, 2013.
During the year ended December 31, 2010, our operations provided cash from operations of $13.8 million and our cash position at December 31, 2010 exceeded $23.0 million. Our operations are not currently dependent on external sources of capital and we have not utilized the $75 million available to us under our revolving credit facility.
Our overall performance generally depends on spending in the heavy civil marine infrastructure market. Spending by our customers, both government and private, is impacted by several important trends affecting our industry, including the following:
|
|
•
|
port and channel expansion and maintenance;
|
-34-
|
|
•
|
deteriorating condition of intracoastal waterways and bridges;
|
|
|
•
|
continued demand in the cruise industry;
|
|
|
•
|
infrastructure spending by the United States Navy and Coast Guard;
|
|
|
•
|
near-shore oil and gas capital expenditures
|
|
|
•
|
ongoing U.S. coastal wetlands restoration and reclamation;
|
|
|
•
|
recurring hurricane restoration and repair.
|
Despite the uncertain economic and political environments, we continue to see positive long term trends in our end markets, including:
|
|
·
|
Ports in our geographic markets have released plans for expansion as a result of recent cargo volume increases and expected future increases as larger ships begin to transit the Panama Canal;
|
|
|
·
|
Good opportunities for coastal restoration and protection projects; and.
|
|
|
·
|
The continuation of the highway transportation program for highway construction, including bridges over water.
|
Our focus in 2011 will be to concentrate on our core business objectives; to manage our business effectively and efficiently, while maintaining pricing discipline; to pursue rational growth strategies while closely monitoring the costs of our operations; and to maintain our strong balance sheet.
Critical Accounting Policies
The consolidated financial statements contained in this report were prepared in accordance with accounting principles generally accepted in the United States (“US GAAP”). The preparation of these financial statements in conformity with US GAAP requires management to make estimates and assumptions that affect both the Company’s carrying values of its assets and liabilities, and the reported amounts of revenues and expenses during the reporting period. Actual results could differ from those estimates. Although our significant accounting policies are described in more detail in Note 2 of the Notes to Consolidated Financial Statements; we believe the following accounting policies to be critical to the judgments and estimates used in
the preparation of our financial statements.
Revenue Recognition
We enter into construction contracts principally on the basis of competitive bids. Although the terms of our contracts vary considerably, most are made on a fixed price basis. Revenues from construction contracts are recognized on the percentage-of-completion method. The percentage-of-completion method measures the ratio of costs incurred and accrued to date for each contract to the estimated total costs for each contract at completion. This requires us to prepare on-going estimates of the costs to complete each contract as the project progresses. In preparing these estimates, we make significant judgments and assumptions concerning our significant cost drivers of materials, labor and equipment, and we evaluate contingencies based on
possible schedule variances, production delays or other productivity factors.
Actual costs may vary from the costs we estimated. Variations from estimated contract costs along with other risks inherent in fixed price contracts may result in actual revenue and gross profits differing from those we estimated and could result in losses on projects. If a current estimate of total contract cost indicates a loss on a contract, the projected loss is recognized in full when determined, without regard to the percentage of completion. We consider unapproved change orders to be contract variations on which we have customer approval for scope change, but not for price associated with that scope change. These costs are included in the estimated cost to complete the contracts and are expensed as incurred. We recognize revenue equal to cost incurred on unapproved change orders when realization
of price approval is probable and the estimated amount is equal to or greater than our cost related to the unapproved change order and the related margin when the change order is formally approved by the customer. Revenue recognized on unapproved change orders is included in contract costs and estimated earnings in excess of billings on uncompleted contracts on the balance sheet. We consider claims to be amounts that we seek or will seek to collect from customers or others for customer-caused changes in contract specifications or design, or other customer-related causes of unanticipated additional contract costs on which there is no agreement with customers on both scope and price changes. Revenue from claims is recognized when agreement is reached with customers as to the value of the claims, which in some instances may not occur until after completion of work under the contract. Costs associated with claims are included in the estimated costs to complete the
contracts and are expensed when incurred. Depending on the size of a particular project, variations from estimated project costs could have a significant impact on our operating results for any fiscal quarter or year. We believe our exposure to losses on fixed price contracts is limited by the relatively short duration of the contracts we undertake and our management’s experience in estimating contract costs.
-35-
Long-Lived Assets
Our long-lived assets consist primarily of equipment used in our operations. Fixed assets are carried at cost and are depreciated over their estimated useful lives, ranging from one to thirty years, using the straight-line method for financial reporting purposes and accelerated methods for tax reporting purposes. The carrying value of our long-lived assets is evaluated periodically based on utilization of the asset and physical condition of the asset, as well as the useful life of the asset to determine if adjustment to the depreciation period or the carrying value is warranted. If events and circumstances such as poor utilization or deteriorated physical condition indicate that the asset(s) should be reviewed for possible impairment, we use projections to assess whether future cash flows, including
disposition, on a non-discounted basis related to the tested assets are likely to exceed the recorded carrying amount of those assets to determine if an impairment exists. If we identify a potential impairment, we will estimate the fair value of the asset through known market transactions of similar equipment and other valuation techniques, which could include the use of similar projections on a discounted basis. We will report a loss to the extent that the carrying value of the impaired assets exceeds their fair values.
Goodwill
We have acquired businesses and assets in purchase transactions that resulted in the recognition of goodwill. In accordance with US GAAP, acquired goodwill is not amortized, but is subject to impairment testing at least annually or more frequently if events or circumstances indicate that the asset more likely than not may be impaired.
Goodwill recorded on our Consolidated Balance Sheets is subject to impairment testing at least annually or more frequently if events or circumstances indicate that the asset more likely than not may be impaired. We evaluate goodwill at the reporting unit level. We have determined that we have three reporting units, which are based on geography, and are referred to internally as “East Coast”, “Gulf Coast” and “Pacific Northwest”. Each reporting unit conducts similar business as described in this Annual Report on Form 10-K, which includes marine construction specialty services. This reporting unit grouping reflects our internal management structure, which is based on the geographic location of our primary field offices. Two
reporting units, Gulf Coast and East Coast have goodwill and are tested for impairment.
At December 31, 2010, goodwill totaled $32.2 million, of which $22.6 million related to the Gulf Coast (including goodwill acquired from the acquisition of T.W. LaQuay), and $9.6 million resulted from the acquisition of equipment on the East Coast in 2008.
We assess the fair value of our two reporting units based on a weighted average of valuations based on market multiples, discounted cash flows, and consideration of our market capitalization. The key assumptions used in the discounted cash flow valuations are discount rates and perpetual growth rates applied to cash flow projections. Also inherent in the discounted cash flow valuation models are past performance, projections and assumptions in current operating plans, and revenue growth rates over the next five years. These assumptions contemplate business, market and overall economic conditions. We also consider assumptions that market participants may use.
As required by the Company’s policy, annual impairment tests of goodwill are performed during the fourth quarter of each year or when circumstances arise that indicate a possible impairment might exist. Based on this testing, we determined that the estimated fair value of our reporting units exceeded their respective carrying values as of October 31, 2010, goodwill was not impaired, and no events have occurred since that date that would require an interim impairment test. In the future, our estimated fair value could be negatively impacted by deteriorating economic conditions, which may reduce our revenue growth potential.
-36-
Income Taxes
We account for income taxes using the liability method prescribed by US GAAP. We evaluate valuation allowances for deferred tax assets for which future realization is uncertain. The estimation of required valuation allowance includes estimates of future taxable income. In our assessment of our deferred tax assets at December 31, 2010, we considered that it was more likely than not that all of the deferred tax assets would be realized. The ultimate realization of deferred tax assets is dependent upon the generation of future taxable income during the periods in which those temporary differences become deductible. We consider the scheduled reversal of deferred tax liabilities, projected future taxable income and tax planning strategies in making this assessment.
The Company accounts for uncertain tax positions in accordance with the provisions ASC 740-10, which prescribes a recognition threshold and measurement attribute for financial statement disclosure of tax positions taken, or expected to be taken, on our consolidated tax return. We evaluate and record any uncertain tax positions based on the amount that management deems is more likely than not to be sustained upon ultimate settlement with the tax authorities in the tax jurisdictions in which we operate.
Insurance Coverage, Litigation, Claims and Contingencies
We maintain insurance coverage for our business and operations. Insurance related to property, equipment, automobile, general liability and a portion of workers’ compensation is provided through traditional policies, subject to a deductible. A portion of our workers’ compensation exposure is covered through a mutual association, which is subject to supplemental calls.
The Company maintains five levels of excess loss insurance coverage, totaling $75 million in excess of primary coverage, which excess loss coverage responds to all of the Company’s insurance policies other than a portion of its Workers’ Compensation coverage and employee health care coverage. The Company’s excess loss coverage responds to most of its policies when a primary limit of $1 million has been exhausted; provided that the primary limit for Maritime Employer’s Liability is $10 million and the Watercraft Pollution Policy primary limit is $5 million.
We have elected to retain a portion of losses that may occur through the use of various deductibles, limits and retentions under our insurance programs. Losses on these policies up to the deductible amounts are accrued in our consolidated financial statements based on known claims incurred and an estimate of claims incurred but not yet reported. We derive our accruals from known facts, historical trends and industry averages to determine the best estimate of the ultimate expected loss. Actual claims may vary from our estimate. We include any adjustments to such reserves in our consolidated results of operations in the period in which they become known.
Accounting for Stock Issued to Employees and Others
We measure the cost of equity compensation to our employees and independent directors based on the estimated grant-date fair value of the award and recognize the expense over the vesting period. We use the Black-Scholes option pricing model to compute the fair value of the awards of equity instruments. The Black-Scholes model requires the use of highly subjective assumptions in the computation. Changes in these assumptions can cause significant fluctuations in the fair value of the option award.
-37-
Consolidated Results of Operations
Current Year—Year Ended December 31, 2010 compared with Year Ended December 31, 2009
The following information is derived from our historical results of operations (dollars in thousands):
|
Twelve months ended December 31,
|
||||||||||||||||
|
2010
|
2009
|
|||||||||||||||
|
Amount
|
Percent
|
Amount
|
Percent
|
|||||||||||||
|
Contract revenues
|
$ | 353,135 | 100.0 | % | $ | 293,494 | 100.0 | % | ||||||||
|
Cost of contract revenues
|
287,902 | 81.5 | % | 230,797 | 78.6 | % | ||||||||||
|
Gross profit
|
65,233 | 18.5 | % | 62,697 | 21.4 | % | ||||||||||
|
Selling, general and administrative expenses
|
32,646 | 9.3 | % | 30,695 | 10.5 | % | ||||||||||
|
Operating income
|
32,587 | 9.2 | % | 32,002 | 10.9 | % | ||||||||||
|
Other (income) expense
|
||||||||||||||||
|
Gain from bargain purchase
|
(1,589 | ) | -0.5 | % | — | 0.0 | % | |||||||||
|
Interest (income)
|
(99 | ) | -0.0 | % | (352 | ) | -0.1 | % | ||||||||
|
Interest expense
|
434 | 0.1 | % | 790 | 0.2 | % | ||||||||||
|
Other (income) expense, net
|
(1,254 | ) | -0.4 | % | 438 | 0.1 | % | |||||||||
|
Income before income taxes
|
33,841 | 9.6 | % | 31,564 | 10.8 | % | ||||||||||
|
Income tax expense
|
11,959 | 3.4 | % | 11,534 | 3.9 | % | ||||||||||
|
Net income
|
$ | 21,882 | 6.2 | % | $ | 20,030 | 6.9 | % | ||||||||
Contract Revenues. Total revenue in 2010 increased $59.6 million or 20.3%, as compared with 2009, of which approximately $31 million related to liquidation of backlog from contracts acquired in the acquisition of T.W. LaQuay Dredging. The assets of T.W. LaQuay Dredging were absorbed into the normal operations of our business and are not a separate reporting unit. The remaining increase in revenue was attributable to the size and type of projects in backlog; the productivity of our labor force, the utilization of our equipment and the progress schedules in the mix of projects between periods; all of which factor into and affect the rate at which revenue is recognized as projects are completed. Our
typical project duration is between three to nine months, and comparisons of individual projects between reporting periods are not indicators of future results. In 2010, our mix of contracts due to the projects we chose to bid (and were awarded), as well as the backlog obtained from T.W. LaQuay Dredging shifted, such that 41% of 2010 revenues were generated from federally funded projects. Overall, 64% of 2010 revenues were generated from governmentally funded projects, with 36% generated from the private sector. Our customer base changes over time, and we are not dependent on a single sector or customer for the projects we bid.
Gross Profit. Gross profit increased by $2.5 million, or 4.0% as compared with the prior year, primarily as a result of the increase in revenues. However, gross margin decreased in 2010 to 18.5% of revenues from 21.4% of revenues in 2009. The decrease was due to pricing pressure experienced on the East Coast which reduced profitability on certain jobs throughout the year. In the fourth quarter, production issues on three projects negatively impacted gross profit and margin. In addition, the mix of contracts in progress required the use of outside subcontractors, more than is historically our norm, which reduced our overall self-performance rate to 82.4% and contributed to the decrease in gross
margin.
Selling, General and Administrative Expense. As compared with the prior year, selling, general and administrative expenses (“SG&A”) increased approximately $2.0 million or 6.4% in 2010. In the current year, $1.7 million was related to the costs of the acquisitions in early 2010, while in 2009 approximately $3.0 million was related to the amortization of construction contracts in backlog acquired in 2008 upon the acquisition of a dredging business along the Eastern Seaboard. Excluding these two items in each year, SG&A increased by approximately $3.3 million, primarily related to additional overheads to support our business growth.
-38-
Other Income, net of expense. Other income of $1.3 million in 2010 resulted from a gain of $1.6 million on the purchase of the business in the Pacific Northwest in February 2010, which fair value, net of the related deferred tax liability, exceeded the purchase price. The balance related to interest expense, net of interest income.
Income Tax Expense. Our effective rate for the year ended December 31, 2010 was 35.3%. This differed from the Company’s statutory rate of 35% primarily due to state income taxes and the non-deductibility of certain permanent tax items, such as incentive stock compensation expense, and which in the current year included a reduction of taxable income related to the net gain on the bargain purchase of the business in the Pacific Northwest. Our effective tax rate at December 31, 2009 was 36.5%.
-39-
Prior Year—Year Ended December 31, 2009 compared with Year Ended December 31, 2008
The following information is derived from our historical results of operations (dollars in thousands):
|
Twelve months ended December 31,
|
||||||||||||||||
|
2009
|
2008
|
|||||||||||||||
|
Amount
|
Percent
|
Amount
|
Percent
|
|||||||||||||
|
Contract revenues
|
$ | 293,494 | 100.0 | % | $ | 261,802 | 100.0 | % | ||||||||
|
Cost of contract revenues
|
230,797 | 78.6 | % | 211,351 | 80.7 | % | ||||||||||
|
Gross profit
|
62,697 | 21.4 | % | 50,451 | 19.3 | % | ||||||||||
|
Selling, general and administrative expenses
|
30,695 | 10.5 | % | 27,730 | 10.6 | % | ||||||||||
|
Operating income
|
32,002 | 10.9 | % | 22,473 | 8.7 | % | ||||||||||
|
Interest (income) expense
|
||||||||||||||||
|
Interest (income)
|
(352 | ) | -0.1 | % | (530 | ) | -0.2 | % | ||||||||
|
Interest expense
|
790 | 0.2 | % | 1,494 | 0.6 | % | ||||||||||
|
Interest (income) expense, net
|
438 | 0.1 | % | 964 | 0.4 | % | ||||||||||
|
Income before income taxes
|
31,564 | 10.8 | % | 21,757 | 8.3 | % | ||||||||||
|
Income tax expense
|
11,534 | 3.9 | % | 7,282 | 2.8 | % | ||||||||||
|
Net income
|
$ | 20,030 | 6.9 | % | $ | 14,475 | 5.5 | % | ||||||||
Contract Revenues. Total revenue in 2009 increased $31.7 million or 12.1%, as compared with 2008. The increase in revenue was attributable to the progress schedules and rate of completion of the contracts in progress in 2009. Our mix of projects during the year shifted toward the public sector, which totaled 55.2% of 2009 revenues, with revenues generated from the private sector representing 44.8%. In 2008, 50.1% of revenues were generated from government agencies and 49.1% from the private sector. An increase in spending by the Corps of Engineers, partly targeting economic recovery, resulted in 18.5% of total revenues generated from federally funded projects, as compared
with 11.1% in the prior year.
Gross Profit. Gross profit increased by $12.2 million, or 24.3% and gross margin improved to 21.4% in 2009 from 19.3% in 2008. We achieved an improvement in gross margin (related to the increase in revenues) despite a reduction in our contract self-performance rate to 87.6% of total costs, as compared with a self-performance rate of 88.2% in 2008. In addition, during 2008, significant production delays which resulted from unexpected amounts of trash and unforeseen site conditions on two projects involving dredging services, negatively affected gross margins in that period, and which did not reoccur in 2009.
Selling, General and Administrative Expense. As compared with the prior year, selling, general and administrative expenses (“SG&A”) increased $3.0 million or 10.6% in 2010. The increase was due primarily to additional overheads to support our business growth. In the prior year, we benefitted from lower group medical and workers’ compensation expenses.
Income Tax Expense. Our effective rate for the year ended December 31, 2009 was 36.5% and differed from the Company’s statutory rate of 35% primarily related to state income taxes and the non-deductibility of certain permanent tax items, such as incentive stock compensation expense, offset in part by the benefit of the domestic production activities deduction on our federal tax return, which net effect increased our overall effective tax rate. Our effective tax rate of 33.5% in 2008 differed from our statutory rate of 35%, primarily due to the benefit of the domestic production activities deduction on the Company’s tax return and true-ups of federal and
state deferred taxes.
Liquidity and Capital Resources
Our primary liquidity needs are for financing working capital, investment in capital expenditures and strategic acquisitions. Historically, our sources of liquidity have been cash provided by our operating activities and borrowings under our credit facility.
-40-
Our working capital position fluctuates from period to period due to normal increases and decreases in operations activity. At December 31, 2010, our working capital was $76.7 million as compared with $130.8 million at December 31, 2009, of which $53.4 million in the prior year balance was related to the proceeds received from the sale of common stock in August 2009.
As of December 31, 2010, we had available cash on hand and availability under our revolving credit facility of $123.2 million.
During 2010, our operations provided cash from operations of $13.8 million. Our operations are not currently dependent on external sources of capital, and we have not utilized our available borrowing of $75 million under our credit facility.
We expect to meet our future internal liquidity and working capital needs, and maintain our equipment fleet through capital expenditure purchases and major repairs, from funds generated in our operating activities, and from the proceeds received from our common stock offering, for at least the next 12 months. We believe our cash position, combined with the capacity available under our revolving credit facility, is adequate for our general business requirements.
The following table provides information regarding our cash flows and our capital expenditures for the years ended December 31, 2010, 2009 and 2008:
|
Year ended December 31,
|
||||||||||||
|
2010
|
2009
|
2008
|
||||||||||
|
(in thousands)
|
||||||||||||
|
Cash provided by (used in):
|
||||||||||||
|
Operating activities
|
$ | 13,839 | $ | 40,336 | $ | 26,471 | ||||||
|
Investing activities
|
(95,755 | ) | (21,598 | ) | (47,337 | ) | ||||||
|
Financing activities
|
354 | 60,286 | 33,994 | |||||||||
|
Capital expenditures (included in investing activities above)
|
29,050 | 22,693 | 14,485 | |||||||||
Operating Activities. Fluctuations in cash generated by operating activities are generally the result of timing differences related to the nature and volume of contracts in any given year. Our operations provided net cash of $13.8 million during fiscal 2010. The change between periods of $26.5 million, as compared with 2009 was due to:
|
|
·
|
An increase in our deferred income taxes of $6.0 million due to an increase in deferred tax liability related to timing differences in book and tax depreciation resulting from the acquisitions in the year;
|
|
|
·
|
An increase of $1.0 million of depreciation expense related to the increase in our fleet;
|
|
|
·
|
An increase of $0.9 million of stock based compensation expense, due to the increase in the fair value of our stock at the time of grants; offset by
|
|
|
·
|
A decrease of $35.3million in working capital components, as described below.
|
-41-
In 2010, the changes in working capital included a decrease in trade payables of $18.9 million compared with 2009, related to the timing of payments to vendors, and based on the mix of contracts in progress. Amounts unbilled to customers, net of our liability related to progress billings, increased by $7.3 million as compared with 2009 and was related to the timing of billings to customers and our contractual ability to bill for materials received but not installed. Due to the timing of estimated federal income tax deposits, our prepaid taxes increased by approximately $4.6 million, and we recorded a receivable of approximately $3.1 million related to the finalization of the purchase price of T.W. LaQuay Dredging. We manage our working capital components in total, rather than by
the individual elements, and fluctuations in accounts receivable and payable balances are normal within our business.
In 2009, our accounts receivable and payable balances increased by $2.5 million and $11.2 million, respectively, and amounts unbilled to customers exceeded billings to customers on our contracts in progress.
Investing Activities. We purchase capital equipment as well as perform major maintenance and upgrades of our existing fleet and construction equipment to support our construction activities. Capital expenditures supporting our operations and enhancing our fleet totaled $29.1 million in 2010, an increase of $6.4 million as compared with 2009, some of which related to the purchase of additional heavy lift capacity. Also in 2010, we acquired the business of T.W. LaQuay Dredging for approximately $61 million, and expanded into the Pacific Northwest through a business acquisition totaling $6.7 million. In 2009, our capital expenditures totaled $22.7 million, which included the purchase of specialized
equipment for approximately $5.8 million. In 2008, we purchased assets to expand our dredging capabilities along the Atlantic Seaboard for a total purchase price of $36.7 million. Proceeds from the sale of property and equipment in 2008 included $2.8 million received from the sale of a vessel no longer considered integral to our fleet.
Financing Activities. Financing activities in 2010 primarily related to loan costs incurred upon the entry into a new credit agreement in June 2010 and to proceeds received from the exercise of stock options. In August 2009, we completed a public offering of common stock, receiving proceeds, net of expenses, of approximately $91.0 million. With a portion of the proceeds, we repaid the outstanding balance on our credit facility. In addition, we received proceeds from stock option exercises, including related tax benefits of $3.4 million. Cash provided by financing activities in 2008 was attributable to our borrowing of $35.0 million under our line of credit to fund the purchase of
assets.
Sources of Capital
On June 29, 2010, the Company entered into a credit agreement with Wells Fargo Bank, National Association, as administrative agent, and Wells Fargo Securities, LLC as sole lead arranger and bookrunner; and the lenders from time to time as party thereto.
The Credit Agreement provides for borrowings of up to $75,000,000 under revolving and swingline loans (as defined in the Credit Agreement) with a $20,000,000 sublimit for the issuance of letters of credit. An additional $25 million is available under the facility subject to the lenders’ discretion (together, the “Credit Facility”). The Credit Facility matures on September 30, 2013, and is guaranteed by the subsidiaries of the Company. The Credit Facility may be used to finance working capital, repay indebtedness, fund acquisitions, and for other general corporate purposes.
Revolving loans may be designated as prime rate based loans (“ABR Loans”) or Eurodollar Loans, at the Company’s request, and may be made in integrals of $500,000, in the case of an ABR Loan, or $1,000,000 in the case of a Eurodollar Loan. Swingline loans may only be designated as ABR Loans, and may be made in amounts equal to integral multiples of $100,000. The Company may convert, change or modify such designations from time to time. Interest is computed based on the designation of the Loans, and bear interest at either a prime-based interest rate or a LIBOR-based interest rate. Principal balances drawn under the Credit Facility may be prepaid at any time, in whole or in part, without premium or penalty. Amounts repaid under the
Credit Facility may be re-borrowed.
-42-
The Credit Facility contains certain restrictive financial covenants that are usual and customary for similar transactions, including;
|
|
·
|
A Fixed Charge Coverage Ratio of not less than 1.50 to 1.00 at all times;
|
|
|
·
|
A Leverage Ratio of not greater than 2.50 to 1.00 at all times;
|
|
|
·
|
A minimum Net Worth of not less than $180 million on the effective date, and at the end of each fiscal quarter thereafter, minimum net worth required as of the end of the immediately preceding fiscal quarter plus 50% of the Borrower’s and its subsidiaries consolidated net income for that quarter, plus 75% of all issuances of equity interests by Borrower during that quarter.
|
In addition, the Credit Facility contains events of default that are usual and customary for similar transactions, including non-payment of principal, interest or fees; inaccuracy of representations and warranties; violation of covenants; bankruptcy and insolvency events; and events constituting a change of control.
The Company is subject to a commitment fee, payable quarterly in arrears on the unused portion of the Credit Facility at a current rate of 0.25% of the unused balance. As of December 31, 2010, no amounts had been drawn under the Credit Facility.
At December 31, 2010, the Company was in compliance with all its financial covenants with a sufficient margin as to not impair its ability to incur additional debt or violate the terms of the Credit Facility, and had outstanding letters of credit of $979,221. Historically, the Company has not relied on debt financing to fund its operations or working capital.
Bonding Capacity
We are generally required to provide various types of surety bonds that provide additional security to our customers for our performance under certain government and private sector contracts. Our ability to obtain surety bonds depends on our capitalization, working capital, past performance and external factors, including the capacity of the overall surety market. At December 31, 2010, we believe our capacity under our current bonding arrangement was in excess of $400 million, of which we had approximately $130 million in surety bonds outstanding. We believe our strong balance sheet and working capital position will
allow us to continue to access our bonding capacity.
Effect of Inflation
We are subject to the effects of inflation through increases in the cost of raw materials, and other items such as fuel. Because the typical duration of a project is between three to nine months we do not believe inflation has had a material impact on our operations.
Off Balance Sheet Arrangements
We currently have no off balance sheet arrangements, other than operating leases to which we are a party, and which are discussed above under “Bonding Capacity” and “Sources of Capital” and which arise in the normal course of business. These arrangements are not reasonably likely to have an effect on our financial condition, or results of operations that is material to investors. See Note 20 – Commitments and Contingencies of Notes to Consolidated Financial Statements beginning on page F-1 of this Annual Report on Form 10-K.
-43-
Contractual Obligations
The following table sets forth information about our contractual obligations and commercial commitments as of December 31, 2010:
|
Payment Due by Period
|
||||||||||||||||||||
|
Total
|
< 1 year
|
1-3 years
|
3-5 years
|
> 5 years
|
||||||||||||||||
|
(in thousands)
|
||||||||||||||||||||
|
Long-term debt obligations
|
$ | — | $ | — | $ | — | $ | — | $ | — | ||||||||||
|
Operating lease obligations
|
8,146 | 3,491 | 3,613 | 820 | 222 | |||||||||||||||
|
Purchase obligations (1)
|
— | — | — | — | — | |||||||||||||||
|
Total
|
$ | 8,146 | $ | 3,491 | $ | 3,613 | $ | 820 | $ | 222 | ||||||||||
|
(1)
|
Commitments pursuant to other purchase orders and subcontracts related to construction contracts are not included since such amounts are expected to be funded under contract billings.
|
To manage risks of changes in the material prices and subcontracting costs used in tendering bids for construction contracts, we obtain firm quotations from our suppliers and subcontractors before submitting a bid. These quotations do not include any quantity guarantees, and we have no obligation for materials or subcontract services beyond those required to complete the contracts that we are awarded for which quotations have been provided.
Recently Issued Accounting Pronouncements
Disclosures about Fair Value Measurements
In January 2010, the FASB issued a new accounting standard update (“ASU”) which clarifies and provides additional disclosure requirements on the transfers of assets and liabilities between Level 1 (quoted prices in active market for identical assets or liabilities) and Level 2 (significant other observable inputs) of the fair value measurement hierarchy, including the reasons for and the timing of the transfers. Additionally, the guidance requires a roll forward of activities on purchases, sales, issuance, and settlements of the assets and liabilities measured using significant unobservable inputs (Level 3 fair value measurements). This ASU is effective for us in 2010, except for the requirements to provide Level 3 activity which will become effective for us in 2011. The adoption of the currently
effective provisions of this ASU did not have a material effect on our consolidated financial statements, and we do not expect the adoption of the remaining provisions of this ASU to have a material effect on our consolidated financial statements.
During the periods presented in these financial statements, the Company implemented other new accounting pronouncements other than the one above that are discussed in the notes where applicable.
-44-
|
Item 7A.
|
QUANTITATIVE AND QUALITATIVE DISCLOSURES ABOUT MARKET RISK
|
We do not enter into derivative financial instruments for trading, speculation or other purposes that would expose the Company to market risk. In the normal course of business, our results of operations are subject to risks related to fluctuation in commodity prices and fluctuations in interest rates.
Commodity price risk
We are subject to fluctuations in commodity prices for concrete, steel products and fuel. Although we attempt to secure firm quotes from our suppliers, we generally do not hedge against increases in prices for concrete, steel and fuel. Commodity price risks may have an impact on our results of operations due to the fixed-price nature of many of our contracts, although the short-term duration of our projects may allow us to include price increases in the costs of our bids.
Interest rate risk
At December 31, 2010, we had no borrowings under our credit agreement. Interest expense interest related primarily to the amortization of costs associated with the entry into the credit facility in June. Our credit facility expires in June 2013. Our objectives in managing interest rate risk are to lower our overall borrowing costs and limit interest rate changes on our earnings and cash flows. To achieve this, we closely monitor changes in interest rates and we utilize cash from operations to reduce our debt position.
|
Item 8.
|
FINANCIAL STATEMENTS AND SUPPLEMENTARY DATA
|
The information required by this Item 8 is submitted as a separate section beginning on page F-1 of this Annual Report on Form 10-K and is incorporated herein by reference.
Additionally, a two-year Summary of Selected Quarterly Financial Data (unaudited) is included in “Selected Quarterly Financial Data” under Item 6 - Selected Financial Data.
|
Item 9.
|
CHANGES IN AND DISAGREEMENTS WITH ACCOUNTANTS ON ACCOUNTING AND FINANCIAL DISCLOSURE
|
None
|
Item 9A.
|
CONTROLS AND PROCEDURES
|
Disclosure Controls and Procedures
We maintain a set of disclosure controls and procedures that are designed to provide reasonable assurance that information required to be disclosed in our reports filed under the Securities Exchange Act of 1934 (the “Exchange Act”) is recorded, processed, summarized, and reported within the time periods specified in the SEC’s rules and forms. Disclosure controls and procedures include, without limitation, controls and procedures designed to ensure that information required to be disclosed by us in the reports that we file or submit under the Exchange Act is accumulated and communicated to our management, including our principal executive officer and principal financial officer, as appropriate to allow timely decisions regarding required disclosure.
Our management, with the participation of our principal executive officer and principal financial officer, has evaluated the effectiveness of our disclosure controls and procedures (as such term is defined in Rules 13a-15(f) and 15d-15(f) under the Exchange Act) as of the end of the period covered by this report. Based on such evaluation, our principal executive and financial officers have concluded that our disclosure controls and procedures were effective with reasonable assurance as of the end of such period.
-45-
Management’s Report on Internal Control Over Financial Reporting
Management is responsible for establishing and maintaining adequate internal control over financial reporting. Internal control over financial reporting is a process designed to provide reasonable assurance regarding the reliability of financial reporting and the preparation of financial statements for external purposes in accordance with generally accepted accounting principles. Internal control over financial reporting includes those policies and procedures that (i) pertain to the maintenance of records that, in reasonable detail, accurately and fairly reflect our transactions and dispositions of our assets; (ii) provide reasonable assurance that transactions are recorded as necessary to permit preparation of financial
statements in accordance with generally accepted accounting principles, and that our receipts and expenditures are being made only in accordance with authorizations of our management and directors; and (iii) provide reasonable assurance regarding prevention or timely detection of unauthorized acquisition, use, or disposition of our assets that could have a material effect on the financial statements.
Internal control over financial reporting cannot provide absolute assurance of achieving financial reporting objectives because of its inherent limitations. Internal control over financial reporting is a process that involves human diligence and compliance and is subject to lapses in judgment and breakdowns resulting from human failures. Internal control over financial reporting can also be circumvented by collusion or improper management override. Because of such limitations, there is a risk that material misstatements may not be prevented or detected on a timely basis by internal control over financial reporting. Also, projections of any evaluation of effectiveness to future periods are subject to the risk that controls may become inadequate because of changes in conditions, or that the degree of compliance
with the policies or procedures may deteriorate. However, these inherent limitations are known features of the financial reporting process. Therefore, it is possible to design into the process safeguards to reduce, though not eliminate, this risk.
Management conducted an assessment of the effectiveness of our internal control over financial reporting as of December 31, 2010. In making this assessment, management used the criteria described in Internal Control — Integrated Framework issued by the Committee of Sponsoring Organizations of the Treadway Commission. Based on this assessment, management concluded that our internal control over financial reporting was effective as of December 31, 2010.
Grant Thornton LLP, an independent registered public accounting firm who audited the consolidated financial statements included in this Annual Report, has issued a report on our internal control over financial reporting dated March 7, 2011 and expressed an unqualified opinion on the effectiveness of our internal control over the financial reporting as of December 31, 2010.
Changes in Internal Control
There were no changes in the Company’s internal control over financial reporting during the Company’s quarter ended December 31, 2010, that have materially affected, or are reasonably likely to materially affect, the Company’s internal control over financial reporting.
|
Item 9B.
|
OTHER INFORMATION
|
None
-46-
PART III
Certain information required by Part III is omitted from this Report. We will file our definitive proxy statement for our Annual Meeting of Stockholders to be held on May 19, 2011 (the “Proxy Statement”) pursuant to regulation 14A not later than 120 days after the end of the fiscal year covered by this Annual Report, and certain information included therein is incorporated by reference herein.
|
Item 10.
|
DIRECTORS, EXECUTIVE OFFICERS AND CORPORATE GOVERNANCE
|
Directors, Executive Officers, Promoters and Control Persons
The information required by Paragraph (a), and Paragraphs (c) through (g) of Item 401 of Regulation S-K (except for information required by Paragraph (e) of that Item to the extent the required information pertains to our executive officers) is hereby incorporated by reference from our definitive proxy statement to be filed with the SEC pursuant to Regulation 14A within 120 days after the close of our fiscal year.
The following table presents the information required by Paragraph (b) of Item 401 of Regulation S-K.
|
Name
|
Age
|
Position with the Company
|
Year Joined the Registrant
|
|||
|
Richard L. Daerr, Jr.
|
66
|
Chairman of the Board
|
2007
|
|||
|
J. Michael Pearson
|
63
|
President, Chief Executive Officer and Director
|
2006
|
|||
|
Thomas N. Amonett
|
67
|
Director
|
2007
|
|||
|
Austin J. Shanfelter
|
54
|
Director
|
2007
|
|||
|
Gene Stoever
|
73
|
Director
|
2007
|
|||
|
Mark R. Stauffer
|
48
|
Executive Vice President and Chief Financial Officer
|
1999
|
|||
|
Elliott J. Kennedy
|
56
|
Executive Vice President
|
1994
|
|||
|
James L. Rose
|
46
|
Executive Vice President
|
2005
|
|||
|
Peter R. Buchler
|
65
|
Executive Vice President, General Counsel and Secretary
|
2009
|
Code of Ethics
We have adopted a code of ethics for our chief executive, chief financial and principal accounting officers; a code of business conduct and ethics for members of our Board of Directors; and corporate governance guidelines. The full text of the codes of ethics and corporate governance guidelines is available at our website www.orionmarinegroup.com. Although we have never done so, in the event we make any amendment to, or grant any waiver from, a provision of the code of ethics that applies to the principal executive officer, principal financial officer or principal accounting officer that requires disclosure under applicable Commission rules, we will disclose such amendment or waiver and the reasons therefore on our website. We will provide any person without charge a copy of any of the aforementioned codes of
ethics upon receipt of a written request. Requests should be addressed to: Orion Marine Group, Inc. 12000 Aerospace, Houston, Texas 77034, Attention: Corporate Secretary.
Corporate Governance
The information required by Items 407(c)(3), (d)(4) and (d)(5) of Regulation S-K is hereby incorporated by reference from our definitive proxy statement to be filed with the SEC pursuant to Regulation 14A within 120 days after the close of our fiscal year.
|
Item 11.
|
EXECUTIVE COMPENSATION
|
The information required by this Item is hereby incorporated by reference from our definitive proxy statement to be filed with the SEC pursuant to Regulation 14A within 120 days after the close of our fiscal year.
-47-
|
Item 12.
|
SECURITY OWNERSHIP OF CERTAIN BENEFICIAL OWNERS AND MANAGEMENT AND RELATED STOCKHOLDER MATTERS
|
The information required by this item is hereby incorporated by reference from our definitive proxy statement to be filed with the SEC pursuant to Regulation 14A within 120 days after the close of our fiscal year. The information required by Item 201(d) of Regulation S-K is submitted in a separate section of this Form 10-K. See Item 5. — Market for Registrant’s Common Equity, Related Stockholder Matters and Issuer Purchases of Equity Securities, above.
|
Item 13.
|
CERTAIN RELATIONSHIPS AND RELATED TRANSACTIONS, AND DIRECTOR INDEPENDENCE
|
The information required by this Item is hereby incorporated by reference from our definitive proxy statement to be filed with the SEC pursuant to Regulation 14A within 120 days after the close of our fiscal year.
|
Item 14.
|
PRINCIPAL ACCOUNTING FEES AND SERVICES
|
The information required by this Item is hereby incorporated by reference from our definitive proxy statement to be filed with the SEC pursuant to Regulation 14A within 120 days after the close of our fiscal year.
-48-
PART IV
|
Item 15.
|
EXHIBITS AND FINANCIAL STATEMENT SCHEDULES
|
The following documents are filed as part of this Report:
|
1.
|
Financial Statements
|
The Company’s Consolidated Financial Statements at December 31, 2010 and 2009 and for each of the three years in the period ended December 31, 2010 and the notes thereto, together with the Report of the Independent Registered Public Accounting Firm on those Consolidated Financial Statements are hereby filed as part of this Report, beginning on page F-1.
|
2.
|
Financial Statement Schedule
|
The following financial statement schedule of the Company for each of the three years in the period ended December 31, 2010 is filed as part of this Report and should be read in conjunction with the Consolidated Financial Statements of the Company.
Schedule II – Schedule of Valuation and Qualifying Accounts
|
3.
|
Exhibits
|
The exhibits listed in the accompanying Exhibit Index are filed or incorporated by reference as part of this Report.
Except as noted below, all exhibits are incorporated by reference to the Company’s Registration Statement on Form S-3 filed on August 20, 2009, as subsequently amended.
|
Exhibit
|
||
|
Number
|
Description
|
|
|
1 .01
|
Form of Indemnity Agreement for Directors and Certain Officers dated November 24, 2008 (filed as Exhibit 1.01 to Form 8-K filed on November 25, 2008)
|
|
|
2 .1
|
Asset Purchase Agreement dated February 28, 2008, by and between OMGI Sub, LLC and Orion Marine Group, Inc. and Subaqueous Services, Inc. and Lance Young (filed as an exhibit to the Company’s Current Report on Form 8-K on March 4, 2008)
|
|
|
2 .2
|
Purchase Agreement dated January 28, 2010 by and among LaQuay Holdings., Inc and Seagull Services Inc. (filed as Exhibit 2.1 to the Company’s Current Report on Form 8-K on February 2, 2010)
|
|
|
3 .1
|
Amended and Restated Certificate of Incorporation of Orion Marine Group, Inc.
|
|
|
3 .2
|
Amended and Restated Bylaws of Orion Marine Group, Inc.
|
|
|
4 .1
|
Registration Rights Agreement between Friedman, Billings, Ramsey & Co., Inc. and Orion Marine Group, Inc. dated May 17, 2008
|
|
|
* 10 .1
|
Loan Agreement, dated as of June 30, 2010, between Orion Marine Group, Inc. and Wells Fargo National Association and Wells Fargo Securities, LLC
|
|
|
10 .2
|
Purchase/Placement Agreement dated May 9, 2009 between Orion Marine Group, Inc. and Friedman, Billings, Ramsey & Co., Inc.
|
|
|
+ 10 .8
|
2005 Stock Incentive Plan
|
|
|
+ 10 .9
|
Form of Stock Option Agreement Under the 2005 Stock Incentive Plan & Notice of Grant of Stock Option
|
|
|
+ 10 .10
|
Form of Restricted Stock Agreement Under the 2005 Stock Incentive Plan & Notice of Grant of Restricted Stock
|
|
|
+ 10 .11
|
Orion Marine Group, Inc. Long Term Incentive Plan
|
|
|
+ 10 .12
|
Form of Stock Option Agreement Under the 2007 Long Term Incentive Plan
|
|
|
+ 10 .13
|
Form of Restricted Stock Agreement and Notice of Grant of Restricted Stock
|
-49-
|
+ 10 .14
|
Executive Incentive Plan (filed as an exhibit to the Quarterly Report on Form 10-Q for the quarterly period ended September 30, 2008)
|
|
|
+ 10 .15
|
Subsidiary Incentive Plan (filed as an exhibit to the Quarterly Report on Form 10-Q for the quarterly period ended September 30, 2008)
|
|
|
+ 10 .16
|
Employment Agreement, dated as of December 4, 2009, by and between Orion Marine Group, Inc. and J. Michael Pearson (filed as exhibit 10.1 to the Current Report on Form 8-K dated December 10, 2009)
|
|
|
+ 10 .17
|
Employment Agreement, dated as of December 4, 2009, by and between Orion Marine Group, Inc. and Mark Stauffer (filed as exhibit 10.2 to the Current Report on Form 8-K dated December 10, 2009)
|
|
|
+ 10 .18
|
Employment Agreement , dated as of December 11, 2009, by and between Orion Marine Group, Inc. and Elliott Kennedy (filed as exhibit 10.4 to the Current Report on Form 8-K dated December 17, 2009)
|
|
|
+ 10 .19
|
Employment Agreement, dated as of December 11, 2009, by and between Orion Marine Group, Inc. and Jim Rose (filed as exhibit 10.5 to the Current Report on Form 8-K dated December 17, 2009)
|
|
|
+ 10 .20
|
Employment Agreement, dated as of December 11, 2009, by and between Orion Marine Group, Inc. and Peter R. Buchler (filed as exhibit 10.3 to the Current Report on Form 8-K dated December 17, 2009)
|
|
|
+ 10 .23
|
Schedule of Changes to Compensation of Non-employee Directors, effective for 2008 (filed as an exhibit to the Quarterly Report on Form 1-Q for the quarterly period ended June 30, 2008)
|
|
|
* 21 .1
|
List of Subsidiaries
|
|
|
* 23 .1
|
Consent of Independent Registered Public Accounting Firm
|
|
|
24 .1
|
Power of Attorney (included on signature page of this filing)
|
|
|
* 31 .1
|
Certification of CEO pursuant to Section 302
|
|
|
* 31 .2
|
Certification of CFO pursuant to Section 302
|
|
|
* 32 .1
|
Certification of CEO and CFO pursuant to Section 906
|
|
*
|
Filed herewith
|
|
**
|
Incorporated by reference to the Company’s report on Form 8K filed with the SEC on March 4, 2008
|
|
+
|
Management contract or compensatory plan or arrangement
|
|
(b)
|
Financial Statement Schedules
|
-50-
SIGNATURES
Pursuant to the requirements of Section 13 or 15(d) of the Securities Exchange Act of 1934, the Registrant has duly caused this Report to be signed on its behalf by the undersigned, thereunto duly authorized.
|
ORION MARINE GROUP, INC.
|
||
|
Date: March 7, 2011
|
By:
|
/s/ J. Michael Pearson
|
|
J. Michael Pearson
President and Chief Executive Officer and Director
|
Pursuant to the requirements of the Securities Exchange Act of 1934, this Report has been signed below by the following persons on behalf of the Registrant and in the capacities and on the dates indicated:
|
Signature
|
Title
|
Date
|
||
|
President and Chief
|
||||
|
/s/ J. Michael Pearson
|
Executive Officer and
|
March 7, 2011
|
||
|
J. Michael Pearson
|
Director
|
|||
|
/s/ Mark R. Stauffer
|
Chief Financial Officer
|
March 7, 2011
|
||
|
Mark R. Stauffer
|
Chief Accounting Officer
|
|||
|
/s/ Richard L. Daerr, Jr.
|
Chairman of the Board
|
March 7, 2011
|
||
|
Richard L. Daerr, Jr.
|
||||
|
/s/ Thomas N. Amonett
|
Director
|
March 7, 2011
|
||
|
Thomas N. Amonett
|
||||
|
/s/ Austin J. Shanfelter
|
Director
|
March 7, 2011
|
||
|
Austin J. Shanfelter
|
||||
|
/s/ Gene Stoever
|
Director
|
March 7, 2011
|
||
|
Gene Stoever
|
|
|
-51-
ORION MARINE GROUP, INC. AND SUBSIDIARIES
CONSOLIDATED FINANCIAL STATEMENTS
WITH REPORT OF INDEPENDENT REGISTERED PUBLIC ACCOUNTING FIRM
December 31, 2010
-F1-
ORION MARINE GROUP, INC. AND SUBSIDIARIES
INDEX TO CONSOLIDATED FINANCIAL STATEMENTS
December 31, 2010
|
Report of Independent Registered Public Accounting Firm
|
F3
|
|
Consolidated Balance Sheets at December 31, 2010 and 2009
|
F5
|
|
Consolidated Statements of Income for the Years Ended December 31, 2010, 2009 and 2008
|
F6
|
|
Consolidated Statement of Stockholders’ Equity for the Year Ended December 31, 2010
|
F7
|
|
Consolidated Statements of Cash Flows for the Years Ended December 31, 2010, 2009 and 2008
|
F8
|
|
Notes to Consolidated Financial Statements
|
F9
|
-F2-
REPORT OF INDEPENDENT REGISTERED PUBLIC ACCOUNTING FIRM
To the Board of Directors and Stockholders of
Orion Marine Group, Inc.
We have audited the accompanying consolidated balance sheets of Orion Marine Group, Inc. and subsidiaries at December 31, 2010 and 2009, and the related consolidated statements of income, stockholders’ equity and cash flows for each of the three years in the period ended December 31, 2010. These financial statements are the responsibility of the Company’s management. Our responsibility is to express an opinion on these financial statements based on our audits.
We conducted our audits in accordance with the standards of the Public Company Accounting Oversight Board (United States). Those standards require that we plan and perform the audit to obtain reasonable assurance about whether the financial statements are free of material misstatement. An audit also includes examining, on a test basis, evidence supporting the amounts and disclosures in the financial statements, assessing the accounting principles used and significant estimates made by management, as well as evaluating the overall financial statement presentation. We believe that our audits provide a reasonable basis for our opinion.
In our opinion, the consolidated financial statements referred to above present fairly, in all material respects, the financial position of Orion Marine Group, Inc. and subsidiaries at December 31, 2010 and 2009 and the results of their operations and their cash flows for each of the three years in the period ended December 31, 2010, in conformity with accounting principles generally accepted in the United States of America.
We also have audited, in accordance with the standards of the Public Company Accounting Oversight Board (United States), Orion Marine Group, Inc.’s internal control over financial reporting as of December 31, 2010, based on criteria established in Internal Control—Integrated Framework issued by the Committee of Sponsoring Organizations of the Treadway Commission (COSO) and our report dated March 7, 2011 expressed an unqualified opinion on the effectiveness of internal control over financial reporting.
/s/ Grant Thornton LLP
Houston, Texas
March 7, 2011
-F3-
REPORT OF INDEPENDENT REGISTERED PUBLIC ACCOUNTING FIRM
To the Board of Directors and Stockholders of
Orion Marine Group, Inc.
We have audited Orion Marine Group, Inc.’s internal control over financial reporting as of December 31, 2010, based on criteria established in Internal Control—Integrated Framework issued by the Committee of Sponsoring Organizations of the Treadway Commission (COSO). Orion Marine Group Inc.’s management is responsible for maintaining effective internal control over financial reporting and for its assessment of the effectiveness of internal control over financial reporting, included in Management’s Report on Internal Control over Financial Reporting. Our responsibility is to express an opinion on Orion Marine Group Inc.’s internal control over financial reporting based on our audit.
We conducted our audit in accordance with the standards of the Public Company Accounting Oversight Board (United States). Those standards require that we plan and perform the audit to obtain reasonable assurance about whether effective internal control over financial reporting was maintained in all material respects. Our audit included obtaining an understanding of internal control over financial reporting, assessing the risk that a material weakness exists, testing and evaluating the design and operating effectiveness of internal control based on the assessed risk, and performing such other procedures as we considered necessary in the circumstances. We believe that our audit provides a reasonable basis for our opinion.
A company’s internal control over financial reporting is a process designed to provide reasonable assurance regarding the reliability of financial reporting and the preparation of financial statements for external purposes in accordance with generally accepted accounting principles. A company’s internal control over financial reporting includes those policies and procedures that (1) pertain to the maintenance of records that, in reasonable detail, accurately and fairly reflect the transactions and dispositions of the assets of the company; (2) provide reasonable assurance that transactions are recorded as necessary to permit preparation of financial statements in accordance with generally accepted accounting principles, and that receipts and expenditures of the company are being made only in
accordance with authorizations of management and directors of the company; and (3) provide reasonable assurance regarding prevention or timely detection of unauthorized acquisition, use, or disposition of the company’s assets that could have a material effect on the financial statements.
Because of its inherent limitations, internal control over financial reporting may not prevent or detect misstatements. Also, projections of any evaluation of effectiveness to future periods are subject to the risk that controls may become inadequate because of changes in conditions, or that the degree of compliance with the policies or procedures may deteriorate.
In our opinion, Orion Marine Group, Inc. has maintained, in all material respects, effective internal control over financial reporting as of December 31, 2010, based on criteria established in Internal Control—Integrated Framework issued by COSO.
We also have audited, in accordance with the standards of the Public Company Accounting Oversight Board (United States), the consolidated balance sheets of Orion Marine Group, Inc. and subsidiaries as of December 31, 2010 and 2009 and the related consolidated statements of income, stockholders’ equity, and cash flows for each of the three years in the period ended December 31, 2010, and our report dated March 7, 2011 expressed an unqualified opinion on those consolidated financial statements.
/s/ GRANT THORNTON LLP
Houston, Texas
March 7, 2011
-F4-
ORION MARINE GROUP, INC. AND SUBSIDIARIES
CONSOLIDATED BALANCE SHEETS
DECEMBER 31, 2010 AND 2009
(In thousands, except share and per share amounts)
|
December 31,
|
||||||||
|
2010
|
2009
|
|||||||
|
ASSETS
|
||||||||
|
Current assets:
|
||||||||
|
Cash and cash equivalents
|
$ | 23,174 | $ | 104,736 | ||||
|
Accounts receivable:
|
||||||||
|
Trade, net of allowance of $0 and $1,202, respectively
|
40,211 | 32,819 | ||||||
|
Retainage
|
10,643 | 12,028 | ||||||
|
Other
|
4,988 | 922 | ||||||
|
Income taxes receivable
|
7,668 | 3,040 | ||||||
|
Note receivable
|
90 | 961 | ||||||
|
Inventory
|
2,991 | 1,472 | ||||||
|
Deferred tax asset
|
1,794 | 1,499 | ||||||
|
Costs and estimated earnings in excess of billings on uncompleted contracts
|
26,103 | 10,868 | ||||||
|
Prepaid expenses and other
|
2,076 | 1,624 | ||||||
|
Total current assets
|
119,738 | 169,969 | ||||||
|
Property and equipment, net
|
155,311 | 90,790 | ||||||
|
Goodwill
|
32,168 | 12,096 | ||||||
|
Intangible assets, net of accumulated amortization
|
5 | 38 | ||||||
|
Other assets
|
357 | 264 | ||||||
|
Total assets
|
$ | 307,579 | $ | 273,157 | ||||
|
LIABILITIES AND STOCKHOLDERS’ EQUITY
|
||||||||
|
Current liabilities:
|
||||||||
|
Current portion of long-term debt
|
$ | — | $ | — | ||||
|
Accounts payable:
|
||||||||
|
Trade
|
25,519 | 23,680 | ||||||
|
Retainage
|
377 | 1,227 | ||||||
|
Accrued liabilities
|
12,463 | 8,354 | ||||||
|
Taxes payable
|
262 | 312 | ||||||
|
Billings in excess of costs and estimated earnings on uncompleted contracts
|
4,389 | 5,636 | ||||||
|
Total current liabilities
|
43,010 | 39,209 | ||||||
|
Long-term debt, less current portion
|
— | — | ||||||
|
Other long-term liabilities
|
746 | 514 | ||||||
|
Deferred income taxes
|
16,707 | 11,453 | ||||||
|
Deferred revenue
|
260 | 315 | ||||||
|
Total liabilities
|
60,723 | 51,491 | ||||||
|
Commitments and contingencies
|
||||||||
|
Stockholders’ equity:
|
||||||||
|
Common stock — $0.01 par value, 50,000,000 authorized, 27,017,165
|
||||||||
|
and 26,852,407 issued; 27,004,934 and 26,840,761 outstanding at December 31, 2010 and 2009, respectively
|
270 | 268 | ||||||
|
Treasury stock, 12,231 and 11,646 shares at December 31, 2010 and 2009, respectively, at cost
|
— | — | ||||||
|
Additional paid-in capital
|
154,667 | 151,361 | ||||||
|
Retained earnings
|
91,919 | 70,037 | ||||||
|
Total stockholders’ equity
|
246,856 | 221,666 | ||||||
|
Total liabilities and stockholders’ equity
|
$ | 307,579 | $ | 273,157 | ||||
The accompanying notes are an integral part of these consolidated financial statements
-F5-
ORION MARINE GROUP, INC. AND SUBSIDIARIES
CONSOLIDATED STATEMENTS OF INCOME
(In thousands, except share and per share amounts)
|
Year ended December 31,
|
||||||||||||
|
2010
|
2009
|
2008
|
||||||||||
|
Contract revenues
|
$ | 353,135 | $ | 293,494 | $ | 261,802 | ||||||
|
Costs of contract revenues
|
287,902 | 230,797 | 211,351 | |||||||||
|
Gross profit
|
65,233 | 62,697 | 50,451 | |||||||||
|
Selling, general and administrative expenses
|
32,646 | 30,694 | 27,730 | |||||||||
| Operating income | 32,587 | 32,002 | 22,721 | |||||||||
|
Other (income) expense
|
||||||||||||
|
Gain from bargain purchase of a business
|
(1,589 | ) | — | — | ||||||||
|
Interest (income)
|
(99 | ) | (352 | ) | (530 | ) | ||||||
|
Interest expense
|
434 | 790 | 1,494 | |||||||||
|
Other (income) expense, net
|
(1,254 | ) | 438 | 964 | ||||||||
|
Income before income taxes
|
33,841 | 31,564 | 21,757 | |||||||||
|
Income tax expense
|
11,959 | 11,534 | 7,282 | |||||||||
|
Net income
|
$ | 21,882 | $ | 20,030 | $ | 14,475 | ||||||
|
Basic earnings per share
|
$ | 0.81 | $ | 0.85 | $ | 0.67 | ||||||
|
Diluted earnings per share
|
$ | 0.81 | $ | 0.84 | $ | 0.66 | ||||||
|
Shares used to compute earnings per share
|
||||||||||||
|
Basic
|
26,899,373 | 23,577,854 | 21,561,201 | |||||||||
|
Diluted
|
27,165,852 | 23,979,943 | 21,979,535 | |||||||||
The accompanying notes are an integral part of these consolidated financial statements
-F6-
ORION MARINE GROUP, INC. AND SUBSIDIARIES
CONSOLIDATED STATEMENT OF STOCKHOLDERS’ EQUITY
(In thousands, except share information)
|
Additional
|
||||||||||||||||||||||||||||
|
Common stock
|
Treasury stock
|
Paid-in
|
Retained
|
|||||||||||||||||||||||||
|
Shares
|
Amount
|
Shares
|
Amount
|
capital
|
earnings
|
Total
|
||||||||||||||||||||||
|
Balance, December 31, 2007
|
21,565,324 | $ | 216 | — | $ | — | $ | 54,336 | $ | 35,532 | $ | 90,084 | ||||||||||||||||
|
Forfeit unvested restricted stock
|
— | (11,646 | ) | — | — | |||||||||||||||||||||||
|
Stock-based compensation
|
1,103 | 1,103 | ||||||||||||||||||||||||||
|
Expenses related to the sale of common stock
|
(51 | ) | (51 | ) | ||||||||||||||||||||||||
|
Issuance of restricted stock
|
12,042 | — | — | — | ||||||||||||||||||||||||
|
Net income
|
— | — | — | — | — | 14,475 | 14,475 | |||||||||||||||||||||
|
Balance, December 31, 2008
|
21,577,366 | $ | 216 | (11,646 | ) | $ | — | $ | 55,388 | $ | 50,007 | $ | 105,611 | |||||||||||||||
|
Stock-based compensation
|
1,614 | 1,614 | ||||||||||||||||||||||||||
|
Exercise of stock options
|
382,852 | $ | 4 | 1,934 | 1,938 | |||||||||||||||||||||||
|
Excess tax benefits from exercise of stock options
|
1,476 | 1,476 | ||||||||||||||||||||||||||
|
Proceeds from sale of common stock, net of expenses
|
4,830,000 | $ | 48 | 90,949 | 90,997 | |||||||||||||||||||||||
|
Issuance of restricted stock
|
62,189 | |||||||||||||||||||||||||||
|
Net income
|
— | — | — | — | — | 20,030 | 20,030 | |||||||||||||||||||||
|
Balance, December 31, 2009
|
26,852,407 | $ | 268 | (11,646 | ) | $ | — | $ | 151,361 | $ | 70,037 | $ | 221,666 | |||||||||||||||
|
Stock-based compensation
|
2,542 | 2,542 | ||||||||||||||||||||||||||
|
Exercise of stock options
|
82,510 | $ | 1 | 668 | 669 | |||||||||||||||||||||||
|
Excess tax benefits from exercise of stock options
|
96 | 96 | ||||||||||||||||||||||||||
|
Issuance of restricted stock
|
82,248 | $ | 1 | 1 | ||||||||||||||||||||||||
|
Forfeiture of restricted stock
|
(585 | ) | — | |||||||||||||||||||||||||
|
Net income
|
— | — | — | — | — | 21,882 | 21,882 | |||||||||||||||||||||
|
Balance, December 31, 2010
|
27,017,165 | $ | 270 | (12,231 | ) | $ | — | $ | 154,667 | $ | 91,919 | $ | 246,856 | |||||||||||||||
The accompanying notes are an integral part of this consolidated financial statement
-F7-
ORION MARINE GROUP, INC. AND SUBSIDIARIES
CONSOLIDATED STATEMENTS OF CASH FLOWS
(In thousands)
|
Year ended December 31,
|
||||||||||||
|
2010
|
2009
|
2008
|
||||||||||
|
Cash flows from operating activities
|
||||||||||||
|
Net income
|
$ | 21,882 | $ | 20,030 | $ | 14,475 | ||||||
|
Adjustments to reconcile net income to net cash provided by operating activities:
|
||||||||||||
|
Depreciation and amortization
|
19,458 | 18,536 | 18,599 | |||||||||
|
Deferred financing cost amortization
|
296 | 252 | 249 | |||||||||
|
Non-cash interest expense
|
— | — | 22 | |||||||||
|
Bad debt (recovery) expense
|
(285 | ) | 442 | 300 | ||||||||
|
Deferred income taxes
|
4,959 | (1,013 | ) | (2,410 | ) | |||||||
|
Stock-based compensation
|
2,542 | 1,614 | 1,103 | |||||||||
|
Gain on bargain purchase of a business
|
(1,589 | ) | — | — | ||||||||
|
Gain on sale of property and equipment
|
(459 | ) | (518 | ) | (1,075 | ) | ||||||
|
Excess tax benefit from stock option exercise
|
(96 | ) | (1,476 | ) | — | |||||||
|
Change in operating assets and liabilities, net of
|
||||||||||||
|
effects of acquisitions of businesses:
|
||||||||||||
|
Accounts receivable
|
(5,073 | ) | (1,996 | ) | (4,550 | ) | ||||||
|
Income tax receivable
|
(5,119 | ) | 2,453 | (4,017 | ) | |||||||
|
Note receivable
|
1,246 | (961 | ) | — | ||||||||
|
Inventory
|
(1,519 | ) | (734 | ) | (92 | ) | ||||||
|
Prepaid expenses and other
|
(698 | ) | 1,608 | (2,380 | ) | |||||||
|
Costs and estimated earnings in excess of
|
||||||||||||
|
billings on uncompleted contracts
|
(13,733 | ) | (3,640 | ) | 1,678 | |||||||
|
Accounts payable
|
(7,651 | ) | 11,241 | 1,848 | ||||||||
|
Accrued liabilities
|
3,024 | 270 | 661 | |||||||||
|
Income tax payable
|
(50 | ) | 314 | (1,960 | ) | |||||||
|
Billings in excess of costs and estimated
|
||||||||||||
|
earnings on uncompleted contracts
|
(3,241 | ) | (6,030 | ) | 4,076 | |||||||
|
Deferred revenue
|
(55 | ) | (56 | ) | (56 | ) | ||||||
|
Net cash provided by operating activities
|
13,839 | 40,336 | 26,471 | |||||||||
|
Cash flows from investing activities:
|
||||||||||||
|
Proceeds from sale of property and equipment
|
827 | 1,095 | 3,861 | |||||||||
|
Purchase of property and equipment
|
(29,050 | ) | (22,693 | ) | (14,485 | ) | ||||||
|
Acquisition of T.W. LaQuay Dredging
|
(60,879 | ) | — | — | ||||||||
|
Acquisition of business (net of cash acquired)
|
(6,653 | ) | — | (36,713 | ) | |||||||
|
Net cash used in investing activities
|
(95,755 | ) | (21,598 | ) | (47,337 | ) | ||||||
|
Cash flows from financing activities:
|
||||||||||||
|
Increase in loan costs
|
(411 | ) | — | (80 | ) | |||||||
|
Borrowings on long-term debt
|
— | — | 35,000 | |||||||||
|
Payments on long-term debt
|
— | (34,125 | ) | (875 | ) | |||||||
|
Purchase of treasury stock
|
— | — | — | |||||||||
|
Exercise of stock options
|
669 | 1,938 | — | |||||||||
|
Excess tax benefit from stock option exercise
|
96 | 1,476 | — | |||||||||
|
Proceeds from the sale of common stock, net of offering costs
|
— | 90,997 | (51 | ) | ||||||||
|
Redemption of common stock
|
— | — | — | |||||||||
|
Net cash provided by financing activities
|
354 | 60,286 | 33,994 | |||||||||
|
Net change in cash and cash equivalents
|
(81,562 | ) | 79,024 | 13,128 | ||||||||
|
Cash and cash equivalents at beginning of period
|
104,736 | 25,712 | 12,584 | |||||||||
|
Cash and cash equivalents at end of period
|
$ | 23,174 | $ | 104,736 | $ | 25,712 | ||||||
|
Supplemental disclosures of cash flow information:
|
||||||||||||
|
Cash paid during the period for:
|
||||||||||||
|
Interest
|
$ | 547 | $ | 553 | $ | 1,234 | ||||||
|
Taxes, net of refunds
|
$ | 12,149 | $ | 9,781 | $ | 14,476 | ||||||
|
Significant non-cash investing and financing activities:
|
||||||||||||
|
Non-cash capital expenditures
|
$ | 1,110 | $ | 42 | $ | — | ||||||
The accompanying notes are an integral part of these consolidated financial statements
-F8-
ORION MARINE GROUP, INC. AND SUBSIDIARIES
NOTES TO CONSOLIDATED FINANCIAL STATEMENTS
YEARS ENDED DECEMBER 31, 2010, 2009 AND 2008
(Tabular Amounts in 000’s, Except for Share and per Share Amounts)
|
1.
|
Description of Business and Basis of Presentation
|
Description of Business
Orion Marine Group, Inc. and its subsidiaries (hereafter collectively referred to as “Orion” or the “Company”) provide a broad range of marine construction services on, over and under the water along the Gulf Coast, the Atlantic Seaboard, the Pacific Northwest and the Caribbean Basin. Our heavy civil marine projects include marine transportation facilities; bridges and causeways; marine pipelines; mechanical and hydraulic dredging and specialty projects. We are headquartered in Houston, Texas.
Although we describe our business in this report in terms of the services we provide, our base of customers and the geographic areas in which we operate, we have concluded that our operations comprise one reportable segment pursuant to Financial Accounting Standards Board (“FASB”) Accounting Standards Codification (“ASC”) Topic 280 – Segment Reporting. In making this determination, we considered that each project has similar characteristics, includes similar services, has similar types of customers and is subject to the same regulatory environment. We organize, evaluate and manage our financial information around each project when making operating decisions and assessing our overall performance.
Basis of Presentation
These consolidated financial statements include the accounts of the parent company, Orion Marine Group, Inc. and its wholly-owned subsidiaries and have been prepared in accordance with accounting principles generally accepted in the United States of America. All significant intercompany balances and transactions have been eliminated in consolidation.
|
2.
|
Summary of Accounting Principles
|
Use of Estimates
The preparation of consolidated financial statements in conformity with accounting principles generally accepted in the United States of America requires management to make estimates and assumptions that affect the reported amounts of assets and liabilities and disclosure of contingent assets and liabilities at the date of the consolidated financial statements and the reported amounts of revenues and expenses during the reporting period. Management’s estimates, judgments and assumptions are continually evaluated based on available information and experience; however, actual amounts could differ from those estimates.
The Company’s significant accounting policies that rely on the application of estimates and assumptions include:
|
|
·
|
Revenue recognition from construction contracts;
|
|
|
·
|
Allowance for doubtful accounts;
|
|
|
·
|
Testing of goodwill and other long-lived assets for possible impairment;
|
|
|
·
|
Income taxes;
|
|
|
·
|
Self-insurance; and
|
|
|
·
|
Stock-based compensation
|
-F9-
Revenue Recognition
The Company records revenue on construction contracts for financial statement purposes on the percentage-of-completion method, measured by the percentage of contract costs incurred to date to total estimated costs for each contract. This method is used because management considers contract costs incurred to be the best available measure of progress on these contracts. Contract revenue reflects the original contract price adjusted for agreed upon change orders. Contract costs include all direct costs, such as material and labor, and those indirect costs related to contract performance such as payroll taxes and insurance. General and administrative costs are charged to expense as incurred. Unapproved claims are recognized as an increase in contract revenue only when the collection is deemed probable and if the
amount can be reasonably estimated for purposes of calculating total profit or loss on long-term contracts. Incentive fees, if available, are billed to the customer based on the terms and conditions of the contract. The Company records revenue and the unbilled receivable for claims to the extent of costs incurred and to the extent we believe related collection is probable and includes no profit on claims recorded. Changes in job performance, job conditions and estimated profitability, including those arising from final contract settlements, may result in revisions to costs and revenues and are recognized in the period in which the revisions are determined. Provisions for estimated losses on uncompleted contracts are made in the period in which such losses are determined, without regard to the percentage of completion. Revenue is recorded net of any sales taxes collected and paid on behalf of the customer, if applicable.
The current asset “costs and estimated earnings in excess of billings on uncompleted contracts” represents revenues recognized in excess of amounts billed to the customer, which management believes will be billed and collected within one year of the completion of the contract. The liability “billings in excess of costs and estimated earnings on uncompleted contracts” represents billings in advance of work performed.
The Company’s projects are typically short in duration, and usually span a period of three to nine months. Historically, we have not combined or segmented contracts.
Classification of Current Assets and Liabilities
The Company includes in current assets and liabilities amounts realizable and payable in the normal course of contract completion.
Cash Equivalents
The Company considers all highly liquid investments with a maturity of three months or less when purchased to be cash equivalents. At times, cash held by financial institutions may exceed federally insured limits. We have not historically sustained losses on our cash balances in excess of federally insured limits. Cash equivalents at December 31, 2010 and 2009 consisted primarily of money market mutual funds and overnight bank deposits.
Foreign Currencies
Historically, the Company’s exposure to foreign currency fluctuations has not been material and has been limited to temporary field accounts, located in countries where the Company performs work, which amounts were insignificant in either 2010 or 2009.
Risk Concentrations
Financial instruments that potentially subject the Company to concentrations of credit risk principally consist of cash and cash equivalents and accounts receivable.
-F10-
The Company depends on its ability to continue to obtain federal, state and local governmental contracts, and indirectly, on the amount of funding available to these agencies for new and current governmental projects. Therefore, the Company’s operations can be influenced by the level and timing of government funding. Statutory mechanics liens provide the Company high priority in the event of lien foreclosures following financial difficulties of private owners, thus minimizing credit risk with private customers.
The following table represents concentrations of receivables (trade and retainage) at December 31, 2010 and 2009:
|
December 31, 2010
|
December 31, 2009
|
|||||||||||||||
|
A/R
|
%
|
A/R
|
%
|
|||||||||||||
|
Federal Government
|
$ | 16,881 | 33 | % | $ | 5,262 | 12 | % | ||||||||
|
State Governments
|
3,156 | 6 | % | 1,124 | 3 | % | ||||||||||
|
Local Municipalities
|
11,236 | 22 | % | 11,431 | 25 | % | ||||||||||
|
Private Companies
|
19,581 | 39 | % | 27,030 | 60 | % | ||||||||||
| $ | 50,854 | 100 | % | $ | 44,847 | 100 | % | |||||||||
At December 31, 2010 and 2009, one customer in each period accounted for 17.7% and 12.3% of total receivables, respectively.
Accounts Receivable
Accounts receivable are stated at the historical carrying value, less write-offs and allowances for doubtful accounts. The Company has significant investments in billed and unbilled receivables as of December 31, 2010 and 2009. Billed receivables represent amounts billed upon the completion of small contracts and progress billings on large contracts in accordance with contract terms and milestones. Unbilled receivables on fixed-price contracts, which are included in costs in excess of billings, arise as revenues are recognized under the percentage-of-completion method. Unbilled amounts on cost-reimbursement contracts represent recoverable costs and accrued profits not yet billed. Revenue associated with these billings is recorded net of any sales tax, if applicable. Past due balances over 90 days and other higher
risk amounts are reviewed individually for collectability. In establishing an allowance for doubtful accounts, the Company evaluates its contract receivables and costs in excess of billings and thoroughly reviews historical collection experience, the financial condition of its customers, billing disputes and other factors. The Company writes off uncollectible accounts receivable against the allowance for doubtful accounts if it is determined that the amounts will not be collected or if a settlement is reached for an amount that is less than the carrying value.
At December 31, 2010 and 2009, the Company had an allowance for doubtful accounts of $0 and $1.2 million respectively.
Balances billed to customers but not paid pursuant to retainage provisions in construction contracts generally become payable upon contract completion and acceptance by the owner. Retention at December 31, 2010 totaled $10.6 million, of which $1.8 million is expected to be collected beyond 2011. Retention at December 31, 2009 totaled $12.0 million.
The Company negotiates change orders and claims with its customers. Unsuccessful negotiations of claims could result in a change to contract revenue that is less than its carrying value, which could result in the recording of a loss. Successful claims negotiations could result in the recovery of previously recorded losses. Significant losses on receivables could adversely affect the Company’s financial position, results of operations and overall liquidity.
Advertising Costs
The Company primarily obtains contracts through the open bid process, and therefore advertising costs are not a significant component of expense. Advertising costs are expensed as incurred. Advertising expenses totaled $63,000 in 2010, $39,500 in 2009, and $30,500 in 2008.
-F11-
Environmental Costs
Costs related to environmental remediation are charged to expense. Other environmental costs are also charged to expense unless they increase the value of the property and/or provide future economic benefits, in which event the costs are capitalized. Liabilities, if any, are recognized when the expenditure is considered probable and the amount can be reasonably estimated.
Fair Value Measurements
We evaluate and present certain amounts included in the accompanying consolidated financial statements at “fair value” in accordance with GAAP, which requires us to base our estimates on assumptions market participants, in an orderly transaction, would use to price an asset or liability, and to establish a hierarchy that prioritizes the information used to determine fair value. In measuring fair value, we use the following inputs in the order of priority indicated:
Level 1 – Quoted prices in active markets for identical, unrestricted assets or liabilities.
Level II – Observable inputs other than Level I prices, such as (i) quoted prices for similar assets or liabilities; (ii) quoted prices in markets that have insufficient volume or infrequent transactions; and (iii) inputs that are derived principally from or corroborated by observable market data for substantially the full term of the assets or liabilities.
Level III – Unobservable inputs to the valuation methodology that are significant to the fair value measurement.
We generally apply fair value valuation techniques on a non-recurring basis associated with (1) valuing assets and liabilities acquired in connection with business combinations and other transactions; (2) valuing potential impairment loss related to long-lived assets; and (3) valuing potential impairment loss related to goodwill and indefinite-lived intangible assets.
Inventory
Inventory consists of parts and small equipment held for use in the ordinary course of business and is valued at the lower of cost or market using historical average cost. Where shipping and handling costs are incurred by us, these charges are included in inventory and charged to cost of contract revenue upon use.
Property and Equipment
Property and equipment are recorded at cost. Ordinary maintenance and repairs that do not improve or extend the useful life of the asset are expensed as incurred. Major renewals and betterments of equipment are capitalized and depreciated generally over three to seven years until the next scheduled maintenance.
When property and equipment are retired or otherwise disposed of, the cost and accumulated depreciation are removed from the accounts and any resulting gain or loss is included in results of operations for the respective period. Depreciation is computed using the straight-line method over the estimated useful lives of the related assets for financial statement purposes, as follows:
|
Automobiles and trucks
|
3 to 5 years
|
|
Buildings and improvements
|
5 to 30 years
|
|
Construction equipment
|
3 to 15 years
|
|
Vessels and dredges
|
1 to 15 years
|
|
Office equipment
|
1 to 5 years
|
The Company generally uses accelerated depreciation methods for tax purposes where appropriate.
-F12-
Dry-docking activities and costs are capitalized and amortized on the straight-line method over a period ranging from three to 15 years until the next scheduled dry-docking. Dry-docking activities include, but are not limited to, the inspection, refurbishment and replacement of steel, engine components, tailshafts, mooring equipment and other parts of the vessel. Amortization related to dry-docking activities is included as a component of depreciation. These activities and the related amortization periods are periodically reviewed to determine if the estimates are accurate. If warranted, a significant upgrade of equipment may result in a revision to the useful life of the asset, in which
case, the change is accounted for prospectively.
Property and equipment are reviewed for impairment whenever events or changes in circumstances indicate that the carrying amount of an asset may not be recoverable. Recoverability of assets to be held and used is measured by a comparison of the carrying amount of an asset to estimated undiscounted future cash flows expected to be generated by the asset. If the carrying amount of an asset exceeds its estimated future cash flows, an impairment charge is recognized in the amount by which the carrying amount of the asset exceeds the fair value of the asset. Assets to be disposed of are separately presented in the balance sheet and reported at the lower of the carrying amount or the fair value, less the costs to sell, and are no longer depreciated. No property and equipment were held for sale at December 31, 2010 and
2009.
Goodwill and Other Intangible Assets
Goodwill
Goodwill recorded on our Consolidated Balance Sheets is subject to impairment testing at least annually or more frequently if events or circumstances indicate that the asset more likely than not may be impaired. We evaluate goodwill at the reporting unit level. The Company has three reporting units, which are based on geography, and are referred to internally as “East Coast”, “Gulf Coast” and Pacific Northwest. Each reporting unit conducts similar business, which includes marine construction specialty services. This reporting unit grouping reflects our internal management structure, which is based on the geographic location of our primary field offices.
At December 31, 2010, goodwill totaled $32.2 million, of which $22.6 million related to the Gulf Coast (including goodwill recorded upon the purchase of T.W. LaQuay Dredging, LLC, as discussed in Note 4 below), and $9.6 million resulted from the acquisition of equipment on the East Coast in 2008. The Pacific Northwest reporting unit does not have goodwill.
The Company assesses the fair value of its reporting units based on a weighted average of valuations based on market multiples, discounted cash flows, and consideration of our market capitalization. The key assumptions used in the discounted cash flow valuations are discount rates and perpetual growth rates applied to cash flow projections. Also inherent in the discounted cash flow valuation models are past performance, projections and assumptions in current operating plans, and revenue growth rates over the next five years. These assumptions contemplate business, market and overall economic conditions. We also consider assumptions that market participants may use.
As required by the Company’s policy, annual impairment tests of goodwill are performed as of October 31 of each year or when circumstances arise that indicate a possible impairment might exist. Based on this testing, the Company determined that goodwill was not impaired as of October 31, 2010, and no events have occurred since that date that would require an interim impairment test. The discount rate used in testing goodwill for impairment was 17% for the Gulf Coast reporting unit and 18.5% for the East Coast reporting unit. Revenue growth for each reporting unit was based on management’s estimates, which was a conservative estimate due to pricing pressures and economic and market conditions. As compared with the impairment test performed in 2009, the
discount rate increased by 110 basis points in the Gulf Coast reporting unit and by 260 basis points in the East Coast reporting unit, due to our assessment of economic conditions and risk while the stabilized growth rate remained constant at 5%. This had the effect of conservatively estimating the fair value in the 2010 impairment test. The impairment test concluded that the fair value of the Gulf Coast reporting unit and the East Coast reporting unit exceeded carrying values by 62% and 16%, respectively. In the future, our estimated fair value could be negatively impacted by deteriorating economic conditions, which may reduce our revenue growth potential.
-F13-
Intangible assets
Intangible assets that have finite lives continue to be subject to amortization. In addition, the Company must evaluate the remaining useful life in each reporting period to determine whether events and circumstances warrant a revision of the remaining period of amortization. If the estimate of an intangible asset’s remaining life is changed, the remaining carrying value of such asset is amortized prospectively over that revised remaining useful life.
Stock-Based Compensation
The Company recognizes compensation expense for equity awards over the vesting period based on the fair value of these awards at the date of grant. The computed fair value of these awards is recognized as a non-cash cost over the period the employee provides services, which is typically the vesting period of the award. The fair value of options granted is estimated on the date of grant using the Black-Scholes option-pricing model. The fair value of restricted stock grants is equivalent to the fair value of the stock issued on the date of grant.
Compensation expense is recognized only for share-based payments expected to vest. The Company estimates forfeitures at the date of grant based on historical experience and future expectations. See Note 14 to the consolidated financial statements for further discussion of the Company’s stock-based compensation plan.
Income Taxes
The Company determines its consolidated income tax provision using the asset and liability method prescribed by US GAAP, which requires the recognition of income tax expense for the amount of taxes payable or refundable for the current period and for deferred tax liabilities and assets for the future tax consequences of events that have been recognized in an entity’s financial statements or tax returns. The Company must make significant assumptions, judgments and estimates to determine its current provision for income taxes, its deferred tax assets and liabilities, and any valuation allowance to be recorded against any deferred tax asset. The current provision for income tax is based upon the current tax laws and the Company’s interpretation of these laws, as well as the probable outcomes of any tax
audits. The value of any net deferred tax asset depends upon estimates of the amount and category of future taxable income reduced by the amount of any tax benefits that the Company does not expect to realize. Actual operating results and the underlying amount and category of income in future years could render current assumptions, judgments and estimates of recoverable net deferred taxes inaccurate, thus impacting the Company’s financial position and results of operations. The Company computes deferred income taxes using the liability method. Under the liability method, deferred tax assets and liabilities are recognized for the future tax consequences attributable to differences between the financial statement carrying amounts of existing assets and liabilities and their respective tax bases. Deferred tax assets and liabilities are measured using enacted tax rates expected to apply to taxable income in the years in which those temporary differences are expected to be recovered
or settled. Under the liability method, the effect on deferred tax assets and liabilities of a change in tax rates is recognized in income in the period that includes the enactment date.
The Company accounts for uncertain tax positions in accordance with the provisions of ASC 740-10 which prescribes a recognition threshold and measurement attribute for financial statement disclosure of tax positions taken, or expected to be taken, on our consolidated tax return. We evaluate and record any uncertain tax positions based on the amount that management deems is more likely than not to be sustained upon examination and ultimate settlement with the tax authorities in the tax jurisdictions in which we operate.
Insurance Coverage
The Company maintains insurance coverage for its business and operations. Insurance related to property, equipment, automobile, general liability, and a portion of workers' compensation is provided through traditional policies, subject to a deductible. A portion of the Company's workers’ compensation exposure is covered through a mutual association, which is subject to supplemental calls.
-F14-
The Company maintains five levels of excess loss insurance coverage, totaling $75 million in excess of primary coverage, which excess loss coverage responds to all of the Company’s insurance policies other than a portion of its Workers’ Compensation coverage and employee health care coverage. The Company’s excess loss coverage responds to most of its policies when a primary limit of $1 million has been exhausted; provided that the primary limit for Maritime Employer’s Liability is $10 million and the Watercraft Pollution Policy primary limit is $5 million.
Separately, the Company’s employee health care is provided through a trust, administered by a third party. The Company funds the trust based on current claims. The administrator has purchased appropriate stop-loss coverage. Losses on these policies up to the deductible amounts are accrued based upon known claims incurred and an estimate to claims incurred but not reported. The accruals are derived from known facts, historical trends and industry averages to determine the best estimate of the ultimate expected loss. Actual claims may vary from our estimate. We include any adjustments to such reserves in our consolidated results of operations in the period in which they become known.
The accrued liability for self-insured claims includes incurred but not reported losses of $4.7 million and $2.1 million at December 31, 2010 and 2009, respectively.
Warranty Costs
Provision for estimated warranty costs, (if any) is made in the period in which such costs become probable and is periodically adjusted to reflect actual experience. The Company historically has not been subject to significant warranty provisions. The Company’s Consolidated Balance Sheets at December 31, 2010 and 2009 included $0.1 million related to warranty costs.
Reclassifications
Certain reclassifications have been made to prior years’ financial statements to conform to the current year presentation. These reclassifications were related to the inclusion of financing cost amortization as a component of interest expense and not selling, general and administrative expenses and had no effect on previously reported net income or retained earnings.
New Accounting Pronouncements
In January 2010, the FASB issued a new accounting standard update (“ASU”) which clarifies and provides additional disclosure requirements on the transfers of assets and liabilities between Level 1 (quoted prices in active market for identical assets or liabilities) and Level 2 (significant other observable inputs) of the fair value measurement hierarchy, including the reasons for and the timing of the transfers. Additionally, the guidance requires a roll forward of activities on purchases, sales, issuance, and settlements of the assets and liabilities measured using significant unobservable inputs (Level 3 fair value measurements). This ASU is effective for us in 2010, except for the requirements to provide Level 3 activity which will become effective for us in 2011. The adoption of the currently
effective provisions of this ASU did not have a material effect on our consolidated financial statements, and we do not expect the adoption of the remaining provisions of this ASU to have a material effect on our consolidated financial statements.
During the periods presented in these financial statements, the Company implemented other new accounting pronouncements other than the one above that are discussed in the notes where applicable.
3. Offering of Common Stock
2009 Common Stock Offering
In August 2009, pursuant to a shelf registration statement on Form S-3, the Company completed a public offering of 4,830,000 shares of its common stock at $19.70 per share. The Company received proceeds, net of underwriting commissions, of $91.3 million ($18.91 per share), and paid approximately $548,000 in related offering expenses. The underwriters contributed $200,000 to offset a portion of the Company’s expenses. A portion of the offering proceeds was used to repay the Company’s outstanding debt of approximately $29.9 million.
-F15-
|
Proceeds received from the sale of securities
|
$ | 95,151 | ||
|
Less:
|
||||
|
Underwriters’ commission
|
(3,806 | ) | ||
| 91,345 | ||||
|
Offering related expenses
|
(548 | ) | ||
|
Expense credit received from underwriters
|
200 | |||
|
Total proceeds, net of expenses
|
$ | 90,997 | ||
|
Use of proceeds:
|
||||
|
Purchase of specialized equipment
|
7,000 | |||
|
Fund acquisitions in 2010
|
54,031 | |||
|
Repayment of outstanding debt
|
29,966 | |||
|
Balance retained in working capital, December 31, 2010
|
$ | — |
-F16-
|
4.
|
Business Acquisitions
|
On January 28, 2010, the Company purchased (a) the membership interests of T.W. LaQuay Dredging, LLC (“TWLD”), a Texas limited liability company, from LaQuay Holdings, Inc. (the “Seller”), (b) all of the issued and outstanding capital stock of Industrial Channel and Dock Company, a Texas Corporation, and Commercial Channel and Dock Company, a Texas Corporation (collectively, the “Channel and Dock Companies”), from Timothy W. LaQuay and Linda F. LaQuay (the principal shareholders of the Seller, the “Principal Shareholders”), and (c) certain parcels of real property located in Port Lavaca, Texas from the Principal Shareholders (collectively, the “Purchase Transactions”). TWLD and its predecessor company have operated as a marine
construction and dredging company in the Gulf Coast markets since 2000. The integration of TWLD’s operations and assets have added to the Company’s dredging fleet and enhanced its presence in the Gulf Coast. At the closing, the Company entered into a consulting agreement with Timothy and Linda LaQuay and with Charles F. Barnett for a term of one year from the Closing Date.
Upon the terms of and subject to the conditions set forth in the Purchase Agreement, the total aggregate consideration paid by the Company to the Seller and the Principal Shareholders consisted of the following:
|
|
·
|
Cash consideration of $52.4 million, paid to the Seller for the membership interests of T.W. LaQuay Dredging;
|
|
|
·
|
Cash consideration of $4.5 million, paid to the Principal Shareholders for the Channel and Dock Companies and the above mentioned parcels of land; and
|
|
|
·
|
An additional $4.0 million paid to Seller as a result of an increase in the purchase price of the membership interests by the amount of additional taxes incurred by the Seller arising from the allocation of the membership interests purchase price, as further described in Section 1060 of the U.S. Internal Revenue Code, as amended.
|
The Purchase Agreement contains customary representations, warranties, covenants and indemnities, including certain post-closing covenants with respect to confidentiality and non-competition.
The following table summarizes the allocation of the purchase price:
|
Receivables and other short-term assets
|
$ | 6,723 | ||
|
Property and equipment
|
$ | 44,925 | ||
|
Accounts payable
|
$ | (8,065 | ) | |
|
Other accrued liabilities
|
$ | (2,776 | ) | |
|
Goodwill
|
$ | 20,072 | ||
|
Total
|
$ | 60,879 |
The purchase price has been allocated to the assets acquired and the liabilities assumed using estimated fair values as of the acquisition date. Working capital items primarily include trade accounts receivable, net of trade accounts payable, which due to their short term nature, the fair value is equal to carrying value. No values were assigned to the acquisition of the trade name or the value of the contracts in backlog, as such amounts were short term in duration and immaterial in fair value.
The goodwill of $20.1 million arising from the acquisition consists primarily of the synergies and economies of scale expected from the combining of the operations of the Company and TWLD. The Company and Seller elected to treat the acquisition as an asset purchase for tax purposes. Including acquisition related costs of approximately $1.2 million, goodwill for tax purposes is approximately $21.3 million, which is amortizable over a 15 year period.
Acquisition related costs of $1.2 million are included in selling, general and administrative expenses in the Company’s income statement for the year ended December 31, 2010.
-F17-
The Company’s condensed consolidated financial statements at December 31, 2010 include results of TWLD for the period since the acquisition. Pro-forma information is presented below as if the purchase had occurred on January 1 of each reporting period:
|
2010
|
2009
|
|||||||
|
Revenue
|
$ | 356,936 | $ | 334,271 | ||||
|
Income before taxes
|
34,291 | 39,206 | ||||||
|
Net income
|
$ | 22,164 | $ | 24,879 | ||||
|
Earnings per share:
|
||||||||
|
Basic
|
$ | 0.82 | $ | 1.06 | ||||
|
Diluted
|
$ | 0.82 | $ | 1.04 | ||||
On February 11, 2010, the Company expanded its business into the Pacific Northwest through the purchase of marine construction equipment items including derrick barges, cranes, hammers and ancillary equipment from a private company exiting the marine construction business, for a purchase price of approximately $7.0 million in cash. The acquisition constitutes a business, as the assets acquired met the definition of a “self-sustaining integrated set of activities and assets capable of being conducted and managed to provide a return to investors, owners, members or participants” and include such items as (a) long-lived assets, such as marine construction equipment, (b) the ability to obtain access to necessary materials or rights, and (c)
employees, which collectively are used to bid and obtain projects, which generate contract revenue through our field office in Tacoma, Washington.
The Company applied the principles of ASC 820 regarding the determination of fair values for a variety of applications, including business combinations. The Company believes that the valuation of $9.2 million reflected the appropriate fair market value under the “in-use” valuation premise, based on the expertise of senior management, as well as reliance on outside sources, such as dealer markets, broker markets and principal to principal markets.
The fair value of the assets acquired of $9.2 million exceeded the fair value of the purchase price of $7.0 million. Accordingly, the acquisition has been accounted for as a bargain purchase, and, as a result, the Company recognized a gain of $1.6 million (net of all tax effects) associated with the transaction. The gain is included in the line item “Gain from bargain purchase of a business” in the 2010 Consolidated Statements of Income.
Acquisition related costs of $0.5 million are included in selling, general and administrative expenses in the Company’s income statement for the year ended December 31, 2010.
Discrete financial information is not available for the business prior to the acquisition.
|
5.
|
Inventory
|
Inventory at December 31, 2010 and December 31, 2009, of $3.0 million and $1.5 million, respectively, consists of parts and small equipment held for use in the ordinary course of business.
|
6.
|
Fair Value of Financial Instruments
|
The fair value of financial instruments is the amount at which the instrument could be exchanged in a current transaction between willing parties. Due to their short term nature, we believe that the carrying value of our accounts receivables, other current assets, accounts payables and other current liabilities approximate their fair values. We have a note receivable in the amount of $90,000 from a customer, which we believe that the carrying value of the note receivable approximates its fair value, and which bears interest at 10%.
The fair value of the Company’s reporting units (as needed for purposes of determining indications of impairment to the carrying value of goodwill) is determined using a weighted average of valuations based on market multiples, discounted cash flows, and consideration of our market capitalization. In 2010, the acquisitions of TWLD and our expansion into the Pacific Northwest resulted in the valuation of fixed assets and goodwill on a non-recurring basis, as presented in the table below:
-F18-
|
December 31,
2010
|
Level 1
|
Level II
|
Level III
|
|||||||||||||
|
Assets acquired in business combinations
|
$ | 54,153 | — | — | $ | 53,746 | ||||||||||
|
Goodwill and other intangibles
|
$ | 20,072 | — | — | $ | 20,072 | ||||||||||
|
7.
|
Contracts in Progress
|
Contracts in progress are as follows at December 31, 2010 and December 31, 2009:
|
2010
|
2009
|
|||||||
|
Costs incurred on uncompleted contracts
|
$ | 268,603 | $ | 235,175 | ||||
|
Estimated earnings
|
79,208 | 61,486 | ||||||
| 347,811 | 296,661 | |||||||
|
Less: Billings to date
|
(326,097 | ) | (291,429 | ) | ||||
| $ | 21,714 | $ | 5,232 | |||||
|
Included in the accompanying consolidated balance sheet under the following captions:
|
||||||||
|
Costs and estimated earnings in excess of billings on uncompleted contracts.
|
$ | 26,103 | $ | 10,868 | ||||
|
Billings in excess of costs and estimated earnings on uncompleted contracts.
|
(4,389 | ) | (5,636 | ) | ||||
| $ | 21,714 | $ | 5,232 | |||||
Contract costs include all direct costs, such as material and labor, and those indirect costs related to contract performance such as payroll taxes, insurance, job supervision and equipment charges. Provisions for estimated losses on uncompleted contracts are made in the period in which such losses are determined. Changes in job performance, job conditions and estimated profitability may result in revisions to costs and income and are recognized in the period in which the revisions are determined. An amount equal to contract costs attributable to claims is included in revenues when realization is probable and the amount can be reliably estimated.
-F19-
|
8.
|
Property and Equipment
|
The following is a summary of property and equipment at December 31, 2010 and December 31, 2009:
|
2010
|
2009
|
|||||||
|
Automobiles and trucks
|
$ | 2,134 | $ | 1,409 | ||||
|
Building and improvements
|
13,026 | 12,832 | ||||||
|
Construction equipment
|
122,792 | 92,230 | ||||||
|
Dredges and dredging equipment
|
91,018 | 44,912 | ||||||
|
Office equipment
|
3,527 | 2,460 | ||||||
| 232,498 | 153,843 | |||||||
|
Less: accumulated depreciation
|
(100,170 | ) | (82,671 | ) | ||||
|
Net book value of depreciable assets
|
132,328 | 71,172 | ||||||
|
Construction in progress
|
13,629 | 14,389 | ||||||
|
Land
|
9,354 | 5,229 | ||||||
| $ | 155,311 | $ | 90,790 | |||||
For the years ended December 31, 2010, 2009 and 2008 depreciation expense was $19.4 million, $15.5 million, and $14.7 million respectively, substantially all of which is included in the cost of contract revenue in the Company’s Consolidated Statements of Income. The assets of the Company are pledged as collateral for the Company’s line of credit.
Construction in progress is stated at cost, which includes the cost of materials, labor and other direct costs attributable to the construction. No provision for depreciation is made on construction in progress until such time as the relevant assets are completed and put into use. Construction in progress at December 31, 2010 represents construction of material and anchor barges, outfitting of boats and crane barges, and repair and refurbishment of dredges.
|
9.
|
Goodwill
|
The table below summarizes activity related to goodwill as of December 31, 2010 and 2009:
|
2010
|
2009
|
|||||||
|
Beginning balance, January 1
|
$ | 12,096 | $ | 12,096 | ||||
|
Additions
|
20,072 | — | ||||||
|
Impairment
|
— | — | ||||||
|
Ending balance, December 31
|
$ | 32,168 | $ | 12,096 | ||||
|
10.
|
Intangible assets
|
The tables below present the activity and amortizations of finite-lived intangible assets
|
2010
|
||||
|
Intangible assets, January 1, 2010
|
$ | 6,900 | ||
|
Additions
|
— | |||
|
Total intangible assets, end of year
|
6,900 | |||
|
Accumulated amortization, January 1, 2010
|
$ | (6,862 | ) | |
|
Current year amortization
|
(33 | ) | ||
|
Total accumulated amortization
|
(6,895 | ) | ||
|
Net intangible assets, end of year
|
$ | 5 | ||
-F20-
The Company’s finite-lived intangible assets are estimated to be amortized as follows:
|
Year Ended December 31,
|
||||
|
2011
|
$ | 5 | ||
|
11.
|
Accrued Liabilities
|
Accrued liabilities at December 31, 2010 and 2009 consisted of the following:
|
2010
|
2009
|
|||||||
|
Accrued salaries, wages and benefits
|
$ | 5,440 | $ | 5,195 | ||||
|
Accrual for self-insurance liabilities
|
4,709 | 2,114 | ||||||
|
Other accrued expenses
|
2,314 | 1,045 | ||||||
| $ | 12,463 | $ | 8,354 | |||||
|
12.
|
Long-term Debt and Line of Credit
|
On June 29, 2010, the Company entered into a credit agreement with Wells Fargo Bank, National Association, as administrative agent, and Wells Fargo Securities, LLC as sole lead arranger and bookrunner; and the lenders from time to time as party thereto.
The Credit Agreement provides for borrowings of up to $75,000,000 under revolving and swingline loans (as defined in the Credit Agreement) with a $20,000,000 sublimit for the issuance of letters of credit. An additional $25 million is available under the facility subject to the lenders’ discretion (together, the “Credit Facility”). The Credit Facility matures on September 30, 2013, and is guaranteed by the subsidiaries of the Company. The Credit Facility may be used to finance working capital, repay indebtedness, fund acquisitions, and for other general corporate purposes.
Revolving loans may be designated as prime rate based loans (“ABR Loans”) or Eurodollar Loans, at the Company’s request, and may be made in integrals of $500,000, in the case of an ABR Loan, or $1,000,000 in the case of a Eurodollar Loan. Swingline loans may only be designated as ABR Loans, and may be made in amounts equal to integral multiples of $100,000. The Company may convert, change or modify such designations from time to time. Interest is computed based on the designation of the Loans, and bear interest at either a prime-based interest rate or a LIBOR-based interest rate. Principal balances drawn under the Credit Facility may be prepaid at any time, in whole or in part, without premium or penalty. Amounts repaid under the
Credit Facility may be re-borrowed.
The Credit Facility contains certain restrictive financial covenants that are usual and customary for similar transactions, including;
|
|
·
|
A Fixed Charge Coverage Ratio of not less than 1.50 to 1.00 at all times;
|
|
|
·
|
A Leverage Ratio of not greater than 2.50 to 1.00 at all times;
|
|
|
·
|
A minimum Net Worth of not less than $180 million on the effective date, and at the end of each fiscal quarter thereafter, minimum net worth required as of the end of the immediately preceding fiscal quarter plus 50% of the Borrower’s and its subsidiaries consolidated net income for that quarter, plus 75% of all issuances of equity interests by Borrower during that quarter.
|
In addition, the Credit Facility contains events of default that are usual and customary for similar transactions, including non-payment of principal, interest or fees; inaccuracy of representations and warranties; violation of covenants; bankruptcy and insolvency events; and events constituting a change of control.
The Company is subject to a commitment fee, payable quarterly in arrears on the unused portion of the Credit Facility at a current rate of 0.25% of the unused balance. As of December 31, 2010, no amounts had been drawn under the Credit Facility.
-F21-
At December 31, 2010, the Company was in compliance with all its financial covenants with a sufficient margin as to not impair its ability to incur additional debt or violate the terms of the Credit Facility, and had outstanding letters of credit of $979,221. Historically, the Company has not relied on debt financing to fund its operations or working capital.
|
13.
|
Stockholders’ Equity
|
Common Stock
In August 2009, pursuant to a shelf registration statement on Form S-3, the Company completed a public offering of 4,830,000 shares of its common stock at $19.70 per share. The Company received proceeds, net of underwriting commissions, of $91.3 million ($18.91 per share), and paid approximately $548,000 in related offering expenses.
|
14.
|
Stock-Based Compensation
|
The Compensation Committee of the Company’s Board of Directors is responsible for the administration of the Company’s two stock incentive plans (the “LTIP” and the “2005 Plan”). In general, the plans provide for grants of restricted stock and stock options to be issued with a per-share price equal to the fair market value of a share of common stock on the date of grant. Option terms are specified at each grant date, but generally are 10 years. Options generally vest over a three to five year period. Total shares of common stock that may be delivered under the LTIP and the 2005 Plan may not exceed 2,943,946.
Restricted Stock
The following table summarizes the restricted stock activity under the 2005 Plan and LTIP:
|
Number
of
Shares
|
Weighted
Average
Fair Value
Per Share
|
|||||||
|
Nonvested at December 31, 2007
|
102,023 | $ | 0.02 | |||||
|
Granted
|
12,042 | $ | 8.72 | |||||
|
Vested
|
(38,132 | ) | $ | 0.02 | ||||
|
Forfeited/repurchased shares
|
(11,646 | ) | $ | 0.02 | ||||
|
Nonvested at December 31, 2008
|
64,287 | $ | 1.65 | |||||
|
Granted
|
62,189 | $ | 19.01 | |||||
|
Vested
|
(36,771 | ) | $ | 0.02 | ||||
|
Forfeited/repurchased shares
|
— | — | ||||||
|
Nonvested at December 31, 2009
|
89,705 | $ | 14.36 | |||||
|
Granted
|
82,248 | $ | 13.86 | |||||
|
Vested
|
(43,136 | ) | $ | 12.31 | ||||
|
Forfeited/repurchased shares
|
(585 | ) | $ | 0.02 | ||||
|
Nonvested at December 31, 2010
|
128,232 | $ | 14.72 | |||||
Changes to the independent director compensation plan, approved in November 2009, resulted in equity compensation granted to each of the independent directors with a fair value of $60,000, with vesting in six months from the date of grant. Also in November 2009, the Compensation Committee of the Board of Directors approved grants of stock to its named executive officers, with vesting over a three year period. In March 2010, certain named executive officers were granted a total of 3,539 shares with a grant date fair value of $17.68 per share. In November 2010, each independent director received a grant of common stock, which is restricted over the vesting period of six months. Each grant of restricted stock had a fair value of $60,000 on the date of grant. Also in
November 2010, the Compensation Committee of the Board of Directors approved grants of restricted stock, totaling 61,177 shares to its named executive officers, with vesting over a three year period. The shares had a fair value on the date of grant of $13.69.
-F22-
Stock Options
The following table summarizes the stock option activity under the 2005 Plan and LTIP:
|
Number
of
Shares
|
Weighted
Average
Exercise
Price
Per Share
|
Weighted
Average
Contractual
Life
(Years)
|
Aggregate
Intrinsic
Value
|
|||||||||||||
|
Outstanding at December 31, 2007
|
902,144 | $ | 9.44 | |||||||||||||
|
Granted
|
451,749 | $ | 6.48 | |||||||||||||
|
Exercised
|
— | — | ||||||||||||||
|
Forfeited
|
(25,553 | ) | $ | 13.65 | ||||||||||||
|
Outstanding at December 31, 2008
|
1,328,340 | $ | 8.35 | |||||||||||||
|
Granted
|
262,934 | $ | 19.19 | |||||||||||||
|
Exercised
|
(382,852 | ) | $ | 5.06 | ||||||||||||
|
Forfeited
|
(22,102 | ) | $ | 11.27 | ||||||||||||
|
Outstanding at December 31, 2009
|
1,186,320 | $ | 11.76 | |||||||||||||
|
Granted
|
217,552 | $ | 13.78 | |||||||||||||
|
Exercised
|
(82,510 | ) | $ | 8.11 | ||||||||||||
|
Forfeited
|
(12,364 | ) | $ | 14.97 | ||||||||||||
|
Outstanding at December 31, 2010
|
1,308,998 | $ | 12.30 | |||||||||||||
|
Vested at December 31, 2010 and expected to vest
|
1,285,910 | $ | 12.25 | 7.85 | $ | 2,407 | ||||||||||
|
Exercisable at December 31, 2010
|
804,264 | $ | 11.52 | 7.18 | $ | 1,702 | ||||||||||
The Company calculates the fair value of each option on the date of grant using the Black-Scholes pricing model and the following weighted-average assumptions in each year:
|
2010
|
2009
|
2008
|
||||||||||
|
Weighted average grant-date fair value of options granted
|
$ | 6.58 | $ | 8.57 | $ | 2.52 | ||||||
|
Risk-free interest rate
|
1.5 | % | 1.3 | % | 2.9 | % | ||||||
|
Expected volatility
|
50.3 | % | 66.5 | % | 37 | % | ||||||
|
Expected term of options (in years)
|
5.4 | 3.0 | 6.0 | |||||||||
|
Dividend yield
|
0 | % | 0 | % | 0 | % | ||||||
The risk-free interest rate is based on interest rates on U.S. Treasury zero-coupon issues that match the contractual terms of the stock option grants. The expected term represents the period in which the Company’s equity awards are expected to be outstanding, which for 2010 is based on the exercise history.
-F23-
In 2008, the expected term was calculated using the “simplified method” as the Company did not have sufficient information regarding historical exercise behavior to accurately estimate the expected term. For grants made in 2009 and 2010, volatility was calculated based on the Company’s historic stock price. Volatility was calculated using an average of similar public companies within the Company’s industry in 2008, as the Company did not have sufficient data to accurately estimate volatility of its common stock. The Company does not anticipate paying dividends in the future.
Compensation expense related to equity award grants totaled $2.5 million, $1.6 million, and $1.1 million, for the years ended December 31, 2010, 2009 and 2008, respectively.
As of December 31, 2010, there was $4.2 million of unrecognized compensation cost, net of estimated forfeitures, related to the Company’s non-vested equity awards, which is expected to be recognized over a weighted average period of 2.2 years.
|
2010
|
2009
|
2008
|
||||||||||
|
Total intrinsic value of options exercised
|
$ | 799 | $ | 5,042 | $ | —- | ||||||
|
Total fair value of shares vested
|
$ | 2,518 | $ | 6,367 | $ | 1,282 | ||||||
|
15.
|
Income Taxes
|
The following table presents the components of our consolidated income tax expense for each fiscal year ended December 31:
|
Current
|
Deferred
|
Total
|
||||||||||
|
2010
|
||||||||||||
|
U.S. Federal
|
$ | 6,658 | $ | 5,019 | $ | 11,677 | ||||||
|
State and local
|
77 | 205 | 282 | |||||||||
| $ | 6,735 | $ | 5,224 | $ | 11,959 | |||||||
|
2009
|
||||||||||||
|
U.S. Federal
|
$ | 11,484 | $ | (392 | ) | $ | 11,092 | |||||
|
State and local
|
1,063 | (621 | ) | 442 | ||||||||
| $ | 12,547 | $ | (1,013 | ) | $ | 11,534 | ||||||
|
2008
|
||||||||||||
|
U.S. Federal
|
$ | 9,090 | $ | (2,403 | ) | $ | 6,687 | |||||
|
State and local
|
602 | (7 | ) | 595 | ||||||||
| $ | 9,692 | $ | (2,410 | ) | $ | 7,282 | ||||||
The Company’s income tax provision reconciles to the provision at the statutory U.S. federal income tax rate for each year ended December 31 as follows:
|
2010
|
2009
|
2008
|
||||||||||
|
Statutory amount (computed at 35%)
|
$ | 11,783 | $ | 11,048 | $ | 7,615 | ||||||
|
State income tax, net of federal benefit
|
252 | 290 | 385 | |||||||||
|
Permanent differences
|
(197 | ) | 5 | (86 | ) | |||||||
|
Other (net)
|
121 | 191 | (632 | ) | ||||||||
|
Consolidated income tax provision
|
$ | 11,959 | $ | 11,534 | $ | 7,282 | ||||||
|
Consolidated effective tax rate
|
35.3 | % | 36.5 | % | 33.5 | % | ||||||
-F24-
The Company’s deferred tax (assets) liabilities are as follows:
|
December 31, 2010
|
December 31, 2009
|
|||||||||||||||
|
Current
|
Long-
term
|
Current
|
Long-
term
|
|||||||||||||
|
Assets related to:
|
||||||||||||||||
|
Accrued liabilities
|
$ | 1,482 | $ | — | $ | 837 | $ | — | ||||||||
|
Intangible assets
|
2,677 | 2,814 | ||||||||||||||
|
Allowance for bad debt
|
— | 421 | ||||||||||||||
|
Non-qualified stock options
|
104 | 72 | ||||||||||||||
|
Other
|
312 | 1,206 | 241 | 731 | ||||||||||||
|
Total assets
|
1,794 | 3,987 | 1,499 | 3,617 | ||||||||||||
|
Liabilities related to:
|
||||||||||||||||
|
Depreciation and amortization
|
(20,652 | ) | (15,003 | ) | ||||||||||||
|
Other
|
— | (42 | ) | — | (67 | ) | ||||||||||
|
Total liabilities
|
— | (20,694 | ) | — | (15,070 | ) | ||||||||||
|
Net deferred assets (liabilities)
|
$ | 1,794 | $ | (16,707 | ) | $ | 1,499 | $ | (11,453 | ) | ||||||
As reported in the balance sheet:
|
December 31,
2010
|
December 31,
2009
|
|||||||
|
As reported in the balance sheet:
|
||||||||
|
Net current deferred tax assets
|
1,794 | 1,499 | ||||||
|
Net non-current deferred tax liabilities
|
(16,707 | ) | (11,453 | ) | ||||
|
Total net deferred tax liabilities:
|
$ | (14,913 | ) | $ | (9,554 | ) | ||
In assessing the realizability of deferred tax assets at December 31, 2010, the Company considered whether it was more likely than not that some portion or all of the deferred tax assets will not be realized. The realization of deferred tax assets depends upon the generation of future taxable income during the periods in which these temporary differences become deductible. As of December 31, 2010, the Company believes that all of the deferred tax assets will be utilized and therefore has not recorded a valuation allowance.
Although the Company believes its recorded assets and liabilities are reasonable, tax regulations are subject to interpretation and tax litigation is inherently uncertain; therefore the Company’s assessments can involve both a series of complex judgments about future events and rely heavily on estimates and assumptions. Although the Company believes that the estimates and assumptions supporting its assessments are reasonable, the final determination of tax audit settlements and any related litigation could be materially different from that which is reflected in historical income tax provisions and recorded assets and liabilities. If the Company were to settle an audit or a matter under litigation, it could have a material effect on the income tax provision, net income, or cash flows in the period or periods
for which that determination is made. Any accruals for tax contingencies are provided for in accordance with US GAAP.
The Company believes that it has no uncertain tax positions. The Company does not believe that its tax positions will significantly change due to the settlement and expiration of statutes of limitations prior to December 31, 2011.
-F25-
The Company and its subsidiaries file income tax returns in the United States federal jurisdiction and in various states. With few exceptions, the Company remains subject to federal and state income tax examinations for the years of 2007, 2008, 2009 and 2010. The Company’s policy is to recognize interest and penalties related to any unrecognized tax liabilities as additional tax expense. No interest or penalties have been accrued at December 31, 2010 and 2009, as the Company has not recorded any uncertain tax positions. The Company believes it has appropriate and adequate support for the income tax positions taken and to be taken on its tax returns and that its accruals for tax liabilities are adequate for all open years based on an assessment of many factors including past experience and interpretations of
tax law applied to the facts of each matter.
|
16.
|
Earnings Per Share
|
Basic earnings per share are based on the weighted average number of common shares outstanding during each period. Diluted earnings per share are based on the weighted average number of common shares outstanding and the effect of all dilutive common stock equivalents during each period. At December 31, 2010, 2009 and 2008, 515,906, 262,934, and 996,489 common stock equivalents, respectively, were not included in the diluted earnings per share calculation, as the effect of these shares would have been anti-dilutive.
We adopted new accounting guidance on January 1, 2009 which addresses whether instruments granted in share-based payment transactions are participating securities prior to vesting and, therefore, need to participate in computing earnings per share under the two-class method. Our non-vested restricted stock awards contain nonforfeitable rights to dividends and consequently are included in the computation of basic earnings per share under the two-class method.
The following table reconciles the numerators and denominators used in the computations of both basic and diluted EPS for each fiscal year ended December 31:
|
2010
|
2009
|
2008
|
||||||||||
|
Basic EPS computation:
|
||||||||||||
|
Numerator:
|
||||||||||||
|
Net income
|
$ | 21,882 | $ | 20,030 | $ | 14,475 | ||||||
|
Denominator:
|
||||||||||||
|
Basic weighted average shares outstanding
|
26,899,373 | 23,577,854 | 21,561,201 | |||||||||
|
Basic earnings per share
|
$ | 0.81 | $ | 0.85 | $ | 0.67 | ||||||
|
Diluted EPS computation:
|
||||||||||||
|
Total basic weighted average shares outstanding
|
26,899,373 | 23,577,854 | 21,561,201 | |||||||||
|
Effect of dilutive securities:
|
||||||||||||
|
Common stock options
|
266,479 | 402,088 | 418,334 | |||||||||
|
Total weighted average shares outstanding assuming dilution
|
27,165,852 | 23,979,943 | 21,979,535 | |||||||||
|
Diluted earnings per share
|
$ | 0.81 | $ | 0.84 | $ | 0.66 | ||||||
|
17.
|
Enterprise Wide Disclosures
|
The Company is a heavy civil contractor specializing in marine construction. The Company operates as a single segment, as each project has similar characteristics, includes similar services, has similar types of customers and is subject to the same regulatory environment. The Company organizes and evaluates its financial information around each project when making operating decisions and assessing its overall performance.
The Company’s primary customers are governmental agencies in the United States. The following table represents concentrations of revenue by type of customer for the years ended December 31, 2010, 2009, and 2008.
-F26-
|
2010
|
%
|
2009
|
%
|
2008
|
%
|
|||||||||||||||||||
|
Federal
|
$ | 143,697 | 41 | % | $ | 54,173 | 19 | % | $ | 29,134 | 11 | % | ||||||||||||
|
State
|
40,145 | 11 | % | 24,835 | 8 | % | 37,340 | 14 | % | |||||||||||||||
|
Local
|
41,868 | 12 | % | 82,933 | 28 | % | 64,713 | 25 | % | |||||||||||||||
|
Private
|
127,425 | 36 | % | 131,553 | 45 | % | 130,615 | 50 | % | |||||||||||||||
| $ | 353,135 | 100 | % | $ | 293,494 | 100 | % | $ | 261,802 | 100 | % | |||||||||||||
Revenues generated outside the United States totaled 5%, 14%, and 7.0% of total revenues for the years ended 2010, 2009 and 2008, respectively. Revenue generated outside the United States in 2009 was primarily related to construction of a cruise pier and facilities in Haiti.
The Company’s long-lived assets are substantially located in the United States.
Significant customers
The following customers accounted for 10% or more of contract revenues for the years ended December 31, 2010, 2009 and 2008:
|
2010
|
2009
|
2008
|
||||||||||
|
Customer A
|
28 | % | 16 | % | N/A | |||||||
|
Customer B
|
10 | % | N/A | N/A | ||||||||
|
Customer C
|
N/A | N/A | 10 | % | ||||||||
|
18.
|
Employee Benefits
|
All employees except the Associate Divers and Associate Tugmasters, and union employees in the Pacific Northwest, are eligible to participate in the Company’s 401(k) Retirement Plan after completing six months of service. Each participant may contribute between 1% and 80% of eligible compensation on a pretax basis, up to the annual IRS limit. The Company matches 100% on the first 2% of eligible compensation contributed to the Plan and 50% on the next 2% of eligible compensation contributed to the Plan. Participants’ contributions are fully vested at all times. Employer matching contributions vest over a four-year period. At its discretion, the Company may make additional matching and profit-sharing contributions. During the years ended December 31, 2010, 2009 and 2008, the Company contributed $1.1
million, $1.0 million, and $0.9 million to the plan in each respective year.
|
19.
|
Commitments and Contingencies
|
Operating Leases
In July 2005, the Company executed a sale-leaseback transaction in which it sold an office building for $2.1 million and entered into a ten year lease agreement. The Company, at its option, can extend the lease for two additional five year terms. Scheduled increases in monthly rent are included in the lease agreement.
The sale of the office building resulted in a gain of $562,000 which has been deferred and amortized over the life of the lease. The Company recognized $54,212 in each of the years ending December 31, 2010, 2009 and 2008, respectively. Rent expense under this agreement was $170,219, $168,504, and $168,162 for each of the years ending December 31, 2010, 2009 and 2008, respectively.
In 2005, the Company entered into a lease agreement for vehicles under a continuing operating lease agreement. Rental expense under this lease for the years ended December 31, 2010, 2009 and 2008 was $3.6 million, $2.1 million, and $1.4 million, respectively.
The Company leases its corporate office in Houston, Texas under a lease with an initial term of nine years. In addition, the Company leases other facilities, including office space and yard facilities, under terms that range from one to five years. The Company also leases short-term field office space at its various construction sites for the duration of the projects.
-F27-
Future minimum lease payments under non-cancelable operating leases as of December 31, 2010 are as follows:
|
Amount
|
||||
|
Year ended December 31,
|
||||
|
2011
|
$ | 3,491 | ||
|
2012
|
2,365 | |||
|
2013
|
1,248 | |||
|
2014
|
527 | |||
|
2015
|
293 | |||
|
Thereafter
|
222 | |||
| $ | 8,146 | |||
Litigation
From time to time the Company is a party to various lawsuits, claims and other legal proceedings that arise in the ordinary course of business. These actions typically seek, among other things, compensation for alleged personal injury, breach of contract, property damage, punitive damages, civil penalties or other losses, or injunctive or declaratory relief. With respect to such lawsuits, the Company accrues reserves when it is probable a liability has been incurred and the amount of loss can be reasonably estimated. The Company does not believe any of these proceedings, individually or in the aggregate, would be expected to have a material adverse effect on results of operations, cash flows or financial condition.
The Company was named as one of a substantial number of defendants in numerous individual claims and lawsuits brought by the residents and landowners of New Orleans, Louisiana and surrounding areas in the United States District Court for the Eastern District of Louisiana. These suits have been classified as a subcategory of suits under the more expansive proceeding, In re Canal Breaches Consolidation Litigation, Civil Action No: 05-4182, (E.D. La,), which was instituted in late 2005. While not technically class actions, the individual claims and lawsuits are being prosecuted in a manner similar to that employed for federal class actions. The claims are based on flooding and related damage from Hurricane Katrina. In general, the claimants state that the
flooding and related damage resulted from the failure of certain aspects of the levee system constructed by the Corps of Engineers, and the claimants seek recovery of alleged general and special damages. The Corps of Engineers contracted with various private dredging companies, including us, to perform maintenance dredging of the waterways. On October 15, 2010, the United States Court of Appeals for the Fifth Circuit affirmed the lower court’s decision and dismissed the claimants’ suit against us and all defendant dredgers.
|
20.
|
Subsidiary Guarantors
|
The Company filed a registration statement on Form S−3 which became effective August 7, 2009, and registered certain securities described therein, including debt securities, which may be guaranteed by certain of the Company’s subsidiaries and are to be offered on a delayed or continuous basis pursuant to Rule 415 under the Securities Act of 1933. Orion Marine Group, Inc., as the parent company, has no independent assets or operations. The Company contemplates that if it offers guaranteed debt securities pursuant to the registration statement, all guarantees will be full and unconditional and joint and several, and any subsidiaries of the Company other than the subsidiary guarantors will be minor. In addition, there are no restrictions on the ability of Orion Marine Group, Inc. to obtain funds from
its subsidiaries by dividend or loan. Finally, there are no restricted assets in any subsidiaries.
-F28-