Attached files
UNITED STATES
SECURITIES AND EXCHANGE COMMISSION
WASHINGTON, D.C. 20549
FORM 10-K
(Mark One)
| x |
ANNUAL REPORT PURSUANT TO SECTION 13 OR 15(d) OF THE SECURITIES EXCHANGE ACT OF 1934
|
| For the fiscal year ended | December 31, 2010 |
| OR | |
|
o
|
TRANSITION REPORT PURSUANT TO SECTION 13 OR 15(d) OF THE SECURITIES EXCHANGE ACT OF 1934
|
| For the transition period from | to |
| Commission File No. | 001-14124 |
| MILLER INDUSTRIES, INC. |
| (Exact name of registrant as specified in its charter) |
|
Tennessee
|
62-1566286
|
|
|
(State or other jurisdiction of incorporation or organization)
|
(I.R.S. Employer Identification No.)
|
|
|
8503 Hilltop Drive, Ooltewah, Tennessee
|
37363
|
|
|
(Address of principal executive offices)
|
(Zip Code)
|
|
(423) 238-4171
|
| (Registrant’s telephone number, including area code) |
Securities registered pursuant to Section 12(b) of the Act:
|
Title of Each Class
|
Name of Each Exchange on Which Registered
|
|||||
| Common Stock, par value $.01 per share | New York Stock Exchange | |||||
Securities registered pursuant to Section 12(g) of the Act:
|
None
|
| (Title of Class) |
Indicate by check mark if the registrant is a well-known seasoned issuer, as defined in Rule 405 of the Securities Act.
o Yes x No
Indicate by check mark if the registrant is not required to file reports pursuant to Section 13 or Section 15(d) of the Act.
o Yes x No
Indicate by check mark whether the registrant (1) has filed all reports required to be filed by Section 13 or 15(d) of the Securities Exchange Act of 1934 during the preceding 12 months (or for such shorter period that the registrant was required to file such reports), and (2) has been subject to such filing requirements for the past 90 days.
x Yes o No
Indicate by check mark whether the registrant has submitted electronically and posted on its corporate Web site, if any, every Interactive Data File required to be submitted and posted pursuant to Rule 405 of Regulation S-T during the preceding 12 months (or for such shorter period that the registrant was required to submit and post such files).
o Yes o No
Indicate by check mark if disclosure of delinquent filers pursuant to Item 405 of Regulation S-K is not contained herein and will not be contained, to the best of registrant’s knowledge, in definitive proxy or information statements incorporated by reference in Part III of this Form 10-K or any amendment to this Form 10-K. o
Indicate by check mark whether the registrant is a large accelerated filer, an accelerated filer, a non-accelerated filer or a smaller reporting company. See the definitions of “large accelerated filer,” “accelerated filer” and “smaller reporting company” in Rule 12b-2 of the Exchange Act:
| Large Accelerated Filer o | Accelerated Filer x |
| Non-accelerated Filer o | Smaller Reporting Company o |
Indicate by check mark whether the registrant is a shell company (as defined in Rule 12b-2 of the Exchange Act).
o Yes x No.
The aggregate market value of the voting stock held by non-affiliates of the registrant (which for purposes hereof are all holders other than executive officers and directors) as of June 30, 2010 (the last business day of the registrant’s most recently completed second fiscal quarter) was $148,801,460 (based on 11,680,692 shares held by non-affiliates at $13.47 per share, the last sale price reported on the New York Stock Exchange on June 30, 2010).
At March 4, 2011 there were 11,792,835 shares of the registrant’s common stock, par value $0.01 per share, outstanding.
DOCUMENTS INCORPORATED BY REFERENCE
The information called for by Part III (Items 10, 11, 12, 13 and 14) is incorporated herein by reference to the Registrant’s definitive proxy statement for its 2010 Annual Meeting of Shareholders which is to be filed pursuant to Regulation 14A.

TABLE OF CONTENTS
PART I
|
ITEM 1.
|
BUSINESS |
1
|
|
| ITEM 1A. |
RISK FACTORS
|
7 | |
| ITEM 1B. |
UNRESOLVED STAFF COMMENTS
|
10 | |
|
ITEM 2.
|
PROPERTIES | 10 | |
|
ITEM 3.
|
LEGAL PROCEEDINGS | 10 | |
| PART II | |||
|
ITEM 5.
|
MARKET FOR REGISTRANT’S COMMON EQUITY, RELATED STOCKHOLDER MATTERS AND ISSUER PURCHASES OF EQUITY SECURITIES | 11 | |
|
ITEM 6.
|
SELECTED FINANCIAL DATA | 13 | |
|
ITEM 7.
|
MANAGEMENT’S DISCUSSION AND ANALYSIS OF FINANCIAL CONDITION AND RESULTS OF OPERATIONS | 14 | |
| ITEM 7A. | QUANTITATIVE AND QUALITATIVE DISCLOSURES ABOUT MARKET RISK | 20 | |
|
ITEM 8.
|
FINANCIAL STATEMENTS AND SUPPLEMENTARY DATA | 20 | |
|
ITEM 9.
|
CHANGES IN AND DISAGREEMENTS WITH ACCOUNTANTS ON ACCOUNTING AND FINANCIAL DISCLOSURE | 21 | |
| ITEM 9A. | CONTROLS AND PROCEDURES | 21 | |
| ITEM 9B. |
OTHER INFORMATION
|
23 | |
| PART III | |||
|
ITEM 10.
|
DIRECTORS, EXECUTIVE OFFICERS OF THE REGISTRANT AND CORPORATE GOVERNANCE | 24 | |
|
ITEM 11.
|
EXECUTIVE COMPENSATION | 24 | |
|
ITEM 12.
|
SECURITY OWNERSHIP OF CERTAIN BENEFICIAL OWNERS AND MANAGEMENT AND RELATED STOCKHOLDER MATTERS | 24 | |
|
ITEM 13.
|
CERTAIN RELATIONSHIPS AND RELATED TRANSACTIONS, AND DIRECTOR INDEPENDENCE | 24 | |
|
ITEM 14.
|
PRINCIPAL ACCOUNTANT FEES AND SERVICES | 24 | |
| PART IV | |||
|
ITEM 15.
|
EXHIBITS, FINANCIAL STATEMENT SCHEDULES | 25 | |
|
FINANCIAL STATEMENTS
|
F-1 | ||
| FINANCIAL STATEMENT SCHEDULES | S-1 | ||
CERTAIN FACTORS AFFECTING FORWARD-LOOKING STATEMENTS
Certain statements in this Annual Report, including but not limited to statements made in Part II–Item 7–”Management’s Discussion and Analysis of Financial Condition and Results of Operations,” may be deemed to be forward-looking statements, as defined in the Private Securities Litigation Reform Act of 1995. Forward-looking statements can be identified by the use of words such as “may,” “will,” “should,” “could,” “continue,” “future,” “potential,” “believe,” “project,” “plan,” “intend,” “seek,” “estimate,” “predict,” “expect,” “anticipate” and similar expressions, or the negative of such terms, or other comparable terminology. Forward-looking statements also include the assumptions underlying or relating to any of the foregoing statements. Such forward-looking statements are made based on our management’s beliefs as well as assumptions made by, and information currently available to, our management. Our actual results may differ materially from the results anticipated in these forward-looking statements due to, among other things: economic and market conditions; the risks related to the general economic health of our customers; our customer’s access to capital and credit to fund purchases, including the ability of our customers to secure floor plan financing; the success and timing of existing and additional export and governmental orders; the cyclical nature of our industry; changes in fuel and other transportation costs; our dependence on outside suppliers of raw materials; changes in the cost of aluminum, steel and related raw materials; and those other risks referenced herein, including those risks referred to in this report, in Part I, Item 1A–”Risk Factors” and those risks discussed in our filings with the Securities and Exchange Commission filed after this Annual Report. Such factors are not exclusive. We do not undertake to update any forward-looking statement that may be made from time to time by, or on behalf of, our company.
i
PART I
General
Miller Industries is the world’s largest manufacturer of vehicle towing and recovery equipment, with executive offices in Ooltewah, Tennessee, domestic manufacturing operations in Tennessee and Pennsylvania, and foreign manufacturing operations in France and the United Kingdom.
Since 1990, we have developed or acquired several of the most well-recognized brands in the towing and recovery equipment manufacturing industry. Our strategy has been to diversify our line of products and increase our presence in the industry by combining internal growth and development with acquisitions of complementary products.
In this Annual Report on Form 10-K, the words “Miller Industries,” “the Company,” “we,” “our,” “ours” and “us” refer to Miller Industries, Inc. and its subsidiaries or any of them.
Towing and Recovery Equipment
We offer a broad range of towing and recovery equipment products that meet most customer design, capacity and cost requirements. We manufacture the bodies of wreckers and car carriers, which are installed on truck chassis manufactured by third parties. We frequently purchase the truck chassis for resale to our customers. Wreckers generally are used to recover and tow disabled vehicles and other equipment and range in type from the conventional tow truck to large recovery vehicles with rotating hydraulic booms and up to 75-ton lifting capacities. Car carriers are specialized flat bed vehicles with hydraulic tilt mechanisms that enable a towing operator to drive or winch a vehicle onto the bed for transport. Car carriers transport new or disabled vehicles and other equipment and are particularly effective over longer distances. We also manufacture a line of transport trailers.
Our products primarily are sold through independent distributors that serve all 50 states, Canada and Mexico, and other foreign markets including Europe, the Pacific Rim, the Middle East, South America and Africa, and through prime contractors to governmental entities. Additionally, as a result of our ownership of Jige in France and Boniface in the United Kingdom, we have substantial distribution capabilities in Europe. While most of our distributor agreements do not contain exclusivity provisions, management believes that approximately 65% of our independent distributors sell our products on an exclusive basis. In addition to selling our products to towing operators, our independent distributors provide parts and service. We also utilize sales representatives to exclusively market our products and provide expertise and sales assistance to our independent distributors. Management believes the strength of our distribution network and the breadth of our product offerings are two key advantages over our competitors.
Product Lines
We manufacture a broad line of wrecker, car carrier and trailer bodies to meet a full range of customer design, capacity and cost requirements.
Wreckers. Wreckers are generally used to recover and tow disabled vehicles and other equipment and range in type from the conventional tow truck to large recovery vehicles with up to 75-ton lifting capacities. Wreckers are available with specialized features, including underlifts, L-arms and scoops, which lift disabled vehicles by the tires or front axle to minimize front end damage to the towed vehicles. Certain heavy duty wrecker models offer rotating booms, which allow heavy duty wreckers to recover vehicles from any angle, and remote control devices for operating wreckers. In addition, certain light duty wreckers are equipped with automatic wheellift hookup devices that allow operators to engage a disabled or unattended vehicle without leaving the cab of the wrecker.
Our wreckers range in capacity from 4 to 75 tons, and are classified as either light duty or heavy duty, with wreckers of 16-ton or greater capacity being classified as heavy duty. Light duty wreckers are used to remove vehicles from accident scenes and vehicles illegally parked, abandoned or disabled, and for general recovery. Heavy duty wreckers are used in towing and recovery applications including overturned tractor trailers, buses, motor homes and other large vehicles.
1
Car Carriers. Car carriers are specialized flat-bed vehicles with hydraulic tilt mechanisms that enable a towing operator to drive or winch a vehicle onto the bed for transport. Car carriers are used to transport new or disabled vehicles and other equipment and are particularly effective for transporting vehicles or other equipment over longer distances. In addition to transporting vehicles, car carriers may also be used for other purposes, including transportation of industrial equipment. Most professional towing operators have added car carriers to their fleets to complement their towing capabilities.
Transport Trailers. Our multi-vehicle transport trailers are specialized auto transport trailers with upper and lower decks and hydraulic ramps for loading vehicles. These trailers are used for moving multiple vehicles for auto auctions, car dealerships, leasing companies and other similar applications. These trailers are easy to load and transport 6 to 7 vehicles. The vehicles can be secured to transport quickly with ratchet and chain tie-downs that are mounted throughout the frame of the transport. Many professional towing operators have added auto transport trailers to their fleets to add to their towing capabilities. Also, we design, engineer and manufacture special-use transport and trailer products to be used primarily in military applications.
Brand Names
We manufacture and market our wreckers, car carriers and trailers under ten separate brand names. Although certain brands overlap in terms of features, prices and distributors, each brand has its own distinctive image and customer base.
Century®. The Century brand is our “top-of-the-line” brand and represents what management believes to be the broadest product line in the industry. The Century line was started in 1974 and produces wreckers ranging from 8-ton light duty to 75-ton heavy duty models, and car carriers in lengths from 20 to 30 feet. Management believes that the Century brand has a reputation as the industry’s leading product innovator.
Vulcan®. Our Vulcan product line includes a range of premium light duty and heavy duty wreckers, ranging from 8-ton light duty to 50-ton heavy duty models, and car carriers. The Vulcan line is sold through its own independent distribution network.
Challenger®. Our Challenger products compete with the Century and Vulcan products and constitute a third premium product line. Challenger products consist of heavy duty wreckers with capacities ranging from 25 to 75 tons. The Challenger line was started in 1975 and is known for high performance heavy duty wreckers and aesthetic design.
Holmes®. Our Holmes product line includes mid-priced wreckers with 4 to 16 ton capacities, a 16-ton rotator and a detachable towing unit (DTU). The Holmes wrecker was first produced in 1916. Historically, the Holmes name has been the most well-recognized and leading industry brand both domestically and internationally.
Champion®. The Champion brand, which was introduced in 1991, includes car carriers which range in length from 19 to 21 feet. The Champion product line, which is generally lower-priced, allows us to offer a full line of car carriers at various competitive price points.
Chevron™. Our Chevron product line is comprised primarily of premium car carriers. Chevron produces a range of premium single-car, multi-car and industrial carriers, as well as wreckers ranging from 8-ton to 16-ton models. The Chevron line is operated autonomously with its own independent distribution network.
Eagle®. Our Eagle products consist of light duty wreckers with the “Eagle Claw” hook-up system that allows towing operators to engage a disabled or unattended vehicle without leaving the cab of the tow truck. The “Eagle Claw” hook-up system was originally developed for the repossession market. Since acquiring Eagle, we have upgraded the quality and features of the Eagle product line and expanded its recovery capability.
2
Titan®. Our Titan product line is comprised of premium multi-vehicle transport trailers which can transport up to 7 vehicles depending on configuration.
Jige™. Our Jige product line is comprised of a broad line of premium light duty and heavy duty wreckers and car carriers marketed primarily in Europe. Jige is a market leader best known for its innovative designs of car carriers and light duty wreckers necessary to operate within the narrow confines of European cities, as well as heavy duty wreckers.
Boniface™. Our Boniface product line is comprised primarily of premium heavy duty wreckers marketed primarily in Europe. Boniface produces heavy duty wreckers specializing in the long underlift technology required to tow modern European tour buses.
Product Development and Manufacturing
Our Holmes and Century brand names are associated with four of the major innovations in the industry: the rapid reverse winch; the tow sling; the hydraulic lifting mechanism; and the underlift with parallel linkage and L-arms. Our engineering staff, in consultation with manufacturing personnel, uses computer-aided design and stress analysis systems to test new product designs and to integrate various product improvements. In addition to offering product innovations, we focus on developing or licensing new technology for our products.
We manufacture wreckers, car carriers and trailers at seven manufacturing facilities located in the United States, France and the United Kingdom. The manufacturing process for our products consists primarily of cutting and bending sheet steel or aluminum into parts that are welded together to form the wrecker, car carrier body or trailer. In addition, during the past several years, we have also begun to produce wrecker bodies using composites and other non-metallic materials. After the frame is formed, components such as hydraulic cylinders, winches, valves and pumps, which are purchased by us from third-party suppliers, are attached to the frame to form the completed wrecker or car carrier body. The completed body is either installed by us, or shipped by common carrier to a distributor where it is then installed, on a truck chassis. Generally, the wrecker or car carrier bodies are painted by us with a primer coat only, so that towing operators can select customized colors to coordinate with chassis colors or fleet colors. To the extent final painting is required before delivery, we generally contract with independent paint shops for such services.
We purchase raw materials and component parts from a number of sources. Although we have no long-term supply contracts, management believes we have good relationships with our primary suppliers. In recent years prices have fluctuated significantly, but we have experienced no significant problems in obtaining adequate supplies of raw materials and component parts to meet the requirements of our production schedules. Management believes that the materials used in the production of our products are available at competitive prices from an adequate number of alternative suppliers. Accordingly, management does not believe that the loss of a single supplier would have a material adverse effect on our business.
Sales, Distribution and Marketing
Management categorizes the towing and recovery market into three general product types: light duty wreckers; heavy duty wreckers; and car carriers. The light duty wrecker market consists primarily of professional wrecker operators, repossession towing services, local and national governmental entities and repair shop or salvage company owners. The heavy duty market includes professional wrecker operators serving the needs of commercial vehicle operators as well as governmental entities. The car carrier market, historically dominated by automobile salvage companies, has expanded to include equipment rental companies that offer delivery service and professional towing operators who desire to complement their existing towing capabilities. Management estimates that there are approximately 35,000 professional towing operators and many more service station, repair shop and salvage operators comprising the overall towing and recovery market.
We have developed a diverse network of independent distributors, consisting of approximately 100 distributors in North America, who serve all 50 states, Canada and Mexico, and numerous distributors that serve other foreign markets. In 2010, no single distributor accounted for more than 10% of our sales. Management believes our broad and diverse network of distributors provides us with the flexibility to adapt to market changes, lessens our dependence on particular distributors and reduces the impact of regional economic factors.
3
Our sales force services our network of independent distributors and consists of sales representatives whose responsibilities include providing administrative and sales support to the entire base of independent distributors. Sales representatives receive commissions on direct sales based on product type and brand and generally are assigned specific territories in which to promote sales of our products and to maintain customer relationships.
In addition to providing services to our network of independent distributors, our sales force sells our products to various governmental entities, including the U.S. federal government and foreign governments, through prime contractors. In 2010, 19.6% of our consolidated net sales were made to the U.S. federal government through prime contractors.
To support sales and marketing efforts, we produce demonstrator models that are used by our sales representatives and independent distributors. To increase exposure to our products, we also serve as the official recovery team for many automobile racing events, including NASCAR races at Daytona, Talladega, Richmond, Chicago, Kansas, California, Michigan, Darlington and the Rolex Daytona 24 Hour Race, among others.
We routinely respond to requests for proposals or bid invitations in consultation with our local distributors. Our products have been selected by the United States General Services Administration as an approved source for certain federal and defense agencies. We intend to continue to pursue government contracting opportunities.
The towing and recovery equipment industry places heavy marketing emphasis on product exhibitions at national, regional and international trade shows. In order to focus our marketing efforts and to control marketing costs, we concentrate our efforts on the major trade shows each year, and we work with our network of independent distributors to concentrate on various regional shows.
Product Warranties and Insurance
We generally offer a 12-month limited manufacturer’s product and service warranty on our wrecker and car carrier products. Our warranty generally provides for repair or replacement of failed parts or components. Warranty service is usually performed by us or an authorized distributor. Management believes that we maintain adequate general liability and product liability insurance.
Backlog
We produce virtually all of our products to order. Our backlog is based upon customer purchase orders that we believe are firm. The level of backlog at any particular time, however, is not an appropriate indicator of our future operating performance. Certain purchase orders are subject to cancellation by the customer upon notification. Given our production and delivery schedules management believes that the current backlog represents less than three months of production except for follow-on governmental orders which we expect production to continue through the third quarter of 2011.
Competition
The towing and recovery equipment manufacturing industry is highly competitive for sales to distributors and towing operators. Management believes that competition in this industry focuses on product quality and innovation, reputation, technology, customer service, product availability and price. We compete on the basis of each of these criteria, with an emphasis on product quality and innovation and customer service. Management also believes that a manufacturer’s relationship with distributors is a key component of success in the industry. Accordingly, we have invested substantial resources and management time in building and maintaining strong relationships with distributors. Management also believes that our products are regarded as high quality within their particular price points. Our marketing strategy is to continue to compete primarily on the basis of quality and reputation rather than solely on the basis of price, and to continue to target the growing group of professional towing operators who as end-users recognize the quality of our products.
4
Traditionally, the capital requirements for entry into the towing and recovery manufacturing industry have been relatively low. Management believes a manufacturer’s capital resources and access to technological improvements have become a more integral component of success in recent years. Certain of our competitors may have greater financial and other resources and may provide more attractive dealer and retail customer financing alternatives than we do.
Employees
We employed approximately 700 people as of December 31, 2010. None of our employees are covered by a collective bargaining agreement, though our employees in France and the United Kingdom have certain similar rights provided by their respective government’s employment regulations. We consider our employee relations to be good.
Intellectual Property Rights
Our development of the underlift parallel linkage and L-arms is considered one of the most innovative developments in the wrecker industry. This technology is significant primarily because it allows the damage-free towing of newer aerodynamic vehicles made of lighter weight materials. This technology, particularly the L-arms, is used in a majority of commercial wreckers today. We hold a number of utility and design patents covering other of our products, including the Vulcan “scoop” wheel-retainer and the car carrier anti-tilt device. We have also obtained the rights to use and develop certain technologies owned or patented by others. Management believes that, until the patents on our technology expire, utilization of our patented technology without a license is an infringement of such patents. We have successfully litigated infringement lawsuits in which the validity of our patents on our technology was upheld, and successfully settled other lawsuits. Pursuant to the terms of a consent judgment entered into in 2000 with the Antitrust Division of the U.S. Department of Justice, we are required to offer non-exclusive royalty-bearing licenses to certain of our key patents to all tow truck and car carrier manufacturers.
Our trademarks “Century,” “Holmes,” “Champion,” “Challenger,” “Formula I,” “Pro Star,” “Street Runner,” “Vulcan,” “Right Approach” and “Extreme Angle,” among others, are registered with the United States Patent and Trademark Office. Management believes that our trademarks are well-recognized by dealers, distributors and end-users in their respective markets and are associated with a high level of quality and value.
Government Regulations and Environmental Matters
Our operations are subject to federal, state and local laws and regulations relating to the generation, storage, handling, emission, transportation and discharge of materials into the environment. Management believes that we are in substantial compliance with all applicable federal, state and local provisions relating to the protection of the environment. The costs of complying with environmental protection laws and regulations has not had a material adverse impact on our financial condition or results of operations in the past and is not expected to have a material adverse impact in the future.
We are also subject to the Magnuson-Moss Warranty Federal Trade Commission Improvement Act which regulates the description of warranties on products. The description and substance of our warranties are also subject to a variety of federal and state laws and regulations applicable to the manufacturing of vehicle components. Management believes that continued compliance with various government regulations will not materially affect our operations.
Executive Officers of the Registrant
Information relating to our executive officers as of the end of the period covered by this Annual Report is set forth below. There are no family relationships among the executive officers, directors or nominees for director, nor are there any arrangements or understandings between any of the executive officers and any other persons pursuant to which they were selected as executive officers.
5
|
Name
|
Age
|
Position
|
||
|
William G. Miller
|
64
|
Chairman of the Board and Co-Chief Executive Officer
|
||
|
Jeffrey I. Badgley
|
58
|
President and Co-Chief Executive Officer
|
||
|
Frank Madonia
|
62
|
Executive Vice President, Secretary and General Counsel
|
||
|
J. Vincent Mish
|
60
|
Executive Vice President, Chief Financial Officer and Treasurer
|
William G. Miller has served as Chairman of the Board since April 1994 and our Co-Chief Executive Officer since October 2003. Mr. Miller served as our Chief Executive Officer from April 1994 until June 1997. In June 1997, he was named Co-Chief Executive Officer, a title he shared with Jeffrey I. Badgley until November 1997. Mr. Miller also served as our President from April 1994 to June 1996. He served as Chairman of Miller Group, Inc. from August 1990 through May 1994, as its President from August 1990 to March 1993, and as its Chief Executive Officer from March 1993 until May 1994. Prior to 1987, Mr. Miller served in various management positions for Bendix Corporation, Neptune International Corporation, Wheelabrator-Frye, Inc. and The Signal Companies, Inc.
Jeffrey I. Badgley has served as our Co-Chief Executive Officer with Mr. Miller since October 2003, as our President since June 1996 and as a director since January 1996. Mr. Badgley served as our Chief Executive Officer from November 1997 to October 2003. In June 1997, he was named our Co-Chief Executive Officer, a title he shared with Mr. Miller until November 1997. Mr. Badgley served as our Vice President from 1994 to 1996, and as our Chief Operating Officer from June 1996 to June 1997. In addition, Mr. Badgley has served as President of Miller Industries Towing Equipment Inc. since 1996. Mr. Badgley served as Vice President—Sales of Miller Industries Towing Equipment Inc. from 1988 to 1996. He previously served as Vice President—Sales and Marketing of Challenger Wrecker Corporation from 1982 until joining Miller Industries Towing Equipment Inc.
Frank Madonia has served as our Executive Vice President, Secretary and General Counsel since September 1998. From April 1994 to September 1998 Mr. Madonia served as our Vice President, General Counsel and Secretary. Mr. Madonia served as Secretary and General Counsel to Miller Industries Towing Equipment Inc. since its acquisition by Miller Group in 1990. From July 1987 through April 1994, Mr. Madonia served as Vice President, General Counsel and Secretary of Flow Measurement. Prior to 1987, Mr. Madonia served in various legal and management positions for United States Steel Corporation, Neptune International Corporation, Wheelabrator-Frye, Inc. and The Signal Companies, Inc.
J. Vincent Mish is a certified public accountant and has served as our Chief Financial Officer and Treasurer since June 1999, a position he also held from April 1994 through September 1996. In December 2002, Mr. Mish was appointed as our Executive Vice President. He also has served as President of the Financial Services Group since September 1996 and as a Vice President of Miller Industries since April 1994. Mr. Mish served as Vice President and Treasurer of Miller Industries Towing Equipment Inc. since its acquisition by Miller Group in 1990. From February 1987 through April 1994, Mr. Mish served as Vice President and Treasurer of Flow Measurement. Mr. Mish worked with Touche Ross & Company (now Deloitte and Touche) for over ten years before serving as Treasurer and Chief Financial Officer of DNE Corporation from 1982 to 1987. Mr. Mish is a member of the American Institute of Certified Public Accountants and the Tennessee and Michigan Certified Public Accountant societies.
Available Information
Our Internet website address is www.millerind.com. We make available free of charge through our website our Annual Reports on Form 10-K, Quarterly Reports on Form 10-Q and Current Reports on Form 8-K, and amendments to those reports, as soon as reasonably practicable after we file them with, or furnish them to, the Securities and Exchange Commission. Our Corporate Governance Guidelines and Code of Business Conduct and Ethics are also available on our website. Other corporate governance-related documents can be found at our website as well.
6
|
ITEM 1A.
|
RISK FACTORS
|
There are many factors that affect our business and the results of our operations, some of which are beyond our control. The following is a description of all known material risks that may cause the actual results of our operations in future periods to differ materially from those currently expected or desired. We encourage you to read this section carefully.
Our business is subject to the cyclical nature of our industry and changes in consumer confidence and in economic conditions in general. Adverse changes or continued uncertainty with respect to these factors may lead to a downturn in our business.
The towing and recovery industry is cyclical in nature and historically the industry has been affected by changes in consumer confidence and in economic conditions in general. Concerns over the slow economic recovery and continued volatility and disruption in domestic and international capital and credit markets have caused significant erosion in consumer confidence. As a result, the overall demand for our products from our commercial customers has been negatively affected, and the level of future sales of our products is uncertain. A prolonged economic downturn, and slow or negative growth in the domestic and global economy, may continue to have a material adverse effect on our business, financial condition and results of operations for the foreseeable future.
Our demand from our customers and towing operators is affected by the availability of capital and access to credit.
The ability of our customers and of towing operators to purchase our products is affected by the availability of capital and credit to them. Our customers rely on floor plan financing in connection with the purchase of our products, and the availability of that financing on acceptable terms has a direct effect on the volume of their purchases. Additionally, in many cases, a towing operator’s decision to purchase our products from one of our distributors is dependent upon their ability to obtain financing upon acceptable terms. Volatility and disruption in the capital and credit markets, principally in the U.S. and Europe, has decreased the availability of capital to, and credit capacity of, our customers and of towing operators. In addition, at least one provider of floor plan financing has exited the market, making floor plan financing increasingly difficult for our customers to secure. This reduced availability of capital and credit has negatively affected the ability and capacity of our customers and of towing operators to purchase towing and related equipment. This, in turn, has negatively impacted sales of our products. If customers are unable to access capital or credit, it could materially and adversely affect our ability to sell our products, and as a result, could negatively affect our business and operating results.
The loss of, or a significant reduction in sales to, our largest customer could adversely affect our results of operations.
For 2010 and 2009, 19.6% and 19.4%, respectively, of our consolidated net sales were made to the U.S. federal government through prime contractors. Prior to 2009, no one customer accounted for more than 10% of our consolidated net sales in any fiscal year. The loss of our U.S. government work, in whole or in part, or the failure to secure follow-on orders from the U.S. government could adversely affect our results of operations. Our U.S. government business is subject to the following risks, among others: (i) this business is susceptible to changes in U.S. government spending, which may reduce future revenues; (ii) most of our contracts with governmental entities through prime contractors are fixed-price contracts, and our actual costs on any of these contracts could exceed our projected costs, (iii) competition for the award of these contracts is intense, and we may not be successful in bidding on future contracts, and (iv) the products we sell to governmental entities are subject to highly technical requirements, and any failure to comply with these requirements could result in unanticipated retrofit costs, delayed acceptance of products, late or reduced payment or cancellation of the contract.
7
Our dependence upon outside suppliers for our raw materials, including aluminum, steel, petroleum-related products and other purchased component parts, leaves us subject to changes in price and delays in receiving supplies of such materials or parts.
We are dependent upon outside suppliers for our raw material needs and other purchased component parts, and although we believe that these suppliers will continue to meet our requirements and specifications, and that alternative sources of supply are available, events beyond our control could have an adverse effect on the cost or availability of raw materials and component parts. Shipment delays, unexpected price increases or changes in payment terms from our suppliers of raw materials or component parts could impact our ability to secure necessary raw materials or component parts, or to secure such materials and parts at favorable prices. To partially offset price increases for raw materials and component parts, we have, from time to time, implemented general price increases and cost surcharges. While we have attempted to pass these increased costs on to our customers, there can be no assurance that we will be able to continue to do so. Additionally, demand for our products could be negatively affected by the unavailability of truck chassis, which are manufactured by third parties and are frequently supplied by us, or are purchased separately by our distributors or by towing operators. Although we believe that sources of our raw materials and component parts will continue to be adequate to meet our requirements and that alternative sources are available, shortages, price increases or delays in shipments of our raw materials and component parts could have a material adverse effect on our financial performance, competitive position and reputation.
Overall demand from our customers may be affected by increases in their fuel and insurance costs and changes in weather conditions.
In recent years, our customers have experienced substantial increases in fuel and other transportation costs, and in the cost of insurance, and while many of these costs have remained stable since 2009, there can be no assurance that these costs will not continue to be volatile, or again increase, for our customers in the future. Additionally, our customers also have, from time to time, been subject to unpredictable and varying weather conditions which could, among other things, impact the cost and availability of fuel and other materials. Any of these factors could negatively affect the ability of our customers to purchase, and their capacity for purchasing, towing and related equipment, and, consequently, have a material negative effect upon our business and operating results.
Our international operations are subject to various political, economic and other uncertainties that could adversely affect our business results, including by restrictive taxation or other government regulation and by foreign currency fluctuation.
A significant portion of our net sales and production in 2010 were outside the United States, primarily in Europe. As a result, our operations are subject to various political, economic and other uncertainties, including risks of restrictive taxation policies, changing political conditions and governmental regulations. Also, a substantial portion of our net sales derived outside the United States, as well as salaries of employees located outside the United States and certain other expenses, are denominated in foreign currencies, including the British pound and the Euro. We are, therefore, subject to risk of financial loss resulting from fluctuations in exchange rates of these currencies against the U.S. dollar.
Our competitors could impede our ability to attract or retain customers.
The towing and recovery equipment manufacturing industry is highly competitive. Competition for sales exists domestically and internationally at the manufacturer, distributor and towing-operator levels and is based primarily on product quality and innovation, reputation, technology, customer service, product availability and price. Competition for sales also comes from the market for used towing and recovery equipment. Certain of our competitors may have substantially greater financial and other resources and may provide more attractive dealer and retail customer financing alternatives than us. If these competitors are able to make it more difficult for us to attract or retain customers, it could have a negative impact on our sales, revenue and financial performance.
8
Our future success depends upon our ability to develop or acquire proprietary products and technology.
Historically, we have been able to develop or acquire patented and other proprietary product innovations which have allowed us to produce what management believes to be technologically advanced products relative to most of our competition. However, certain of our patents have expired, and others will expire in the next few years, and as a result, we may not have a continuing competitive advantage through proprietary products and technology. In addition, pursuant to the terms of a consent judgment entered into in 2000 with the Antitrust Division of the U.S. Department of Justice, we are required to offer non-exclusive royalty-bearing licenses to certain of our key patents to all wrecker and car carrier manufacturers. If we are unable to develop or acquire new products and technology in the future, our ability to maintain market share, and, consequently, our revenues and operating results, may be negatively affected.
The requirements and restrictions imposed by our current credit facility restrict our ability to operate our business, and failure to comply with these requirements and restrictions could adversely affect our business.
The terms of our current credit facility restrict our ability and our subsidiaries’ ability to, among other things, incur additional indebtedness, guarantee the indebtedness of another person, pay dividends or make loans or investments in certain situations, incur liens, sell, discount or dispose of accounts receivable or promissory notes, enter into any new line of business, permit certain loans to officers or employees, sell, transfer, convey or grant any security interest in any material trademark, merge or consolidate with any other person, or sell, transfer or dispose of all or substantially all of our assets. Our current credit facility also requires us to meet certain financial tests, and to comply with certain other reporting, affirmative and negative covenants.
If we fail to comply with the requirements of our current credit facility, such non-compliance would result in an event of default. If not waived by the bank, such event of default would result in the acceleration of any amounts due under the current credit facility, and may permit the bank to foreclose on our assets.
Our ability to service our credit arrangements may be affected by fluctuations in interest rates.
Interest on our obligations outstanding under our current credit facility and other credit arrangements is connected to the LIBOR rate or prime rate. Therefore, an increase in the LIBOR rate or the prime rate would increase interest expense and could have an effect on our ability to satisfy our obligations under those arrangements outstanding at any particular time. Our liquidity and access to capital resources could be affected by increasing interest rates.
We depend upon skilled labor to manufacture our products, and if we experience problems hiring and retaining skilled labor, our business may be negatively affected.
The timely manufacture and delivery of our products requires an adequate supply of skilled labor, and the operating costs of our manufacturing facilities can be adversely affected by high turnover in skilled positions. Accordingly, our ability to increase sales, productivity and net earnings will be limited to a degree by our ability to employ the skilled laborers necessary to meet our requirements. There can be no assurance that we will be able to maintain an adequate skilled labor force necessary to efficiently operate our facilities. In addition, while our employees are not currently members of a union, there can be no assurance that the employees at any of our facilities will not choose to become unionized in the future.
Any loss of the services of our key executives could have a material adverse impact on our operations.
Our success is highly dependent on the continued services of our management team. The loss of services of one or more key members of our senior management team could have a material adverse effect on us.
9
A product liability claim in excess of our insurance coverage, or an inability to acquire or maintain insurance at commercially reasonable rates, could have a material adverse effect upon our business.
We are subject to various claims, including product liability claims arising in the ordinary course of business, and may at times be a party to various legal proceedings incidental to our business. We maintain reserves and liability insurance coverage at levels based upon commercial norms and our historical claims experience. A successful product liability or other claim brought against us in excess of our insurance coverage, or the inability of us to acquire or maintain insurance at commercially reasonable rates, could have a material adverse effect upon our business, operating results and financial condition.
Our stock price may fluctuate greatly as a result of the general volatility of the stock market.
From time to time, there may be significant volatility in the market price for our common stock. Our quarterly operating results, changes in earnings estimated by analysts, if any, changes in general conditions in our industry or the economy or the financial markets or other developments affecting us could cause the market price of our common stock to fluctuate substantially.
Our charter and bylaws contain anti-takeover provisions that may make it more difficult or expensive to acquire us in the future or may negatively affect our stock price.
Our charter and bylaws contain restrictions that may discourage other persons from attempting to acquire control of us, including, without limitation, prohibitions on shareholder action by written consent and advance notice requirements regarding amendments to certain provisions of our charter and bylaws. In addition, our charter authorizes the issuance of up to 5,000,000 shares of preferred stock. The rights and preferences for any series of preferred stock may be set by the board of directors, in its sole discretion and without shareholder approval, and the rights and preferences of any such preferred stock may be superior to those of common stock and thus may adversely affect the rights of holders of common stock.
None.
|
ITEM 2.
|
PROPERTIES
|
We operate four manufacturing facilities in the United States. The facilities are located in Ooltewah, Tennessee; Hermitage, Pennsylvania; Mercer, Pennsylvania; and Greeneville, Tennessee. The Ooltewah plant, containing approximately 302,000 square feet, produces light and heavy duty wreckers and trailers; the Hermitage plant, containing approximately 118,000 square feet, produces car carriers; the Mercer plant, containing approximately 110,000 square feet, produces car carriers and light duty wreckers; and the Greeneville plant, containing approximately 112,000 square feet, produces car carriers, heavy duty wreckers and trailers.
We also have manufacturing operations at two facilities located in the Lorraine region of France, which have, in the aggregate, approximately 180,000 square feet, and manufacturing operations in Norfolk, England, with approximately 48,000 square feet.
We are, from time to time, a party to litigation arising in the normal course of our business. Litigation is subject to various inherent uncertainties, and it is possible that some of these matters could be resolved unfavorably to us, which could result in substantial damages against us. We have established accruals for matters that are probable and reasonably estimable and maintain product liability and other insurance that management believes to be adequate. Management believes that any liability that may ultimately result from the resolution of these matters in excess of available insurance coverage and accruals will not have a material adverse effect on our consolidated financial position or results of operations.
10
PART II
|
MARKET FOR REGISTRANT’S COMMON EQUITY, RELATED STOCKHOLDER MATTERS AND ISSUER PURCHASES OF EQUITY SECURITIES
|
Market Price of and Dividends on the Registrant’s Common Equity and Related Stockholder Matters
Our common stock is traded on the New York Stock Exchange under the symbol “MLR.” The following table sets forth the quarterly range of high and low sales prices for the common stock for the periods indicated.
|
Price Range of Common Stock
|
||||||||
|
Period
|
High
|
Low
|
||||||
|
Year Ended December 31, 2009
|
||||||||
|
First Quarter
|
$ | 6.71 | $ | 4.95 | ||||
|
Second Quarter
|
9.21 | 6.39 | ||||||
|
Third Quarter
|
11.70 | 7.81 | ||||||
|
Fourth Quarter
|
11.60 | 9.46 | ||||||
|
Year Ended December 31, 2010
|
||||||||
|
First Quarter
|
$ | 13.45 | $ | 10.85 | ||||
|
Second Quarter
|
15.49 | 11.79 | ||||||
|
Third Quarter
|
14.85 | 11.41 | ||||||
|
Fourth Quarter
|
16.03 | 13.02 | ||||||
|
Year Ending December 31, 2011
|
||||||||
|
First Quarter (through March 4, 2011)
|
$ | 17.20 | $ | 14.30 | ||||
The approximate number of holders of record and beneficial owners of common stock as of December 31, 2010 was 557 and 3,000, respectively.
Prior to March 2010, we had never declared cash dividends on our common stock. On March 8, 2010, our board of directors adopted a dividend policy to consider and pay annual cash dividends subject to our ability to satisfy all applicable statutory and regulatory requirements and our continued financial strength, and declared the first such annual cash dividend of $0.10 per share. Our board of directors, on March 7, 2011, declared the second such annual cash dividend of $0.12 payable to shareholders of record as of March 17, 2011. Any future determination as to the payment of cash dividends will depend upon such factors as earnings, capital requirements, our financial condition, restrictions in financing agreements and other factors deemed relevant by our board of directors. Covenants under our current credit facility restrict the payment of cash dividends if the Company would be in violation of the minimum tangible net worth test or the leverage ratio test in the current loan agreement as a result of the dividend, among various other restrictions.
Purchases of Equity Securities by the Issuer and Affiliated Purchasers
There were no share repurchases during the fourth quarter of 2010.
Sales of Unregistered Securities
We did not sell any unregistered securities during the year ended December 31, 2010.
11
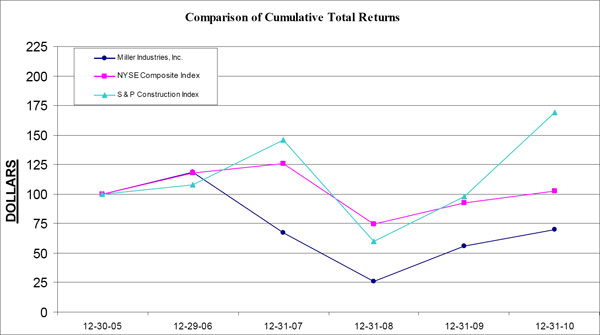
Performance Graph
The following line graph compares the percentage change in the cumulative shareholder return of our common stock with The New York Stock Exchange Composite Index and the Standard & Poor’s Construction Index over the period of time from December 31, 2005 through December 31, 2010. The respective returns assume reinvestment of dividends paid.
|
12/30/05
|
12/29/06
|
12/31/07
|
12/31/08
|
12/31/09
|
12/31/10
|
|||||||||||||||||||
|
Miller Industries, Inc.
|
100 | 118 | 67 | 26 | 56 | 70 | ||||||||||||||||||
|
NYSE Composite Index
|
100 | 118 | 126 | 74 | 93 | 103 | ||||||||||||||||||
|
S&P Construction Index
|
100 | 108 | 146 | 60 | 98 | 169 | ||||||||||||||||||
12
The following table presents selected statements of income data and selected balance sheet data on a consolidated basis. We derived the selected historical consolidated financial data from our audited consolidated financial statements and related notes. You should read this data together with Item 7–”Management’s Discussion and Analysis of Financial Condition and Results of Operation” and our consolidated financial statements and related notes that are a part of this Annual Report on Form 10-K.
|
Years Ended December 31,
|
||||||||||||||||||||
|
2010
|
2009
|
2008
|
2007
|
2006
|
||||||||||||||||
|
(In thousands except per share data)
|
||||||||||||||||||||
|
Statements of Income Data:
|
||||||||||||||||||||
|
Net Sales
|
$ | 306,897 | $ | 237,567 | $ | 270,989 | $ | 400,032 | $ | 409,421 | ||||||||||
|
Costs and Expenses:
|
||||||||||||||||||||
|
Costs of operations
|
260,566 | 202,272 | 237,362 | 343,885 | 349,639 | |||||||||||||||
|
Selling, general, and administrative expenses
|
26,665 | 24,905 | 25,940 | 27,396 | 27,213 | |||||||||||||||
|
Interest expense
|
305 | 883 | 1,241 | 3,392 | 3,518 | |||||||||||||||
|
Other Expense (Income)
|
71 | (442 | ) | 678 | (291 | ) | (376 | ) | ||||||||||||
|
Total costs and expenses
|
287,607 | 227,618 | 265,221 | 374,382 | 379,994 | |||||||||||||||
|
Income from continuing operations before income taxes
|
19,290 | 9,949 | 5,768 | 25,650 | 29,427 | |||||||||||||||
|
Income tax provision
|
7,583 | 3,933 | 2,182 | 9,319 | 2,454 | |||||||||||||||
|
Income from continuing operations
|
11,707 | 6,016 | 3,586 | 16,331 | 26,973 | |||||||||||||||
|
Discontinued operations:
|
||||||||||||||||||||
|
Gain from discontinued operations, net of taxes
|
— | — | — | — | 126 | |||||||||||||||
|
Tax benefit of advances to and investment in certain discontinued operations
|
— | — | — | — | (18,244 | ) | ||||||||||||||
|
Gain from discontinued operations
|
— | — | — | — | 18,370 | |||||||||||||||
|
Net income
|
$ | 11,707 | $ | 6,016 | $ | 3,586 | $ | 16,331 | $ | 45,343 | ||||||||||
|
Basic net income per common share:
|
||||||||||||||||||||
|
Income from continuing operations
|
$ | 1.00 | $ | 0.52 | $ | 0.31 | $ | 1.41 | $ | 2.37 | ||||||||||
|
Gain from discontinued operations
|
— | — | — | — | 1.62 | |||||||||||||||
|
Basic income
|
$ | 1.00 | $ | 0.52 | $ | 0.31 | $ | 1.41 | $ | 3.99 | ||||||||||
|
Diluted net income per common share:
|
||||||||||||||||||||
|
Income from continuing operations
|
$ | 0.96 | $ | 0.51 | $ | 0.31 | $ | 1.40 | $ | 2.33 | ||||||||||
|
Gain from discontinued operations
|
— | — | — | — | 1.58 | |||||||||||||||
|
Diluted income
|
$ | 0.96 | $ | 0.51 | $ | 0.31 | $ | 1.40 | $ | 3.91 | ||||||||||
|
Weighted average shares outstanding:
|
||||||||||||||||||||
|
Basic
|
11,671 | 11,611 | 11,594 | 11,556 | 11,360 | |||||||||||||||
|
Diluted
|
12,163 | 11,902 | 11,656 | 11,655 | 11,596 | |||||||||||||||
|
December 31,
|
||||||||||||||||||||
|
2010
|
2009
|
2008
|
2007
|
2006
|
||||||||||||||||
|
Balance Sheet Data:
|
||||||||||||||||||||
|
Working capital
|
$ | 106,831 | $ | 94,247 | $ | 79,364 | $ | 82,092 | $ | 76,266 | ||||||||||
|
Total assets
|
199,876 | 172,320 | 174,281 | 189,042 | 197,432 | |||||||||||||||
|
Long-term obligations, less current portion
|
5 | 185 | 2,417 | 4,203 | 10,537 | |||||||||||||||
|
Common shareholders’ equity
|
150,568 | 141,439 | 131,972 | 132,488 | 113,383 | |||||||||||||||
|
December 31,
|
||||||||||||||||||||
|
2010
|
2009
|
2008
|
2007
|
2006
|
||||||||||||||||
|
Other Data:
|
||||||||||||||||||||
|
Cash dividend per share
|
$ | 0.10 | $ | — | $ | — | $ | — | $ | — | ||||||||||
13
ITEM 7. MANAGEMENT’S DISCUSSION AND ANALYSIS OF FINANCIAL CONDITION AND RESULTS OF OPERATIONS
The following discussion of our results of operations and financial condition should be read in conjunction with the Consolidated Financial Statements and Notes thereto.
Executive Overview
Miller Industries, Inc. is the world’s largest manufacturer of vehicle towing and recovery equipment, with domestic manufacturing subsidiaries in Tennessee and Pennsylvania, and foreign manufacturing subsidiaries in France and the United Kingdom. We offer a broad range of equipment to meet our customers’ design, capacity and cost requirements under our Century®, Vulcan®, Challenger®, Holmes®, Champion®, Chevron™, Eagle®, Titan®, Jige™ and Boniface™ brand names.
Our management focuses on a variety of key indicators to monitor our overall operating and financial performance. These indicators include measurements of revenue, operating income, gross margin, income from continuing operations, earnings per share, capital expenditures and cash flow.
We derive revenues primarily from product sales made through our network of domestic and foreign independent distributors. Our revenues are sensitive to a variety of factors including general economic conditions as well as demand for, and price of, our products, our technological competitiveness, our reputation for providing quality products and reliable service, competition within our industry and the cost of raw materials (including aluminum, steel and petroleum-related products).
Our industry is cyclical in nature and in recent years the overall demand for our products and our resulting revenues continued to be negatively affected by:
|
|
●
|
wavering levels of consumer confidence;
|
|
|
●
|
volatility and disruption in domestic and international capital and credit markets and the resulting decrease in the availability of financing, including floor plan financing, for our customers and towing operators;
|
|
|
●
|
significant periodic increases in fuel and insurance costs and their negative effect on the ability of our customers to purchase towing and related equipment;
|
|
|
●
|
the overall effects of the global economic downturn;
|
|
|
●
|
and, currently, the slow economic recovery.
|
We remain concerned about the continuing effects of these factors on the towing and recovery industry, and with the cooperation of our employees have continued certain steps implemented in 2009 to lower costs in response to these uncertainties. These steps included headcount reductions for certain non-production personnel and reductions in certain administrative expenses. Due to increased demand for our domestic products and higher production of follow-on government orders through prime contractors during 2010, production hours at all facilities have been restored and reduced work weeks and furloughs have been eliminated. We will continue to monitor our cost structure to ensure that it remains in line with business conditions.
In addition, we have been and will continue to be affected by changes in the prices that we pay for raw materials, particularly aluminum, steel, petroleum-related products and other raw materials, which represent a substantial part of our total cost of operations. In the past, as we have determined necessary, we have implemented price increases to offset these higher costs. We also developed alternatives to some of the components used in our production process that incorporate these raw materials, and our suppliers have implemented these alternatives in the production of our component parts. We continue to monitor raw material prices and availability in order to more favorably position the Company in this dynamic market.
14
During the second half of 2008, we began to secure follow-on governmental orders through prime contractors for which we now expect production to continue through the third quarter of 2011. Through these follow-on governmental orders, along with continued performance in the governmental and international marketplace, we were able to somewhat offset significantly lower demand from our commercial customers which began in the second half of 2008. Although demand has not recovered to pre-2008 levels, we have seen strengthening demand for our domestic products from our commercial customers during 2010. We continue to work to fulfill these follow-on government orders and orders from commercial customers, and to secure additional export and governmental orders, but we cannot predict the success or timing of any such orders. For 2010, 19.6% of our consolidated net sales were made to the U.S. federal government through prime contractors.
There were no borrowings under our current credit facility at December 31, 2010.
Critical Accounting Policies
Our consolidated financial statements are prepared in accordance with accounting principles generally accepted in the United States of America, which require us to make estimates. Certain accounting policies are deemed “critical,” as they require management’s highest degree of judgment, estimates and assumptions. A discussion of critical accounting policies, the judgments and uncertainties affecting their application and the likelihood that materially different amounts would be reported under different conditions or using different assumptions follows:
Accounts Receivable
We extend credit to customers in the normal course of business. Collections from customers are continuously monitored and an allowance for doubtful accounts is maintained based on historical experience and any specific customer collection issues. While such bad debt expenses have historically been within expectations and the allowance established, there can be no assurance that we will continue to experience the same credit loss rates as in the past.
Inventory
Inventory costs include materials, labor and factory overhead. Inventories are stated at the lower of cost or market (net realizable value), determined on a first-in, first-out basis. Appropriate consideration is given to obsolescence, valuation and other factors in determining net realizable value. Revisions of these estimates could result in the need for adjustments.
Long-Lived Assets
Long-lived assets are reviewed for impairment whenever events or circumstances indicate that the carrying amount of these assets may not be fully recoverable. When a determination has been made that the carrying amount of long-lived asset may not be fully recovered, the amount of impairment is measured by comparing an asset’s estimated fair value to its carrying value. The determination of fair value is based on projected future cash flows discounted at a rate determined by management, or if available independent appraisals or sales price negotiations. The estimation of fair value includes significant judgment regarding assumptions of revenue, operating costs, interest rates, property and equipment additions, and industry competition and general economic and business conditions among other factors. We believe that these estimates are reasonable, however, changes in any of these factors could affect these evaluations. Based on these estimates, we believe that our long-lived assets are appropriately valued.
Goodwill
Goodwill is tested for impairment annually or if an event or circumstance occurs that would more likely than not reduce the fair value of the reporting unit below the carrying amount. We assess the fair value of goodwill using impairment testing generally based on two-step test. The first step identifies potential impairment by comparing the fair value of the reporting unit with its carrying value. If the fair value exceeds the carrying value the second step is not necessary. If the carrying value is more than the fair value, the second step of testing is performed to compare the fair value of the goodwill with its carrying value. An impairment loss would be recognized to the extent that the carrying value of the goodwill exceeds it fair value. We cannot predict the occurrence of certain events or changes in circumstances that might adversely affect the carrying value of goodwill. Such events might include, but are not limited to, the impact of the economic environment or a material change in a relationship with significant customers.
15
Warranty Reserves
We estimate expense for product warranty claims at the time products are sold. These estimates are established using historical information about the nature, frequency, and average cost of warranty claims. We review trends of warranty claims and take actions to improve product quality and minimize warranty claims. We believe the warranty reserve is adequate; however, actual claims incurred could differ from the original estimates, requiring adjustments to the accrual.
Income Taxes
We recognize deferred tax assets and liabilities based on differences between the financial statement carrying amounts and the tax bases of assets and liabilities. Differences between the effective tax rate and the expected tax rate are due to changes in deferred tax assets. We consider the need to record a valuation allowance to reduce deferred tax assets to the amount that is more likely than not to be realized. We consider tax loss carryforwards, reversal of deferred tax liabilities, tax planning and estimates of future taxable income in assessing the need for a valuation allowance. If unrecognized tax positions exist, we record interest and penalties related to the unrecognized tax positions as income tax expense in our consolidated statements of income.
Revenues
Under our accounting policies, revenues are recorded when the risk of ownership for products has transferred to independent distributors or other customers, which generally occurs on shipment. From time to time, revenue is recognized under a bill and hold arrangement. Recognition of revenue on bill and hold arrangements occurs when risk of ownership has passed to the customer, a fixed written commitment has been provided by the customer, the goods are complete and ready for shipment, the goods are segregated from inventory, no performance obligation remains, and a schedule for delivery has been established. While we manufacture only the bodies of wreckers, which are installed on truck chassis manufactured by third parties, we frequently purchase the truck chassis for resale to our customers. Sales of company-purchased truck chassis are included in net sales. Margins are substantially lower on completed recovery vehicles containing company-purchased chassis because the markup over the cost of the chassis is nominal.
Foreign Currency Translation
The functional currency for our foreign operations is the applicable local currency. The translation from the applicable foreign currencies to U.S. dollars is performed for balance sheet accounts using current exchange rates in effect at the balance sheet date, historical rates for equity and the weighted average exchange rate during the period for revenue and expense accounts. Foreign currency translation adjustments are included in shareholders’ equity. Intercompany transactions denominated in a currency other than the functional currency are remeasured into the functional currency. Gains and losses resulting from foreign currency transactions are included in other income and expense in our consolidated statements of income.
16
Results of Operations
The following table sets forth, for the years indicated, the components of the consolidated statements of income expressed as a percentage of net sales.
|
2010
|
2009
|
2008
|
||||||||||
|
Net Sales
|
100.0 | % | 100.0 | % | 100.0 | % | ||||||
|
Costs and expenses:
|
||||||||||||
|
Costs of operations
|
84.8 | % | 85.1 | % | 87.6 | % | ||||||
|
Selling, general and administrative
|
8.6 | % | 10.5 | % | 9.6 | % | ||||||
|
Interest expense
|
0.1 | % | 0.4 | % | 0.5 | % | ||||||
|
Other Expense (Income)
|
0.2 | % | (0.2 | )% | 0.2 | % | ||||||
|
Total costs and expenses
|
93.7 | % | 95.8 | % | 97.9 | % | ||||||
|
Income before income taxes
|
6.3 | % | 4.2 | % | 2.1 | % | ||||||
Year Ended December 31, 2010 Compared to Year Ended December 31, 2009
Net sales were $306.9 million for the year ended December 31, 2010, compared to $237.6 million for the year ended December 31, 2009, an increase of 29.2%. This increase is attributable to increased demand for our domestic products particularly for completed recovery vehicles containing company-purchased chassis, as well as higher production of follow-on government orders through prime contractors. These increases were partially offset by lower foreign sales.
Costs of operations increased 28.8% to $260.6 million for the year ended December 31, 2010 from $202.3 million for the year ended December 31, 2009. The increase in costs of operations was attributable to higher production levels resulting from the increase in domestic and governmental sales. Overall, costs of operations as a percentage of net sales decreased slightly from 85.1% for the year ended December 31, 2009 to 84.8% for the year ended December 31, 2010.
Selling, general and administrative expenses for the year ended December 31, 2010 increased to $26.7 million from $24.9 million for the year ended December 31, 2009. The increase was attributable to higher costs resulting from production due to higher sales levels during the period. As a percentage of sales, selling, general and administrative expenses decreased to 8.6% for 2010 from 10.5% for 2009 due to the fixed nature of certain of these expenses.
Interest expense decreased to $0.3 million for the year ended December 31, 2010 from $0.9 million for the year ended December 31, 2009. Decreases in interest expense were primarily due to lower interest on distributor floor plan financing and decreases in interest on chassis purchases.
Other income and expense relates to foreign currency transaction gains and losses. During 2010, the net loss was $71,000 compared to a net gain of $0.4 million for 2009.
The provision for income taxes for the years ended December 31, 2010 and 2009 reflects a combined federal, state and foreign tax rate of 39.3% and 39.4%, respectively.
Year Ended December 31, 2009 Compared to Year Ended December 31, 2008
Net sales were $237.6 million for the year ended December 31, 2009, compared to $271.0 million for the year ended December 31, 2008, a decrease of 12.3%. This decrease is attributable to decreased demand due to the factors discussed under Executive Overview above.
Costs of operations decreased 14.8% to $202.3 million for the year ended December 31, 2009 from $237.4 million for the year ended December 31, 2008, which was attributable to lower overall production levels, including labor hours worked, in connection with the economic downturn described above. Overall, costs of operations decreased from 87.6% for the year ended December 31, 2008 to 85.1% for the year ended December 31, 2009 primarily due to product mix as well as lower costs for raw material, including aluminum, steel and other petroleum-related products.
17
Selling, general and administrative expenses for the year ended December 31, 2009 decreased to $24.9 million from $25.9 million for the year ended December 31, 2008. The decrease is attributable to cost reduction efforts as well as the impact of lower sales volume. As a percentage of sales, selling, general and administrative expenses increased to 10.5% for 2009 from 9.6% for 2008 due to the fixed nature of many of these expenses being spread over a lower sales base.
Interest expense decreased to $0.9 million for the year ended December 31, 2009 from $1.2 million for the year ended December 31, 2008. Decreases in interest expense were primarily due to lower debt levels, decreases in interest on chassis purchases together with interest on distributor floor plan financing.
Other income and expense relates to foreign currency transaction gains and losses. During 2009, the net gain was $0.4 million compared to a net loss of $0.7 million for 2008. The change relates to the weakening of the US dollar against most major currencies.
The provision for income taxes for the years ended December 31, 2009 and 2008 reflects a combined federal, state and foreign tax rate of 39.4% and 37.8%, respectively.
Liquidity And Capital Resources
Cash provided by operating activities was $17.5 million for the year ended December 31, 2010, compared to $19.7 million for the year ended December 31, 2009, and $4.6 million for the year ended December 31, 2008. The cash provided by operating activities for 2010 reflects increases in accounts payable due to timing of purchases for governmental orders offset by increases in accounts receivable and inventory due to improved sales volume.
Cash used in investing activities was $4.9 million for the year ended December 31, 2010, compared to $0.5 million for the year ended December 31, 2009, and $4.7 million for the year ended December 31, 2008. The cash used in investing activities for 2010 was primarily for the purchase of property, plant and equipment.
Cash used in financing activities was $0.9 million for the year ended December 31, 2010, compared to $3.9 million for the year ended December 31, 2009, and $1.7 million for the year ended December 31, 2008. The cash used in financing activities in 2010 was used to pay dividends as well as repay equipment and other notes payable.
Over the past year, we generally have used available cash flow from operations to pay dividends, to pay down long-term debt obligations, and to pay for capital expenditures.
As of December 31, 2010, we had cash and cash equivalents of $46.3 million, exclusive of unused availability under our current credit facility. Our primary cash requirements include working capital, capital expenditures, the funding of any declared cash dividends and interest and principal payments on indebtedness, if any, under our current credit facility. We expect our primary sources of cash to be cash flow from operations and cash and cash equivalents on hand at December 31, 2010, with borrowings under our current credit facility being available if needed. We expect these sources to be sufficient to satisfy our cash needs during 2011 and for the next several years. However, our ability to satisfy our cash needs will substantially depend upon a number of factors including our future operating performance, taking into account the economic and other factors discussed above and elsewhere in this Annual Report, as well as financial, business and other factors, many of which are beyond our control.
18
Contractual Obligations
The following is a summary of our contractual obligations as of December 31, 2010.
|
Payment Due By Period (in thousands)
|
||||||||||||||||||||
|
Contractual Obligations(1)
|
Total
|
Less than
1 year
|
1-3 years
|
3-5 years
|
More than
5 years
|
|||||||||||||||
|
Equipment Notes Payable
|
$ | 49 | $ | 44 | $ | 5 | $ | — | $ | — | ||||||||||
|
Operating Lease Obligations
|
1,333 | 569 | 584 | 174 | 6 | |||||||||||||||
|
Purchase Obligations (2)
|
32,352 | 32,352 | — | — | — | |||||||||||||||
|
Commitments for construction and acquisition of plant and equipment
|
845 | 845 | — | — | — | |||||||||||||||
|
Total
|
$ | 34,579 | $ | 33,810 | $ | 589 | $ | 174 | $ | 6 | ||||||||||
|
(1)
|
Amounts do not include potential contingent obligations of $13.2 million under repurchase commitments with third-party lenders in the event of customer default.
|
|
(2)
|
Purchase obligations represent open purchase orders for raw materials and other components issued in the normal course of business.
|
Credit Facilities and Other Obligations
Current Credit Facility
On April 6, 2010 we entered into a Loan Agreement with First Tennessee Bank National Association for a $20.0 million unsecured revolving credit facility. The current credit facility contains customary representations and warranties, events of default, and financial, affirmative and negative covenants for loan agreements of this kind. Covenants under the current credit facility restrict the payment of cash dividends if the Company would be in violation of the minimum tangible net worth test or the leverage ratio test in the current loan agreement as a result of the dividend, among various restrictions.
In the absence of a default, all borrowings under the current credit facility bear interest at the LIBOR Rate plus 1.75% per annum. The Company will pay a non-usage fee under the current loan agreement at a rate per annum equal to between 0.15% and 0.35% of the unused amount of the current credit facility, which fee shall be paid quarterly. The current credit facility is scheduled to expire March 31, 2013.
Previous Credit Facility
On April 6, 2010, in connection with the consummation of the current credit facility, the Company terminated its credit agreement with Wachovia Bank National Association for a $27.0 million senior secured credit facility. The previous credit facility, as amended, consisted of a $20.0 million revolving credit facility, and a $7.0 million term loan. The previous credit facility was secured by substantially all of our assets, and contained customary representations and warranties, events of default and affirmative and negative covenants for secured facilities of this type. Covenants under the previous credit facility restricted the payment of cash dividends if a default or event of default under the credit agreement had occurred or would result from the payment of dividends or if the Company would be in violation of the consolidated fixed charge coverage ratio test in the credit agreement as a result of the payment of dividends, among various other restrictions.
Outstanding Borrowings
There was no outstanding borrowings under the current credit facility or the previous credit facility as of December 31, 2010 and 2009.
Interest Rate Sensitivity
Changes in interest rates affect the interest paid on indebtedness under our current credit facility because the outstanding amounts of indebtedness under our current credit facility are subject to variable interest rates. Under our current credit facility, the non-default rate of interest is equal to the LIBOR Market Index Rate plus 1.75% per annum (for a rate of interest of 2.01% at December 31, 2010). Because there were no amounts outstanding under our current credit facility, a one percent change in the interest rate on our variable-rate debt would not have materially impacted our financial position, results of operations or cash flows for the year ended December 31, 2010.
19
Other Long-Term Obligations
We had approximately $49,000 of equipment notes payable and other long-term obligations at December 31, 2010. We also had approximately $1.3 million in non-cancellable operating lease obligations at December 31, 2010.
Recent Accounting Pronouncements
In January 2009, the SEC issued Final Rule No. 33-9002, Interactive Data to Improve Financial Reporting, which will require the Company to submit financial statements in XBRL (extensible business reporting language) format with its SEC filings beginning June 30, 2011.
ITEM 7A. QUANTITATIVE AND QUALITATIVE DISCLOSURES ABOUT MARKET RISK
In the normal course of our business, we are exposed to market risk from changes in interest rates and foreign currency exchange rates that could impact our results of operations and financial position.
Interest Rate Risk
Changes in interest rates affect the interest paid on indebtedness under our current credit facility because the outstanding amounts of indebtedness under our current credit facility are subject to variable interest rates. Under our current credit facility, the non-default rate of interest is equal to the LIBOR Market Index Rate plus 1.75% per annum (for a rate of interest of 2.01% at December 31, 2010). Because there were no amounts outstanding under our current credit facility, a one percent change in the interest rate on our variable-rate debt would not have materially impacted our financial position, results of operations or cash flows for the year ended December 31, 2010.
Foreign Currency Exchange Rate Risk
We are subject to risk arising from changes in foreign currency exchange rates related to our international operations in Europe. We manage our exposure to our foreign currency exchange rate risk through our regular operating and financing activities, and not through the use of any financial or derivative instruments, forward contracts or hedging activities. Because we report in U.S. dollars on a consolidated basis, foreign currency exchange fluctuations could have a translation impact on our financial position. At December 31, 2010, we recognized a $2.4 million decrease in our foreign currency translation adjustment account compared with December 31, 2009 because of the strengthening of the U.S. dollar against certain foreign currencies. During the year ended December 31, 2010 and 2009, the impact of foreign currency exchange rate changes on our results of operations and cash flows was a loss of approximately $0.1 million and gain of approximately $0.4 million, respectively.
|
ITEM 8.
|
FINANCIAL STATEMENTS AND SUPPLEMENTARY DATA
|
The response to this item is included in Part IV, Item 15 of this Report.
20
| ITEM 9. |
CHANGES IN AND DISAGREEMENTS WITH ACCOUNTANTS ON ACCOUNTING AND FINANCIAL DISCLOSURE
|
None.
Disclosure Controls and Procedures
We carried out an evaluation, under the supervision and with the participation of our management, including our chief executive and chief financial officers, of the effectiveness of the design and operation of our disclosure controls and procedures, as defined in Rules 13a-15(e) and 15d-15(e) under the Securities Exchange Act of 1934, as of the end of the period covered by this report. Based upon this evaluation, our Co-Chief Executive Officers and our Chief Financial Officer have concluded that the disclosure controls and procedures were effective as of the end of the period covered by this Annual Report to ensure that information required to be disclosed in our reports that we file or submit under the Exchange Act are recorded, processed, summarized and reported within the time periods specified in Securities and Exchange Commission rules and forms.
Management’s Report On Internal Control Over Financial Reporting
Management of Miller Industries, Inc. is responsible for establishing and maintaining adequate internal control over financial reporting (as defined in Rules 13a-15(f) and 15d-15(f) under the Exchange Act). Our internal control over financial reporting is a process designed to provide reasonable assurance regarding the reliability of financial reporting and the preparation of financial statements for external purposes in accordance with accounting principles generally accepted in the United States of America. The Company’s internal control over financial reporting includes those policies and procedures that (1) pertain to the maintenance of records that, in reasonable detail, accurately and fairly reflect the transactions and dispositions of the assets of the Company; (2) provide reasonable assurance that transactions are recorded as necessary to permit preparation of financial statements in accordance with U.S. generally accepted accounting principles, and that receipts and expenditures of the Company are being made only in accordance with authorizations of management and directors of the Company; and (3) provide reasonable assurance regarding prevention or timely detection of unauthorized acquisition, use, or disposition of the Company’s assets that could have a material effect on the financial statements.
Because of its inherent limitations, internal control over financial reporting may not prevent or detect misstatements. Also, projections of any evaluation of effectiveness to future periods are subject to the risk that controls may be inadequate because of changes in conditions, or that the degree of compliance with the policies or procedures may deteriorate.
Management, including our principal executive officers and principal financial officer, conducted an evaluation of the effectiveness of our internal control over financial reporting as of December 31, 2010. In making this assessment, management used the criteria set forth by the Committee of Sponsoring Organizations of the Treadway Commission in “Internal Control—Integrated Framework.” Based on our assessment under those criteria, we concluded that, as of December 31, 2010, we maintained effective internal control over financial reporting.
Joseph Decosimo and Company, PLLC, the independent registered public accounting firm who audited the Company’s consolidated financial statements included in this report, has issued an audit report on the effectiveness of the Company’s internal control over financial reporting as of December 31, 2010, which appears herein.
March 8, 2011
21
Report of Independent Registered Public Accounting Firm
Board of Directors and Shareholders
Miller Industries, Inc.
Ooltewah, Tennessee
We have audited Miller Industries, Inc.’s internal control over financial reporting as of December 31, 2010, based on criteria established in Internal Control—Integrated Framework issued by the Committee of Sponsoring Organizations of the Treadway Commission (the COSO criteria). Miller Industries, Inc.’s management is responsible for maintaining effective internal control over financial reporting and for its assessment of the effectiveness of internal control over financial reporting included in the accompanying Management Report on Internal Control Over Financial Reporting. Our responsibility is to express an opinion on the Company’s internal control over financial reporting based on our audit.
We conducted our audit in accordance with the standards of the Public Company Accounting Oversight Board (United States). Those standards require that we plan and perform the audit to obtain reasonable assurance about whether effective internal control over financial reporting was maintained in all material respects. Our audit included obtaining an understanding of internal control over financial reporting, assessing the risk that a material weakness exists, testing and evaluating the design and operating effectiveness of internal control based on the assessed risk, and performing such other procedures as we considered necessary in the circumstances. We believe that our audit provides a reasonable basis for our opinion.
A company’s internal control over financial reporting is a process designed to provide reasonable assurance regarding the reliability of financial reporting and the preparation of financial statements for external purposes in accordance with generally accepted accounting principles. A company’s internal control over financial reporting includes those policies and procedures that (1) pertain to the maintenance of records that, in reasonable detail, accurately and fairly reflect the transactions and dispositions of the assets of the company; (2) provide reasonable assurance that transactions are recorded as necessary to permit preparation of financial statements in accordance with generally accepted accounting principles, and that receipts and expenditures of the company are being made only in accordance with authorizations of management and directors of the company; and (3) provide reasonable assurance regarding prevention or timely detection of unauthorized acquisition, use, or disposition of the company’s assets that could have a material effect on the financial statements.
Because of its inherent limitations, internal control over financial reporting may not prevent or detect misstatements. Also, projections of any evaluation of effectiveness to future periods are subject to the risk that controls may become inadequate because of changes in conditions, or that the degree of compliance with the policies or procedures may deteriorate.
In our opinion, Miller Industries, Inc. maintained, in all material respects, effective internal control over financial reporting as of December 31, 2010, based on the COSO criteria.
We have also audited, in accordance with the standards of the Public Company Accounting Oversight Board (United States), the consolidated balance sheets of Miller Industries, Inc. and subsidiaries as of December 31, 2010 and 2009, and the related consolidated statements of income, shareholders’ equity, and cash flows for each of the three years in the period ended December 31, 2010, and our report dated March 8, 2011, expressed an unqualified opinion on those consolidated financial statements.
/s/ Joseph Decosimo and Company, PLLC
Chattanooga, Tennessee
March 8, 2011
22
Changes in Internal Control Over Financial Reporting
There were no changes in our internal control over financial reporting that occurred during our most recent fiscal quarter that have materially affected, or are reasonably likely to materially affect, our internal control over financial reporting.
At a meeting held on March 7, 2011, the Board of Directors of the Company took several actions as part of its long-term succession planning for the leadership of the Company. First, it was decided that Mr. William G. Miller would no longer serve as a Co-Chief Executive Officer of the Company and that Mr. Jeffrey Badgley would serve as the sole Chief Executive Officer of the Company. Mr. Miller will continue to serve as the executive Chairman of the Board and as a full-time employee of the Company. Mr. Badgley was elected to serve as the Vice-Chairman of the Board. The Board also elected two new executive officers of the Company – William G. Miller, II, age 32, as President, and Vincent J. Tiano, age 46, as Vice President, Sales – North America. Mr. Miller, who is the son of the Chairman of the Company, has been employed by the Company in a number of positions since 2002, most recently serving as Vice President – Sales Southeast Region. Mr. Tiano has been employed by the Company since 1997, most recently serving as Vice President of Miller Industries Towing Equipment, Inc., a subsidiary of the Company.
Paul Drack has indicated his desire to not stand for re-election to the Board of Directors of the Company at the upcoming Annual Meeting of Shareholders, after having served as a director since 1994. The Nominating Committee of the Board has determined that he will not be replaced at this time. As a result, the Board, pursuant to Section 2.2 of the Amended and Restated By-laws of the Company and Section 9 of the Company’s Charter, determined that the number of directors constituting the Board of Directors shall be five (5), effective immediately prior to the Company’s Annual Meeting of Shareholders to be held in 2011.
23
PART III
The Proxy Statement for our Annual Meeting of Shareholders, to be filed with the Securities and Exchange Commission, will contain information relating to our directors and audit committee, compliance with Section 16(a) of the Exchange Act, and our code of ethics applicable to our chief executive, financial and accounting officers, which information is incorporated by reference herein. Information relating to our executive officers is included in Item 1 of this report.
The Proxy Statement for our Annual Meeting of Shareholders, to be filed with the Securities and Exchange Commission, will contain information relating to director and executive officer compensation, which information is incorporated by reference herein.
The Proxy Statement for our Annual Meeting of Shareholders, to be filed with the Securities and Exchange Commission, will contain information relating to security ownership of certain beneficial owners and management, which information is incorporated by reference herein.
The Proxy Statement will also contain information relating to our equity compensation plans, which information is incorporated by reference herein.
The Proxy Statement for our Annual Meeting of Shareholders, to be filed with the Securities and Exchange Commission, will contain information relating to certain relationships and related transactions between us and certain of our directors and executive officers, which information is incorporated by reference herein.
The Proxy Statement for our Annual Meeting of Shareholders, to be filed with the Securities and Exchange Commission, will contain information relating to the fees charged and services provided by Joseph Decosimo and Company, PLLC, our principal accountants during the last three fiscal years, and our pre-approval policy and procedures for audit and non-audit services, which information is incorporated by reference into this report.
24
PART IV
(a) The following documents are filed as part of this Report:
1. Financial Statements
|
Description
|
Page Number
in Report |
|||
|
Report of Independent Registered Public Accounting Firm
|
F-2 | |||
|
Consolidated Balance Sheets as of December 31, 2010 and 2009
|
F-3 | |||
|
Consolidated Statements of Income for the years ended December 31, 2010, 2009 and 2008
|
F-4 | |||
|
Consolidated Statements of Shareholders’ Equity for the years ended December 31, 2010, 2009 and 2008
|
F-5 | |||
|
Consolidated Statements of Cash Flows for the years ended December 31, 2010, 2009 and 2008
|
F-6 | |||
|
Notes to Consolidated Financial Statements
|
F-7 | |||
2. Financial Statement Schedules
The following Financial Statement Schedule for the Registrant is filed as part of this Report and should be read in conjunction with the Consolidated Financial Statements:
|
Description
|
Page Number
in Report |
|||
|
Schedule II - Valuation and Qualifying Accounts
|
S-1 | |||
All schedules, except those set forth above, have been omitted since the information required is included in the financial statements or notes or have been omitted as not applicable or not required.
3. Exhibits
The following exhibits are required to be filed with this Report by Item 601 of Regulation S-K:
|
Description
|
Incorporated by
Reference to Registration File Number |
Form or
Report |
Date of Report
|
Exhibit
Number in Report |
|||||
|
3.1
|
Charter, as amended, of the Registrant
|
–
|
Form 10-K
|
December 31, 2001
|
3.1
|
||||
|
3.2
|
Amended and Restated Bylaws of the Registrant
|
–
|
Form 10-Q
|
November 8, 2007
|
3.2
|
||||
|
10.1
|
Form of Noncompetition Agreement between the Registrant and certain officers of the Registrant
|
33-79430
|
S-1
|
August 1994
|
10.28
|
||||
|
10.2
|
Form of Nonexclusive Distributor Agreement
|
33-79430
|
S-1
|
August 1994
|
10.31
|
||||
|
10.3
|
Miller Industries, Inc. Stock Option and Incentive Plan**
|
33-79430
|
S-1
|
August 1994
|
10.1
|
25
|
Description
|
Incorporated by
Reference to Registration File Number |
Form or
Report |
Date of Report
|
Exhibit
Number in Report |
|
10.4
|
Form of Incentive Stock Option Agreement under Miller Industries, Inc. Stock Option and Incentive Plan**
|
33-79430
|
S-1
|
August 1994
|
10.2
|
||||
|
10.5
|
Miller Industries, Inc. Non-Employee Director Stock Option Plan**
|
33-79430
|
S-1
|
August 1994
|
10.4
|
||||
|
10.6
|
Form of Director Stock Option Agreement**
|
33-79430
|
S-1
|
August 1994
|
10.5
|
||||
|
10.7
|
First Amendment to Miller Industries, Inc. Non-Employee Director Stock Option Plan**
|
–
|
Form 10-K
|
April 30, 1995
|
10.38
|
||||
|
10.8
|
Second Amendment to Miller Industries, Inc. Non-Employee Director Stock Option Plan**
|
–
|
Form 10-K
|
April 30, 1996
|
10.39
|
||||
|
10.9
|
Second Amendment to Miller Industries, Inc. Stock Option and Incentive Plan**
|
–
|
Form 10-K
|
April 30, 1996
|
10.40
|
||||
|
10.10
|
Employment Agreement dated as of December 30, 2008 between the Registrant and William G. Miller**
|
–
|
Form 10-Q
|
May 6, 2009
|
10.1
|
||||
|
10.11
|
Form of Indemnification Agreement by and between the Registrant and each of William G. Miller, Jeffrey I. Badgley, A. Russell Chandler, Paul E. Drack, Frank Madonia, J. Vincent Mish, Richard H. Roberts and Theodore H. Ashford **
|
–
|
Form 10-Q
|
September 14, 1998
|
10
|
||||
|
10.12
|
Employment Agreement, dated as of December 30, 2008, between the Registrant and Jeffrey I. Badgley**
|
–
|
Form 10-Q
|
May 6, 2009
|
10.2
|
||||
|
10.13
|
Employment Agreement, dated as of December 30, 2008 between the Registrant and Frank Madonia**
|
–
|
Form 10-Q
|
May 6, 2009
|
10.3
|
||||
|
10.14
|
Employment Agreement, dated as of December 30, 2008 between the Registrant and J. Vincent Mish**
|
–
|
Form 10-Q
|
May 6, 2009
|
10.4
|
||||
|
10.15
|
Agreement between the Registrant and Jeffrey I. Badgley, effective December 30, 2008**
|
–
|
Form 10-Q
|
May 6, 2009
|
10.5
|
||||
|
10.16
|
Agreement between the Registrant and Frank Madonia, effective December 30, 2008**
|
–
|
Form 10-Q
|
May 6, 2009
|
10.6
|
||||
|
10.17
|
Agreement between the Registrant and J. Vincent Mish, effective December 30, 2008**
|
–
|
Form 10-Q
|
May 6, 2009
|
10.7
|
||||
|
10.18
|
Non-Employee Director Stock Plan**
|
–
|
Schedule 14A
|
January 23, 2004
|
Annex A
|
||||
|
10.19
|
Miller Industries, Inc. 2005 Equity Incentive Plan**
|
–
|
Schedule 14A
|
May 2, 2005
|
Annex B
|
26
|
Description
|
Incorporated by
Reference to Registration File Number |
Form or
Report |
Date of Report
|
Exhibit
Number in Report |
|
10.20
|
Loan Agreement, dated April 6, 2010, by and among the Registrant, certain of the Registrant’s wholly-owned subsidiaries, and First Tennessee National Association
|
–
|
Form 8-K
|
April 12, 2010
|
10.1
|
||||
|
10.21
|
Agreement, dated April 6, 2010, by and between the Registrant, certain of the Registrant’s wholly-owned subsidiaries, and First Tennessee National Association
|
–
|
Form 8-K
|
April 12, 2010
|
10.2
|
||||
|
10.22
|
Agreement, dated April 6, 2010, by and between the Registrant, certain of the Registrant’s wholly-owned subsidiaries, and First Tennessee National Association
|
–
|
Form 8-K
|
April 12, 2010
|
10.3
|
||||
|
21
|
Subsidiaries of the Registrant*
|
||||||||
|
23.1
|
Consent of Joseph Decosimo and Company, PLLC*
|
||||||||
|
24
|
Power of Attorney (see signature page)*
|
||||||||
|
31.1
|
Certification Pursuant to Rules 13a-14(a)/15d-14(a) by Co-Chief Executive Officer*
|
||||||||
|
31.2
|
Certification Pursuant to Rules 13a-14(a)/15d-14(a) by Co-Chief Executive Officer*
|
||||||||
|
31.3
|
Certification Pursuant to Rule 13a-14(a)/15d-14(a) by Chief Financial Officer*
|
||||||||
|
32.1
|
Certification Pursuant to Section 1350 of Chapter 63 of Title 18 of United States Code by Co-Chief Executive Officer*
|
||||||||
|
32.2
|
Certification Pursuant to Section 1350 of Chapter 63 of Title 18 of United States Code by Co-Chief Executive Officer*
|
||||||||
|
32.3
|
Certification Pursuant to Section 1350 of Chapter 63 of Title 18 of United States Code by Chief Financial Officer*
|
* Filed herewith.
** Management contract or compensatory plan or arrangement.
|
(b)
|
The Registrant hereby files as exhibits to this Report the exhibits set forth in Item 15(a)3 hereof.
|
|
I
|
The Registrant hereby files as financial statement schedules to this Report the financial statement schedules set forth in Item 15(a)2 hereof.
|
27
INDEX TO FINANCIAL STATEMENTS
|
REPORT OF INDEPENDENT REGISTERED PUBLIC ACCOUNTING FIRM
|
F-2
|
|
|
CONSOLIDATED BALANCE SHEETS AS OF DECEMBER 31, 2010 AND 2009
|
F-3
|
|
|
CONSOLIDATED STATEMENTS OF INCOME FOR THE YEARS ENDED DECEMBER 31, 2010, 2009 AND 2008
|
F-4
|
|
|
CONSOLIDATED STATEMENTS OF SHAREHOLDERS’ EQUITY FOR THE YEARS ENDED DECEMBER 31, 2010, 2009 AND 2008
|
F-5
|
|
|
CONSOLIDATED STATEMENTS OF CASH FLOWS FOR THE YEARS ENDED DECEMBER 31, 2010, 2009 AND 2008
|
F-6
|
|
|
NOTES TO CONSOLIDATED FINANCIAL STATEMENTS
|
F-7
|
|
|
SCHEDULE II – VALUATION AND QUALIFYING ACCOUNTS
|
S-1
|
REPORT OF INDEPENDENT REGISTERED PUBLIC ACCOUNTING FIRM
Board of Directors and Shareholders
Miller Industries, Inc.
Ooltewah, Tennessee
We have audited the accompanying consolidated balance sheets of Miller Industries, Inc. and subsidiaries as of December 31, 2010 and 2009, and the related consolidated statements of income, shareholders’ equity and cash flows for each of the three years in the period ended December 31, 2010. Our audits also included the financial statement schedule listed in the Index at Item 15. These consolidated financial statements and financial statement schedule are the responsibility of the Company’s management. Our responsibility is to express an opinion on these consolidated financial statements and financial statement schedule based on our audits.
We conducted our audits in accordance with the standards of the Public Company Accounting Oversight Board (United States). Those standards require that we plan and perform the audit to obtain reasonable assurance about whether the consolidated financial statements are free of material misstatement. An audit includes examining, on a test basis, evidence supporting the amounts and disclosures in the consolidated financial statements. An audit also includes assessing the accounting principles used and significant estimates made by management, as well as evaluating the overall financial statement presentation. We believe that our audits provide a reasonable basis for our opinion.
In our opinion, the consolidated financial statements referred to above present fairly, in all material respects, the financial position of Miller Industries, Inc. and subsidiaries as of December 31, 2010 and 2009, and the results of their operations and their cash flows for each of the three years in the period ended December 31, 2010, in conformity with accounting principles generally accepted in the United States of America. Also, in our opinion, the financial statement schedule when considered in relation to the basic consolidated financial statements taken as a whole, presents fairly, in all material respects, the information set forth therein.
We also have audited, in accordance with the standards of the Public Company Accounting Oversight Board (United States), the Company’s internal control over financial reporting as of December 31, 2010, based on criteria established in Internal Control—Integrated Framework issued by the Committee of Sponsoring Organizations of the Treadway Commission (COSO) and our report dated March 8, 2011 expressed an unqualified opinion on the effectiveness on the Company’s internal control over financial reporting.
/s/ Joseph Decosimo and Company, PLLC
Chattanooga, Tennessee
March 8, 2011
MILLER INDUSTRIES, INC. AND SUBSIDIARIES
CONSOLIDATED BALANCE SHEETS
DECEMBER 31, 2010 AND 2009
(In thousands, except share data)
|
2010
|
2009
|
|||||||
|
ASSETS
|
||||||||
|
CURRENT ASSETS:
|
||||||||
|
Cash and temporary investments
|
$ | 46,334 | $ | 36,160 | ||||
|
Accounts receivable, net of allowance for doubtful accounts of $1,843 and $2,090, at December 31, 2010 and 2009, respectively
|
60,110 | 44,673 | ||||||
|
Inventories
|
38,938 | 36,061 | ||||||
|
Prepaid expenses
|
3,556 | 2,296 | ||||||
|
Current deferred income taxes
|
5,218 | 5,882 | ||||||
|
Total current assets
|
154,156 | 125,072 | ||||||
|
PROPERTY, PLANT, AND EQUIPMENT, net
|
33,813 | 32,203 | ||||||
|
GOODWILL
|
11,619 | 11,619 | ||||||
|
DEFERRED INCOME TAX ASSETS
|
— | 3,365 | ||||||
|
OTHER ASSETS
|
288 | 61 | ||||||
| $ | 199,876 | $ | 172,320 | |||||
|
LIABILITIES AND SHAREHOLDERS’ EQUITY
|
||||||||
|
CURRENT LIABILITIES:
|
||||||||
|
Current portion of long-term obligations
|
$ | 44 | $ | 185 | ||||
|
Accounts payable
|
34,008 | 19,139 | ||||||
|
Accrued liabilities
|
13,273 | 11,501 | ||||||
|
Total current liabilities
|
47,325 | 30,825 | ||||||
|
LONG-TERM OBLIGATIONS, less current portion
|
5 | 56 | ||||||
|
DEFERRED INCOME TAX LIABILITIES
|
1,978 | — | ||||||
|
COMMITMENTS AND CONTINGENCIES (Notes 3 and 5)
|
||||||||
|
SHAREHOLDERS’ EQUITY:
|
||||||||
|
Preferred stock, $.01 par value; 5,000,000 shares authorized, none issued or outstanding
|
0 | 0 | ||||||
|
Common stock, $.01 par value; 100,000,000 shares authorized, 11,709,275 and 11,627,315, outstanding at December 31, 2010 and 2009, respectively
|
117 | 116 | ||||||
|
Additional paid-in capital
|
162,447 | 161,512 | ||||||
|
Accumulated deficit
|
(12,062 | ) | (22,606 | ) | ||||
|
Accumulated other comprehensive income
|
66 | 2,417 | ||||||
|
Total shareholders’ equity
|
150,568 | 141,439 | ||||||
| $ | 199,876 | $ | 172,320 | |||||
The accompanying notes are an integral part of these consolidated statements.
F-3
MILLER INDUSTRIES, INC. AND SUBSIDIARIES
CONSOLIDATED STATEMENTS OF INCOME
FOR THE YEARS ENDED DECEMBER 31, 2010, 2009 AND 2008
(In thousands, except per share data)
|
2010
|
2009
|
2008
|
||||||||||
|
NET SALES
|
$ | 306,897 | $ | 237,567 | $ | 270,989 | ||||||
|
COSTS AND EXPENSES
|
||||||||||||
|
Costs of operations
|
260,566 | 202,272 | 237,362 | |||||||||
|
Selling, general, and administrative expenses
|
26,665 | 24,905 | 25,940 | |||||||||
|
Interest expense, net
|
305 | 883 | 1,241 | |||||||||
|
Other Expense (Income)
|
71 | (442 | ) | 678 | ||||||||
|
Total costs and expenses
|
287,607 | 227,618 | 265,221 | |||||||||
|
INCOME BEFORE INCOME TAXES
|
19,290 | 9,949 | 5,768 | |||||||||
|
INCOME TAX PROVISION
|
7,583 | 3,933 | 2,182 | |||||||||
|
NET INCOME
|
$ | 11,707 | $ | 6,016 | $ | 3,586 | ||||||
|
BASIC INCOME PER COMMON SHARE
|
$ | 1.00 | $ | 0.52 | $ | 0.31 | ||||||
|
DILUTED INCOME PER COMMON SHARE
|
$ | 0.96 | $ | 0.51 | $ | 0.31 | ||||||
|
WEIGHTED AVERAGE SHARES OUTSTANDING:
|
||||||||||||
|
Basic
|
11,671 | 11,611 | 11,594 | |||||||||
|
Diluted
|
12,163 | 11,902 | 11,656 | |||||||||
The accompanying notes are an integral part of these consolidated statements.
F-4
MILLER INDUSTRIES, INC. AND SUBSIDIARIES
CONSOLIDATED STATEMENTS OF SHAREHOLDERS’ EQUITY
FOR THE YEARS ENDED DECEMBER 31, 2010, 2009 AND 2008
(In thousands, except share data)
|
Common Stock
|
Additional Paid-In Capital
|
Accumulated Deficit
|
Accumulated Other Comprehensive Income (Loss)
|
Total
|
||||||||||||||||
|
BALANCE, December 31, 2007
|
$ | 116 | $ | 160,700 | $ | (32,208 | ) | $ | 3,880 | $ | 132,488 | |||||||||
|
Components of comprehensive income:
|
||||||||||||||||||||
|
Net income
|
— | — | 3,586 | — | 3,586 | |||||||||||||||
|
Foreign currency translation adjustments
|
— | — | — | (4,321 | ) | (4,321 | ) | |||||||||||||
|
Total comprehensive income (loss)
|
— | — | 3,586 | (4,321 | ) | (735 | ) | |||||||||||||
|
Issuance of common stock to non-employee directors (5,409)
|
— | 75 | — | — | 75 | |||||||||||||||
|
Exercise of stock options (210)
|
— | 1 | — | — | 1 | |||||||||||||||
|
Stock-based compensation expense
|
— | 143 | — | — | 143 | |||||||||||||||
|
BALANCE, December 31, 2008
|
116 | 160,919 | (28,622 | ) | (441 | ) | 131,972 | |||||||||||||
|
Components of comprehensive income:
|
||||||||||||||||||||
|
Net income
|
— | — | 6,016 | — | 6,016 | |||||||||||||||
|
Foreign currency translation adjustments
|
— | — | — | 2,858 | 2,858 | |||||||||||||||
|
Total comprehensive income
|
— | — | 6,016 | 2,858 | 8,874 | |||||||||||||||
|
Issuance of common stock to non-employee directors (14,562)
|
— | 75 | — | — | 75 | |||||||||||||||
|
Exercise of stock options (18,955)
|
— | 119 | — | — | 119 | |||||||||||||||
|
Stock-based compensation expense
|
— | 399 | — | — | 399 | |||||||||||||||
|
BALANCE, December 31, 2009
|
116 | 161,512 | (22,606 | ) | 2,417 | 141,439 | ||||||||||||||
|
Components of comprehensive income:
|
||||||||||||||||||||
|
Net income
|
— | — | 11,707 | — | 11,707 | |||||||||||||||
|
Foreign currency translation adjustments
|
— | — | — | (2,351 | ) | (2,351 | ) | |||||||||||||
|
Total comprehensive income
|
— | — | 11,707 | (2,351 | ) | 9,356 | ||||||||||||||
|
Issuance of common stock to non-employee directors (7,835)
|
— | 93 | — | — | 93 | |||||||||||||||
|
Exercise of stock options (74,125)
|
1 | 443 | — | — | 444 | |||||||||||||||
|
Stock-based compensation expense
|
— | 399 | — | — | 399 | |||||||||||||||
|
Dividends paid, $0.10 per share
|
— | — | (1,163 | ) | — | (1,163 | ) | |||||||||||||
|
BALANCE, December 31, 2010
|
$ | 117 | $ | 162,447 | $ | (12,062 | ) | $ | 66 | $ | 150,568 | |||||||||
The accompanying notes are an integral part of these consolidated statements.
F-5
MILLER INDUSTRIES, INC. AND SUBSIDIARIES
CONSOLIDATED STATEMENTS OF CASH FLOWS
FOR THE YEARS ENDED DECEMBER 31, 2010, 2009 AND 2008
(In thousands)
|
2010
|
2009
|
2008
|
||||||||||
|
OPERATING ACTIVITIES:
|
||||||||||||
|
Net income
|
$ | 11,707 | $ | 6,016 | $ | 3,586 | ||||||
|
Adjustments to reconcile net income to net cash flows from operating activities:
|
||||||||||||
|
Depreciation and amortization
|
3,533 | 3,514 | 3,516 | |||||||||
|
Deferred tax provision
|
6,008 | 1,735 | 672 | |||||||||
|
Provision for doubtful accounts
|
220 | 714 | 634 | |||||||||
|
Stock-based compensation
|
399 | 399 | 143 | |||||||||
|
Issuance of non-employee director shares
|
93 | 75 | 75 | |||||||||
|
(Gain) Loss on disposals of equipment
|
(28 | ) | 70 | — | ||||||||
|
Changes in operating assets and liabilities:
|
||||||||||||
|
Accounts receivable
|
(16,378 | ) | 7,629 | 11,588 | ||||||||
|
Inventories
|
(4,081 | ) | 9,239 | (6,827 | ) | |||||||
|
Prepaid expenses and other
|
(1,283 | ) | (379 | ) | (114 | ) | ||||||
|
Other Long-term assets
|
(257 | ) | — | — | ||||||||
|
Accounts payable
|
15,362 | (8,882 | ) | (10,776 | ) | |||||||
|
Accrued liabilities and other
|
2,230 | (411 | ) | 2,113 | ||||||||
|
Net cash flows from operating activities
|
17,525 | 19,719 | 4,610 | |||||||||
|
INVESTING ACTIVITIES:
|
||||||||||||
|
Purchases of property, plant, and equipment
|
(5,279 | ) | (755 | ) | (4,850 | ) | ||||||
|
Proceeds from sale of equipment
|
24 | 1 | 2 | |||||||||
|
Payments received on notes receivables
|
390 | 212 | 180 | |||||||||
|
Net cash flows from investing activities
|
(4,865 | ) | (542 | ) | (4,668 | ) | ||||||
|
FINANCING ACTIVITIES:
|
||||||||||||
|
Payments on long-term obligations
|
(178 | ) | (4,094 | ) | (1,859 | ) | ||||||
|
Borrowings under long-term obligations
|
— | 46 | 138 | |||||||||
|
Payments of cash dividends
|
(1,163 | ) | — | — | ||||||||
|
Additions to deferred financing costs
|
(51 | ) | — | (2 | ) | |||||||
|
Proceeds from exercise of stock options
|
443 | 119 | 1 | |||||||||
|
Net cash flows from financing activities
|
(949 | ) | (3,929 | ) | (1,722 | ) | ||||||
|
EFFECT OF EXCHANGE RATE CHANGES ON CASH AND TEMPORARY INVESTMENTS
|
(1,537 | ) | 1,467 | (2,057 | ) | |||||||
|
NET CHANGE IN CASH AND TEMPORARY INVESTMENTS
|
10,174 | 16,715 | (3,837 | ) | ||||||||
|
CASH AND TEMPORARY INVESTMENTS, beginning of year
|
36,160 | 19,445 | 23,282 | |||||||||
|
CASH AND TEMPORARY INVESTMENTS, end of year
|
$ | 46,334 | $ | 36,160 | $ | 19,445 | ||||||
|
SUPPLEMENTAL DISCLOSURE OF CASH FLOW INFORMATION:
|
||||||||||||
|
Cash payments for interest
|
$ | 692 | $ | 1,191 | $ | 1,863 | ||||||
|
Cash payments for income taxes, net of refunds
|
$ | 1,150 | $ | 2,755 | $ | 475 | ||||||
The accompanying notes are an integral part of these consolidated statements.
F-6
MILLER INDUSTRIES, INC. AND SUBSIDIARIES
NOTES TO CONSOLIDATED FINANCIAL STATEMENTS
|
1.
|
ORGANIZATION AND NATURE OF OPERATIONS
|
Miller Industries, Inc. and subsidiaries (“the Company”) is the world’s largest manufacturer of vehicle towing and recovery equipment. The principal markets for the Company’s towing and recovery equipment are approximately 100 independent distributors and the users of towing and recovery equipment located primarily throughout North America, and other customers throughout the world. The Company’s products are marketed under the brand names of Century®, Challenger®, Holmes®, Champion®, Eagle®, Titan®, JigeTM, BonifaceTM, Vulcan®, and ChevronTM.
|
2.
|
SUMMARY OF SIGNIFICANT ACCOUNTING POLICIES
|
Use of Estimates in the Preparation of Financial Statements
The preparation of financial statements in conformity with generally accepted accounting principles requires management to make estimates and assumptions that affect the reported amounts of assets and liabilities and disclosure of contingent assets and liabilities at the date of the financial statements and the reported amounts of revenues and expenses during the reporting period. Actual results could differ from those estimates.
Consolidation
The accompanying consolidated financial statements include the accounts of Miller Industries, Inc. and its subsidiaries. All significant intercompany transactions and balances have been eliminated.
Cash and Temporary Investments
Cash and temporary investments include all cash and cash equivalent investments with original maturities of three months or less.
Fair Value of Financial Instruments
The carrying values of cash and temporary investments, accounts receivable, accounts payable and accrued liabilities are reasonable estimates of their fair values because of the short maturity of these financial instruments. The carrying values of long-term obligations are reasonable estimates of their fair values based on the rates available for obligations with similar terms and maturities.
Inventories
Inventory costs include materials, labor and factory overhead. Inventories are stated at the lower of cost or market (net realizable value), determined on a first-in, first-out basis. Appropriate consideration is given to obsolescence, valuation and other factors in determining net realizable value. Revisions of these estimates could result in the need for adjustments. Inventories, net of reserves, at December 31, 2010 and 2009 consisted of the following (in thousands):
|
2010
|
2009
|
|||||||
|
Chassis
|
$ | 7,585 | $ | 7,183 | ||||
|
Raw materials
|
17,243 | 14,114 | ||||||
|
Work in process
|
7,181 | 6,190 | ||||||
|
Finished goods
|
6,929 | 8,574 | ||||||
| $ | 38,938 | $ | 36,061 | |||||
F-7
Property, Plant, and Equipment
Property, plant and equipment are recorded at cost. Depreciation for financial reporting purposes is provided using the straight-line method over the estimated useful lives of the assets. Accelerated depreciation methods are used for income tax reporting purposes. Estimated useful lives range from 20 to 30 years for buildings and improvements and 5 to 10 years for machinery and equipment, furniture and fixtures, and software costs. Expenditures for routine maintenance and repairs are charged to expense as incurred. Internal labor is used in certain capital projects.
Property, plant and equipment at December 31, 2010 and 2009 consisted of the following (in thousands):
|
2010
|
2009
|
|||||||
|
Land and improvements
|
$ | 4,772 | $ | 4,796 | ||||
|
Buildings and improvements
|
30,909 | 29,994 | ||||||
|
Machinery and equipment
|
25,920 | 22,983 | ||||||
|
Furniture and fixtures
|
7,560 | 7,196 | ||||||
|
Software costs
|
7,251 | 7,118 | ||||||
| 76,412 | 72,087 | |||||||
|
Less accumulated depreciation
|
(42,599 | ) | (39,884 | ) | ||||
| $ | 33,813 | $ | 32,203 | |||||
The Company recognized $3,502,000, $3,475,000 and $3,440,000, in depreciation expense in 2010, 2009 and 2008, respectively. In 2008, $75,000 of interest costs were capitalized for construction period interest.
The Company capitalizes costs related to software development in accordance with established criteria, and amortizes those costs to expense on a straight-line basis over five years. System development costs not meeting proper criteria for capitalization are expensed as incurred.
Basic and Diluted Income Per Common Share
Basic income per common share is computed by dividing net income by the weighted average number of common shares outstanding. Diluted income per common share is calculated by dividing net income by the weighted average number of common and potential dilutive common shares outstanding. Diluted net income per common share takes into consideration the assumed exercise of outstanding stock options resulting in approximately 492,000, 291,000 and 29,000 potential dilutive common shares in 2010, 2009 and 2008, respectively. Options to purchase approximately 6,000 shares of common stock were outstanding during 2008, but were not included in the computation of diluted earnings per share because the effect would have been anti-dilutive. For 2010 and 2009, none of the outstanding stock options would have been anti-dilutive.
Long-Lived Assets
The Company periodically reviews the carrying amount of its long-lived assets to determine if those assets may be recoverable based upon the future operating cash flows expected to be generated by those assets. Management believes that its long-lived assets are appropriately valued.
Goodwill
Goodwill consists of the excess of cost of acquired entities over the sum of the amounts assigned to identifiable assets acquired less liabilities assumed. Goodwill is not amortized. However, the Company evaluates the carrying value of goodwill for impairment at least annually or if an event or circumstance occurs that would indicate that the carrying amount had been impaired. The carrying value of the entity is compared to the fair value. If the fair value is less, a comparison of the carrying value of goodwill to the fair value of goodwill is performed to determine if a writedown is required.
F-8
Patents, Trademarks and Other Purchased Product Rights
The cost of acquired patents, trademarks and other purchased product rights is capitalized and amortized using the straight-line method over various periods not exceeding 20 years. Total accumulated amortization of these assets was $1,547,000 at December 31, 2010 and 2009. At December 31, 2010 and 2009, all intangible assets subject to amortization were fully amortized. As acquisitions and dispositions of intangible assets occur in the future, the amortization amounts may vary.
Deferred Financing Costs
All deferred financing costs are included in other assets and are amortized using the straight-line method over the terms of the respective obligations. Total accumulated amortization of deferred financing costs at December 31, 2010 and 2009 was $19,000 and $364,000, respectively. Amortization expense in 2010, 2009 and 2008, was $32,000, $39,000 and $76,000, respectively, and is included in interest expense in the accompanying consolidated statements of income. Based on the current amount of deferred financing costs subject to amortization, the estimated amortization expense in future years is not significant.
Accrued Liabilities
Accrued liabilities consisted of the following at December 31, 2010 and 2009 (in thousands):
|
2010
|
2009
|
|||||||
|
Accrued wages, commissions, bonuses and benefits
|
$ | 5,143 | $ | 4,497 | ||||
|
Accrued products warranty
|
2,738 | 1,995 | ||||||
|
Accrued income taxes
|
1,036 | 1,202 | ||||||
|
Other
|
4,356 | 3,807 | ||||||
| $ | 13,273 | $ | 11,501 | |||||
Income Taxes
The Company recognizes as deferred income tax assets and liabilities the future tax consequences of the differences between the financial statement carrying amounts of existing assets and liabilities and their respective tax bases. The Company considers the need to record a valuation allowance to reduce deferred tax assets to the amount that is more likely than not to be realized. Tax loss carryforwards, reversal of deferred tax liabilities, tax planning and estimates of future taxable income are considered in assessing the need for a valuation allowance. If unrecognized tax positions exist, interest and penalties related to unrecognized tax positions are recorded as income tax expense in the consolidated statements of income.
Stock-Based Compensation
Stock compensation expense was $399,000 for 2010 and 2009, and $143,000 for 2008. The stock-based compensation expense is included in selling, general and administrative expenses in the accompanying consolidated statements of income.
The fair value of each option grant has been estimated as of the date of grant using the Black-Scholes option-pricing model with the following weighted average assumptions for grants in 2004: expected dividend yield of 0%; expected volatility of 43%; risk-free interest rate of 2.94%; and expected life of 5.5 years. Using these assumptions, the fair value of options granted in 2004 is approximately $1,242,000, which was amortized as compensation expense over the vesting period of the options. No options were granted during 2010 or 2009. The fair value of options granted in 2008 has been estimated as of the date of the grant using the Black-Scholes option-pricing model with the following weighted average assumptions: expected dividend yield of 0%; expected volatility of 44%; risk-free interest rate of 1.71%; and expected life of four years. Using these assumptions, the fair value of options granted in 2009 was $1,596,000, which is being amortized as compensation expense over the vesting period.
F-9
At December 31, 2010, the Company had $731,000 of unrecognized compensation expense related to stock options, with $399,000 to be expensed in 2011 and the remainder of $332,000 to be expensed in 2012. The Company issued approximately 74,000 and 19,000 shares of common stock during 2010 and 2009, respectively, from the exercise of stock options.
Product Warranty
The Company generally provides a one-year limited product and service warranty on certain of its products. The Company provides for the estimated cost of this warranty at the time of sale. Warranty expense in 2010, 2009 and 2008, was $2,411,000, $2,295,000 and $1,995,000, respectively.
The table below provides a summary of the warranty liability for December 31, 2010 and 2009 (in thousands):
|
2010
|
2009
|
|||||||
|
Accrual at beginning of the year
|
$ | 1,995 | $ | 878 | ||||
|
Provision
|
2,411 | 2,295 | ||||||
|
Settlement and Other
|
(1,668 | ) | (1,178 | ) | ||||
|
Accrual at end of year
|
$ | 2,738 | $ | 1,995 | ||||
Credit Risk
Financial instruments that potentially subject the Company to significant concentrations of credit risk consist principally of cash investments and trade accounts receivable. The Company places its cash investments with high-quality financial institutions and limits the amount of credit exposure through the use of accounts and funds backed by the U.S. Government and its agencies.
Revenue Recognition
Revenue is recorded by the Company when the risk of ownership for products has transferred to the independent distributors or other customers, which is generally upon shipment. From time to time, revenue is recognized under a bill and hold arrangement. Recognition of revenue on bill and hold arrangements occurs when risk of ownership has passed to the customer, a fixed written commitment has been provided by the customer, the goods are complete and ready for shipment, the goods are segregated from inventory, no performance obligation remains, and a schedule for delivery has been established.
Shipping and Handling Fees and Cost
The Company records revenues earned for shipping and handling as revenue, while the cost of shipping and handling is classified as cost of operations.
Foreign Currency Translation
The functional currency for the Company’s foreign operations is the applicable local currency. The translation from the applicable foreign currencies to U.S. dollars is performed for balance sheet accounts using current exchange rates in effect at the balance sheet date, historical rates for equity and the weighted average exchange rate during the period for revenue and expense accounts. Foreign currency translation adjustments resulting from such translations are included in shareholders’ equity. Intercompany transactions denominated in a currency other than the functional currency are remeasured into the functional currency. Gains and losses resulting from foreign currency transactions are included in other income (expense).
F-10
Recent Accounting Pronouncements
Recently Adopted Standards
In January 2009, the SEC issued Final Rule No. 33-9002, Interactive Data to Improve Financial Reporting, which will require the Company to submit financial statements in XBRL (extensible business reporting language) format with its SEC filings beginning June 30, 2011.
Reclassifications
Certain prior year amounts have been reclassified to conform to current year presentation, with no impact on previously reported shareholders’ equity or net income.
|
3.
|
LONG-TERM OBLIGATIONS
|
Long-Term Obligations
Long-term obligations consisted of the following at December 31, 2010 and 2009 (in thousands):
|
2010
|
2009
|
|||||||
|
Equipment notes, weighted average interest rate of 6.2%, payable in monthly installments
|
$ | 49 | $ | 241 | ||||
|
Less current portion
|
(44 | ) | (185 | ) | ||||
| $ | 5 | $ | 56 | |||||
Credit Facilities
Current Credit Facility. On April 6, 2010 we entered into a Loan Agreement with First Tennessee Bank National Association for a $20.0 million unsecured revolving credit facility (the “Current Credit Facility”). The Current Credit Facility contains customary representations and warranties, events of default, and financial, affirmative and negative covenants for loan agreements of this kind. Covenants under the Current Credit Facility restrict the payment of cash dividends if the Company would be in violation of the minimum tangible net worth test or the leverage ratio test in the current loan agreement as a result of the dividend, among various restrictions.
In the absence of a default, all borrowings under the Current Credit Facility bear interest at the LIBOR Rate plus 1.75% per annum. The Company will pay a non-usage fee under the current loan agreement at a rate per annum equal to between 0.15% and 0.35% of the unused amount of the Current Credit Facility, which fee shall be paid quarterly. The Current Credit Facility is scheduled to expire March 31, 2013.
Previous Credit Facility. On April 6, 2010, in connection with the consummation of the Current Credit Facility, the Company terminated its Credit Agreement (the “Previous Credit Agreement”) with Wachovia Bank, National Association, for a $27.0 million senior secured credit facility (the “Previous Credit Facility”). The Previous Credit Facility, as amended, consisted of a $20.0 million revolving credit facility, and a $7.0 million term loan. The Previous Credit Facility was secured by substantially all of the Company’s assets, and contained customary representations and warranties, events of default and affirmative and negative covenants for secured facilities of this type. Covenants under the Previous Credit Facility restricted the payment of cash dividends if a default or event of default under the Previous Credit Agreement had occurred or would result from the payment of dividends, or if the Company would be in violation of the consolidated fixed charge coverage ratio test in the Previous Credit Agreement as a result of the payment of dividends, among various other restrictions.
At December 31, 2010 and 2009, the Company had no outstanding borrowings under the Current Credit Facility or the Previous Credit Facility. In June 2009, the Company repaid the remaining outstanding balance under the Term Loan.
F-11
Interest Rate Sensitivity. Changes in interest rates affect the interest paid on indebtedness under our Current Credit Facility because the outstanding amounts of indebtedness under our Current Credit Facility are subject to variable interest rates. Under our Current Credit Facility, the non-default rate of interest is equal to the LIBOR Market Index Rate plus 1.75% per annum (for a rate of interest of 2.01% at December 31, 2010). A one percent change in the interest rate on our variable-rate debt would not have materially impacted our financial position, results of operations or cash flows for the year ended December 31, 2010.
Future maturities of long-term obligations at December 31, 2010 are as follows (in thousands):
|
2011
|
$ | 44 | ||
|
2012
|
5 | |||
| $ | 49 |
|
4.
|
STOCK-BASED COMPENSATION PLANS
|
In accordance with the Company’s stock-based compensation plans, the Company may grant incentive stock options as well as non-qualified and other stock-related incentives to officers, employees and non-employee directors of the Company. Options vest ratably over a two to four-year period beginning on the grant date and expire ten years from the date of grant. Shares available for granting options at December 31, 2010, 2009 and 2008 were 0.6 million.
A summary of the activity of stock options for the years ended December 31, 2010, 2009 and 2008, is presented below (shares in thousands):
|
2010
|
2009
|
2008
|
||||||||||||||||||||||
|
Shares Under Option
|
Weighted Average Exercise Price
|
Shares Under Option
|
Weighted Average Exercise Price
|
Shares Under Option
|
Weighted Average Exercise Price
|
|||||||||||||||||||
|
Outstanding at Beginning of Period
|
905 | $ | 5.83 | 930 | $ | 5.87 | 205 | $ | 15.24 | |||||||||||||||
|
Granted
|
— | — | — | — | 801 | 5.49 | ||||||||||||||||||
|
Exercised
|
(74 | ) | 5.99 | (19 | ) | 6.23 | — | — | ||||||||||||||||
|
Forfeited and cancelled
|
— | — | (6 | ) | 10.79 | (76 | ) | 27.05 | ||||||||||||||||
|
Outstanding at End of Period
|
831 | $ | 5.82 | 905 | $ | 5.83 | 930 | $ | 5.87 | |||||||||||||||
|
Options exercisable at year end
|
430 | $ | 6.13 | 304 | $ | 6.50 | 129 | $ | 8.25 | |||||||||||||||
|
Weighted average fair value of options granted
|
$ | — | $ | — | $ | 1.99 | ||||||||||||||||||
A summary of options outstanding under the Company’s stock-based compensation plans at December 31, 2010 is presented below (shares in thousands):
| Exercise Price Range |
Shares Under Option
|
Weighted Average Exercise Price of Options Outstanding
|
Weighted Average Remaining Life
|
Options Exercisable
|
Weighted Average Exercise Price of Shares Exercisable
|
|||||||||||||||||||||||||
| $ |
3.05
|
– | $ | 3.37 | 4 | $ | 3.05 | 0.9 | 4 | $ | 3.05 | |||||||||||||||||||
|
5.49
|
– | 8.24 | 727 | 5.49 | 7.8 | 326 | 5.49 | |||||||||||||||||||||||
|
8.31
|
– | 10.94 | 100 | 8.31 | 3.2 | 100 | 8.31 | |||||||||||||||||||||||
|
Total
|
831 | $ | 5.82 | 7.3 | 430 | $ | 6.13 | |||||||||||||||||||||||
|
5.
|
COMMITMENTS AND CONTINGENCIES
|
Commitments
The Company has entered into various operating leases for buildings, office equipment and trucks. Rental expense under these leases was $1,346,000, $1,331,000 and $1,402,000 in 2010, 2009 and 2008, respectively.
F-12
At December 31, 2010 future minimum lease payments under non-cancelable operating leases for the next five years and in the aggregate are as follows (in thousands):
|
2011
|
$ | 569 | ||
|
2012
|
392 | |||
|
2013
|
191 | |||
|
2014
|
92 | |||
|
2015
|
83 | |||
|
Thereafter
|
6 | |||
| $ | 1,333 |
The Company has also entered into arrangements with third-party lenders where it has agreed, in the event of a default by the customer, to repurchase from the third-party lender Company products repossessed from the customer. These arrangements are typically subject to a maximum repurchase amount. The Company’s risk under these arrangements is mitigated by the value of the products repurchased as part of the transaction. The maximum amount of collateral the Company could be required to purchase was approximately $13.2 million and $11.3 million at December 31, 2010 and 2009, respectively. No repurchases of products were required during 2010 or 2009.
Contingencies
The Company is, from time to time, a party to litigation arising in the normal course of its business. Litigation is subject to various inherent uncertainties, and it is possible that some of these matters could be resolved unfavorably to the Company, which could result in substantial damages against the Company. The Company has established accruals for matters that are probable and reasonably estimable and maintains product liability and other insurance that management believes to be adequate. Management believes that any liability that may ultimately result from the resolution of these matters in excess of available insurance coverage and accruals will not have a material adverse effect on the consolidated financial position or results of operations of the Company.
6. INCOME TAXES
Deferred tax assets and liabilities are determined based on the differences between the financial and tax basis of existing assets and liabilities using the currently enacted tax rates in effect for the year in which the differences are expected to reverse.
The provision for income taxes on income consisted of the following in 2010, 2009 and 2008, (in thousands):
|
2010
|
2009
|
2008
|
||||||||||
|
Current:
|
||||||||||||
|
Federal
|
$ | 300 | $ | — | $ | — | ||||||
|
State
|
634 | 235 | 49 | |||||||||
|
Foreign
|
641 | 1,963 | 1,461 | |||||||||
| 1,575 | 2,198 | 1,510 | ||||||||||
|
Deferred:
|
||||||||||||
|
Federal
|
5,874 | 1,444 | 700 | |||||||||
|
State
|
68 | 302 | — | |||||||||
|
Foreign
|
66 | (11 | ) | (28 | ) | |||||||
| 6,008 | 1,735 | 672 | ||||||||||
| $ | 7,583 | $ | 3,933 | $ | 2,182 | |||||||
The principal differences between the federal statutory tax rate and the income tax expense in 2010, 2009 and 2008:
|
2010
|
2009
|
2008
|
||||||||||
|
Federal statutory tax rate
|
34.4 | % | 34.3 | % | 35.0 | % | ||||||
|
State taxes, net of federal tax benefit
|
2.8 | % | 3.2 | % | 1.4 | % | ||||||
|
Excess of foreign tax over US tax on foreign income
|
0.8 | % | 0.5 | % | 2.5 | % | ||||||
|
Other
|
1.3 | % | 1.5 | % | (1.1 | )% | ||||||
|
Effective tax rate
|
39.3 | % | 39.5 | % | 37.8 | % | ||||||
F-13
Deferred income tax assets and liabilities reflect the impact of temporary differences between the amounts of assets and liabilities for financial reporting and income tax reporting purposes. Temporary differences and carry forwards which give rise to deferred tax assets and liabilities at December 31, 2010 and 2009 are as follows (in thousands):
|
2010
|
2009
|
|||||||
|
Deferred tax assets:
|
||||||||
|
Allowance for doubtful accounts
|
$ | 69 | $ | 147 | ||||
|
Accruals and reserves
|
3,287 | 2,130 | ||||||
|
Net operating loss carryforward
|
447 | 7,130 | ||||||
|
Deductible goodwill and impairment charges
|
— | 64 | ||||||
|
Other
|
1,415 | 985 | ||||||
|
Total deferred tax assets
|
5,218 | 10,456 | ||||||
|
Deferred tax liabilities:
|
||||||||
|
Property, plant, and equipment
|
1,978 | 1,209 | ||||||
|
Total deferred tax liabilities
|
1,978 | 1,209 | ||||||
|
Net deferred tax asset
|
$ | 3,240 | $ | 9,247 | ||||
As of December 31, 2010, the Company had federal net operating loss carryforwards of approximately $1.1 million which will expire between 2019 and 2026. The federal net operating loss carryforwards are comprised primarily of losses from advances to and investments in certain discontinued operations resulting from the RoadOne liquidation. In addition, the Company had an AMT credit carryforward of approximately $1.3 million, that may be carried forward indefinitely.
As of December 31, 2010, the Company has state net operating loss carryforwards of approximately $1.6 million.
At December 31, 2010 and 2009, the Company had no unrecognized tax positions. The Company does not expect its unrecognized tax positions to change significantly in the next twelve months. If unrecognized tax positions existed, the interest and penalties related to the unrecognized tax positions would be recorded as income tax expense in the consolidated statements of income.
The Company is subject to United States federal income taxes, as well as income taxes in various states and foreign jurisdictions. The Company’s tax years 2007 through 2009 remain open to examination for U.S. Federal income taxes. With few exceptions, the Company is no longer subject to state or non-U.S. income tax examinations prior to 2007.
|
7.
|
PREFERRED STOCK
|
The Company has authorized 5,000,000 shares of undesignated preferred stock which can be issued in one or more series. The terms, price and conditions of the preferred shares will be set by the board of directors. No shares have been issued.
|
8.
|
EMPLOYEE BENEFIT PLANS
|
The Company maintains a contributory retirement plan for all full-time employees with at least 90 days of service. The plan is designed to provide tax-deferred income to the Company’s employees in accordance with the provisions of Section 401(k) of the Internal Revenue Code.
The plan provides that each participant may contribute the maximum allowable under Internal Revenue Service regulations. For 2010, 2009 and 2008, the Company matched 50% of the first 5% of participant contributions. Matching contributions vest over the first five years of employment. Company contributions to the plan were $344,000, $314,000 and $430,000 in 2010, 2009 and 2008, respectively.
F-14
9. GEOGRAPHIC AND CUSTOMER INFORMATION
Net sales and long-lived assets (property, plant and equipment and goodwill and intangible assets) by region were as follows (net sales are attributed to regions based on the locations of customers) (in thousands):
|
2010
|
2009
|
2008
|
||||||||||||||||||||||
|
Net Sales
|
Long-Lived Assets
|
Net Sales
|
Long-Lived Assets
|
Net Sales
|
Long-Lived Assets
|
|||||||||||||||||||
|
North America
|
$ | 257,740 | $ | 42,838 | $ | 180,722 | $ | 40,896 | $ | 191,355 | $ | 43,472 | ||||||||||||
|
Foreign
|
49,157 | 2,594 | 56,845 | 2,926 | 79,634 | 2,904 | ||||||||||||||||||
| $ | 306,897 | $ | 45,432 | $ | 237,567 | $ | 43,822 | $ | 270,989 | $ | 46,376 | |||||||||||||
The Company’s largest customer accounted for 19.6% of consolidated sales for 2010 and 19.4% of consolidated sales for 2009. At December 31, 2010 and 2009, the Company’s largest customer represented 22.0% and 16.5%, respectively, of accounts receivable. No single customer accounted for 10% or more of consolidated net sales in 2008.
|
10.
|
QUARTERLY FINANCIAL INFORMATION (UNAUDITED)
|
The following is a summary of the unaudited quarterly financial information for the years ended December 31, 2010 and 2009 (in thousands, except per share data):
|
Net Sales
|
Operating Income
|
Net
Income
|
Basic Income Per Share
|
Diluted
Income Per Share |
||||||||||||||||
|
2010
|
||||||||||||||||||||
|
First Quarter
|
$ | 72,295 | $ | 3,351 | $ | 2,008 | $ | 0.17 | $ | 0.17 | ||||||||||
|
Second Quarter
|
81,256 | 5,345 | 3,157 | 0.27 | 0.26 | |||||||||||||||
|
Third Quarter
|
73,664 | 4,912 | 2,924 | 0.25 | 0.24 | |||||||||||||||
|
Fourth Quarter
|
79,682 | 6,058 | 3,618 | 0.31 | 0.29 | |||||||||||||||
|
Total
|
$ | 306,897 | $ | 19,666 | $ | 11,707 | $ | 1.00 | $ | 0.96 | ||||||||||
|
2009
|
||||||||||||||||||||
|
First Quarter
|
$ | 58,756 | $ | 1,965 | $ | 913 | $ | 0.08 | $ | 0.08 | ||||||||||
|
Second Quarter
|
54,255 | 2,248 | 1,386 | 0.12 | 0.12 | |||||||||||||||
|
Third Quarter
|
57,547 | 2,898 | 1,700 | 0.15 | 0.14 | |||||||||||||||
|
Fourth Quarter
|
67,009 | 3,279 | 2,017 | 0.17 | 0.17 | |||||||||||||||
|
Total
|
$ | 237,567 | $ | 10,390 | $ | 6,016 | $ | 0.52 | $ | 0.51 | ||||||||||
11. SUBSEQUENT EVENT
On March 7, 2011, the Company’s board of directors declared an annual cash dividend of $0.12 per share. The dividend is payable March 24, 2011 to shareholders of record as of March 17, 2011.
F-15
MILLER INDUSTRIES, INC. AND SUBSIDIARIES
SCHEDULE II –VALUATION AND QUALIFYING ACCOUNTS
|
Balance at Beginning of Period
|
Charged to Expense
|
Accounts Written Off
|
Balance at End of Period
|
|||||||||||||
|
(In Thousands)
|
||||||||||||||||
|
Year ended December 31, 2008
|
||||||||||||||||
|
Deduction from asset accounts:
|
||||||||||||||||
|
Allowance for doubtful accounts
|
$ | 1,640 | 634 | (393 | ) | $ | 1,881 | |||||||||
|
Year ended December 31, 2009
|
||||||||||||||||
|
Deduction from asset accounts:
|
||||||||||||||||
|
Allowance for doubtful accounts
|
$ | 1,881 | 714 | (505 | ) | $ | 2,090 | |||||||||
|
Year ended December 31, 2010
|
||||||||||||||||
|
Deduction from asset accounts:
|
||||||||||||||||
|
Allowance for doubtful accounts
|
$ | 2,090 | 220 | (467 | ) | $ | 1,843 | |||||||||
S-1
SIGNATURES
Pursuant to the requirements of Section 13 or 15(d) of the Securities Exchange Act of 1934, the Registrant has duly caused this Report to be signed on its behalf by the undersigned, thereunto duly authorized, on the 8th day of March, 2011.
| MILLER INDUSTRIES, INC. | |||
|
|
By:
|
/s/ Jeffrey I. Badgley | |
| Jeffrey I. Badgley | |||
| President, Co-Chief Executive Officer and Director | |||
Know all men by these presents, that each person whose signature appears below constitutes and appoints Jeffrey I. Badgley as attorney-in-fact, with power of substitution, for him in any and all capacities, to sign any amendments to this Report on Form 10-K, and to file the same, with exhibits thereto, and other documents in connection therewith, with the Securities and Exchange Commission, hereby ratifying and confirming all that said attorney-in-fact may do or cause to be done by virtue hereof.
Pursuant to the requirements of the Securities Exchange Act of 1934, this Report has been signed below by the following persons on behalf of the Registrant in the capacities indicated on the 8th day of March, 2011.
|
Signature
|
Title
|
|
/s/ William G. Miller
|
Chairman of the Board of Directors and Co-Chief Executive Officer
|
||
|
William G. Miller
|
|||
|
/s/ Jeffrey I. Badgley
|
President, Co-Chief Executive Officer and Director
|
||
| Jeffrey I. Badgley | |||
|
/s/ J. Vincent Mish
|
Executive Vice President, Treasurer and Chief Financial Officer (Principal Financial and Accounting Officer)
|
||
| J. Vincent Mish | |||
|
/s/ Theodore H. Ashford, III
|
Director
|
||
|
Theodore H. Ashford, III
|
|||
|
/s/ A. Russell Chandler, III
|
Director
|
||
|
A. Russell Chandler, III
|
|||
|
/s/ Paul E. Drack
|
Director
|
||
|
Paul E. Drack
|
|||
|
/s/ Richard H. Roberts
|
Director
|
||
|
Richard H. Roberts
|
EXHIBIT INDEX
|
Exhibit Number
|
Description
|
|
|
21
|
Subsidiaries of the Registrant
|
|
|
23.1
|
Consent of Joseph Decosimo and Company, PLLC
|
|
|
24
|
Power of Attorney (see signature page)
|
|
|
31.1
|
Certification Pursuant to Rules 13a-14(a)/15d-14(a) by Co-Chief Executive Officer
|
|
|
31.2
|
Certification Pursuant to Rules 13a-14(a)/15d-14(a) by Co-Chief Executive Officer
|
|
|
31.3
|
Certification Pursuant to Rules 13a-14(a)/15d-14(a) by Chief Financial Officer
|
|
|
32.1
|
Certification Pursuant to Section 1350 of Chapter 63 of Title 18 of United States Code by Co-Chief Executive Officer
|
|
|
32.2
|
Certification Pursuant to Section 1350 of Chapter 63 of Title 18 of United States Code by Co-Chief Executive Officer
|
|
|
32.3
|
Certification Pursuant to Section 1350 of Chapter 63 of Title 18 of United States Code by Chief Financial Officer
|