Attached files
| file | filename |
|---|---|
| 8-K - 8-K - CARDINAL FINANCIAL CORP | a11-7386_18k.htm |
Exhibit 99.1
|
|
Cardinal Financial Corporation Spring 2011 |

|
|
Forward-Looking Statements Statements contained in this presentation which are not historical facts are forward-looking statements as that item is defined in the Private Securities Litigation Reform Act of 1995. Such forward-looking statements are subject to risks and uncertainties, which could cause actual results to differ materially from estimated results. For an explanation of the risks and uncertainties associated with forward-looking statements, please refer to the Company’s Annual Report on Form 10-K for the year ended December 31, 2009 and other reports filed and furnished to the Securities and Exchange Commission. |
|
|
Cardinal Financial Corporation Our Philosophy |

|
|
Our Operating Philosophy Aggressive on Sales, CONSERVATIVE ON RISK 4 |

|
|
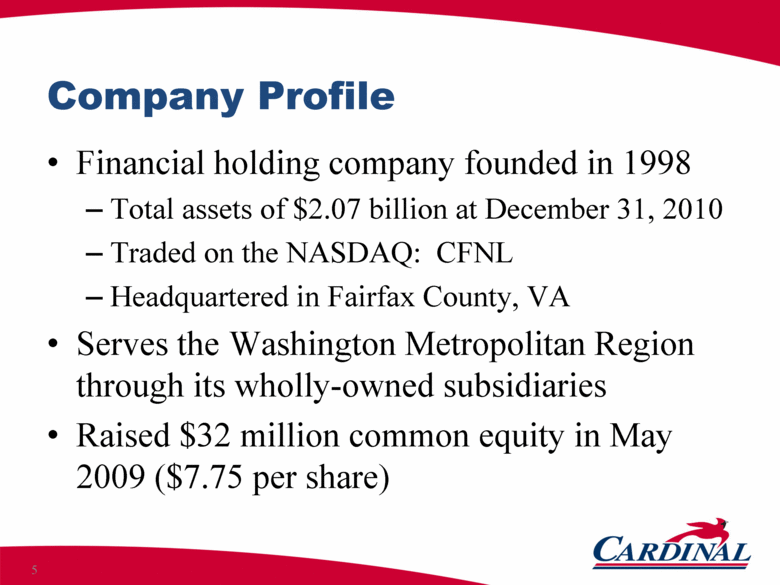
Company Profile Financial holding company founded in 1998 Total assets of $2.07 billion at December 31, 2010 Traded on the NASDAQ: CFNL Headquartered in Fairfax County, VA Serves the Washington Metropolitan Region through its wholly-owned subsidiaries Raised $32 million common equity in May 2009 ($7.75 per share) 5 |
|
|
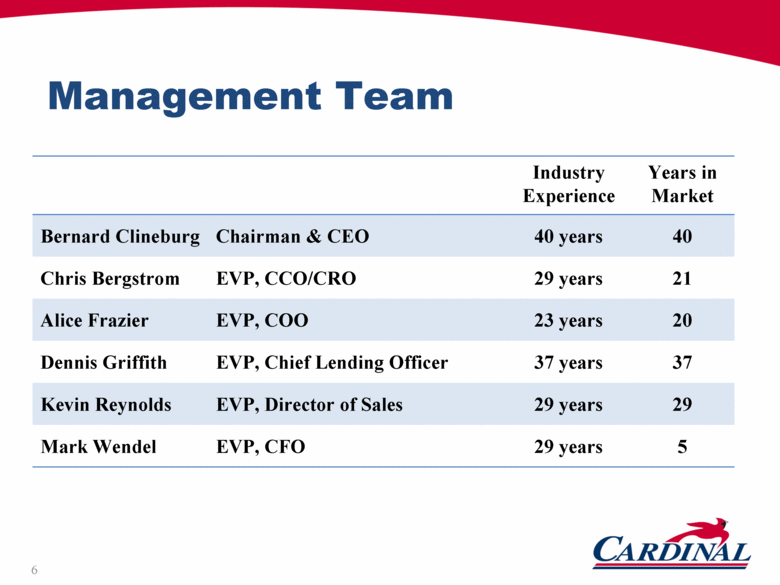
Management Team Industry Experience Years in Market Bernard Clineburg Chairman & CEO 40 years 40 Chris Bergstrom EVP, CCO/CRO 29 years 21 Alice Frazier EVP, COO 23 years 20 Dennis Griffith EVP, Chief Lending Officer 37 years 37 Kevin Reynolds EVP, Director of Sales 29 years 29 Mark Wendel EVP, CFO 29 years 5 6 |
|
|
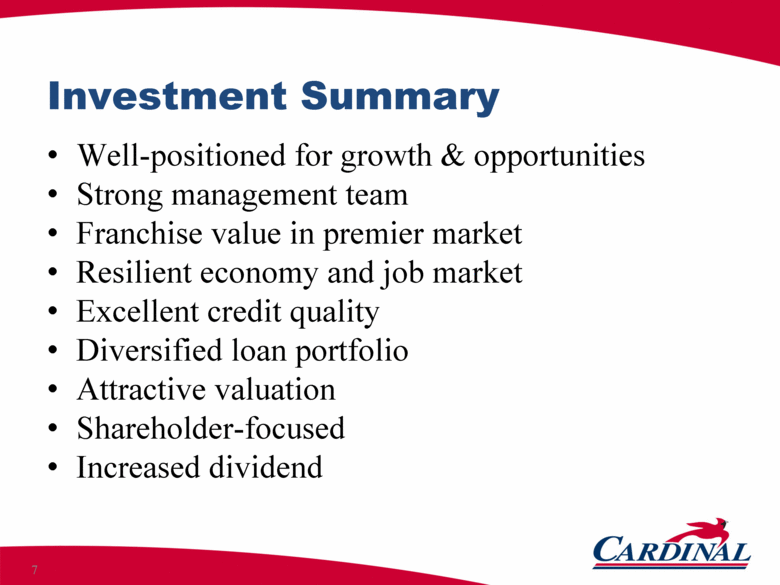
Investment Summary Well-positioned for growth & opportunities Strong management team Franchise value in premier market Resilient economy and job market Excellent credit quality Diversified loan portfolio Attractive valuation Shareholder-focused Increased dividend 7 |
|
|
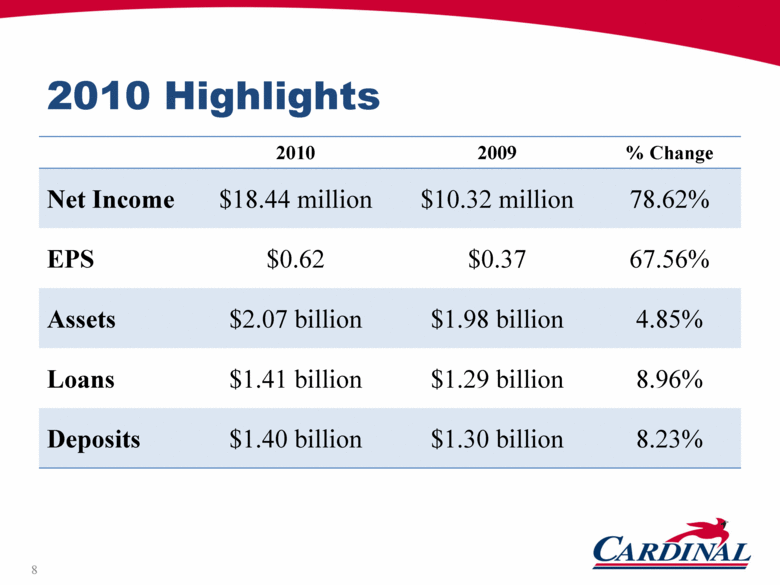
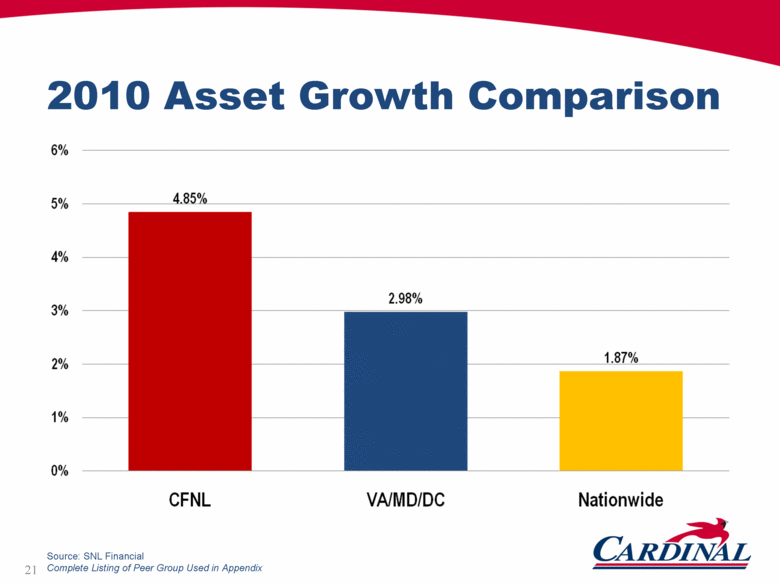
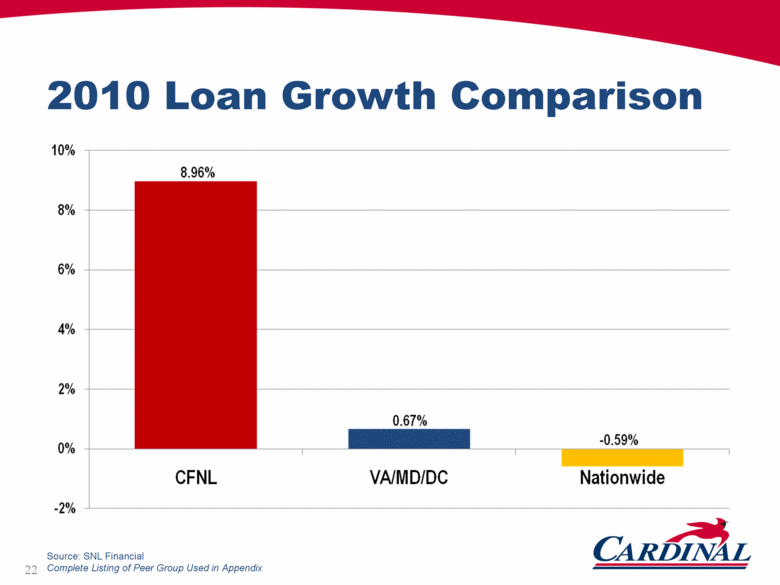
2010 Highlights 2010 2009 % Change Net Income $18.44 million $10.32 million 78.62% EPS $0.62 $0.37 67.56% Assets $2.07 billion $1.98 billion 4.85% Loans $1.41 billion $1.29 billion 8.96% Deposits $1.40 billion $1.30 billion 8.23% 8 |
|
|
Public Recognition 2010 Business of the Year 9 |

|
|
Cardinal Financial Corporation Our Market |

|
|
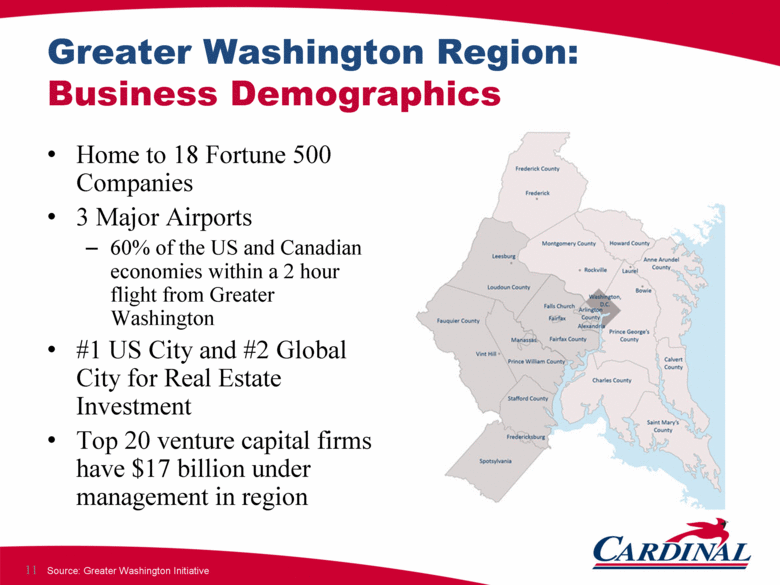
Greater Washington Region: Business Demographics Home to 18 Fortune 500 Companies 3 Major Airports 60% of the US and Canadian economies within a 2 hour flight from Greater Washington #1 US City and #2 Global City for Real Estate Investment Top 20 venture capital firms have $17 billion under management in region Source: Greater Washington Initiative 11 |
|
|
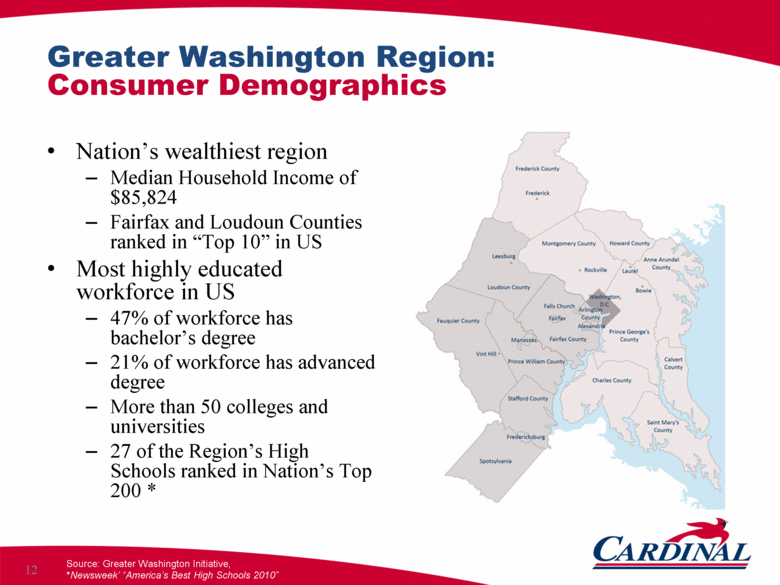
Nation’s wealthiest region Median Household Income of $85,824 Fairfax and Loudoun Counties ranked in “Top 10” in US Most highly educated workforce in US 47% of workforce has bachelor’s degree 21% of workforce has advanced degree More than 50 colleges and universities 27 of the Region’s High Schools ranked in Nation’s Top 200 * Source: Greater Washington Initiative, *Newsweek’ “America’s Best High Schools 2010” Greater Washington Region: Consumer Demographics 12 |
|
|
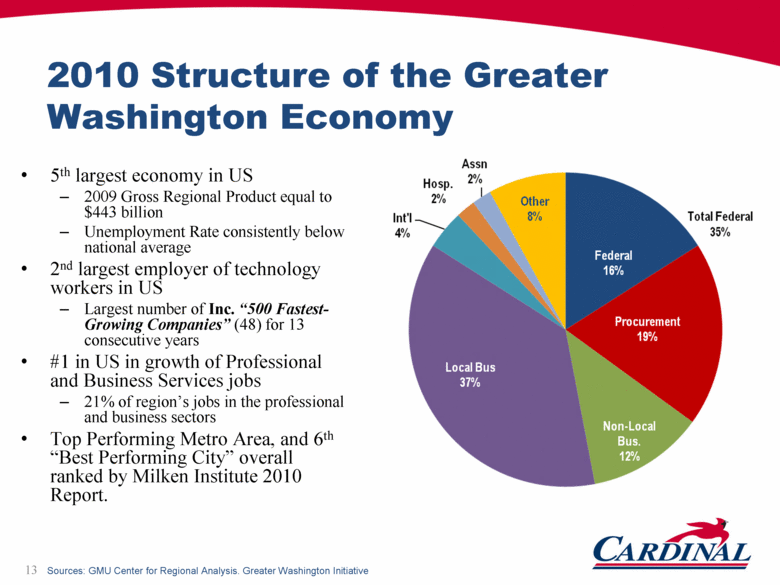
2010 Structure of the Greater Washington Economy 5th largest economy in US 2009 Gross Regional Product equal to $443 billion Unemployment Rate consistently below national average 2nd largest employer of technology workers in US Largest number of Inc. “500 Fastest-Growing Companies” (48) for 13 consecutive years #1 in US in growth of Professional and Business Services jobs 21% of region’s jobs in the professional and business sectors Top Performing Metro Area, and 6th “Best Performing City” overall ranked by Milken Institute 2010 Report. Sources: GMU Center for Regional Analysis. Greater Washington Initiative 13 |
|
|
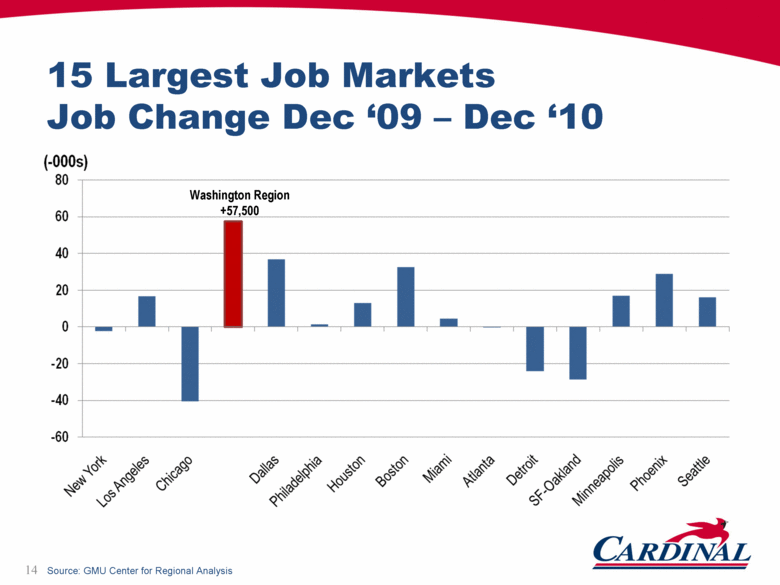
15 Largest Job Markets Job Change Dec ‘09 – Dec ‘10 Washington Region +57,500 Source: GMU Center for Regional Analysis 14 |
|
|
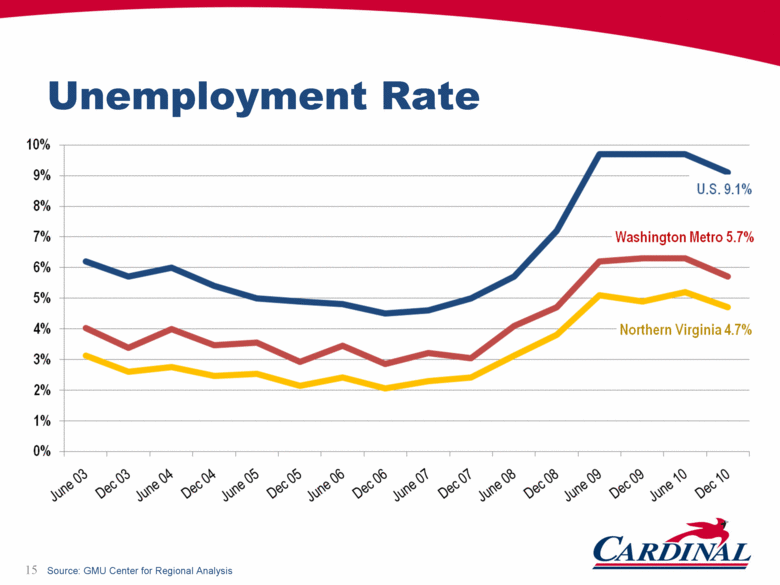
Unemployment Rate Source: GMU Center for Regional Analysis 15 |
|
|
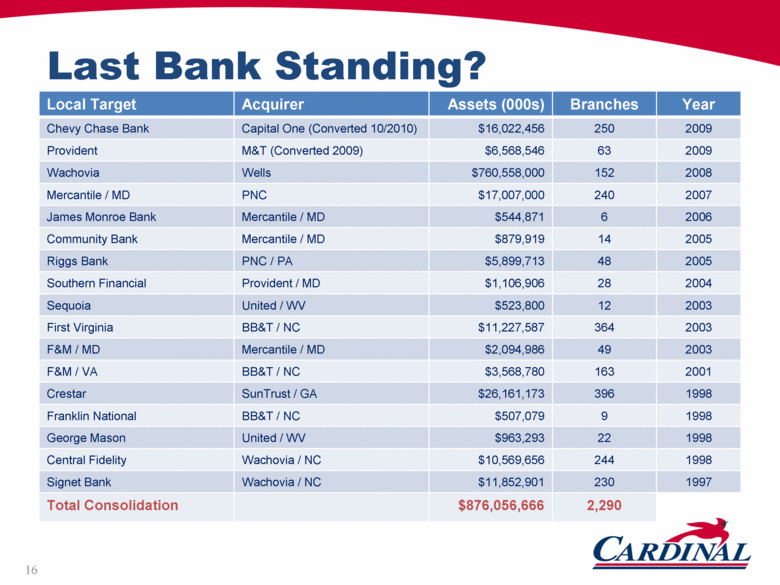
Local Target Acquirer Assets (000s) Branches Year Chevy Chase Bank Capital One (Converted 10/2010) $16,022,456 250 2009 Provident M&T (Converted 2009) $6,568,546 63 2009 Wachovia Wells $760,558,000 152 2008 Mercantile / MD PNC $17,007,000 240 2007 James Monroe Bank Mercantile / MD $544,871 6 2006 Community Bank Mercantile / MD $879,919 14 2005 Riggs Bank PNC / PA $5,899,713 48 2005 Southern Financial Provident / MD $1,106,906 28 2004 Sequoia United / WV $523,800 12 2003 First Virginia BB&T / NC $11,227,587 364 2003 F&M / MD Mercantile / MD $2,094,986 49 2003 F&M / VA BB&T / NC $3,568,780 163 2001 Crestar SunTrust / GA $26,161,173 396 1998 Franklin National BB&T / NC $507,079 9 1998 George Mason United / WV $963,293 22 1998 Central Fidelity Wachovia / NC $10,569,656 244 1998 Signet Bank Wachovia / NC $11,852,901 230 1997 Total Consolidation $876,056,666 2,290 Last Bank Standing? 16 |
|
|
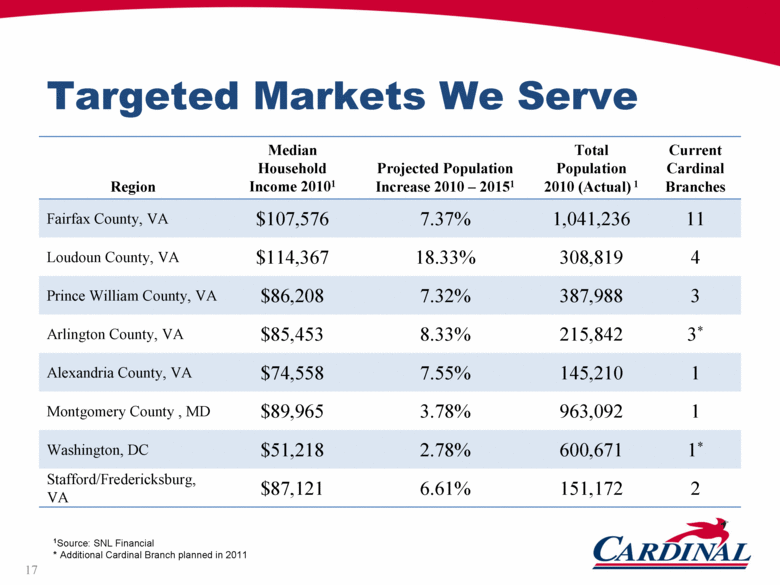
Targeted Markets We Serve Region Median Household Income 20101 Projected Population Increase 2010 – 20151 Total Population 2010 (Actual) 1 Current Cardinal Branches Fairfax County, VA $107,576 7.37% 1,041,236 11 Loudoun County, VA $114,367 18.33% 308,819 4 Prince William County, VA $86,208 7.32% 387,988 3 Arlington County, VA $85,453 8.33% 215,842 3* Alexandria County, VA $74,558 7.55% 145,210 1 Montgomery County , MD $89,965 3.78% 963,092 1 Washington, DC $51,218 2.78% 600,671 1* Stafford/Fredericksburg, VA $87,121 6.61% 151,172 2 1Source: SNL Financial * Additional Cardinal Branch planned in 2011 17 |
|
|
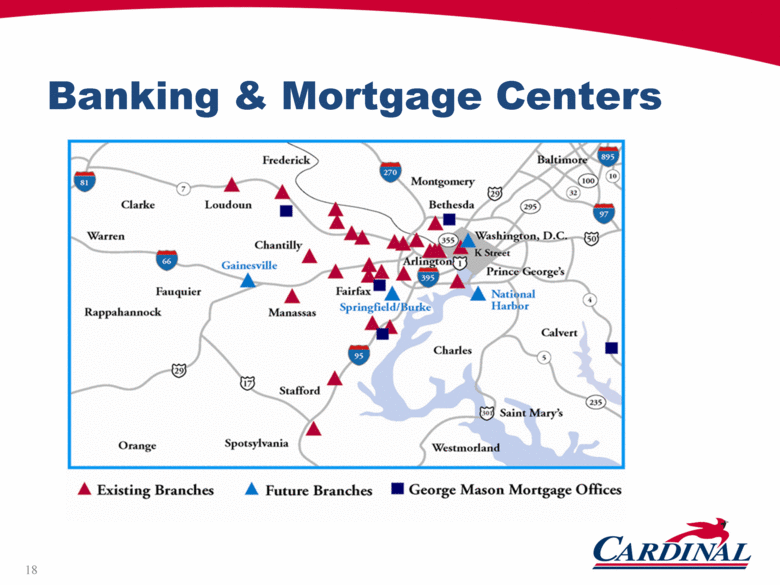
Banking & Mortgage Centers 18 |
|
|
Cardinal Financial Corporation Product Mix Customer Profile Credit Quality |
|
|
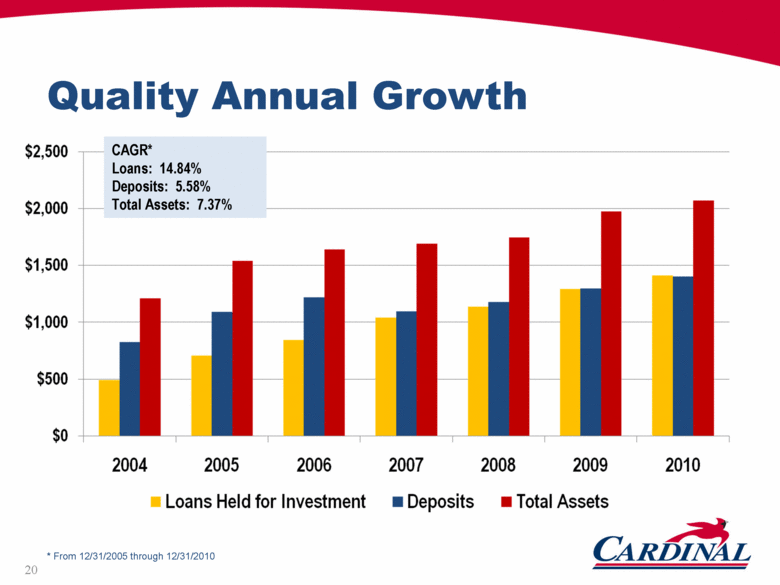
Quality Annual Growth CAGR* Loans: 14.84% Deposits: 5.58% Total Assets: 7.37% * From 12/31/2005 through 12/31/2010 20 |
|
|
2010 Asset Growth Comparison Source: SNL Financial Complete Listing of Peer Group Used in Appendix 21 |
|
|
2010 Loan Growth Comparison Source: SNL Financial Complete Listing of Peer Group Used in Appendix 22 |
|
|
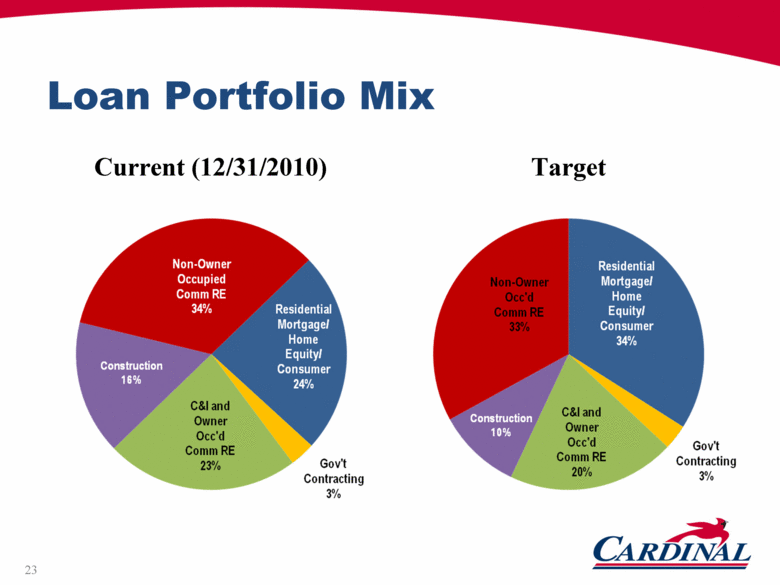
Loan Portfolio Mix Current (12/31/2010) Target 23 |
|
|
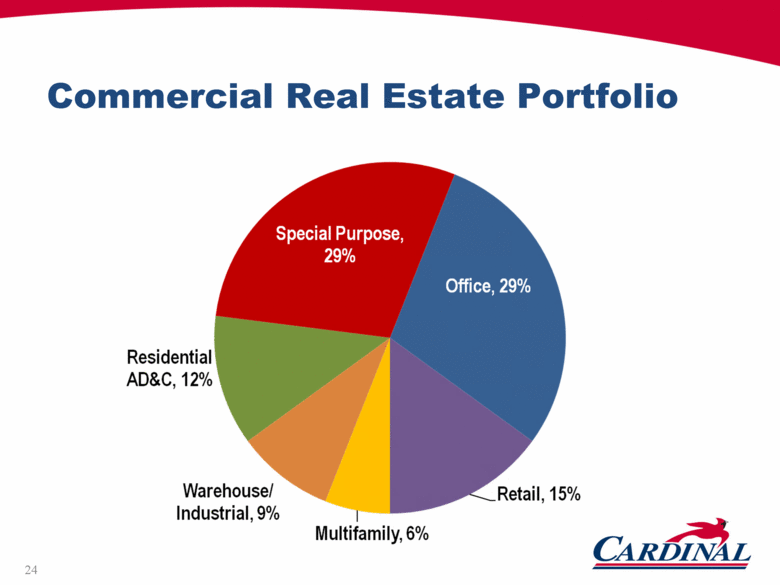
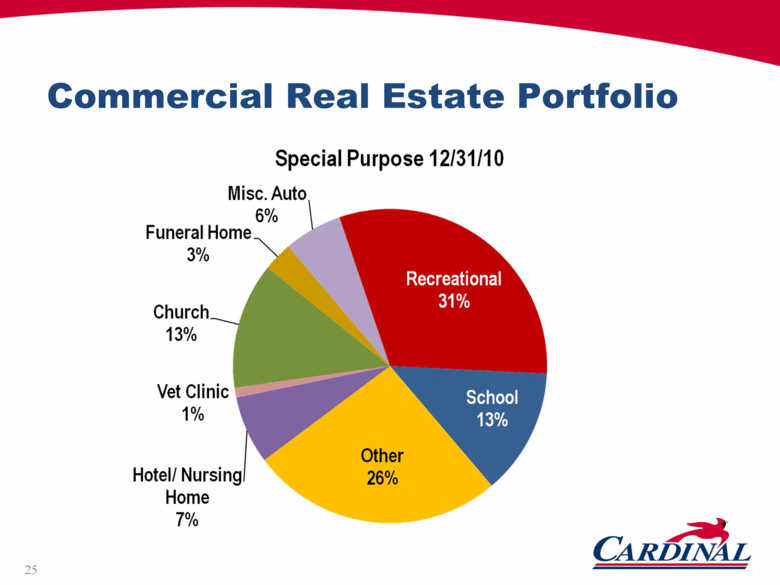
Commercial Real Estate Portfolio 24 |
|
|
Commercial Real Estate Portfolio 25 |
|
|
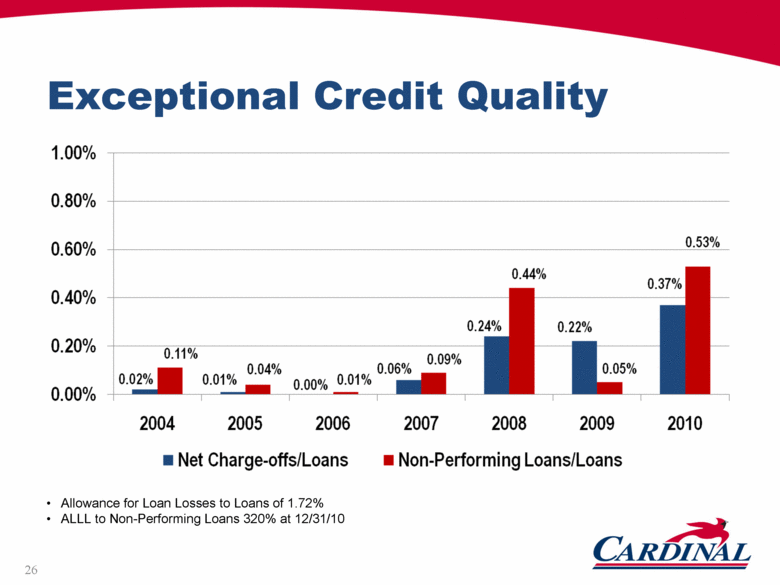
Exceptional Credit Quality Allowance for Loan Losses to Loans of 1.72% ALLL to Non-Performing Loans 320% at 12/31/10 26 |
|
|
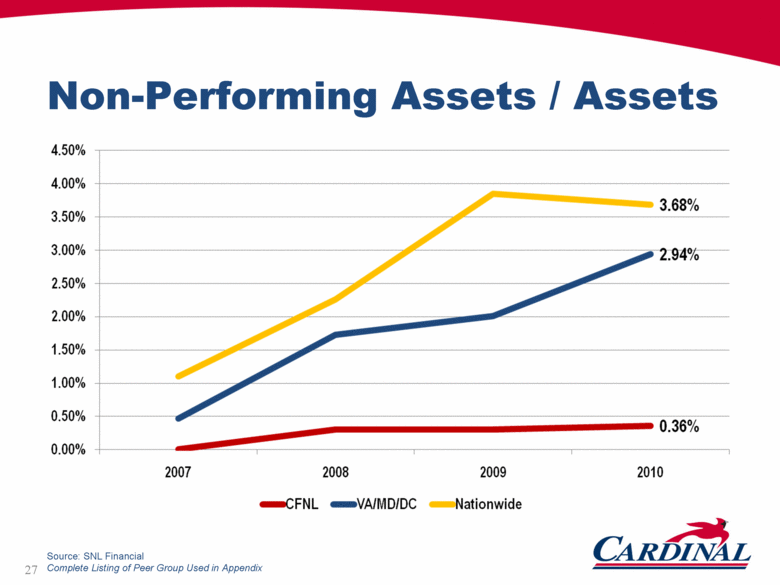
Non-Performing Assets / Assets Source: SNL Financial Complete Listing of Peer Group Used in Appendix 27 |
|
|
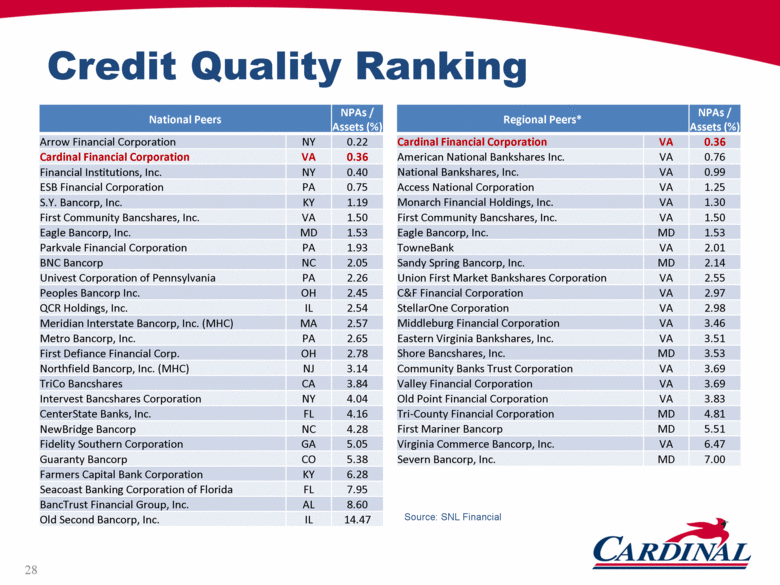
Credit Quality Ranking National Peers NPAs / Assets (%) Arrow Financial Corporation NY 0.22 Cardinal Financial Corporation VA 0.36 Financial Institutions, Inc. NY 0.40 ESB Financial Corporation PA 0.75 S.Y. Bancorp, Inc. KY 1.19 First Community Bancshares, Inc. VA 1.50 Eagle Bancorp, Inc. MD 1.53 Parkvale Financial Corporation PA 1.93 BNC Bancorp NC 2.05 Univest Corporation of Pennsylvania PA 2.26 Peoples Bancorp Inc. OH 2.45 QCR Holdings, Inc. IL 2.54 Meridian Interstate Bancorp, Inc. (MHC) MA 2.57 Metro Bancorp, Inc. PA 2.65 First Defiance Financial Corp. OH 2.78 Northfield Bancorp, Inc. (MHC) NJ 3.14 TriCo Bancshares CA 3.84 Intervest Bancshares Corporation NY 4.04 CenterState Banks, Inc. FL 4.16 NewBridge Bancorp NC 4.28 Fidelity Southern Corporation GA 5.05 Guaranty Bancorp CO 5.38 Farmers Capital Bank Corporation KY 6.28 Seacoast Banking Corporation of Florida FL 7.95 BancTrust Financial Group, Inc. AL 8.60 Old Second Bancorp, Inc. IL 14.47 Regional Peers* NPAs / Assets (%) Cardinal Financial Corporation VA 0.36 American National Bankshares Inc. VA 0.76 National Bankshares, Inc. VA 0.99 Access National Corporation VA 1.25 Monarch Financial Holdings, Inc. VA 1.30 First Community Bancshares, Inc. VA 1.50 Eagle Bancorp, Inc. MD 1.53 TowneBank VA 2.01 Sandy Spring Bancorp, Inc. MD 2.14 Union First Market Bankshares Corporation VA 2.55 C&F Financial Corporation VA 2.97 StellarOne Corporation VA 2.98 Middleburg Financial Corporation VA 3.46 Eastern Virginia Bankshares, Inc. VA 3.51 Shore Bancshares, Inc. MD 3.53 Community Banks Trust Corporation VA 3.69 Valley Financial Corporation VA 3.69 Old Point Financial Corporation VA 3.83 Tri-County Financial Corporation MD 4.81 First Mariner Bancorp MD 5.51 Virginia Commerce Bancorp, Inc. VA 6.47 Severn Bancorp, Inc. MD 7.00 Source: SNL Financial 28 |
|
|
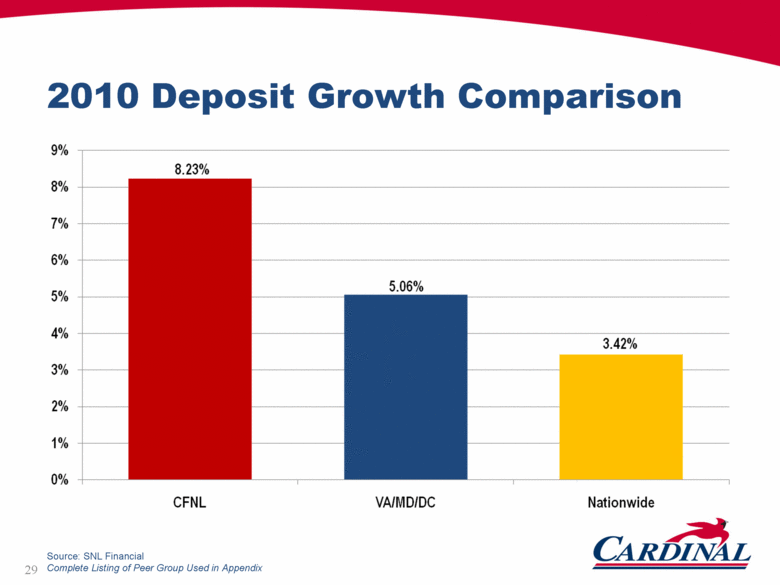
2010 Deposit Growth Comparison Source: SNL Financial Complete Listing of Peer Group Used in Appendix 29 |
|
|
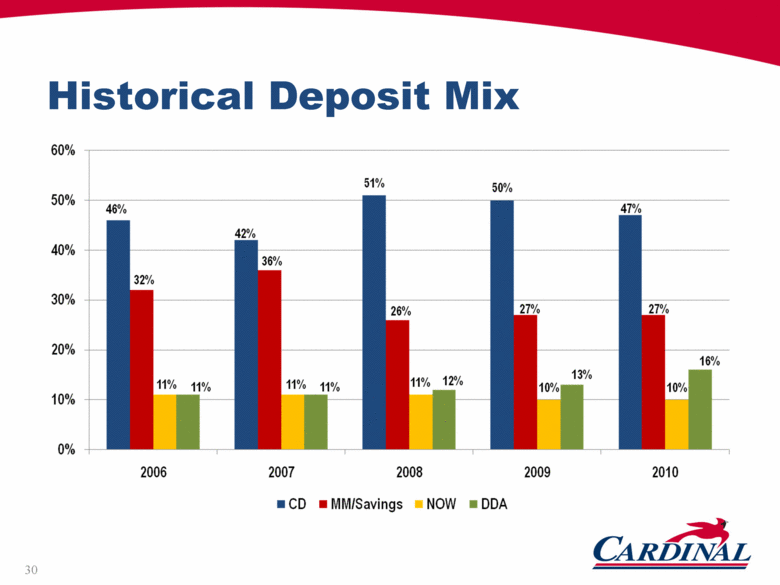
Historical Deposit Mix 30 |
|
|
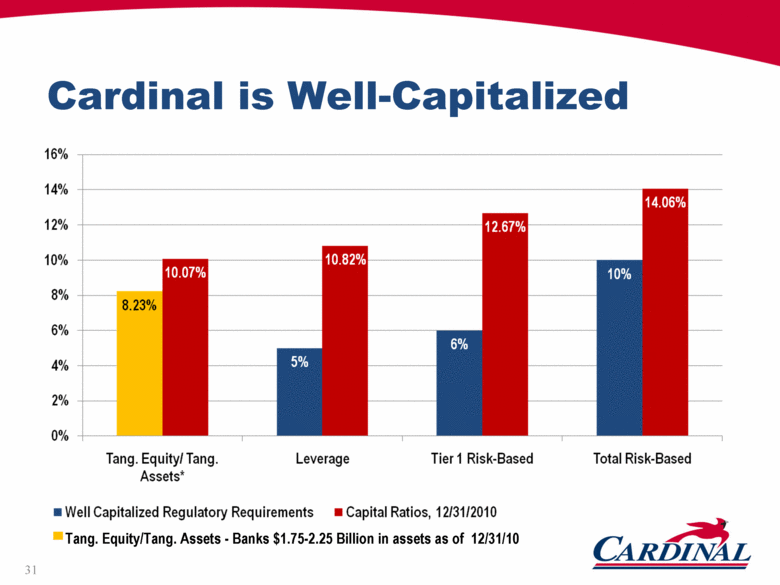
Cardinal is Well-Capitalized Tang. Equity/Tang. Assets - Banks $1.75-2.25 Billion in assets as of 12/31/10 31 |
|
|
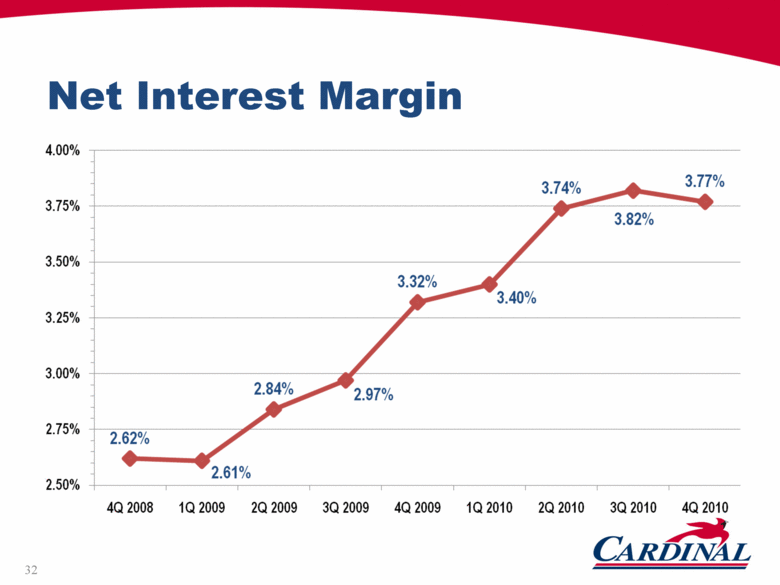
Net Interest Margin 32 |
|
|
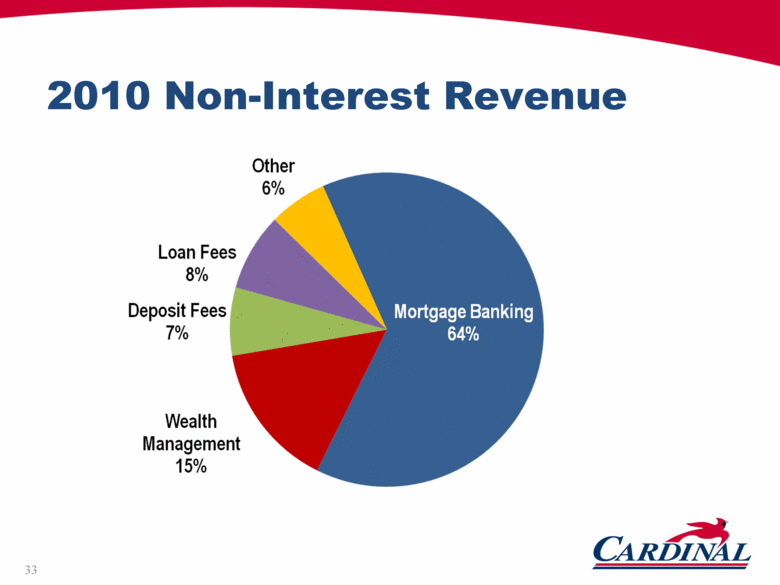
2010 Non-Interest Revenue 33 |
|
|
Cardinal Financial Corporation 2011 Initiatives: Profitability Growth Acquisition |
|
|
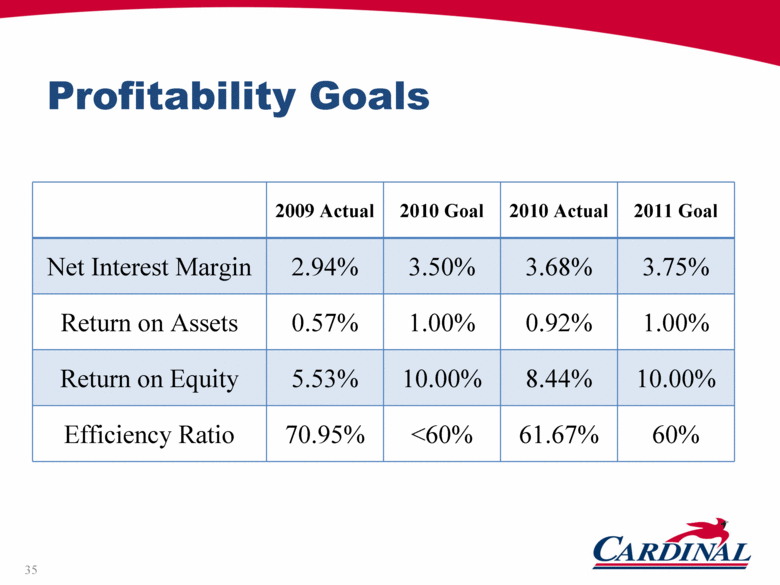
Profitability Goals 2009 Actual 2010 Goal 2010 Actual 2011 Goal Net Interest Margin 2.94% 3.50% 3.68% 3.75% Return on Assets 0.57% 1.00% 0.92% 1.00% Return on Equity 5.53% 10.00% 8.44% 10.00% Efficiency Ratio 70.95% <60% 61.67% 60% 35 |
|
|
Organic Growth Strategy Capitalize on current market conditions and bank consolidation Penetrate our existing markets and further improve our branch positioning, expansion in key markets Implement expanded e-Commerce Strategy Increase targeted customer cross-sell Continue to recruit experienced bankers 36 |
|
|
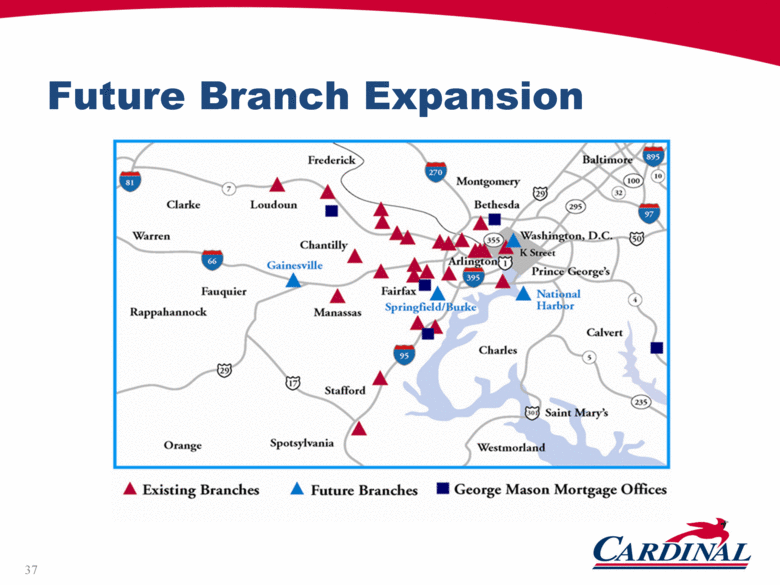
Future Branch Expansion 37 |
|
|
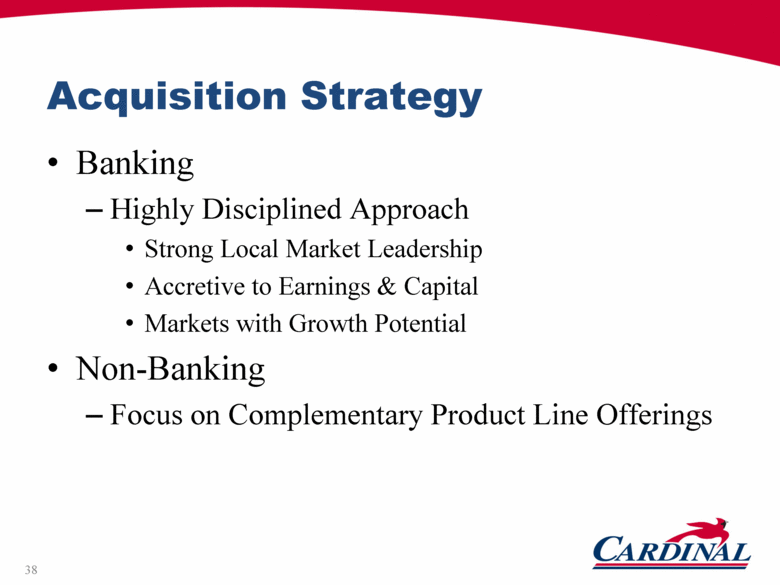
Acquisition Strategy Banking Highly Disciplined Approach Strong Local Market Leadership Accretive to Earnings & Capital Markets with Growth Potential Non-Banking Focus on Complementary Product Line Offerings 38 |
|
|
Cardinal Financial Corporation Stock Valuation |

|
|
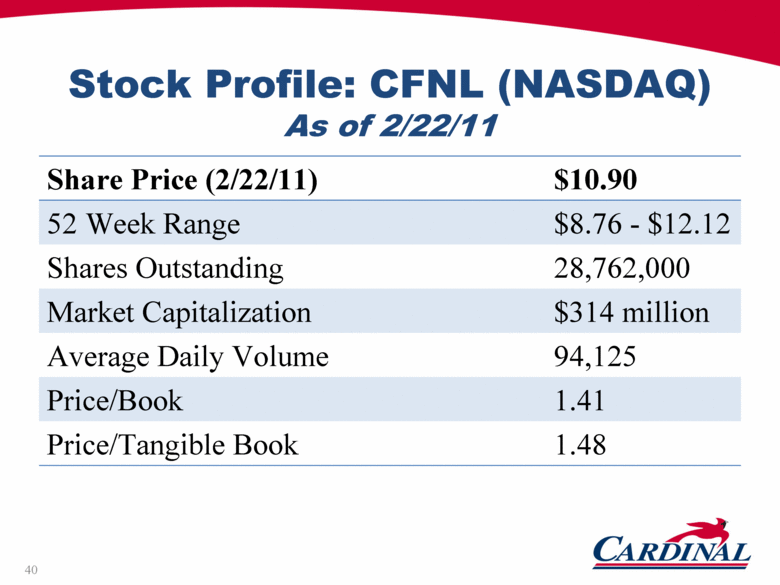
Stock Profile: CFNL (NASDAQ) As of 2/22/11 Share Price (2/22/11) $10.90 52 Week Range $8.76 - $12.12 Shares Outstanding 28,762,000 Market Capitalization $314 million Average Daily Volume 94,125 Price/Book 1.41 Price/Tangible Book 1.48 40 |
|
|
Cardinal Financial Corporation Spring 2011 |
|
|
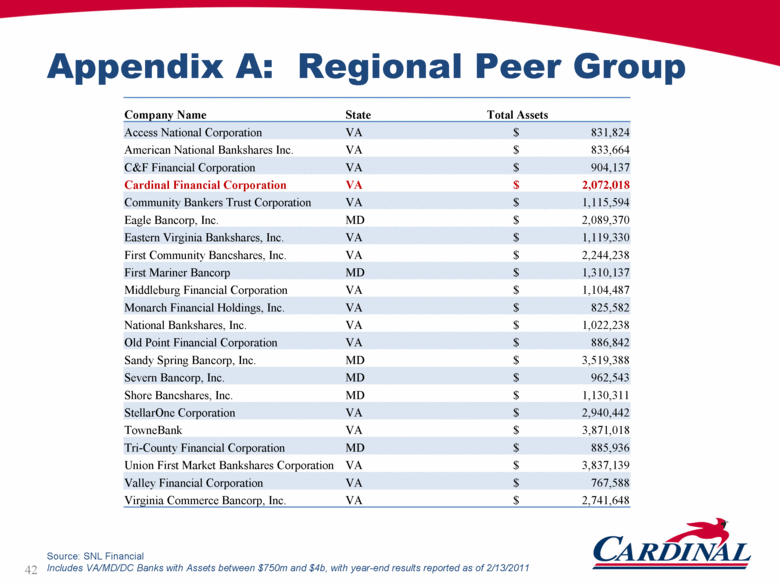
Appendix A: Regional Peer Group Company Name State Total Assets Access National Corporation VA $ 831,824 American National Bankshares Inc. VA $ 833,664 C&F Financial Corporation VA $ 904,137 Cardinal Financial Corporation VA $ 2,072,018 Community Bankers Trust Corporation VA $ 1,115,594 Eagle Bancorp, Inc. MD $ 2,089,370 Eastern Virginia Bankshares, Inc. VA $ 1,119,330 First Community Bancshares, Inc. VA $ 2,244,238 First Mariner Bancorp MD $ 1,310,137 Middleburg Financial Corporation VA $ 1,104,487 Monarch Financial Holdings, Inc. VA $ 825,582 National Bankshares, Inc. VA $ 1,022,238 Old Point Financial Corporation VA $ 886,842 Sandy Spring Bancorp, Inc. MD $ 3,519,388 Severn Bancorp, Inc. MD $ 962,543 Shore Bancshares, Inc. MD $ 1,130,311 StellarOne Corporation VA $ 2,940,442 TowneBank VA $ 3,871,018 Tri-County Financial Corporation MD $ 885,936 Union First Market Bankshares Corporation VA $ 3,837,139 Valley Financial Corporation VA $ 767,588 Virginia Commerce Bancorp, Inc. VA $ 2,741,648 Source: SNL Financial Includes VA/MD/DC Banks with Assets between $750m and $4b, with year-end results reported as of 2/13/2011 42 |
|
|
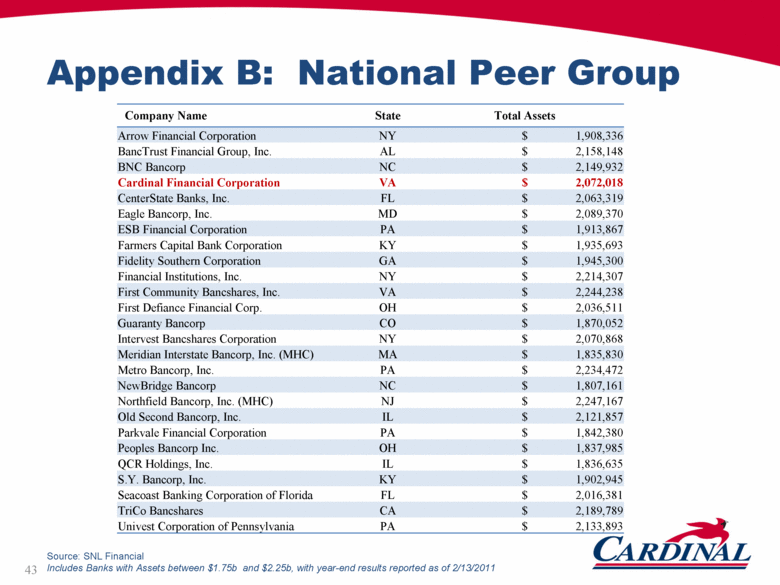
Appendix B: National Peer Group Company Name State Total Assets Arrow Financial Corporation NY $ 1,908,336 BancTrust Financial Group, Inc. AL $ 2,158,148 BNC Bancorp NC $ 2,149,932 Cardinal Financial Corporation VA $ 2,072,018 CenterState Banks, Inc. FL $ 2,063,319 Eagle Bancorp, Inc. MD $ 2,089,370 ESB Financial Corporation PA $ 1,913,867 Farmers Capital Bank Corporation KY $ 1,935,693 Fidelity Southern Corporation GA $ 1,945,300 Financial Institutions, Inc. NY $ 2,214,307 First Community Bancshares, Inc. VA $ 2,244,238 First Defiance Financial Corp. OH $ 2,036,511 Guaranty Bancorp CO $ 1,870,052 Intervest Bancshares Corporation NY $ 2,070,868 Meridian Interstate Bancorp, Inc. (MHC) MA $ 1,835,830 Metro Bancorp, Inc. PA $ 2,234,472 NewBridge Bancorp NC $ 1,807,161 Northfield Bancorp, Inc. (MHC) NJ $ 2,247,167 Old Second Bancorp, Inc. IL $ 2,121,857 Parkvale Financial Corporation PA $ 1,842,380 Peoples Bancorp Inc. OH $ 1,837,985 QCR Holdings, Inc. IL $ 1,836,635 S.Y. Bancorp, Inc. KY $ 1,902,945 Seacoast Banking Corporation of Florida FL $ 2,016,381 TriCo Bancshares CA $ 2,189,789 Univest Corporation of Pennsylvania PA $ 2,133,893 Source: SNL Financial Includes Banks with Assets between $1.75b and $2.25b, with year-end results reported as of 2/13/2011 43 |