Attached files
| file | filename |
|---|---|
| 8-K - TRUSTMARK CORP 8-K 3-7-2011 - TRUSTMARK CORP | form8k.htm |

Raymond James Annual Investors Conference
Orlando, Florida
March 7, 2011
Orlando, Florida
March 7, 2011

Forward-Looking Statements
Certain statements contained in this document constitute forward-looking statements within the meaning of the Private Securities Litigation Reform Act of
1995. You can identify forward-looking statements by words such as “may,” “hope,” “will,” “should,” “expect,” “plan,” “anticipate,” “intend,” “believe,”
“estimate,” “predict,” “potential,” “continue,” “could,” “future” or the negative of those terms or other words of similar meaning. You should read statements
that contain these words carefully because they discuss our future expectations or state other “forward-looking” information. These forward-looking
statements include, but are not limited to, statements relating to anticipated future operating and financial performance measures, including net interest
margin, credit quality, business initiatives, growth opportunities and growth rates, among other things, and encompass any estimate, prediction,
expectation, projection, opinion, anticipation, outlook or statement of belief included therein as well as the management assumptions underlying these
forward-looking statements. (You should be aware that the occurrence of the events described under the caption “Risk Factors” in Trustmark’s filings with
the Securities and Exchange Commission could have an adverse effect on our business, results of operations and financial condition.) Should one or
more of these risks materialize, or should any such underlying assumptions prove to be significantly different, actual results may vary significantly from
those anticipated, estimated, projected or expected.
Risks that could cause actual results to differ materially from current expectations of Management include, but are not limited to, changes in the level of
nonperforming assets and charge-offs, local, state and national economic and market conditions, including the extent and duration of the current volatility
in the credit and financial markets, changes in our ability to measure the fair value of assets in our portfolio, material changes in the level and/or volatility
of market interest rates, the performance and demand for the products and services we offer, including the level and timing of withdrawals from our
deposit accounts, the costs and effects of litigation and of unexpected or adverse outcomes in such litigation, our ability to attract noninterest-bearing
deposits and other low cost funds, competition in loan and deposit pricing, as well as the entry of new competitors into our markets through de novo
expansion and acquisitions, economic conditions and monetary and other governmental actions designed to address the level and volatility of interest
rates and the volatility of securities, currency and other markets, the enactment of legislation and changes in existing regulations, or enforcement
practices, or the adoption of new regulations, changes in accounting standards and practices, including changes in the interpretation of existing
standards, that affect our consolidated financial statements, changes in consumer spending, borrowings and savings habits, technological changes,
changes in the financial performance or condition of our borrowers, changes in our ability to control expenses, changes in our compensation and benefit
plans, greater than expected costs or difficulties related to the integration of new products and lines of business, natural disasters, environmental
disasters, acts of war or terrorism and other risks described in our filings with the Securities and Exchange Commission.
Although we believe that the expectations reflected in such forward-looking statements are reasonable, we can give no assurance that such expectations
will prove to be correct. Except as required by law, we undertake no obligation to update or revise any of this information, whether as the result of new
information, future events or developments or otherwise.
will prove to be correct. Except as required by law, we undertake no obligation to update or revise any of this information, whether as the result of new
information, future events or developments or otherwise.
2

3
ü Strong market share in legacy markets with growth potential
in Houston and Memphis
in Houston and Memphis
ü Diversified and stable business mix
ü Proven ability to generate superior profitability through the
cycle
cycle
ü Solid credit quality as a result of diligent credit risk
management
management
ü Robust capital position provides strategic flexibility
Investment Thesis
Trustmark is Uniquely Positioned to Capitalize
on Market Opportunities
on Market Opportunities
4
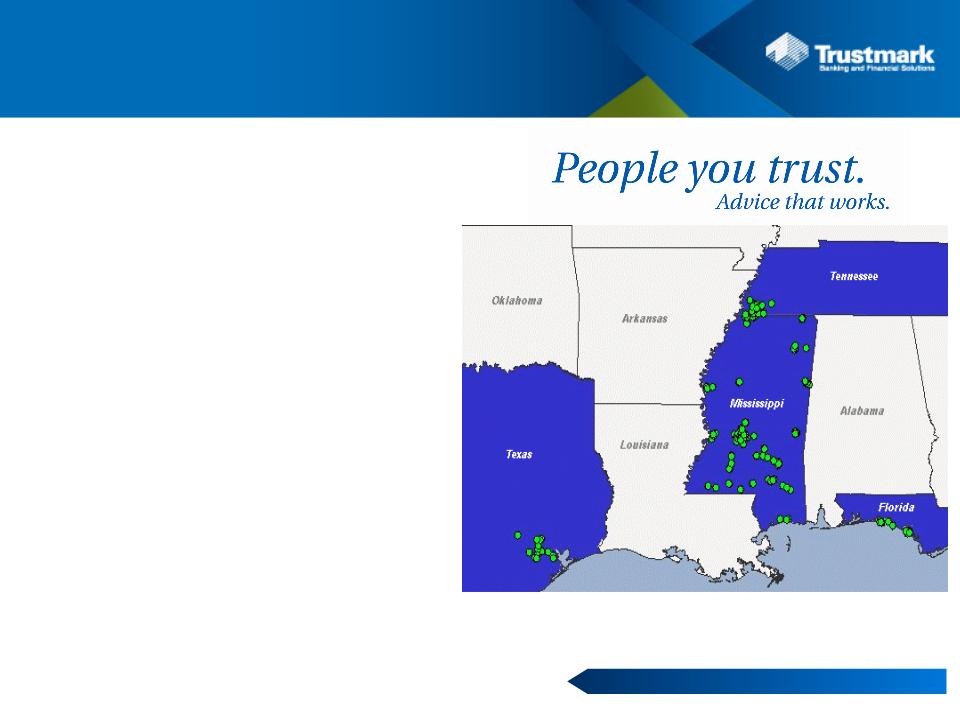
Strong Market Share in Legacy Markets
Growth Opportunities in Houston and Memphis
Growth Opportunities in Houston and Memphis
Strong Market Share
2010 Financial Highlights
Total Assets $9.6 billion
Total Loans HFI $6.1 billion
Total Deposits $7.0 billion
TCE/TA 9.11%
Risk-based Capital Ratio 15.77%
Net Income $100.6 million
ROAA 1.08%
Return on Average Tangible
Common Equity 12.31%
Integrated Provider of Financial Solutions
• 150 Retail Banking Centers
• Commercial Banking and Treasury Services
• Mortgage Banking
• Wealth Management
• Insurance
Total Shareholder Return (as of 12/31/2010)
One Year 14.97%
Three Year 12.36%
Five Year 10.10%
5
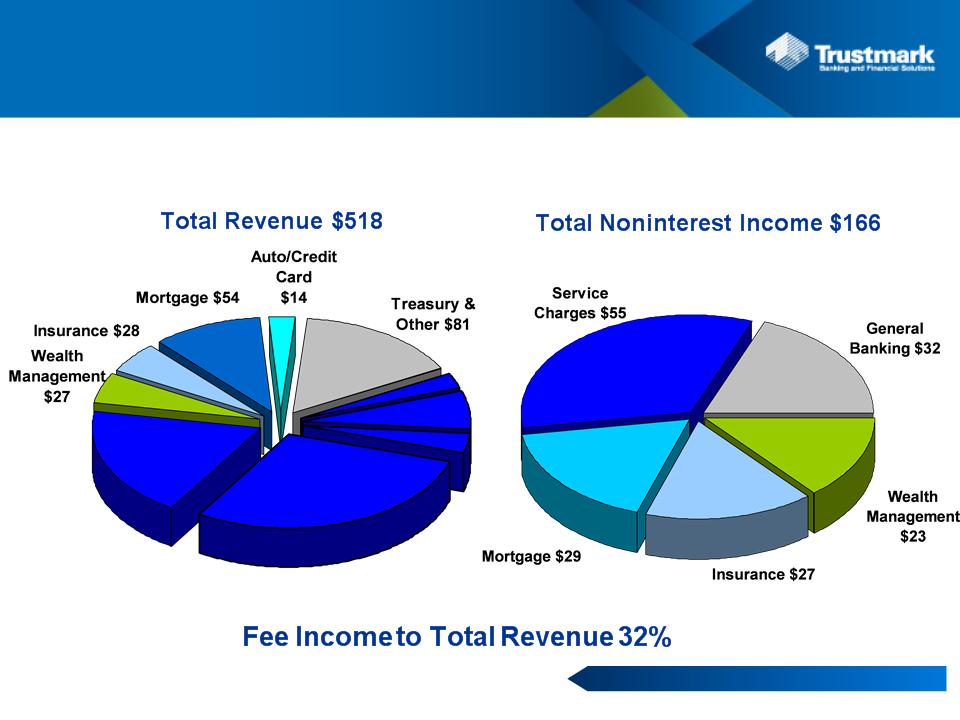
Diversified and Stable Business Mix
($ in millions)
18%
33%
14%
16%
19%
11%
5%
5%
3%
16%
Jackson 29%
FL Panhandle 2%
Houston, TX 7%
Memphis, TN 3%
Commercial -
Retail Banking
$313
MS-Other 19%
For The Year Ended December 31, 2010
Diversified Revenue Base
6
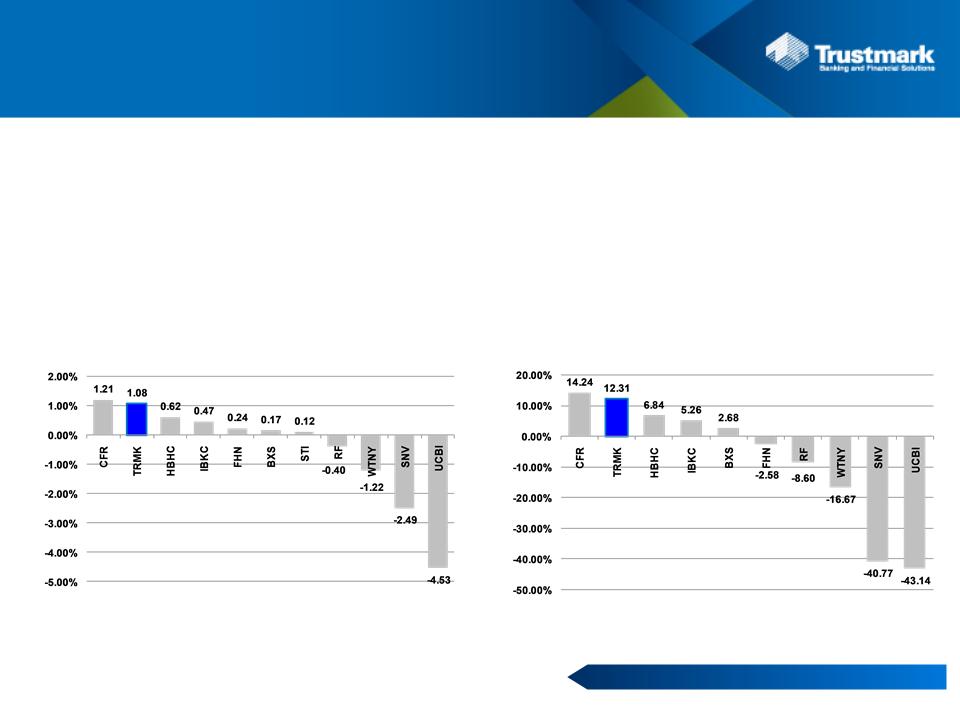
Proven Ability to Generate Superior Profitability
($ in millions)
Superior Profitability
|
Profitability and Key Ratios
|
2009
|
Q1-10
|
Q2-10
|
Q3-10
|
Q4-10
|
2010
|
|
Net Income Available to Common Shareholders
|
$73.0(1) |
$23.5
|
$26.2
|
$25.9
|
$25.2
|
$100.6
|
|
Return on Average Assets
|
0.98%
|
1.02%
|
1.13%
|
1.11%
|
1.07%
|
1.08%
|
|
Return on Average Tangible Common Equity
|
10.80%(1)
|
11.98%
|
12.92%
|
12.38%
|
11.96%
|
12.31%
|
(1) TRMK net income available to common shareholders includes $20 million of dividends and discount
accretion on $215 million of TARP Preferred Stock redeemed in the fourth quarter of 2009.
accretion on $215 million of TARP Preferred Stock redeemed in the fourth quarter of 2009.
(2) Metric not available for STI
Source: SNL Financial
2010 Return on Average Assets
2010 Return on Average Tangible Common Equity (2)
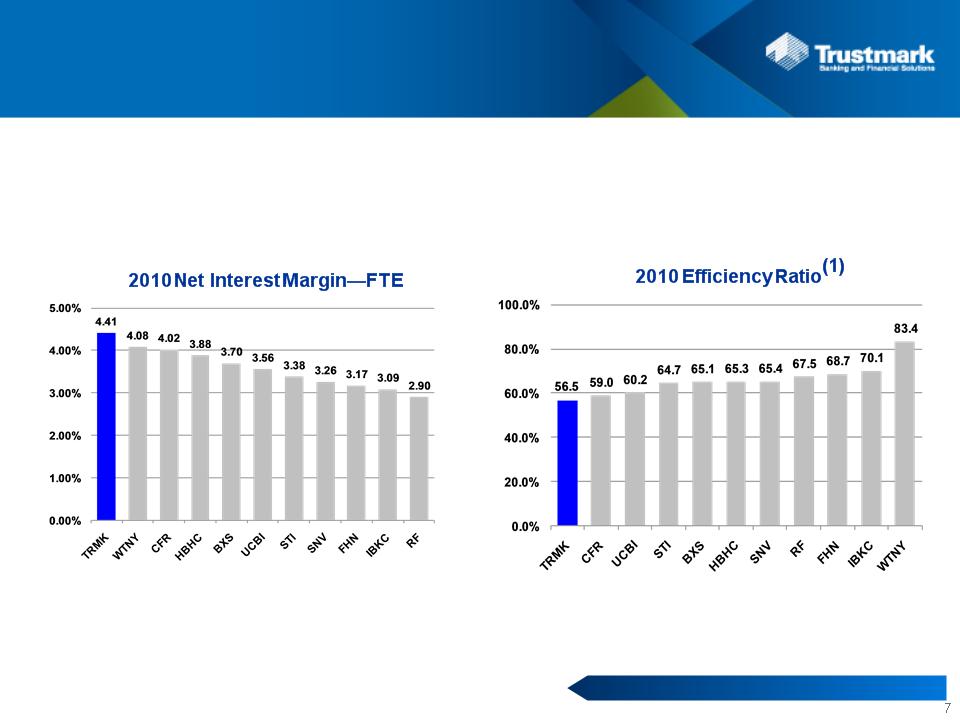
ü Best in class margin resulting from disciplined loan and deposit pricing and prudent investment
portfolio management
portfolio management
ü Management’s focus on expense initiatives has translated into a top tier operating platform
... Driven by Best in Class Net Interest Margin
and Efficiency Ratio
and Efficiency Ratio
Core Earnings Strength
(1) Efficiency ratio calculated as noninterest expense before foreclosed property expense, amortization of intangibles, and goodwill impairments as a percent of net interest income (fully taxable
equivalent, if applicable) and noninterest revenues, excluding only gains from securities transactions and nonrecurring items.
equivalent, if applicable) and noninterest revenues, excluding only gains from securities transactions and nonrecurring items.
Source: SNL Financial
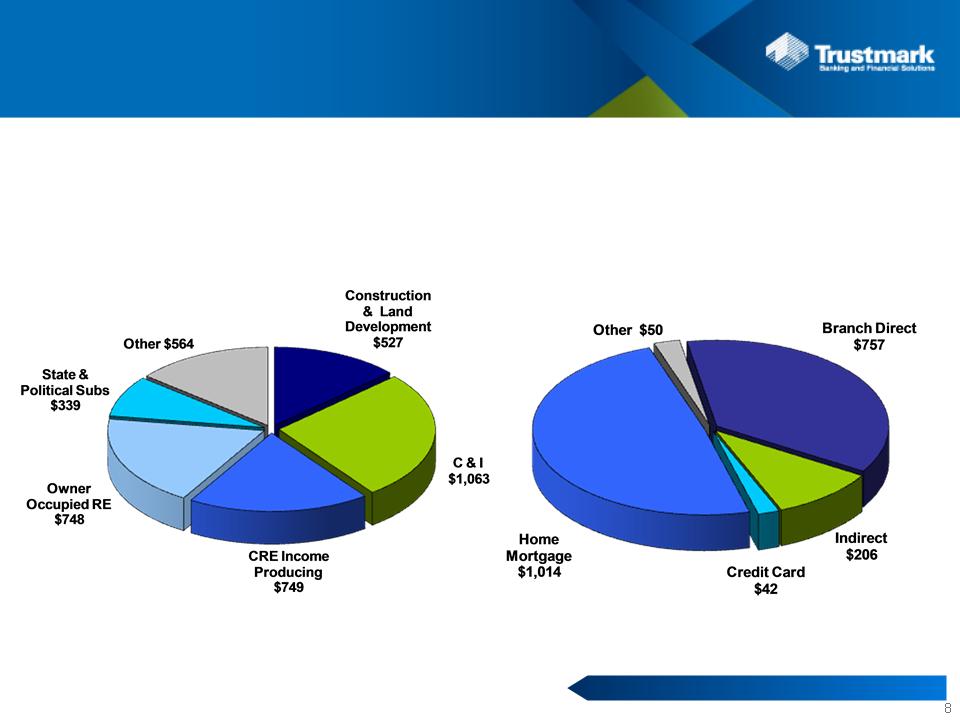
Balanced Loan Portfolio
Consumer Loans $2,070
Commercial Loans $3,990
2%
37%
2%
10%
49%
13%
19%
27%
19%
8%
14%
Total Loans Held for Investment $6,060
Balanced Loan Portfolio
ü Total loans held for investment decreased $259.6 million from the prior year to $6.1 billion
• Construction and land development loans declined $246.8 million
• Indirect auto portfolio declined $192.2 million
• Loans in other business lines expanded $179.4 million
December 31, 2010
($ in millions)
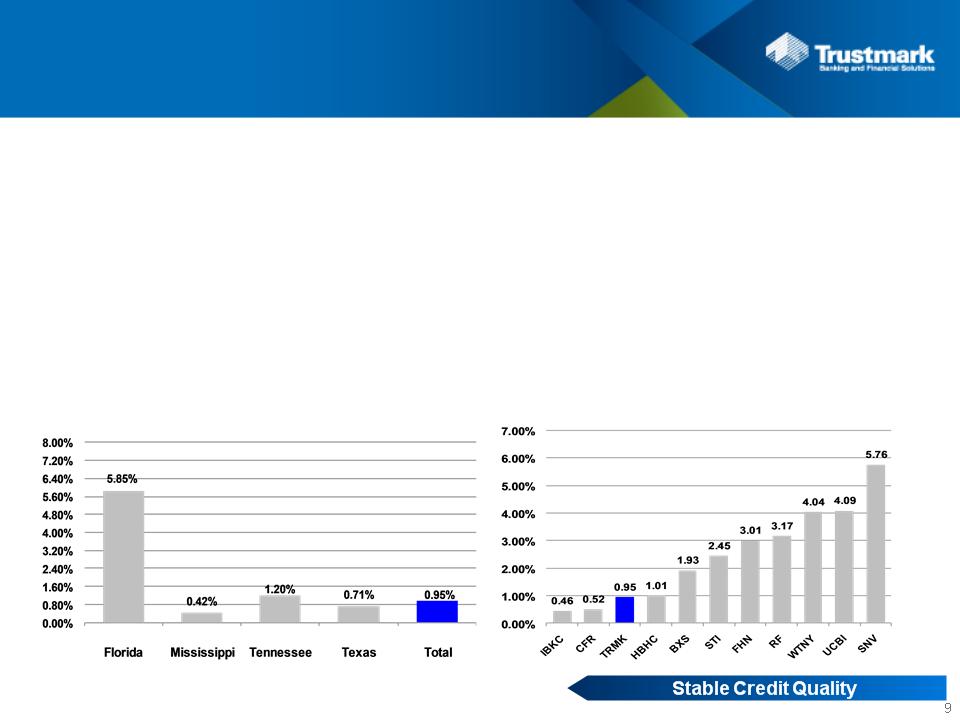
Prudent Credit Risk Management
ü During 2010, the Florida construction and land development portfolio was reduced by 33.6% to $132.0 million. At
year end 2010, the associated reserve on this portfolio was $16.4 million, or 12.41%.
year end 2010, the associated reserve on this portfolio was $16.4 million, or 12.41%.
ü Allocation of $93.5 million allowance for loan losses represented 1.94% of commercial loans and 0.78% of consumer
and home mortgage loans, resulting in an allowance to total loans of 1.54%
and home mortgage loans, resulting in an allowance to total loans of 1.54%
|
|
Florida
|
Mississippi (1)
|
Tennessee (2)
|
Texas
|
Total
|
|
Total Loans (including HFS)
|
$444.4
|
$4,449.0
|
$533.2
|
$786.6
|
$6,213.3
|
|
Nonaccrual Loans
|
$53.8
|
$39.8
|
$14.7
|
$34.6
|
$142.9
|
|
Other Real Estate
|
$32.4
|
$24.2
|
$16.4
|
$13.7
|
$86.7
|
|
Nonperforming Assets
|
$86.1
|
$64.0
|
$31.1
|
$48.4
|
$229.6
|
|
Nonperforming Assets/Total Loans + ORE
|
18.06%
|
1.43%
|
5.66%
|
6.05%
|
3.64%
|
|
Provision for Loan Losses
|
$19.9
|
$14.2
|
$5.6
|
$9.8
|
$49.5
|
|
Net Charge-offs
|
$28.7
|
$19.0
|
$6.6
|
$5.5
|
$59.7
|
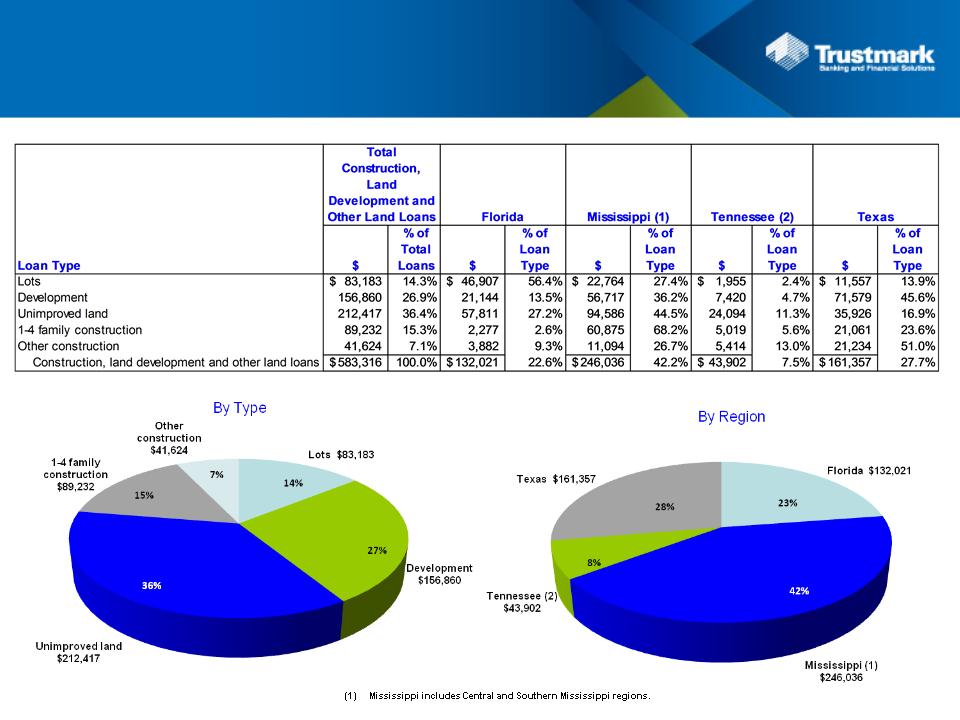
(1) Mississippi includes Central and Southern Mississippi regions.
(2) Tennessee includes Memphis, Tennessee and Northern Mississippi regions.
Source: SNL Financial
Peer 2010 NCOs/Average Loans
December 31, 2010
($ in millions)
TRMK 2010 NCOs/Average Loans
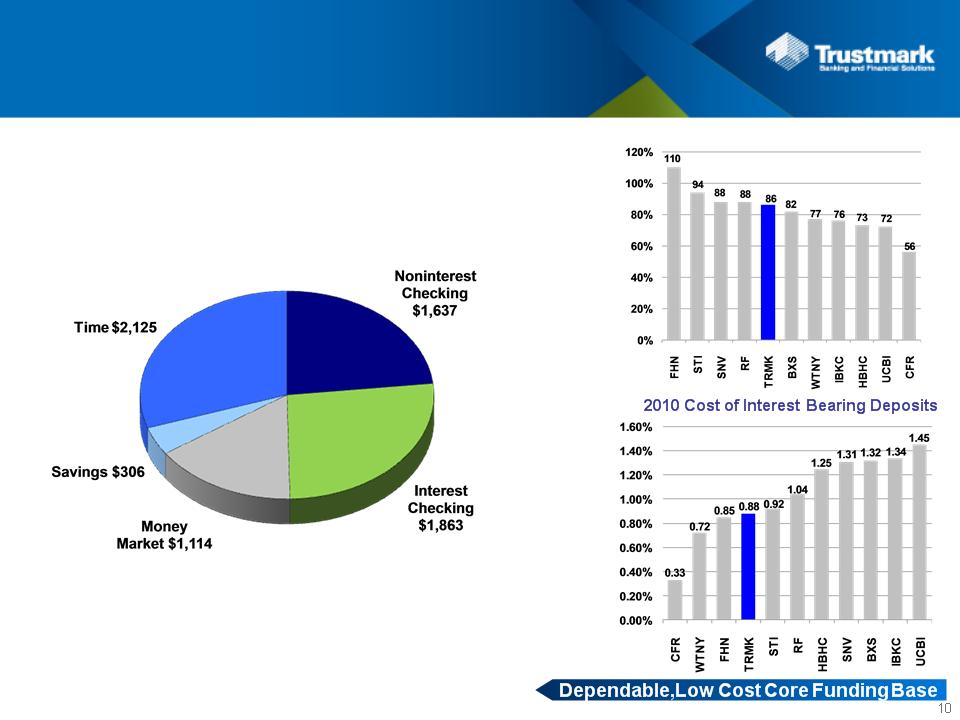
Dependable, Low Cost Core Funding Base
Total Deposits $7,045
Source: SNL Financial and company reports
Loans HFI / Deposits
26%
4%
16%
30%
23%
December 31, 2010
($ in millions)
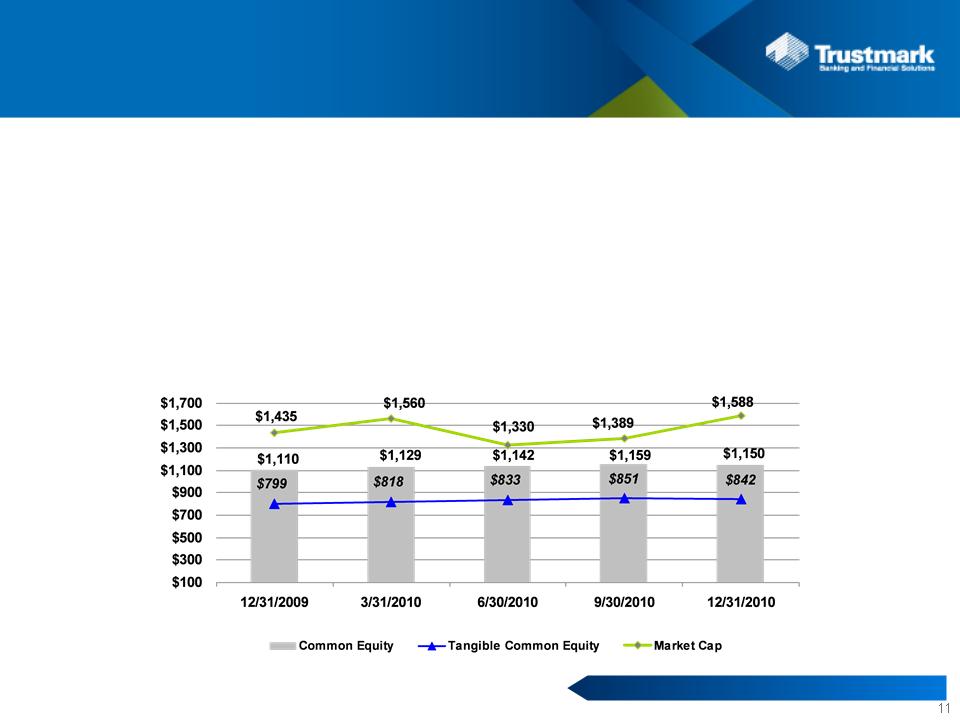
Robust Capital Position
Provides Strategic Flexibility
Provides Strategic Flexibility
|
|
Q4-09
|
Q1-10
|
Q2-10
|
Q3-10
|
Q4-10
|
|
Tangible Common Equity / Tangible Assets
|
8.67%
|
9.11%
|
9.32%
|
9.34%
|
9.11%
|
|
Tier 1 Risk-Based Capital Ratio
|
12.61%
|
13.15%
|
13.53%
|
13.75%
|
13.77%
|
|
Total Risk-Based Capital Ratio
|
14.58%
|
15.15%
|
15.53%
|
15.75%
|
15.77%
|
ü Optimized capital structure; continued leadership position in capital strength among mid-cap peers
ü Existing capital base could support $2 billion to $3 billion in additional assets while maintaining appropriate capital
ratios.
ratios.
Robust Capital Position
($ in millions)
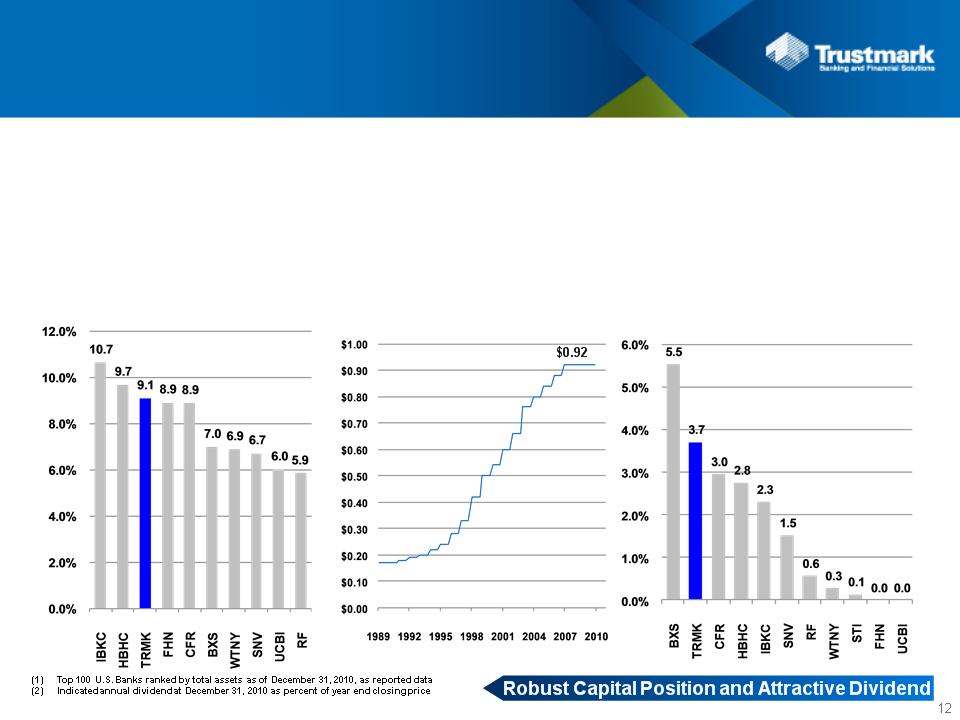
Robust Capital Position and Attractive Dividend
Tangible Common Equity /
Tangible Assets (3)
Tangible Assets (3)
ü Given quality and stability of earnings, Trustmark has increased its dividend over time and maintained it through
the cycle
the cycle
ü Trustmark is one of the 28 largest banks (1) in the U.S. that maintained its dividend since September 2007
Trustmark’s Annual
Dividend - Last 20 Years
Dividend - Last 20 Years
Dividend Yield (2)
(3) Metric not available for STI
Source: SNL Financial

Well Positioned for Continued Success
|
|
Industry
|
TRMK
|
|
Economy
|
ü Slow recovery with continued uncertainty
|
ü Trustmark’s core franchise provides stability and profitability
ü Growth opportunities in Houston and Memphis (and
throughout the franchise) when economy normalizes |
|
Interest Rates
|
ü Exceptionally low interest rates
|
ü Maintain net interest income
|
|
Credit
|
ü Continued elevation in credit costs
|
ü Anticipate additional reductions in problem assets and
provisioning |
|
Regulatory
Reform |
ü Reg E and Durbin Amendment provide
revenue headwinds |
ü Evaluating products and services structure to mitigate
potential impact of regulatory reform ü Reg E - Opt in 72% response rate, 79% accepted OD
protection; • Potential revenue reduction of Opt-in estimated at $3 to
$4 million in 2011
• Potential revenue reduction of additional regulatory
guidance estimated at $3 to $5 million in 2011
ü Durbin Amendment - potential revenue reduction of $4 to $6
million in 2011 if implemented as written and in the estimated time frame |
|
|
ü Anticipate higher regulatory capital
requirements |
ü Robust capital position provides significant flexibility;
capacity to increase assets by $2 to $3 billion and maintain capital at appropriate levels |
|
Consolidation
|
ü Sluggish economic environment coupled with
increased credit costs and reduced revenue from regulatory reform will likely result in increased consolidation |
ü Ability to leverage existing capital base
ü Proven capabilities to successfully acquire and integrate
financial services firms |
13

Strategic Priorities
ü Continue to manage through challenging business cycle
ü Aggressively work to dispose of ORE
ü Maintain fortress balance sheet and appropriate capital ratios
ü Position organization for success in new regulatory reform environment
ü Prudent investments to support revenue growth
ü Seek strategic opportunities to enhance long-term shareholder value
Priorities in 2011


16
Supplemental Information
17
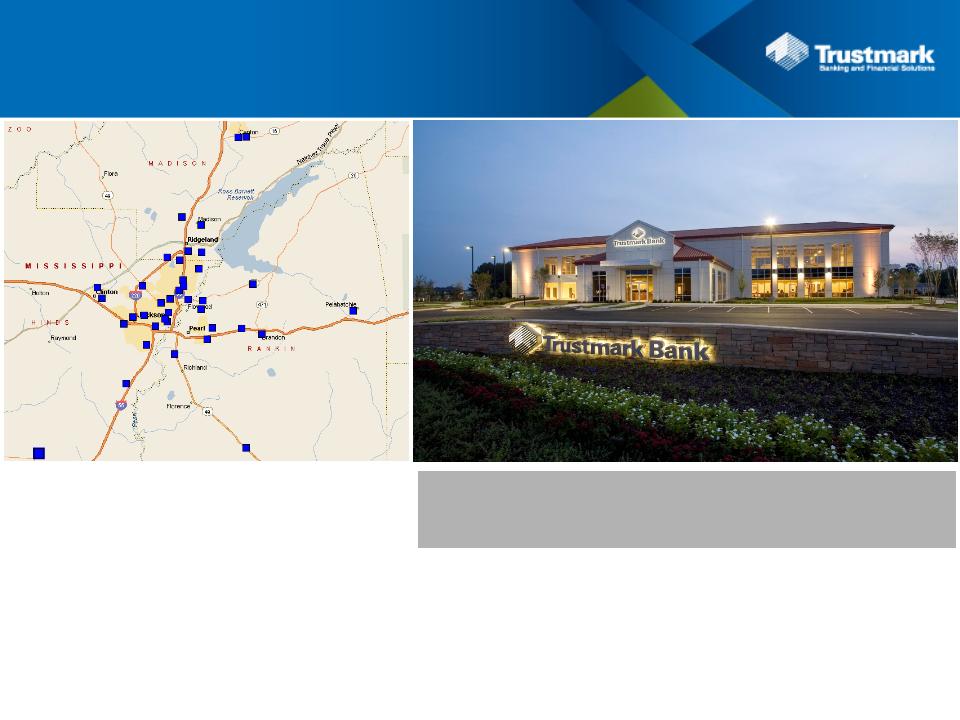
Jackson Metro
Ø Trustmark has $2.1 billion in loans
and $3.4 billion in deposits+
and $3.4 billion in deposits+
Ø Maintain market dominance
through cross-selling and
retention
through cross-selling and
retention
|
County
|
2010
Population
|
2010-15
Projected
Population Growth |
Deposit
Market Share++ |
TRMK
Banking Centers |
|
Hinds
|
250,044
|
-0.67%
|
40.58%
|
21
|
|
Rankin
|
146,177
|
9.82%
|
33.09%
|
11
|
|
Madison
|
97,343
|
11.41%
|
21.54%
|
8
|
|
TOTAL
|
493,564
|
4.82%
|
35.05%
|
40
|
+ As of 12/31/2010
++ As of 6/30/2010
Source: SNL Financial and ESRI
Banking center
18
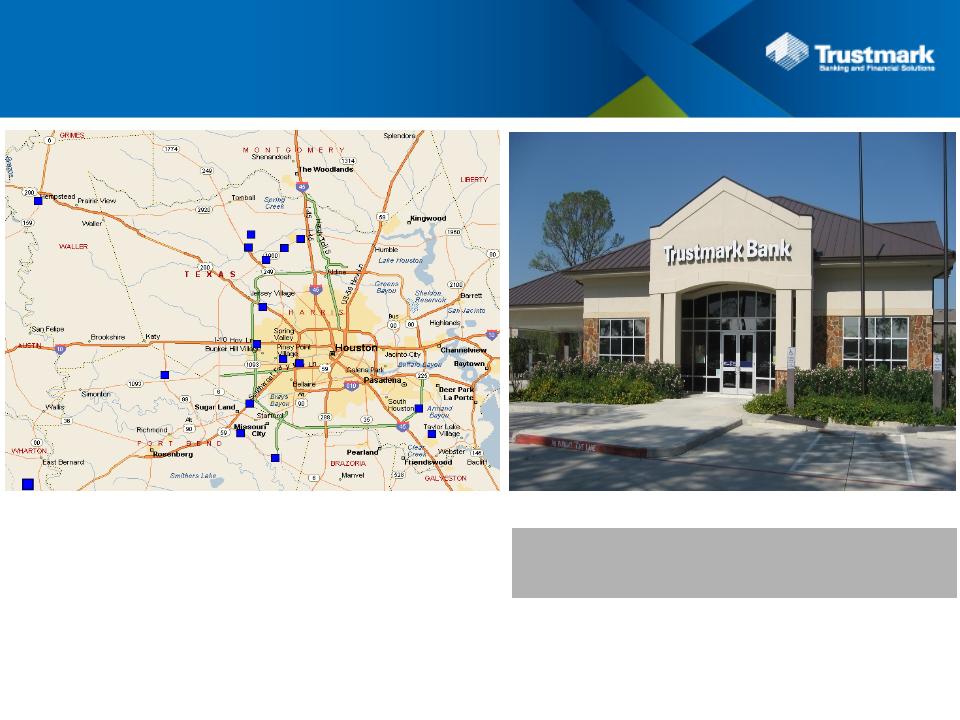
Houston MSA
Ø Trustmark has $787 million in loans and $456
million in deposits+
million in deposits+
Ø Building stronger Commercial, Retail, and
Wealth Management platforms
Wealth Management platforms
|
Market
|
2010
Population
|
2010-15
Projected Population Growth
|
Deposit
Market Share++ |
TRMK
Banking Centers |
|
Houston MSA
|
6,017,013
|
10.46%
|
0.37%
|
16
|
+ As of 12/31/2010
++ As of 6/30/2010
Source: SNL Financial and ESRI
Banking center
19
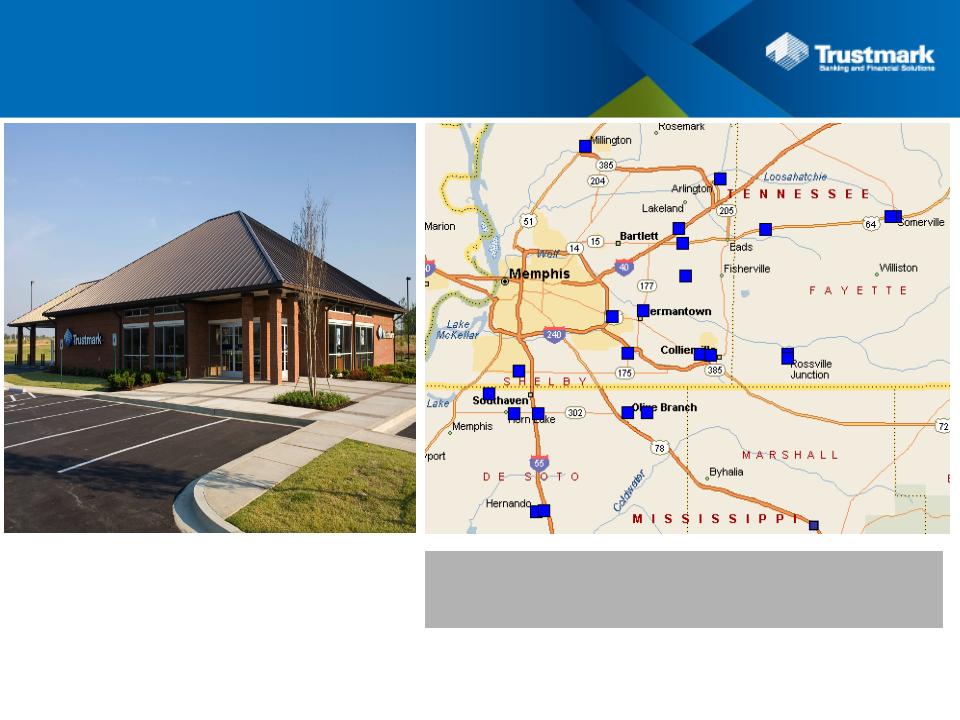
Memphis MSA
Ø Trustmark has $399 million in
loans and $637 million in deposits+
loans and $637 million in deposits+
Ø Focus on middle market
commercial and real estate lending
commercial and real estate lending
|
Market
|
2010
Population
|
2010-15
Projected
Population Growth |
Deposit
Market Share++ |
TRMK
Banking Centers |
|
Memphis MSA
|
1,325,833
|
4.28%
|
2.83%
|
22
|
Banking center
+ As of 12/31/2010
++ As of 6/30/2010
Source: SNL Financial and ESRI
20
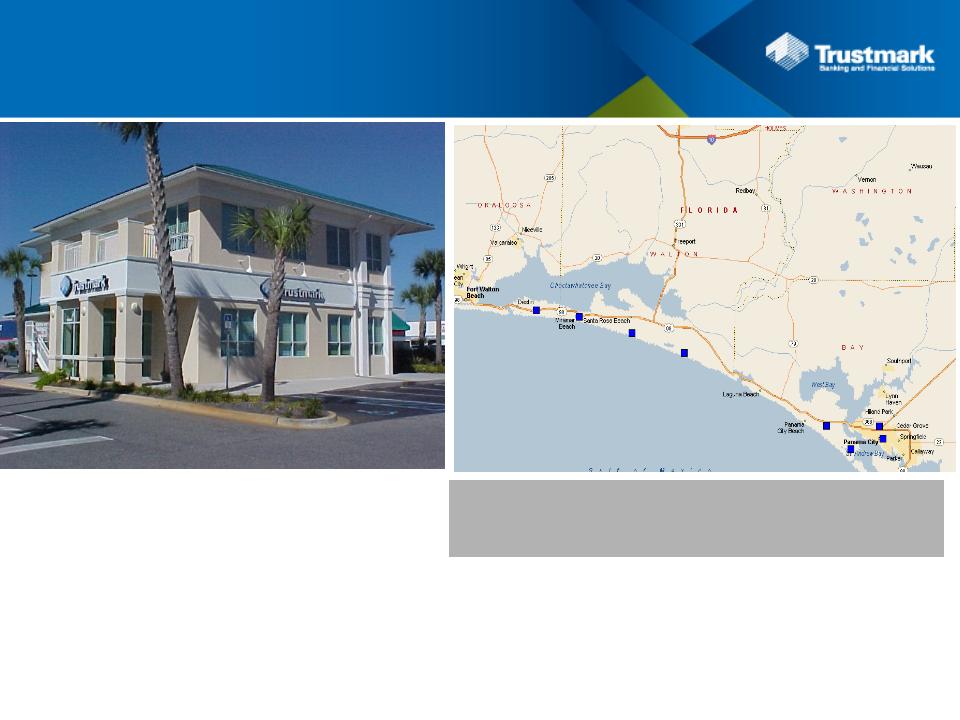
Florida Panhandle
Ø Trustmark has $444 million in loans
and $218 million in deposits+
and $218 million in deposits+
Ø Cross-sell to Fisher-Brown’s
commercial insurance customers
commercial insurance customers
Ø Focus on commercial lending and
expansion of wealth management
expansion of wealth management
|
County
|
2010
Population
|
2010-15
Projected
Population Growth |
Deposit
Market Share++ |
TRMK
Banking Centers |
|
Bay
|
170,196
|
2.72%
|
4.57%
|
4
|
|
Okaloosa
|
191,856
|
3.29%
|
1.32%
|
1
|
|
Walton
|
57,960
|
9.34%
|
7.67%
|
3
|
|
Total
|
420,012
|
3.89%
|
3.27%
|
8
|
+ As of 12/31/2010
++ As of 6/30/2010
Source: SNL Financial and ESRI
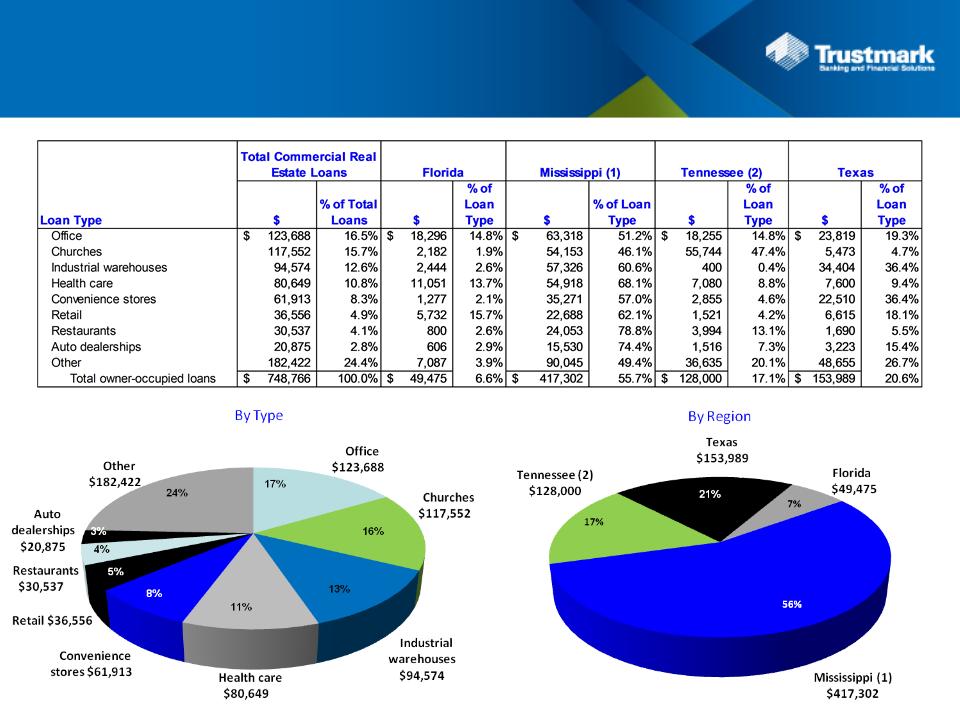
Owner-Occupied CRE
December 31, 2010
December 31, 2010
($ in thousands)
(1) Mississippi includes Central and Southern Mississippi regions.
(2) Tennessee includes Memphis, Tennessee and Northern Mississippi regions.
21
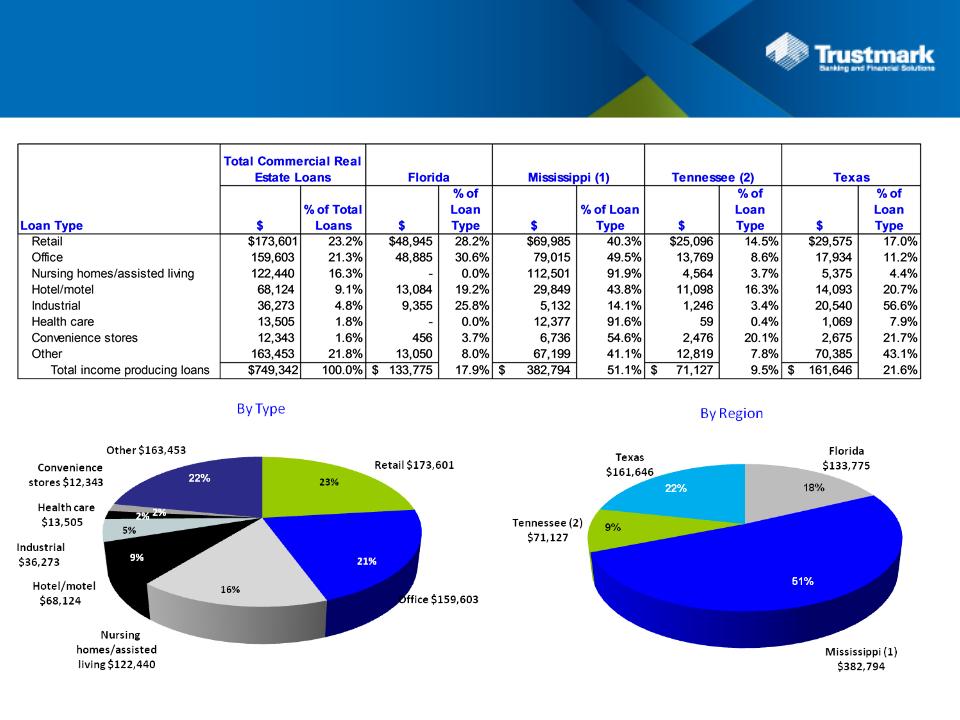
Income Producing CRE
December 31, 2010
December 31, 2010
($ in thousands)
(1) Mississippi includes Central and Southern Mississippi regions.
(2) Tennessee includes Memphis, Tennessee and Northern Mississippi regions.
22
($ in thousands)
(2) Tennessee includes Memphis, Tennessee and Northern Mississippi regions.
Construction, Land Development and Other Land Loans
December 31, 2010
December 31, 2010
23
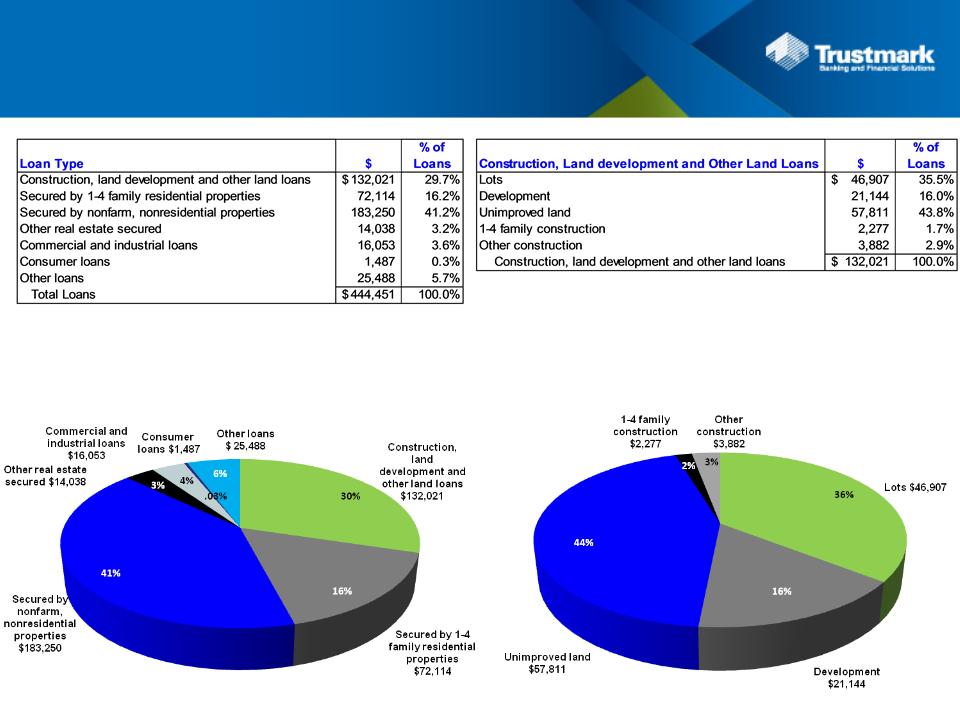
Florida Loans
December 31, 2010
December 31, 2010
($ in thousands)
By Loan Type
$444 million
Construction, Land Development and
Other Land Loans
Other Land Loans
$132 million
24
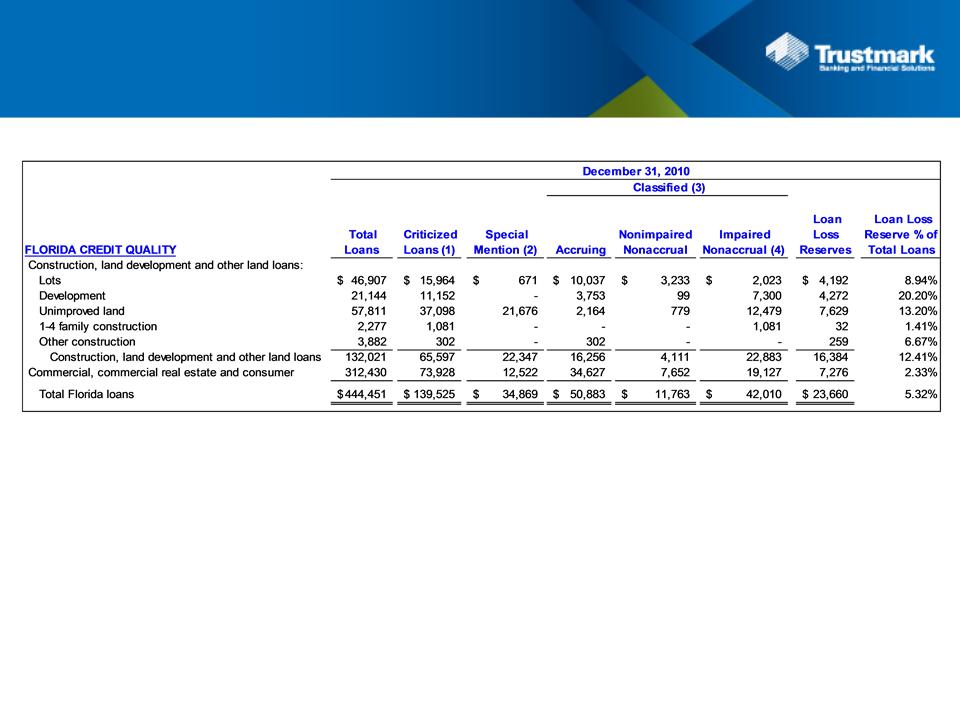
Florida Loans
December 31, 2010
December 31, 2010
($ in thousands)
1) Criticized loans equal all special mention and classified loans.
2) Special mention loans exhibit potential credit weaknesses that, if not resolved, may ultimately result in a more severe classification.
3) Classified loans include those loans identified by management as exhibiting well-defined credit weaknesses that may jeopardize repayment in full of the debt.
4) All nonaccrual loans over $500 thousand are individually assessed for impairment. Impaired loans have been determined to be collateral dependent and assessed using a
fair value approach. Fair value estimates begin with appraised values, normally from recently received and reviewed appraisals. Appraised values are adjusted down for
costs associated with asset disposal. At the time a loan is deemed to be impaired, the full difference between book value and the most likely estimate of the asset’s net
realizable value is charged off. However, as subsequent events dictate and estimated net realizable values decline, required reserves are established.
25

26
Contact Information
Trustmark Corporation’s common stock is listed on the NASDAQ National Market System and is traded under the
symbol TRMK. Additional information is available at www.trustmark.com.
symbol TRMK. Additional information is available at www.trustmark.com.
Investor Inquiries:
Louis E. Greer
Treasurer and Principal Financial Officer
601-208-2310
lgreer@trustmark.com
F. Joseph Rein, Jr.
Senior Vice President
601-208-6898
jrein@trustmark.com
Shareholder Services
Trustmark’s shareholder services are provided by American Stock Transfer & Trust Company, LLC .
Trustmark Corporation
c/o American Stock Transfer & Trust Co.
Operations Center
6201 15th Avenue
Brooklyn, NY 11219
(877) 476-4393
info@amstock.com
www.amstock.com