Attached files
Table of Contents
UNITED STATES
SECURITIES AND EXCHANGE COMMISSION
WASHINGTON, DC 20549
FORM 10-K
(Mark One)
| x | ANNUAL REPORT PURSUANT TO SECTION 13 OR 15(d) OF THE SECURITIES EXCHANGE ACT OF 1934 |
For the Fiscal Year Ended December 31, 2010
or
| ¨ | TRANSITION REPORT PURSUANT TO SECTION 13 OR 15(d) OF THE SECURITIES EXCHANGE ACT OF 1934 FOR THE TRANSITION PERIOD FROM TO |
Commission file number: 001-33040
HUGHES COMMUNICATIONS, INC.
(Exact Name of Registrant as Specified in Its Charter)
| Delaware | 13-3871202 | |
| (State or Other Jurisdiction of Incorporation or Organization) |
(I.R.S. Employer Identification No.) |
11717 Exploration Lane, Germantown, Maryland 20876
(Address of Principal Executive Offices and Zip Code)
(301) 428-5500
(Registrant’s Telephone Number, Including Area Code)
Securities registered pursuant to Section 12(b) of the Act:
| Common Stock: $0.001 par value | The NASDAQ Stock Market LLC (NASDAQ Global Select Market) | |
| (Title of Each Class) | (Name Of Each Exchange On Which Registered) |
Securities registered pursuant to Section 12(g) of the Act:
None
Indicate by check mark if the registrant is a well-known seasoned issuer, as defined in Rule 405 of the Securities Act. ¨ Yes x No
Indicate by check mark if the registrant is not required to file reports pursuant to Section 13 or Section 15(d) of the Act. ¨ Yes x No
Indicate by check mark whether the registrant (1) has filed all reports required to be filed by Section 13 or 15(d) of the Securities Exchange Act of 1934 during the preceding 12 months (or for such shorter period that the registrant was required to file such reports) and (2) has been subject to such filing requirements for the past 90 days. x Yes ¨ No
Indicate by check mark whether the registrant has submitted electronically and posted on its corporate Web site, if any, every Interactive Data File required to be submitted and posted pursuant to Rule 405 of Regulation S-T during the preceding 12 months (or for such shorter period that the registrant was required to submit and post such files). ¨ Yes ¨ No
Indicate by check mark if disclosure of delinquent filers pursuant to Item 405 of Regulation S-K is not contained herein, and will not be contained, to the best of registrant’s knowledge, in definitive proxy or information statements incorporated by reference in Part III of this Form 10-K or any amendment to this Form 10-K. x
Indicate by check mark if the registrant is a large accelerated filer, an accelerated filer, a non-accelerated filer, or a smaller reporting company. See the definitions of “large accelerated filer,” “accelerated filer” and “smaller reporting company” in Rule 12b-2 of the Exchange Act.
| Large accelerated filer | ¨ | Accelerated filer | x | |||
| Non-accelerated filer | ¨ (Do not check if a smaller reporting company) | Smaller reporting company | ¨ |
Indicate by check mark whether the company is a shell company (as defined in Rule 12b-2 of the Exchange Act). ¨ Yes x No
The aggregate market value of the voting and non-voting common equity held by non-affiliates as of June 30, 2010 was $216,359,926.
The number of shares of the registrant’s common stock outstanding as of March 3, 2011 was 21,834,354.
DOCUMENTS INCORPORATED BY REFERENCE
Portions of the registrant’s definitive Proxy Statement to be filed with the Securities and Exchange Commission in connection with the registrant’s 2010 annual meeting of stockholders are incorporated by reference into Part III of this Annual Report on Form 10-K. Such Proxy Statement will be filed with the Securities and Exchange Commission not later than 120 days after the registrant’s fiscal year ended December 31, 2010.
Table of Contents
| Page | ||||||
| 1 | ||||||
| Item 1. |
2 | |||||
| Item 1A. |
20 | |||||
| Item 1B. |
34 | |||||
| Item 2. |
35 | |||||
| Item 3. |
35 | |||||
| Item 4. |
36 | |||||
| 37 | ||||||
| Item 5. |
37 | |||||
| Item 6. |
39 | |||||
| Item 7. |
Management’s Discussion and Analysis of Financial Condition and Results of Operations |
40 | ||||
| Item 7A. |
64 | |||||
| Item 8. |
66 | |||||
| Item 9. |
Changes in and Disagreements with Accountants on Accounting and Financial Disclosure |
122 | ||||
| Item 9A. |
122 | |||||
| Item 9B. |
123 | |||||
| 124 | ||||||
| Item 10. |
124 | |||||
| Item 11. |
127 | |||||
| Item 12. |
Security Ownership of Certain Beneficial Owners and Management and Related Stockholder Matters |
127 | ||||
| Item 13. |
Certain Relationships and Related Transactions, and Director Independence |
128 | ||||
| Item 14. |
128 | |||||
| 129 | ||||||
| Item 15. |
129 | |||||
| 135 | ||||||
i
Table of Contents
SPECIAL NOTE REGARDING FORWARD-LOOKING STATEMENTS
This Annual Report on Form 10-K contains “forward-looking statements” that involve risks and uncertainties within the meaning of various provisions of the Securities Act of 1933 and of the Securities Exchange Act of 1934. Forward-looking statements include statements concerning our plans, objectives, goals, strategies, future events, future revenues or performance, capital expenditures, financing needs and other information that is not historical information and, in particular, appear in the sections entitled “Risk Factors,” “Management’s Discussion and Analysis of Financial Condition and Results of Operations” and elsewhere in this report. When used in this report, the words “estimates,” “expects,” “anticipates,” “forecasts,” “plans,” “intends,” “believes,” “seeks,” “may,” “will,” “should” and variations of these words or similar expressions (or the negative versions of any of these words) are intended to identify forward-looking statements. All forward-looking statements, including, without limitation, management’s examination of historical operating trends, are based upon our current expectations and various assumptions. Our expectations, beliefs and projections are expressed in good faith and we believe there is a reasonable basis for them. However, we can give no assurance that management’s expectations, beliefs and projections will be achieved.
There are a number of risks and uncertainties that could cause our actual results to differ materially from the results referred to in the forward-looking statements contained in this report. Important factors that could cause our actual results to differ materially from the results referred to in the forward-looking statements we make in this report are set forth elsewhere in this report, including under the heading Item 1A. Risk Factors.
1
Table of Contents
| Item 1. | Business |
Unless otherwise indicated or the context requires otherwise, the terms “HCI,” the “Company,” “we,” “us” and “our” refer to Hughes Communications, Inc. and its subsidiaries, including Hughes Network Systems, LLC (“HNS”).
Overview
We were formed as a Delaware corporation on June 23, 2005 and in February 2006 we became a publicly traded company. Our stock trades on the NASDAQ Global Select Market under the symbol “HUGH.” We operate our business primarily through our wholly-owned subsidiary, HNS, a telecommunications company. We are the world’s leading provider of broadband satellite network services and systems to the enterprise market. We are also the largest satellite Internet broadband access provider to North American consumers, which we refer to as the Consumer market. In addition, we provide managed services to large enterprises that combine the use of satellite and terrestrial alternatives, thus offering solutions that are tailored and cost optimized to the specific customer requirements. We also provide networking systems solutions to customers for mobile satellite and wireless backhaul systems.
Since HNS’ deployment of the first very small aperture terminal (“VSAT”) network in 1983, we have been a leader in commercial digital satellite communications and have achieved extensive depth and experience in the development, manufacturing and operation of satellite-based data, voice and video networks. Leveraging this expertise, we provide highly reliable, end-to-end communications with guaranteed quality of service to our enterprise customers regardless of the number of fixed or mobile sites or their geographic location. HNS started in this business as an equipment and system supplier. During 1988, HNS became a service provider to medium and large enterprises, including Fortune 1000 companies. In the early part of this decade, HNS leveraged its experience with its enterprise customers to expand its business into other growing market areas such as providing broadband Internet service to the Consumer market. In addition, we have strategically used our technology base and expertise in satellite communication to provide turnkey satellite ground systems and user terminal equipment to mobile system operators.
As part of our commitment supporting the growth of our North American enterprise and consumer business, we launched our SPACEWAYTM 3 satellite (“SPACEWAY 3”) in August 2007 and started providing service in North America on the SPACEWAY network in April 2008. In addition, in June 2009, HNS entered into an agreement with Space Systems/Loral, Inc. (“SS/L”) for the design and manufacturing of our next-generation, high throughput geostationary satellite (“Jupiter”). Jupiter will employ a multi-spot beam, bent pipe Ka-band architecture and will provide additional capacity for our HughesNet service to the Consumer market in North America. We anticipate launching Jupiter in the first half of 2012.
Recent Developments—Merger Agreement with EchoStar Corporation
On February 13, 2011, the Company entered into an Agreement and Plan of Merger (the “Merger Agreement”) with EchoStar Corporation, a Nevada corporation (“EchoStar”), EchoStar Satellite Services L.L.C., a Colorado limited liability company (“Satellite Services”), and Broadband Acquisition Corporation, a Delaware corporation (“Merger Sub”), pursuant to which, subject to the terms and conditions set forth therein, Merger Sub will merge with and into the Company (the “Merger”), with the Company continuing as the surviving entity and becoming a wholly owned subsidiary of EchoStar.
Pursuant to the Merger Agreement, upon the closing of the Merger, each of the Company’s issued and outstanding share of common stock (other than any of the Company’s common stock with respect to which appraisal rights have been duly exercised under Delaware law) will automatically be converted into the right to receive $60.70 in cash (without interest) and cancelled. The Merger Agreement also contemplates the repayment of all of HNS’ outstanding debt, including the 9 1/2% Senior Notes due 2014, except that the $115 million loan
2
Table of Contents
facility guaranteed by COFACE, the French Export Credit Agency, will continue to remain outstanding following the Merger if the requisite lender consents thereunder are obtained.
Each of the boards of directors of the Company and Merger Sub approved the Merger Agreement and deemed it advisable and fair to, and in the best interests of, their respective companies and stockholders, to enter into the Merger Agreement and to consummate the Merger and the transactions and agreements contemplated thereby. The board of directors of EchoStar approved the Merger Agreement and deemed it advisable and fair to, and in the best interests of, its stockholders to enter into the Merger Agreement and to consummate the transactions and agreements contemplated thereby.
The Merger is expected to close later this year, subject to certain closing conditions, including among others, (i) receiving the required approvals of the Company’s stockholders, which approval was effected on February 13, 2011, by written consent of a majority of the Company’s stockholders (the “Majority Stockholders’ Written Consents”), (ii) 20 business days having elapsed since the mailing to the Company’s stockholders of the definitive information statement, with respect to such adoption of the Merger Agreement, in accordance with the Securities Exchange Act of 1934, as amended (the “Exchange Act”), and the rules and regulations promulgated thereunder, (iii) receiving certain government regulatory approvals, including approval by the Federal Communications Commission (“FCC”), the expiration or termination of the waiting period under the Hart-Scott-Rodino Antitrust Improvements Act of 1976, as amended, and the receipt of the consents required under certain export control laws, (iv) the absence of any order or injunction by a court of competent jurisdiction preventing the consummation of the Merger, and the absence of any action taken, or any law enacted, entered, enforced or made applicable to the Merger, by any governmental entity that makes the consummation of the Merger illegal or otherwise restrains, enjoins or prohibits the Merger, (v) the absence of any proceeding in which the Office of Communications of the United Kingdom seeks to prohibit or enjoin the Merger, (vi) the accuracy of the representations and warranties made by the Company, EchoStar and Merger Sub, (vii) the performance, in all material respects, by each of the Company, EchoStar and Merger Sub of all its respective obligations, agreements and covenants under the Merger Agreement, (viii) subject to certain customary exceptions, the absence of (a) a change or event that has a material adverse effect on the business, financial condition or results of operations of the Company and its subsidiaries, taken as a whole or (b) any event, change, occurrence or effect that would prevent, materially delay or materially impede the performance by the Company of its obligations under this Agreement or the consummation of the transactions contemplated hereby, if not cured, in either case since February 13, 2011 and (ix) holders of shares of the Company’s common stock representing in excess of 25% of the Company’s outstanding common stock shall not have exercised (or if exercised, shall not have withdrawn prior to the commencement of the marketing period for the financing of the pending transaction) rights of dissent in connection with the Merger. The Merger Agreement clarifies that no party may rely on a failure of conditions to be satisfied if such party’s breach was the proximate cause of the failure.
The Merger Agreement contains customary representations, warranties and covenants of the Company, EchoStar and Merger Sub. In particular, the Company makes certain representations and warranties related to the business in which it and the Company operates, including with respect to our communications licenses; the health of our satellite currently in orbit and other related information; that there are no claims under coordination and concession agreements; the status of our earth stations; and compliance with regulatory and export control laws. EchoStar and Merger Sub also make a representation that EchoStar and Satellite Services have sufficient financing in order to complete the Merger.
The Company has agreed to various covenants in the Merger Agreement, including, among others, covenants (i) to use commercially reasonable efforts to conduct its business in the ordinary course consistent with past practice during the interim period between the execution of the Merger Agreement and completion of the Merger, (ii) not to engage in certain kinds of transactions during this interim period and (iii) to cooperate and use commercially reasonable efforts to take all actions necessary to obtain all governmental and antitrust, FCC and regulatory approvals, subject to certain customary limitations. As noted above, EchoStar and Satellite Services represent and warrant in the Merger Agreement that at the closing of the Merger they will have access to
3
Table of Contents
sufficient funds to consummate the Merger and the other transactions contemplated by the Merger Agreement, and there is no closing condition related to them having procured such financing.
The Merger Agreement also contains a covenant pursuant to which the Company has agreed, subject to certain customary exceptions described below, that it will not, and will cause its representatives not to, solicit, facilitate (including by providing information) or participate in any negotiations or discussions with any person relating to, any takeover proposal, as further described in the Merger Agreement. The Merger Agreement contains a “fiduciary-out” provision, which provides that, prior to the time the stockholders of the Company have adopted and approved the Merger Agreement (which adoption and approval was obtained on February 13, 2011 pursuant to the Majority Stockholders’ Written Consents), the board of directors of the Company may engage with alternative purchasers, change its recommendation to the Company stockholders or enter into a definitive agreement with respect to an unsolicited acquisition proposal, only if the board of directors of the Company has determined in good faith (a) that failure to take such action is likely to be inconsistent with the board’s fiduciary duties, and (b) that the acquisition proposal constitutes a “Superior Proposal.” However, as the Company stockholders have approved and adopted the Merger Agreement, the “fiduciary-out” provision no longer provides an exception to the non-solicitation obligations described in this paragraph.
The Merger Agreement also contains a covenant pursuant to which EchoStar or the surviving entity must indemnify officers, directors and employees of the Company and its subsidiaries for a period of six years following the closing of the Merger for all liabilities or claims related to their service or employment with the Company or its subsidiaries occurring prior to the closing of the Merger. This covenant further requires EchoStar to keep in place the Company’s directors and officers liability and fiduciary liability insurance policies in effect at the closing, or purchase a “tail policy” offering similar coverage unless the Company purchases such a policy prior to closing.
The Merger Agreement contains certain termination rights for both the Company and EchoStar. In addition to certain termination rights related to breaches of the agreement or actions taken by the Company with respect to alternative transactions, so long as the failure of the terminating party to comply with its obligations is not the cause for delay in closing, each of EchoStar and the Company has the right to terminate the Merger Agreement unilaterally if the Merger has not closed by a date nine months from the execution of the Merger Agreement. In addition, the Merger Agreement provides that, upon termination of the Merger Agreement under specified circumstances, the Company may be required to pay EchoStar a termination fee of $45 million.
The Merger Agreement also contains termination and other rights related to the occurrence of certain reductions in performance or total loss of the Company’s satellite currently in orbit, and certain waivers increasing risks associated with construction, launch or operation of the Company’s satellite currently under construction (a “Material Satellite Event”). Upon a Material Satellite Event, EchoStar is entitled to terminate the Merger Agreement until 60 days after the Company provides a written plan describing its intended response (the “Mitigation Plan”). If EchoStar has not provided written consent to the Mitigation Plan 30 days after delivery, the Company can then terminate the Merger Agreement. In addition, from the date of any Material Satellite Event until EchoStar’s approval of the Mitigation Plan, the Company will also be required to provide EchoStar with daily reports of customer complaints and subscriber cancellations.
The representations, warranties and covenants contained in the Merger Agreement were made by the parties thereto only for purposes of that agreement and as of specific dates; were solely for the benefit of the parties to the Merger Agreement; may be subject to limitations agreed upon by the contracting parties, including being qualified by confidential disclosures made for the purposes of allocating contractual risk between the parties to the Merger Agreement instead of establishing these matters as facts (such disclosures include information that has been included in Hughes’ public disclosures, as well as additional non-public information); and may be subject to standards of materiality applicable to the contracting parties that differ from those applicable to investors. Investors are not third party beneficiaries under the Merger Agreement (except for the right of Hughes’ stockholders to receive the transaction consideration from and after the consummation of the Merger) and should
4
Table of Contents
not rely on the representations, warranties and covenants or any descriptions thereof as characterizations of the actual state of facts or condition of Hughes or EchoStar or any of their respective subsidiaries or affiliates. Additionally, the representations, warranties, covenants, conditions and other terms of the Merger Agreement may be subject to subsequent waiver or modification. Moreover, information concerning the subject matter of the representations, warranties and covenants may change after the date of the Merger Agreement, which subsequent information may or may not be fully reflected in Hughes’ public disclosures.
Industry Overview
The emergence of VSATs in the 1980s marked the beginning of a new era in satellite communication. The use of smaller antennas meant that the benefits of satellite-based communication could be made commercially viable in a wide range of applications, whereas previous uses were generally limited to government and large commercial installations. A VSAT network operates by connecting multiple, geographically-dispersed communication sites through a satellite to a single point (the network hub) and from there to the customer’s data center. VSAT operators typically either lease transponder capacity from a third-party fixed satellite service provider or they construct and launch their own satellites. VSAT networks can operate independently or as a complete overlay to terrestrial networks and can, therefore, provide a single source solution for a particular customer’s communication requirements. Other benefits include a highly secure and reliable network and service availability across a single or multiple regions. In addition, due to the shared nature of the satellite communications resource, VSATs provide attractive economics for multi-site applications that have various levels of traffic requirements at any one site. VSAT networks can support a full spectrum of capabilities and customer applications including email, Internet-based virtual private networks, video/voice, Internet access, Internet telephony, distance learning, content distribution and financial transactions.
VSAT networks allow every site in a network to have access to consistent service levels, sometimes with a guaranteed minimum level of quality, compared with terrestrial networks in which service levels across areas may differ both within a single network and across different networks. In addition, VSAT networks have multiple layers of redundancy, including multiple network operation centers and arrangements to shift loads to backup satellites or transponders in the event of a particular satellite and/or transponder’s failure. Another advantage of VSAT satellite solutions is that due to their wireless nature, they are able to be deployed more rapidly than terrestrial services. The VSAT solution provides users with the ability to multicast and broadcast under the same economic model that has enabled the rapid growth in direct-to-home satellite television. As a result, tasks such as the distribution of training videos are achieved efficiently and economically via a VSAT satellite solution.
Business Segments
We currently operate in five business segments—(i) the North America Broadband segment; (ii) the International Broadband segment; (iii) the Telecom Systems segment; (iv) the HTS Satellite segment; and (v) the Corporate and Other segment. Within the North America Broadband segment, sales are attributed to the Consumer group, which delivers broadband Internet service to consumer customers, and the Enterprise group, which provides satellite, wire line and wireless communication network products and services to enterprises in North America. The International Broadband segment consists of our international service companies and provides managed networks services and equipment to enterprise customers and broadband service providers worldwide. The Telecom Systems segment consists of the Mobile Satellite Systems group, the Terrestrial Microwave group, and the Telematics group. The Mobile Satellite Systems group provides turnkey satellite ground segment systems to mobile system operators. The Terrestrial Microwave group provides point-to-multipoint microwave radio network systems that are used for cellular backhaul and broadband wireless access. The Telematics group provides development, engineering and manufacturing services to Hughes Telematics, Inc. (“HTI”). However, as a result of the unfavorable impact of the economy on the automobile industry in 2009, HTI terminated substantially all of the development, engineering and manufacturing services with us in August 2009. We expect our future revenue from the Telematics group to be insignificant. The HTS Satellite segment, which is a new segment starting in 2010, consists of activities related to the development,
5
Table of Contents
construction and launch of high throughput satellites and currently represents construction activities of Jupiter and the development of related network equipment. As a result of the newly established HTS Satellite segment in 2010, construction activities of Jupiter in 2009, which previously had been included in the North America Broadband segment, have been reclassified to the HTS Satellite segment to conform to the current period presentation. The Corporate and Other segment includes certain minority interest investments held by us, our corporate offices and assets not specifically related to another business segment. Due to the complementary nature and common architecture of our services and products across our business segments, we are able to leverage our expertise and resources within our various operating units to yield significant cost efficiencies.
See Note 19—Segment Data and Geographic Data to the Company’s audited consolidated financial statements included in Item 8. Financial Statements and Supplementary Data of this report for financial information by operating segment and by geographic location.
6
Table of Contents
The following chart summarizes the key elements of our markets comprising our business segments, excluding our HTS Satellite segment and Corporate and Other segment, each of which is discussed in further detail below:
| North America Broadband Segment |
International Broadband Segment |
Telecom Systems Segment | ||||||||||||||||||||||||||||||||
| Consumer |
Enterprise |
Enterprise |
Mobile Satellite Systems |
Terrestrial |
Telematics | |||||||||||||||||||||||||||||
| Customer Base | • |
Consumer subscription services | • |
Enterprises, government and local government agencies in North America | • |
Enterprises, Telecom carriers and government agencies located outside of North America | • |
Mobile satellite-based voice and data service operators | • |
Cellular mobile operators and local exchange carriers | • |
Telematics service providers | ||||||||||||||||||||||
| 2010 Revenues (in millions) | • |
$477 | • |
$257 | • |
$206 | • |
$80 | • |
$15 | • |
$0.5 | ||||||||||||||||||||||
| Products/ Service Application(s) | • |
Internet access and equipment | • |
VSAT equipment | • |
VSAT equipment | • |
Turnkey mobile network solutions including gateways/terminals | • |
Microwave- based networking equipment | • |
Telematics development | ||||||||||||||||||||||
| • |
ISP services including e-mail | • |
Intranet/Internet access | • |
Intranet/Internet access | • | Wireless backhaul equipment for cellular service providers | |||||||||||||||||||||||||||
| • |
IP VPN | • • |
IP VPN Multicast file delivery/video streaming |
• •
•
• |
IP VPN Multicast file delivery/video streaming Customized business solutions Turnkey managed network services |
|||||||||||||||||||||||||||||
| • |
Customized business solutions | |||||||||||||||||||||||||||||||||
| • |
Turnkey managed network services | |||||||||||||||||||||||||||||||||
| - Program and Installation - Management - Maintenance - Customer care |
• |
- Program and Installation - Management - Maintenance - Customer care Inventory management |
||||||||||||||||||||||||||||||||
| • |
Inventory management | |||||||||||||||||||||||||||||||||
| • |
Content distribution | • |
Content distribution | |||||||||||||||||||||||||||||||
| • |
Online Learning | • |
Online Learning | |||||||||||||||||||||||||||||||
| • |
Satellite and Terrestrial transport | • |
VoIP | |||||||||||||||||||||||||||||||
| Representative Customers | • | Internet subscribers | • |
ExxonMobil Corporation, Blockbuster, Inc., GTECH Corporation, Lowe’s, Wendy’s International, BP, Wyndham Worldwide Corporation, Chevron Corporation, Shell, Walgreens Co., Rite Aid, YUM Brands, Social Security Administration, Burger King Corporation, ConocoPhillips | • |
Avanti Communications Group plc, VISA International Service Association, World Bank, Communications and Transport Ministry of México (SCT) , Telefonica, Afsat, the Ministry of Foreign Affairs of Saudi Arabia, State Bank of India, Camelot Group plc, Bentley Walker, TIM BRASIL, VIVO, Telemar Norte Leste | • | Globalstar, Inc., ICO Global Communications Ltd., Inmarsat Ltd., LightSquared, Inc., Boeing Company, TerreStar Networks, Inc., Thuraya Satellite Telecommunications Company, Iridium Communications, Inc. | • | Nokia Siemens Networks, Vodafone Italy/ Portugal/Greece, Wind Italy/Greece, Vodacom South Africa, PTC Poland, BTC Bulgaria, T-Mobile Czech, Crowley Poland, Covad USA, GTS Central Europe | • | Hughes Telematics, Inc. | ||||||||||||||||||||||
7
Table of Contents
North America Broadband Segment
Business Overview
In August 2007, we launched our SPACEWAY 3 satellite and introduced service in North America on the SPACEWAY network in April 2008. SPACEWAY 3 was designed and developed as a next generation Ka-band broadband satellite system with a unique architecture for broadband data communications. Because SPACEWAY 3 supports higher data rates and offers direct user-to-user network connectivity, we are able to offer our North American enterprise and consumer customers faster communication rates, reduce our operating costs substantially through the reduction of third-party transponder capacity expenses as we utilize the additional capacity of SPACEWAY 3, and as a result, significantly improve our margins.
To further expand our business in North America, in June 2009, we entered into a contract with SS/L to build our Jupiter satellite, which is anticipated to be launched in the first half of 2012. We believe that our satellites will provide us the opportunity to grow our Consumer business and provide specialized services aimed at expanding our offerings to large enterprises, allowing us to compete more effectively in the enterprise wide area networking market.
Consumer Group
Our Consumer group was launched in 2001. Utilizing our VSAT data networking capabilities, we have developed a consumer service that reaches all 50 states, Puerto Rico and parts of Canada. With the advent of competing low-cost cable modem and Digital Subscriber Line (“DSL”) services, we have focused our marketing and sales efforts on the underserved markets that would be less likely to receive terrestrial broadband service. These markets include rural and suburban areas. We deliver broadband Internet service with an accompanying set of Internet service provider (“ISP”) services such as e-mail and web hosting and offer various service plans to appeal to particular market segments.
The user terminal for our consumer customers consists of a 0.74m or 0.98m antenna and radio transceiver located on the roof or side of a home and a satellite modem located indoors near the user’s computer or router. Our third-party contractors install the user terminals for our customers and we have developed an extensive set of business processes and systems to maintain the quality and timeliness of our installations. We use gateways throughout the United States to communicate with the consumer terminals. From these gateway locations, we connect directly to the public Internet and host our ISP services. Our network operations centers in Germantown, Maryland, and Las Vegas, Nevada, manage the delivery of our service and maintain our quality and performance. Our network operations centers also provide advanced engineering support to our customer call centers.
We modify our service offerings from time to time to provide packages that are attractive to our customers. Currently, our service packages provide our customers the option to purchase the equipment up front or to rent the equipment with a 24-month service contract and a monthly service fee that varies depending on the level of service selected and includes the following:
| • | satellite-based Internet access; |
| • | live technical support that is available 24 hours per day, seven days per week; |
| • | multiple e-mail accounts; |
| • | professional standard installation; and |
| • | a commercial-grade antenna. |
Enterprise Group
We provide or enable a variety of network equipment and services for uses such as private networking, intranet and Internet broadband access, voice services, connectivity to suppliers, franchisees and customers,
8
Table of Contents
credit authorization, inventory management, content delivery and video distribution to enterprises. Our Enterprise group offers complete turnkey solutions and managed services to enterprises, including program management, installation, training and support services. In North America, we deliver services using not only our VSAT satellite transport platforms, but also DSL and wireless transport platforms. We currently serve more than 200 companies, including Fortune 1000 companies, which have numerous widely dispersed operating units. Our enterprise customer base includes industry leaders in the energy, hospitality, retail and services industries.
We maintain our market leadership position by offering global large enterprises customizable and complete turnkey solutions. Enterprise customers typically enter into non-cancelable contracts with an average duration of three to five years. These contracts typically include commitments for specific levels of service and bandwidth, as well as bundled packages consisting of hardware, services and capacity across our network that are tailored specifically to their needs.
Our networking capabilities have attracted a strong franchisee customer base that includes large national chains. We provide these customers with a complete solution to enhance internal sales activities, develop brand-specific IP credit solutions, build secure branded websites and launch successful sales campaigns.
Sales, Marketing and Distribution
Our distribution strategy is designed around a core sales team that has developed an extensive knowledge of our customers’ requirements. For our Enterprise group, the market coverage by our direct sales force is supplemented by additional distribution channels, including resellers, retail, and direct-marketing, in order to maximize our potential customer base. For our Consumer group, we have an extensive independent nationwide retail distribution network consisting of distributors, dealers, sales agents and major retailers. Our distribution channels reach across North America. Our distributors recruit and support dealers throughout the territory in their efforts to sell our services and also coordinate installation of the equipment for all our customers. Our sales and marketing operations are based at our corporate headquarters in Germantown, Maryland. We also maintain other regional sales offices in North America. We will continue to grow our direct and indirect marketing and distribution channels through direct mail, television advertising, dealers, sales agents and value added resellers.
In August 2010, we were awarded $58.7 million from the U.S. Government as the only national provider of high-speed satellite broadband service under the broadband stimulus programs, established pursuant to the American Recovery and Reinvestment Act of 2009. This award is part of the U.S. Government’s investments in broadband projects to expand access to broadband service and create jobs and economic opportunity in rural, underserved communities nationwide. We began to offer services to customers under this program in October 2010.
Installation and Technical Support
We rely extensively on a third-party installation network covering all 50 U.S. states, Canada and Puerto Rico. Our network of installation teams are trained and certified by us and are required to meet installation guidelines that we monitor. The installation services are managed and tracked on a web-based work order management system that provides the visibility and accountability to manage installation and trouble resolution for each customer. Our installers and service contractors must complete a certification program and their work is subject to quality control audits.
We provide our customers with comprehensive support services, which may include a sales team that consists of a program manager, engineers and account team members. We also provide our customers with a customer care web portal, which allows them to open trouble tickets and track problems or failures from start to resolution. Our maintenance support services are provided by a third party that has many service sites throughout the U.S., including Alaska and Hawaii, Puerto Rico and Canada. These sites are staffed with technicians trained
9
Table of Contents
in accordance with standards that we establish. Additionally, our help desk and network operations centers provide 24-hour technical support. The customer service representatives at these call centers are also trained in accordance with standards that we establish. Our call center operations currently utilize both in-house and outsourced support.
We have engaged several companies to provide call center support for our customers. Such companies are organized to handle calls from our retail customers regarding service, billing and installation support, and they provide deep support to our wholesale customers. These centers are supervised by our customer service organization, and they process most customer calls. We have a staff of technical support personnel that assist these centers with difficult or unusual problems.
International Broadband Segment
Business Overview
Enterprise Group
We provide satellite communication network products and services to customers worldwide. Our products and services are particularly well-suited to many of our international markets because of the geographic dispersion of our customers as well as the lack of local infrastructure. We have also shifted our international focus from providing only hardware to also providing shared-hub services, modeled in part on our North American enterprise business. Shared-hub services are now available both via our own hubs covering Europe, Brazil, China, Northern Africa, India and the Middle East and through third party and joint venture operations.
We lease transponder capacity on satellites from multiple providers for our enterprise customers. We also maintain hub facilities, located in Germany, China, India and Brazil that provide ground support to our international enterprise customers.
Our international customers span a wide variety of industries and include state-owned operators as well as private businesses. Our service and product offerings in our International Enterprise group are substantially similar to those in our North American Enterprise group. In addition, we have been successful in providing application solutions that are especially well-suited to emerging markets. Examples include satellite based distance learning and education services in Mexico and India, Internet access centers available to populations in remote areas in India for e-governance and delivery of digitized cinema to movie theaters.
Sales, Marketing and Distribution
Our equipment sales and marketing activities are performed directly through our sales offices in the United States and other parts of the world. We currently have sales offices in Germantown, Maryland; Milton Keynes, United Kingdom; Griesheim, Germany; Rome, Italy; Sao Paulo, Brazil; Mexico City, Mexico; New Delhi, Mumbai and Bangalore in India; Dubai, United Arab Emirates; Moscow, Russia; Jakarta, Indonesia; and Beijing, China. In addition, depending on the need, we appoint sales representatives in various countries who are compensated on a commission basis. In other areas, notably Africa, the Middle East, Japan, the Russian Federation, Australia, Indonesia and Malaysia, we provide our infrastructure equipment to independent service providers that in turn provide the satellite communications services to enterprise customers using our equipment. We also pursue dedicated systems sales using a combination of our own sales staff and our sales representative channels.
We have established subsidiaries in Europe, China, India and Brazil that provide end-to-end communication services to customers in those regions. These subsidiaries are fully staffed with local sales, marketing, support, administrative and management staff. Periodic training is provided to our sales staff and channels through regional seminars and training sessions at our Germantown, Maryland headquarters.
10
Table of Contents
Installation and Technical Support
Our European, Indian, Brazilian and Chinese operations provide VSAT installation services for our customers through a network of third-party installers, similar to our North American installation operations. In certain limited circumstances, we provide installation services ourselves. In regions that are not covered by our services, our customers provide their own installation services. In all instances, hub equipment installation services are provided by our Germantown, Maryland or India installation teams.
We provide hardware and software maintenance services through annual customer assistance center maintenance agreements. On-site repair of VSATs and maintenance services are provided in Europe, India and Brazil through subcontractors. In other areas, our customers provide their own repair services to the end-users. Our customer assistance center maintenance offerings include a customer assistance center that is operated 24 hours per day, 365 days per year, and is available to our customers worldwide, as well as assistance through regional support centers in Europe, India and Brazil. In addition, an on-line trouble reporting and tracking system, functionally similar to our North American counterpart, is made available to our customers around the world.
Telecom Systems Segment
Business Overview
The Telecom Systems segment consists of the Mobile Satellite Systems group, the Terrestrial Microwave group, and the Telematics group. We believe our Mobile Satellite Systems and Terrestrial Microwave groups address strategic markets that have significant advantages. None of these groups requires substantial operating cash or working capital and each of them is a low fixed-cost operation.
Mobile Satellite Systems Group
Our Mobile Satellite Systems group provides turnkey satellite ground segment systems to mobile system operators that include Globalstar, Inc. (“Globalstar”), ICO Global Communications Ltd. (“ICO”), Inmarsat plc, LightSquared, Inc. (“LightSquared,” formerly SkyTerra Communications, Inc.), Mexico’s Secretary of Communication and Transport via a subcontract to Boeing Company (MEXSAT program), TerreStar Networks, Inc. (“TerreStar”), Thuraya Satellite Telecommunications Company and Iridium Communications, Inc. (“Iridium”). As a part of these system solutions, we provide design and development, engineering, terminals, Ground Based Beam Forming (“GBBF”) equipment, Base Station solutions, Radio Access Networks (“RAN”) and other subsystems as may be required. These systems provide voice, data and fax services to handheld or transportable terminals. The Mobile Satellite Systems group generally has large, multi-year contracts with its customers.
We will continue to develop and leverage our satellite communication expertise in the Mobile Satellite Systems group on an opportunistic basis. We also have been actively pursuing a number of opportunities in the area of hybrid satellite/terrestrial mobile networks. For example, we have completed development and deployment of GBBF equipment for two different satellite systems. We have also completed the development of satellite base stations for LightSquared, TerreStar and ICO. In addition, we are under contract with TerreStar for development of a satellite chipset and platform to enable the utilization of handheld terminals and Globalstar to provide next generation RAN and a user terminal chipset. In addition, we are under contract with Iridium to design and deploy a replacement of an Access Network Controller for their existing satellite communication system. We believe that the Ancillary Terrestrial Component operator business is a growth area of the mobile satellite industry as it allows sharing of bandwidth between terrestrial and satellite applications. We develop and manufacture satellite terminals for the land portable and land mobile market segments, including machine to machine SCADA applications for the Inmarsat BGAN system. We also manufacture BGAN terminals on an OEM basis for the maritime and military sectors.
11
Table of Contents
The Mobile Satellite Systems group has been and will continue to be a complementary part of our core VSAT business. Our VSAT technology and engineering teams support our mobile satellite efforts, which in turn contribute to advancing our technology in the VSAT arena with customer funded programs.
Terrestrial Microwave Group
We have developed a family of broadband products for point-to-multipoint (“PMP”) microwave radio network systems that enable mobile operators to connect their cell sites and fixed operators to provide wireless broadband services quickly, cost-effectively and competitively. Our broadband PMP microwave systems have gained a reputation for technical excellence and have been deployed in North America, South America, Europe, Africa, and Asia by well known operators.
Our current contracts require us to either supply equipment along with support services on a turnkey basis, or simply supply equipment to the end customers or our distributors. Typically, contracts range from one to five years for the supply of equipment with corresponding periods for equipment maintenance services. We do not anticipate significant expansion in the Terrestrial Microwave group; however, we will continue to assess customer opportunities on a project-by-project basis.
Telematics Group
We entered into an agreement with HTI to provide development, engineering and manufacturing services and an overall automotive telematics system for HTI, comprising the telematics system hub and the Telematics Control Unit. As a result of the adverse impact of the economy in the automobile industry in 2009, one of HTI’s customers filed bankruptcy. Consequently, HTI terminated substantially all of the development, engineering and manufacturing services with us in August 2009. We expect our future revenue from the Telematics group to be insignificant.
HTS Satellite Segment
The HTS Satellite segment, which consists of activities related to the development, construction and launch of high throughput satellites, was established in 2010. Currently, the HTS Satellite segment includes construction activities of our Jupiter satellite and the development of related network equipment.
Corporate and Other Segment
The Corporate and Other segment consists of certain minority interest investments held by us and our corporate offices and assets not related to another business segment.
Our Strengths
Our strengths include the following:
Leading Satellite Internet Broadband Access Provider to Underserved Rural Consumer Markets in North America—We focus our marketing and sales efforts on underserved markets that are less likely to receive terrestrial broadband service. We believe that the existing or contemplated terrestrial broadband solutions are not likely to provide access to the Consumer market in the foreseeable future given the high costs associated with developing a terrestrial network and the lack of population density in some of these markets. Since we are one of the few satellite broadband service providers to address this market, it represents a significant growth opportunity for us.
Leading Provider of Broadband Satellite Network Services and Systems to the Enterprise Market—Over the last 20 years, we have shipped more than 2.5 million VSAT terminals to customers in more than 100 countries.
12
Table of Contents
We have maintained our leadership position in this market, which has allowed us to leverage our scale and expertise to offer a broader suite of enhanced managed services to our customers. Our enterprise customers include blue chip companies and leaders in the retail, energy, financial, hospitality and services industries. Our customers typically have widely dispersed branches spread over a large geographic area, such as gas service stations (Shell International, ExxonMobil Corporation, BP, ConocoPhillips and Chevron Corporation) and retailers (Walgreens Co., Rite Aid Corporation and Lowe’s Companies, Inc.). Service contracts with these enterprises generally range from three to five years in duration and historically, we have experienced a high rate of renewals. We also have many long-term relationships with our customers, some of which exceed 20 years, which have contributed to a significant revenue backlog.
SPACEWAY 3 Provides Significant Additional Capacity and Operating Leverage—Our SPACEWAY 3 satellite is one of the most technologically advanced satellite broadband services platforms in our industry, optimized for data and designed to provide 10 gigabits per second of capacity and subscriber speeds comparable to DSL. SPACEWAY 3 enables us to more effectively offer bandwidth on demand through its dynamic capacity allocation and on board routing capabilities. In addition, SPACEWAY 3 provides us with significant cost savings by decreasing transponder leasing expenses. In April 2008, we began to provide service on the SPACEWAY network.
Market Leader in Technology and Innovation—We have been a leader in pioneering major advances in satellite data communication technology since we developed the first VSAT network more than 20 years ago. Through our focused research and development efforts, we have developed industry-leading hardware and software technology that has proven critical to the development of VSAT industry standards. We have designed a common platform for all of our existing broadband products which reduces costs for research and development, manufacturing, maintenance, customer support and network operations. The common platform also allows us to develop solutions for new and different end markets.
Diversified Revenue Stream—We benefit from a geographically diverse revenue stream that consists of a mix of services and hardware revenues. In 2010, we derived approximately 75.8% of our global revenues from providing services and 24.2% from hardware revenues and enterprise equipment leases. We expect service revenues to continue to exceed hardware revenues in the foreseeable future. Within the North America and International Broadband segments, our revenues are well diversified across our customer base and not concentrated in a few large customers.
Experienced Senior Management Team and Strong Controlling Private Equity Stockholder—Our senior management team has extensive experience in the satellite communications industry, with an average industry experience of 31 years. We are majority-owned by various investment vehicles that are affiliated with Apollo Management, L.P., together with its affiliates (“Apollo”). Apollo is a leading private equity investment firm with significant expertise in the satellite communications sector.
Our Business Strategy
Our business strategy, before giving effect to the Merger, is to continue growing our revenue and cash flow generation capability by capitalizing on the increasing demand for consumer satellite broadband and enterprise solutions, while lowering our costs and utilizing our industry expertise and technology leadership. Our strategy includes the following initiatives:
| • | Continue our focus on being the technology leader and the low cost provider to facilitate our growth; |
| • | Continue to provide high levels of reliable and quality services with a stable enterprise market characterized by long-term contracts that have a high renewal rate providing the base for us to grow; |
| • | Continue to expand our VSAT growth through our Consumer group in the North America Broadband segment and our service companies in the International Broadband segment; |
| • | Expand on the opportunities for growth in the Telecom System segment by extending our reach with mobile satellite projects; |
13
Table of Contents
| • | Continue to expand our vertical integration strategy from satellite to subscriber on a global basis; and |
| • | Lower our transponder leasing costs substantially and significantly improve our margins through the utilization of SPACEWAY 3 and Jupiter. |
Consistent with our strategy to grow and improve our financial position, we also review our competitive position on an ongoing basis and, from time to time, consider various acquisitions, strategic alliances, and divestitures, which we believe would be beneficial to our business.
Competition
The network communications industry is highly competitive. As a provider of data network products and services in the United States and internationally, we compete with a large number of telecommunications service providers. This increasingly competitive environment has put pressure on prices and margins. To compete effectively, we emphasize our network quality, our customization capability, our offering of networks as a turnkey managed service rather than as an equipment sale, our position as a single point of contact for products and services and our competitive prices.
We face competition in our North American Consumer group on several fronts. The traditional telecommunications and wireless carriers, as well as DSL and cable Internet service providers offer competing services in many communities we seek to serve. Cost, speed and accessibility are key determining factors in the election of a service provider by the consumer. In addition, we face direct competition from other satellite broadband providers in virtually all of our markets. Our primary satellite competitor is WildBlue Communications, Inc. (“WildBlue”), which is owned by Viasat, Inc. (“ViaSat”). To a much lesser extent, we compete with smaller satellite operators such as Spacenet, Inc., which is a subsidiary of Gilat Satellite Networks Ltd. (“Gilat”). We offer service throughout the United States, as well as in Puerto Rico and Canada. We seek to differentiate ourselves based on our service quality, proprietary technology, distribution channels and the SPACEWAY 3 satellite network. Currently, we have capacity available for expansion in all of our markets and expect this to be an advantage over WildBlue until sometime in the second half of 2011 when ViaSat expects to launch a new satellite for use by WildBlue. We believe that we will have sufficient capacity to grow our business and that our capacity will grow significantly when we launch our next generation satellite, Jupiter, in the first half of 2012. However, faster subscriber growth rates than anticipated or increases in subscriber consumption of capacity beyond our current expectations could force us to modify our marketing and business plans in some of our coverage regions, prior to the launch of Jupiter. The competitive dynamic between us and our competitors is constantly changing as we and our competitors strive to improve our respective competitive positions. While the current competitive dynamic provides us the opportunity to grow our business, we cannot be certain of its continuing effects on our business as our competitors modify or adapt their strategies and service offerings.
We have encountered competition in our Enterprise groups from major established carriers such as AT&T Corp., Verizon, Sprint Corporation, British Telecommunications plc, France Télécom, Deutsche Telekom AG and the global consortia of telecom operators and other major carriers, which provide international telephone, private line and private network services using their national telephone networks and those of other carriers.
Our broadband networks generally have an advantage over terrestrial networks where the network must reach many locations over large distances, where the customer has a “last mile” or congestion problem that cannot be solved easily with terrestrial facilities and where there is a need for transmission to remote locations or emerging markets. By comparison, ground-based facilities (e.g., fiber optic cables) often have an advantage for carrying large amounts of bulk traffic between a small number of fixed locations. However, because of a customer’s particular circumstances, the pricing offered by suppliers and the effectiveness of the marketing efforts of the competing suppliers also play a key role in this competitive environment.
Our principal competitors in our Enterprise groups for the supply of VSAT satellite networks are Gilat, ViaSat and iDirect Technologies (“iDirect”). Unlike Gilat, which offers a full line of broadband products and
14
Table of Contents
services for enterprise customers, ViaSat and iDirect offer enterprises only broadband products. In competing with Gilat, ViaSat and iDirect, we emphasize particular technological features of our products and services, our ability to customize networks and perform desired development work, the quality of our customer service and our willingness to be flexible in structuring arrangements for the customer. We are aware of other emerging competitors that supply networks, equipment and services. We also face competition from resellers and numerous local companies who purchase equipment and sell services to local customers.
The satellite market currently has two open technology standards for VSAT equipment: (i) Internet Protocol over Satellite (“IPoS”), which is our own standard and is recognized by the European Telecommunications Standards Institute (“ETSI”), in Europe, the Telecommunications Industry Association in the United States and the International Telecommunication Union (“ITU”) and (ii) Digital Video Broadcast-Return Channel by Satellite (“DVB-RCS”), which is also recognized by the ETSI and the ITU. There are several manufacturers providing and supporting DVB-RCS and some manufacturers are considering providing and supporting IPoS.
Government Regulation
The provision of telecommunications is highly regulated. We are required to comply with the laws and regulations of, and often obtain approvals from, national and local authorities in connection with most of the services that we provide. As a provider of communications services in the United States, we are subject to the regulatory authority of the United States, primarily the FCC. We are also subject to the export control laws and regulations and trade and economic sanctions laws and regulations of the United States with respect to the export of telecommunications equipment and services. Certain aspects of our business are subject to state and local regulation. The FCC has preempted many state and local regulations that impair the installation and use of VSATs. However, our business nonetheless may be adversely affected by state and local regulation, including zoning regulations that impair the ability to install VSATs. In addition, we are subject to regulation by the national communications regulatory authorities of other countries in which we, and under certain circumstances our resellers and distributors, provide service.
Regulation by the FCC
All commercial entities that use radio frequencies to provide communications services in the United States are subject to the jurisdiction of the FCC under the Communications Act of 1934, as amended. The Communications Act prohibits the operation of certain satellite earth station facilities, such as those operated by us and certain of our customers, except under licenses issued by the FCC. Changes in our FCC-licensed earth station operations require license modifications that generally must be approved by the FCC in advance. The earth station licenses we hold are granted for ten to fifteen year terms. The FCC also has granted periodic requests by us for special temporary authorizations and experimental authorizations to operate new or modified facilities on a temporary basis. The FCC generally renews satellite earth station licenses routinely.
As a provider of telecommunications in the United States, we are presently required to contribute a percentage of our revenues from telecommunications services to the Universal Service Fund to support mechanisms that subsidize the provision of services to low-income consumers, high-cost areas, schools, libraries and rural health care providers. This percentage is set each calendar quarter by the FCC. Current FCC rules permit us to pass this Universal Service Fund contribution through to our customers.
The FCC also requires broadband Internet access and Internet telephony service providers to comply with the requirements of the Federal Communications Assistance for Law Enforcement Act (“CALEA”). CALEA requires telecommunications carriers, including satellite-based carriers, to ensure that law enforcement agencies are able to conduct lawfully-authorized surveillance of users of their services.
As a provider of interconnected VOIP services, we are required to abide by a number of rules related to telephony service. Some of the key regulations that pertain to us are rules dealing with the protection of customer information and the processing of emergency calls.
15
Table of Contents
FCC Licensing of Satellites
We currently hold a license issued by the FCC to operate SPACEWAY 3 at 95° West Longitude. We also hold authorizations through the Office of Communications in the United Kingdom to operate satellites at certain locations on the geostationary arc, which we may use for SPACEWAY 3, Jupiter or any future satellites we acquire.
Our spacecraft operations are subject to the licensing jurisdiction of, and conditions imposed by, the FCC and any other government whose ITU filing we use to operate the satellite. Such conditions may include, for example, that we implement the satellite system in a manner consistent with certain milestones (such as for the satellite design and construction, ground segment procurement, and launch and implementation of service), that the satellite control center be located in national territory, that a license be obtained prior to launching or operating the satellite or that a license be obtained before interconnecting with the local switched telephone network.
ITU Frequency Registration
The orbital location and frequencies for our satellites are subject to the frequency registration and coordination process of the ITU. The ITU Radio Regulations define the international rules and rights for a satellite to use specific radio frequencies at a specific orbital location. We have made filings with the ITU for SPACEWAY 3, Jupiter and for other potential future satellites we acquire.
International Regulation
We must comply with the applicable laws and regulations and, where required, obtain the approval of the regulatory authority of each country in which we, or under certain circumstances our resellers, provide services or operate earth stations. The laws and regulatory requirements regulating access to satellite systems vary from country to country. In certain countries, a license is required to provide our services and to operate satellite earth stations. The application procedure can be time-consuming and costly in some countries, and the terms of licenses vary for different countries. In some countries, there may be restrictions on our ability to interconnect with the local switched telephone network. In addition, in certain countries, there are limitations on the fees that can be charged for the services we provide.
Many countries permit competition in the provision of voice, data or video services, the ownership of the equipment needed to provide telecommunications services and the provision of transponder capacity to that country. We believe that this trend should continue due to commitments by many countries to open their satellite markets to competition. In other countries, however, a single entity, often the government-owned telecommunications authority, may hold a monopoly on the ownership and operation of telecommunications facilities or on the provision of telecommunications to, from or within the country. In those cases, we may be required to negotiate for access to service or equipment provided by that monopoly entity, and we may not be able to obtain favorable rates or other terms.
Export Control Requirements and Sanctions Regulations
In the operation of our business, we must comply with all applicable export control and economic sanctions laws and regulations of the United States and other countries. Applicable United States laws and regulations include the Arms Export Control Act, the International Traffic in Arms Regulations (“ITAR”), the Export Administration Regulations and the trade sanctions laws and regulations administered by the United States Department of the Treasury’s Office of Foreign Assets Control (“OFAC”).
The export of certain hardware, technical data and services relating to satellites to non-United States persons is regulated by the United States Department of State’s Directorate of Defense Trade Controls, under the ITAR.
16
Table of Contents
Other items are controlled for export by the United States Department of Commerce’s Bureau of Industry and Security (“BIS”), under the Export Administration Regulations. For example, BIS regulates our export of equipment for earth stations in ground networks located outside of the United States. In addition, we cannot provide certain equipment or services to certain countries subject to United States trade sanctions unless we first obtain the necessary authorizations from OFAC. We are also subject to the Foreign Corrupt Practices Act that prohibits payment of bribes or giving anything of value to foreign government officials for the purpose of obtaining or retaining business or gaining a competitive advantage.
Intellectual Property
We currently rely on a combination of patent, trade secret, copyright and trademark law, together with licenses, non-disclosure and confidentiality agreements and technical measures, to establish and protect proprietary rights in our products. We hold United States patents covering various aspects of our products and services, including patents covering technologies that we believe will enable the production of lower cost satellite terminals and provide for significant acceleration of communication speeds and enhancement of throughput. By federal statute, the duration of each of our patents is 20 years from the earliest filing date. We have granted licenses to use our trademarks and service-marks to resellers worldwide, and we typically retain the right to monitor the use of those marks and impose significant restrictions on their use in efforts to ensure a consistent brand identity. We protect our proprietary rights in our software through software licenses that, among other things, require that the software source code be maintained as confidential information and prohibit any reverse-engineering of that code.
We believe that our patents are important to our business. We also believe that, in some areas, the improvement of existing products and the development of new products, as well as reliance upon trade secrets and unpatented proprietary know-how, are important in establishing and maintaining a competitive advantage. We believe, to a certain extent, that the value of our products and services are dependent upon our proprietary software, hardware and other technology, remaining “trade secrets” or subject to copyright protection. Generally, we enter into non-disclosure and invention assignment agreements with our employees, subcontractors and certain customers and other business partners.
Research and Development, Engineering and Manufacturing
We have a skilled and multi-disciplined engineering organization that develops our products and services. Our in-house technological capability includes the complete set of skills required to develop the hardware, software and firmware required in our products and services. In addition to our product development skills, over the past 30 years, we have pioneered numerous advances in the area of wireless communication techniques and methodologies. During this period, the Company and its predecessors have been granted over 500 patents, many of which have been adopted in numerous communication standards in both satellite and terrestrial systems. Of these patents, HNS currently owns over 230 patents. The remaining patents are subject to either a royalty-free perpetual license or a covenant not to assert from The DIRECTV Group, Inc., HNS’ former parent.
With respect to hardware development, our skill-set includes complex digital designs, radio frequency and intermediate frequency analog designs, advanced application-specific integrated circuit designs and sophisticated consumer and system level packaging designs. We also have extensive experience in developing products for high-volume, low-cost manufacturing for the consumer industry, including satellite TV set-top receivers and dual mode satellite and cellular handsets.
As a complement to our hardware development, we have developed extensive experience in designing reliable software systems as part of our telecommunication systems and services offerings. For example, our broadband product line for the enterprise market supports an extensive range of protocols for data communications. Our software engineers have also developed many large turnkey systems for our customers by
17
Table of Contents
designing the overall solution, implementing the various subsystems, deploying the entire network and user terminals, integrating and verifying the operational system and ultimately training the customers’ technicians and operators.
Our products are designed, manufactured and tested primarily at our facilities in Maryland; however, we outsource a significant portion of the manufacturing of our products to third parties. Our manufacturing facilities, together with our third-party arrangements, have sufficient capacity to handle current demand. We continuously adjust our capacity based on our production requirements. We also work with third-party vendors for the development and manufacture of components that are integrated into our products. We develop dual sourcing capabilities for critical parts when practical and we evaluate outsourced subcontract vendors on a periodic basis. We have implemented a multifaceted strategy focused on meeting customer demand for our products and reducing production costs. Our operations group, together with our research and development group, work with our vendors and subcontractors to reduce development costs and to increase production efficiency in order to obtain components at lower prices.
Subsidiaries
We own a number of subsidiaries. A complete list of our subsidiaries is filed as Exhibit 21.1 to this report.
Environmental
We are subject to various federal, state and local laws relating to the protection of the environment, most significantly the Resource Conservation and Recovery Act (“RCRA”) and the Emergency Planning and Community Right-to-Know Act (“EPCRA”). Our Safety, Health and Environmental Affairs department manages our compliance with all applicable federal and state environmental laws and regulations.
Under the RCRA, we are considered a small quantity generator. As such, we perform weekly inspections of any waste storage areas to ensure that their integrity has not been breached and to ensure that the waste receptacles are intact. We also label all hazardous waste containers with appropriate signage identifying both the contents and the date the waste was generated, and we use a third-party waste hauler to transport and dispose of such waste. Hazardous and other waste is manifested and shipped in accordance with Environmental Protection Agency, Department of Transportation and relevant state regulations.
As required by the EPCRA, we file periodic reports with regulators covering four areas: Emergency Planning, Emergency Release, Hazardous Chemical Storage and Toxic Chemical Release. We maintain small quantities of hazardous materials on our premises and, therefore, have relatively modest reporting requirements under the EPCRA.
Our environmental compliance costs to date have not been material, and we currently have no reason to believe that such costs will become material in the foreseeable future.
Employees and Labor Relations
As of December 31, 2010, we had 2,254 employees, including 648 employees from our less than wholly-owned subsidiaries. Other than 54 of our employees located in Italy and Brazil, none are represented by a union. We believe that our relations with our employees are good.
Generally, our employees are retained on an at-will basis. However, we have entered into employment and non-competition agreements with our Chief Executive Officer, Chief Financial Officer, General Counsel and each of our Executive Vice Presidents. We require all at-will employees to sign at-will employee agreements which contain a confidentiality agreement and an agreement not to compete with the Company during their employment with us and for a period of two years following the termination of their employment.
18
Table of Contents
Additional Information
The Securities and Exchange Commission (the “SEC”) maintains an Internet site (http://www.sec.gov) that contains periodic and other reports such as annual, quarterly and current reports on Forms 10-K, 10-Q and 8-K, respectively, as well as proxy and information statements regarding the Company, Hughes Network Systems, LLC and other companies that file electronically with the SEC. Copies of our SEC filings, including our annual reports on Form 10-K, quarterly reports on Form 10-Q, current reports on Form 8-K, and amendments to those reports filed or furnished pursuant to Section 13(a) or 15(d) of the Exchange Act, are available on our website as soon as reasonably practicable after we electronically file such reports with the SEC. Investors and other interested parties can also access these reports at www.hughes.com and follow the link to Investor Relations.
19
Table of Contents
| Item 1A. | Risk Factors |
This section should be read carefully considering the risks described below as well as other information and data included in this report. Any of the following risks could materially and adversely affect our business, results of operations and financial condition.
Risks Related to the Nature and Operation of Our Business
The enterprise network communications industry is highly competitive. We may be unsuccessful in competing effectively against other terrestrial and satellite-based network providers in our Enterprise groups.
We operate in a highly competitive enterprise network communications industry in the sale and lease of our products and services. Our industry is characterized by competitive pressures to provide enhanced functionality for the same or lower price with each new generation of technology. As the prices of our products decrease, we will need to sell more products and/or reduce the per-unit costs to improve or maintain our results of operations. Our Enterprise groups face competition from providers of terrestrial-based networks, such as Digital Subscriber Line (“DSL”), cable modem service, Multiprotocol Label Switching and Internet protocol-based virtual private networks, which may have advantages over satellite networks for certain customer applications. Terrestrial-based networks are offered by telecommunications carriers and other large companies, many of which have substantially greater financial resources and greater name recognition than us.
The costs of a satellite network may exceed those of a terrestrial-based network, especially in areas that have experienced significant DSL and cable Internet build-out. It may become more difficult for us to compete with terrestrial providers as the number of these areas increase and the cost of their network and hardware services declines. We also compete for enterprise clients with other satellite network providers, satellite providers that are targeting small and medium businesses and smaller independent systems integrators on procurement projects. In Asia and Latin America, the build-out of terrestrial networks has adversely impacted demand for very small aperture terminal (“VSAT”) services and regulation and inequitable access remain barriers to new business.
The consumer network communications market is highly competitive. We may be unsuccessful in competing effectively against DSL and cable service providers and other satellite broadband providers in the Consumer market.
We face competition in our Consumer group primarily from DSL and cable Internet service providers. Also, other satellite and wireless broadband companies have launched or are planning the launch of consumer satellite Internet access services in competition with us in North America. Some of these competitors offer consumer services and hardware at lower prices than ours. In addition, terrestrial alternatives do not require our external dish which may limit customer acceptance of our products.
If we are unable to develop, introduce and market new products, applications and services on a cost effective and timely basis, or if we are unable to sell our new products and services to existing and new customers, our business could be adversely affected.
The network communications market is characterized by rapid technological changes, frequent new product introductions and evolving industry standards. If we fail to develop new technology or keep pace with significant industry technological changes, our existing products and technology could be rendered obsolete. Even if we keep up with technological innovation, we may not meet the demands of the network communications market. For example, our large enterprise customers may only choose to renew services with us at substantially lower prices or for a decreased level of service. Many of our large enterprise customers have existing networks available to them and may opt to find alternatives to our VSAT services or may renew with us solely as a backup network. If we are unable to respond to technological advances on a cost effective and timely basis, or if our
20
Table of Contents
products or applications are not accepted by the market, then our business, financial condition and results of operations would be adversely affected.
Economic factors may result in reduced demand and pricing pressure on our products and services.
Our business depends on the economic health and willingness of our customers and potential customers to make and adhere to capital and financial commitments to purchase our products and services. The U.S. and world economic markets have been undergoing a period of slowdown or recession, and the future economic environment may continue to be unfavorable. In addition, the telecommunications industry has been facing significant challenges resulting from excess capacity, new technologies and intense price competition. If the conditions in the U.S. and world economic markets continue to be volatile or deteriorate further or if the telecommunications industry experiences future weaknesses, we could experience reduced demand for, and pricing pressure on, our products and services, which could lead to a reduction in our revenues and adversely affect our business, financial condition and results of operations.
We face risks associated with our satellites.
If we are unable to continue to operate SPACEWAY 3, or to launch or operate Jupiter, as a result of any of the following risks, we will be unable to realize the anticipated benefits from such satellites, and our business, financial condition and results of operations could be adversely affected:
| • | Business plan—Our business plan may be unsuccessful, and we may not be able to achieve the cost savings that we expect from our satellites. A failure to attract a sufficient number of customers would result in our inability to realize the cost savings that we expect to achieve from the anticipated lower costs of bandwidth associated with the capacity of our satellites. In addition, we will continue to incur start-up losses associated with the launch and operation of our satellites until we acquire a sufficient number of customers. |
| • | Regulatory license risk—Our satellites are primarily intended to provide services to North America. Spacecraft operations are subject to compliance with the licensing conditions of the United States Federal Communications Commission (“FCC”) and those of any other government whose International Telecommunication Union filings we may use to operate our satellites in the future. Satellite authorizations granted by the FCC or foreign regulatory agencies are typically subject to conditions imposed by such regulatory agency in addition to such agency’s general authority to modify, cancel or revoke those authorizations. Failure to comply with such requirements, or comply in a timely manner could lead to the loss of authorizations and could have an adverse effect on our business, financial condition and results of operations. |
| • | In-orbit risks—SPACEWAY 3 is, and Jupiter will be, subject to similar potential satellite failures or performance degradations as other satellites. In-orbit risks similar to those described below under “—Satellite failures or degradations in satellite performance could affect our business, financial condition and results of operations” apply to our satellites. To the extent there is an anomaly or other in-orbit failure with respect to SPACEWAY 3, we do not currently have a replacement satellite or backup transponder capacity and would have to identify and lease alternative transponder capacity that may not be available on economic terms or at all. Likewise, if we send erroneous or corrupted signals to one of our satellites from the ground, such errors or corruption may result in a temporary or permanent loss of ability to use some or all of the communications capacity of such satellite. Additionally, we could be required to reposition the antennas of our customers, which would entail significant cost and could require new or modified licenses from regulatory authorities. |
| • | Insurance—The price, terms and availability of satellite insurance can fluctuate significantly. These policies may not continue to be available on commercially reasonable terms or at all. In addition to higher premiums, insurance policies may provide for higher deductibles, shorter coverage periods and policy exclusions related to satellite health. |
21
Table of Contents
| • | Launch risks—There are risks associated with the launch of satellites, including launch failure, damage or destruction during launch and improper orbital placement. Launch failures result in significant delays in the deployment of satellites because of the need both to construct replacement satellites, which can take up to 36-48 months, and obtain other launch opportunities. Only certain launch vehicles can lift and place into orbit spacecraft in the mass range of the Jupiter satellite, which further limits the launch opportunities for the Jupiter satellite. The overall historical loss rate in the satellite industry for all launches of commercial satellites in fixed orbits in the last five years is estimated by some industry participants to be 5% but may be higher. In April 2010, we entered into an agreement with Arianespace for the launch of our Jupiter satellite in the first half of 2012. |
| • | Cost and schedule risks—We may be required to spend in excess of our current forecast for the launch and launch insurance for our Jupiter satellite. The launch of satellites is often subject to delays resulting from launch vehicle construction delays, cost overruns, periodic unavailability of reliable launch opportunities and delays in obtaining regulatory approvals. |
Satellite failures or degradations in satellite performance could affect our business, financial condition and results of operations.
For many of our customers, we lease satellite transponder capacity from fixed satellite service (“FSS”) providers in order to send and receive data communications to and from our VSAT networks. Beginning on April 3, 2008, we also began providing capacity on our SPACEWAY 3 satellite. Satellites are subject to in-orbit risks including malfunctions, commonly referred to as anomalies, and collisions with meteoroids, decommissioned spacecraft or other space debris. Anomalies occur as a result of various factors, such as satellite manufacturing errors, problems with the power systems or control systems of the satellites and general failures resulting from operating satellites in the harsh space environment.
For risks associated with anomalies affecting our satellites, see “—We face risks associated with our satellites.” Any single anomaly or series of anomalies affecting the satellites on which we lease transponder capacity could materially adversely affect our operations and revenues and our relationships with current customers, as well as our ability to attract new customers for our satellite services. Anomalies may also reduce the expected useful life of a satellite, thereby creating additional expenses due to the need to provide replacement or backup capacity and potentially reduce revenues if service is interrupted on the satellites we utilize. We may not be able to obtain backup capacity at similar prices, or at all. In addition, an increased frequency of anomalies could impact market acceptance of our services.
Any failure on our part to perform our VSAT service contracts or provide satellite broadband access as a result of satellite failures could result in: (i) a loss of revenue despite continued obligations under our leasing arrangements; (ii) possible cancellation of our long-term contracts; (iii) inability to continue with our subscription-based customers; (iv) incurring additional expenses to reposition customer antennas to alternative satellites; and (v) damaging our reputation, which could negatively affect our ability to retain existing customers or to gain new business. The cancellation of long-term contracts due to service disruptions is an exception to the generally non-cancelable nature of our contracts, and such cancellation would reduce our revenue backlog described in this report. See “—The failure to adequately anticipate the need for transponder capacity or the inability to obtain transponder capacity could harm our results of operations.”
The failure to adequately anticipate the need for transponder capacity or the inability to obtain transponder capacity could harm our results of operations.
We have made substantial contractual commitments for transponder capacity based on our existing customer contracts and backlog, as well as anticipated future business, to the extent our existing customers are not expected to utilize our SPACEWAY 3 satellite. If future demand does not meet our expectations, we will be committed to maintain excess transponder capacity for which we will have no or insufficient revenues to cover our costs, which would have a negative impact on our margins and results of operations. Our transponder leases
22
Table of Contents
are generally for two to five years, and different leases cover satellites with coverage of different geographical areas or support different applications and features, so we may not be able to quickly or easily adjust our capacity to changes in demand. If we only purchase transponder capacity based on existing contracts and bookings, capacity for certain types of coverage in the future that cannot be readily served by SPACEWAY 3 may be unavailable to us and we may not be able to satisfy certain needs of our customers, which could result in a loss of possible new business and could negatively impact the margins earned for those services. At present, until the launch and operation of additional satellites, there is limited availability of capacity on the Ku-band frequencies in North America. In addition, the FSS industry has seen consolidation in the past decade, and today, the three main FSS providers in North America and a number of smaller regional providers own and operate the current satellites that are available for our capacity needs. The failure of any of these FSS providers or a downturn in their industry as a whole could reduce or interrupt the Ku-band capacity available to us. If we are not able to renew our capacity leases at economically viable rates, or if capacity is not available due to any problems of the FSS providers, our business and results of operations could be adversely affected, to the extent SPACEWAY 3 and Jupiter are unable to satisfy the associated demand.
Our networks and those of our third-party service providers may be vulnerable to security risks.
We expect the secure transmission of confidential information over public networks to continue to be a critical element of our operations. Our networks and those of our third-party service providers and our customers may be vulnerable to unauthorized access, computer viruses and other security problems. Persons who circumvent security measures could wrongfully obtain or use information on the network or cause interruptions, delays or malfunctions in our operations, any of which could have a material adverse effect on our business, financial condition and results of operations. We may be required to expend significant resources to protect against the threat of security breaches or to alleviate problems, including reputational harm and litigation, caused by any breaches. In addition, our customer contracts, in general, do not contain provisions which would protect us against liability to third parties with whom our customers conduct business. Although we have implemented and intend to continue to implement industry-standard security measures, these measures may prove to be inadequate and result in system failures and delays that could lower network operations center availability and have a material adverse effect on our business, financial condition and results of operations.
We are dependent upon suppliers of components, manufacturing outsourcing, installation, and customer service, and our results of operations may be materially affected if any of these third-party providers fail to appropriately deliver the contracted goods or services.
We are dependent upon third-party services and products provided to us, including the following:
| • | Components—A limited number of suppliers manufacture some of the key components required to build our VSATs. These key components may not be continually available and we may not be able to forecast our component requirements sufficiently in advance, which may have a detrimental effect on supply. If we are required to change suppliers for any reason, we would experience a delay in manufacturing our products if another supplier is not able to meet our requirements on a timely basis. In addition, if we are unable to obtain the necessary volumes of components on favorable terms or prices on a timely basis, we may be unable to produce our products at competitive prices and we may be unable to satisfy demand from our customers. |
| • | Commodity Price Risk—All of our products contain components whose base raw materials have undergone dramatic cost fluctuations in the last 24 months. Fluctuations in pricing of raw materials have the ability to affect our product costs. Although we have been successful in offsetting or mitigating our exposure to these fluctuations, such changes could have an adverse impact on our product costs. |
| • | Manufacturing outsourcing—While we develop and manufacture prototypes for our products, we use contract manufacturers to produce a significant portion of our hardware. If these contract manufacturers fail to provide products that meet our specifications in a timely manner, then our customer relationships may be harmed. |
23
Table of Contents
| • | Installation and customer support service—Each of our North American and international operations utilize a network of third-party installers to deploy our hardware. In addition, a portion of our customer support and management is provided by offshore call centers. Since we provide customized services for our customers that are essential to their operations, a decline in levels of service or attention to the needs of our customers or the occurrence of negligent and careless acts could adversely affect our reputation, renewal rates and ability to win new business. |
If our products contain defects, we could be subject to significant costs to correct such defects and our product and network service contracts could be delayed or cancelled, which could expose us to significant liability and adversely affect our revenues.
The products and the networks we deploy are highly complex, and some may contain defects when first introduced or when new versions or enhancements are released, despite extensive testing and our quality control procedures. In addition, many of our products and network services are designed to interface with our customers’ existing networks, each of which has different specifications and utilize multiple protocol standards. Our products and services must interoperate with the other products and services within our customers’ networks, as well as with future products and services that might be added to these networks, to meet our customers’ requirements. Further, in the Consumer market, our products are usually installed in residential and other locations where there might be a higher likelihood of product liability claims relating to improper or unsafe products or installations. The occurrence of any defects, errors or failures in our products or network services could result in: (i) additional costs to correct such defects; (ii) cancellation of orders; (iii) a reduction in revenue backlog; (iv) product returns or recalls; (v) diversion of our resources; (vi) legal actions by our customers or our customers’ end users, including for damages caused by a defective product; and (vii) the issuance of credits to customers and other losses to us, our customers or end users. Any of these occurrences could also result in the loss of or delay in market acceptance of our products and services and loss of sales, which would harm our reputation and our business and adversely affect our revenues and profitability. In addition, our insurance would not cover the cost of correcting significant errors, defects, or security problems.
Our failure to develop, obtain or protect our intellectual property rights could adversely affect our future performance and growth.
We rely on a combination of United States and foreign patent, trademark, copyright and trade secret laws as well as licenses, nondisclosure, confidentiality and other contractual agreements or restrictions to protect our proprietary rights to the technologies and inventions used in our services and products, including proprietary VSAT technology and related services and products. We have registered trademarks and patents and have pending trademark and patent applications in the United States and a number of foreign countries. However, our patent and trademark applications may not be allowed by the applicable governmental authorities to issue as patents or register as trademarks at all, or in a form that will be advantageous to us. In addition, in some instances, we may not have registered important patent and trademark rights in these and other countries. If we fail to timely file a patent application in any such country, we may be precluded from doing so at a later date. In addition, the laws of some countries do not protect and do not allow us to enforce our proprietary rights to the same extent as do the laws of the United States. Accordingly, we might not be able to protect our proprietary products and technologies against unauthorized third-party copying or use, which could negatively affect our competitive position.
Furthermore, our intellectual property may prove inadequate to protect our proprietary rights, may be infringed or misappropriated by others, or may diminish in value over time. Our competitors may be able to freely make use of our patented technology after our patents expire or may challenge the validity, enforceability or scope of our patents, trademarks or trade secrets. Competitors also may independently develop products or services that are substantially equivalent or superior to our technology. In addition, it may be possible for third parties to reverse-engineer, otherwise obtain, copy and use information that we regard as proprietary. If we are unable to protect our services and products through the enforcement of our intellectual property rights, our ability to compete based on our current market advantages may be harmed.
24
Table of Contents
We also rely on unpatented proprietary technology. To protect our trade secrets and other proprietary information, we require employees, consultants, advisors and collaborators to enter into confidentiality agreements. These agreements may not provide meaningful protection for our trade secrets, know-how or other proprietary information in the event of any unauthorized use, misappropriation or disclosure of such trade secrets, know-how or other proprietary information. If we fail to prevent substantial unauthorized access to our trade secrets, we risk the loss of those intellectual property rights and whatever competitive advantage they provide us.
Claims that our services and products infringe the intellectual property rights of others could increase our costs and reduce our sales, which would adversely affect our results of operations.
We have received, and may in the future receive, communications from third parties claiming that we or our products infringe upon the intellectual property rights of third parties. In addition, we may be named in the future as a defendant in lawsuits claiming that our services or products infringe upon the intellectual property rights of third parties. Litigation may be necessary to determine the validity and scope of third-party rights or to defend against claims of infringement. Litigation may also be necessary to enforce our intellectual property rights or to defend against claims that our intellectual property rights are invalid or unenforceable. Such litigation, regardless of the outcome, could result in substantial costs and diversion of resources, including time and attention of management and other key personnel, and could have a material adverse effect on our business, financial condition and results of operations. We expect to be increasingly subject to such claims as the number of products and competitors in our industry grows.
We may not be aware of all intellectual property rights that our services or products may potentially infringe. Further, without lengthy litigation, it may not be possible to determine definitively whether a claim of infringement is valid. We cannot estimate the extent to which we may be required in the future to obtain intellectual property licenses or the availability and cost of any such licenses. Those costs, and their impact on our earnings, could be material. Damages in patent infringement cases may also include treble damages in certain circumstances. If a third party holds intellectual property rights, it may not allow us to use our intellectual property at any price, or on terms acceptable to us, which could materially adversely affect our competitive position. To the extent that we are required to pay royalties to third parties to whom we are not currently making payments, these increased costs of doing business could materially adversely affect our results of operations. In addition, under some of our agreements with customers, we are not permitted to use all or some of the intellectual property developed for that customer for other customers and in other cases, we have agreed not to provide similar services to such customers’ competitors. Further, our service agreements with our customers generally provide that we will defend and indemnify them for claims against them relating to our alleged infringement of third-party intellectual property rights with respect to services and products we provide. Third parties may assert infringement claims against our customers. These claims may require us to initiate or defend protracted and costly litigation on behalf of our customers, regardless of the merits of these claims. If any of these claims succeed, we may be forced to pay damages on behalf of our customers or may be required to obtain licenses for the products they use. If we cannot obtain all necessary licenses on commercially reasonably terms, our customers may be forced to stop using our products.
In addition, our patents, trademarks and other proprietary rights may be subject to various attacks claiming they are invalid or unenforceable. These attacks might invalidate, render unenforceable or otherwise limit the scope of the protection that our patents, trademarks and other rights afford us. If we lose the use of a product name or brand name, our efforts spent on building that brand may be lost, and we will have to rebuild a brand for that product, which we may or may not be able to do, and which would cause us to incur new costs in connection with building such brand name. If we are involved in a patent infringement suit, even if we prevail, there is no assurance that third parties will not be able to design around our patents, which could harm our competitive position.
25
Table of Contents
If we are unable to license technology from third parties on satisfactory terms, our developmental costs could increase and we may not be able to deploy our services and products in a timely manner.
We depend, in part, on technology that we license from third parties on a non-exclusive basis and integrate into our products and service offerings. Licenses for third-party technology that we use in our current products may be terminated or not renewed, and we may be unable to license third-party technology necessary for such products in the future. Furthermore, we may be unable to renegotiate acceptable third-party license terms to reflect changes in our pricing models. Changes to or the loss of a third-party license could lead to an increase in the costs of licensing or inoperability of products or network services. In addition, technology licensed from third parties may have undetected errors that impair the functionality or prevent the successful integration of our products or services. As a result of any such changes or loss, we may need to incur additional development costs to ensure continued performance of our products or suffer delays until replacement technology, if available, can be obtained and integrated.
We are majority-owned by various investment vehicles affiliated with Apollo and Apollo’s interests as an equity holder may conflict with the interests of the holders of HNS’ debt instruments or with the other equity holders of the Company.
At December 31, 2010, Apollo Management, L.P., together with its affiliates (“Apollo”) owned in the aggregate 12,408,611 shares, or approximately 56.8%, of our issued and outstanding common stock. Therefore, Apollo has control over our management and policies, such as the election of our directors, the appointment of new management and the approval of any other action requiring the approval of our stockholders, including any amendments to our certificate of incorporation and mergers or sales of all or substantially all of our assets. The interests of Apollo may not in all cases be aligned with those of the holders of HNS’ 9.50% senior notes issued in 2006 and 2009 (collectively, the “Senior Notes”) or those of the other holders of our common stock. In addition, if the Merger is not consummated, the level of Apollo’s ownership of our common stock could have the effect of discouraging or impeding an unsolicited acquisition proposal in the future. Furthermore, Apollo may, in the future, own businesses that directly or indirectly compete with us. Apollo may also pursue acquisition opportunities that may be complementary to our business, and as a result, those acquisition opportunities may not be available to us. Subject to limitations contained in HNS’ Limited Liability Company Agreement, the indentures governing the Senior Notes, HNS’ $50.0 million revolving credit facility (the “Revolving Credit Facility”), HNS’ $115.0 million term loan facility (the “Term Loan Facility”), HNS’ $115 million loan agreement with BNP Paribas and Societe Generale (“COFACE Guaranteed Facility”), which is guaranteed by COFACE, the French Export Credit Agency, and the Merger Agreement regarding affiliate transactions, Apollo may cause the Company or HNS to enter into transactions with their affiliates to buy or sell assets.
We are a holding company and the inability of our subsidiaries to pay distributions or dividends or transfer funds or other assets to us would harm our ability to pay future dividends.
We are a holding company and our principal assets are membership interests of HNS and cash. Although we do not currently intend to pay dividends on our shares of common stock for the foreseeable future (See “—Risks Relating to our Common Stock”), in the event that we choose to pay dividends, we would be primarily reliant on distributions or dividends from our subsidiaries to pay such dividends. The ability of HNS to pay us distributions or transfer funds or other assets is subject to the terms of HNS’ debt agreements which contain covenants which, among other things, limit the ability of HNS and certain of its subsidiaries to pay dividends or distributions or redeem or repurchase capital stock. Such limitations could harm our ability to pay future dividends, if any.
Our future success depends on our ability to retain our key employees.
We are dependent on the services of HNS’ and our senior management team to remain competitive in our industry. The loss of one or more members of HNS’ or our senior management team could have an adverse effect on us until qualified replacements are found. We may not be able to quickly replace these individuals with persons of equal experience and capabilities. In addition, technological innovation depends, to a significant
26
Table of Contents
extent, on the work of technically skilled employees. Competition for executive, managerial and skilled personnel in our industry is intense. We expect to face continued increases in compensation costs in order to attract and retain senior executives, managers and skilled employees, especially if the current job market improves. We may not be able to retain our existing senior management, fill new positions or vacancies created by expansion or turnover or attract or retain the management and personnel necessary to develop and market our products. We do not maintain key man life insurance on any of these individuals.
Risks Related to the Regulation of Our Business
We may face difficulties in obtaining regulatory approvals for our provision of telecommunications services, and we may face changes in regulation, each of which could adversely affect our operations.
In a number of countries where we operate, the provision of telecommunications services is highly regulated. In such countries, we are required to obtain approvals from national and local authorities in connection with most of the services that we provide. In many jurisdictions, we must maintain such approvals through compliance with license conditions or payment of annual regulatory fees.
While the governmental authorizations for our current business generally have not been difficult to obtain in a timely manner, the need to obtain particular authorizations in the future may delay our provision of current and new services. Moreover, the imposition by a governmental entity of conditions on our authorizations, or the failure to obtain authorizations necessary to launch and operate satellites or provide satellite service, could have a material adverse effect on our ability to generate revenue and conduct our business as currently planned. Violations of laws or regulations may result in various sanctions including fines, loss of authorizations and the denial of applications for new authorizations or for the renewal of existing authorizations.
Future changes to the regulations under which we operate could make it difficult for us to obtain or maintain authorizations, increase our costs or make it easier or less expensive for our competitors to compete with us.
We may face difficulties in accurately assessing and collecting contributions towards the Universal Service Fund.
As a provider of telecommunications in the United States, we are presently required to contribute a percentage of our revenues from telecommunications services to the Universal Service Fund to support mechanisms that subsidize the provision of services to low-income consumers, high-cost areas, schools, libraries and rural health care providers. This percentage is set each calendar quarter by the FCC. Current FCC rules permit us to pass this Universal Service Fund contribution onto our customers.
Because our customer contracts often include both telecommunications services, which create such support obligations, and other goods and services, which do not, it can be difficult to determine which portion of our revenues forms the basis for this contribution and the amount that we can recover from our customers. If the FCC, which oversees the support mechanisms, or a court or other governmental entity were to determine that we computed our contribution obligation incorrectly or passed the wrong amount onto our customers, we could become subject to additional assessments, liabilities, or other financial penalties. In addition, the FCC is considering substantial changes to its Universal Service Fund contribution and distribution rules. These changes could impact our future contribution obligations and those of third parties that provide communication services to our business. Any such change to the Universal Service Fund contribution rules could adversely affect our costs of providing service to our customers. In addition, changes to the Universal Service Fund distribution rules could intensify the competition we face by offering subsidies to competing firms and/or technologies.
Our international sales and operations are subject to applicable laws relating to trade, export controls and foreign corrupt practices, the violation of which could adversely affect our operations.
We must comply with all applicable export control laws and regulations of the United States and other countries. United States laws and regulations applicable to us include the Arms Export Control Act, the
27
Table of Contents
International Traffic in Arms Regulations (“ITAR”), the Export Administration Regulations (“EAR”) and the trade sanctions laws and regulations administered by the United States Department of the Treasury’s Office of Foreign Assets Control (“OFAC”). The export of certain hardware, technical data and services relating to satellites is regulated by the United States Department of State’s Directorate of Defense Trade Controls under ITAR. Other items are controlled for export by the United States Department of Commerce’s Bureau of Industry and Security under the EAR. We cannot provide services to certain countries subject to United States trade sanctions unless we first obtain the necessary authorizations from OFAC. In addition, we are subject to the Foreign Corrupt Practices Act, that, generally, bars bribes or unreasonable gifts to foreign governments or officials. See Item 1. Business—Government Regulation.
Violations of these laws or regulations could result in significant sanctions including fines, more onerous compliance requirements, debarments from export privileges or loss of authorizations needed to conduct aspects of our international business. A future violation of ITAR or the other regulations enumerated above could materially adversely affect our business, financial condition and results of operations.
Our foreign operations expose us to regulatory risks and restrictions not present in our domestic operations.
Our operations outside the United States accounted for approximately 23.3% of our revenues for the year ended December 31, 2010, and we expect our foreign operations to continue to represent a significant portion of our business. We have operations in Brazil, Germany, India, Indonesia, Italy, Mexico, the Russian Federation, South Africa, the United Arab Emirates, the United Kingdom and China, among other nations. Over the last 20 years, we have sold products in over 100 countries. Our foreign operations involve varying degrees of risks and uncertainties inherent in doing business abroad. Such risks include:
| • | Complications in complying with restrictions on foreign ownership and investment and limitations on repatriation—We may not be permitted to own our operations in some countries and may have to enter into partnership or joint venture relationships. Many foreign legal regimes restrict our repatriation of earnings to the United States from our subsidiaries and joint venture entities. We may also be limited in our ability to distribute or access our assets by the governing documents pertaining to such entities. In such event, we will not have access to the cash flow and assets of our joint ventures. |
| • | Difficulties in following a variety of foreign laws and regulations, such as those relating to data content retention, privacy and employee welfare—Our international operations are subject to the laws of many different jurisdictions that may differ significantly from United States law. For example, local political or intellectual property law may hold us responsible for the data that is transmitted over our network by our customers. Also, other nations have more stringent employee welfare laws that guarantee perquisites that we must offer. Compliance with these laws may lead to increased operations costs, loss of business opportunities or violations that result in fines or other penalties. |
| • | We face significant competition in our international markets—Outside North America, we have traditionally competed for VSAT hardware and services sales primarily in Europe, Brazil and India and focused only on hardware revenues in other regions. In Europe, we face intense competition which is not expected to abate in the near future. |
| • | Changes in exchange rates between foreign currencies and the United States dollar—We conduct our business and incur costs in the local currency of a number of the countries in which we operate. Accordingly, our results of operations are reported in the relevant local currency and then translated to United States dollars at the applicable currency exchange rate for inclusion in our financial statements. These fluctuations in currency exchange rates have affected, and may in the future affect, revenue, profits and cash earned on international sales. In addition, we sell our products and services and acquire supplies and components from countries that historically have been, and may continue to be, susceptible to recessions or currency devaluation. |
| • | Greater exposure to the possibility of economic instability, the disruption of operations from labor and political disturbances, expropriation or war—As we conduct operations throughout the world, we |
28
Table of Contents
| could be subject to regional or national economic downturns or instability, labor or political disturbances or conflicts of various sizes. Any of these disruptions could detrimentally affect our sales in the affected region or country or lead to damage to, or expropriation of, our property or danger to our personnel. |
| • | Competition with large or state-owned enterprises and/or regulations that effectively limit our operations and favor local competitors—Many of the countries in which we conduct business have traditionally had state owned or state granted monopolies on telecommunications services that favor an incumbent service provider. We face competition from these favored and entrenched companies in countries that have not deregulated. The slower pace of deregulation in these countries, particularly in Asia and Latin America, has adversely affected the growth of our business in these regions. |
| • | Customer credit risks—Customer credit risks are exacerbated in foreign operations because there is often little information available about the credit histories of customers in the foreign countries in which we operate. |
Risks Related to HNS’ Indebtedness
HNS’ high level of indebtedness could adversely affect its ability to raise additional capital to fund HNS’ operations and could limit its ability to react to changes in the economy or its industry and prevent HNS from meeting its obligations.
HNS is significantly leveraged. The following table shows HNS’ level of indebtedness as of December 31, 2010 (in thousands):
| December 31, 2010 |
||||
| Senior Notes(1) |
$590,173 | |||
| Term Loan Facility |
115,000 | |||
| COFACE Guaranteed Facility |
27,403 | |||
| VSAT hardware financing |
6,323 | |||
| Revolving bank borrowings |
967 | |||
| Capital lease and other |
6,995 | |||
| Total debt |
$ | 746,861 | ||
| (1) | Includes 2006 Senior Notes and 2009 Senior Notes. |
HNS’ substantial degree of leverage could have important consequences, including the following:
| • | it may limit HNS’ ability to obtain additional debt or equity financing for working capital, capital expenditures, debt service requirements, acquisitions and general corporate or other purposes; |
| • | a substantial portion of HNS’ cash flows from operations will be dedicated to the payment of principal and interest on its indebtedness and will not be available for other purposes, including its operations, capital expenditures, investments in new technologies and future business opportunities; |
| • | the debt service requirements of HNS’ other indebtedness could make it more difficult for it to satisfy its financial obligations; |
| • | HNS’ Revolving Credit Facility is at a variable rate of interest, exposing HNS to the risk of increased interest rates; |
| • | it may limit HNS’ ability to adjust to changing market conditions and place HNS at a competitive disadvantage compared to its competitors that have less debt or more financial resources; and |
| • | HNS may be vulnerable in a downturn in general economic condition or in its business, or HNS may be unable to carry out capital spending that is important to its growth. |
29
Table of Contents
HNS may not be able to generate cash to meet its debt service needs or to fund its operations.
HNS’ ability to make payments on or to refinance its indebtedness and to fund its operations will depend on HNS’ ability to generate cash in the future, which is subject in part to general economic, financial, competitive, legislative, regulatory and other factors that are beyond its control.
HNS may not generate sufficient cash flow from operations and future borrowings may not be available to HNS under its Revolving Credit Facility or otherwise in amounts sufficient to enable it to service its indebtedness or to fund its operations or other liquidity needs. If HNS is unable to generate sufficient cash, it will be forced to take actions such as revising or delaying its strategic plans, reducing or delaying capital expenditures, selling assets, restructuring or refinancing its debt or seeking additional equity capital. HNS may not be able to affect any of these remedies on satisfactory terms, or at all. Each of its Revolving Credit Facility, Term Loan Facility, COFACE Guaranteed Facility and the indentures governing the Senior Notes restrict its ability to dispose of assets and use the proceeds from such dispositions. Therefore, we may not be able to consummate those dispositions or to use those proceeds to meet any debt service obligations when due.
If HNS cannot make scheduled payments on its debt, HNS will be in default and, as a result:
| • | its debt holders could declare all outstanding principal and interest to be due and payable; |
| • | the lenders under its Revolving Credit Facility could terminate their commitments to loan HNS money and foreclose against the assets securing their borrowings; and |
| • | we could lose our equity investment in HNS, which equity interests have been pledged by us to the lenders under HNS’ Revolving Credit Facility. |
Despite current indebtedness levels, subject to conditions in the Merger Agreement, we may still be able to incur substantially more debt. This could further exacerbate the risks described above.
The terms of each of the Merger Agreement, our Revolving Credit Facility, Term Loan Facility, COFACE Guaranteed Facility and the indentures governing the Senior Notes contain restrictions on our ability and the ability of our subsidiaries to incur additional debt. These restrictions are subject to a number of important qualifications and exceptions and the amount of indebtedness incurred in compliance with these restrictions could be substantial. Any incurrence of additional indebtedness could further exacerbate the risks described above.
Covenants in HNS’ debt agreements and the Merger Agreement restrict our business in many ways.
HNS’ Revolving Credit Facility, Term Loan Facility, COFACE Guaranteed Facility and the indentures governing the Senior Notes contain various covenants that limit HNS’ ability and/or its restricted subsidiaries’ ability to, among other things:
| • | incur, assume or guarantee additional indebtedness; |
| • | issue redeemable stock and preferred stock; |
| • | repurchase capital stock; |
| • | make other restricted payments including, without limitation, paying dividends and making investments; |
| • | redeem debt that is junior in right of payment to the Senior Notes; |
| • | create liens without securing the Senior Notes; |
| • | sell or otherwise dispose of assets, including capital stock of subsidiaries; |
| • | enter into agreements that restrict dividends from its subsidiaries; |
| • | merge, consolidate and sell, or otherwise dispose of substantially all of its assets; |
30
Table of Contents
| • | enter into transactions with affiliates; |
| • | guarantee indebtedness; and |
| • | enter into new lines of business; |
In addition, HNS’ COFACE Guaranteed Facility also requires that HNS comply with certain maintenance covenants. Under the Merger Agreement, we have agreed to various covenants that affect our business, including, among others, covenants (i) to use commercially reasonable efforts to conduct its business in the ordinary course consistent with past practice during the interim period between the execution of the Merger Agreement and completion of the Merger and (ii) not to engage in certain kinds of transactions during this interim period, including the incurrence of indebtedness.
A breach of any of the covenants under the Revolving Credit Facility, the Term Loan Facility, the indentures governing the Senior Notes, or the COFACE Guaranteed Facility could result in a default under HNS’ Revolving Credit Facility, the Term Loan Facility, the Senior Notes, and the COFACE Guaranteed Facility. Upon the occurrence of an event of default under HNS’ Revolving Credit Facility, the lenders could elect to declare all amounts outstanding under its Revolving Credit Facility to be immediately due and payable and terminate all commitments to extend further credit. If HNS is unable to repay those amounts, the lenders under HNS’ Revolving Credit Facility could proceed against the collateral that secures that indebtedness. HNS has pledged a significant portion of its assets as collateral under its Revolving Credit Facility. If the lenders under HNS’ Revolving Credit Facility accelerate the repayment of borrowings, HNS may not have sufficient assets to repay its Revolving Credit Facility and its other indebtedness.
Risks Related to the Merger
The Merger is subject to satisfaction or waiver of certain customary conditions.
The completion of the Merger is subject to the satisfaction or waiver of certain customary conditions, including (i) the receipt of certain government regulatory approvals, including approval by the FCC, the expiration or termination of the waiting period under the Hart-Scott-Rodino Antitrust Improvements Act of 1976, as amended, and the receipt of the consents required under certain export control laws, (ii) the absence of any order or injunction by a court of competent jurisdiction preventing the consummation of the Merger, and the absence of any action taken, or any law enacted, entered, enforced or made applicable to the Merger, by any governmental entity that makes the consummation of the Merger illegal or otherwise restrains, enjoins or prohibits the Merger, (iii) the accuracy of the representations and warranties of the parties and compliance by the parties with their respective obligations under the Merger Agreement and (iv) holders of shares of our common stock representing in excess of 25% of our outstanding shares of common stock shall not have exercised (or if exercised, shall not have withdrawn prior to the commencement of the marketing period for the financing of the pending transaction) rights of dissent in connection with the Merger. We cannot assure you that the Merger contemplated by the Merger Agreement will be consummated or that it will close in a timely manner or, if not consummated, that we will enter into a comparable or superior transaction with another party.
The Merger may not be completed if sufficient financing is not funded.
EchoStar and Satellite Services have obtained an aggregate financing commitment of $1.0 billion in senior secured bridge financing and $800 million in senior unsecured bridge financing in connection with financing the transactions contemplated by the Merger Agreement, including the payment of the cash merger consideration and the repayment of our indebtedness under the Revolving Credit Facility, the Term Loan Facility, the Senior Notes and, if lender consents are not obtained, the COFACE Guaranteed Facility. The funding under such commitment is subject to conditions, including conditions that do not relate directly to the Merger Agreement. We cannot assure you that the committed amount will be sufficient to complete the Merger. Those amounts might be insufficient if, among other things, we, EchoStar or Satellite Services have substantially less cash
31
Table of Contents
on hand or EchoStar and Satellite Services have substantially less net proceeds from the debt financings than we currently expect. Although obtaining the debt financing is not a condition to the completion of the Merger, the failure of EchoStar and Satellite Services to obtain sufficient financing is likely to result in the failure of the Merger to be completed in a timely manner, if at all.
Our future business and financial position may be adversely affected if the Merger is not completed.
If the Merger Agreement is terminated and the Merger is not consummated, we will have incurred substantial expenses without realizing the expected benefits of the Merger. In addition, we may also be subject to additional risks including, without limitation:
| • | substantial costs related to the Merger, such as legal, accounting and financial advisory fees, that must be paid regardless of whether the Merger is completed; |
| • | potential disruption to the current business plan and our operating activities and distraction of our workforce and management team; and |
| • | potential loss of key customers and suppliers as a result of any negative reaction to the Merger, including as result of the uncertainty concerning our operations while the Merger is pending and after the Merger is closed. |
The Merger creates unique risks in the time leading up to closing, and there are also risks of completing the conditions to closing.
The Merger Agreement generally requires us to operate our business in the ordinary course pending consummation of the proposed combination, but restricts us, without EchoStar’s consent, from taking certain specified actions until the Merger is complete or the Merger Agreement is terminated. Further, the pending Merger increases our risk of loss of key employees due to, among other things, uncertainty concerning the post-Merger operation of the Company.
Until all conditions to the Merger are satisfied and the related debt financing is ready to be funded, we cannot be certain that the Merger will close. We will incur significant transaction costs relating to the proposed Merger, whether or not the proposed Merger is completed. Additionally, matters relating to the Merger (including integration planning) may require substantial commitments of time and resources, which could otherwise have been devoted to other beneficial opportunities and there may be potential difficulties in employee retention as a result of the Merger.
Any loss of business opportunities or key personnel could have an adverse impact on future business, and, as a result, result in lower future sales and earnings.
If we are unable to complete our proposed Merger with EchoStar, our stock price could suffer.
The termination of the Merger Agreement would likely result in a decline in our stock price to the extent that our stock price reflects a market assumption that we will complete the Merger and our stockholders will receive the per share merger consideration specified in the Merger Agreement.
Since announcing the proposed Merger, class action lawsuits have been filed against the Company and its directors. The outcome or settlement of these claims may have an adverse effect upon our results of operation.
Since the announcement of the proposed Merger, putative class action lawsuits seeking to enjoin the Merger, among other things, have been filed on behalf of our stockholders, two in the Delaware Court of Chancery and two in the Circuit Court for Montgomery County, Maryland. Descriptions of these lawsuits, are set forth in Item 3. Legal Proceedings of this Report and are incorporated herein by reference. The cost of defending such law suits and paying any judgment or settlement in connection therewith could have an adverse impact on our financial results.
32
Table of Contents
Risks Related to the Separation from LightSquared, Inc. (“LightSquared,” formerly SkyTerra Communications, Inc.)
We may incur significant liability to LightSquared pursuant to the provisions of the tax sharing agreement.
The tax sharing agreement governs the allocation between us and LightSquared of tax liabilities and related tax matters, such as the preparation and filing of tax returns and tax contests, for all taxable periods ended on or before February 21, 2006. We will generally be responsible for, and indemnify LightSquared and its subsidiaries against, all tax liabilities imposed on or attributable to:
| • | the Company and any of its subsidiaries relating to all taxable periods; and |
| • | LightSquared and any of its subsidiaries for all taxable periods or portions thereof ending on or prior to a change of control of LightSquared. |
Risks Relating to Our Common Stock
There may be a limited public market for our common stock and our stock price may experience volatility.
The stock market from time to time experiences extreme price and volume fluctuations that are often unrelated to the operating performance of particular companies. Changes in earnings estimates by analysts, if any, and economic and other external factors may have a significant effect on the market price of our common stock. Fluctuations or decreases in the trading price of our common stock may adversely affect the liquidity of the trading market for our common stock.
Fluctuations in our results of operations could adversely affect the trading price of our common stock.
Our results of operations may fluctuate as a result of a variety of factors, many of which are outside of our control, including:
| • | risks and uncertainties affecting the current and proposed business of HNS and the broadband satellite industry; |
| • | increased competition in the broadband satellite industry; |
| • | competition in the North America and International Broadband segments and the Telecom Systems segment; and |
| • | general economic conditions. |
As a result of these possible fluctuations, period-to-period comparisons of our financial results may not be reliable indicators of future performance.
Future sales of our shares could depress the market price of our common stock.
We may, in the future, sell additional shares of our common stock to raise capital, which could result in substantial dilution and a decrease in the market price of our common stock. These sales, or the possibility that these sales may occur, also might make it more difficult for us to sell equity securities in the future at a time and at a price that we deem appropriate.
At December 31, 2010, we had 21,834,787 shares of our common stock outstanding, all of which are freely tradable without restriction under the Securities Act except for any such shares held at any time by any of our “affiliates,” as such term is defined under Rule 144 promulgated under the Securities Act. In addition, all of the shares of common stock issued or reserved for issuance or issuable upon the exercise of stock options under our 2006 Equity and Incentive Plan will be available for sale in the open market, unless such shares of common stock are subject to vesting restrictions. We may have to issue additional shares of our common stock to satisfy the Class B Units and bonus units of HNS, which may, to the extent vested, be exchanged for our common stock.
33
Table of Contents
We do not plan to pay dividends on our common stock and consequently, the only opportunity to achieve a return on an investment in our common stock is if the price of our common stock appreciates.
We do not plan to declare dividends on our common stock for the foreseeable future and do not plan to pay dividends on our common stock. In addition, the agreements governing HNS’ outstanding indebtedness and Merger Agreement limit our ability to pay dividends on our common stock. The only opportunity to achieve a positive return on an investment in our common stock prior to the completion of the Merger for the foreseeable future may be if the market price of our common stock appreciates.
Provisions in our charter documents and Delaware law may delay or prevent our acquisition by a third party.
Our certificate of incorporation and by-laws contain several provisions that may make it more difficult for a third party to acquire control of us without the approval of our board of directors. These provisions include, among other things, advance notice for raising business or making nominations at meetings of stockholders and “blank check” preferred stock. Blank check preferred stock enables our board of directors, without stockholder approval, to designate and issue additional series of preferred stock with such special dividend, liquidation, conversion, voting or other rights, including the right to issue convertible securities with no limitations on conversion, as our board of directors may determine, including rights to dividends and proceeds in a liquidation that are senior to the common stock. In addition, our board may issue additional shares of common stock without any further vote or action by our common stockholders, which would have the effect of diluting common stockholders. These provisions may make it more difficult or expensive for a third party to acquire a majority of our outstanding voting common stock. In addition, the Delaware General Corporation Law contains provisions that could make it more difficult for a third party to acquire control of us.
| Item 1B. | Unresolved Staff Comments |
We have no unresolved comments from the Securities and Exchange Commission.
34
Table of Contents
| Item 2. | Properties |
Our principal executive offices are located at 11717 Exploration Lane, Germantown, Maryland 20876. Our properties consist of design centers, manufacturing facilities, service facilities and sales and marketing offices and are located in the United States, Latin America, Europe, Asia and Africa. Substantially all of our properties are used to support our North America and International Broadband segments. The following table sets forth our owned and leased properties as of December 31, 2010.
| Location |
Owned/ Leased |
Square Footage |
Function | |||||||
| Germantown, Maryland(1) |
Owned | 311,000 | Corporate headquarters—office and engineering lab, network operations, shared hubs | |||||||
| Gaithersburg, Maryland |
Leased | 107,500 | Manufacturing, test | |||||||
| Gaithersburg, Maryland |
Leased | 80,000 | Engineering, office space | |||||||
| Gurgaon, India(2) |
Leased | 66,800 | Development center | |||||||
| Gurgaon, India(1) (2) |
Leased | 43,600 | Corporate headquarters (Hughes Communication India Limited), shared hub, operations, warehouse | |||||||
| Las Vegas, Nevada(1) |
Leased | 49,300 | Shared hub, antennae yards, backup network operation and control center for SPACEWAY, gateways | |||||||
| Griesheim, Germany(1) |
Leased | 51,200 | Office space, shared hub, operations, warehouse | |||||||
| San Diego, California |
Leased | 20,900 | Engineering, sales | |||||||
| Barueri, Brazil(1) |
Leased | 11,000 | Warehouse, shared hub | |||||||
| Southfield, Michigan(1) |
Leased | 15,000 | Shared hub | |||||||
| Milton Keynes, United Kingdom |
Leased | 14,900 | Corporate headquarters (Europe) and operations | |||||||
| Bangalore, India(2) |
Leased | 15,300 | Office space, guest house | |||||||
| Kolkata, India(2) |
Leased | 9,300 | Warehouse, office space, studio | |||||||
| Lindon, Utah |
Leased | 7,900 | Office space | |||||||
| Sao Paulo, Brazil |
Leased | 6,700 | Corporate headquarters (Brazil) | |||||||
| New Delhi, India |
Leased | 6,000 | Corporate headquarters (India) | |||||||
| Mumbai, India(2) |
Leased | 5,600 | Warehouse, office space | |||||||
| Alexandria, Virginia |
Leased | 4,700 | Warehouse | |||||||
| Beijing, China(2) |
Leased | 4,600 | Sales, marketing, operations | |||||||
| Gaithersburg, Maryland |
Leased | 3,500 | Warehouse, garage | |||||||
| Rockville, Maryland(2) |
Leased | 3,500 | Corporate office for subsidiary | |||||||
| Rome, Italy |
Leased | 2,700 | Sales, marketing | |||||||
| Chicago, Illinois |
Leased | 2,500 | Sales, marketing | |||||||
| Moscow, Russia |
Leased | 1,100 | Sales, marketing | |||||||
| Dubai, United Arab Emirates |
Leased | 500 | Sales | |||||||
| Lomas de Chaputepec, Mexico |
Leased | 450 | Sales, marketing, operations | |||||||
| Fort Lauderdale, Florida |
Leased | 160 | Sales | |||||||
| San Jose, California(2) |
Leased | 100 | Sales | |||||||
| (1) | We perform network services and customer support functions 24 hours a day, 7 days a week, 365 days a year at these locations. |
| (2) | Including properties of subsidiaries that are less than wholly-owned by the Company. |
| Item 3. | Legal Proceedings |
We are periodically involved in litigation in the ordinary course of our business involving claims regarding intellectual property infringement, product liability, property damage, personal injury, contracts, employment and worker’s compensation. We do not believe that there are any such pending or threatened legal proceedings, including ordinary litigation incidental to the conduct of our business and the ownership of our properties that, if adversely determined, would have a material adverse effect on our business, financial condition, results of operations or liquidity.
In March 2009, an arbitration panel ruled in our favor in our arbitration against Sea Launch Limited Partnership and Sea Launch Company, LLC (collectively, “Sea Launch”) entitling HNS to a full refund of $44.4
35
Table of Contents
million (the “Deposit”) in payments made to Sea Launch in connection with launch services for SPACEWAY 3, in addition to interest of 10% per annum on the $44.4 million from July 10, 2007 until payment on the Deposit is received in full. On June 22, 2009, Sea Launch filed a voluntary petition to reorganize under Chapter 11 of the U.S. Bankruptcy Code in the U.S. Bankruptcy Court for the District of Delaware. As a result of this filing, our efforts to pursue collection of the arbitral award from Sea Launch were stayed under the bankruptcy laws. On May 27, 2010, HNS entered into a settlement agreement with Sea Launch to resolve the claim that it filed in the Sea Launch bankruptcy (the “Settlement Agreement”). The Settlement Agreement provides that Sea Launch will irrevocably issue to us two credits, each in the amount of $22.2 million (the “Credits”), in satisfaction and discharge of HNS’ bankruptcy claim. The Credits may be used by HNS to defray the cost of up to two launches contracted by December 31, 2015, and scheduled to occur by December 31, 2017. In addition, subject to the terms and conditions of the Settlement Agreement, one or both Credits may be transferred to third parties. The bankruptcy court has approved the Settlement Agreement, and its terms have been incorporated into the court’s order approving Sea Launch’s plan of reorganization. The Settlement Agreement became effective on October 27, 2010.
On May 18, 2009, the Company and HNS received notice of a complaint filed in the U.S. District Court for the Northern District of California by two California subscribers to the HughesNet service. The plaintiffs complain about the speed of the HughesNet service, the Fair Access Policy, early termination fees and certain terms and conditions of the HughesNet subscriber agreement. The plaintiffs seek to pursue their claims as a class action on behalf of other California subscribers. On June 4, 2009, the Company and HNS received notice of a similar complaint filed by another HughesNet subscriber in the Superior Court of San Diego County, California. The plaintiff in this case also seeks to pursue his claims as a class action on behalf of other California subscribers. Both cases have been consolidated into a single case in the U.S. District Court for the Northern District of California. In January 2011, the Company agreed to settle this consolidated case on a nationwide basis, subject to court approval. As a result, the Company has accrued $1.9 million for estimated settlement costs, plaintiffs’ attorney fees and other related expenses. In the event that the settlement is not effectuated, the Company would revert to its previous position of vigorously defending these matters as it believes that the allegations in these complaints are not meritorious.
On December 18, 2009, the Company and HNS received notice of a complaint filed in the Cook County, Illinois, Circuit Court by a former subscriber to the HughesNet service. The complaint seeks a declaration allowing the former subscriber to file a class arbitration challenging early termination fees under the subscriber agreement. The Company was dismissed from this case in September 2010, while HNS remains a defendant. HNS’ motion to dismiss, filed in September 2010, is pending, and HNS will continue to vigorously defend the case.
Some or all of the Company, its Directors, EchoStar Corporation, EchoStar Satellite Services, L.L.C. (“EchoStar LLC”), Broadband Acquisition Corporation (“Merger Sub”), and Apollo Global Management, LLC (“AGM”) have been named as defendants in four shareholder class action lawsuits in connection with the proposed transaction in which EchoStar will acquire all of the outstanding equity of HCI and its subsidiaries. On February 18, 2011, the Gottlieb Family Foundation filed its class action complaint in the Circuit Court for Montgomery County, Maryland. On February 23, 2011, Plymouth County Retirement System filed its shareholder class action complaint in the Court of Chancery of the State of Delaware. On February 24, 2011, Edward Ostensoe filed a shareholder class action complaint in the Circuit Court for Montgomery County, Maryland. On February 28, 2011, Nina J. Shah Rohrbasser Irr. Trust filed a shareholder class action complaint in the Court of Chancery of the State of Delaware. Each complaint alleges that the directors of the Company breached their fiduciary duties in agreeing to the transaction. The complaints also allege that some or all of the Company, EchoStar, EchoStar LLC, Merger Sub and AGM aided and abetted such breaches by the directors of the Company. In each case, the Plaintiffs seek to enjoin the proposed transaction and/or damages, costs, and attorney fees. The Company believes that the allegations in all of these complaints are not meritorious and we intend to vigorously defend these matters.
No other material legal proceedings have commenced or been terminated during the period covered by this report.
| Item 4. | (Removed and Reserved) |
36
Table of Contents
| Item 5. | Market for Registrant’s Common Equity, Related Stockholder Matters and Issuer Purchases of Equity Securities |
During 2010 and 2009, our common stock was traded on the NASDAQ Global Select Market (“NASDAQ”) under the symbol “HUGH.” The following table shows the high and low sale prices per share of our common stock for each quarter during 2010 and 2009 as reported by the NASDAQ:
| High | Low | |||||||
| Year Ended December 31, |
||||||||
| 2010: |
||||||||
| First quarter |
$ | 29.25 | $ | 24.76 | ||||
| Second quarter |
$ | 29.34 | $ | 21.19 | ||||
| Third quarter |
$ | 28.40 | $ | 22.44 | ||||
| Fourth quarter |
$ | 43.94 | $ | 26.53 | ||||
| 2009: |
||||||||
| First quarter |
$ | 20.25 | $ | 7.77 | ||||
| Second quarter |
$ | 25.20 | $ | 11.50 | ||||
| Third quarter |
$ | 31.52 | $ | 20.25 | ||||
| Fourth quarter |
$ | 31.44 | $ | 21.68 | ||||
The closing sale price of our common stock as reported on the NASDAQ on March 3, 2011 was $59.80 per share. At that date, there were 514 holders of record of our common stock.
Dividends
We have not paid any dividends on our common stock, and we do not anticipate or intend to pay cash dividends on our common stock for the foreseeable future. We are a holding company and our principal assets are membership interests of Hughes Network Systems, LLC (“HNS”) and cash. In the event that we choose to pay dividends, we would be primarily reliant on distributions or dividends from our subsidiaries to pay such dividends. The ability of HNS to pay us distributions or transfer funds or other assets is subject to the terms of HNS’ debt agreements which, among other things, limit the ability of HNS and certain of its subsidiaries to pay dividends or distributions or transfer funds or other assets to us. Our board of directors will determine any changes in our dividend policy based upon its analysis of factors it deems relevant. We expect that these factors will include our financial condition, earnings, cash requirements and legal requirements.
37
Table of Contents
Performance Graph
The following performance graph shows the cumulative total return to a holder of our common stock compared with the cumulative total return of the NASDAQ Composite Index and the NASDAQ Telecommunications Index for the period from February 23, 2006 (the date our common stock began trading on a national market) through December 31, 2010. The comparison assumes the investment of $100 on February 23, 2006 in our common stock and each of the foregoing indices and reinvestment of all dividends.
Cumulative Total Returns
$100 Invested at February 23, 2006
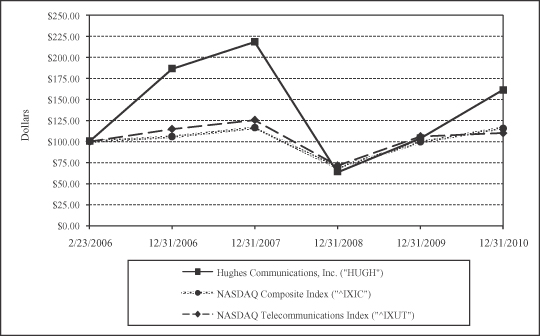
| February
23, 2006 |
December 31, | |||||||||||||||||||||||
| 2006 | 2007 | 2008 | 2009 | 2010 | ||||||||||||||||||||
| Hughes Communications, Inc. |
$ | 100.00 | $ | 186.48 | $ | 218.44 | $ | 63.76 | $ | 104.12 | $ | 161.80 | ||||||||||||
| NASDAQ Composite Index |
$ | 100.00 | $ | 105.97 | $ | 116.36 | $ | 69.19 | $ | 99.55 | $ | 116.39 | ||||||||||||
| NASDAQ Telecommunications Index |
$ | 100.00 | $ | 115.13 | $ | 125.69 | $ | 71.67 | $ | 106.24 | $ | 110.41 | ||||||||||||
38
Table of Contents
| Item 6. | Selected Financial Data |
Set forth below is our selected consolidated financial data. For the years ended or as of December 31, 2010, 2009, 2008, 2007 and 2006, our consolidated balance sheets and statements of operations data are derived from our audited consolidated financial statements. The selected consolidated financial data presented below should be read in conjunction with our consolidated financial statements, the notes to our consolidated financial statements included in Item 8. Financial Statements and Supplementary Data and Item 7. Management’s Discussion and Analysis of Financial Condition and Results of Operations of this report.
| As of or For the Year Ended December 31, | ||||||||||||||||||||
| 2010 | 2009 | 2008 | 2007 | 2006 | ||||||||||||||||
| (Dollars in thousands, except per share amounts) | ||||||||||||||||||||
| Consolidated statements of operations data: |
||||||||||||||||||||
| Revenues |
$ | 1,043,327 | $ | 1,009,699 | $ | 1,060,353 | $ | 970,648 | $ | 858,699 | ||||||||||
| Income tax expense |
$ | 5,716 | $ | 2,446 | $ | 7,593 | $ | 5,337 | $ | 54,110 | ||||||||||
| Income (loss) from continuing operations |
$ | 22,787 | $ | (52,693 | ) | $ | 9,018 | $ | 43,540 | $ | (39,310 | ) | ||||||||
| Net income (loss) attributable to Hughes Communications, Inc. (“HCI”) stockholders |
$ | 22,787 | $ | (52,693 | ) | $ | 9,018 | $ | 43,540 | $ | (40,567 | ) | ||||||||
| Basic net earnings (loss) per common share: |
||||||||||||||||||||
| Continuing operations |
$ | 1.05 | $ | (2.46 | ) | $ | 0.44 | $ | 2.31 | $ | (2.44 | ) | ||||||||
| Discontinued operations |
- | - | - | - | 0.01 | |||||||||||||||
| Basic net earnings (loss) per common share |
$ | 1.05 | $ | (2.46 | ) | $ | 0.44 | $ | 2.31 | $ | (2.43 | ) | ||||||||
| Diluted net earnings (loss) per common share: |
||||||||||||||||||||
| Continuing operations |
$ | 1.00 | $ | (2.46 | ) | $ | 0.44 | $ | 2.26 | $ | (2.44 | ) | ||||||||
| Discontinued operations |
- | - | - | - | 0.01 | |||||||||||||||
| Diluted net earnings (loss) per common share |
$ | 1.00 | $ | (2.46 | ) | $ | 0.44 | $ | 2.26 | $ | (2.43 | ) | ||||||||
| Consolidated balance sheet data: |
||||||||||||||||||||
| Total assets |
$ | 1,363,175 | $ | 1,302,394 | $ | 1,190,393 | $ | 1,129,837 | $ | 931,644 | ||||||||||
| Long-term obligations |
$ | 767,884 | $ | 731,313 | $ | 596,303 | $ | 584,287 | $ | 487,269 | ||||||||||
| HCI stockholders’ equity |
$ | 329,050 | $ | 304,041 | $ | 339,144 | $ | 262,435 | $ | 216,424 | ||||||||||
| Ratio of earnings to fixed charges |
1.2x | * | 1.2x | 1.6x | 1.3x | |||||||||||||||
| Deficiency of earnings to fixed charges |
$ | (51,087 | ) | |||||||||||||||||
| * | Ratio not provided due to deficiency in the period. |
39
Table of Contents
| Item 7. | Management’s Discussion and Analysis of Financial Condition and Results of Operations |
The following discussion and analysis of the Company’s financial condition and results of operations are based upon financial statements which have been prepared in accordance with accounting principles generally accepted in the United States of America and should be read together with our consolidated financial statements and the notes to those consolidated financial statements included elsewhere in this report. This report contains forward-looking statements that involve risks and uncertainties, including statements regarding our capital needs, business strategy, expectations and intentions within the meaning of Section 27A of the Securities Act of 1933, as amended, and Section 21E of the Securities Exchange Act of 1934, as amended, which represent our expectations or beliefs concerning future events. We urge you to consider statements that use the terms “believe,” “do not believe,” “anticipate,” “expect,” “plan,” “may,” “estimate,” “strive,” “intend,” “will,” “should,” and variations of these words or similar expressions are intended to identify forward-looking statements. These statements reflect our current views with respect to future events and because our business is subject to numerous risks, and uncertainties, our actual results could differ materially from those anticipated in the forward-looking statements, including those set forth below under this “Item 7. Management’s Discussion and Analysis of Financial Condition and Results of Operations” “Special Note Regarding Forward-Looking Statements” and contained elsewhere in this report. All forward-looking statements speak only as of the date of this report. Actual results will most likely differ from those reflected in these forward-looking statements and the differences could be substantial. We disclaim any obligation to update these forward-looking statements or disclose any difference, except as may be required by securities laws, between our actual results and those reflected in these statements. Although we believe that our plans, intentions and expectations reflected in or suggested by the forward-looking statements in this report are reasonable, we can give no assurance that such plans, intentions or expectations will be achieved.
Overview
Hughes Communications, Inc. (“HCI” and, together with its consolidated subsidiaries, the “Company” or “we,” “us,” and “our”) operates its business primarily through Hughes Network Systems, LLC (“HNS”), our wholly-owned subsidiary, a telecommunications company. We provide equipment and services to the broadband communications marketplace. We have extensive technical expertise in satellite, wire line and wireless communications which we utilize in a number of product and service offerings. In particular, we offer a spectrum of broadband equipment and services to the managed services market, which is comprised of enterprises with a requirement to connect a large number of geographically dispersed locations with reliable, scalable, and cost-effective applications, such as credit card verification, inventory tracking and control, and broadcast video. We provide broadband network services and systems to the international and domestic enterprise markets and satellite Internet broadband access to North American consumers, which we refer to as the Consumer market. In addition, we provide networking systems to customers for mobile satellite, wireless backhaul systems and telematics. These services are generally provided on a contract or project basis and may involve the use of proprietary products engineered by us.
Strategic Initiatives and Their Impact on Our Results of Operations
For the years ended December 31, 2010, 2009 and 2008, our net income (loss) attributable to our stockholders was $22.8 million, $(52.7) million and $9.0 million, respectively. The changes in our net income (loss) for both 2010 and 2009 were significantly impacted by the $50.6 million impairment losses recognized in 2009 associated mainly with our prepaid deposit (the “Deposit”) paid to Sea Launch Company, LLC (“Sea Launch”). See Item 3—Legal Proceedings of this report for further detail. Our gross margin for 2010 increased by $44.1 million, or 16.3%, compared to 2009, primarily attributable to the growth in our consumer subscriber base. The increase in our 2010 net income was partially offset by additional selling, general and administrative (“SG&A”) expenses incurred in 2010 as part of our effort in expanding our consumer and enterprise businesses in the North America Broadband segment. In addition to the impairment mentioned above, our 2009 net loss also reflected $9.9 million of interest expense associated with the issuance of the $150.0 million of 9.50% senior notes maturing on April 15, 2014 (“2009 Senior Notes”) in 2009.
40
Table of Contents
Technology— We incorporate advances in technology to reduce costs and to increase the functionality and reliability of our products and services. Through the usage of advanced spectrally efficient modulation and coding methodologies, such as DVB-S2, and proprietary software web acceleration and compression techniques, we continue to improve the efficiency of our networks. In addition, we invest in technologies to enhance our system and network management capabilities, specifically our managed services for enterprises. We also continue to invest in next generation technologies that can be applied to our future products and services.
Acquisitions, Strategic Alliances and Divestitures—We continue to focus on expanding the identified markets for our products, services and network solutions in our North America Broadband, International Broadband and Telecom Systems segments. Consistent with our strategy to grow and improve our financial position, we also review our competitive position on an ongoing basis and, from time to time, consider various acquisitions, strategic alliances and divestitures which we believe would be beneficial to our business. We, from time to time, consider various alternatives related to the development, construction and ownership structure of satellite assets and related ground infrastructure, capacity features and other factors that would promote long-term growth on a global basis, while meeting the needs of our customers.
On February 13, 2011, we entered into an Agreement and Plan of Merger (the “Merger Agreement”) with EchoStar Corporation, a Nevada corporation (“EchoStar”), EchoStar Satellite Services L.L.C., a Colorado limited liability company, and Broadband Acquisition Corporation, a Delaware corporation (“Merger Sub”), pursuant to which, subject to the terms and conditions set forth therein, Merger Sub will merge with and into the Company (the “Merger”), with the Company continuing as the surviving entity and becoming a wholly owned subsidiary of EchoStar. The Merger is expected to close later this year, subject to certain closing conditions, including among others, certain government regulatory approvals, such as approval by the Federal Communications Commission and the Federal Trade Commission.
Sales and Distribution—In June 2009, HNS entered into an agreement with Space Systems/Loral, Inc. (“SS/L”), under which SS/L will manufacture our next-generation, geostationary high throughput satellite (“HTS”) named Jupiter. Jupiter will employ a multi-spot beam, bent pipe Ka-band architecture and will provide additional capacity for the HughesNet service in North America. The Company anticipates launching Jupiter in the first half of 2012. HNS entered into a contract with Barrett Xplore Inc. (“Barrett”), whereby Barrett agreed to lease user beams and purchase gateways and Ka-band terminals for the Jupiter satellite that are designed to operate in Canada (the “Barrett Agreement”). As of December 31, 2010, our revenue backlog from Barrett totaled to $254.3 million. Of this, $245 million is associated with Barrett leasing the user beams and expected to be realized ratably over 15 years once Jupiter is launched and placed into service and $9.3 million is related to the development and delivery of the gateways and terminals, which is expected to be completed in 2011.
In August 2010, we were awarded $58.7 million from the U.S. Government as the only national provider of high-speed satellite broadband service under the broadband stimulus programs, established pursuant to the American Recovery and Reinvestment Act of 2009. This award is part of the U.S. Government’s investments in broadband projects to expand access to broadband service and create jobs and economic opportunity in rural, underserved communities nationwide. We began to offer services to customers under this program in October 2010.
Key Business Metrics
Business Segments—We divide our operations into five distinct segments—(i) the North America Broadband segment; (ii) the International Broadband segment; (iii) the Telecom Systems segment; (iv) the HTS Satellite segment; and (v) the Corporate and Other segment. Within the North America Broadband segment, sales are attributed to the Consumer group, which delivers broadband Internet service to consumer customers, and the Enterprise group, which provides satellite, wireline and wireless communication network products and services to enterprises. The International Broadband segment consists of our international service companies and provides managed network services and equipment to enterprise customers and broadband service providers worldwide.
41
Table of Contents
The Telecom Systems segment consists of the Mobile Satellite Systems group, the Terrestrial Microwave group, and the Telematics group. The Mobile Satellite Systems group provides turnkey satellite ground segment systems to mobile system operators. The Terrestrial Microwave group provides point-to-multipoint microwave radio network systems that are used for both cellular backhaul and broadband wireless access. The Telematics group provides development, engineering and manufacturing services to Hughes Telematics, Inc. (“HTI”). However, as a result of the unfavorable impact of the economy on the automobile industry in 2009, HTI terminated substantially all of the development, engineering and manufacturing services with us in August 2009. We expect our future revenue from the Telematics group to be insignificant. The HTS Satellite segment, which is a new segment starting in 2010, consists of activities related to the development, construction and launch of high throughput satellites and currently represents construction activities of Jupiter and the development of related network equipment. As a result of the newly established HTS Satellite segment in 2010, construction activities of Jupiter in 2009, which was included in the North America Broadband segment, have been reclassified to the HTS Satellite segment to conform to the current period presentation. The Corporate and Other segment includes certain minority interest investments held by us and our corporate offices and assets not specifically related to another business segment. Due to the complementary nature and common architecture of our services and products across our business segments, we are able to leverage our expertise and resources within our various operating units to yield significant cost efficiencies.
Revenues—We generate revenues from the sale of hardware and the provision of services. In our North America and International Broadband segments, we generate revenues from services and hardware. In our Telecom Systems segment, we generate revenues primarily from the development and sale of hardware. Some of our enterprise customers purchase equipment separately and operate their own networks. These customers include large enterprises, incumbent local exchange carriers, governmental agencies and resellers. Contracts for our services vary in length depending on the customers’ requirements.
Average revenue per unit (“ARPU”)—ARPU is calculated by dividing the total service revenues from the Consumer group for the reporting period by the sum of the total number of subscribers in our Consumer group at the end of each month in the reporting period. Our ARPU calculation may not be consistent with other companies’ calculation in the same or similar businesses as we are not aware of any uniform standards for calculating ARPU.
Churn rate—Churn rate represents the average of the monthly churn rates for the months included in the reporting period. Monthly churn rate is calculated by dividing the number of churns for the month for the subscribers by the number of subscribers at the end of the month in our Consumer group and our small/medium enterprise and wholesale business customers. Our churn rate calculations may not be consistent with other companies’ calculation in the same or similar businesses as we are not aware of any uniform standards for calculating churn rate.
42
Table of Contents
Services—Our services revenue is varied in nature and includes equipment rental from our consumer rental program, total turnkey communications services, terminal relocation, maintenance and changes, transponder capacity and multicast or broadcast services. Our services are offered on a contractual basis, which vary in length based on the particular end market. Typically, our large enterprise customers enter into a three- to five-year contract, and our consumer customers enter into a 24-month contract. We bill and recognize service revenues on a monthly per site basis. Our services include the following:
| Service Type |
Description | |||
| Broadband connectivity | • | Provides basic transport, intranet connectivity services and Internet service provider services | ||
| • | Applications include high-speed Internet access, IP VPN, multicast file delivery and streaming, point-of-sale credit transactions, enterprise back-office communications, and satellite backup for frame relay service and other terrestrial networks | |||
| Managed network services | • | Provides one-stop turnkey suite of bundled services that include wireline and wireless satellite networks | ||
| • | Includes network design program management, installation management, network and application engineering services, proactive network management, network operations, field maintenance and customer care | |||
| ISP services and hosted application | • | Provides Internet connectivity and hosted customer-owned and managed applications on our network facilities | ||
| • | Provides the customer application services developed by us or in conjunction with our service partners | |||
| • | Includes Internet access, e-mail services, web hosting and online payments | |||
| Digital media services | • | Digital content management and delivery including video, online learning and digital signage applications | ||
| Customized business solutions | • | Provides customized, industry-specific enterprise solutions that can be applied to multiple businesses in a given industry | ||
Our services to enterprise customers are negotiated on a contract-by-contract basis with price varying based on numerous factors, including number of sites, complexity of system and scope of services provided. We have the ability to integrate these service offerings to provide comprehensive solutions for our customers. We also provide managed services to our customers who operate their own dedicated network facilities and charge them a management fee for the operation and support of their networks.
Hardware—We offer our enterprise customers the option to purchase their equipment up front or to finance the sale through a third-party leasing company as part of their service agreement under which payments are made over a fixed term. Our consumer customers also have the option to purchase the equipment up front with a 24-month service contract. Hardware revenues of the North American Enterprise group and International Broadband segment are derived from: (i) network operating centers; (ii) radio frequency terminals (earth stations); (iii) VSAT components including indoor units, outdoor units, and antennas; (iv) voice, video and data appliances; (v) routers and DSL modems; and (vi) system integration services to integrate all of the above into a system.
We also provide specialized equipment to our Mobile Satellite Systems and Terrestrial Microwave customers. Through large multi-year contracts, we develop and supply turnkey networking and terminal systems for various operators who offer mobile satellite-based services. We also supply microwave-based networking equipment to mobile operators for back-hauling their data from cellular telephone sites to their switching centers. In addition, local exchange carriers use our equipment for broadband access traffic from corporations bypassing local phone companies. The size and scope of these projects vary from year to year by customer and do not follow a pattern that can be reasonably predicted.
43
Table of Contents
Revenue Backlog—We benefit from strong visibility of our future revenues. At December 31, 2010, 2009 and 2008, our total revenue backlog, which we define as our expected future revenue under customer contracts that are non-cancelable and excluding agreements with our consumer customers, was approximately $1,063.8 million, $834.0 million and $840.9 million, respectively. We expect to realize future revenue from our backlog as follows: $318.7 million in 2011, $230.8 million in 2012, $140.1 million in 2013, $95.1 million in 2014 and $279.1 million thereafter. Included in our revenue backlog are future revenues of $254.3 million associated with our Jupiter satellite. Of the $254.3 million, $245.0 million is associated with the the Barrett Agreement for satellite capacity, which revenue is expected to be realized ratably over 15 years once the satellite is launched and placed into service and $9.3 million is related to gateway developments for Barrett. Of the $245.0 million in backlog, the Company has collected $5.0 million related to a non-refundable reservation fee.
The amounts included in backlog represent the full contract value for the duration of the contract and does not include termination fees. We do not assume that a contract will be renewed beyond its stated expiration date. In certain cases of breach for non-payment or customer bankruptcy, we may not be able to recover the full value of certain contracts or termination fees.
Generally, following the successful launch of a satellite, if the satellite is operating nominally, our customers may only terminate their service agreements for satellite capacity by paying us all, or substantially all, of the payments that would have otherwise become due over the term of the service agreement. In the case of our satellite under construction, Jupiter, we would not be obligated to return the customer prepayments made under service agreements for the satellite if the launch was to fail. Also, if the launch of Jupiter was significantly delayed, our customers could exercise their right of termination under their service agreement. See Item 1A. Risk Factors and Special Note Regarding Forward-Looking Statements for a discussion of the potential risks to our revenue and backlog. Although we have signed contracts with our consumer customers for 24 months, we do not include these contractual commitments in our backlog.
Cost of Services—Our cost of services primarily consist of transponder capacity leases, hub infrastructure, customer care, wireline and wireless capacity, depreciation expense related to network infrastructure and capitalized hardware and software, and the salaries and related employment costs for those employees who manage our network operations and other project areas. These costs are dependent on the number of customers served and have increased relative to our growth. We continue to execute a number of cost containment and efficiency initiatives that were implemented in previous years. In addition, the migration to a single upgraded platform for ongoing consumer customers from our North America Broadband segment has enabled us to leverage our satellite bandwidth and network operation facilities to achieve further cost efficiencies. The costs associated with transponder capacity leases for the Consumer group are expected to decline as more customers are added to the SPACEWAY network.
Cost of Hardware—We outsource a significant portion of the manufacturing of our hardware for our North America and International Broadband and Telecom Systems segments to third-party contract manufacturers. Our cost of hardware relates primarily to direct materials and subsystems (e.g., antennas), salaries and related employment costs for those employees who are directly associated with the procurement and manufacture of our products and other items of indirect overhead incurred in the procurement and production process. Cost of hardware also includes certain engineering and hardware costs related to the design of a particular product for specific customer programs. As we have developed new product offerings, we have reduced product costs due to higher levels of component integration, design improvements and volume increases.
Subscriber acquisition costs (“SAC”) are associated with our Consumer group and are comprised of three elements: (i) the subsidy for the cost of hardware and related installation; (ii) certain sales and marketing expense; and (iii) dealer and customer service representative commissions on new installations/activations. The subsidy for cost of hardware and related cost of installation is deferred and amortized over the shorter of the initial contract period or the useful life of the hardware as a component of cost of hardware for hardware related sales or cost of services for activities related to the consumer rental program. The portion of SAC related to sales
44
Table of Contents
and marketing is expensed as incurred. Dealer and customer service representative commissions are deferred and amortized over the initial contract period as a component of sales and marketing expense.
SG&A—Selling expenses primarily consist of the salaries, commissions, related benefit costs of our direct sales force and marketing staff, advertising, channel compensations on new activations which are deferred and amortized over the initial consumer contract period, travel, allocation of facilities, and other directly related overhead costs for our domestic and international businesses. General and administrative expenses include bad debt expense and salaries and related employee benefits for employees associated with common supporting functions, such as accounting and finance, risk management, legal, information technology, administration, human resources, and senior management. Selling, general, and administrative costs also include facilities costs, third-party service providers’ costs (such as outside tax and legal counsel, and insurance providers), bank fees related to credit card processing charges and depreciation of fixed assets.
Research and Development (“R&D”)—The Company’s R&D programs are important to support future growth by reducing costs and providing new technology and innovations to its customers. R&D expenses primarily consist of the salaries of certain members of our engineering staff plus an applied overhead charge. R&D expenses also include engineering support for existing platforms and development efforts to build new products and software applications, subcontractors, material purchases and other direct costs in support of product development.
Market Trends Impacting Our Revenues
The following table presents our revenues by end market for the years ended December 31, 2010, 2009 and 2008 (dollars in thousands):
| Variance | ||||||||||||||||||||||||||||
| Year Ended December 31, | 2010 vs. 2009 | 2009 vs. 2008 | ||||||||||||||||||||||||||
| 2010 | 2009 | 2008 | Amount | % | Amount | % | ||||||||||||||||||||||
| Revenues: |
||||||||||||||||||||||||||||
| Services revenues |
$ | 791,324 | $ | 712,592 | $ | 611,247 | $ | 78,732 | 11.0 % | $ | 101,345 | 16.6 % | ||||||||||||||||
| Hardware revenues |
252,003 | 297,107 | 449,106 | (45,104 | ) | (15.2)% | (151,999 | ) | (33.8)% | |||||||||||||||||||
| Total revenues |
$ | 1,043,327 | $ | 1,009,699 | $ | 1,060,353 | $ | 33,628 | 3.3 % | $ | (50,654 | ) | (4.8)% | |||||||||||||||
| Revenues by end market: |
||||||||||||||||||||||||||||
| North America Broadband segment: |
||||||||||||||||||||||||||||
| Consumer |
$ | 477,056 | $ | 419,563 | $ | 376,055 | $ | 57,493 | 13.7 % | $ | 43,508 | 11.6 % | ||||||||||||||||
| Enterprise |
256,694 | 270,716 | 291,610 | (14,022 | ) | (5.2)% | (20,894 | ) | (7.2)% | |||||||||||||||||||
| Total North America Broadband segment |
733,750 | 690,279 | 667,665 | 43,471 | 6.3 % | 22,614 | 3.4 % | |||||||||||||||||||||
| International Broadband segment |
205,607 | 203,886 | 237,188 | 1,721 | 0.8 % | (33,302 | ) | (14.0)% | ||||||||||||||||||||
| Telecom Systems segment: |
||||||||||||||||||||||||||||
| Mobile Satellite Systems |
79,824 | 76,772 | 105,725 | 3,052 | 4.0 % | (28,953 | ) | (27.4)% | ||||||||||||||||||||
| Terrestrial Microwave |
14,744 | 12,083 | 18,248 | 2,661 | 22.0 % | (6,165 | ) | (33.8)% | ||||||||||||||||||||
| Telematics |
501 | 23,645 | 31,065 | (23,144 | ) | (97.9)% | (7,420 | ) | (23.9)% | |||||||||||||||||||
| Total Telecom Systems segment |
95,069 | 112,500 | 155,038 | (17,431 | ) | (15.5)% | (42,538 | ) | (27.4)% | |||||||||||||||||||
| HTS Satellite segment |
3,317 | - | - | 3,317 | * | - | * | |||||||||||||||||||||
| Corporate and Other segment |
5,584 | 3,034 | 462 | 2,550 | 84.0 % | 2,572 | 556.7 % | |||||||||||||||||||||
| Total revenues |
$ | 1,043,327 | $ | 1,009,699 | $ | 1,060,353 | $ | 33,628 | 3.3 % | $ | (50,654 | ) | (4.8)% | |||||||||||||||
| * | Percentage not meaningful. |
45
Table of Contents
The following table presents our churn rate, ARPU, average monthly gross subscriber additions, and subscribers as of or for the years ended December 31, 2010, 2009 and 2008:
| As of or For the Year Ended December 31, |
Variance | |||||||||||||||||||||||||||
| 2010 vs. 2009 | 2009 vs. 2008 | |||||||||||||||||||||||||||
| 2010 | 2009 | 2008 | Amount | % | Amount | % | ||||||||||||||||||||||
| Churn rate(1) |
2.12% | 2.23% | 2.36% | 0.11% | 4.9% | 0.13% | 5.5% | |||||||||||||||||||||
|
ARPU(2) |
$ | 74 | $ | 70 | $ | 68 | $ | 4 | 5.7% | $ | 2 | 2.9% | ||||||||||||||||
| Average monthly gross subscriber additions(1) |
17,700 | 16,500 | 14,000 | 1,200 | 7.3% | 2,500 | 17.9% | |||||||||||||||||||||
| Subscribers(1) |
578,200 | 504,300 | 432,800 | 73,900 | 14.7% | 71,500 | 16.5% | |||||||||||||||||||||
| (1) | Relates to our Consumer group and our small/medium enterprise and wholesale business customers who receive subscription services. The small/medium enterprise and wholesale business customers are part of our Enterprise group. The Consumer and Enterprise groups are part of our North America Broadband segment. The trend of this metric has been substantially similar for the Consumer group and the small/medium enterprise and wholesale business customers. |
| (2) | Relates only to our Consumer group, which is part of our North America Broadband segment. |
North America Broadband Segment
Revenue from our Consumer group for the year ended December 31, 2010 increased by 13.7% to $477.1 million compared to the same period in 2009. The growth in our Consumer group has been driven primarily by three factors: (i) the substantial growth in the number of subscribers arising from increased consumer awareness of our products and services as a result of the expansion of our use of direct mail campaigns and television commercials targeting geographic areas that have historically been underserved by DSL and cable services; (ii) value-added services, such as express repair and web premium content services, and the election by our customers to utilize the consumer rental program and to subscribe to higher level service plans resulting in an increase in ARPU; and (iii) improvements in customer retention as shown by the reduction in the churn rate.
As of December 31, 2010 and 2009, we achieved a total subscription base of 578,200 and 504,300, respectively, which included 36,100 and 28,000, respectively, subscribers in our small/medium enterprise and wholesale businesses. Our ARPU, which is used to measure average monthly consumer subscription service revenues on a per subscriber basis, was $74 and $70 for the years ended December 31, 2010 and 2009, respectively.
Revenue from our North American Enterprise group for the year ended December 31, 2010 decreased by 5.2% to $256.7 million compared to the same period in 2009. The decrease was related to the reduction in hardware revenues due to delays in customer buying decisions, which impacted new hardware orders. Partially offsetting the reduction in hardware revenues was the increase in service revenues as a result of growth in the managed service business. Enterprise service revenue is generally characterized by long-term service contracts.
International Broadband Segment
Revenue from our International Enterprise group for the year ended December 31, 2010 increased by 0.8% to $205.6 million compared to the same period in 2009, primarily due to the favorable impact of currency exchange of $7.1 million as a result of the depreciation of the U.S. dollar and the continued growth of our expanding array of solutions and global services to enterprises and government organizations in Brazil and the Africa/Middle East region. The increase was partially offset by delays in customer buying decisions which impacted new hardware orders.
46
Table of Contents
Telecom Systems Segment
Revenue from our Telecom Systems segment for the year ended December 31, 2010 decreased by 15.5% to $95.1 million compared to the same period in 2009. The decrease was due to a reduction in revenue from our Telematics group of $23.1 million to $0.5 million compared to the same period in 2009. The decrease in revenue was partially offset by the increase in revenue from our Mobile Satellite Systems and Terrestrial Microwave groups.
HTS Satellite Segment
Pursuant to the Barrett Agreement, we develop and deliver gateways for Barrett’s service business in Canada which will utilize Jupiter capacity. In 2010, we recognized $3.3 million of hardware revenues for the HTS Satellite segment.
Selected Segment Data
Our operations are comprised of five segments: (i) the North America Broadband segment; (ii) the International Broadband segment; (iii) the Telecom Systems segment; (iv) the HTS Satellite segment; and (v) the Corporate and Other segment. The following tables set forth our revenues and operating income for our reportable segments (dollars in thousands):
| Variance | ||||||||||||||||||||||||||||
| Year Ended December 31, | 2010 vs. 2009 | 2009 vs. 2008 | ||||||||||||||||||||||||||
| 2010 | 2009 | 2008 | Amount | % | Amount | % | ||||||||||||||||||||||
| Revenues by end market: |
||||||||||||||||||||||||||||
| North America Broadband segment |
$ | 733,750 | $ | 690,279 | $ | 667,665 | $ | 43,471 | 6.3 % | $ | 22,614 | 3.4 % | ||||||||||||||||
| International Broadband segment |
205,607 | 203,886 | 237,188 | 1,721 | 0.8 % | (33,302 | ) | (14.0)% | ||||||||||||||||||||
| Telecom Systems segment |
95,069 | 112,500 | 155,038 | (17,431 | ) | (15.5)% | (42,538 | ) | (27.4)% | |||||||||||||||||||
| HTS Satellite segment |
3,317 | - | - | 3,317 | * | - | * | |||||||||||||||||||||
| Corporate and Other segment |
5,584 | 3,034 | 462 | 2,550 | 84.0 % | 2,572 | 556.7 % | |||||||||||||||||||||
| Total revenues |
$ | 1,043,327 | $ | 1,009,699 | $ | 1,060,353 | $ | 33,628 | 3.3 % | $ | (50,654 | ) | (4.8)% | |||||||||||||||
| Operating income (loss) by end market: |
||||||||||||||||||||||||||||
| North America Broadband segment(1) |
$ | 67,884 | $ | (7,991 | ) | $ | 21,339 | $ | 75,875 | * | $ | (29,330 | ) | * | ||||||||||||||
| International Broadband segment |
10,571 | 15,120 | 21,679 | (4,549 | ) | (30.1)% | (6,559 | ) | (30.3)% | |||||||||||||||||||
| Telecom Systems segment |
14,183 | 14,227 | 25,116 | (44 | ) | (0.3)% | (10,889 | ) | (43.4)% | |||||||||||||||||||
| HTS Satellite segment |
(3,350 | ) | (37 | ) | - | (3,313 | ) | * | (37 | ) | * | |||||||||||||||||
| Corporate and Other segment(2) |
(3,664 | ) | (9,007 | ) | (3,842) | 5,343 | 59.3 % | (5,165 | ) | (134.4)% | ||||||||||||||||||
| Total operating income |
$ | 85,624 | $ | 12,312 | $ | 64,292 | $ | 73,312 | 595.5 % | $ | (51,980 | ) | (80.8)% | |||||||||||||||
| * | Percentage not meaningful. |
| (1) | For the year ended December 31, 2009, operating loss for North America Broadband segment includes $44.4 million of impairment loss related to our prepaid deposit (see Item 3—Legal Proceedings for further discussion). |
| (2) | For the year ended December 31, 2009, amount includes $5.2 million impairment loss related to our investment in HTI. |
47
Table of Contents
Results of Operations
Year Ended December 31, 2010 Compared to Year Ended December 31, 2009
Revenues
| Year Ended December 31, | Variance | |||||||||||||||
| (Dollars in thousands) |
2010 | 2009 | Amount | % | ||||||||||||
| Services revenues |
$ | 791,324 | $ | 712,592 | $ | 78,732 | 11.0 % | |||||||||
| Hardware revenues |
252,003 | 297,107 | (45,104 | ) | (15.2)% | |||||||||||
| Total revenues |
$ | 1,043,327 | $ | 1,009,699 | $ | 33,628 | 3.3 % | |||||||||
| % of revenue to total revenues: |
||||||||||||||||
| Services revenues |
75.8% | 70.6% | ||||||||||||||
| Hardware revenues |
24.2% | 29.4% | ||||||||||||||
Services Revenues
The increase in services revenues was attributable to our North America Broadband segment. Revenues from our Consumer group increased by $72.4 million to $454.4 million in 2010 compared to $382.0 million in 2009. The increase was primarily due to the growth in our subscriber base and ARPU as a result of increased marketing and sales efforts, as well as a larger percentage of our customers utilizing the consumer rental program throughout 2010 compared to 2009 and the increased adoption of premium service offerings among our consumer subscriber base.
In addition, revenue from our North America Enterprise group increased by $7.8 million to $191.5 million in 2010 compared to $183.7 million in 2009. The increase reflected the growth in our managed services business, new contracts awarded in prior periods that provided incremental service revenue in 2010 and the growth in our small/medium and wholesale subscriber base.
Furthermore, services revenue from our International Broadband segment increased by $12.3 million to $134.4 million in 2010 from $122.1 million in 2009, primarily due to the continued growth of our expanding array of solutions and global services to enterprises and government organizations in Brazil and the Africa/Middle East region. Also, contributing to the increase in international service revenue was $6.3 million as a result of the favorable impact of currency exchange due to the depreciation of the U.S. dollar.
Partially offsetting the increase in services revenue was a decrease in revenue from our Telecom Systems segment of $16.4 million to $5.4 million in 2010 compared to $21.8 million in 2009, mainly as a result of a significant reduction in revenues from the Telematics group.
Hardware Revenues
Hardware revenues from our North America Broadband segment decreased by $36.8 million to $87.8 million in 2010 compared to $124.6 million in 2009.
Despite the growth in the subscriber base, hardware revenues in the Consumer group decreased by $15.0 million to $22.6 million in 2010 compared to $37.6 million in 2009. The decrease was due to an increase in customers utilizing (i) the consumer rental program, which accounts for rental revenues as services revenues, instead of the previously offered financed purchase plan, which revenues were accounted for as hardware revenues and (ii) the consumer rebate programs which reduced hardware revenues.
48
Table of Contents
Hardware revenue from our North America Enterprise group also decreased by $21.8 million to $65.2 million in 2010 compared to $87.0 million in 2009. The decrease was due to a lower volume of shipments as enterprise customers delayed their buying decisions as well as the changes in the product mix where the emphasis on managed services, which typically includes a combination of satellite and terrestrial hardware, has led to lower upfront hardware revenue.
In addition, hardware revenues from our International Broadband segment decreased by $10.6 million to $71.2 million in 2010 compared to $81.8 million in 2009. The decrease was primarily due to the completion of the rollout of terminal shipments in 2009 on a multi-year contract for a large lottery operator in the United Kingdom and a decrease in shipment volume to our international enterprise customers as delays in customer buying decisions impacted new hardware orders. These decreases were slightly offset by a $0.8 million favorable impact of currency exchange due to the depreciation of the U.S. dollar.
Hardware revenues from our Telecom Systems segment decreased by $1.0 million to $89.7 million in 2010 compared to $90.7 million in 2009, mainly due to the decrease in hardware revenue from the Telematics group.
The decrease in hardware revenues in 2010 was partially offset by revenues of $3.3 million from the HTS segment associated with the construction of gateway equipment for Barrett pursuant to the Barrett Agreement.
Cost of Revenues
| Year Ended December 31, | Variance | |||||||||||||||
| (Dollars in thousands) |
2010 | 2009 | Amount | % | ||||||||||||
| Cost of services |
$ | 493,023 | $ | 448,804 | $ | 44,219 | 9.9 % | |||||||||
| Cost of hardware |
234,805 | 289,516 | (54,711 | ) | (18.9)% | |||||||||||
| Total cost of revenues |
$ | 727,828 | $ | 738,320 | $ | (10,492 | ) | (1.4)% | ||||||||
| Gross margin: |
||||||||||||||||
| Services revenues |
37.7% | 37.0% | ||||||||||||||
| Hardware revenues |
6.8% | 2.6% | ||||||||||||||
Cost of Services
Cost of services increased in conjunction with the increase in services revenues, mainly due to the growth in our consumer subscriber base and our managed services businesses in the North America Broadband segment. The primary drivers for the increased costs associated with this growth in services included customer service and support, wireline and wireless costs, field services, network operations and depreciation expense, which increased by $41.9 million for the year ended December 31, 2010 compared to the same period in 2009. The increases were partially offset by lower transponder capacity lease expense. We expect transponder capacity lease expense for the Consumer group to continue to decrease as more customers are placed on the SPACEWAY network.
In addition, cost of services from our International Broadband segment increased by $12.7 million, primarily due to an increase in the number of enterprise and global service sites in service across Brazil and the Africa/Middle East region. The increase was partially offset by a decrease of $12.6 million in cost of services from the Telecom Systems segment to $4.1 million in 2010 compared to $16.7 million in 2009, mainly related to the decline in Telematics group revenue.
Cost of Hardware
Cost of hardware decreased in conjunction with the reduction in hardware revenues. Cost of hardware from our North America Broadband segment decreased by $40.6 million to $121.6 million in 2010 compared to
49
Table of Contents
$162.2 million in 2009. Of the $40.6 million reduction, $26.9 million was attributable to the Consumer group despite the growth in the consumer subscriber base. Cost of hardware from the Consumer group decreased because of: (i) more customers utilizing the consumer rental program, for which hardware cost is accounted for as a component of services cost, instead of the previously offered deferred purchase plan, which cost was accounted for as hardware cost and (ii) lower hardware unit cost as a result of improved manufacturing efficiency.
Cost of hardware from our International Broadband segment decreased by $11.9 million to $44.9 million in 2010 compared to $56.8 million in 2009, primarily due to the reduction in hardware revenues. Cost of hardware from our Telecom Systems segment decreased by $4.9 million, primarily related to the reduction in hardware cost from the Telematics group.
Cost of hardware in 2010 also included the costs associated with the construction of gateway equipment for Barrett pursuant to the Barrett Agreement, which did not exist in 2009.
Selling, General and Administrative Expense
| Year Ended December 31, | Variance | |||||||||||||||
| (Dollars in thousands) |
2010 | 2009 | Amount | % | ||||||||||||
| Selling, general and administrative expense |
$ | 206,512 | $ | 180,675 | $ | 25,837 | 14.3% | |||||||||
| % of revenue |
19.8% | 17.9% | ||||||||||||||
The increase in SG&A expense was mainly driven by our expanded efforts in promoting our consumer and enterprise business in our North America Broadband segment, which caused an increase of $15.0 million in expenses. In addition, SG&A expense from our international subsidiaries increased by $4.9 million, primarily due to increased bad debt expenses in India and increased costs in Brazil, as a result of favorable foreign currency impacts in 2009. In December 2010, we also recorded an estimated reserve of $1.9 million for settlement costs associated with a consumer class-action lawsuit filed against us in 2009. See Item 3—Legal Proceedings of this report for further detail.
Loss on Impairments
There was no impairment loss recognized in 2010. In 2009, we recognized $50.6 million of impairment losses, primarily related to the Deposit paid to Sea Launch. See Item 3—Legal Proceedings of this report for further detail.
Research and Development
| Year Ended December 31, | Variance | |||||||||||||||
| (Dollars in thousands) |
2010 | 2009 | Amount | % | ||||||||||||
| Research and development |
$ | 20,279 | $ | 22,296 | $ | (2,017) | (9.0)% | |||||||||
| % of revenue |
1.9% | 2.2% | ||||||||||||||
R&D expense decreased due to a reduction in development activities of $7.4 million from our North America Broadband segment. This decrease was partially offset by the increase in R&D activities of $3.9 million and $1.2 million related to the construction of Jupiter and our Mobile Satellite Systems group, respectively.
Amortization of Intangible Assets
| Year Ended December 31, | Variance | |||||||||||||||
| (Dollars in thousands) |
2010 | 2009 | Amount | % | ||||||||||||
| Amortization of intangible assets |
$ | 3,084 | $ | 5,457 | $ | (2,373) | (43.5)% | |||||||||
| % of revenue |
0.3% | 0.5% | ||||||||||||||
50
Table of Contents
Amortization of intangible assets decreased primarily due to the impact of intangible assets reaching the end of their estimated life.
Operating Income
| Year Ended December 31, | Variance | |||||||||||||||
| (Dollars in thousands) |
2010 | 2009 | Amount | % | ||||||||||||
| Operating income |
$ | 85,624 | $ | 12,312 | $ | 73,312 | 595.5% | |||||||||
| % of revenue |
8.2% | 1.2% | ||||||||||||||
Our operating income increased significantly due to the improvement in gross margin of $44.1 million in 2010 compared to 2009, as a result of growth in our services businesses, primarily in our North American businesses, and the reduction of costs associated with leased satellite capacity. In addition, in 2009, we recognized impairment costs of $50.6 million associated with our Deposit paid to Sea Launch and our equity investment in HTI. There was no impairment cost in 2010. The increase in our operating income was partially offset by higher SG&A expenses of $25.8 million.
Interest Expense
| Year Ended December 31, | Variance | |||||||||||||||
| (Dollars in thousands) |
2010 | 2009 | Amount | % | ||||||||||||
| Interest expense |
$ | 59,345 | $ | 64,119 | $ | (4,774) | (7.4)% | |||||||||
Interest expense primarily relates to interest on the $450 million of 9.50% senior notes maturing on April 15, 2014 (the “2006 Senior Notes”), $150 million of 9.50% senior notes maturing on April 15, 2014 (the “2009 Senior Notes”) and the $115 million term loan maturing on April 15, 2014 (the “Term Loan Facility”) less capitalized interest associated with the construction of our Jupiter satellite. The decrease in interest expense was primarily due to $12.2 million of increased capitalized interest associated with the construction of Jupiter in 2010. The decrease was partially offset by higher interest expense of $6.6 million recognized on the 2009 Senior Notes for the twelve months in 2010 compared to eight months in 2009 as the 2009 Senior Notes were issued in May 2009.
Interest and Other Income, Net
| Year Ended December 31, | Variance | |||||||||||||||
| (Dollars in thousands) |
2010 | 2009 | Amount | % | ||||||||||||
| Interest income |
$ | 2,043 | $ | 2,222 | $ | (179) | (8.1)% | |||||||||
| Other income, net |
374 | 214 | 160 | 74.8 % | ||||||||||||
| Total interest and other income, net |
$ | 2,417 | $ | 2,436 | $ | (19) | (0.8)% | |||||||||
The decrease in interest and other income, net was primarily due to a reduction of interest income earned on third party receivables in 2010. The decrease was partially offset by a net increase in other income as there was no extinguishment of lease financing arrangement in 2010. Other income, net mainly includes gain on sale of cost method investment and extinguishment of lease financing.
Income Tax Expense
| Year Ended December 31, | Variance | |||||||||||||||
| (Dollars in thousands) |
2010 | 2009 | Amount | % | ||||||||||||
| Income tax expense |
$ | 5,716 | $ | 2,446 | $ | 3,270 | 133.7% | |||||||||
51
Table of Contents
Changes in income tax expense are generally attributable to state income taxes and income earned from certain of our foreign subsidiaries. For the years ended December 31, 2010 and 2009, our income tax expense was partially offset by $0.4 million and $2.8 million, respectively, of income tax benefit generated by our Indian subsidiary as a result of its engagement in telecommunications infrastructure development. Indian tax law provides for a deduction of 100% of profits and gains derived from qualifying infrastructure businesses for ten consecutive assessment years. This benefit is available to us through the tax assessment year of 2015/2016.
Year Ended December 31, 2009 Compared to Year Ended December 31, 2008
Revenues
| Year Ended December 31, | Variance | |||||||||||||||
| (Dollars in thousands) |
2009 | 2008 | Amount | % | ||||||||||||
| Services revenues |
$ | 712,592 | $ | 611,247 | $ | 101,345 | 16.6 % | |||||||||
| Hardware revenues |
297,107 | 449,106 | (151,999 | ) | (33.8)% | |||||||||||
| Total revenues |
$ | 1,009,699 | $ | 1,060,353 | $ | (50,654 | ) | (4.8)% | ||||||||
| % of revenue to total revenues: |
||||||||||||||||
| Services revenues |
70.6% | 57.6% | ||||||||||||||
| Hardware revenues |
29.4% | 42.4% | ||||||||||||||
Services Revenues
Services revenue for the year ended December 31, 2009 increased primarily due to higher revenue of $59.1 million from our Consumer group to $382.0 million in 2009 compared to $322.9 million in 2008.
The increase was primarily due to the growth of our consumer subscriber base and, in part, to the election by customers to utilize the consumer rental program introduced in September 2008, for which we recognized services revenue of $16.0 million and $0.7 million in 2009 and 2008, respectively. Also contributing to the increase in services revenues was revenue growth of $30.3 million from our North American Enterprise group to $183.7 million in 2009 compared to $153.4 million in 2008, mainly as a result of growth and a shift toward our managed services business, new contracts awarded in 2008 that provided incremental service revenue in 2009 and the growth in our small/medium and wholesale subscriber base.
Also contributing to higher services revenue was an increase of $19.6 million from our International Broadband segment to $122.1 million in 2009 from $102.5 million in 2008, primarily due to the continued growth in the number of enterprise sites in service internationally, mainly in India and Brazil.
Partially offsetting the increase was a decrease in revenue from our Telecom Systems segment of $10.2 million to $21.8 million in 2009 compared to $32.0 million in 2008, mainly impacted by significant reduction in revenues from the Telematics group.
Hardware Revenues
The decrease in hardware revenues in 2009 was mainly due to the decline in revenues from our North America Broadband segment, which decreased by $66.8 million to $124.6 million in 2009 compared to $191.4 million in 2008. Hardware revenues from our North American Enterprise group decreased by $51.2 million to $87.0 million in 2009 compared to $138.2 million in 2008 as a result of the emphasis on managed services which has led to a change in product mix and a shift towards lower upfront hardware revenue and an increase in recurring service revenues. Despite the growth in our consumer subscriber base, hardware revenues in the Consumer group decreased by $15.6 million to $37.6 million in 2009 compared to $53.2 million in 2008 as a result of changes in consumer plans in response to competitive pressures and the election by customers to utilize
52
Table of Contents
the consumer rental program. Additionally, hardware revenues from our International Broadband segment decreased by $52.9 million to $81.8 million in 2009 compared to $134.7 million in 2008. The decrease resulted from the completion of the rollout of terminal shipments on a multi-year contract for a large lottery operator in the United Kingdom.
Further contributing to the decrease in hardware revenues was a decrease in revenues of $32.3 million from our Telecom Systems segment to $90.7 million in 2009 compared to $123.0 million in 2008. The decrease was mainly due to several development contracts in the Mobile Satellite group reaching their completion stage.
Cost of Revenues
| Year Ended December 31, | Variance | |||||||||||||||
| (Dollars in thousands) |
2009 | 2008 | Amount | % | ||||||||||||
| Cost of services |
$ | 448,804 | $ | 406,697 | $ | 42,107 | 10.4 | % | ||||||||
| Cost of hardware |
289,516 | 378,264 | (88,748 | ) | (23.5 | )% | ||||||||||
| Total cost of revenues |
$ | 738,320 | $ | 784,961 | $ | (46,641 | ) | (5.9 | )% | |||||||
| Gross margin: |
||||||||||||||||
| Services revenues |
37.0% | 33.5% | ||||||||||||||
| Hardware revenues |
2.6% | 15.8% | ||||||||||||||
Cost of Services
Cost of services increased partly due to higher fixed expenses of $15.9 million from our North American Enterprise group related to the commencement of SPACEWAY services, which began in April 2008 and primarily consisted of SPACEWAY related depreciation, as well as related network operations center and support, operation of Traffic Off-load Gateways, and in-orbit insurance. These costs are generally fixed in nature and are expected to be absorbed in the coming quarters as additional consumer customers are added to the SPACEWAY network. In addition, other support costs including customer service, wire line and wireless costs, field services, network operation and depreciation expense increased by $37.6 million. The increase in cost of services was partially offset by lower transponder capacity lease expense of $16.2 million, mainly resulting from reduction in transponder capacity lease expense for the Consumer group as new consumer customers were added to the SPACEWAY network. We expect transponder capacity lease expense for the Consumer group to continue to decrease as more customers are placed on the SPACEWAY network.
Cost of services in our International Broadband segment increased by $12.0 million, primarily due to an increase in the number of enterprise sites in service across Europe and Brazil. The increase in cost of services was partially offset by a decrease of $6.3 million in cost of services from the Telematics group from lower revenues.
Cost of Hardware
Corresponding with the decrease in hardware revenues, cost of hardware within the respective groups decreased for the year ended December 31, 2009 compared to the same period in 2008. Cost of hardware from our North America Broadband segment, International Broadband segment, and Telecom Systems segment decreased by $35.8 million, $29.5 million, and $23.4 million, respectively, for the year ended December 31, 2009 compared to $198.0 million, $86.3 million, and $94.0 million, respectively, for the same period in 2008.
53
Table of Contents
Selling, General and Administrative Expense
| Year Ended December 31, | Variance | |||||||||||||||
| (Dollars in thousands) |
2009 | 2008 | Amount | % | ||||||||||||
| Selling, general and administrative expense |
$ | 180,675 | $ | 177,848 | $ | 2,827 | 1.6 | % | ||||||||
| % of revenue |
17.9% | 16.8% | ||||||||||||||
The increase in SG&A expense was mainly a result of our expanded efforts in promoting our consumer business which caused marketing costs to increase by $14.3 million. The increase was partially offset by lower compensation expense of $12.1 million related to the one time retention program established in April 2005 (the “Retention Program”) and other incentive plans. For further discussion of the Retention Program, see Note 17—Other Benefits to our audited consolidated financial statements included in Item 8. Financial Statements and Supplementary Data of this report.
Loss on Impairments
In June 2009, we recognized $45.4 million of impairment loss. Of the $45.4 million, $44.4 million related the impairment of the Deposit and $1.0 million of impairment cost related to a cost method investment with a book value of $1.0 million, which was subsequently sold for a nominal amount. In December 2009, we recognized $5.2 million of impairment loss on our investment in HTI. There was no impairment loss recognized in 2008.
Research and Development
| Year Ended December 31, | Variance | |||||||||||||||
| (Dollars in thousands) |
2009 | 2008 | Amount | % | ||||||||||||
| Research and development |
$ | 22,296 | $ | 26,833 | $ | (4,537 | ) | (16.9)% | ||||||||
| % of revenue |
2.2% | 2.5% | ||||||||||||||
R&D decreased due to a reduction in development activities in our North America Broadband segment. This reduction was partially offset by a $3.2 million increase in development activities related to the construction of our Jupiter satellite.
Amortization of Intangible Assets
| Year Ended December 31, | Variance | |||||||||||||||
| (Dollars in thousands) |
2009 | 2008 | Amount | % | ||||||||||||
| Amortization of intangible assets |
$ | 5,457 | $ | 6,419 | $ | (962 | ) | (15.0)% | ||||||||
| % of revenue |
0.5% | 0.6% | ||||||||||||||
Amortization of intangible assets decreased due to the impact of adjustments to our intangible assets in 2008 to reflect the reversal of valuation allowances against deferred tax assets associated with our United Kingdom and German subsidiaries pursuant to the application of ASC 805-740, “Business Combinations—Income Taxes.”
Operating Income
| Year Ended December 31, | Variance | |||||||||||||||
| (Dollars in thousands) |
2009 | 2008 | Amount | % | ||||||||||||
| Operating income |
$ | 12,312 | $ | 64,292 | $ | (51,980 | ) | (80.8)% | ||||||||
| % of revenue |
1.2% | 6.1% | ||||||||||||||
54
Table of Contents
Our operating income decreased significantly due to the recognition of $44.4 million impairment loss associated with the Deposit, $1.0 million impairment loss on a cost method investment in the second quarter of 2009 and $5.2 million of impairment loss on our investment in HTI in the fourth quarter of 2009.
Interest Expense
| Year Ended December 31, | Variance | |||||||||||||||
| (Dollars in thousands) |
2009 | 2008 | Amount | % | ||||||||||||
| Interest expense |
$ | 64,119 | $ | 51,327 | $ | 12,792 | 24.9% | |||||||||
Interest expense primarily relates to interest on the 2006 Senior Notes, the 2009 Senior Notes and the Term Loan Facility less capitalized interest associated with the construction of our satellites. We recognized $9.9 million of interest expense, which included the accretion of the original issue discount, on the 2009 Senior Notes offered in May 2009. In addition, interest expense increased by $3.0 million due to the discontinuation of capitalization of interest associated with the construction of SPACEWAY 3 after the satellite was placed into service in April 2008, which was partially offset by the capitalization of interest of $1.7 million related to the construction of the Jupiter satellite.
Interest and Other Income, Net
| Year Ended December 31, | Variance | |||||||||||||||
| (Dollars in thousands) |
2009 | 2008 | Amount | % | ||||||||||||
| Interest income |
$ | 2,222 | $ | 4,377 | $ | (2,155 | ) | (49.2 | )% | |||||||
| Other income, net |
214 | 178 | 36 | 20.2 | % | |||||||||||
| Total interest and other income, net |
$ | 2,436 | $ | 4,555 | $ | (2,119 | ) | (46.5 | )% | |||||||
The decrease in total interest and other income, net was primarily due to lower rates of return on our investments for the year ended December 31, 2009 compared to the same period in 2008 as we invested our cash in secure but lower yielding investments.
Income Tax Expense
| Year Ended December 31, | Variance | |||||||||||||||
| (Dollars in thousands) |
2009 | 2008 | Amount | % | ||||||||||||
| Income tax expense |
$ | 2,446 | $ | 7,593 | $ | (5,147 | ) | (67.8 | )% | |||||||
Changes in income tax expense are generally attributable to state income taxes and income earned from our foreign subsidiaries. For the year ended December 31, 2009, our income tax expense was partially offset by $2.8 million of income tax benefit generated by our Indian subsidiary as a result of it being engaged in telecommunications infrastructure development. Indian tax law provides for a deduction of 100% of profits and gains derived from qualifying infrastructure businesses for ten consecutive assessment years. This benefit is available to us through the tax assessment year of 2015/2016.
55
Table of Contents
Liquidity and Capital Resources
Year Ended December 31, 2010 Compared to Year Ended December 31, 2009
| Year Ended December 31, | Variance | |||||||||||||||
| (Dollars in thousands) |
2010 | 2009 | Amount | % | ||||||||||||
| Net cash provided by (used in): |
||||||||||||||||
| Operating activities |
$ | 148,721 | $ | 151,382 | $ | (2,661 | ) | (1.8)% | ||||||||
| Investing activities |
$ | (290,032 | ) | $ | (220,036 | ) | $ | (69,996 | ) | (31.8)% | ||||||
| Financing activities |
$ | 17,758 | $ | 129,790 | $ | (112,032 | ) | (86.3)% | ||||||||
Net Cash Flows from Operating Activities
Net cash provided by operating activities was approximately $148.7 million in 2010. This was due to approximately $164.8 million of cash generated by earnings after adjustments of non-cash expenses offset by a net increase in working capital of approximately $16.1 million. Net cash provided by operations was approximately $151.4 million in 2009. This was due to approximately $111.5 million of cash generated by earnings after adjustment for non-cash expenses plus a net decrease in working capital of $39.9 million.
Net Cash Flows from Investing Activities
The increase in net cash used in investing activities was mainly due to an increase in capital expenditures on a cash basis of $132.4 million, primarily related to the construction of our Jupiter satellite. The increase was partially offset by a net decrease in marketable securities of $49.7 million.
Capital expenditures on a cash basis for the years ended December 31, 2010 and 2009 are shown as follows (in thousands):
| Year Ended December 31, | ||||||||||||
| 2010 | 2009 | Variance | ||||||||||
| Capital expenditures: |
||||||||||||
| Jupiter program |
$ | 172,975 | $ | 44,024 | $ | 128,951 | ||||||
| Capital expenditures—VSAT |
98,261 | 96,138 | 2,123 | |||||||||
| Capitalized software |
13,073 | 12,772 | 301 | |||||||||
| Capital expenditures—other |
9,114 | 7,821 | 1,293 | |||||||||
| SPACEWAY program |
2,469 | 2,781 | (312 | ) | ||||||||
| Total capital expenditures(1) |
$ | 295,892 | $ | 163,536 | $ | 132,356 | ||||||
| (1) | Capital expenditures on an accrual basis were $295.9 million and $190.5 million for the years ended December 31, 2010 and 2009, respectively. |
Net Cash Flows from Financing Activities
For the year ended December 31, 2010, the net cash provided by our financing activities of $17.8 million was mainly driven by the financing activity in connection with the launch related costs of our Jupiter satellite. The increase in cash provided by our financing activities was partially offset by the repayment of our long-term debt and debt issuance costs associated with our financing facility. For the year ended December 31, 2009, our net cash provided by financing activities was mainly related to the issuance of the 2009 Senior Notes.
56
Table of Contents
Year Ended December 31, 2009 Compared to Year Ended December 31, 2008
| Year Ended December 31, | Variance | |||||||||||||||
| (Dollars in thousands) |
2009 | 2008 | Amount | % | ||||||||||||
| Net cash provided by (used in): |
||||||||||||||||
| Operating activities |
$ | 151,382 | $ | 71,703 | $ | 79,679 | 111.1% | |||||||||
| Investing activities |
$ | (220,036 | ) | $ | (88,552 | ) | $ | (131,484 | ) | (148.5)% | ||||||
| Financing activities |
$ | 129,790 | $ | 83,201 | $ | 46,589 | 56.0% | |||||||||
Net Cash Flows from Operating Activities
Net cash provided by operating activities was approximately $151.4 million in 2009. This was due to approximately $111.5 million of cash generated by earnings after adjustments of non-cash expenses plus a net decrease in working capital of approximately $39.9 million. Net cash provided by operations was approximately $71.7 million in 2008. This was due to approximately $85.9 million of cash generated by earnings after adjustment for non-cash expenses offset by a net increase in working capital of $14.2 million.
Net Cash Flows from Investing Activities
The increase in net cash used in investing activities was mainly due to: (i) an increase in capital expenditures on a cash basis of $67.3 million, as set forth in the table below; (ii) a net increase in marketable securities of $64.2 million; and (iii) a long-term loan receivable of $10.0 million advanced to a customer. Partially offsetting the increase was the cash used in the Helius acquisition of $10.5 million that occurred in February 2008.
Capital expenditures on a cash basis for the years ended December 31, 2009 and 2008 are shown as follows (in thousands):
| Year Ended December 31, | ||||||||||||
| 2009 | 2008 | Variance | ||||||||||
| Capital expenditures: |
||||||||||||
| Capital expenditures—VSAT |
$ | 96,138 | $ | 41,314 | $ | 54,824 | ||||||
| Jupiter program |
44,024 | - | 44,024 | |||||||||
| Capitalized software |
12,772 | 14,564 | (1,792 | ) | ||||||||
| Capital expenditures—other |
7,821 | 13,144 | (5,323 | ) | ||||||||
| SPACEWAY program |
2,781 | 27,211 | (24,430 | ) | ||||||||
| Total capital expenditures(1) |
$ | 163,536 | $ | 96,233 | $ | 67,303 | ||||||
| (1) | Capital expenditures on an accrual basis were $190.5 million and $96.2 million for the years ended December 31, 2009 and 2008, respectively. |
Net Cash Flows from Financing Activities
The increase in net cash provided by financing activities was primarily due to the net proceeds of $133.6 million received from HNS’ offering of the 2009 Senior Notes completed on May 27, 2009. Partially offsetting the increase was the net cash proceeds of $93.0 million related to our equity offering that occurred in 2008.
57
Table of Contents
Future Liquidity Requirements
As of December 31, 2010, our Cash and cash equivalents and Marketable securities were $182.7 million and our total debt was $746.9 million. We are significantly leveraged as a result of our indebtedness. The Merger Agreement contemplates the repayment of all of HNS’ outstanding debt, including the 9 1/2% Senior Notes due 2014, except that the $115 million loan facility guaranteed by COFACE, the French Export Credit Agency, will continue to remain outstanding following the Merger if the requisite lender consents thereunder are obtained.
Revolving Credit Facility and Term Loan
On March 16, 2010, HNS entered into a credit agreement with JP Morgan Chase Bank, N.A. and Barclays Capital to amend and restate its senior secured $50 million revolving credit facility (the “Revolving Credit Facility”). Pursuant to the terms of the agreement, among other changes, the maturity date of the Revolving Credit Facility was extended to March 16, 2014, subject to an early maturity date of 91 days prior to March 16, 2014 in the event HNS’ 2009 and 2006 Senior Notes and HNS’ Term Loan Facility (as defined below) are not (i) repaid in full or (ii) refinanced with new debt (or amended) with maturities of no earlier than 91 days after March 16, 2014. The terms of the Revolving Credit Facility were amended to be: (i) in respect of the interest rate, at our option, the Alternative Borrowing Rate (as defined in the Revolving Credit Facility) plus 2.00% or the Adjusted London Interbank Offered Rate (“LIBOR”) (as defined in the Revolving Credit Facility) plus 3.00% and (ii) in respect of the participation fee for outstanding letters of credit, 3.00% per annum, in each case subject to downward adjustment based on our leverage ratio. As of December 31, 2010, the total outstanding letters of credit and the available borrowing capacity under the Revolving Credit Facility was $4.4 million and $45.6 million, respectively. As of December 31, 2010, the Revolving Credit Facility was rated Baa3 and BB- by Moody’s and Standard & Poor’s (“S&P”), respectively.
In February 2007, HNS borrowed $115 million from a syndicate of banks pursuant to a senior unsecured credit agreement (the “Term Loan Facility”), which matures on April 15, 2014. The Term Loan Facility is guaranteed, on a senior unsecured basis, by all of HNS’ existing and future subsidiaries that guarantee its existing 2006 Senior Notes and the Revolving Credit Facility. The interest on the Term Loan Facility is paid quarterly at Adjusted LIBOR (as defined in the Term Loan Facility) plus 2.50%. To mitigate the variable interest rate risk associated with the Term Loan Facility, HNS entered into an agreement to swap the Adjusted LIBOR for a fixed rate of 5.12% per annum (the “Swap Agreement”). As a result, the Term Loan Facility has a fixed interest rate of 7.62% per annum and is subject to certain mandatory and optional prepayment provisions and contains negative covenants and events of default, in each case, substantially similar to those provisions contained in the indentures governing the Senior Notes. The remaining net interest payments on the Term Loan Facility are estimated to be approximately $8.8 million for each of the years ending December 31, 2011 through 2013 and $3.3 million for the year ending December 31, 2014. As of December 31, 2010, the Term Loan was rated B1 and B by Moody’s and S&P, respectively.
Our subsidiaries primarily meet their working capital requirements through their respective operations or the utilization of local credit facilities. Occasionally, the subsidiaries utilize temporary advances to/from HNS to meet temporary cash requirements. Certain of our foreign subsidiaries maintain various revolving lines of credit and term loans funded by their respective local banks in local currency. As of December 31, 2010, the aggregate balance outstanding under these loans was $2.8 million. Our subsidiaries may be restricted from paying dividends to HNS under the terms of these loans.
HNS and its subsidiaries are separate and distinct legal entities and, except for HNS’ existing and future subsidiaries that are or will be guarantors of the Senior Notes, the Term Loan Facility, COFACE Guaranteed Facility and the Revolving Credit Facility, they will have no obligation, contingent or otherwise, to pay amounts due under the Senior Notes, Term Loan Facility, COFACE Guaranteed Facility and the Revolving Credit Facility, or to make any funds available to pay those amounts, whether by dividend, distribution, loan or other payment.
58
Table of Contents
Senior Notes
In May 2009, HNS, along with its subsidiary, HNS Finance Corp., as co-issuer, completed a private debt offering of $150.0 million of 9.50% senior notes maturing on April 15, 2014 (the “2009 Senior Notes”). The 2009 Senior Notes are guaranteed on a senior unsecured basis by each of HNS’ current and future domestic subsidiaries that guarantee any of HNS’ indebtedness or indebtedness of HNS’ other subsidiary guarantors. Interest on the 2009 Senior Notes is accrued from April 15, 2009 and is paid semi-annually in arrears on April 15 and October 15 of each year, beginning on October 15, 2009. HNS received net proceeds of approximately $133.6 million from the offering. HNS has used and intends to continue to use these net proceeds for general corporate purposes, which could include working capital needs, corporate development opportunities (which may include acquisitions), capital expenditures and opportunistic satellite fleet expansion. As of December 31, 2010, the 2009 Senior Notes were rated B1 and B by Moody’s and S&P, respectively. As of December 31, 2010, HNS had recorded $3.0 million of accrued interest payable related to the 2009 Senior Notes.
In April 2006, HNS issued $450 million of 9.50% senior notes maturing on April 15, 2014 (the “2006 Senior Notes”), which are guaranteed on a senior unsecured basis by HNS and each of its current and future domestic subsidiaries that guarantee any of HNS’ indebtedness or indebtedness of HNS’ other subsidiary guarantors. Interest on the 2006 Senior Notes is paid semi-annually in arrears on April 15 and October 15. As of December 31, 2010, we had recorded $8.9 million of accrued interest payable related to the 2006 Senior Notes. As of December 31, 2010, the 2006 Senior Notes were rated B1 and B by Moody’s and S&P, respectively.
COFACE Guaranteed Facility
On October 29, 2010, HNS entered into a $115 million loan agreement with BNP Paribas and Societe Generale (“COFACE Guaranteed Facility”), which is guaranteed by COFACE, the French Export Credit Agency, to finance the launch related costs for Jupiter. Pursuant to the COFACE Guaranteed Facility agreement, loan draw-downs, which began in the fourth quarter of 2010, will occur over the construction period for the launch vehicle up to the time of the launch, which is estimated to be in the first half of 2012. The COFACE Guaranteed Facility has a fixed interest rate of 5.13%, payable semi-annually in arrears starting six months after each borrowing, and requires that principal repayments are to be paid in 17 consecutive equal semi-annual installments starting the earlier of (i) six months after the in-orbit delivery, or (ii) December 1, 2012. The agreement also contains covenants and conditions which are customary for financings of this type. As of December 31, 2010, HNS had $27.4 million of borrowings under the loan and an available borrowing capacity of $87.6 million.
Although the terms and covenants with respect to the 2009 Senior Notes are substantially identical to the 2006 Senior Notes, the 2009 Senior Notes were issued under a separate indenture and do not vote together with the 2006 Senior Notes. Each of the indentures governing the 2006 Senior Notes and 2009 Senior Notes (collectively, the “Senior Notes”), the agreement governing the amended Revolving Credit Facility, the agreement governing the COFACE Guaranteed Facility and the agreement governing the Term Loan Facility require HNS to comply with certain affirmative and negative covenants: (i) in the case of the indentures, for so long as any Senior Notes are outstanding; (ii) in the case of the amended Revolving Credit Facility, for so long as the amended Revolving Credit Facility is in effect; (iii) in the case of the COFACE Guaranteed Facility, for so long as the COFACE Guaranteed Facility remains outstanding; and (iv) in the case of the Term Loan Facility, for so long as the Term Loan Facility remains outstanding. Negative covenants contained in these agreements include limitations on the ability of HNS and/or certain of its subsidiaries to incur additional indebtedness; issue redeemable stock and subsidiary preferred stock; incur liens; pay dividends or distributions or redeem or repurchase capital stock; prepay, redeem or repurchase debt; make loans and investments; enter into agreements that restrict distributions from HNS’ subsidiaries; sell assets and capital stock of our subsidiaries; enter into certain transactions with affiliates; consolidate or merge with or into, or sell substantially all of our assets to, another person; and enter into new lines of business. In addition to these negative covenants, the amended Revolving Credit Facility, the indentures governing the Senior Notes, the COFACE Guaranteed Facility and/or the agreement governing the Term Loan Facility contain affirmative covenants that require us to: (i) preserve our
59
Table of Contents
businesses and properties; (ii) maintain insurance over our assets; (iii) pay and discharge all material taxes when due; and (iv) furnish the lenders’ administrative agent our financial statements for each fiscal quarter and fiscal year, certificates from a financial officer certifying that no Event of Default or Default has occurred during the fiscal period being reported, litigation and other notices, compliance with laws, maintenance of records and other such customary covenants. HNS and its subsidiaries comprise a substantial portion of our net assets and results of operations since January 1, 2006. Because of the negative covenants above, there are certain restrictions on the sale of HNS’ net assets. As of December 31, 2010 and 2009, HNS’ consolidated net assets were $221.9 million and $200.0 million, respectively. Management believes that the Company was in compliance with all of its debt covenants as of December 31, 2010.
Other
In June 2009, HNS entered into an agreement with Space Systems/Loral, Inc. (“SS/L”) for the construction of Jupiter and agreed to make installment payments to SS/L upon the completion of each milestone as set forth in the agreement. In connection with the construction of Jupiter, HNS entered into a contract with Barrett, whereby Barrett agreed to lease user beams and purchase gateways and Ka-band terminals for the Jupiter satellite that are designed to operate in Canada. In April 2010, HNS entered into an agreement with Arianespace for the launch of Jupiter in the first half of 2012. Pursuant to the agreement, the Ariane 5 will launch Jupiter into geosynchronous transfer orbit from Guiana Space Centre in Kourou, French Guiana. As of December 31, 2010, our remaining obligation for the construction and launch of Jupiter was approximately $210.8 million.
Based on our current and anticipated levels of operations and conditions in our markets and industry, we expect to meet our short-term cash requirements through the use of cash on hand and cash from operations that we expect to generate. We expect to meet our long-term cash requirements through a combination of (i) cash on hand and cash from operations that we expect to generate and (ii) a possible refinancing of HNS’ senior notes and/or term loan that mature in 2014. If the Merger is not consummated, we believe that our current resources are sufficient to meet our short-term cash requirements. However, our ability to fund these needs and to comply with the financial covenants under our debt agreements depends on our future operating performance and cash flow, which is subject to prevailing economic conditions, the level of spending by our customers and other factors, many of which are beyond our control. We do not currently anticipate making borrowings under the $50 million Revolving Credit Facility for the next twelve months. Any future acquisitions, joint ventures, acquisition of a satellite, or other similar transactions will likely require additional capital and there can be no assurance that any such capital will be available to us on acceptable terms, if at all.
Contractual Obligations
The following table summarizes our contractual obligations at December 31, 2010 and the effect such obligations are expected to have on our liquidity and cash flow in future periods (in thousands):
| Due in | ||||||||||||||||||||||||||||
| 2011 | 2012 | 2013 | 2014 | 2015 | Thereafter | Total | ||||||||||||||||||||||
| Senior Notes(1) |
$ | - | $ | - | $ | - | $ | 600,000 | $ | - | $ | - | $ | 600,000 | ||||||||||||||
| Term loans |
1,399 | 131 | 131 | 115,131 | 89 | - | 116,881 | |||||||||||||||||||||
| VSAT hardware financing obligations(2) |
3,109 | 2,266 | 631 | 260 | 57 | - | 6,323 | |||||||||||||||||||||
| COFACE Guaranteed Facility |
- | 1,612 | 3,224 | 3,224 | 3,224 | 16,119 | 27,403 | |||||||||||||||||||||
| Orbital slot commitment(3) |
705 | 747 | 792 | 840 | 890 | 943 | 4,917 | |||||||||||||||||||||
| Revolving loans |
967 | - | - | - | - | - | 967 | |||||||||||||||||||||
| Estimated interest payments(4) |
68,179 | 67,681 | 67,374 | 33,174 | 1,074 | 2,337 | 239,819 | |||||||||||||||||||||
| Jupiter commitments |
165,632 | 15,280 | 4,249 | 2,864 | 3,880 | 18,851 | 210,756 | |||||||||||||||||||||
| Transponder lease obligations |
119,466 | 67,483 | 49,846 | 35,685 | 28,337 | 11,947 | 312,764 | |||||||||||||||||||||
| Leases and other commitments |
14,008 | 11,652 | 8,028 | 6,387 | 3,190 | 4,753 | 48,018 | |||||||||||||||||||||
| Total |
$ | 373,465 | $ | 166,852 | $ | 134,275 | $ | 797,565 | $ | 40,741 | $ | 54,950 | $ | 1,567,848 | ||||||||||||||
60
Table of Contents
| (1) | Represents the face value of 2006 Senior Notes and 2009 Senior Notes. |
| (2) | Represents our VSAT hardware financing obligations that were funded by third-party financial institutions. |
| (3) | Represents a commitment to a related party for certain rights in connection with a satellite orbital slot for SPACEWAY 3. |
| (4) | Primarily includes interest calculated on the Senior Notes, Term loans, VSAT hardware financing obligations, COFACE Guaranteed Facility, and Orbital slot commitment. |
Commitments and Contingencies
For a discussion of commitments and contingencies, see Note 22—Commitments and Contingencies to our audited consolidated financial statements included in Item 8. Financial Statements and Supplementary Data of this report.
Off-Balance Sheet Arrangements
We are required to issue standby letters of credit and bonds primarily to support certain sales of our equipment to international government customers. These letters of credit are either bid bonds to support contract bids or to support advance payments made by customers upon contract execution and prior to equipment being shipped, or guarantees of performance issued in support of its warranty obligations. Bid bonds typically expire upon the issue of the award by the customer. Advance payment bonds expire upon receipt by the customer of equipment, and performance bonds typically expire when the warranty expires, generally one year after the installation of the equipment.
As of December 31, 2010, we had $16.2 million of contractual obligations to customers and other statutory/governmental agencies, which were secured by letters of credit issued through us and our subsidiaries’ credit facilities. Of this amount, $4.4 million was issued under the Revolving Credit Facility; $0.7 million was secured by restricted cash; $1.1 million related to insurance bonds; and $10.0 million was issued under credit arrangements available to our Indian and Brazilian subsidiaries. Certain letters of credit issued by our foreign subsidiaries are secured by certain assets.
Seasonality
Like many communications infrastructure equipment vendors, a higher amount of our hardware revenues occur in the second half of the year due to our customers’ annual procurement and budget cycles. Large enterprises and operators often allocate their capital expenditure budgets at the beginning of their fiscal year (which often coincides with the calendar year). The typical sales cycle for large complex system procurements is 6 to 12 months, which often results in the customer expenditure occurring towards the end of the year. Customers often seek to expend the budgeted funds prior to the end of the year and the next budget cycle. As a result, interim results are not indicative of the results to be expected for the full year.
Inflation
Historically, inflation has not had a material effect on our results of operations.
Certain Relationships and Related Transactions
For a discussion of related-party transactions, see Note 20—Transactions with Related Parties to our audited consolidated financial statements included in Item 8. Financial Statements and Supplementary Data of this report.
Critical Accounting Policies and Estimates
Our discussion and analysis of our financial condition and results of operations are based upon our consolidated financial statements, which have been prepared in accordance with generally accepted accounting principles in the United States. The preparation of these financial statements requires us to make estimates and assumptions that affect the reported amounts of assets and liabilities and the disclosure of contingencies at the date of the financial statements as well as the reported amounts of revenues and expenses during the reporting period. We evaluate these estimates and assumptions on an ongoing basis. The results of these estimates form the
61
Table of Contents
basis for making judgments about the carrying values of assets and liabilities that are not readily apparent from other sources. Actual results could differ from these estimates under different assumptions and conditions.
Revenue Recognition
Service revenues and hardware revenues are generally recognized when services are rendered or products are installed and as title passes to those customers, net of sales taxes. Billings for revenues that have not been earned are deferred and recognized in the period when earned. In situations where customer offerings represent a bundled arrangement for both services and hardware, revenue elements are separated into their relevant components (services or hardware) for revenue recognition purposes. We offer a rebate to qualifying new consumer subscribers and record a reduction in revenue in the same period the related sale occurs based on an estimate of the number of rebates that will be redeemed. This estimate is based on historical experience and actual sales during the promotion.
Our consumer rental program allows consumer customers to rent the equipment with a 24-month service contract. Once the initial contract ends, it becomes a month-to-month contract. Revenue on the rental equipment is recognized on a monthly basis as service revenue until the customer terminates the contract with us.
In August 2010, we were awarded $58.7 million from the U.S Government as the only national provider of high-speed satellite broadband service under the broadband stimulus programs, established pursuant to the American Recovery and Reinvestment Act of 2009. Under the consumer broadband stimulus program, eligible consumer customers have month-to-month service contracts and do not have to pay for the rental of the equipment.
All upfront fees collected in connection with the service arrangements are deferred and recognized as service revenue over the term of the customer arrangement.
In addition to providing standard product and service offerings, we also enter into contracts to design, develop and deliver telecommunication networks to customers. These contracts for telecommunication networks require significant effort to develop and construct the network over an extended time period. Revenues are also earned from long-term contracts for the sale of mobile satellite communications systems. Sales under these long-term contracts are recognized using the percentage-of-completion (cost-to-cost) method of accounting. Under this method, sales are recorded equivalent to costs incurred plus a portion of the profit expected to be realized, determined based on the ratio of costs incurred to estimated total costs at completion. Profits expected to be realized on long-term contracts are based on estimates of total sales value and costs at completion. These estimates are reviewed and revised periodically throughout the lives of the contracts, and adjustments to profits resulting from such revisions are recorded in the accounting period in which the revisions are made. Estimated losses on contracts are recorded in the period in which they are identified.
Business Combinations and Intangible Assets
We have participated in several significant transactions that have impacted our financial statements. We account for business combinations in accordance with ASC 805, “Business Combinations.” The acquisition of businesses is an element of our business strategy. Under the purchase method, we are required to record the net assets acquired at the estimated fair value at the date of acquisition. The determination of the fair value of the assets acquired and liabilities assumed requires the Company to make estimates and assumptions that affect the Company’s financial statements. Intangible assets acquired in connection with business combinations which have finite lives are amortized over their estimated useful lives. The estimated useful lives are based on estimates of the period during which the assets are expected to generate revenue. Intangible assets with finite lives are tested for impairment whenever events or changes in circumstances indicate that the carrying amount of the assets may no longer be recoverable.
62
Table of Contents
Income Taxes
We must make certain estimates and judgments in determining provisions for income taxes. These estimates and judgments occur in the calculation of tax credits, tax benefits and deductions, and in the calculation of certain tax assets and liabilities, which arise from differences in the timing of recognition of revenue and expense for tax and financial statement purposes.
We assess the recoverability of deferred tax assets at each reporting date and where applicable, record a valuation allowance to reduce the total deferred tax assets to amounts that will, more-likely-than-not, be realized in the future. Our assessment includes an analysis of whether deferred tax assets will be realized in the ordinary course of operations based on the available positive and negative evidence, including the scheduling of deferred tax liabilities and forecasted taxable income from operating activities. The underlying assumptions we use in forecasting future taxable income require significant judgment. In the event that actual taxable income from operating activities differs from forecasted amounts, or if we change our estimates of forecasted taxable income from operating activities, we could record additional charges in order to adjust the carrying value of deferred tax assets to their realizable amounts. Such charges could be material to our consolidated results of operations and financial position.
We also review our positions taken or that will be taken on the income tax returns for unrecognized tax benefits, assess whether such unrecognized tax benefits meet the more-likely-than-not threshold, and determine the need to record a liability in accordance with ASC 740, “Income Taxes,” along with any penalty and interest.
In addition, the calculation of our tax liabilities involves dealing with uncertainties in the application of complex tax regulations, domestically and internationally. We recognize liabilities for anticipated tax audit issues in the United States and other tax jurisdictions based on our determination of whether, and the extent to which, additional tax assessments are probable and estimable. If we ultimately determine that payment of these amounts is less than we originally expected, we reverse the liability and recognize a tax benefit during the period in which we determine that the liability is no longer necessary.
Subscriber Acquisition Costs (“SAC”)
Our Consumer group, included in the North America Broadband segment, offers Internet and data networking services to consumers and small-medium businesses in North America. The products and services are sold to customers using a variety of competitive service packages, through an extensive independent nationwide network of distributors, dealers, sales agents and retail companies. SAC is an important component of our cost to acquire new consumer subscribers. SAC consists of dealer and customer service representative commissions on new installations and, in certain cases, the cost of hardware and installation provided to customers at the inception of service or cost of services for activities related to the consumer rental program. SAC is deferred when a customer commits to a service agreement, and the deferred SAC is amortized over the commitment period as the related service revenue is earned. Prior to 2007, service agreements were 12 to 15 months in duration. In May 2007, we began to offer only 24-month service agreements. Our consumer rental program allows consumer customers to rent the equipment with a 24-month service contract. Once the initial contract ends, it becomes a month-to-month contract. Revenue on the rental equipment is recognized on a monthly basis as service revenue until the customer terminates the contracts with us. We monitor the recoverability of subscriber acquisition costs and are entitled to an early termination fee if the subscriber cancels service prior to the end of the commitment period. The recoverability of deferred subscriber acquisition costs is reasonably assured through the monthly rental fee charged to customers, the ability to recover the equipment, and/or the ability to charge an early termination fee.
New Accounting Pronouncements
For a discussion of new accounting pronouncements, see Note 2—Basis of Presentation and Summary of Significant Accounting Policies to our audited consolidated financial statements included in Item 8. Financial Statements and Supplementary Data of this report.
63
Table of Contents
| Item 7A. | Quantitative and Qualitative Disclosures about Market Risk |
The following discussion and the estimated amounts generated from the sensitivity analyses referred to below include forward-looking statements of market risk which assume for analytical purposes that certain adverse market conditions may occur. Actual future market conditions may differ materially from such assumptions because the amounts shown below are the result of analyses used for the purpose of assessing possible risks and the mitigation thereof. Accordingly, you should not consider the forward-looking statements as projections by us of future events or losses.
General
Our cash flows and earnings are subject to fluctuations resulting from changes in foreign currency exchange rates, interest rates and changes in the market value of our equity investments. We manage our exposure to those market risks through internally established policies and procedures and, when deemed appropriate, through the use of derivative financial instruments. We enter into derivative instruments only to the extent considered necessary to meet our risk management objectives and do not enter into derivative contracts for speculative purposes.
Foreign Currency Risk
We generally conduct our business in United States dollars. Our international business is conducted in a variety of currencies, including U.S. dollars, and it is therefore exposed to fluctuations in foreign currency exchange rates. Our objective in managing our exposure to foreign currency changes is to reduce earnings and cash flow volatility associated with foreign exchange rate fluctuations. Accordingly, we may enter into foreign exchange contracts to mitigate risks associated with foreign currency denominated assets, liabilities, commitments and anticipated foreign currency transactions. As of December 31, 2010, we had an estimated $13.1 million of foreign currency denominated receivables and payables outstanding, and $5.9 million of hedge contracts in place to partially mitigate foreign currency risk. The differences between the face amount of the foreign exchange contracts and their estimated fair values were not material as of December 31, 2010.
The impact of a hypothetical 10% adverse change in exchange rates on the fair value of foreign currency denominated net assets and liabilities of our foreign subsidiaries would be an estimated loss of $6.1 million as of December 31, 2010.
Marketable Securities Risk
We have a significant amount of cash that is invested in marketable securities which is subject to market risk due to interest rate fluctuations. We have established an investment policy which governs our investment strategy and stipulates that we diversify investments among United States Treasury securities and other high credit quality debt instruments that we believe to be low risk. We are averse to principal loss and seek to preserve our invested funds by limiting default risk and market risk.
Interest Rate Risk
HNS’ Senior Notes, the COFACE Guaranteed Facility and outstanding borrowings related to VSAT hardware financing arrangements are not subject to interest rate fluctuations because the interest rate is fixed for the term of the instrument. We are subject to variable interest rates on certain other debt including the Revolving Credit Facility and the Term Loan Facility. To the extent we draw against the Revolving Credit Facility, increases in interest rates would have an adverse impact on our results of operations.
To mitigate the variable interest rate risk associated with the Term Loan Facility, we entered into the Swap Agreement to swap the Adjusted LIBOR based interest on the Term Loan Facility for a fixed interest rate of 5.12% per annum. The remaining net interest payments based on the Swap Agreement and the Term Loan
64
Table of Contents
Facility are paid quarterly and estimated to be approximately $8.8 million for each of the years ending December 31, 2011 through 2013 and $3.3 million for the year ending December 31, 2014. The security for our interest obligation under the Swap Agreement is the same as the security for the Revolving Credit Facility described in Note 12—Debt to our audited consolidated financial statements included in Item 8 in this report.
Market Concentration and Credit Risk
We provide services and extend credit to a number of equipment customers, service providers, and a large number of consumers, both in the United States and around the world. We monitor our exposure to credit losses and maintain, as necessary, allowances for anticipated losses. Financial instruments which potentially subject us to a concentration of credit risk consist of cash, cash equivalents and marketable investments. Although we maintain cash balances at financial institutions that exceed federally insured limits, these balances are placed with high credit quality financial institutions.
Commodity Price Risk
All of our products contain components whose base raw materials have undergone dramatic cost fluctuations in the last 24 months. Fluctuations in pricing of raw materials have the ability to affect our product costs. Although we have been successful in offsetting or mitigating our exposure to these fluctuations, such changes could have an adverse impact on our product costs. We are unable to predict the possible impact of changes in commodity prices.
65
Table of Contents
| Item 8. | Financial Statements and Supplementary Data |
REPORT OF INDEPENDENT REGISTERED PUBLIC ACCOUNTING FIRM
To the Board of Directors and Stockholders of
Hughes Communications, Inc.
Germantown, Maryland
We have audited the accompanying consolidated balance sheets of Hughes Communications, Inc. and subsidiaries (the “Company”) as of December 31, 2010 and 2009, and the related consolidated statements of operations, changes in equity, and cash flows for each of the three years in the period ended December 31, 2010. Our audits also included Schedule II listed in the Index at Item 15. We also have audited the Company’s internal control over financial reporting as of December 31, 2010, based on criteria established in Internal Control—Integrated Framework issued by the Committee of Sponsoring Organizations of the Treadway Commission. The Company’s management is responsible for these financial statements and financial statement schedule, for maintaining effective internal control over financial reporting, and for its assessment of the effectiveness of internal control over financial reporting, included in the accompanying Management Report on Internal Control Over Financial Reporting. Our responsibility is to express an opinion on these financial statements and financial statement schedule and an opinion on the Company’s internal control over financial reporting based on our audits.
We conducted our audits in accordance with the standards of the Public Company Accounting Oversight Board (United States). Those standards require that we plan and perform the audit to obtain reasonable assurance about whether the financial statements are free of material misstatement and whether effective internal control over financial reporting was maintained in all material respects. Our audits of the financial statements included examining, on a test basis, evidence supporting the amounts and disclosures in the financial statements, assessing the accounting principles used and significant estimates made by management, and evaluating the overall financial statement presentation. Our audit of internal control over financial reporting included obtaining an understanding of internal control over financial reporting, assessing the risk that a material weakness exists, testing and evaluating the design and operating effectiveness of internal control based on the assessed risk. Our audits also included performing such other procedures as we considered necessary in the circumstances. We believe that our audits provide a reasonable basis for our opinions.
A company’s internal control over financial reporting is a process designed by, or under the supervision of, the company’s principal executive and principal financial officers, or persons performing similar functions, and effected by the company’s board of directors, management, and other personnel to provide reasonable assurance regarding the reliability of financial reporting and the preparation of financial statements for external purposes in accordance with generally accepted accounting principles. A company’s internal control over financial reporting includes those policies and procedures that (1) pertain to the maintenance of records that, in reasonable detail, accurately and fairly reflect the transactions and dispositions of the assets of the company; (2) provide reasonable assurance that transactions are recorded as necessary to permit preparation of financial statements in accordance with generally accepted accounting principles and that receipts and expenditures of the company are being made only in accordance with authorizations of management and directors of the company; and (3) provide reasonable assurance regarding prevention or timely detection of unauthorized acquisition, use, or disposition of the company’s assets that could have a material effect on the financial statements.
Because of the inherent limitations of internal control over financial reporting, including the possibility of collusion or improper management override of controls, material misstatements due to error or fraud may not be prevented or detected on a timely basis. Also, projections of any evaluation of the effectiveness of the internal control over financial reporting to future periods are subject to the risk that the controls may become inadequate because of changes in conditions, or that the degree of compliance with the policies or procedures may deteriorate.
66
Table of Contents
In our opinion, the consolidated financial statements referred to above present fairly, in all material respects, the financial position of Hughes Communications, Inc. and subsidiaries as of December 31, 2010 and 2009, and the results of their operations and their cash flows for each of the three years in the period ended December 31, 2010, in conformity with accounting principles generally accepted in the United States of America. Also, in our opinion, such financial statement schedule, when considered in relation to the basic consolidated financial statements taken as a whole, presents fairly, in all material respects, the information set forth therein. Also, in our opinion, the Company maintained, in all material respects, effective internal control over financial reporting as of December 31, 2010, based on the criteria established in Internal Control—Integrated Framework issued by the Committee of Sponsoring Organizations of the Treadway Commission.
/s/ Deloitte & Touche LLP
Baltimore, Maryland
March 7, 2011
67
Table of Contents
HUGHES COMMUNICATIONS, INC.
CONSOLIDATED BALANCE SHEETS
(Dollars in thousands, except per share amounts)
| December 31, | ||||||||
| 2010 | 2009 | |||||||
| ASSETS |
||||||||
| Current assets: |
||||||||
| Cash and cash equivalents |
$ | 138,131 | $ | 261,038 | ||||
| Marketable securities |
44,532 | 47,188 | ||||||
| Receivables, net |
186,692 | 163,816 | ||||||
| Inventories |
57,819 | 60,244 | ||||||
| Prepaid expenses and other |
26,127 | 22,476 | ||||||
| Total current assets |
453,301 | 554,762 | ||||||
| Property, net |
774,052 | 602,403 | ||||||
| Capitalized software costs, net |
46,092 | 49,776 | ||||||
| Intangible assets, net |
11,440 | 14,524 | ||||||
| Goodwill |
5,093 | 5,093 | ||||||
| Other assets |
73,197 | 75,836 | ||||||
| Total assets |
$ | 1,363,175 | $ | 1,302,394 | ||||
| LIABILITIES AND EQUITY |
||||||||
| Current liabilities: |
||||||||
| Accounts payable |
$ | 120,202 | $ | 119,461 | ||||
| Short-term debt |
6,285 | 6,750 | ||||||
| Accrued liabilities and other |
128,790 | 131,774 | ||||||
| Total current liabilities |
255,277 | 257,985 | ||||||
| Long-term debt |
740,576 | 714,957 | ||||||
| Other long-term liabilities |
27,308 | 16,356 | ||||||
| Total liabilities |
1,023,161 | 989,298 | ||||||
| Commitments and contingencies |
||||||||
| Equity: |
||||||||
| Hughes Communications, Inc. (“HCI”) stockholders’ equity: |
||||||||
| Preferred stock, $0.001 par value; 1,000,000 shares authorized and no shares issued and outstanding as of December 31, 2010 and 2009 |
- | - | ||||||
| Common stock, $0.001 par value; 64,000,000 shares authorized; 21,834,787 shares and 21,633,539 shares issued and outstanding as of December 31, 2010 and 2009, respectively |
22 | 22 | ||||||
| Additional paid in capital |
735,233 | 730,809 | ||||||
| Accumulated deficit |
(387,756 | ) | (410,543 | ) | ||||
| Accumulated other comprehensive loss |
(18,449 | ) | (16,247 | ) | ||||
| Total HCI stockholders’ equity |
329,050 | 304,041 | ||||||
| Noncontrolling interests |
10,964 | 9,055 | ||||||
| Total equity |
340,014 | 313,096 | ||||||
| Total liabilities and equity |
$ | 1,363,175 | $ | 1,302,394 | ||||
See accompanying Notes to the Consolidated Financial Statements.
68
Table of Contents
HUGHES COMMUNICATIONS, INC.
CONSOLIDATED STATEMENTS OF OPERATIONS
(Dollars in thousands, except per share amounts)
| Year Ended December 31, | ||||||||||||
| 2010 | 2009 | 2008 | ||||||||||
| Revenues: |
||||||||||||
| Services revenues |
$ | 791,324 | $ | 712,592 | $ | 611,247 | ||||||
| Hardware revenues |
252,003 | 297,107 | 449,106 | |||||||||
| Total revenues |
1,043,327 | 1,009,699 | 1,060,353 | |||||||||
| Operating costs and expenses: |
||||||||||||
| Cost of services |
493,023 | 448,804 | 406,697 | |||||||||
| Cost of hardware |
234,805 | 289,516 | 378,264 | |||||||||
| Selling, general and administrative |
206,512 | 180,675 | 177,848 | |||||||||
| Loss on impairments |
- | 50,639 | - | |||||||||
| Research and development |
20,279 | 22,296 | 26,833 | |||||||||
| Amortization of intangible assets |
3,084 | 5,457 | 6,419 | |||||||||
| Total operating costs and expenses |
957,703 | 997,387 | 996,061 | |||||||||
| Operating income |
85,624 | 12,312 | 64,292 | |||||||||
| Other income (expense): |
||||||||||||
| Interest expense |
(59,345 | ) | (64,119 | ) | (51,327 | ) | ||||||
| Interest income |
2,043 | 2,222 | 4,377 | |||||||||
| Other income, net |
374 | 214 | 178 | |||||||||
| Income (loss) before income tax expense and equity in earnings (losses) of unconsolidated affiliates |
28,696 | (49,371 | ) | 17,520 | ||||||||
| Income tax expense |
(5,716 | ) | (2,446 | ) | (7,593 | ) | ||||||
| Equity in earnings (losses) of unconsolidated affiliates |
- | 170 | (599 | ) | ||||||||
| Net income (loss) |
22,980 | (51,647 | ) | 9,328 | ||||||||
| Net income attributable to the noncontrolling interests |
(193 | ) | (1,046 | ) | (310 | ) | ||||||
| Net income (loss) attributable to HCI stockholders |
$ | 22,787 | $ | (52,693 | ) | $ | 9,018 | |||||
| Income (loss) per share: |
||||||||||||
| Basic |
$ | 1.05 | $ | (2.46 | ) | $ | 0.44 | |||||
| Diluted |
$ | 1.00 | $ | (2.46 | ) | $ | 0.44 | |||||
| Shares used in computation of per share data: |
||||||||||||
| Basic |
21,606,162 | 21,393,151 | 20,317,155 | |||||||||
| Diluted |
22,738,207 | 21,393,151 | 20,633,833 | |||||||||
See accompanying Notes to the Consolidated Financial Statements.
69
Table of Contents
HUGHES COMMUNICATIONS, INC.
CONSOLIDATED STATEMENTS OF CHANGES IN EQUITY
(Dollars in thousands, except per share amounts)
| HCI Shareholders’ Equity | ||||||||||||||||||||||||||||
| Common Stock ($.001 par value) |
Additional Paid-In Capital |
Accumulated Deficit |
Accumulated Other Comprehensive Loss |
Noncontrolling Interest |
Total | Comprehensive Income (Loss) |
||||||||||||||||||||||
| Balance at January 1, 2008 |
$ | 19 | $ | 631,300 | $ | (366,868 | ) | $ | (2,016 | ) | $ | 5,327 | $ | 267,762 | ||||||||||||||
| Issuance of common stock in connection with equity offering |
2 | 93,044 | 93,046 | |||||||||||||||||||||||||
| Issuance of common stock through exercise of stock options |
- | 75 | 75 | |||||||||||||||||||||||||
| Issuance of restricted stock |
1 | - | 1 | |||||||||||||||||||||||||
| Retirement of restricted stock and bonus units |
(6,032 | ) | (6,032 | ) | ||||||||||||||||||||||||
| Share-based compensation |
5,724 | 5,724 | ||||||||||||||||||||||||||
| Other |
447 | 447 | ||||||||||||||||||||||||||
| Comprehensive income (loss): |
||||||||||||||||||||||||||||
| Net income |
9,018 | 310 | 9,328 | $ | 9,328 | |||||||||||||||||||||||
| Foreign currency translation adjustments |
(13,594 | ) | (923 | ) | (14,517 | ) | (14,517 | ) | ||||||||||||||||||||
| Unrealized loss on hedging instruments |
(13,931 | ) | - | (13,931 | ) | (13,931 | ) | |||||||||||||||||||||
| Reclassification of realized loss on hedging instruments |
2,010 | - | 2,010 | 2,010 | ||||||||||||||||||||||||
| Unrealized loss on available-for-sale securities |
(55 | ) | - | (55 | ) | (55 | ) | |||||||||||||||||||||
| Balance at December 31, 2008 |
$ | 22 | $ | 724,558 | $ | (357,850 | ) | $ | (27,586 | ) | $ | 4,714 | $ | 343,858 | $ | (17,165 | ) | |||||||||||
| Consolidation of Hughes Systique Corporation |
3,372 | 3,372 | ||||||||||||||||||||||||||
| Retirement of restricted stock |
(724 | ) | (724 | ) | ||||||||||||||||||||||||
| Share-based compensation |
7,371 | 7,371 | ||||||||||||||||||||||||||
| Purchase of subsidiary shares from noncontrolling interests |
(396 | ) | (19 | ) | (430 | ) | (845 | ) | ||||||||||||||||||||
| Comprehensive income (loss): |
||||||||||||||||||||||||||||
| Net income (loss) |
(52,693 | ) | 1,046 | (51,647 | ) | $ | (51,647 | ) | ||||||||||||||||||||
| Foreign currency translation adjustments |
6,910 | 353 | 7,263 | 7,263 | ||||||||||||||||||||||||
| Unrealized gain on hedging instruments |
2,180 | - | 2,180 | 2,180 | ||||||||||||||||||||||||
| Reclassification of realized loss on hedging instruments |
4,701 | - | 4,701 | 4,701 | ||||||||||||||||||||||||
| Unrealized loss on available-for-sale securities |
(2,433 | ) | - | (2,433 | ) | (2,433 | ) | |||||||||||||||||||||
| Balance at December 31, 2009 |
$ | 22 | $ | 730,809 | $ | (410,543 | ) | $ | (16,247 | ) | $ | 9,055 | $ | 313,096 | $ | (39,936 | ) | |||||||||||
| Share-based compensation |
7,514 | 7,514 | ||||||||||||||||||||||||||
| Retirement of restricted stock and bonus units |
(3,224 | ) | (3,224 | ) | ||||||||||||||||||||||||
| Issuance of common stock through exercise of stock options |
134 | 134 | ||||||||||||||||||||||||||
| Investment in a joint venture |
1,462 | 1,462 | ||||||||||||||||||||||||||
| Comprehensive income (loss): |
||||||||||||||||||||||||||||
| Net income |
22,787 | 193 | 22,980 | $ | 22,980 | |||||||||||||||||||||||
| Foreign currency translation adjustments |
642 | 254 | 896 | 896 | ||||||||||||||||||||||||
| Unrealized loss on hedging instruments |
(7,938 | ) | - | (7,938 | ) | (7,938 | ) | |||||||||||||||||||||
| Reclassification of realized loss on hedging instruments |
5,559 | - | 5,559 | 5,559 | ||||||||||||||||||||||||
| Unrealized loss on available-for-sale securities |
(465 | ) | - | (465 | ) | (465 | ) | |||||||||||||||||||||
| Balance at December 31, 2010 |
$ | 22 | $ | 735,233 | $ | (387,756 | ) | $ | (18,449 | ) | $ | 10,964 | $ | 340,014 | $ | 21,032 | ||||||||||||
See accompanying Notes to the Consolidated Financial Statements
70
Table of Contents
HUGHES COMMUNICATIONS, INC.
CONSOLIDATED STATEMENTS OF CASH FLOWS
(In thousands)
| Year Ended December 31, | ||||||||||||
| 2010 | 2009 | 2008 | ||||||||||
| Cash flows from operating activities: |
||||||||||||
| Net income (loss) |
$ | 22,980 | $ | (51,647 | ) | $ | 9,328 | |||||
| Adjustments to reconcile net income (loss) to net cash flows from operating activities: |
||||||||||||
| Depreciation and amortization |
131,586 | 102,731 | 68,937 | |||||||||
| Amortization of debt issuance costs |
2,818 | 2,025 | 1,424 | |||||||||
| Share-based compensation expense |
7,514 | 7,371 | 5,724 | |||||||||
| Equity in (earnings) losses from unconsolidated affiliates |
- | (170 | ) | 599 | ||||||||
| Loss on impairments |
- | 50,639 | - | |||||||||
| Other |
(56 | ) | 535 | (97 | ) | |||||||
| Change in other operating assets and liabilities, net of acquisition: |
||||||||||||
| Receivables, net |
(22,371 | ) | 41,584 | (2,540 | ) | |||||||
| Inventories |
1,697 | 6,438 | (2,710 | ) | ||||||||
| Prepaid expenses and other |
1,721 | 5,369 | (9,319 | ) | ||||||||
| Accounts payable |
20,098 | 13,954 | 6,314 | |||||||||
| Accrued liabilities and other |
(17,266 | ) | (27,447 | ) | (5,957 | ) | ||||||
| Net cash provided by operating activities |
148,721 | 151,382 | 71,703 | |||||||||
| Cash flows from investing activities: |
||||||||||||
| Change in restricted cash |
1,211 | 223 | 3,104 | |||||||||
| Purchases of marketable securities |
(105,692 | ) | (62,118 | ) | (2,070 | ) | ||||||
| Proceeds from sales of marketable securities |
108,289 | 15,000 | 19,190 | |||||||||
| Expenditures for property |
(282,819 | ) | (150,764 | ) | (81,669 | ) | ||||||
| Expenditures for capitalized software |
(13,073 | ) | (12,772 | ) | (14,564 | ) | ||||||
| Proceeds from sale of property |
205 | 397 | - | |||||||||
| Acquisition of Helius, Inc., net of cash received |
- | - | (10,543 | ) | ||||||||
| Cash acquired, consolidation of Hughes Systique Corporation |
- | 828 | - | |||||||||
| Long-term loan receivable |
- | (10,000 | ) | - | ||||||||
| Investment in Hughes Systique Corporation |
- | - | (1,500 | ) | ||||||||
| Hughes Systique Corporation note receivables |
- | - | (500 | ) | ||||||||
| Other, net |
1,847 | (830 | ) | - | ||||||||
| Net cash used in investing activities |
(290,032 | ) | (220,036 | ) | (88,552 | ) | ||||||
| Cash flows from financing activities: |
||||||||||||
| Short-term revolver borrowings |
4,761 | 6,791 | - | |||||||||
| Repayments of revolver borrowings |
(5,347 | ) | (7,861 | ) | - | |||||||
| Net increase in notes and loans payable |
- | - | 223 | |||||||||
| Proceeds from equity offering |
- | - | 93,046 | |||||||||
| Proceeds from exercise of stock options |
134 | - | 75 | |||||||||
| Long-term debt borrowings |
31,602 | 147,849 | 3,606 | |||||||||
| Repayment of long-term debt |
(6,252 | ) | (12,377 | ) | (13,749 | ) | ||||||
| Debt issuance costs |
(7,140 | ) | (4,612 | ) | - | |||||||
| Net cash provided by financing activities |
17,758 | 129,790 | 83,201 | |||||||||
| Effect of exchange rate changes on cash and cash equivalents |
646 | (3,914 | ) | 3,372 | ||||||||
| Net increase (decrease) in cash and cash equivalents |
(122,907 | ) | 57,222 | 69,724 | ||||||||
| Cash and cash equivalents at beginning of the period |
261,038 | 203,816 | 134,092 | |||||||||
| Cash and cash equivalents at end of the period |
$ | 138,131 | $ | 261,038 | $ | 203,816 | ||||||
| Supplemental cash flow information: |
||||||||||||
| Cash paid for interest, net of amounts capitalized |
$ | 53,205 | $ | 60,410 | $ | 54,138 | ||||||
| Cash paid for income taxes |
$ | 7,521 | $ | 5,659 | $ | 3,622 | ||||||
| Supplemental non-cash disclosures related to: |
||||||||||||
| Capitalized software and property acquired, not paid |
$ | 26,954 | $ | 26,946 | ||||||||
| Investment in Hughes Telematics, Inc. |
$ | 13,000 | ||||||||||
| Consolidation of Hughes Systique Corporation |
$ | 5,328 | ||||||||||
| 95 West capital lease |
$ | 5,751 | ||||||||||
See accompanying Notes to the Consolidated Financial Statements.
71
Table of Contents
HUGHES COMMUNICATIONS, INC.
NOTES TO THE CONSOLIDATED FINANCIAL STATEMENTS
Note 1: Organization and Description of Business
Hughes Communications, Inc. (“HCI” and, together with its consolidated subsidiaries, the “Company” or “we”) was formed as a Delaware corporation on June 23, 2005 and we are a publicly traded company. Our stock trades on the NASDAQ Global Select Market under the symbol “HUGH.”
We operate our business primarily through our wholly-owned subsidiary, Hughes Network Systems, LLC (“HNS”). We are a telecommunications company that provides equipment and services to the broadband communications marketplace. We have extensive technical expertise in satellite, wireline and wireless communications which we utilize in a number of product and service offerings. In particular, we offer a spectrum of broadband equipment and services to the managed services market, which is comprised of enterprises with a requirement to connect a large number of geographically dispersed locations with reliable, scalable, and cost-effective applications, such as credit card verification, inventory tracking and control, and broadcast video. We provide broadband network services and systems to the international and domestic enterprise markets and satellite broadband Internet access to North American consumers, which we refer to as the Consumer market. In addition, we provide networking systems solutions to customers for mobile satellite, wireless backhaul systems and telematics. These services are generally provided on a contract or project basis and may involve the use of proprietary products engineered by us.
We have five reportable segments, which we operate and manage as strategic business units and organize by products and services. We measure and evaluate our reportable segments based on the operating earnings of the respective segments. Our business segments include: (i) the North America Broadband segment; (ii) the International Broadband segment; (iii) the Telecom Systems segment; (iv) the HTS Satellite segment; and (v) the Corporate and Other segment. The North America Broadband segment consists of the Consumer group, which delivers broadband Internet service to consumer customers, and the Enterprise group, which provides satellite, wireline and wireless communication network products and services to enterprises. The International Broadband segment consists of our international service companies and provides managed network services and equipment to enterprise customers and broadband service providers worldwide. The Telecom Systems segment consists of the Mobile Satellite Systems group, the Terrestrial Microwave group, and the Telematics group. The Mobile Satellite Systems group provides turnkey satellite ground segment systems to mobile system operators. The Terrestrial Microwave group provides point-to-multipoint microwave radio network systems that are used for both cellular backhaul and broadband wireless access. The Telematics group provides development, engineering and manufacturing services to Hughes Telematics, Inc. (“HTI”). However, as a result of the unfavorable impact of the economy on the automobile industry in 2009, HTI terminated substantially all of the development, engineering and manufacturing services with us in August 2009. We expect our future revenue from the Telematics group to be insignificant. The HTS Satellite segment, which is a new segment starting in 2010, consists of activities related to the development, construction and launch of high throughput satellites (“HTS”) and currently represents construction activities of our new satellite named Jupiter and the development of related network equipment. As a result of the newly established HTS Satellite segment in 2010, construction activities of Jupiter in 2009, which was included in the North America Broadband segment, have been reclassified to the HTS Satellite segment to conform to the current period presentation. The Corporate and Other segment includes certain minority interest investments held by us and our corporate offices and assets not specifically related to another business segment.
Note 2: Basis of Presentation and Summary of Significant Accounting Policies
Basis of Presentation
The accompanying consolidated financial statements have been prepared in accordance with: (i) generally accepted accounting principles in the United States of America (“GAAP”); (ii) the instructions to Form 10-K;
72
Table of Contents
HUGHES COMMUNICATIONS, INC.
NOTES TO THE CONSOLIDATED FINANCIAL STATEMENTS (CONTINUED)
and (iii) the guidance of Rule 10-01 of Regulation S-X under the Securities and Exchange Act of 1934, as amended, for financial statements required to be filed with the Securities and Exchange Commission (“SEC”). They include the assets, liabilities, results of operations and cash flows of the Company, including its domestic and foreign subsidiaries that are more than 50% owned or for which the Company is deemed to be the primary beneficiary as defined by the Financial Accounting Standards Board (“FASB”) Accounting Standards Codification (the “ASC” or the “Codification”) 810, “Consolidation.” Entities in which the Company holds at least 20% ownership or in which there are other indicators of significant influence are generally accounted for by the equity method, whereby the Company records its proportionate share of the entities’ results of operations. Entities in which the Company holds less than 20% ownership and does not have the ability to exercise significant influence are generally carried at cost. As a result of our new segment in 2010, the HTS Satellite segment, certain prior period items in these consolidated financial statements have been reclassified to conform to the current period presentation.
Effective January 1, 2009, we adopted the update to ASC 810 relating to noncontrolling interests, which did not have a material impact on our financial condition, results of operations or cash flows. However, the update impacted the presentation and disclosure of noncontrolling interests on our consolidated financial statements. As a result, certain prior period items in these consolidated financial statements have been reclassified to conform to the current period presentation.
All intercompany balances and transactions with subsidiaries and other consolidated entities have been eliminated.
Use of Estimates in the Preparation of the Consolidated Financial Statements
The preparation of our consolidated financial statements in accordance with GAAP requires management to make estimates and assumptions that affect reported amounts of assets and liabilities, disclosure of contingent assets and liabilities, and the reported amounts of revenues and expenses. Management bases its estimates and assumptions on historical experience and on various other factors that are believed to be reasonable under the circumstances. Due to the inherent uncertainty involved in making estimates, actual results reported in future periods may be affected by changes in those estimates.
Market Concentrations and Credit Risk
We provide services and extend credit to a number of communications equipment customers, service providers, and a large number of consumers, both in the United States and around the world. We monitor our exposure to credit losses and maintain, as necessary, allowances for anticipated losses. No single customer accounted for more than 10% of total annual revenues in any of the periods presented in this report. Financial instruments which potentially subject us to a concentration of credit risk consist of cash, cash equivalents and marketable investments. Although we maintain cash balances at financial institutions that exceed federally insured limits, these balances are placed with high credit quality financial institutions.
Revenue Recognition
Service revenues and hardware revenues are generally recognized when services are rendered or products are installed and as title passes to those customers, net of sales taxes. Billings for revenues that have not been earned are deferred and recognized in the period when earned. In situations where customer offerings represent a bundled arrangement for both services and hardware, revenue elements are separated into their relevant components (services or hardware) for revenue recognition purposes. We offer a rebate to qualifying new
73
Table of Contents
HUGHES COMMUNICATIONS, INC.
NOTES TO THE CONSOLIDATED FINANCIAL STATEMENTS (CONTINUED)
consumer subscribers and record a reduction in revenue in the same period in which the related sale occurs based on an estimate of the number of rebates that will be redeemed. This estimate is based on historical experience and actual sales during the promotion.
Our consumer rental program allows consumer customers to rent the equipment with a 24-month service contract. Once the initial contract ends, it becomes a month-to-month contract. Revenue on the rental equipment is recognized on a monthly basis as service revenue until the customer terminates the contracts with us.
In August 2010, we were awarded $58.7 million from the U.S. Government as the only national provider of high-speed satellite broadband service under the broadband stimulus programs, established pursuant to the American Recovery and Reinvestment Act of 2009. Under the consumer broadband stimulus program, eligible consumer customers have month-to-month service contracts and do not have to pay for the rental of the equipment.
All upfront fees collected in connection with the service arrangements are deferred and recognized as service revenue over the term of the customer arrangement.
In addition to providing standard product and service offerings, we also enter into contracts to design, develop and deliver telecommunication networks to customers. These contracts for telecommunication networks require significant effort to develop and construct the network, over an extended time period. Revenues are also earned from long-term contracts for the sale of mobile satellite communications systems. Sales under these long-term contracts are recognized using the percentage-of-completion (cost-to-cost) method of accounting. Under this method, sales are recorded equivalent to costs incurred plus a portion of the profit expected to be realized, based on the ratio of costs incurred to estimated total costs at completion. Profits expected to be realized on long-term contracts are based on estimates of total sale values and costs at completion. These estimates are reviewed and revised periodically throughout the lives of the contracts, and adjustments to profits resulting from such revisions are recorded in the accounting period in which the revisions are made. Estimated losses on contracts are recorded in the period in which they are identified.
Income Taxes
Deferred tax assets and liabilities are recognized for the future tax consequences attributable to differences between the financial statement carrying amounts of existing assets and liabilities and their respective tax bases and for operating loss and tax credit carryforwards. Deferred tax assets and liabilities are measured using enacted tax rates expected to be applied to taxable income in the years in which those temporary differences are expected to be recovered or settled. The effect on deferred tax assets and liabilities of a change in tax rates is recognized in income in the period that includes the enactment date. Under the terms of the April 22, 2005 agreement entered into between LightSquared, Inc. (“LightSquared,” formerly SkyTerra Communications, Inc.) and DTV Network Systems, Inc. (“DTV Networks”) whereby LightSquared acquired 50% of HNS voting, or Class A membership interests, DIRECTV retains the tax benefits from the net operating losses generated by DTV Networks and has responsibility for all of the pre-closing domestic and international income tax liabilities of DTV Networks. We have recorded a liability in the balance sheet for the estimated amount we may be required to pay to DIRECTV resulting from prepaid taxes exceeding tax liabilities as of April 22, 2005.
We record net deferred tax assets to the extent we believe these assets will more-likely-than-not be realized. In making such determination, we consider all available positive and negative evidence, including scheduled reversals of deferred tax liabilities, projected future taxable income, tax planning strategies and recent financial operations. In the event we were to determine that we would be able to realize our deferred income tax assets in the future in excess of their net recorded amount, we would make an adjustment to the valuation allowance which may reduce the provision for income taxes.
74
Table of Contents
HUGHES COMMUNICATIONS, INC.
NOTES TO THE CONSOLIDATED FINANCIAL STATEMENTS (CONTINUED)
Income tax positions must meet a more-likely-than-not recognition threshold at the effective date to be recognized upon the adoption of ASC 740 and in subsequent periods. ASC 740 provides that a tax benefit from an uncertain tax position may be recognized when it is more-likely-than-not that the position will be sustained upon examination, including resolutions of any related appeals or litigation processes, based on the technical merits. It also provides guidance on measurement, derecognition, classification, interest and penalties, accounting in interim periods, disclosure and transition.The Company recognizes interest accrued related to unrecognized tax benefits in operating expenses and penalties in income tax expense in the consolidated statements of operations.
As a result of the revision in ASC 805, “Business Combinations,” effective January 1, 2009, adjustments recorded to the valuation allowance related to deferred tax assets recognized in connection with earlier business combinations will impact tax expense in lieu of recording an adjustment to intangible assets.
Cash and Cash Equivalents
We consider all highly liquid investments with original maturities of ninety days or less at the date of investment to be cash equivalents.
Restricted Cash
Cash subject to restrictions expiring within one year is included in Prepaid expenses and other in the accompanying Consolidated Balance Sheets. Cash subject to restrictions expiring beyond one year is included in Other assets in the accompanying Consolidated Balance Sheets. As of December 31, 2010 and 2009, we had $0.7 million and $1.9 million of restricted cash, respectively, which secures certain of our letters of credit. As of December 31, 2010, restrictions on the cash relating to letters of credit will be released as the letters of credit expire through December 2013.
Marketable Securities
We classify all debt securities with original maturities exceeding ninety days as available-for-sale investments in accordance with ASC 320, “Investment—Debt and Equity Securities.” Securities classified as available-for-sale securities are carried at fair value with the related unrealized gains and losses reported as a component of accumulated other comprehensive loss (“AOCL”). Fair value is based on quoted market prices as of the reporting date. The book value of these securities is adjusted for amortization or accretion of premium and discounts over the contractual lives of the securities, which is included in Interest income in the accompanying Consolidated Statements of Operations.
Available-for-sale investments in debt securities that have an unrealized loss are evaluated for impairment in accordance with ASC 320. Our management uses judgments to evaluate each security held at a loss based on market conditions and other factors to determine if the decline in the market value of the security indicates an other-than-temporary impairment. When our management believes that the security is impaired, we recognize the impairment charge by writing down the amortized cost basis of the security to its estimated fair market value.
The Company had no investments classified as trading or held-to-maturity at December 31, 2010 and 2009.
Property and Depreciation
Property and equipment are carried at cost and depreciated or amortized on a straight-line basis over their estimated useful lives, generally three to thirty years. Land is carried at cost, and land improvements are depreciated over ten years. Buildings are depreciated over thirty years. Leasehold improvements are amortized over the lesser of their estimated useful lives or lease term.
75
Table of Contents
HUGHES COMMUNICATIONS, INC.
NOTES TO THE CONSOLIDATED FINANCIAL STATEMENTS (CONTINUED)
A significant component of our property and equipment is the capitalized costs associated with the satellite and related assets, which include costs associated with the construction of the satellite, launch services, insurance premiums for the satellite launch and the in-orbit testing period, capitalized interest incurred during the construction of the satellite, and other costs directly related to the satellite. Capitalized satellite costs are depreciated on a straight-line basis over the estimated useful life of 15 years. The Company periodically reviews, at least annually, the remaining estimated useful life of the satellite to determine if revisions to the estimated life are necessary.
Our Consumer rental equipment is related to our consumer rental program which allows consumer customers to rent the equipment with a 24-month service contract. Once the initial contract ends, it becomes a month-to-month contract. Consumer rental equipment includes the cost of installation and customer premise equipment, which is depreciated on a straight-line basis over the estimated useful life of 2-4 years.
Capitalized Software Costs
Software development costs are capitalized in accordance with ASC 985-20, “Costs of Computer Software to Be Sold, Leased, or Otherwise Marketed.” Capitalized software development costs are amortized using the straight-line method over their estimated useful lives, not in excess of five years. Software program reviews are conducted at least annually, or as events and circumstances warrant such a review, to ensure that capitalized software development costs are not impaired and that costs associated with programs that are no longer generating revenue are expensed. Amortization of software development costs was $10.1 million, $14.2 million and $11.3 million for the years ended December 31, 2010, 2009 and 2008, respectively.
Intangible Assets
Intangible assets acquired in connection with business combinations which have finite lives are amortized on a straight-line basis over their estimated useful lives. Intangible assets are retired when they are fully amortized. Intangible assets and their estimated useful lives as of December 31, 2010 are as follows:
| Life (Years) | ||
| Customer relationships |
7 - 8 | |
| Patented technology |
8 | |
| Trademarks |
10 | |
| Favorable leases |
3 |
Goodwill
Goodwill is the excess of purchase price over the fair value of identified net assets of businesses acquired. Goodwill is accounted for in accordance with ASC 350, “Intangibles—Goodwill and Other.” Under the provisions of this statement, the Company’s goodwill is tested at the reporting unit level for impairment on an annual basis during the fourth quarter, or earlier if events and circumstances occur indicating that goodwill might be impaired. During 2010, 2009 and 2008, the Company did not recognize any goodwill impairment charges.
Debt Issuance Costs
Debt issuance costs are amortized based upon the lives of the associated debt obligations using the effective interest method with such amortization included in Interest expense in the accompanying Consolidated Statements of Operations. For the years ended December 31, 2010, 2009 and 2008, we amortized $2.8 million,
76
Table of Contents
HUGHES COMMUNICATIONS, INC.
NOTES TO THE CONSOLIDATED FINANCIAL STATEMENTS (CONTINUED)
$2.0 million and $1.4 million, respectively, of debt issuance costs related to our debts. As of December 31, 2010 and 2009, the Company had $17.2 million and $12.9 million, respectively, of unamortized debt issuance costs included in Other assets in the accompanying Consolidated Balance Sheets.
Subscriber Acquisition Costs (“SAC”)
SAC is an important component of our costs to acquire new consumer subscribers. SAC consists of costs paid to third-party dealers and customer service representative commissions on new installations and, in certain cases, the cost of hardware and installation provided to customers at the inception of service or cost of services for activities related to the consumer rental program, which we began to offer to our consumer customers in September 2008. SAC is deferred when a customer commits to a service agreement, and the deferred SAC is amortized over the commitment period as the related service revenue is earned. Prior to 2007, service agreements were 12 to 15 months in duration. In May 2007, the Company began to offer only 24 month service agreements. Customers who receive hardware and installation under these service agreements have a higher monthly service rate than is charged to customers who purchase their equipment outright at the inception of service. The Company monitors the recoverability of subscriber acquisition costs and is entitled to an early termination fee (secured by customer credit card information) if the subscriber cancels service prior to the end of the commitment period. The recoverability of deferred subscriber acquisition costs is reasonably assured through the increased monthly service fee charged to customers, the ability to recover the equipment, and/or the ability to charge an early termination fee. At December 31, 2010 and 2009, the Company had $25.7 million and $29.9 million of deferred SAC, respectively, included in Other assets in the accompanying Consolidated Balance Sheets.
Valuation of Long-Lived Assets
The Company evaluates the carrying value of long-lived assets to be held and used annually or when events and circumstances warrant such a review. The carrying value of a long-lived asset is considered impaired when the carrying value of the asset exceeds the aggregate amount of its separately identifiable undiscounted future cash flows. In that event, a loss is recognized based on the amount by which the carrying value exceeds the fair value of the long-lived asset. Changes in estimates of future cash flows could result in a write-down of long-lived assets in a future period. During 2010 and 2008, the Company did not recognize any impairment charges on long-lived assets. In 2009, the Company recognized $50.6 million of impairment charges on long-lived assets associated mainly with our prepaid deposit (the “Deposit”) paid to Sea Launch Company, LLC (“Sea Launch”). See Note 22—Commitments and Contingencies for further detail.
Foreign Currency
Certain foreign operations have determined the local currency to be their functional currency. Accordingly, these foreign entities translate assets and liabilities from their local currencies to U.S. dollars using period-end exchange rates while income and expense accounts are translated at the average rates in effect during the period. The resulting translation adjustment is recorded in AOCL, a separate component of equity. Translation adjustments for foreign currency denominated equity investments are not material and are recorded as part of AOCL.
The Company also has foreign operations where the U.S. dollar has been determined as the functional currency. Gains and losses resulting from re-measurement of the foreign currency denominated assets, liabilities and transactions into the U.S. dollar are recognized currently in the statements of operations and were not material in each of the periods presented herein.
77
Table of Contents
HUGHES COMMUNICATIONS, INC.
NOTES TO THE CONSOLIDATED FINANCIAL STATEMENTS (CONTINUED)
Investments and Financial Instruments
The Company maintains its investments in equity securities in Other assets in the accompanying Consolidated Balance Sheets. Non-marketable equity securities are carried at cost. Marketable equity securities are considered available-for-sale and carried at fair value based on quoted market prices with unrealized gains or losses (excluding other-than-temporary losses), reported as part of AOCL. The Company continually reviews its investments to determine whether a decline in fair value below the cost basis is “other-than-temporary.” The Company considers, among other factors: the magnitude and duration of the decline; the financial health and business outlook of the investee, including industry and sector performance, changes in technology, and operational and financing cash flow factors; and the Company’s intent and ability to hold the investment. If the decline in fair value is judged to be other-than-temporary, the carrying value of the security is written down to its estimated fair value, and the impairment on the security is recognized in the statements of operations in (i) Other income (loss), net and recorded as a reclassification adjustment from AOCL for marketable equity securities and (ii) Loss on impairments for non-marketable securities.
Investments in which the Company owns at least 20% of the voting securities or has significant influence are accounted for under the equity method of accounting. Equity method investments are recorded at cost and adjusted for the appropriate share of the net earnings or losses of the investee. The carrying value of investments may include a component of goodwill if the cost of our investment exceeds the fair value of the investment, and any such goodwill is subject to an evaluation for impairment pursuant to ASC 323—“Investments—Equity Method and Joint Ventures.” Investee losses are recorded up to the amount of the investment plus advances and loans made to the investee, and financial guarantees made on behalf of the investee. In certain instances, this can result in the Company recognizing investee earnings or losses in excess of its ownership percentage. We had cost method investments of $6.7 million and $7.0 million as of December 31, 2010 and 2009, respectively, and equity method investments of $8.3 million as of each December 31, 2010 and 2009.
The carrying value of cash and cash equivalents; receivables, net; other assets; accounts payable; and amounts included in accrued liabilities and other liabilities meeting the definition of a financial instrument approximated their respective fair value at December 31, 2010 and 2009 because of their short-term maturity.
The Company carries all derivative financial instruments in the balance sheets at fair value based on quoted market prices. The Company uses derivative contracts to minimize the financial impact of changes in the fair value of recognized assets, liabilities, and unrecognized firm commitments, or the variability of cash flows associated with forecasted transactions in accordance with internal risk management policies. Changes in fair value of designated, qualified, and effective fair value hedges are recognized in earnings as offsets to the changes in fair value of the related hedged items. Changes in fair value of designated, qualified, and effective cash flow hedges are deferred and recorded as a component of AOCL until the hedged transactions occur and are recognized in earnings. Changes related to amounts excluded from the effectiveness assessment of a hedging derivative’s change in fair value and the ineffective portion of a hedge is immediately recognized in the statements of operations. Both at the inception of the hedge and on an on-going basis, we assess whether the derivatives are highly effective. Hedge accounting is prospectively discontinued when hedge instruments are no longer highly effective. During 2010 and 2009, the Company did not enter into any material hedge transactions.
The Company enters into interest rate swaps from time to time to manage its interest rate exposure. These derivatives may be designated as cash flow hedges or fair value hedges depending on the nature of the risk being hedged. Derivatives used to hedge risk associated with changes in the cash flows of certain variable rate debt obligations are designated as cash flow hedges. Derivatives used to hedge risk associated with changes in the fair value of certain fixed rate debt obligations are designated as fair value hedges. Consequently, changes in the fair value of the hedged debt obligations that are attributable to the hedged risk are recognized in the current period earnings.
78
Table of Contents
HUGHES COMMUNICATIONS, INC.
NOTES TO THE CONSOLIDATED FINANCIAL STATEMENTS (CONTINUED)
The Company’s cash flows and earnings are subject to fluctuations resulting from changes in foreign currency exchange rates, interest rates, and changes in the market value of its equity investments. We manage our exposure to these market risks through internally established policies and procedures and, when deemed appropriate, through the use of derivative financial instruments. We enter into derivative instruments only to the extent considered necessary to meet our risk management objectives and do not enter into derivative contracts for speculative purposes.
The Company generally conducts its business in U.S. dollars with some business conducted in a variety of foreign currencies and, therefore, is exposed to fluctuations in foreign currency exchange rates. Our objective in managing our exposure to foreign currency changes is to reduce earnings and cash flow volatility associated with foreign exchange rate fluctuations. Accordingly, we enter into foreign exchange contracts to mitigate risks associated with foreign currency denominated assets, liabilities, commitments and anticipated foreign currency transactions. The gains and losses on derivative foreign exchange contracts offset changes in the value of the related exposures. As of December 31, 2010 and 2009, we had purchased foreign exchange contracts totaling $5.9 million and $4.1 million, respectively, to mitigate foreign currency fluctuation risks associated with short-term U.S. dollar denominated obligations. The differences between the face amount of the foreign exchange contracts and their estimated fair values were not material at December 31, 2010 and 2009. All of the forward exchange contracts outstanding at December 31, 2010 expire in 2011.
The Company is exposed to credit risk in the event of non-performance by the counterparties to its derivative financial instrument contracts. While the Company believes this risk is remote, credit risk is managed through the periodic monitoring and approval of financially sound counterparties.
Net Earnings (Loss) Per Common Share
Basic net earnings (loss) per common share is computed by dividing net income (loss) attributable to HCI stockholders by the weighted average number of common shares outstanding. Diluted net earnings (loss) per common share reflects the potential dilution from the exercise or conversion of securities into the Company’s common stock. However, in accordance with ASC 260, “Earnings Per Share,” potential common shares have been excluded from the computation of any diluted per share amount in periods when a loss from continuing operations exists, such as 2009. The potential dilutive effect of outstanding stock options and warrants is calculated using the “treasury stock” method. The Company excluded 547,400 stock options that were granted in 2008 from the computation of diluted net earnings (loss) per common share for 2008, as the effect would have been anti-dilutive.
The following table provides a reconciliation of the shares used in calculating earnings (loss) per common share:
| Year Ended December 31, | ||||||||||||
| 2010 | 2009 | 2008 | ||||||||||
| Basic weighted average common shares outstanding |
21,606,162 | 21,393,151 | 20,317,155 | |||||||||
| Effect of dilutive securities: |
||||||||||||
| Restricted stock units |
11,615 | - | 51,070 | |||||||||
| Restricted stock awards |
120,714 | - | 201,829 | |||||||||
| Options to purchase common stock |
322,211 | - | 63,779 | |||||||||
| HNS Bonus Unit Plan |
31,803 | - | - | |||||||||
| HNS Class B Unit Plan |
645,702 | - | - | |||||||||
| Diluted weighted average common shares outstanding |
22,738,207 | 21,393,151 | 20,633,833 | |||||||||
79
Table of Contents
HUGHES COMMUNICATIONS, INC.
NOTES TO THE CONSOLIDATED FINANCIAL STATEMENTS (CONTINUED)
New Accounting Pronouncements
Recently Adopted Accounting Guidance
In January 2010, the FASB issued Accounting Standard Update (“ASU”) 2010-06 to improve disclosures about fair value measurements. ASU 2010-6 clarifies certain existing disclosures and requires new disclosure regarding significant transfers in and out of Level 1 and Level 2 of fair value measurements and the reasons for the transfer. In addition, ASU 2010-06 clarifies existing fair value disclosures about the level of disaggregation and about inputs and valuation techniques used to measure fair value. The amendments in ASU 2010-06 were effective for fiscal years beginning after December 15, 2009, and for interim periods within those fiscal periods. The adoption of ASU 2010-06 did not have a material impact on our disclosure about fair value measurements.
In June 2009 and December 2009, the FASB amended ASC 810 changing certain consolidation guidance and requiring improved financial reporting by enterprises involved with variable interest entities (“VIE”). The amendments provide guidance in determining when a reporting entity should include the assets, liabilities, noncontrolling interest and results of activities of a VIE in its consolidated financial statements. The amendments to ASC 810 were effective for the first annual reporting period beginning after November 15, 2009, for interim periods within that first annual reporting period, and for interim and annual reporting periods thereafter. The adoption of amendments to consolidation rules did not have any impact on our disclosures relating to our VIE activity and our financial statements.
Accounting Guidance Not Yet Effective
In October 2009, the FASB issued ASU 2009-14 to amend ASC 605 “Revenue Recognition.” The amendments in this update change the accounting model for revenue arrangements that include both tangible products and software elements. The amendments in ASU 2009-14 will be effective for us beginning January 1, 2011. We believe that ASU 2009-13 will not have a material impact on our financial statements.
In October 2009, the FASB issued ASU 2009-13 amending ASC 605 related to revenue arrangements with multiple deliverables. Among other things, ASU 2009-13 provides guidance for entities in determining the accounting for multiple deliverable arrangements and establishes a hierarchy for determining the amount of revenue to allocate to the various deliverables. The amendments in ASU 2009-13 will be effective for us beginning January 1, 2011. We believe that ASU 2009-13 will not have a material impact on our on our financial statements
Note 3: Consolidation of Hughes Systique Corporation
Hughes Systique Corporation (“Hughes Systique”) is a communications consulting and software company. HNS has contracts with Hughes Systique for software development services. The founders of Hughes Systique include Pradman Kaul, our Chief Executive Officer (“CEO”) and President and certain former employees of HNS, including Pradeep Kaul, who is the CEO and President of Hughes Systique, HNS’ former Executive Vice President and the brother of our CEO and President. The Company acquired an equity investment in Hughes Systique Series A Preferred Stock (“HSC Preferred Stock”) of $3.0 million and $1.5 million in October 2005 and January 2008, respectively.
In February 2008, the Company and Nextwave Broadband Inc. (“Nextwave”), a former significant shareholder of Hughes Systique, agreed to make available to Hughes Systique a term loan facility (the “Loan”) of up to $3.0 million. Under the Loan, each loan request was to be at least $1.0 million, and the Loan was to be
80
Table of Contents
HUGHES COMMUNICATIONS, INC.
NOTES TO THE CONSOLIDATED FINANCIAL STATEMENTS (CONTINUED)
funded equally by the Company and Nextwave. The Loan has a fixed interest rate of 6%, and it is convertible into common shares of Hughes Systique upon non-payment or an event of default. Hughes Systique has the option to pay the interest annually or to convert the interest to principal as a “payment in kind.” In February 2008, the Company and Nextwave each funded $0.5 million as part of a $1.0 million loan drawdown by Hughes Systique under the Loan. In March 2009, Hughes Systique requested and the Company funded the remaining $1.0 million of its original $1.5 million loan commitment. As a result, the Company is not obligated to provide any further funding to Hughes Systique under the Loan.
On March 11, 2009, Hughes Systique entered into a termination and settlement agreement with Nextwave (the “Termination Agreement”). The Termination Agreement provided for the following: (i) Hughes Systique relieved Nextwave of its obligation to fund its remaining commitment under the Loan; (ii) Nextwave waived Hughes Systique’s obligation to repay amounts previously funded, together with accrued interest; and (iii) Hughes Systique waived Nextwave’s obligations for the purchase of services under existing agreements between Nextwave and Hughes Systique and Nextwave’s obligation to repay outstanding accounts receivable of approximately $0.8 million. Additionally, Nextwave’s ownership in HSC Preferred Stock, which represented approximately 31.79% of Hughes Systique’s equity, was converted to a reduced level of ownership, representing a 5% interest in Hughes Systique’s common stock. The effect of these transactions has increased, on an undiluted basis, our ownership in Hughes Systique to approximately 45.23% and the ownership of our CEO and President and his brother in Hughes Systique to approximately 25.61%. Pursuant to ASC 810, these transactions caused a reconsideration event on March 11, 2009, resulting in the Company becoming the “primary beneficiary” of Hughes Systique, a VIE. As a result, the Company is required to consolidate Hughes Systique’s assets and liabilities and results of operations for periods beginning on or after March 12, 2009 (the “Consolidation Date”). In accordance with ASC 805 “Business Combinations,” the basis of Hughes Systique’s assets and liabilities were adjusted to their fair values. The excess of the fair value of the net assets consolidated from Hughes Systique over their carrying value has been reflected as goodwill in accordance with ASC 805. We believe that the goodwill resulting from the consolidation of Hughes Systique corresponds to the expected future prospects of Hughes Systique. The total amount of goodwill is not expected to be deductible for tax purposes.
The following table summarizes the fair values of Hughes Systique’s assets and liabilities at the Consolidation Date (in thousands):
| Amount | ||||
| Current assets |
$ | 5,250 | ||
| Property |
717 | |||
| Intangible assets |
1,329 | |||
| Goodwill |
2,432 | |||
| Total assets |
9,728 | |||
| Current liabilities |
(2,808 | ) | ||
| Long-term liabilities |
(763 | ) | ||
| Total liabilities |
(3,571 | ) | ||
| Net assets consolidated prior to noncontrolling interest |
6,157 | |||
| Noncontrolling interest |
(3,372 | ) | ||
| Net assets consolidated |
$ | 2,785 | ||
81
Table of Contents
HUGHES COMMUNICATIONS, INC.
NOTES TO THE CONSOLIDATED FINANCIAL STATEMENTS (CONTINUED)
Based on the valuation of Hughes Systique’s intangible assets, using an income approach, the fair values of the intangible assets at the Consolidation Date were as follows (in thousands):
| Weighted Average Useful Lives (years) |
Amount | |||||||
| Customer relationships |
7 | $ | 620 | |||||
| Favorable leases |
3 | 629 | ||||||
| Backlog |
2 | 80 | ||||||
| Total amortizable intangible assets |
5 | $ | 1,329 | |||||
Hughes Systique’s revenue, after eliminating inter-company transactions, was $4.7 million for the year ended December 31, 2010 compared to $2.4 million for the same period in 2009 (since the acquisition date). Pro forma financial statements are not presented for Hughes Systique at the acquisition date as its results of operations were not material to our consolidated financial statements.
Note 4: Marketable Securities
The amortized cost basis and estimated fair values of available-for-sale marketable securities are summarized as follows (in thousands):
| Cost Basis | Gross Unrealized | Estimated Fair Value |
||||||||||||||
| Losses | Gain | |||||||||||||||
| December 31, 2010: |
||||||||||||||||
| Municipal commercial paper |
$ | 17,875 | $ | - | $ | - | $ | 17,875 | ||||||||
| U.S. government bonds and treasury bills |
5,000 | - | 5,000 | |||||||||||||
| Other debt securities |
21,665 | (8 | ) | 21,657 | ||||||||||||
| Total available-for-sale securities |
$ | 44,540 | $ | (8 | ) | $ | - | $ | 44,532 | |||||||
| December 31, 2009: |
||||||||||||||||
| U.S. government bonds and treasury bills |
$ | 22,155 | $ | - | $ | 6 | $ | 22,161 | ||||||||
| Other debt securities |
25,019 | 8 | 25,027 | |||||||||||||
| Total available-for-sale securities |
$ | 47,174 | $ | - | $ | 14 | $ | 47,188 | ||||||||
Our investments in municipal commercial papers have A-1/A-1+ and P-1 ratings from Standard & Poor’s (“S&P”) and Moody’s, respectively, and our investments in U.S. government bonds and treasury bills have AAa and Aaa ratings from S&P and Moody’s, respectively. The investments in Other debt securities have A-1/A-1+ and P-1 ratings from S&P and Moody’s, respectively. In addition to these investments, we hold marketable equity securities as a long-term investment in Other assets (see Note 10—Other Assets for further discussion).
82
Table of Contents
HUGHES COMMUNICATIONS, INC.
NOTES TO THE CONSOLIDATED FINANCIAL STATEMENTS (CONTINUED)
Note 5: Receivables, Net
Receivables, net consisted of the following (in thousands):
| December 31, | ||||||||
| 2010 | 2009 | |||||||
| Trade receivables |
$ | 172,309 | $ | 154,863 | ||||
| Contracts in process |
25,208 | 16,952 | ||||||
| Other receivables |
4,332 | 4,101 | ||||||
| Total receivables |
201,849 | 175,916 | ||||||
| Allowance for doubtful accounts |
(15,157 | ) | (12,100 | ) | ||||
| Total receivables, net |
$ | 186,692 | $ | 163,816 | ||||
Trade receivables included $5.8 million and $8.7 million of amounts due from affiliates as of December 31, 2010 and 2009, respectively. Advances and progress billings offset against contracts in process amounted to $2.8 million and $0.3 million as of December 31, 2010 and 2009, respectively.
Note 6: Inventories
Inventories consisted of the following (in thousands):
| December 31, | ||||||||||||
| 2010 | 2009 | |||||||||||
| Production materials and supplies |
$ | 7,270 | $ | 7,896 | ||||||||
| Work in process |
12,828 | 15,615 | ||||||||||
| Finished goods |
37,721 | 36,733 | ||||||||||
| Total inventories |
$ | 57,819 | $ | 60,244 | ||||||||
Inventories are carried at the lower of cost or market, principally using standard costs adjusted to reflect actual cost, based on variance analyses performed throughout the year. Inventories are adjusted to net realizable value using management’s best estimates of future use. In making its assessment of future use or recovery, management considers the aging and composition of inventory balances, the effects of technological and/or design changes, forecasted future product demand based on firm or near-firm customer orders and alternative means of disposition of excess or obsolete items.
83
Table of Contents
HUGHES COMMUNICATIONS, INC.
NOTES TO THE CONSOLIDATED FINANCIAL STATEMENTS (CONTINUED)
Note 7: Property, Net
Property, net consisted of the following (dollars in thousands):
| Estimated Useful Lives (years) |
December 31, | |||||||||
| 2010 | 2009 | |||||||||
| Land and improvements |
10 | $ | 5,888 | $ | 5,885 | |||||
| Buildings and leasehold improvements |
2 -30 | 35,643 | 32,996 | |||||||
| Satellite related assets |
15 | 380,394 | 380,394 | |||||||
| Machinery and equipment |
1 - 7 | 213,419 | 179,923 | |||||||
| Consumer rental equipment |
2 - 4 | 140,616 | 71,725 | |||||||
| VSAT operating lease hardware |
2 - 5 | 13,137 | 18,945 | |||||||
| Furniture and fixtures |
5 - 7 | 1,732 | 1,571 | |||||||
| Construction in progress —Jupiter |
238,358 | 66,555 | ||||||||
| —Other |
15,924 | 12,888 | ||||||||
| Total property |
1,045,111 | 770,882 | ||||||||
| Accumulated depreciation |
(271,059 | ) | (168,479 | ) | ||||||
| Total property, net |
$ | 774,052 | $ | 602,403 | ||||||
Satellite related assets primarily consist of SPACEWAYTM 3 (“SPACEWAY 3”), a broadband satellite system with a unique architecture for broadband data communications. In April 2008, we placed SPACEWAY 3 into service and began to depreciate its related costs on a straight-line basis over the estimated useful life of 15 years. Satellite related assets include the costs associated with the construction and launch of the satellite, insurance premiums for the satellite launch and the in-orbit testing period, interest incurred during the construction of the satellite, and other costs directly related to the satellite.
In June 2009, HNS entered into an agreement with Space Systems/Loral, Inc. (“SS/L”) under which SS/L will manufacture Jupiter, our next-generation and geostationary high throughput satellite. Jupiter will employ a multi-spot beam, bent pipe Ka-band architecture and will provide additional capacity for the HughesNet service in North America. The construction of Jupiter began in July 2009 and we began to capitalize all direct costs associated with the construction and the launch of the satellite, including interest incurred during the construction of the satellite. Jupiter is scheduled to be launched in the first half of 2012.
We capitalized $14.0 million and $1.7 million of interest for 2010 and 2009, respectively, related to the construction of Jupiter. In 2008, we capitalized $4.8 million of interest related to the construction of SPACEWAY 3. During 2010, 2009 and 2008, depreciation expense for property was $111.6 million, $83.1 million and $51.2 million, respectively.
84
Table of Contents
HUGHES COMMUNICATIONS, INC.
NOTES TO THE CONSOLIDATED FINANCIAL STATEMENTS (CONTINUED)
Note 8: Intangible Assets, Net
Intangible assets, net consisted of the following (dollars in thousands):
| Estimated Useful Lives (years) |
Cost Basis | Accumulated Amortization |
Net Basis | |||||||||||
| December 31, 2010: |
||||||||||||||
| Customer relationships |
7 - 8 | $ | 10,405 | $ | (5,473 | ) | $ | 4,932 | ||||||
| Patented technology and trademarks |
8 - 10 | 15,275 | (9,012 | ) | 6,263 | |||||||||
| Favorable leases |
3 | 629 | (384 | ) | 245 | |||||||||
| Total intangible assets, net |
$ | 26,309 | $ | (14,869 | ) | $ | 11,440 | |||||||
| December 31, 2009: |
||||||||||||||
| Backlog and customer relationships |
2 - 8 | $ | 22,312 | $ | (16,133 | ) | $ | 6,179 | ||||||
| Patented technology and trademarks |
2 - 10 | 15,745 | (7,854 | ) | 7,891 | |||||||||
| Favorable leases |
3 | 629 | (175 | ) | 454 | |||||||||
| Total intangible assets, net |
$ | 38,686 | $ | (24,162 | ) | $ | 14,524 | |||||||
We amortize the recorded values of our intangible assets over their estimated useful lives. As of December 31, 2010, $12.4 million of fully amortized intangible assets were retired and as a result, it is not included in the balance included in the table above. For the years ended December 31, 2010, 2009 and 2008, we recorded $3.1 million, $5.5 million and $6.4 million, respectively, of amortization expense. In 2010, we did not incur costs to renew or extend the term of our intangible assets. Estimated future amortization expense as of December 31, 2010 is as follows (in thousands):
| Amount | ||||
| Year ending December 31, |
||||
| 2011 |
$ | 3,028 | ||
| 2012 |
2,854 | |||
| 2013 |
2,818 | |||
| 2014 |
1,326 | |||
| 2015 |
1,326 | |||
| Thereafter |
88 | |||
| Total estimated future amortization expense |
$ | 11,440 | ||
Note 9: Goodwill
Goodwill consisted of the following (in thousands):
| Amount | ||||
| Balance at December 31, 2008 |
$ | 2,661 | ||
| Goodwill related to consolidation of Hughes Systique |
2,432 | |||
| Total goodwill at December 31, 2010 and 2009(1) |
$ | 5,093 | ||
| (1) | Consisted of $2.6 million related to the North America Broadband segment and $2.4 million related to the Corporate and Other segment. |
85
Table of Contents
HUGHES COMMUNICATIONS, INC.
NOTES TO THE CONSOLIDATED FINANCIAL STATEMENTS (CONTINUED)
Note 10: Other Assets
Other assets consisted of the following (in thousands):
| December 31, | ||||||||
| 2010 | 2009 | |||||||
| Subscriber acquisition costs |
$ | 25,695 | $ | 29,884 | ||||
| Debt issuance costs |
17,150 | 12,899 | ||||||
| Other |
30,352 | 33,053 | ||||||
| Total other assets |
$ | 73,197 | $ | 75,836 | ||||
As of December 31, 2010, “Other” included our cost method and equity method investments, which includes our investment in HTI. On March 12, 2009, we exchanged $13.0 million of receivables that HTI owed to us for HTI convertible preferred stock (“HTI Preferred Stock”) as part of a $50.0 million private placement of HTI Preferred Stock. In connection with the merger of HTI with Polaris Acquisition Corp. (the “HTI Merger”), which occurred on March 31, 2009, HTI became a publicly traded company and our HTI Preferred Stock was converted into approximately 3.3 million shares of HTI common stock (“HTI Shares”), of which 1.3 million shares and 2.0 million shares are referred to as Non-escrowed shares and Escrowed shares, respectively. The Escrowed shares are subject to certain restrictions and/or earn-out provisions pursuant to the HTI Merger agreement.
As of December 31, 2010, the Non-escrowed shares had a fair value of $3.8 million. We recorded an unrealized loss of $0.5 million for the year ended December 31, 2010 and of $2.9 million since the inception of our investment in the Non-escrowed shares in AOCL.
The Escrowed Shares are held by HTI in escrow, and the release of these shares is subject to various earn-out provisions based on HTI attaining specified stock prices of $20.00, $24.50 and $30.50 over specified periods within 5 years of the Merger. If the full earn-out is achieved, our investment could represent approximately 3.6% of HTI’s outstanding common stock. If the earn-out is not attained, all or a portion of the Escrowed Shares will be forfeited. In addition to the risk and valuation fluctuations associated with the earn-out target, the carrying value of the investment in HTI may be subject to fair value adjustments in future reporting periods. We account for the Escrowed Shares using the cost method in accordance with ASC 325 “Investments—Other,” as the Escrowed Shares are not considered marketable equity securities as of December 31, 2010. In accordance with ASC 320-10-35, “Investments—Debt and Equity Securities—Subsequent Measurement”, we recognized $5.2 million of other than temporary impairment loss in December 2009 based on our estimate of fair value of Escrowed Shares in “Loss on impairments” included in the accompanying Consolidated Statements of Operations. HTI investment is related to our Corporate and Other segment. As of December 31, 2010, the carrying value and estimated fair value of the HTI Escrowed Shares was $1.1 million and $0.5 million, respectively.
86
Table of Contents
HUGHES COMMUNICATIONS, INC.
NOTES TO THE CONSOLIDATED FINANCIAL STATEMENTS (CONTINUED)
Note 11: Accrued Liabilities and Other
Accrued liabilities and other consisted of the following (in thousands):
| December 31, | ||||||||
| 2010 | 2009 | |||||||
| Accrued and other liabilities |
$ | 47,107 | $ | 44,456 | ||||
| Progress billings to customers |
40,912 | 47,911 | ||||||
| Payroll and other compensation |
27,698 | 26,512 | ||||||
| Accrued interest expense |
13,073 | 12,895 | ||||||
| Total accrued liabilities and other |
$ | 128,790 | $ | 131,774 | ||||
Note 12: Debt
Short-term and the current portion of long-term debt consisted of the following (dollars in thousands):
| Interest Rates at December 31, 2010 |
December 31, | |||||||||
| 2010 | 2009 | |||||||||
| VSAT hardware financing |
7.27% - 15.00% | $ | 3,109 | 3,158 | ||||||
| Revolving bank borrowings |
8.75% | 967 | 1,547 | |||||||
| Capital lease and other |
5.50% - 39.60% | 2,209 | 2,045 | |||||||
| Total short-term and the current portion of long-term debt |
$ | 6,285 | $ | 6,750 | ||||||
As of December 31, 2010, HNS had outstanding revolving bank borrowings of $1.0 million, which had a variable interest rate of 8.75%. The borrowing was obtained by HNS’ Indian subsidiary under its revolving line of credit with a local bank. There is no requirement for compensating balances for these borrowings. The total amount available for borrowing by our foreign subsidiaries under various revolving lines of credit was $4.1 million as of December 31, 2010.
Long-term debt consisted of the following (dollars in thousands):
| Interest Rates at December 31, 2010 |
December 31, | |||||||||
| 2010 | 2009 | |||||||||
| Senior Notes(1) |
9.50% | $ | 590,173 | $ | 587,874 | |||||
| Term Loan Facility |
7.62% | 115,000 | 115,000 | |||||||
| COFACE Guaranteed Facility |
5.13% | 27,403 | - | |||||||
| VSAT hardware financing |
7.27% - 15.00% | 3,214 | 5,861 | |||||||
| Capital lease and other |
5.50% - 39.60% | 4,786 | 6,222 | |||||||
| Total long-term debt |
$ | 740,576 | $ | 714,957 | ||||||
| (1) | Includes 2006 Senior Notes and 2009 Senior Notes. |
On October 29, 2010, HNS entered into a $115 million loan agreement with BNP Paribas and Societe Generale (“COFACE Guaranteed Facility”), which is guaranteed by COFACE, the French Export Credit Agency, to finance the launch related costs for Jupiter satellite. Pursuant to the COFACE Guaranteed Facility agreement,
87
Table of Contents
HUGHES COMMUNICATIONS, INC.
NOTES TO THE CONSOLIDATED FINANCIAL STATEMENTS (CONTINUED)
loan draw-downs, which began in the fourth quarter of 2010, will occur over the construction period for the launch vehicle up to the time of the launch, which is estimated to be in the first half of 2012. COFACE Guaranteed Facility has a fixed interest rate of 5.13%, payable semi-annually in arrears starting six months after each borrowing, and requires that principal repayments are to be paid in 17 consecutive equal semi-annual installments starting the earlier of (i) six months after the in-orbit delivery, or (ii) December 1, 2012. The agreement also contains covenants and conditions which are customary for financings of this type. As of December 31, 2010, HNS had $27.4 million of borrowings outstanding under the loan and an available borrowing capacity of $87.6 million.
On March 16, 2010, HNS entered into a credit agreement with JP Morgan Chase Bank, N.A. and Barclays Capital to amend and restate its senior secured $50 million revolving credit facility (the “Revolving Credit Facility”). Pursuant to the terms of the agreement, among other changes, the maturity date of the Revolving Credit Facility was extended to March 16, 2014, subject to an early maturity date of 91 days prior to March 16, 2014 in the event HNS’ 2009 and 2006 Senior Notes and HNS’ Term Loan Facility (as defined below) are not (i) repaid in full or (ii) refinanced with new debt (or amended) with maturities of no earlier than 91 days after March 16, 2014. The terms of the Revolving Credit Facility were amended to be: (i) in respect of the interest rate, at our option, the Alternative Borrowing Rate (as defined in the Revolving Credit Facility) plus 2.00% or the Adjusted London Interbank Offered Rate (“LIBOR”) (as defined in the Revolving Credit Facility) plus 3.00% and (ii) in respect of the participation fee for outstanding letters of credit, 3.00% per annum, in each case subject to downward adjustment based on our leverage ratio. For the years ended December 31, 2010 and 2009, there was no borrowing under the Revolving Credit Facility. As of December 31, 2010, the Revolving Credit Facility had total outstanding letters of credit of $4.4 million and an available borrowing capacity of $45.6 million.
On May 27, 2009, HNS, along with its subsidiary, HNS Finance Corp., as co-issuer, completed a private debt offering of $150.0 million of 9.50% senior notes maturing on April 15, 2014 (the “2009 Senior Notes”). The terms and covenants with respect to the 2009 Senior Notes are substantially identical to those of the 2006 Senior Notes. Interest on the 2009 Senior Notes is accrued from April 15, 2009 and is paid semi-annually in arrears on April 15 and October 15 of each year, beginning on October 15, 2009. After the original issue discount of $13.6 million and related offering expenses of approximately $4.5 million, HNS received net proceeds of approximately $133.6 million, including $1.7 million of prepaid interest received from the note holders, from the offering. The 2009 Senior Notes were offered and sold in the United States only to qualified institutional buyers pursuant to Rule 144A of the Securities Act of 1933, as amended, (the “Securities Act”) and in offshore transactions to non-United States persons in reliance on Regulation S of the Securities Act. In connection with the offering of the 2009 Senior Notes, HNS entered into a registration rights agreement requiring HNS to complete a registered exchange offer relating to the 2009 Senior Notes within 360 days after May 27, 2009. On August 17, 2009, HNS completed the registered exchange offer pursuant to the registration rights agreement. Accordingly, the 2009 Senior Notes have been registered under the Securities Act. As of December 31, 2010 and 2009, HNS recorded $3.0 million of accrued interest payable related to the 2009 Senior Notes.
In February 2007, HNS borrowed $115 million from a syndicate of banks (the “Term Loan Facility”), which matures on April 15, 2014. The interest on the Term Loan Facility is paid quarterly at Adjusted LIBOR (as defined in the Term Loan Facility) plus 2.50% per annum. To mitigate the variable interest rate risk associated with the Term Loan Facility, HNS entered into a swap agreement to swap the Adjusted LIBOR for a fixed interest rate of 5.12% per annum (the “Swap Agreement”). As a result, the Term Loan Facility has a fixed interest rate of 7.62% per annum. As of December 31, 2010 and 2009, interest accrued based on the Swap Agreement and the Term Loan Facility was $0.7 million and $0.8 million, respectively.
88
Table of Contents
HUGHES COMMUNICATIONS, INC.
NOTES TO THE CONSOLIDATED FINANCIAL STATEMENTS (CONTINUED)
In April 2006, HNS issued $450 million of 9.50% senior notes maturing on April 15, 2014 (the “2006 Senior Notes”). Interest on the 2006 Senior Notes is paid semi-annually in arrears on April 15 and October 15. As of December 31, 2010 and 2009, we recorded $8.9 million of accrued interest payable related to the 2006 Senior Notes.
Although the terms and covenants with respect to the 2009 Senior Notes are substantially identical to the 2006 Senior Notes, the 2009 Senior Notes were issued under a separate indenture and do not vote together with the 2006 Senior Notes. Each of the indentures governing the 2006 Senior Notes and the 2009 Senior Notes (collectively, the “Senior Notes”), the agreement governing the amended Revolving Credit Facility, the agreement governing the COFACE Guaranteed Facility and the agreement governing the Term Loan Facility require HNS to comply with certain affirmative and negative covenants: (i) in the case of the indentures, for so long as any Senior Notes are outstanding; (ii) in the case of the amended Revolving Credit Facility, so long as the amended Revolving Credit Facility is in effect; (iii) in the case of the COFACE Guaranteed Facility, for so long as the COFACE Guaranteed Facility remains outstanding; and (iv) in the case of the Term Loan Facility, for so long as the Term Loan Facility remains outstanding. Negative covenants contained in these agreements include limitations on the ability of HNS and/or certain of its subsidiaries to incur additional indebtedness; issue redeemable stock and subsidiary preferred stock; incur liens; pay dividends or distributions or redeem or repurchase capital stock; prepay, redeem or repurchase debt; make loans and investments; enter into agreements that restrict distributions from HNS’ subsidiaries; sell assets and capital stock of our subsidiaries; enter into certain transactions with affiliates; consolidate or merge with or into, or sell substantially all of our assets to, another person; and enter into new lines of business. In addition to these negative covenants, the amended Revolving Credit Facility, the indentures governing the Senior Notes, the COFACE Guaranteed Facility and/or the agreement governing the Term Loan Facility contain affirmative covenants that require us to: (i) preserve our businesses and properties; (ii) maintain insurance over our assets; (iii) pay and discharge all material taxes when due; and (iv) furnish the lenders’ administrative agent our financial statements for each fiscal quarter and fiscal year, certificates from a financial officer certifying that no Event of Default or Default has occurred during the fiscal period being reported, litigation and other notices, compliance with laws, maintenance of records and other such customary covenants. HNS and its subsidiaries comprise a substantial portion of the Company’s net assets and results of operations since January 1, 2006. Because of the negative covenants above, there are certain restrictions on the sale of HNS’ assets. As of December 31, 2010 and 2009, HNS’ net assets were $221.9 million and $200.0 million, respectively. Management believes that HNS was in compliance with all of its debt covenants as of December 31, 2010.
Prior to September 2005, we leased certain VSAT hardware under an operating lease with customers which were funded by two financial institutions at the inception of the operating lease for the future operating lease revenues. As part of the agreement, the financial institution received title to the equipment and obtained the residual rights to the equipment after the operating lease with the customer expires and assumed the credit risk associated with non-payment by the customers. However, we retained a continuing obligation to the financing institution to indemnify it from losses it may incur (up to the original value of the hardware) from non-performance of our system (a “Non-Performance Event”). Accordingly, we recognized a liability to the financial institution for the funded amount. We have not provided a reserve for a Non-Performance Event because we believe that the possibility of an occurrence of a Non-Performance Event due to a service outage is remote, given the ability to quickly re-establish customer service at relatively nominal costs.
In July 2006, we entered into a capital lease with 95 West Co., Inc. (“95 West Co.”) and its parent, Miraxis License Holdings, LLC (“MLH”), which are our related parties as discussed in Note 20—Transactions with Related Parties. Pursuant to the capital lease agreement, 95 West Co. and MLH agreed to provide a series of coordination agreements allowing HNS to operate SPACEWAY 3 at the 95° west longitude orbital slot where
89
Table of Contents
HUGHES COMMUNICATIONS, INC.
NOTES TO THE CONSOLIDATED FINANCIAL STATEMENTS (CONTINUED)
95 West Co. and MLH have higher priority rights. As of December 31, 2010, the remaining debt balance under the capital lease was $4.9 million, which was included in “Capital lease and other” in the short-term and long-term debt tables above. The remaining payments under the capital lease are subject to conditions in the agreement including our ability to operate SPACEWAY 3 and are $1.0 million for each of the years ending December 31, 2011 through 2016.
Principal payments of our debt at December 31, 2010 are as follows (in thousands):
| Amount | ||||
| Year ending December 31, |
||||
| 2011 |
$ | 6,285 | ||
| 2012 |
4,803 | |||
| 2013 |
4,817 | |||
| 2014 |
709,634 | |||
| 2015 |
4,260 | |||
| Thereafter |
17,062 | |||
| Total debt |
$ | 746,861 | ||
Note 13: Financial Instruments
Interest Rate Swap
The interest on the Term Loan Facility was at Adjusted LIBOR plus 2.50% per annum. To mitigate the variable interest rate risk associated with the Term Loan Facility, we entered into the Swap Agreement to swap the Adjusted LIBOR for a fixed interest rate of 5.12% per annum. As a result, the Term Loan Facility has a fixed interest rate of 7.62% per annum. We account for the Swap Agreement as a cash flow hedge in accordance with ASC 815-30 “Derivatives and Hedging—Cash Flow Hedges.” Accordingly, in connection with the fair market valuation of the interest rate swap, we recorded a net unrealized loss of $2.4 million, a net unrealized gain of $6.9 million and a net unrealized loss of $11.9 million for the years ended December 31, 2010, 2009 and 2008, respectively, in AOCL. The remaining net interest payments based on the Swap Agreement and the Term Loan Facility are paid quarterly and estimated to be approximately $8.8 million for each of the years ending December 31, 2011 through 2013 and $3.3 million for the year ending December 31, 2014. We recorded interest expense of $8.9 million, $9.0 million and $8.9 million for the years ended December 31, 2010, 2009 and 2008, respectively, on the Term Loan Facility.
Note 14: Fair Value
Under ASC 820 “Fair Value Measurements and Disclosures,” fair value is defined as the price that would be received to sell an asset or paid to transfer a liability (exit price) in an orderly transaction between market participants at the measurement date, and the principal market is defined as the market in which the reporting entity would sell the asset or transfer the liability with the greatest volume and level of activity for the asset or liability. If there is no principal market, the most advantageous market is used. This is the market in which the reporting entity would sell the asset or transfer the liability with the price that maximizes the amount that would be received for the asset or minimizes the amount that would be paid to transfer the liability. ASC 820 clarifies that fair value should be based on assumptions market participants would make in pricing the asset or liability. Where available, fair value is based on observable quoted market prices or derived from observable market data. Where observable prices or inputs are not available, valuation models are used (i.e. Black-Scholes, a barrier
90
Table of Contents
HUGHES COMMUNICATIONS, INC.
NOTES TO THE CONSOLIDATED FINANCIAL STATEMENTS (CONTINUED)
option model or a binomial model). ASC 820 established the following three levels used to classify the inputs used in measuring fair value measurements:
Level 1-Inputs are unadjusted quoted prices in active markets for identical assets or liabilities available at the measurement date.
Level 2-Inputs are unadjusted quoted prices for similar assets and liabilities in active markets, quoted prices for identical or similar assets and liabilities in markets that are not active, inputs, other than quoted prices, that are observable, and inputs derived from or corroborated by observable market data.
Level 3-Inputs are unobservable inputs which reflect the reporting entity’s own assumptions on the assumptions market participants would use in pricing the asset or liability based on the best available information.
In determining fair value, we use various valuation approaches, including market, income and/or cost approaches. Other valuation techniques involve significant management judgment. As of December 31, 2010, the carrying values of cash and cash equivalents, receivables, net, accounts payable, and short-term debt approximated their respective fair values because of their short-term maturities.
Our investment in the HTI Shares was measured using Level 1 and Level 2 inputs for the Non-escrowed shares and Escrowed shares, respectively. The fair value of the Non-escrowed shares, as shown in the table below, was determined based on the quoted market prices. For the year ended December 31, 2010, we recognized unrealized losses of $0.5 million in AOCL related to the Non-escrowed shares. The fair value of the Escrowed shares, as shown in the table below, was determined using market observable data and utilizing a barrier option pricing model. The valuation of the Escrowed shares reflects the Company’s best estimate of what market participants would use in pricing the investment based on the best available information. For the year ended December 31, 2010, the estimated fair value of the Escrowed shares declined by $0.6 million from its carrying value of $1.1 million at December 31, 2009 to $0.5 million as of December 31, 2010. Based on our valuation analysis in accordance with ASC 320-10-35 “Investments—Debt and Equity Securities—Subsequent Measurement,” we determined that the decline in the estimated fair value of the Escrowed shares during 2010 is not an “other than temporary” impairment.
Our Senior Notes were categorized as Level 1 of the fair value hierarchy as we utilized pricing for recent market transactions for identical notes.
Our Term Loan Facility originally had a variable interest rate based on observable interest rates plus 2.50% per annum. To mitigate the variable interest rate risk, we entered into the Swap Agreement to swap the Adjusted LIBOR for a fixed interest rate of 5.12% per annum. As a result, the Term Loan Facility has a fixed interest rate of 7.62% per annum. We adjust the value of the interest rate swap on a quarterly basis. The fair value of the interest rate swap was categorized as Level 2 of the fair value hierarchy.
91
Table of Contents
HUGHES COMMUNICATIONS, INC.
NOTES TO THE CONSOLIDATED FINANCIAL STATEMENTS (CONTINUED)
Assets and liabilities measured at fair value on a recurring basis are summarized below (dollars in thousands):
| Level | Included In |
December 31, 2010 | ||||||||||||
| Carrying Value |
Fair Value |
|||||||||||||
| Marketable securities |
2 | Marketable securities | $ | 39,532 | $ | 39,532 | ||||||||
| Marketable security |
1 | Marketable securities | $ | 5,000 | $ | 5,000 | ||||||||
| HTI Non-escrowed Shares |
1 | Other assets | $ | 3,770 | $ | 3,770 | ||||||||
| HTI Escrowed Shares |
2 | Other assets | $ | 1,121 | $ | 499 | ||||||||
| 2006 Senior Notes |
1 | Long-term debt | $ | 450,000 | $ | 464,625 | ||||||||
| 2009 Senior Notes |
1 | Long-term debt | $ | 140,173 | (1) | $ | 153,750 | |||||||
| Term Loan Facility |
2 | Long-term debt | $ | 115,000 | $ | 110,688 | ||||||||
| COFACE Guaranteed Facility |
2 | Long-term debt | $ | 27,403 | $ | 29,018 | ||||||||
| Orbital slot commitment |
2 | Short-term/Long-term debt | $ | 4,917 | $ | 5,487 | ||||||||
| VSAT hardware financing |
2 | Short-term/Long-term debt | $ | 6,323 | $ | 6,436 | ||||||||
| Interest rate swap on the Term Loan Facility |
2 | Other long-term liabilities | $ | 12,901 | $ | 12,901 | ||||||||
| (1) | Amount represents the face value of $150.0 million, net of the remaining original issue discount of $9.8 million. |
Note 15: Income Taxes
The income (loss) before income tax expense and equity in earnings (losses) of unconsolidated affiliates and the corresponding income tax expense (benefit) reflected on the consolidated statements of operations for the years ended December 31, 2010, 2009 and 2008 consisted of the following (in thousands):
| Year Ended December 31, | ||||||||||||
| 2010 | 2009 | 2008 | ||||||||||
| Income (loss) before income tax expense and equity in earnings (losses) of unconsolidated affiliates: |
||||||||||||
| Domestic income (loss) |
$ | 19,984 | $ | (60,612 | ) | $ | 9,093 | |||||
| Foreign income |
8,712 | 11,241 | 8,427 | |||||||||
| Total |
$ | 28,696 | $ | (49,371 | ) | $ | 17,520 | |||||
| Components of income tax expense: |
||||||||||||
| Current income tax expense: |
||||||||||||
| Foreign |
$ | 5,950 | $ | 2,750 | $ | 2,373 | ||||||
| State |
756 | 650 | 803 | |||||||||
| Total current income tax expense |
6,706 | 3,400 | 3,176 | |||||||||
| Deferred income tax expense (benefit): |
||||||||||||
| Foreign |
(990 | ) | (954 | ) | 4,417 | |||||||
| Federal |
- | - | - | |||||||||
| Total deferred income tax expense (benefit) |
(990 | ) | (954 | ) | 4,417 | |||||||
| Total income tax expense |
$ | 5,716 | $ | 2,446 | $ | 7,593 | ||||||
We entered into a tax sharing agreement with LightSquared (the “Tax Sharing Agreement”) at the time of the separation of the Company from LightSquared during 2006, pursuant to which we are responsible for all LightSquared tax liabilities through February 21, 2006. As a result, we paid LightSquared $1.1 million for its
92
Table of Contents
HUGHES COMMUNICATIONS, INC.
NOTES TO THE CONSOLIDATED FINANCIAL STATEMENTS (CONTINUED)
2006 alternative minimum tax (“AMT”) liability. In accordance with the Tax Sharing Agreement, we are entitled to reimbursement of the $1.1 million from LightSquared at such time LightSquared realizes the benefit of the AMT credit. Recent tax legislation contains provisions enabling the acceleration of AMT credit refund, which LightSquared collected from the Internal Revenue Service and forwarded to the Company in December 2010.
Our consolidated temporary differences that give rise to the net deferred tax assets at December 31, 2010 and 2009 are as follows (in thousands):
| December 31, | ||||||||
| 2010 | 2009 | |||||||
| Deferred tax assets: |
||||||||
| Net operating loss carryforwards |
$ | 149,246 | $ | 141,041 | ||||
| Capital loss carryforwards |
3,649 | 4,797 | ||||||
| Alternative minimum tax credit |
475 | 475 | ||||||
| Research and development credit |
6,952 | 5,568 | ||||||
| Other assets |
13,490 | 12,201 | ||||||
| Total gross deferred tax assets |
173,812 | 164,082 | ||||||
| Deferred tax liabilities: |
||||||||
| Investment in Hughes Network Systems, LLC |
80,599 | 75,490 | ||||||
| Compensation expense on restricted stock |
490 | 554 | ||||||
| Total gross deferred tax liability |
81,089 | 76,044 | ||||||
| Net deferred tax assets before valuation allowance |
92,723 | 88,038 | ||||||
| Valuation allowance |
(87,075 | ) | (83,540 | ) | ||||
| Net deferred tax assets |
$ | 5,648 | $ | 4,498 | ||||
As we have not met the more-likely-than-not criteria of ASC 740 on deferred tax assets in certain jurisdictions and therefore have maintained a full valuation allowance on these deferred tax assets as of December 31, 2010. Certain deferred tax assets, namely $5.1 million associated with our foreign subsidiaries and $0.5 million associated with our AMT credit, require no valuation allowance.
As of December 31, 2010, our Federal and State net operating losses (“NOL”) carryforwards are approximately $334.6 million expiring between the years 2012 and 2029, if unused, and our capital loss carryforwards were approximately $10.4 million expiring between 2011 and 2014, if unused.
Our German and United Kingdom (“U.K.”) subsidiaries have approximately $35.2 million and $50.8 million of NOL carryforwards, respectively. As the U.K. subsidiary is treated as a disregarded entity for U.S. income tax purposes, its net income or loss is reported on HNS’ partnership income tax return and subsequently allocated to us. The NOL carryforwards are available to reduce future U.K. taxable income and do not expire. The NOL carryforwards of the German subsidiary are available to reduce future German taxable income and do not expire.
As the German and U.K. subsidiaries have not met the more-likely–than-not criteria of ASC 740, we maintained a full valuation allowance on the German and U.K. deferred tax assets as of December 31, 2010. The ultimate realization of deferred tax assets is dependent upon the generation of future taxable income during the periods in which those temporary differences become deductible. We considered the scheduled reversal of deferred tax liabilities, projected future taxable income and tax planning in making these assessments.
93
Table of Contents
HUGHES COMMUNICATIONS, INC.
NOTES TO THE CONSOLIDATED FINANCIAL STATEMENTS (CONTINUED)
For the years ended December 31, 2010, 2009 and 2008, income tax expense differs from the amounts computed by applying the statutory rates to our income from continuing operations before income taxes as follows (in thousands):
| Year Ended December 31, | ||||||||||||
| 2010 | 2009 | 2008 | ||||||||||
| Income (loss) before income tax expense and equity in earnings (losses) of unconsolidated affiliates: |
$ | 28,696 | $ | (49,371 | ) | $ | 17,520 | |||||
| Federal income tax @ 35% |
$ | 10,043 | $ | (17,280 | ) | $ | 6,132 | |||||
| Net permanent differences |
(1,385 | ) | 274 | 512 | ||||||||
| Change in valuation allowance |
(5,804 | ) | 20,677 | 896 | ||||||||
| State taxes, net of federal benefit |
756 | 648 | 803 | |||||||||
| Foreign taxes in excess of federal tax (benefit) |
2,106 | (1,873 | ) | (750 | ) | |||||||
| Total income tax expense |
$ | 5,716 | $ | 2,446 | $ | 7,593 | ||||||
We have not provided for U.S. deferred income taxes or foreign withholding taxes on $33.1 million of our undistributed earnings for certain non-U.S. subsidiaries earnings because these earnings are intended to be permanently reinvested in operations outside the United States.
Under ASC740, we may recognize the tax benefit from an uncertain tax position only if it is more-likely-than-not that the tax position will be sustained on examination by the taxing authorities, based on the technical merits of the position. The tax benefits recognized in the financial statements from such a position should be measured based on the largest benefit that has a greater than fifty percent likelihood of being realized upon ultimate settlement with a taxing authority that has full knowledge of all relevant information. ASC 740 requires increased disclosures and also provides guidance on de-recognition, classification, interest and penalties on income taxes and accounting in interim periods.
A tabular reconciliation of a change in unrecognized tax benefits for the years ended December 31, 2010 and 2009 is as follows (in thousands):
| December 31, | ||||||||||||
| 2010 | 2009 | 2008 | ||||||||||
| Beginning balance of unrecognized tax benefits |
$ | 11,142 | $ | 10,222 | $ | 8,708 | ||||||
| Gross increases—tax positions in prior periods |
44 | 230 | 989 | |||||||||
| Gross decreases—tax positions in prior periods |
(7,794 | ) | - | - | ||||||||
| Gross increases—tax positions in current period |
741 | 690 | 525 | |||||||||
| Ending balance of unrecognized tax benefits |
$ | 4,133 | $ | 11,142 | $ | 10,222 | ||||||
In accordance with ASC 740, we have identified unrecognized tax benefits related to tax positions of $11.1 million as of December 31, 2009, an additional $0.8 million, and a reduction of $7.8 million of unrecognized tax benefits in 2010. If recognized, the total unrecognized tax benefits would impact our effective tax rate. We anticipate that uncertain tax positions will increase within the next twelve months in a range of $0.5 million to $1.0 million.
We recognize interest accrued related to unrecognized tax benefits in operating expenses and penalties in income tax expense in the consolidated statements of operations. As of December 31, 2010, we have not
94
Table of Contents
HUGHES COMMUNICATIONS, INC.
NOTES TO THE CONSOLIDATED FINANCIAL STATEMENTS (CONTINUED)
recorded any liability for the payment of interest or penalties associated with uncertain tax positions. Following is a description of the tax years that remain subject to examination by major tax jurisdictions:
| United States - Federal |
1997 and forward | |||
| United States - Various States |
1997 and forward | |||
| United Kingdom |
2005 and forward | |||
| Germany |
2004 and forward | |||
| Italy |
2006 and forward | |||
| India |
1995 and forward | |||
| Mexico |
2000 and forward | |||
| Brazil |
2004 and forward |
During 2009, the Internal Revenue Service (“IRS”) conducted an audit of the Company’s 2007 U.S. Income Tax Return. The Company received a final determination letter with no adjustments proposed by the IRS.
Note 16: Employee Share-Based Payments
2006 Equity and Incentive Plan
In January 2006, we adopted and our Board of Directors approved the 2006 Equity and Incentive Plan (the “Plan”). The Plan provides for the grant of equity-based awards, including restricted common stock, restricted stock units, stock options, stock appreciation rights and other equity-based awards, as well as cash bonuses and long-term cash awards to directors, officers, other employees, advisors and consultants of the Company and its subsidiaries who are selected by our Compensation Committee for participation in the Plan. Unless earlier terminated by our Board of Directors, the Plan will expire on the tenth anniversary of the date of its adoption. Termination of the Plan is not intended to adversely affect any award that is then outstanding without the award holder’s consent. Our Board of Directors may amend the Plan at any time. Plan amendments are not intended to adversely affect any award that is then outstanding without the award holder’s consent, and the Company must obtain stockholder approval of a plan amendment if stockholder approval is required to comply with any applicable law, regulation or stock exchange rule.
The Plan provides for the issuance of up to 2,700,000 shares of our common stock which may be issued in the form of restricted stock, stock options or stock appreciation rights; provided that the maximum number of shares that may be issued pursuant to the exercise of incentive stock options may not exceed 1,350,000 shares. In accordance with the terms of the Plan, in August 2006, the Board of Director delegated to the CEO the authority to award, at the CEO’s discretion, up to 250,000 shares in the aggregate of restricted stock to employees (other than Section 16 reporting persons) up to a maximum award of 4,000 shares per employee. The CEO has issued restricted stock awards and restricted stock units to employees, for which 50% of the shares vest on the second anniversary of the issuance date, and an additional 25% of the shares vest on each of the third and fourth anniversaries of the issuance date. The fair value of the shares is calculated based on the market price on the grant date.
We also issue shares under the Plan to directors, officers and key employees and contractors of the Company and its wholly-owned subsidiaries. These awards are issued at their fair market value on the date of grant. In February 2009, we issued an aggregate of 90,000 shares of restricted stock, which vest over a three year period, to members of our Board of Directors.
The Company and HNS account for shares issued in accordance with the provisions of ASC 718, “Compensation—Stock Compensation.” The Company records compensation expense for restricted stock awards
95
Table of Contents
HUGHES COMMUNICATIONS, INC.
NOTES TO THE CONSOLIDATED FINANCIAL STATEMENTS (CONTINUED)
and restricted stock units on a straight-line basis over their vesting period. For the years ended December 31, 2010, 2009 and 2008, we recorded compensation expense related to the issuance of restricted stock awards and restricted stock units, after adjustment for forfeitures, of $2.4 million, $2.9 million and $3.2 million, respectively. As of December 31, 2010, we had $1.5 million of unrecognized compensation expense related to the restricted stock awards and restricted stock units, which will be recognized over a weighted average life of 1.89 years. We recognized a tax benefit of $3.8 million, $1.2 million and $2.6 million related to restricted stock awards, restricted stock units and stock options for the years ended December 31, 2010, 2009 and 2008, respectively.
Summaries of non-vested restricted stock awards and restricted stock units are as follows:
Restricted Stock Awards
| Shares | Weighted-Average Grant-Date Fair Value |
|||||||
| Non-vested at December 31, 2009 |
162,360 | $ | 27.37 | |||||
| Forfeited |
(2,950 | ) | $ | 46.89 | ||||
| Vested |
(81,084 | ) | $ | 33.60 | ||||
| Non-vested at December 31, 2010 |
78,326 | $ | 20.19 | |||||
The weighted-average grant date fair value of restricted stock awards granted for the years ended December 31, 2009 and 2008 were $11.13 and $47.95, respectively. No restricted stock awards were granted for the year ended December 31, 2010. The total fair value of shares vested during the years ended December 31, 2010, 2009 and 2008 were $2.7 million, $3.6 million and $6.9 million, respectively.
Restricted Stock Units
| Shares | Weighted-Average Grant-Date Fair Value |
|||||||
| Non-vested at December 31, 2009 |
8,675 | $ | 28.73 | |||||
| Granted |
18,000 | $ | 28.99 | |||||
| Vested |
(3,175 | ) | $ | 45.35 | ||||
| Non-vested at December 31, 2010 |
23,500 | $ | 26.68 | |||||
The weighted-average grant date fair value of restricted stock units granted for the years ended December 31, 2010, 2009 and 2008 were $28.99, $8.82 and $43.27, respectively. The total fair value of units vested during the years ended December 31, 2010, 2009 and 2008 were $0.1 million, $0.1 million and $0.2 million, respectively.
Stock Option Program
On April 24, 2008, our Compensation Committee made stock options awards under the Plan (the “Stock Option Program”), which consisted of the issuance of non-qualified stock options to employees of the Company and its subsidiaries. A total of 1,250,000 options (the “Option Pool”) have been authorized under the Stock Option Program for option awards during the period of April 24, 2008 to December 31, 2011. The grant and exercise price of the stock options is the closing price of the Company’s common stock on the date of the grant.
96
Table of Contents
HUGHES COMMUNICATIONS, INC.
NOTES TO THE CONSOLIDATED FINANCIAL STATEMENTS (CONTINUED)
Any options forfeited or cancelled before exercise will be deposited back into the Option Pool and will become available for award under the Stock Option Program. In accordance with the terms of the Stock Option Program, the Compensation Committee delegated to our Chief Executive Officer (“CEO”) and President the authority to award options, at his discretion, to the current and future employees of the Company and its subsidiaries. Each grant has a 10 year life and vests 50% on the second anniversary of the grant date and 25% on each of the third and fourth anniversaries of the grant date. The fair value of each option award was estimated on the date of grant using a Black-Scholes option valuation model based on the assumptions noted in the table below.
Since we became a public registrant in February 2006, we did not have sufficient history to measure expected volatility using our own stock price history nor have the history to compute the expected term of the stock options at the time of issuing stock options to employees. As a result, we utilized an average volatility based on a group of companies identified as our peers. We estimated the expected term of the stock options, which is closely aligned with the identified peer group, based upon the current anticipated corporate growth, the currently identified market value of the stock price at issuance and the vesting schedule of the stock options. The risk-free interest rate is based on the published U.S. Treasury Yield Curve as of the grant date for the period of 5 years which most closely correlates to the expected term of the option award. Dividend yield is zero as we have not, nor do we currently plan to, issue dividends to our shareholders.
On March 19, 2009, we offered eligible participants in the Stock Option Program the opportunity to exchange (the “Exchange Offer”) all or a portion of their eligible outstanding stock options for new stock options, on a one-for-one basis, through an exchange offer, which expired on April 16, 2009. Each new option (the “New Option”) has an exercise price of $14.47, which was the closing price of our common stock on April 15, 2009, and a new vesting schedule to reflect the new grant date of April 16, 2009.
As a result of the Exchange Offer, which was completed on April 16, 2009, 546,900 outstanding stock options (representing 100% participation) were exchanged, and the estimated fair value of the New Options of $2.3 million was computed using a Black-Scholes option valuation model based on the new grant date. The compensation expense related to the New Options is recognized on a straight-line basis over the four-year vesting period beginning on the date of grant.
The key assumptions for the option awards for the years ended December 31, 2010, 2009 and 2008 are as follows:
| Year Ended December 31, | ||||||
| 2010 | 2009 | 2008 | ||||
| Volatility range |
45.33% - 45.90% | 45.97% - 47.92% | 47.60% - 55.0% | |||
| Weighted-average volatility |
45.40% | 47.62% | 47.67% | |||
| Expected term |
5 years | 5 years | 5 years | |||
| Risk-free interest rate range |
1.18% - 2.59% | 1.71% - 2.20% | 3.15% - 1.50% | |||
| Weighted-average risk-free interest rate |
1.20% | 1.79% | 3.14% | |||
97
Table of Contents
HUGHES COMMUNICATIONS, INC.
NOTES TO THE CONSOLIDATED FINANCIAL STATEMENTS (CONTINUED)
A summary of option activity under the Stock Option Program is presented below:
| Option Shares |
Weighted- Average Exercise Price |
Weighted Average Remaining Contractual Life |
Aggregate Intrinsic Value(1) |
|||||||||||||
| Outstanding at January 1, 2008 |
- | $ | - | |||||||||||||
| Granted |
562,400 | $ | 53.67 | |||||||||||||
| Forfeited or expired |
(10,000 | ) | $ | 54.00 | ||||||||||||
| Outstanding at December 31, 2008 |
552,400 | $ | 53.67 | 9.32 | $ | - | ||||||||||
| Retired |
(546,900 | ) | $ | 54.00 | ||||||||||||
| Granted |
647,400 | $ | 16.77 | |||||||||||||
| Forfeited or expired |
(4,850 | ) | $ | 20.84 | ||||||||||||
| Outstanding at December 31, 2009 |
648,050 | $ | 16.77 | 9.37 | $ | 6,326 | ||||||||||
| Granted |
572,500 | $ | 28.99 | |||||||||||||
| Forfeited or expired |
(22,350 | ) | $ | 19.56 | ||||||||||||
| Exercised |
(1,250 | ) | $ | 17.03 | ||||||||||||
| Outstanding at December 31, 2010 |
1,196,950 | $ | 22.56 | 9.04 | $ | 21,412 | ||||||||||
| Vested and expected to vest at December 31, 2010 |
1,077,255 | $ | 22.56 | 9.04 | $ | 19,271 | ||||||||||
| Exercisable at December 31, 2010 |
1,250 | $ | 17.03 | 7.96 | $ | 29 | ||||||||||
| (1) | In thousands. |
The weighted-average grant date fair value of options granted during the years 2010, 2009 and 2008 were $28.99, $16.77 and $53.67, respectively. The total intrinsic value of options exercised for the year ended December 31, 2010 was minimal. The compensation expense related to stock option awards is recognized on a straight-line basis over the four-year vesting period beginning on the date of grant. We recorded $4.3 million, $3.5 million and $2.0 million compensation expense for the years ended December 31, 2010, 2009 and 2008, respectively. As of December 31, 2010, we had $12.6 million of unrecognized compensation expense for non-vested stock options, which is expected to be recognized over a weighted average period of 3.08 years. As of December 31, 2010, there were 1,250 stock options outstanding and exercisable, which have an exercise price of $17.03.
HNS’ Bonus Unit Plan
In July 2005, HNS adopted an incentive bonus unit plan (the “Bonus Unit Plan”) pursuant to which 4.4 million bonus units representing approximately 4% of the increase in the value of HNS, as defined in the Bonus Unit Plan, were granted to certain of its employees. The bonus units provide for time vesting over five years and are subject to a participant’s continued employment with HNS. Pursuant to the Bonus Unit Plan, if participants are employed by HNS on the predetermined exchange dates, they are entitled to exchange their vested bonus units for shares of our common stock.
The first exchange occurred on July 15, 2008, when approximately 1.9 million bonus units were exchanged for 192,399 shares of our common stock. The number of our common stock shares to be issued upon each exchange is calculated based upon the fair market value of the vested bonus unit divided by the closing trading price of our common stock for the 20 business days immediately preceding the date of the exchange. The fair value of the bonus units on the grant date was approximately $1.2 million, after adjustment for a 13% estimated forfeiture rate, based on the estimated increase in the fair market value of HNS’ net equity at the time of the grant.
98
Table of Contents
HUGHES COMMUNICATIONS, INC.
NOTES TO THE CONSOLIDATED FINANCIAL STATEMENTS (CONTINUED)
On September 19, 2008, HNS issued 310,000 bonus units to certain of its employees pursuant to the terms of the Bonus Unit Plan. The fair value of the new issuance of bonus units was determined using a forward pricing model. The total estimated compensation expense for the new issuance of bonus units is $1.7 million, after adjustment for a 10% estimated forfeiture rate. Pursuant to ASC 718, we amortize the compensation expense of the Bonus Unit Plan over the vesting period beginning on the date of grant. For the years ended December 31, 2010, 2009 and 2008, we recognized compensation expense of $0.8 million, $0.8 million and $0.4 million, respectively. On July 15, 2010, the 2.1 million vested bonus units vested were exchanged for approximately 207,000 shares (net of income tax withholding) of our common stock pursuant to the Bonus Unit Plan. The remaining 300,000 bonus units will vest on July 15, 2011.
The following table summarizes changes in bonus units under the Bonus Unit Plan:
| Year Ended December 31, | ||||||||
| 2010 | 2009 | |||||||
| Non-vested beginning balance |
2,453,250 | 2,500,000 | ||||||
| Converted to HCI common shares |
(2,139,500 | ) | - | |||||
| Forfeited |
(13,750 | ) | (46,750 | ) | ||||
| Non-vested ending balance |
300,000 | 2,453,250 | ||||||
HNS Class B Membership Interests
HNS’ Class B membership interests were issued to certain members of our senior management, two of HNS’ former senior management and a member of our Board of Directors. The Class B membership interests are subject to certain vesting requirements, with 50% of the Class B membership interests subject to time vesting over five years and the other 50% vesting based upon certain performance criteria. At the holders’ election, vested Class B membership interests may be exchanged for our common stock. The number of shares of our common stock to be issued upon such exchange is based upon the fair market value of such vested Class B membership interest tendered for exchange divided by the average closing trading price of our common stock for the 20 business days immediately preceding the date of such exchange. As of December 31, 2010, 3,272 of the 3,280 outstanding Class B membership interests were vested. If the total outstanding Class B membership interests were to convert into our common stock as of December 31, 2010, they could be exchanged for approximately 646,000 shares of our common stock. On September 25, 2009, we registered 75,000 shares of our common stock with the SEC on Form S-8 to be issued, from time to time, upon the exchange of the Class B membership interests.
Pursuant to ASC 718 “Compensation—Stock Compensation,” HNS determined that the Class B membership interests had nominal value at the date of grant, and, accordingly, $0.1 million compensation expense was recorded for each of the years ended December 31, 2010, 2009 and 2008. A summary of changes in Class B membership interests is as follows:
| Year Ended December 31, | ||||||||
| 2010 | 2009 | |||||||
| Outstanding beginning balance |
3,330 | 3,656 | ||||||
| Converted to HCI common shares |
(50 | ) | (326 | ) | ||||
| Outstanding ending balance |
3,280 | 3,330 | ||||||
99
Table of Contents
HUGHES COMMUNICATIONS, INC.
NOTES TO THE CONSOLIDATED FINANCIAL STATEMENTS (CONTINUED)
LightSquared’s 1998 Long Term Incentive Plan
Pursuant to LightSquared’s 1998 Long Term Incentive Plan (the “LightSquared Plan”), the compensation committee of the Board of Directors of LightSquared was required to make an equitable adjustment to the terms of options issued under the LightSquared Plan in the event a special, large and nonrecurring dividend or distribution affects LightSquared’s common stock such that an adjustment is appropriate in order to prevent dilution or enlargement of the rights of the participants under the LightSquared Plan. LightSquared’s compensation committee has discretion to make such an adjustment to any option issued under the LightSquared Plan by adjusting the number and kind of shares that may be issued in respect of outstanding options or the exercise price relating to such options. Pursuant to this provision, LightSquared’s compensation committee determined that holders of stock options issued under the LightSquared Plan who were members of LightSquared’s management and Board of Directors as of the date of the distribution, when LightSquared separated us into a publicly traded company in 2006 (the “Distribution”), as well as a consultant and former directors who were involved with LightSquared’s acquisition of HNS, would receive an option to purchase one share of our common stock for each option to purchase two shares of LightSquared common stock that they held as of the date of the Distribution. The issuance of such options to purchase our common stock was in lieu of a larger adjustment to the exercise price of the LightSquared options that such holders would otherwise have been entitled to, had they not received options to purchase our common stock. A reduction in the exercise price (or in some cases, an increase in the number of shares) was the manner in which all other LightSquared options outstanding under the plan were adjusted. In February 2006, the Company issued options to purchase 435,836 shares of our common stock to holders of LightSquared options under the Plan.
The exercise price of such options to purchase shares of our common stock that were issued to certain holders of options to purchase LightSquared common stock was determined by multiplying the exercise price of such LightSquared option by a fraction, the numerator of which was the closing price of a share of our common stock on the first trading day after the Distribution date multiplied by the exchange ratio of 0.5 and the denominator of which was that price multiplied by the exchange ratio plus the closing price of a share of LightSquared common stock on the first trading day after the Distribution date and further dividing such result by the exchange ratio.
The fair value of each share or option, as applicable, was determined on the date of grant, except for shares of restricted stock issued to a consultant. In accordance with ASC 505-50, “Equity-Based Payments to Non-Employees”, the fair value of such shares is adjusted at the end of the reporting period, and accordingly, the fair value as of December 31, 2010 was used for determining compensation expense attributable to such shares.
The following table summarizes stock option activity and related information for the LightSquared Plan for the years ended December 31, 2010, 2009 and 2008:
| Number of Shares |
Weighted Average Exercise Price |
Aggregate Intrinsic Value* |
||||||||||
| Options outstanding & exercisable at January 1, 2008 |
65,834 | $ | 19.80 | $ | 2,292 | |||||||
| Exercised by holders of LightSquared options |
(3,334 | ) | $ | 22.53 | $ | - | ||||||
| Options outstanding & exercisable at December 31, 2008 |
62,500 | $ | 19.65 | $ | - | |||||||
| Options outstanding & exercisable at December 31, 2009 |
62,500 | $ | 19.65 | $ | 399 | |||||||
| Exercised by holders of LightSquared options |
(5,000 | ) | $ | 22.53 | $ | - | ||||||
| Options outstanding & exercisable at December 31, 2010 |
57,500 | $ | 19.40 | $ | 1,210 | |||||||
| * | In thousands. |
100
Table of Contents
HUGHES COMMUNICATIONS, INC.
NOTES TO THE CONSOLIDATED FINANCIAL STATEMENTS (CONTINUED)
The following table summarizes information about stock options that are outstanding and exercisable as of December 31, 2010:
| Stock Options Outstanding and Exercisable | ||||||||||||
| Range of Exercise Prices |
Number of Shares |
Weighted Average Exercise Price |
Weighted Average Remaining Life (Years) |
|||||||||
| $1.48 |
5,000 | $ | 1.48 | 3.13 | ||||||||
| $20.23 - $22.53 |
52,500 | $ | 21.11 | 4.30 | ||||||||
| 57,500 | $ | 19.40 | 4.20 | |||||||||
Note 17: Other Benefits
401(k) Plan
We have a 401(k) salary deferral program for eligible employees in the United States who have met certain service requirements. Eligible employees may contribute up to 25% (16% for highly compensated employees) of their eligible compensation into the plan on a pre-tax basis each payroll period, subject to a limit of $16,500 in 2010 per the IRS. Employee contributions are immediately vested. We will match 100% of employee contributions up to 3% of eligible compensation and 50% of employee contributions on up to an additional 6% of eligible compensation. Matching contributions are 100% vested after eligible employees have completed three years of service. During 2010, 2009 and 2008, we made $6.7 million, $6.9 million and $6.9 million, respectively, of matching contributions.
In addition, as allowed by the IRS, participants who are age 50 or older may make additional contributions (“catch-up contributions”), up to $5,500 in 2010, into the plan. The Company does not match the catch-up contributions. The plan also permits participants to make contributions on an after-tax basis.
Long-Term Cash Incentive Retention Program
In 2005, HNS established a one-time employee retention program (“Retention Program”), which was designed to retain certain employees chosen by HNS’ senior management. As a result of HNS successfully attaining 100% of its earnings goal for 2008, as defined in the Retention Program, HNS paid an aggregate of $14.7 million to eligible participants under the Retention Program in 2009, of which $13.2 million was accrued as of December 31, 2008. The Company has no further obligation associated with the Retention Program.
Note 18: Stockholders’ Equity
The Company is a publicly-traded company and is authorized to issue 64,000,000 shares of common stock, par value $0.001 per share. The Company is also authorized to issue 1,000,000 shares of preferred stock, par value $0.001 per share. The preferred stock can be issued in one or more classes or series, and the Board of Directors have the authority to establish voting rights, preferences, and other rights related to dividends, convertibility, redemptions and other limitations as may be permitted by the General Corporation Law of the State of Delaware. As of December 31, 2010, no class or series of preferred stock had been established by the Company’s Board of Directors.
101
Table of Contents
HUGHES COMMUNICATIONS, INC.
NOTES TO THE CONSOLIDATED FINANCIAL STATEMENTS (CONTINUED)
Note 19: Segment Data and Geographic Data
Set forth below is selected financial information for our operating segments (in thousands). There were no intersegment transactions in 2010, 2009 and 2008.
| North America Broadband |
International Broadband |
Telecom Systems |
HTS Satellite |
Corporate and Other |
Consolidated | |||||||||||||||||||
| As of or For the Year Ended December 31, 2010 | ||||||||||||||||||||||||
| Revenues |
$ | 733,750 | $ | 205,607 | $ | 95,069 | $ | 3,317 | $ | 5,584 | $ | 1,043,327 | ||||||||||||
| Operating income (loss) |
$ | 67,884 | $ | 10,571 | $ | 14,183 | $ | (3,350 | ) | $ | (3,664 | ) | $ | 85,624 | ||||||||||
| Depreciation and amortization |
$ | 111,743 | $ | 15,029 | $ | 4,182 | $ | - | $ | 632 | $ | 131,586 | ||||||||||||
| Assets |
$ | 633,775 | $ | 185,316 | $ | 44,252 | $ | 249,952 | $ | 249,880 | $ | 1,363,175 | ||||||||||||
| Capital expenditures(1) |
$ | 95,628 | $ | 10,295 | $ | 343 | $ | 180,741 | $ | 8,885 | $ | 295,892 | ||||||||||||
| As of or For the Year Ended December 31, 2009 | ||||||||||||||||||||||||
| Revenues |
$ | 690,279 | $ | 203,886 | $ | 112,500 | $ | - | $ | 3,034 | $ | 1,009,699 | ||||||||||||
| Operating income (loss)(2) |
$ | (7,991 | ) | $ | 15,120 | $ | 14,227 | $ | (37 | ) | $ | (9,007 | ) | $ | 12,312 | |||||||||
| Depreciation and amortization |
$ | 84,706 | $ | 13,355 | $ | 4,078 | $ | - | $ | 592 | $ | 102,731 | ||||||||||||
| Assets |
$ | 632,803 | $ | 184,461 | $ | 45,500 | $ | 66,596 | $ | 373,034 | $ | 1,302,394 | ||||||||||||
| Capital expenditures(1) |
$ | 95,556 | $ | 15,124 | $ | 1,213 | $ | 44,065 | $ | 7,578 | $ | 163,536 | ||||||||||||
| As of or For the Year Ended December 31, 2008 | ||||||||||||||||||||||||
| Revenues |
$ | 667,665 | $ | 237,188 | $ | 155,038 | $ | - | $ | 462 | $ | 1,060,353 | ||||||||||||
| Operating income (loss) |
$ | 21,339 | $ | 21,679 | $ | 25,116 | $ | - | $ | (3,842 | ) | $ | 64,292 | |||||||||||
| Depreciation and amortization |
$ | 55,868 | $ | 9,233 | $ | 3,836 | $ | - | $ | - | $ | 68,937 | ||||||||||||
| Assets |
$ | 648,603 | $ | 197,087 | $ | 64,727 | $ | - | $ | 279,976 | $ | 1,190,393 | ||||||||||||
| Capital expenditures(1) |
$ | 71,696 | $ | 11,188 | $ | 2,223 | $ | - | $ | 11,126 | $ | 96,233 | ||||||||||||
| (1) | Capital expenditures on an accrual basis were: $295.9 million, $190.5 million and $96.2 million for the years ended December 31, 2010, 2009 and 2008, respectively. |
| (2) | Operating loss for North America Broadband includes $44.4 million of impairment loss related to our prepaid deposit to Sea Launch, which was impaired in 2009. |
For the years ended December 31, 2010, 2009 and 2008, no single customer accounted for more than 10% of total revenues. Revenues by geographic area are summarized by customers’ locations as follows (in thousands):
| Year Ended December 31, | ||||||||||||
| 2010 | 2009 | 2008 | ||||||||||
| North America |
$ | 829,948 | $ | 801,808 | $ | 803,496 | ||||||
| Africa, Asia and the Middle East |
89,679 | 88,939 | 106,627 | |||||||||
| Europe |
62,607 | 69,430 | 115,495 | |||||||||
| South America and the Caribbean |
61,093 | 49,522 | 34,735 | |||||||||
| Total revenues |
$ | 1,043,327 | $ | 1,009,699 | $ | 1,060,353 | ||||||
102
Table of Contents
HUGHES COMMUNICATIONS, INC.
NOTES TO THE CONSOLIDATED FINANCIAL STATEMENTS (CONTINUED)
Individual countries with significant revenues for the three years ended December 31, 2010 are as follows (in thousands):
| Year Ended December 31, | ||||||||||||
| 2010 | 2009 | 2008 | ||||||||||
| United States |
$ | 800,327 | $ | 774,719 | $ | 785,349 | ||||||
| Brazil |
$ | 56,791 | $ | 42,167 | $ | 30,038 | ||||||
| India |
$ | 47,237 | $ | 39,294 | $ | 48,067 | ||||||
| United Kingdom |
$ | 21,457 | $ | 29,257 | $ | 66,555 | ||||||
| Total property, net by geographic area is summarized customers’ locations as follows (in thousands): |
||||||||||||
| December 31, | ||||||||||||
| 2010 | 2009 | |||||||||||
| North America: |
||||||||||||
| United States |
$ | 744,758 | $ | 573,755 | ||||||||
| Mexico |
5 | 55 | ||||||||||
| Total North America |
744,763 | 573,810 | ||||||||||
| South America and the Caribbean |
13,377 | 12,702 | ||||||||||
| Africa, Asia and the Middle East |
11,284 | 10,768 | ||||||||||
| Europe |
4,628 | 5,123 | ||||||||||
| Total property, net |
$ | 774,052 | $ | 602,403 | ||||||||
Note 20: Transactions with Related Parties
In the ordinary course of our operations, we enter into transactions with related parties to purchase and/or sell telecommunications services, equipment, and inventory. Related parties include all entities that are related to Apollo Management, L.P. and its affiliates (collectively “Apollo”), our controlling stockholder.
Separation Agreement
As part of the Distribution in 2006, LightSquared and the Company entered into a separation agreement (“Separation Agreement”). Among other things, the Separation Agreement provides for certain indemnifications, tax sharing, consulting services and access to facilities.
Indemnification—The Separation Agreement provides that the Company will indemnify LightSquared against losses based on, arising out of, or resulting from (i) the ownership or the operation of the assets or properties transferred to the Company under the Separation Agreement, and the operation or conduct of the business of, including contracts entered into and any activities engaged in by, the Company, whether in the past or future; (ii) any other activities the Company engages in; (iii) any guaranty or keep well of or by LightSquared provided to any parties with respect to any of the Company’s actual or contingent obligations; and (iv) certain other matters described in the Separation Agreement. The Separation Agreement provides that LightSquared will indemnify the Company against losses based on, arising out of, or resulting from the ownership or operation of the assets or properties of Mobile Satellite Ventures LP (“MSV”) and TerreStar Networks, Inc., (“TerreStar”) or the operation or conduct of their businesses, including the contracts entered into by them, and certain other matters described in the Separation Agreement.
103
Table of Contents
HUGHES COMMUNICATIONS, INC.
NOTES TO THE CONSOLIDATED FINANCIAL STATEMENTS (CONTINUED)
Tax sharing agreement—The tax sharing agreement governs the allocation between the Company and LightSquared of tax liabilities and related tax matters, such as the preparation and filing of tax returns and tax contests, for all taxable periods ended on or before February 21, 2006. The Company will generally be responsible for, and indemnify LightSquared and its subsidiaries against, all tax liabilities imposed on or attributable to (i) the Company and any of its subsidiaries relating to all taxable periods and (ii) LightSquared and any of its subsidiaries for all taxable periods or portions thereof ending on or prior to a change of control of LightSquared, in each case, after taking into account any tax attributes of LightSquared or any of its subsidiaries that are available to offset such tax liabilities. Notwithstanding the foregoing, the Company is not responsible for any taxes relating to MSV, TerreStar or a change of control of LightSquared. Additionally, under the tax sharing agreement, LightSquared is responsible for, and indemnifies the Company and its subsidiaries against, all tax liabilities imposed on or attributable to MSV and TerreStar relating to all taxable periods, LightSquared and any of its subsidiaries relating to all taxable periods or portions thereof beginning and ending after a change of control, and any change of control of LightSquared.
Hughes Telematics, Inc.
In July 2006, HNS granted a limited license to HTI allowing HTI to use the HUGHES trademark. The license is limited in that HTI may use the HUGHES trademark only in connection with its business of automotive telematics and only in combination with the TELEMATICS name. As partial consideration for the license, the agreement provides that HNS will be HTI’s preferred engineering services provider. The license is royalty-free, except that HTI has agreed to pay a royalty to HNS in the event HTI no longer has a commercial or affiliated relationship with HNS.
In October 2007, HNS entered into an agreement with HTI and a customer of HTI, whereby HNS agreed to assume the rights and performance obligations of HTI in the event that HTI fails to perform its obligations due to a fundamental cause such as bankruptcy or the cessation of its telematics business. In connection with that agreement, HNS and HTI have entered into a letter agreement pursuant to which HTI has agreed to take certain actions to enable HNS to assume HTI’s obligations in the event that such action is required. However, as a result of the Merger, as defined and described in Note 10—Other Assets, HNS’ obligations to HTI and its customer expired when HTI became a public company in March 2009 with an initial market capitalization value greater than $300.0 million. In January 2008, HNS entered into an agreement with HTI for the development of an automotive telematics system for HTI, comprising the telematics system hub and the Telematics Control Unit (“TCU”), which will serve as the user appliance in the telematics system.
In March 2009, we made an equity investment in HTI, which represented approximately 3.8% of HTI’s outstanding common stock. See Note 10—Other Assets for further discussion. In August 2009, HTI terminated substantially all of the development, engineering and manufacturing services with HNS as a result of the bankruptcy filing of one of HTI’s customers.
On December 18, 2009, HNS entered into a promissory note with HTI (“Promissory Note”) for $8.3 million of account receivables that HTI owed to HNS. The Promissory Note had a maturity date of December 31, 2010 and an interest rate of 12% per annum. On November 5, 2010, the Company revised the term of the Promissory Note to extend the maturity date to December 31, 2011. As of December 31, 2010, the remaining Promissory Note, including accrued interest, had a balance of $5.6 million. HNS expects to fully recover $5.6 million.
HTI is controlled by an affiliate of Apollo. Jeffrey A. Leddy, a member of HNS’ Board of Managers and our Board of Directors, is the CEO and a director of HTI and owns less than 1.5% of HTI’s equity as of December 31, 2010. In addition, Andrew Africk and Aaron Stone, members of HNS’ Board of Managers and our Board of Directors, are directors of HTI and partners of Apollo.
104
Table of Contents
HUGHES COMMUNICATIONS, INC.
NOTES TO THE CONSOLIDATED FINANCIAL STATEMENTS (CONTINUED)
Hughes Systique Corporation
HNS has contracted with Hughes Systique, an entity consolidated with the Company, for software development services. In addition to our 45.23% ownership in Hughes Systique, our CEO and President and his brother, who is the CEO and President of Hughes Systique and our former Executive Vice President, in the aggregate, owned approximately 25.61%, on an undiluted basis, of Hughes Systique’s outstanding shares as of December 31, 2010. Furthermore, our CEO and President and Jeffrey A. Leddy, a member of our Board of Directors and HNS’ Board of Managers, serve on the board of directors of Hughes Systique. As a result of the Termination Agreement, we are required to consolidate Hughes Systique’s results of operations in our operating results. For a description of additional transactions entered into between the Company and Hughes Systique, see Note 3—Consolidation of Hughes Systique Corporation.
Agreement with 95 West Co., Inc.
In July 2006, HNS entered into an agreement with 95 West Co. and its parent, MLH, pursuant to which 95 West Co. and MLH agreed to provide a series of coordination agreements which allow HNS to operate its SPACEWAY 3 at an orbital position where such parties have higher-priority rights. Jeffrey A. Leddy, a member of our Board of Directors and HNS’ Board of Managers, is the managing director of 95 West Co. and MLH and also owns a small interest in each. Andrew Africk, another member of our Board of Directors and HNS’ Board of Managers, is also a director of MLH. As part of the agreement, HNS agreed to pay $9.3 million, in annual installments of $0.3 million in 2006, $0.75 million in each year between 2007 and 2010 and $1.0 million in each year between 2011 and 2016 for the use of the orbital position, subject to conditions in the agreement including HNS’ ability to operate SPACEWAY 3. As of December 31, 2010, the remaining debt balance under the capital lease was $4.9 million, which was included in “Capital lease and other” in the short-term and long-term debt tables included in Note 12—Debt. During 2010, we paid $0.75 million to 95 West Co. pursuant to the agreement.
Smart & Final, Inc.
As of December 31, 2010, Apollo owned, directly or indirectly, 96% of Smart & Final, Inc. (“Smart & Final”). We provide broadband products and services to Smart & Final.
CKE Restaurants, Inc.
On July 12, 2010, an affiliate of Apollo acquired CKE Restaurants, Inc. (“CKE”). As a result, CKE indirectly became our related party as of that date. We provide broadband products and services to CKE.
Intelsat Holdings Limited
The Company and its subsidiaries lease satellite transponder capacity from Intelsat Holdings Limited (“Intelsat”). In addition, our Italian subsidiary, Hughes Network Systems, S.r.L., entered into a cooperation agreement with Intelsat, Telespazio and Telecom Italia. Under this agreement, the parties are cooperating to provide broadband satellite services for Italian businesses operating in Eastern Europe and North Africa. Effective February 4, 2008, Apollo divested its entire ownership interest in Intelsat, and as a result, Intelsat is no longer a related party.
105
Table of Contents
HUGHES COMMUNICATIONS, INC.
NOTES TO THE CONSOLIDATED FINANCIAL STATEMENTS (CONTINUED)
Other
Certain members of our Board of Directors and officers serve on the boards of directors of some of our affiliates. In some cases, such directors and officers have received stock-based compensation from such affiliates for their service. In those cases, the amount of stock-based compensation received by the directors and officers is comparable to stock-based compensation awarded to other non-executive members of the affiliates’ boards of directors.
Related Party Transactions
Sales and purchase transactions with related parties are as follows (in thousands):
| Year Ended December 31, | ||||||||||||
| 2010 | 2009 | 2008 | ||||||||||
| Sales: |
||||||||||||
| HTI |
$ | 501 | $ | 23,644 | $ | 31,065 | ||||||
| Others |
1,046 | 476 | 897 | |||||||||
| Total sales |
$ | 1,547 | $ | 24,120 | $ | 31,962 | ||||||
| Purchases: |
||||||||||||
| Hughes Systique(1) |
$ | - | $ | 1,591 | $ | 9,419 | ||||||
| 95 West Co. |
- | - | 750 | |||||||||
| Intelsat(2) |
- | - | 10,074 | |||||||||
| Total purchases |
$ | - | $ | 1,591 | $ | 20,243 | ||||||
| (1) | For the period after March 11, 2009, Hughes Systique’s results of operations are consolidated with the Company’s operating results. |
| (2) | Subsequent to February 4, 2008, Intelsat is no longer a related party. |
Assets resulting from transactions with related parties are as follows (in thousands):
| December 31, | ||||||||||||
| 2010 | 2009 | |||||||||||
| Due from related parties: |
||||||||||||
| HTI |
$ | 5,632 | $ | 8,652 | ||||||||
| Others |
159 | 52 | ||||||||||
| Total due from related parties |
$ | 5,791 | $ | 8,704 | ||||||||
Note 21: Net Income (loss) Attributable to HCI stockholders and Transfer from Noncontrolling Interests
| Year Ended December 31, | ||||||||||||
| 2010 | 2009 | 2008 | ||||||||||
| (In thousands) | ||||||||||||
| Net income (loss) attributable to HCI stockholders |
$ | 22,787 | $ | (52,693 | ) | $ | 9,018 | |||||
| Transfers from the noncontrolling interest: |
||||||||||||
| Decrease in HCI paid-in capital for purchase of subsidiary shares |
- | (396 | ) | - | ||||||||
| Change from net income (loss) attributable to |
||||||||||||
| HCI stockholders and transfers from the noncontrolling interest |
$ | 22,787 | $ | (53,089 | ) | $ | 9,018 | |||||
106
Table of Contents
HUGHES COMMUNICATIONS, INC.
NOTES TO THE CONSOLIDATED FINANCIAL STATEMENTS (CONTINUED)
Note 22: Commitments and Contingencies
Litigation
We are periodically involved in litigation in the ordinary course of our business involving claims regarding intellectual property infringement, product liability, property damage, personal injury, contracts, employment and worker’s compensation. We do not believe that there are any such pending or threatened legal proceedings, including ordinary litigation incidental to the conduct of our business and the ownership of our properties that, if adversely determined, would have a material adverse effect on our business, financial condition, results of operations or liquidity.
In October 2008, Hughes Telecommunicaçoes do Brasil Ltda. (“HTB”), a wholly-owned subsidiary of HNS, received a tax assessment of approximately $7.6 million from the State of São Paulo Treasury Department. The tax assessment alleges that HTB failed to pay certain import taxes to the State of São Paulo. Recent decrees and legislative actions by the State of São Paulo will alleviate approximately $4.8 million of the tax assessment over time with no impact to the Company. We do not believe the assessment is valid and plan to dispute the State of São Paulo’s claims and to defend vigorously against these allegations. Therefore, we have not recorded a liability. It is the opinion of management that such litigation is not expected to have a material adverse effect on our financial position, results of operations or cash flows.
In March 2009, an arbitration panel ruled in favor of HNS in its arbitration against Sea Launch Limited Partnership and Sea Launch Company, LLC (collectively, “Sea Launch”) entitling HNS to a full refund of $44.4 million (the “Deposit”) in payments made to Sea Launch in connection with launch services for SPACEWAY 3, in addition to interest of 10% per annum on the $44.4 million from July 10, 2007 until payment on the Deposit is received in full. On June 22, 2009, Sea Launch filed a voluntary petition to reorganize under Chapter 11 of the U.S. Bankruptcy Code in the U.S. Bankruptcy Court for the District of Delaware. As a result of this filing, our efforts to pursue collection of the arbitral award from Sea Launch were stayed under the bankruptcy laws. On May 27, 2010, HNS entered into a settlement agreement with Sea Launch to resolve the claim that HNS filed in the Sea Launch bankruptcy (the “Settlement Agreement”). The Settlement Agreement provides that Sea Launch will irrevocably issue to HNS two credits, each in the amount of $22.2 million (the “Credits”), in satisfaction and discharge of HNS’ bankruptcy claim. The Credits may be used by HNS to defray the cost of up to two launches contracted by December 31, 2015, and scheduled to occur by December 31, 2017. In addition, subject to the terms and conditions of the Settlement Agreement, one or both Credits may be transferred to third parties. The bankruptcy court has approved the Settlement Agreement, and its terms have been incorporated into the court’s order approving Sea Launch’s plan of reorganization. The Settlement Agreement became effective on October 27, 2010.
On May 18, 2009, the Company and HNS received notice of a complaint filed in the U.S. District Court for the Northern District of California by two California subscribers to the HughesNet service. The plaintiffs complain about the speed of the HughesNet service, the Fair Access Policy, early termination fees and certain terms and conditions of the HughesNet subscriber agreement. The plaintiffs seek to pursue their claims as a class action on behalf of other California subscribers. On June 4, 2009, the Company and HNS received notice of a similar complaint filed by another HughesNet subscriber in the Superior Court of San Diego County, California. The plaintiff in this case also seeks to pursue his claims as a class action on behalf of other California subscribers. Both cases have been consolidated into a single case in the U.S. District Court for the Northern District of California. In January 2011, the Company agreed to settle this consolidated case on a nationwide basis, subject to court approval. As a result, the Company has accrued $1.9 million for estimated settlement costs, plaintiffs’ attorney fees and other related expenses. In the event that the settlement is not effectuated, the
107
Table of Contents
HUGHES COMMUNICATIONS, INC.
NOTES TO THE CONSOLIDATED FINANCIAL STATEMENTS (CONTINUED)
Company would revert to its previous position of vigorously defending these matters as it believes that the allegations in these complaints are not meritorious.
On December 18, 2009, the Company and HNS received notice of a complaint filed in the Cook County, Illinois, Circuit Court by a former subscriber to the HughesNet service. The complaint seeks a declaration allowing the former subscriber to file a class arbitration challenging early termination fees under the subscriber agreement. The Company was dismissed from this case in September 2010, while HNS remains a defendant. HNS’s motion to dismiss, filed in September 2010, is pending, and HNS will continue to vigorously defend the case.
Some or all of the Company, its Directors, EchoStar Corporation, EchoStar Satellite Services, L.L.C. (“EchoStar LLC”), Broadband Acquisition Corporation (“Merger Sub”), and Apollo Global Management, LLC (“AGM”) have been named as defendants in four shareholder class action lawsuits in connection with the proposed transaction in which EchoStar will acquire all of the outstanding equity of HCI and its subsidiaries. See Note 25—Subsequent Events for further discussion. On February 18, 2011, the Gottlieb Family Foundation filed its class action complaint in the Circuit Court for Montgomery County, Maryland. On February 23, 2011, Plymouth County Retirement System filed its shareholder class action complaint in the Court of Chancery of the State of Delaware. On February 24, 2011, Edward Ostensoe filed a shareholder class action complaint in the Circuit Court for Montgomery County, Maryland. On February 28, 2011, Nina J. Shah Rohrbasser Irr. Trust filed a shareholder class action complaint in the Court of Chancery of the State of Delaware. Each complaint alleges that the directors of the Company breached their fiduciary duties in agreeing to the transaction. The complaints also allege that some or all of the Company, EchoStar, EchoStar LLC, Merger Sub and AGM aided and abetted such breaches by the directors of the Company. In each case, the Plaintiffs seek to enjoin the proposed transaction and/or damages, costs, and attorney fees. The Company believes that the allegations in all of these complaints are not meritorious and we intend to vigorously defend these matters.
Product Warranties
We warrant our hardware products over 12 months, depending on the products sold, following the date of installation. A large portion of our enterprise customers enter into maintenance agreements under which we recognize revenue for providing maintenance services that prolong the life and effectiveness of the installed hardware, thus minimizing the potential for warranty claims or repairs. Warranty reserves are determined based on historical warranty repair experience and an assessment of the number of units remaining under warranty coverage. Long-term contracts for the sale of wireless communications systems may include contractual provisions relating to warranty coverage for fixed terms generally not exceeding five years. Warranty provisions for these contracts are included in the determination of overall contract costs and earnings, based on management’s estimates of the cost of the related coverage. Accrued contract warranty costs are reviewed and adjusted, as appropriate, over the term of the contractual warranty period.
Changes in accrued warranty costs were as follows (in thousands):
| December 31, | ||||||||
| 2010 | 2009 | |||||||
| Balance beginning of period |
$ | 1,943 | $ | 3,909 | ||||
| Warranty costs accrual |
342 | 2,372 | ||||||
| Warranty costs incurred |
(567 | ) | (4,338 | ) | ||||
| Balance at end of period |
$ | 1,718 | $ | 1,943 | ||||
108
Table of Contents
HUGHES COMMUNICATIONS, INC.
NOTES TO THE CONSOLIDATED FINANCIAL STATEMENTS (CONTINUED)
Leases
We have non-cancelable operating leases having lease terms in excess of one year, primarily for real property. Future minimum payments under such leases at December 31, 2010 are as follows (in thousands):
| Amount | ||||
| Year ending December 31, |
||||
| 2011 |
$ | 13,071 | ||
| 2012 |
10,956 | |||
| 2013 |
7,347 | |||
| 2014 |
5,705 | |||
| 2015 |
3,017 | |||
| Thereafter |
4,097 | |||
| Total minimum lease payments |
$ | 44,193 | ||
Rental expenses under operating leases, net of sublease income, were $15.3 million, $14.4 million and $12.8 million for the years ended December 31, 2010, 2009 and 2008, respectively. The total of minimum rentals to be received in the future under non-cancelable subleases as of December 31, 2010 was $0.1 million.
We have non-cancelable vendor obligations for acquisition of transponder capacity. Future minimum payments under such obligations at December 31, 2010 are as follows (in thousands):
| Amount | ||||
| Year ending December 31, |
||||
| 2011 |
$ | 119,466 | ||
| 2012 |
67,483 | |||
| 2013 |
49,846 | |||
| 2014 |
35,685 | |||
| 2015 |
28,337 | |||
| Thereafter |
11,947 | |||
| Total minimum lease payments |
$ | 312,764 | ||
Rental expenses under operating leases for transponder capacity were $172.6 million, $180.9 million and $193.3 million for the years ended December 31, 2010, 2009 and 2008, respectively.
Commitments
In June 2009, HNS entered into an agreement with SS/L for the construction of Jupiter and has agreed to make installment payments to SS/L upon the completion of each milestone as set forth in the agreement. HNS entered into a contract with Barrett Xplore Inc. (“Barrett”), whereby Barrett agreed to lease user beams and purchase gateways and Ka-band terminals for the Jupiter satellite that are designed to operate in Canada. In April 2010, HNS entered into an agreement with Arianespace for the launch of Jupiter in the first half of 2012. Pursuant to the agreement, the Ariane 5 will launch Jupiter into geosynchronous transfer orbit from Guiana Space Centre in Kourou, French Guiana. As of December 31, 2010, our remaining obligation for the construction and launch of Jupiter was approximately $210.8 million.
109
Table of Contents
HUGHES COMMUNICATIONS, INC.
NOTES TO THE CONSOLIDATED FINANCIAL STATEMENTS (CONTINUED)
We are contingently liable under standby letters of credit and bonds in the aggregate amount of $16.2 million that were undrawn as of December 31, 2010. Of this amount, $4.4 million was issued under the Revolving Credit Facility; $0.7 million was secured by restricted cash; $1.1 million related to insurance bonds; and $10.0 million was issued under credit arrangements available to our Indian and Brazilian subsidiaries. Certain letters of credit issued by our foreign subsidiaries are secured by certain assets. As of December 31, 2010, these obligations were scheduled to expire as follows: $13.5 million in 2011; $1.0 million in 2012; $0.4 million in 2013; and $1.3 million in 2014 and thereafter.
Note 23: Supplemental Guarantor and Non-Guarantor Financial Information
On August 8, 2007, the Company filed a shelf registration statement on Form S-3, as amended on November 15, 2007, to register shares of our common stock, preferred stock, and warrants and debt securities and non-convertible debt securities of HNS and HNS Finance Corp., a finance subsidiary which is HNS’s wholly-owned subsidiary (the “Co-Issuer”), as co issuers. In connection with any future issuance of debt securities of HNS and the Co-Issuer, we will, and one or more of our other subsidiaries may, on a joint and several basis, offer full and unconditional guarantees of the obligations of HNS and the Co-Issuer, under such debt securities. The registration statement was declared effective by the Securities and Exchange Commission on November 19, 2007 and expired on November 19, 2010.
In lieu of providing separate audited financial statements of HNS, the Co-Issuer and HNS’ guarantor subsidiaries, condensed financial statements prepared in accordance with Rule 3-10 and Rule 5-04 of Regulation S-X are presented below. The column marked “Parent” represents our results of operations, with the subsidiaries accounted for using the equity method. The column marked “Subsidiary Issuer” represents the results of HNS. The column marked “Guarantor Subsidiaries” includes the results of HNS’ guarantor subsidiaries and the Co-Issuer, which is a co-issuer of HNS’ Senior Notes and which had no assets, operations, revenues or cash flows for the periods presented. The column marked “Non-Guarantor Subsidiaries” includes the results of non-guarantor subsidiaries of the Company and HNS. Eliminations necessary to arrive at the information for the Company on a consolidated basis for the periods presented are included in the column so labeled. Separate financial statements and other disclosures concerning the Co-Issuer and HNS’ Guarantor Subsidiaries are not presented because management has determined that they are not material to investors.
110
Table of Contents
HUGHES COMMUNICATIONS, INC.
NOTES TO THE CONSOLIDATED FINANCIAL STATEMENTS (CONTINUED)
The following represents the supplemental condensed financial statements of the Company, HNS, the Guarantor Subsidiaries and the Non-guarantor Subsidiaries. These condensed financial statements should be read in conjunction with our consolidated financial statements and notes thereto. In 2010, the Company liquidated one of its wholly-owned non-guarantor subsidiaries. As a result, certain prior period items in the following supplemental condensed financial statements have been reclassified to conform to the current period presentation.
Condensed Consolidated Balance Sheet as of December 31, 2010
(In thousands)
| Parent | Subsidiary Issuer |
Guarantor Subsidiaries |
Non-Guarantor Subsidiaries |
Eliminations | Total | |||||||||||||||||||
| Assets |
||||||||||||||||||||||||
| Cash and cash equivalents |
$ | 56,583 | $ | 67,707 | $ | 256 | $ | 13,585 | $ | - | $ | 138,131 | ||||||||||||
| Marketable securities |
37,857 | 6,675 | - | - | - | 44,532 | ||||||||||||||||||
| Receivables, net |
9,437 | 141,422 | 38 | 61,067 | (25,272 | ) | 186,692 | |||||||||||||||||
| Inventories |
- | 45,388 | - | 12,431 | - | 57,819 | ||||||||||||||||||
| Prepaid expenses and other |
181 | 9,172 | 70 | 16,704 | - | 26,127 | ||||||||||||||||||
| Total current assets |
104,058 | 270,364 | 364 | 103,787 | (25,272 | ) | 453,301 | |||||||||||||||||
| Property, net |
- | 713,007 | 32,948 | 28,097 | - | 774,052 | ||||||||||||||||||
| Investment in subsidiaries |
221,665 | 118,080 | - | - | (339,745 | ) | - | |||||||||||||||||
| Other assets |
7,404 | 98,967 | 1,405 | 29,746 | (1,700 | ) | 135,822 | |||||||||||||||||
| Total assets |
$ | 333,127 | $ | 1,200,418 | $ | 34,717 | $ | 161,630 | $ | (366,717 | ) | $ | 1,363,175 | |||||||||||
| Liabilities and equity |
||||||||||||||||||||||||
| Accounts payable |
$ | 681 | $ | 101,684 | $ | 199 | $ | 36,764 | $ | (19,126 | ) | $ | 120,202 | |||||||||||
| Short-term debt |
- | 2,284 | - | 4,001 | - | 6,285 | ||||||||||||||||||
| Accrued liabilities and other |
756 | 109,561 | - | 24,619 | (6,146 | ) | 128,790 | |||||||||||||||||
| Total current liabilities |
1,437 | 213,529 | 199 | 65,384 | (25,272 | ) | 255,277 | |||||||||||||||||
| Long-term debt |
- | 737,677 | - | 2,899 | - | 740,576 | ||||||||||||||||||
| Other long-term liabilities |
- | 27,308 | - | 1,700 | (1,700 | ) | 27,308 | |||||||||||||||||
| Total HCI stockholders’ equity |
329,050 | 221,904 | 26,194 | 91,647 | (339,745 | ) | 329,050 | |||||||||||||||||
| Noncontrolling interests |
2,640 | - | 8,324 | - | - | 10,964 | ||||||||||||||||||
| Total liabilities and equity |
$ | 333,127 | $ | 1,200,418 | $ | 34,717 | $ | 161,630 | $ | (366,717 | ) | $ | 1,363,175 | |||||||||||
111
Table of Contents
HUGHES COMMUNICATIONS, INC.
NOTES TO THE CONSOLIDATED FINANCIAL STATEMENTS (CONTINUED)
Condensed Consolidated Balance Sheet as of December 31, 2009
(In thousands)
| Parent | Subsidiary Issuer |
Guarantor Subsidiaries |
Non-Guarantor Subsidiaries |
Eliminations | Total | |||||||||||||||||||
| Assets |
||||||||||||||||||||||||
| Cash and cash equivalents |
$ | 74,825 | $ | 173,991 | $ | 1,091 | $ | 11,131 | $ | - | $ | 261,038 | ||||||||||||
| Marketable securities |
16,062 | 31,126 | - | - | - | 47,188 | ||||||||||||||||||
| Receivables, net |
7,888 | 115,948 | 628 | 63,405 | (24,053 | ) | 163,816 | |||||||||||||||||
| Inventories |
- | 47,437 | 138 | 12,669 | - | 60,244 | ||||||||||||||||||
| Prepaid expenses and other |
264 | 7,421 | 234 | 14,557 | - | 22,476 | ||||||||||||||||||
| Total current assets |
99,039 | 375,923 | 2,091 | 101,762 | (24,053 | ) | 554,762 | |||||||||||||||||
| Property, net |
- | 542,642 | 32,792 | 26,969 | - | 602,403 | ||||||||||||||||||
| Investment in subsidiaries |
200,687 | 115,136 | - | - | (315,823 | ) | - | |||||||||||||||||
| Other assets |
8,903 | 102,045 | 3,221 | 32,663 | (1,603 | ) | 145,229 | |||||||||||||||||
| Total assets |
$ | 308,629 | $ | 1,135,746 | $ | 38,104 | $ | 161,394 | $ | (341,479 | ) | $ | 1,302,394 | |||||||||||
| Liabilities and equity |
||||||||||||||||||||||||
| Accounts payable |
$ | 753 | $ | 97,114 | $ | 2,272 | $ | 39,122 | $ | (19,800 | ) | $ | 119,461 | |||||||||||
| Short-term debt |
- | 2,054 | - | 4,696 | - | 6,750 | ||||||||||||||||||
| Accrued liabilities and other |
701 | 110,088 | 714 | 24,524 | (4,253 | ) | 131,774 | |||||||||||||||||
| Total current liabilities |
1,454 | 209,256 | 2,986 | 68,342 | (24,053 | ) | 257,985 | |||||||||||||||||
| Long-term debt |
- | 710,259 | - | 4,698 | - | 714,957 | ||||||||||||||||||
| Other long-term liabilities |
- | 16,191 | - | 1,768 | (1,603 | ) | 16,356 | |||||||||||||||||
| Total HCI stockholders’ equity |
304,041 | 200,040 | 29,197 | 86,586 | (315,823 | ) | 304,041 | |||||||||||||||||
| Noncontrolling interests |
3,134 | - | 5,921 | - | - | 9,055 | ||||||||||||||||||
| Total liabilities and equity |
$ | 308,629 | $ | 1,135,746 | $ | 38,104 | $ | 161,394 | $ | (341,479 | ) | $ | 1,302,394 | |||||||||||
112
Table of Contents
HUGHES COMMUNICATIONS, INC.
NOTES TO THE CONSOLIDATED FINANCIAL STATEMENTS (CONTINUED)
Condensed Consolidated Statement of Operations for the Year Ended December 31, 2010
(In thousands)
| Parent | Subsidiary Issuer |
Guarantor Subsidiaries |
Non-Guarantor Subsidiaries |
Eliminations | Total | |||||||||||||||||||
| Revenues |
$ | 902 | $ | 907,682 | $ | 1,911 | $ | 164,187 | $ | (31,355 | ) | $ | 1,043,327 | |||||||||||
| Operating costs and expenses: |
||||||||||||||||||||||||
| Costs of revenues |
- | 635,057 | 306 | 120,871 | (28,406 | ) | 727,828 | |||||||||||||||||
| Selling, general and administrative |
3,834 | 168,742 | 3,641 | 33,244 | (2,949 | ) | 206,512 | |||||||||||||||||
| Research and development |
- | 19,824 | 455 | - | - | 20,279 | ||||||||||||||||||
| Amortization of intangible assets |
- | 2,582 | 168 | 334 | - | 3,084 | ||||||||||||||||||
| Total operating costs and expenses |
3,834 | 826,205 | 4,570 | 154,449 | (31,355 | ) | 957,703 | |||||||||||||||||
| Operating income (loss) |
(2,932 | ) | 81,477 | (2,659 | ) | 9,738 | - | 85,624 | ||||||||||||||||
| Other income (expense): |
||||||||||||||||||||||||
| Interest expense |
- | (58,098 | ) | - | (1,497 | ) | 250 | (59,345 | ) | |||||||||||||||
| Interest and other income, net |
729 | 625 | 870 | 443 | (250 | ) | 2,417 | |||||||||||||||||
| Equity in earnings of subsidiaries |
24,558 | 2,252 | - | - | (26,810 | ) | - | |||||||||||||||||
| Income (loss) before income tax expense |
22,355 | 26,256 | (1,789 | ) | 8,684 | (26,810 | ) | 28,696 | ||||||||||||||||
| Income tax expense |
(25 | ) | (863 | ) | - | (4,828 | ) | - | (5,716 | ) | ||||||||||||||
| Net income (loss) |
22,330 | 25,393 | (1,789 | ) | 3,856 | (26,810 | ) | 22,980 | ||||||||||||||||
| Net (income) loss attributable to noncontrolling interests |
457 | - | (1,214 | ) | 564 | - | (193 | ) | ||||||||||||||||
| Net income (loss) attributable to HCI stockholders |
$ | 22,787 | $ | 25,393 | $ | (3,003 | ) | $ | 4,420 | $ | (26,810 | ) | $ | 22,787 | ||||||||||
113
Table of Contents
HUGHES COMMUNICATIONS, INC.
NOTES TO THE CONSOLIDATED FINANCIAL STATEMENTS (CONTINUED)
Condensed Consolidated Statement of Operations for the Year Ended December 31, 2009
(In thousands)
| Parent | Subsidiary Issuer |
Guarantor Subsidiaries |
Non-Guarantor Subsidiaries |
Eliminations | Total | |||||||||||||||||||
| Revenues |
$ | 600 | $ | 873,794 | $ | 9,680 | $ | 158,719 | $ | (33,094 | ) | $ | 1,009,699 | |||||||||||
| Operating costs and expenses: |
||||||||||||||||||||||||
| Costs of revenues |
- | 644,750 | 5,281 | 117,810 | (29,521 | ) | 738,320 | |||||||||||||||||
| Selling, general and administrative |
3,879 | 147,793 | 5,173 | 27,403 | (3,573 | ) | 180,675 | |||||||||||||||||
| Loss on impairments |
6,239 | 44,400 | - | - | - | 50,639 | ||||||||||||||||||
| Research and development |
- | 19,574 | 2,722 | - | - | 22,296 | ||||||||||||||||||
| Amortization of intangible assets |
- | 4,038 | 1,126 | 293 | - | 5,457 | ||||||||||||||||||
| Total operating costs and expenses |
10,118 | 860,555 | 14,302 | 145,506 | (33,094 | ) | 997,387 | |||||||||||||||||
| Operating income (loss) |
(9,518 | ) | 13,239 | (4,622 | ) | 13,213 | - | 12,312 | ||||||||||||||||
| Other income (expense): |
||||||||||||||||||||||||
| Interest expense |
- | (62,972 | ) | - | (1,344 | ) | 197 | (64,119 | ) | |||||||||||||||
| Interest and other income, net |
987 | 1,541 | - | 275 | (197 | ) | 2,606 | |||||||||||||||||
| Equity in earnings (losses) of subsidiaries |
(44,466 | ) | 4,033 | - | - | 40,433 | - | |||||||||||||||||
| Income (loss) before income tax (expense) benefit |
(52,997 | ) | (44,159 | ) | (4,622 | ) | 12,144 | 40,433 | (49,201 | ) | ||||||||||||||
| Income tax (expense) benefit |
2 | (746 | ) | - | (1,702 | ) | - | (2,446 | ) | |||||||||||||||
| Net income (loss) |
(52,995 | ) | (44,905 | ) | (4,622 | ) | 10,442 | 40,433 | (51,647 | ) | ||||||||||||||
| Net (income) loss attributable to noncontrolling interests |
302 | - | (1,842 | ) | 494 | - | (1,046 | ) | ||||||||||||||||
| Net income (loss) attributable to HCI stockholders |
$ | (52,693 | ) | $ | (44,905 | ) | $ | (6,464 | ) | $ | 10,936 | $ | 40,433 | $ | (52,693 | ) | ||||||||
114
Table of Contents
HUGHES COMMUNICATIONS, INC.
NOTES TO THE CONSOLIDATED FINANCIAL STATEMENTS (CONTINUED)
Condensed Consolidated Statement of Operations for the Year Ended December 31, 2008
(In thousands)
| Parent | Subsidiary Issuer |
Guarantor Subsidiaries |
Non-Guarantor Subsidiaries |
Eliminations | Total | |||||||||||||||||||
| Revenues |
$ | 462 | $ | 894,885 | $ | 13,873 | $ | 186,728 | $ | (35,595 | ) | $ | 1,060,353 | |||||||||||
| Operating costs and expenses: |
||||||||||||||||||||||||
| Costs of revenues |
24 | 676,339 | 5,878 | 134,476 | (31,756 | ) | 784,961 | |||||||||||||||||
| Selling, general and administrative |
4,280 | 140,747 | 5,533 | 31,127 | (3,839 | ) | 177,848 | |||||||||||||||||
| Research and development |
- | 23,931 | 2,902 | - | - | 26,833 | ||||||||||||||||||
| Amortization of intangible assets |
- | 5,387 | 1,032 | - | - | 6,419 | ||||||||||||||||||
| Total operating costs and expenses |
4,304 | 846,404 | 15,345 | 165,603 | (35,595 | ) | 996,061 | |||||||||||||||||
| Operating income (loss) |
(3,842 | ) | 48,481 | (1,472 | ) | 21,125 | - | 64,292 | ||||||||||||||||
| Other income (expense): |
||||||||||||||||||||||||
| Interest expense |
(2 | ) | (49,898 | ) | - | (1,429 | ) | 2 | (51,327 | ) | ||||||||||||||
| Interest and other income, net |
802 | 2,448 | - | 708 | (2 | ) | 3,956 | |||||||||||||||||
| Equity in earnings of subsidiaries |
12,096 | 11,988 | - | - | (24,084 | ) | - | |||||||||||||||||
| Income (loss) before income tax expense |
9,054 | 13,019 | (1,472 | ) | 20,404 | (24,084 | ) | 16,921 | ||||||||||||||||
| Income tax expense |
(5 | ) | (923 | ) | - | (6,665 | ) | - | (7,593 | ) | ||||||||||||||
| Net income (loss) |
9,049 | 12,096 | (1,472 | ) | 13,739 | (24,084 | ) | 9,328 | ||||||||||||||||
| Net (income) loss attributable to noncontrolling interests |
(31 | ) | - | (381 | ) | 102 | - | (310 | ) | |||||||||||||||
| Net income (loss) attributable to HCI stockholders |
$ | 9,018 | $ | 12,096 | $ | (1,853 | ) | $ | 13,841 | $ | (24,084 | ) | $ | 9,018 | ||||||||||
115
Table of Contents
HUGHES COMMUNICATIONS, INC.
NOTES TO THE CONSOLIDATED FINANCIAL STATEMENTS (CONTINUED)
Condensed Consolidated Statement of Cash Flows for the Year Ended December 31, 2010
(In thousands)
| Parent | Subsidiary Issuer |
Guarantor Subsidiaries |
Non-Guarantor Subsidiaries |
Eliminations | Total | |||||||||||||||||||
| Cash flows from operating activities: |
||||||||||||||||||||||||
| Net income (loss) |
$ | 22,330 | $ | 25,393 | $ | (1,789 | ) | $ | 3,856 | $ | (26,810 | ) | $ | 22,980 | ||||||||||
| Adjustments to reconcile net income (loss) to net cash flows from operating activities |
(19,275 | ) | 107,216 | 3,036 | 7,954 | 26,810 | 125,741 | |||||||||||||||||
| Net cash provided by operating activities |
3,055 | 132,609 | 1,247 | 11,810 | - | 148,721 | ||||||||||||||||||
| Cash flows from investing activities: |
||||||||||||||||||||||||
| Change in restricted cash |
- | 1,103 | - | 108 | - | 1,211 | ||||||||||||||||||
| Purchases of marketable securities |
(76,412 | ) | (29,280 | ) | - | - | - | (105,692 | ) | |||||||||||||||
| Proceeds from sales of marketable securities |
54,596 | 53,693 | - | - | - | 108,289 | ||||||||||||||||||
| Expenditures for property |
- | (271,863 | ) | (2,082 | ) | (8,874 | ) | - | (282,819 | ) | ||||||||||||||
| Expenditures for capitalized software |
- | (13,073 | ) | - | - | - | (13,073 | ) | ||||||||||||||||
| Proceeds from sales of property |
- | 19 | - | 186 | - | 205 | ||||||||||||||||||
| Other, net |
385 | - | - | 1,462 | - | 1,847 | ||||||||||||||||||
| Net cash used in investing activities |
(21,431 | ) | (259,401 | ) | (2,082 | ) | (7,118 | ) | - | (290,032 | ) | |||||||||||||
| Cash flows from financing activities: |
||||||||||||||||||||||||
| Short-term revolver borrowings |
- | - | - | 4,761 | - | 4,761 | ||||||||||||||||||
| Repayments of revolver borrowings |
- | - | - | (5,347 | ) | - | (5,347 | ) | ||||||||||||||||
| Proceeds from exercise of stock options |
134 | - | - | - | - | 134 | ||||||||||||||||||
| Long-term debt borrowings |
- | 29,702 | - | 1,900 | - | 31,602 | ||||||||||||||||||
| Repayment of long-term debt |
- | (2,054 | ) | - | (4,198 | ) | - | (6,252 | ) | |||||||||||||||
| Debt issuance costs |
- | (7,140 | ) | - | - | - | (7,140 | ) | ||||||||||||||||
| Net cash provided by (used in) financing activities |
134 | 20,508 | - | (2,884 | ) | - | 17,758 | |||||||||||||||||
| Effect of exchange rate changes on cash and cash equivalents |
- | - | - | 646 | - | 646 | ||||||||||||||||||
| Net decrease in cash and cash equivalents |
(18,242 | ) | (106,284 | ) | (835 | ) | 2,454 | - | (122,907 | ) | ||||||||||||||
| Cash and cash equivalents at beginning of period |
74,825 | 173,991 | 1,091 | 11,131 | - | 261,038 | ||||||||||||||||||
| Cash and cash equivalents at end of period |
$ | 56,583 | $ | 67,707 | $ | 256 | $ | 13,585 | $ | - | $ | 138,131 | ||||||||||||
116
Table of Contents
HUGHES COMMUNICATIONS, INC.
NOTES TO THE CONSOLIDATED FINANCIAL STATEMENTS (CONTINUED)
Condensed Consolidated Statement of Cash Flows for the Year Ended December 31, 2009
(In thousands)
| Parent | Subsidiary Issuer |
Guarantor Subsidiaries |
Non-Guarantor Subsidiaries |
Eliminations | Total | |||||||||||||||||||
| Cash flows from operating activities: |
||||||||||||||||||||||||
| Net income (loss) |
$ | (52,995 | ) | $ | (44,905 | ) | $ | (4,622 | ) | $ | 10,442 | $ | 40,433 | $ | (51,647 | ) | ||||||||
| Adjustments to reconcile net income (loss) to net cash flows from operating activities |
40,051 | 202,417 | 8,534 | (7,540 | ) | (40,433 | ) | 203,029 | ||||||||||||||||
| Net cash provided by (used in) operating activities |
(12,944 | ) | 157,512 | 3,912 | 2,902 | - | 151,382 | |||||||||||||||||
| Cash flows from investing activities: |
||||||||||||||||||||||||
| Change in restricted cash |
331 | (1 | ) | - | (107 | ) | - | 223 | ||||||||||||||||
| Purchases of marketable securities |
(21,038 | ) | (41,080 | ) | - | - | - | (62,118 | ) | |||||||||||||||
| Proceeds from sales of marketable securities |
5,000 | 10,000 | - | - | - | 15,000 | ||||||||||||||||||
| Expenditures for property |
- | (133,746 | ) | (4,837 | ) | (12,181 | ) | - | (150,764 | ) | ||||||||||||||
| Expenditures for capitalized software |
- | (12,772 | ) | - | - | - | (12,772 | ) | ||||||||||||||||
| Proceeds from sales of property |
- | 14 | 3 | 380 | - | 397 | ||||||||||||||||||
| Cash acquired, consolidation of Hughes Systique |
- | - | - | 828 | - | 828 | ||||||||||||||||||
| Long-term loan receivable |
- | (10,000 | ) | - | - | - | (10,000 | ) | ||||||||||||||||
| Other, net |
(75 | ) | (410 | ) | - | (345 | ) | - | (830 | ) | ||||||||||||||
| Net cash used in investing activities |
(15,782 | ) | (187,995 | ) | (4,834 | ) | (11,425 | ) | - | (220,036 | ) | |||||||||||||
| Cash flows from financing activities: |
||||||||||||||||||||||||
| Short-term revolver borrowings |
- | - | - | 6,791 | - | 6,791 | ||||||||||||||||||
| Repayments of revolver borrowings |
- | - | - | (7,861 | ) | - | (7,861 | ) | ||||||||||||||||
| Long-term debt borrowings |
- | 138,024 | - | 9,825 | - | 147,849 | ||||||||||||||||||
| Repayment of long-term debt |
- | (4,894 | ) | - | (7,483 | ) | - | (12,377 | ) | |||||||||||||||
| Debt issuance costs |
- | (4,612 | ) | - | - | - | (4,612 | ) | ||||||||||||||||
| Net cash provided by financing activities |
- | 128,518 | - | 1,272 | - | 129,790 | ||||||||||||||||||
| Effect of exchange rate changes on cash and cash equivalents |
- | - | - | (3,914 | ) | - | (3,914 | ) | ||||||||||||||||
| Net increase (decrease) in cash and cash equivalents |
(28,726 | ) | 98,035 | (922 | ) | (11,165 | ) | - | 57,222 | |||||||||||||||
| Cash and cash equivalents at beginning of period |
103,551 | 75,956 | 2,013 | 22,296 | - | 203,816 | ||||||||||||||||||
| Cash and cash equivalents at end of period |
$ | 74,825 | $ | 173,991 | $ | 1,091 | $ | 11,131 | $ | - | $ | 261,038 | ||||||||||||
117
Table of Contents
HUGHES COMMUNICATIONS, INC.
NOTES TO THE CONSOLIDATED FINANCIAL STATEMENTS (CONTINUED)
Condensed Consolidated Statement of Cash Flows for the Year Ended December 31, 2008
(In thousands)
| Parent | Subsidiary Issuer |
Guarantor Subsidiaries |
Non-Guarantor Subsidiaries |
Eliminations | Total | |||||||||||||||||||
| Cash flows from operating activities: |
||||||||||||||||||||||||
| Net income (loss) |
$ | 9,049 | $ | 12,096 | $ | (1,472 | ) | $ | 13,739 | $ | (24,084 | ) | $ | 9,328 | ||||||||||
| Adjustments to reconcile net income (loss) to net cash flows from operating activities |
(7,509 | ) | 40,452 | 8,174 | (2,826 | ) | 24,084 | 62,375 | ||||||||||||||||
| Net cash provided by operating activities |
1,540 | 52,548 | 6,702 | 10,913 | - | 71,703 | ||||||||||||||||||
| Cash flows from investing activities: |
||||||||||||||||||||||||
| Change in restricted cash |
- | 3,577 | - | (473 | ) | - | 3,104 | |||||||||||||||||
| Purchases of marketable securities |
(2,070 | ) | - | - | - | - | (2,070 | ) | ||||||||||||||||
| Proceeds from sales of marketable securities |
8,100 | 11,090 | - | - | - | 19,190 | ||||||||||||||||||
| Expenditures for property |
- | (69,535 | ) | (4,839 | ) | (7,295 | ) | - | (81,669 | ) | ||||||||||||||
| Expenditures for capitalized software |
- | (14,564 | ) | - | - | - | (14,564 | ) | ||||||||||||||||
| Proceeds from sales of property |
- | (10,543 | ) | - | - | - | (10,543 | ) | ||||||||||||||||
| Investment in Hughes Systique |
(1,500 | ) | - | - | - | - | (1,500 | ) | ||||||||||||||||
| Hughes Systique note receivables |
(500 | ) | - | - | - | - | (500 | ) | ||||||||||||||||
| Net cash provided by (used in) investing activities |
4,030 | (79,975 | ) | (4,839 | ) | (7,768 | ) | - | (88,552 | ) | ||||||||||||||
| Cash flows from financing activities: |
||||||||||||||||||||||||
| Net increase in notes and loans payable |
- | - | - | 223 | - | 223 | ||||||||||||||||||
| Proceeds from equity offering |
93,046 | - | - | - | - | 93,046 | ||||||||||||||||||
| Proceeds from exercise of stock options |
75 | - | - | - | - | 75 | ||||||||||||||||||
| Long-term debt borrowings |
- | 173 | - | 3,433 | - | 3,606 | ||||||||||||||||||
| Repayment of long-term debt |
- | (10,320 | ) | - | (3,429 | ) | - | (13,749 | ) | |||||||||||||||
| Net cash provided by (used in) financing activities |
93,121 | (10,147 | ) | - | 227 | - | 83,201 | |||||||||||||||||
| Effect of exchange rate changes on cash and cash equivalents |
- | - | - | 3,372 | - | 3,372 | ||||||||||||||||||
| Net increase (decrease) in cash and cash equivalents |
98,691 | (37,574 | ) | 1,863 | 6,744 | - | 69,724 | |||||||||||||||||
| Cash and cash equivalents at beginning of period |
4,860 | 113,530 | 150 | 15,552 | - | 134,092 | ||||||||||||||||||
| Cash and cash equivalents at end of period |
$ | 103,551 | $ | 75,956 | $ | 2,013 | $ | 22,296 | $ | - | $ | 203,816 | ||||||||||||
118
Table of Contents
HUGHES COMMUNICATIONS, INC.
NOTES TO THE CONSOLIDATED FINANCIAL STATEMENTS (CONTINUED)
Note 24: Supplementary Unaudited Quarterly Financial Information
The following table sets forth selected unaudited quarterly financial data, which included all adjustments that are necessary, in the opinion of our management, for a fair presentation of its results of operations for the interim periods (in thousands, except per share data):
| 1st Quarter | 2nd Quarter | 3rd Quarter | 4th Quarter | |||||||||||||
| 2010: |
||||||||||||||||
| Revenues |
$ | 243,193 | $ | 252,368 | $ | 266,282 | $ | 281,484 | ||||||||
| Gross margin |
$ | 66,594 | $ | 73,390 | $ | 81,506 | $ | 94,009 | ||||||||
| Net income (loss) |
$ | (6,174 | ) | $ | 1,529 | $ | 9,968 | $ | 17,657 | |||||||
| Net income (loss) attributable to HCI stockholders |
$ | (6,140 | ) | $ | 1,910 | $ | 10,137 | $ | 16,880 | |||||||
| Basic earnings (loss) per share |
$ | (0.29 | ) | $ | 0.09 | $ | 0.47 | $ | 0.78 | |||||||
| Diluted earnings (loss) per share |
$ | (0.29 | ) | $ | 0.08 | $ | 0.45 | $ | 0.74 | |||||||
| 2009: |
||||||||||||||||
| Revenues |
$ | 240,215 | $ | 255,827 | $ | 251,417 | $ | 262,240 | ||||||||
| Gross margin |
$ | 59,340 | $ | 67,485 | $ | 69,003 | $ | 75,551 | ||||||||
| Net income (loss) |
$ | (4,328 | ) | $ | (47,432 | ) | $ | (2,529 | ) | $ | 2,642 | |||||
| Net income (loss) attributable to HCI stockholders |
$ | (4,696 | ) | $ | (47,742 | ) | $ | (2,622 | ) | $ | 2,367 | |||||
| Basic earnings (loss) per share |
$ | (0.22 | ) | $ | (2.23 | ) | $ | (0.12 | ) | $ | 0.11 | |||||
| Diluted earnings (loss) per share |
$ | (0.22 | ) | $ | (2.23 | ) | $ | (0.12 | ) | $ | 0.11 | |||||
Note 25: Subsequent Event
Agreement and Plan of Merger
On February 13, 2011, we entered into an Agreement and Plan of Merger (the “Merger Agreement”) with EchoStar Corporation, a Nevada corporation (“EchoStar”), EchoStar Satellite Services L.L.C., a Colorado limited liability company (“Satellite Services”), and Broadband Acquisition Corporation, a Delaware corporation (“Merger Sub”), pursuant to which, subject to the terms and conditions set forth therein, Merger Sub will merge with and into the Company (the “Merger”), with the Company continuing as the surviving entity and becoming a wholly owned subsidiary of EchoStar.
Pursuant to the Merger Agreement, upon the closing of the Merger, each of our issued and outstanding share of common stock (other than any of our common stock with respect to which appraisal rights have been duly exercised under Delaware law) will automatically be converted into the right to receive $60.70 in cash (without interest) and cancelled. Vested restricted stock award and restricted stock units will become our common stock upon the closing of the Merger and are therefore entitled to the right to receive $60.70 in cash (without interest) and cancelled. Unvested restricted stock awards and restricted stock units at the closing of the Merger have the right to receive $60.70 in cash (without interest) and cancel, payable at the time such restricted stocks vest.
Vested stock options to acquire our common stock will continue to be outstanding until the closing of the Merger. Upon the closing of the Merger, vested options will be cancelled, and within 10 days after the closing of the Merger, each vested stock option will receive $60.70 in cash (without interest) minus the exercise price of the stock option per share. Unvested stock option at closing of the Merger will be converted into the right to receive $60.70 in cash (without interest) minus the exercise price of the stock option per share and cancel, payable at the time such options vest.
119
Table of Contents
HUGHES COMMUNICATIONS, INC.
NOTES TO THE CONSOLIDATED FINANCIAL STATEMENTS (CONTINUED)
The Merger Agreement also contemplates to refinance certain of HNS’ existing debts, including the 2009 and 2006 Senior Notes. The COFACE Guaranteed Facility will continue to remain outstanding following the Merger if the requisite lender consents thereunder are obtained.
Each of the boards of directors of the Company and Merger Sub approved the Merger Agreement and deemed it advisable and fair to, and in the best interests of, their respective companies and stockholders, to enter into the Merger Agreement and to consummate the Merger and the transactions and agreements contemplated thereby. The board of directors of EchoStar approved the Merger Agreement and deemed it advisable and fair to, and in the best interests of, its stockholders to enter into the Merger Agreement and to consummate the transactions and agreements contemplated thereby.
The Merger is expected to close later this year, subject to certain closing conditions, including among others, (i) receiving the required approvals of our stockholders, which approval was effected on February 13, 2011, by written consent of a majority of our stockholders (the “Majority Stockholders’ Written Consents”), (ii) 20 business days having elapsed since the mailing to our stockholders of the definitive information statement, with respect to such adoption of the Merger Agreement, in accordance with the Securities Exchange Act of 1934, as amended, and the rules and regulations promulgated thereunder, (iii) receiving certain government regulatory approvals, including approval by the Federal Communications Commission (“FCC”), the expiration or termination of the waiting period under the Hart-Scott-Rodino Antitrust Improvements Act of 1976, as amended, and the receipt of the consents required under certain export control laws, (iv) the absence of any order or injunction by a court of competent jurisdiction preventing the consummation of the Merger, and the absence of any action taken, or any law enacted, entered, enforced or made applicable to the Merger, by any governmental entity that makes the consummation of the Merger illegal or otherwise restrains, enjoins or prohibits the Merger, (v) the absence of any proceeding in which the Office of Communications of the United Kingdom seeks to prohibit or enjoin the Merger, (vi) the accuracy of the representations and warranties made by the Company, EchoStar and Merger Sub, (vii) the performance, in all material respects, by each of the Company, EchoStar and Merger Sub of all its respective obligations, agreements and covenants under the Merger Agreement, (viii) subject to certain customary exceptions, the absence of (a) a change or event that has a material adverse effect on the business, financial condition or results of operations of the Company and its subsidiaries, taken as a whole or (b) any event, change, occurrence or effect that would prevent, materially delay or materially impede the performance by the Company of its obligations under this Agreement or the consummation of the transactions contemplated hereby, if not cured, in either case since February 13, 2011 and (ix) holders of the Company’s common stock representing in excess of 25% of the Company’s outstanding common stock shall not have exercised (or if exercised, shall not have withdrawn prior to the commencement of the marketing period for the financing of the pending transaction) rights of dissent in connection with the Merger. The Merger Agreement clarifies that no party may rely on a failure of conditions to be satisfied if such party’s breach was the proximate cause of the failure.
The Merger Agreement contains customary representations, warranties and covenants of the Company, EchoStar and Merger Sub. In particular, the Company makes certain representations and warranties related to the business in which it operates, including with respect to its communications licenses; the health of its satellite currently in orbit and other related information; that there are no claims under coordination and concession agreements; the status of the HNS’ earth stations; and compliance with regulatory and export control laws. EchoStar and Merger Sub also make a representation that EchoStar and Satellite Services have sufficient financing in order to complete the Merger.
The Company has agreed to various covenants in the Merger Agreement, including, among others, covenants (i) to use commercially reasonable efforts to conduct its business in the ordinary course consistent with
120
Table of Contents
HUGHES COMMUNICATIONS, INC.
NOTES TO THE CONSOLIDATED FINANCIAL STATEMENTS (CONTINUED)
past practice during the interim period between the execution of the Merger Agreement and completion of the Merger, (ii) not to engage in certain kinds of transactions during this interim period and (iii) to cooperate and use commercially reasonable efforts to take all actions necessary to obtain all governmental and antitrust, FCC and regulatory approvals, subject to certain customary limitations. As noted above, EchoStar and Satellite Services represent and warrant in the Merger Agreement that at the closing of the Merger they will have access to sufficient funds to consummate the Merger and the other transactions contemplated by the Merger Agreement, and there is no closing condition related to them having procured such financing.
The Merger Agreement also contains a covenant pursuant to which the Company has agreed, subject to certain customary exceptions described below, that it will not, and will cause its representatives not to, solicit, facilitate (including by providing information) or participate in any negotiations or discussions with any person relating to, any takeover proposal, as further described in the Merger Agreement. The Merger Agreement contains a “fiduciary-out” provision, which provides that, prior to the time the Company’s stockholders have adopted and approved the Merger Agreement (which adoption and approval was obtained on February 13, 2011 pursuant to the Majority Stockholders’ Written Consents), the Company’s board of directors may engage with alternative purchasers, change their recommendation to the Company’s stockholders or enter into a definitive agreement with respect to an unsolicited acquisition proposal, only if the Company’s board of directors have determined in good faith (a) that failure to take such action is likely to be inconsistent with the board’s fiduciary duties, and (b) that the acquisition proposal constitutes a “Superior Proposal.” However, as the Company’s stockholders have approved and adopted the Merger Agreement, the “fiduciary-out” provision no longer provides an exception to the non-solicitation obligations described in this paragraph.
The Merger Agreement also contains a covenant pursuant to which EchoStar or the surviving entity must indemnify officers, directors and employees of Hughes and its subsidiaries for a period of six years following the closing of the Merger for all liabilities or claims related to their service or employment with the Company’s or its subsidiaries occurring prior to the closing of the Merger. This covenant further requires EchoStar to keep in place the Company’s directors and officers liability and fiduciary liability insurance policies in effect at the closing, or purchase a “tail policy” offering similar coverage unless the Company purchases such a policy prior to closing.
The Merger Agreement contains certain termination rights for both the Company and EchoStar. In addition to certain termination rights related to breaches of the agreement or actions taken by the Company with respect to alternative transactions, so long as the failure of the terminating party to comply with its obligations is not the cause for delay in closing, each of EchoStar and the Company has the right to terminate the Merger Agreement unilaterally if the Merger has not closed by a date nine months from the execution of the Merger Agreement. In addition, the Merger Agreement provides that, upon termination of the Merger Agreement under specified circumstances, the Company may be required to pay EchoStar a termination fee of $45 million.
The Merger Agreement also contains termination and other rights related to the occurrence of certain reductions in performance or total loss of the Company’s satellite currently in orbit, and certain waivers increasing risks associated with construction, launch or operation of the Company’s satellite currently under construction (a “Material Satellite Event”). Upon a Material Satellite Event, EchoStar is entitled to terminate the Merger Agreement until 60 days after the Company provides a written plan describing its intended response (the “Mitigation Plan”). If EchoStar has not provided written consent to the Mitigation Plan 30 days after delivery, the Company can then terminate the Merger Agreement. In addition, from the date of any Material Satellite Event until EchoStar’s approval of the Mitigation Plan, the Company will also be required to provide EchoStar with daily reports of customer complaints and subscriber cancellations.
The foregoing description of the Merger Agreement and the transactions and agreements contemplated thereby does not purport to be complete and is subject to and qualified in its entirety by reference to the Merger Agreement.
121
Table of Contents
| Item 9. | Changes in and Disagreements with Accountants on Accounting and Financial Disclosure |
None.
| Item 9A. | Controls and Procedures |
Disclosure Controls and Procedures
As required by Rules 13a-15 and 15d-15 of the Securities Exchange Act of 1934, the Company has evaluated, with the participation of management, including the Chief Executive Officer and the Chief Financial Officer, the effectiveness of its disclosure controls and procedures (as defined in such rules) as of the end of the period covered by this annual report. Based on such evaluation, the Chief Executive Officer and Chief Financial Officer concluded that the Company’s disclosure controls and procedures are effective to ensure that information required to be disclosed by the Company in reports prepared in accordance with the rules and regulations of the Securities and Exchange Commission (the “SEC”) is recorded, processed, summarized and reported within the time periods specified by the SEC’s rules and forms.
Our management, including the Company’s Chief Executive Officer and Chief Financial Officer, does not expect that the Company’s disclosure controls and procedures will prevent all errors and all fraud. A control system, no matter how well conceived and operated, can provide only reasonable, not absolute, assurance that the objectives of the control system are met. Further, the design of a control system must reflect the fact that there are resource constraints, and the benefits of controls must be considered relative to their costs. Because of the inherent limitations in all control systems, no evaluation of controls can provide absolute assurance that all control issues and instances of fraud, if any, within the Company have been detected. These inherent limitations include the realities that judgments in decision-making can be faulty, and that breakdowns can occur because of simple error or mistake.
Additionally, controls can be circumvented by the individual acts of some persons, by collusion of two or more people, or by management override of the control. The design of any system of controls also is based in part upon certain assumptions about the likelihood of future events, and there can be no assurance that any design will succeed in achieving its stated goals under all potential future conditions; over time, controls may become inadequate because of changes in conditions, or the degree of compliance with the policies or procedures may deteriorate. Because of the inherent limitations in a cost-effective control system, misstatements due to error or fraud may occur and not be detected.
Changes in Internal Control Over Financial Reporting
There have been no changes in the Company’s internal control over financial reporting that occurred during the fourth quarter of the year ended December 31, 2010 that have materially affected, or are reasonably likely to materially affect, the Company’s internal control over financial reporting. The Company continues to review its disclosure controls and procedures, including its internal controls over financial reporting, and may from time to time make changes aimed at enhancing their effectiveness and to ensure that the Company’s systems evolve with its business.
Management Report on Internal Control Over Financial Reporting
Our management is responsible for establishing and maintaining adequate internal control over financial reporting. Our internal control system is designed to provide reasonable assurance regarding the reliability of financial reporting and the preparation of financial statements for external purposes in accordance with generally accepted accounting principles in the United States (“GAAP”) and includes those policies and procedures that:
| • | pertain to the maintenance of records that in reasonable detail accurately and fairly reflect the transactions and dispositions of the assets of the company; |
122
Table of Contents
| • | provide reasonable assurance that transactions are recorded as necessary to permit preparation of financial statements in accordance with GAAP, and that receipts and expenditures of the company are being made only in accordance with authorizations of management and directors of the company; and |
| • | provide reasonable assurance regarding prevention or timely detection of unauthorized acquisition, use or disposition of the company’s assets that could have a material effect on its financial statements. |
Because of its inherent limitations, a system of internal control over financial reporting can provide only reasonable assurance and may not prevent or detect misstatements. Further, because of changes in conditions, effectiveness of internal controls over financial reporting may vary over time. Our system contains self-monitoring mechanisms, and actions are taken to correct deficiencies as they are identified.
Our management conducted an evaluation of the effectiveness of the system of internal control over financial reporting based on the framework in Internal Control—Integrated Framework issued by the Committee of Sponsoring Organizations of the Treadway Commission. Based on this evaluation, our management concluded that our system of internal control over financial reporting was effective as of December 31, 2010. The effectiveness of our internal controls over financial reporting has been audited by Deloitte & Touche LLP, an independent registered public accounting firm, as stated in their report, which is included herein.
| Item 9B. | Other Information |
None.
123
Table of Contents
| Item 10. | Directors, Executive Officers and Corporate Governance |
Set forth below is certain information concerning members of our Board of Directors, our executive officers and certain other officers. Our Board of Directors is composed of seven members. Each director is elected for a one-year term or until such person’s successor is duly elected or qualified.
| Name |
Age | Position | ||||
| Pradman P. Kaul |
64 | Chief Executive Officer, President and Director | ||||
| Grant A. Barber |
51 | Executive Vice President and Chief Financial Officer | ||||
| T. Paul Gaske |
57 | Executive Vice President | ||||
| Adrian Morris |
56 | Executive Vice President | ||||
| Bahram Pourmand |
64 | Executive Vice President | ||||
| Thomas J. McElroy |
55 | Chief Accounting Officer | ||||
| Dean A. Manson |
44 | Senior Vice President, General Counsel and Secretary | ||||
| Deepak V. Dutt |
66 | Vice President, Treasurer and Investor Relations officer | ||||
| Cleo V. Belmonte |
33 | Assistant Secretary | ||||
| Andrew D. Africk |
44 | Director | ||||
| O. Gene Gabbard |
70 | Director | ||||
| Jeffrey A. Leddy |
55 | Director | ||||
| Lawrence J. Ruisi |
62 | Director | ||||
| Aaron J. Stone |
38 | Director | ||||
| Michael D. Weiner |
58 | Director | ||||
Pradman P. Kaul—Chief Executive Officer, President and Director. Mr. Kaul has been our Chief Executive Officer and President as well as a member of our Board of Directors since February 2006, and has been HNS’ Chief Executive Officer and President since 2000. Mr. Kaul was appointed to, and has served as Chairman of, HNS’ Board of Managers since April 22, 2005. Previously, Mr. Kaul served as the Chief Operating Officer, Executive Vice President and Director of Engineering of HNS. With over 37 years of experience at HNS, Mr. Kaul has a deep knowledge and understanding of the Company, its operations and its lines of business. Before joining HNS in 1973, Mr. Kaul worked at COMSAT Laboratories in Clarksburg, Maryland. Mr. Kaul received a Bachelor of Science degree in Electrical Engineering from The George Washington University and a Master of Science degree in Electrical Engineering from the University of California at Berkeley. He holds numerous patents and has published articles and papers on a variety of technical topics concerning satellite communications. Mr. Kaul has been inducted as a member of the National Academy of Engineering.
Grant A. Barber—Executive Vice President and Chief Financial Officer. Mr. Barber has been our Executive Vice President and Chief Financial Officer since February 2006 and has served as the Executive Vice President and Chief Financial Officer of HNS since January 2006. From 2003 to 2006, Mr. Barber served first as Controller and then Executive Vice President and Chief Financial Officer for Acterna, Inc., a global manufacturer of test and measurement equipment for the Telco and Cable markets located in Germantown, Maryland. From 1984 through 2002, Mr. Barber served in various senior financial positions with Nortel Networks in the United States, Canada, France and England. Mr. Barber received his Bachelor degree in Business Administration from Wilfrid Laurier University and is a Canadian chartered accountant.
T. Paul Gaske— Executive Vice President. Mr. Gaske has been our Executive Vice President since February 2006 and has also served as HNS’ Executive Vice President, North American Division since 1999. Mr. Gaske joined HNS in 1977. Mr. Gaske has held a variety of engineering, marketing, and business management positions throughout his career. Mr. Gaske holds a Bachelor of Science degree in Electrical Engineering from the University of Maryland and a Master of Science degree in Computer Science from Johns Hopkins University in Baltimore, Maryland. He is a member of the Institute of Electrical and Electronics
124
Table of Contents
Engineering (IEEE), a published author on satellite networking technologies and markets and the holder of numerous patents in satellite communications and broadband networking.
Adrian Morris—Executive Vice President. Mr. Morris has been our Executive Vice President and HNS’ Executive Vice President, Engineering since February 2006. Prior to that, Mr. Morris had been Senior Vice President of Engineering since 1996. His career began with HNS in 1982 as a hardware design engineer and he has held a variety of technical and management positions throughout his career. Mr. Morris received a Bachelor of Science degree from Trinity College Dublin and a Master of Science degree in Digital Techniques from Heriot Watt University, Edinburgh. Prior to joining HNS, he worked for Ferranti Electronics and Electro Optics Division. Mr. Morris is a co-inventor for a number of patents in digital communications and has authored several published papers. He is also a member of the IEEE.
Bahram Pourmand—Executive Vice President. Mr. Pourmand has been our Executive Vice President since February 2006 and has also served as HNS’ Executive Vice President, International Division since 1993. Mr. Pourmand joined HNS in 1979 and is currently responsible for all aspects of HNS’ international operations, including oversight of profit and loss, marketing, product development and strategic direction for HNS’ global activities. Prior to joining HNS, Mr. Pourmand was a director with Rockwell International in Dallas, Texas. Mr. Pourmand has a Bachelor of Science degree in Electrical Engineering from Texas Tech University and a Master of Science degree in Electrical Engineering from Southern Methodist University.
Thomas J. McElroy—Chief Accounting Officer. Mr. McElroy has been our Chief Accounting Officer since February 2006. In August 2007, he was appointed Senior Vice President and Controller of HNS and is responsible for all financial accounting and reporting matters for HNS and its global consolidated operations. From June 2006 to September 2007, he was HNS’ Vice President and Controller. Prior to joining HNS in January 1988 as a Director of Finance, Mr. McElroy was a Senior Manager in the audit group for Price Waterhouse & Co. in Washington, DC from 1977 to 1988. He received his Bachelor of Science degree in Accounting from St. Francis University.
Dean A. Manson—Senior Vice President, General Counsel and Secretary. Mr. Manson has been our and HNS’ Senior Vice President, General Counsel and Secretary since August 2007, prior to which he was our Vice President, General Counsel and Secretary since February 2006 and HNS’ Vice President, General Counsel and Secretary since November 2004. Mr. Manson also serves as a director or officer for several of our subsidiaries. Before joining HNS in June 2000 as Assistant Vice President, Legal, Mr. Manson was associated with the law firm of Milbank, Tweed, Hadley & McCloy LLP. Mr. Manson earned a Bachelor of Science degree in Engineering from Princeton University and a Juris Doctorate degree from Columbia University School of Law.
Deepak V. Dutt—Vice President, Treasurer and Investor Relations Officer. Mr. Dutt has been our Vice President, Treasurer and Investor Relations Officer since March 2007. Mr. Dutt has served as Vice President and Treasurer of HNS since January 2001 and as Investor Relations Officer of HNS since February 2008. Mr. Dutt joined HNS in July 1993 and has held various positions in finance since then, including corporate planning, international finance, treasury and an international assignment as Chief Financial Officer of a subsidiary of the Company where he played a lead role in its start-up and in taking it public. Prior to joining our Company, Mr. Dutt served in various positions in the U.S. and overseas at IBM Corporation in sales, marketing and finance. He received a Bachelor of Science degree in Engineering from the University of Poona, India.
Cleo V. Belmonte—Assistant Secretary. Ms. Belmonte has been our Assistant Secretary since March 2007 and Senior Counsel, Securities of HNS since joining the Company in January 2007. Prior to joining HNS, from 2002 to 2006, Ms. Belmonte was an associate with the law firms of Pillsbury Winthrop Shaw Pittman LLP and Patton Boggs LLP where she practiced securities and general corporate law. Ms. Belmonte received Bachelor of Science degrees in Multinational Business Operations, Marketing and Business Management from Florida State University. Ms. Belmonte received a Juris Doctorate degree from the Georgetown University Law Center.
Andrew D. Africk—Director. Mr. Africk has been a director since December 2005. Mr. Africk is a senior partner of Apollo Advisors, L.P., which, together with its affiliates, acts as managing general partner of the
125
Table of Contents
Apollo Investment Funds, a series of private securities investment funds, where he has worked since 1992. Mr. Africk has significant experience making and managing private equity investments on behalf of Apollo and has over 18 years experience financing, analyzing and investing in public and private companies. Mr. Africk led the diligence team for the acquisition of the majority ownership of the Company by Apollo and has worked closely with the management of the Company since the acquisition. Mr. Africk also serves on the Board of Directors of Hughes Telematics and SOURCECORP, Incorporated. From 1999 to 2008, Mr. Africk served on the board of directors of LightSquared, Inc. (“LightSquared,” formerly SkyTerra Communications, Inc.), including its predecessor. From 2005 to 2008, Mr. Africk served as the vice chairman of the board of directors of Intelsat Holdings, Ltd. From 2003 to 2006, Mr. Africk served on the board of directors of Superior Essex Inc. From 2001 to 2008, Mr. Africk served on the board of directors of Mobile Satellite Ventures. From 2003 to 2008, Mr. Africk served on the board of directors of Terrestar Networks, Inc. From 2007 to 2008, Mr. Africk served on the board of directors of Terrestar Global, Inc. From October 2009 to December 2009, Mr. Africk served on the boards of directors of Parallel Petroleum. Mr. Africk also serves on HNS’ Board of Managers. Mr. Africk serves as the chairman of our Nominating and Corporate Governance Committee and our Compensation Committee.
O. Gene Gabbard—Director. Mr. Gabbard has been a director since June 2006. He is a private investor who has more than 25 years of general management experience in the telecommunications and technology sectors. Mr. Gabbard is a member of the board of directors of COLT Telecom, SA, Luxembourg, a pan-European provider of business communications services. He is also a member of the Board of Directors of Knology, Inc., West Point, Georgia and NetCracker, Technology Corporation,Waltham, Massachusetts. From August 1990 to January 1993, Mr. Gabbard was Executive Vice President and Chief Financial Officer of MCI Communications Corporation. Mr. Gabbard serves on our Audit Committee.
Jeffrey A. Leddy—Director. Mr. Leddy has been a director since our formation in June 2005. Mr. Leddy was our President from our formation in June 2005 until February 2006 and our Chief Executive Officer from November 2005 until February 2006. Mr. Leddy is currently the Chief Executive Officer of Hughes Telematics and has more than 30 years of experience with communication companies. He previously served as LightSquared’s Chief Executive Officer and President from April 2003 through December 2006, having served as its President and Chief Operating Officer since October 2002 and its Senior Vice President of Operations since June 2002. From September 1980 to December 2001, Mr. Leddy worked for EMS Technologies, most recently as a Vice President. Mr. Leddy also serves on the board of directors of Hughes Telematics and Hughes Systique Corporation. Mr. Leddy also serves on HNS’ Board of Managers.
Lawrence J. Ruisi—Director. Mr. Ruisi has been a director since June 2006. He is a private investor/consultant and also serves on the Board of Governors of Sound Shore Medical Center where he was Chairman from 2002 to 2006. Mr. Ruisi also serves on the boards of directors of Innkeepers USA, a privately held hotel real estate investment trust and Adaptec, Inc., a data storage provider to OEMs. Mr. Ruisi has over twenty years of experience in the entertainment industry in which he held various senior executive positions. He was Chief Executive Officer and President of Loews Cineplex Entertainment from 1998 to 2002, Executive Vice President of Sony Pictures Entertainment from 1991 to 1998, Senior Vice President of Columbia Pictures Entertainment from 1987 to 1990 and Senior Vice President Finance and Vice President and Controller of Tri-Star Pictures from 1983 to 1987. Mr. Ruisi started his career in public accounting and worked for Price Waterhouse & Co. from 1970 to 1983. He has extensive experience in corporate finance and accounting. Mr. Ruisi serves as the chairman of our Audit Committee.
Aaron J. Stone—Director. Mr. Stone has been a director since December 2005. Mr. Stone is a senior partner of Apollo Advisors, L.P., which, together with its affiliates, acts as managing general partner of the Apollo Investment Funds, a series of private securities investment funds, where he has worked since 1997. Mr. Stone has significant experience making and managing private equity investments on behalf of Apollo and has over 14 years experience financing, analyzing and investing in public and private companies. Mr. Stone worked with the diligence team for the acquisition of the majority ownership of the Company by Apollo and has worked closely with the management of the Company since the acquisition. Mr. Stone also serves on the board of directors of AMC Entertainment Inc., Hughes Telematics, Inc., Parallel Petroleum, and Connections Academy, LLC. From 2005 to 2008, Mr. Stone served on the board of directors of LightSquared, Intelsat
126
Table of Contents
Holdings, Ltd. and Mobile Satellite Ventures. From 2004 to 2007, Mr. Stone served on the board of directors of Educate, Inc. Mr. Stone also serves on HNS’ Board of Managers. Mr. Stone serves on our Compensation Committee and Nominating and Corporate Governance Committee.
Michael D. Weiner—Director. Mr. Weiner has been a director since December 2005. Mr. Weiner has been Chief Legal Officer and General Counsel of Ares Management since September 2006. He also serves on the board of directors of LightSquared. Previously, Mr. Weiner was employed with Apollo Advisors, L.P. and Apollo Real Estate Advisors and served as general counsel of the Apollo organization from 1992 to September 2006. From 1998 to 2006, Mr. Weiner served on the board of directors of Quality Distribution, Inc. Prior to joining Apollo, Mr. Weiner was a partner in the law firm of Morgan, Lewis & Bockius. Mr. Weiner has over 30 years of extensive experience in securities law, public and private financings, and corporate and commercial transactions. Mr. Weiner serves on our Audit Committee.
Code of Ethics
We have adopted a written code of ethics, the “Amended and Restated Code of Ethics” for our Chief Executive and Senior Financial Officers, which is applicable to our principal executive officer, principal financial officer, principal accounting officer or controller and other executive officers who perform similar functions (collectively, the “Selected Officers”). Our Code of Ethics is available on our website at www.hughes.com or you may request a free copy of our Code of Ethics from:
Hughes Communications, Inc.
11717 Exploration Lane
Germantown, MD 20876
Attn: Sandi Kerentoff
To date, there have been no waivers under the Code of Ethics. We intend to disclose any changes in our waivers under the Code of Ethics applicable to any Selected Officer or by filing a Form 8-K. Certain information required by this item is incorporated by reference to the Company’s definitive Proxy Statement to be filed with the Securities and Exchange Commission in connection with the Company’s 2010 annual meeting stockholders.
| Item 11. | Executive Compensation |
The information required by this item is incorporated by reference to the Company’s definitive Proxy Statement to be filed with the Securities and Exchange Commission in connection with the Company’s 2011 annual meeting of stockholders.
| Item 12. | Security Ownership of Certain Beneficial Owners and Management and Related Stockholder Matters |
Certain information required by this item is incorporated by reference to the Company’s definitive Proxy Statement to be filed with the Securities and Exchange Commission in connection with the Company’s 2011 annual meeting of stockholders.
Securities Authorized for Issuance under the Equity Compensation Plans
On January 30, 2006, we adopted the 2006 Equity and Incentive Plan (the “Plan”), which provides for the grant of equity-based awards, including restricted common stock, restricted stock units, stock options, stock appreciation rights and other equity-based awards, as well as cash bonuses and long-term cash awards to our directors, officers and other employees, advisors and consultants who are selected by its compensation committee for participation in the Plan. Unless earlier terminated by our Board of Directors, the Plan will expire on January 30, 2016. Termination of the Plan is not intended to adversely affect any award that is then outstanding without the award holder’s consent. Our Board of Directors may amend the Plan at any time. Plan amendments are not intended to adversely affect any award that is then outstanding without the award holder’s consent, and we must obtain stockholder approval of a plan amendment if stockholder approval is required to comply with any applicable law, regulation or stock exchange rule.
127
Table of Contents
The following table provides information regarding our equity compensation plans as of December 31, 2010:
| Plan category |
Securities to
be Issued upon Exercise of Outstanding Options, Warrants and Rights ( a ) |
Weighted Average Exercise Price of Outstanding Options, Warrants and Rights ( b ) |
Securities Remaining Available for Future Issuance Under Equity Compensation Plans (excluding Securities Reflected in Column (a)) ( c ) |
|||||||||
| Equity compensation plans approved by security holders: |
||||||||||||
| The Plan(1) |
1,196,950 | $ | 22.56 | 53,050 | ||||||||
| Hughes Network Systems LLC Bonus Unit Plan (“HNS Bonus Unit Plan”)(2) |
||||||||||||
| Equity compensation plans not approved by security holders: |
||||||||||||
| SkyTerra 1998 Long Term Incentive Plan (“SkyTerra Plan”)(3) |
57,500 | $ | 19.40 | - | ||||||||
| Hughes Network Systems, LLC Class B Unit Plan (“HNS Class B Unit Plan”)(4) |
||||||||||||
| Total |
1,254,450 | $ | 22.42 | 53,050 | ||||||||
| (1) | The Plan provides for this issuance of equity based awards in various forms including restricted common stock, restricted stock units, stock options, stock appreciation rights and other equity based awards. As of December 31, 2010, 23,500 restricted stock units, which are subject to time vesting, granted to our international employees were outstanding. Upon vesting, each restricted stock unit is convertible into one share of common stock. |
| (2) | In July 2005, HNS adopted the “HNS Bonus Unit Plan pursuant to which 4.4 million bonus units were granted to certain employees. The bonus units provide for time vesting and are subject to a participant’s continued employment with HNS at the time of predetermined exchange dates. As of December 31, 2010, 300,000 bonus units were outstanding. The number of shares of our common stock to be issued upon each exchange would be based upon the fair market value of the vested bonus units divided by the closing trading price of our common stock for the 20 business days immediately preceding the date of the exchange. |
| (3) | In February 2006, the stock options granted under the SkyTerra Plan were converted into options to purchase shares of our common stock. |
| (4) | Class B membership interests of HNS (“Class B Units”) have been granted to certain employees, officers, directors, consultants and contractors of HNS and the Company pursuant to the terms of the HNS Second Amended and Restated Limited Liability Company Agreement and the Restricted Unit Purchase Agreements and Employment Agreements entered into between HNS and the Class B Unit holders. These agreements collectively constitute the Class B Unit Plan. The Class B Units are subject to time and performance vesting restrictions and are exchangeable for our common stock upon vesting. As of December 31, 2010, 3,280 Class B Units were outstanding. The number of shares of our common stock to be issued upon the exchange is based upon the fair market value of besting Class B Units divided bythe average closing trading price of our common stock for the 20 business days immediately preceding the date of the exchange. |
| Item 13. | Certain Relationships and Related Transactions, and Director Independence |
The information required by this item is incorporated by reference to the Company’s definitive Proxy Statement to be filed with the Securities and Exchange Commission in connection with the Company’s 2011 annual meeting of stockholders.
| Item 14. | Principal Accountant Fees and Services |
The information required by this item is incorporated by reference to the Company’s definitive Proxy Statement to be filed with the Securities and Exchange Commission in connection with the Company’s 2011 annual meeting of stockholders.
128
Table of Contents
| Item 15. | Exhibits and Financial Statement Schedules |
| Page Number | ||||||||
| (a) | 1. | All Consolidated Financial Statements | Item 8 | |||||
| 2. | Financial Statement Schedule I—Condensed Financial Information of the Registrant | 110 | ||||||
| Financial Statement Schedule II—Valuation and Qualifying Accounts for the Years Ended December 31, 2010, 2009 and 2008 | 134 | |||||||
| 3. | Exhibits | See below | ||||||
|
Exhibit |
Description | |
| 2.1 | Agreement and Plan of Merger by and among Hughes Communications, Inc., Utah Acquisition Corp., Helius, Inc., Canopy Ventures I, L.P., and Canopy Group, in its capacity as Shareholder Representative dated as of December 21, 2007 (incorporated by reference to Exhibit 2.1 to the Annual Report on Form 10-K of Hughes Communications, Inc. filed March 10, 2008 (File No. 001-33040)). | |
| 2.2 | Agreement and Plan of Merger between EchoStar Corporation, EchoStar Satellite Services L.L.C., Broadband Acquisition Corporation and among Hughes Communications, Inc. dated as of February 13, 2011 (incorporated by reference to Exhibit 2.1 to the Current Report on Form 8-K of Hughes Communications, Inc. filed February 15, 2011 (File No. 001-33040)). | |
| 3.1 | Amended and Restated Certificate of Incorporation of Hughes Communications, Inc., dated as of December 2, 2005 (incorporated by reference to Exhibit 3.1 to the Registration Statement on Form S-1 of Hughes Communications, Inc. filed December 5, 2005 (File No. 333-130136)).). | |
| 3.2 | Amended and Restated By-Laws of Hughes Communications, Inc., dated as of December 2, 2005 (incorporated by reference to Exhibit 3.2 to the Registration Statement on Form S-1 of Hughes Communications, Inc. filed December 5, 2005 (File No. 333-130136)). | |
| 3.3 | Certificate of Amendment to the Amended and Restated Certificate of Incorporation of Hughes Communications, Inc., dated February 16, 2006 (incorporated by reference to Exhibit 3.1 to the Current Report on Form 8-K of Hughes Communications, Inc. filed February 24, 2006 (File No. 000-51784)). | |
| 4.1 | Specimen Common Stock Certificate (incorporated by reference to Exhibit 4.1 to Amendment No. 3 to the Registration Statement on Form S-1 of Hughes Communications, Inc. filed February 6, 2006 (File No. 333-130136)). | |
| 4.2 | Form of Subscription Rights Certificate (incorporated by reference to Exhibit 4.2 to Amendment No. 3 to the Registration Statement on Form S-1 of Hughes Communications, Inc. filed February 6, 2006 (File No. 333-130136)). | |
| 4.3 | Indenture dated as of April 13, 2006 between Hughes Network Systems, LLC, HNS Finance Corp., the guarantors party thereto and Wells Fargo Bank, National Association, as trustee (incorporated by reference to Exhibit 4.1 to the Current Report on Form 8-K of Hughes Communications, Inc. filed April 17, 2006 (File No. 000-51784)). | |
| 4.4 | Supplemental Indenture No. 1 dated as of May 6, 2008 among Helius, LLC, Helius Acquisition, LLC and Advanced Satellite Research, LLC, Hughes Network Systems, LLC, HNS Finance Corp., the other Guarantors (as defined in the Indenture) and Wells Fargo Bank, National Association (incorporated by reference to Exhibit 4 to the Quarterly Report on Form 10-Q of Hughes communications, Inc. filed on August 7, 2008 (File No. 001-33040)). | |
| 4.5 | Registration Rights Agreement, dated as of April 13, 2006, by and among Hughes Network Systems, LLC, HNS Finance Corp., the guarantor subsidiaries of Hughes Network Systems, LLC party thereto and Bear, Stearns & Co. Inc., Morgan Stanley & Co. Incorporated and Banc of America Securities LLC (incorporated by reference to Exhibit 10.1 to the Current Report on Form 8-K of Hughes Communications, Inc. filed April 17, 2006 (File No. 000-51784)). |
129
Table of Contents
|
Exhibit |
Description | |
| 4.6 | Form of 9 1/2% Senior Notes due 2014 (included in the Indenture filed as Exhibit 4.1 to the Current Report on Form 8-K of Hughes Communications, Inc. filed April 17, 2006 (File No. 000-51784)). | |
| 4.7 | Indenture, dated as of May 27, 2009, among Hughes Network Systems, LLC, HNS Finance Corp., each of the guarantors party thereto and Wells Fargo Bank, National Association, as trustee (incorporated by reference to Exhibit 4.5 to the Registration Statement on Form S-4 of Hughes Network Systems, LLC filed May 29, 2009 (File No. 333-160307)). | |
| 4.8 | Registration Rights Agreement, dated as of May 27, 2009, among Hughes Network Systems, LLC, HNS finance Corp., the guarantors listed on Schedule I thereto and J.P. Morgan Securities Inc. (incorporated by reference to Exhibit 4.6 to the Registration Statement on Form S-4 of Hughes Network Systems, LLC filed May 29, 2009 (File No. 333-160307)). | |
| 10.1 | Separation Agreement, dated as of December 30, 2005, by and between Hughes Communications, Inc. and SkyTerra Communications, Inc. (currently known as LightSquared, Inc.) (incorporated by reference to Exhibit 10.1 to the Current Report on Form 8-K of SkyTerra Communications, Inc. filed January 3, 2006 (File No. 000-13865)). | |
| 10.2 | First Amendment to Separation Agreement, dated as of February 3, 2006, by and between Hughes Communications, Inc. and SkyTerra Communications, Inc. (currently known as LightSquared, Inc.) (incorporated by reference to Exhibit 10.2 to Amendment No. 3 to the Registration Statement on Form S-1 of Hughes Communications, Inc. filed February 6, 2006 (File No. 333-130136)). | |
| 10.3 | Tax Sharing Agreement, dated as of December 30, 2005, by and between Hughes Communications, Inc. and SkyTerra Communications, Inc. (currently known as LightSquared, Inc.) (incorporated by reference to Exhibit 10.2 to the Current Report on Form 8-K of SkyTerra Communications, Inc. filed January 3, 2006 (File No. 000-13865)). | |
| 10.4 | Employment Agreement, dated as of April 23, 2005, by and between Hughes Network Systems, LLC and Pradman Kaul (incorporated by reference to Exhibit 10.3 to the Registration Statement on Form S-1 of Hughes Communications, Inc. filed December 5, 2005 (File No. 333-130136)). | |
| 10.5 | Restricted Unit Purchase Agreement, dated as of June 20, 2005, between Hughes Network Systems, LLC and Jeffrey A. Leddy (incorporated by reference to Exhibit 10.4 to the Registration Statement on Form S-1 of Hughes Communications, Inc. filed December 5, 2005 (File No. 333-130136)). | |
| 10.6 | 2006 Equity and Incentive Plan (incorporated by reference to Exhibit 10.6 to Amendment No. 3 to the Registration Statement on Form S-1 of Hughes Communications, Inc. filed February 6, 2006 (File No. 333-130136)). | |
| 10.7 | Amended and Restated Limited Liability Company Agreement, dated as of April 22, 2005, by and between Hughes Network Systems, Inc. and SkyTerra Communications, Inc. (currently known as LightSquared, Inc.) (incorporated by reference to Exhibit 99.3 to the Current Report on Form 8-K of SkyTerra Communications, Inc. filed April 26, 2005 (File No. 000-13865)). | |
| 10.8 | Investor Rights Agreement, dated as of April 22, 2005, by and among Hughes Network Systems, LLC, Hughes Network Systems, Inc. and SkyTerra Communications, Inc. (incorporated by reference to Exhibit 99.5 to the Current Report on Form 8-K of SkyTerra Communications, Inc. filed April 26, 2005 (File No. 000-13865)). | |
| 10.9 | First Lien Credit Agreement, dated as of April 22, 2005, as Amended and Restated as of June 24, 2005, among Hughes Network Systems, LLC, as borrower, the lenders party thereto, JPMorgan Chase Bank, N.A., as Administrative Agent, Bear Stearns Corporate Lending Inc., as Syndication Agent, and J.P. Morgan Securities Inc. and Bear, Stearns & Co. Inc., as joint lead arrangers and joint bookrunners (incorporated by reference to Exhibit 10.8 to the Registration Statement on Form S-1 of Hughes Communications, Inc. filed December 5, 2005 (File No. 333-130136)). |
130
Table of Contents
|
Exhibit |
Description | |
| 10.10 | Credit Agreement dated as of April 22, 2005, as amended and restated as of June 27, 2005, as further amended and restated as of April 13, 2006, as further amended and restated as of March 16, 2010, among Hughes Network Systems, LLC, JP Morgan Chase Bank, N.A., as administrative agent, Barclays Capital, as syndication agent, J.P. Morgan Securities Inc., as sole lead book runner, and J.P. Morgan Securities Inc. and Barclays Capital, as joint lead arrangers (incorporated by reference to Exhibit 10.2 to the quarterly report on Form 10-Q of Hughes Communications, Inc. filed May 5, 2010 (File No. 001-33040)). | |
| 10.11 | Contribution and Membership Interest Purchase Agreement, dated December 3, 2004, by and among The DIRECTV Group, Inc., Hughes Network Systems, Inc., SkyTerra Communications, Inc. (currently known as LightSquared, Inc.) and Hughes Network Systems, LLC (incorporated by reference to the Current Report on Form 8-K of SkyTerra Communications, Inc. filed December 9, 2004 (File No. 000-13865)). | |
| 10.12 | Membership Interest Purchase Agreement, dated as of November 10, 2005, by and among SkyTerra Communications, Inc. (currently known as LightSquared, Inc.), SkyTerra Holdings, Inc., The DIRECTV Group, Inc., DTV Network Systems, Inc. and Hughes Network Systems, LLC (incorporated by reference to Exhibit 10.1 to the Current Report on Form 8-K of SkyTerra Communications, Inc. filed November 14, 2005 (File No. 000-13865)). | |
| 10.13 | Registration Rights Agreement, dated as of January 1, 2006, by and among Hughes Communications, Inc., Apollo Investment Fund IV, L.P., Apollo Overseas Partners IV, L.P., AIF IV/RRRR LLC, AP/RM Acquisition LLC and ST/RRRR LLC (incorporated by reference to Exhibit 10.5 to the Current Report on Form 8-K of SkyTerra Communications, Inc. filed January 3, 2006 (File No. 000-13865)). | |
| 10.14 | Hughes Network Systems, LLC Bonus Unit Plan (incorporated by reference to Exhibit 10.1 to the quarterly report on Form 10-Q of SkyTerra Communications, Inc. filed August 15, 2005 (File No. 000-13865)). | |
| 10.15 | Employment Agreement, dated as of April 23, 2005, by and between Hughes Network Systems, LLC and Paul Gaske (incorporated by reference to Exhibit 10.19 to Amendment No. 2 to the Registration Statement on Form S-1 of Hughes Communications, Inc. filed January 26, 2006 (File No. 333-130136)). | |
| 10.16 | Employment Agreement, dated as of April 23, 2005, by and between Hughes Network Systems, LLC and Bahram Pourmand (incorporated by reference to Exhibit 10.20 to Amendment No. 2 to the Registration Statement on Form S-1 of Hughes Communications, Inc. filed January 26, 2006 (File No. 333-130136)). | |
| 10.17 | Employment Agreement, dated as of April 23, 2005, by and between Hughes Network Systems, LLC and Adrian Morris (incorporated by reference to Exhibit 10.21 to Amendment No. 2 to the Registration Statement on Form S-1 of Hughes Communications, Inc. filed January 26, 2006 (File No. 333-130136)). | |
| 10.18 | Second Amended and Restated Limited Liability Company Agreement of Hughes Network Systems, LLC, dated as of February 28, 2006, by and among Hughes Communications, Inc., the Class B Members and the other signatories thereto (incorporated by reference to Exhibit 10.1 to the Current Report on Form 8-K of Hughes Communications, Inc. filed March 3, 2006 (File No. 000-51784)). | |
| 10.19 | Employment Agreement, dated February 23, 2006, between Hughes Communications, Inc., Hughes Network Systems, LLC and Grant A. Barber (incorporated by reference to Exhibit 10.1 to the Current Report on Form 8-K of Hughes Communications, Inc. filed February 27, 2006 (File No. 000-51784)). | |
| 10.20 | Management and Advisory Services Agreement dated March 27, 2006 between Hughes Communications, Inc. and Hughes Network Systems, LLC (incorporated by reference to Exhibit 10.1 to the Current Report on Form 8-K of Hughes Communications, Inc. filed March 29, 2006 (File No. 000-51784)). |
131
Table of Contents
|
Exhibit |
Description | |
| 10.21 | Form of Indemnification Agreement (incorporated by reference to Exhibit 10.1 to the Current Report on Form 8-K of Hughes Communications, Inc. filed June 22, 2006 (File No. 000-51784)). | |
| 10.22 | Credit Agreement, dated as of February 23, 2007, among Hughes Network Systems, LLC and HNS Finance Corp. as co-borrowers, Bear Stearns Corporate Lending Inc. (“BSCL”) as the initial lender, Bear Stearns & Co. Inc. as lead arranger and book running manager, and BSCL as administrative agent (incorporated by reference to Exhibit 10.1 to the Current Report on Form 8-K of Hughes Network Systems, LLC filed February 27, 2007 (File No. 333-138009)). | |
| 10.23 | First Amendment to Amended and Restated Credit Agreement and First Lien Guarantee and Collateral Agreement, dated as of April 6, 2007, by and among Hughes Network System, LLC, as the Borrower, and Bear Stearns Corporate Lending Inc., as administrative agent (incorporated by reference to Exhibit 10.1 to the Current Report on Form 8-K of Hughes Network System, LLC filed April 12, 2007) (File No. 333-138009)). | |
| 10.24 | Hughes Network systems, LLC Long Term Cash Incentive Retention Program (Incorporated by reference to Exhibit 4 to the Quarterly Report on Form 10-Q of Hughes Communications, Inc. filed on May 7, 2008 File No. 001-33040)). | |
| 10.25 | Contract between Hughes Network Systems, LLC and Space Systems/Loral, Inc. for the Hughes Jupiter Satellite Program dated June 8, 2009 (Confidential treatment has been granted for certain portion of this exhibit pursuant to Rule 24b-2 under the Securities Exchange Act of 1934, as amended, which portions have been omitted and filed separately with the Securities and Exchange Commission) (incorporated by reference to Exhibit 10.1 to the quarterly report on Form 10-Q of Hughes Communications, Inc. filed August 7, 2009 (File No. 001-33040)). | |
| 10.26 | Amendment Agreement dated March 16, 2010 among Hughes Network Systems, LLC, the lenders party thereto, JP Morgan Chase Bank, as administrative agent, Barclays Capital, as syndication agent, to the Credit Agreement dated as of April 22, 2005, as amended and restated as of June 27, 2005, and as further amended and restated as of April 13, 2006, among Hughes Network Systems, LLC, the lenders from time to time party thereto, Bear, Sterns Corporate Lending Inc., as the administrative agent, Morgan Stanley Senior Funding, Inc., as syndication agent, and Bear, Stearns & Co. Inc. and Morgan Stanley Senior Funding, Inc., as joint lead arrangers and joint book managers (incorporated by reference to Exhibit 10.1 to the quarterly report on Form 10-Q of Hughes Communications, Inc. filed May 5, 2010 (File No. 001-33040)). | |
| 10.27 | Launch Services Agreement by and between Hughes Network Systems, LLC and Arianespace dated April 30, 2010 (portions of the agreement have been omitted pursuant to a confidential treatment request) (incorporated by reference to Exhibit 10.1 to the quarterly report on Form 10-Q of Hughes Communications, Inc. filed August 4, 2010 (File No. 001-33040)). | |
| 10.28 | Coface Covered Export Credit Agreement between Hughes Network Systems, LLC, as Borrower, the companies listed in Schedule I as Original Guarantors, BNP Paribas and Societe Generale, as Original Lenders, BNP Paribas and Societe Generale, as Mandated Lead Arrangers, BNP Paribas, as Facility Agent, Documentation Agent and Security Agent, and Societe Generale as Structuring Bank , dated October 29, 2010 (incorporated by reference to Exhibit 10.25 to the Annual Report on Form 10-K of Hughes Network Systems, LLC filed March 7, 2011 (File No. 333-138009)). | |
| 10.29* | Employment Agreement, dated December 23, 2010, between Hughes Communications, Inc. and Pradman P. Kaul. This Agreement is one of five substantially identical employment agreements and includes a schedule which identifies material details in which each agreement differs from the one that is filed herewith. | |
| 11* | Statement regarding computation of earnings per share. | |
| 12* | Statement of computation of ratio of earnings to fixed charges. | |
| 21.1* | List of Subsidiaries of Hughes Communications, Inc. |
132
Table of Contents
|
Exhibit |
Description | |
| 23.1* | Consent of Independent Registered Public Accounting Firm—Deloitte & Touche LLP | |
| 31.1* | Certification of Chief Executive Officer of Hughes Communications, Inc. pursuant to Section 302 of the Sarbanes-Oxley Act of 2002. | |
| 31.2* | Certification of Chief Financial Officer of Hughes Communications, Inc. pursuant to Section 302 of the Sarbanes-Oxley Act of 2002. | |
| 32* | Certification of Chief Executive Officer and Chief Financial Officer of Hughes Communications, Inc. pursuant to Section 906 of the Sarbanes-Oxley Act of 2002. |
| * | Filed herewith. |
133
Table of Contents
Financial Statements Schedules
Schedule I—Condensed Financial Information of the Registrant
The condensed financial information required by this schedule is included in Note 22—Commitments and Contingencies and Note 23—Supplemental Guarantor and Non-Guarantor Financial Information to the Company’s audited consolidated financial statements included in Item 8. Financial Statements and Supplementary Data of this report.
Schedule II—Valuation and Qualifying Accounts for the Years Ended December 31, 2010, 2009 and 2008
| Additional to | ||||||||||||||||||||
| Deductions - Descriptions |
Beginning Balance |
Costs and Expenses |
Other Accounts |
Deductions | Ending Balance |
|||||||||||||||
| (In thousands) | ||||||||||||||||||||
| Reserves and allowances deducted from asset accounts: |
||||||||||||||||||||
| Allowances for doubtful accounts: |
||||||||||||||||||||
| Year ended December 31, 2010 |
$ | 12,100 | $ | 32,642 | $ | - | $ | (29,585 | ) | $ | 15,157 | |||||||||
| Year ended December 31, 2009 |
$ | 9,551 | $ | 21,408 | $ | - | $ | (18,859 | ) | $ | 12,100 | |||||||||
| Year ended December 31, 2008 |
$ | 9,060 | $ | 15,198 | $ | - | $ | (14,707 | ) | $ | 9,551 | |||||||||
| Deferred tax valuation allowance: |
||||||||||||||||||||
| Year ended December 31, 2010 |
$ | 83,540 | $ | 3,535 | $ | - | $ | - | $ | 87,075 | ||||||||||
| Year ended December 31, 2009 |
$ | 43,080 | $ | 40,460 | $ | - | $ | - | $ | 83,540 | ||||||||||
| Year ended December 31, 2008 |
$ | 30,040 | $ | 13,040 | $ | - | $ | - | $ | 43,080 | ||||||||||
134
Table of Contents
Pursuant to the requirements of the Securities Exchange Act of 1934, the registrant has duly caused this report to be signed on its behalf by the undersigned thereunto duly authorized.
| Date: March 7, 2011 |
HUGHES COMMUNICATIONS, INC. (Registrant) | |||
| /s/ GRANT A. BARBER
| ||||
| Name: | Grant A. Barber | |||
| Title: | Executive Vice President and Chief Financial Officer (Principal Financial Officer) | |||
Pursuant to the requirements of the Securities Exchange Act of 1934, this Annual Report on Form 10-K has been signed below by the following persons on behalf of the registrant and in the capacities indicated.
| Signature | Title | Date | ||
| /S/ PRADMAN P. KAUL Pradman P. Kaul |
Chief Executive Officer, President and Director (Principal Executive Officer) |
March 7, 2011 | ||
| /S/ GRANT A. BARBER Grant A. Barber |
Executive Vice President and Chief Financial Officer (Principal Financial Officer) |
March 7, 2011 | ||
| /S/ THOMAS J. MCELROY Thomas J. McElroy |
Chief Accounting Officer (Principal Accounting Officer) |
March 7, 2011 | ||
| /S/ O. GENE GABBARD O. Gene Gabbard |
Director | March 7, 2011 | ||
| /S/ LAWRENCE J. RUISI Lawrence J. Ruisi |
Director | March 7, 2011 | ||
| /S/ MICHAEL D. WEINER Michael D. Weiner |
Director | March 7, 2011 | ||
| /S/ JEFFREY A. LEDDY Jeffrey A. Leddy |
Director | March 7, 2011 | ||
| /S/ ANDREW D. AFRICK Andrew D. Africk |
Director | March 7, 2011 | ||
| /S/ AARON J. STONE Aaron J. Stone |
Director | March 7, 2011 | ||
135