Attached files
Table of Contents
UNITED STATES
SECURITIES AND EXCHANGE COMMISSION
Washington, D. C. 20549
FORM 10-K
(Mark one)
| x | ANNUAL REPORT PURSUANT TO SECTION 13 OR 15(d) OF THE SECURITIES EXCHANGE ACT OF 1934 |
For the fiscal year ended December 31, 2010
| ¨ | TRANSITION REPORT PURSUANT TO SECTION 13 OR 15(d) OF THE SECURITIES EXCHANGE ACT OF 1934 |
Commission File Number: 000-51630
UNION DRILLING, INC.
(Exact name of registrant as specified in its charter)
| DELAWARE | 16-1537048 | |
| (State or other jurisdiction of incorporation or organization) |
(I.R.S. Employer Identification Number) | |
| 4055 International Plaza Suite 610 Fort Worth, Texas |
76109 | |
| (Address of principal executive offices) | (Zip Code) | |
Registrant’s telephone number, including area code: 817-735-8793
Registrant’s website: www.uniondrilling.com
Securities registered pursuant to Section 12(b) of the Act:
| Common Stock, $0.01 Par Value | NASDAQ Global Select Market | |
| (Title of each class) | (Name of each exchange on which registered) |
Securities registered pursuant to Section 12(g) of the Act: None
Indicate by check mark if the registrant is a well-known seasoned issuer, as defined in Rule 405 of the Securities Act. Yes ¨ No x
Indicate by check mark if the registrant is not required to file reports pursuant to Section 13 or Section 15(d) of the Exchange Act. Yes ¨ No x
Indicate by check mark whether the registrant: (1) has filed all reports required to be filed by Section 13 or 15(d) of the Securities Act of 1934 during the preceding 12 months (or for such shorter period that the registrant was required to file such reports), and (2) has been subject to such filing requirements for the past 90 days. Yes x No ¨
Indicate by check mark whether the registrant has submitted electronically and posted on its corporate Web site, if any, every Interactive Data File required to be submitted and posted pursuant to Rule 405 of Regulation S-T during the preceding 12 months (or for such shorter period that the registrant was required to submit and post such files). Yes ¨ No ¨
Indicate by check mark if disclosure of delinquent filers pursuant to Item 405 of Regulation S-K is not contained herein, and will not be contained, to the best of registrant’s knowledge, in definitive proxy or information statements incorporated by reference in Part III of this Form 10-K or any amendment to this Form 10-K. x
Indicate by check mark whether the registrant is a large accelerated filer, an accelerated filer, a non-accelerated filer or a smaller reporting company. See the definitions of “large accelerated filer,” “accelerated filer” and “smaller reporting company” in Rule 12b-2 of the Exchange Act. (Check one):
| Large accelerated filer | ¨ | Accelerated filer | x | |||
| Non-accelerated filer | ¨ (Do not check if a smaller reporting company) | Smaller reporting company | ¨ |
Indicate by check mark whether the registrant is a shell company (as defined in Rule 12b-2 of the Securities Exchange Act of 1934). Yes ¨ No x
The aggregate market value of the registrant’s voting and nonvoting common equity held by non-affiliates of the registrant as of June 30, 2010, the last business day of the registrant’s most recently completed second fiscal quarter, was $83,317,966 based on the last sales price of the registrant’s common stock on June 30, 2010 as reported on the NASDAQ Global Select Market. The determination of affiliate status for the purposes of this calculation is not necessarily a conclusive determination for other purposes. The calculation excludes shares held by directors and officers and by each stockholder whose ownership exceeded 10% of the Registrant’s outstanding Common Stock. Exclusion of these shares should not be construed to indicate that any such person controls, is controlled by or is under common control with the Registrant.
As of March 3, 2011, there were 25,182,345 shares of common stock, par value $0.01 per share, of the registrant issued and 23,182,345 shares outstanding.
DOCUMENTS INCORPORATED BY REFERENCE
Portions of the definitive proxy statement related to the registrant’s 2011 Annual Meeting of Stockholders to be held on June 9, 2011 to be filed subsequently with the Securities and Exchange Commission, are incorporated by reference into Part III of this Annual Report on Form 10-K.
Table of Contents
ii
Table of Contents
| Item 1. | Business |
We provide contract land drilling services and equipment to oil and natural gas producers in the United States. In addition to our drilling rigs, we provide the drilling crews and most of the ancillary equipment needed to operate our drilling rigs. We commenced operations in 1997 with 12 drilling rigs and related equipment acquired from an entity providing contract drilling services under the name “Union Drilling.” Through a combination of acquisitions, new rig construction and divestitures of older, smaller equipment, we currently operate a fleet of 71 marketed land drilling rigs. We presently focus our operations in selected oil and natural gas production regions in the United States. The drilling activity of our customers is highly dependent on many factors, including the market price of oil and natural gas, available capital, available drilling prospects, support services and market availability. These factors should not be considered an exhaustive list. See Item 1A. “Risk Factors.”
Many of our rigs operate in unconventional producing areas, which are characterized by formations with very low permeability rock, such as shales, tight sands and coal bed methane, or CBM, that require specialized drilling techniques to efficiently develop the oil or natural gas resources. Horizontal drilling is often used in these formations to increase the exposure of the wellbore to the oil or natural gas producing formation and increase drainage rates and production volumes. We have equipped 53 of our 71 rigs for drilling horizontal wells. As many of these areas are also characterized by hard rock formations entailing more difficult drilling conditions, we have equipped 50 of our 71 rigs with compressed air circulation systems, also known as underbalanced drilling, which provides higher penetration rates through hard rock formations when compared to traditional fluid-based circulation systems. We have also outfitted seven of our 71 rigs with walking or skidding systems which allow for multiple wells to be drilled in a single location to provide efficiency and to reduce the overall environmental impact. Moreover, we continue to enhance our fleet of drilling rigs with technological capabilities through upgrades, acquisitions or new rig construction in order to improve drilling productivity and reduce total well costs for our customers.
Our market
We provide drilling services to customers engaged in developing oil and natural gas bearing formations in selected areas of the United States. Our strategy is to focus on areas that have high growth potential, adequate takeaway capacity and low finding and development costs in order to maximize utilization and return on capital throughout the commodity price cycle. During 2010, oil prices rebounded while natural gas prices did not. In response to this development, we repositioned the majority of our Texas-based rigs that were previously drilling for natural gas into West Texas to drill for oil. In addition, several of our rigs drilling for natural gas are now concentrated in areas where the produced gas has a component of natural gas liquids that generate a higher return for our customers in the current price environment. Our principal operations are in the Appalachian Basin, extending from New York to Tennessee including the Marcellus, Huron, and Utica shales, as well as the Clinton, Medina, and Oriksany sands; the Arkoma Basin in eastern Oklahoma and Arkansas, including the Fayetteville, Caney, and Woodford shales; and the Fort Worth Basin in North Texas, including the Barnett Shale and in West Texas, the Permian and Delaware Basins.
Customers
We market our rigs to a number of customers, who are principally major or independent oil and natural gas producers. Repeat business from customers accounts for a substantial portion of our business. We do not invest in oil or natural gas properties and therefore, do not drill for our own account. In 2010, 2009 and 2008, we performed services for 78, 64, and 121 customers, respectively. In 2010, 2009 and 2008, our top 20 customers provided 80%, 89% and 71%, respectively, of our total revenue. The following table shows our three largest customers as a percentage of our total contract drilling revenue for each of the last three years.
3
Table of Contents
| Year |
Customer |
Total Contract Drilling Revenue Percentage |
||||
| 2010 | Exxon Mobil Corp (formerly XTO) | 26.9 | % | |||
| Chief Oil & Gas LLC | 14.0 | % | ||||
| Broad Oak Energy | 5.6 | % | ||||
| Total | 46.5 | % | ||||
| 2009 | Exxon Mobil Corp (formerly XTO) | 27.9 | % | |||
| Quicksilver Resources Inc. | 15.9 | % | ||||
| Chief Oil & Gas LLC | 10.9 | % | ||||
| Total | 54.7 | % | ||||
| 2008 | Exxon Mobile Corp (formerly XTO) | 17.7 | % | |||
| Quicksilver Resources Inc. | 12.4 | % | ||||
| Chief Oil & Gas LLC | 4.9 | % | ||||
| Total | 35.0 | % | ||||
Drilling contracts
We enter into written contracts with our customers for all rig deployments. The length of contracts has ranged from a one-well project to multi-year term for major exploration programs. Our contracts are obtained either through competitive bidding or through direct negotiations with customers. Our oil and natural gas drilling contracts provide for compensation on a daywork (fixed rate per day is charged) or footage (fixed rate per foot of hole drilled to a stated depth) basis. Contracts performed on a footage basis involve greater financial risk to us. In each of 2010 and 2009, approximately 96% of our revenues were derived from daywork contracts. The contract terms we offer generally depend on the complexity and risk of operations, the on-site drilling conditions, the type of equipment used and the anticipated duration of the work to be performed. In most instances, our contacts provide for additional payments related to rig mobilization and demobilization, as well as reimbursement of certain out-of-pocket costs.
As of December 31, 2010, we had 22 rigs under term contracts, which we define as a contract for drilling services with an original term in excess of six months. In some cases, a contract may be extended beyond the original term at prices mutually agreeable to us and the customer.
Our rig fleet
A land drilling rig consists of a derrick, a substructure, a hoisting system, a rotating system, pumps and holding tanks to circulate and clean drilling fluid, blowout preventers and other related equipment. Diesel engines are typically the main power sources for a drilling rig. There are numerous factors that differentiate land drilling rigs, including their power generation systems and their drilling depth capabilities. The actual drilling depth capability of a rig may be more or less than its rated depth capability due to numerous factors, including the size, weight and amount of the drill pipe on the rig. The intended well depth and the drill site conditions determine the amount of drill pipe and other equipment needed to drill a well.
Derrick hookload capacity and rig horsepower are the main drivers of depth rating. They determine a rig’s ability to lower, hoist and suspend casing and drilling pipe weight in the wellbore. Relative to total measured depth, horizontal wells have lower requirements on hookload and horsepower because casing, which is used to isolate the natural gas bearing formation from other geological features, is not run into the horizontal section of the well and once drill pipe is laying horizontally, its suspended weight and the power required to raise it decreases compared to a vertical wellbore of the same length.
We utilize rig horsepower to categorize our rigs into three sizes of rigs including small (less than 750 hp), medium (750-999 hp) and large rigs (>1,000 hp). During 2010, the overall improvement in the U.S. land drilling rig count was led by the large and medium rigs, and to a much lesser extent, the smaller rigs. At December 31, 2010, the utilization rates for our rigs were 100% for our large rigs, 71% for our medium rigs, and 30% for our small rigs.
4
Table of Contents
Circulating systems, which can be based on either fluid or compressed air, are used while drilling to evacuate cuttings and prevent the pipe from becoming stuck in the wellbore. Relative to vertical wells of the same measured depth, horizontal wells require greater circulating capability to move the cuttings from the horizontal section through a 90 degree curve to the initial vertical section of the wellbore.
The size and type of rig utilized depends, among other factors, upon well depth and site conditions. An active maintenance and replacement program during the life of a drilling rig permits upgrading of components on an individual basis. Over the life of a typical rig, due to the normal wear and tear of operating up to 24 hours a day, several of the major components, such as engines, air compressors, boosters and drill pipe, are replaced or rebuilt on a periodic basis as required. Other components, such as the substructure, mast and drawworks, can be utilized for extended periods of time with proper maintenance.
Our drilling rigs have engines that power the hoisting and rotating systems rated from 400 to 1,600 horsepower and derricks with weight suspension capacities from 110,000 to 760,000 pounds. Most of our rigs that are equipped for horizontal drilling have a pair of circulating pumps, each powered by engines that vary from 500 to 1,600 horsepower and our rigs that are capable of underbalanced drilling have two to four air compressors and one to two compression boosters, each with engines of 450 to 750 horsepower. Twenty-seven of our rigs also have top drive units that separate the power and control of the hoisting and rotating functions, which often provides better performance in horizontal drilling. Many larger drilling rigs capable of drilling in deep formations generate electricity from diesel engines and power electric motors attached to the equipment in the hoisting, rotating and circulating systems. We have eleven rigs of this design.
Due to the geologic characteristics in the Appalachian and Arkoma Basins, many of the wells drilled in these areas utilize underbalanced or air drilling. We believe that air drilling provides advantages over traditional fluid drilling techniques when drilling through hard rock formations. These advantages include improved drilling penetration rates, no fluid loss into the formation and minimized formation damage. We believe that we are one of the most experienced U.S. contractors using air drilling techniques.
We have outfitted seven of our rigs with either walking or skidding systems that allow for pad drilling, or drilling of multiple wellheads on one surface location in order to reduce the environmental impact of drilling because less surface area is disturbed, provide for less wear to our rig equipment and less time relocating the rig, all of which make it more efficient and less expensive to complete and produce the wells for our customers.
We believe that our drilling rigs and other related equipment are in good operating condition. Our employees perform periodic maintenance and repair work on our drilling rigs. We rely on various oilfield service companies for major repair work and overhaul of our drilling equipment when needed. We also engage in periodic improvement of our drilling equipment. In the event of major breakdowns or mechanical problems, our rigs could be subject to significant idle time and a resulting loss of revenue if the necessary repair services are not immediately available.
We also own a fleet of trucks that are used to move our rigs as well as bulldozers, forklifts, various vehicles and other equipment that is used to support the operation of our rigs.
The following table sets forth certain information regarding each of our marketed rigs as of February 28, 2011:
|
Rig # |
Division |
Drawworks |
Pumps |
Hook Load | ||||
| Rig 058 |
Appalachia | 1,600 | 1,600 | 750,000 | ||||
| Rig 054 |
Appalachia | 1,000 | 1,300 | 441,000 | ||||
| Rig 059 |
Appalachia | 1,000 | 1,600 | 400,000 | ||||
| Rig 060 |
Appalachia | 1,000 | 1,000 | 760,000 | ||||
| Rig 121 |
Appalachia | 1,000 | 1,600 | 500,000 | ||||
| Rig 207 |
Appalachia | 1,000 | 1,600 | 550,000 | ||||
| Rig 209 |
Appalachia | 1,000 | 1,300 | 550,000 | ||||
| Rig 021 |
Appalachia | 900 | 1,000 | 365,000 | ||||
| Rig 048 |
Appalachia | 900 | 1,000 | 410,000 |
5
Table of Contents
|
Rig # |
Division |
Drawworks |
Pumps |
Hook Load | ||||
| Rig 052 |
Appalachia | 900 | 1,600 | 365,000 | ||||
| Rig 124 |
Appalachia | 900 | 1,300 | 400,000 | ||||
| Rig 051 |
Appalachia | 850 | 800 | 300,000 | ||||
| Rig 053 |
Appalachia | 515 | 350 | 185,000 | ||||
| Rig 055 |
Appalachia | 515 | n/a | 185,000 | ||||
| Rig 056 |
Appalachia | 515 | n/a | 185,000 | ||||
| Rig 057 |
Appalachia | 515 | 550 | 185,000 | ||||
| Rig 037 |
Appalachia | 500 | 600 | 300,000 | ||||
| Rig 044 |
Appalachia | 500 | 800 | 275,000 | ||||
| Rig 045 |
Appalachia | 500 | n/a | 300,000 | ||||
| Rig 046 |
Appalachia | 500 | 1,000 | 300,000 | ||||
| Rig 001 |
Appalachia | 450 | 250 | 212,000 | ||||
| Rig 005 |
Appalachia | 450 | n/a | 240,000 | ||||
| Rig 015 |
Appalachia | 450 | 800 | 212,000 | ||||
| Rig 018 |
Appalachia | 450 | 400 | 224,000 | ||||
| Rig 020 |
Appalachia | 450 | 800 | 224,000 | ||||
| Rig 024 |
Appalachia | 450 | 600 | 300,000 | ||||
| Rig 025 |
Appalachia | 450 | 600 | 300,000 | ||||
| Rig 034 |
Appalachia | 450 | 600 | 300,000 | ||||
| Rig 035 |
Appalachia | 450 | 600 | 300,000 | ||||
| Rig 036 |
Appalachia | 450 | 600 | 300,000 | ||||
| Rig 042 |
Appalachia | 450 | 400 | 231,000 | ||||
| Rig 219 |
Arkoma | 1,500 | 1,600 | 750,000 | ||||
| Rig 122 |
Arkoma | 1,200 | 1,600 | 500,000 | ||||
| Rig 125 |
Arkoma | 1,000 | 1,600 | 500,000 | ||||
| Rig 126 |
Arkoma | 1,000 | 1,600 | 500,000 | ||||
| Rig 038 |
Arkoma | 900 | 900 | 358,000 | ||||
| Rig 047 |
Arkoma | 900 | 1,000 | 369,000 | ||||
| Rig 040 |
Arkoma | 800 | 800 | 358,000 | ||||
| Rig 104 |
Arkoma | 800 | 900 | 300,000 | ||||
| Rig 110 |
Arkoma | 800 | 1,000 | 500,000 | ||||
| Rig 112 |
Arkoma | 800 | 800 | 375,000 | ||||
| Rig 114 |
Arkoma | 800 | 800 | 250,000 | ||||
| Rig 116 |
Arkoma | 800 | 800 | 250,000 | ||||
| Rig 123 |
Arkoma | 800 | 1,000 | 390,000 | ||||
| Rig 211 |
Arkoma | 800 | 1,000 | 390,000 | ||||
| Rig 115 |
Arkoma | 700 | 900 | 250,000 | ||||
| Rig 032 |
Arkoma | 500 | 900 | 310,000 | ||||
| Rig 117 |
Arkoma | 500 | n/a | 110,000 | ||||
| Rig 119 |
Arkoma | 500 | 500 | 120,000 | ||||
| Rig 105 |
Arkoma | 450 | 800 | 260,000 | ||||
| Rig 220 |
Texas | 1,500 | 1,600 | 750,000 | ||||
| Rig 221 |
Texas | 1,500 | 1,600 | 750,000 | ||||
| Rig 222 |
Texas | 1,500 | 1,600 | 750,000 | ||||
| Rig 223 |
Texas | 1,500 | 1,600 | 750,000 | ||||
| Rig 224 |
Texas | 1,500 | 1,600 | 750,000 | ||||
| Rig 212 |
Texas | 1,400 | 1,300 | 420,000 | ||||
| Rig 216 |
Texas | 1,200 | 1,300 | 520,000 | ||||
| Rig 217 |
Texas | 1,000 | 1,300 | 550,000 | ||||
| Rig 225 |
Texas | 1,000 | 1,300 | 550,000 |
6
Table of Contents
|
Rig # |
Division |
Drawworks |
Pumps |
Hook Load | ||||
| Rig 227 |
Texas | 1,000 | 1,600 | 550,000 | ||||
| Rig 228 |
Texas | 1,000 | 1,300 | 550,000 | ||||
| Rig 229 |
Texas | 1,000 | 1,000 | 550,000 | ||||
| Rig 230 |
Texas | 1,000 | 800 | 650,000 | ||||
| Rig 214 |
Texas | 920 | 1000 | 390,000 | ||||
| Rig 206 |
Texas | 900 | 900 | 350,000 | ||||
| Rig 215 |
Texas | 900 | 1,000 | 420,000 | ||||
| Rig 226 |
Texas | 900 | 900 | 420,000 | ||||
| Rig 205 |
Texas | 750 | 800 | 350,000 | ||||
| Rig 210 |
Texas | 750 | 650 | 280,000 | ||||
| Rig 201 |
Texas | 650 | 500 | 300,000 | ||||
| Rig 203 |
Texas | 400 | 400 | 180,000 |
Competition
We encounter substantial competition from other land drilling contractors. The fact that drilling rigs are mobile and can be moved from one region to another in response to market conditions heightens the competition in the industry. Our principal competitors primarily include other publicly traded drilling companies and some of the larger, privately held drilling contractors. No single drilling company dominates within our regions. We believe crews, rig capability, pricing and rig availability are the primary factors our potential customers consider in determining which drilling contractor to select. In addition, we believe the following factors are important:
| • | the mobility and efficiency of the rigs; |
| • | the safety records of the rigs; |
| • | crew experience and skill; |
| • | customer relationships; |
| • | the offering of ancillary services; and |
| • | the ability to provide drilling equipment adaptable to, and personnel familiar with, current technologies and drilling techniques. |
While we must be competitive in our pricing, our strategy generally emphasizes the quality of our equipment, the safety record of our rigs and the experience of our rig crews to differentiate us from our competitors. Further, we have continued to enhance our safety and training initiatives including hiring a vice president of safety and training, investing in automation equipment across our fleet, rolling out behavior-based safety training to all levels of employees, and expanding our drug testing procedures.
Raw materials
The materials and supplies we use in our drilling operations include fuels, drill pipe and drill collars to operate drilling equipment, oil and lubricants to maintain equipment, paint and coating to protect equipment, as well as miscellaneous hardware, including hoses, belts, nuts and fasteners. We do not rely on a single source of supply for any of these items.
Seasonality
Certain of our operations in the Appalachian Basin are conducted in areas subject to extreme weather conditions and often in difficult terrain. During certain parts of the year, primarily in the winter and the spring, our operations are often hindered because of cold, snow or muddy conditions. Certain state and local governments impose restrictions on the movement of our equipment during parts of the year when the roads are susceptible to damage from the movement of heavy equipment. These restrictions are known as “frost laws.” Our operations can be limited from time to time by the difficulty of operating in certain weather conditions.
In the southern Appalachian Basin, our operations are limited primarily by winter weather in the fourth quarter and the first quarter. In the northern Appalachian Basin, our operations are limited primarily by the frost laws in the first quarter and the second quarter.
7
Table of Contents
Employees
As of February 28, 2011, we had approximately 1,220 employees. The number of employees fluctuates depending on the number of drilling projects we are engaged in at any particular time. None of our employment arrangements is subject to collective bargaining arrangements.
Government regulation and environmental matters
General
Many aspects of our operations are subject to federal, state and local, environmental, health and safety laws and regulations. We do not anticipate any material capital expenditures for environmental control facilities or extraordinary expenditures to comply with environmental rules and regulations in the foreseeable future. However, compliance costs under existing laws or under any new requirements could become material, and we could incur liability in any instance of noncompliance.
Environmental regulation
Our activities are subject to federal, state and local laws and regulations governing environmental quality, pollution control and the preservation of natural resources (including global climate change). These laws and regulations concern, among other things, air emissions, water use and disposal, the containment, disposal and recycling of waste materials, and reporting of the storage, use or release of certain chemicals or hazardous substances. Numerous federal and state environmental laws regulate drilling activities and impose liability for discharges of waste or spills, including those in coastal areas.
Except for the handling of waste directly generated from the operation and maintenance of our drilling rigs, such as waste oils and wash water, it is our practice, to the greatest extent practicable, to require our customers to contractually assume responsibility for compliance with environmental regulations. Laws and regulations protecting the environment have become more stringent in recent years, and may, in some circumstances, impose strict liability, rendering a person liable for environmental damage without regard to negligence or fault on the part of that person. These laws and regulations may expose us to liability for the conduct of or conditions caused by others, or for our own acts that were in compliance with all applicable laws at the time the acts were performed. The application of these requirements or adoption of new requirements could have a material adverse effect on us.
Environmental regulations that affect our customers also have an indirect impact on us. Increasingly stringent environmental regulation of the oil and natural gas industry has led to higher drilling costs and a more difficult and lengthy well permitting process. The primary environmental statutory and regulatory programs that affect our operations include The Oil Pollution Act of 1990 (OPA), and the Comprehensive Environmental Response, Compensation, and Liability Act, as amended (CERCLA). OPA pertains to the prevention of and response to spills or discharges of hazardous substances or oil into navigable waters. We have incurred no liability under OPA. CERCLA imposes liability, without regard to fault or the legality of the original conduct, on certain classes of persons with respect to the release of a “hazardous substance” into the environment. To date, we have not been named as a potentially responsible party under CERCLA.
Hazardous waste disposal
Our operations involve the generation or handling of materials that may be classified as hazardous waste and subject to various federal laws and comparable state statutes. The U.S. Environmental Protection Agency, or the EPA, and various state agencies have limited the disposal options for some hazardous and nonhazardous wastes. We believe that our operations are in material compliance with applicable environmental laws and regulations.
Health and safety matters
Our facilities and operations are also subject to the requirements of the federal Occupational Safety and Health Act, or OSHA, as well as comparable state and local laws that regulate the protection of worker health and safety. In addition, the OSHA hazard communication standard requires that we maintain certain information about any hazardous materials used or produced in our operations and that this information be provided to employees, state and local government authorities and citizens. We believe that our operations are in material compliance with OSHA requirements, including general industry standards, record keeping requirements and monitoring of occupational exposure to regulated substances.
8
Table of Contents
Trucking regulations
We operate a fleet of trucks to transport our drilling rigs and related equipment. We operate as a private motor carrier, not as a common carrier for hire. We are licensed to perform both intrastate and interstate trucking operations. As a private motor carrier, we are subject to certain safety regulations issued by the U.S. Department of Transportation, or DOT, and comparable state regulatory agencies. These trucking regulations cover, among other things, driver operations, maintaining log books, truck manifest preparations, the placement of safety placards on our regulated trucks and trailers, driver drug and alcohol testing, safety of operation and equipment, and several other aspects of truck operations. Our trucking operations are also subject to certain OSHA requirements when our employees are loading or unloading equipment at a drilling site. We believe our trucking operations are in material compliance with applicable regulations.
Available Information
We were incorporated in the State of Delaware in 1997. Our principal executive offices are located at 4055 International Plaza, Suite 610, Fort Worth, Texas 76109. Our telephone number is 817-735-8793.
We file annual, quarterly and current reports, proxy statements and other information with the Securities and Exchange Commission, or SEC. You may read and copy our reports, proxy statements and other information at the SEC’s public reference room at 100 F Street, N.E., Room 1580, Washington, D.C. 20549-0213. You can request copies of these documents at prescribed rates by writing to the SEC at Public Reference Section, SEC, 100 F Street, N.E., Washington, D.C. 20549-0213. Please call the SEC at 1 800-SEC-0330 for more information about the operation of the public reference room. Our SEC filings are also available at the SEC’s website at www.sec.gov. Because our common stock is listed on the NASDAQ Global Select Market, you may also inspect reports, proxy statements and other financial information about us at the offices of the NASDAQ Global Select Market, One Liberty Plaza, 165 Broadway, New York, New York 10006.
You may obtain a free copy of our annual reports on Form 10-K, quarterly reports on Form 10-Q and current reports on Form 8-K and amendments to those reports as soon as reasonably practicable after such reports have been filed with or furnished to the SEC on our website at www.uniondrilling.com or by contacting our Investor Relations Department at 817-735-8793. In addition, our Code of Ethics is available on our website.
| Item 1A. | Risk Factors |
Risks Relating to Our Business
We operate in a highly competitive industry with excess drilling capacity which can adversely affect our results of operations.
The contract land drilling services industry in which we operate is very competitive. Further, drilling rigs are mobile and can be moved from one region to another in response to market conditions, which heightens the competition in the industry. Over the last few years, there has been a substantial increase in the supply of land drilling rigs, whether through new construction or refurbishment. In recent months, while there has been an increase in land drilling activities, particularly oil and liquids-rich natural gas directed, it has been dominated by the large or higher performance rigs. As a result, there is currently excess capacity for smaller rigs. Excess capacity and price competition can negatively impact our revenue rates, utilization and profitability, as well as the value of our rig equipment, which could result in write-downs of our asset carrying values.
Our business and operations are substantially dependent upon, and affected by, the level of U.S. land-based oil and natural gas exploration and development activity, which has experienced significant volatility. If the level of that activity is depressed, our business and results of operations could be adversely affected.
Our business and operations are substantially dependent upon, and affected by, the level of U.S. land-based oil and natural gas exploration and development activity. Exploration and development activity determines the demand for contract land drilling and related services. We have no control over the factors driving the level of U.S. oil and natural gas exploration and development activity. If the level of that activity is depressed, our business and results of operations could be adversely affected. Other factors include, among others, the following:
| • | the market prices of oil and natural gas; |
9
Table of Contents
| • | market expectations about future prices of oil and natural gas; |
| • | the cost of producing and delivering oil and natural gas; |
| • | the capacity of the oil and natural gas pipeline network; |
| • | government regulations and trade restrictions; |
| • | the presence or absence of tax incentives; |
| • | national and international political and economic conditions; |
| • | levels of production by, and other activities of, the Organization of Petroleum Exporting Countries and other oil and natural gas producers; |
| • | the levels of imports of natural gas, whether by pipelines from Canada or Mexico or by tankers in the form of LNG; and |
| • | the development of alternate energy sources and the long-term effects of worldwide energy conservation measures. |
We cannot accurately predict the future level of demand for, or pricing of, oil and natural gas, for our contract drilling services or overall future conditions in the land-based contract drilling industry.
A weak global economy may affect the Company’s business.
As a result of volatility in natural gas prices and lingering uncertainty of when the global economic environment will experience a sustained recovery, the Company is unable to accurately predict the extent to which its customers will spend on exploration and development drilling or whether customers and /or vendors and suppliers will be able to access financing necessary to sustain or increase their current level of operations, fulfill their commitments and/or fund future operations and obligations. Furthermore, the Company is unable to predict the extent its existing customers will have continuing viability and capability to pay amounts owed to the Company. The overall weak economic environment continues to impact industry fundamentals, particularly demand for the smaller, conventional style drilling rigs. These conditions could have a material adverse effect on the Company’s business, including limiting the growth of our revenues and potential impairments of our rig fleet.
In the year ended December 31, 2010, we derived approximately 47% of our total revenues from our top three customers. The loss of any of our principal customers and the failure to remarket the rigs employed by those customers could have a material adverse effect on our financial condition and results of operations.
In the year ended December 31, 2010, our three largest customers accounted for approximately 27%, 14% and 6%, respectively, of our total revenues. Our principal customers may not continue to employ our services and we may not be able to successfully remarket the rigs. The loss of any of our principal customers and the failure to remarket the rigs utilized by those customers could have a material adverse effect on our financial condition and results of operations.
If we cannot keep our rigs utilized at profitable rates, our operating results could be adversely affected.
Our business has high fixed costs, and if we cannot keep our rigs utilized at profitable rates, our operating results could be adversely affected through reductions in our revenues and impairments of our rig fleet.
Increased competition in our drilling markets could adversely affect rates and utilization of our rigs, which could adversely affect our financial condition and results of operations.
We face competition from significantly larger domestic and international drilling contractors, many with greater resources. Their greater resources may enable them to allocate those resources into any of our regional markets. The additional competition in our markets, either by existing competitors or new entrants would increase the rig supply in those markets, which could adversely affect the rates we can charge and utilization levels we can achieve.
New technologies may cause our drilling methods or equipment to become less competitive, resulting in an adverse effect on our financial condition and results of operations.
Although we take measures to ensure that we use advanced oil and natural gas drilling technology, changes in technology or improvements in competitors’ equipment could make our equipment, especially our smaller, conventional rigs, less competitive or require significant capital investments to keep our equipment competitive.
10
Table of Contents
Term contracts may in certain instances be terminated without an early termination payment.
Term drilling contracts customarily provide for termination at the election of the customer, with an “early termination payment” to be paid to the Company if a contract is terminated prior to the expiration of the term. However, under certain limited circumstances, such as destruction of a drilling rig, limited capital resources of the customer or bankruptcy of the customer, no early termination payment may be paid to the Company or, if paid, not paid in full or in a timely manner. Even if an early termination payment is owed to the Company, the customer may not have the ability to timely pay (or pay at all) the early termination payment.
Increased or decreased demand among drilling contractors for consumable supplies, including fuel, and ancillary rig equipment, such as pumps, valves, drillpipe and engines, may lead to delays in obtaining these materials and our inability to operate our rigs in an efficient manner.
Most of our contracts provide that our customers bear the financial impact of increased fuel prices. However, prolonged shortages in the availability of fuel to run our drilling rigs resulting from action of the elements, warlike actions or other ‘Force Majeure’ events could result in the suspension of our contracts and have a material adverse effect on our financial condition and results of operations. We have periodically experienced increased lead times in purchasing ancillary equipment for our drilling rigs. To the extent there are significant delays in being able to purchase important components for our rigs, certain of our rigs may not be available for operation or may not be able to operate as efficiently as expected, which could adversely affect our financial condition and results of operations.
Reduced demand can drive suppliers from the market. With reduced suppliers, consumables for our operations may not be readily available. Additionally, suppliers may experience shortfalls in obtaining their materials and/or labor. Suppliers who have been regular providers to us may experience shortfalls and that may lead to delays as we secure other sources.
To the extent we acquire additional rigs in the future, we may experience difficulty integrating those acquisitions. Additionally, we may incur leverage to effect those acquisitions, which adds additional financial risk to our business. To the extent we incur additional leverage in financing acquisitions, it may adversely affect our financial position.
The process of integrating acquired rigs or newly constructed rigs may involve unforeseen difficulties and may require a disproportionate amount of management’s attention and other resources. We may not be able to successfully manage and integrate new rigs into our existing operations or successfully maintain the market share attributable to drilling rigs that we purchase. We also may encounter cost overruns related to newly constructed rigs or unexpected costs related to acquired rigs. To the extent we experience some or all of these difficulties, our financial condition could be adversely affected.
Expanding our fleet by building new rigs or acquiring rigs from third parties may cause us to incur additional financial leverage, increasing our financial risk, and debt service requirements, which could adversely affect our operating results and financial position.
We may decide to purchase or internally build additional drilling rigs and upgrade or refurbish some of our marketed drilling rigs. Any delay could result in a loss of revenue.
We may purchase or internally build additional drilling rigs and upgrade or refurbish some of our current drilling rigs. All of these projects are subject to risks of delay or cost overruns inherent in large construction projects. Among those risks are:
| • | shortages of equipment, materials or skilled labor; |
| • | long lead times or delays in the delivery of ordered materials and equipment; |
| • | engineering problems; |
| • | work stoppages; |
| • | weather interference; |
| • | availability of specialized services; and |
| • | cost increases. |
11
Table of Contents
These factors may contribute to delays in the delivery, upgrade or completion of the refurbishment of the drilling rigs, which could result in a loss of revenue. Additionally, we may incur higher costs than expected, which would adversely affect the economics of the investment in such rigs.
We may not be able to raise additional funds through public or private financings or additional borrowings, which could have a material adverse effect on our financial condition.
The contract drilling industry is capital intensive. Our cash flow from operations and the continued availability of credit are subject to a number of variables, including general economic conditions, and more specifically, our rig utilization rates, operating margins and ability to control costs and obtain contracts in a competitive industry. Our cash flow from operations and present borrowing capacity may not be sufficient to fund our anticipated acquisition program, capital expenditures and working capital requirements. We may from time to time seek additional financing, either in the form of bank borrowings, sales of debt or equity securities or otherwise. To the extent our capital resources and cash flow from operations are at any time insufficient to fund our activities or repay our indebtedness as it becomes due, we will need to raise additional funds through public or private financings or additional borrowings. We may not be able to obtain any such capital resources in the amount or at the time when needed. If we are at any time not able to obtain the necessary capital resources, our financial condition and results of operations could be materially adversely affected.
We could be adversely affected if we lost the services of certain of our senior officers and key employees.
The success of our business is highly dependent upon the services, efforts and abilities of certain key employees, such as our regional managers and of Christopher D. Strong, our President and Chief Executive Officer, Tina L. Castillo, our Chief Financial Officer and David S. Goldberg, our General Counsel. Our business could be materially and adversely affected by the loss of any of these individuals. We have limited employment agreements with some key employees. We do not maintain key man life insurance on the lives of any of our executive officers.
Competition for experienced technical personnel may negatively impact our operations or financial results.
We utilize highly skilled personnel in operating and supporting our business. In times of high utilization, it can be difficult to retain, and in some cases, find qualified individuals. Although to date our operations have not been materially affected by competition for personnel, an inability to obtain or find a sufficient number of qualified personnel could materially impact our business, financial condition and results of operations.
Our operations could be adversely affected by abnormally poor weather conditions.
Our operations are conducted in areas subject to poor weather conditions, and often in difficult terrain. Primarily in the winter and spring, our operations are often curtailed because of cold, snow or muddy conditions. Unusually severe weather conditions could further curtail our operations and could have a material adverse effect on our financial condition and results of operations.
We have limited control over the timing of payment of our deferred tax liabilities.
We currently have deferred tax liabilities and have limited control over the timing of the payment of these deferrals. These deferred liabilities could come due at a time when our revenues are reduced. This could cause tax payments to be due at a time when our cash flow from operations is reduced. Such a situation could have a material adverse effect on our financial condition.
Our operations are subject to hazards inherent in the land drilling business beyond our control. If those risks are not adequately insured or indemnified against, our results of operations could be adversely affected.
Our operations are subject to many hazards inherent in the land drilling business, including, but not limited to:
| • | blowouts; |
| • | craterings; |
| • | fires; |
| • | explosions; |
| • | equipment failures; |
| • | poisonous gas emissions; |
| • | loss of well control; |
12
Table of Contents
| • | loss of hole; |
| • | damaged or lost equipment; and |
| • | damage or loss from inclement weather or natural disasters. |
These hazards are to some extent beyond our control and could cause, among other things:
| • | personal injury or death; |
| • | serious damage to or destruction of property and equipment; |
| • | suspension of drilling operations; and |
| • | damage to the environment, including damage to producing formations and surrounding areas. |
Our insurance policies for public liability and property damage to others and injury or death to persons are in some cases subject to large deductibles and may not be sufficient to protect us against liability for all consequences of well disasters, personal injury, extensive fire damage or damage to the environment. We may not be able to maintain adequate insurance in the future at rates we consider reasonable, or particular types of coverage may not be available. The occurrence of events, including any of the above-mentioned risks and hazards, that are not fully insured against or the failure of a customer that has agreed to indemnify us against certain liabilities to meet its indemnification obligations could subject us to significant liability and could have a material adverse effect on our financial condition and results of operations.
Our operations are subject to environmental, health and safety laws and regulations that may expose us to liabilities for noncompliance, which could adversely affect us.
The U.S. oil and natural gas industry is affected from time to time in varying degrees by political developments and federal, state and local environmental, health and safety laws and regulations applicable to our business. Our operations are vulnerable to certain risks arising from the numerous environmental health and safety laws and regulations. These laws and regulations may restrict the types, quantities and concentration of various substances that can be released into the environment in connection with drilling activities, require reporting of the storage, use or release of certain chemicals and hazardous substances, require removal or cleanup of contamination under certain circumstances, and impose substantial civil liabilities or criminal penalties for violations. Environmental laws and regulations may impose strict liability, rendering a company liable for environmental damage without regard to negligence or fault, and could expose us to liability for the conduct of, or conditions caused by, others, or for our acts that were in compliance with all applicable laws at the time such acts were performed. Moreover, there has been a trend in recent years toward stricter standards in environmental, health and safety legislation and regulation, which may continue. While the scientific debate concerning the impact of human activities on world climate change continues, we recognize the need to minimize in a commercially reasonable manner our impact on the environment, including the release of greenhouse gases.
We may incur material liability related to our operations under governmental regulations, including environmental, health and safety requirements. We cannot predict how existing laws and regulations may be interpreted by enforcement agencies or court rulings, whether additional laws and regulations will be adopted, or the effect such changes may have on our business, financial condition or results of operations. Because the requirements imposed by such laws and regulations are subject to change, we are unable to forecast the ultimate cost of compliance with such requirements. The modification of existing laws and regulations or the adoption of new laws or regulations, both in the U.S. and globally, which directly or indirectly curtail exploratory or development drilling for oil and natural gas for economic, political, environmental or other reasons could have a material adverse effect on us by limiting drilling opportunities.
New legislation and regulatory initiatives relating to hydraulic fracturing could result in increased costs and additional operating restrictions or delays.
The EPA has commenced a study of the potential environmental impacts of hydraulic fracturing including the impact on drinking water sources and public health, and a committee of the U.S. House of Representatives is also conducting an investigation of hydraulic fracturing practices. Legislation has been introduced before Congress to provide for federal regulation of hydraulic fracturing and to require disclosure of the chemicals used in the fracturing process. In addition, some states (such as New York) have and others are considering adopting regulations that could restrict hydraulic fracturing in certain circumstances. Any new laws, regulations or permitting requirements regarding hydraulic fracturing could lead to operational delays, increased costs, or third party or governmental claims, and could result in additional burdens that could serve to delay or limit the drilling services we provide to third parties whose drilling operations could be impacted by these regulations or increase our costs of compliance and doing business as well as delay the development of unconventional gas resources from shale formations which are not commercial without the use of hydraulic fracturing.
13
Table of Contents
Our debt agreements contain restrictions that limit our flexibility in operating our business.
Our revolving credit facility contains various provisions that limit our ability to engage in specified types of transactions. These provisions limit our ability to, among other things:
| • | incur additional indebtedness; |
| • | issue certain preferred shares; |
| • | unless certain conditions are satisfied, pay dividends on or make distributions in respect of our capital stock or make other restricted payments; |
| • | make certain investments, including capital expenditures; |
| • | sell certain assets; |
| • | create liens; and |
| • | consolidate, merge, sell or otherwise dispose of all or substantially all of our assets. |
Risks Related to Our Common Stock
Our principal stockholder has significant ownership.
As of February 28, 2011, Union Drilling Company LLC, our principal stockholder, owned approximately 34% of our outstanding common stock. As a result, Union Drilling Company LLC and its affiliates may substantially influence the outcome of stockholder votes, including votes concerning the election of directors, the adoption or amendment of provisions in our certificate of incorporation or bylaws and the approval of mergers and other significant corporate transactions. The existence of this level of ownership concentration makes it less likely that any small holder of our common stock will be able to affect the management or direction of Union Drilling. These factors may also have the effect of delaying or preventing a change in the management or voting control of Union Drilling.
Trading volume of our common stock may contribute to its price volatility.
Our common stock is traded on the NASDAQ Global Select Market. During the period from January 1, 2010 through February 28, 2011, the average daily trading volume of our common stock as reported by the NASDAQ Global Select Market was 60,695 shares. There can be no assurance that a more or less active trading market in our common stock will develop. As a result, relatively small or large trades may have a disproportionate impact on the price of our common stock and, therefore, may contribute to the price volatility of our common stock. As a result, our common stock may be subject to greater price volatility than the stock market when taken as a whole, or comparable securities of other contract drilling service providers, who may or may not have greater volumes.
The market price of our common stock has been, and may continue to be, volatile. During the period from January 1, 2010 through February 28, 2011, the trading price of our common stock ranged from $4.28 to $8.66 per share. Because of the limited trading market of our common stock and the price volatility of our common stock, you may be unable to fully sell shares of our common stock when you desire or at a price you desire.
We do not intend to pay cash dividends on our common stock in the foreseeable future, and therefore only appreciation of the price of our common stock, which may not occur, will provide a return to our stockholders.
We currently anticipate that we will retain all future earnings, if any, to finance growth and development of our business. We do not intend to pay cash dividends in the foreseeable future. Any payment of cash dividends will depend upon our financial condition, capital requirements, earnings and other factors deemed relevant by our board of directors. In addition, the terms of our revolving credit facility restrict us from paying dividends and making other distributions unless certain conditions are satisfied. As a result, presently only appreciation of the price of our common stock, which may not occur, will provide a return to our stockholders.
Provisions in our certificate of incorporation and bylaws as well as Delaware corporate law may make a takeover difficult.
Provisions in our certificate of incorporation and bylaws, as well as Delaware corporate law, may make it difficult and expensive for a third party to pursue a tender offer, change in control or takeover attempt that is opposed by our board of directors. These anti-takeover provisions could substantially impede the ability of public stockholders to benefit from a change in control or in a change to our management and board of directors.
14
Table of Contents
| Item 1B. | Unresolved Staff Comments |
None.
| Item 2. | Properties |
Our principal executive offices are located in Fort Worth, Texas and include approximately 12,600 square feet of leased office space. Our contract drilling operations are conducted from eight field offices (three offices serving the Appalachian basin, three offices serving the Barnett and Permian basins, and two offices serving the Arkoma basin) which contain warehouse, office and yard space to support day-to-day operations, including the repair and maintenance of equipment, as well as the storage of equipment, inventory and supplies, and to facilitate administrative responsibilities and sales. We own three of our field office locations, while the rest are leased. We believe that none of the leased facilities is individually material to our operations and that our existing facilities are suitable and adequate to meet our needs.
| Item 3. | Legal Proceedings |
See Note 12 of the financial statements, included in “Item 8. Financial Statements and Supplementary Data” for a summary of our legal proceedings, such information being incorporated herein by reference.
| Item 4. | [Reserved] |
| Item 5. | Market for Registrant’s Common Equity, Related Stockholder Matters and Issuer Purchases of Equity Securities |
As of February 28, 2011, 23,182,345 shares of our common stock were outstanding. As of February 28, 2011, the number of holders of record of our common stock was seven.
Our common stock trades on the NASDAQ Global Select Market under the symbol “UDRL.” The following table sets forth, for each of the periods indicated, the high and low trading price per share for our common stock on the NASDAQ Global Select Market:
| Low | High | |||||||
| Fiscal Year 2010 |
||||||||
| Fourth quarter |
$ | 4.28 | $ | 8.00 | ||||
| Third quarter |
$ | 4.40 | $ | 6.49 | ||||
| Second quarter |
$ | 4.81 | $ | 7.08 | ||||
| First quarter |
$ | 5.79 | $ | 8.39 | ||||
| Fiscal Year 2009 |
||||||||
| Fourth quarter |
$ | 5.80 | $ | 8.29 | ||||
| Third quarter |
$ | 5.36 | $ | 7.91 | ||||
| Second quarter |
$ | 3.44 | $ | 10.25 | ||||
| First quarter |
$ | 2.51 | $ | 6.38 | ||||
The last reported sales price for our common stock on the NASDAQ Global Select Market on February 28, 2011 was $7.74 per share.
We have not paid or declared any cash dividends on our common stock and currently intend to retain earnings to fund our working capital needs and growth opportunities. Any future dividends will be at the discretion of our board of directors after taking into account various factors it deems relevant, including our financial condition and performance, cash needs, income tax consequences and the restrictions Delaware and other applicable laws and our credit facilities then impose. Our debt arrangements include provisions that generally place certain limits on payment of cash dividends and share repurchases.
15
Table of Contents
Equity Compensation Plan Information
The following table provides information as of December 31, 2010 about our common stock that may be issued upon the exercise of options, warrants and rights granted to employees, consultants or members of the board of directors under all of our existing equity compensation plans:
| Number of shares of common stock to be issued upon exercise of outstanding options, warrants and rights |
Weighted average exercise price per share of outstanding options warrants and rights |
Number of shares of common stock remaining available for future issuance under equity compensation plans (excluding shares reflected in column (a) ) |
||||||||||
| ( a ) | ( b ) | ( c ) | ||||||||||
| Equity compensation plans approved by security holders |
1,278,127(1) | $ | 9.66 | 372,617(2) | ||||||||
| (1) | Includes 176,545 shares of common stock issuable upon the exercise of options that were outstanding under our Amended and Restated 2000 Stock Option Plan and 1,101,582 shares of common stock issuable upon the exercise of options that were outstanding under our Amended and Restated 2005 Stock Incentive Plan, in each case, as of December 31, 2010. |
| (2) | These are available for future issuance under our Amended and Restated 2005 Stock Incentive Plan as of December 31, 2010. |
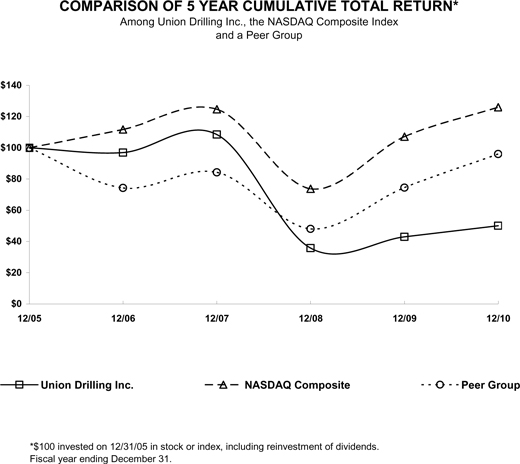
PERFORMANCE GRAPH
The following graph shows a comparison of the total cumulative returns over the past five year period of an investment of $100 in cash on November 22, 2005, the first trading day following our initial public offering, in (i) our common stock, (ii) the Nasdaq Composite Index, U.S. Companies, and (iii) a peer group index that the Company selected that includes 4 public companies within our industry. The companies that comprise the peer group index are Bronco Drilling Company, Inc., Helmerich & Payne, Inc., Patterson-UTI Energy, Inc. and Pioneer Drilling Company. The historical comparisons in the graph are required by the SEC and are not intended to forecast or be indicative of the possible future performance of our common stock. The graph assumes that all dividends have been reinvested (since November 2005, the Company has not declared any cash dividends).
| November 22, 2005 |
2006 | 2007 | 2008 | 2009 | 2010 | |||||||||||||||||||
| Union Drilling, Inc |
$ | 100 | $ | 97.71 | $ | 109.44 | $ | 36.02 | $ | 43.37 | $ | 50.10 | ||||||||||||
| NASDAQ Composite |
100 | 116.35 | 126.25 | 74.61 | 107.78 | 125.93 | ||||||||||||||||||
| Peer Group |
100 | 75.62 | 85.78 | 48.97 | 75.87 | 95.99 | ||||||||||||||||||
16
Table of Contents
The foregoing graph shall not be deemed to be “soliciting material” or to be “filed” with the Securities and Exchange Commission or subject to Regulation 14A or 14C under the Securities Exchange Act of 1934 and shall not be deemed incorporated by reference into any filing made by the Company under the Securities Act of 1933 or the Securities Exchange Act of 1934, notwithstanding any general statement contained in any such filing incorporating this Annual Report by reference, except to the extent the Company incorporates such graph by specific reference.
17
Table of Contents
| Item 6. | Selected Financial Data |
The following information derives from our audited financial statements. You should review this information in conjunction with “Management’s Discussion and Analysis of Financial Condition and Results of Operations” in Item 7 of this report and the historical financial statements and related notes this report contains.
| Year Ended December 31, | ||||||||||||||||||||
| 2010 | 2009 | 2008 | 2007 | 2006 | ||||||||||||||||
| (In thousands, except per share data) | ||||||||||||||||||||
| Revenues |
$ | 192,539 | $ | 168,922 | $ | 302,780 | $ | 289,035 | $ | 256,944 | ||||||||||
| (Loss) income from operations |
(25,330 | ) | (15,641 | ) | 20,389 | 53,291 | 54,487 | |||||||||||||
| (Loss) income before income taxes |
(24,982 | ) | (16,426 | ) | 20,361 | 52,852 | 54,270 | |||||||||||||
| Net (loss) income |
(16,068 | ) | (12,033 | ) | 7,750 | 30,832 | 31,852 | |||||||||||||
| (Loss) earnings per common share-basic |
(0.69 | ) | (0.55 | ) | 0.35 | 1.41 | 1.50 | |||||||||||||
| (Loss) earnings per common share-diluted |
(0.69 | ) | (0.55 | ) | 0.35 | 1.41 | 1.47 | |||||||||||||
| Long-term debt, including current portion and line of credit |
30,227 | 9,767 | 47,745 | 17,309 | 35,574 | |||||||||||||||
| Stockholders’ equity |
201,756 | 216,323 | 204,713 | 203,409 | 167,599 | |||||||||||||||
| Total assets |
300,010 | 293,010 | 336,605 | 277,308 | 257,418 | |||||||||||||||
| Calculation of EBITDA: |
||||||||||||||||||||
| Net (loss) income |
$ | (16,068 | ) | $ | (12,033 | ) | $ | 7,750 | $ | 30,832 | $ | 31,852 | ||||||||
| Interest expense |
1,005 | 794 | 845 | 1,824 | 527 | |||||||||||||||
| Income tax (benefit) expense |
(8,914 | ) | (4,393 | ) | 12,611 | 22,020 | 22,418 | |||||||||||||
| Depreciation and amortization |
49,932 | 47,719 | 44,298 | 39,072 | 24,820 | |||||||||||||||
| Impairment charge |
— | 4,069 | 7,909 | — | 1,000 | |||||||||||||||
| EBITDA |
$ | 25,955 | $ | 36,156 | $ | 73,413 | $ | 93,748 | $ | 80,617 | ||||||||||
EBITDA is earnings before net interest, income taxes, depreciation and amortization and non-cash impairment. The Company believes EBITDA is a useful measure of evaluating its financial performance because it is used by external users, such as investors, commercial banks, research analysts and others, to assess: (1) the financial performance of Union Drilling’s assets without regard to financing methods, capital structure or historical cost basis, (2) the ability of Union Drilling’s assets to generate cash sufficient to pay interest costs and support its indebtedness, and (3) Union Drilling’s operating performance and return on capital as compared to those of other entities in our industry, without regard to financing or capital structure. EBITDA is not a measure of financial performance under generally accepted accounting principles. However, EBITDA is a common alternative measure of operating performance used by investors, financial analysts and rating agencies. A reconciliation of EBITDA to net (loss) income is included above. EBITDA as presented may not be comparable to other similarly titled measures reported by other companies.
18
Table of Contents
| Item 7. | Management’s Discussion and Analysis of Financial Condition and Results of Operations |
This management’s discussion and analysis of financial condition and results of operations (“MD&A”) section of our Annual Report on Form 10-K discusses our results of operations, liquidity and capital resources, and certain factors that may affect our future results, including economic and industry-wide factors. You should read this MD&A in conjunction with our financial statements and accompanying notes included under Part II, Item 8, of this Annual Report.
Statements we make in the following MD&A discussion and in other parts of this report that express a belief, expectation or intention, as well as those which are not historical fact, are forward-looking statements within the meaning of the federal securities laws and are subject to risks, uncertainties and assumptions. These forward-looking statements may be identified by the use of words such as “expect,” “anticipate,” “believe,” “estimate,” “potential” or similar words. These matters include statements concerning management’s plans and objectives relating to our operations or economic performance and related assumptions, including general economic and business conditions and industry trends, the continued strength or weakness of the contract land drilling industry in the geographic areas in which we operate, decisions about onshore exploration and development projects to be made by oil and gas companies, the highly competitive nature of our business, our future financial performance, including availability, terms and deployment of capital, the continued availability of qualified personnel, and changes in, or our failure or inability to comply with, government regulations, including those relating to workplace safety and the environment. Although we believe that the expectations reflected in these forward-looking statements are reasonable, we can give no assurance that such expectations will prove to have been correct. Further, we specifically disclaim any duty to update any of the information set forth in this report, including any forward-looking statements. Forward-looking statements are made based on management’s current expectations and beliefs concerning future events and, therefore, involve a number of assumptions, risks and uncertainties, including the risk factors described in Item 1A, “Risk Factors,” above. Management cautions that forward-looking statements are not guarantees, and our actual results could differ materially from those expressed or implied in the forward-looking statements.
Company Overview
Union Drilling, Inc. (“Union Drilling,” “Company” or “we”) provides contract land drilling services and equipment, primarily to oil and natural gas producers. In addition to drilling rigs, we provide the drilling crews and most of the ancillary equipment needed to operate our drilling rigs.
We provide drilling services to customers engaged in developing oil and natural gas bearing formations in selected areas of the United States. Our strategy is to focus on areas that have high growth potential, adequate takeaway capacity and low finding and development costs in order to maximize utilization and return on capital throughout the commodity price cycle. During 2010, oil prices rebounded while natural gas prices did not. In response to this development, we repositioned the majority of our Texas-based rigs that were previously drilling for natural gas into West Texas to drill for oil. In addition, several of our rigs drilling for natural gas are now concentrated in areas where the produced gas has a component of natural gas liquids that generate a higher return for our customers in the current price environment. Our principal operations are in the Appalachian Basin, extending from New York to Tennessee including the Marcellus, Huron, and Utica shales, as well as the Clinton, Medina, and Oriksany sands; the Arkoma Basin in eastern Oklahoma and Arkansas, including the Fayetteville, Caney, and Woodford shales; and the Fort Worth Basin in North Texas, including the Barnett Shale and in West Texas, the Permian and Delaware Basins.
We commenced operations in 1997 with 12 drilling rigs and related equipment acquired from an entity providing contract drilling services under the name “Union Drilling.” Through a combination of acquisitions, new rig construction and divestitures of older, smaller equipment, we currently operate a fleet of 71 marketed land drilling rigs. We continue to enhance our fleet of drilling rigs with technological capabilities through upgrades, acquisitions or new rig construction in order to improve drilling productivity and reduce total well costs for our customers. At various times, we remove rigs from our marketed fleet, and the components are sold or made available for use on our other rigs.
Key Indicators of Financial Performance for Management
Key performance measurements in our industry are rig utilization, revenue per revenue day and operating expenses per revenue day. Revenue days for each rig are days when the rig is earning revenues under a contract, which is usually a period from the date the rig begins moving to the drilling location until the rig is released from the contract. We compute rig utilization rates by dividing revenue days by total available days during a period. Total available days are the number of calendar days during the period that we have owned the marketed rig.
19
Table of Contents
The following table summarizes management’s key indicators of financial performance for each of the three years in the period ended December 31, 2010:
| Years Ended December 31, | ||||||||||||
| 2010 | 2009 | 2008 | ||||||||||
| Revenue days |
12,735 | 9,700 | 17,538 | |||||||||
| Average number of marketed rigs |
71.0 | 71.0 | 71.0 | |||||||||
| Marketed rig utilization rates |
49.1 | % | 37.4 | % | 67.5 | % | ||||||
| Revenue per revenue day |
$ | 15,119 | $ | 17,415 | $ | 17,264 | ||||||
| Operating expenses per revenue day |
$ | 11,256 | $ | 11,129 | $ | 11,181 | ||||||
Our business is substantially dependent on and affected by the level of U.S. land-based oil and natural gas exploration and development activity. As a result of the decline in natural gas prices commencing in the second half of 2008, overall demand for drilling services correspondingly decreased and we reached a utilization trough in the third quarter of 2009. Since that time, particularly during 2010, we experienced improvement in our marketed rig utilization rates due to a shift to oil drilling and relatively stable demand for natural gas drilling in shale plays. However, as term contracts with higher rates expired and re-priced in the current market, our revenue per revenue day declined in 2010 compared to 2009. In conjunction with the improvement of our marketed rig utilization, we incurred additional start up costs to return idled rigs to operations, which also decreased our drilling margin per revenue day.
We devote substantial resources to maintaining and upgrading our rig fleet. On a regular basis, we remove certain rigs from service to perform upgrades. In the short term, these actions result in fewer revenue days and slightly lower utilization; however, in the long term, we believe the upgrades will help the marketability of the rigs and improve their operating performance.
Critical Accounting Policies and Estimates
Revenue and cost recognition. We generate revenue principally by drilling wells for oil and natural gas producers under daywork or footage contracts, which provide for the drilling of single or multiple well projects. Revenues on daywork contracts are recognized based on the days worked at the dayrate each contract specifies. Mobilization fees are recognized as the related drilling services are provided. We recognize revenues on footage contracts based on the footage drilled for the applicable accounting period. Expenses are recognized based on the costs incurred during that same accounting period. Reimbursements received for out-of-pocket expenses are recorded as revenues and direct expenses.
Accounts receivable. We evaluate the creditworthiness of our customers based on their financial information, if available, information obtained from major industry suppliers, and our past experiences, if any, with the customer. In some instances, we require new customers to make prepayments. We typically invoice our customers semi-monthly during the performance of the contracts and upon completion of the contract, with payment due within 30 days. We established an allowance for doubtful accounts of $0.2 million and $1.4 million at December 31, 2010 and 2009, respectively. Any allowance established is subject to judgment and estimates made by management. We determine our allowance by considering a number of factors, including the length of time trade accounts receivable are past due, our previous loss history, our assessment of our customers’ current abilities to pay obligations to us and the condition of the general economy and the oil and natural gas industry as a whole. Our bad debt expense was $0.1 million, $1.1 million and $6.3 million for 2010, 2009 and 2008, respectively. We write off specific accounts receivable when we determine they are uncollectible. During 2010, we wrote off $1.3 million of accounts receivable for one customer. During 2009, we wrote off $1.2 million of accounts receivable for two customers.
At December 31, 2010 and 2009, our unbilled receivables totaled $1.4 million and $1.6 million, respectively, all of which relates to the revenue recognized, but not yet billed, on contracts in progress at December 31, 2010 and 2009, respectively. The $0.2 million decrease at December 31, 2010 compared to December 31, 2009 is due to the timing of progress billings.
20
Table of Contents
Asset impairments. We assess the impairment of long-lived assets whenever events or circumstances indicate that the asset’s carrying value may not be recoverable. Factors that could trigger an impairment review would be any significant negative trends in the industry or the general economy, our contract revenue rates, our rig utilization rates, cash flows generated from operating our drilling rigs, existence of term drilling contracts, current and future oil and natural gas prices, industry analysts’ outlook for the oil and gas industry and their view of our customers’ access to capital and the trends in the price of used drilling equipment observed by our management. If a review of our long-lived assets indicates that our carrying value exceeds the estimated undiscounted future cash flows, an impairment charge is made to adjust the carrying value to the estimated fair value. Cash flows are estimated by management considering factors such as expectations of future industry trends and the impact on dayrates, utilization and operating expenses; historical performance of the asset; the remaining expected life of the asset; any cash investment required to make the asset more marketable; suitability, specification and size of the rig; terminal value, as well as overall competitive dynamics. Use of different assumptions could result in an impairment charge different from that reported.
In 2010, no impairments were required due to modestly improving conditions in the U.S. land-based drilling industry.
Depreciation. We provide for depreciation of our drilling rigs, transportation and other equipment on a straight line method over useful lives that we have estimated and that range from two to 12 years. Unlike depreciation based on units-of-production, our approach to depreciation does not change when equipment becomes idle or when utilization changes. We continue to depreciate idled equipment on a straight-line basis despite the fact that our revenues and operating costs may vary with changes in utilization levels. Our estimates of the useful lives of our drilling, transportation and other equipment are based on our experience in the drilling industry with similar equipment.
Deferred taxes. We record deferred taxes for the basis difference in our property and equipment between financial reporting and tax reporting purposes and other costs such as compensation, employee benefits and other accrued liabilities which are deductible in different periods for financial reporting and tax reporting purposes. For property and equipment, basis differences arise from differences in depreciation periods and methods and the value of assets acquired in a business acquisition where we acquire the stock of an entity rather than its assets. For financial reporting purposes, we depreciate the various components of our drilling rigs and refurbishments over two to 12 years, while federal income tax rules require that we depreciate drilling rigs and refurbishments over five years. In 2009 and 2008, tax depreciation also included bonus depreciation allowed as a result of the American Recovery and Reinvestment Act of 2009 and the Economic Stimulus Act of 2008, respectively. In 2010, bonus depreciation is not expected to create any current tax benefit and is not included in our tax depreciation calculations. In the earlier years of our ownership of a drilling rig, our tax depreciation may often exceed our financial reporting depreciation, resulting in our recording deferred tax liabilities on this depreciation difference. In later years, financial reporting depreciation exceeds tax depreciation, and the deferred tax liability begins to reverse.
Accrued workers’ compensation. The Company accrues for costs under our workers’ compensation insurance program in accrued expenses and other liabilities. We have a deductible of $100,000 per covered accident under our workers’ compensation insurance. Our insurance policies require us to maintain letters of credit to cover our deductible payments. As of December 31, 2010 and 2009, we satisfied this requirement with letters of credit totaling $4.3 million and $4.8 million, respectively. We accrue for these costs as claims are incurred based on cost estimates established for each claim by the insurance companies providing the administrative services for processing the claims, including estimates for incurred but not reported claims, claims paid directly by us, administrative costs associated with these claims, and our historical experience with these types of claims. In addition, as needed, we accrue the estimated workers compensation premium payable to Ohio, a monopolistic state, when our rigs work in that state.
Stock-based compensation. Compensation cost resulting from share-based payment awards are measured at fair value and recognized in general and administrative expense on a straight line basis over the requisite service period. The amount of compensation cost recognized at any date is at least equal to the portion of the grant-date fair value of the award that is vested at that date. For the years ended December 31, 2010, 2009 and 2008, the Company recorded stock-based compensation expense of $1.3 million ($0.8 million net of tax), $1.8 million ($1.1 million net of tax), and $2.1 million ($1.5 million net of tax), respectively. Total unamortized stock-based compensation was approximately $3.7 million at December 31, 2010, and will be recognized over a weighted average service period of 3.5 years. Any tax benefit realized from stock options exercised is included as a cash inflow from financing activities on the statement of cash flows.
21
Table of Contents
Estimating the fair value of options granted requires us to utilize valuation models and to establish several underlying assumptions. The fair value of option grants was estimated using the Black-Scholes option valuation model based on the following weighted average assumptions:
| 2010 | 2009 | 2008 | ||||
| Risk-free interest rate |
1.4% - 1.6% | 2.1% - 2.6% | 1.6% - 2.5% | |||
| Expected life |
5 years | 5 years | 5 years | |||
| Dividend yield |
0% | 0% | 0% | |||
| Expected volatility |
77% - 78% | 74% - 75% | 52% - 61% |
The risk-free interest rate is the implied yield available for zero-coupon U.S. government issues with a remaining term equal to the expected life of the options.
The expected lives of the options are determined based on the Company’s expectations of individual option holders’ anticipated behavior and the term of the option.
The Company has not paid out dividends historically; thus, the dividend yield is estimated at zero percent.
Volatility is based upon price performance of the Company and prior to November 2010 included a peer company, as the Company did not have a sufficient historical price base to determine potential volatility over the term of the issued options.
Results of Operations
Our operations primarily consist of drilling oil or natural gas wells for our customers under either daywork contracts and, to a lesser extent, footage contracts. Contract terms we offer generally depend on the complexity and risk of operations, the on-site drilling conditions, the type of equipment used, the anticipated duration of the work to be performed and the overall demand for rigs in our markets. Our contracts generally provide for the drilling of a specified number of wells or a specific period of time for which the rig will be under contract.
Statements of Operations Analysis
The following table provides selected information about our operations for the years ended December 31, 2010, 2009 and 2008 (in thousands).
| Years Ended December 31, | ||||||||||||
| 2010 | 2009 | 2008 | ||||||||||
| Revenues |
$ | 192,539 | $ | 168,922 | $ | 302,780 | ||||||
| Operating expenses |
143,348 | 107,956 | 196,100 | |||||||||
| Depreciation and amortization |
49,932 | 47,719 | 44,298 | |||||||||
| Impairment charge |
— | 4,069 | 7,909 | |||||||||
| General and administrative expense |
24,589 | 24,819 | 34,084 | |||||||||
| Interest expense |
1,005 | 794 | 845 | |||||||||
| Other income and gain on disposal of assets |
1,353 | 9 | 817 | |||||||||
| Effective income tax rate |
35.7 | % | 26.7 | % | 61.9 | % | ||||||
Revenues. The $23.6 million or 14% increase in revenues in 2010 compared to 2009 was primarily due to the increase in our marketed rig utilization from 37.4% in 2009 to 49.1% in 2010, as a result of the improvement in the level of U.S. land-based drilling that began in the second half of 2009 particularly directed for oil drilling, and partially offset by lower dayrates.
The $133.9 million, or 44% decrease in revenues in 2009 compared to 2008 was primarily due to the decrease in our marketed rig utilization, from 67.5% in 2008 to 37.4% in 2009, as a result of the decline in the level of U.S. land-based natural gas exploration and development activity that began in the second half of 2008.
22
Table of Contents
Operating expenses. Our operating expenses in 2010 compared to 2009 increased $35.4 million, or 33%, primarily due to the increase in marketed rig utilization, additional costs incurred to prepare certain idled rigs to return to operation during 2010 and increased safety training and supplies costs. In addition, employment costs increased beginning in the first half of 2010 as the Company restored wage reductions that were implemented in 2009 in response to the deteriorating market conditions.
The $88.1 million, or 45% decrease in operating expenses in 2009 compared to 2008 was due to the decrease in our marketed rig utilization. Employment costs, fuel, supplies and repairs and maintenance costs decreased as a result of having a greater number of idled rigs compared to the prior year.
Depreciation and amortization. The $2.2 million, or 5%, increase in depreciation and amortization expense in 2010 compared to 2009 was due to the increase in depreciable assets, resulting from three rig purchases and various other capital equipment upgrades in 2010 that enhanced our fleet capabilities. Capital expenditures were $60.3 million in 2010.
The $3.4 million, or 8% increase in depreciation and amortization expense in 2009 compared to 2008 was primarily due to the increase in depreciable assets. During the first half of 2009, rig purchases and capital equipment upgrades were added to our fleet as part of our 2008 capital spending program. Capital expenditures were $31.5 million in 2009.
Impairment charge. During 2010, there were no impairment charges recognized while in 2009, $4.1 million of impairment charges were recognized related to certain long-lived assets to write down the carrying value of these assets to fair value. The $7.9 million impairment charge in 2008 was related to goodwill impairment recognized in the fourth quarter of 2008.
General and administrative expenses. Our general and administrative expenses decreased slightly, or $0.2 million, in 2010 compared to 2009. This decrease was primarily due to a $1.0 million decrease in the provision for doubtful accounts, as well as lower corporate insurance rates and property taxes in 2010 compared to 2009. These decreases were partially offset by higher employment costs due to increased headcount as well as consulting fees related to a new information system conversion and implementation.
The $9.3 million, or 27% decrease in 2009 compared to 2008 was primarily due to a $5.2 million decrease in the provision for doubtful accounts, as well as decreased employment costs and other cost reductions in response to the decrease in operations.
Interest expense. The $211,000 increase in interest expense in 2010 compared to 2009 was primarily attributable to the increase in the average balance of our revolving credit, proceeds of which were used to partially fund our 2010 capital spending program. There was no significant change in interest expense in 2009 compared to 2008.
Other income and gain on disposal of assets. Other income and gain (loss) on disposal of assets increased $1.3 million in 2010 compared to 2009 due to a gain on the settlement of a rig physical insurance claim as well as gains from the disposal of non-core assets.
The $808,000 decrease in other income and gain (loss) on disposal of assets in 2009 over 2008 is primarily due to fewer gains on disposal of drillpipe. In addition, 2008 includes a $400,000 gain on involuntary conversions related to rig damages.
Taxes. Our effective income tax rates of 35.7%, 26.7%, and 61.9% for 2010, 2009 and 2008, respectively, differ from the federal statutory rate of 35%, primarily due to the non-deductible goodwill impairment charge in 2008, and the domestic manufacturing deduction in 2009, state income taxes and permanent book/tax differences such as those associated with the 50% deduction limitation on per diem meals expense, the domestic manufacturing deduction and stock-based compensation. See Note 6 to our Financial Statements for further information on our income taxes.
The increase in income tax benefit in 2010 compared to 2009 was primarily due to the increase in pre-tax loss in 2010, as well as an increase in the effective income tax rates in 2010.
At December 31, 2010 and 2009, we had federal net operating loss carryforwards for income tax purposes of approximately $23.3 million and $98,000, respectively. These losses may be carried forward for 20 years and will begin to expire in 2023. State net operating loss carryforwards at December 31, 2010 and 2009 were $43.6 million and $22.3 million, respectively. State net operating loss carryforwards vary as to carryforward period and will begin
23
Table of Contents
to expire in 2014, depending upon the jurisdiction where applied. At December 31, 2010 and 2009, a valuation allowance of $70,000 and $61,000, respectively, was established for state net operating loss carryforwards in states where utilization is uncertain due to lack of forecasted future operations. Based upon 2010 results and forecasted future operations, we believe it is more likely than not that the remaining amounts will be realized.
The Company’s 2006 through 2009 U.S. federal income and 2006 and 2007 employment tax returns are currently under examination by the IRS. Although we believe our tax estimates are reasonable, the final determination of tax audits could be materially different than that which is reflected in our tax provisions and accruals.
Liquidity and Capital Resources
Our operations have historically generated sufficient cash flow to meet our requirements for debt service and equipment expenditures (excluding major business and asset acquisitions). Cash flow provided by operating activities was $34.9 million, $58.5 million and $73.0 million during 2010, 2009 and 2008, respectively. The decrease in cash flows provided by operating activities in 2010 compared to 2009 was primarily due to the improvement in timing of accounts receivable collections in 2009. This resulted in lower accounts receivable balances which has been continued throughout 2010. The decrease in 2009 compared to 2008 was primarily due to the decrease in rig utilization in 2009.
Our cash flow from operations primarily was used to invest in new machinery and equipment as well as for capitalized upgrades to our fleet. During 2010, 2009 and 2008, cash used in investing activities totaled $55.6 million, $43.9 million and $91.1 million, respectively.
For the year ended December 31, 2010, our cash flow from financing activities was $20.7 million, consisting primarily of the $21.1 million increase in our net borrowings on our Revolving Credit and Security Agreement and other debt. Cash flow used in financing activities was $15.0 million for 2009. In June 2009, the Company completed a public offering consisting of 3.0 million shares of newly issued common stock at a price of $8.25 per share. Proceeds to the Company, net of underwriting discounts and other fees and expenses, were $23.2 million and were used to repay indebtedness outstanding under the Company’s revolving credit facility. In June 2009, we used $2.5 million in borrowings on our credit facility to pay off certain notes payable for equipment with interest rates higher than the revolving credit facility. In addition, in January 2009, we purchased 285,182 shares of common stock for $1.6 million under a repurchase program. For the year ended December 31, 2008, our cash flow from financing activities was $18.4 million, consisting primarily of the $33.1 million increase in our net borrowings on our revolving credit facility and other debt, and partially offset by $8.9 million used for treasury stock purchases during the fourth quarter of 2008.
We believe cash generated by our operations and our ability to borrow the currently unused portion of our revolving credit facility of approximately $63.2 million, after reductions for approximately $4.3 million outstanding letters of credit as of December 31, 2010, should allow us to meet our routine financial obligations for the foreseeable future.
Sources of Capital Resources
Our rig fleet has grown from 12 rigs in 1997 to 71 marketed rigs at December 31, 2010. We have financed this growth with a combination of debt and equity financing, as well as operating cash flows. At December 31, 2010, our total debt to total capital was approximately 13.0%.
See Note 8 of the financial statements, included in “Item 8. Financial Statements and Supplementary Data” for a summary of our capital resources, such information being incorporated herein by reference.
24
Table of Contents
Uses of Capital Resources
For the years ended December 31, 2010 and 2009, the additions to our property and equipment consisted of the following (in thousands):
| Years Ended December 31, | ||||||||
| 2010 | 2009 | |||||||
| Buildings |
$ | — | $ | 47 | ||||
| Leasehold improvements |
— | 16 | ||||||
| Drilling rigs and related equipment |
57,191 | 31,173 | ||||||
| Vehicles |
210 | 257 | ||||||
| Information systems |
2,908 | 15 | ||||||
| Furniture and fixtures |
— | 2 | ||||||
| Property and equipment additions |
$ | 60,309 | $ | 31,510 | ||||
| Plus adjustments for non-cash transactions: |
||||||||
| Cash paid in current period for prior period accruals |
810 | 13,824 | ||||||
| Current period accruals |
(2,616 | ) | (810 | ) | ||||
| Asset exchange |
— | (8 | ) | |||||
| Cash used for purchases of machinery and equipment |
$ | 58,503 | $ | 44,516 | ||||
Our capital expenditures program in 2010 included the purchase of three rigs and partial payments associated with a fourth rig. In addition, we upgraded and enhanced several of the existing rigs and related equipment in our fleet with pad drilling systems, top drives, larger drawworks and higher horsepower mud pumps. In 2010, we began a process of implementing a new information system that we put into production in January 2011.
Additions to drilling equipment during 2009 includes $18.3 million for progress payments related to four rigs that became available for service during the second quarter of 2009, which were included in our 2008 capital spending program.
25
Table of Contents
Working Capital
Our working capital decreased from $23.0 million at December 31, 2009 to $11.6 million at December 31, 2010. Our current ratio, which we calculate by dividing our current assets by our current liabilities, was 1.5 and 2.6 at December 31, 2010 and 2009, respectively.
The changes in the components of our working capital were as follows (in thousands):
| December 31, | ||||||||||||
| 2010 | 2009 | Change | ||||||||||
| Cash and cash equivalents |
$ | 4 | $ | 6 | $ | (2 | ) | |||||
| Accounts receivable |
29,901 | 22,732 | 7,169 | |||||||||
| Inventories |
1,252 | 1,944 | (692 | ) | ||||||||
| Income tax recoverable |
1,023 | 8,913 | (7,890 | ) | ||||||||
| Prepaid expenses, deposits and other receivables |
2,112 | 2,391 | (279 | ) | ||||||||
| Deferred taxes |
1,186 | 1,169 | 17 | |||||||||
| Current assets |
35,478 | 37,155 | (1,677 | ) | ||||||||
| Accounts payable |
13,076 | 8,180 | 4,896 | |||||||||
| Current portion of notes payable for equipment |
173 | 598 | (425 | ) | ||||||||
| Financed insurance premiums |
909 | 855 | 54 | |||||||||
| Accrued expenses and other liabilities |
9,696 | 4,511 | 5,185 | |||||||||
| Current liabilities |
23,854 | 14,144 | 9,710 | |||||||||
| Working capital |
$ | 11,624 | $ | 23,011 | $ | (11,387 | ) | |||||
The $7.2 million increase in accounts receivable at December 31, 2010 compared to December 31, 2009 was primarily due to the increase in revenue in 2010 compared to 2009.
The $7.9 decrease in income tax recoverable at December 31, 2010 compared to December 31, 2009 was primarily due to $8.9 million in tax refunds received in 2010, partially offset by a $1.1 million tax payment in 2010 related to an amended 2008 federal tax return. We expect to recover the remaining IRS refunds in 2011.
The $4.9 million increase in accounts payable at December 31, 2010 from December 31, 2009 was primarily due to increased operating expenses in 2010 compared to 2009, as well as an increase in capital expenditures.
Accrued expenses and other liabilities increased $5.2 million at December 31, 2010 from December 31, 2009 primarily due to a $1.5 million increase in accrued payroll as a result of increased headcount and four more days accrued due to pay cycle timing. In addition, our workers’ compensation claims accrual increased $2.2 million, of which $500,000 related to five of our employees injured in a fire at a drill site in West Virginia in June 2010 and $700,000 related to the prior policy year premium refund received in September 2010. The remaining increase is attributable to increased headcount and related medical accruals, as well as higher operating expenses from improved utilization.
Long-term Debt
Our long-term debt at December 31, 2010 and 2009 consisted of the following (in thousands):
| December 31, | ||||||||
| 2010 | 2009 | |||||||
| Revolving credit facility |
$ | 30,054 | $ | 8,996 | ||||
| Long-term notes payable for equipment |
— | 173 | ||||||
| $ | 30,054 | $ | 9,169 | |||||
26
Table of Contents
Contractual Obligations
The following table includes all of our contractual obligations of the type specified below at December 31, 2010 (in thousands):
| Contractual Obligations |
Total | Less than 1 year |
1-3 years | 4 - 5 years |
More than 5 years |
|||||||||||||||
| Revolving credit facility (a) |
$ | 30,054 | $ | — | $ | 30,054 | $ | — | $ | — | ||||||||||
| Notes payable for equipment |
173 | 173 | — | — | — | |||||||||||||||
| Operating lease obligations |
2,029 | 1,285 | 744 | — | — | |||||||||||||||
| Purchase obligations for fleet upgrades |
10,831 | 10,831 | — | — | — | |||||||||||||||
| Interest on notes payable |
1 | 1 | — | — | — | |||||||||||||||
| Total |
$ | 43,088 | $ | 12,290 | $ | 30,798 | $ | — | $ | — | ||||||||||
| (a) | The amount included in the table above represents principal maturities only. See “Item 7A. Quantitative and Qualitative Disclosures About Market Risk” for information regarding estimated future interest payment obligations under long-term debt obligations and Note 8 of Notes to Financial Statements included in “Item 8. Financial Statements and Supplementary Data.” |
Inflation
Inflation did not have a significant effect on our results of operations in any of the periods reported. While we experienced some mild inflationary pressure in the second half of 2008 relating to labor, certain materials and equipment costs and fuel expense, throughout 2009 and 2010 we experienced no meaningful impacts to our business from any inflationary pressure. Management believes it is possible for some inflationary pressure to arise if the U.S. economic recovery becomes more certain; however, there is no current belief that inflation will have a significant effect on our operations in 2011.
Off Balance Sheet Arrangements
We do not currently have any off balance sheet arrangements.
Recently Issued Accounting Standards
See Note 2 of the financial statements, included in “Item 8. Financial Statements and Supplementary Data.”, for recently issued accounting standards, such information being incorporated herein by reference.
| Item 7A. | Quantitative and Qualitative Disclosures About Market Risk |
We are subject to market risk exposure related to changes in interest rates on our revolving credit facility, which provides for interest on borrowings under the facility at a floating rate. At December 31, 2010, we had $30.0 million outstanding debt on our revolving credit facility. An increase or decrease of 1% in the interest rate would have a corresponding decrease or increase in our interest expense of approximately $300,000 annually.
27
Table of Contents
| Item 8. | Financial Statements and Supplementary Data |
UNION DRILLING, INC.
INDEX TO FINANCIAL STATEMENTS
28
Table of Contents
REPORT OF INDEPENDENT REGISTERED PUBLIC
ACCOUNTING FIRM
The Board of Directors and Stockholders of
Union Drilling, Inc.
We have audited Union Drilling, Inc.’s (the “Company”) internal control over financial reporting as of December 31, 2010, based on criteria established in Internal Control – Integrated Framework issued by the Committee of Sponsoring Organizations of the Treadway Commission (the COSO criteria). Union Drilling, Inc.’s management is responsible for maintaining effective internal control over financial reporting, and for its assessment of the effectiveness of internal control over financial reporting included in the accompanying Management’s Report on Internal Control Over Financial Reporting. Our responsibility is to express an opinion on the Company’s internal control over financial reporting based on our audit.
We conducted our audit in accordance with the standards of the Public Company Accounting Oversight Board (United States). Those standards require that we plan and perform the audit to obtain reasonable assurance about whether effective internal control over financial reporting was maintained in all material respects. Our audit included obtaining an understanding of internal control over financial reporting, assessing the risk that a material weakness exists, testing and evaluating the design and operating effectiveness of internal control based on the assessed risk, and performing such other procedures as we considered necessary in the circumstances. We believe that our audit provides a reasonable basis for our opinion.
A company’s internal control over financial reporting is a process designed to provide reasonable assurance regarding the reliability of financial reporting and the preparation of financial statements for external purposes in accordance with generally accepted accounting principles. A company’s internal control over financial reporting includes those policies and procedures that (1) pertain to the maintenance of records that, in reasonable detail, accurately and fairly reflect the transactions and dispositions of the assets of the company; (2) provide reasonable assurance that transactions are recorded as necessary to permit preparation of financial statements in accordance with generally accepted accounting principles, and that receipts and expenditures of the company are being made only in accordance with authorizations of management and directors of the company; and (3) provide reasonable assurance regarding prevention or timely detection of unauthorized acquisition, use, or disposition of the company’s assets that could have a material effect on the financial statements.
Because of its inherent limitations, internal control over financial reporting may not prevent or detect misstatements. Also, projections of any evaluation of effectiveness to future periods are subject to the risk that controls may become inadequate because of changes in conditions, or that the degree of compliance with the policies or procedures may deteriorate.
In our opinion, Union Drilling, Inc. maintained, in all material respects, effective internal control over financial reporting as of December 31, 2010, based on the COSO criteria.
We also have audited, in accordance with the standards of the Public Company Accounting Oversight Board (United States), the balance sheets of Union Drilling, Inc. as of December 31, 2010 and 2009 and the related statements of operations, stockholders’ equity, and cash flows for each of the three years in the period ended December 31, 2010 and our report dated March 4, 2011 expressed an unqualified opinion thereon.
/s/ Ernst & Young LLP
Fort Worth, Texas
March 4, 2011
29
Table of Contents
Report of Independent Registered Public Accounting Firm
The Board of Directors and Stockholders
of Union Drilling, Inc.
We have audited the accompanying balance sheets of Union Drilling, Inc. (the “Company”) as of December 31, 2010 and 2009, and the related statements of operations, stockholders’ equity, and cash flows for each of the three years in the period ended December 31, 2010. These financial statements are the responsibility of the Company’s management. Our responsibility is to express an opinion on these financial statements based on our audits.
We conducted our audits in accordance with the standards of the Public Company Accounting Oversight Board (United States). Those standards require that we plan and perform the audit to obtain reasonable assurance about whether the financial statements are free of material misstatement. An audit includes examining, on a test basis, evidence supporting the amounts and disclosures in the financial statements. An audit also includes assessing the accounting principles used and significant estimates made by management, as well as evaluating the overall financial statement presentation. We believe that our audits provide a reasonable basis for our opinion.
In our opinion, the financial statements referred to above present fairly, in all material respects, the financial position of Union Drilling, Inc. at December 31, 2010 and 2009, and the results of its operations and its cash flows for each of the three years in the period ended December 31, 2010, in conformity with U.S. generally accepted accounting principles.
We also have audited, in accordance with the standards of the Public Company Accounting Oversight Board (United States), Union Drilling, Inc.’s internal control over financial reporting as of December 31, 2010, based on criteria established in Internal Control – Integrated Framework issued by the Committee of Sponsoring Organizations of the Treadway Commission and our report dated March 4, 2011 expressed an unqualified opinion thereon.
/s/ Ernst & Young LLP
Fort Worth, Texas
March 4, 2011
30
Table of Contents
Balance Sheets
(in thousands, except share and per share data)
| December 31, | ||||||||
| 2010 | 2009 | |||||||
| Assets: |
||||||||
| Current assets: |
||||||||
| Cash and cash equivalents |
$ | 4 | $ | 6 | ||||
| Accounts receivable (net of allowance for doubtful accounts of $153 and $1,379 at December 31, 2010 and 2009, respectively) |
29,901 | 22,732 | ||||||
| Inventories |
1,252 | 1,944 | ||||||
| Income tax recoverable |
1,023 | 8,913 | ||||||
| Prepaid expenses, deposits and other receivables |
2,112 | 2,391 | ||||||
| Deferred taxes |
1,186 | 1,169 | ||||||
| Total current assets |
35,478 | 37,155 | ||||||
| Intangible assets (net of accumulated amortization of $920 and $618 at December 31, 2010 and 2009, respectively) |
1,280 | 1,582 | ||||||
| Property, buildings and equipment (net of accumulated depreciation of $239,362 and $194,197 at December 31, 2010 and 2009, respectively) |
263,210 | 254,063 | ||||||
| Other assets |
42 | 210 | ||||||
| Total assets |
$ | 300,010 | $ | 293,010 | ||||
| Liabilities and Stockholders’ Equity: |
||||||||
| Current liabilities: |
||||||||
| Accounts payable |
$ | 13,076 | $ | 8,180 | ||||
| Current portion of notes payable for equipment |
173 | 598 | ||||||
| Financed insurance premiums |
909 | 855 | ||||||
| Accrued expense and other liabilities |
9,696 | 4,511 | ||||||
| Total current liabilities |
23,854 | 14,144 | ||||||
| Revolving credit facility |
30,054 | 8,996 | ||||||
| Long-term notes payable for equipment |
— | 173 | ||||||
| Deferred taxes |
44,089 | 53,157 | ||||||
| Customer advances and other long-term liabilities |
257 | 217 | ||||||
| Total liabilities |
98,254 | 76,687 | ||||||
| Stockholders’ equity: |
||||||||
| Common stock, par value $.01 per share; 75,000,000 shares authorized; 25,182,345 shares and 25,123,103 shares issued at December 31, 2010 and 2009, respectively |
252 | 251 | ||||||
| Additional paid-in capital |
170,788 | 169,288 | ||||||
| Retained earnings |
41,179 | 57,247 | ||||||
| Treasury stock; 2,000,000 shares at each of December 31, 2010 and 2009, respectively |
(10,463 | ) | (10,463 | ) | ||||
| Total stockholders’ equity |
201,756 | 216,323 | ||||||
| Total liabilities and stockholders’ equity |
$ | 300,010 | $ | 293,010 | ||||
See accompanying notes to financial statements.
31
Table of Contents
Statements of Operations
(in thousands, except share and per share data)
| Years Ended December 31 | ||||||||||||
| 2010 | 2009 | 2008 | ||||||||||
| Revenues |
$ | 192,539 | $ | 168,922 | $ | 302,780 | ||||||
| Cost and expenses |
||||||||||||
| Operating expenses |
143,348 | 107,956 | 196,100 | |||||||||
| Depreciation and amortization |
49,932 | 47,719 | 44,298 | |||||||||
| Impairment charge |
— | 4,069 | 7,909 | |||||||||
| General and administrative |
24,589 | 24,819 | 34,084 | |||||||||
| Total cost and expenses |
217,869 | 184,563 | 282,391 | |||||||||
| Operating (loss) income |
(25,330 | ) | (15,641 | ) | 20,389 | |||||||
| Interest expense |
(1,005 | ) | (794 | ) | (845 | ) | ||||||
| Gain (loss) on disposal of assets |
1,351 | (112 | ) | 606 | ||||||||
| Other income |
2 | 121 | 211 | |||||||||
| (Loss) income before income taxes |
(24,982 | ) | (16,426 | ) | 20,361 | |||||||
| Income tax (benefit) expense |
(8,914 | ) | (4,393 | ) | 12,611 | |||||||
| Net (loss) income |
$ | (16,068 | ) | $ | (12,033 | ) | $ | 7,750 | ||||
| (Loss) earnings per common share: |
||||||||||||
| Basic |
$ | (0.69 | ) | $ | (0.55 | ) | $ | 0.35 | ||||
| Diluted |
$ | (0.69 | ) | $ | (0.55 | ) | $ | 0.35 | ||||
| Weighted-average common shares outstanding: |
||||||||||||
| Basic |
23,167,131 | 21,796,868 | 21,890,273 | |||||||||
| Diluted |
23,167,131 | 21,796,868 | 22,005,118 | |||||||||
See accompanying notes to financial statements.
32
Table of Contents
Statements of Stockholders’ Equity
(in thousands, except share data)
| Common Stock | Additional Paid-In Capital |
Retained Earnings |
Treasury Stock |
Total | ||||||||||||||||||||
| Shares | $ | |||||||||||||||||||||||
| Balance at January 1, 2008 |
21,974,884 | $ | 220 | $ | 141,659 | $ | 61,530 | $ | — | $ | 203,409 | |||||||||||||
| Compensation costs included in net income |
— | — | 1,899 | — | — | 1,899 | ||||||||||||||||||
| Exercise of stock options and related tax benefit of $139 |
49,497 | — | 555 | — | — | 555 | ||||||||||||||||||
| Purchase of treasury stock |
(1,714,818 | ) | — | — | — | (8,900 | ) | (8,900 | ) | |||||||||||||||
| Net income |
— | — | — | 7,750 | — | 7,750 | ||||||||||||||||||
| Balance at December 31, 2008 |
20,309,563 | 220 | 144,113 | 69,280 | (8,900 | ) | 204,713 | |||||||||||||||||
| Compensation costs included in net loss |
— | — | 1,774 | — | — | 1,774 | ||||||||||||||||||
| Exercise of stock options |
98,722 | 1 | 247 | — | — | 248 | ||||||||||||||||||
| Purchase of treasury stock |
(285,182 | ) | — | — | — | (1,563 | ) | (1,563 | ) | |||||||||||||||
| Issuance of common shares, net of $1,566 issue costs |
3,000,000 | 30 | 23,154 | — | — | 23,184 | ||||||||||||||||||
| Net loss |
— | — | — | (12,033 | ) | — | (12,033 | ) | ||||||||||||||||
| Balance at December 31, 2009 |
23,123,103 | 251 | 169,288 | 57,247 | (10,463 | ) | 216,323 | |||||||||||||||||
| Compensation costs included in net loss |
— | — | 1,275 | — | — | 1,275 | ||||||||||||||||||
| Exercise of stock options |
59,242 | 1 | 225 | — | — | 226 | ||||||||||||||||||
| Net loss |
— | — | — | (16,068 | ) | — | (16,068 | ) | ||||||||||||||||
| Balance at December 31, 2010 |
23,182,345 | $ | 252 | $ | 170,788 | $ | 41,179 | $ | (10,463 | ) | $ | 201,756 | ||||||||||||
See accompanying notes to financial statements.
33
Table of Contents
Statements of Cash Flows
(in thousands)
| Year Ended December 31, | ||||||||||||
| 2010 | 2009 | 2008 | ||||||||||
| Operating activities: |
||||||||||||
| Net (loss) income |
$ | (16,068 | ) | $ | (12,033 | ) | $ | 7,750 | ||||
| Adjustments to reconcile net (loss) income to net cash provided by operating activities: |
||||||||||||
| Depreciation and amortization |
49,932 | 47,719 | 44,298 | |||||||||
| Impairment charge |
— | 4,069 | 7,909 | |||||||||
| Amortization of stock-based compensation expense |
1,275 | 1,774 | 1,899 | |||||||||
| Provision for doubtful accounts |
97 | 1,072 | 6,318 | |||||||||
| (Gain) loss on disposal of assets |
(1,351 | ) | 112 | (606 | ) | |||||||
| Provision for deferred taxes |
(9,085 | ) | 3,680 | 20,190 | ||||||||
| Excess tax benefits from share-based payment arrangements |
— | — | (139 | ) | ||||||||
| Changes in operating assets and liabilities: |
||||||||||||
| Accounts receivable |
(7,266 | ) | 20,908 | (11,152 | ) | |||||||
| Inventories |
692 | 495 | (335 | ) | ||||||||
| Income tax recoverable, prepaid expenses and deposits |
8,337 | 734 | (4,940 | ) | ||||||||
| Accounts payable |
3,090 | (4,690 | ) | 4,760 | ||||||||
| Accrued expenses and other liabilities |
5,225 | (5,344 | ) | (2,904 | ) | |||||||
| Cash flow provided by operating activities |
34,878 | 58,496 | 73,048 | |||||||||
| Investing activities: |
||||||||||||
| Purchases of machinery and equipment |
(58,503 | ) | (44,516 | ) | (94,107 | ) | ||||||
| Proceeds from sale of machinery and equipment |
2,883 | 598 | 3,023 | |||||||||
| Cash flow used in investing activities |
(55,620 | ) | (43,918 | ) | (91,084 | ) | ||||||
| Financing activities: |
||||||||||||
| Borrowings on line of credit |
218,661 | 189,178 | 329,013 | |||||||||
| Repayments on line of credit |
(197,603 | ) | (222,827 | ) | (295,946 | ) | ||||||
| Cash overdrafts |
— | 276 | (3,669 | ) | ||||||||
| Borrowings - other debt |
992 | 1,149 | 634 | |||||||||
| Repayments - other debt |
(1,536 | ) | (4,623 | ) | (3,265 | ) | ||||||
| Proceeds from stock offering, net of issue costs |
— | 23,184 | — | |||||||||
| Purchases of treasury stock |
— | (1,563 | ) | (8,900 | ) | |||||||
| Exercise of stock options |
226 | 248 | 416 | |||||||||
| Excess tax benefits from share-based payment arrangements |
— | — | 139 | |||||||||
| Cash flow provided by (used in) financing activities |
20,740 | (14,978 | ) | 18,422 | ||||||||
| Net (decrease) increase in cash |
(2 | ) | (400 | ) | 386 | |||||||
| Cash and cash equivalents at beginning of period |
6 | 406 | 20 | |||||||||
| Cash and cash equivalents at end of period |
$ | 4 | $ | 6 | $ | 406 | ||||||
See accompanying notes to financial statements.
34
Table of Contents
NOTES TO FINANCIAL STATEMENTS
1. Organization and Description of Business
Union Drilling, Inc. (“Union Drilling”, “Company” or “we”), incorporated in Delaware in 1997, provides contract land drilling services and equipment, primarily to oil and natural gas producers. In addition to our drilling rigs, we provide the drilling crews and most of the ancillary equipment needed to operate our drilling rigs. We commenced operations with 12 drilling rigs and related equipment acquired from an entity providing contract drilling services under the name “Union Drilling.” Through a combination of acquisitions, new rig construction and divestitures of older, smaller equipment, we currently operate a fleet of 71 marketed land drilling rigs. We presently focus our operations in selected oil and natural gas production regions in the United States, primarily the Fort Worth Basin in North Texas, the Permian Basin in West Texas, the Arkoma Basin in Oklahoma and Arkansas and throughout the Appalachian Basin.
We market our rigs to a number of customers, who are principally major or independent oil and natural gas producers. Revenues from the top ten customers for the year ended December 31, 2010 represented 68% of total revenues with two customers’ revenue totaling 27% and 14%, respectively. Revenues from the top ten customers for the year ended December 31, 2009 represented approximately 76% of total revenues with three customers’ revenue totaling 28%, 16% and 11% respectively. Revenues from the top ten customers for the year ended December 31, 2008 represented approximately 56% of total revenues with two customers’ revenue totaling 18% and 12%, respectively.
2. Summary of Significant Accounting Policies
Basis of Presentation
The financial statements relate solely to the accounts of Union Drilling, Inc. The Company has no controlling financial interests in any entity which would require consolidation.
Use of Estimates
The preparation of financial statements in conformity with accounting principles generally accepted in the United States requires management to make estimates and assumptions that affect the amounts reported in the financial statements and accompanying notes. Actual results may differ from those estimates.
Cash and Cash Equivalents
The Company considers all highly liquid investments with an original maturity date of three months or less when purchased to be cash equivalents.
Accounts Receivable
We evaluate the creditworthiness of our customers based on their financial information, if available, information obtained from major industry suppliers, and our past experiences, if any, with the customer. In some instances, we require new customers to make prepayments. We typically invoice our customers semi-monthly during the performance of the contracts and upon completion of the contract, with payment due within 30 days. We established an allowance for doubtful accounts of $0.2 million and $1.4 million at December 31, 2010 and 2009, respectively. Any allowance established is subject to judgment and estimates made by management. We determine our allowance by considering a number of factors, including the length of time trade accounts receivable are past due, our previous loss history, our assessment of our customers’ current abilities to pay obligations to us and the condition of the general economy and the oil and natural gas industry as a whole. We write off specific accounts receivable when we determine they are uncollectible. See Note 4 for additional information on the allowance for doubtful accounts.
Our contract drilling work in progress relates to the revenue recognized, but not yet billed, on contracts in progress at the balance sheet date.
35
Table of Contents
Inventories
Inventories maintained by the Company are primarily engines and consumable replacement parts. Inventories are maintained on a first-in, first-out basis, and recorded at the lower of cost or net realizable value.
Prepaid Expenses, Deposits and Other Receivables
Prepaid expenses, deposits and other receivables include items such as insurance, taxes, utility deposits, fees and insurance claim receivables. We routinely expense our prepaid expenses in the normal course of business over the periods these expenses benefit. A detail of prepaid expenses, deposits and other receivables is as follows:
| December 31, | ||||||||
| 2010 | 2009 | |||||||
| Prepaid insurance |
$ | 1,404 | $ | 1,307 | ||||
| Deposits |
496 | 491 | ||||||
| Unamortized loan costs |
168 | 168 | ||||||
| Sales tax recoverable |
— | 130 | ||||||
| Insurance premiums recoverable |
— | 245 | ||||||
| Other |
44 | 50 | ||||||
| $ | 2,112 | $ | 2,391 | |||||
Goodwill and Intangible Assets
In light of the adverse market conditions affecting our common stock price beginning in the fourth quarter of 2008, we recorded an impairment charge of $7.9 million for goodwill associated with the 2005 purchase of Thornton Drilling Company. We utilized multiple market approaches to estimate the fair value of goodwill. In developing these fair value estimates, there was considerable judgment involved, particularly in determining the valuation methodologies to utilize and the weighting of different valuation methodologies applied. Certain key assumptions included the trading day period over which to assess market capitalization, implied control premium, multiple of earnings before interest, income taxes, depreciation and amortization and forecasted operating results. Our first step of the impairment test, which required us to compare the estimated fair value of the reporting unit to the carrying value, indicated that our goodwill was impaired. We then measured the impairment by allocating the fair value to the identifiable assets and liabilities of the reporting unit based on respective fair values and there was no residual value for goodwill; accordingly, we wrote off the entire carrying amount of goodwill.
Our customer list is amortized over the estimated benefit period which was initially determined to be 20 years, but in 2009, was revised to 10 years based on actual historical customer turnover. This change in estimate, from 16.3 years remaining at December 31, 2008 to 5.3 years remaining at December 31, 2009, increased the annual amortization from $110,000 to $302,000. Depreciation and amortization includes amortization of intangibles of $302,000, $206,000 and $281,000 for the years ended December 31, 2010, 2009 and 2008, respectively. The remaining life at December 31, 2010 is 4.3 years.
The total cost and accumulated amortization of intangible assets are as follows (in thousands):
| December 31, | ||||||||
| 2010 | 2009 | |||||||
| Customer list |
$ | 2,200 | $ | 2,200 | ||||
| Accumulated amortization |
(920 | ) | (618 | ) | ||||
| Intangible assets, net |
$ | 1,280 | $ | 1,582 | ||||
36
Table of Contents
Property, Buildings and Equipment
Property, buildings and equipment is stated at cost, net of accumulated depreciation. The Company capitalizes costs of replacements or renewals that improve or extend the lives of existing property, buildings and equipment. Maintenance and repairs are expensed as incurred. Depreciation is calculated on the straight-line method over the estimated remaining useful lives of the assets. Depreciation on acquired or constructed rigs and other components commences when the assets are ready for use. Once placed in service, depreciation continues when assets are being repaired, refurbished or between periods of deployment. As a result, our depreciation charges will not vary with changes in utilization levels, unlike our revenue. Our estimates of the useful lives of our drilling, transportation and other equipment are based on our experience in the drilling industry with similar equipment. For the years ended December 31, 2010, 2009 and 2008, depreciation expense was $49.6 million, $47.5 million and $44.0 million, respectively.
The estimated lives of the assets are as follows:
| Buildings |
30 - 40 years | |||
| Drilling rigs and related equipment |
2 - 12 years | |||
| Vehicles |
5 - 7 years |
Impairment of Long-Lived Assets
We assess the impairment of long-lived assets whenever events or circumstances indicate that the asset’s carrying value may not be recoverable. Factors that could trigger an impairment review would be any significant negative trends in the industry or the general economy, our contract revenue rates, our rig utilization rates, cash flows generated from operating our drilling rigs, existence of term drilling contracts, current and future oil and natural gas prices, industry analysts’ outlook for the oil and gas industry and their view of our customers’ access to capital and the trends in the price of used drilling equipment observed by our management. If a review of our long-lived assets indicates that our carrying value exceeds the estimated undiscounted future cash flows, an impairment charge is made to adjust the carrying value to the estimated fair value. Cash flows are estimated by management considering factors such as expectations of future industry trends and the impact on dayrates, utilization and operating expenses; historical performance of the asset; the remaining expected life of the asset; any cash investment required to make the asset more marketable; suitability, specification and size of the rig; terminal value; as well as overall competitive dynamics. Use of different assumptions could result in an impairment charge different from that reported.
Accrued Workers’ Compensation
The Company accrues for costs under our workers’ compensation insurance program in accrued expenses and other liabilities. We have a deductible of $100,000 per covered accident under our workers’ compensation insurance. Our insurance policies require us to maintain letters of credit to cover our deductible payments. As of December 31, 2010 and 2009, we satisfied this requirement with letters of credit totaling $4.3 million and $4.8 million, respectively. We accrue for these costs as claims are incurred based on cost estimates established for each claim by the insurance companies providing the administrative services for processing the claims, including an estimate for incurred but not reported claims, claims paid directly by us, administrative costs associated with these claims and our historical experience with these types of claims. In addition, as needed, we accrue the estimated workers’ compensation premium payable to Ohio, a monopolistic state, when our rigs work in that state.
Stock-Based Compensation
Compensation cost resulting from share-based payment awards are measured at fair value and recognized in general and administrative expense on a straight line basis over the requisite service period. The amount of compensation cost recognized at any date is at least equal to the portion of the grant-date fair value of the award that is vested at that date. For the years ended December 31, 2010, 2009 and 2008, the Company recorded stock-based compensation expense of $1.3 million ($0.8 million net of tax), $1.8 million ($1.1 million net of tax) and $2.1 million ($1.5 million net of tax), respectively. Total unamortized stock-based compensation was approximately $3.7 million at December 31, 2010, and will be recognized over a weighted average service period of 3.5 years. Any tax benefit realized from stock options exercised is included as a cash inflow from financing activities on the statement of cash flows.
37
Table of Contents
Estimating the fair value of options granted requires us to utilize valuation models and to establish several underlying assumptions. The fair value of option grants was estimated using the Black-Scholes option valuation model based on the following weighted average assumptions:
| 2010 | 2009 | 2008 | ||||
| Risk-free interest rate |
1.4% - 1.6% | 2.1% - 2.6% | 1.6% - 2.5% | |||
| Expected life |
5 years | 5 years | 5 years | |||
| Dividend yield |
0% | 0% | 0% | |||
| Expected volatility |
77% - 78% | 74% - 75% | 52% - 61% | |||
The risk-free interest rate is the implied yield available for zero-coupon U.S. government issues with a remaining term equal to the expected life of the options.
The expected lives of the options are determined based on the Company’s expectations of individual option holders’ anticipated behavior and the term of the option.
The Company has not paid out dividends historically; thus, the dividend yield is estimated at zero percent.
Volatility is based upon price performance of the Company and prior to November 2010 included a peer company, as the Company did not have a sufficient historical price base to determine potential volatility over the term of the issued options.
Revenue Recognition
We generate revenue principally by drilling wells for oil and natural gas producers under daywork or footage contracts, which provide for the drilling of single or multiple well projects. Revenues on daywork contracts are recognized based on the days worked at the dayrate each contract specifies. Mobilization fees are recognized as the related drilling services are provided. We recognize revenues on footage contracts based on the footage drilled for the applicable accounting period. Expenses are recognized based on the costs incurred during that same accounting period. Reimbursements received for out-of-pocket expenses are recorded as revenues and direct expenses.
Concentration of Credit Risk
Substantially all of the Company’s operations relate to drilling services performed for major or independent oil and natural gas producers in the United States. The Company utilizes a fleet of land drilling rigs to provide these contract drilling services. These operations are aggregated into one reportable segment based on the similarity of economic characteristics among all markets and the similarity of the nature of the services provided and the type of customers served.
Income Taxes
We record deferred taxes for the basis difference in our property and equipment between financial reporting and tax reporting purposes and other costs such as compensation, employee benefits and other accrued liabilities which are deductible in different periods for financial reporting and tax reporting purposes. For property and equipment, basis differences arise from differences in depreciation periods and methods and the value of assets acquired in a business acquisition where we acquire the stock of an entity rather than its assets. For financial reporting purposes, we depreciate the various components of our drilling rigs and refurbishments over two to 12 years, while federal income tax rules require that we depreciate drilling rigs and refurbishments over five years. In 2009 and 2008, tax depreciation also included bonus depreciation allowed as a result of the American Recovery and Reinvestment Act of 2009 and the Economic Stimulus Act of 2008, respectively. In 2010, bonus depreciation is not expected to create any current tax benefit and is not included in our tax depreciation calculations. In the earlier years of our ownership of a drilling rig, our tax depreciation may often exceed our financial reporting depreciation, resulting in our recording deferred tax liabilities on this depreciation difference. In later years, financial reporting depreciation exceeds tax depreciation, and the deferred tax liability begins to reverse.
38
Table of Contents
Earnings Per Share
Basic earnings per common share is computed by dividing net (loss) income by the weighted average number of common shares outstanding during the period. Diluted earnings per common share is computed by dividing net income by the weighted average number of common shares outstanding during the period and the effect of all dilutive common stock equivalents, such as stock options and restricted stock units. The treasury stock method is used to compute the assumed incremental shares related to our outstanding stock options and restricted stock units. The average common stock market prices for the periods are used to determine the number of incremental shares.
In periods where there is a net loss, diluted earnings per common share is equal to basic earnings per common share since the effect of including any dilutive common stock equivalents would be antidilutive.
Other Comprehensive Income
For fiscal years 2010, 2009 and 2008, other comprehensive income equals net income.
Recent Accounting Pronouncements
In October 2009, the Financial Accounting Standards Board (“FASB”) issued Accounting Standards Update (“ASU”) No. 2009-13, amending Subtopic 605-25 Revenue Recognition – Multiple-Element Arrangements, which establishes the accounting and reporting guidance for arrangements under which a vendor will perform multiple revenue-generating activities. This ASU amends the criteria for separating consideration in multiple-deliverable arrangements and expands the related disclosures. This ASU is effective prospectively for revenue arrangements entered into or materially modified in fiscal years beginning on or after June 15, 2010, with early adoption permitted. The adoption of ASU No. 2009-13 on January 1, 2011 did not have a material effect on the financial condition or results of operations of the Company.
In January 2010, the FASB issued ASU No. 2010-06, amending Topic 820 Fair Value Measurements and Disclosures. This ASU updates Subtopic 820-10 and requires the following new disclosures: 1) disclose separately the amounts of significant transfers in and out of Level 1 and Level 2 fair value measurements and describe the reasons for the transfers; and 2) present separately in the reconciliation for fair value measurements using significant unobservable inputs (Level 3), information about purchases, sales, issuances and settlements (on a gross basis rather than one net number). In addition, this ASU clarifies existing disclosures as follows: 1) provide fair value measurement disclosures for each class of assets and liabilities (often a subset within a line item in the statement of financial position); and 2) provide disclosures about the valuation techniques and inputs used to measure both recurring and nonrecurring Level 2 or Level 3 fair value measurements. These new disclosures and clarifications of existing disclosures are effective for interim and annual reporting periods beginning after December 15, 2009, except for the disclosures about purchases, sales, issuances and settlements in the Level 3 reconciliation of fair value measurements, which are effective for fiscal years beginning after December 15, 2010, and for interim periods within those fiscal years. The adoption of ASU No. 2010-06 did not have a material impact on our financial condition or results of operations.
39
Table of Contents
3. Fair Value Measurement
The Fair Value Measurements and Disclosures Topic of the FASB Codification utilizes a fair value hierarchy that prioritizes the inputs to valuation techniques used to measure fair value into three broad levels. The following is a brief description of those three levels:
| Level 1: | Observable inputs such as quoted prices for identical assets or liabilities in active markets | |
| Level 2: | Other inputs that are observable directly or indirectly, such as quoted prices for similar assets or liabilities or market-corroborated inputs | |
| Level 3: | Unobservable inputs for which there is little or no market data and which require us to develop our own assumptions about how market participants would price the assets or liabilities |
We use the following methods and assumptions in estimating our fair value disclosures for financial instruments. The carrying amount of cash and cash equivalents approximates fair value due to the short-term maturity of these instruments. For accounts and other receivables, accounts payable, accrued liabilities, debt and notes payable, we believe that recorded amounts approximate fair value due to the relatively short maturity period. Further, the pricing mechanisms in the Company’s debt agreements combined with the short-term nature of the equipment financing arrangements result in the carrying values of these obligations approximating their respective fair values.
We do not have any financial instruments for which estimates of fair value disclosures utilize Level 3 inputs.
During 2009, we recorded $4.1 million of impairment charges related to certain long-lived assets with a carrying amount of $23.0 million and an estimated fair value of $18.9 million. Estimated fair value was determined using significant unobservable inputs (Level 3) based on both an income approach and a market approach. The income approach was calculated as the estimated discounted future net cash flows assumed to be received from the operation of the asset over its useful life and a terminal value, while market was based on external industry data for similar equipment. The Company’s assessment of the significance of a particular input to the fair value measurement requires judgment and may affect the valuation of nonfinancial assets and liabilities and their placement within the fair value hierarchy levels.
4. Accounts Receivable
Accounts receivable consist of the following (in thousands):
| December 31, | ||||||||
| 2010 | 2009 | |||||||
| Billed receivables |
$ | 28,903 | $ | 22,691 | ||||
| Unbilled receivables |
1,361 | 1,613 | ||||||
| Reserve for sales credits |
(210 | ) | (193 | ) | ||||
| Total receivables |
30,054 | 24,111 | ||||||
| Allowance for doubtful accounts |
(153 | ) | (1,379 | ) | ||||
| Net receivables |
$ | 29,901 | $ | 22,732 | ||||
40
Table of Contents
Activity in the allowance for doubtful accounts was as follows (in thousands):
| Balance, January 1, 2008 |
$ | 311 | ||
| Net charge to expense |
6,318 | |||
| Amounts written off |
(5,134 | ) | ||
| Balance, December 31, 2008 |
1,495 | |||
| Net charge to expense |
1,072 | |||
| Amounts written off |
(1,188 | ) | ||
| Balance, December 31, 2009 |
1,379 | |||
| Net charge to expense |
97 | |||
| Amounts written off |
(1,323 | ) | ||
| Balance, December 31, 2010 |
$ | 153 | ||
5. Property, Buildings and Equipment
Major classes of property, buildings and equipment are as follows (in thousands):
| December 31, | ||||||||
| 2010 | 2009 | |||||||
| Land |
$ | 988 | $ | 988 | ||||
| Buildings |
1,641 | 1,643 | ||||||
| Drilling and well service equipment |
475,994 | 423,588 | ||||||
| Vehicles |
12,419 | 12,053 | ||||||
| Furniture and fixtures |
168 | 168 | ||||||
| Information systems |
688 | 663 | ||||||
| Leasehold improvements |
126 | 126 | ||||||
| Construction in progress |
10,548 | 9,031 | ||||||
| 502,572 | 448,260 | |||||||
| Accumulated depreciation |
(239,362 | ) | (194,197 | ) | ||||
| $ | 263,210 | $ | 254,063 | |||||
During 2010, 2009 and 2008, we capitalized $481,000, $636,000 and $1.2 million, respectively, of interest costs incurred during the construction periods of certain drilling equipment.
At December 31, 2010, and 2009, we had $2.6 million and $0.8 million, respectively, of capital expenditures accrued but not yet paid.
In 2010, we began a process of implementing a new information system that we put into production in January 2011. Capitalized costs associated with this project were $2.9 million and have been classified as construction in progress at December 31, 2010.
During 2009, business conditions were challenging for the drilling industry, rivaling one of the worst contractions the industry has seen since the 1980’s, requiring us to evaluate our long-lived assets for impairment. Based on our assessment, $4.1 million of impairment was recognized for the year ended December 31, 2009 (see Note 3. Fair Value Measurement for a discussion of the measurement of the impairment charge). In 2010, no impairments were required due to modestly improving conditions in the U.S. land-based drilling industry. In the event that certain of our smaller rigs remain idle due to excess capacity for that class of rig, the Company may be required to record additional impairment of its long-lived assets in the future, and such an impairment expense, even though non-cash, could be material and negatively impact our earnings.
41
Table of Contents
6. Income Taxes
The current and deferred components of income tax (benefit) expense are as follows (in thousands):
| Years Ended December 31, | ||||||||||||
| 2010 | 2009 | 2008 | ||||||||||
| Current tax (benefit) expense: |
||||||||||||
| Federal |
$ | 202 | $ | (8,060 | ) | $ | (7,318 | ) | ||||
| State |
(31 | ) | (13 | ) | (261 | ) | ||||||
| 171 | (8,073 | ) | (7,579 | ) | ||||||||
| Deferred tax expense (benefit): |
||||||||||||
| Federal |
(8,120 | ) | 4,033 | 18,993 | ||||||||
| State |
(965 | ) | (353 | ) | 1,197 | |||||||
| (9,085 | ) | 3,680 | 20,190 | |||||||||
| Income tax (benefit) expense |
$ | (8,914 | ) | $ | (4,393 | ) | $ | 12,611 | ||||
Total income tax expense differed from the amounts computed by applying the U.S. statutory federal income tax rate to income before income taxes as a result of the following (in thousands):
| 2010 | 2009 | 2008 | ||||||||||
| U.S. statutory federal income tax rate |
35 | % | 35 | % | 35 | % | ||||||
| Income tax (benefit) expense at the statutory federal tax rate |
$ | (8,743 | ) | $ | (5,749 | ) | $ | 7,126 | ||||
| State and local income taxes, net of federal tax benefits |
(859 | ) | (613 | ) | 755 | |||||||
| Meal allowances |
956 | 851 | 1,962 | |||||||||
| Non-cash compensation |
57 | 39 | 130 | |||||||||
| Goodwill impairment charge |
— | — | 3,062 | |||||||||
| Domestic production deduction |
(97 | ) | 745 | — | ||||||||
| Decrease in unrecognized tax benefits |
(2 | ) | (45 | ) | (276 | ) | ||||||
| Deferred tax rate adjustment |
(218 | ) | 60 | — | ||||||||
| Valuation allowance |
9 | 61 | — | |||||||||
| Other |
(17 | ) | 258 | (148 | ) | |||||||
| Income tax (benefit) expense |
$ | (8,914 | ) | $ | (4,393 | ) | $ | 12,611 | ||||
During 2010, 2009 and 2008, the Company received tax refunds, net of payments made, of approximately $7.7 million, $6.4 million and $2.6 million, respectively.
42
Table of Contents
The components of the net deferred income tax assets and liabilities are as follows (in thousands):
| December 31, | ||||||||
| 2010 | 2009 | |||||||
| Current deferred tax assets: |
||||||||
| Bad debt expense |
$ | 59 | $ | 535 | ||||
| Workers compensation and other insurance reserves |
1,305 | 955 | ||||||
| Sales returns |
81 | 75 | ||||||
| Other |
203 | 56 | ||||||
| 1,648 | 1,621 | |||||||
| Long-term deferred tax assets: |
||||||||
| Stock compensation |
1,965 | 1,538 | ||||||
| Minimum tax credit |
3,349 | 3,522 | ||||||
| Net operating loss carry forwards |
10,418 | 1,259 | ||||||
| Other |
101 | 73 | ||||||
| 15,833 | 6,392 | |||||||
| Total deferred tax assets |
17,481 | 8,013 | ||||||
| Less valuation allowance |
(70 | ) | (61 | ) | ||||
| Net deferred tax asset |
17,411 | 7,952 | ||||||
| Current deferred tax liabilities: |
||||||||
| Prepaid expenses |
462 | 452 | ||||||
| Long-term deferred tax liabilities: |
||||||||
| Intangible assets |
495 | 614 | ||||||
| Property, building and equipment, principally due to differences in depreciation |
59,357 | 58,874 | ||||||
| 59,852 | 59,488 | |||||||
| Total deferred tax liabilities |
60,314 | 59,940 | ||||||
| Net deferred tax liability |
$ | 42,903 | $ | 51,988 | ||||
Deferred tax assets and liabilities are presented net in the balance sheet according to their current or long-term classification.
The Company had federal net operating loss carryforwards of approximately $23.3 million and $98,000 at December 31, 2010 and 2009, respectively. These losses may be carried forward for 20 years and will begin to expire in 2023. State net operating losses at December 31, 2010 and 2009, were $43.6 million and $22.3 million, respectively. State losses vary as to carryforward period and will begin to expire in 2014, depending upon the jurisdiction where applied. In 2010 and 2009, a valuation allowance of $70,000 and $61,000, respectively, was established for state net operating loss carryforwards in states where utilization is uncertain due to lack of forecasted future operations.
At December 31, 2010 and 2009, we had approximately $239,000 and $208,000, respectively, of unrecognized tax benefits, of which approximately $155,000 and $135,000, respectively, would affect our effective tax rate if recognized. Such amounts are carried as other long-term liabilities.
43
Table of Contents
A reconciliation of the beginning and ending amount of unrecognized tax benefits is as follows (in thousands):
| 2010 | 2009 | |||||||
| Balance at beginning of year |
$ | 208 | $ | 438 | ||||
| Reductions for tax positions of prior years |
(17 | ) | (332 | ) | ||||
| Additions for tax positions taken during current period |
41 | 109 | ||||||
| Additions for tax positions of prior years |
7 | 80 | ||||||
| Settlements with taxing authorities |
— | (87 | ) | |||||
| Balance at end of year |
$ | 239 | $ | 208 | ||||
Interest and penalties related to uncertain tax positions are classified as interest expense and general and administrative costs, respectively. During 2010, the Company recognized $9,000 in interest expense related to unrecognized tax benefits. During 2009, the Company recognized cost reversals of $96,000 in interest and penalty expense related to unrecognized tax benefits. During 2008, the Company recognized $82,500 in interest and penalties related to unrecognized tax benefits. As of December 31, 2010 and 2009, the Company had $17,000 and $8,000, respectively, of interest accrued in relation to uncertain tax positions. It is reasonably possible that within the next 12 months, we may resolve some or all of the uncertain tax positions as a result of negotiations with taxing authorities which would result in a decrease in unrecognized tax.
The Company files income tax returns in the U.S. federal and in various state jurisdictions, and, prior to 2007, in Canada. The tax years 2006 to 2009 remain open to examination by the major taxing jurisdictions to which we are subject. In addition, tax years 1999, 2000, 2002 and 2003 remain open due to utilized losses in some jurisdictions in subsequent years. The Company’s 2006 through 2009 U.S. federal returns are currently under examination by the IRS. Although the Company believes it has adequately provided for all tax positions, amounts asserted by taxing authorities could be greater than the Company’s accrued position. See Note 12. Commitments and Contingencies for additional information regarding the IRS examination.
7. Accrued Expenses and Other Liabilities
A detail of accrued expenses and other liabilities is as follows (in thousands):
| December 31, | ||||||||
| 2010 | 2009 | |||||||
| Payroll and bonus |
$ | 3,269 | $ | 1,755 | ||||
| Workers compensation |
3,078 | 888 | ||||||
| Medical claims |
1,639 | 871 | ||||||
| Other taxes |
495 | 269 | ||||||
| Other |
1,215 | 728 | ||||||
| $ | 9,696 | $ | 4,511 | |||||
Other taxes includes sales, franchise and property taxes.
8. Debt Obligations
In March 2005, we entered into a Revolving Credit and Security Agreement with PNC Bank, for itself and as agent for a group of lenders. This credit facility has been amended numerous times, most recently in September 2008. In addition to PNC Bank, the current group of lenders consists of Capital One Leverage Finance Corp., M&I Business Credit, LLC, M&T Bank and TD Bank, N.A. This credit facility matures on March 30, 2012 and provides for a $97.5 million borrowing base. Amounts outstanding under the credit facility bear interest, depending upon facility usage, at either (i) the higher of the Federal Funds Open Rate plus 75 to 125 basis points or PNC Bank’s base commercial lending rate (4.25% at December 31, 2010) or (ii) LIBOR plus 250 to 300 basis points (3.02% at December 31, 2010). Interest on outstanding loans is due monthly for domestic rate loans and at the end of the relevant interest period for LIBOR loans. Depending upon our facility usage, we are assessed an unused line fee of 37.5 to 62.5 basis points on the available borrowing capacity. The available borrowing capacity was $63.2 million as of December 31, 2010. There is a $7.5 million sublimit for letters of credit. If we repay and terminate the
44
Table of Contents
obligations under this facility prior to March 30, 2011, we will incur a prepayment penalty. As of December 31, 2010, we had a loan balance of $30.0 million under the credit facility, and an additional $4.3 million of the total capacity had been utilized to support our letter of credit requirement. As of December 31, 2009, $9.0 million was outstanding under our credit facility and $4.8 million of the total capacity was utilized to support our letter of credit requirement.
In general, the credit facility is secured by substantially all of our assets The forced liquidation value of our assets serving as collateral is determined annually by an independent appraisal, with adjustments for acquisitions and dispositions between appraisals. The credit facility contains affirmative and negative covenants and also provides for events of default that are typical for such an agreement. Among the affirmative covenants are requirements to maintain a specified tangible net worth and a fixed charge coverage ratio. As of December 31, 2010, our actual tangible net worth was $200.5 million compared to the required minimum tangible net worth of $66.8 million, while our actual fixed charge coverage ratio of 13.2 exceeded the required 1.1 fixed charge coverage ratio. Among the negative covenants are restrictions on major corporate transactions, incurrence of indebtedness and amendments to our organizational documents. Events of default would include a change in control and any change in our operations or condition, which has a material adverse effect. As of December 31, 2010, we were in compliance with all of our financial covenants.
To date, the credit facility primarily has been used to pay for rig acquisitions and for our working capital requirements. The credit facility may also be used by the Company, subject to certain conditions, to repurchase its common stock and/or pay a cash dividend.
In addition, the Company has entered into various equipment-specific financing agreements with a third-party financing institution. The terms of these agreements had initial terms ranging from 24 to 48 months. In June 2009, we used $2.5 million in borrowings on our credit facility to pay off certain of these notes payable with interest rates higher than the revolving credit facility. As of December 31, 2010 and 2009, the total outstanding balance under these arrangements was approximately $173,000 and $771,000, respectively, and is classified, according to payment date, in current portion of notes payable for equipment and long-term notes payable for equipment in the accompanying balance sheets. At December 31, 2010, the stated interest rate on these borrowings ranges from zero percent to 4.2%. At December 31, 2010, because all remaining scheduled payments will be made over the next twelve months, the future debt payments under these agreements approximate the present value of the net payments.
The Company paid approximately $1.5 million, $1.5 million and $1.9 million in interest on all debt during 2010, 2009 and 2008, respectively.
9. Stockholders’ Equity
At December 31, 2010, the number of authorized shares of common stock was 75,000,000 shares, of which 23,182,345 shares were outstanding, and 1,650,744 shares were reserved for future issuance through the Company’s equity based plans. The number of authorized shares of preferred stock was 100,000 shares at December 31, 2010. No shares of preferred stock were outstanding or reserved for future issuance.
During 2009, the Company purchased in the open market 285,182 shares of common stock for $1.6 million under the 2008 Union Drilling, Inc. Share Repurchase Program. In 2008, the Company purchased 1,714,818 shares for $8.9 million. These repurchased shares are classified as treasury stock in the accompanying financial statements.
In June 2009, the Company completed a public offering consisting of three million shares of newly issued common stock at a price of $8.25 per share. Proceeds to the Company, net of underwriting discounts and other fees and expenses, were $23.2 million and were used to repay indebtedness outstanding under the Company’s revolving credit facility.
10. Management Compensation
Equity Based Plans
The Company has two equity based plans, the Amended and Restated 2005 Stock Incentive Plan and the Amended and Restated 2000 Stock Option Plan. Under each plan, 1,579,552 shares of the Company’s common stock have been authorized for awards of stock options. Under both plans, incentive and non-qualified stock options may be awarded to directors and employees. Restricted stock and restricted stock units may be granted under the Amended and Restated 2005 Stock Incentive Plan. As of December 31, 2010, 1,195,734 options and 353,319 restricted stock
45
Table of Contents
units have been granted under the Amended and Restated 2005 Stock Incentive Plan and 1,548,124 options have been granted under the Amended and Restated 2000 Stock Option Plan. Stock options are granted with an exercise price equal to the fair market value on the grant date, which is determined by the closing trading price of our common stock on the Nasdaq Global Select Market. Prior to the Company’s initial public offering in November 2005, the exercise price of stock options were based on the Board of Directors’ assessment of the fair market value of the stock at the time the options were granted.
Stock options. Options typically vest in four equal annual installments from the grant date, depending on the terms of the grant, and, unless earlier exercised or forfeited, expire on the tenth anniversary of the grant date. A summary of stock option activity was as follows:
| 2010 | 2009 | 2008 | ||||||||||||||||||||||
| Shares | Weighted Average Exercise Price |
Shares | Weighted Average Exercise Price |
Shares | Weighted Average Exercise Price |
|||||||||||||||||||
| Outstanding at beginning of year |
894,333 | $ | 9.64 | 879,890 | $ | 10.40 | 845,097 | $ | 10.92 | |||||||||||||||
| Granted |
100,000 | 6.19 | 243,088 | 6.69 | 90,871 | 4.72 | ||||||||||||||||||
| Exercised |
(59,242 | ) | 3.80 | (98,722 | ) | 2.51 | (49,497 | ) | 8.41 | |||||||||||||||
| Forfeited/expired |
(6,000 | ) | 6.32 | (129,923 | ) | 14.68 | (6,581 | ) | 14.00 | |||||||||||||||
| Outstanding at end of year |
929,091 | $ | 9.66 | 894,333 | $ | 9.64 | 879,890 | $ | 10.40 | |||||||||||||||
| Options exercisable at end of year |
590,194 | $ | 11.05 | 506,493 | $ | 10.72 | 506,402 | $ | 9.29 | |||||||||||||||
| Weighted average fair value of options granted during the year |
$ | 3.89 | $ | 4.16 | $ | 2.46 | ||||||||||||||||||
New shares of common stock are issued to satisfy options exercised. Cash received from the exercise of options for the years ended December 31, 2010, 2009 and 2008, was $226,000, $248,000 and $416,000, respectively. The total intrinsic value of options exercised during 2010, 2009 and 2008 was $168,000, $37,000 and $514,000, respectively.
A summary of options outstanding as of December 31, 2010, was as follows:
| Options Outstanding | Options Exercisable | |||||||||||||||||||
| Range of Exercise Prices |
Number Outstanding |
Weighted Average Years of Remaining Contractual Life |
Weighted Average Exercise Price |
Number Outstanding |
Weighted Average Exercise Price |
|||||||||||||||
| $3.80 to $9.89 |
471,436 | 8.2 | $ | 5.93 | 178,309 | $ | 5.25 | |||||||||||||
| $12.75 to $14.62 |
457,655 | 5.8 | $ | 13.50 | 411,885 | $ | 13.55 | |||||||||||||
| 929,091 | 590,194 | |||||||||||||||||||
The aggregate intrinsic value of options outstanding and options exercisable as of December 31, 2010 was $702,000 and $378,000, respectively. The weighted average remaining contractual life of options exercisable as of December 31, 2010 was 6.0 years.
The total fair value of options vested during the years ended December 31, 2010, 2009 and 2008, was $0.7 million, $1.1 million and $1.2 million, respectively.
The following table summarizes additional information as of December 31, 2010 for fully vested options and options expected to vest:
| Number of shares outstanding |
902,283 | |||
| Weighted average exercise price |
$ | 9.72 | ||
| Aggregate intrinsic value (in thousands) |
$ | 678 | ||
| Weighted average remaining contractual term |
7.0 years |
46
Table of Contents
Restricted stock awards. During 2010, 50,000 restricted stock units were awarded at a weighted average grant date fair value of $7.41 per unit and vesting period from four to six years. During 2009, 38,545 restricted stock units were awarded at a weighted average grant date fair value of $6.32 per unit and vesting periods ranging from three to four years. During 2008, 264,774 restricted stock units were awarded at a weighted average grant date fair value of $15.75 per unit and vesting periods ranging from three to seven years. One of these 2008 awards for 200,000 restricted stock units is subject to both performance and service criteria, which have not been met as of December 31, 2010.
The following table summarizes the status of non-vested restricted stock units for the years ended December 31:
| 2010 | 2009 | |||||||
| Nonvested at beginning of year |
299,036 | 264,774 | ||||||
| Granted |
50,000 | 38,545 | ||||||
| Vested |
— | — | ||||||
| Forfeited |
— | (4,283 | ) | |||||
| Nonvested at end of year |
349,036 | 299,036 | ||||||
Employee Benefit Plan
The Company has a defined contribution employee benefit plan covering substantially all of its employees. Company contributions to the plan are discretionary. The Company made contributions of approximately $305,000, $275,000 and $585,000 during the years ended December 31, 2010, 2009 and 2008, respectively.
Contingent Management Compensation
The Company’s Chief Executive Officer (“CEO”) and certain other participants have been awarded rights to participate in the proceeds associated with the appreciation in value ultimately associated with dispositions of the Company’s shares held by Union Drilling Company LLC (“UDC”), our principal stockholder. In order to receive benefits from this arrangement, the fair market value of the Company’s shares held by UDC must exceed certain threshold amounts.
The CEO is to receive benefits as a result of UDC’s sale, distribution or disposition of Company shares and the related recognition of a gain in excess of the threshold amount. These rights may be repurchased from the CEO at fair market value, which includes consideration of the threshold amount in the determination of that value, upon his termination of employment by the Company. Further, the rights may be repurchased from the CEO for no consideration upon voluntary termination or upon termination of employment by the Company for cause.
At December 31, 2010 and 2009, the threshold amounts were $42.6 million and $38.7 million, respectively. These amounts are determined based upon cash invested in UDC (and invested by UDC in the Company’s stock) plus a compounded annual return of 10% less cash returned to investors. In 2010 and 2009, $11,000 and $12,000, respectively, of compensation costs were recognized as a result of the fair value of the assets owned by UDC exceeding the threshold. In 2008, the Company recognized $218,000 of compensation cost reversals as a result of the decrease in the market value of the Company’s common stock price. All compensation costs related to these rights are classified as general and administrative expense. As UDC is responsible for the cash settlement of these awards, the offsetting balance is recorded as additional paid in capital.
The defined participants in this arrangement would be entitled to up to 22.5% of the value realized in excess of the threshold amount. The CEO is entitled to approximately 1% of the 22.5%.
47
Table of Contents
11. (Loss) Earnings Per Common Share
Because we incurred a net loss for the years ended December 31, 2010 and 2009, basic and diluted loss per share were calculated as our net loss divided by the weighted average shares outstanding. Excluded from the computation of diluted loss per share for the year ended December 31, 2010 and 2009 were 300,080 and 579,732 respectively, weighted average options and restricted stock units because the effect of including them would have been antidilutive.
For the years ended December 31, 2008, the following table presents a reconciliation of the numerators and denominators of the basic earnings per share and diluted earnings per share computations:
| 2008 | ||||
| Net income |
$ | 7,750 | ||
| Weighted average shares outstanding |
21,890,273 | |||
| Incremental shares from assumed conversion of stock options |
114,845 | |||
| Weighted average and assumed incremental shares |
22,005,118 | |||
| Earnings per share: |
||||
| Basic |
$ | 0.35 | ||
| Diluted |
$ | 0.35 | ||
The weighted average number of dilutive shares in 2008 excludes 122,500 options due to their antidilutive effects.
12. Commitments and Contingencies
Operating Leases
The Company leases certain buildings, automobiles, office equipment and phone services under noncancelable operating agreements. Lease expense was approximately $2.7 million, $2.2 million and $2.3 million for the years ended December 31, 2010, 2009 and 2008, respectively. As of December 31, 2010, future minimum lease payments under noncancelable operating leases consist of the following (in thousands):
| 2011 |
$ | 1,285 | ||
| 2012 |
524 | |||
| 2013 |
220 | |||
| 2014 |
— | |||
| 2015 |
— | |||
| Total |
$ | 2,029 | ||
Litigation and Other Contingencies
From time to time, we are a party to claims, litigation or other legal or administrative proceedings that we consider to arise in the ordinary course of our business. While no assurances can be given regarding the outcome of these or any other pending proceedings, or the ultimate effect such outcomes may have, other than the IRS examination discussed below, we do not believe we are a party to any legal or administrative proceedings which, if determined adversely to us, individually or in the aggregate, would have a material effect on our financial position, results of operations or cash flows. Management believes that the Company maintains adequate levels of insurance necessary to cover its business risk.
48
Table of Contents
The Company’s 2006 through 2009 U.S. federal income and employment tax returns are currently under examination by the IRS. We believe the primary focus of the IRS relates to our treatment of certain per diem payments to field employees and worker classification for certain independent contractors. To date, we have not received any notice of proposed assessment. Given the stage of the examination and because the IRS has not proposed any assessments, the Company cannot, at this time, reasonably estimate the amount, if any, of employment taxes, interest, penalties or additions to tax that may be assessed by the IRS. The Company may be able to estimate a reasonable amount or range of exposure, if any, in the future as more information is obtained during the course of the examination. Should an assessment be proposed, the Company believes that it has valid arguments in support of its employment tax positions and intends to vigorously assert them. Although the final resolution of this matter could have a material effect on our results of operations for the particular reporting period in which the estimated liability is recorded, we believe that any resulting liability would not materially affect our financial position.
13. Quarterly Financial Data (Unaudited)
The following table sets forth unaudited financial results on a quarterly basis for each of the last two years (in thousands, except per share amounts):
| First Quarter |
Second Quarter |
Third Quarter |
Fourth Quarter |
Total | ||||||||||||||||
| 2010 |
||||||||||||||||||||
| Revenues |
$ | 38,660 | $ | 43,678 | $ | 52,028 | $ | 58,173 | $ | 192,539 | ||||||||||
| Operating loss |
(9,607 | ) | (8,260 | ) | (6,421 | ) | (1,042 | ) | (25,330 | ) | ||||||||||
| Net loss |
(5,968 | ) | (5,344 | ) | (4,443 | ) | (313 | ) | (16,068 | ) | ||||||||||
| Net loss per common share: |
||||||||||||||||||||
| Basic |
$ | (0.26 | ) | $ | (0.23 | ) | $ | (0.19 | ) | (0.01 | ) | $ | (0.69 | ) | ||||||
| Diluted |
$ | (0.26 | ) | $ | (0.23 | ) | $ | (0.19 | ) | (0.01 | ) | $ | (0.69 | ) | ||||||
| 2009 |
||||||||||||||||||||
| Revenues |
$ | 54,297 | $ | 38,872 | $ | 35,184 | $ | 40,569 | $ | 168,922 | ||||||||||
| Operating loss |
(637 | ) | (6,679 | ) | (5,166 | ) | (3,159 | ) | (15,641 | ) | ||||||||||
| Net loss |
(271 | ) | (4,900 | ) | (3,972 | ) | (2,890 | ) | (12,033 | ) | ||||||||||
| Net loss per common share: |
||||||||||||||||||||
| Basic |
$ | (0.01 | ) | $ | (0.24 | ) | $ | (0.17 | ) | $ | (0.12 | ) | $ | (0.55 | ) | |||||
| Diluted |
$ | (0.01 | ) | $ | (0.24 | ) | $ | (0.17 | ) | $ | (0.12 | ) | $ | (0.55 | ) | |||||
14. Subsequent Event
In February 2011, we acquired a 1,000 hp mechanical rig (Rig 230) for an aggregate purchase price of $5.3 million.
49
Table of Contents
| Item 9. | Changes in and Disagreements with Accountants on Accounting and Financial Disclosure |
None
| Item 9A. | Controls and Procedures |
Evaluation of Disclosure Controls and Procedures.
As of the end of the period covered by this report, we carried out an evaluation, under the supervision and with the participation of management, including our Chief Executive Officer and Chief Financial Officer, of the effectiveness of our disclosure controls and procedures (as defined in 13a-15(e) of the Securities Exchange Act of 1934, or the Exchange Act). Based on that evaluation, our Chief Executive Officer and our Chief Financial Officer concluded that our disclosure controls and procedures are effective.
Management’s Report on Internal Control over Financial Reporting.
Management is responsible for establishing and maintaining adequate internal control over financial reporting (as defined in Rule 13a-15(f) under the Securities Exchange Act of 1934). Our internal control over financial reporting is designed to provide reasonable assurance to management and the Board of Directors regarding the preparation and fair presentation of published financial statements. Because of its inherent limitations, internal control over financial reporting may not prevent or detect misstatements. Therefore, even those systems determined to be effective can provide only reasonable assurance with respect to financial statement preparation and presentation. Management assessed the effectiveness of our internal control over financial reporting as of December 31, 2010. In making this assessment, management used the criteria set forth by the Committee of Sponsoring Organizations of the Treadway Commission (COSO) in Internal Control – Integrated Framework. Based on our assessment, we believe that, as of December 31, 2010, our internal control over financial reporting is effective based on those criteria.
Attestation Report of Independent Registered Public Accounting Firm.
The attestation report of our independent registered public accounting firm regarding internal control over financial reporting is set forth in Item 8 of this Annual Report on Form 10-K under the caption “Report of Independent Registered Public Accounting Firm Report” and is incorporated herein by reference.
Changes in Internal Control over Financial Reporting.
No change in our internal control over financial reporting (as defined in Rules 13a-15(f) and 15d-15(f) under the Exchange Act) occurred during the fiscal quarter ended December 31, 2010 that has materially affected, or is reasonably likely to materially affect, our internal control over financial reporting.
| Item 9B. | Other Information |
None.
In Items 10, 11, 12, 13 and 14 below, we are incorporating by reference the information we refer to in those Items from the definitive proxy statement for our 2011 Annual Meeting of Stockholders. We intend to file our definitive proxy statement with the SEC by April 30, 2011.
| Item 10. | Directors, Executive Officers and Corporate Governance |
We have a Code of Ethics that applies to our directors and all employees including our principal executive officer, principal financial officer, principal accounting officer and persons performing similar functions. Our Code of Ethics is posted in the “Investor Relations” section on our website at http://www.uniondrilling.com.
50
Table of Contents
The other information required in response to this Item will be set forth in our definitive proxy statement for our 2011 Annual Meeting of Stockholders and is incorporated herein by reference.
| Item 11. | Executive Compensation |
The information required in response to this Item will be set forth in our definitive proxy statement for our 2011 Annual Meeting of Stockholders and is incorporated herein by reference.
| Item 12. | Security Ownership of Certain Beneficial Owners and Management and Related Stockholder Matters |
The information required in response to this Item will be set forth in our definitive proxy statement for our 2011 Annual Meeting of Stockholders and is incorporated herein by reference.
| Item 13. | Certain Relationships and Related Transactions, and Director Independence |
The information required in response to this Item will be set forth in our definitive proxy statement for our 2011 Annual Meeting of Stockholders and is incorporated herein by reference.
| Item 14. | Principal Accountant Fees and Services |
The information required in response to this Item will be set forth in our definitive proxy statement for our 2011 Annual Meeting of Stockholders and is incorporated herein by reference.
51
Table of Contents
| Item 15. | Exhibits and Financial Statement Schedules |
| (a) | The following documents are filed as a part of this report: |
1. Financial Statements.
See Index to Financial Statements on page 28.
2. Financial Statement Schedules:
All financial statement schedules have been omitted because they are not applicable or the required information is presented in the financial statements or the notes to the financial statements.
| (b) | Exhibits. A list of exhibits required by Item 601 of Regulation S-K and to be filed as part of this report is set forth in the Index to Exhibits beginning on page 54, which immediately precedes such exhibits. |
52
Table of Contents
Pursuant to the requirements of Section 13 or 15(d) of the Securities Exchange Act of 1934, the registrant has duly caused this report to be signed on its behalf by the undersigned, thereunto duly authorized.
| UNION DRILLING, INC. | ||||||||
| March 4, 2011 | By: | /s/ Tina L. Castillo | ||||||
| Tina L. Castillo | ||||||||
| Vice President, Chief Financial Officer and Treasurer | ||||||||
Pursuant to the requirements of the Securities Exchange Act of 1934, this report has been signed below by the following persons on behalf of the registrant and in the capacities and on the dates indicated.
| Signature |
Title |
Date | ||
| /s/ Christopher D. Strong |
||||
| Christopher D. Strong | President, Chief Executive Officer and Director | March 4, 2011 | ||
| /s/ Tina L. Castillo |
||||
| Tina L. Castillo | Vice President, Chief Financial Officer and Treasurer | March 4, 2011 | ||
| /s/ Thomas H. O’Neill, Jr. |
||||
| Thomas H. O’Neill Jr. | Director | March 4, 2011 | ||
| /s/ Howard I. Hoffen |
||||
| Howard I. Hoffen | Director | March 4, 2011 | ||
| /s/ Gregory D. Myers |
||||
| Gregory D. Myers | Director | March 4, 2011 | ||
| /s/ M. Joseph McHugh |
||||
| M. Joseph McHugh | Director | March 4, 2011 | ||
| /s/ T.J. Glauthier |
||||
| T.J. Glauthier | Director | March 4, 2011 | ||
| /s/ Ronald Harrell |
||||
| Ronald Harrell | Director | March 4, 2011 | ||
| /s/ Robert M. Wohleber |
||||
| Robert M. Wohleber | Director | March 4, 2011 | ||
53
Table of Contents
UNION DRILLING, INC.
INDEX TO EXHIBITS
| Exhibit |
Description | |||
| 3.1 | — | Form of Amended and Restated Certificate of Incorporation of Union Drilling (incorporated by reference to Exhibit 3.1 to our Registration Statement on Form S-1 (File No. 333-127525) filed on August 15, 2005). | ||
| 3.2 | — | Form of Amended and Restated Bylaws of Union Drilling (incorporated by reference to Exhibit 3.1 to our Form 8-K filed on August 9, 2007). | ||
| 4.1 | — | Specimen Stock Certificate for the common stock, par value $0.01 per share, of Union Drilling (incorporated by reference to Exhibit 4.1 to our Registration Statement on Form S-1 (File No. 333-127525) filed on August 15, 2005). | ||
| 10.1† | — | First Amendment to Union Drilling’s Amended and Restated 2000 Stock Option Plan and Its Accompanying Form of Stock Option Agreement (incorporated by reference to Exhibit 10.1 to our Form 8-K filed on November 30, 2007). | ||
| 10.2† | — | Form of Stock Option Agreement under First Amendment to Union Drilling’s Amended and Restated 2000 Stock Option Plan (incorporated by reference to Exhibit 10.1 to our Form 8-K filed on November 30, 2007). | ||
| 10.3† | — | Stock Option Plan and Agreement, dated May 13, 1999, by and between Union Drilling and Christopher Strong (incorporated by reference to Exhibit 10.3 to our Registration Statement on Form S-1 (File No. 333-127525) filed on August 15, 2005). | ||
| 10.4† | — | First Amendment to Union Drilling’s 2005 Stock Option Plan and Its Accompanying Form of Stock Option Agreement (incorporated by reference to Exhibit 10.2 to our Form 8-K filed on November 30, 2007). | ||
| 10.5† | — | Form of Stock Option Agreement under Union Drilling’s Amended and Restated 2005 Stock Option Plan (incorporated by reference to Exhibit 10.2 to our Form 8-K filed on November 30, 2007). | ||
| 10.5.1† | — | Amended and Restated 2005 Stock Incentive Plan and the accompanying forms of award agreements (incorporated by reference to Exhibit 10.1 to our Form 8-K filed on June 11, 2008). | ||
| 10.5.2† | — | Restricted Stock Unit Agreement, dated June 10, 2008, between Union Drilling and Christopher D. Strong (incorporated by reference to Exhibit 10.2 to our Form 8-K filed on June 11, 2008). | ||
| 10.6 | — | Form of Stockholders Agreement by and among Union Drilling and certain of its direct and indirect stockholders (incorporated by reference to Exhibit 10.6 to Amendment No. 2 to our Registration Statement on Form S-1 (File No. 333-127525) filed on October 18, 2005). | ||
| 10.7 | — | Revolving Credit and Security Agreement, dated March 31, 2005, between Union Drilling the lenders signatory thereto and PNC Bank, as agent for the lenders, together with the First Amendment dated April 19, 2005 (incorporated by reference to Exhibit 10.7 to our Registration Statement on Form S-1 (File No. 333-127525) filed on August 15, 2005). | ||
| 10.8 | — | Stock Purchase Agreement, dated as of March 31, 2005, by and between Union Drilling and Richard Thornton, the sole stockholder of Thornton Drilling Company (incorporated by reference to Exhibit 10.8 to our Registration Statement on Form S-1 (File No. 333-127525) filed on August 15, 2005). | ||
| 10.9 | — | Registration Rights Agreement, dated as of March 31, 2005, between Union Drilling and Richard Thornton (incorporated by reference to Exhibit 10.9 to our Registration Statement on Form S-1 (File No. 333-127525) filed on August 15, 2005). | ||
| 10.10† | — | Employment Agreement, dated as of March 31, 2005, between Union Drilling and Richard Thornton (incorporated by reference to Exhibit 10.10 to our Registration Statement on Form S-1 (File No. 333-127525) filed on August 15, 2005). | ||
| 10.11 | — | Stock Purchase Agreement, dated as of March 31, 2005, by and between Union Drilling, Steven A. Webster, Wolf Marine S.A. and William R. Ziegler (incorporated by reference to Exhibit 10.11 to our Registration Statement on Form S-1 (File No. 333-127525) filed on August 15, 2005). | ||
| 10.12 | — | Option and Asset Purchase and Sale Agreement dated as of February 28, 2005 between Thornton Drilling Company and SPA Drilling, LP; Amendment No. 1 to Purchase and Sale Agreement between Thornton Drilling Company and SPA Drilling, LP; and Assignment and Assumption Agreement between Thornton Drilling Company and Union Drilling Texas, LP. (incorporated by reference to Exhibit 10.12 to Amendment No. 4 to our Registration Statement on Form S-1 (File No. 333-127525) filed on November 7, 2005). | ||
54
Table of Contents
| 10.13 | — | Asset Purchase Agreement, dated May 31, 2005, between C and L Services, LP and Union Drilling Texas, LP. (incorporated by reference to Exhibit 10.13 to our Registration Statement on Form S-1 (File No. 333-127525) filed on August 15, 2005). | ||
| 10.14 | — | Forms of Indemnification Agreement with Union Drilling directors and certain of its officers (incorporated by reference to Exhibit 10.14 to Amendment No. 2 to our Registration Statement on Form S-1 (File No. 333-127525) filed on October 18, 2005). | ||
| 10.15 | — | Second Amendment, dated August 15, 2005, to the Revolving Credit and Security Agreement between Union Drilling, the lenders signatory thereto and PNC Bank, as agent for the lenders (incorporated by reference to Exhibit 10.15 to Amendment No. 1 to our Registration Statement on Form S-1 (File No. 333-127525) filed on September 28, 2005). | ||
| 10.16 | — | Asset Purchase Agreement, dated August 12, 2005, between C and L Services, LP and Union Drilling Texas, LP. (incorporated by reference to Exhibit 10.16 to Amendment No. 1 to our Registration Statement on Form S-1 (File No. 333-127525) filed on September 28, 2005). | ||
| 10.17 | — | Third Amendment, dated October 5, 2005, to the Revolving Credit and Security Agreement between Union Drilling, the lenders signatory thereto and PNC Bank, as agent for the lenders (incorporated by reference to Exhibit 10.17 to Amendment No. 2 to our Registration Statement on Form S-1 (File No. 333-127525) filed on October 18, 2005). | ||
| 10.18 | — | Option to purchase drilling rigs from National Oilwell Varco (incorporated by reference to Exhibit 10.18 to Amendment No. 4 to our Registration Statement on Form S-1 (File No. 333-127525) filed on November 7, 2005). | ||
| 10.19 | — | Purchase and Sale Agreement, dated December 8, 2005, between Union Drilling and National-Oilwell, L.P., relating to the purchase of three drilling rigs (incorporated by reference to Exhibit 10.1 to our Form 8-K filed on December 13, 2005). | ||
| 10.20 | — | Option Agreement, dated December 8, 2005, between Union Drilling and National-Oilwell, L.P., relating to the purchase of three drilling rigs (incorporated by reference to Exhibit 10.2 to our Form 8-K filed on December 13, 2005). | ||
| 10.21 | — | Assets Purchase Agreement, dated December 19, 2005, between Permian Drilling Corporation and Maverick Oil and Gas, Inc., (incorporated by reference to Exhibit 10.1 to our Form 8-K filed on February 3, 2006). | ||
| 10.22 | — | Agreement Regarding Assignment and Assumption of Rights and Obligations under Assets Purchase Agreement, dated January 30, 2006, between Maverick Oil and Gas, Inc. and Thornton Drilling Company; (incorporated by reference to Exhibit 10.1 to our Form 8-K filed on February 3, 2006). | ||
| 10.23 | — | Addendum to Assets Purchase Agreement and Letter Agreement, dated January 30, 2006, between Permian Drilling Corporation, Maverick Oil and Gas, Inc. and Thornton Drilling Company, (incorporated by reference to Exhibit 10.1 to our Form 8-K filed on February 3, 2006). | ||
| 10.24 | — | Purchase and Sale Agreement dated April 21, 2006 between Union Drilling and National-Oilwell, L.P., relating to the purchase price of three drilling rigs (incorporated by reference to Exhibit 10.2 to our Form 8-K filed on May 2, 2006). | ||
| 10.25 | — | Fourth Amendment to Revolving Credit and Security Agreement, dated September 27, 2006, between Union Drilling, Inc., Thornton Drilling Company, Union Drilling Texas L.P., and PNC Bank, National Association, for itself and for other lenders (incorporated by reference to Exhibit 10.1 to our Form 8-K filed on September 28, 2006). | ||
| 10.26 | — | Fifth Amendment to Revolving Credit and Security Agreement, dated December 5, 2006, between Union Drilling, Inc., Thornton Drilling Company, Union Drilling Texas L.P., and PNC Bank, National Association, for itself and for other lenders (incorporated by reference to Exhibit 10.1 to our Form 8-K/A filed on December 7, 2006). | ||
| 10.27 | — | Purchase and Sale Agreement dated January 4, 2008 between Union Drilling and IDM Equipment, LLC (incorporated by reference to Exhibit 10.1 to our Form 8-K filed on January 8, 2008). | ||
| 10.28 | — | Sixth Amendment to Revolving Credit and Security Agreement dated July 29, 2008 between Union Drilling and PNC Bank, National Association, for itself and for the other lenders (incorporated by reference to Exhibit 10.1 to our Form 8-K filed on July 31, 2008). | ||
| 10.29 | — | Seventh Amendment to Revolving Credit and Security Agreement dated September 30, 2008 between Union Drilling and PNC Bank, National Association, for itself and for the other lenders (incorporated by reference to Exhibit 10.1 to our Form 8-K filed on October 6, 2008). | ||
| 10.30 | — | Separation Agreement dated August 10, 2009 between Union Drilling, Inc. and A.J. Verdecchia (incorporated by reference to Exhibit 10.1 to our Form 8-K filed on August 11, 2009). | ||
55
Table of Contents
| 23.1* | — | Consent of Ernst & Young LLP, Independent Registered Public Accounting Firm | ||
| 31.1* | — | Rule 13a-14(a)/15d-14(a) Certification of Chief Executive Officer. | ||
| 31.2* | — | Rule 13a-14(a)/15d-14(a) Certification of Chief Financial Officer. | ||
| 32.1* | — | Section 1350 Certification of Chief Executive Officer.** | ||
| 32.2* | — | Section 1350 Certification of Chief Financial Officer.** | ||
| † | Management contract or compensatory plan or arrangement. |
| * | Filed with this Report. |
| ** | This Certification shall not be deemed “filed” for purposes of Section 18 of the Securities Exchange Act of 1934, as amended, or otherwise subject to the liability of that section. This Certification shall not be deemed to be incorporated by reference into any filing of the Company under the Securities Act of 1933 or the Securities Exchange Act of 1934, each as amended, whether made before or after the date hereof, except to the extent that the Company specifically incorporates it by reference. |
56