Attached files
Table of Contents
UNITED STATES
SECURITIES AND EXCHANGE COMMISSION
Washington, D.C. 20549
FORM 10-K
(Mark One)
| x | ANNUAL REPORT PURSUANT TO SECTION 13 OR 15(d) OF THE SECURITIES EXCHANGE ACT OF 1934 |
For the fiscal year ended: December 26, 2010
or
| ¨ | TRANSITION REPORT PURSUANT TO SECTION 13 OR 15(d) OF THE SECURITIES EXCHANGE ACT OF 1934 |
For the transition period from to
Commission file number: 1-9824
The McClatchy Company
(Exact name of registrant as specified in its charter)
| Delaware | 52-2080478 | |
| State or other jurisdiction of incorporation or organization | I.R.S. Employer Identification No. | |
| 2100 “Q” Street, Sacramento, CA | 95816 | |
| (Address of principal executive offices) | (Zip Code) | |
Registrant’s telephone number, including area code: 916-321-1846
Securities registered pursuant to Section 12(b) of the Act:
| Title of each class |
Name of each exchange on which registered | |
| Class A Common Stock, par value $.01 per share | New York Stock Exchange |
Securities registered pursuant to section 12(g) of the Act:
None
Indicate by check mark if the registrant is a well-known seasoned issuer, as defined in Rule 405 of the Securities Act. ¨ Yes x No
Indicate by check mark if the registrant is not required to file reports pursuant to Section 13 or Section 15(d) of the Act. ¨ Yes x No
Indicate by check mark whether the registrant (1) has filed all reports required to be filed by Section 13 or 15(d) of the Securities Exchange Act of 1934 during the preceding 12 months (or for such shorter period that the registrant was required to file such reports), and (2) has been subject to such filing requirements for the past 90 days x Yes ¨ No
Indicate by check mark whether the registrant has submitted electronically and posted on its corporate Web site, if any, every Interactive Data File required to be submitted and posted pursuant to Rule 405 of Regulation S-T (§ 232.405 of this chapter) during the preceding 12 months (or for such shorter period that the registrant was required to submit and post such files). ¨ Yes ¨ No
Indicate by check mark if disclosure of delinquent filers pursuant to Item 405 of Regulation S-K (§ 229.405 of this chapter) is not contained herein, and will not be contained, to the best of registrant’s knowledge, in definitive proxy or information statements incorporated by reference in Part III of this Form 10-K or any amendment to this Form 10-K. ¨
Indicate by check mark whether the registrant is a large accelerated filer, an accelerated filer, a non-accelerated filer, or a smaller reporting company. See the definitions of “large accelerated filer,” “accelerated filer” and “smaller reporting company” in Rule 12b-2 of the Exchange Act. (Check one):
Large accelerated filer ¨ Accelerated filer x Non-accelerated filer ¨ (Do not check if a smaller reporting company) Smaller reporting company ¨
Indicate by check mark whether the registrant is a shell company (as defined in Rule 12b-2 of the Exchange Act). ¨ Yes x No
Based on the closing price of the Company’s Class A Common Stock on the New York Stock Exchange on June 25, 2010 the last business day of the Company’s second fiscal quarter, the aggregate market value of the voting and non-voting common equity held by non-affiliates was approximately $257.1 million. For purposes of the foregoing calculation only, as required by Form 10-K, the Registrant has included in the shares owned by affiliates, the beneficial ownership of Common Stock of officers and directors of the Registrant and members of their families, and such inclusion shall not be construed as an admission that any such person is an affiliate for any purpose.
Shares outstanding as of February 25, 2011:
Class A Common Stock 60,221,538
Class B Common Stock 24,800,962
DOCUMENTS INCORPORATED BY REFERENCE
Definitive Proxy Statement for the Company’s May 18, 2011 Annual Meeting of Shareholders to be filed pursuant to Regulation 14A under the Securities Exchange Act of 1934 (incorporated in Part II and Part III to the extent provided in Items 10, 11, 12, 13 and 14 hereof).
Table of Contents
INDEX TO THE McCLATCHY COMPANY
2010 FORM 10-K
| Item No. |
Page |
|||||
| PART I | ||||||
| 1. |
2 | |||||
| 1A. |
8 | |||||
| 1B. |
13 | |||||
| 2. |
13 | |||||
| 3. |
14 | |||||
| 4. |
14 | |||||
| PART II | ||||||
| 5. |
15 | |||||
| 6. |
17 | |||||
| 7. |
Management’s Discussion and Analysis of Financial Condition and Results of Operations |
18 | ||||
| 7A. |
38 | |||||
| 8. |
39 | |||||
| 9. |
Changes In and Disagreements With Accountants on Accounting and Financial Disclosure |
80 | ||||
| 9A. |
80 | |||||
| 9B. |
80 | |||||
| PART III | ||||||
| 10. |
81 | |||||
| 11. |
81 | |||||
| 12. |
Security Ownership of Certain Beneficial Owners and Management and Related Stockholder Matters |
81 | ||||
| 13. |
Certain Relationships and Related Transactions, and Director Independence |
82 | ||||
| 14. |
82 | |||||
| PART IV | ||||||
| 15. |
83 | |||||
Table of Contents
Forward-Looking Information:
This report on Form 10-K contains forward-looking statements regarding the Company’s actual and expected financial performance and operations. These statements are based upon our current expectations and knowledge of factors impacting our business, including, without limitation, statements about our ability to consummate contemplated sales transactions for our assets or investments, and the ability of those sales to enable debt reduction on anticipated terms, our customers and the markets in which we operate, advertising revenues, the effect of revenues on the fair value of our reporting units, our impairment analyses and our evaluation of the factors pertinent thereto, the economy, our pension plans, including our assumptions regarding return on pension plan assets and assumed discount rates and future contributions to our qualified pension plan, newsprint costs, our restructuring plans, including projected costs and savings, amortization expense, stock option expenses, prepayment of debt, capital expenditures, litigation, sufficiency of capital resources, possible acquisitions and investments, and our future financial performance. Such statements are subject to risks, trends and uncertainties. Forward-looking statements are generally preceded by, followed by or are a part of sentences that include the words “believes,” “expects,” “anticipates,” “estimates,” or similar expressions. For all of those statements, we claim the protection of the safe harbor for forward-looking statements contained in the Private Securities Litigation Reform Act of 1995.
You should understand that the following important factors, in addition to those discussed elsewhere in this document, particularly in the section entitled “Risk Factors” and in the documents which we incorporate by reference, could affect the future results of McClatchy and could cause those future results to differ materially from those expressed in our forward-looking statements: the duration and depth of economic recessions and strength of subsequent recoveries; McClatchy might not generate cash from operations, or otherwise, necessary to reduce debt or meet debt covenants as expected; McClatchy might not consummate contemplated transactions to enable debt reduction on anticipated terms or at all; McClatchy might not achieve its expense reduction targets or might do harm to its operations in attempting to achieve such targets; McClatchy’s operations have been, and will likely continue to be, adversely affected by competition, including competition from internet publishing and advertising platforms; increases in the cost of newsprint; bankruptcies or financial strain of its major advertising customers; litigation or any potential litigation; geo-political uncertainties including the risk of war; changes in printing and distribution costs from anticipated levels; changes in interest rates; changes in pension assets and liabilities; increased consolidation among major retailers in our markets or other events depressing the level of advertising; our inability to negotiate and obtain favorable terms under collective bargaining agreements with unions; competitive action by other companies; decreased circulation and diminished revenues from retail, classified and national advertising; and other factors, many of which are beyond our control.
1
Table of Contents
| ITEM 1. | BUSINESS |
Available Information
The McClatchy Company (McClatchy or the Company) maintains a website which includes an investor relations section available to all interested parties at www.mcclatchy.com. All filings with the United States Securities and Exchange Commission, along with any amendments thereto, are available free of charge on our website in the Investor Relations section. The Company’s corporate governance guidelines; charters for the following committees of the board of directors: audit committee, committee on the board, pension and savings plans committee, compensation and nominating committees; and the Company’s codes of business conduct and ethics and senior officers code of ethics may also be found on this website. In addition, paper copies of any such filings and corporate governance documents are available free of charge by contacting us at the address listed on the cover page of this filing. The contents of this website are not incorporated into this filing. Further, our reference to the URL for this website is intended to be an inactive textual reference only.
Overview
The Company is a hybrid print and digital, news and advertising company committed to a three-pronged strategy:
| • | First, to operate high-quality newspapers in growth markets; |
| • | Second, to operate the leading local digital business in each of its daily newspaper markets, including websites, email products, mobile services and other electronic media; and |
| • | Third, to extend these franchises by supplementing the mass reach of the newspaper with direct marketing and direct mail products so that advertisers can capture both mass and targeted audiences with one-stop shopping. |
By virtue of its strategy, the Company is the leading local media company in its premium growth markets. The Company has more than a century and a half of experience in mass and targeted media with its origins in the California Gold Rush era of 1857. Originally incorporated in California as McClatchy Newspapers, Inc., the Company’s three original California newspapers—The Sacramento Bee, The Fresno Bee and The Modesto Bee—were the core of the Company until 1979 when the Company began to diversify geographically outside of California. At that time, it purchased two newspapers in the Northwest, the Anchorage Daily News and the Tri-City Herald in southeastern Washington. In 1986, the Company purchased The (Tacoma) News Tribune and in 1987, the Company reincorporated in Delaware. The Company expanded into the Carolinas when it purchased newspapers in South Carolina in 1990 and The News and Observer Publishing Company in North Carolina in 1995.
On June 27, 2006, the Company acquired Knight-Ridder, Inc. (the Acquisition), retaining 20 former Knight-Ridder, Inc. (Knight Ridder) owned daily papers that are in strong markets, and significant digital assets.
The Company is the third largest newspaper publisher by circulation in the United States, with 30 daily newspapers, approximately 43 non-dailies and direct marketing and direct mail operations located in 29 markets across the country. The Company’s newspapers range from large dailies serving metropolitan areas to non-daily newspapers serving small communities. For the fiscal year 2010, the Company had an average paid daily circulation of 2.1 million and Sunday circulation of 2.8 million. McClatchy also operates local websites in each of its markets that complement its newspapers and extend its audience reach. McClatchy-owned newspapers include, among others, The Miami Herald, The Sacramento Bee, the Fort Worth Star-Telegram, The Kansas City Star, The Charlotte Observer, and The (Raleigh) News & Observer.
2
Table of Contents
McClatchy also owns a portfolio of premium digital assets, including 14.4% of CareerBuilder LLC, which operates the nation’s largest online job site CareerBuilder.com, 25.6% of Classified Ventures LLC, a company that offers two of the nation’s premier classified websites: the auto website Cars.com and the rental site Apartments.com and 33.3% of HomeFinder LLC, which operates the real estate website HomeFinder.com.
McClatchy is listed on the New York Stock Exchange under the symbol MNI.
Strategic Emphasis
The Company’s local media businesses have undergone a period of tremendous structural and cyclical change. The Company’s strategy of being the leading local media company in each of its markets is furthered by focusing on five major operational imperatives:
| • | Increasing advertising revenues; |
| • | Expanding its digital advertising business; |
| • | Maintaining its commitment to public service journalism; |
| • | Broadening audience in its local markets; and |
| • | Focusing on cost controls. |
Increasing Advertising Revenues
Advertising revenues make up the vast majority of the Company’s revenues, making the quality of its sales function of utmost importance. Advertising revenues were approximately 76% of consolidated net revenues in fiscal 2010 and 78% in fiscal 2009. Circulation revenues approximated 20% of consolidated net revenues in fiscal 2010 and 19% in fiscal 2009.
The Company has a local sales force in each of its markets and believes that these sales forces are generally larger than those of other local media outlets and websites in those markets. The Company’s sales forces are responsible for delivering to advertisers the broad array of its advertising products, including print, digital and direct marketing products. The Company’s advertisers range from large national retail chains to local automobile dealerships to small businesses and classified advertisers. Increasingly, the Company’s emphasis has been on growing the breadth of products offered to advertisers, particularly its digital products, while expanding its relationships with smaller advertisers. To reach national advertisers, the Company’s newspapers work with national advertising representation firms and the Company’s corporate advertising department to develop relationships and make it easier for those large advertisers to place orders.
Expanding McClatchy’s Digital Advertising Business
The Company’s advertising revenues from digital advertising have been growing even as the Company has faced structural and cyclical change. McClatchy continues to be an industry leader in digital advertising revenue from newspaper websites as a percent of total advertising with 18.1% of advertising coming from digital products in fiscal 2010, compared to 16.2% in fiscal 2009. For fiscal 2010, 45.2% of the Company’s digital advertising revenues came from advertisements placed only online; that is, they were not tied to a joint print buy. Management believes this independent revenue stream bodes well for the future of the Company’s digital business and is evidence of its importance as a resource for advertisers.
The Company’s websites offer classified digital advertising products provided by companies in which we hold non-majority equity interests, including CareerBuilder for employment, Cars.com for autos and Apartments.com in the rental category.
3
Table of Contents
The Company is a member, along with other newspaper companies, in a broad-based partnership with Yahoo, Inc. (Yahoo). The Company’s local sales force is able to sell Yahoo advertising inventory and share in the revenue from the sales.
Maintaining Commitment to Public Service Journalism
The Company believes that high-quality news content is the foundation of the mass reach necessary for the press to play its role in a democratic society. It is also the underpinning of the Company’s success in the marketplace. McClatchy newspapers continually receive national and regional awards among their peers for high-quality journalism.
Today, the Company delivers breaking news as its websites compete with television and radio broadcasters for news headlines that can subsequently be expanded in its newspapers. The Company’s news organizations can provide both targeted information and in-depth coverage as needed through newspapers, websites, mobile delivery and other developing technologies.
Management believes its newspapers and websites are well-equipped to discover, produce and distribute premium quality content in ways that leverage the Company’s size and tap technology to find efficiencies in newsgathering and distribution.
Broadening Newspaper’s Audiences in Their Local Markets
Each of the Company’s daily newspapers has the largest circulation of any newspaper serving its particular community, and coupled with a local website, reaches a broad audience in each market. The Company believes that its broad reach in each market is of primary importance in attracting advertising, the principal source of revenues for the Company.
While daily newspaper paid circulation was down 6.9% and Sunday circulation was down 6.3% in fiscal 2010 compared with fiscal 2009, a portion of the decline in print circulation reflected initiatives the Company began in 2009, including aggressive price increases at most newspapers and reductions in distribution by the Company to eliminate unprofitable circulation not valued by advertisers. Circulation volumes improved steadily during the course of 2010 as the Company’s newspapers cycled over these 2009 initiatives, from down 10.0% daily and 8.2% Sunday in the first fiscal quarter of 2010 to down 4.5% daily and 4.2% Sunday in the fourth quarter of fiscal 2010, in each case as compared to the corresponding periods in the prior year. In addition, the Company’s digital audience continues to show growth, with average local daily unique visitors at McClatchy newspapers’ websites in 2010 up 17.3% from 2009. In addition, all McClatchy websites now offer mobile-friendly versions for smartphones, and many are available on e-readers, tablets and other mobile devices.
The Audit Bureau of Circulations (ABC) now certifies audience reach where surveys are available— generally in larger markets. Based on September 2010 ABC data the Company’s newspapers deliver unduplicated reach of print and online readers of 60.7% in its 14 measured McClatchy markets.
To remain the leading local media company and a must-buy for advertisers, McClatchy is focused on maintaining a broad reach of print and digital audiences in each market it serves. McClatchy will continue to refine and strengthen its print platform, but its growth increasingly comes from its digital products and the beneficial impact those products have on the total audience the Company delivers for its advertisers.
Focusing on Cost Controls
The ongoing structural and cyclical change in the current economy demands that the Company respond by reengineering and restructuring its operations to achieve an efficient and sustainable cost structure. Compensation expense is the largest component of the Company’s cash operating expenses. Technology increasingly is giving the Company the ability to operate more efficiently and reduce staff and related
4
Table of Contents
compensation expense. The Company looks actively for opportunities to realize efficiencies by outsourcing and/or centralizing certain functions such as production, circulation, finance, information systems, customer call centers, and advertising operations. For instance, nine of the Company’s newspapers are now produced by others in outsourcing arrangements. The Company also believes using technology is an important component of its restructuring plans.
The Company’s newspaper operations have emphasized restructuring moves that are preferred or acceptable to our audiences and advertisers, such as reducing the width of newspapers or reducing unprofitable circulation that reaches areas outside of a newspaper’s core market. The Company is focusing its efforts on quality content production, effective sales efforts and growth in digital operations.
During the last three years the Company announced strategic restructuring programs that resulted in significant reduction of staffing and announced the freezing of the Company’s pension plans and other cost saving measures. See further discussion in, Item 7, “Management’s Discussion and Analysis of Financial Condition and Results of Operation.”
Other Operational Information
Each of the Company’s newspapers is largely autonomous in its local advertising and editorial operations in order to meet most effectively the needs of the communities it serves.
The Company has two operating segments. Each segment consists primarily of a group of newspapers and related businesses reporting to a segment manager that are aggregated into a single reportable segment. Publishers and editors of each of the newspapers make the day-to-day decisions and report to one of two vice presidents of operations (segment managers). The segment managers are responsible for implementing the operating and financial plans at each of the newspapers within their respective operating segment. The corporate managers, including executive officers, set the basic business, accounting, financial and reporting policies.
Publishers also work together to consolidate functions and share resources regionally and across the Company in operational areas that lend themselves to such efficiencies, such as certain regional or national sales efforts, accounting functions, digital publishing systems and products, information technology functions and others. A corporate advertising department was formed in 2008 and is headed by a vice president of advertising who works with the Company’s largest advertisers in placing advertising across the Company in newspapers and online websites. These efforts are often coordinated through the segment managers and corporate personnel.
The Company’s newspaper business is somewhat seasonal, with peak revenues and profits generally occurring in the second and fourth quarters of each year reflecting the spring and Thanksgiving and Christmas holidays, respectively. The first quarter, when holidays are not prevalent, is historically the slowest quarter for revenues and profits.
5
Table of Contents
The following table summarizes the circulation of each of the Company’s daily newspapers. These circulation figures are reported on the Company’s fiscal year basis and are not meant to reflect Audit Bureau of Circulations (ABC) reported figures.
| 2010 |
2009 |
|||||||||||||||
| Circulation by Newspaper |
Daily |
Sunday |
Daily |
Sunday |
||||||||||||
| The Sacramento Bee |
211,745 | 263,340 | 226,329 | 272,738 | ||||||||||||
| The Kansas City (Missouri) Star |
210,891 | 299,091 | 222,415 | 316,390 | ||||||||||||
| The Charlotte Observer |
163,120 | 216,173 | 175,565 | 231,243 | ||||||||||||
| Fort Worth Star-Telegram |
160,627 | 235,000 | 174,991 | 259,011 | ||||||||||||
| The Miami Herald |
155,818 | 220,308 | 167,998 | 245,849 | ||||||||||||
| The (Raleigh) News & Observer |
133,944 | 185,106 | 144,356 | 194,924 | ||||||||||||
| The Fresno Bee |
114,549 | 139,616 | 129,542 | 153,251 | ||||||||||||
| Lexington Herald-Leader |
94,509 | 112,136 | 101,229 | 117,219 | ||||||||||||
| The (Tacoma) News Tribune |
83,839 | 95,769 | 91,545 | 104,974 | ||||||||||||
| The (Columbia, SC) State |
77,654 | 99,221 | 87,633 | 111,587 | ||||||||||||
| The Wichita Eagle |
72,677 | 108,549 | 76,024 | 116,944 | ||||||||||||
| The Modesto Bee |
63,537 | 72,007 | 68,102 | 74,903 | ||||||||||||
| El Nuevo Herald |
57,134 | 73,592 | 61,261 | 81,634 | ||||||||||||
| Idaho Statesman (Boise) |
50,842 | 72,933 | 53,913 | 73,121 | ||||||||||||
| Belleville (Illinois) News-Democrat |
50,155 | 54,324 | 50,167 | 57,127 | ||||||||||||
| The (Macon, GA) Telegraph |
48,726 | 65,107 | 49,133 | 64,578 | ||||||||||||
| Anchorage Daily News |
46,883 | 52,432 | 51,749 | 57,641 | ||||||||||||
| The (Myrtle Beach, SC) Sun News |
38,441 | 51,687 | 42,892 | 54,889 | ||||||||||||
| (Biloxi) Sun Herald |
38,437 | 42,504 | 39,665 | 45,032 | ||||||||||||
| The Bradenton (Florida) Herald |
35,589 | 45,290 | 39,134 | 45,925 | ||||||||||||
| Tri-City (Washington) Herald |
34,209 | 38,531 | 37,073 | 39,961 | ||||||||||||
| The (San Luis Obispo, CA) Tribune |
33,863 | 38,978 | 34,579 | 39,717 | ||||||||||||
| (Columbus, GA) Ledger-Enquirer |
33,835 | 42,197 | 35,483 | 43,933 | ||||||||||||
| The Olympian (Washington) |
25,107 | 30,041 | 27,530 | 33,271 | ||||||||||||
| The (Rock Hill, SC) Herald |
23,185 | 26,765 | 24,993 | 27,947 | ||||||||||||
| (Pennsylvania) Centre Daily Times |
20,592 | 27,026 | 22,024 | 28,352 | ||||||||||||
| The Island Packet (Hilton Head, SC) |
18,475 | 20,882 | 18,417 | 19,724 | ||||||||||||
| The Bellingham (Washington) Herald |
17,730 | 22,295 | 19,496 | 24,342 | ||||||||||||
| Merced (California) Sun-Star |
13,848 | — | 14,702 | — | ||||||||||||
| The Beaufort (South Carolina) Gazette |
10,108 | 10,298 | 10,694 | 10,171 | ||||||||||||
The Company’s newspapers are generally delivered by independent contractors, and subscription revenues are recorded net of direct delivery costs.
Other Operations
The Company owns 14.4% of CareerBuilder LLC, which operates the nation’s largest online job site CareerBuilder.com, and 25.6% of Classified Ventures LLC, a company that offers classified websites such as Cars.com and Apartments.com. The Company owns 33.3% of HomeFinder LLC, which operates the real estate website HomeFinder.com. The Company also owns a 15.0% interest in TKG Internet Holdings, which owns 75.0% of Topix.net (Topix), a general interest website focused on local communities, for an effective ownership of 11.3%.
McClatchy-Tribune Information Service (MCT), a joint venture of McClatchy and Tribune Company (Tribune), offers stories, graphics, illustrations, photos and paginated pages for print publishers and web-ready
6
Table of Contents
content for online publishers. All the Company’s newspapers, Washington D.C. staff and foreign bureaus produce MCT editorial material. Content is also supplied by Tribune newspapers and a number of other newspapers.
The Company owns 49.5% of the voting stock and 70.6% of the nonvoting stock of The Seattle Times Company. The Seattle Times Company owns The Seattle Times newspaper and weekly newspapers in Puget Sound and daily newspapers located in Walla Walla and Yakima, Washington.
In addition, the Company owns a 27.0% interest in Ponderay Newsprint Company (Ponderay), a general partnership, which owns and operates a newsprint mill in the state of Washington. The Company is required to purchase up to 56,800 metric tons of newsprint annually from Ponderay on a “take-if-tendered” basis at prevailing market prices.
The Company and affiliates of Cox Enterprises, Inc. and Media General Inc. each owned a 33.3% interest in SP Newsprint Co. (SP), a newsprint manufacturing company that was sold to a third party in 2008. The Company has an annual purchase commitment that extended for six years from the date of the sale. The Company’s purchase commitment for 2011 is for up to 109,730 metric tons of newsprint from SP.
The Company uses the equity method of accounting for a majority of its investments in unconsolidated companies.
Raw Materials
During fiscal 2010, the Company consumed approximately 183,000 metric tons of newsprint compared to 218,000 metric tons in fiscal 2009 for its continuing operations. The decrease in tons consumed was primarily due to lower advertising sales and circulation volumes, and to a reduction of web widths at certain newspapers. The Company currently obtains a majority of its supply of newsprint from Ponderay and SP, as well as a number of other suppliers, primarily under long-term contracts.
The Company’s earnings are sensitive to changes in newsprint prices. Newsprint expense accounted for 9.2% of total operating expenses in fiscal 2010 and 10.7% in fiscal 2009. However, because the Company has an ownership interest in Ponderay, an increase in newsprint prices, while negatively affecting the Company’s operating expenses, would increase the earnings from its share of this investment, therefore partially offsetting the increase in the Company’s newsprint expense. A decline in newsprint prices would have the opposite effect. Ponderay is also impacted by fluctuations in the cost of energy and fiber used in the paper-making process. The Company estimates that it will use approximately 175,000 metric tons of newsprint in fiscal 2011, depending on the level of print advertising, circulation volumes and other business considerations.
The Company purchased 149,545 metric tons of newsprint from Ponderay and SP in 2010. See the discussion above; Item 7, “Management’s Discussion and Analysis of Financial Condition and Results of Operation”; and the financial statements and accompanying notes for further discussion of the impact of these investments on the Company’s business.
McClatchy fully supports recycling efforts. In 2010, 99.4% of the newsprint used by McClatchy newspapers was made up of some recycled fiber; the average content was 69.8% recycled fiber. This translates into an overall recycled newsprint average of 69.4%. During 2010, all of McClatchy’s newspapers collected and recycled press waste, newspaper returns and printing plates.
Competition
The Company’s newspapers, direct marketing programs and internet sites compete for advertising revenues and readers’ time with television, radio, other internet sites, direct mail companies, free shoppers, suburban
7
Table of Contents
neighborhood and national newspapers and other publications, and billboard companies, among others. In some of its markets, the Company’s newspapers also compete with other newspapers published in nearby cities and towns. Competition for advertising is generally based upon print readership levels and demographics, advertising rates, internet usage and advertiser results, while competition for circulation and readership is generally based upon the content, journalistic quality, service and the price of the newspaper.
The Company’s major daily newspapers are the primary general circulation newspaper in each of their respective markets. Its newspaper internet sites are generally the leading local sites in each of the Company’s major daily newspaper markets, based upon research conducted by the Company and various independent sources. Nonetheless, the Company has noted changes in readership trends, including a shift of readers to the internet and mobile devices, and has experienced greater shift of advertising in the classified categories to digital advertising. The Company faces greater competition, particularly in the areas of employment, automotive and real estate advertising, from online competitors. To address the structural shift to digital media, the Company’s newspapers provide editorial content on a wide variety of platforms and formats—from its daily newspaper to leading local websites; on social network sites such as Facebook and Twitter; on smartphones and on e-readers; on blogs and in niche publications and websites; in e-mail newsletters and RSS feeds. In addition its websites offer leading digital classified products such as CareerBuilder.com, Cars.com and Apartments.com and the Company continues to expand its partnerships with technology companies such as its affiliation with Yahoo on retail efforts.
Employees—Labor
As of December 26, 2010, the Company had approximately 8,473 full and part-time employees (equating to approximately 7,773 full-time equivalent employees), of whom approximately 6% were represented by unions. Most of the Company’s union-represented employees are currently working under labor agreements expiring in 2012. Twenty of the Company’s 30 daily papers have no unions.
While the Company’s newspapers have not had a strike for decades and the Company does not currently anticipate a strike occurring, the Company cannot preclude the possibility that a strike may occur at one or more of its newspapers when future negotiations occur. The Company believes that, in the event of a newspaper strike, it would be able to continue to publish and deliver to subscribers, a capability which is critical to retaining revenues from advertising and circulation, although there can be no assurance of this.
Compliance with Environmental Laws
The Company uses appropriate waste disposal techniques for items such as ink and other toxic fluids. The Company has a $1 million letter of credit shared among various state environmental agencies and the US Environmental Protection Agency to provide collateral related to existing or previously disposed oil drums. However, the Company does not have any significant environmental issues and has no significant expenses or capital expenditures related to environmental control facilities.
| ITEM 1A. | RISK FACTORS |
The Company has significant competition in the market for news and advertising, which may reduce its advertising and circulation revenues in the future.
The Company’s primary source of revenues is advertising, followed by circulation. In recent years, the advertising industry generally has experienced a secular shift toward internet advertising and away from other traditional media. In addition, the Company’s circulation has declined, reflecting general trends in the newspaper industry including consumer migration toward the internet and other media for news and information. The Company faces increasing competition from other digital sources for both advertising and circulation revenues. This competition has intensified as a result of the continued developments of digital media technologies.
8
Table of Contents
Distribution of news, entertainment and other information over the internet, as well as through mobile phones and other devices, continues to increase in popularity. These technological developments are increasing the number of media choices available to advertisers and audiences. As media audiences fragment, the Company expects advertisers to allocate larger portions of their advertising budgets to digital media. This increased competition has had and is expected to continue to have an adverse effect on the Company’s business and financial results, including negatively impacting revenues and operating income.
Weak general economic and business conditions subject the Company to risks of declines in advertising revenues.
Despite some signs of recovery, the United States economy continues to be in a period of economic uncertainty. Certain aspects of the economy, including real estate, employment and consumer confidence, remain distressed. The economies in California and Florida, where approximately a third of the Company’s advertising revenues are generated, have been particularly hard hit and are recovering more slowly than the national economy. These economic conditions have had and are expected to continue to have an adverse effect on the Company’s advertising revenues. To the extent these economic conditions continue or worsen, the Company’s business and advertising revenues will be adversely affected, which could negatively impact the Company’s operations and cash flows and the Company’s ability to meet the covenants in its senior secured credit agreement. In addition, seasonal variations in consumer spending cause our quarterly advertising revenues to fluctuate. Second and fourth quarter advertising revenues are typically higher than first and third quarter advertising revenues, reflecting the slower economic activity in the winter and summer and the stronger fourth quarter holiday season. If general economic conditions and other factors cause a decline in revenues, particularly during the second or fourth quarters, we may not be able to grow or maintain our revenues for the year, which would have an adverse effect on the Company’s business and financial results.
If management is unable to execute cost-control measures successfully, total operating costs may be greater than expected, which may adversely affect the Company’s profitability.
As a result of recent adverse general economic and business conditions and the Company’s operating results, the Company has taken steps to lower operating costs by reducing workforce and implementing general cost-control measures. If the Company does not achieve its expected savings from these initiatives, or if operating costs increase as a result of these initiatives, total operating costs may be greater than anticipated. Although management believes that appropriate steps have been taken and are being taken to implement cost-control efforts, such efforts may affect the Company’s business and its ability to generate future revenue. Portions of the Company’s expenses are fixed costs that neither increase nor decrease proportionately with revenues. As a result, management is limited in its ability to reduce costs in the short term. If these cost-control efforts do not reduce costs sufficiently, income from continuing operations may decline.
An economic downturn and the decline in the price of the Company’s publicly-traded stock may result in goodwill and masthead impairment charges.
The Company recorded masthead impairment charges of $59.6 million in 2008 and $3.0 billion of goodwill and masthead impairment charges in 2007 reflecting the economic downturn and the decline in the price of the Company’s publicly-traded common stock. Further erosion of general economic, market or business conditions could have a negative impact on the Company’s stock price, which may require the Company to record additional impairment charges in the future.
The Company owns excess real property whose carrying value may be subject to impairment given the protracted downturn in commercial real estate in recent years.
The Company has excess real property that is classified as a “Level 3” classification under applicable accounting rules with respect to fair value guidance. Level 3 classifications are used in cases in which there is
9
Table of Contents
limited or no market activity to determine the value of an asset or liability, thereby requiring the reporting entity to make estimates and assumptions related to the pricing of the asset or liability. The Company recorded a write-down of $21.4 million in 2010 and $26.3 million in 2009 on the carrying value of land that was formerly under contract to be sold in Miami, Florida, based on its analysis of an independent appraisal of the property, including the economic downturn and the decline in the fair value of the commercial real estate in Miami. The Company may need to record additional write-downs of excess property if its analysis indicates that its carrying value no longer reflects the fair value of any of the property. Any such write-downs could have a material adverse effect on the Company’s financial position.
The Company has $1.8 billion in total consolidated debt, which subjects the Company to significant financial risk.
As of December 26, 2010, the Company had approximately $1.8 billion in total principal indebtedness outstanding. This level of debt increases the Company’s vulnerability to general adverse economic and industry conditions. Higher leverage ratios could affect the Company’s future ability to refinance maturing debt or the ultimate structure of such refinancing. In addition, the Company’s credit ratings could affect its ability to refinance its debt.
Covenants in the indenture governing the Company’s 11.50% Senior Secured Notes due 2017 (the “2017 Notes”) and its senior secured credit facility restrict the Company’s operations in many ways.
The indenture governing the 2017 Notes and the senior secured credit facility contain various covenants that limit, subject to certain exceptions, the Company’s ability and/or its restricted subsidiaries’ ability to, among other things:
| • | incur liens or additional debt or provide guarantees; |
| • | issue redeemable stock and preferred stock; |
| • | pay dividends or make distributions on capital stock or repurchase capital stock or repurchase outstanding notes or debentures prior to their stated maturity; |
| • | make loans, investments or acquisitions; |
| • | enter into agreements that restrict distributions from its subsidiaries; |
| • | create or permit restrictions on the ability of its subsidiaries to pay dividends or distributions or guarantee debt or create liens; |
| • | sell assets and capital stock of its subsidiaries; |
| • | enter into certain transactions with its affiliates; and |
| • | dissolve, liquidate, consolidate or merge with or into, or sell substantially all its assets to another person. |
The restrictions contained in the indenture for the 2017 Notes and the senior secured credit facility could adversely affect the Company’s ability to:
| • | finance its operations; |
| • | make needed capital expenditures; |
| • | make strategic acquisitions or investments or enter into alliances; |
| • | withstand a future downturn in its business or the economy in general; |
| • | engage in business activities, including future opportunities, that may be in its interest; and |
| • | plan for or react to market conditions or otherwise execute our business strategies. |
10
Table of Contents
The Company’s ability to comply with covenants contained in the indenture for the 2017 Notes and the senior secured credit facility may be affected by events beyond its control, including prevailing economic, financial and industry conditions. Even if the Company is able to comply with all of the applicable covenants, the restrictions on its ability to manage its business could adversely affect its business by, among other things, limiting its ability to take advantage of financings, mergers, acquisitions and other corporate opportunities that the Company believes would be beneficial to it.
Potential disruptions in the credit markets could adversely affect the availability and cost of short-term funds for liquidity requirements and could adversely affect the Company’s access to capital or to obtain financing at reasonable rates and its ability to refinance existing debt at reasonable rates or at all.
If internal funds are insufficient to fund the Company’s operations, the Company may be required to rely on the banking and credit markets to meet its financial commitments and short-term liquidity needs. Disruptions in the capital and credit markets, as were experienced during 2008 and 2009, could adversely affect the Company’s ability to access additional funds in the capital markets or draw on its senior secured credit facility. There can be no assurance that continued or increased volatility and disruption in the capital and credit markets will not impair the Company’s liquidity in future periods. If this should happen, any alternative credit arrangements may not be put in place without a potentially significant increase in the Company’s cost of borrowing.
As of December 26, 2010, the Company had approximately $1.8 billion in total principal indebtedness, consisting of $875 million of publicly-traded senior secured notes and unsecured publicly-traded notes maturing in 2011, 2014, 2017, 2027 and 2029. The near-term 2011 notes totaled $18.1 million and the 2014 notes totaled $168.9 million. While cash flow should permit the Company to lower the amount of this debt before it matures, a significant portion of this debt will probably need to be refinanced in the future. Access to the capital markets for longer-term financing may be restricted if disruptions in the capital and credit markets as were experienced during 2008 and 2009 occur again.
The Company requires newsprint for operations and, therefore, its operating results may be adversely affected if the price of newsprint increases.
Newsprint is the major component of the Company’s cost of raw materials. Newsprint accounted for 9.2% of McClatchy’s operating expenses for fiscal 2010. Accordingly, earnings are sensitive to changes in newsprint prices. The price of newsprint has historically been volatile and may increase as a result of various factors, including:
| • | declining newsprint supply from mill closures; |
| • | reduction in newsprint suppliers because of consolidation in the newsprint industry; |
| • | paper mills reducing their newsprint supply because of switching their production to other paper grades; and |
| • | a decline in the financial situation of newsprint suppliers. |
The Company has not attempted to hedge fluctuations in the normal purchases of newsprint or enter into contracts with embedded derivatives for the purchase of newsprint. If the price of newsprint increases materially, operating results could be adversely affected. If newsprint suppliers experience labor unrest, transportation difficulties or other supply disruptions, the Company’s ability to produce and deliver newspapers could be impaired and/or the cost of the newsprint could increase, both of which would negatively affect its operating results.
11
Table of Contents
A portion of the Company’s employees are members of unions and if the Company experiences labor unrest, its ability to produce and deliver newspapers could be impaired.
If McClatchy experiences labor unrest, its ability to produce and deliver newspapers could be impaired in some locations. The results of future labor negotiations could harm the Company’s operating results. The Company’s newspapers have not endured a labor strike for decades. However, management cannot ensure that a strike will not occur at one or more of the Company’s newspapers in the future. As of December 26, 2010, approximately 6.0% of full-time and part-time employees were represented by unions. Most of the Company’s union-represented employees are currently working under labor agreements, which expire in 2012. McClatchy faces collective bargaining upon the expirations of these labor agreements. Even if its newspapers do not suffer a labor strike, the Company’s operating results could be harmed if the results of labor negotiations restrict its ability to maximize the efficiency of its newspaper operations.
Under the Pension Protection Act, the Company will be required to make greater contributions to its defined benefit pension plans in the next several years than previously required, placing greater liquidity needs upon its operations.
The poor capital markets of 2008 had a significantly negative impact on the investment funds in the Company’s pension plan, which was partially offset by strong returns in the capital markets in 2009 and 2010. However, as a result of the plan’s lower assets, the projected benefit obligations of the Company’s qualified pension plan exceeded plan assets by $479.1 million as of December 26, 2010. The Company made an $8.2 million contribution to its retirement plan in the third quarter of fiscal 2010. In January 2011, McClatchy contributed company-owned real property valued at $49.6 million to its retirement plan that is expected to meet substantially all of the Company’s 2011 funding requirements.
Nonetheless, the excess of benefit obligations over pension assets is expected to give rise to an increase in required pension contributions over the next several years. The Pension Relief Act of 2010 (PRA) provides relief in the funding requirements of the qualified defined benefit pension plan, and the Company has elected an option that allows the funding related to its 2009 plan year required contributions to be paid over 15 years (15-year-deferral relief option). Under the PRA, the Company may elect a 15-year-deferral relief option on one additional plan year in the future. However, even with the relief provided by the PRA, management expects future contributions to be substantially higher than the 2010 amounts. In addition, poor capital market performance and/or lower long-term interest rates may result in greater annual contributions.
The Company has invested in certain internet ventures, but such ventures may not be as successful as expected, which could adversely affect the results of operations of the Company.
The Company continues to evaluate its business and make strategic investments in digital ventures, either alone or with partners, to further its growth in its digital businesses. There can be no assurances that these investments or partnerships will result in advertising growth or will produce equity income or capital gains in future years.
If the Company is not successful in growing its digital businesses, its business, financial condition and prospects will be adversely affected.
The Company’s future growth depends to a significant degree upon the development of its digital businesses. The growth and success of its digital businesses over the long term depends on various factors, including, among other things the ability to:
| • | continue to increase digital audiences; |
| • | attract advertisers to its websites; |
| • | maintain or increase the advertising rates on its websites; |
12
Table of Contents
| • | exploit new and existing technologies to distinguish its products and services from those of its competitors and develop new content, products and services; and |
| • | invest funds and resources in digital opportunities. |
If the Company is not successful in growing its digital businesses, its business, financial condition and prospects will be adversely affected.
Circulation declines could adversely affect the Company’s circulation and advertising revenues.
Advertising and circulation revenues are affected by circulation and readership levels of the Company’s newspapers. In recent years, newspapers have experienced difficulty maintaining or increasing print circulation levels because of a number of factors, including:
| • | increased competition from other publications and other forms of media technologies available in various markets, including the internet and other new media formats that are often free for users; |
| • | continued fragmentation of media audiences; |
| • | a growing preference among some consumers to receive all or a portion of their news other than from a newspaper; |
| • | increases in subscription and newsstand rates; and |
| • | declining discretionary spending by consumers affected by negative economic conditions. |
These factors could also affect the Company’s newspapers’ ability to institute circulation price increases for print products. A prolonged reduction in circulation would have a material adverse effect on advertising revenues. To maintain the Company’s circulation base, it may be required to incur additional costs which it may not be able to recover through circulation and advertising revenues.
Adverse results from litigation or governmental investigations can impact the Company’s business practices and operating results.
From time to time, the Company and its subsidiaries are parties to litigation and regulatory, environmental and other proceedings with governmental authorities and administrative agencies. Adverse outcomes in lawsuits or investigations could result in significant monetary damages or injunctive relief that could adversely affect our operating results or financial condition as well as our ability to conduct our businesses as they are presently being conducted.
| ITEM 1B. | UNRESOLVED STAFF COMMENTS |
None.
| ITEM 2. | PROPERTIES |
The corporate headquarters of the Company are located at 2100 “Q” Street, Sacramento, California. At December 26, 2010, the Company had newspaper production facilities in 29 markets situated in 15 states. The Company’s facilities vary in size and in total occupy about 7.9 million square feet. Approximately 1.3 million of the total square footage is leased from others, while the remaining square footage is property owned by the Company. The Company owns substantially all of its production equipment, although certain office equipment is leased.
Beginning on January 14, 2011, a total of 0.9 million of Company-owned square footage of property was contributed to the Company’s qualified defined benefit pension plan and leased back by the Company. This transaction is discussed in greater detail in Item. 8, Note 13 to the Consolidated Financial Statements.
13
Table of Contents
The Company maintains its properties in good condition and believes that its current facilities are adequate to meet the present needs of its newspapers.
| ITEM 3. | LEGAL PROCEEDINGS |
The Company becomes involved from time to time in claims and lawsuits incidental to the ordinary course of its business, including such matters as libel, invasion of privacy, intellectual property infringement, wrongful termination actions, wage and hour violations and complaints alleging discrimination. In addition, the Company is involved from time to time in governmental and administrative proceedings concerning employment, labor, environmental and other claims. Historically, such claims and proceedings have not had a material adverse effect upon the Company’s consolidated results of operations or financial condition.
| ITEM 4. | REMOVED AND RESERVED |
14
Table of Contents
| ITEM 5. | MARKET FOR THE REGISTRANT’S COMMON EQUITY, RELATED STOCKHOLDER MATTERS AND ISSUER PURCHASES OF EQUITY SECURITIES |
Market Information: The Company’s Class A Common Stock is listed on the New York Stock Exchange (NYSE symbol—MNI). A small amount of Class A Common Stock is also traded on other exchanges. The Company’s Class B Stock is not publicly traded. The following table lists per share dividends paid on both classes of Common Stock and the high and low prices of the Company’s Class A Common Stock as reported by the NYSE for each fiscal quarter of 2010 and 2009:
| PRICES |
||||||||||||
| HIGH |
LOW |
DIVIDENDS |
||||||||||
| Year Ended December 26, 2010: |
||||||||||||
| First quarter |
$ | 6.28 | $ | 3.23 | $ | 0.00 | ||||||
| Second quarter |
$ | 7.16 | $ | 3.76 | $ | 0.00 | ||||||
| Third quarter |
$ | 4.26 | $ | 2.60 | $ | 0.00 | ||||||
| Fourth quarter |
$ | 5.13 | $ | 2.63 | $ | 0.00 | ||||||
| Year Ended December 27, 2009: |
||||||||||||
| First quarter |
$ | 1.87 | $ | 0.35 | $ | 0.09 | ||||||
| Second quarter |
$ | 1.33 | $ | 0.46 | $ | 0.00 | ||||||
| Third quarter |
$ | 2.88 | $ | 0.39 | $ | 0.00 | ||||||
| Fourth quarter |
$ | 4.04 | $ | 2.13 | $ | 0.00 | ||||||
Holders:
The number of record holders of Class A and Class B Common Stock at February 25, 2011 was 5,652 and 22, respectively.
Dividends:
The payment and amount of future dividends remain within the discretion of the Board of Directors and will depend upon the Company’s future earnings, financial condition and requirements, and other factors considered relevant by the Board. The Company suspended its quarterly dividend after the payment of the first quarter dividend in fiscal 2009. Also, the amount of future dividends is governed by reaching certain leverage levels of earnings before interest, taxes, depreciation and amortization (EBITDA) under its senior secured credit agreement.
Sales of Unregistered Securities:
None
Purchases of Equity Securities:
None
The following graph compares the cumulative five-year total return attained by shareholders on The McClatchy Company’s common stock versus the cumulative total returns of the S&P Midcap 400 index and a customized peer group composed of nine companies. The Company selected its peer group based on the fact that McClatchy is a pure-play newspaper publishing and digital media company with no other media business beyond its newspaper and online business.
15
Table of Contents
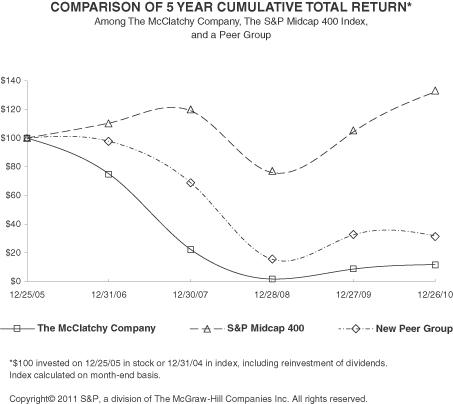
| 12/25/05 |
12/31/06 |
12/30/07 |
12/28/08 |
12/27/09 |
12/26/10 |
|||||||||||||||||||
| The McClatchy Company |
100.00 | 75.38 | 22.77 | 1.63 | 8.66 | 11.72 | ||||||||||||||||||
| S&P Midcap 400 |
100.00 | 110.32 | 119.12 | 75.96 | 104.36 | 132.16 | ||||||||||||||||||
| Peer Group |
100.00 | 97.80 | 69.24 | 15.46 | 32.55 | 31.73 | ||||||||||||||||||
The Company’s current customized peer group includes nine companies which are publicly traded with a majority of their revenues from newspaper publishing. This peer group includes: A H Belo Corp., E W Scripps Company, Gannett Inc., Gatehouse Media Inc., Journal Communications Inc., Lee Enterprises Inc., Media General Inc., New York Times Company and Sun-Times Media Group Inc.
16
Table of Contents
| ITEM 6. | SELECTED FINANCIAL DATA |
The following selected financial data should be read in conjunction with the Consolidated Financial Statements and related notes, “Management’s Discussion and Analysis of Financial Condition and Results of Operations,” and other financial information appearing elsewhere in this Annual Report on Form 10-K. The information set forth below is not necessarily indicative of the Company’s future financial condition or results of operations.
SELECTED FINANCIAL DATA (1)(2)
(in thousands, except per share amounts)
| December 26, 2010 |
December 27, 2009 |
December 28, 2008 |
December 30, 2007 (1) |
December 31, 2006 (2) |
||||||||||||||||
| REVENUES—NET: |
||||||||||||||||||||
| Advertising |
$ | 1,049,964 | $ | 1,143,129 | $ | 1,568,766 | $ | 1,911,722 | $ | 1,432,913 | ||||||||||
| Circulation |
272,776 | 278,256 | 265,584 | 275,658 | 194,940 | |||||||||||||||
| Other |
52,492 | 50,199 | 66,106 | 72,983 | 47,337 | |||||||||||||||
| 1,375,232 | 1,471,584 | 1,900,456 | 2,260,363 | 1,675,190 | ||||||||||||||||
| OPERATING EXPENSES: |
||||||||||||||||||||
| Depreciation and amortization |
133,404 | 142,889 | 142,948 | 148,559 | 98,865 | |||||||||||||||
| Other operating expenses |
1,002,945 | 1,130,183 | 1,536,343 | 1,685,710 | 1,229,417 | |||||||||||||||
| Goodwill and masthead impairment |
— | — | 59,563 | 2,992,046 | — | |||||||||||||||
| 1,136,349 | 1,273,072 | 1,738,854 | 4,826,315 | 1,328,282 | ||||||||||||||||
| OPERATING INCOME (LOSS) |
238,883 | 198,512 | 161,602 | (2,565,952 | ) | 346,908 | ||||||||||||||
| NON-OPERATING (EXPENSES) INCOME: |
||||||||||||||||||||
| Interest expense |
(177,641 | ) | (127,276 | ) | (157,385 | ) | (197,997 | ) | (93,664 | ) | ||||||||||
| Interest income |
550 | 47 | 1,429 | 243 | 3,562 | |||||||||||||||
| Equity income (loss) in unconsolidated |
11,752 | 2,130 | (14,021 | ) | (36,899 | ) | 4,951 | |||||||||||||
| Write-down of investments and land |
(24,297 | ) | (28,322 | ) | (26,462 | ) | (84,568 | ) | — | |||||||||||
| Gain (loss) on non-operating items and other—net |
(10,396 | ) | 44,320 | 56,922 | 1,982 | 9,128 | ||||||||||||||
| (200,032 | ) | (109,101 | ) | (139,517 | ) | (317,239 | ) | (76,023 | ) | |||||||||||
| INCOME (LOSS) FROM CONTINUING OPERATIONS BEFORE INCOME TAXES |
38,851 | 89,411 | 22,085 | (2,883,191 | ) | 270,885 | ||||||||||||||
| INCOME TAX PROVISION (BENEFIT) |
5,661 | 29,147 | 19,278 | (156,582 | ) | 87,390 | ||||||||||||||
| INCOME (LOSS) FROM CONTINUING OPERATIONS |
33,190 | 60,264 | 2,807 | (2,726,609 | ) | 183,495 | ||||||||||||||
| INCOME (LOSS) FROM DISCONTINUED OPERATIONS, NET OF INCOME TAXES |
3,083 | (6,174 | ) | (6,758 | ) | (9,404 | ) | (339,072 | ) | |||||||||||
| NET INCOME (LOSS) |
$ | 36,273 | $ | 54,090 | $ | (3,951 | ) | $ | (2,736,013 | ) | $ | (155,577 | ) | |||||||
| NET INCOME (LOSS) PER COMMON SHARE: |
||||||||||||||||||||
| Basic: |
||||||||||||||||||||
| Income (loss) from continuing operations |
$ | 0.39 | $ | 0.72 | $ | 0.03 | $ | (33.26 | ) | $ | 2.85 | |||||||||
| Income (loss) from discontinued operations |
0.04 | (0.07 | ) | (0.08 | ) | (0.11 | ) | (5.27 | ) | |||||||||||
| Net income (loss) per share |
$ | 0.43 | $ | 0.65 | $ | (0.05 | ) | $ | (33.37 | ) | $ | (2.42 | ) | |||||||
| Diluted: |
||||||||||||||||||||
| Income (loss) from continuing operations |
$ | 0.39 | $ | 0.72 | $ | 0.03 | $ | (33.26 | ) | $ | 2.84 | |||||||||
| Income (loss) from discontinued operations |
0.04 | (0.07 | ) | (0.08 | ) | (0.11 | ) | (5.25 | ) | |||||||||||
| Net income (loss) per share |
$ | 0.43 | $ | 0.65 | $ | (0.05 | ) | $ | (33.37 | ) | $ | (2.41 | ) | |||||||
| DIVIDENDS PER COMMON SHARE |
$ | — | $ | 0.09 | $ | 0.54 | $ | 0.72 | $ | 0.72 | ||||||||||
| CONSOLIDATED BALANCE SHEET DATA: |
||||||||||||||||||||
| Total assets |
$ | 3,136,359 | $ | 3,302,899 | $ | 3,522,206 | $ | 4,137,919 | $ | 8,054,710 | ||||||||||
| Long-term debt (3) |
1,703,339 | 1,896,436 | 2,037,776 | 2,471,827 | 2,746,669 | |||||||||||||||
| Stockholders’ equity |
219,345 | 170,189 | 52,429 | 425,540 | 3,103,624 | |||||||||||||||
| (1) | On March 5, 2007, the Company sold the (Minneapolis) Star Tribune newspaper of Minneapolis, MN. Results of the (Minneapolis) Star Tribune newspaper are included in discontinued operations for all periods presented. |
| (2) | On June 27, 2006 the Company purchased Knight-Ridder, Inc. Information as of and for the year ended December 31, 2006, includes the newspapers and other operations from the acquisition since the beginning of the third quarter of fiscal 2006. |
| (3) | Excludes $530.0 million classified in current liabilities as of December 31, 2006, as such debt was repaid with proceeds from the disposition of the (Minneapolis) Star Tribune newspaper. |
17
Table of Contents
| ITEM 7. | MANAGEMENT’S DISCUSSION AND ANALYSIS OF FINANCIAL CONDITION AND RESULTS OF OPERATION |
Overview
The McClatchy Company is the third largest newspaper publisher by circulation in the United States, with 30 daily newspapers, approximately 43 non-dailies, and direct marketing and direct mail operations. McClatchy also operates leading local websites in each of its markets which extend its audience reach. The websites offer users information, comprehensive news, advertising, e-commerce and other services. Together with its newspapers and direct marketing products, these interactive operations make McClatchy the leading local media company in each of its premium high growth markets. McClatchy-owned newspapers include The Miami Herald, The Sacramento Bee, the Fort Worth Star-Telegram, The Kansas City Star, The Charlotte Observer, and The News & Observer (Raleigh).
McClatchy also owns a portfolio of premium digital assets, including 14.4% of CareerBuilder LLC, which operates the nation’s largest online job site CareerBuilder.com, 25.6% of Classified Ventures LLC, a company that offers classified websites such as the auto website Cars.com and the rental site Apartments.com, and 33.3% of HomeFinder LLC, which operates the online real estate website HomeFinder.com.
The Company’s primary source of revenue is print and digital advertising, which accounted for 76.3% of the Company’s revenue for fiscal 2010. Print and digital advertising revenues are derived from retail, national and classified advertising. Print and preprinted insert advertising are sold in the daily newspaper, but are also sold in direct marketing and other advertising products. While percentages vary from year to year and from newspaper to newspaper, classified advertising has, over time, generally decreased as a percentage of total advertising revenues. Classified advertising as a percentage of total advertising revenues was 26.7% in 2010 compared to 26.9% in fiscal 2009 and 31.3% in fiscal 2008. The decrease in classified advertising as a percentage of total advertising from 2008 to recent periods was primarily as a result of the economic slowdown affecting classified advertising and the secular shift in advertising demand to digital products.
While revenues from retail advertising carried as a part of newspapers (run-of-press or ROP advertising) or in advertising inserts placed in newspapers (preprint advertising) has decreased year over year, retail advertising has, over time, generally increased as a percentage of total advertising. For 2010 retail advertising was 52.5% of total advertising compared to 53.4% in fiscal 2009 and 50.1% in fiscal 2008. This is partially a reflection of retail advertising declining at a slower rate than classified advertising during the economic downturn, thus increasing as a percentage of total advertising.
National advertising as a percentage of total advertising revenue remained relatively similar year-over-year and contributed 9.2% of total advertising revenue in fiscal 2010. Direct marketing and other advertising made up the remainder of the Company’s advertising revenues in fiscal 2010.
While included in the revenues described above, all categories of digital advertising are performing better than print advertising. The Company, along with a number of other newspaper companies, is a partner in a broad-based partnership with Yahoo, Inc. (Yahoo). The Company’s local sales force is able to sell Yahoo advertising inventory and share in the revenue from the sales.
In total, revenues from digital advertising increased 2.4% in fiscal 2010 compared to fiscal 2009 while print advertising revenues declined 10.2% over the same periods. Also, digital advertising revenues represented 18.1% of total advertising revenues in fiscal 2010, up from 16.2% of total advertising revenues in fiscal 2009 and 11.6% of total advertising in fiscal 2008.
Circulation revenues increased to 19.8% of the Company’s newspaper revenues in fiscal 2010 from 18.9% in fiscal 2009 and 14.0% in fiscal 2008. Most of the Company’s newspapers are delivered by independent contractors. Circulation revenues are recorded net of direct delivery costs.
18
Table of Contents
See the following “Results of Operations” for a discussion of the Company’s revenue performance and contribution by category for fiscal 2010, 2009 and 2008.
Recent Events and Trends
Advertising Revenues:
Advertising revenues declined in fiscal 2009 and fiscal 2008, but the declines moderated in 2010 as the economy began to recover. Management believes the declines are primarily attributable to the weaknesses in the United States economy and the general shift in advertising to the internet, particularly in the classified area, where the Company’s newspapers face increased competition.
During 2010 certain advertising revenue categories, including digital and direct marketing advertising grew year-over-year from 2009. The digital and direct marketing categories also gained strength in their rates of growth in the last half of 2010 and management expects this trend to continue in 2011.
See the revenue discussions in management’s review of the Company’s “Results of Operations.”
Purchase of Debt Securities:
In February 2011 the Company purchased $28.4 million aggregate principal amount of its outstanding debt securities for $28.4 million in cash generated by operations and partially obtained from its Credit Agreement. The Company purchased outstanding principal amount of debt securities as follows: $0.4 million of the 15.75% senior notes maturing in 2014, $8.0 million of unsecured notes maturing in 2014, $10.0 million of unsecured notes maturing in 2017 and $10.0 million of its secured notes maturing in 2017.
Contribution of Company-Owned Real Property to Pension Plan:
In January 2011 the Company contributed certain of its real property appraised at $49.6 million to its qualified defined benefit pension plan. The Company is leasing back the property from its pension plan for 10 years at an annual rent of approximately $4.0 million. The property will be managed by an independent fiduciary and the appraisals and lease payments have been determined by that fiduciary.
McClatchy expects its required pension contribution under ERISA to be approximately $51.2 million in 2011, and the contribution of real property is expected to satisfy most of the required pension contribution in 2011. The remaining required contribution for 2011, if any, will be made in cash. See Note 13 to the Consolidated Financial Statements for a greater description of this transaction and the “Liquidity and Capital Resources” section below for a discussion of potential future pension contributions.
Restructuring Plans and Other Expense Activity:
In 2008, the Company announced plans to reduce its workforce as the Company streamlined its operations and staff size. The Company’s workforce in 2008 was reduced by approximately 2,550 positions. In March 2009, the Company announced additional restructuring efforts, which included reducing the Company’s workforce by 15%, or 1,650 positions, the freezing of the Company’s pension plans and a temporary suspension of the Company matching contribution to the 401(k) plan as of March 31, 2009. The Company’s restructuring plan also involved wage reductions across the Company for additional savings. The Company’s chairman and chief executive officer (CEO) declined his 2008 and 2009 bonuses and other executive officers did not receive bonuses for 2008. In addition, effective March 30, 2009, the CEO’s base salary was reduced by 15%, other executive officers’ salaries were reduced by 10%, and no bonuses were paid to any employee in 2009. The Company also reduced the cash compensation, including retainers and meeting fees, paid to its directors by approximately 13%, and the directors declined any stock awards for 2008 and 2009. The costs related to these plans, including related
19
Table of Contents
severance, were largely paid in the years the plans were implemented. Much of the expense reductions from the plans are permanent in nature, however, the impact of the savings were mostly realized in fiscal years 2008 and 2009 and through the first fiscal quarter of 2010.
Newsprint:
Newsprint prices are volatile and are largely dependent on global demand and supply for newsprint. Supply and demand are largely in balance as the result of higher export demand and reductions in capacity. As a result, producers have been able to increase prices in the second half of 2009 and in fiscal 2010.
Significant changes in newsprint prices can increase or decrease the Company’s operating expenses, and therefore, directly affect the Company’s operating results. However, because the Company has ownership interests in newsprint producer Ponderay, an increase in newsprint prices, while negatively affecting the Company’s operating expenses, would increase its share of earnings from this investment. A decline in newsprint prices would have the opposite effect. Ponderay is also impacted by the higher cost of energy and fiber used in the paper-making process. The impact of newsprint price increases on the Company’s financial results is discussed under “Results of Operations” below.
Debt Refinancing:
February 11, 2010: The Company was a party to a credit agreement, dated as of June 27, 2006 (as amended through May 20, 2009, the “original credit agreement”), which provided for a five-year revolving credit facility and term loans. On January 26, 2010, the Company entered into an amendment and restatement of the original credit agreement that became effective on February 11, 2010 (the “Amended and Restated Credit Agreement”), immediately prior to the closing of an offering of $875.0 million of senior secured notes. The Amended and Restated Credit Agreement required a substantial reduction in bank debt and allowed for the early retirement of other bond debt using the proceeds of the secured notes offering. The Company was in compliance with all covenants of the credit agreement at the time of the refinancing.
Upon closing of the refinancing transaction on February 11, 2010, the Amended and Restated Credit Agreement provided for a $262.0 million term loan and a $249.3 million revolving credit facility, including a $100.0 million letter of credit sub-facility, and extended the term of certain of the credit commitments to July 1, 2013. In connection with the Amended and Restated Credit Agreement, certain of the lenders did not extend the maturity of their commitments from the original maturity date of June 27, 2011. See discussion of the December 16, 2010, amendment below for additional details on the Amended and Restated Credit Agreement.
In connection with the Amended and Restated Credit Agreement, the Company issued new 11.50% Senior Secured Notes due 2017 (the “2017 Notes”) totaling $875.0 million. In addition, the Company completed tender offers for its 7.125% notes due in 2011 (the “2011 Notes”) and 15.75% senior notes due in 2014 (the “2014 Senior Notes”), paying $187.3 million in cash for aggregate principal amounts of $148.0 million of 2011 Notes and $23.9 million of 2014 Notes.
December 16, 2010, Amendment: The Company paid down the principal amount of its term loans outstanding under the Amended and Restated Credit Agreement throughout 2010 using its cash from operations. On December 16, 2010 the Company entered into an amendment of the Amended and Restated Credit Agreement (the Credit Agreement) to, among other things, remove certain restrictions on the ability to repurchase its publicly-traded bonds, to repay the remaining $41.0 million of bank term loans and to reduce the lenders’ revolving loan commitments under the Amended and Restated Credit Agreement. The remaining term loans were repaid on December 20, 2010.
The Credit Agreement provides for a $150.8 million revolving credit facility, including a $100.0 million letter of credit sub-facility. Revolving commitments of $25.8 million will terminate on June 27, 2011 and the remaining revolving loan commitments of $125.0 million will terminate on July 1, 2013.
20
Table of Contents
Debt Exchange Offers: On June 26, 2009, the Company completed a private debt exchange offer for all of its outstanding debt securities for a combination of cash and its 2014 Senior Notes. The 2014 Senior Notes were senior unsecured obligations and were guaranteed by McClatchy’s existing and future material domestic subsidiaries. The Company exchanged $3.4 million in cash and $24.2 million of 2014 Senior Notes in the exchange offer. In exchange for the cash and 2014 Senior Notes the Company retired the following outstanding principal amount of debt securities maturing in the respective years: $3.8 million in 2011 notes, $11.1 million in 2014 notes, $53.4 million in 2017 notes, $10.8 million in 2027 debentures and $23.8 million in 2029 debentures. The Company recorded a pre-tax gain of approximately $44.1 million on the exchange in 2009. The gain was equal to the carrying amount of the exchanged securities less the total future cash payments of the 2014 Senior Notes, including both payments of interest and principal amount, and related expenses of the exchange. A total of $23.9 million of 2014 Senior Notes were repurchased in connection with the February 2010 tender-offer using the proceeds from the 2017 Notes discussed in “Debt Refinancing” section above. The remainder of the 2014 Senior Notes was repurchased in February 2011.
In the second fiscal quarter of 2008, the Company repurchased $300.0 million aggregate principal amount of its outstanding debt securities for $282.4 million in cash obtained from its original credit facility. In the second half of 2008, the Company purchased $19.0 million aggregate principal of its outstanding debt securities maturing in 2009 in the open market for $17.7 million in cash obtained from its original credit facility. The Company recorded gains totaling $21.0 million on the extinguishments of these notes which included the write-off of approximately $3.0 million of net unamortized premiums related to these securities.
See Note 5 to the Consolidated Financial Statements for an expanded discussion of these transactions.
Disposition Transactions:
On March 5, 2007, the Company sold the (Minneapolis) Star Tribune and other publications and websites related to the newspaper for $530.0 million. In 2008, the Company received a total income tax benefit of approximately $200.0 million related to the sale; $185.0 million of the income tax benefit was received as an income tax refund and approximately $15.0 million was recouped through reductions to income taxes payable.
On January 31, 2011, the contract to sell certain land in Miami terminated because the buyer did not consummate the transaction by the closing deadline in the contract. Management evaluated the value of this land on its balance sheet and, as a result of this evaluation, the Company wrote down the value of the land by $21.4 million in the fourth quarter of 2010. This transaction is discussed in greater detail in Note 3 to the Consolidated Financial Statements.
Recent Accounting Pronouncements:
See Note 1 to the Consolidated Financial Statements for a discussion of recent accounting pronouncements.
Critical Accounting Policies
The accompanying discussion and analysis of our financial condition and results of operations are based upon the Company’s consolidated financial statements, which have been prepared in accordance with generally accepted accounting principles in the United States. The preparation of these financial statements requires management to make estimates and judgments that affect the reported amounts of assets, liabilities, revenues and expenses, and related disclosure of contingent assets and liabilities. These estimates form the basis for making judgments about the carrying values of assets and liabilities that are not readily apparent from other sources. The Company bases its estimates and judgments on historical experience and on various other assumptions that it believes are reasonable under the circumstances. However, future events are subject to change and the best estimates and judgments routinely require adjustment. The most significant areas involving estimates and
21
Table of Contents
assumptions are amortization and/or impairment of goodwill and other intangibles, pension and post-retirement expenses, insurance reserves, and the Company’s accounting for income taxes. The Company believes the following critical accounting policies, in particular, affect its more significant judgments and estimates used in the preparation of its consolidated financial statements.
Goodwill and Intangible Impairment—The Company tests for goodwill annually (at year-end) or whenever events occur or circumstances change that would more likely than not reduce the fair value of a reporting unit below its carrying amount. Such indicators of impairment may include, but are not limited to, changes in business climate such as an economic downturn, significant operating cash flow declines related to its newspapers or a major change in the assessment of future operations of its newspapers, or a sustained decline in the Company’s stock price below the per-share book value of stockholders’ equity. The Company conducted its annual impairment testing at the end of its fiscal years in 2010, 2009 and 2008. As a result of its testing, impairment charges related to newspaper mastheads were recorded in fiscal 2008. Please see additional information in Note 1 to the Company’s Consolidated Financial Statements.
Summary of Approach and Analysis of Impairments:
The required two-step approach to test for impairment requires the use of accounting judgments and estimates of future operating results. Because accounting standards require that impairment testing be done at a reporting unit level, the Company performs this testing on its operating segments (which are considered reporting units). An impairment charge generally is recognized when the carrying amount of the reporting unit’s net assets exceeds the estimated fair value of the reporting unit. In summary the Company conducts its tests and considers the following factors:
| • | The fair value of the Company’s reporting units is determined using a discounted cash flow model. The projected cash flows are based on estimates of revenues, newsprint expenses and other cash costs. While these estimates are always inherently subject to risks and uncertainties, the ability to project future operations (and in particular advertising revenues) is difficult. |
| • | The discount rate is determined using the Company’s weighted average cost of capital, adjusted for risks perceived by investors which are implicit in the Company’s publicly-traded stock price. |
| • | The amount of a goodwill impairment charge requires management to allocate the fair value of the reporting units to all of the assets and liabilities of that unit (including any unrecognized intangible assets), using its best judgments and estimates in valuing the reporting unit, to determine the implied fair value of goodwill. |
| • | The resulting total fair value of the reporting units is then reconciled to the market capitalization of the Company, giving effect to an appropriate control premium. A goodwill impairment charge is recorded to the extent that the implied goodwill values are below the book value of goodwill for the reporting units. |
Fair value calculations by their nature require management to make assumptions about future operating results which can be difficult to predict with certainty. They are influenced by management’s views of future advertising trends in the industry and in the markets in which it operates newspapers. The variability in these trends and the difficulty in projecting advertising growth, in particular, in each newspaper market are impacted by the unprecedented declines in advertising in recent years. The Company implemented restructuring plans which have mitigated the impact of these declines on its cash flows and helped stabilize operations. However, based on management’s analysis, the fair value of the Company’s reporting units exceeded the carrying value by approximately 20.0% as of December 26, 2010.
22
Table of Contents
Masthead Considerations:
Newspaper mastheads (newspaper titles and website domain names) are not subject to amortization and are tested for impairment annually (at year-end), or more frequently if events or changes in circumstances indicate that the asset might be impaired. The impairment test consists of a comparison of the fair value of each newspaper masthead with its carrying amount. The Company uses a relief from royalty approach which utilizes a discounted cash flow model to determine the fair value of each newspaper masthead. Management’s judgments and estimates of future operating results in determining the reporting unit fair values are consistently applied to each newspaper in determining the fair value of each newspaper masthead.
The Company performed its annual impairment tests on newspaper mastheads as of December 26, 2010, December 27, 2009, and December 28, 2008. As a result, impairment charges related to newspaper mastheads were recorded in fiscal 2008. However, no impairment charges to the value of mastheads were recorded in 2010 and 2009. See Note 1 to the Consolidated Financial Statements for a discussion of the impairment charges recorded in 2008.
Other Intangible Assets Considerations:
Long-lived assets such as intangible assets are subject to amortization (primarily advertiser and subscriber lists) and are tested for recoverability whenever events or change in circumstances indicate that their carrying amounts may not be recoverable. The carrying amount of each asset group is not recoverable if it exceeds the sum of the undiscounted cash flows expected to result from the use of such asset group. No impairment loss was recognized on intangible assets subject to amortization in 2010, 2009 or 2008.
Pension and Post-Retirement Benefits—The Company has significant pension and post-retirement benefit costs and credits that are developed from actuarial valuations. Inherent in these valuations are key assumptions including discount rates and expected returns on plan assets. The Company is required to consider current market conditions, including changes in interest rates, in establishing these assumptions. Changes in the related pension and post-retirement benefit costs or credits may occur in the future because of changes resulting from fluctuations in the Company’s employee headcount and/or changes in the various assumptions.
Current standards of accounting for defined benefit pension plans and post-retirement benefit plans requires recognition of (1) the funded status of a pension plan (difference between the plan assets at fair value and the projected benefit obligation) and (2) the funded status of a post-retirement plan (difference between the plan assets at fair value and the accumulated benefit obligation), as an asset or liability on the balance sheet. At December 26, 2010, net retirement obligations in excess of retirement plans’ assets were $613.3 million. This amount included $134.2 million for non-qualified plans that do not have assets. Obligations in excess of plan assets for the Company’s qualified plan netted to a $479.1 million liability at December 26, 2010. The funded status as of December 26, 2010, does not include the contribution of property of $49.6 million to the qualified pension plan in January 2011 that is discussed in Note 13 to the Consolidated Financial Statements. At December 27, 2009, net retirement obligations in excess of retirement plans’ assets were $639.2 million. This amount included $139.2 million for non-qualified plans that do not have assets. Obligations in excess of qualified plan assets netted to a $500.0 million liability at December 27, 2009.
On February 5, 2009, the Company announced a decision to freeze its defined benefit pension plans as of March 31, 2009.
The Company used discount rates of 5.09% to 6.05% and an assumed long-term return on assets of 8.25% to calculate its retirement expenses in 2010. The 2010 expenses were also impacted by freezing the plan in March 2009. See Note 7 to the Consolidated Financial Statements for a more in-depth discussion of the Company’s policies in setting its key assumptions related to these obligations.
23
Table of Contents
For fiscal 2010 a change in the weighted average rates would have had the following impact on the Company’s net benefit cost:
| • | A decrease of 50 basis points in the long-term rate of return would have increased the Company’s net benefit cost by approximately $5.8 million; |
| • | A decrease of 25 basis points in the discount rate would have decreased the Company’s net benefit cost by approximately $0.5 million. |
Income Taxes—The Company’s current and deferred income tax provisions are calculated based on estimates and assumptions that could differ from the actual results reflected in income tax returns filed during the subsequent year. These estimates are reviewed and adjusted, if needed, throughout the year. Adjustments between the Company’s estimates and the actual results of filed returns are recorded when identified.
The amount of income taxes paid is subject to periodic audits by federal and state taxing authorities, which may result in proposed assessments. These audits may challenge certain aspects of the Company’s tax positions such as the timing and amount of deductions and allocation of taxable income to the various tax jurisdictions. Income tax contingencies require significant management judgment in estimating final outcomes. Actual results could materially differ from these estimates and could significantly affect the effective tax rate and cash flows in future periods.
Insurance—The Company is insured for workers’ compensation using both self-insurance and large deductible programs. The Company relies on claims experience in determining an adequate provision for insurance claims.
The Company used a discount rate of 2.2% to calculate workers’ compensation reserves as of December 26, 2010. A decrease of 25 basis points in the discount rate would have had an immaterial effect on total workers’ compensation reserves. A 10% increase in the claims would have increased the total workers’ compensation reserves by approximately $2.0 million.
Results of Operations
Fiscal 2010 Compared to Fiscal 2009
The Company reported income from continuing operations in fiscal 2010 of $33.2 million or 39 cents per share. The Company’s total net income in fiscal 2010 was $36.3 million or 43 cents per share including discontinued operations in fiscal 2010.
Revenues:
Revenues in fiscal 2010 were $1.4 billion, down 6.5% from revenues of $1.5 billion in fiscal 2009. Advertising revenues were $1.0 billion in fiscal 2010, down 8.1% from fiscal 2009, and circulation revenues were $272.8 million in fiscal 2010, down 2.0% from fiscal 2009.
24
Table of Contents
The following summarizes the Company’s revenue by category, which compares fiscal 2010 with fiscal 2009 (dollars in thousands):
| December
26, 2010 |
December 27, 2009 |
% Change |
||||||||||
| Advertising: |
||||||||||||
| Retail |
$ | 550,993 | $ | 610,280 | (9.7 | ) | ||||||
| National |
97,068 | 106,251 | (8.6 | ) | ||||||||
| Classified: |
||||||||||||
| Auto |
83,221 | 90,667 | (8.2 | ) | ||||||||
| Real estate |
55,468 | 70,655 | (21.5 | ) | ||||||||
| Employment |
56,032 | 58,963 | (5.0 | ) | ||||||||
| Other |
85,101 | 87,212 | (2.4 | ) | ||||||||
| Total classified |
279,822 | 307,497 | (9.0 | ) | ||||||||
| Direct marketing and other |
122,081 | 119,101 | 2.5 | |||||||||
| Total advertising |
1,049,964 | 1,143,129 | (8.1 | ) | ||||||||
| Circulation |
272,776 | 278,256 | (2.0 | ) | ||||||||
| Other |
52,492 | 50,199 | 4.6 | |||||||||
| Total revenues |
$ | 1,375,232 | $ | 1,471,584 | (6.5 | ) | ||||||
Advertising revenue is the largest component of the Company’s revenue, accounting for 76.3% and 77.7% of total revenues in 2010 and 2009, respectively. The Company categorizes advertising as follows:
| • | Retail—local retailers, local stores of national retailers, department and furniture stores, restaurants and other consumer-related businesses. Retail advertising also includes revenues from preprinted advertising inserts distributed in the newspaper. |
| • | National—national and major accounts such as telecommunications companies, financial institutions, movie studios, airlines and other national companies. |
| • | Classified—local auto dealers, employment, real estate including display advertising and other classified advertising. |
| • | Direct Marketing and Other—advertisements in direct mail, shared mail and niche publications, total market coverage publications and other miscellaneous advertising. |
Advertising in the newspaper is typically display advertising, or in the case of classified, display and/or liner advertising, while digital advertising is in the form of display or banner ads, video, search advertising and/or liner ads. Advertising printed directly in the newspaper is considered “run of press” (ROP) advertising while preprint advertising consists of preprinted advertising inserts delivered with the newspaper.
Retail advertising in fiscal 2010 decreased $59.3 million or 9.7% from fiscal 2009. The declines in retail advertising were across numerous segments, including the furniture and home furnishings segments and department store advertising. Digital retail advertising in fiscal 2010 increased $4.2 million, or 5.9%, from fiscal 2009 driven by banner and display advertisements and the impact of the Yahoo alliance, while print ROP advertising in fiscal 2010 decreased $44.5 million or 15.6% from fiscal 2009. Preprint advertising in fiscal 2010 decreased $19.0 million or 7.5% from fiscal 2009.
National advertising in fiscal 2010 decreased $9.2 million or 8.6% from fiscal 2009. The declines in total national advertising were primarily in the telecommunications and national automotive segments. Digital national advertising in fiscal 2010 decreased $0.1 million or 0.6% from fiscal 2009.
25
Table of Contents
Classified advertising in fiscal 2010 decreased $27.7 million, or 9.0% from fiscal 2009. Print classified advertising in fiscal 2010 declined $28.0 million or 13.0%. Digital classified advertising in fiscal 2010 increased $0.4 million, or 0.4%, from fiscal 2009 as the Company recorded growth in every classified category except digital real estate advertising. The following is a discussion of the major classified advertising categories:
| • | Automotive advertising in fiscal 2010 decreased $7.4 million, or 8.2%, from fiscal 2009, reflecting lower automotive sales and the consolidation of automotive dealers in early 2010. Print automotive advertising in fiscal 2010 declined $8.4 million, or 14.3%, from fiscal 2009 while digital automotive advertising in fiscal 2010 grew $1.0 million, or 3.1% from fiscal 2009. The better results in digital advertising, relative to other major categories, reflect the strength of the Company’s Cars.com digital products. |
| • | Real estate advertising in fiscal 2010 decreased $15.2 million, or 21.5%, from fiscal 2009. The Company continued to be adversely impacted by the real estate downturn. In total, print real estate advertising declined $13.2 million, or 24.4%, while digital real estate advertising declined $2.0 million, or 12.2% from fiscal 2009. |
| • | Employment advertising in fiscal 2010 decreased $2.9 million, or 5.0%, from fiscal 2009 reflecting a national slowdown in hiring resulting in a decrease in employment advertising. However, employment advertising grew in the second half of 2010. For the full year, print employment advertising declined $3.1 million, or 10.4%, while digital employment advertising increased $0.1 million, or 0.4% from fiscal 2009. |
| • | Other classified advertising, which primarily includes third-party liners, legal and remembrances advertisements, decreased $2.1 million in fiscal 2010, or 2.4% from fiscal 2009. Print other classified declined $3.4 million in fiscal 2010, or 4.6% from fiscal 2009. Digital other classified grew $1.3 million, or 9.4%. |
Digital advertising revenue, which is included in each of the advertising categories discussed above, totaled $189.9 million in fiscal 2010, an increase of 2.4% as compared to fiscal 2009. Digital retail advertising and all categories of digital classified advertising, except real estate, increased in 2010 compared to 2009.
Direct marketing advertising grew $3.5 million, or 3.0%, in fiscal 2010 from fiscal 2009 reflecting growing popularity of the Company’s “Sunday Select” product and other direct marketing products. Sunday Select is a package of preprints delivered to non-newspaper subscribers upon request.
In fiscal 2010, circulation revenues decreased $5.5 million, or 2.0%, from fiscal 2009, primarily reflecting lower volumes. Average paid daily circulation declined 6.9% and Sunday was down 6.3% in fiscal 2010. Circulation volume trends improved during 2010 as the Company’s newspapers cycled the circulation initiatives taken in 2009 to both cut expenses and increase prices. Nonetheless, the Company expects circulation volumes to remain lower in fiscal 2011 compared to fiscal 2010 reflecting the fragmentation of audiences faced by all media as available outlets proliferate and readership trends change.
26
Table of Contents
Operating Expenses:
Operating expenses in fiscal 2010 and fiscal 2009 include severance related restructuring charges and accelerated depreciation on equipment related to the outsourcing of printing at various newspapers. The following table summarizes operating expenses, as well as the amount of these items in operating expenses in fiscal 2010 and 2009 (in thousands):
| 2010 |
2009 |
% Change |
||||||||||
| Operating expenses |
$ | 1,136,349 | $ | 1,273,072 | (10.7 | ) | ||||||
| Total restructuring charges |
15,863 | 39,139 | (59.5 | ) | ||||||||
| Compensation expense |
$ | 519,180 | $ | 582,241 | (10.8 | ) | ||||||
| Compensation-related restructuring charges |
9,853 | 28,575 | (65.5 | ) | ||||||||
Operating expenses in fiscal 2010 decreased $136.7 million, or 10.7%, from fiscal 2009 as the Company continued to reduce costs to mitigate the impact of revenue declines. Operating expenses in fiscal 2010 included $9.9 million in severance related to the Company’s continued restructuring program and $6.0 million of accelerated depreciation on equipment related to the outsourcing of printing at various newspapers. Operating expenses in fiscal 2009 included $28.6 million in severance and benefit plan curtailment gain related to the Company’s restructuring plans and $10.6 million of accelerated depreciation on equipment related to the outsourcing of printing at various newspapers.
Compensation expenses in fiscal 2010 decreased $63.1 million, or 10.8%, from fiscal 2009, and included the restructuring charges discussed above, which were greater in fiscal 2009 than in fiscal 2010. The decline in compensation primarily reflected reductions in staffing. On average, staffing was down 13.4% in fiscal 2010 compared to fiscal 2009. Fringe benefit costs in fiscal 2010 were similar to the amount in fiscal 2009 as lower medical costs were offset by higher retirement benefits, primarily accrued 401(k) supplemental contributions (see Note 7 to the Consolidated Financial Statements for an expanded discussion of 401(k) plan benefits).
Newsprint and supplement expense in fiscal 2010 was down 18.3% from fiscal 2009 primarily reflecting declines in newsprint usage, and to a lesser extent, average newsprint prices for the year (owing to lower newsprint prices in the first half of fiscal 2010). Newsprint expense in fiscal 2010 was down 23.6% while supplement expense increased 5.7% from fiscal 2009. Depreciation and amortization expenses in fiscal 2010 declined $9.5 million compared to fiscal 2009 and included the impact of lower accelerated depreciation on equipment related to outsourcing in 2010. Depreciation expense was also lower because of lower capital expenditures in recent years and by other assets that became fully depreciated during the year. Other operating costs were down $33.7 million, or 8.8%, from fiscal 2009 reflecting companywide efforts to reduce costs, including, among others, reductions in bad debt expense, energy-related expenses and professional services.
Interest:
Interest expense in fiscal 2010 increased $50.4 million, or 39.6%, from fiscal 2009 due primarily to higher interest rates on the new secured notes issued in the February 2010 debt refinancing, offset partially by lower debt balances. In addition, interest expense in fiscal 2010 included a $2.1 million write-off of deferred debt financing fees associated with bank term debt repaid during the year that was not associated with amendment of the credit agreement. See Note 5 to the Consolidated Financial Statements for a discussion of the Company’s debt refinancing in 2010.
Equity Income:
Income from unconsolidated investments was $11.8 million in fiscal 2010 compared to income of $2.1 million in fiscal 2009. The Company’s internet-related joint ventures, particularly CareerBuilder and Classified Ventures, reported greater income in fiscal 2010.
27
Table of Contents
Write-down of Investments and Land:
In fiscal 2010, a less-than-50% owned company identified goodwill impairment at a reporting unit and as a result, the Company recognized a charge of $3.0 million related to its share of this impairment in the fourth quarter of fiscal 2010.
On January 31, 2011, the contract to sell certain land in Miami terminated because the buyer did not consummate the transaction by the closing deadline in the contract. Management evaluated the value of this land on its balance sheet and, as a result of this evaluation, the Company wrote down the value of the land by $21.4 million in the fourth quarter of 2010. The Company wrote down the value of the land by $26.3 million in the fourth quarter of 2009 after extending the deadline on the contract to January 31, 2011, and receipt of an additional $6.0 million nonrefundable deposit from the buyer. This transaction is discussed in greater detail in Note 3 to the Consolidated Financial Statements.
Gain (Loss) on Extinguishment of Debt:
On February 11, 2010, the Company completed a refinancing of substantially all of its debt maturing in 2011 by amending and restating its credit agreement, issuing $875.0 million of senior secured notes and tendering for certain public notes due in 2011 and 2014. On December 16, 2010, the Company agreed to repay all of its outstanding term debt (totaling $41.0 million) under this facility and lenders agreed to amend the Amended and Restated Credit Agreement (Credit Agreement) to eliminate restrictions on the early retirement of the company’s existing public bonds. The Company paid $32.0 million in fees related to various transactions in the refinancing and the subsequent amendment, most of which were capitalized as deferred financing costs. However, the Company recognized $10.7 million in losses on debt refinancing and the subsequent amendment to its Credit Agreement in fiscal 2010.
On June 26, 2009, the Company completed a private debt exchange offer for all of its outstanding debt securities for a combination of cash and its 2014 Senior Notes. In exchange for the $3.4 million in cash and $24.2 million of 2014 Senior Notes the Company retired $102.8 million of unsecured publicly traded bonds. A total of $23.9 million of 2014 Senior Notes were repurchased in connection with the February 2010 tender offer using the proceeds from the senior secured notes discussed in “Recent Events and Trends, Debt Refinancing” section above. The Company recorded an after-tax gain of $44.1 million on the transaction in fiscal 2009.
See Note 5 to the Consolidated Financial Statements for an expanded discussion of these transactions.
Income Taxes:
The effective income tax rate on income from continuing operations in fiscal 2010 was 14.6%. The effective tax rate is lower than the statutory federal tax rate due largely to tax settlements for certain federal and state tax issues, including expiration of open tax years for certain states. Further, the effective tax rate percentage was affected by the inclusion in pre-tax income of discrete items such as the extinguishment of debt, the write-down of an asset previously under contract to be sold, and severance for fiscal 2010. The effective tax rate on earnings excluding the impact of these items was approximately 41.6%, and is largely reflective of higher effective state tax rates in certain states in which the Company operates.
Discontinued Operations:
In fiscal 2010, the Company recorded $4.9 million in pre-tax income mainly related to a reduction in a reserve for potential indemnification obligations related to workers’ compensation claims. The obligations are associated with disposed newspapers and the reserve was reduced because the affected newspapers paid the current amounts and have shown the ability to continue to service their obligations.
28
Table of Contents
In fiscal 2009 the Company reserved $10.7 million for indemnifications related to several divested papers.
Fiscal 2009 Compared to Fiscal 2008
The Company reported income from continuing operations in fiscal 2009 of $60.3 million or 72 cents per share. The Company’s total net income in fiscal 2009 was $54.1 million or 65 cents per share including discontinued operations in fiscal 2009.
Revenues:
Revenues in fiscal 2009 were $1.5 billion, down 22.6% from revenues of $1.9 billion in fiscal 2008. Advertising revenues were $1.1 billion in fiscal 2009, down 27.1% from advertising in fiscal 2008, and circulation revenues were $278.3 million in fiscal 2009, up 4.8% from fiscal 2008.
As discussed in “Recent Events and Trends” above, the economic weakness in the United States continued to impact the Company’s advertising revenues in 2009. Circulation revenues increased primarily as a result of price increases at most newspapers.
The following summarizes the Company’s revenue by category, which compares fiscal 2009 with fiscal 2008 (dollars in thousands):
| December
27, 2009 |
December 28, 2008 |
% Change |
||||||||||
| Advertising: |
||||||||||||
| Retail |
$ | 610,280 | $ | 786,316 | (22.4 | ) | ||||||
| National |
106,251 | 146,376 | (27.4 | ) | ||||||||
| Classified: |
||||||||||||
| Auto |
90,667 | 131,332 | (31.0 | ) | ||||||||
| Real estate |
70,655 | 123,276 | (42.7 | ) | ||||||||
| Employment |
58,963 | 144,089 | (59.1 | ) | ||||||||
| Other |
87,212 | 91,637 | (4.8 | ) | ||||||||
| Total classified |
307,497 | 490,334 | (37.3 | ) | ||||||||
| Direct marketing and other |
119,101 | 145,740 | (18.3 | ) | ||||||||
| Total advertising |
1,143,129 | 1,568,766 | (27.1 | ) | ||||||||
| Circulation |
278,256 | 265,584 | 4.8 | |||||||||
| Other |
50,199 | 66,106 | (24.1 | ) | ||||||||
| Total revenues |
$ | 1,471,584 | $ | 1,900,456 | (22.6 | ) | ||||||
Advertising revenue is the largest component of the Company’s revenue, accounting for approximately 77.7% and 82.5% of total revenues in 2009 and 2008, respectively.
Retail advertising in fiscal 2009 decreased $176.0 million, or 22.4%, from fiscal 2008. The declines in retail advertising were across numerous segments, including the furniture and home furnishings segments and in department store advertising. Digital retail advertising in fiscal 2009 increased $24.1 million or 51.8% from fiscal 2008 driven by banner and display advertisements and the impact of the Yahoo alliance, while print ROP advertising in fiscal 2009 decreased $137.1 million or 32.5% from fiscal 2008. Preprint advertising in fiscal 2009 decreased $63.1 million or 19.8% from fiscal 2008.
National advertising in fiscal 2009 decreased $40.1 million or 27.4% from fiscal 2008. The declines in total national advertising were primarily in the telecommunications and national automotive segments. However, digital national advertising increased $6.3 million or, 38.2%, from fiscal 2008.
29
Table of Contents
Classified advertising in fiscal 2009 decreased $182.8 million, or 37.3%, from fiscal 2008. Print classified advertising in fiscal 2009 declined $156.5 million, or 42.1%. Digital classified advertising in fiscal 2009 decreased $26.3 million, or 22.2%, from fiscal 2008 largely due to a $29.8 million decline in employment advertising that was partially offset by other digital classified advertising growth. The following is a discussion of the major classified advertising categories:
| • | Automotive advertising in fiscal 2009 decreased $40.7 million or 31.0% from fiscal 2008, reflecting lower automotive sales and the consolidation of automotive dealers. Print automotive advertising in fiscal 2009 declined $40.1 million, or 40.6%, from fiscal 2008 while digital automotive advertising in fiscal 2009 declined $0.6 million, or 1.7%, from fiscal 2008. The better results in digital advertising, relative to other major categories, reflect the strength of the Company’s cars.com online products. |
| • | Real estate advertising in fiscal 2009 decreased $52.6 million or, 42.7%, from fiscal 2008. The Company continued to be adversely impacted by the real estate downturn. In total, print real estate advertising declined $52.2 million, or 49.2%, while digital real estate advertising declined $0.4 million, or 2.5%, from fiscal 2008. |
| • | Employment advertising in fiscal 2009 decreased $85.1 million, or 59.1%, from fiscal 2008 reflecting a national slowdown in hiring and therefore, employment advertising. The declines were reflected both in print employment advertising, down $55.3 million, or 65.3%, and digital employment advertising, down $29.8 million, or 50.2%, from fiscal 2008. |
| • | Other classified advertising, which primarily includes third-party liners, legal and obituary advertisements, decreased $4.4 million in fiscal 2009, or 4.8%, from fiscal 2008. Print other classified declined $8.9 million in fiscal 2009, or 10.8%, from fiscal 2008. Digital other classified grew $4.5 million, or 48.3%, reflecting growth in numerous categories of advertising. |
Digital advertising revenue, which is included in each of the advertising categories discussed above, totaled $185.5 million in fiscal 2009, an increase of 2.3% as compared to fiscal 2008. In particular, retail, national and other digital classified advertising have shown the strongest results in digital advertising sales. Excluding employment advertising, digital advertising grew 27.8% in fiscal 2009 as compared to fiscal 2008.
Direct marketing and other advertising in fiscal 2009 decreased $26.6 million, or 18.3%, from fiscal 2008. The decline reflected the overall slow advertising environment in 2009 and its impact on direct marketing programs.
In fiscal 2009, circulation revenues increased $12.7 million, or 4.8%, from fiscal 2008, primarily reflecting price increases partially offset by lower volumes. Average paid daily circulation declined 11.4% and Sunday was down 8.3% in fiscal 2009. The declines in fiscal 2009 reflected significant price increases, the Company’s focus on reducing circulation programs deemed to be of lesser value to its advertising customers and changes in readership trends.
30
Table of Contents
Operating Expenses:
Operating expenses in fiscal 2009 and fiscal 2008 include restructuring charges and operating expenses in fiscal 2009 include $10.6 million of accelerated depreciation on equipment related to the outsourcing of printing at various newspapers. Operating expenses in fiscal 2008 also include an impairment charge on mastheads. The following table summarizes operating expenses, as well as the amount of these items in operating expenses in fiscal 2009 and 2008 (in thousands):
| 2009 |
2008 |
% Change |
||||||||||
| Operating expenses |
$ | 1,273,072 | $ | 1,738,854 | (26.8 | ) | ||||||
| Restructuring charges and other items |
39,139 | 104,503 | (62.5 | ) | ||||||||
| Compensation expense |
$ | 582,241 | $ | 822,771 | (29.2 | ) | ||||||
| Compensation-related restructuring charges |
28,575 | 44,704 | (36.1 | ) | ||||||||
Operating expenses in fiscal 2009 decreased $465.8 million, or 26.8%, from fiscal 2008, as the Company continued to reduce costs to mitigate the impact of revenue declines. Operating expenses in fiscal 2009 included $28.5 million in severance and benefit plan curtailment gain related to the Company’s continued restructuring program and $10.6 million of accelerated depreciation on equipment related to the outsourcing of printing at various newspapers. Operating expenses in fiscal 2008 included $44.7 million in severance and benefit plan curtailment gain related to the Company’s restructuring plans and $59.8 million in non-cash impairment charges related primarily to mastheads.
Compensation expenses in fiscal 2009 decreased $240.5 million, or 29.2%, from fiscal 2008, and included the restructuring charges discussed above, which were greater in fiscal 2008 than in fiscal 2009. The decline in compensation primarily reflected salary cuts and reductions in staffing. On average staffing was down 25.8% in fiscal 2009 compared to fiscal 2008 and fringe benefits (primarily medical and retirement expenses) were down by 33.8%.
Newsprint and supplement expense in fiscal 2009 was down 33.8% from fiscal 2008 primarily reflecting declines in newsprint usage, and to a lesser extent, newsprint prices. Newsprint expense in fiscal 2009 was down 36.1% while supplement expense was down 21.3% from fiscal 2008. Depreciation and amortization expenses in fiscal 2009 were about even with the fiscal 2008 amount and includes the impact of the $10.6 million accelerated depreciation on equipment, which was partially offset by lower depreciation caused by lower capital expenditures in recent years and by other assets that became fully depreciated during the year. Other operating costs were down $80.0 million, or 17.4%, from fiscal 2008 reflecting Company-wide cost controls.
Interest:
Interest expense in fiscal 2009 declined $30.1 million, or 19.1%, from fiscal 2008. Interest related to the Company’s debt in fiscal 2009 declined $21.5 million and primarily reflected lower interest rates and debt balances. The remainder of the decline resulted from lower accrued interest on the liability for unrecognized tax benefits. The Company reversed accrued interest on certain state tax reserves which were settled in the fourth quarter and, therefore, were not payable.
Equity Income:
Income from unconsolidated investments was $2.1 million in fiscal 2009 compared to losses of $14.0 million in fiscal 2008. The income primarily reflects successful results at the Company’s internet related joint ventures; while the Company recorded losses from SP that were included in the fiscal 2008 prior to its disposition.
31
Table of Contents
Write down of Investments and Land:
In January 2010, the Company extended the contract to sell certain land in Miami to January 31, 2011, in exchange for the receipt of an additional $6.0 million nonrefundable deposit. Notwithstanding the extension of the contract, management evaluated the value of this land on its balance sheet given the challenging credit markets faced by the buyer and the decline in commercial real estate market in Miami. As a result of this evaluation, the Company wrote down the value of the land by $26.3 million in the fourth quarter of 2009. This transaction is discussed in greater detail in Note 3 to the Consolidated Financial Statements.
On June 30, 2008, the Company sold its 15.0% ownership interest in ShopLocal for $7.9 million and used the proceeds to reduce debt. The Company reduced its carrying value of ShopLocal to match the sales price.
Also in fiscal 2008, a less-than-50% owned company identified goodwill impairment at a reporting unit and, as a result, the Company recognized a charge related to this investment. The total non-cash pre-tax charges related to impairments of internet investments recorded in fiscal 2008 were $26.5 million. For an expanded discussion of transactions and events related to the Company’s less than 50%-owned companies see Note 3 to the Consolidated Financial Statements.
Gain on Extinguishment of Debt:
On June 26, 2009, the Company completed a private debt exchange offer for all of its outstanding debt securities for a combination of cash and its 2014 Senior Notes. In exchange for the $3.4 million in cash and $24.2 million of 2014 Senior Notes, the Company retired $102.8 million of unsecured publicly-traded bonds. A total of $23.9 million of 2014 Senior Notes were repurchased in connection with the February 2010 tender-offer using the proceeds from the senior secured notes discussed in “Recent Events and Trends, Debt Refinancing” section above. The Company recorded a gain of $44.1 million on the transaction in fiscal 2009.
In the second fiscal quarter of 2008, the Company repurchased $300.0 million aggregate principal amount of its outstanding debt securities for $282.4 million in cash obtained from its original credit facility. In the second half of 2008, the Company purchased $19.0 million aggregate principal of its outstanding debt securities maturing in 2009 in the open market for $17.7 million in cash obtained from its original credit facility. The Company recorded gains of $21.0 million on these transactions which included the write-off of approximately $3.0 million of net unamortized premiums related to these securities.
See Note 5 to the Consolidated Financial Statements for an expanded discussion of these transactions.
Income Taxes:
The income tax rate on income from continuing operations in fiscal 2009 was 32.6% and differs from the statutory rate as a result of state taxes, changes in certain estimates, and the settlement of certain open state tax issues favorable to the Company. The effective tax rate excluding the impact of discrete items such as extinguishment of debt, write-down of asset held for sale, and severance for fiscal 2009 was approximately 45.0% and is reflective of lower earnings in relation to permanently nondeductible expenses and higher effective state tax rates in certain states in which the Company operates.
Discontinued Operations:
The Company has potential indemnification obligations associated with disposed newspaper operations. In 2008 and 2009, the Company reserved amounts totaling $8.4 million and $10.7 million, respectively for indemnifications related to several divested papers.
32
Table of Contents
LIQUIDITY AND CAPITAL RESOURCES
Sources and Uses of Liquidity and Capital Resources:
The Company’s cash and cash equivalents were $17.5 million as of December 26, 2010. The Company’s available cash was largely used to repay amounts under on the Company’s Credit Agreement in fiscal 2008 through 2010.
Operating activities:
The Company generated $227.3 million, $131.6 million and $194.3 million of cash from operating activities of continuing operations in fiscal 2010, 2009 and 2008, respectively. The increase in cash from operating activities in fiscal 2010 from fiscal 2009 primarily relates to lower expenses as a result of cost restructuring over the past two years. The decrease in cash from operating activities in 2009 from 2008 primarily relates to lower advertising revenues and receipts due largely to the economic recession.
The Company made an $8.2 million contribution to its defined benefit pension plan in the third quarter of fiscal 2010. In January 2011 the Company contributed certain of its real property appraised at $49.6 million to its qualified defined benefit pension plan. McClatchy expects its required pension contribution under the Employee Retirement Income Security Act to be approximately $51.2 million in 2011, and the contribution of real property is expected to satisfy most of the Company’s required pension contribution for fiscal 2011. The remaining required contribution for fiscal 2011, if any, will be made in cash. See Notes 7 and 13 to the Consolidated Financial Statements for greater discussion of the Company’s contributions.
As of December 26, 2010, the projected benefit obligations of the Company’s qualified pension plan exceeded plan assets by $479.1 million compared to $500.0 million at the end of fiscal 2009. The excess of benefit obligations over pension assets is expected to give rise to an increase in required pension contributions over the next several years. The Pension Relief Act of 2010 (PRA) provides relief in the funding requirements of the qualified defined benefit pension plan, and the Company elected an option that allows the funding related to its 2009 plan year required contributions to be paid over 15 years (15-year-deferral relief option). Under the PRA, the Company may elect a 15-year-deferral relief option on one additional plan year in the future. Even with the relief provided, however, based on the current funding position of the pension plan, management expects future contributions to be substantially higher than the 2011 amounts; but also expects contributions in future years to be manageable using the Company’s cash from operations.
While amounts of future contributions are subject to numerous assumptions, including among others, changes in interest rates, returns on assets in the pension plan and future government regulations, the current unfunded balance including approximately $159.4 million in the next three years, is expected to be paid over future periods as estimated in the schedule of contractual obligations below. The timing of the payments in the schedule of contractual obligations reflects actuarial estimates the Company believes to be reasonable, but are subject to changes in estimates. Management believes cash from operations will be sufficient to satisfy our contribution requirements.
The Company used $2.1 million in cash from discontinued operations in 2010 for healthcare costs and, to a lesser degree, workers’ compensation costs for divested bankrupt newspapers. The Company used $8.4 million in cash from discontinued operations in 2009 primarily for income taxes paid in settlements of open tax issues related to newspapers which were disposed. In fiscal 2008 the Company generated $187.6 million in cash from discontinued operations, which was primarily from a $185.0 million income tax refund related to the sale of The Star Tribune Company.
33
Table of Contents
Investing activities:
The Company generated $17.5 million of cash from investing activities in fiscal 2010. The Company received $23.4 million in dividends from its interest in Classified Ventures and received a $6.0 million deposit on land in Miami which was previously under contract to be sold (see Note 3 to the Consolidated Financial Statements). The Company also received proceeds from the sales of unused property, plant and equipment (PP&E), and these inflows were partially offset by the purchase of PP&E. Capital expenditures have averaged $16.9 million annually over the last three years, and are expected to be about $20.0 million in 2011.
In 2009, the Company used $0.1 million of cash from investing activities resulting from the receipt of $13.5 million in proceeds from selling various assets, and receipts, net of closing adjustments, related to the sale of its interest in the SP Newsprint Company (sold in 2008). These sources were offset by purchases of PP&E totaling $13.6 million.
The Company generated $74.0 million of cash from investing activities of continuing operations in fiscal 2008. In 2008, the Company received $63.1 million in proceeds from the sales of the Company’s interests in SP and ShopLocal and $33.2 million in proceeds from the sale of other assets. These inflows were partially offset by the purchase of PP&E totaling $21.4 million.
Financing activities:
The Company used $231.3 million for financing activities in fiscal 2010. The Company received net proceeds of $864.7 million from the issuance of $875.0 million in senior secured notes (See discussion of debt refinancing under “Debt and Related Matters” below). The Company used proceeds from the refinancing and cash from operations and investments to repay $330.7 million in revolving bank debt and $546.8 million in term bank debt under its credit facility. In addition, the Company paid $187.3 million to retire $171.9 million in aggregate principal of notes that would have matured in 2011 and 2014. The Company paid $32.0 million in costs associated with the various refinancing transactions, most of which were recorded as deferred financing charges and the rest recorded as a loss on debt extinguishment.
The Company used $121.9 million to fund financing activities in fiscal 2009. During the second quarter of fiscal 2009, the Company repaid $31.0 million in bonds due on April 15, 2009. The Company also paid an aggregate of $7.1 million in cash ($3.4 million in payments to bondholders) and related expenses and issued $24.2 million of 15.75% senior notes due July 15, 2014, in total consideration to retire $102.8 million in publicly traded debt securities in its June 2009 private exchange offer. See Note 5 and the discussion under “Debt and Related Matters” below for more detail on this transaction.
In fiscal 2009, the Company repaid $3.2 million of its Term A loan under its original credit agreement, reduced its revolving bank debt by $61.0 million under its original credit agreement, and paid $5.7 million in fees to amend its original credit agreement. The Company also paid $14.9 million in dividends in fiscal 2009. The Company suspended its dividend after the payment of the first quarter dividend in 2009. The amount of future dividends is governed by reaching certain leverage levels of earnings before interest, taxes, depreciation and amortization (EBITDA) under its senior secured credit agreement.
The Company used $476.7 million of cash to fund financing transactions in fiscal 2008. A total of $300.9 million in cash, including offering expenses, was used to repurchase $319.0 million in face value of bonds (see discussion of “Debt and Related Matters” below) and $116.9 million was used to repay bank debt. The Company also paid $9.7 million in financing costs relating to amending its original credit agreement in the first and third fiscal quarters of 2008 and paid $51.8 million in dividends.
While the Company expects that most of its free cash flow generated from operations in the foreseeable future will be used to repay debt, management believes that operating cash flow and liquidity under its credit
34
Table of Contents
facilities as described below are adequate to meet the liquidity needs of the Company, including currently planned capital expenditures and other investments at least for the next 12 months.
Debt and Related Matters:
Purchase of Debt Securities:
In February 2011 the Company purchased $28.4 million aggregate principal amount of its outstanding debt securities for $28.4 million in cash generated by operations and partially obtained from its Credit Agreement. The Company purchased outstanding principal amount of debt securities as follows: $0.4 million of the 15.75% of its 2014 Senior Notes, $8.0 million of unsecured notes maturing in 2014, $10.0 million of unsecured notes maturing in 2017 and $10.0 million of its secured notes maturing in 2017. As of February 25, 2011, the Company had $26.1 million of revolving loans outstanding and had $77.2 million available under its revolving credit facilities, net of outstanding letters of credit.
Original Credit Agreement:
The Company was a party to a credit facility originally entered into on June 27, 2006, as amended that provided for $590.0 million five-year revolving credit facility and $546.8 million five-year Term A loan (“original credit agreement or facility”). Both the Term A loan and the revolving credit facility were originally due on June 27, 2011 prior to the amendments discussed below. The original credit facility had been amended several times and was most recently amended and restated in connection with a larger refinancing entered into in February 2010 as discussed below.
Debt Refinancing
February 11, 2010: The original credit agreement provided for a five-year revolving credit facility and term loans. On January 26, 2010, the Company entered into an amendment and restatement of the original credit agreement that became effective on February 11, 2010 (the “Amended and Restated Credit Agreement”), immediately prior to the closing of an offering of $875.0 million of senior secured notes. The Amended and Restated Credit Agreement required a substantial reduction in bank debt and allowed for the early retirement of other bond debt using the proceeds of the secured notes offering. The Company was in compliance with all covenants of the credit agreement at the time of the refinancing.
Upon closing of the refinancing transaction on February 11, 2010, the Amended and Restated Credit Agreement provided for a $262.0 million term loan and a $249.3 million revolving credit facility, including a $100.0 million letter of credit sub-facility, and extended the term of certain of the credit commitments to July 1, 2013. In connection with the Amended and Restated Credit Agreement, certain of the lenders did not extend the maturity of their commitments from the original maturity date of June 27, 2011. See discussion of the December 16, 2010, amendment below for additional details on the Amended and Restated Credit Agreement.
In connection with the Amended and Restated Credit Agreement, the Company issued new 11.5% senior secured notes due February 15, 2017, totaling $875.0 million (the “2017 Notes”). The notes are secured by a first-priority lien on certain of McClatchy’s and the subsidiary guarantors’ assets, and will rank equally with liens granted under McClatchy’s Credit Agreement. The assets securing the debt are unchanged from the original credit agreement and include intangible assets, inventory, receivables and certain other assets. See Note 5 to the Consolidated Financial Statements for an expanded discussion of the 2017 Notes. In addition, the Company completed tender offers for its 7.125% Notes due in 2011 and 15.75% senior notes due 2014 (2014 Senior Notes), paying $187.3 million in cash for $171.9 million of principal 2011 and 2014 notes.
35
Table of Contents
The 2017 Notes were issued in a private placement. In August 2010, the original 2017 Notes (and associated guarantees) were exchanged for new 2017 Notes (and associated guarantees) that have terms substantially identical to the original notes except that the 2017 Notes issued in the exchange are not subject to transfer restrictions.
December 16, 2010, Amendment: The Company paid down the principal amount of its term loans outstanding under the Amended and Restated Credit Agreement throughout 2010 using its cash from operations. On December 16, 2010 the Company entered into an amendment of the Amended and Restated Credit Agreement (the Credit Agreement) to, among other things, remove certain restrictions on the ability to repurchase its publicly-traded bonds, to repay the remaining $41.0 million of bank term loans and to reduce the lenders’ revolving loan commitments under the Amended and Restated Credit Agreement. The remaining term loans were repaid on December 20, 2010.
The Credit Agreement provides for a $150.8 million revolving credit facility, including a $100.0 million letter of credit sub-facility. Revolving commitments of $25.8 million will terminate on June 27, 2011, and the remaining revolving loan commitments of $125.0 million will terminate on July 1, 2013.
At December 26, 2010, the Company had outstanding letters of credit totaling $54.3 million securing estimated obligations stemming from workers’ compensation claims and other contingent claims. At December 26, 2010, net of these letters of credit, a total of $96.5 million was available under the Company’s revolving facility under the Credit Agreement; however, a portion of the revolving facility was used to repurchase notes in February 2011 as discussed above.
Debt under the Credit Agreement incurs interest at the London Interbank Offered Rate (LIBOR) plus a spread ranging from 425 basis points to 575 basis points or at a base rate plus a spread ranging from 325 basis points to 475 basis points. In each case, the applicable spread is based upon the Company’s consolidated total leverage ratio (as defined in the Credit Agreement). In the case of a LIBOR spread, the Credit Agreement sets a floor on LIBOR for the purposes of interest payments of no less than 300 basis points (except for working capital borrowings which are not subject to the 300 basis point floor and are limited to $45.0 million and a 30 day term). A commitment fee for the unused revolving credit is priced at 50 basis points to 75 basis points based upon the Company’s consolidated total leverage ratio (as defined in the Credit Agreement). The Company currently pays interest on borrowings under the Credit Agreement at a rate of 425 basis points over the 300 basis point LIBOR floor (or 7.25%) and pays 50.0 basis points for commitment fees. As of the December 26, 2010, no borrowings were outstanding under the Credit Agreement other than letters of credit.
The Credit Agreement contains quarterly financial covenants including requirements that the Company maintain a minimum consolidated interest coverage ratio (as defined in the Credit Agreement) of 1.50 to 1.00. The Company is required to maintain a maximum consolidated leverage ratio (as defined in the Credit Agreement) of 6.75 to 1.00 from the quarter ending in March 2010 through the quarter ending December 2010; decreasing to 6.50 to 1.00 from the quarter ending in March 2011 through the quarter ending in December 2011; decreasing to 6.25 to 1.00 from the quarter ending in March 2012 through the quarter ending in December 2012; and decreasing to 6.00 to 1.00 thereafter. Under the Credit Agreement the Company is required to maintain at least $50.0 million of available liquidity, defined as the sum of cash equivalents plus the amount available under the Company’s revolving facility as of the last day of each fiscal quarter. The Credit Agreement includes limitations on cash dividends allowed to be paid at certain leverage levels and other covenants, including limitations on additional debt.
At December 26, 2010, the Company’s consolidated interest coverage ratio (as defined in the Credit Agreement) was 2.38 to 1.00; its consolidated leverage ratio (as defined in the Credit Agreement) was 4.59 to 1.00; its available liquidity was $114.0 million; and the Company was in compliance with all financial covenants. Because of the significance of the Company’s outstanding debt, remaining in compliance with its financial
36
Table of Contents
covenants is critical to the Company’s operations. If revenue declines continue beyond those currently anticipated, the Company expects to continue to restructure operations and reduce debt to maintain compliance with its financial covenants.
Substantially all of the Company’s subsidiaries (as defined in the Credit Agreement) have guaranteed the Company’s obligations under the Credit Agreement and senior secured notes (together considered “senior secured debt”). The holders of the senior secured debt have entered into an intercreditor agreement that governs the sharing of security interest and other provisions of the senior secured debt. The Company has granted a security interest to the trustee of the intercreditor agreement in assets that include, but are not limited to, intangible assets, inventory, receivables and certain minority investments as collateral for the debt, but the security interest excludes any land, buildings, machinery and equipment (PP&E) and any leasehold interests and improvements with respect to such PP&E, which would be reflected on a consolidated balance sheet of the Company and its subsidiaries, and shares of stock and indebtedness of the subsidiaries of the Company.
2008 Notes Repurchases—In fiscal 2008, the Company purchased $319.0 million aggregate principal amount of its outstanding debt securities for $300.1 million in cash obtained from its original credit facility. The Company recognized $21.0 million in gain on the extinguishment of debt through December 28, 2008, on these transactions.
2009 Exchange Offer—On June 26, 2009, the Company completed a private debt exchange offer for all of its outstanding debt securities for a combination of cash and its 2014 Senior Notes. The 2014 Senior Notes are senior unsecured obligations and are guaranteed by McClatchy’s existing and future material domestic subsidiaries. The Company exchanged $3.4 million in cash and $24.2 million of 2014 Senior Notes in the exchange offer. In exchange for the cash and 2014 Senior Notes the Company retired the following outstanding principal amount of debt securities maturing in the respective years: $3.8 million in 2011 notes, $11.1 million in 2014 notes, $53.4 million in 2017 notes, $10.8 million in 2027 debentures and $23.8 million in 2029 debentures. The Company recorded a pre-tax gain of approximately $44.1 million on the exchange in 2009. The gain was equal to the carrying amount of the exchanged securities less the total future cash payments of the 2014 Senior Notes, including both payments of interest and principal amount, and related expenses of the exchange. A total of $23.9 million of 2014 Senior Notes were repurchased in connection with the February 2010 tender-offer using the proceeds from the 2017 Notes discussed in “Debt Refinancing” section above, leaving $0.4 million outstanding (which were purchased in February 2011. See Note 13 to the Consolidated Financial Statements for a description of this transaction).
Senior Secured Notes: The 11.50% Senior Secured Notes due February 15, 2017 (the “2017 Notes”) are governed by an indenture that includes a number of covenants that are applicable to the Company and its restricted subsidiaries. The covenants are subject to a number of important exceptions and qualifications set forth in the indenture for the 2017 Notes. These covenants include, among other things, restrictions on the ability of the Company and its restricted subsidiaries to incur additional debt, make investments and other restricted payments, pay dividends on capital stock, or redeem or repurchase capital stock or subordinated obligations; sell assets or enter into sale/leaseback transactions; create specified liens; create or permit restrictions on the ability of the Company’s restricted subsidiaries to pay dividends or make other distributions to it; engage in certain transactions with affiliates; and consolidate or merge with or into other companies or sell all or substantially all of the Company’s and its subsidiaries’ assets, taken as a whole.
Off-Balance-Sheet Arrangements:
As of December 26, 2010, the Company did not have any significant off-balance-sheet arrangements as defined in Item 303(a)(4)(ii) of Regulation S-K.
37
Table of Contents
Contractual Obligations:
The following table summarizes specific financial obligations under the Company’s contractual obligations and commercial commitments related to continuing operations as of December 26, 2010 (in thousands):
| Payments Due By Period |
||||||||||||||||||||
| Total |
Less than 1 Year |
1-3 Years |
3-5 Years |
More than 5 Years |
||||||||||||||||
| Included in the Company’s balance sheet: |
||||||||||||||||||||
| Long-term debt principal |
$ | 1,774,692 | $ | — | $ | 18,323 | $ | 169,313 | $ | 1,587,056 | ||||||||||
| Pension obligations (a) |
582,714 | 8,957 | 159,430 | 108,510 | 305,817 | |||||||||||||||
| Post-retirement obligations (a) |
30,585 | 4,439 | 7,638 | 5,655 | 12,853 | |||||||||||||||
| Workers’ compensation obligations |
20,391 | 5,183 | 6,127 | 3,474 | 5,607 | |||||||||||||||
| Other long-term obligations (b) |
26,380 | 8,142 | 8,398 | 7,336 | 2,504 | |||||||||||||||
| Other obligations: |
||||||||||||||||||||
| Purchase obligations (c) |
131,156 | 19,938 | 26,398 | 16,355 | 68,465 | |||||||||||||||
| Operating leases |
55,911 | 12,640 | 19,475 | 12,098 | 11,698 | |||||||||||||||
| Total (d) |
$ | 2,621,829 | $ | 59,299 | $ | 245,789 | $ | 322,741 | $ | 1,994,000 | ||||||||||
| (a) | Retirement obligations do not take into account the tax-deductibility of the payments. The timing of the payments of these obligations reflects actuarial estimates the Company believes to be reasonable. |
| (b) | Primarily deferred compensation, future lease obligations and indemnification obligations reserves related to disposed newspapers. Amounts exclude approximately $4.0 million in annual lease payments to the Company’s defined benefit pension plan for company-owned land contributed and leased back from the plan in January 2011. See Note 13 in Item. 8 “Financial Statements and Supplementary Data”. |
| (c) | Primarily printing outsource agreements and capital expenditures for property, plant and equipment. |
| (d) | The table excludes unrecognized tax benefits, and related penalty and interest, totaling $80.4 million because a reasonably reliable estimate of the timing of future payments, if any, cannot be determined. It also excludes pre-tax interest on debt that is expected to be approximately $155.6 million or less annually. |
| ITEM 7A. | QUANTITATIVE AND QUALITATIVE DISCLOSURES ABOUT MARKET RISK |
Currently all of the Company’s outstanding debt is at a fixed rate.
The discount rate used to measure the Company’s obligations under its qualified defined benefit pension plan is generally based upon long-term interest rates on highly-rated corporate bonds. Hence, changes in long-term interest rates may have a significant impact on the funding position of the Company’s qualified defined pension plan. Management estimates that a 1.0% increase in its discount rate could decrease its pension obligations by approximately $200.0 million. Based on current interest rates the amount of contributions due to the plan and the timing of the payments of these obligations are included in the table of contractual obligations above and reflect actuarial estimates the Company believes to be reasonable.
See the discussion at “Recent Events and Trends—Operating Expenses” for the impact of market changes on the Company’s newsprint and pension costs.
38
Table of Contents
| ITEM 8. | FINANCIAL STATEMENTS AND SUPPLEMENTARY DATA |
AND FINANCIAL STATEMENT SCHEDULES
| Page |
||||
| 40 | ||||
| 42 | ||||
| 43 | ||||
| 44 | ||||
| 45 | ||||
| 46 | ||||
All other schedules are omitted as not applicable under the rules of Regulation S-X.
39
Table of Contents
REPORT OF INDEPENDENT REGISTERED PUBLIC ACCOUNTING FIRM
To the Board of Directors and Stockholders of The McClatchy Company:
We have audited the accompanying consolidated balance sheets of The McClatchy Company and subsidiaries (the Company) as of December 26, 2010 and December 27, 2009 and the related consolidated statements of operations, stockholders’ equity, and cash flows for each of the three years in the period ended December 26, 2010. We also have audited the Company’s internal control over financial reporting as of December 26, 2010 based on criteria established in Internal Control—Integrated Framework issued by the Committee of Sponsoring Organizations of the Treadway Commission. The Company’s management is responsible for these financial statements, for maintaining effective internal control over financial reporting, and for its assessment of the effectiveness of internal control over financial reporting, included in the accompanying “Management Report on Internal Control Over Financial Reporting.” Our responsibility is to express an opinion on these financial statements and an opinion on the Company’s internal control over financial reporting based on our audits.
We conducted our audits in accordance with the standards of the Public Company Accounting Oversight Board (United States). Those standards require that we plan and perform the audit to obtain reasonable assurance about whether the financial statements are free of material misstatement and whether effective internal control over financial reporting was maintained in all material respects. Our audits of the financial statements included examining, on a test basis, evidence supporting the amounts and disclosures in the financial statements, assessing the accounting principles used and significant estimates made by management, and evaluating the overall financial statement presentation. Our audit of internal control over financial reporting included obtaining an understanding of internal control over financial reporting, assessing the risk that a material weakness exists, and testing and evaluating the design and operating effectiveness of internal control based on the assessed risk. Our audits also included performing such other procedures as we considered necessary in the circumstances. We believe that our audits provide a reasonable basis for our opinions.
A company’s internal control over financial reporting is a process designed by, or under the supervision of, the company’s principal executive and principal financial officers, or persons performing similar functions, and effected by the company’s board of directors, management, and other personnel to provide reasonable assurance regarding the reliability of financial reporting and the preparation of financial statements for external purposes in accordance with generally accepted accounting principles. A company’s internal control over financial reporting includes those policies and procedures that (1) pertain to the maintenance of records that, in reasonable detail, accurately and fairly reflect the transactions and dispositions of the assets of the company; (2) provide reasonable assurance that transactions are recorded as necessary to permit preparation of financial statements in accordance with generally accepted accounting principles, and that receipts and expenditures of the company are being made only in accordance with authorizations of management and directors of the company; and (3) provide reasonable assurance regarding prevention or timely detection of unauthorized acquisition, use, or disposition of the company’s assets that could have a material effect on the financial statements.
Because of the inherent limitations of internal control over financial reporting, including the possibility of collusion or improper management override of controls, material misstatements due to error or fraud may not be prevented or detected on a timely basis. Also, projections of any evaluation of the effectiveness of the internal control over financial reporting to future periods are subject to the risk that the controls may become inadequate because of changes in conditions, or that the degree of compliance with the policies or procedures may deteriorate.
In our opinion, the consolidated financial statements referred to above present fairly, in all material respects, the financial position of the Company as of December 26, 2010 and December 27, 2009 and the results of their operations and their cash flows for each of the three years in the period ended December 26, 2010, in conformity with accounting principles generally accepted in the United States of America. Also, in our opinion, the
40
Table of Contents
Company maintained, in all material respects, effective internal control over financial reporting as of December 26, 2010, based on the criteria established in Internal Control—Integrated Framework issued by the Committee of Sponsoring Organizations of the Treadway Commission.
/S/ DELOITTE & TOUCHE LLP
Sacramento, California
March 4, 2011
41
Table of Contents
CONSOLIDATED STATEMENT OF OPERATIONS
(In thousands, except for per share amounts)
| Year Ended |
||||||||||||
| December 26, 2010 |
December 27, 2009 |
December 28, 2008 |
||||||||||
| REVENUES—NET: |
||||||||||||
| Advertising |
$ | 1,049,964 | $ | 1,143,129 | $ | 1,568,766 | ||||||
| Circulation |
272,776 | 278,256 | 265,584 | |||||||||
| Other |
52,492 | 50,199 | 66,106 | |||||||||
| 1,375,232 | 1,471,584 | 1,900,456 | ||||||||||
| OPERATING EXPENSES: |
||||||||||||
| Compensation |
519,179 | 582,241 | 822,771 | |||||||||
| Newsprint and supplements |
136,642 | 167,164 | 252,599 | |||||||||
| Depreciation and amortization |
133,404 | 142,889 | 142,948 | |||||||||
| Other operating expenses |
347,124 | 380,778 | 460,973 | |||||||||
| Masthead impairment |
— | — | 59,563 | |||||||||
| 1,136,349 | 1,273,072 | 1,738,854 | ||||||||||
| OPERATING INCOME |
238,883 | 198,512 | 161,602 | |||||||||
| NON-OPERATING (EXPENSES) INCOME: |
||||||||||||
| Interest expense |
(177,641 | ) | (127,276 | ) | (157,385 | ) | ||||||
| Interest income |
550 | 47 | 1,429 | |||||||||
| Equity income (loss) in unconsolidated companies—net |
11,752 | 2,130 | (14,021 | ) | ||||||||
| Write-down of investments and land |
(24,297 | ) | (28,322 | ) | (26,462 | ) | ||||||
| Gain on sale of SP Newsprint Company |
— | 208 | 34,417 | |||||||||
| Gain (loss) on extinguishment of debt |
(10,661 | ) | 44,117 | 21,026 | ||||||||
| Gain (loss) on non-operating items and other—net |
265 | (5 | ) | 1,479 | ||||||||
| (200,032 | ) | (109,101 | ) | (139,517 | ) | |||||||
| INCOME FROM CONTINUING OPERATIONS BEFORE INCOME TAXES |
38,851 | 89,411 | 22,085 | |||||||||
| INCOME TAX PROVISION |
5,661 | 29,147 | 19,278 | |||||||||
| INCOME FROM CONTINUING OPERATIONS |
33,190 | 60,264 | 2,807 | |||||||||
| INCOME (LOSS) FROM DISCONTINUED OPERATIONS, NET OF INCOME TAXES |
3,083 | (6,174 | ) | (6,758 | ) | |||||||
| NET INCOME (LOSS) |
$ | 36,273 | $ | 54,090 | $ | (3,951 | ) | |||||
| NET INCOME (LOSS) PER COMMON SHARE: |
||||||||||||
| Basic: |
||||||||||||
| Income from continuing operations |
$ | 0.39 | $ | 0.72 | $ | 0.03 | ||||||
| Income (loss) from discontinued operations |
0.04 | (0.07 | ) | (0.08 | ) | |||||||
| Net income (loss) per share |
$ | 0.43 | $ | 0.65 | $ | (0.05 | ) | |||||
| Diluted: |
||||||||||||
| Income from continuing operations |
$ | 0.39 | $ | 0.72 | $ | 0.03 | ||||||
| Income (loss) from discontinued operations |
0.04 | (0.07 | ) | (0.08 | ) | |||||||
| Net income (loss) per share |
$ | 0.43 | $ | 0.65 | $ | (0.05 | ) | |||||
| WEIGHTED AVERAGE NUMBER OF COMMON SHARES: |
||||||||||||
| Basic |
84,760 | 83,785 | 82,333 | |||||||||
| Diluted |
85,539 | 83,810 | 82,409 | |||||||||
See notes to consolidated financial statements.
42
Table of Contents
(In thousands, except share amounts)
| December 26, 2010 |
December 27, 2009 |
|||||||
| ASSETS |
||||||||
| CURRENT ASSETS: |
||||||||
| Cash and cash equivalents |
$ | 17,508 | $ | 6,157 | ||||
| Trade receivables, net of allowances of $7,836 in 2010 and $10,298 in 2009 |
183,741 | 205,840 | ||||||
| Other receivables |
11,809 | 9,660 | ||||||
| Newsprint, ink and other inventories |
33,322 | 36,374 | ||||||
| Deferred income taxes |
22,762 | 23,648 | ||||||
| Income tax receivable |
9,444 | 10,019 | ||||||
| Land and other assets held for sale |
2,709 | 6,390 | ||||||
| Other current assets |
18,992 | 23,153 | ||||||
| 300,287 | 321,241 | |||||||
| PROPERTY, PLANT AND EQUIPMENT: |
||||||||
| Land |
196,497 | 195,918 | ||||||
| Building and improvements |
391,746 | 389,803 | ||||||
| Equipment |
797,919 | 800,034 | ||||||
| Construction in progress |
3,286 | 3,091 | ||||||
| 1,389,448 | 1,388,846 | |||||||
| Less accumulated depreciation |
(680,240 | ) | (621,266 | ) | ||||
| 709,208 | 767,580 | |||||||
| INTANGIBLE ASSETS: |
||||||||
| Identifiable intangibles—net |
653,225 | 711,758 | ||||||
| Goodwill |
1,014,257 | 1,006,020 | ||||||
| 1,667,482 | 1,717,778 | |||||||
| INVESTMENTS AND OTHER ASSETS |
||||||||
| Investments in unconsolidated companies |
306,881 | 322,109 | ||||||
| Other assets |
152,501 | 174,191 | ||||||
| 459,382 | 496,300 | |||||||
| TOTAL ASSETS |
$ | 3,136,359 | $ | 3,302,899 | ||||
| LIABILITIES AND STOCKHOLDERS’ EQUITY |
||||||||
| CURRENT LIABILITIES: |
||||||||
| Accounts payable |
$ | 47,771 | $ | 46,240 | ||||
| Accrued compensation |
74,833 | 86,969 | ||||||
| Income taxes payable |
2,942 | 11,453 | ||||||
| Unearned revenue |
75,125 | 78,908 | ||||||
| Accrued interest |
51,864 | 21,148 | ||||||
| Other accrued liabilities |
14,750 | 18,492 | ||||||
| 267,285 | 263,210 | |||||||
| NON-CURRENT LIABILITIES: |
||||||||
| Long-term debt |
1,703,339 | 1,896,436 | ||||||
| Deferred income taxes |
232,566 | 243,167 | ||||||
| Pension and postretirement obligations |
599,904 | 604,701 | ||||||
| Other long-term obligations |
113,920 | 125,196 | ||||||
| 2,649,729 | 2,869,500 | |||||||
| COMMITMENTS AND CONTINGENCIES |
||||||||
| STOCKHOLDERS’ EQUITY: |
||||||||
| Common stock $.01 par value: |
||||||||
| Class A—authorized 200,000,000 shares, issued 60,278,448 in 2010 and 59,705,101 in 2009 |
603 | 597 | ||||||
| Class B—authorized 60,000,000 shares, issued 24,800,962 in 2010 and 2009 |
248 | 248 | ||||||
| Additional paid-in capital |
2,212,915 | 2,207,122 | ||||||
| Retained earnings (accumulated deficit) |
(1,746,828 | ) | (1,783,101 | ) | ||||
| Treasury stock at cost, 116,045 shares in 2010 and 37,902 in 2009 |
(532 | ) | (153 | ) | ||||
| Accumulated other comprehensive (loss) |
(247,061 | ) | (254,524 | ) | ||||
| 219,345 | 170,189 | |||||||
| TOTAL LIABILITIES AND STOCKHOLDERS’ EQUITY |
$ | 3,136,359 | $ | 3,302,899 | ||||
See notes to consolidated financial statements.
43
Table of Contents
CONSOLIDATED STATEMENT OF CASH FLOWS
(In thousands)
| December 26, 2010 |
December 27, 2009 |
December 28, 2008 |
||||||||||
| CASH FLOWS FROM OPERATING ACTIVITIES: |
||||||||||||
| Net income (loss) |
$ | 36,273 | $ | 54,090 | $ | (3,951 | ) | |||||
| Less net income (loss) from discontinued operations |
3,083 | (6,174 | ) | (6,758 | ) | |||||||
| Net income (loss) from continuing operations |
33,190 | 60,264 | 2,807 | |||||||||
| Reconciliation to net cash provided by continuing operations: |
||||||||||||
| Depreciation and amortization |
133,404 | 142,889 | 142,948 | |||||||||
| Masthead impairment |
— | — | 59,563 | |||||||||
| Impairment related to investments and land |
24,297 | 28,322 | 26,462 | |||||||||
| Contribution to pension plan |
(8,235 | ) | — | — | ||||||||
| Employee benefit expense |
5,568 | 1,659 | 14,724 | |||||||||
| Stock compensation expense |
4,626 | 2,971 | 4,104 | |||||||||
| Deferred income taxes |
(25,963 | ) | 4,415 | (73,215 | ) | |||||||
| Gain on sale of SP Newsprint |
— | (208 | ) | (34,417 | ) | |||||||
| Loss (gain) on extinguishment of debt |
10,661 | (44,117 | ) | (21,026 | ) | |||||||
| Equity (income) loss in unconsolidated companies in excess of cash received |
(11,752 | ) | (995 | ) | 14,021 | |||||||
| Write-off of deferred financing cost |
2,148 | 364 | 3,738 | |||||||||
| Other |
2,642 | 12,545 | 9,829 | |||||||||
| Changes in certain assets and liabilities: |
||||||||||||
| Trade receivables |
22,099 | 37,860 | 45,850 | |||||||||
| Inventories |
3,052 | 12,927 | (13,071 | ) | ||||||||
| Other current assets |
5,201 | (6,110 | ) | 9,018 | ||||||||
| Accounts payable |
523 | (24,594 | ) | (25,767 | ) | |||||||
| Accrued compensation |
8,264 | 1,386 | (19,309 | ) | ||||||||
| Income taxes |
(6,568 | ) | (55,633 | ) | 75,129 | |||||||
| Other current liabilities |
24,144 | (42,348 | ) | (27,086 | ) | |||||||
| Net cash from operating activities of continuing operations |
227,301 | 131,597 | 194,302 | |||||||||
| Net cash from operating activities of discontinued operations |
(2,106 | ) | (8,431 | ) | 187,567 | |||||||
| Net cash from operating activities |
225,195 | 123,166 | 381,869 | |||||||||
| CASH FLOWS FROM INVESTING ACTIVITIES: |
||||||||||||
| Proceeds from sale of equipment and other |
2,952 | 9,284 | 33,172 | |||||||||
| Proceeds from sale of investments |
— | 4,208 | 63,141 | |||||||||
| Deposit for land |
6,000 | — | — | |||||||||
| Purchases of property, plant and equipment |
(15,628 | ) | (13,574 | ) | (21,418 | ) | ||||||
| Dividend from equity investment |
24,274 | — | — | |||||||||
| Equity investments and other |
(120 | ) | (23 | ) | (855 | ) | ||||||
| Net cash from investing activities |
17,478 | (105 | ) | 74,040 | ||||||||
| CASH FLOWS FROM FINANCING ACTIVITIES: |
||||||||||||
| Proceeds from issuance of notes |
864,710 | — | — | |||||||||
| Repayments of term bank debt |
(546,800 | ) | (3,200 | ) | — | |||||||
| Net repayments of revolving bank debt |
(330,700 | ) | (61,000 | ) | (116,900 | ) | ||||||
| Purchases of notes |
(31,929 | ) | — | — | ||||||||
| Extinguishment of public notes and related expenses |
(155,410 | ) | (38,082 | ) | (300,871 | ) | ||||||
| Payment of cash dividends |
— | (14,905 | ) | (51,828 | ) | |||||||
| Payment of financing costs |
(31,986 | ) | (5,665 | ) | (9,741 | ) | ||||||
| Other—principally stock issuances |
793 | 950 | 2,613 | |||||||||
| Net cash from financing activities |
(231,322 | ) | (121,902 | ) | (476,727 | ) | ||||||
| NET CHANGE IN CASH AND CASH EQUIVALENTS |
11,351 | 1,159 | (20,818 | ) | ||||||||
| CASH AND CASH EQUIVALENTS, BEGINNING OF YEAR |
6,157 | 4,998 | 25,816 | |||||||||
| CASH AND CASH EQUIVALENTS, END OF YEAR |
$ | 17,508 | $ | 6,157 | $ | 4,998 | ||||||
See notes to consolidated financial statements.
44
Table of Contents
CONSOLIDATED STATEMENT OF STOCKHOLDERS’ EQUITY
(In thousands, except share and per share amounts)
| Par Value Class A |
Par Value Class B |
Additional Paid-In Capital |
Retained Earnings (Accumulated Deficit) |
Accumulated Other Comprehensive Income (Loss) |
Treasury Stock |
Total |
||||||||||||||||||||||
| BALANCES, DECEMBER 30, 2007 |
$ | 571 | $ | 251 | $ | 2,197,041 | $ | (1,781,298 | ) | $ | 9,097 | $ | (122 | ) | $ | 425,540 | ||||||||||||
| Net loss |
(3,951 | ) | (3,951 | ) | ||||||||||||||||||||||||
| Other comprehensive income (loss), net of tax: |
||||||||||||||||||||||||||||
| Pension and postretirement plans: |
||||||||||||||||||||||||||||
| Unamortized loss |
(323,996 | ) | (323,996 | ) | ||||||||||||||||||||||||
| Prior service credit |
(2,266 | ) | (2,266 | ) | ||||||||||||||||||||||||
| Other comprehensive loss related to equity investments |
(5,147 | ) | (5,147 | ) | ||||||||||||||||||||||||
| Other comprehensive loss |
(331,409 | ) | ||||||||||||||||||||||||||
| Total comprehensive loss |
(335,360 | ) | ||||||||||||||||||||||||||
| Dividends declared ($.54 per share) |
(44,468 | ) | (44,468 | ) | ||||||||||||||||||||||||
| Issuance of 412,135 Class A shares under stock plans |
4 | 2,771 | 2,775 | |||||||||||||||||||||||||
| Stock compensation expense |
4,104 | 4,104 | ||||||||||||||||||||||||||
| Purchase of 2,235 shares of treasury stock |
(22 | ) | (22 | ) | ||||||||||||||||||||||||
| Tax impact from stock plans |
(140 | ) | (140 | ) | ||||||||||||||||||||||||
| BALANCES, DECEMBER 28, 2008 |
575 | 251 | 2,203,776 | (1,829,717 | ) | (322,312 | ) | (144 | ) | 52,429 | ||||||||||||||||||
| Net income |
54,090 | 54,090 | ||||||||||||||||||||||||||
| Other comprehensive income (loss), net of tax: |
||||||||||||||||||||||||||||
| Pension and postretirement plans: |
||||||||||||||||||||||||||||
| Unamortized gain |
67,539 | 67,539 | ||||||||||||||||||||||||||
| Prior service cost |
368 | 368 | ||||||||||||||||||||||||||
| Other comprehensive loss related to equity investments |
(119 | ) | (119 | ) | ||||||||||||||||||||||||
| Other comprehensive income |
67,788 | |||||||||||||||||||||||||||
| Total comprehensive income |
121,878 | |||||||||||||||||||||||||||
| Dividends declared ($.09 per share) |
(7,474 | ) | (7,474 | ) | ||||||||||||||||||||||||
| Conversion of 250,000 Class B shares to Class A shares |
3 | (3 | ) | |||||||||||||||||||||||||
| Issuance of 1,934,656 Class A shares under stock plans |
19 | 940 | 959 | |||||||||||||||||||||||||
| Stock compensation expense |
2,971 | 2,971 | ||||||||||||||||||||||||||
| Purchase of 32,638 shares of treasury stock |
(9 | ) | (9 | ) | ||||||||||||||||||||||||
| Tax impact from stock plans |
(565 | ) | (565 | ) | ||||||||||||||||||||||||
| BALANCES, DECEMBER 27, 2009 |
597 | 248 | 2,207,122 | (1,783,101 | ) | (254,524 | ) | (153 | ) | 170,189 | ||||||||||||||||||
| Net income |
36,273 | 36,273 | ||||||||||||||||||||||||||
| Other comprehensive income (loss), net of tax: |
||||||||||||||||||||||||||||
| Pension and postretirement plans: |
||||||||||||||||||||||||||||
| Unamortized gain |
8,050 | 8,050 | ||||||||||||||||||||||||||
| Prior service credit |
(640 | ) | (640 | ) | ||||||||||||||||||||||||
| Other comprehensive loss related to equity investments |
53 | 53 | ||||||||||||||||||||||||||
| Other comprehensive income |
7,463 | |||||||||||||||||||||||||||
| Total comprehensive income |
43,736 | |||||||||||||||||||||||||||
| Issuance of 573,347 Class A shares under stock plans |
6 | 1,161 | 1,167 | |||||||||||||||||||||||||
| Stock compensation expense |
4,626 | 4,626 | ||||||||||||||||||||||||||
| Purchase of 78,143 shares of treasury stock |
(379 | ) | (379 | ) | ||||||||||||||||||||||||
| Tax impact from stock plans |
6 | 6 | ||||||||||||||||||||||||||
| BALANCES, DECEMBER 26, 2010 |
$ | 603 | $ | 248 | $ | 2,212,915 | $ | (1,746,828 | ) | $ | (247,061 | ) | $ | (532 | ) | $ | 219,345 | |||||||||||
See notes to consolidated financial statements.
45
Table of Contents
NOTES TO CONSOLIDATED FINANCIAL STATEMENTS
| NOTE 1. | SIGNIFICANT ACCOUNTING POLICIES |
The McClatchy Company (the Company or McClatchy) is the third largest newspaper publisher in the United States based on daily circulation, with 30 daily newspapers and approximately 43 non-dailies in 29 markets across the country. McClatchy also operates leading local websites and direct marketing operations in each of its markets which complement its newspapers and extend its audience reach in each market. The Company’s newspapers include, among others, The Miami Herald, The Sacramento Bee, the Fort Worth Star-Telegram, The Kansas City Star, The Charlotte Observer and The (Raleigh) News & Observer.
McClatchy also owns a portfolio of premium digital assets, including 14.4% of CareerBuilder LLC, which operates the nation’s largest online job site CareerBuilder.com, 25.6% of Classified Ventures LLC, a company that offers classified websites such as: the auto website Cars.com and the rental site Apartments.com, and 33.3% of HomeFinder LLC, which operates the online real estate website HomeFinder.com. McClatchy is listed on the New York Stock Exchange under the symbol MNI.
The consolidated financial statements include the Company and its subsidiaries. Intercompany items and transactions are eliminated. In preparing the financial statements, management makes estimates and assumptions that affect the reported amounts of assets and liabilities and disclosure of contingent assets and liabilities at the date of the financial statements and the reported amounts of revenues and expenses during the reporting period. Actual results could differ from those estimates.
Discontinued operations—The Company divested 13 newspapers from 2006 through 2007. The sales contracts for several of the disposed newspapers include indemnification obligations. Expenses and credits related to disposed newspaper operations have been recorded as discontinued operations.
Revenue recognition—The Company recognizes revenues from advertising placed in a newspaper and/or on a website over the advertising contract period or as services are delivered, as appropriate, and recognizes circulation revenues as newspapers are delivered over the applicable subscription term. Circulation revenues are recorded net of direct delivery costs. Other revenue is recognized when the related product or service has been delivered. Revenues are recorded net of estimated incentives, including special pricing agreements, promotions and other volume-based incentives and net of sales tax collected from the customer. Revisions to these estimates are charged to revenues in the period in which the facts that give rise to the revision become known.
Cash equivalents are highly liquid debt investments with original maturities of three months or less.
Concentrations of credit risks—Financial instruments, which potentially subject the Company to concentrations of credit risks, are principally cash and cash equivalents and trade accounts receivables. Cash and cash equivalents are placed with major financial institutions. As of December 26, 2010, the Company had $13.3 million of cash balances at financial institutions in excess of federal insurance limits. The Company routinely assesses the financial strength of significant customers and this assessment, combined with the large number and geographic diversity of its customers, limits the Company’s concentration of risk with respect to trade accounts receivable.
Allowance for Doubtful Accounts—The Company maintains an allowance account for estimated losses resulting from the risk its customers will not make required payments. Generally, the Company uses the aging of accounts receivable, reserving for all accounts due 90 days or longer, to establish allowances for losses on accounts receivable. However, if the Company becomes aware that the financial condition of specific customers has deteriorated, additional allowances are provided.
46
Table of Contents
The Company provides an allowance for doubtful accounts as follows (in thousands):
| Year Ended |
||||||||||||
| December 26, 2010 |
December 27, 2009 |
December 28, 2008 |
||||||||||
| Balance at beginning of year |
$ | 10,298 | $ | 15,255 | $ | 11,416 | ||||||
| Charged to costs and expenses |
7,479 | 16,459 | 21,355 | |||||||||
| Amounts written off |
(9,941 | ) | (21,416 | ) | (17,516 | ) | ||||||
| Balance at end of year |
$ | 7,836 | $ | 10,298 | $ | 15,255 | ||||||
Inventories are stated at the lower of cost (based principally on the first-in, first-out method) or current market value.
Property, plant and equipment are stated at cost. Major improvements, as well as interest incurred during construction, are capitalized. Capitalized interest was not material in fiscal 2010, 2009 or 2008. Expenditures for maintenance and repairs are charged to expense as incurred.
Depreciation is computed generally on a straight-line basis over estimated useful lives of:
5 to 60 years for buildings and improvements
9 to 25 years for presses
2 to 15 years for other equipment
Equity Investments in Unconsolidated Companies—The Company uses the equity method of accounting for its investments in and earnings or losses of companies that it does not control but over which it does exert significant influence. The Company considers whether the fair values of any of its equity method investments have declined below their carrying value whenever adverse events or changes in circumstances indicate that recorded values may not be recoverable. If the Company considered any decline to be other than temporary (based on various factors, including historical financial results and the overall health of the investee), then a write-down would be recorded to estimated fair value. See Note 3 for discussion of investments in unconsolidated companies.
Segment reporting—The Company’s primary business is the publication of newspapers and related digital and direct marketing products. The Company has two operating segments which it aggregates into a single reportable segment because each has similar economic characteristics, products, customers and distribution methods. Each segment consists primarily of a group of newspapers reporting to a segment manager.
Goodwill and intangible impairment—The Company tests for impairment of goodwill annually (at year-end) or whenever events occur or circumstances change that would more likely than not reduce the fair value of a reporting unit below its carrying amount. The required two-step approach uses accounting judgments and estimates of future operating results. Changes in estimates or the application of alternative assumptions could produce significantly different results. Impairment testing is done at a reporting unit level. The Company performs this testing on operating segments, which are also considered reporting units. An impairment loss generally is recognized when the carrying amount of the reporting unit’s net assets exceeds the estimated fair value of the reporting unit. The estimates and judgments that most significantly affect the fair value calculation are assumptions related to revenue growth, newsprint prices, compensation levels, discount rate and private and public market trading multiples for newspaper assets. The Company’s considers current market capitalization (based upon the recent stock market prices) plus an estimated control premium in determining the reasonableness of the fair value of the reporting units. The Company performed its annual testing at the end of its fiscal year in 2010, 2009 and 2008. No impairment loss was recognized on goodwill in any of these years.
47
Table of Contents
Newspaper mastheads (newspaper titles and website domain names) are not subject to amortization and are tested for impairment annually (at year-end), or more frequently if events or changes in circumstances indicate that the asset might be impaired. The impairment test consists of a comparison of the fair value of each newspaper masthead with its carrying amount. The Company performed impairment tests on newspaper mastheads as of at the end of its fiscal year in 2010, 2009 and 2008. In 2008, the Company recorded an impairment charge related to newspaper mastheads of $59.6 million.
Long-lived assets such as intangible assets are amortized (primarily advertiser and subscriber lists) and are tested for recoverability whenever events or changes in circumstances indicate that their carrying amounts may not be recoverable. The carrying amount of each asset group is not recoverable if it exceeds the sum of the undiscounted cash flows expected to result from the use of such asset group. No impairment loss was recognized on intangible assets subject to amortization in fiscal years 2010, 2009 and 2008.
Stock-based compensation—Beginning in fiscal 2006, all share-based payments to employees, including grants of employee stock options, stock appreciation rights, restricted stock units and restricted stock under equity incentive plans and purchases under the employee stock purchase plan, are recognized in the financial statements based on their fair values. At December 26, 2010, the Company had six stock-based compensation plans. Total stock-based compensation expense was $4.6 million, $3.0 million and $4.1 million in fiscal 2010, 2009 and 2008, respectively.
Income Taxes—The Company accounts for income taxes using the liability method. Under this method, deferred tax assets and liabilities are determined based on differences between the financial reporting and tax bases of assets and liabilities and are measured using the enacted tax rates and laws that are expected to be in effect when the differences are expected to reverse.
Current accounting standards in the United States prescribe a recognition threshold and measurement of a tax position taken or expected to be taken in an enterprise’s tax returns. The Company recognizes accrued interest related to unrecognized tax benefits in interest expense. Accrued penalties are recognized as a component of income tax expense.
Fair Value of Financial Instruments—Generally accepted accounting principles require the disclosure of the fair value of certain financial instruments, whether or not recognized in the balance sheet, for which it is practicable to estimate fair value. The Company estimated the fair values presented below using appropriate valuation methodologies and market information available as of year-end. Considerable judgment is required to develop estimates of fair value, and the estimates presented are not necessarily indicative of the amounts that the Company could realize in a current market exchange. The use of different market assumptions or estimation methodologies could have a material effect on the estimated fair values. Additionally, the fair values were estimated at year-end, and current estimates of fair value may differ significantly from the amounts presented.
The following methods and assumptions were used to estimate the fair value of each class of financial instruments:
Cash and equivalents, accounts receivable and accounts payable. The carrying amount of these items approximates fair value.
Long-term debt. The fair value of long-term debt is determined based on a number of observable inputs including the current market activity of the Company’s publicly-traded notes, trends in investor demand and market values of comparable publicly traded debt. At December 26, 2010, the estimated fair value and the carrying value of long-term debt was $1.7 billion.
48
Table of Contents
Comprehensive income (loss)—The Company records changes in its net assets from non-owner sources in its Consolidated Statement of Stockholders’ Equity. Such changes relate primarily to valuing its pension liabilities, net of tax effects. The following table summarizes the changes in other comprehensive income (loss) (in thousands):
| Changes to Comprehensive income (loss) |
||||||||||||
| (in thousands) | Pre-Tax |
Tax |
After-Tax |
|||||||||
| Year Ended December 26, 2010: |
||||||||||||
| Pension and post retirement plans: |
||||||||||||
| Unamortized gain |
$ | 13,416 | $ | (5,366 | ) | $ | 8,050 | |||||
| Prior service credit |
(1,066 | ) | 426 | (640 | ) | |||||||
| Other comprehensive income related to equity investments |
88 | (35 | ) | 53 | ||||||||
| $ | 12,438 | $ | (4,975 | ) | $ | 7,463 | ||||||
| Year Ended December 27, 2009: |
||||||||||||
| Pension and post retirement plans: |
||||||||||||
| Unamortized gain |
$ | 112,565 | $ | (45,026 | ) | $ | 67,539 | |||||
| Prior service cost |
613 | (245 | ) | 368 | ||||||||
| Other comprehensive loss related to equity investments |
(199 | ) | 80 | (119 | ) | |||||||
| $ | 112,979 | $ | (45,191 | ) | $ | 67,788 | ||||||
| Year Ended December 28, 2008: |
||||||||||||
| Pension and post retirement plans: |
||||||||||||
| Unamortized loss |
$ | (539,993 | ) | $ | 215,997 | $ | (323,996 | ) | ||||
| Prior service credit |
(3,778 | ) | 1,512 | (2,266 | ) | |||||||
| Other comprehensive loss related to equity investments |
(8,578 | ) | 3,431 | (5,147 | ) | |||||||
| $ | (552,349 | ) | $ | 220,940 | $ | (331,409 | ) | |||||
Earnings per share (EPS)—Basic EPS excludes dilution from common stock equivalents and reflects income divided by the weighted average number of common shares outstanding for the period. Diluted EPS is based upon the weighted average number of outstanding shares of common stock and dilutive common stock equivalents in the period. Common stock equivalents arise from dilutive stock options, restricted stock units and restricted stock and are computed using the treasury stock method. The weighted average anti-dilutive stock options that could potentially dilute basic EPS in the future, but were not included in the weighted average share calculation were 4.3 million in fiscal 2010, 6.3 million in fiscal 2009 and 5.0 million in fiscal 2008.
New Accounting Pronouncements—In June 2009, a new pronouncement was issued amending the interpretation of accounting literature related to consolidations. The new guidance applies to rules in determining whether an enterprise has a controlling financial interest in a variable interest entity. This determination identifies the primary beneficiary of a variable interest entity as the enterprise that has both the power to direct the activities of a variable interest entity that most significantly impacts the entity’s economic performance and the obligation to absorb losses or the right to receive benefits of the entity that could potentially be significant to the variable interest entity. The new pronouncement also requires ongoing reassessments of whether an enterprise is the primary beneficiary and eliminates the quantitative approach previously required for determining the primary beneficiary. The new pronouncement was effective for the Company on December 28, 2009. The adoption of this pronouncement did not have a material effect on the consolidated financial statements.
In January 2010, the FASB issued authoritative guidance that will require entities to make new disclosures about recurring or nonrecurring fair-value measurements of assets and liabilities, including (i) the amounts of significant transfers between Level 1 and Level 2 fair-value measurements and the reasons for the transfers, (ii) the reasons for any transfers in or out of Level 3, and (iii) information on purchases, sales, issuances and
49
Table of Contents
settlements on a gross basis in the reconciliation of recurring Level 3 fair value measurements. The FASB also clarified existing fair-value measurement disclosure guidance about the level of disaggregation of assets and liabilities, and information about the valuation techniques and inputs used in estimating Level 2 and Level 3 fair-value measurements. Except for certain detailed Level 3 disclosures, which are effective for fiscal years beginning after December 15, 2010 and interim periods within those years, we have adopted these amended standards. The adoption of this disclosure-only guidance did not have an impact on the Company’s consolidated financial results.
| NOTE 2. | DISCONTINUED OPERATIONS |
In 2006 the Company announced the sale of The Star Tribune Company, owner of the Star Tribune newspaper and recorded a loss on the sale of the newspaper as discontinued operations in fiscal 2006. The Company received a cash income tax benefit of $185.0 million in 2008 related to the sale of the (Minneapolis) Star Tribune newspaper and other publications and websites related to the newspaper (See the Consolidated Statement of Cash Flows).
In 2009 and 2008 the Company reserved amounts for indemnification obligations related to several divested papers. In 2010, the Company reversed a reserve (and recorded income) of $6.5 million related to certain of the indemnification obligations as the related newspapers paid current amounts and showed the ability to continue to meet their obligations to the Company.
The income or loss from discontinued operations, net of income taxes, for fiscal 2010, 2009 and 2008 were as follows (in thousands):
| 2010 |
2009 |
2008 |
||||||||||
| Income (loss) from discontinued operations before income taxes |
$ | 4,897 | $ | (9,810 | ) | $ | (8,070 | ) | ||||
| Income tax benefit (expense) |
(1,814 | ) | 3,636 | 1,312 | ||||||||
| Income (loss) from discontinued operations |
$ | 3,083 | $ | (6,174 | ) | $ | (6,758 | ) | ||||
| NOTE 3. | INVESTMENTS IN UNCONSOLIDATED COMPANIES AND MIAMI LAND |
The following is the Company’s ownership interest and investment in unconsolidated companies and joint ventures as of December 26, 2010, and December 27, 2009, (dollars in thousands):
| Company |
% Ownership Interest |
December 26, 2010 |
December 27, 2009 |
|||||||||
| CareerBuilder, LLC |
14.4 | $ | 220,777 | $ | 218,736 | |||||||
| Classified Ventures, LLC |
25.6 | 66,976 | 81,538 | |||||||||
| HomeFinder, LLC |
33.3 | 3,061 | 5,048 | |||||||||
| Seattle Times Company (C-Corporation) |
49.5 | — | — | |||||||||
| Ponderay (general partnership) |
27.0 | 13,320 | 13,754 | |||||||||
| Other |
Various | 2,747 | 3,033 | |||||||||
| $ | 306,881 | $ | 322,109 | |||||||||
The Company uses the equity method of accounting for a majority of investments.
HomeFinder, LLC, formerly a division of Classified Ventures, LLC (CV), operates the real estate website HomeFinder.com. It was spun off in the first quarter of 2009 into a separate limited liability corporation in which the Company has a one-third ownership interest. The initial carrying value of the Company’s investment in HomeFinder primarily represented its proportionate ownership of HomeFinder which was previously reflected in the Company’s value of CV.
50
Table of Contents
In fiscal 2010 CV paid the Company a dividend totaling $24.3 million that was recorded as a return of capital and reduced the carrying value of the Company’s investment in CV.
Also in 2010, a less-than-50% owned company identified goodwill impairment at a reporting unit and as a result, the Company recognized $3.0 million as its portion of the charge related to this write-down in fiscal 2010. In fiscal 2008, a less-than-50% owned company identified goodwill impairment at a reporting unit and as a result, the Company recognized its portion of the charge related to this write-down. The total non-cash pre-tax charges related to impairments of internet investments recorded in fiscal 2008 were $26.5 million.
On March 31, 2008, McClatchy and its partners, affiliates of Cox Enterprises, Inc. and Media General, Inc., completed the sale of SP Newsprint Company (SP), of which McClatchy was a one-third owner. The Company recorded a gain on the transaction of approximately $34.4 million. The Company used the $55.0 million of sales proceeds it received in the second fiscal quarter of 2008 and an additional $5.0 million it received in 2009 to reduce debt.
The Company has an annual purchase commitment for 109,730 metric tons of newsprint from SP. The Company is required to purchase 56,800 metric tons of newsprint of annual production from Ponderay on a “take-if-tendered” basis at prevailing market prices.
At the end of 2008, the Seattle Times Company (STC) recorded a comprehensive loss related to its retirement plan liabilities. The Company recorded its share of the comprehensive loss in the Company’s comprehensive income (loss) in stockholders’ equity to the extent that it had a carrying value in its investment in STC. As a result, the Company’s investment in STC at December 27, 2008, was zero, and no future income or losses from STC will be recorded until the Company’s carrying value on its balance sheet is restored through future earnings by STC.
The Company also incurred expense related to the purchase of products and services provided by these companies, for the uploading and hosting of online advertising on behalf of the Company’s newspapers’ advertisers.
The following table summarizes expenses incurred for products provided by its less-than 50% owned companies and is recorded in operating expenses in fiscal 2010, 2009 and 2008 (in thousands):
| Career- Builder |
Classified Ventures |
Ponderay |
Other |
|||||||||||||
| 2010 |
$ | 1,272 | $ | 11,073 | $ | 23,048 | NA | |||||||||
| 2009 |
1,241 | 10,250 | 27,413 | NA | ||||||||||||
| 2008 |
2,670 | 11,561 | 15,703 | $ | 353 | |||||||||||
As of December 26, 2010, and December 27, 2009, the Company had approximately $3.6 million and $3.9 million, respectively, included in amounts payable to CareerBuilder, CV and Ponderay.
51
Table of Contents
The table below presents the summarized financial information for the Company’s investments in unconsolidated companies on a combined basis (dollars in thousands):
| 2010 |
2009 |
|||||||||||
| Current assets |
$ | 473,765 | $ | 393,914 | ||||||||
| Noncurrent assets |
603,216 | 664,876 | ||||||||||
| Current liabilities |
298,229 | 269,501 | ||||||||||
| Noncurrent liabilities |
280,184 | 269,546 | ||||||||||
| Equity |
498,568 | 519,743 | ||||||||||
| 2010 |
2009 |
2008 |
||||||||||
| Net revenues |
$ | 1,195,755 | $ | 1,142,551 | $ | 1,334,372 | ||||||
| Operating income (loss) |
102,863 | 67,442 | (52,579 | ) | ||||||||
| Net income (loss) |
95,855 | 66,524 | (50,722 | ) | ||||||||
On January 31, 2011, the contract to sell certain land in Miami terminated because the buyer did not consummate the transaction by the closing deadline in the contract. Under the terms of an agreement with the developer, McClatchy is now entitled to receive a $7.0 million termination fee. McClatchy previously received approximately $16.5 million in nonrefundable deposits, which it used to repay debt.
The Company obtained an independent appraisal to determine the fair value of the land at December 26, 2010. The valuation process incorporated the income capitalization valuation technique and the market data or direct sales comparison approach. Based on the appraisal, the carrying value was written down by $21.4 million to $116.0 million in 2010 (net of the $16.5 million of nonrefundable deposits received) and is included in other assets on the Company’s Balance Sheet.
The Company wrote down the value of the land by $26.3 million in the fourth quarter of 2009 after extending the deadline on the contract to January 31, 2011, and receipt of an additional $6.0 million nonrefundable deposit from the buyer. The fair value analysis performed in 2009 incorporated an independent appraisal and consideration of the existing contract to sell the land.
Fair value measurement requires three classifications of investments based on the nature of available fair value inputs and the valuation methodologies used to measure these investments at fair value. Under the fair value guidance, the Company classified the land as a Level 3 classification. Level 3 classifications are based on input to the valuation methodology that are unobservable inputs in situations where there is little or no market activity for the asset or liability and the reporting entity makes estimates and assumptions related to the pricing of the asset or liability.
52
Table of Contents
| NOTE 4. | INTANGIBLE ASSETS AND GOODWILL |
Intangible assets and goodwill consisted of the following (in thousands):
| December 26, 2010 |
||||||||||||
| Gross Amount |
Accumulated Amortization |
Net Amount |
||||||||||
| Intangible assets subject to amortization: |
||||||||||||
| Advertiser and subscriber lists |
$ | 803,840 | $ | (364,010 | ) | $ | 439,830 | |||||
| Other |
37,071 | (30,063 | ) | 7,008 | ||||||||
| Total |
$ | 840,911 | $ | (394,073 | ) | 446,838 | ||||||
| Other intangible assets not subject to amortization: |
||||||||||||
| Newspaper mastheads |
206,387 | |||||||||||
| Total |
653,225 | |||||||||||
| Goodwill |
1,014,257 | |||||||||||
| Total intangible assets and goodwill |
$ | 1,667,482 | ||||||||||
| December 27, 2009 |
||||||||||||
| Gross Amount |
Accumulated Amortization |
Net Amount |
||||||||||
| Intangible assets subject to amortization: |
||||||||||||
| Advertiser and subscriber lists |
$ | 803,840 | $ | (307,177 | ) | $ | 496,663 | |||||
| Other |
37,066 | (28,358 | ) | 8,708 | ||||||||
| Total |
$ | 840,906 | $ | (335,535 | ) | 505,371 | ||||||
| Other intangible assets not subject to amortization: |
||||||||||||
| Newspaper mastheads |
206,387 | |||||||||||
| Total |
711,758 | |||||||||||
| Goodwill |
1,006,020 | |||||||||||
| Total intangible assets and goodwill |
$ | 1,717,778 | ||||||||||
Changes in identifiable intangible assets and goodwill in fiscal 2010 and 2009 consisted of the following (in thousands):
| December 27, 2009 |
Impairment Charges/ Adjustments |
Amortization Expense |
December 26, 2010 |
|||||||||||||
| Intangible assets subject to amortization |
$ | 840,906 | $ | 5 | $ | — | $ | 840,911 | ||||||||
| Accumulated amortization |
(335,535 | ) | 115 | (58,653 | ) | (394,073 | ) | |||||||||
| 505,371 | 120 | (58,653 | ) | 446,838 | ||||||||||||
| Mastheads and other |
206,387 | — | — | 206,387 | ||||||||||||
| Goodwill (1) |
1,006,020 | 8,237 | — | 1,014,257 | ||||||||||||
| Total |
$ | 1,717,778 | $ | 8,357 | $ | (58,653 | ) | $ | 1,667,482 | |||||||
| (1) | In 2010, the Company identified an error related to carryover tax basis associated with investments in certain internet companies obtained in the Company’s 2006 acquisition of Knight Ridder. Research revealed that no tax basis should have been ascribed to these investments. The Company corrected this error by increasing goodwill and decreasing deferred tax assets by $8.2 million in 2010. Management has determined that the impact of this error is not material to the previously issued consolidated financial statements. |
53
Table of Contents
| December 28, 2008 |
Impairment Charges/ Adjustments |
Amortization Expense |
December 27, 2009 |
|||||||||||||
| Intangible assets subject to amortization |
$ | 843,906 | $ | (3,000 | ) | $ | — | $ | 840,906 | |||||||
| Accumulated amortization |
(279,217 | ) | 3,000 | (59,318 | ) | (335,535 | ) | |||||||||
| 564,689 | — | (59,318 | ) | 505,371 | ||||||||||||
| Mastheads and other |
206,387 | — | — | 206,387 | ||||||||||||
| Goodwill |
1,006,020 | — | — | 1,006,020 | ||||||||||||
| Total |
$ | 1,777,096 | $ | — | $ | (59,318 | ) | $ | 1,717,778 | |||||||
There were no additions to intangible assets in 2009.
Changes in indefinite lived intangible assets and goodwill as of December 26, 2010 consisted of the following (in thousands):
| Original
Gross Amount |
Accumulated Impairment |
Carrying Amount |
||||||||||
| Mastheads and other |
$ | 683,000 | $ | (476,613 | ) | $ | 206,387 | |||||
| Goodwill |
3,589,253 | (2,574,996 | ) | 1,014,257 | ||||||||
| Total |
$ | 4,272,253 | $ | (3,051,609 | ) | $ | 1,220,644 | |||||
Amortization expense was $58.7 million, $59.3 million and $61.0 million in fiscal 2010, 2009 and 2008, respectively. The estimated amortization expense for the five succeeding fiscal years is as follows (in thousands):
| Year |
Amortization Expense |
|||
| 2011 |
$ | 57,562 | ||
| 2012 |
57,387 | |||
| 2013 |
56,247 | |||
| 2014 |
57,769 | |||
| 2015 |
47,276 | |||
| NOTE 5. | LONG-TERM DEBT |
As of December 26, 2010, and December 27, 2009, long-term debt consisted of the following (in thousands):
| December 26, 2010 |
December 27, 2009 |
|||||||
| Term A bank debt, interest at 4.2% at year-end 2009 |
$ | — | $ | 546,800 | ||||
| Revolving bank debt, interest 4.2% at year-end 2009 |
— | 330,700 | ||||||
| Notes: |
||||||||
| $875 million 11.50% senior secured notes due in 2017 |
865,978 | — | ||||||
| $375 thousand 15.75% senior notes due in 2014 (1) |
552 | 41,120 | ||||||
| $18 million 7.125% notes due in 2011 |
18,172 | 167,001 | ||||||
| $169 million 4.625% notes due in 2014 |
157,634 | 154,694 | ||||||
| $347 million 5.750% notes due in 2017 |
324,842 | 321,594 | ||||||
| $89 million 7.150% debentures due in 2027 |
82,495 | 82,099 | ||||||
| $276 million 6.875% debentures due in 2029 |
253,666 | 252,428 | ||||||
| Long-term debt |
$ | 1,703,339 | $ | 1,896,436 | ||||
| (1) | Includes future interest to be paid on these notes. |
54
Table of Contents
As discussed in Note 13, in February 2011, the Company purchased $28.4 million aggregate principal amount of its outstanding debt securities for $28.4 million in cash generated by operations and partially obtained from its Credit Agreement.
The Company was a party to a credit facility originally entered into on June 27, 2006, as amended that provided for $590.0 million five-year revolving credit facility and $546.8 million five-year Term A loan (“original credit agreement or facility”). Both the Term A loan and the revolving credit facility were originally due on June 27, 2011 prior to the amendments discussed below. The original credit facility had been amended several times and was most recently amended and restated in connection with a larger refinancing entered into in February 2010 as discussed below.
The Company’s outstanding notes are stated net of unamortized discounts (totaling $71.4 million and $69.4 million as of December 26, 2010, and December 27, 2009, respectively) resulting from recording such assumed liabilities at fair value as of the June 27, 2006, acquisition of Knight Ridder and the issuance of the 11.50% senior secured notes at an original issue discount.
In accounting for the refinancing discussed below, management analyzed the transactions on an individual lender basis in accordance with relevant accounting guidance as it relates to debt modification or extinguishment. The Company recognized $10.7 million in loss on debt refinancing and subsequent debt payments in 2010.
Debt Refinancing:
February 11, 2010: The original credit agreement provided for a five-year revolving credit facility and term loans. On January 26, 2010, the Company entered into an amendment and restatement of the original credit agreement that became effective on February 11, 2010 (the “Amended and Restated Credit Agreement”), immediately prior to the closing of an offering of $875.0 million of senior secured notes. The Amended and Restated Credit Agreement required a substantial reduction in bank debt and allowed for the early retirement of other bond debt using the proceeds of the secured notes offering. The Company was in compliance with all covenants of the credit agreement at the time of the refinancing.
Upon closing of the refinancing transaction on February 11, 2010, the Amended and Restated Credit Agreement provided for a $262.0 million term loan and a $249.3 million revolving credit facility, including a $100.0 million letter of credit sub-facility, and extended the term of certain of the credit commitments to July 1, 2013. In connection with the Amended and Restated Credit Agreement, certain of the lenders did not extend the maturity of their commitments from the original maturity date of June 27, 2011. See discussion of the December 16, 2010, amendment below for additional details on the Amended and Restated Credit Agreement.
In connection with the Amended and Restated Credit Agreement, the Company issued new 11.5% senior secured notes due February 15, 2017, totaling $875.0 million (the “2017 Notes”). The notes are secured by a first-priority lien on certain of McClatchy’s and the subsidiary guarantors’ assets, and will rank equally with liens granted under McClatchy’s Credit Agreement. The assets securing the debt are unchanged from the original credit agreement and include intangible assets, inventory, receivables and certain other assets. In addition, the Company completed tender offers for its 7.125% notes due in 2011 and 15.75% senior notes due 2014 (“2014 Senior Notes”), paying $187.3 million in cash for $171.9 million of principal 2011 and 2014 notes.
The 2017 Notes were issued in a private placement. In August 2010, the original 2017 Notes (and associated guarantees) were exchanged for new 2017 Notes (and associated guarantees) that have terms substantially identical to the original notes except that the 2017 Notes issued in the exchange are not subject to transfer restrictions.
December 16, 2010, Amendment: The Company paid down the principal amount of its term loans outstanding under the Amended and Restated Credit Agreement throughout 2010 using its cash from operations.
55
Table of Contents
On December 16, 2010, the Company entered into an amendment of the Amended and Restated Credit Agreement (the Credit Agreement) to, among other things, remove certain restrictions on the ability to repurchase its publicly-traded bonds, to repay the remaining $41.0 million of bank term loans and to reduce the lenders’ revolving loan commitments under the Amended and Restated Credit Agreement. The remaining term loans were repaid on December 20, 2010.
The Credit Agreement provides for a $150.8 million revolving credit facility, including a $100.0 million letter of credit sub-facility. Revolving commitments of $25.8 million will terminate on June 27, 2011, and the remaining revolving loan commitments of $125.0 million will terminate on July 1, 2013.
At December 26, 2010, the Company had outstanding letters of credit totaling $54.3 million securing estimated obligations stemming from workers’ compensation claims and other contingent claims. At December 26, 2010, net of these letters of credit, a total of $96.5 million was available under the Company’s revolving facility under the Credit Agreement.
Debt under the Credit Agreement incurs interest at the London Interbank Offered Rate (LIBOR) plus a spread ranging from 425 basis points to 575 basis points or at a base rate plus a spread ranging from 325 basis points to 475 basis points. In each case, the applicable spread is based upon the Company’s consolidated total leverage ratio (as defined in the Credit Agreement). In the case of a LIBOR spread, the Credit Agreement sets a floor on LIBOR for the purposes of interest payments of no less than 300 basis points (except for working capital borrowings which are not subject to the 300 basis point floor and are limited to $45.0 million and a 30 day term). A commitment fee for the unused revolving credit is priced at 50 basis points to 75 basis points based upon the Company’s consolidated total leverage ratio (as defined in the Credit Agreement). As of December 26, 2010, the Company paid interest on borrowings under the Credit Agreement at a rate of 425 basis points over the 300 basis point LIBOR floor (or 7.25%) and pays 50.0 basis points for commitment fees. As of the December 26, 2010, no borrowings were outstanding under the Credit Agreement other than the letters of credit.
The Credit Agreement contains quarterly financial covenants including requirements that the Company maintain a minimum consolidated interest coverage ratio (as defined in the Credit Agreement) of 1.50 to 1.00. The Company is required to maintain a maximum consolidated leverage ratio (as defined in the Credit Agreement) of 6.75 to 1.00 from the quarter ending in March 2010 through the quarter ending December 2010; decreasing to 6.50 to 1.00 from the quarter ending in March 2011 through the quarter ending in December 2011; decreasing to 6.25 to 1.00 from the quarter ending in March 2012 through the quarter ending in December 2012; and decreasing to 6.00 to 1.00 thereafter. Under the Credit Agreement the Company is required to maintain at least $50.0 million of available liquidity, defined as the sum of cash equivalents plus the amount available under the Company’s revolving facility, as of the last day of each fiscal quarter. The Credit Agreement includes limitations on cash dividends allowed to be paid at certain leverage levels and other covenants, including limitations on additional debt.
At December 26, 2010, the Company was in compliance with all financial debt covenants. Because of the significance of the Company’s outstanding debt, remaining in compliance with debt covenants is critical to the Company’s operations. If revenue declines continue beyond those currently anticipated, the Company expects to continue to restructure operations and reduce debt to maintain compliance with its covenants.
Senior Secured Notes—The 2017 Notes are governed by an indenture entered into on February 11, 2010, which includes a number of covenants that are applicable to the Company and its restricted subsidiaries. The covenants are subject to a number of important exceptions and qualifications set forth in the indenture for the 2017 Notes. These covenants include, among other things, restrictions on the ability of the Company and its restricted subsidiaries to incur additional debt; make investments and other restricted payments; pay dividends on capital stock or redeem or repurchase capital stock or subordinated obligations; sell assets or enter into sale/leaseback transactions; create specified liens; create or permit restrictions on the ability of the Company’s restricted subsidiaries to pay dividends or make other distributions to the Company; engage in certain
56
Table of Contents
transactions with affiliates; and consolidate or merge with or into other companies or sell all or substantially all of the Company’s and its subsidiaries’ assets, taken as a whole.
Substantially all of the Company’s subsidiaries have guaranteed the Company’s obligations under the Credit Agreement and 2017 Notes (“senior secured debt”). See Note 11 for consolidating financial information on the Company’s subsidiaries that have guaranteed the senior secured debt (“Guarantor Subsidiaries”), all other subsidiaries (“Non-Guarantor Subsidiaries”) and the parent company.
In addition, the Company has granted a security interest to the banks that are a party to the Amended and Restated Credit Agreement and the trustee under the indenture governing the 2017 Notes that include, but are not limited to, intangible assets, inventory, receivables and certain minority investments as collateral for the debt. The security interest does not include any land, buildings, machinery and equipment (“PP&E”) and any leasehold interests and improvements with respect to such PP&E, which would be reflected on a consolidated balance sheet of the Company and its subsidiaries, and shares of stock and indebtedness of the subsidiaries of the Company.
The following table presents the approximate annual maturities of debt as of December 26, 2010, based upon the Company’s required payments, for the next five years and thereafter (in thousands):
| Year |
Payments (1) |
|||
| 2011 |
$ | 18,205 | ||
| 2012 |
59 | |||
| 2013 |
59 | |||
| 2014 |
169,313 | |||
| 2015 |
||||
| Thereafter |
1,587,056 | |||
| Debt principal |
$ | 1,774,692 | ||
| (1) | Long-term debt includes $18.2 million of 7.125% notes due on June 1, 2011, which are expected to be refinanced using the Company’s bank revolving credit, which matures on July 1, 2013. Amounts also include future interest to be paid on $375,000 of 15.75% notes due in 2014. |
2009 Exchange Offer—On June 26, 2009, the Company completed a private debt exchange offer for all of its outstanding debt securities for a combination of cash and its 2014 Senior Notes. The 2014 Senior Notes were senior unsecured obligations and were guaranteed by McClatchy’s existing and future material domestic subsidiaries. The Company exchanged $3.4 million in cash and $24.2 million of 2014 Senior Notes in the exchange offer. In exchange for the cash and 2014 Senior Notes the Company retired the following outstanding principal amount of debt securities maturing in the respective years: $3.8 million in 2011 notes, $11.1 million in 2014 notes, $53.4 million in 2017 notes, $10.8 million in 2027 debentures and $23.8 million in 2029 debentures. The Company recorded a pre-tax gain of approximately $44.1 million on the exchange in 2009. The gain was equal to the carrying amount of the exchanged securities less the total future cash payments of the 2014 Senior Notes, including both payments of interest and principal amount, and related expenses of the exchange. A total of $23.9 million of 2014 Senior Notes were repurchased in connection with the February 2010 tender-offer using the proceeds from the 2017 Notes discussed in “Debt Refinancing” section above, leaving $0.4 million outstanding (which were repurchased in February 2011. See Note 13 for a description of this transaction.)
2008 Notes Repurchases—In fiscal 2008, the Company purchased $319.0 million aggregate principal amount of its outstanding debt securities for $300.1 million in cash obtained from its original credit facility. The Company recognized $21.0 million in gain on the extinguishment of debt through December 28, 2008, on these transactions.
57
Table of Contents
| NOTE 6. | INCOME TAXES |
Income tax provision (benefit) related to continuing operations consist of (in thousands):
| Year Ended |
||||||||||||
| December 26, 2010 |
December 27, 2009 |
December 28, 2008 |
||||||||||
| Current: |
||||||||||||
| Federal |
$ | 26,625 | $ | 29,505 | $ | 66,682 | ||||||
| State |
4,999 | (4,774 | ) | 25,031 | ||||||||
| Deferred: |
||||||||||||
| Federal |
(16,612 | ) | 4,221 | (62,349 | ) | |||||||
| State |
(9,351 | ) | 195 | (10,086 | ) | |||||||
| Income tax provision |
$ | 5,661 | $ | 29,147 | $ | 19,278 | ||||||
The effective tax rate for continuing operations and the statutory federal income tax rate are reconciled as follows:
| Year Ended |
||||||||||||
| December 26, 2010 |
December 27, 2009 |
December 28, 2008 |
||||||||||
| Statutory rate |
35.0 | % | 35.0 | % | 35.0 | % | ||||||
| State taxes, net of federal benefit |
0.6 | % | 7.5 | % | 4.4 | % | ||||||
| Changes in estimates |
2.9 | % | 3.5 | % | 7.6 | % | ||||||
| Changes in unrecognized tax benefits |
(7.6 | )% | (10.5 | )% | 40.8 | % | ||||||
| Benefit of certain manufacturing deductions |
— | (3.5 | )% | — | ||||||||
| Settlements |
(19.5 | )% | — | — | ||||||||
| Other |
3.2 | % | 0.6 | % | (0.5 | )% | ||||||
| Effective tax rate |
14.6 | % | 32.6 | % | 87.3 | % | ||||||
The components of deferred tax assets and liabilities recorded in the Company’s Consolidated Balance Sheet on December 26, 2010 and December 27, 2009 are (in thousands):
| 2010 |
2009 |
|||||||
| Deferred tax assets: |
||||||||
| Compensation benefits |
$ | 267,584 | $ | 282,300 | ||||
| State taxes |
26,761 | 28,449 | ||||||
| State loss carryovers |
14,714 | 13,718 | ||||||
| Other |
7,612 | 9,891 | ||||||
| Total deferred tax assets |
316,671 | 334,358 | ||||||
| Valuation allowance |
(14,714 | ) | (13,718 | ) | ||||
| Net deferred tax assets |
301,957 | 320,640 | ||||||
| Deferred tax liabilities: |
||||||||
| Depreciation and amortization |
386,784 | 423,446 | ||||||
| Investments in unconsolidated subsidiaries |
72,459 | 68,974 | ||||||
| Debt discount |
18,696 | 26,091 | ||||||
| Deferred gain on debt |
33,822 | 21,648 | ||||||
| Total deferred tax liabilities |
511,761 | 540,159 | ||||||
| Net deferred tax liabilities |
$ | 209,804 | $ | 219,519 | ||||
58
Table of Contents
The valuation allowance, which relates to state net operating and capital loss carryovers, increased by $1.0 million and decreased by $2.4 million during 2010 and 2009, respectively.
The Company has varying amounts of net operating loss and capital loss carryovers in several states. The net operating losses expire in various years between 2017 and 2030 if not used. The capital loss carryovers will expire in 2012 if not used prior to that time.
As of December 26, 2010, the Company had approximately $80.4 million of long-term liabilities relating to uncertain tax positions consisting of approximately $52.0 million in gross unrecognized tax benefits (primarily state tax positions before the offsetting effect of federal income tax) and $28.4 million in gross accrued interest and penalties. If recognized, substantially all of the net unrecognized tax benefits would impact the effective tax rate. It is reasonably possible that a reduction of up to $52.2 million of unrecognized tax benefits and related interest may occur within the next 12 months as a result of the closure of certain audits and the expiration of statutes of limitations. Net accrued interest and penalties at December 26, 2010, December 27, 2009, and December 28, 2008, were approximately $21.0 million, $17.0 million and $19.1 million, respectively.
A reconciliation of the beginning and ending amount of unrecognized tax benefits is as follows (in thousands):
| 2010 |
2009 |
2008 |
||||||||||
| Balance at beginning of fiscal year |
$ | 53,359 | $ | 74,414 | $ | 72,557 | ||||||
| Increases based on tax positions in prior year |
7,529 | 2,432 | 12,073 | |||||||||
| Decreases based on tax positions in prior year |
(1,148 | ) | (1,576 | ) | (659 | ) | ||||||
| Increases based on tax positions in current year |
1,811 | 1,512 | 6,699 | |||||||||
| Settlements |
(784 | ) | (16,000 | ) | (6,691 | ) | ||||||
| Lapse of statute of limitations |
(8,775 | ) | (7,423 | ) | (9,565 | ) | ||||||
| Balance at end of fiscal year |
$ | 51,992 | $ | 53,359 | $ | 74,414 | ||||||
The Company is currently under audit by the following jurisdictions and for the years indicated: California for 2006, Minnesota for 2003 through 2006, Washington, D.C., for 2006, New Jersey for 1997 through 2006 and Illinois for 2006 through 2007. Statutes remain open for federal purposes from 2005 through 2010 and for state purposes from 2003 through 2009, with the exception of New Jersey for which statutes remain open from 1997 through 2006.
| NOTE 7. | EMPLOYEE BENEFITS |
Pension and Post-Retirement Plans:
The Company sponsors defined benefit pension plans (retirement plans), which cover a majority of its employees. Benefits are based on years of service and compensation. Contributions to the plans are made by the Company in amounts deemed necessary to provide the required benefits and as required by law. The Company made an $8.2 million contribution to its retirement plan in the third quarter of fiscal 2010. No contributions to the Company’s qualified benefit plans were made in fiscal 2008 and 2009.
The Company expects its required contributions in 2011 to be approximately $51.2 million. On January 14, 2011, the Company contributed company-owned real property from seven locations appraised in total at $49.6 million to its qualified defined benefit pension plan and expects the contribution of real property to satisfy most of the Company’s required pension contribution for fiscal 2011. The remaining required contribution, if any, will be made in cash.
The Company also has a limited number of supplemental retirement plans to provide key employees with additional retirement benefits, which were frozen on March 31, 2009, as discussed below. These plans are funded
59
Table of Contents
on a pay-as-you-go basis and the accrued pension obligation is largely included in other long-term obligations. The Company paid $7.5 million in both fiscal 2010 and 2009 and $7.2 million in fiscal 2008 for these plans.
In 2008, the Company implemented plans that reduced its workforce by a total of approximately 2,550 positions. Through December 28, 2008, the workforce reductions resulted in severance costs of $44.6 million (largely paid in 2008); pension curtailment losses in certain defined benefit plans of $2.4 million; and a gain in a post-retirement plan of $2.2 million.
In March 2009, the Company implemented a plan that reduced its work force by approximately 1,650 positions. Through December 27, 2009, the workforce reductions resulted in severance costs of $30.5 million (largely paid in 2009). The Company also froze all pension plans as of March 31, 2009. Accordingly, the Company recorded a curtailment gain of $1.9 million in 2009 related to the plan freezes.
The elements of pension costs for continuing operations are as follows (in thousands):
| December 26, 2010 |
December 27, 2009 |
December 28, 2008 |
||||||||||
| Service Cost |
$ | 5,885 | $ | 6,783 | $ | 30,468 | ||||||
| Interest Cost |
93,796 | 95,136 | 100,056 | |||||||||
| Expected return on plan assets |
(96,151 | ) | (99,326 | ) | (114,243 | ) | ||||||
| Prior service cost amortization |
14 | 34 | 277 | |||||||||
| Actuarial (gain) loss |
2,229 | 16 | (2,603 | ) | ||||||||
| Curtailment (gain) loss |
— | (1,900 | ) | 2,363 | ||||||||
| Net pension expense |
$ | 5,773 | $ | 743 | $ | 16,318 | ||||||
The Company also provides or subsidizes certain life insurance benefits for employees. The elements of post-retirement expenses for continuing operations are as follows (in thousands):
| December 26, 2010 |
December 27, 2009 |
December 28, 2008 |
||||||||||
| Service cost |
$ | — | $ | — | $ | 49 | ||||||
| Interest cost |
1,487 | 2,162 | 2,414 | |||||||||
| Actuarial gain |
(612 | ) | (198 | ) | (587 | ) | ||||||
| Prior service credit amortization |
(1,080 | ) | (1,048 | ) | (1,171 | ) | ||||||
| Curtailment gain |
— | — | (2,299 | ) | ||||||||
| Net post-retirement (credit) expense |
$ | (205 | ) | $ | 916 | $ | (1,594 | ) | ||||
60
Table of Contents
The following tables provide reconciliations of the plans’ benefit obligations, fair value of assets, funded status and amounts recognized in the Company’s Consolidated Balance Sheet at December 26, 2010, and December 27, 2009 (in thousands):
| Pension Benefits |
Postretirement Benefits |
|||||||||||||||
| 2010 |
2009 |
2010 |
2009 |
|||||||||||||
| Change in Benefit Obligation |
||||||||||||||||
| Benefit obligation, beginning of year |
$ | 1,589,495 | $ | 1,563,921 | $ | 34,636 | $ | 43,712 | ||||||||
| Service cost |
5,885 | 6,783 | — | — | ||||||||||||
| Interest cost |
93,796 | 95,136 | 1,487 | 2,162 | ||||||||||||
| Plan participants’ contributions |
— | — | 1,329 | 1,413 | ||||||||||||
| Actuarial (gain)/loss |
31,215 | 92,747 | (1,985 | ) | (6,792 | ) | ||||||||||
| Gross benefits paid |
(80,625 | ) | (81,802 | ) | (4,882 | ) | (5,458 | ) | ||||||||
| Administrative expenses |
(5,642 | ) | (4,610 | ) | — | — | ||||||||||
| Plan amendments |
— | — | — | (401 | ) | |||||||||||
| Curtailments |
— | (82,680 | ) | — | — | |||||||||||
| Benefit obligation, end of year |
$ | 1,634,124 | $ | 1,589,495 | $ | 30,585 | $ | 34,636 | ||||||||
| Accumulated benefit obligation, end of year |
$ | 1,634,124 | $ | 1,589,495 | ||||||||||||
| Change in Plan Assets |
||||||||||||||||
| Fair value of plan assets, beginning of year |
$ | 984,868 | $ | 845,588 | $ | — | $ | — | ||||||||
| Actual return on plan assets |
137,181 | 218,198 | — | — | ||||||||||||
| Employer contribution |
15,628 | 7,494 | 3,553 | 4,045 | ||||||||||||
| Plan participants’ contributions |
— | — | 1,329 | 1,413 | ||||||||||||
| Gross benefits paid |
(80,625 | ) | (81,802 | ) | (4,882 | ) | (5,458 | ) | ||||||||
| Administrative expenses |
(5,642 | ) | (4,610 | ) | — | — | ||||||||||
| Fair value of plan assets, end of year |
$ | 1,051,410 | $ | 984,868 | $ | — | $ | — | ||||||||
| Funded Status |
||||||||||||||||
| Fair value of plan assets |
$ | 1,051,410 | $ | 984,868 | $ | — | $ | — | ||||||||
| Benefit obligations |
(1,634,124 | ) | (1,589,495 | ) | (30,585 | ) | (34,636 | ) | ||||||||
| Funded status and amount recognized, end of year |
$ | (582,714 | ) | $ | (604,627 | ) | $ | (30,585 | ) | $ | (34,636 | ) | ||||
| Amounts recognized in the statement of financial position consist of: |
||||||||||||||||
| Current liability |
$ | (8,956 | ) | $ | (7,400 | ) | $ | (4,440 | ) | $ | (5,161 | ) | ||||
| Noncurrent liability |
(573,758 | ) | (597,227 | ) | (26,145 | ) | (29,475 | ) | ||||||||
| $ | (582,714 | ) | $ | (604,627 | ) | $ | (30,585 | ) | $ | (34,636 | ) | |||||
| Amounts recognized in accumulated other comprehensive income consist of: |
||||||||||||||||
| Net actuarial loss/(gain) |
$ | 418,809 | $ | 430,852 | $ | (8,350 | ) | $ | (6,977 | ) | ||||||
| Prior service cost/(credit) |
55 | 70 | (9,697 | ) | (10,778 | ) | ||||||||||
| $ | 418,864 | $ | 430,922 | $ | (18,047 | ) | $ | (17,755 | ) | |||||||
61
Table of Contents
As of December 26, 2010, and December 27, 2009, the measurement dates for the plans, plan assets and related target allocations are as follows (dollars in thousands):
| December 26, 2010 |
December 27, 2009 |
2011 Target Allocation |
||||||||||
| Equity securities |
$ | 621,842 | $ | 570,415 | 60 | % | ||||||
| Debt securities |
217,269 | 223,197 | 28 | % | ||||||||
| Real estate securities |
51,679 | 48,787 | 7 | % | ||||||||
| Commodities |
51,619 | 47,706 | 5 | % | ||||||||
| Cash equivalents and other |
109,001 | 94,763 | — | |||||||||
| Plan assets |
$ | 1,051,410 | $ | 984,868 | 100 | % | ||||||
The Company’s investment policies are designed to maximize plans’ returns within reasonable and prudent levels of risk, with an investment horizon of greater than 10 years so that interim investment returns and fluctuations are viewed with appropriate perspective. The policy also aims to maintain sufficient liquid returns to provide for the payment of retirement benefits and plan expenses, hence, small portions of the equity and debt investments are held in marketable mutual funds.
The Company’s policy seeks to provide an appropriate level of diversification of assets, as reflected in its target allocations, as well as limits placed on concentrations of equities in specific sectors or industries. It uses a mix of active managers and passive index funds and a mix of separate accounts, mutual funds, common collective trusts and other investment vehicles.
The Company’s assumed long-term return on assets was developed using a weighted average return based upon its portfolio of assets and expected returns for each asset class, taking into account projected inflation, interest rates and market returns and further adjusted for active and passive investment styles as appropriate for each manager and asset class. The assumed return was also reviewed in light of historical and recent returns in total and by asset class.
Expected benefit payments to retirees under the Company’s retirement and post-retirement plans over the next 10 years are summarized below (in thousands):
| Retirement Plans (1) |
Post-retirement Plans |
|||||||
| 2011 |
$ | 79,228 | $ | 4,440 | ||||
| 2012 |
81,815 | 3,987 | ||||||
| 2013 |
85,131 | 3,651 | ||||||
| 2014 |
88,872 | 3,362 | ||||||
| 2015 |
92,893 | 2,293 | ||||||
| 2016-2020 |
531,252 | 10,333 | ||||||
| Total |
$ | 959,191 | $ | 28,066 | ||||
| (1) | Largely to be paid from the qualified defined benefit pension plan |
The Company’s discount rate was determined by matching a portfolio long-term, non-callable, high quality bonds to the plans’ projected cash flows.
62
Table of Contents
Weighted average assumptions used for valuing benefit obligations were:
| 2010 |
2009 |
|||||||
| Discount rate in determining pension benefit obligation |
5.90 | % | 6.05 | % | ||||
| Discount rate in determining post-retirement obligations |
4.84 | % | 5.09 | % | ||||
Weighted average assumptions used in calculating expense:
| 2010 |
2009 |
2008 |
||||||||||
| Long-term return on assets |
8.25 | % | 8.25 | % | 8.50 | % | ||||||
| Discount rate in determining pension expense |
6.05 | % | 6.52 | % | 6.41 | % | ||||||
| Discount rate in determining post-retirement expense |
5.09 | % | 6.22 | % | 5.93 | % | ||||||
The plans were revalued as of June 30, 2008, and September 30, 2008 to account for plan curtailments using appropriate discount rates at the time that also impacted pension and post-retirement expenses in fiscal 2008. The plans were revalued once again at March 31, 2009, to reflect the plan freeze that impacted pension expenses in 2009.
The following table summarizes data for pension plans with accumulated benefit obligations in excess of plan assets (in thousands):
| December
26, 2010 |
December
27, 2009 |
|||||||
| Projected benefit obligation |
$ | 1,634,124 | $ | 1,589,495 | ||||
| Accumulated benefit obligation |
1,634,124 | 1,589,495 | ||||||
| Fair value of plan assets |
1,051,410 | 984,868 | ||||||
For the post-retirement plans, the medical cost trend rates are expected to decline from 8.0% in 2010 to 5.0% by the year 2018. As of December 26, 2010, a 1.0% increase in the assumed health care cost trend rate would increase the benefit obligation by $1.3 million, and a 1.0% decrease in the assumed health care cost trend rate would decrease the benefit obligation by $1.1 million. As of December 27, 2009, a 1.0% increase in the assumed health care cost trend rate would increase the benefit obligation by $1.4 million, and a 1.0% decrease in the assumed health care cost trend rate would decrease the benefit obligation by $1.3 million.
Defined Contribution Plans:
The Company had separate deferred compensation plans (401(k) plans) for employees of Knight Ridder, Inc. and The McClatchy Company, which enable qualified employees to voluntarily defer compensation. On March 31, 2009, the Company temporarily suspended its matching contribution to the 401(k) plans. On June 29, 2009, the Knight Ridder 401(k) plan was merged into The McClatchy Company 401(k) Plan (“McClatchy Plan”). The McClatchy Plan, as amended, includes a Company match (once reinstated) and a supplemental contribution that is tied to Company performance (as defined in the plan).
The Company has made no matching contributions to the McClatchy Plan since the second fiscal quarter of 2009. Matching contributions in fiscal 2009 were $2.2 million. The Company incurred $10.8 million of expense related to supplemental contributions for the McClatchy Plan in fiscal 2010. No supplemental contributions were recorded in 2009.
Fair Value Measurement:
Fair value measurements accounting framework establishes a framework for measuring fair value of assets and liabilities. This framework provides a hierarchy that prioritizes the inputs to valuation techniques used to measure fair value. The hierarchy gives the highest priority to unadjusted quoted prices in active markets for
63
Table of Contents
identical assets or liabilities (level 1 measurements) and the lowest priority to unobservable inputs (level 3 measurements). The three levels of the fair value hierarchy are described below:
Level 1—Inputs to the valuation methodology are quoted prices available in active markets for identical investments as of the reporting date.
Level 2—Inputs to the valuation methodology are other than quoted prices in active markets, which are either directly or indirectly observable as of the reporting date, and fair value can be determined through the use of models or other valuation methodologies.
Level 3—Inputs to the valuation methodology are unobservable inputs in situations where there is little or no market activity for the asset or liability, and the reporting entity makes estimates and assumptions related to the pricing of the asset or liability including assumptions regarding risk.
The table below summarizes the plan’s financial instruments for fiscal 2010 that are carried at fair value on a recurring basis by the fair value hierarchy levels discussed above (in thousands):
| 2010 |
||||||||||||||||
| Plan Assets |
||||||||||||||||
| Level 1 |
Level 2 |
Level 3 |
Total |
|||||||||||||
| Cash and cash equivalents |
$ | 38,717 | $ | — | $ | — | $ | 38,717 | ||||||||
| Mutual funds |
32,708 | — | — | 32,708 | ||||||||||||
| Corporate stock |
200 | — | — | 200 | ||||||||||||
| Corporate debt instruments |
— | 70,060 | — | 70,060 | ||||||||||||
| U.S. Government securities |
— | 171,942 | — | 171,942 | ||||||||||||
| Common collective trusts |
— | 692,553 | — | 692,553 | ||||||||||||
| Mortgage and asset backed securities |
— | 17,140 | — | 17,140 | ||||||||||||
| Other |
— | 9,612 | 36,728 | 46,340 | ||||||||||||
| Total |
$ | 71,625 | $ | 961,307 | $ | 36,728 | 1,069,660 | |||||||||
| Pending trades |
(18,250 | ) | ||||||||||||||
| $ | 1,051,410 | |||||||||||||||
The table below summarizes changes in the fair value of the plan’s Level 3 investment assets held for the year ended December 26, 2010 (in thousands):
| Commercial Bank Loans |
Private Equity |
Receivable |
Total |
|||||||||||||
| Beginning Balance, December 27, 2009 |
$ | 1,538 | $ | 7,904 | $ | 32,216 | $ | 41,658 | ||||||||
| Purchases, issuances, sales, settlements (net) |
(5,165 | ) | (172 | ) | (3,280 | ) | (8,617 | ) | ||||||||
| Unrealized gains |
3,627 | 60 | — | 3,687 | ||||||||||||
| Ending Balance, December 26, 2010 |
$ | — | $ | 7,792 | $ | 28,936 | $ | 36,728 | ||||||||
64
Table of Contents
The table below summarizes the plan’s financial instruments for fiscal 2009 that are carried at fair value on a recurring basis by the fair value hierarchy levels discussed above (in thousands):
| 2009 |
||||||||||||||||
| Plan Assets |
||||||||||||||||
| Level 1 |
Level 2 |
Level 3 |
Total |
|||||||||||||
| Cash and cash equivalents |
$ | 46,144 | $ | — | $ | — | $ | 46,144 | ||||||||
| Mutual funds |
66,793 | — | — | 66,793 | ||||||||||||
| Corporate stock |
37,904 | — | — | 37,904 | ||||||||||||
| Corporate debt instruments |
— | 70,526 | — | 70,526 | ||||||||||||
| U.S. Government securities |
— | 148,199 | — | 148,199 | ||||||||||||
| Common collective trusts |
— | 538,334 | — | 538,334 | ||||||||||||
| Mortgage and asset backed securities |
— | 23,685 | — | 23,685 | ||||||||||||
| Other |
— | 31,070 | 41,658 | 72,728 | ||||||||||||
| Total |
$ | 150,841 | $ | 811,814 | $ | 41,658 | 1,004,313 | |||||||||
| Pending trades |
(19,445 | ) | ||||||||||||||
| $ | 984,868 | |||||||||||||||
The table below summarizes changes in the fair value of the plan’s Level 3 investment assets held for the year ended December 27, 2009 (in thousands):
| Commercial Bank Loans |
Private Equity |
Receivable |
Total |
|||||||||||||
| Beginning Balance, December 28, 2008 |
$ | 13,897 | $ | 8,048 | $ | 15,000 | $ | 36,945 | ||||||||
| Purchases, issuances, sales, settlements (net) |
(13,835 | ) | 101 | — | (13,734 | ) | ||||||||||
| Unrealized gains (losses) |
1,476 | (245 | ) | 17,216 | 18,447 | |||||||||||
| Ending Balance, December 27, 2009 |
$ | 1,538 | $ | 7,904 | $ | 32,216 | $ | 41,658 | ||||||||
Cash and cash equivalents. The carrying value of these items approximates fair value.
Mutual funds. These investments are publicly traded investments, which are valued using the Net Asset Value (NAV). The NAV of the mutual funds is a quoted price in an active market. The NAV is determined once a day after the closing of the exchange based upon the underlying assets in the fund, less the fund’s liabilities, expressed on a per-share basis.
Corporate stock. The fair value of corporate stock is based on the exchange quoted market prices. When quoted prices are not available for identical stock, an industry standard valuation model is used which maximizes observable inputs.
Corporate debt instruments. The fair value of corporate debt instruments is based on yields currently available on comparable securities of issuers with similar credit ratings. When quoted prices are not available for identical or similar debt instruments, the fair value is based upon an industry valuation model, which maximizes observable inputs.
U.S. Government securities. U.S. government securities primarily consist of investments in U.S. Treasury Bonds, Indexed Linked Bonds and Treasury Inflation Protected Securities. The fair value of U.S. government securities is based on quoted market prices when available or is based on yields currently available on comparable securities or on an industry valuation model, which maximizes observable inputs.
65
Table of Contents
Common collective trusts. These investments are valued based on the NAV of the underlying investments and are provided by the fund issuers. NAV for these funds represent the quoted price in a non-market environment. There are no restrictions on participants’ ability to withdraw funds from the common collective trusts.
Mortgage and asset backed securities. Mortgage and asset backed securities are valued using quotes from independent pricing vendors based on recent trading activity and other relevant information, including market interest rate curves, referenced credit spreads, and estimated prepayment rates, where applicable.
Other. Other includes:
Private Equity Fund. Private equity funds represent investments in limited partnerships, which invest in start-up or other private companies. Fair value is estimated based on valuations of comparable public companies, recent sales of comparable private and public companies, and discounted cash flow analysis of portfolio companies and is included as a Level 3 investment in the table above.
Receivable. This asset represents the estimated amount to be received from a redemption request made from an equity investment fund in 2008. In early 2009, the Company became aware of a regulatory action and criminal charges for securities fraud filed against two principals that operated the investment strategy in which the fund was invested. Accordingly, timing and amount of the pension plan’s redemption are uncertain. The fund assets are held by a court-appointed receiver. Criminal and civil claims are in process against the fund principals.
At December 28, 2008, the Company recorded the value of the receivable at $15.0 million based upon the amount the pension plan expected to collect. During 2009, the Company became aware of facts leading it to believe the plan would ultimately collect $32.2 million of its investment and accordingly valued its receivable in the plan at this amount at December 27, 2009. The Company received $3.3 million in December 2010, which reduces the net receivable to $28.9 million as of December 26, 2010. The Company believes the remaining balance is still collectible. Any difference between the recorded amount and the actual redemption amounts will result in an adjustment to the Company’s net pension liabilities and other comprehensive loss in its financial statements upon final resolution. This asset is included as a Level 3 investment in the table above.
| NOTE 8. | CASH FLOW INFORMATION |
Cash paid during the fiscal 2010, 2009 and 2008 for interest and income taxes were (in thousands):
| 2010 |
2009 |
2008 |
||||||||||
| Interest paid (net of amount capitalized) |
$ | 123,402 | $ | 111,065 | $ | 139,468 | ||||||
| Interest paid on tax settlements |
82 | 5,466 | — | |||||||||
| Income taxes paid (net of refunds) |
37,246 | 77,481 | (168,054 | ) | ||||||||
During 2009, the Company exchanged senior notes due in July 2014 for outstanding notes due in 2011, 2014, 2017 and 2029. See Note 5 for an expanded discussion of this transaction. As a result, the Company issued notes and retired notes for amounts summarized below (in thousands):
| 2009 |
||||
| Issuance of senior notes and future interest in debt exchange |
$ | 43,503 | ||
| Carrying value of unsecured notes exchanged for senior notes in debt exchange |
$ | (89,423 | ) | |
There were no non-cash financing activities during fiscal 2010 and 2008.
66
Table of Contents
Net cash from operating activities of discontinued operations are summarized below (in thousands):
| 2010 |
2009 |
2008 |
||||||||||
| Income (loss) from discontinued operations |
$ | 3,083 | $ | (6,174 | ) | $ | (6,758 | ) | ||||
| Reconciliation to net cash from discontinued operations: |
||||||||||||
| Refund/(payment) of income taxes related to sale of newspapers |
— | (7,260 | ) | 190,134 | ||||||||
| Changes in assets and liabilities and other, net |
(5,189 | ) | 5,003 | 4,191 | ||||||||
| Net cash from operating activities of discontinued operations |
$ | (2,106 | ) | $ | (8,431 | ) | $ | 187,567 | ||||
| NOTE 9. | COMMITMENTS AND CONTINGENCIES |
The Company has purchase obligations primarily related to printing outsource agreements and capital expenditures for property, plant and equipment expiring at various dates through 2028, totaling $131.2 million.
Lease commitments—The Company and its subsidiaries rent certain facilities and equipment under operating leases expiring at various dates through December 2019. Total rental expense, included in other operating expenses, from continuing operations amounted to $14.5 million in fiscal 2010, $15.2 million in fiscal 2009 and $16.8 million in fiscal 2008. Most of the leases provide that the Company pay taxes, maintenance, insurance and certain other operating expenses applicable to the leased premises in addition to the minimum monthly payments. Some of the operating leases have built in escalation clauses.
The Company has subleased office space to other companies under noncancellable agreements that expire at various dates through 2019. Sublease income from operating leases totaled $3.0 million, $2.5 million and $0.8 million in fiscal 2010, 2009 and fiscal 2008, respectively.
Minimum rental commitments under operating leases with non-cancelable terms in excess of one year and sublease income from leased space are (in thousands):
| Year |
Lease Obligation |
Sublease Income |
Net Amount |
|||||||||
| 2011 |
$ | 12,640 | $ | (2,579 | ) | $ | 10,061 | |||||
| 2012 |
10,375 | (1,363 | ) | 9,012 | ||||||||
| 2013 |
9,100 | (972 | ) | 8,128 | ||||||||
| 2014 |
7,113 | (333 | ) | 6,780 | ||||||||
| 2015 |
4,985 | (285 | ) | 4,700 | ||||||||
| Thereafter |
11,698 | (6 | ) | 11,692 | ||||||||
| Total |
$ | 55,911 | $ | (5,538 | ) | $ | 50,373 | |||||
The lease commitments discussed above do not include commitments of approximately $4.0 million due annually to the Company’s qualified defined benefit plan that were entered into on January 14, 2011. See Note 13 for an expanded discussion of this transaction.
Self-Insurance—The Company retains the risk for workers’ compensation resulting from uninsured deductibles per accident or occurrence that are subject to annual aggregate limits. Losses up to the deductible amounts are accrued based upon known claims incurred and an estimate of claims incurred but not reported. For the year ended December 26, 2010, the Company compiled its historical data pertaining to the self-insurance experiences and actuarially developed the ultimate loss associated with its self-insurance programs for workers’ compensation liability. Management believes that the actuarial valuation provides the best estimate of the ultimate losses to be expected under these programs.
67
Table of Contents
The undiscounted ultimate losses of all the Company’s self-insurance reserves at December 26, 2010, and December 27, 2009, were $20.4 million and $24.4 million, respectively. Based on historical payment patterns, the Company expects payments of undiscounted ultimate losses to be made as follows (in thousands):
| Year |
Amount |
|||
| 2011 |
$ | 5,183 | ||
| 2012 |
3,566 | |||
| 2013 |
2,561 | |||
| 2014 |
1,953 | |||
| 2015 |
1,521 | |||
| Thereafter |
5,607 | |||
| Total |
$ | 20,391 | ||
The Company discounts the ultimate losses above to present value using an approximate risk-free rate over the average life of its insurance claims. For the years ended December 26, 2010, and December 27, 2009, the discount rate used was 2.23% and 3.67%, respectively. The present value of all self-insurance reserves for the employee group health claims and workers’ compensation liability recorded at December 26, 2010, and December 27, 2009, was $19.9 million and $21.0 million, respectively.
The Company had letters of credit of $7.5 million outstanding at December 26, 2010, to collateralize its self-insurance obligations.
Other contingent claims—There are libel and other legal actions that have arisen in the ordinary course of business and are pending against the Company. From time to time the Company is involved as a party in various governmental proceedings, including environmental matters. Management believes, after reviewing such actions with counsel, that the expected outcome of pending actions will not have a material adverse effect on the Company’s consolidated financial statements taken as a whole, although no assurances can be given. No material amounts for any losses from litigation which may ultimately occur have been recorded in the consolidated financial statements, as management believes that any such losses are not probable.
The Company has certain indemnifications related to workers’ compensation claims and multi-employer pension plans of disposed newspaper operations. In 2010 the Company reversed a reserve (and recorded income) of $6.5 million related to certain of the indemnification obligations as the related newspapers paid current amounts and showed the ability to continue to meet their obligations to the Company. In 2008 and 2009, the Company reserved amounts totaling $8.4 million and $10.7 million, respectively, related to these indemnifications. Remaining indemnification obligations related to disposed newspapers are not expected to be material to the Company’s financial position or results of operations.
| NOTE 10. | COMMON STOCK AND STOCK PLANS |
The Company’s Class A and Class B Common Stock participate equally in dividends. Holders of Class B are entitled to one vote per share and to elect as a class 75% of the Board of Directors, rounded down to the nearest whole number. Holders of Class A Common Stock are entitled to one-tenth of a vote per share and to elect as a class 25% of the Board of Directors, rounded up to the nearest whole number. Class B Common Stock is convertible at the option of the holder into Class A Common Stock on a share-for-share basis.
The holders of shares of Class B Common Stock are parties to an agreement, the intent of which is to preserve control of the Company by the McClatchy family. Under the terms of the agreement, the Class B shareholders have agreed to restrict the transfer of any shares of Class B Common Stock to one or more “Permitted Transferees,” subject to certain exceptions. A “Permitted Transferee” is any current holder of shares
68
Table of Contents
of Class B Common Stock of the Company; any lineal descendant of Charles K. McClatchy (1858 to 1936); or a trust for the exclusive benefit of, or in which all of the remainder beneficial interests are owned by, one or more lineal descendants of Charles K. McClatchy.
Generally, Class B shares can be converted into shares of Class A Common Stock and then transferred freely (unless, following conversion, the outstanding shares of Class B Common Stock would constitute less than 25% of the total number of all outstanding shares of common stock of the Company). In the event that a Class B shareholder attempts to transfer any shares of Class B Common Stock in violation of the agreement, or upon the happening of certain other events enumerated in the agreement as “Option Events,” each of the remaining Class B shareholders has an option to purchase a percentage of the total number of shares of Class B Common Stock proposed to be transferred equal to such remaining Class B shareholder’s ownership percentage of the total number of outstanding shares of Class B Common Stock. If all the shares proposed to be transferred are not purchased by the remaining Class B shareholders, the Company has the option of purchasing the remaining shares. The agreement can be terminated by the vote of the holders of 80% of the outstanding shares of Class B Common Stock who are subject to the agreement. The agreement will terminate on September 17, 2047, unless terminated earlier in accordance with its terms.
At December 26, 2010, the Company has six stock-based compensation plans, which are described below.
The Company’s Amended Employee Stock Purchase Plan (the Purchase Plan) reserved 4,625,000 shares of Class A Common Stock for issuance to employees. Eligible employees may purchase shares at 85% of “fair market value” (as defined) through payroll deductions. The Purchase Plan can be automatically terminated by the Company at any time. As of December 26, 2010, a total of 4,340,461 shares of Class A Common Stock have been issued under the Purchase Plan.
The Company has two stock option plans which reserve 4,062,500 Class A Common shares for issuance to key employees—the 1994 and 1997 plans (Employee Plans). Terms of each of the Employee Plans are substantially the same. Options are granted at the market price of the Class A Common Stock on the date of grant. The options vest in installments over four years, and once vested are exercisable up to 10 years from the date of grant. Although the plans permit the Company, at its sole discretion, to settle unexercised options by granting stock appreciation rights, the Company does not intend to avail itself of this alternative for option grants made under these plans. The 1994 plan (which has 1,051,450 outstanding grants at December 26, 2010) expired in January 2004 and has been replaced by the 2004 stock incentive plan (see the discussion below).
The Company’s two amended and restated stock option plans for outside directors (the 1990 Stock Option Plan and the 2001 Director Plan, together the Directors’ Plans) provide for the issuance of up to 687,500 shares of Class A Common Stock. Generally, under these plans each non-employee director was granted, at the conclusion of each regular annual meeting of stockholders, an option to purchase shares of Class A Common Stock at fair market value on the date of the grant. Terms of the Directors’ Plans are similar to the terms of the Employee Plans. No options were granted in 2010, 2009 or 2008 under these plans.
The Company has a stock incentive plan (the 2004 plan) that reserves 9,000,000 Class A Common shares for issuance to key employees and outside directors. Terms of the 2004 plan are similar to the Employee and Directors’ Plans, except that the 2004 plan permits the following type of incentive awards in addition to common stock, stock options and stock appreciation rights: restricted stock, unrestricted stock, stock units and dividend equivalent rights. Beginning in fiscal 2005, the Company awarded stock-settled stock appreciation rights (SARs) in lieu of stock options. The SARs were granted at fair market value, have a 10-year term and vest in four equal annual installments beginning on March 1 following the year for which the award was made.
In 2010 the Company granted 10,000 shares of Class A Common Stock to each non-employee director at the conclusion of the regular annual meeting of stockholders, for a total of 110,000 shares from the 2004 plan. In 2009, the Company granted 845,000 restricted stock units (RSU) at fair market value on the date of grant ($3.42
69
Table of Contents
per share) to certain key employees from the 2004 plan. The RSUs vest on March 1, 2012. As of December 26, 2010, there were $1.5 million of unrecognized compensation costs for non-vested RSUs, which are expected to be recognized over 1.2 years.
Outstanding options and SARs are summarized as follows:
| Options/ SARs |
Weighted Average Exercise Price |
Aggregate Intrinsic Value (in thousands) |
||||||||||
| Outstanding December 30, 2007 |
5,076,800 | $ | 41.53 | $ | — | |||||||
| Granted |
1,787,000 | $ | 1.88 | |||||||||
| Forfeited |
(134,625 | ) | $ | 30.63 | ||||||||
| Expired |
(171,825 | ) | $ | 40.76 | ||||||||
| Outstanding December 28, 2008 |
6,557,350 | $ | 30.97 | $ | — | |||||||
| Granted |
1,136,000 | $ | 3.41 | |||||||||
| Forfeited |
(312,000 | ) | $ | 11.95 | ||||||||
| Expired |
(341,500 | ) | $ | 27.93 | ||||||||
| Outstanding December 27, 2009 |
7,039,850 | $ | 26.79 | $ | 3,086 | |||||||
| Granted |
10,000 | $ | 4.96 | |||||||||
| Exercised |
(119,250 | ) | $ | 1.70 | ||||||||
| Forfeited |
(44,250 | ) | $ | 7.07 | ||||||||
| Expired |
(254,150 | ) | $ | 40.53 | ||||||||
| Outstanding December 26, 2010 |
6,632,200 | $ | 26.82 | $ | 6,060 | |||||||
| Vested and Expected to Vest December 26, 2010 |
6,511,250 | $ | 27.25 | $ | 5,837 | |||||||
| Options exercisable: |
||||||||||||
| December 28, 2008 |
2,561,725 | $ | — | |||||||||
| December 27, 2009 |
2,987,725 | $ | 2 | |||||||||
| December 26, 2010 |
3,572,450 | $ | 869 | |||||||||
As of December 26, 2010, there were $4.5 million of unrecognized compensation costs related to options and SAR’s granted under the Company’s plans. The cost is expected to be recognized over a weighted average period of 1.8 years.
The following tables summarize information about stock options and SARs outstanding in the stock plans at December 26, 2010:
| Range of Exercise Prices |
Options/ SARs Outstanding |
Average Remaining Contractual Life |
Weighted Average Exercise Price |
Options/ SARs Exercisable |
Weighted Average Exercise Price |
|||||||||||||||
| $ 1.5 - $3.42 |
2,581,000 | 8.39 | $ | 2.44 | 281,250 | $ | 1.70 | |||||||||||||
| $ 4.91 - $45.98 |
2,353,950 | 5.33 | $ | 27.26 | 1,593,950 | $ | 31.07 | |||||||||||||
| $47.22 - $73.36 |
1,697,250 | 3.01 | $ | 63.27 | 1,697,250 | $ | 63.27 | |||||||||||||
| 6,632,200 | 5.93 | $ | 26.82 | 3,572,450 | $ | 44.05 | ||||||||||||||
The weighted average remaining contractual life on options exercisable at December 26, 2010, was 4.12 years. The weighted average remaining contractual life of options vested and expected to vest at December 26, 2010, was 5.88 years. The fair value of the stock options and SARs granted was estimated on the date of grant using a Black-Scholes option valuation model that uses the assumptions noted in the following table. The expected life of the options represents the period of time that options granted are expected to be outstanding
70
Table of Contents
using the historical exercise behavior of employees. The expected dividend yield is based on historical dividends declared per year, giving consideration for any anticipated change and the estimated stock price over the expected life of the options based on historical experience. Expected volatility was based on historical volatility for a period equal to the stock option’s expected life for shares granted. The risk-free rate for periods within the contractual life of the option is based on the U.S. Treasury yield curve in effect at the time of grant.
| 2010 |
2009 |
2008 |
||||||||||
| Expected life in years |
6.10 | 6.06 | 5.99 | |||||||||
| Dividend yield |
NIL | NIL | NIL | |||||||||
| Volatility |
0.83 | 0.82 | 0.45 | |||||||||
| Risk-free interest rate |
2.77 | % | 2.72 | % | 1.59 | % | ||||||
| Weighted average exercise price of options/SARs granted |
$ | 4.96 | $ | 3.41 | $ | 1.88 | ||||||
| Weighted average fair value of options/SARs granted |
$ | 3.57 | $ | 2.43 | $ | 0.78 | ||||||
The Company also offers eligible employees the option to purchase Class A Common Stock under the Purchase Plan. The expense associated with the plan is computed using a Black-Scholes option valuation model with similar assumptions to those described for stock options, except that volatility is computed using a one-year look back given the short-term nature of this option. Expense associated with the Purchase Plan is included in the stock-related compensation.
| NOTE 11. | FINANCIAL INFORMATION FOR SUBSIDIARY GUARANTORS AND NON-GUARANTORS |
Substantially all of the Company’s subsidiaries (“Guarantor Subsidiaries”) have guaranteed the Company’s obligations under the Credit Agreement and 2017 Secured Notes. Each of the Guarantor Subsidiaries are 100% owned by The McClatchy Company (“Parent”) and the guarantees provided by the Guarantor Subsidiaries are full and unconditional and joint and several. The primary asset owned by the Parent is land in Miami valued at $116.0 million. See Note 3 for a greater description of this land.
The Company transferred ownership of certain unconsolidated companies from the Parent to a Guarantor Subsidiary. The Company recast the 2009 and 2008 consolidating financial statements below to reflect the transfer made in fiscal 2010.
71
Table of Contents
The following tables present condensed consolidating financial information for the Guarantor Subsidiaries, all other subsidiaries (“Non-Guarantor Subsidiaries”) and the Parent. These condensed consolidating financial statements were prepared in accordance with Rule 3-10 of the Securities and Exchange Commission Regulation S-X, “Financial Statements of Guarantors and Issuers of Guaranteed Securities Registered or Being Registered.” The Company accounts for investments in these subsidiaries under the equity method of accounting. The financial statements include eliminations which are primarily related to investments in subsidiaries and intercompany balances and transactions. All cash receipts and payments are at Guarantor Subsidiaries and no cash transactions take place at Non-Guarantor Subsidiaries or at the Parent company, accordingly all activities attributed to the Parent and Non-Guarantor Subsidiaries are of a non-cash nature in the statement of cash flows. Amounts are in thousands:
CONDENSED CONSOLIDATING BALANCE SHEET AS OF DECEMBER 26, 2010
| Guarantor Subsidiaries |
Non-Guarantor Subsidiaries |
Parent |
Eliminations |
Consolidated |
||||||||||||||||
| CURRENT ASSETS: |
||||||||||||||||||||
| Cash and cash equivalents |
$ | 17,508 | $ | 17,508 | ||||||||||||||||
| Trade receivables, net of allowances |
183,741 | 183,741 | ||||||||||||||||||
| Newsprint, ink and other inventories |
33,322 | 33,322 | ||||||||||||||||||
| Other current assets |
61,795 | $ | 237 | $ | 3,684 | 65,716 | ||||||||||||||
| Total current assets |
296,366 | 237 | 3,684 | 300,287 | ||||||||||||||||
| Property, plant and equipment, net |
709,207 | 1 | 709,208 | |||||||||||||||||
| Identifiable intangibles—net |
653,225 | 653,225 | ||||||||||||||||||
| Goodwill |
1,014,257 | 1,014,257 | ||||||||||||||||||
| Investments in unconsolidated companies |
305,539 | 1,279 | 63 | 306,881 | ||||||||||||||||
| Other assets |
8,128 | 144,373 | 152,501 | |||||||||||||||||
| Investment in and advances to subsidiaries |
1,981,477 | (1,981,477 | ) | — | ||||||||||||||||
| TOTAL ASSETS |
$ | 2,986,722 | $ | 1,517 | $ | 2,129,597 | $ | (1,981,477 | ) | $ | 3,136,359 | |||||||||
| CURRENT LIABILITIES: |
||||||||||||||||||||
| Accounts payable and accrued compensation |
$ | 114,405 | $ | 1,036 | $ | 7,163 | $ | 122,604 | ||||||||||||
| Unearned revenue |
75,125 | 75,125 | ||||||||||||||||||
| Other accrued liabilities |
17,192 | 4 | 52,360 | 69,556 | ||||||||||||||||
| Total current liabilities |
206,722 | 1,040 | 59,523 | 267,285 | ||||||||||||||||
| Long-term debt |
— | 1,703,339 | 1,703,339 | |||||||||||||||||
| Pension and postretirement obligations |
599,904 | 599,904 | ||||||||||||||||||
| Other long-term obligations |
198,866 | 230 | 147,390 | 346,486 | ||||||||||||||||
| Total Liabilities |
1,005,492 | 1,270 | 1,910,252 | 2,917,014 | ||||||||||||||||
| CAPITAL STRUCTURE |
1,981,230 | 247 | 219,345 | $ | (1,981,477 | ) | 219,345 | |||||||||||||
| TOTAL LIABILITIES AND STOCKHOLDERS’ EQUITY |
$ | 2,986,722 | $ | 1,517 | $ | 2,129,597 | $ | (1,981,477 | ) | $ | 3,136,359 | |||||||||
72
Table of Contents
CONDENSED CONSOLIDATING BALANCE SHEET AS OF DECEMBER 27, 2009
| Guarantor Subsidiaries |
Non-Guarantor Subsidiaries |
Parent |
Eliminations |
Consolidated |
||||||||||||||||
| CURRENT ASSETS: |
||||||||||||||||||||
| Cash and cash equivalents |
$ | 6,157 | $ | 6,157 | ||||||||||||||||
| Trade receivables, net of allowances |
205,840 | 205,840 | ||||||||||||||||||
| Newsprint, ink and other inventories |
36,374 | 36,374 | ||||||||||||||||||
| Other current assets |
70,054 | $ | 440 | $ | 2,376 | 72,870 | ||||||||||||||
| Total current assets |
318,425 | 440 | 2,376 | 321,241 | ||||||||||||||||
| Property, plant and equipment, net |
767,577 | 3 | 767,580 | |||||||||||||||||
| Identifiable intangibles—net |
711,758 | 711,758 | ||||||||||||||||||
| Goodwill |
1,006,020 | 1,006,020 | ||||||||||||||||||
| Investments in unconsolidated companies |
321,003 | 1,106 | 322,109 | |||||||||||||||||
| Other assets |
7,634 | 166,557 | 174,191 | |||||||||||||||||
| Investment in and advances to subsidiaries |
2,078,071 | $ | (2,078,071 | ) | — | |||||||||||||||
| TOTAL ASSETS |
$ | 3,132,417 | $ | 1,549 | $ | 2,247,004 | $ | (2,078,071 | ) | $ | 3,302,899 | |||||||||
| CURRENT LIABILITIES: |
||||||||||||||||||||
| Accounts payable and accrued compensation |
$ | 126,870 | $ | 904 | $ | 5,435 | $ | 133,209 | ||||||||||||
| Unearned revenue |
78,908 | 78,908 | ||||||||||||||||||
| Other accrued liabilities |
27,236 | 28 | 23,829 | 51,093 | ||||||||||||||||
| Total current liabilities |
233,014 | 932 | 29,264 | 263,210 | ||||||||||||||||
| Long-term debt |
1,896,436 | 1,896,436 | ||||||||||||||||||
| Pension and postretirement obligations |
604,701 | 604,701 | ||||||||||||||||||
| Other long-term obligations |
216,973 | 275 | 151,115 | 368,363 | ||||||||||||||||
| Total Liabilities |
1,054,688 | 1,207 | 2,076,815 | 3,132,710 | ||||||||||||||||
| CAPITAL STRUCTURE |
2,077,729 | 342 | 170,189 | $ | (2,078,071 | ) | 170,189 | |||||||||||||
| TOTAL LIABILITIES AND STOCKHOLDERS’ EQUITY |
$ | 3,132,417 | $ | 1,549 | $ | 2,247,004 | $ | (2,078,071 | ) | $ | 3,302,899 | |||||||||
73
Table of Contents
CONDENSED CONSOLIDATING STATEMENT OF OPERATIONS
FOR THE YEAR ENDED DECEMBER 26, 2010
| Guarantor Subsidiaries |
Non-Guarantor Subsidiaries |
Parent |
Eliminations |
Consolidated |
||||||||||||||||
| REVENUES—NET: |
||||||||||||||||||||
| Advertising |
$ | 1,049,964 | $ | 1,049,964 | ||||||||||||||||
| Circulation |
272,776 | 272,776 | ||||||||||||||||||
| Other |
51,934 | $ | 558 | 52,492 | ||||||||||||||||
| Total revenues—net |
1,374,674 | 558 | 1,375,232 | |||||||||||||||||
| OPERATING EXPENSES: |
||||||||||||||||||||
| Compensation |
519,044 | 135 | 519,179 | |||||||||||||||||
| Newsprint and supplements |
136,642 | 136,642 | ||||||||||||||||||
| Depreciation and amortization |
133,404 | 133,404 | ||||||||||||||||||
| Other operating expenses |
345,677 | 83 | $ | 1,364 | 347,124 | |||||||||||||||
| Total operating expenses |
1,134,767 | 218 | 1,364 | 1,136,349 | ||||||||||||||||
| OPERATING INCOME (LOSS) |
239,907 | 340 | (1,364 | ) | 238,883 | |||||||||||||||
| NON-OPERATING (EXPENSES) INCOME: |
||||||||||||||||||||
| Interest income (expense) |
32 | (177,673 | ) | (177,641 | ) | |||||||||||||||
| Write-down of investments and land |
(2,947 | ) | (21,350 | ) | (24,297 | ) | ||||||||||||||
| Loss on extinguishment of debt |
(10,661 | ) | (10,661 | ) | ||||||||||||||||
| Intercompany (charges) credits |
(124,876 | ) | 13,518 | 111,358 | — | |||||||||||||||
| Other—net |
12,403 | 164 | — | 12,567 | ||||||||||||||||
| INCOME (LOSS) FROM CONTINUING OPERATIONS BEFORE INCOME TAXES |
124,519 | 14,022 | (99,690 | ) | 38,851 | |||||||||||||||
| INCOME TAX PROVISION (BENEFIT) |
38,841 | 5,749 | (38,929 | ) | 5,661 | |||||||||||||||
| INCOME (LOSS) FROM CONTINUING OPERATIONS |
85,678 | 8,273 | (60,761 | ) | 33,190 | |||||||||||||||
| EQUITY INCOME FROM SUBSIDIARIES |
93,951 | $ | (93,951 | ) | — | |||||||||||||||
| INCOME FROM DISCONTINUED OPERATIONS, NET OF INCOME TAXES |
3,083 | 3,083 | ||||||||||||||||||
| NET INCOME |
$ | 85,678 | $ | 8,273 | $ | 36,273 | $ | (93,951 | ) | $ | 36,273 | |||||||||
74
Table of Contents
CONDENSED CONSOLIDATING STATEMENT OF OPERATIONS
FOR THE YEAR ENDED DECEMBER 27, 2009
| Guarantor Subsidiaries |
Non-Guarantor Subsidiaries |
Parent |
Eliminations |
Consolidated |
||||||||||||||||
| REVENUES—NET: |
||||||||||||||||||||
| Advertising |
$ | 1,143,129 | $ | 1,143,129 | ||||||||||||||||
| Circulation |
278,256 | 278,256 | ||||||||||||||||||
| Other |
49,605 | $ | 594 | 50,199 | ||||||||||||||||
| Total revenues—net |
1,470,990 | 594 | 1,471,584 | |||||||||||||||||
| OPERATING EXPENSES: |
||||||||||||||||||||
| Compensation |
582,123 | 118 | 582,241 | |||||||||||||||||
| Newsprint and supplements |
167,164 | 167,164 | ||||||||||||||||||
| Depreciation and amortization |
142,889 | 142,889 | ||||||||||||||||||
| Other operating expenses |
379,145 | 90 | $ | 1,543 | 380,778 | |||||||||||||||
| Total operating expenses |
1,271,321 | 208 | 1,543 | 1,273,072 | ||||||||||||||||
| OPERATING INCOME (LOSS) |
199,669 | 386 | (1,543 | ) | 198,512 | |||||||||||||||
| NON-OPERATING (EXPENSES) INCOME: |
||||||||||||||||||||
| Interest income (expense ) |
1,928 | (129,204 | ) | (127,276 | ) | |||||||||||||||
| Write-down of investments and land |
(2,022 | ) | (26,300 | ) | (28,322 | ) | ||||||||||||||
| Gain on extinguishment of debt |
44,117 | 44,117 | ||||||||||||||||||
| Intercompany (charges) credits |
(121,975 | ) | 13,518 | 108,457 | — | |||||||||||||||
| Other—net |
2,427 | (127 | ) | 80 | 2,380 | |||||||||||||||
| INCOME (LOSS) FROM CONTINUING OPERATIONS BEFORE INCOME TAXES |
80,027 | 13,777 | (4,393 | ) | 89,411 | |||||||||||||||
| INCOME TAX PROVISION (BENEFIT) |
25,111 | 5,649 | (1,613 | ) | 29,147 | |||||||||||||||
| INCOME (LOSS) FROM CONTINUING OPERATIONS |
54,916 | 8,128 | (2,780 | ) | 60,264 | |||||||||||||||
| EQUITY INCOME FROM SUBSIDIARIES |
63,044 | $ | (63,044 | ) | — | |||||||||||||||
| LOSS FROM DISCONTINUED OPERATIONS, NET OF INCOME TAXES |
(6,174 | ) | (6,174 | ) | ||||||||||||||||
| NET INCOME |
$ | 54,916 | $ | 8,128 | $ | 54,090 | $ | (63,044 | ) | $ | 54,090 | |||||||||
75
Table of Contents
CONDENSED CONSOLIDATING STATEMENT OF OPERATIONS
FOR THE YEAR ENDED DECEMBER 28, 2008
| Guarantor Subsidiaries |
Non-Guarantor Subsidiaries |
Parent |
Eliminations |
Consolidated |
||||||||||||||||
| REVENUES—NET: |
||||||||||||||||||||
| Advertising |
$ | 1,568,323 | $ | 443 | $ | 1,568,766 | ||||||||||||||
| Circulation |
265,550 | 34 | 265,584 | |||||||||||||||||
| Other |
65,280 | 826 | 66,106 | |||||||||||||||||
| Total revenues—net |
1,899,153 | 1,303 | 1,900,456 | |||||||||||||||||
| OPERATING EXPENSES: |
||||||||||||||||||||
| Compensation |
822,231 | 540 | 822,771 | |||||||||||||||||
| Newsprint and supplements |
252,546 | 53 | 252,599 | |||||||||||||||||
| Depreciation and amortization |
142,948 | 142,948 | ||||||||||||||||||
| Other operating expenses |
459,004 | 115 | $ | 1,854 | 460,973 | |||||||||||||||
| Masthead impairment |
59,563 | 59,563 | ||||||||||||||||||
| Total operating expenses |
1,736,292 | 708 | 1,854 | 1,738,854 | ||||||||||||||||
| OPERATING INCOME (LOSS) |
162,861 | 595 | (1,854 | ) | 161,602 | |||||||||||||||
| NON-OPERATING (EXPENSES) INCOME: |
||||||||||||||||||||
| Interest expense |
(2,933 | ) | (154,452 | ) | (157,385 | ) | ||||||||||||||
| Equity (loss) income in unconsolidated companies-net |
(14,606 | ) | 585 | (14,021 | ) | |||||||||||||||
| Write-down of investments |
(26,462 | ) | (26,462 | ) | ||||||||||||||||
| Gain on sale of SP Newsprint Company |
34,417 | 34,417 | ||||||||||||||||||
| Gain on extinguishment of debt |
21,026 | 21,026 | ||||||||||||||||||
| Intercompany (charges) credits |
(195,749 | ) | 12,518 | 183,231 | — | |||||||||||||||
| Other—net |
1,964 | 944 | 2,908 | |||||||||||||||||
| INCOME (LOSS) FROM CONTINUING OPERATIONS BEFORE INCOME TAXES |
(40,508 | ) | 13,698 | 48,895 | 22,085 | |||||||||||||||
| INCOME TAX PROVISION (BENEFIT) |
(4,292 | ) | 5,616 | 17,954 | 19,278 | |||||||||||||||
| INCOME (LOSS) FROM CONTINUING OPERATIONS |
(36,216 | ) | 8,082 | 30,941 | 2,807 | |||||||||||||||
| EQUITY (LOSS) FROM SUBSIDIARIES |
(28,134 | ) | $ | 28,134 | — | |||||||||||||||
| LOSS FROM DISCONTINUED OPERATIONS, NET OF INCOME TAXES |
(6,758 | ) | (6,758 | ) | ||||||||||||||||
| NET INCOME (LOSS) |
$ | (36,216 | ) | $ | 8,082 | $ | (3,951 | ) | $ | 28,134 | $ | (3,951 | ) | |||||||
76
Table of Contents
CONDENSED CONSOLIDATING STATEMENT OF CASH FLOWS
FOR THE YEAR ENDED DECEMBER 26, 2010 (UNAUDITED)
| Guarantor Subsidiaries |
Non-Guarantor Subsidiaries |
Parent |
Consolidated |
|||||||||||||
| CASH FROM OPERATING ACTIVITIES |
$ | 225,195 | $ | — | $ | — | $ | 225,195 | ||||||||
| CASH FROM INVESTING ACTIVITIES: |
||||||||||||||||
| Dividend from equity investment |
24,274 | 24,274 | ||||||||||||||
| Other |
(6,796 | ) | (6,796 | ) | ||||||||||||
| Net cash from investing activities |
17,478 | 17,478 | ||||||||||||||
| CASH FLOWS FROM FINANCING ACTIVITIES: |
||||||||||||||||
| Proceeds from issuance of notes |
864,710 | 864,710 | ||||||||||||||
| Net repayments of revolving bank debt |
(330,700 | ) | (330,700 | ) | ||||||||||||
| Repayment of term debt |
(546,800 | ) | (546,800 | ) | ||||||||||||
| Purchase of notes |
(31,929 | ) | (31,929 | ) | ||||||||||||
| Purchase of public notes and related expenses |
(155,410 | ) | (155,410 | ) | ||||||||||||
| Payment of financing costs |
(31,986 | ) | (31,986 | ) | ||||||||||||
| Other-principally stock transactions |
793 | 793 | ||||||||||||||
| Net cash from financing activities |
(231,322 | ) | (231,322 | ) | ||||||||||||
| NET CHANGE IN CASH |
11,351 | 11,351 | ||||||||||||||
| CASH AT BEGINNING OF YEAR |
6,157 | 6,157 | ||||||||||||||
| CASH AT END OF YEAR |
$ | 17,508 | $ | — | $ | — | $ | 17,508 | ||||||||
CONDENSED CONSOLIDATING STATEMENT OF CASH FLOWS
FOR THE YEAR ENDED DECEMBER 27, 2009
| Guarantor Subsidiaries |
Non-Guarantor Subsidiaries |
Parent |
Consolidated |
|||||||||||||
| NET CASH FROM OPERATING ACTIVITIES |
$ | 123,166 | $ | — | $ | — | $ | 123,166 | ||||||||
| CASH FROM INVESTING ACTIVITIES |
(105 | ) | (105 | ) | ||||||||||||
| CASH FLOWS FROM FINANCING ACTIVITIES: |
||||||||||||||||
| Net repayments of revolving bank debt |
(61,000 | ) | (61,000 | ) | ||||||||||||
| Extinguishment of public notes |
(38,082 | ) | (38,082 | ) | ||||||||||||
| Other-net |
(22,820 | ) | (22,820 | ) | ||||||||||||
| Net cash from financing activities |
(121,902 | ) | (121,902 | ) | ||||||||||||
| NET CHANGE IN CASH |
1,159 | 1,159 | ||||||||||||||
| CASH AT BEGINNING OF YEAR |
4,998 | 4,998 | ||||||||||||||
| CASH AT END OF YEAR |
$ | 6,157 | $ | — | $ | — | $ | 6,157 | ||||||||
77
Table of Contents
CONDENSED CONSOLIDATING STATEMENT OF CASH FLOWS
FOR THE YEAR ENDED DECEMBER 28, 2008
| Guarantor Subsidiaries |
Non-Guarantor Subsidiaries |
Parent |
Consolidated |
|||||||||||||
| CASH FLOWS FROM OPERATING ACTIVITIES: |
||||||||||||||||
| Cash from operating activities of continuing operations |
$ | 194,302 | $ | — | $ | — | $ | 194,302 | ||||||||
| Cash from operating activities of discontinued operations |
187,567 | 187,567 | ||||||||||||||
| Net cash from operating activities |
381,869 | 381,869 | ||||||||||||||
| CASH FLOWS FROM INVESTING ACTIVITIES: |
||||||||||||||||
| Proceeds from sale of equipment and other |
33,172 | 33,172 | ||||||||||||||
| Proceeds from sale of investments |
63,141 | 63,141 | ||||||||||||||
| Other |
(22,273 | ) | (22,273 | ) | ||||||||||||
| Net cash from investing activities |
74,040 | 74,040 | ||||||||||||||
| CASH FLOWS FROM FINANCING ACTIVITIES: |
||||||||||||||||
| Net repayments of revolving bank debt |
(116,900 | ) | (116,900 | ) | ||||||||||||
| Extinguishment of public notes |
(300,871 | ) | (300,871 | ) | ||||||||||||
| Payment of dividends |
(51,828 | ) | (51,828 | ) | ||||||||||||
| Other-net |
(7,128 | ) | (7,128 | ) | ||||||||||||
| Net cash from financing activities |
(476,727 | ) | (476,727 | ) | ||||||||||||
| NET CHANGE IN CASH |
(20,818 | ) | (20,818 | ) | ||||||||||||
| CASH AT BEGINNING OF YEAR |
25,816 | 25,816 | ||||||||||||||
| CASH AT END OF YEAR |
$ | 4,998 | $ | — | $ | — | $ | 4,998 | ||||||||
| NOTE 12. | QUARTERLY RESULTS OF OPERATIONS (UNAUDITED) |
The Company’s business is somewhat seasonal with peak revenues and profits generally occurring in the second and fourth quarters of each year as a result of increased advertising activity during the holiday seasons. The first quarter is historically the slowest quarter for revenues and profits. The Company’s quarterly results are summarized as follows (in thousands, except per share amounts):
| 1st Quarter |
2nd Quarter |
3rd Quarter |
4th Quarter |
|||||||||||||
| 2010 |
||||||||||||||||
| Net revenues |
$ | 335,565 | $ | 342,030 | $ | 327,710 | $ | 369,927 | ||||||||
| Operating income |
46,591 | 57,097 | 50,339 | 84,856 | ||||||||||||
| Income (loss) from continuing operations |
(1,958 | ) | 7,278 | 12,081 | 15,789 | |||||||||||
| Income (loss) from discontinued operations |
2,203 | — | (161 | ) | (917 | ) | ||||||||||
| Income (loss) from continuing operations per common share |
(0.02 | ) | 0.09 | 0.14 | 0.19 | |||||||||||
| Income (loss) from discontinued operations per common share |
0.05 | — | — | (0.01 | ) | |||||||||||
| 2009 |
||||||||||||||||
| Net revenues |
$ | 365,625 | $ | 365,335 | $ | 347,390 | $ | 393,234 | ||||||||
| Operating income (loss) |
(10,862 | ) | 44,788 | 60,367 | 104,219 | |||||||||||
| Income (loss) from continuing operations |
(37,724 | ) | 42,003 | 23,601 | 32,384 | |||||||||||
| Income (loss) from discontinued operations |
209 | 210 | (38 | ) | (6,555 | ) | ||||||||||
| Income (loss) from continuing operations per common share |
(0.45 | ) | 0.50 | 0.28 | 0.38 | |||||||||||
| Loss from discontinued operations per common share |
— | — | — | (.08 | ) | |||||||||||
78
Table of Contents
| NOTE 13. | SUBSEQUENT EVENTS |
Purchase of Debt Securities: In February 2011 the Company purchased $28.4 million aggregate principal amount of its outstanding debt securities for $28.4 million in cash generated by operations and partially obtained from its Credit Agreement. The Company purchased outstanding principal amount of debt securities as follows: $0.4 million of its 2014 senior notes, $8.0 million of unsecured notes maturing in 2014, $10.0 million of unsecured notes maturing in 2017 and $10.0 million of its secured notes maturing in 2017. As of February 25, 2011, the Company had $26.1 million of revolving loans outstanding and had $77.2 million available under its revolving credit facilities, net of outstanding letters of credit.
Contribution of Real Property to Qualified Defined Benefit Plan: On January 14, 2011, the Company contributed company-owned real property from seven locations to its qualified defined benefit pension plan. The pension plan obtained independent appraisals of the property, and based on these appraisals the plan recorded the contribution (the fair value of the property) at $49.6 million on January 14, 2011.
The Company has entered into leases for the contributed properties for 10 years at an annual rent of approximately $4.0 million and expects to continue to use the properties in its newspaper operations at the seven locations. The properties will be managed on behalf of the pension plan by an independent fiduciary, and the terms of the leases were negotiated with the fiduciary.
McClatchy expects its required pension contribution under the Employee Retirement Income Security Act to be approximately $51.2 million in 2011, and the contribution of real property is expected to satisfy virtually all of the Company’s required pension contribution for fiscal 2011. The remaining required contribution, if any, will be made in cash.
The contribution and leaseback of the properties were treated as a financing transaction and accordingly, the Company will continue to depreciate the carrying value of the properties in its financial statements and no gain or loss is recognized. The $49.6 million will be recorded in other long-term obligations and will be reduced by a portion of lease payments made to the pension plan. The transaction will be recorded in the first fiscal quarter of 2011 and therefore the funded status of the Company’s qualified pension plan disclosed in Note 7 and elsewhere in these financial statements does not reflect this transaction.
79
Table of Contents
| ITEM 9. | CHANGES IN AND DISAGREEMENTS WITH ACCOUNTANTS ON ACCOUNTING AND FINANCIAL DISCLOSURE |
Not applicable.
| ITEM 9A. | CONTROLS AND PROCEDURES |
Evaluation of disclosure controls and procedures. The Company’s management evaluated, with the participation of its Chief Executive Officer (CEO) and Chief Financial Officer (CFO), the effectiveness of the design and operation of the Company’s disclosure controls and procedures (as defined in Rules 13a-15(e) or 15d-15(e) under the Securities Exchange Act of 1934, as amended) as of the end of the period covered by this Annual Report on Form 10-K. Based on this evaluation, the Company’s management, including the CEO and CFO, concluded that the Company’s disclosure controls and procedures were effective at that time to ensure that information it is required to disclose in reports that it files or submits under the Securities Exchange Act of 1934 is accumulated and communicated to its management, including its principal executive and principal financial officers, as appropriate to allow timely decisions regarding required disclosure and that such information is recorded, processed, summarized and reported within the time periods specified in the Securities and Exchange Commission Rules and Forms.
Changes in internal control over financial reporting. There was no change in the Company’s internal control over financial reporting that occurred during the last fiscal quarter of fiscal 2010 that has materially affected, or is reasonably likely to materially affect, the Company’s internal control over financial reporting.
MANAGEMENT REPORT ON INTERNAL CONTROL OVER FINANCIAL REPORTING
The management of the Company is responsible for establishing and maintaining adequate internal control over financial reporting for the Company. The Company’s internal control system over financial reporting is designed to provide reasonable assurance regarding the preparation and fair presentation of the Company’s financial statements presented in accordance with generally accepted accounting principles in the United States of America.
An internal control system over financial reporting has inherent limitations and may not prevent or detect misstatements. Therefore, even those systems determined to be effective can provide only reasonable assurance with respect to financial statement preparation and presentation.
Management of the Company assessed the effectiveness of the Company’s internal control over financial reporting as of December 26, 2010. In making this assessment, management used the criteria set forth by the Committee of Sponsoring Organizations of the Treadway Commission (COSO) in Internal Control – Integrated Framework. Based on management’s assessment and those criteria, management believes that the Company’s internal control over financial reporting was effective as of December 26, 2010.
The McClatchy Company’s independent registered public accounting firm has issued an attestation report on the Company’s internal control over financial reporting. This report appears on page 40.
| ITEM 9B. | OTHER INFORMATION |
Not Applicable.
80
Table of Contents
| ITEM 10. | DIRECTORS, EXECUTIVE OFFICERS AND CORPORATE GOVERNANCE |
Biographical information for Class A Directors, Class B Directors and executive officers contained under the captions “Nominees for Class A Directors,” “Nominees for Class B Directors” and “Other Executive Officers” under the heading “Election of Directors” in the definitive Proxy Statement for the Company’s 2011 Annual Meeting of Shareholders (the Proxy Statement) is incorporated herein by reference.
In addition, the names of each member of, as well as other information about, the Company’s standing Audit Committee contained under the caption “Audit Committee” under the heading “Corporate Governance and Board Matters” in the Proxy Statement is incorporated herein by reference.
Audit Committee Financial Experts—The Board of Directors of McClatchy has determined that S. Donley Ritchey, Chair of the Audit Committee, and Leroy Barnes Jr., Audit Committee member, are audit committee financial experts as defined by Item 407(d)(5) of Regulation S-K of the Securities and Exchange Act of 1934, as amended (the Exchange Act) and are independent as defined by the listing standards of the New York Stock Exchange.
Codes of Conduct—The Board of Directors of McClatchy has adopted a Code of Ethics for Senior Officers for the Company’s senior financial and accounting officers and the CEO. In addition, the Board has adopted a Code of Business Conduct and Ethics for all officers, directors and employees. The Code of Business Conduct and Ethics and the Code of Ethics for Senior Officers are available on the Company’s website at www.mcclatchy.com and are also available in print to any shareholder requesting copies by sending an email to our investor relations department at elintecum@mcclatchy.com. The Company will disclose on its website when there have been any waivers of, or amendments to, the Code of Ethics for Senior Officers.
Corporate Governance Guidelines—The Board of Directors of McClatchy has adopted Corporate Governance Guidelines which are available on the Company’s website at www.mcclatchy.com. The Guidelines are also available in print to any shareholder requesting a copy.
Policy Regarding Director Recommendations by Security Holders—Information contained under the caption “Consideration of Director Nominees” under the heading “Corporate Governance and Board Matters” in the Proxy Statement is incorporated herein by reference.
Section 16(a) Beneficial Ownership Reporting Compliance—Information contained under the heading “Section 16(a) Beneficial Ownership Reporting Compliance” in the Proxy Statement is incorporated herein by reference.
| ITEM 11. | EXECUTIVE COMPENSATION |
The information (including tables and footnotes) contained under the headings “Director Compensation” and “Executive Compensation,” in the Proxy Statement is incorporated herein by reference.
| ITEM 12. | SECURITY OWNERSHIP OF CERTAIN BENEFICIAL OWNERS AND MANAGEMENT AND RELATED STOCKHOLDER MATTERS |
The information contained under the heading “Principal Shareholders” and under the sub-heading “Securities Authorized for Issuance Under Equity Compensation Plans” of the section entitled “Executive Compensation” in the Proxy Statement is incorporated herein by reference.
81
Table of Contents
| ITEM 13. | CERTAIN RELATIONSHIPS AND RELATED TRANSACTIONS, AND DIRECTOR INDEPENDENCE |
The information contained under the headings “Certain Relationships and Related Transactions” and under subheading “Board Independence” of the section entitled “Corporate Governance and Board Matters” in the Proxy Statement is incorporated herein by reference.
| ITEM 14. | PRINCIPAL ACCOUNTANT FEES AND SERVICES |
Information regarding principal accounting fees and services is set forth under the headings “Fees Billed to McClatchy by Deloitte & Touche LLP” and “Audit Committee Pre-Approval Policy” under the section entitled “Ratification of Deloitte & Touche LLP as McClatchy’s Independent Registered Public Accounting Firm” in the Proxy Statement, which information is incorporated herein by reference.
82
Table of Contents
| ITEM 15. | EXHIBITS AND FINANCIAL STATEMENT SCHEDULES |
| (a)&(c) | Financial Statements and Financial Statement Schedules filed as a part of this Report are listed in the Index to Financial Statements and Financial Statement Schedules on page 39 hereof. | |
| (b) | Exhibits filed as part of this Report are listed in the Exhibit Index beginning on page 86 hereof. | |
83
Table of Contents
SIGNATURES
Pursuant to the requirements of Section 13 or 15(d) of the Securities Exchange Act of 1934, the registrant has duly caused this report to be signed on its behalf by the undersigned, thereunto duly authorized.
| The McClatchy Company | ||
| By: |
/s/ GARY B. PRUITT | |
| Gary B. Pruitt, Chairman, President and Chief Executive Officer | ||
Date March 4, 2011
Pursuant to the requirements of the Securities Exchange Act of 1934, this report has been signed below by the following persons on behalf of the Registrant and in the capacities and on the dates indicated.
| Principal Executive Officer: | ||
| By: |
/s/ GARY B. PRUITT | |
| Gary B. Pruitt, Chairman of the Board, President, Chief Executive Officer and Director | ||
Date: March 4, 2011
| Principal Financial Officer: | ||
| By: |
/s/ PATRICK J. TALAMANTES | |
| Patrick J. Talamantes, Vice President, Finance and Chief Financial Officer | ||
Date: March 4, 2011
| Principal Accounting Officer: | ||
| By: |
/s/ HAI NGUYEN | |
| Hai Nguyen, Controller | ||
Date: March 4, 2011
| Directors: | ||
| By: |
/s/ ELIZABETH BALLANTINE | |
| Elizabeth Ballantine, Director | ||
Date: March 4, 2011
| By: |
/s/ LEROY BARNES, JR. | |
| Leroy Barnes, Jr., Director | ||
Date: March 4, 2011
84
Table of Contents
| Directors (continued): | ||
| By: |
/s/ MOLLY MALONEY EVANGELISTI | |
| Molly Maloney Evangelisti, Director | ||
Date March 4, 2011
| By: |
/s/ KATHLEEN FOLEY FELDSTEIN | |
| Kathleen Foley Feldstein, Director | ||
| Date: March 4, 2011 | ||
| By: |
/s/ R. LARRY JINKS | |
| R. Larry Jinks, Director | ||
| Date: March 4, 2011 | ||
| By: |
/s/ BROWN MCCLATCHY MALONEY | |
| Brown McClatchy Maloney, Director | ||
| Date: March 4, 2011 | ||
| By: |
/s/ KEVIN S. MCCLATCHY | |
| Kevin S. McClatchy, Director | ||
| Date: March 4, 2011 | ||
| By: |
/s/ WILLIAM MCCLATCHY | |
| William McClatchy, Director | ||
| Date: March 4, 2011 | ||
| By: |
/s/ THEODORE R. MITCHELL | |
| Theodore R. Mitchell, Director | ||
| Date: March 4, 2011 | ||
| By: |
/s/ S. DONLEY RITCHEY | |
| S. Donley Ritchey, Director | ||
| Date: March 4, 2011 | ||
| By: |
/s/ FREDERICK R. RUIZ | |
| Frederick R. Ruiz, Director | ||
| Date: March 4, 2011 | ||
85
Table of Contents
TABLE OF EXHIBITS
| Exhibit |
Description | |
| 2.1* | Agreement and Plan of Merger, dated March 12, 2006, between the Company and Knight-Ridder, Inc., included as Exhibit 2.1 in the Company’s Current Report on Form 8-K filed March 12, 2006. | |
| 3.1* | The Company’s Restated Certificate of Incorporation dated June 26, 2006, included as Exhibit 3.1 in the Company’s Quarterly Report on Form 10-Q for the quarter ended June 25, 2006. | |
| 3.2* | The Company’s Bylaws as amended and restated effective July 23, 2008, included as Exhibit 3.2 in the Company’s Current Report on Form 8-K filed July 28, 2008. | |
| 4.1* | Form of Physical Note for Commercial Paper Program included as Exhibit 4.1 to the Company’s Quarterly Report on Form 10-Q for the quarter ended June 27, 2004. | |
| 10.1* | Stock Purchase Agreement by and between The McClatchy Company and Snowboard Acquisition Corporation, dated December 26, 2006, included as Exhibit 2.1 to the Company’s Current Report on Form 8-K filed December 26, 2006. | |
| 10.2* | Credit Agreement dated June 27, 2006, by and among the Company, lenders party thereto, Bank of America, N.A. as Administrative Agent, Swing Line Lender and Letter of Credit Issuer, JPMorgan Chase Bank as Syndication Agent and Banc of America Securities LLC and JPMorgan Securities Inc. as Joint Lead Arrangers and Joint Book Managers, included as Exhibit 10.2 in the Company’s Quarterly Report on Form 10-Q filed for the quarter ending on June 25, 2006. | |
| 10.3* | Amendment No. 1 to Credit Agreement dated March 28, 2007, by and between The McClatchy Company and Bank of America, N.A., as Administrative Agent, included as Exhibit 99.1 in the Company’s Current Report on Form 8-K filed April 2, 2007. | |
| 10.4* | Amendment No. 2 to Credit Agreement dated July 30, 2007, by and between The McClatchy Company and Bank of America, N.A., as Administrative Agent, included as Exhibit 10.1 in the Company’s Current Report on Form 8-K filed July 31, 2007. | |
| 10.5* | Amendment No. 3 to Credit Agreement dated March 28, 2008, by and between The McClatchy Company and Bank of America, N.A., as Administrative Agent, included as Exhibit 10.1 in the Company’s Current Report on Form 8-K filed March 31, 2008. | |
| 10.6* | Amendment No. 4 to Credit Agreement dated as of September 26, 2008, by and among The McClatchy Company, the lenders under its Credit Agreement dated June 27, 2006, and amended on March 28, 2007, July 19, 2007, and March 28, 2008 (the “Credit Agreement”) by and among The McClatchy Company, Bank of America, N.A., as Administrative Agent, Swing Line Lender and L/C Issuer, JPMorgan Chase Bank, N.A., as Syndication Agent, and other lenders thereto and Bank of America, N.A., as Administrative Agent, included as Exhibit 10.1 to the Company’s Current Report on Form 8-K filed on September 30, 2008. | |
| 10.7* | Amendment No. 5 to Credit Agreement dated May 20, 2009, by and between The McClatchy Company and Bank of America, N.A., as Administrative Agent, included as Exhibit 10.1 in the Company’s Current Report on Form 8-K filed May 21, 2009. | |
| 10.8* | Amended and Restated Credit Agreement, dated as of February 11, 2010, among the Company, the lenders from time to time party thereto, Bank of America, N.A., Administrative Agent, Swing Line Lender and L/C Issuer included as Exhibit 10.1 in the Company’s Form 8-K filed on February 17, 2010. | |
| 10.9* | Amended and Restated Guaranty dated as of September 26, 2008, executed by certain subsidiaries of The McClatchy Company in favor of the lenders under the Credit Agreement, included as Exhibit 10.3 to the Company’s Current Report on Form 8-K filed on September 30, 2008. | |
86
Table of Contents
| Exhibit |
Description | |
| 10.10* | Security Agreement dated as of September 26, 2008, executed by The McClatchy Company and certain of its subsidiaries in favor of Bank of America, N.A., as Administrative Agent, included as Exhibit 10.2 to the Company’s Current Report on Form 8-K filed on September 30, 2008. | |
| 10.11* | General Continuing Guaranty dated May 4, 2007, by each Material Subsidiary in favor of the Lenders party to the Credit Agreement dated June 27, 2006, by and between The McClatchy Company, the Lenders and Bank of America, N.A., as Administrative Agent, included as Exhibit 10.3 in the Company’s Quarterly Report on Form 10-Q for the quarter ending on April 1, 2007. | |
| 10.12* | Second Supplemental Indenture dated June 27, 2006, between the Company and Knight-Ridder, Inc. included as Exhibit 10.3 in the Company’s Quarterly Report on Form 10-Q filed for the quarter ending on June 25, 2006. | |
| 10.13* | Fourth Supplemental Indenture dated June 27, 2006, between the Company and Knight-Ridder, Inc. included as Exhibit 10.4 in the Company’s Quarterly Report on Form 10-Q filed for the quarter ending on June 25, 2006. | |
| 10.14* | Contract for Purchase and Sale of Real Property by and between The Miami Herald Publishing Company and Richmond, Inc. and Knight Ridder, Inc. and Citisquare Group, LLC, dated March 3, 2005, included as Exhibit 10.23 in the Company’s Quarterly Report on Form 10-Q filed for the quarter ending July 1, 2007. | |
| 10.15* | Amendment to Contract for Purchase and Sale of Real Property by and between The Miami Herald Publishing Company and Richmond, Inc. and Knight Ridder, Inc. and Citisquare Group, LLC, dated March 3, 2005, included as Exhibit 10.24 in the Company’s Quarterly Report on Form 10-Q filed for the quarter ending July 1, 2007. | |
| 10.16* | Third Amendment to Contract for Purchase and Sale of Real Property dated as of December 30, 2008, by and between The McClatchy Company, a Delaware corporation, Richwood, Inc., a Florida corporation, and Citisquare Group, LLC, a Florida limited liability company included as Exhibit 10.1 in the Company’s Current Report on Form 8-K filed on January 5, 2009. | |
| 10.17* | Fourth Amendment to Contract for Purchase and Sale of Real Property dated as of December 31, 2009, by and between The McClatchy Company, a Delaware corporation, Richwood, Inc., a Florida corporation, and Citisquare Group, LLC, a Florida limited liability company included as Exhibit 10.1 in the Company’s Current Report on Form 8-K filed on January 6, 2010. | |
| 10.18* | Purchase Agreement, dated February 4, 2010, by and among the Company, certain of the Company’s subsidiaries and J.P. Morgan Securities Inc. as Representative of the several Initial Purchasers included as Exhibit 10.1 in the Company’s Current Report on Form 8-K filed on February 9, 2010. | |
| 10.19* | Indenture, dated February 11, 2010, among The McClatchy Company, the subsidiary guarantors party thereto and The Bank of New York Mellon Trust Company, N.A. relating to the 11.50% Senior Secured Notes due 2017 included as Exhibit 4.1 in the Company’s Current Report on Form 8-K filed on February 17, 2010. | |
| 10.20* | Registration Rights Agreement, dated February 11, 2010, between The McClatchy Company and J.P. Morgan Securities Inc., relating to the 11.50% Senior Secured Notes due 2017 included as Exhibit 4.2 in the Company’s Current Report on Form 8-K filed on February 17, 2010. | |
| **10.21* | The McClatchy Company Management by Objective Plan Description included as Exhibit 10.4 in the Company’s Report filed on Form 10-K for the year ending December 30, 2000. | |
| **10.22* | The Company’s Amended and Restated CEO Bonus Plan, included as Exhibit 10.27 in the Company’s Quarterly Report on Form 10-Q for the quarter ending June 29, 2008. | |
87
Table of Contents
| Exhibit |
Description | |
| **10.23* | 2010 Senior Executive Retention Bonus Plan included as Exhibit 10.1 to the Company’s Current Report on Form 8-K filed on January 29, 2010. | |
| **10.24* | The Company’s Amended and Restated Long-Term Incentive Plan included as Exhibit 99.1 to the Company’s Current Report on Form 8-K filed May 23, 2005. | |
| **10.25* | Amendment No. 1 to the Company’s Amended and Restated Long-Term Incentive Plan, included as Exhibit 10.26 in the Company’s Quarterly Report on Form 10-Q for the quarter ending June 29, 2008. | |
| **10.26* | Amended and Restated Supplemental Executive Retirement Plan included as Exhibit 10.4 to the Company’s Report on Form 10-K for the year ending December 29, 2002. | |
| **10.27* | Amendment Number 1 to The McClatchy Company Supplemental Executive Retirement Plan included as Exhibit 10.1 on the Company’s Current Report on Form 8-K filed on February 10, 2009. | |
| **10.28* | The McClatchy Company Benefit Restoration Plan included as Exhibit 10.3 on the Company’s Current Report on Form 8-K filed on February 10, 2009. | |
| **10.29* | The McClatchy Company Bonus Recognition Plan included as Exhibit 10.4 on the Company’s Current Report on Form 8-K filed on February 10, 2009. | |
| **10.30* | Amended and Restated 1994 Stock Option Plan included as Exhibit 10.15 to the Company’s Quarterly Report on Form 10-Q filed for the Quarter Ending on July 1, 2001. | |
| **10.31* | The Company’s 2004 Stock Incentive Plan, as amended and restated included as Exhibit 10.25 in the Company’s Quarterly Report on Form 10-Q filed for the quarter ending June 29, 2008. | |
| **10.32* | Form of Chief Executive Stock Appreciation Rights Agreement related to the Company’s 2004 Stock Incentive Plan included as Exhibit 10.25 in the Company’s Report on Form 10-K for the year ending December 30, 2007. | |
| **10.33* | Form of 2004 Stock Incentive Plan Nonqualified Stock Option Agreement included as Exhibit 99.1 to the Company’s Current Report on Form 8-K filed December 16, 2004. | |
| **10.34* | Form of Restricted Stock Agreement related to the Company’s 2004 Stock Incentive Plan, included as Exhibit 99.1 to the Company’s Current Report on Form 8-K filed January 28, 2005. | |
| **10.35* | Form of Restricted Stock Unit Agreement related to the Company’s 2004 Stock Incentive Plan, included as Exhibit 10.1 to the Company’s Current Report on Form 8-K filed December 18, 2009. | |
| **10.36* | Amended and Restated Employment Agreement between the Company and Gary B. Pruitt dated October 22, 2003, included as Exhibit 10.10 to the Company’s Form 10-K for the year ending December 28, 2003. | |
| **10.37* | Second Amendment to Amended and Restated Employee Agreement for Mr. Pruitt included as Exhibit 10.2 on the Company’s Current Report on Form 8-K filed on February 10, 2009. | |
| **10.38* | Form of Indemnification Agreement between the Company and each of its officers and directors, included as Exhibit 99.1 to the Company’s Current Report on Form 8-K filed on May 23, 2005. | |
| **10.39* | Amended and Restated 1997 Stock Option Plan included as Exhibit 10.7 to the Company’s Report on Form 10-K for the year ending December 29, 2002. | |
| **10.40* | Amendment 1 to The McClatchy Company 1997 Stock Option Plan dated January 23, 2007 included as Exhibit 10.16 to the Company’s Report on Form 10-K for the year ending December 31, 2006. | |
88
Table of Contents
| Exhibit |
Description | |||
| **10.41* | The Company’s Amended and Restated 1990 Directors’ Stock Option Plan dated February 1, 1998 included as Exhibit 10.12 to the Company’s Report on Form 10-K for the year ending December 31, 1997. | |||
| **10.42* | The Company’s Amended and Restated 2001 Director Stock Option Plan, included as Exhibit 10.13 to the Company’s Report on Form 10-K for the year ending December 31, 2005. | |||
| **10.43* | Amendment 1 to The McClatchy Company 2001 Director Option Plan dated January 23, 2007 included as Exhibit 10.18 to the Company’s Report on Form 10-K for the year ended December 31, 2006. | |||
| **10.44* | The Company’s Amended and Restated Employee Stock Purchase Plan, included as Exhibit 10.28 in the Company’s Quarterly Report on Form 10-Q for the quarter ending June 29, 2008. | |||
| **10.45* | Separation and Release Agreement between the Company and Lynn Dickerson dated July 16, 2009, included as exhibit 10.21 to the Company’s Quarterly Report on Form 10-Q filed for the quarter ending on June 28, 2009. | |||
| 10.46* | Amendment No. 1 to the Amended and Restated Credit Agreement, dated February 11, 2010, among the Company, the lenders from time to time party thereto, Bank of America, N.A., Administrative Agent, Swing Line Lender and L/C Issuer included as exhibit 10.1 in the Company’s Current Report on Form 8-K filed on December 20, 2010. | |||
| 12 | Computation of Earnings to Fixed Charges. | |||
| 21 | Subsidiaries of the Company. | |||
| 23 | Consent of Deloitte & Touche LLP | |||
| 31.1 | Certification of the Chief Executive Officer of The McClatchy Company pursuant to Rule 13a-14(a) under the Exchange Act. | |||
| 31.2 | Certification of the Chief Financial Officer of The McClatchy Company pursuant to Rule 13a-14(a) under the Exchange Act. | |||
| 32.1 | Certification of the Chief Executive Officer of The McClatchy Company pursuant to 18 U.S.C. Section 1350. | |||
| 32.2 | Certification of the Chief Financial Officer of The McClatchy Company pursuant to 18 U.S.C. Section 1350. | |||
| * | Incorporated by reference |
| ** | Compensation plans or arrangements for the Company’s executive officers and directors |
89