Attached files
| file | filename |
|---|---|
| 8-K - FORM 8-K - Kraton Corp | d8k.htm |
 March
3, 2011 Kraton Performance Polymers, Inc.
Fourth Quarter 2010 Earnings Conference Call
Exhibit 99.1 |
 Forward-Looking Statement Disclaimer
2
This presentation may include “forward-looking statements” that reflect our plans,
beliefs, expectations and current views with respect to, among other things, future events and
financial performance. Forward-looking statements are often characterized by the use
of words such as “believes,” “estimates,” “expects,” “projects,” “may,” “intends,”
“plans” or “anticipates,” or by discussions of strategy, plans or intentions. All
forward-looking statements in this presentation are made based on management's current
expectations and estimates, which involve risks, uncertainties and other factors that could
cause actual results to differ materially from those expressed in forward- looking
statements. Readers are cautioned not to place undue reliance on forward-looking statements. These risks
and uncertainties are more fully described in “Part I. Item 1A. Risk Factors” contained in
our Annual Report on 10-K, as filed with the Securities and Exchange Commission and as
subsequently updated in our Quarterly Reports on Form 10-Q, and include risks related to:
conditions in the global economy and capital markets; our reliance on LyondellBasell Industries
for the provision of significant operating and other services; the failure of our raw materials
suppliers to perform their obligations under long-term supply agreements, or our inability to
replace or renew these agreements when they expire; limitations in the availability of raw
materials we need to produce our products in the amounts or at the prices necessary for us to
effectively and profitably operate our business; competition in our end- use markets, by
other producers of SBCs and by producers of products that can be substituted for our products; our
ability to produce and commercialize technological innovations; our ability to protect our
intellectual property, on which our business is substantially dependent; infringement of our
products on the intellectual property rights of others; seasonality in our Paving and Roofing
business; financial and operating constraints related to our substantial level of indebtedness;
product liability claims and other lawsuits arising from environmental damage or personal
injuries associated with chemical manufacturing; political and economic risks in the various countries in
which we operate; the inherently hazardous nature of chemical manufacturing; health, safety and
environmental laws, including laws that govern our employees’ exposure to chemicals deemed
harmful to humans; regulation of our customers, which could affect the demand for our products
or result in increased compliance costs; international trade, export control, antitrust, zoning
and occupancy and labor and employment laws that could require us to modify our current
business practices and incur increased costs; our relationship with our employees; loss of key
personnel or our inability to attract and retain new qualified personnel; fluctuations in currency
exchange rates ; the fact that we do not enter into long-term contracts with our customers;
a decrease in the fair value of our pension assets, which could require us to materially
increase future funding of the pension plan; and concentration of ownership among our principal
stockholders, which may prevent new investors from influencing significant corporate decisions.
We assume no obligation to update such information. Further information concerning issues that
could materially affect financial performance related to forward looking statements can be found in our periodic
filings with the Securities and Exchange Commission. |
 GAAP
Disclaimer 3
This presentation includes the use of both GAAP (generally accepted accounting
principles) and non-GAAP financial measures. The non-GAAP financial
measures are EBITDA and Adjusted EBITDA. The most directly comparable GAAP
financial measure is net income/loss. A reconciliation of the non-GAAP
financial measures used in this presentation to the most directly comparable
GAAP measure is included herein. We consider EBITDA and Adjusted EBITDA
important supplemental measures of our performance and believe they are
frequently used by investors and other interested parties in the evaluation
of companies in our industry. EBITDA and Adjusted EBITDA have limitations as
analytical tools and should not be considered in isolation or as a
substitute for analysis of our results under GAAP in the United States.
|
 Update
on 2010 Business Priorities Innovation-led Top-line
Growth
Capital Investment
Executed $56 million capex program with all projects on
schedule and within budget
Belpre IR conversion
Paulinia IRL expansion
Belpre DCS Phase II
Significant progress in evaluating options for
additional HSBC capacity
Earnings Growth
Q4 revenue up 15% y/y, net income of $10 million
2010 revenue up 27%, net income of $97 million
Q4 Adjusted EBITDA of $34 million
2010 Adjusted EBITDA of $195 million
4
Innovation volume at record level
Performance in PVC alternatives for wire & cable and
medical applications in 2010 above plan
Year end vitality index at 13% |
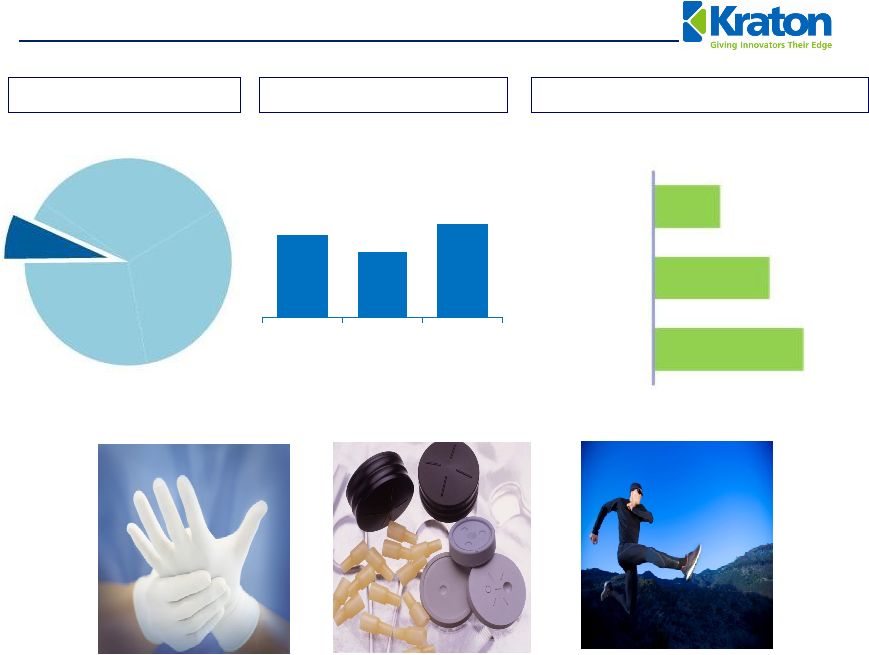
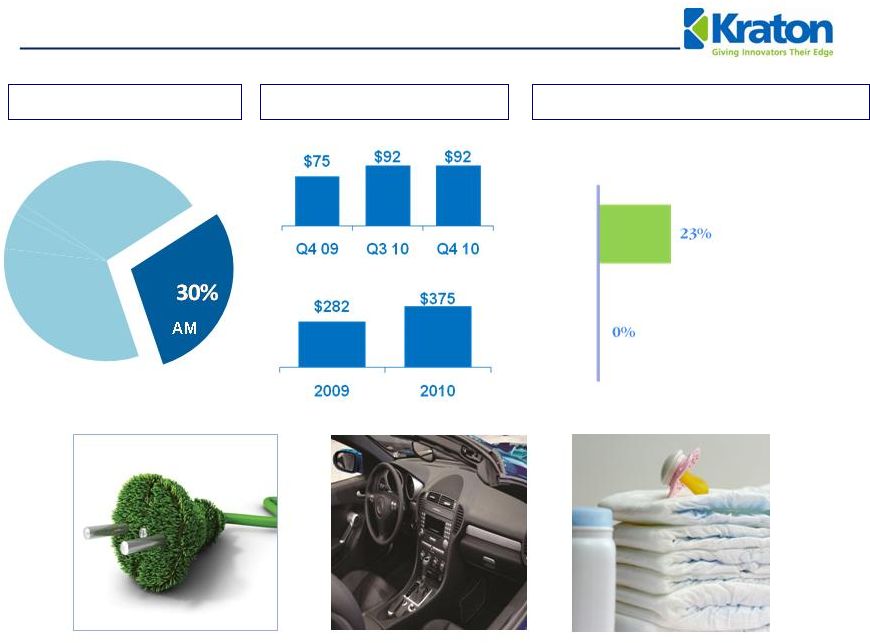 Advanced Materials End Use Review
5
2010 Revenue
Profile
Change in Sales Revenue
End Use Revenue
Change in Sales Revenue
US $ in millions
AM
Q4 2010 vs. Q4 2009
Q4 2010 vs. Q3 2010 |
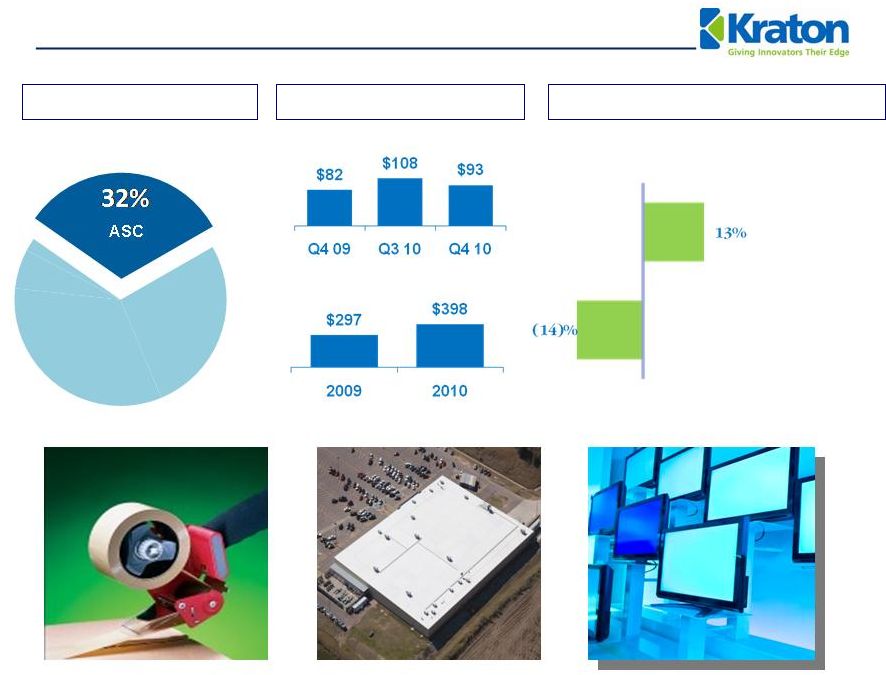 Adhesives, Sealants and Coatings End Use Review
2010 Revenue Profile
Change in Sales Revenue
6
Q4 2010 vs. Q4 2009
Q4 2010 vs. Q3 2010
End Use Revenue
US $ in millions
ASC |
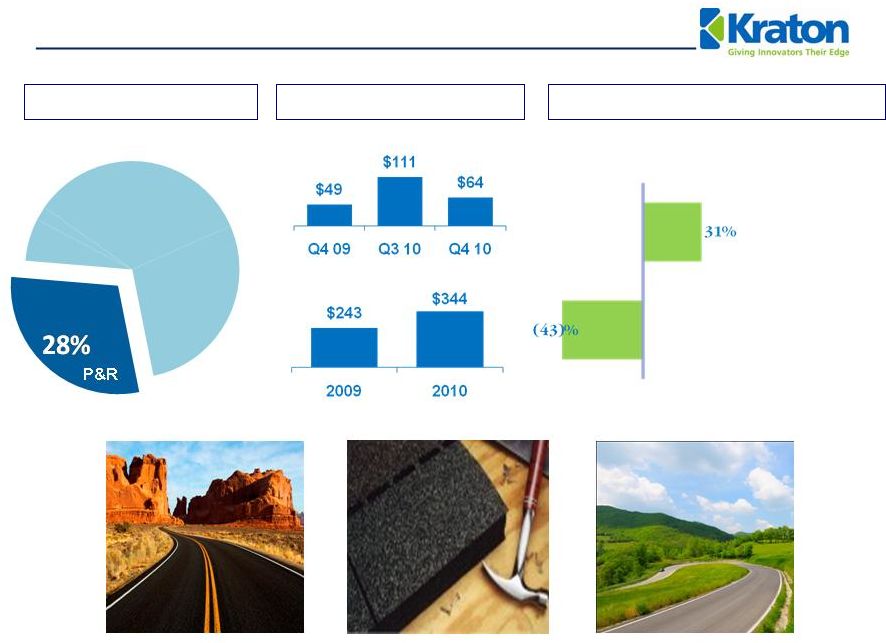 Paving
and Roofing End-Use Review 7
2010 Revenue
Profile
Change in Sales Revenue
End Use Revenue
Change in Sales Revenue
US $ in millions
P&R
Q4 2010 vs. Q4 2009
Q4 2010 vs. Q3 2010 |
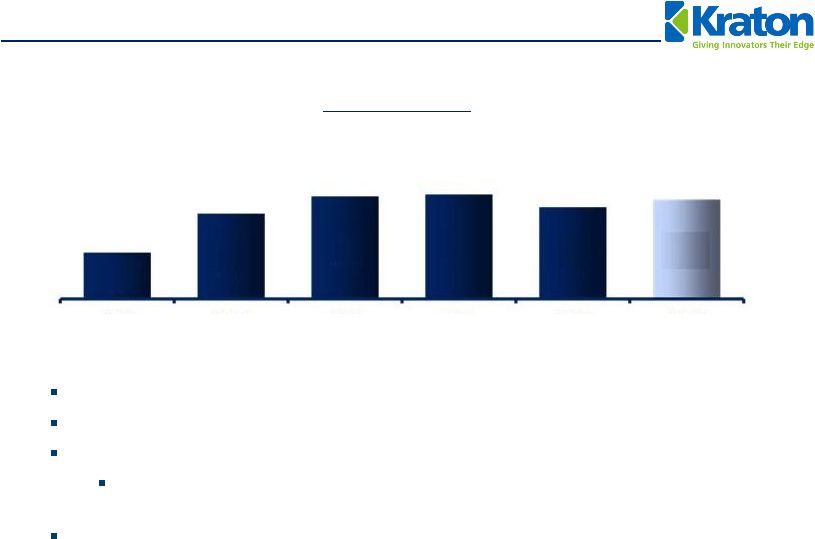
 Emerging Businesses End Use Review
8
2010 Revenue
Profile
Annual Sales Revenue
End Use Revenue
US $ in millions
US $ in millions
$24
$19
$27
Q4 09
Q3 10
Q4 10
7%EB
$35
$61
$79
2010
2009
2008 |
 Innovation-led Top Line Growth
9
Goal -
20% of revenue from innovation
Vitality Index
Innovation volume at record levels
Good technical progress on all innovation platforms
Strong performance in key projects
2010 combined revenue for wire & cable , IV films, self-adhered roofing
and protective films was up 350% from 2009.
Innovation
platforms
such
as
slush
molding
and
Nexar™
are
in
qualification
phase
6%
11%
13%
13%
14%
12%
2005
2006
2007
2008
2009
2010 |
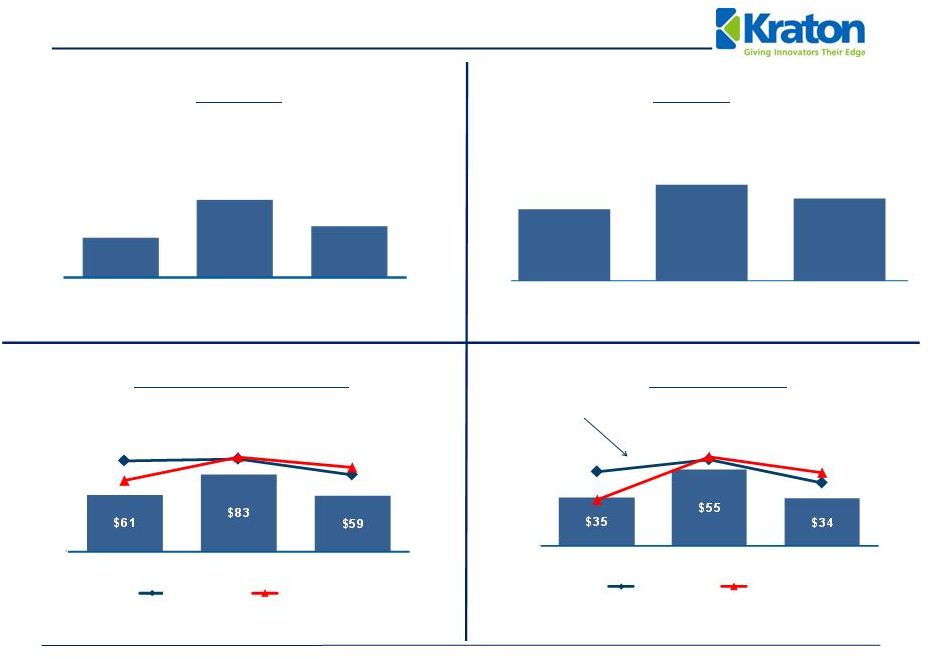 Volume (kT)
Selected Financial Trends –
Q4 2010
(1)
Q4 2009 includes by-product revenue of $12 mln associated with our
Pernis, the Netherlands facility, which was closed in Q4 2009.
(2)
Adjusted EBITDA is GAAP EBITDA excluding management fees, restructuring and
related charges, non-cash expenses, and the gain on extinguishment of
debt. 10
Revenue
(1)
(US $ in Millions)
Gross Profit and Gross Margin
(US $ in Millions)
Adjusted EBITDA
(2)
(US $ in Millions)
Adjusted
EBITDA
Margin
61
81
Volume (kT)
Revenue
(1)
(US $ in Millions)
Selected Financial Trends –
Q4 2010
(1)
Q4 2009 includes by-product revenue of $12 mln associated with our
Pernis, the Netherlands facility, which was closed in Q4 2009.
(2)
Adjusted EBITDA is GAAP EBITDA excluding management fees, restructuring and
related charges, non-cash expenses, and the gain on extinguishment of
debt. 10
Gross Profit and Gross Margin
(US $ in Millions)
Adjusted EBITDA
(2)
(US $ in Millions)
Adjusted
EBITDA
Margin
67
Q3 10
Q4 10
Q4 09
Q3 10
Q4 10
Q4 09
Q3 10
Q4 10
Q4 09
Q3 10
Q4 10
Q4 09
$251
$335
$288
24.7%
25.2%
22.6%
20.6%
24.3%
19.0%
16.4%
16.9%
13.9%
11.9%
14.0%
8.7%
Margin (FIFO)
Margin (LIFO)
Margin (FIFO)
Margin (LIFO) |
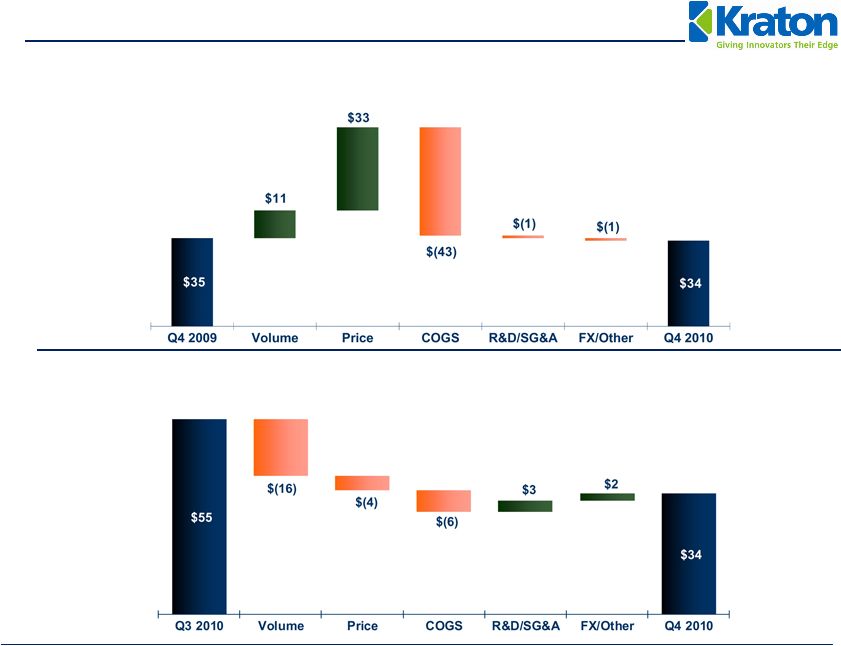
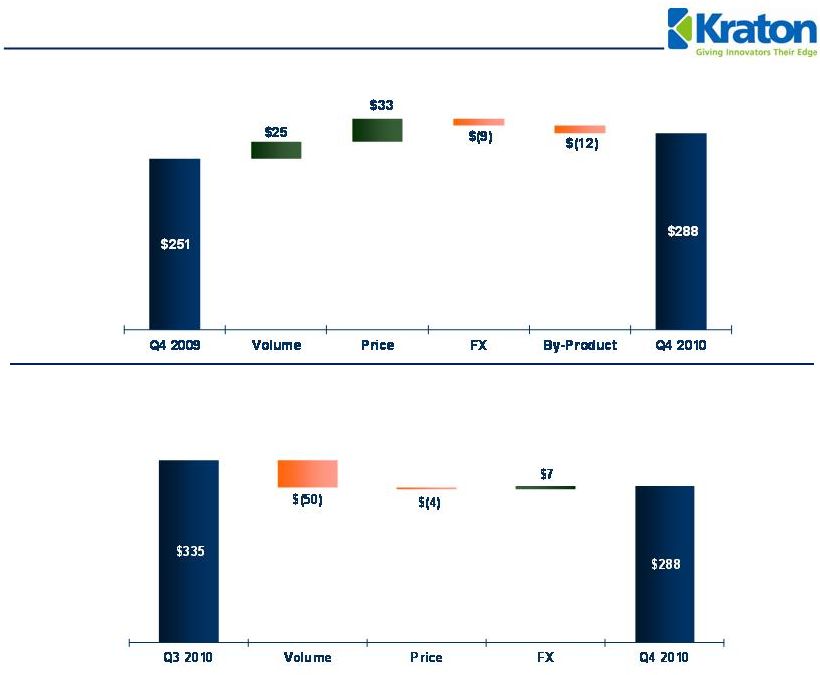 Q4
2010 Operating Revenue Walk Q4 2010 vs. Q3 2010
Q4 2010 vs. Q4 2009
US $ in millions
11 |
 Q4
2010 Adjusted EBITDA (1)
Walk
Q4 2010 vs. Q3 2010
Q4 2010 vs. Q4 2009
US $ in millions
(1)
Adjusted EBITDA is GAAP EBITDA excluding management fees, restructuring and related charges,
non-cash expenses, and the gain on extinguishment of debt.
12 |
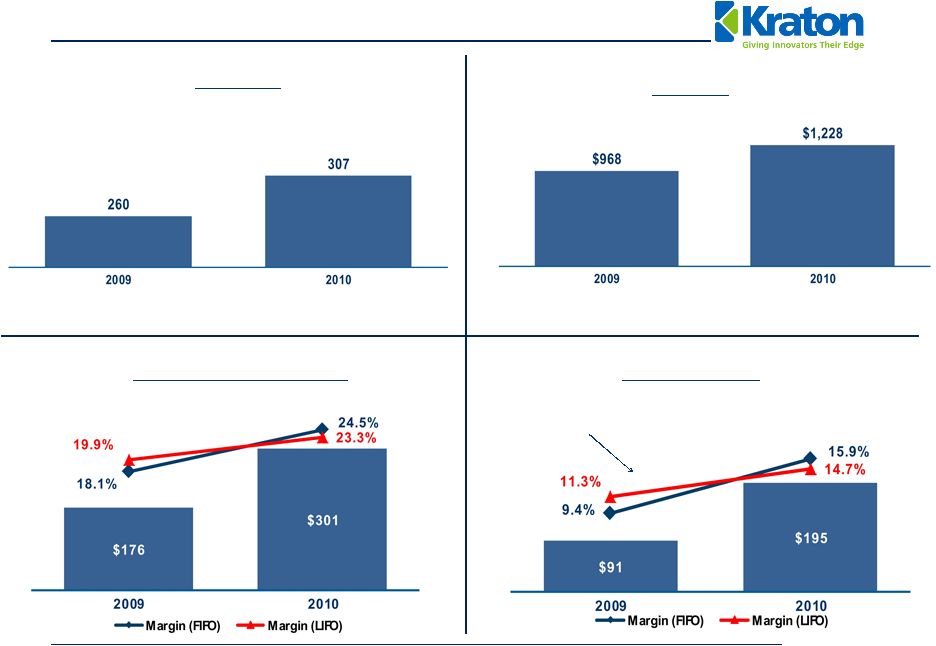 Volume (kT)
Selected Financial Trends –
2010 vs. 2009
(1)
2009 includes by-product revenue of $48 mln associated with our Pernis,
the Netherlands facility, which was closed in Q4 2009. (2)
Adjusted EBITDA is GAAP EBITDA excluding management fees, restructuring and
related charges, non-cash expenses, and the gain on extinguishment of
debt. 13
Revenue
(1)
(US $ in Millions)
Gross Profit and Gross Margin
(US $ in Millions)
Adjusted EBITDA
(2)
(US $ in Millions)
Adjusted
EBITDA
Margin |
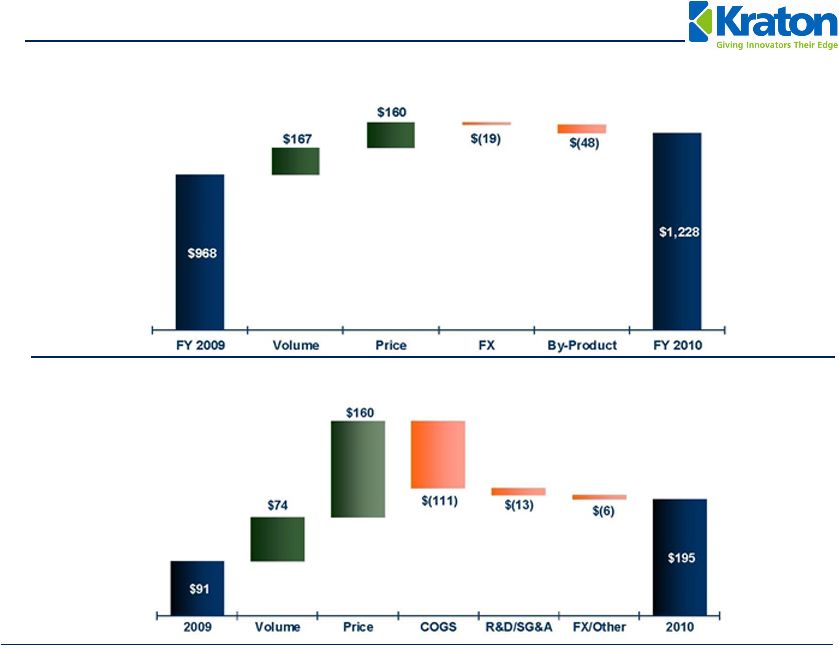 2010
Operating
Revenue
and
Adjusted
EBITDA
(1)
Walk
Operating Revenue
Adjusted EBITDA
US $ in millions
14
(1)
Adjusted EBITDA is GAAP EBITDA excluding management fees, restructuring and related charges,
non-cash expenses, and the gain on extinguishment of debt.
|
 2010
Financial Overview (1)
Adjusted EBITDA is GAAP EBITDA excluding management fees, restructuring and related charges,
non-cash expenses, and the gain on extinguishment of debt.
US $ in Thousands except per share data
15
Fourth Quarter
Full Year
2010
2009
2010
2009
Sales Volume (kT)
67
61
307
260
Total Operating Revenues
$
288,165
$
250,708
$
1,228,425
$
968,004 Cost of Goods Sold
228,793
189,840
927,932
792,472
Gross Profit
59,372
60,868
300,493
175,532
Operating expenses
Research and Development
5,947
6,097
23,628
21,212
Selling, General and Administrative
23,652
22,919
92,305
79,504
Depreciation and Amortization of Identifiable Intangibles
13,178
25,169
49,220
66,751
Gain on Extinguishment of Debt
-
-
-
23,831
Equity in Earnings of Unconsolidated Joint Venture
170
98
487
403
Interest Expense, net
5,506
9,179
23,969
33,956
Income (Loss) Before Income Taxes
11,259
(2,398)
111,858
(1,657)
Income Tax
Expense 960
(882)
15,133
(1,367)
Net Income (Loss)
$
10,299
$
(1,516)
$
96,725
$
(290) Earnings
(Loss)
per
Common
Share
-
Diluted
$
0.32
$
(0.07)
$
3.07
$
(0.01) Adjusted
EBITDA (1)
$
34,311
$
35,044
$
194,906
$
91,359 |
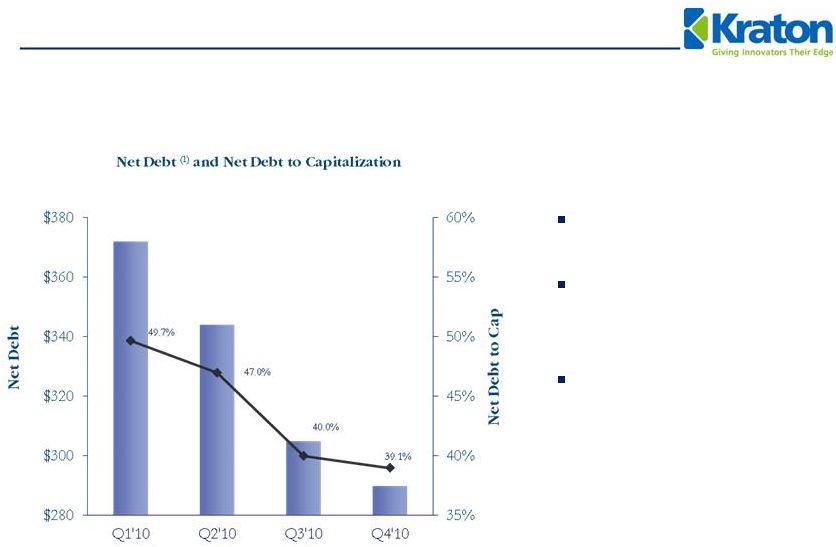 US $
in millions 16
Cash at year end of $93
million.
Net Debt-to-Capitalization
ratio of 39.1% at quarter
end.
Net Debt to Adjusted
EBITDA was 1.49x at
12/31/10.
(1)
Net debt is equal to Long-term debt, less Cash and Cash equivalents.
Balance Sheet |
 Debt
Refinancing Increased Liquidity
Attractive Interest Rate
Environment
Old Notes
8.125%
New Notes
6.750%
Extended Maturities
17
Old Revolver
$80 Million
New Revolver
$200 Million
Accordion Feature
$125 Million
Required Payments ($US Millions)
2011
2012
2013
2014
2015+
Old
$2
$109
$108
$163
---
New*
$8
$ 8
$ 11
$ 15
$358
* New bonds mature 2019 |
 Selected 2011 Estimates
Working capital (excluding cash) as a % of
revenue
25% to 27%
Capital spending
$80 to $85 million
Interest expense
(1)
~$31 million
Research & development
~$27 million
SG&A
~ $93 million
Depreciation and amortization
~$61 million
Book tax rate
(2)
~9%
18
(1)
Includes
accelerated
write-off
of
deferred
financing
costs
associated
with
the
debt
refinancing
of
$5
million. Total non-recurring items associated with the refinancing were $9
million. (2)
Q1 2011 currently expected to be ~ 14%. |
 March 3, 2011
Appendix |
 Reconciliation of Net Income/(Loss) to EBITDA and
Adjusted EBITDA
20
US $ in Thousands
Three months Ended
Three months Ended
Twelve months Ended
Twelve months Ended
12/31/2010
12/31/2009
12/31/2010
12/31/2009
Net Income (Loss)
$
10,299
$
(1,516)
$
96,725
$
(290) Add(deduct):
Interest expense, net
5,506
9,179
23,969
33,956
Income tax expense
960
(882)
15,133
(1,367)
Depreciation and amortization expenses
13,178
25,169
49,220
66,751
EBITDA
(1)
$
29,943
$
31,950
$
185,047
$
99,050 EBITDA
(1)
$
29,943
$
31,950
$
185,047
$
99,050 Add(deduct):
Management fees and expenses
-
500
-
2,000
Restructuring and related charges
3,732
2,143
6,387
9,677
Other non-cash expenses
636
451
3,472
4,463
Gain on extinguishment of debt
-
-
-
(23,831)
Adjusted
EBITDA
(2)
$
34,311
$
35,044
$
194,884
$
91,359 Restructuring and related
detail: Cost of goods sold
$
-
$
440 6,107
6,747
Research and development
-
-
-
-
Selling, general and administrative
2,717
1,703
5,371
2,930
Total restructuring and related charges
$
1,864
$
2,144
$
6,427
$
9,677 (1) The EBITDA measure is used by management to evaluate
operating performance. Management believes that EBITDA is useful to investors because it is frequently used by investors and
other interested parties in the evaluation of companies in our
industry. EBITDA is not a recognized term under GAAP and
does not purport to be an alternative to net income (loss) as an indicator of operating performance or to cash flows from operating
activities as a measure of liquidity. Since not all companies use
identical calculations, this presentation of EBITDA may not be comparable to other similarly titled measures of other
companies. Additionally, EBITDA is not intended to be a measure of free
cash flow for management's discretionary use, as it does not consider certain cash requirements such as interest
payments, tax payments and debt service requirements.
(2) Adjusted EBITDA is EBITDA excluding
management fees, restructuring and related charges, non-cash expenses, and the gain on extinguishment of debt. |
 March 3, 2011
Kraton Performance Polymers, Inc.
Fourth Quarter 2010 Earnings Conference Call |