Attached files
| file | filename |
|---|---|
| EX-10.9 - EX-10.9 - Whiting Canadian Holding Co ULC | a2202431zex-10_9.htm |
| EX-32.1 - EX-32.1 - Whiting Canadian Holding Co ULC | a2202431zex-32_1.htm |
| EX-23.1 - EX-23.1 - Whiting Canadian Holding Co ULC | a2202431zex-23_1.htm |
| EX-31.2 - EX-31.2 - Whiting Canadian Holding Co ULC | a2202431zex-31_2.htm |
| EX-31.1 - EX-31.1 - Whiting Canadian Holding Co ULC | a2202431zex-31_1.htm |
| EX-32.2 - EX-32.2 - Whiting Canadian Holding Co ULC | a2202431zex-32_2.htm |
| EX-10.8 - EX-10.8 - Whiting Canadian Holding Co ULC | a2202431zex-10_8.htm |
| EX-23.2 - EX-23.2 - Whiting Canadian Holding Co ULC | a2202431zex-23_2.htm |
| EX-99.1 - EX-99.1 - Whiting Canadian Holding Co ULC | a2202431zex-99_1.htm |
| EX-21.1 - EX-21.1 - Whiting Canadian Holding Co ULC | a2202431zex-21_1.htm |
| EX-10.10 - EX-10.10 - Whiting Canadian Holding Co ULC | a2202431zex-10_10.htm |
Use these links to rapidly review the document
TABLE OF CONTENTS
PART IV
UNITED STATES
SECURITIES AND EXCHANGE COMMISSION
Washington D.C. 20549
FORM 10-K
ANNUAL REPORT PURSUANT TO SECTION 13 OR 15(d) OF THE
SECURITIES EXCHANGE ACT OF 1934
For the fiscal year ended December 31, 2010
Commission file number: 001-32920

(Exact name of registrant as specified in its charter)
| Yukon Territory (State or other jurisdiction of incorporation or organization) |
N/A (I.R.S. Employer Identification No.) |
|
1625 Broadway, Suite 250 |
||
| Denver, Colorado 80202 | (303) 592-8075 | |
| (Address of principal executive offices) | (Registrant's telephone number, including area code) |
Securities pursuant to Section 12(b) of the Act:
| Title of Each Class | Name of Exchange on Which Registered | |
|---|---|---|
| Common Stock | NYSE Amex LLC |
Securities registered pursuant to Section 12(g) of the Act:
Title of Each Class N/A
Indicate by check mark if the registrant is a well-known seasoned issuer, as defined in Rule 405 of the Securities Act. Yes ý No o
Indicate by check mark if the registrant is not required to file reports pursuant to Section 13 or Section 15(d) of the Act. Yes o No ý
Indicate by check mark whether the registrant (1) has filed all reports required to be filed by Section 13 or 15(d) of the Securities Exchange Act of 1934 during the preceding 12 months (or for such shorter period that the registrant was required to file such reports), and (2) has been subject to such filing requirements for the past 90 days. Yes ý No o
Indicate by check mark whether the registrant has submitted electronically and posted on its corporate Web site, if any, every Interactive Data File required to be submitted and posted pursuant to Rule 405 of Regulation S-T (§ 232.405 of this chapter) during the preceding 12 months (or for such shorter period that the registrant was required to submit and post such files). Yes o No o
Indicate by check mark if disclosure of delinquent filers pursuant to Item 405 of Regulation S-K is not contained herein, and will not be contained, to the best of the registrant's knowledge, in definitive proxy or information statements incorporated by reference on Part III of this Form 10-K or any amendment to this Form10-K. o
Indicate by check mark whether the registrant is a large accelerated filer, an accelerated filer, a non-accelerated filer, or a smaller reporting company. See the definitions of "large accelerated filer, accelerated filer, and smaller reporting company" in Rule 12b-2 of the Exchange Act. (Check one):
| Large accelerated filer o | Accelerated filer ý | Non-accelerated filer o (Do not check if a smaller reporting company) |
Smaller reporting company o |
Indicate by check mark whether the registrant is a shell company (as defined in Rule 12b-2 of the Exchange Act). Yes o No ý
At June 30, 2010, the aggregate market value of the registrant's Common Stock held by non-affiliates of the registrant was approximately $381,539,663. The number of shares of the registrant's Common Stock outstanding as of March 1, 2011, was 178,548,205.
DOCUMENTS INCORPORATED BY REFERENCE
Certain portions of the registrant's definitive proxy statement to be filed with the Securities and Exchange Commission pursuant to Regulation 14A not later than April 30, 2011, in connection with the registrant's 2011 Annual Meeting of Shareholders, are incorporated herein by reference into Part III of this Annual Report on Form 10-K.
KODIAK OIL & GAS CORP.
FORM 10-K
TABLE OF CONTENTS
1
CAUTIONARY NOTE REGARDING FORWARD-LOOKING STATEMENTS
The information discussed in this annual report on Form 10-K includes "forward-looking statements" within the meaning of Section 27A of the Securities Act of 1933 (the "Securities Act") and Section 21E of the Securities Exchange Act of 1934 (the "Exchange Act"). All statements, other than statements of historical facts, included herein concerning, among other things, planned capital expenditures, increases in oil and gas production, the number of anticipated wells to be drilled after the date hereof, future cash flows and borrowings, pursuit of potential acquisition opportunities, our financial position, business strategy and other plans and objectives for future operations, are forward-looking statements. These forward-looking statements are identified by their use of terms and phrases such as "may," "expect," "estimate," "project," "plan," "believe," "intend," "achievable," "anticipate," "will," "continue," "potential," "should," "could," and similar terms and phrases. Although we believe that the expectations reflected in these forward-looking statements are reasonable, they do involve certain assumptions, risks and uncertainties. Our results could differ materially from those anticipated in these forward-looking statements as a result of certain factors, including, among others:
- •
- our ability to generate sufficient cash flow from operations, borrowings or other sources to enable us to fully develop
our undeveloped operated and non-operated acreage positions;
- •
- future capital requirements and uncertainty of obtaining additional funding on terms acceptable to us;
- •
- unsuccessful drilling and completion activities and the possibility of resulting write-downs;
- •
- geographical concentration of our operations;
- •
- constraints imposed on our business and operations by our credit agreements and our ability to generate sufficient cash
flows to repay our debt obligations;
- •
- availability of borrowings under our credit agreements;
- •
- termination fees related to drilling rig contracts;
- •
- increases in the cost of drilling, completion and gas gathering or other costs of production and operations;
- •
- our ability to successfully drill wells that produce oil or natural gas in commercially viable quantities;
- •
- failure to meet our proposed drilling schedule;
- •
- financial losses and reduced earnings related to our commodity derivative agreements, and failure to produce enough oil to
satisfy our commodity derivative agreements;
- •
- historical incurrence of losses;
- •
- adverse variations from estimates of reserves, production, production prices and expenditure requirements, and our
inability to replace our reserves through exploration and development activities;
- •
- hazardous, risky drilling operations and adverse weather and environmental conditions;
- •
- limited control over non-operated properties;
- •
- reliance on limited number of customers;
- •
- title defects to our properties and inability to retain our leases;
2
- •
- incorrect estimates of proved reserves, the presence or recoverability of estimated oil and natural gas reserves and the
actual future production rates and associated costs of properties that we acquire;
- •
- our ability to successfully develop our large inventory of undeveloped operated and non-operated acreage;
- •
- our ability to retain key members of our senior management and key technical employees, and conflicts of interests with
respect to our directors;
- •
- marketing and transportation constraints in the Williston Basin;
- •
- federal and tribal regulations and laws;
- •
- our current level of indebtedness and the effect of any increase in our level of indebtedness;
- •
- risks in connection with potential acquisitions and the integration of significant acquisitions;
- •
- price volatility of oil and natural gas prices, and the effect that lower prices may have on our net income and
stockholders' equity;
- •
- a decline in oil or natural gas production or oil or natural gas prices, and the impact of general economic conditions on
the demand for oil and natural gas and the availability of capital;
- •
- impact of environmental, health and safety, and other governmental regulations, and of current or pending legislation;
- •
- effects of competition;
- •
- effect of seasonal factors;
- •
- lack of availability of drilling rigs, equipment, supplies, insurance, personnel and oil field services;
- •
- further sales or issuances of common stock; and
- •
- our common stock's limited trading history.
Finally, our future results will depend upon various other risks and uncertainties, including, but not limited to, those detailed in the section entitled "Risk Factors" included elsewhere in this annual report. All forward-looking statements attributable to us or persons acting on our behalf are expressly qualified in their entirety by the cautionary statements in this section and elsewhere in this annual report. Other than as required under securities laws, we do not assume a duty to update these forward-looking statements, whether as a result of new information, subsequent events or circumstances, changes in expectations or otherwise.
3
ITEMS 1 AND 2. BUSINESS AND PROPERTIES
Company Overview and Strategy
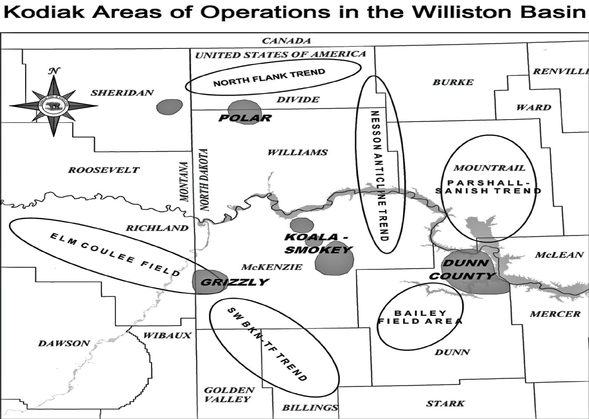
Kodiak Oil & Gas Corp. ("Kodiak," "we" or the "Company") is an independent energy company focused on the exploration, exploitation, acquisition and production of crude oil and natural gas in the United States. We have developed an oil and natural gas asset base of proved reserves, as well as a portfolio of development and exploratory drilling opportunities on high-potential conventional and non-conventional prospects with an emphasis on oil resource plays. Our oil and natural gas reserves and operations are primarily concentrated in two Rocky Mountain basins, the Williston Basin of North Dakota and Montana and in the Green River Basin of Wyoming and Colorado. Kodiak's historic focus has been to internally identify prospects, acquire lands encompassing those prospects and evaluate those prospects using subsurface geology and geophysical data and exploratory drilling. In 2010, we also added to our asset base through a targeted acquisition of properties within our existing core operating area. We intend to continue to evaluate and invest in acquisitions and internally generated prospects.
As of December 31, 2010, our primary assets include the following:
Williston Basin
Williston Basin in Western North Dakota and Eastern Montana: As of January 31, 2011, we owned an interest in approximately 112,000 gross acres and 69,000 net acres in this geologic basin. Our primary targets within the Williston Basin are the Bakken Pool consisting of the middle Bakken and Three Forks formations, collectively "Bakken", as well as other formations that produce in the basin including the Mission Canyon and Red River formations. In 2010, we increased our leasehold primarily in McKenzie, Williams and Divide counties by adding approximately 25,000 net acres through leasehold acquisitions, a portion of which included several producing properties, for a total cost of approximately $128.8 million. During 2010, we invested capital expenditures of approximately $67.0 million related primarily to drilling and completion operations where we drilled 22 gross (10.9 net) wells and completed 16 gross (6.5 net) wells. As of December 31, 2010, we operate, or have an interest in, a total of 35 gross (17.3 net) producing wells in the Williston Basin.
As of February 28, 2011, we are operating two drilling rigs on our acreage, and we have contracted a third operated rig that we expect to commence operations in the second quarter of 2011. In addition, our partner in an area of mutual interest with respect to which we have approximately 50% ownership interest is currently operating one rig and has indicated it will be mobilizing a second rig in mid-year 2011.
Green River Basin
Vermillion Basin of southwest Wyoming: Our primary leaseholdings in the Green River Basin are located in an area referred to as the Vermillion Basin. As of January 31, 2011, we owned an approximate 25% non-operating interest in 37,000 gross (8,000 net) acres in the Vermillion Basin that is prospective for the Baxter Shale, a 3,000-foot-thick, condensate and gas-prone interval that is also referred to as the Niobrara Shale in other parts of Wyoming and Colorado. During 2010, our partner completed a well that has been turned to production facilities. Although we participated and were carried in the drilling, we did not participate in the completion operations. We will continue to evaluate the play, but have not allocated capital expenditures toward the prospect during 2011.
The Company was incorporated on March 17, 1972 in the Province of British Columbia, Canada, under the name "Pacific Talc Ltd." pursuant to the Company Act (British Columbia). On
4
November 12, 1998, the name of the Company was changed to "Columbia Copper Company Ltd." On September 28, 2001, the Company was continued from British Columbia to the Yukon Territory and the name of the Company was changed to "Kodiak Oil & Gas Corp." On September 23, 2003, we incorporated a wholly-owned subsidiary, Kodiak Oil & Gas (USA) Inc. in Colorado. Kodiak Oil & Gas (USA) Inc. was formed to hold all of our US oil and gas properties located in the United States.
For a summary of Kodiak's financial information, including revenues from external customers, information on loss, long-lived assets, and total assets, see Item 6—"Selected Consolidated Financial Information" and Item 8—"Financial Statements and Supplementary Data."
We focus on enhancing value for our shareholders through growing reserves, production volumes and cash flow utilizing advanced development, drilling and completion technologies to systematically explore for, develop and produce oil and natural gas reserves. Key elements of our business strategy include:
Focus on Developing our Williston Basin Leasehold Position. We intend to continue developing our acreage position in the Williston Basin in order to maximize the value of our resource potential. Due to the results from our producing wells and current commodity prices, we intend to concentrate the majority of our capital expenditures in the Williston Basin. We believe that our experience in the application of advanced drilling and completion techniques, access to drilling rigs and the high working interests that we maintain in our properties provide us with a competitive advantage in developing our approximately 69,000 net acres that are prospective for the Bakken Pool.
Leverage our Experience in the Williston Basin. We have continued to develop expertise in drilling and completion technologies in horizontal pad-based drilling and multi-stage isolated fracture stimulations. Our drilling and completion techniques in the Williston Basin have evolved from drilling and completing long single and multi-lateral wells with single large uncontrolled hydraulic fracture stimulations in late 2006 to drilling long lateral wells from multi-well pads with 15 isolated hydraulic fracture stimulation stages beginning in the first quarter 2009. Most recently, we have drilled and are completing long lateral wells with up to 24 isolated fracture stimulation stages. With our largely contiguous acreage position, we have the ability to drill multiple wells from a single drilling pad, thereby reducing the time and cost of rig mobilization and minimizing the surface disturbance. We will continue to refine our drilling and completion techniques, as well as monitor the results of other operators, in an effort to enhance well performance and the associated estimated ultimate recoveries and rates of return. We expect our drilling and completion techniques to continue to evolve and believe that such evolution has the potential to significantly enhance our initial production rates, ultimate recovery factors and rate of return on invested capital.
Retain Operational Control and Significant Working Interest. In our principal development targets, we typically seek to maintain operational control of our development and drilling activities. As operator, we retain more control over the timing, selection and process of drilling prospects, and completion design, which enhances our ability to maximize our return on invested capital and gives us greater control over the timing, allocation and amounts of our capital expenditures. Retaining operational control also gives us the ability to control the financing, construction and operation of infrastructure related to our production operations. We have continued to maintain high working interest in our Williston Basin properties which maximizes our exposure to generated cash flows and increases in value as the properties are developed. With operational control, we can also schedule our drilling program to satisfy most of our lease stipulations and continue to put our acreage into "held by production" status, thus eliminating expirations. In 2010, our two major leasehold acquisitions in the Williston Basin included leasehold where we will operate and have a working interest in excess of 90%.
Evaluate and Pursue Strategic Acquisitions in the Williston Basin. We intend to continue to evaluate and potentially acquire additional acreage and producing assets in the Williston Basin in areas
5
near our core acreage. We believe that operating in a concentrated area allows us to more efficiently deploy our resources, manage costs, leverage our base of technical expertise and capture economies of scale.
Maintain a Disciplined Financial Approach. Our goal is to remain financially strong, yet flexible, through the prudent management of our balance sheet and appropriate management of commodity price volatility. We have historically funded our oil and gas operations and acquisitions through a combination of equity issuances, bank borrowings and internally generated cash flow.
2011 Capital Budget
Our anticipated 2011 capital expenditure budget is $200 million, which is allocated to oil and gas activities in the Williston Basin of North Dakota targeting the Bakken Pool. We have allocated $150 million to the drilling of 28 gross (18.4 net) wells and the completion of 26 gross (18.4 net) Kodiak-operated wells. We have also allocated $10 million for infrastructure build-out. Such infrastructure costs will involve expenses associated with connecting our wells to gathering systems for which we have contracted with third party pipeline companies. The remaining $40 million is allocated to non-operated drilling activity pursuant to which we expect approximately 10 gross (5 net) wells to be drilled utilizing one drilling rig in our area of mutual interest with ExxonMobil Corporation located in Dunn County. We have been notified by ExxonMobil that it expects to have a second rig operating on the lands during the second half of 2011. The addition of this second non-operated rig will require us to modify our current capital budget. We expect to have a non-operating working interest ranging from 40% to 50% in most of the wells drilled by ExxonMobil in this area in 2011.
We have not allocated any of our capital expenditure budget toward drilling and completion activity in the Vermillion Basin in Southwestern Wyoming. During 2010, we participated in the drilling of a well in the Vermillion Basin, through a carried interest, but elected not to participate in its completion. The well has been turned to production facilities and is currently being evaluated. Our participation in future wells in this basin is subject to additional results from the recently completed well and to prevailing Rocky Mountain liquids and natural gas prices at the time of the election.
Our 2011 capital expenditure budget is subject to various factors, including market conditions, oilfield services and equipment availability, commodity prices and drilling results. While we continue to explore opportunities to expand our acreage position, our current budget is allocated to drilling and completing wells. Any leasehold acquisitions that we choose to pursue would require us to adjust our budget, as we have not allocated any of our 2011 capital budget to acreage acquisitions.
Other factors that could cause us to further increase our level of activity and adjust our capital expenditure budget include a reduction in service and material costs, the formation of joint ventures with other exploration and production companies, the divestiture of non-strategic assets, a further improvement in commodity prices or well performance that exceeds our forecasts, any of which could positively impact our operating cash flow. Factors that could cause us to reduce level of activity and adjust our capital budget include, but are not limited to, increases in service and materials costs, reductions in commodity prices or under-performance of wells relative to our forecasts, any of which could negatively impact our operating cash flow.
6
The following table sets forth our capital expenditures for the year ended December 31, 2010 and our capital expenditures budget for our principal properties in 2011. Net capital expenditures include both cash expenditures and accrued expenditures and are net of proceeds from divestitures.
Project Location
|
2010 Actual Capital Expenditures ($000) |
2011 Budgeted Net Capital Expenditures ($000) |
|||||
|---|---|---|---|---|---|---|---|
Williston Basin |
|||||||
Mission Canyon—Red River wells and infrastructure |
$ | 3,100 | $ | — | |||
Bakken-Three Forks / McKenzie County, ND wells and infrastructure |
20,700 | 65,000 | |||||
Bakken-Three Forks / Dunn County, ND wells and infrastructure |
43,200 | 135,000 | |||||
Bakken-Three Forks / Smokey and Polar acquisitions |
114,100 | — | |||||
Acreage |
14,700 | — | |||||
Total Williston Basin |
$ | 195,800 | 200,000 | ||||
Wyoming |
$ | 200 | $ | — | |||
Total All Areas |
$ | 196,000 | $ | 200,000 | |||
Capital Resources
Our 2011 drilling program is designed to provide flexibility in identifying suitable well locations and in the timing and size of capital investment. We anticipate funding this 2011 capital program through a combination of existing working capital, the increase in our operating cash flows, and additional credit that may be available under either our borrowing base or second lien term loan facilities.
As of December 31, 2010, we have working capital of $110 million primarily consisting of $101 million of cash and equivalents and our inventory of tubular goods and prepaid drilling totaling $18 million, offset by our current liabilities. In addition, we have an existing revolving line of credit with a borrowing base of $50 million that is currently undrawn. Further, we expect that our borrowing base will increase with the addition of proved properties as a result of our ongoing drilling and completion activities.
We anticipate that our operating cash flows will continue to increase as additional wells are drilled and placed on production. In 2010, our average sales volumes increased to approximately 1,260 barrels of oil equivalent per day (BOEPD), or 110% over 2009 volumes. In addition to our planned drilling in 2011, as of February 28, 2011, we have six gross (4.4 net) operated wells and two (one net) non-operated wells that have been drilled and are awaiting completion. If we are able to drill and complete our wells as anticipated and they produce at rates similar to those generated by our existing wells, we would expect our production rates and operating cash flows to grow significantly as we move through 2011.
We believe that our future cash flows may be enhanced due to our individual well's performance as suggested by our wells drilled and completed in 2010 compared to those in 2009 (for details of 2010 operations, see summary chart below titled, "2010 Bakken Drilling and Completion Activities") . In the three longer laterals drilled and completed in 2009, we averaged 319 BOEPD for the first 360 days of production for a cumulative average total BOE of 115,000. This compares to the two longer laterals completed in the third quarter of 2010 that averaged 689 BOEPD for the first 180 days of production for a cumulative average total of 122,000 BOE. Likewise, we have seen the same improvement with our shorter laterals. We completed five shorter laterals in 2009 and early 2010 which averaged 181 BOEPD
7
for the first 360 days of production for an average cumulative production of 65,000 BOE. We completed three wells with similar type length of laterals in 2010 and achieved average production rates of 401 BOEPD and cumulative production of 72,000 BOE in the first 180 days of production. If we continue to achieve higher sustained production rates, we believe we could generate increased cash flows and achieve a shorter payout period and internal rate of return for our wells.
We cannot give assurances that our working capital on hand, our cash flow from operations or any available borrowings will be sufficient to fund our anticipated capital expenditures. If our existing and potential sources of liquidity through operating cash flows or expanded available borrowings are not sufficient to undertake our planned capital expenditures, we may be required to alter our drilling program, pursue joint ventures with third parties, sell interests in one or more of our properties or sell common shares or debt securities. If we are not successful in obtaining sufficient funding or completing an alternative transaction on a timely basis on terms acceptable to us, we would be required to curtail our expenditures or restructure our operations, and we would be unable to implement our planned exploration and drilling program.
Our Properties
Williston Basin
Our primary geologic target in the Williston Basin is the Bakken Pool. The Williston Basin also produces from many other formations including, but not limited to, the Mission Canyon, Nisku and Red River. In the Bakken Pool, our primary objective is the dolomitic, sandy interval between the two Bakken Shales at an approximate vertical depth of 10,300-11,300 feet and the Three Forks Formation that is present immediately below the lower Bakken Shale. We are currently operating a two-rig program in the Williston Basin and anticipate continued operation throughout 2011. We intend to take delivery of a third drilling rig in the second quarter of 2011under a contract that expires 24 months after we take delivery. In addition to our operated rigs, our joint venture partner on our Dunn County
8
acreage is operating one drilling rig on the lands it operates. Recently, we have been notified that our partner has scheduled the addition of another rig during the second half of 2011. We anticipate having a working interest of up to 50% in most of the wells to be drilled by these two non-operated rigs. In total, for the year 2011, our preliminary capital expenditure budget for the Williston Basin is comprised of $200.0 million for drilling, completion, and related infrastructure.
In 2010, the Company's capital expenditures in the Williston Basin totaled $195.8 million, including $67.0 million for drilling, completion and infrastructure activities and $128.8 million for acreage leasing and acquisitions. During 2010, excluding the Smokey/Polar acquisition discussed below, Kodiak acquired 10,263 net acres for total consideration of $19.3 million at an average purchase price of $1,881 per acre.
On November 30, 2010, we completed the acquisition of oil and gas properties known as the Smokey and Polar operating areas for $108.6 million. The acquired assets, which are comprised of producing properties and undeveloped leasehold, together with various other related permits, contracts, equipment, data and other items, are located in McKenzie, Williams and Divide Counties of North Dakota.
As a result of the acquisition, we acquired approximately 19,000 gross mineral acres (11,750 net) in McKenzie County, and 4,100 gross (2,750 net) mineral acres northern Williams County and southern Divide County. The McKenzie County acreage includes four producing wellbores and associated equipment, three of which we operate.
Important considerations in the planning of our future drilling program in the Williston Basin include the following:
- •
- We anticipate drilling most of our future operated wells on 1,280 acre drilling blocks allowing for drilling of nearly
10,000 foot laterals. Based upon our exploration efforts in 2009 and 2010, we believe that the internal rate of return of the longer laterals is higher than we were achieving with our shorter
laterals.
- •
- In late 2010, we completed our first middle Bakken well in Dunn County that was drilled approximately 1,300 feet from a
well that had been on production for approximately 18 months. With the data obtained during the stimulation procedures, we experienced very little communication and we are encouraged that this
spacing can be used as we move to development. Based upon the thickness of the middle Bakken in our prospect areas, we believe the results of our completion work support a density of four middle
Bakken wells within a drilling unit, regardless as to length of lateral.
- •
- We drilled our first operated Three Forks Formation well off of the same drilling pad as the middle Bakken well described
above. This well was positioned 700 feet horizontally from a middle Bakken well with approximately 65 feet of vertical separation. During the fracture stimulation procedures, we observed a small
amount of communication between the two reservoirs. However, based upon our limited production data since completion, we believe that the two reservoirs could be producing independently from each
other.
- •
- We have not tested density of wells in the Three Forks Formation. However, based upon industry activity and well control
in the area, the general belief is that the Three Forks Formation could support three to four wells within a drilling unit.
- •
- We are currently testing this same density of wellbores in McKenzie County and expect to have additional information later in 2011 regarding the wellbore density and formations of that area.
As a result of our work described above, we believe that many of our wells could be drilled in the Three Forks Formation for which we have not recorded any proved undeveloped reserves. Completion
9
techniques have been and will continue to be evaluated with the expectation of further enhancing our completion methods as more data becomes available.
Our leasehold is largely contiguous and by virtue of our high working interest and operatorship, we can control the development pace and location of surface facilities. We believe this strategy, combined with pad drilling and long laterals, will maximize the efficiency of our drilling program and minimize the infrastructure required to connect our wells to sales pipelines. As a result, we are able to plan our locations to minimize the number of wells required to hold our acreage by establishing production within the primary terms of our leases.
Dunn, Mountrail and McLean Counties, North Dakota (59,000 gross and 34,000 net acres)
We continue to develop our Dunn County leasehold. Our leasehold acreage in this operating area is entirely encompassed by the Fort Berthold Indian Reservation (FBIR) that is held in trust and administered by the Bureau of Indian Affairs (BIA) on behalf of the individual members of the Hidatsa, Mandan and Arikara tribes, collectively known as the Three Affiliated Tribes.
In 2010, we spud or participated in 13 gross (6.0 net) wells and completed 11 gross (4.7 net) wells on our Dunn County acreage. To date, we have drilled a total of 24 gross (12.0 net) wells with 20 gross (9.5 net) wells completed and on production. Of the 24 gross wells drilled to date, Kodiak has an average working interest of 50% and operates 20 gross wells.
During 2011, we plan to drill or participate in 29 gross (16.7 net) wells and complete 26 gross (15.8 net) wells in this area. Of the 29 gross wells to be drilled, we estimate that 19 will be operated by Kodiak with an average working interest of 64%. As of February 28, 2011, we had three gross (1.95 net) operated wells and two gross (1.0 net) non-operated wells drilled and waiting on completion.
In the fourth quarter of 2010, we completed two middle Bakken wells and partially completed our first Three Forks well. Although severe winter weather significantly affected our completion operations and the productive performance of the wells, the well results have provided important data towards the productive potential of the Three Forks Formation and the density of drilling within the middle Bakken Formation on our leasehold.
The partially completed Three Forks well, although completed in six of the scheduled 22 stages, has produced a 30-day average of 532 barrels of oil per day (BOPD) and 421 thousand cubic feet (Mcf) of natural gas per day, or 603 BOEPD. The remaining 16 stages of this well are scheduled for completion in the second quarter of 2011. This well was drilled 700 feet from the nearest middle Bakken well discussed below. From the early production, we are encouraged that the Three Forks Formation appears to be producing independently of the middle Bakken Formation which would indicate a second independent reservoir. At this time, we have not tested density of wells in the Three Forks Formation. However, based upon industry activity, the general belief is that the Three Forks Formation could support three to four wells within a drilling unit.
One of the two middle Bakken wells completed in the fourth quarter of 2010 was drilled 1,300 feet from an existing producing middle Bakken well that had been on production for over 18 months. During completion work, some pressure communication was observed; however, both wells now appear to be producing independently. While the production history of the wells is limited and the early production was curtailed due to severe weather and resulting transportation difficulties, we believe the initial results do lend support to drilling at least four middle Bakken wells within a drilling unit based upon the thickness of the middle Bakken in this area.
10
McKenzie County, North Dakota (37,500 gross and 25,500 net acres)
In 2010, we continued to grow and enhance our position in McKenzie County, both through leasehold acquisitions and through drilling operations. As of January 31, 2011, we have accumulated 28,000 gross (20,000 net) acres in central McKenzie County in our Koala and Smokey project areas. Our Smokey project includes four producing wells, three of which are operated by Kodiak, and one third-party operated well that is awaiting completion. In the Smokey project, we obtained an 87% interest in the leasehold and, consistent with our strategy to maintain high working interest across our leasehold, we subsequently purchased the remaining interests from third parties. The Smokey acreage is serviced by existing third-party crude and natural gas pipeline infrastructure which provides multiple take-away options. When added to our Koala project area, our central McKenzie County leasehold establishes another core area that provides for expansion of our multi-year drilling program.
As of February 28, 2011, we had two wells waiting on completion in Koala that had been drilled off of one pad. One of the wells was drilled in the Three Forks Formation and one well was drilled in the middle Bakken. The wells are separated by approximately 700 feet of horizontal displacement. We are presently drilling on a second drilling pad in the same immediate area. These two wells are approximately 1,300 feet apart and both drilled in the middle Bakken which will test wellbore density. One well is already drilled with production liner in the hole and drilling of the second well is underway. We anticipate that the wells on the first pad will be completed in the first quarter 2011, with the wells on the second pad to follow in the second quarter of 2011.
In our Grizzly area in western McKenzie County of the southeastern Elm Coulee trend, we have grown our acreage footprint while continuing our drilling and completion activities. As of January 31, 2011, we have accumulated 9,350 gross (5,700 net) acres in this area. During 2010 we drilled two gross (1.16) net operated wells and one gross (0.25 net) non-operated wells. The Grizzly Federal #1-27H-R was drilled and completed in the Three Forks Formation. The well was only completed in ten stages due to mechanical issues, and therefore, the effective producing lateral length is less than 4,000 feet. Despite these issues, the production from the well has exceeded our expectations and has provided good evidence that the Three Forks is commercial in this area. The cumulative daily production averages for 30, 60 and 90 days were 210, 204, and 196 BOEPD per day, respectively, indicating a much flatter decline curve than we have experienced in other operating areas. In February 2011, the Grizzly #13-6H well was completed in the middle Bakken. This was a reentry well where we drilled out a short horizontal lateral of approximately 3,100 feet and fracture stimulated using 10 stages with a cemented liner. Initial production from the well was 378 BOEPD and 128 MCF of natural gas per day or 399 BOEPD. During the first 15 days of production, the well has averaged 160 BOPD. The well will be placed on pump in the first quarter of 2011. In this area of the Williston Basin, we have experienced lower reservoir pressure in both the middle Bakken and the Three Forks formation which is caused primarily by depth of burial. As a result the wells typically flow back at lower rates and require the installation of pumping units in the early stages of the production life. We will continue to refine our completion work specific to this area in an effort to control our well costs and maximize our returns on capital employed. However, the well results encourage us to budget additional drilling and completion in this area, and we anticipate drilling four gross (2.6 net) wells in this area in late 2011 and continuing into 2012. Our development work will target both the middle Bakken and the Three Forks formations, and we expect to utilize 1,280 acre drilling units and target lateral lengths of approximately 10,000 feet.
Williams and Divide Counties North Dakota and Sheridan County, Montana (15,100 gross and 9,600 net acres)
In Williams and Divide Counties, industry exploration activity continues to progress in evaluating the productive potential of both the middle Bakken and the Three Forks Formation. We will continue to follow this exploration work and intend to drill our first wells on these lands in 2012. Just to the west into Sheridan County, the primary producing objectives historically have been the Mission Canyon
11
and the Red River Formations at approximate depths of 8,000 feet and 11,000 feet, respectively. During 2010, we drilled two seismically defined wells targeting the Red River Formation. One of the wells was completed as a commercial producer while the other did not produce in economic quantities. While drilling the second well, the Bakken was cored. We are currently evaluating the potential of reentering the well and kicking off a horizontal lateral in the Bakken. We continue to monitor Bakken exploration efforts in this area as exploration activity continues to move towards this area.
The following summary provides a tabular presentation of data pertinent to our Williston Basin drilling and completion activities targeting the Bakken during 2010 (gas is converted on a 6 Mcf to 1 barrel of oil basis):
2010 Bakken Drilling and Completion Activities
Kodiak Oil & Gas Corp.
North Dakota (Bakken and Three Forks) Drilling and Completion Activities
| |
|
|
|
Production | |
|
||||||||||||||||||||||||
|---|---|---|---|---|---|---|---|---|---|---|---|---|---|---|---|---|---|---|---|---|---|---|---|---|---|---|---|---|---|---|
| |
|
|
IP 24- Hour Test BOE/D |
Gas / Oil Ratio (GOR) Range |
|
|||||||||||||||||||||||||
Well
|
WI / NRI (%) |
Completion Date |
30 Day Cum BOE/d |
60 Day Cum BOE/d |
90 Day Cum BOE/d |
180 Day Cum BOE/d |
360 Day Cum BOE/d |
Well Status(1) |
||||||||||||||||||||||
Dunn County, ND: Longer Laterals (Over 5,000') |
||||||||||||||||||||||||||||||
MC #13-34-28-1H |
59 / 48 | Sep-10 | 1,906 | 1,082 | 1,074 | 995 | 723 | — | 760 | FW | ||||||||||||||||||||
MC #13-34-28-2H |
59 / 48 | Aug-10 | 2,055 | 1,259 | 1,073 | 932 | 655 | — | 790 | FW | ||||||||||||||||||||
TSB #14-21-33-16H3 |
50 / 41 | Dec-10 | 1,042 | 603 | — | — | — | — | 530 | FW | (3) | |||||||||||||||||||
TSB #14-21-33-15H |
50 / 41 | Dec-10 | 2,050 | 877 | (2) | 780 | — | — | — | 800 | FW | |||||||||||||||||||
TSB #14-21-16-2H |
50 / 41 | Q1 11 | — | — | — | — | — | — | — | WOC | ||||||||||||||||||||
TSB #2-24-12-2H |
50 / 41 | 2011 | — | — | — | — | — | — | — | WOC | ||||||||||||||||||||
SC #2-24-25-15H |
96 / 79 | 2011 | — | — | — | — | — | — | — | WOC | ||||||||||||||||||||
TSB #2-24-12-1H3 |
50 / 41 | 2011 | — | — | — | — | — | — | — | Drilling | ||||||||||||||||||||
Dunn County, ND: Shorter Laterals (Under 5,000') |
||||||||||||||||||||||||||||||
MC #16-3-11H |
60 / 49 | Feb-10 | 1,419 | 798 | 694 | 621 | 496 | 353 | 880 | FW | ||||||||||||||||||||
MC #16-3H |
60 / 49 | Mar-10 | 1,495 | 671 | 537 | 478 | 356 | — | 800 | FW | ||||||||||||||||||||
MC #13-34-3H |
60 / 49 | Jun-10 | 1,517 | 678 | 580 | 496 | 351 | — | 750 | FW | ||||||||||||||||||||
TSB #14-21-4H |
50 / 41 | Dec-10 | 1,196 | 656 | (2) | 470 | — | — | — | 750 | FW | |||||||||||||||||||
McKenzie County, ND |
||||||||||||||||||||||||||||||
Grizzly 13-6H |
68 / 56 | Feb-11 | 399 | — | — | — | — | — | — | FW | ||||||||||||||||||||
Grizzly 1-27H-R |
74 / 60 | Sep-10 | 507 | 210 | 204 | 196 | — | — | 800 | PW | ||||||||||||||||||||
Koala 9-5-6-5H |
95 / 78 | Q1 11 | — | — | — | — | — | — | — | WOC | ||||||||||||||||||||
Koala 9-5-6-12H3 |
95 / 78 | Q1 11 | — | — | — | — | — | — | — | WOC | ||||||||||||||||||||
Koala 3-2-11-14H |
52 / 42 | 2011 | — | — | — | — | — | — | — | WOC | ||||||||||||||||||||
Koala 3-2-11-13H |
53 / 43 | 2011 | — | — | — | — | — | — | — | Drilling | ||||||||||||||||||||
| (1) Well Status is as of March 1, 2011 | FW = Flowing Well | |
| (2) Production curtailed due to weather conditions and limited crude oil transportation | PW = Pumping Well | |
| (3) Only 6 out of 22 stages completed and producing | WOC = Waiting on Completion |
Midstream Activities: Oil and Gas Transportation and Water Disposal Pipelines
In 2010, we reached a definitive agreement with a third-party pipeline operator that allows for the gathering and sales of crude oil and natural gas and gathering and disposal of water through pipelines over certain of our Dunn County gross acreage position. Our joint venture partner in this area that operates a portion of Kodiak's leasehold had previously reached an agreement with the same pipeline operator. Combined, these agreements allow all of the wells completed by either company within the area of mutual interest to produce into the same gathering and pipeline system.
This gathering system has been completed through the northern part of Kodiak's Dunn County leasehold. The first four of the Company's currently producing wells were connected in late December 2010 and oil, gas, and water is now transported through the gathering systems. We expect to make
12
significant progress toward connecting our Dunn County wells to the gathering system during 2011 such that, by year-end, a majority of our oil and gas will be transported through pipelines. Moving oil, gas and water through the gathering systems eliminates trucking costs and associated surface disturbance, and mitigates weather-related production interruptions. Additionally, Kodiak is capturing revenue generated from the sales of associated natural gas and natural gas liquids that were previously flared. Moving our produced water through the pipeline for disposal will reduce lease operating expense as compared to the cost of trucking.
Our McKenzie County operations in the Grizzly and Koala areas benefit from existing gas gathering and pipelines systems near our acreage that allow us to monetize our associated gas and related natural gas liquids. For our Smokey acreage, we have contracted with a third party midstream company to build oil and gas gathering infrastructure to efficiently move our products to markets. This midstream company is in the final stages of completing its main pipeline and is constructing a gas processing facility. We expect to have gathering lines connected to our Smokey wells as we begin drilling in the area during 2011.
Green River Basin (45,300 gross and 15,000 net acres)
Our primary leaseholdings in the Green River Basin are located in an area referred to as the Vermillion Basin. In this geologic region, we believe there is natural gas trapped in various sands, coals and shales at depths ranging from 2,000 feet to nearly 15,000 feet. The primary target of our current exploration efforts in this area is the over-pressured Baxter Shale at depths to approximately 13,000 feet.
In 2010, the operator of our Vermillion Basin prospect re-entered a well that was vertically drilled in 2008 to the top of the Baxter Shale and has horizontally drilled a lateral to evaluate the potential of the Baxter Shale interval. The well has been completed and turned to production. We will continue to monitor the performance of this well and evaluate the prospect before allocating capital to the project.
Our Leasehold
As of January 31, 2011, we had several hundred lease agreements representing approximately 168,000 gross and 93,000 net acres primarily in the Williston and Green River Basins.
In the Williston Basin of North Dakota and Montana, as of January 31, 2011, we owned an interest in approximately 112,000 gross acres and 69,000 net acres. We owned approximately 59,000 gross acres and 34,000 net acres in Dunn County, North Dakota, with most of these lands acquired in 2007 and 2008. The majority of our land in this prospect area is held in trust and is administered by the BIA on behalf of the individual members of the Three Affiliated Tribes Fort Berthold Indian Reservation. Typically these lands are acquired through private negotiations with the individual land owners and the Three Affiliated Tribes and have a primary lease term of five years. In most cases we have one to three years remaining on the primary term of these leases. Approximately 30% of these lands are encompassed within federal operating units approved by the Bureau of Land Management (BLM) that allow for the orderly exploration and development. The land owner typically retains an 18% landowner royalty. In most cases, these lands require an annual delay rental of $2.50 per net acre.
Our acreage located in the Williston Basin in McKenzie, Williams and Divide Counties, North Dakota, and Sheridan County, Montana, is held primarily on the basis of fee and federal leases. These leases typically carry a primary term of three to 10 years with landowner royalties of 12.5% to 18.5%. In most cases we obtain "paid up" fee leases that do not require annual delay rentals. The federal lands require annual delay rentals of $1.50 to $2.00 per net acre.
13
The majority of our lands located in Wyoming are federal lands administered by the U.S. Bureau of Land Management ("BLM"). Typically these lands are acquired through a public auction and have a primary lease term of ten years. The U.S. Department of the Interior normally retains a 12.5% royalty interest in these lands. Most of our lands in this area are encompassed within federal operating units approved by the BLM that allow for the orderly exploration and development of the federal lands. In most cases, these federal lands require an annual delay rental of $1.50 per net acre.
In February 2008, we entered into an exploration agreement with Devon Energy ("Devon") under which Devon earned a 50% working interest in our leasehold interests in the Vermillion Basin in exchange for, among other things, expenditures that approximate the cost of three horizontally drilled and completed wells. Effective August 1, 2009, we amended that agreement with Devon whereby we have assigned additional interests to Devon. In return, we were carried for a portion of our 25% working interest in expenditures incurred in 2010 and retain an approximate 25% working interest in the balance of the acreage.
The following table sets forth our gross and net acres of developed and undeveloped oil and natural gas leases as of January 31, 2011.
| |
Undeveloped Acreage(1) |
Developed Acreage(2) |
Total Acreage | ||||||||||||||||
|---|---|---|---|---|---|---|---|---|---|---|---|---|---|---|---|---|---|---|---|
| |
Gross | Net | Gross | Net | Gross | Net | |||||||||||||
Green River Basin |
|||||||||||||||||||
Wyoming |
36,466 | 9,159 | 1,520 | 908 | 37,986 | 10,067 | |||||||||||||
Colorado |
7,339 | 4,960 | 0 | 0 | 7,339 | 4,960 | |||||||||||||
Williston Basin |
|||||||||||||||||||
Montana |
7,501 | 3,446 | 1,440 | 2,446 | 8,941 | 5,892 | |||||||||||||
North Dakota |
84,880 | 51,989 | 18,080 | 11,227 | 102,960 | 63,216 | |||||||||||||
Other Basins |
|||||||||||||||||||
Wyoming |
10,538 | 8,849 | 0 | 0 | 10,538 | 8,849 | |||||||||||||
Acreage Totals |
146,724 |
78,403 |
21,040 |
14,581 |
167,764 |
92,984 |
|||||||||||||
- (1)
- Undeveloped
acreage is lease acreage on which wells have not been drilled or completed to a point that would permit the production of commercial quantities
of oil and natural gas regardless of whether such acreage includes proved reserves.
- (2)
- Developed acreage is the number of acres that are allocated or assignable to producing wells or wells capable of production.
We believe we have satisfactory title, in all material respects, to substantially all of our producing properties in accordance with standards generally accepted in the oil and natural gas industry. Substantially all of our proved oil and natural gas properties are pledged as collateral for borrowings under our revolving line of credit and second lien facilities.
Substantially all of the leases summarized in the preceding table will expire at the end of their respective primary terms unless (i) the existing lease is renewed; (ii) we have obtained production from the acreage subject to the lease prior to the end of the primary term, in which event the lease will remain in effect until the cessation of production; or (iii) it is contained within a Federal unit. The
14
following table sets forth the gross and net acres of undeveloped land subject to leases that will expire during the next three years and have no options for renewal or are not included in Federal units:
| |
Expiring Acreage | |||||||
|---|---|---|---|---|---|---|---|---|
Year Ending
|
Gross | Net | ||||||
December 31, 2011 |
18,107 | 13,908 | ||||||
December 31, 2012 |
21,769 | 13,598 | ||||||
December 31, 2013 |
14,578 | 10,431 | ||||||
Total |
54,454 | 37,937 | ||||||
Our Drilling Activity
All of our drilling activities are conducted on a contract basis by independent drilling contractors. We do not own any drilling equipment. The following table sets forth the number and type of wells that we completed during the years ended December 31, 2010, 2009 and 2008.
| |
2010 | 2009 | 2008 | |||||||||||||||||
|---|---|---|---|---|---|---|---|---|---|---|---|---|---|---|---|---|---|---|---|---|
| |
Gross | Net | Gross | Net | Gross | Net | ||||||||||||||
Development wells, completed as: |
||||||||||||||||||||
Oil wells |
14 | 5.7 | — | — | — | — | ||||||||||||||
Gas wells |
— | — | — | — | 1 | 0.1 | ||||||||||||||
Non-Productive(1) |
— | — | — | — | — | — | ||||||||||||||
Exploratory wells, completed as: |
||||||||||||||||||||
Oil wells |
2 | 0.8 | 9 | 4.8 | — | — | ||||||||||||||
Gas wells |
— | — | — | — | — | — | ||||||||||||||
Non-Productive(1) |
— | — | — | — | — | — | ||||||||||||||
Total |
16 | 6.5 | 9 | 4.8 | 1 | 0.1 | ||||||||||||||
- (1)
- A non-productive well (also known as a dry hole) is a well found to be incapable of producing either oil or natural gas in sufficient quantities to justify completion as an oil or natural gas well.
Wells in Progress
In addition to the above wells, as of December 31, 2010, we have two gross (0.60 net) non-operated wells in progress and seven gross (5.0 net) operated wells in progress. The change in wells in progress is summarized in the following table:
| |
Gross | Net | ||||||
|---|---|---|---|---|---|---|---|---|
December 31, 2009 wells drilling or waiting on completion |
3 | 1.3 | ||||||
Wells Drilled in 2010 |
22 | 10.9 | ||||||
Wells Completed in 2010 |
16 | 6.5 | ||||||
December 31, 2010 wells drilling or waiting on completion |
9 | 5.7 | ||||||
Productive Wells
As part of our corporate strategy, we seek to operate our wells where possible and to maintain a high level of participation in our wells by investing our own capital in drilling operations. The following table summarizes our productive wells as of December 31, 2010, all of which are located in the Rocky
15
Mountain region of the United States. Productive wells are wells that are producing or capable of producing, including shut-in wells.
| |
Operated | Non-operated | Total | |||||||||||||||||
|---|---|---|---|---|---|---|---|---|---|---|---|---|---|---|---|---|---|---|---|---|
| |
Gross | Net | Gross | Net | Gross | Net | ||||||||||||||
Williston Basin |
||||||||||||||||||||
Oil and associated gas wells |
29 | 16.5 | 6 | 0.7 | 35 | 17.2 | ||||||||||||||
Wyoming/Colorado |
||||||||||||||||||||
Gas wells |
5 | 4.7 | 11 | 4.0 | 16 | 8.7 | ||||||||||||||
Total |
34 | 21.2 | 17 | 4.7 | 51 | 25.9 | ||||||||||||||
Our Reserves
All of our reserves are located within the continental United States, primarily in the Williston Basin, and an estimate of the quantity of reserves is prepared by an independent petroleum engineering consulting firm. The discussion in Management's Discussion Analysis under the heading "Oil and Gas Reserves" contains, among other things, a tabular presentation of our reserve estimates as of December 31, 2010 and 2009, and is incorporated by reference herein. In conjunction with such reserve estimates, you should read the footnotes to, and the disclosure following, such table, as well as the "Supplemental Oil and Gas Reserve Information (Unaudited)" following the footnotes to our audited financial statements for the years ended December 31, 2010 and 2009 included in this Form 10-K.
Marketing and Major Customers
The principal products produced by us are crude oil and natural gas. These products are marketed and sold primarily to purchasers that have access to nearby pipeline facilities, refineries or other markets. Typically, crude oil is sold at the wellhead at field-posted prices and natural gas is sold both (i) under contract at negotiated prices based upon factors normally considered in the industry (such as distance from well to pipeline, pressure, quality); and (ii) at spot prices. We currently have no long- term fixed-price delivery contracts in place.
The sales of most of our crude oil is to a third-party marketing company, Plains Marketing LP ("Plains"). During the year ended December 31, 2010, 75% of our total oil and gas revenues were received from Plains. There were no other companies that purchased more than 10% of our oil and gas production. Although a substantial portion of our production is purchased by one customer, we do not believe the loss of this customer would have a material adverse effect on our business as other customers would be accessible to us.
Competition
The oil and gas industry is intensely competitive, particularly with respect to the acquisition of prospective oil and natural gas properties and oil and natural gas reserves. Our ability to effectively compete is dependent on our geological, geophysical and engineering expertise, and our financial resources. We must compete against a substantial number of major and independent oil and natural gas companies that have larger technical staffs and greater financial and operational resources than we do. Many of these companies not only engage in the acquisition, exploration, development and production of oil and natural gas reserves, but also have refining operations, market refined products and generate electricity. We also compete with other oil and natural gas companies to secure drilling rigs and other equipment necessary for drilling and completion of wells. As crude oil and natural gas prices decline, access to additional drilling equipment becomes more available. Conversely, as commodity prices increase, drilling equipment may be in short supply from time to time.
16
Commodity Price Environment
Generally, the demand for and the price of natural gas increases during the colder winter months and decreases during the warmer summer months. Pipelines, utilities, local distribution companies and industrial users utilize natural gas storage facilities and purchase some of their anticipated winter requirements during the summer, which can lessen seasonal demand fluctuations. Crude oil and the demand for heating oil are also impacted by seasonal factors, with generally higher prices in the winter. Seasonal anomalies, such as mild winters, sometimes lessen these fluctuations.
Our results of operations and financial condition are significantly affected by oil and natural gas commodity prices, which can fluctuate dramatically. The market for oil and natural gas is beyond our control and prices are difficult to predict. We currently use financial hedges to limit our overall exposure to fluctuations in oil prices but the hedging arrangements may also reduce our potential cash flows by limiting our exposure to commodity price increases. Our hedges are intended to mitigate the risk of a reduction in cash flows that may affect our ability to meet our obligations and capital expenditure budget while at the same time ensuring an acceptable rate of return on our investments. Our total volumes that can be hedged are limited under our credit agreements to 85% of our forecasted production from our proved developed producing oil and gas reserves.
Governmental Regulations and Environmental Laws
Regulation of Oil and Gas Operations
Our oil and natural gas exploration, production and related operations, when developed, are subject to extensive laws and regulations promulgated by federal, state, tribal and local authorities and agencies. These laws and regulations often require permits for drilling operations, drilling bonds and reports concerning operations, and impose other requirements relating to the exploration for and production of oil and natural gas. Many of the laws and regulations govern the location of wells, the method of drilling and casing wells, the plugging and abandoning of wells, the restoration of properties upon which wells are drilled, temporary storage tank operations, air emissions from flaring, compression, the construction and use of access roads, sour gas management and the disposal of fluids used in connection with operations.
Our operations are also subject to various conservation laws and regulations. These laws and regulations govern the size of drilling and spacing units or proration units, the density of wells that may be drilled in oil and natural gas properties and the unitization or pooling of natural gas and oil properties. In this regard, some states allow the forced pooling or integration of lands and leases to facilitate exploration while other states rely primarily or exclusively on voluntary pooling of lands and leases. In areas where pooling is primarily or exclusively voluntary, it may be more difficult to form units and therefore more difficult to develop a project if the operator owns less than 100% of the leasehold. In addition, state conservation laws establish maximum rates of production from oil and natural gas wells, generally prohibit the venting or flaring of natural gas, and impose specified requirements regarding the ratability of production. On some occasions, tribal and local authorities have imposed moratoria or other restrictions on exploration and production activities that must be addressed before those activities can proceed.
The failure to comply with any such laws and regulations can result in substantial penalties. In addition, the effect of all these laws and regulations may limit the amount of oil and natural gas we can produce from our wells and may limit the number of wells or the locations at which we can drill. The increasing regulatory burden on the oil and natural gas industry will most likely increase our cost of doing business and may affect our profitability. Although we believe we are in substantial compliance with current applicable laws and regulations relating to our oil and gas operations, we are unable to predict the future cost or impact of complying with such laws and regulations because such laws and regulations are frequently amended or reinterpreted. We may be required to make significant
17
expenditures to comply with governmental laws and regulations, which could have a material adverse effect on our business, financial condition and results of operations.
Environmental Regulation
Our operations and properties are subject to extensive and changing federal, state, tribal and local laws and regulations relating to environmental protection, including the generation, storage, handling, emission, transportation and discharge of materials into the environment, and relating to safety and health. The recent trend in environmental legislation and regulation generally is toward stricter standards, and we expect that this trend will continue. These laws and regulations:
- •
- require the acquisition of permits or other authorizations before construction, drilling and certain other activities;
- •
- require environmental reviews and assessments of proposed actions prior to the issuance of permits or the granting of
governmental approvals;
- •
- limit or prohibit construction, drilling and other activities on specified lands within wilderness and other protected
areas; and
- •
- impose substantial liabilities for pollution resulting from our operations.
The various environmental permits required for our operations may be subject to revocation, modification and renewal by issuing authorities. Governmental authorities have the power to enforce their regulations, and violations are subject to fines or injunctions, or both. We believe that we are in substantial compliance with current applicable environmental laws and regulations, and have no material commitments for capital expenditures to comply with existing environmental requirements. Nevertheless, changes in existing environmental laws and regulations or interpretations thereof could have a significant impact on us, as well as the oil and natural gas industry in general.
The Comprehensive Environmental, Response, Compensation, and Liability Act, or CERCLA, and comparable state statutes impose strict, joint and several liability on owners and operators of sites and on persons who disposed of or arranged for the disposal of "hazardous substances" found at such sites. It is not uncommon for the government to file claims requiring cleanup actions, demands for reimbursement for government-incurred cleanup costs, or natural resource damages, or for neighboring landowners and other third parties to file claims for personal injury and property damage allegedly caused by hazardous substances released into the environment. The Federal Resource Conservation and Recovery Act, or RCRA, and comparable state statutes govern the disposal of "solid waste" and "hazardous waste" and authorize the imposition of substantial fines and penalties for noncompliance, as well as requirements for corrective actions. Although CERCLA currently excludes petroleum from its definition of "hazardous substance," state laws affecting our operations may impose clean-up liability relating to petroleum and petroleum-related products. In addition, although RCRA classifies certain oil field wastes as "non-hazardous," such exploration and production wastes could be reclassified as hazardous wastes thereby making such wastes subject to more stringent handling and disposal requirements. CERCLA, RCRA and comparable state statutes can impose liability for clean-up of sites and disposal of substances found on drilling and production sites long after operations on such sites have been completed. Other statutes relating to the storage and handling of pollutants include the Oil Pollution Act of 1990, or OPA, which requires certain owners and operators of facilities that store or otherwise handle oil to prepare and implement spill response plans relating to the potential discharge of oil into surface waters. The OPA, contains numerous requirements relating to prevention of, reporting of, and response to oil spills into waters of the United States. State laws mandate oil cleanup programs with respect to contaminated soil. A failure to comply with OPA's requirements or inadequate cooperation during a spill response action may subject a responsible party to civil or criminal enforcement actions.
18
The Endangered Species Act, or ESA, seeks to ensure that activities do not jeopardize endangered or threatened animal, fish and plant species, or destroy or modify the critical habitat of such species. Under the ESA, exploration and production operations, as well as actions by federal agencies, may not significantly impair or jeopardize the species or its habitat. The ESA has been used to prevent or delay drilling activities and provides for criminal penalties for willful violations of its provisions. Other statutes that provide protection to animal and plant species and that may apply to our operations include, without limitation, the Fish and Wildlife Coordination Act, the Fishery Conservation and Management Act, the Migratory Bird Treaty Act. Although we believe that our operations are in substantial compliance with these statutes, any change in these statutes or any reclassification of a species as threatened or endangered or re-determination of the extent of "critical habit" could subject us to significant expenses to modify our operations or could force us to discontinue some operations altogether.
The National Environmental Policy Act, or NEPA, requires a thorough review of the environmental impacts of "major federal actions" and a determination of whether proposed actions on federal and certain Indian lands would result in "significant impact." For purposes of NEPA, "major federal action" can be something as basic as issuance of a required permit. For oil and gas operations on federal and certain Indian lands or requiring federal permits, NEPA review can increase the time for obtaining approval and impose additional regulatory burdens on the natural gas and oil industry, thereby increasing our costs of doing business and our profitability.
The Clean Water Act, or CWA, and comparable state statutes, impose restrictions and controls on the discharge of pollutants, including spills and leaks of oil and other substances, into waters of the United States. The discharge of pollutants into regulated waters is prohibited, except in accordance with the terms of a permit issued by the Environmental Protection Agency (EPA) or an analogous state agency. The CWA regulates storm water run-off from oil and natural gas facilities and requires a storm water discharge permit for certain activities. Such a permit requires the regulated facility to monitor and sample storm water run-off from its operations. The CWA and regulations implemented thereunder also prohibit discharges of dredged and fill material in wetlands and other waters of the United States unless authorized by an appropriately issued permit. The CWA and comparable state statutes provide for civil, criminal and administrative penalties for unauthorized discharges for oil and other pollutants and impose liability on parties responsible for those discharges for the costs of cleaning up any environmental damage caused by the release and for natural resource damages resulting from the release.
The Safe Drinking Water Act, or SDWA, and the Underground Injection Control (UIC) program promulgated thereunder, regulate the drilling and operation of subsurface injection wells. EPA directly administers the UIC program in some states and in others the responsibility for the program has been delegated to the state. The program requires that a permit be obtained before drilling a disposal well. Violation of these regulations and/or contamination of groundwater by oil and natural gas drilling, production, and related operations may result in fines, penalties, and remediation costs, among other sanctions and liabilities under the SWDA and state laws. In addition, third party claims may be filed by landowners and other parties claiming damages for alternative water supplies, property damages, and bodily injury.
The Clean Air Act, as amended, restricts the emission of air pollutants from many sources, including oil and gas operations. New facilities may be required to obtain permits before work can begin, and existing facilities may be required to incur capital costs in order to remain in compliance. In addition, the EPA has promulgated more stringent regulations governing emissions of toxic air pollutants from sources in the oil and gas industry, and these regulations may increase the costs of compliance for some facilities.
19
Significant studies and research have been devoted to climate change and global warming, and climate change has developed into a major political issue in the United States and globally. Certain research suggests that greenhouse gas emissions contribute to climate change and pose a threat to the environment. Recent scientific research and political debate has focused in part on carbon dioxide and methane incidental to oil and natural gas exploration and production. Many state governments have enacted legislation directed at controlling greenhouse gas emissions, and future state and federal legislation and regulation could impose additional restrictions or requirements in connection with our operations and favor use of alternative energy sources, which could increase operating costs and demand for oil products. As such, our business could be materially adversely affected by domestic and international legislation targeted at controlling climate change.
The Company has not incurred, and does not currently anticipate incurring, any material capital expenditures for environmental control facilities.
Employees and Office Space
Our principal executive offices are located at 1625 Broadway, Suite 250, Denver, Colorado 80202, and our telephone number is (303) 592-8075. As of December 31, 2010, we employed 35 full-time employees. None of our employees are subject to a collective bargaining agreement and we consider our relations with our employees to be very good.
Available Information
We maintain a website at http://www.kodiakog.com. The information contained on or accessible through our website is not part of this Annual Report on Form 10-K. Our Annual Report on Form 10-K, Quarterly Reports on Form 10-Q, Current Reports on Form 8-K and amendments to reports filed or furnished pursuant to Sections 13(a) and 15(d) of the Exchange Act, are available on our website, free of charge, as soon as reasonably practicable after we electronically file such reports with, or furnish those reports to, the SEC.
We maintain a Code of Business Conduct and Ethics for Directors, Officers and Employees ("Code of Conduct"). A copy of our Code of Conduct may be found on our website in the Corporate Governance section. Our Code of Conduct contains information regarding whistleblower procedures.
20
An investment in our common stock involves a high degree of risk. In addition to the other information included in this annual report on Form 10-K, you should carefully consider the risks described below before purchasing shares of our common stock. If any of the following risks actually occur, our business, financial condition and results of operations could materially suffer. As a result, the trading price of our common stock could decline, and you might lose all or part of your investment.
Risks Related to the Company
Our current working capital, together with cash generated from anticipated production, may not be sufficient to support all planned exploration and development opportunities.
Our working capital, together with cash generated from anticipated production, may not be sufficient to support anticipated exploration and development opportunities. If we realize lower than expected cash from production, either due to lower than anticipated production levels or a decline in commodity prices from recent levels, we would need to curtail our planned exploration and development activities or seek alternative sources of capital, including by means of entering into joint ventures with other exploration and production companies, sales of interests in certain of our properties or by undertaking additional financing activities (including through the issuance of equity or the incurrence of debt). We may not be able to access the capital markets or otherwise secure such additional financing on reasonable terms or at all, and financing may not continue to be available to us under our existing or new financing arrangements. The availability of these sources of capital will depend upon a number of factors, including general economic and financial market conditions, oil and natural gas prices and our market value and operating performance. If additional capital resources are unavailable, we may curtail our drilling, development and other activities or be forced to sell some of our assets on an untimely or unfavorable basis. Any such curtailment or sale could have a material adverse effect on our business, financial condition and results of operation.
Part of our strategy involves drilling in existing or emerging shale plays using available horizontal drilling and completion techniques. The results of our planned exploratory and development drilling in these plays are subject to drilling and completion technique risks and drilling results may not meet our expectations for reserves or production. As a result, we may incur material write-downs and the value of our undeveloped acreage could decline if drilling results are unsuccessful.
Operations in the Bakken involve utilizing drilling and completion techniques as developed by ourselves and our service providers. Risks that we face while drilling include, but are not limited to, landing our wellbore in the desired drilling zone, staying in the desired drilling zone while drilling horizontally through the formation, running our casing the entire length of the wellbore and being able to run tools and other equipment consistently through the horizontal wellbore. Risks that we face while completing our wells include, but are not limited to, being able to fracture stimulate the planned number of stages, being able to run tools the entire length of the wellbore during completion operations and successfully cleaning out the wellbore after completion of the final fracture stimulation stage.
Our experience with horizontal drilling utilizing the latest drilling and completion techniques specifically in the Bakken is limited. Ultimately, the success of these drilling and completion techniques can only be evaluated over time as more wells are drilled and production profiles are established over a sufficiently long time period. If our drilling results are less than anticipated or we are unable to execute our drilling program because of capital constraints, lease expirations, access to gathering systems and limited takeaway capacity or otherwise, and/or natural gas and oil prices decline, the return on our
21
investment in these areas may not be as attractive as we anticipate and we could incur material write-downs of unevaluated properties and the value of our undeveloped acreage could decline in the future.
Substantially all of our producing properties and operations are located in the Williston Basin region, making us vulnerable to risks associated with operating in one major geographic area.
Approximately 98% of our estimated proved reserves at December 31, 2010 and approximately 88% of our 2010 sales were generated in the Williston Basin in northeastern Montana and northwestern North Dakota. As a result, we may be disproportionately exposed to the impact of delays or interruptions of production from these wells caused by transportation capacity constraints, curtailment of production, availability of equipment, facilities, personnel or services, significant governmental regulation, natural disasters, adverse weather conditions, plant closures for scheduled maintenance or interruption of transportation of oil or natural gas produced from the wells in this area. In addition, the effect of fluctuations on supply and demand may become more pronounced within specific geographic oil and gas producing areas such as the Williston Basin, which may cause these conditions to occur with greater frequency or magnify the effect of these conditions. Due to the concentrated nature of our portfolio of properties, a number of our properties could experience any of the same conditions at the same time, resulting in a relatively greater impact on our results of operations than they might have on other companies that have a more diversified portfolio of properties. Such delays or interruptions could have a material adverse effect on our financial condition and results of operations.
Certain covenants under our credit agreements could limit our flexibility and prevent us from taking certain actions. In addition, there can be no assurance that we will be able to generate sufficient cash flows to repay our debt obligations under our credit agreements. The occurrence of any of the foregoing could adversely affect our business, results of operations and financial condition.
Our credit agreements contain a number of affirmative, negative and financial covenants that limit our ability to take certain actions and require us to comply with specified financial ratios and other performance covenants. To the extent that we owe amounts under our credit agreements, such provisions may affect our ability to obtain future financing and pursue attractive business opportunities and our flexibility in planning for, and reacting to, changes in business conditions. No assurance can be provided that we will not violate the covenants of our credit agreements in the future. If we are unable to comply with applicable covenants in the future, our lenders could pursue their contractual remedies under the credit agreements, including requiring the immediate repayment in full of all amounts outstanding and foreclosing on the oil and gas properties mortgaged to our lenders. Additionally, we cannot be certain that, if the lenders demand immediate repayment of any amounts outstanding, we would be able to secure adequate or timely replacement financing on acceptable terms or at all.
Availability under our revolving credit facility is based on a borrowing base which is subject to redetermination by our lenders. If our borrowing base is reduced, we may be required to repay amounts outstanding under our revolving credit facility.
In the event that we borrow under our revolving credit facility, our ability to make payments due under our revolving credit facility will depend upon our future operating performance, which is subject to general economic and competitive conditions and to financial, business and other factors, many of which we cannot control. In addition, our borrowing base is subject to semi-annual redetermination by our lender based on its valuation of our proved reserves and the lender's internal criteria. In the event the amount outstanding under our revolving credit facility at any time exceeds the borrowing base at such time, we may be required to repay a portion of our outstanding borrowings on an accelerated basis. If we do not have sufficient funds on hand for repayment in such event, or to service our debt obligations generally, we may be required to seek a waiver or amendment from our lenders, refinance
22
our revolving credit facility, sell assets or sell additional shares of securities. We may not be able obtain such financing or complete such transactions on terms acceptable to us, or at all. In addition, our credit agreements may limit our ability to take certain of such actions. Failure to make the required repayment could result in a default under our revolving credit facility and second lien term loan. Our failure to generate sufficient funds to pay our debts or to undertake any of these actions successfully, or to comply with the covenants under our revolving credit facility mentioned above, could materially adversely affect our business, results of operations and financial condition.
We may not be able to successfully drill wells that produce oil or natural gas in commercially viable quantities.
We cannot assure you that each well we drill will produce commercial quantities of oil and natural gas. The total cost of drilling, completing and operating a well is uncertain before drilling commences. Overruns in budgeted expenditures are a common risk that can make a particular project uneconomical. The use of seismic data and other technologies and the study of producing fields in the same area will not enable us to know conclusively prior to drilling each well whether oil or natural gas will be present or, if present, whether oil or natural gas will be present in commercial quantities. Our use of seismic data is subject to interpretation and may not accurately identify the presence of natural gas and oil. Further, many factors may curtail, delay or cancel drilling, including the following:
- •
- delays and restrictions imposed by or resulting from compliance with regulatory requirements;
- •
- changes in laws and regulations applicable to oil and natural gas activities;
- •
- hazards resulting from unusual or unexpected geological or environmental conditions;
- •
- shortages of or delays in obtaining equipment and qualified personnel;
- •
- equipment failures or accidents;
- •
- adverse weather conditions;
- •
- reductions in oil and natural gas prices;
- •
- land title problems;
- •
- unanticipated transportation costs and delays; and
- •
- limitations in the market for oil and natural gas.
Any of these risks can cause substantial losses, including personal injury or loss of life, damage to or destruction of property, natural resources and equipment, pollution, environmental contamination or loss of wells and other regulatory penalties. The occurrence of any of these events could negatively affect our ability to successfully drill wells that produce oil or natural gas in commercially viable quantities.
We may not adhere to our proposed drilling schedule.
Our final determination of whether to drill any scheduled or budgeted wells will be dependent on a number of factors, including:
- •
- the availability and costs of drilling and service equipment and crews;
- •
- economic and industry conditions;
- •
- prevailing and anticipated prices for oil and gas;
- •
- the availability of sufficient capital resources;
- •
- the results of our exploitation efforts;
23
- •
- the acquisition, review and interpretation of seismic data; and
- •
- our ability to obtain permits for drilling locations.
Although we have identified or budgeted for several drilling locations, we may not be able to lease or drill those locations within our expected time frame or at all. In addition, our drilling schedule may vary from our expectations because of future uncertainties.
Our commodity derivative arrangements could result in financial losses or could reduce our earnings.
From time to time, we enter into financial hedge arrangements (commodity derivative agreements) in order to manage our commodity price risk and to provide a more predictable cash flow from operations. We do not intend to designate our derivative instruments as hedges for accounting purposes. The fair value of our derivative instruments will be marked to market at the end of each quarter and the resulting unrealized gains or losses due to changes in the fair value of our derivative instruments will be recognized in current earnings. Accordingly, our earnings may fluctuate significantly as a result of changes in fair value of our derivative instruments.
Our actual future production may be significantly higher or lower than we estimate at the time we enter into derivative contracts for such period. If the actual amount of production is higher than we estimated, we will have greater commodity price exposure than we intended. If the actual amount of production is lower than the notional amount that is subject to our derivative financial instruments, we might be forced to satisfy all or a portion of our derivative transactions without the benefit of the cash flow from our sale of the underlying physical commodity, resulting in a substantial diminution of our liquidity. As a result of these factors, our hedging activities may not be as effective as we intend in reducing the volatility of our cash flows. Derivative instruments also expose us to the risk of financial loss in some circumstances, including when:
- •
- production is less than the volume covered by the derivative instruments;
- •
- the counter-party to the derivative instrument defaults on its contract obligations;
- •
- there is an increase in the differential between the underlying price in the derivative instrument and actual prices
received; or
- •
- the steps we take to monitor our derivative financial instruments do not detect and prevent transactions that are inconsistent with the Company's risk management strategies.
In addition, depending on the type of derivative arrangements we enter, the agreements could limit the benefit we would receive from increases in oil prices. We cannot assure you that the hedging transactions we have entered into, or will enter into, will adequately protect us from fluctuations in oil prices.
We have historically incurred losses and cannot assure investors as to future profitability.
We have historically incurred losses from operations during our history in the oil and natural gas business. As of December 31, 2010, we had a cumulative deficit of approximately $108 million. While we have developed some of our properties, many of our properties are in the exploration stage, and to date we have established a limited volume of proved reserves on our properties. Our ability to be profitable in the future will depend on successfully implementing our acquisition, exploration, development and production activities, all of which are subject to many risks beyond our control. We cannot assure you that we will successfully implement our business plan or that we will achieve commercial profitability in the future. Even if we become profitable on an annual basis, we cannot assure you that our profitability will be sustainable or increase on a periodic basis. In addition, should we be unable to continue as a going concern, realization of assets and settlement of liabilities in other
24
than the normal course of business may be at amounts significantly different from those in the financial statements included in this annual report.
The actual quantities and present value of our proved reserves may be lower than we have estimated. In addition, the present value of future net revenues from our proved reserves will not necessarily be the same as the current market value of our estimated oil and natural gas reserves.
This annual report contains estimates of our proved oil and natural gas reserves and the estimated future net revenues from these reserves. The December 31, 2010 reserve estimate was prepared by Netherland Sewell & Associates, Inc. The process of estimating oil and natural gas reserves is complex and requires significant decisions and assumptions in the evaluation of available geological, geophysical, engineering and economic data for each reservoir. Accordingly, these estimates are inherently imprecise. Actual future production, oil and natural gas prices, revenues, taxes, development and operating expenses, and quantities of recoverable oil and natural gas reserves most likely will vary from these estimates and vary over time. Such variations may be significant and could materially affect the estimated quantities and present value of our proved reserves. In addition, we may adjust estimates of proved reserves to reflect production history, results of exploration and development drilling, results of secondary and tertiary recovery applications, prevailing oil and natural gas prices and other factors, many of which are beyond our control. You should also not assume that our initial rates of production of our wells will lead to greater overall production over the life of the wells, or that early results suggesting lack of reservoir continuity will prove to be accurate.
You should not assume that the present value of future net revenues referred to in this annual report is the current market value of our estimated oil and natural gas reserves. In accordance with SEC requirements, the estimated discounted future net cash flows from proved reserves are generally based on the un-weighted average of the closing prices during the first day of each of the twelve months preceding the end of the fiscal year. Actual future prices and costs may be materially higher or lower than the prices and costs as of the date of the estimate. Any change in consumption by oil or natural gas purchasers or in governmental regulations or taxation will also affect actual future net cash flows. The timing of both the production and the expenses from the development and production of our oil and natural gas properties will affect the timing of actual future net cash flows from proved reserves and their present value. In addition, the 10% discount factor, which is required by the SEC to be used in calculating discounted future net cash flows for reporting purposes, is not necessarily the most appropriate discount factor nor does it reflect discount factors used in the market place for the purchase and sale of oil and natural gas.
Our reserves and production will decline, and unless we replace our oil and natural gas reserves, our business, financial condition and results of operations will be adversely affected.
Producing oil and natural gas reserves ultimately results in declining production that will vary depending on reservoir characteristics and other factors. Thus, our future oil and natural gas production and resulting cash flow and earnings are directly dependent upon our success in developing our current reserves and finding additional recoverable reserves. We may not be able to develop, find or acquire additional reserves to replace our current and future production at acceptable costs.
25
Our business involves numerous operating hazards and exposure to significant weather and climate risks. We have not insured and cannot fully insure against all risks related to our operations, which could result in substantial claims for which we are underinsured or uninsured.
We have not insured and cannot fully insure against all risks and have not attempted to insure fully against risks where coverage is prohibitively expensive. Our exploration, drilling and other activities are subject to risks such as:
- •
- adverse weather conditions, natural disasters and other environmental disturbances;
- •
- fires and explosions;
- •
- environmental hazards, such as uncontrollable flows of natural gas, oil, brine, well fluids, toxic gas or other pollution
into the environment, including groundwater and shoreline contamination;
- •
- abnormally pressured formations;
- •
- mechanical failures of drilling equipment;
- •
- personal injuries and death, including insufficient worker compensation coverage for third-party contractors who provide
drilling services; and
- •
- acts of terrorism.
In particular, our operations in North Dakota, Montana and Wyoming are conducted in areas subject to extreme weather conditions and often in difficult terrain. Primarily in the winter and spring, our operations are often curtailed because of cold, snow and wet conditions. Unusually severe weather could further curtail these operations, including drilling of new wells or production from existing wells, and depending on the severity of the weather, could have a material adverse effect on our business, financial condition and results of operations. In addition, weather conditions and other events could temporarily impair our ability to transport our oil and natural gas production.
We do not carry business interruption insurance coverage. Losses and liabilities arising from uninsured and underinsured events, which could arise from even one catastrophic accident, could reduce the funds available for our exploration, development and production activities and could materially and adversely affect our business, results of operations and financial condition.
We have limited control over activities in properties we do not operate, which could reduce our production and revenues, affect the timing and amounts of capital requirements and potentially result in a dilution of our respective ownership interest in the event we are unable to make any required capital contributions.
We do not operate all of the properties in which we have an interest. As a result, we may have a limited ability to exercise influence over normal operating procedures, expenditures or future development of underlying properties and their associated costs. For all of the properties that are operated by others, we are dependent on their decision-making with respect to day-to-day operations over which we have little control. The failure of an operator of wells in which we have an interest to adequately perform operations, or an operator's breach of applicable agreements, could reduce production and revenues we receive from that well. The success and timing of our drilling and development activities on properties operated by others depend upon a number of factors outside of our control, including the timing and amount of capital expenditures, the available expertise and financial resources, the inclusion of other participants and the use of technology. Since we do not own a majority interest in many of the wells we do not operate, we may not be in a position to remove the operator in the event of poor performance.
In particular, we are party to a joint venture agreement with a third party that relates to the development of certain of our properties in Dunn County, North Dakota. Pursuant to this agreement, we are required to pay 50% of the drilling expenses attributable to our joint venture's proportionate
26
interest incurred in the area of mutual interest, which includes the drilling expenses associated with a new well spud during the fourth quarter of 2010. We allocated $40 million of our 2011 capital budget toward the payment of these drilling expenses. If the expenses associated with our joint venture partner's exploration activity exceed our current expectations or if our joint venture partner mobilizes additional drilling rigs during 2011, we may be required to make significantly higher capital contributions to satisfy our proportionate share of the exploration costs. If such capital contributions are required, we may not be able to obtain the financing necessary to satisfy our obligations or we may have to reallocate our anticipated capital expenditure budget. In the event that we do not participate in future capital contributions with respect to this joint venture agreement or any other agreements relating to properties we do not operate, our respective ownership interest could be diluted.
We depend on a limited number of customers for sales of our oil. We are exposed to credit risk if one or more of our significant customers becomes insolvent and fails to pay amounts owed to us.
For the year ended December 31, 2010, approximately 75% of our oil revenue was from one customer. We also sell our production to a number of other customers, and we believe that those customers, along with other purchasers, would purchase all or substantially all of our production in the event that our major customer curtailed its purchases. It is possible that one or more of our customers will become financially distressed and default on their obligations to the Company. Furthermore, bankruptcy of one or more of our customers, or some other similar procedure, might make it difficult for us to collect all or a significant portion of amounts owed by the customers. Our inability to collect our accounts receivable could have a material adverse effect on our results of operations.
The concentration of credit risk in a single industry affects our overall exposure to credit risk because customers may be similarly affected by changes in economic and other conditions. Although we have not been directly affected, we are aware that some refiners have filed for bankruptcy protection, which has caused the affected producers to not receive payment for the production that was delivered. If economic conditions deteriorate, it is likely that additional, similar situations will occur which will expose us to added risk of not being paid for oil or natural gas that we deliver. We do not obtain credit protections such as letters of credit, guarantees or prepayments from our purchasers. We are unable to predict what impact the financial difficulties of any of our purchasers may have on our future results of operations and liquidity.
Our interests are held in the form of leases that we may be unable to retain and the title to our properties may be defective.
Our properties are held under leases and working interests in leases. Generally, the leases we are a party to provide for a fixed term, but contain a provision that allows us to extend the term of the lease so long as we are producing oil or natural gas in quantities to meet the required payments under the lease. If we or the holder of a lease fails to meet the specific requirements of the lease regarding delay rental payments, continuous production or development, or similar terms, portions of the lease may terminate or expire. There can be no assurance that any of the obligations required to maintain each lease will be met. The termination or expiration of our leases or the working interests relating to leases may reduce our opportunity to exploit a given prospect for oil and natural gas production and thus have a material adverse effect on our business, results of operation and financial condition.
It is our practice in acquiring oil and natural gas leases or interests in oil and natural gas leases not to undergo the expense of retaining lawyers to fully examine the title to the interest to be placed under lease or already placed under lease. Rather, we rely upon the judgment of oil and natural gas lease brokers or landmen who actually do the field work in examining records in the appropriate governmental office before attempting to place under lease a specific interest. We believe that this practice is widely followed in the oil and natural gas industry.
27
Prior to drilling a well for oil and natural gas, it is the normal practice in the oil and natural gas industry for the person or company acting as the operator of the well to hire a lawyer to examine the title to the unit within which the proposed oil and natural gas well is to be drilled. Frequently, as a result of such examination, curative work must be done to correct deficiencies in the marketability of the title. The work entails expense and might include obtaining an affidavit of heirship or causing an estate to be administered. The examination made by the title lawyers may reveal that the oil and natural gas lease or leases are worthless, having been purchased in error from a person who is not the owner of the mineral interest desired. In such instances, the amount paid for such oil and natural gas lease or leases may be lost.
Properties that we acquire may not produce oil or natural gas as projected, and we may be unable to determine reserve potential, identify liabilities associated with the properties or obtain protection from sellers against them, which could cause us to incur losses.
One of our growth strategies is to pursue selective acquisitions of undeveloped leaseholder oil and natural gas reserves. If we choose to pursue an acquisition, we will perform a review of the target properties that we believe is consistent with industry practices. However, these reviews are inherently incomplete. Generally, it is not feasible to review in depth every individual property involved in each acquisition. Even a detailed review of records and properties may not necessarily reveal existing or potential problems, nor will it permit a buyer to become sufficiently familiar with the properties to assess fully their deficiencies and potential. We may not perform an inspection on every well, and environmental problems, such as groundwater contamination, are not necessarily observable even when an inspection is undertaken. Even when problems are identified, we may not be able to obtain effective contractual protection against all or part of those problems, and we may assume environmental and other risks and liabilities in connection with the acquired properties.
Our large inventory of undeveloped acreage and large percentage of undeveloped proved reserves may create additional economic risk.
Our success is largely dependent upon our ability to develop our large inventory of future drilling locations, undeveloped acreage and undeveloped reserves. As of December 31, 2010, approximately 62% of our total proved reserves were undeveloped. To the extent our drilling results are not as successful as we anticipate, natural gas and oil prices decline, or sufficient funds are not available to drill these locations and reserves, we may not capture the expected or projected value of these properties. In addition, delays in the development of our reserves or increases in costs to drill and develop such reserves will reduce the PV-10 value of our estimated proved undeveloped reserves and future net revenues estimated for such reserves and may result in some projects becoming uneconomic.
We depend on our key management personnel and technical experts and the loss any of these individuals could adversely affect our business.
If we lose the services of our key management personnel, technical experts or are unable to attract additional qualified personnel, our business, financial condition, results of operations, development efforts and ability to grow could suffer. We have assembled a team of engineers and geologists who have considerable experience in applying advanced horizontal drilling and completion technology to explore for and to develop oil and natural gas. We depend upon the knowledge, skill and experience of these experts to assist us in improving the performance and reducing the risks associated with our participation in oil and natural gas exploration and development projects. In addition, the success of our business depends, to a significant extent, upon the abilities and continued efforts of our management.
28
Marketing and transportation constraints in the Williston Basin could adversely affect our operations and result in significant fluctuations in our realized prices for oil and, to a lesser extent, natural gas.
We deliver oil and natural gas through gathering systems and pipelines that we do not own. These facilities may not be available to us in the future. In particular, the Williston Basin crude oil marketing and transportation environment has historically been characterized by periods when oil production has surpassed local transportation and refining capacity. These factors could force us to shut-in producing wells, delay the commencement of production, or discontinue development plans for some of our properties. In addition, these factors have resulted, and could continue to result, in substantial discounts in the price received for crude oil compared to benchmark prices, such as the West Texas Intermediate crude oil prices. The persistence of such constraints could have a material adverse effect on our financial condition and results of operations.
Operations on the Fort Berthold Indian Reservation of the Three Affiliated Tribes in North Dakota are subject to various federal and tribal regulations and laws, any of which may increase our costs and delay our operations.
Various federal agencies within the U.S. Department of the Interior, particularly the Bureau of Ocean Energy Management, Regulation and Enforcement (formerly the Minerals Management Service) and the Bureau of Indian Affairs, along with the Three Affiliated Tribes, promulgate and enforce regulations pertaining to operations on the Fort Berthold Indian Reservation. In addition, the Three Affiliated Tribes is a sovereign nation having the right to enforce laws and regulations independent from federal, state and local statutes and regulations. These tribal laws and regulations include various taxes, fees and other conditions that apply to lessees, operators and contractors conducting operations on Native American tribal lands. Lessees and operators conducting operations on tribal lands are generally subject to the Native American tribal court system. One or more of these factors may increase our costs of doing business on the Fort Berthold Indian Reservation and may have an adverse impact on our ability to effectively transport products within the Fort Berthold Indian Reservation or to conduct our operations on such lands.
Our level of indebtedness may increase and reduce our financial flexibility.
As of December 31, 2010, we had approximately $40 million in outstanding debt. In the future, we may incur additional indebtedness in order to make future acquisitions or to develop our properties.
Our level of indebtedness could affect our operations in several ways, including the following:
- •
- a significant portion of our cash flows could be used to service our indebtedness;
- •
- a high level of debt would increase our vulnerability to general adverse economic and industry conditions;
- •
- the covenants contained in the agreements governing our outstanding indebtedness will limit our ability to borrow
additional funds, dispose of assets, pay dividends and make certain investments;
- •
- a high level of debt may place us at a competitive disadvantage compared to our competitors that are less leveraged and
therefore, may be able to take advantage of opportunities that our indebtedness would prevent us from pursuing;
- •
- our debt covenants may also affect our flexibility in planning for, and reacting to, changes in the economy and in our
industry;
- •
- a high level of debt may make it more likely that a reduction in the borrowing base of our revolving credit facility following a periodic redetermination could require us to repay a portion of our then outstanding bank borrowings; and
29
- •
- a high level of debt may impair our ability to obtain additional financing in the future for working capital, capital expenditures, acquisitions, general corporate or other purposes.
A high level of indebtedness increases the risk that we may default on our debt obligations. Our ability to meet our debt obligations and to reduce our level of indebtedness depends on our future performance. General economic conditions, oil and natural gas prices and financial, business and other factors affect our operations and our future performance. Many of these factors are beyond our control. We may not be able to generate sufficient cash flows to pay the interest on our debt and future working capital, borrowings or equity financing may not be available to pay or refinance such debt. Factors that will affect our ability to raise cash through an offering of our capital stock or a refinancing of our debt include financial market conditions, the value of our assets and our performance at the time we need capital.
In addition, our borrowing base under our revolving credit facility is subject to periodic redeterminations. We could be forced to repay a portion of our bank borrowings due to redeterminations of our borrowing base. If we are forced to do so, we may not have sufficient funds to make such repayments. If we do not have sufficient funds and are otherwise unable to negotiate renewals of our borrowings or arrange new financing, we may have to sell significant assets or our debt repayment obligations could be accelerated. Any such sale or acceleration could have a material adverse effect on our business and financial results.
We may be subject to risks in connection with acquisitions and the integration of significant acquisitions may be difficult.
We periodically evaluate acquisitions of reserves, properties, prospects and leaseholds and other strategic transactions that appear to fit within our overall business strategy. The successful acquisition of producing properties requires an assessment of several factors, including:
- •
- recoverable reserves;
- •
- future oil and natural gas prices and their appropriate differentials;
- •
- development and operating costs; and
- •
- potential environmental and other liabilities.
The accuracy of these assessments is inherently uncertain. In connection with these assessments, we perform a review of the subject properties that we believe to be generally consistent with industry practices. Our review will not reveal all existing or potential problems nor will it permit us to become sufficiently familiar with the properties to fully assess their deficiencies and potential recoverable reserves. Inspections may not always be performed on every well, and environmental problems are not necessarily observable even when an inspection is undertaken. Even when problems are identified, the seller may be unwilling or unable to provide effective contractual protection against all or part of the problems. We often are not entitled to contractual indemnification for environmental liabilities and acquire properties on an "as is" basis.
Significant acquisitions and other strategic transactions may involve other risks, including:
- •
- diversion of our management's attention to evaluating, negotiating and integrating significant acquisitions and strategic
transactions;
- •
- challenge and cost of integrating acquired operations, information management and other technology systems and business
cultures with those of ours while carrying on our ongoing business;
- •
- difficulty associated with coordinating geographically separate organizations;
30
- •
- challenge of attracting and retaining personnel associated with acquired operations; and
- •
- failure to realize the full benefit that we expect in estimated proved reserves, production volume, cost savings from operating synergies or other benefits anticipated from an acquisition, or to realize these benefits within the expected time frame.
The process of integrating operations could cause an interruption of, or loss of momentum in, the activities of our business. Members of our senior management may be required to devote considerable amounts of time to this integration process, which will decrease the time they will have to manage our business. If our senior management is not able to effectively manage the integration process, or if any significant business activities are interrupted as a result of the integration process, our business could suffer.
Risks Relating to Our Industry
Oil and natural gas prices are volatile. A substantial or extended decline in oil prices and, to a lesser extent, natural gas prices, could adversely affect our financial position, financial results, cash flows, access to capital and ability to grow.
Historically, the markets for natural gas and oil have been volatile and they are likely to continue to be volatile. As with most other companies involved in resource exploration and development, we may be adversely affected by future increases in the costs of conducting exploration, development and resource extraction that may not be fully offset by increases in the price received on sales of oil or natural gas. Our focus on exploration activities therefore exposes us to greater risks than are generally encountered in later-stage oil and natural gas property development companies.
The economic success of any drilling project will depend on numerous factors, including:
- •
- our ability to drill, complete and operate wells;
- •
- our ability to estimate the volumes of recoverable reserves relating to individual projects;
- •
- rates of future production;
- •
- future commodity prices; and
- •
- investment and operating costs and possible environmental liabilities.
Wide fluctuations in natural gas and oil prices may result from relatively minor changes in the supply of and demand for natural gas and oil, market uncertainty and other factors that are beyond our control, including:
- •
- worldwide and domestic supplies of natural gas and oil;
- •
- weather conditions;
- •
- the level of consumer demand;
- •
- the price and availability of alternative fuels;
- •
- technological advances affecting energy consumption;
- •
- the proximity and capacity of natural gas pipelines and other transportation facilities;
- •
- the price and level of foreign imports;
- •
- domestic and foreign governmental regulations and taxes;
- •
- the nature and extent of regulation relating to carbon dioxide and other greenhouse gas emissions;
31
- •
- the actions of the Organization of Petroleum Exporting Countries;
- •
- political instability or armed conflict in oil-producing regions; and
- •
- overall domestic and global economic conditions.
Volatile oil and natural gas prices make it difficult to estimate the value of producing properties for acquisition and often cause disruption in the market for oil and natural gas producing properties, as buyers and sellers have difficulty agreeing on such value. Price volatility also makes it difficult to budget for and project the return on acquisitions and development and exploitation projects.
Our revenues, operating results, profitability and future rate of growth depend primarily upon the prices we receive for oil and, to a lesser extent, natural gas, that we sell. Prices also affect the amount of cash flow available for capital expenditures and our ability to borrow money or raise additional capital. In addition, we may need to record asset carrying value write-downs if prices fall, as was the case in 2008 and 2007. A significant decline in the prices of natural gas or oil could adversely affect our financial position, financial results, cash flows, access to capital and ability to grow.
Oil and natural gas are commodities subject to price volatility based on many factors outside the control of producers, and low prices may make properties uneconomic for future production.
Oil and natural gas are commodities, and, therefore, their prices are subject to wide fluctuations in response to relatively minor changes in supply and demand. Historically, the markets for oil and natural gas have been volatile. These markets will likely continue to be volatile in the future. The prices a producer may expect and its level of production depend on numerous factors beyond its control, such as:
- •
- changes in global supply and demand for oil and natural gas;
- •
- economic conditions in the United States and Canada;
- •
- the actions of the Organization of Petroleum Exporting Countries;
- •
- government regulation;
- •
- the price and quantity of imports of foreign oil and natural gas;
- •
- political conditions, including embargoes, in oil- and natural gas-producing regions;
- •
- the level of global oil and natural gas inventories;
- •
- weather conditions;
- •
- technological advances affecting energy consumption; and
- •
- the price and availability of alternative fuels.
Lower oil and natural gas prices may not only decrease revenues on a per unit basis, but also may reduce the amount of oil and natural gas that can be economically produced. Lower prices will also negatively affect the value of proved reserves.
To attempt to reduce our price risk, in 2010 we implemented a strategy to hedge a portion of our expected future production. We cannot assure you that such transactions will reduce the risk or minimize the effect of any decline in oil or natural gas prices. Any substantial or extended decline in the prices of or demand for oil would have a material adverse effect on our financial condition and results of operations.
32
Lower oil and natural gas prices may cause us to record ceiling test write-downs.
We use the full cost method of accounting to account for our oil and natural gas operations. Accordingly, we capitalize the cost to acquire, explore for and develop oil and natural gas properties. Under full cost accounting rules, the net capitalized costs of oil and natural gas properties may not exceed a "full cost ceiling" which is based upon the present value of estimated future net cash flows from proved reserves, including the effect of hedges in place, discounted at 10%, plus the lower of cost or fair market value of unproved properties. If at the end of any fiscal period we determine that the net capitalized costs of oil and natural gas properties exceed the full cost ceiling, we must charge the amount of the excess to earnings in the period then ended. This is called a "ceiling test write-down." This charge does not impact cash flow from operating activities, but does reduce our net income and stockholders' equity. While we did not recognize any ceiling test write-downs in 2010, we may recognize write-downs in the future if commodity prices continue to decline or if we experience substantial downward adjustments to our estimated proved reserves.
Conducting operations in the oil and natural gas industry subjects us to complex laws and regulations that can have a material adverse effect on the cost, manner and feasibility of doing business.
Companies that explore for and develop, produce and sell oil and natural gas in the United States are subject to extensive federal, state, local and tribal laws and regulations, including complex tax and environmental laws and the corresponding regulations, and are required to obtain various permits and approvals from federal, state, local and tribal agencies and authorities. Our ability to obtain, sustain and renew these permits on acceptable terms and without unfavorable restrictions or conditions is subject to a change in regulations and policies and to the discretion of the applicable governmental agencies or authorities, among other factors. Our inability to obtain, or our loss of or denial of extensions of, any of these permits could limit our ability to conduct our operations as planned. In addition, we may be required to make large expenditures to comply with governmental regulations. Matters subject to regulation include:
- •
- water discharge and disposal permits for drilling operations;
- •
- drilling permits and bonds;
- •
- method of drilling and casing wells;
- •
- plugging and abandoning wells and reclamation and restoration of properties;
- •
- reports concerning operations;
- •
- air quality, noise levels and related permits;
- •
- location and spacing of wells;
- •
- rights-of-way and easements;
- •
- unitization and pooling of properties;
- •
- gathering, storage, transportation and marketing of oil and natural gas;
- •
- taxation; and
- •
- waste transport and disposal permits and requirements.
33
Failure to comply with these laws may result in the suspension or termination of operations and subject us to liabilities and administrative, civil and criminal penalties. Compliance costs can be significant. Moreover, these laws could change in ways that substantially increase the costs of doing business. Any such liabilities, penalties, suspensions, terminations or regulatory changes could materially and adversely affect our business, financial condition and results of operations.
Our operations are subject to environmental, health and safety laws and regulations that may expose us to significant costs and liabilities.
Our oil and natural gas exploration and production operations are subject to stringent and complex federal, state, local and tribal laws and regulations governing health and safety aspects of our operations, the discharge of materials into the environment or otherwise relating to environmental protection. These laws and regulations include, but are not limited to, the federal Clean Water Act, as amended by the Oil Pollution Act, the federal Clean Air Act, the federal Resource Conservation and Recovery Act, the federal Comprehensive Environmental Response, Compensation, and Liability Act, the Safe Drinking Water Act, the Endangered Species Act, the National Environmental Policy Act and the Occupational Safety and Health Act and their state counterparts and similar statutes, which provide for civil, criminal and administrative penalties and other sanctions for violation of their requirements.
These laws and regulations may impose numerous obligations on us and our operations including by requiring us to obtain permits before conducting drilling or underground injection activities; restricting the types, quantities and concentration of materials that we can release into the environment; limiting or prohibiting drilling activities on certain lands lying within wilderness, wetlands and other protected areas or on lands containing protected species; subjecting us to specific health and safety requirements addressing worker protection; imposing substantial liabilities on us for pollution resulting from our operations; and requiring us to organize and report information about the hazardous materials we use in our operations to employees, state and local government authorities and local citizens. Numerous governmental authorities, such as the U.S. Environmental Protection Agency, or the EPA, and analogous state agencies, have the power to enforce compliance with these laws and regulations and the permits issued under them, and their interpretation and enforcement of these laws, regulations and permits have tended to become more stringent over time. Failure to comply with these laws, regulations and permits may result in the assessment of administrative, civil or criminal penalties; the imposition of investigatory, remedial or monitoring obligations; and the issuance of injunctions limiting or prohibiting some or all of our operations.
There is inherent risk of incurring significant environmental costs and liabilities in the performance of our operations because of our handling of petroleum hydrocarbons and wastes; air emissions and wastewater discharges related to our operations; our ownership, lease or operation of real property; and historical industry operations and waste disposal practices. Under certain environmental laws and regulations, we could be subject to strict, joint and several liability for the removal or remediation of contamination at properties we currently own, lease or operate or have owned, leased or operated in the past. These laws often impose liability even if the owner, lessee or operator was not responsible for the contamination, or the contamination resulted from actions taken in compliance with all applicable laws in effect at the time. Private parties, including the owners of properties upon which our wells are drilled and facilities where our petroleum hydrocarbons or wastes are taken for reclamation or disposal, may bring claims against us for property damage or personal injury, including as a result of exposure to hazardous materials, or to enforce compliance with, or seek damages under, applicable environmental laws and regulations. In addition, the risk of accidental spills or releases could expose us to significant liabilities that could have a material adverse effect on our financial condition or results of operations. Changes in environmental laws and regulations occur frequently, and such changes could require us to make significant expenditures to attain and maintain compliance and may otherwise have a material
34
adverse effect on our own results of operations, competitive position or financial condition. We may not be able to recover some or any of these costs from insurance.
The regulations of "over-the-counter" derivatives introduced by the Dodd-Frank Wall Street Reform and Consumer Protection Act (the "Dodd-Frank Act") could adversely impact our hedging strategy.
Through its comprehensive new regulatory regime for derivatives, the Dodd-Frank Act imposes mandatory clearing, exchange-trading and margin requirements on many derivatives transactions (including formerly unregulated over-the-counter derivatives) in which we may engage. The Dodd-Frank Act also creates new categories of regulated market participants who will be subject to significant new capital, registration, recordkeeping, reporting, disclosure, business conduct and other regulatory requirements. The details of these requirements and the parameters of these categories remain to be clarified through rulemaking and interpretations by the CFTC, the SEC, the Federal Reserve and other regulators in a regulatory implementation process. These rules and regulations are expected to be proposed by July 2011.
Nonetheless, based on information available as of the date of this annual report, the possible effect of the Dodd-Frank Act will be to increase our overall costs of entering into derivatives transactions. In particular, new margin requirements, position limits and capital charges, even if not directly applicable to us, may cause an increase in the pricing of derivatives transactions sold by market participants to whom such requirements apply. Administrative costs, due to new requirements such as registration, recordkeeping, reporting, and compliance, even if not directly applicable to us, may also be reflected in higher pricing of derivatives. New exchange-trading and trade reporting requirements may lead to reductions in the liquidity of derivative transactions, causing higher pricing or reduced availability of derivatives, adversely affecting the performance of our hedging strategies. Additionally, the financial counterparties to our derivative instruments may be required to spin off some of their derivatives activities to a separate entity, which may not be as creditworthy as the current counterparty.
The Dodd-Frank Act could result in the cost of executing our hedging strategy increasing significantly, which could potentially result in an undesirable decrease in the amount of oil production we hedge. If our hedging costs increase and we are required to post cash collateral, our business would be adversely affected as a result of reduced cash flow and reduced liquidity. Additionally, in the event that we hedge lower quantities in response to higher hedging costs and increased margin requirements, our exposure to changes in commodity prices would increase, which could result in decreased cash flows.
Federal and state legislation and regulatory initiatives relating to hydraulic fracturing could result in increased costs and additional operating restrictions or delays.
Hydraulic fracturing is an important and common practice that is used to stimulate production of hydrocarbons, particularly natural gas, from tight formations. The process involves the injection of water, sand and chemicals under pressure into rock formations to fracture the surrounding rock and stimulate production. The process is typically regulated by state oil and gas commissions, but is not subject to regulation at the federal level. However, the EPA has commenced a study of the potential environmental impacts of hydraulic fracturing activities, and Congress has recently considered legislation that would require the disclosure of chemicals used by the oil and gas industry in the hydraulic fracturing process. The legislation would have required the reporting and public disclosure of chemicals used in the fracturing process, which could make it easier for third parties opposing the hydraulic fracturing process to initiate legal proceedings based on allegations that specific chemicals used in the fracturing process could adversely affect groundwater. Although the legislation died in January 2011, if new laws or regulations that significantly restrict hydraulic fracturing are reintroduced and adopted, such laws could lead to operational delays or increased operating costs and could result in
35
additional regulatory burdens, making it more difficult to perform hydraulic fracturing and increasing our costs of compliance and doing business.
Changes in tax laws may impair our results of operations and adversely impact the value of our common stock.
The Obama administration's proposed budget for the 2011 and 2012 fiscal year includes numerous proposed tax changes. Among the changes contained in the budget proposal is the elimination of certain key U.S. federal income tax preferences currently available to oil and gas exploration and production companies. These changes include, but are not limited to, (i) the repeal of the percentage depletion allowance for oil and gas properties, (ii) the elimination of current deductions for intangible drilling and development costs, (iii) the elimination of the deduction for certain U.S. production activities, (iv) the repeal of the passive loss exception for working interests in oil and gas properties and (v) an extension of the amortization period for certain geological and geophysical expenditures. The Close Big Oil Tax Loophole Act, which was introduced in the Senate in February 2011, includes many of the same proposals but is limited to taxpayers with annual gross revenues in excess of $100 million. It is not possible at this time to predict how legislation or new regulations that may be adopted to address these proposals would impact our business, but any such future laws and regulations could adversely affect the amount of our taxable income or loss and could have a negative impact on the value of our common stock.
Possible regulation related to global warming and climate change could have an adverse effect on our operations and demand for oil and gas.
Studies over recent years have indicated that emissions of certain gases may be contributing to warming of the Earth's atmosphere. In response to these studies, governments have begun adopting domestic and international climate change regulations that require reporting and reductions of the emission of greenhouse gases. Methane, a primary component of natural gas, and carbon dioxide, a by-product of the burning of oil, natural gas and refined petroleum products, are considered greenhouse gases. In the United States, at the state level, many states, either individually or through multi-state regional initiatives, have begun implementing legal measures to reduce emissions of greenhouse gases, primarily through the planned development of emission inventories or regional greenhouse gas cap and trade programs or have begun considering adopting greenhouse gas regulatory programs. At the federal level, Congress has considered legislation that could establish a cap and trade system for restricting greenhouse gas emissions in the United States. The ultimate outcome of this federal legislative initiative remains uncertain.
In addition to pending climate legislation, the EPA has issued greenhouse gas monitoring and reporting regulations. Beyond measuring and reporting, the EPA issued an "Endangerment Finding" under section 202(a) of the Clean Air Act, concluding greenhouse gas pollution threatens the public health and welfare of current and future generations. The finding serves as a first step to issuing regulations that would require permits for and reductions in greenhouse gas emissions for certain facilities.
In the courts, several decisions have been issued that may increase the risk of claims being filed by government entities and private parties against companies that have significant greenhouse gas emissions. Such cases may seek to challenge air emissions permits that greenhouse gas emitters apply for and seek to force emitters to reduce their emissions or seek damages for alleged climate change impacts to the environment, people, and property.
Any laws or regulations that may be adopted to restrict or reduce emissions of greenhouse gases could require us to incur increased operating and compliance costs. In addition, such laws and
36
regulations may adversely affect demand for the fossil fuels we produce, including by increasing the cost of combusting fossil fuels and by creating incentives for the use of alternative fuels and energy.
The oil and natural gas industry is subject to significant competition, which may adversely affect our ability to compete.
Oil and natural gas exploration is intensely competitive and involves a high degree of risk. In our efforts to acquire oil and natural gas producing properties, we compete with other companies that have greater resources. Many of these companies not only explore for and produce oil and natural gas, but also conduct refining and petroleum marketing operations on a worldwide basis. Their competitive advantages may negatively impact our ability to acquire prospective properties, develop reserves, attract and retain quality personnel and raise capital. Their competitive advantages may also better enable our competitors to sustain the impact of higher exploration and production costs, oil and natural gas price volatility, productivity variances among properties, competition from alternative fuel sources and technologies, overall industry cycles and other factors related to our industry.
Our operations and demand for our products are affected by seasonal factors, which may lead to fluctuations in our operating results.
Our operating results are likely to vary due to seasonal factors. Demand for oil and natural gas products will generally increase during the winter because they are often used as heating fuels. The amount of such increased demand will depend to some extent upon the severity of winter. Because of the seasonality of our business and continuous fluctuations in the prices of our products, our operating results are likely to fluctuate from period to period.
The lack of availability or high cost of drilling rigs, equipment, supplies, insurance, personnel and oil field services could adversely affect our ability to execute our exploration and development plans on a timely basis and within our budget.
Our industry is cyclical and, from time to time, there is a shortage of drilling rigs, equipment, supplies or qualified personnel. During these periods, the costs and delivery times of rigs, equipment and supplies tend to increase, in some cases substantially. In addition, the demand for, and wage rates of, qualified drilling rig crews rise as the number of active rigs in service increases within a geographic area. If increasing levels of exploration and production result in response to strong prices of oil and natural gas, the demand for oilfield services will likely rise, and the costs of these services will likely increase, while the quality of these services may suffer. If the lack of availability or high cost of drilling rigs, equipment, supplies, insurance or qualified personnel were particularly severe in the areas in which we operate, we could be materially and adversely affected.
Risks Relating to Our Common Stock
Future sales or other issuances of our common stock could depress the market for our common stock.
We may seek to raise additional funds through one or more public offerings of our common stock, in amounts and at prices and terms determined at the time of the offering. Any sales of large quantities of our common stock could reduce the price of our common stock, and, to the extent that we raise additional capital by issuing equity securities, our existing stockholders' ownership will be diluted.
Our common stock has a limited trading history and has experienced price and volume volatility.
Our common stock has been trading on the NYSE Amex LLC since June 21, 2006. Prior to listing on the NYSE Amex LLC, our common stock traded on the TSX Venture Exchange, or TSX-V,
37
beginning September 28, 2001. The price of our common stock may be impacted by any of the following, some of which may have little or no relation to our company or industry:
- •
- the breadth of our stockholder base and extent to which securities professionals follow our common stock;
- •
- investor perception of our Company and the oil and natural gas industry, including industry trends;
- •
- domestic and international economic and capital market conditions, including fluctuations in commodity prices;
- •
- responses to quarter-to-quarter variations in our results of operations;
- •
- announcements of significant acquisitions, strategic alliances, joint ventures or capital commitments by us or our
competitors;
- •
- additions or departures of key personnel;
- •
- sales or purchases of our common stock by large stockholders or our insiders;
- •
- accounting pronouncements or changes in accounting rules that affect our financial reporting; and
- •
- changes in legal and regulatory compliance unrelated to our performance.
In addition, the stock market in general and the market for natural gas and oil exploration companies in particular have experienced extreme price and volume fluctuations that have often been unrelated or disproportionate to the operating results or asset values of those companies. These broad market and industry factors may seriously impact the market price and trading volume of our common shares regardless of our actual operating performance.
We have not paid cash dividends on our common stock and do not anticipate paying any dividends on our common stock in the foreseeable future.
We do not anticipate paying cash dividends on our common stock in the foreseeable future. Payment of future cash dividends, if any, will be at the discretion of our board of directors and will depend on our financial condition, results of operations, contractual restrictions, capital requirements, business prospects and other factors that our board of directors considers relevant. Furthermore, our credit agreements with our lender prohibits us from paying dividends with respect to our common stock. Accordingly, investors may only see a return on their investment if the value of our securities appreciates.
Our constating documents permit us to issue an unlimited number of shares without shareholder approval.
Our Articles of Continuation permit us to issue an unlimited number of shares of our common stock. Subject to the requirements of any exchange on which we may be listed, we will not be required to obtain the approval of shareholders for the issuance of additional shares of our common stock. Issuances of shares of our common stock will result in immediate dilution to existing shareholders and may have an adverse effect on the value of their shareholdings.
Sales, or the availability for sale, of substantial amounts of our common stock could adversely affect the value of our common stock.
No prediction can be made as to the effect, if any, that future sales of our common stock, or the availability of common stock for future sales, will have on the market price of our common stock. We have several stockholders that hold a significant number of shares of our common stock. Sales of
38
substantial amounts of our common stock in the public market and the availability of shares for future sale, including by one or more of our significant stockholders or shares of our common stock issuable upon exercise of outstanding options to acquire shares of our common stock, could adversely affect the prevailing market price of our common stock. This in turn would adversely affect the fair value of the common stock and could impair our future ability to raise capital through an offering of our equity securities.
ITEM 1B. UNRESOLVED STAFF COMMENTS
Not applicable.
We have no material legal proceedings pending, and we do not know of any material proceedings contemplated by governmental authorities. There are no material proceedings to which any director, officer or any of our affiliates, any owner of record or beneficially of more than five percent of any class of our voting securities, or any associate of any such director, officer, our affiliates, or security holder, is a party adverse to us or our consolidated subsidiary or has a material interest adverse to us or our consolidated subsidiary.
ITEM 4. [REMOVED AND RESERVED]
39
ITEM 5. MARKET FOR REGISTRANT'S COMMON STOCK, RELATED STOCKHOLDER MATTERS AND ISSUER PURCHASES OF EQUITY SECURITIES
Market Information
Shares of our common stock, no par value, are issued in registered form. The transfer agent for the shares is Computershare Trust Company Inc., 100 University Avenue, 9th Floor, Toronto, Ontario M5J 2Y1. Our common stock has been listed and posted for trading on the NYSE Amex LLC since June 21, 2006 under the symbol "KOG". On February 28, 2011, there were 67 holders of record of our Common Stock which does not include the shareholders for whom shares are held in a nominee or street name.
| |
NYSE Amex LLC | ||||||
|---|---|---|---|---|---|---|---|
Quarter Ended
|
High | Low | |||||
December 31, 2010 |
$ | 6.95 | $ | 3.37 | |||
September 30, 2010 |
$ | 3.63 | $ | 2.43 | |||
June 30, 2010 |
$ | 4.34 | $ | 2.47 | |||
March 31, 2010 |
$ | 3.45 | $ | 2.19 | |||
December 31, 2009 |
$ | 2.78 | $ | 2.03 | |||
September 30, 2009 |
$ | 2.89 | $ | 0.70 | |||
June 30, 2009 |
$ | 1.49 | $ | 0.33 | |||
March 31, 2009 |
$ | 0.58 | $ | 0.16 | |||
Dividend Policy
We have never paid any cash dividends on our common stock and do not anticipate paying any dividends in the foreseeable future. Our current business plan is to retain any future earnings to finance the expansion and development of our business. Any future determination to pay cash dividends will be at the discretion of our board of directors, and will be dependent upon our financial condition, results of operations, capital requirements and other factors as our board may deem relevant at that time.
Exchange Controls
Canada has no system of exchange controls. There are no exchange restrictions on borrowing from foreign countries nor on the remittance of dividends, interest, royalties and similar payments, management fees, loan repayments, settlement of trade debts, or the repatriation of capital. However, any dividends remitted to U.S. Holders, as defined below, will be subject to withholding tax. See "Canadian Federal Income Tax Considerations."
Except as provided in the Investment Canada Act (the "Act"), as amended by the Canada-United States Free Trade Implementation Act (Canada) and the Canada-United States Free Trade Agreement, there are no limitations specific to the rights of non-Canadians to hold or vote our common stock under the laws of Canada or the Yukon Territory or in our charter documents. Our company is not a "Canadian business," as defined in the Act; therefore, the limitations in the Act do not apply to our company.
Certain United States Federal Income Tax Considerations
The following is a general summary of certain material U.S. federal income tax considerations applicable to a U.S. Holder (as defined below) arising from and relating to the acquisition, ownership, and disposition of common shares of the Company.
40
This summary is for general information purposes only and does not purport to be a complete analysis or listing of all potential U.S. federal income tax considerations that may apply to a U.S. Holder arising from and relating to the acquisition, ownership, and disposition of common shares. In addition, this summary does not take into account the individual facts and circumstances of any particular U.S. Holder that may affect the U.S. federal income tax consequences to such U.S. Holder, including specific tax consequences to a U.S. Holder under an applicable tax treaty. Accordingly, this summary is not intended to be, and should not be construed as, legal or U.S. federal income tax advice with respect to any U.S. Holder. Each U.S. Holder should consult its own tax advisor regarding the U.S. federal, U.S. federal alternative minimum, U.S. federal estate and gift, U.S. state and local tax, and foreign tax consequences relating to the acquisition, ownership and disposition of common shares.
No legal opinion from U.S. legal counsel or ruling from the Internal Revenue Service (the "IRS") has been requested, or will be obtained, regarding the U.S. federal income tax consequences of the acquisition, ownership, and disposition of common shares. This summary is not binding on the IRS, and the IRS is not precluded from taking a position that is different from, and contrary to, the positions taken in this summary. In addition, because the authorities on which this summary is based are subject to various interpretations, the IRS and the U.S. courts could disagree with one or more of the positions taken in this summary.
Scope of this Summary
Authorities
This summary is based on the Internal Revenue Code of 1986, as amended (the "Code"), Treasury Regulations (whether final, temporary, or proposed), published rulings of the IRS, published administrative positions of the IRS, U.S. court decisions, the Convention Between Canada and the United States of America with Respect to Taxes on Income and on Capital, signed September 26, 1980, as amended (the "Canada-U.S. Tax Convention"), and U.S. court decisions that are applicable and, in each case, as in effect and available, as of the date of this document. Any of the authorities on which this summary is based could be changed in a material and adverse manner at any time, and any such change could be applied on a retroactive or prospective basis which could affect the U.S. federal income tax considerations described in this summary. This summary does not discuss the potential effects, whether adverse or beneficial, of any proposed legislation that, if enacted, could be applied on a retroactive or prospective basis.
U.S. Holders
For purposes of this summary, the term "U.S. Holder" means a beneficial owner of common shares that is for U.S. federal income tax purposes:
- •
- an individual who is a citizen or resident of the U.S.;
- •
- a corporation (or other entity taxable as a corporation for U.S. federal income tax purposes) organized under the laws of
the U.S., any state thereof or the District of Columbia;
- •
- an estate whose income is subject to U.S. federal income taxation regardless of its source; or
- •
- a trust that (1) is subject to the primary supervision of a court within the U.S. and the control of one or more U.S. persons for all substantial decisions or (2) has a valid election in effect under applicable Treasury regulations to be treated as a U.S. person.
Non-U.S. Holders
For purposes of this summary, a "non-U.S. Holder" is a beneficial owner of common shares that is not a U.S. Holder. This summary does not address the U.S. federal income tax consequences to
41
non-U.S. Holders arising from and relating to the acquisition, ownership, and disposition of common shares. Accordingly, a non-U.S. Holder should consult its own tax advisor regarding the U.S. federal, U.S. federal alternative minimum, U.S. federal estate and gift, U.S. state and local tax, and foreign tax consequences (including the potential application of and operation of any income tax treaties) relating to the acquisition, ownership, and disposition of common shares.
U.S. Holders Subject to Special U.S. Federal Income Tax Rules Not Addressed
This summary does not address the U.S. federal income tax considerations applicable to U.S. Holders that are subject to special provisions under the Code, including the following U.S. Holders: (a) U.S. Holders that are tax-exempt organizations, qualified retirement plans, individual retirement accounts, or other tax-deferred accounts; (b) U.S. Holders that are financial institutions, underwriters, insurance companies, real estate investment trusts, or regulated investment companies; (c) U.S. Holders that are dealers in securities or currencies or U.S. Holders that are traders in securities that elect to apply a mark-to-market accounting method; (d) U.S. Holders that have a "functional currency" other than the U.S. dollar; (e) U.S. Holders that own common shares as part of a straddle, hedging transaction, conversion transaction, constructive sale, or other arrangement involving more than one position; (f) U.S. Holders that acquired common shares in connection with the exercise of employee stock options or otherwise as compensation for services; (g) U.S. Holders that hold common shares other than as a capital asset within the meaning of Section 1221 of the Code (generally, property held for investment purposes); (h) partnerships and other pass-through entities (and investors in such partnerships and entities); or (j) U.S. Holders that own or have owned (directly, indirectly, or by attribution) 10% or more of the total combined voting power of the outstanding shares of the Company. This summary also does not address the U.S. federal income tax considerations applicable to U.S. Holders who are (a) U.S. expatriates or former long-term residents of the U.S. subject to Section 877 of the Code, (b) persons that have been, are, or will be a resident or deemed to be a resident in Canada for purposes of the Tax Act; (c) persons that use or hold, will use or hold, or that are or will be deemed to use or hold common shares in connection with carrying on a business in Canada; (d) persons whose common shares constitute "taxable Canadian property" under the Tax Act; or (e) persons that have a permanent establishment in Canada for the purposes of the Canada-U.S. Tax Convention. U.S. Holders that are subject to special provisions under the Code, including U.S. Holders described immediately above, should consult their own tax advisor regarding the U.S. federal, U.S. federal alternative minimum, U.S. federal estate and gift, U.S. state and local tax, and foreign tax consequences relating to the acquisition, ownership and disposition of common shares.
If an entity that is classified as a partnership for U.S. federal income tax purposes holds common shares, the U.S. federal income tax consequences to such partnership and the partners of such partnership generally will depend on the activities of the partnership and the status of such partners. Partners of entities that are classified as partnerships for U.S. federal income tax purposes should consult their own tax advisor regarding the U.S. federal income tax consequences arising from and relating to the acquisition, ownership, and disposition of common shares.
Tax Consequences Not Addressed
This summary does not address the U.S. state and local, U.S. federal estate and gift, U.S. federal alternative minimum tax or foreign tax consequences to U.S. Holders of the acquisition, ownership, and disposition of common shares. Each U.S. Holder should consult its own tax advisor regarding the U.S. state and local, U.S. federal estate and gift, U.S. federal alternative minimum tax and foreign tax consequences of the acquisition, ownership, and disposition of common shares.
42
U.S. Federal Income Tax Consequences of the Acquisition, Ownership, and Disposition of Common Shares
If the Company is not considered a "passive foreign investment company" (a "PFIC", as defined below) at any time during a U.S. Holder's holding period, the following sections will generally describe the U.S. federal income tax consequences to U.S. Holders of the acquisition, ownership, and disposition of the Company's common shares.
Distributions on Common Shares
A U.S. Holder that receives a distribution, including a constructive distribution, with respect to the Company's common shares will be required to include the amount of such distribution in gross income as a dividend (without reduction for any foreign income tax withheld from such distribution) to the extent of the current or accumulated "earnings and profits" of the Company. To the extent that a distribution exceeds the current and accumulated "earnings and profits" of the Company, such distribution will be treated (a) first, as a tax-free return of capital to the extent of a U.S. Holder's tax basis in the common shares and, (b) thereafter, as gain from the sale or exchange of such common shares (see "Disposition of Common Shares" below). However, the Company does not intend to maintain the calculations of earnings and profits in accordance with U.S. federal income tax principles, and each U.S. Holder should therefore assume that any distribution by the Company with respect to common shares will constitute ordinary dividend income. Dividends received on common shares generally will not be eligible for the "dividends received deduction."
For taxable years beginning before January 1, 2013, a dividend paid by the Company generally will be taxed at the preferential tax rates applicable to long-term capital gains if (a) the Company is a "qualified foreign corporation" (as defined below), (b) the U.S. Holder receiving such dividend is an individual, estate, or trust, and (c) certain holding period requirements are met. The Company generally will be a "qualified foreign corporation" under Section 1(h)(11) of the Code (a "QFC") if (a) the Company is eligible for the benefits of the Canada-U.S. Tax Convention, or (b) common shares of the Company are readily tradable on an established securities market in the U.S. However, even if the Company satisfies one or more of such requirements, the Company will not be treated as a QFC if the Company is a PFIC for the taxable year during which the Company pays a dividend or for the preceding taxable year. (See the section below under the heading "Passive Foreign Investment Company Rules").
If a U.S. Holder fails to qualify for the preferential tax rate applicable to dividends discussed above, a dividend paid by the Company to a U.S. Holder, including a U.S. Holder that is an individual, estate, or trust, generally will be taxed at ordinary income tax rates (and not at the preferential tax rates applicable to long-term capital gains). The dividend rules are complex, and each U.S. Holder should consult its own tax advisor regarding the dividend rules.
Disposition of Common Shares
A U.S. Holder will recognize gain or loss on the sale or other taxable disposition of common shares in an amount equal to the difference, if any, between (a) the amount of cash plus the fair market value of any property received and (b) such U.S. Holder's tax basis in the common shares sold or otherwise disposed of. Subject to the PFIC rules discussed below, any such gain or loss generally will be capital gain or loss, which will be long-term capital gain or loss if common shares are held for more than one year.
Gain or loss recognized by a U.S. Holder on the sale or other taxable disposition of Common Shares generally will be treated as "U.S. source" for purposes of applying the U.S. foreign tax credit rules unless the gain is subject to tax in Canada and is resourced as "foreign source" under the Canada-U.S. Tax Convention and such U.S. Holder elects to treat such gain or loss as "foreign source."
43
Preferential tax rates apply to long-term capital gains of a U.S. Holder that is an individual, estate, or trust. There are currently no preferential tax rates for long-term capital gains of a U.S. Holder that is a corporation. Deductions for capital losses are subject to significant limitations under the Code.
Receipt of Foreign Currency
The amount of any distribution paid in foreign currency to a U.S. Holder in connection with the ownership of common shares, or on the sale, exchange or other taxable disposition of common shares, generally will be equal to the U.S. dollar value of such foreign currency based on the exchange rate applicable on the date of receipt (regardless of whether such foreign currency is converted into U.S. dollars at that time). A U.S. Holder that receives foreign currency and converts such foreign currency into U.S. dollars at a conversion rate other than the rate in effect on the date of receipt may have a foreign currency exchange gain or loss, which generally would be treated as U.S. source ordinary income or loss. If the foreign currency received is not converted into U.S. dollars on the date of receipt, a U.S. Holder will have a basis in the foreign currency equal to its U.S. dollar value on the date of receipt. Each U.S. Holder should consult its own U.S. tax advisor regarding the U.S. federal income tax consequences of receiving, owning, and disposing of foreign currency.
Foreign Tax Credit
A U.S. Holder who pays (whether directly or through withholding) foreign income tax with respect to dividends paid on common shares generally will be entitled, at the election of such U.S. Holder, to receive either a deduction or a credit for such foreign income tax paid. Generally, a credit will reduce a U.S. Holder's U.S. federal income tax liability on a dollar-for-dollar basis, whereas a deduction will reduce a U.S. Holder's income subject to U.S. federal income tax. This election is made on a year-by-year basis and applies to all foreign taxes paid (whether directly or through withholding) by a U.S. Holder during a year.
Complex limitations apply to the foreign tax credit, including the general limitation that the credit cannot exceed the proportionate share of a U.S. Holder's U.S. federal income tax liability that such U.S. Holder's "foreign source" taxable income bears to such U.S. Holder's worldwide taxable income. In applying this limitation, a U.S. Holder's various items of income and deduction must be classified, under complex rules, as either "foreign source" or "U.S. source." In addition, this limitation is calculated separately with respect to specific categories of income. Dividends paid by the Company generally will constitute "foreign source" income and generally will be categorized as "passive income."
Subject to specific rules, foreign taxes paid with respect to any distribution in respect of stock in a PFIC are generally eligible for the foreign tax credit. The rules relating to distributions by a PFIC and their eligibility for the foreign tax credit are complicated, and a U.S. Holder should consult with their own tax advisor regarding the availability of the foreign tax credit with respect to distributions by a PFIC.
The foreign tax credit rules are complex, and each U.S. Holder should consult its own tax advisor regarding the foreign tax credit rules.
Information Reporting; Backup Withholding Tax For Certain Payments
Under U.S. federal income tax law and regulations, certain categories of U.S. Holders must file information returns with respect to their investment in, or involvement in, a foreign corporation. Penalties for failure to file certain of these information returns are substantial. U.S. Holders of common shares should consult with their own tax advisors regarding the requirements of filing information returns, and if applicable, any "mark-to-market election" or "QEF election" (each as defined below).
44
Payments made within the U.S., or by a U.S. payor or U.S. middleman, of dividends on, and proceeds arising from certain sales or other taxable dispositions of, common shares generally will be subject to information reporting and backup withholding tax, at the rate of 28%, if a U.S. Holder (a) fails to furnish such U.S. Holder's correct U.S. taxpayer identification number (generally on Form W-9), (b) furnishes an incorrect U.S. taxpayer identification number, (c) is notified by the IRS that such U.S. Holder has previously failed to properly report items subject to backup withholding tax, or (d) fails to certify, under penalty of perjury, that such U.S. Holder has furnished its correct U.S. taxpayer identification number and that the IRS has not notified such U.S. Holder that it is subject to backup withholding tax. However, U.S. Holders that are corporations generally are excluded from these information reporting and backup withholding tax rules. Any amounts withheld under the U.S. backup withholding tax rules will be allowed as a credit against a U.S. Holder's U.S. federal income tax liability, if any, or will be refunded, if such U.S. Holder furnishes required information to the IRS on a timely basis. Each U.S. Holder should consult its own tax advisor regarding the information reporting and backup withholding tax rules.
Passive Foreign Investment Company Rules
If the Company were to constitute a PFIC (as defined below) for any year during a U.S. Holder's holding period, then certain different and potentially adverse tax consequences would apply to such U.S. Holder's acquisition, ownership and disposition of common shares.
The Company generally will be a PFIC under Section 1297 of the Code if, for a taxable year, (a) 75% or more of the gross income of the Company for such taxable year is passive income or (b) 50% or more of the assets held by the Company either produce passive income or are held for the production of passive income, based on the quarterly average of the fair market value of such assets. "Gross income" generally means all revenues less the cost of goods sold, and "passive income" includes, for example, dividends, interest, certain rents and royalties, certain gains from the sale of stock and securities, and certain gains from commodities transactions. Active business gains arising from the sale of commodities generally are excluded from passive income if substantially all of a foreign corporation's commodities are (a) stock in trade of such foreign corporation or other property of a kind which would properly be included in inventory of such foreign corporation, or property held by such foreign corporation primarily for sale to customers in the ordinary course of business, (b) property used in the trade or business of such foreign corporation that would be subject to the allowance for depreciation under Section 167 of the Code, or (c) supplies of a type regularly used or consumed by such foreign corporation in the ordinary course of its trade or business.
In addition, for purposes of the PFIC income test and asset test described above, if the Company owns, directly or indirectly, 25% or more of the total value of the outstanding shares of another corporation, the Company will be treated as if it (a) held a proportionate share of the assets of such other corporation and (b) received directly a proportionate share of the income of such other corporation. In addition, for purposes of the PFIC income test and asset test described above, "passive income" does not include any interest, dividends, rents, or royalties that are received or accrued by the Company from a "related person" (as defined in Section 954(d)(3) of the Code), to the extent such items are properly allocable to the income of such related person that is not passive income.
Under certain attribution rules, if the Company is a PFIC, U.S. Holders will be deemed to own their proportionate share of any subsidiary of the Company which is also a PFIC (a "Subsidiary PFIC"), and will be subject to U.S. federal income tax on (i) a distribution on the shares of a Subsidiary PFIC or (ii) a disposition of shares of a Subsidiary PFIC, both as if the holder directly held the shares of such Subsidiary PFIC.
The Company does not believe that it was a PFIC for the tax year ended December 31, 2010, and based on current business plans and financial projections, the Company does not expect that it will be a
45
PFIC for the tax year ending December 31, 2011. The determination of whether the Company will be a PFIC for a taxable year depends, in part, on the application of complex U.S. federal income tax rules, which are subject to differing interpretations. In addition, whether the Company will be a PFIC for its current taxable year depends on the assets and income of the Company over the course of each such taxable year and, as a result, cannot be predicted with certainty as of the date of this document. Consequently, there can be no assurance regarding the Company's PFIC status for any taxable year during which U.S. Holders hold common shares, and there can be no assurance that the IRS will not challenge the determination made by the Company concerning its PFIC status.
Under the default PFIC rules, a U.S. Holder would be required to treat any gain recognized upon a sale or disposition of our common shares as ordinary (rather than capital), and any resulting U.S. federal income tax may be increased by an interest charge which is not deductible by non-corporate U.S. Holders. Rules similar to those applicable to dispositions will generally apply to distributions in respect of our common shares which exceed a certain threshold level.
While there are U.S. federal income tax elections that sometimes can be made to mitigate these adverse tax consequences (including, without limitation, the "QEF Election" and the "Mark-to-Market Election"), such elections are available in limited circumstances and must be made in a timely manner. U.S. Holders are urged to consult their own tax advisers regarding the potential application of the PFIC rules to the ownership and disposition of our common shares, and the availability of certain U.S. tax elections under the PFIC rules.
U.S. Holders should be aware that, for each taxable year, if any, that the Company or any Subsidiary PFIC is a PFIC, the Company can provide no assurances that it will satisfy the record keeping requirements of a PFIC, or that it will make available to U.S. Holders the information such U.S. Holders require to make a QEF Election under Section 1295 of the Code with respect of the Company or any Subsidiary PFIC. Each U.S. Holder should consult its own tax advisor regarding the availability of, and procedure for making, a QEF Election with respect to the Company and any Subsidiary PFIC.
The above discussion is only a brief summary of the PFIC rules. The PFIC rules are complex, and each U.S. Holder should consult its own financial advisor, legal counsel, or accountant regarding the PFIC rules and how the PFIC rules may affect the U.S. federal income tax consequences of the acquisition, ownership, and disposition of Common Shares.
Information Reporting; Backup Withholding Tax
Payments made within the U.S., or by a U.S. payor or U.S. middleman, of dividends on, or proceeds arising from the sale or other taxable disposition of, Common Shares generally will be subject to information reporting and backup withholding tax, at the rate of 28%, if a U.S. Holder (a) fails to furnish such U.S. Holder's correct U.S. taxpayer identification number (generally on Form W-9), (b) furnishes an incorrect U.S. taxpayer identification number, (c) is notified by the IRS that such U.S. Holder has previously failed to properly report items subject to backup withholding tax, or (d) fails to certify, under penalty of perjury, that such U.S. Holder has furnished its correct U.S. taxpayer identification number and that the IRS has not notified such U.S. Holder that it is subject to backup withholding tax. However, U.S. Holders that are corporations generally are excluded from these information reporting and backup withholding tax rules. Any amounts withheld under the U.S. backup withholding tax rules will be allowed as a credit against a U.S. Holder's U.S. federal income tax liability, if any, or will be refunded, if such U.S. Holder furnishes required information to the IRS. Each U.S. Holder should consult its own tax advisor regarding the information reporting and backup withholding tax rules.
46
Sales of Unregistered Securities
During the year ended December 31, 2010, we did not have any sale of securities in transactions that were not registered under the Securities Act of 1933, as amended.
Issuer Purchases of Equity Securities
During the fiscal year ended December 31, 2010, neither the Company nor any affiliated purchaser purchased any of the Company's equity securities.
ITEM 6. SELECTED CONSOLIDATED FINANCIAL INFORMATION
The following tables set forth selected consolidated financial data as of and for the years ended December 31, 2010, 2009, 2008, 2007, and 2006. The data as of and for the fiscal years ended December 31 for the respective years was derived from our audited annual consolidated financial statements included elsewhere in this Form 10-K.
You should read the following selected consolidated financial data together with our historical consolidated financial statements, including the related notes, and "Management's Discussion and Analysis of Financial Conditions and Results of Operations" included elsewhere in this Form 10-K. Also see "Recently Adopted Accounting Pronouncements" included in the notes to the consolidated financial statements included elsewhere in this Form 10-K.
| |
(In thousands) | |||||||||||||||
|---|---|---|---|---|---|---|---|---|---|---|---|---|---|---|---|---|
| |
For the Years Ended December 31, | |||||||||||||||
| |
2010 | 2009 | 2008 | 2007 | 2006 | |||||||||||
Income Statement Data: |
||||||||||||||||
Revenue |
$ |
24,856 |
$ |
11,338 |
$ |
6,965 |
$ |
9,320 |
$ |
4,965 |
||||||
Cost and expenses, excluding impairment |
27,219 | 13,901 | 15,963 | 13,506 | 7,751 | |||||||||||
Asset impairment |
— | — | 47,500 | 34,000 | — | |||||||||||
Net loss |
(2,402 | ) | (2,563 | ) | (56,498 | ) | (38,186 | ) | (2,786 | ) | ||||||
Basic and diluted net loss per common share |
$ | (0.02 | ) | $ | (0.02 | ) | $ | (0.62 | ) | $ | (0.44 | ) | $ | (0.04 | ) | |
No dividends have been declared in any of the periods presented above.
| |
(In thousands) | |||||||||||||||
|---|---|---|---|---|---|---|---|---|---|---|---|---|---|---|---|---|
| |
For the Years Ended December 31, | |||||||||||||||
| |
2010 | 2009 | 2008 | 2007 | 2006 | |||||||||||
Balance Sheet Data: |
||||||||||||||||
Current assets |
$ |
135,316 |
$ |
37,005 |
$ |
20,655 |
$ |
15,378 |
$ |
61,117 |
||||||
Property and equipment, net |
232,662 | 42,236 | 17,843 | 58,386 | 52,250 | |||||||||||
Total assets |
369,937 | 79,683 | 39,016 | 74,331 | 113,774 | |||||||||||
Current liabilities |
25,427 | 8,694 | 5,231 | 5,163 | 9,879 | |||||||||||
Stockholders' equity |
$ | 299,047 | $ | 69,928 | $ | 32,998 | $ | 68,293 | $ | 103,645 | ||||||
Basic and diluted weighted-average common shares outstanding |
131,444 | 103,689 | 90,739 | 87,743 | 71,425 | |||||||||||
47
ITEM 7. MANAGEMENT'S DISCUSSION AND ANALYSIS OF FINANCIAL CONDITION AND RESULTS OF OPERATIONS
The following discussion and analysis should be read in conjunction with the "Selected Consolidated Financial Information" in Item 6 above and our historical consolidated financial statements and the accompanying notes included elsewhere in this Form 10-K.
Overview and 2010 Key Developments
We are an independent energy company focused on the exploration, exploitation, acquisition and production of natural gas and crude oil in the United States. Our oil and natural gas reserves and operations are primarily concentrated in the Williston Basin of North Dakota and Montana and in the Green River Basin of Wyoming and Colorado. Kodiak's historic focus has been to internally identify prospects, acquire lands encompassing those prospects and evaluate those prospects using subsurface geology and geophysical data and exploratory drilling. We have developed an oil and natural gas asset base of proved reserves, as well as a portfolio of development and exploratory drilling opportunities on high potential conventional and non-conventional oil and natural gas prospects that we have the opportunity to explore, drill and develop. We will continue to evaluate and invest in acquisitions and internally generated prospects to increase the value of the Company.
Smokey/Polar Acquisition
On November 30, 2010, we closed the acquisition of oil and gas properties located in the areas known as the Smokey and Polar prospects. The acquisition, comprised of producing properties and undeveloped leasehold, together with various other related permits, contracts, equipment, data and other assets, is located in McKenzie, Williams and Divide Counties of North Dakota. We funded the cash purchase price of $110 million with cash on hand and borrowings under an expanded revolving credit facility and a new second lien term loan.
As a result of this acquisition, we acquired 19,016 gross mineral acres (11,742 net) in McKenzie County and 4,117 gross (2,752 net) mineral acres in northern Williams County and southern Divide County. The McKenzie County acreage includes four producing wellbores and associated equipment, three of which are operated by us. In McKenzie County, we acquired an approximate 87% working interest and a 70% net revenue interest in the acquired leasehold and subsequently purchased the remaining working interest from unrelated parties. In the Williams and Divide lands, we acquired a 100% working interest and 82% net revenue interest in the acquired leasehold. Because of our high working interest on this leasehold, we expect to operate the majority of the drilling units that will be comprised of this acreage.
Drilling and Completions
As of December 31, 2010, we had 51 total gross (26.0 net) wells on production, of which 34 (21.2 net) wells are Kodiak operated and 35 (17.3 net) wells are in the Williston Basin of North Dakota and Montana primarily in the Bakken. During 2010, we participated in drilling 22 gross (10.9) wells, and we have completed 16 gross (6.5 net) as producers. This compares to 11 gross (5.5) net wells drilled and 9 gross (4.8 net) wells completed in 2009. Six gross wells were waiting on completion at year end 2010 and have either been scheduled for completion during early 2011 or are part of multi-well pads that are expected to be completed after all the wells have been drilled on each shared pad. Eleven of the 16 wells completed in 2010 are Kodiak operated, four of which were completed with lateral lengths greater than 5,000 feet.
In 2010, the focus of our drilling and completion activity in the Bakken was to continue to improve on the performance and resulting financial returns of our wells primarily by modifying our completion process. As compared to 2009, we used larger volumes of proppants, tighter spacing and more fracture
48
stimulation (frac) stages and improved gel designs. We believe that these efforts have improved our wells' performance as suggested by the increased production over their early life. The graph below compares Bakken wells that were completed in 2009 to Bakken wells that were completed in 2010 under comparable conditions with the exception of the changes in technique discussed above. Although the population is a limited number of wells (8 wells in 2009 and 5 in 2010), and although the comparison relates only to the initial production of the wells, we believe the comparison suggests the potential impact that our improved techniques may have had on well performance. In the three longer laterals drilled and completed in 2009 we averaged 319 BOEPD for the first 360 days of production for a cumulative average total BOE of 115,000. This compares to two longer laterals completed in the third quarter of 2010 that averaged 689 BOEPD for the first 180 days of production or a cumulative average total of 122,000 BOE. Likewise we have experienced the same improvement with our shorter laterals. We completed five shorter laterals in 2009 and early 2010 which averaged 181 BOEPD for the first 360 days of production for an average cumulative production of 65,000 BOE. We completed three wells with similar length of laterals in 2010 and achieved average production rates of 401 BOEPD and cumulative production of 72,000 BOE in the first 180 days of production. Completion techniques have been and will continue to be evaluated with the expectation of further enhancing our completion methods as more data becomes available.
Production Comparison—Representative Long and Short Lateral Wells
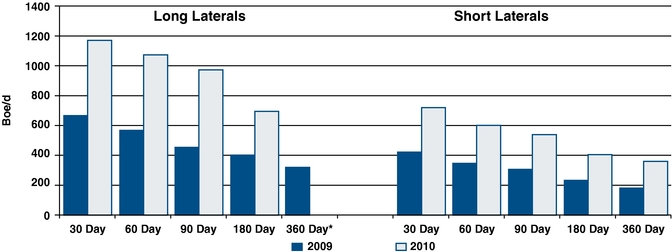
- *
- Long laterals completed in 2010 have not reached 360 days in production history.
As we continue to develop the Bakken, we will predominantly drill long horizontal laterals (up to 10,000 feet) on 1,280 acre drilling blocks and utilize multi-well pads. We believe that we achieve stronger internal rates of return on our wells with long laterals as compared to those with short laterals. Multi-well pads allow us to efficiently drill, complete and operate our wells and reduce costs with fewer rig mobilizations, while also minimizing the impact on the surface locations. All of the 28 gross operated wells budgeted for 2011 are expected to have longer horizontal laterals.
49
Another key focus of our 2010 oil and gas operations was to further evaluate the density of drilling and the potential of the Three Forks Formation. During 2010, we completed wells on our Dunn County acreage in the middle Bakken Formation with laterals approximately 1,300 feet apart from each other. Testing indicated very little communication during the fracture stimulation and no change in production rates was evident. This work supports our belief that these lands can be developed with four wells per drilling unit. Late in 2010, we partially completed our first well in the Three Forks Formation on our Dunn County leasehold. While only six of the anticipated 22 stages are completed due to a leak in the frac string that was subsequently repaired, early results were indicative of the high potential of the formation and very little communication with the middle Bakken reservoir, suggesting separate reservoirs. We plan to complete the remaining stages of the well in early 2011. Although we have not tested the density of wells in the Three Forks Formation, the general belief based upon industry activity is that the Three Forks Formation could support three to four wells within a drilling unit. We are testing these same spacing patterns in McKenzie County and expect to have additional information later in the year.
One key part of our exploration and development program has been the use of pad drilling. Starting in 2010, we are now drilling up to four wells from each pad and we believe that, in future years, the number of wells off of each pad could grow. The significance of pad drilling is primarily directed to mobilization and demobilization of our drilling rigs. As the industry is facing a shortage of services, the use of pad drilling has become even more important as it lowers the number of moves required between wells, eliminating the need for trucks to move the equipment which are in tight demand. Furthermore, we believe we will see some efficiencies in our completion work as we can eliminate mobilization and demobilization time for our pressure pumping company allowing it more efficient use of its time. In 2011, we plan to drill all wells from two-well to four-well pads.
Our Williston Basin leasehold is largely contiguous and by virtue of our high working interest and operatorship, we are generally able to control the development pace and location of surface facilities. This strategy, combined with pad drilling and long laterals, will maximize the efficiency of our drilling program and minimize the infrastructure required to connect our wells to sales pipelines. As a result, we plan our locations to minimize the number of wells required to hold our acreage by establishing production within the primary terms of our leases.
Oil and Gas Reserves
As of December 31, 2010, we had estimated proved reserves of 10.0 million barrels ("MMBbls") of oil and 9.0 billion cubic feet ("BCF") of natural gas with a present value discounted at 10% of $161.1 million, before income tax effect, or $154.6 million after the effect of income taxes. Our reserves are comprised of 87% crude oil and 13% natural gas on an energy equivalent basis. This is an increase of 162% over our 2009 crude oil reserves and 133% over our 2009 natural gas reserves.
All of our reserves are located within the continental United States with 95% in the Williston Basin in North Dakota and Montana. Netherland Sewell & Associates, Inc. ("Netherland"), our independent petroleum engineering consulting firm, prepared our estimated reserves as of December 31, 2010, 2009 and 2008. Reserve estimates are inherently imprecise and remain subject to revisions based on production history, results of additional exploration and development drilling, results of secondary and tertiary recovery applications, prevailing oil and natural gas prices, and other factors. You should read the notes following the table below and the information following the notes to our
50
audited financial statements for the years ended December 31, 2010 and 2009 included in this Form 10-K in conjunction with the following reserve estimates:
| |
As of December 31, | ||||||
|---|---|---|---|---|---|---|---|
| |
2010(4) | 2009(4) | |||||
Proved Developed Oil Reserves (Thousands of Barrels, or MBbls) |
3,756.4 | 1,170.4 | |||||
Proved Undeveloped Oil Reserves (MBbls) |
6,254.0 | 2,646.3 | |||||
Total Proved Oil Reserves (MBbls) |
10,010.4 | 3,816.7 | |||||
Proved Developed Gas Reserves (Million Cubic Feet, or MMcf) |
3,653.0 | 1,454.9 | |||||
Proved Undeveloped Gas Reserves (MMcf) |
5,307.2 | 2,393.6 | |||||
Total Proved Gas Reserves (MMcf) |
8,960.2 | 3,848.5 | |||||
Total Proved Gas Equivalents (Million Cubic Feet Equivalent, or MMcfe)(1) |
69,022.6 | 26,748.9 | |||||
Total Proved Oil Equivalents (Thousands of Barrels Equivalent, or MBOE)(1) |
11,503.8 | 4,458.2 | |||||
Present Value of Estimated Future Net Revenues After Income Taxes, Discounted at 10%(2)(3) |
$ | 154,568.0 | $ | 39,062.8 | |||
- (1)
- We
converted oil to Mcf of gas equivalent at a ratio of one barrel to six Mcf.
- (2)
- We
calculated the present value of estimated future net revenues as of December 31, 2010 and 2009 using the 12 month arithmetic average first
of month price January through December for the respective years. The average resulting price used as of December 31, 2010 was $5.07 per Mcf for natural gas and $69.15 per barrel of oil. The
average resulting price used as of December 31, 2009 was $3.60 per Mcf for natural gas and $51.81 per barrel of oil.
- (3)
- The
Present Value of Estimated Future Net Revenues After Income Taxes, Discounted at 10%, is referred to as the "Standardized Measure." There is a
$6.6 million tax effect in 2010 and no tax effect in 2009 as the tax basis in properties and net operating loss exceeds the future net revenues. See Supplemental Oil and Gas Reserve Information
(Unaudited) following our audited financial statements for the years ended December 31, 2010 and 2009.
- (4)
- The reserves at December 31, 2010 and 2009 were estimated using the definitions in SEC Release No.33-8995 Modernization of Oil and Gas Reporting. The values for the 2010 oil and gas reserves are based on natural gas price of $3.92 per MMBtu (Questar Rocky Mountains price) or $4.39 per MMBtu (Northern Ventura price) and crude oil price of $79.40 per barrel (West Texas Intermediate price). The values for the 2009 reserves are based on natural gas price of $3.02 per MMBtu (Questar Rocky Mountains price) or $3.95 per MMBtu (Northern Ventura price) and crude oil price of $61.08 per barrel (West Texas Intermediate price). All prices are then further adjusted for transportation, quality and basis differentials.
51
The table below summarizes our 2010 reserves by field and by the applicable wells' categorization as of year-end 2009 along with the remaining and ultimate estimated reserves, in total and average per well:
2010 Reserves by Field and Previous Year Category
2009 Reserve Category
|
Gross Wells | Net Wells | Net Remaining Oil Equivalent (MBOE) |
Gross Ultimate EUR (MBOE) |
EUR per Well (MBOE) |
||||||||||||
|---|---|---|---|---|---|---|---|---|---|---|---|---|---|---|---|---|---|
Bakken/Three Forks |
|||||||||||||||||
Proved developed producing |
8 | 4.2 | 1,021.0 | 3,189.2 | 398.64 | ||||||||||||
Proved developed non producing |
2 | 1.4 | 157.9 | 430.6 | 215.29 | ||||||||||||
Proved undeveloped |
8 | 4.2 | 1,530.7 | 3,851.8 | 481.48 | ||||||||||||
Non-proved |
6 | 1.5 | 674.5 | 3,402.2 | 567.04 | ||||||||||||
Acquired in place |
4 | 2.7 | 787.5 | 1,636.8 | 409.21 | ||||||||||||
Total Bakken/Three Forks |
28 | 14.0 | 4,171.5 | 12,510.6 | 2,071.7 | ||||||||||||
Other Fields |
|||||||||||||||||
Proved developed producing |
19 | 10.5 | 147.3 | 1,517.3 | 79.9 | ||||||||||||
Non-proved |
1 | 0.3 | 46.4 | 207.5 | 207.5 | ||||||||||||
Total Other |
20 | 10.9 | 193.7 | 1,724.8 | 86.2 | ||||||||||||
Total Proved Developed(1) |
48 | 24.9 | 4,365.2 | 14,235.4 | 296.6 | ||||||||||||
2009 Reserve Category
|
Gross Wells | Net Wells | Net Remaining Oil Equivalent (MBOE) |
Gross Ultimate EUR (MBOE) |
EUR per Well (MBOE) |
||||||||||||
|---|---|---|---|---|---|---|---|---|---|---|---|---|---|---|---|---|---|
Bakken/Three Forks |
|||||||||||||||||
Proved undeveloped |
6 | 3.7 | 1,509.5 | 3,092.9 | 515.5 | ||||||||||||
Non-proved |
14 | 9.2 | 2,880.5 | 6,773.9 | 483.8 | ||||||||||||
Acquired in place |
7 | 6.1 | 2,748.5 | 3,978.5 | 568.4 | ||||||||||||
Total Bakken/Three Forks |
27 | 19.0 | 7,138.5 | 13,845.3 | 1,567.7 | ||||||||||||
- (1)
- One well remains proved developed non-producing at year-end 2010
The increase in our total proved reserves in 2010 is a result of increased drilling and completion activity in our Bakken acreage and the acquisition of the Smokey/Polar acreage in the fourth quarter of 2010. We drilled a total of 22 gross (10.9 net) wells and completed 16 gross (6.5) net wells incurring a total of $67 million in capital expenditures for these operations. The 16 completed wells include five wells targeting the middle Bakken Formation with longer laterals (over 5,000 feet) and four middle Bakken wells with shorter laterals. When we began drilling operations in the Williston Basin in 2008 and 2009, most of our wells were drilled with lateral lengths less than 5,000 feet. As we continued into 2010, we changed our drilling to include almost entirely longer laterals. As we look to 2011, we expect to be drilling all longer laterals. Also included are five wells drilled by third parties in which we have small non-operated interests and one well completed in Sheridan County, Montana that produces from the Red River Formation. Largely as a result of our extensive drilling program, we increased the number of proved undeveloped (PUD) locations from 15 at year-end 2009 to 27 at year-end 2010. These PUD locations are in offsetting drilling units to our producing wells or the producing wells of other operators. Although we believe our drilling and completion activity in late 2010 demonstrates the
52
viability of multiple locations per drilling unit in the middle Bakken Formation particularly on our Dunn County leasehold where we have completed tighter density drilling, we have limited our PUD reserves to one location per drilling unit pending additional production history from wells in this area. The increased number of PUD locations is also a reflection of our increasing rig count. During 2009, we operated one drilling rig. In early 2010, we brought in a second operated rig and then late in 2010 our joint venture partner brought in its first rig resulting in three drilling rigs which are drilling lands where we have significant working interests. In 2011, we have scheduled a third operated rig to commence drilling activity in the first quarter. We have not included material reserves for the Three Forks Formation as we have only recently completed a well in this formation. However, as we project our 2011 drilling program and beyond, we are anticipating drilling one middle Bakken well and one Three Forks well from each of our drilling pads.
Our total PUD reserves as of December 31, 2010 were 7.1 MMBoe, which represents 62% of our total proved reserves as compared to 68% at December 31, 2009. We had no proved undeveloped reserves at December 31, 2008. Thus, all undeveloped reserves as of December 31, 2009 were primarily a result of our 2009 exploratory drilling activity. At year-end 2009, PUD reserves were attributed to 15 gross locations. Of these 15 gross locations, 8 gross wells were drilled, completed and placed on production in 2010 as result of incurred expenditures of $26.7 million. These eight wells were attributed 1.3 MMBoe at year-end 2009 and at year-end 2010, the same eight wells were estimated to have 1.5 MMBoe of remaining oil and gas reserves. Two of the 2009 PUD locations were further expanded with two wells drilled from each PUD location. In one of these two locations, the additional well was drilled into the Three Forks Formation. Of the seven remaining 2009 PUD locations, as of January 31, 2011, two locations have been drilled but not completed, four locations remain undrilled but are in various stages of preparation and permit acquisition and remain classified as PUD locations at year-end 2010. The PUD reserves on these four wells are estimated to be 1.0 MMBoe at year-end 2010 as compared to 0.9 MMBoe at year-end 2009.
Controls Over Reserve Report Preparation, Technical Qualifications and Technologies Used
Our year-end reserve report is prepared by Netherland based upon a review of property interests being appraised, production from such properties, current costs of operation and development, current prices for production, agreements relating to current and future operations and sale of production, geoscience and engineering data, and other information we provide to them. To ensure accuracy and completeness of the data prior to submission to Netherland, the information we provide is reviewed by the following persons with the following qualifications:
- •
- Senior Reservoir Engineer, Wally O'Connell: Mr. O'Connell, a Registered Professional Engineer, is our
reserves manager and has over 35 years of experience in the oil and gas industry in the areas of engineering and reserves management. He has worked for us since 2007 in the role of reserves
manager. Prior to such time, he served as Exploitation Manager-Wattenberg Area for both Anadarko Petroleum Corporation from 2006 to 2007 and Kerr-McGee Rocky Mountain Corporation from 1998
to 2006. Prior to such time, he served in a variety of lead reservoir and petroleum engineering positions at various companies, including Questa Engineering Corporation, Whiting Petroleum Corporation
and Nicor Exploration Company. He received a Bachelor of Science in Petroleum Engineering from Montana College of Mineral Science and Technology in 1972.
- •
- Vice President Engineering, Russell Branting: Mr. Branting has served as Kodiak's Operations Manager since June 2007. He has more than 20 years of experience focused throughout the Rocky Mountain region, with extensive experience in the Green River Basin in Wyoming. He has served in various positions in petroleum engineering and operations with Western Gas Resources, Inc., Petropro Engineers, Inc., Tesco Underbalanced Drilling Services, Chevron USA, Inc., and Snyder Oil Corporation. He was most recently the Project Engineer for Western Gas
53
- •
- Chief Operating Officer, James Catlin: Mr. Catlin has over 30 years of geologic experience,
primarily in the Rocky Mountain region. He has served as a director of the Company since February 2001 and Chief Operating Officer since June 2006. Mr. Catlin was an owner of CP
Resources LLC, an independent oil and natural gas company, from 1986 to 2001. Mr. Catlin was a founder of Deca Energy and served as its Vice-President from 1980 to 1986. He
worked as a district geologist for Petroleum Inc. and Fuelco prior to such time. He received a Bachelor of Arts and a Masters degree in Geology from the University of Northern Illinois in 1973.
- •
- President and Chief Executive Officer, Lynn Peterson: Mr. Peterson has approximately 30 years of experience in the oil and gas industry. He has served as a director of the Company since November 2001 and President and Chief Executive Officer since July 2002. He was an owner of CP Resources, LLC, an independent oil and natural gas company, from 1986 to 2001. Mr. Peterson served as Treasurer of Deca Energy from 1981 to 1986. Mr. Peterson was employed by Ernst and Whinney as a certified public accountant prior to this time. He received a Bachelor of Science in Accounting from the University of Northern Colorado in 1975.
Resources, Inc. where he was responsible for managing all operations ongoing in the Greater Green River Business Unit, deep Powder River Basin Business Unit and Exploration team. Dr. Branting earned his Ph. D. in Petroleum Engineering from the University of Wyoming in 1993.
The reserves estimates shown herein have been independently evaluated by Netherland, Sewell & Associates, Inc. (NSAI), a worldwide leader of petroleum property analysis for industry and financial organizations and government agencies. NSAI was founded in 1961 and performs consulting petroleum engineering services under Texas Board of Professional Engineers Registration No. F-002699. Within NSAI, the technical persons primarily responsible for preparing the estimates set forth in the NSAI reserves report incorporated herein are Mr. Dan Paul Smith and Mr. John Hattner. Dan has been practicing consulting petroleum engineering at NSAI since 1980. He is a Registered Professional Engineer in the State of Texas (License No. 49093) and has over 30 years of practical experience in petroleum engineering and in the estimation and evaluation of reserves. He graduated from Mississippi State University in 1973 with a Bachelor of Science Degree in Petroleum Engineering. John Hattner has been practicing consulting petroleum geology at NSAI since 1991. John is a Certified Petroleum Geologist and Geophysicist in the State of Texas (License No. 559) and has over 30 years of practical experience in petroleum geosciences, with over 19 years experience in the estimation and evaluation of reserves. He graduated from University of Miami, Florida, in 1976 with a Bachelor of Science Degree in Geology; from Florida State University in 1980 with a Master of Science Degree in Geological Oceanography; and from Saint Mary's College of California in 1989 with a Master of Business Administration Degree. Both technical principals meet or exceed the education, training, and experience requirements set forth in the Standards Pertaining to the Estimating and Auditing of Oil and Gas Reserves Information promulgated by the Society of Petroleum Engineers; both are proficient in judiciously applying industry standard practices to engineering and geoscience evaluations as well as applying SEC and other industry reserves definitions and guidelines.
A variety of methodologies are used to determine our proved reserve estimates. The principal methodologies employed are reservoir simulation, decline curve analysis, volumetric, material balance, advance production type curve matching, petro-physics/log analysis and analogy. Some combination of these methods is used to determine reserve estimates in substantially all of our fields.
For more information regarding our oil and gas reserves, see the discussion under the heading "Supplemental Oil and Gas Reserve Information (Unaudited)", following the footnotes to our financial statements in Item 8.
54
Oil and Gas Sales
In 2010, our crude oil sales averaged 1,184 barrels per day and gas sales averaged 446 Mcf per day. This was an increase of 137% for oil sales and a decrease of 26% for gas sales over the volumes sold in 2009. During 2010, our revenues from oil and gas sales increased by $19.7 million or 174% to $31.0 million. These increases are primarily due to bringing 6.5 net wells on to production in 2010 in addition to commodity prices increases. Of our total increase in oil and gas sales revenue, 87% was due to increased sales volumes and 13% was due to commodity price increases. Total oil and gas production expenses increased 206% to $6.8 million in 2010 from $2.2 million in 2009. Of the $4.6 million increase in 2010, $2.2 million was due to increased production taxes and $2.4 million was due to higher operating costs, primarily related to the additional well count.
Our revenues are directly affected by oil and natural gas commodity prices, which can fluctuate dramatically. The commodity prices are beyond our control and are difficult to predict. We have seen significant volatility in oil and natural gas prices in recent years. Since early 2009, oil prices have steadily increased while natural gas prices have not increased in a similar manner. We believe that spot market prices reflect worldwide concerns about the global economy, producers' ability to ensure sufficient supply to meet increasing demand amid a host of uncertainties caused by political instability, a fluctuating U.S. dollar, and crude oil refining and natural gas infrastructure constraints. Prices that we have historically received have varied widely depending on commodity and location of sales-points. In 2010, we experienced improving crude oil prices in the Williston Basin whereas, in Wyoming, we have not seen an increase in natural gas prices. Overall, the average crude oil price we received during 2010 was $69.89 per barrel versus $58.35 per barrel in 2009, while our average gas price received during 2010 was $4.81 per Mcf compared to $2.84 per Mcf in 2009.
2011 Outlook
Our board of directors approved a $200 million capital expenditure budget for 2011, all of which is allocated to oil and gas activities to continue to develop the Bakken play in the Williston Basin of North Dakota and Montana. As part of the total capital expenditure budget, we have allocated $126.9 million to the drilling of 29 gross (16.7 net) wells and completion of 26 gross (15.8 net) wells on our Dunn County acreage, including $40.0 million for 10 gross (5.0 net) non operated wells operated by our partner ExxonMobil Corporation. For our McKenzie County acreage, we have allocated $60.4 million for drilling nine gross (6.7 net) operated wells and completing 10 gross (7.7 net) operated wells. Because of our predominantly contiguous leasehold, Kodiak's working interest averages approximately 67% in the operated 2011 drilling program, thereby providing flexibility within the budget in identifying suitable well locations and in the timing and size of capital investment.
The 2011 capital expenditure budget is subject to revision due to market conditions, oilfield services and equipment availability, commodity prices and drilling results. Although we continue to explore opportunities to expand our acreage position, we have not allocated any of our 2011 capital budget to acquisitions. Rather, our current budget is allocated entirely to drilling and completing wells and to infrastructure costs related to connecting our wells to gathering systems. Potential leasehold acquisitions would therefore require us to adjust our budget. Kodiak expects to fund the budget from cash on hand, cash flow from operations and potential borrowings under a reserve-based revolving line of credit.
We anticipate operating a three rig drilling program in the Williston Basin, on our acreage in Dunn and McKenzie Counties. We believe our permitting procedures on the lands in Dunn County will provide us with ample permits as we move through the year and we are now starting to permit our 2012 program. Permitting in other parts of North Dakota is less cumbersome and time consuming and we anticipate having adequate permits for our drilling program.
55
Our 2011 and 2012 permitting and drilling programs are designed to move all of our current acreage into held by production (HBP) status within the primary term of our existing leases, and we do not anticipate significant expiration issues with our leases.
During the first quarter of 2011, we have continued to experience difficult weather conditions in the Williston Basin. These conditions have caused delays in completion procedures and have also caused interruptions to our production, as oil tankers have been restricted in physically accessing our locations. We anticipate that we can return our production to more normal levels going into the second quarter of 2011, as not only should the weather conditions improve, but we have connected four of our wells in Dunn County into pipelines and are in the final stages of connecting an additional four wells. With that accomplished, we are able to move oil, gas and water through the pipelines which eliminates our trucking issues.
We are currently scheduled to complete two of our wells in McKenzie County in March 2011. The completion of these wells was scheduled earlier in the quarter but has been delayed due to the inclement weather. As these wells will have few days, if any, of production in the first quarter we would expect our first quarter production to be comparable to the fourth quarter of 2010. We expect to resume our forecasted production schedule in the second quarter of 2011.
As further discussed below, if our existing and potential sources of liquidity are not sufficient to undertake our currently planned expenditures, we may alter this drilling program and capital budget or pursue other sources of capital. There can be no assurance that any such transactions can be completed or that such transactions would satisfy our operating capital requirements. If we are not successful in obtaining sufficient funding or completing an alternative transaction on a timely basis on terms acceptable to us, we would be required to curtail this capital budget which would cause us to be unable to implement our original exploration and drilling program.
Liquidity and Capital Resources
The following table summarizes our sources and uses of cash for each of the three years ended December 31, 2010, 2009 and 2008.
| |
(In thousands) | |||||||||
|---|---|---|---|---|---|---|---|---|---|---|
| |
For the years ended December 31, | |||||||||
| |
2010 | 2009 | 2008 | |||||||
Capital Resources and Liquidity |
||||||||||
Cash and cash equivalents at end of the period |
$ | 101,198 | $ | 24,885 | $ | 7,581 | ||||
Net cash provided by operating activities |
$ | 10,315 | $ | 9,395 | $ | (2,174 | ) | |||
Net cash used in investing activities |
$ | (200,009 | ) | $ | (28,155 | ) | $ | (20,911 | ) | |
Net cash provided by financing activities |
$ | 266,007 | $ | 36,064 | $ | 17,651 | ||||
Increase (decrease) in cash and cash equivalents |
$ | 76,313 | $ | 17,304 | $ | (5,434 | ) | |||
Our primary cash requirements are for the exploration, development and acquisition of oil and gas properties. Historically, including in the last three years, we have financed our operations, property acquisitions and other capital investments from the proceeds of offerings of our equity securities, borrowings under lending arrangements with financial institutions and, more recently to a limited extent, cash generated from operations. During 2010, we did not generate sufficient cash flows from operations to fund our 2010 capital expenditure budget. Consequently, we undertook the following financing arrangements:
- •
- We conducted two equity financings of our common stock in 2010 resulting in net cash provided by financing activities of approximately $224 million. In the first of these financings, we issued 28,750,000 shares of common stock in August 2010 through a public offering for gross proceeds
56
- •
- In May 2010, we established a $200 million revolving line of credit with Wells Fargo Bank, N.A. The borrowing base,
reflecting the maximum amount that may be outstanding under the credit facility, was initially $20 million and subsequently increased to $50 million in November 2010. This facility,
which is currently undrawn, expires under its terms in May 2014, unless the term is extended. For further details on the revolving line of credit see Note 8—Credit Agreement under
Item 8 in this report.
- •
- In November 2010, we established a $40 million second lien facility with Wells Fargo Energy Capital, Inc, which is fully drawn as of December 31, 2010 and expires under its terms in November 2014. This facility has provision for early payment after one year from inception, or November 2011. Such early payment would require varying premiums to be paid over the principal amount. Although we anticipate holding the outstanding borrowing to expiration, we may pre-pay after the one-year period depending on our then existing liquidity position. Changes to our liquidity that may motivate us to pre-pay this debt include increased operating cash flows and the ability to replace this debt with cash obtained through equity offerings or other long-term debt. For further details on the second lien facility see Note 8—Credit Agreement under Item 8 in this report.
of approximately $79 million. In December 2010, we issued 28,750,000 shares of common stock through a public offering for gross proceeds of approximately $158 million.
We are subject to restrictive covenants under each of our revolving line of credit and second lien facility. The ability to maintain these facilities and borrow additional funds is dependent on a number of variables, including our proved reserves, and assumptions regarding the price at which oil and natural gas can be sold.
As of December 31, 2010, we had working capital of $110 million, no outstanding borrowings under our revolving line of credit, a balance on our second lien loan of $40 million, and other significant obligations in respect of both our office lease and our three drilling rig contracts (see the discussion under the heading "Contractual Obligations" below). Our working capital as of December 31, 2010 included $101 million of cash and $18.2 million of prepaid tubular goods to be used in our 2011 drilling program. We believe our cash flows from operations, our existing working capital and increases in our borrowing base, if necessary and available, will be sufficient to meet our planned 2011 capital expenditure budget. If our existing and potential sources of liquidity were not to be sufficient to undertake our currently planned expenditures or any revisions thereto, we may alter our drilling program, pursue joint ventures with third parties, sell interest in one or more of our properties or sell securities of the Company. There can be no assurance that any such transactions can be completed or that such transactions would satisfy our operating capital requirements. If we are not successful in obtaining sufficient funding or completing an alternative transaction on a timely basis on terms acceptable to us, we would be required to curtail our planned expenditures or restructure our operations, and we would be unable to implement our original exploration and drilling program.
As we operate the majority of our acreage, specifically our Williston acreage, we have the ability to adjust our drilling schedule to reflect the changing commodity price or oil field service environment. Should we reduce our ownership and relinquish the right to operate certain properties, we would become subject to obligations imposed by others, without the ability to control our drilling schedule.
Our increase in cash provided by operations from 2009 to 2010 is directly related to the successful drilling and completion operations accomplished during 2009 and 2010. Our production and resulting revenue has increased as each well has been turned to production. In addition to the increase in the number of wells on production, the initial per-well production has increased for our recently added wells.
57
Excluding the Smokey/Polar acquisition in the fourth quarter of 2010, our principal investing activities during the three years ended December 31, 2010 related primarily to the addition of oil and gas leases and oil and gas drilling activities. We recorded $67 million in development and exploration costs in 2010 as compared to $27.1 million in 2009 and $11.0 million in 2008.
Operating Results
Production and Sales Volumes, Average Sales Prices, and Production Costs
The Bakken is the only field (as such term is used within the meaning of applicable regulations of the SEC) that contains more than 15% of our total proved reserves. At December 31, 2010, this field contained 99% of our total proved reserves, nearly all of which are located in Dunn and McKenzie Counties. The following table discloses our oil and gas production and sales volumes from the Bakken field, from our other fields combined and in total, for the periods indicated:
| |
For the years ended | |||||||||||
|---|---|---|---|---|---|---|---|---|---|---|---|---|
| |
December 31, 2010 | December 31, 2009 | December 31, 2008 | |||||||||
Sales Volume (Bakken): |
||||||||||||
Gas (Mcf) |
11,156 | 6,092 | 6,370 | |||||||||
Oil (Bbls) |
402,344 | 145,181 | 18,734 | |||||||||
Sales Volume (Other): |
||||||||||||
Gas (Mcf) |
151,775 | 214,363 | 203,445 | |||||||||
Oil (Bbls) |
29,955 | 37,377 | 44,861 | |||||||||
Sales Volume (Total): |
||||||||||||
Gas (Mcf) |
162,931 | 220,455 | 209,815 | |||||||||
Oil (Bbls) |
432,299 | 182,558 | 63,595 | |||||||||
Sales volumes (BOE) |
459,454 | 219,300 | 98,564 | |||||||||
Production from acquisition(1): |
||||||||||||
August 1 - November 30, 2010 |
||||||||||||
Gas (Mcf) |
75,059 | — | — | |||||||||
Oil (Bbls) |
50,903 | — | — | |||||||||
Natural Gas flared (Mcf)(2): |
282,726 |
82,660 |
3,074 |
|||||||||
Total production (Bakken) |
||||||||||||
Gas (Mcf) |
368,941 | 88,752 | 9,444 | |||||||||
Oil (Bbls) |
453,247 | 145,181 | 18,734 | |||||||||
Total production (Other) |
||||||||||||
Gas (Mcf) |
151,775 | 214,363 | 203,445 | |||||||||
Oil (Bbls) |
29,955 | 37,377 | 44,861 | |||||||||
Total production volume: |
||||||||||||
Gas (Mcf) |
520,716 | 303,115 | 212,889 | |||||||||
Oil (Bbls) |
483,202 | 182,558 | 63,595 | |||||||||
Production volumes (BOE) |
569,988 | 233,076 | 98,564 | |||||||||
- (1)
- Includes
production on acquired properties for periods prior to the closing date of the transaction but subsequent to the effective date. Sales revenue for
this production is treated as an adjustment of the purchase price and not in the Company's revenue for the period. All such volumes are related to the Bakken field.
- (2)
- Includes production of natural gas that is not included in our sales volumes. All flared gas is related to the Bakken field. Beginning in late 2010, we began connecting previously flared gas into
58
gas pipelines for delivery to markets. A majority of our natural gas is expected to be connected by the end of 2011.
Sales prices received, and production costs per sold BOE for the years ended December 31, 2010, 2009 and 2008 are summarized in the following table:
| |
For the years ended | |||||||||
|---|---|---|---|---|---|---|---|---|---|---|
| |
December 31, 2010 | December 31, 2009 | December 31, 2008 | |||||||
Sales Price: |
||||||||||
Gas ($/Mcf) |
$ | 4.81 | $ | 2.84 | $ | 6.54 | ||||
Oil ($/Bbls) |
$ | 69.89 | $ | 58.35 | $ | 84.86 | ||||
Commodity Price Risk Management Activities ($/Sales BOE): |
||||||||||
Realized loss |
$ | 0.88 | $ | — | $ | — | ||||
Unrealized loss |
$ | 12.50 | $ | — | $ | — | ||||
Production costs ($/Sales BOE): |
||||||||||
Lease operating expenses |
$ | 7.03 | $ | 4.25 | $ | 28.78 | ||||
Production and property taxes |
$ | 7.49 | $ | 5.50 | $ | 6.54 | ||||
Gathering, transportation, marketing |
$ | 0.26 | $ | 0.37 | $ | 0.99 | ||||
Year Ended December 31, 2010 Compared to Year Ended December 31, 2009
Oil sales revenues. Oil sales revenues increased by $19.5 million to $30.2 million for the year ended December 31, 2010 as compared to oil sales of $10.7 million for the year ended December 31, 2009. Our oil sales volume increased 137% to 432.3 thousand barrels (MBbls) in 2010 as compared to 182.6 MBbls in 2009. The increased revenue from oil sales in 2010 is attributed to a $17.4 million positive impact due to increased volumes. Additionally, the average price we realized on the sale of our oil increased from $58.35 per barrel for the year ended December 31, 2009, to $69.89 for the year ended December 31, 2010 resulting in a positive impact of $2.1 million in revenue.
Natural Gas sales revenues. Natural gas sales volumes decreased by 57,000 Mcf to 163,000 Mcf for the year ended December 31, 2010. The average price we realized on the sale of our natural gas was $4.81 per Mcf in 2010 compared to $2.84 per Mcf in 2009. The increase in natural gas prices realized resulted in a $435,000 increase in natural gas revenue while the decline in natural gas volumes resulted in a decline in natural gas revenue by $277,000 for total increase of our gas sales revenue of approximately $158,000. The decline in our natural gas sales volumes is largely a result of our focus on the development of our Bakken properties as opposed to our Wyoming assets that historically have contributed a majority of our natural gas production. Although our Bakken wells do produce associated gas, to-date most of this gas has been flared. Late in 2010, we began connecting our wells to third party pipelines that will gather and transport the gas to processing plants and sales pipelines. We expect that a majority of our remaining wells will be connected to gas pipelines during 2011 which will allow us to capture the related sales revenue.
Loss on commodity price risk management activities. For the twelve months ended December 31, 2010 we incurred a total loss on our risk management activities of $6.1 million. This loss is a result of our hedging program used to mitigate our exposure to commodity price fluctuations that may inhibit our ability to fund our capital expenditure budget or other obligations. This loss was comprised of approximately $400,000 of realized losses for transactions that were settled in the fourth quarter of 2010 and $5.7 million of unrealized losses for the mark-to-market of forward transactions. The unrealized loss is a non-cash adjustment for the value of our risk management transactions at December 31, 2010. These transactions will continue to change in value and we will likely add to our
59
hedging program. Therefore we expect our net income to reflect the volatility of commodity price forward markets. Our cash flows will only be affected upon settlement of the transactions at the current market prices at that time.
Oil and gas production expense. Our oil and gas production expense increased by $4.6 million to $6.8 million for the year ended December 31, 2010, from $2.2 million for the same period in 2009. The increase is primarily due to a $2.2 million increase in production taxes and a $2.4 million increase in lease operating expenses ("LOE"). The production tax increase is attributable to increased revenue as it is calculated as a fixed percentage of sales revenue. LOE increased year over year due to a higher number of wells that we operate or participate in. On a per unit basis, LOE increased from $4.25 per barrel sold in 2009 to $7.03 in 2010. This increase is related to higher operating costs primarily in our Williston Basin activities. The largest cost driver in our Williston Basin operations is the disposal of water used in the well completion operations. We expense the water handling costs once oil production is established. To date, this water has been transported by truck to third party disposal facilities. Late in 2010, we began connecting our wells to third party pipelines that will transport water directly to disposal facilities. We expect that a majority of our remaining wells will be connected to water pipelines during 2011, which will substantially reduce our water-related costs.
Depletion, depreciation, amortization and abandonment liability accretion ("DDA") expense. Our depletion, depreciation, amortization and abandonment liability accretion expense increased by $5.0 million to $8.2 million for the year ended December 31, 2010, from $3.2 million for the same period in 2009. This increase is due to increased volumes sold in 2010 as sales increased by approximately 240,000 BOE. On a per unit basis, DDA increased from approximately $14 per barrel sold in 2009 to $18 per barrel sold in 2010. This increase is primarily due to increased well costs as compared to reserves as estimated in our annual reserve report. In 2010, we have predominantly completed our wells using a greater number of fracture stimulation stages and increased volumes of proppant. These factors have increased the well completion costs but we believe that the higher upfront costs will generate overall higher returns through greater production volumes and total oil and gas reserves. Currently, because of the early stages of development of our Bakken play, our reserves include the increased well costs but not the improved reserves. We believe that as our improved results are reflected in our future estimated reserves, the DDA rate per unit will decrease over time.
General and administrative ("G&A") expense. General and administrative expense increased by $3.7 million to $12.2 million for the year ended December 31, 2010, from $8.5 million for the same period in 2009. This increase is due to the growth in personnel and related costs as we have expanded our operational activities. Total employees have increased to 35 at year-end 2010 from 15 at year-end 2009. Also contributing to the increase are costs associated with the Smokey/Polar acquisition in the fourth quarter 2010. Under Accounting Standard Codification 805, "ASC 805", our acquisition-related costs of approximately $370,000 were expensed to G&A expense.
Our G&A expense includes the non-cash expense for stock-based compensation for stock options and share grants under our 2007 Stock Incentive Plan. For the twelve months ended December 31, 2010, this expense was $4.5 million as compared to $3.4 million in 2009. Approximately $600,000 of the year over year increase was due to the use of shares of common stock in lieu of cash for a portion of the 2010 executive bonus award.
Net loss. Our net loss was approximately $2.4 million for the year ended December 31, 2010, as compared to a net loss of $2.6 million for 2009. Although our revenue, net of production expenses, was higher compared to 2009, our 2010 net loss was negatively impacted by increased DDA, G&A and, most significantly, the loss on risk management activities discussed above.
60
Year Ended December 31, 2009 Compared to Year Ended December 31, 2008
Oil sales revenues. Oil sales revenues increased by $5.3 million to a record $10.7 million for the year ended December 31, 2009 as compared to oil sales of $5.4 million for the year ended December 31, 2008. Our oil sales volume increased 187% in 2009 as compared to 2008. The increased revenue in 2009 is attributed to a $6.9 million positive impact due to increased volumes. However, the average price we realized on the sale of our oil decreased from $84.86 per barrel for the year ended December 31, 2008, to $58.35 for the year ended December 31, 2009. Therefore, a negative impact of $1.7 million is attributed to the decline in oil price in 2009 as compared to 2008.
Natural Gas sales revenues. Natural gas sales revenues decreased by $746,000 to $625,000 for the year ended December 31, 2009, from $1.4 million for the same period of 2008. The average price we realized on the sale of our natural gas was $2.84 per Mcf in 2009 compared to $6.54 per Mcf in 2008. This 57% decline in natural gas prices realized resulted in a $777,000 decline in natural gas revenue in 2009 as compared to 2008. Natural gas sales volumes were 220,000 Mcf for the year ended December 31, 2009, compared to 210,000 Mcf for the same period in 2008. This 5% increase in natural gas volumes partially offset the decline in natural gas revenue by $30,000.
Interest and Other Income. Interest and other income decreased by $136,000 to $61,000 in 2009 from $196,000 for the same period in 2008 due to both a decrease in average investible cash throughout the year and lower interest rate paid for funds held with our banks.
Oil and gas production expense. Our oil and gas production expense decreased by $1.4 million to $2.2 million for the year ended December 31, 2009, from $3.6 million for the same period in 2008. The decrease is primarily due to workover expense of $1.7 million recorded in 2008 which was partially offset by additional production expense attributable to each new well coming on to production during 2009.
Depletion, depreciation, amortization and abandonment liability accretion ("DDA") expense. Our depletion, depreciation, amortization and abandonment liability accretion expense decreased by $1.0 million to $3.2 million for the fiscal year ended December 31, 2009, from $4.2 million for the same period in 2008. Although increased production volumes impact DDA by increasing cost on a units of production basis, due to impairment charges taken in 2008, the full cost pool was lower resulting in a lower DDA rate charged for 2009.
Asset impairment. There were no asset impairment charges during 2009. During the last half of 2008, crude oil and natural gas prices dropped from their highs set in the summer of 2008 and the Company's full cost pool exceeded the ceiling by approximately $47.5 million after taking into account decrease in prices following the period ends. Subsequent to the end of the third and fourth quarters of 2008, there was no recovery in price and therefore impairment expenses of $15.5 million and $32.0 million were recorded in the third and fourth quarters of 2008, respectively.
General and administrative expense. General and administrative expense increased by $310,000 to $8.5 million for the fiscal year ended December 31, 2009, from $8.2 million for the same period in 2008. Excluding the non-cash stock-based compensation expense in each period our general and administrative expenses increased by $433,000 or 9% during 2009 as compared to the same period in 2008. We recorded lower stock-based compensation expense of approximately $3.4 million for the year ended December 31, 2009 compared to $3.5 million recorded for the same period in 2008, related to options and restricted stock issued to officers, directors and employees. The reduction in the stock-based compensation expense is due in part to the reversal recorded of non-vested performance based-stock options that expired as of March 20, 2009. Stock-based compensation expense related to the expired performance based stock options was approximately $122,000. Additionally, on December 31, 2009 certain officers and directors voluntarily cancelled stock options issued in 2007. The
61
unamortized expense related to these cancelled options of approximately $413,000 was recognized in stock-based compensation expense as of December 31, 2009.
Net loss. Our net loss improved or decreased by $53.9 million to a net loss of $2.6 million for the year ended December 31, 2009, from a net loss of $56.5 million for 2008. As more fully described above, the asset impairment of $47.5 million in 2008 was the primary cause of the decrease in net loss from 2008. In addition, our increased oil production and resulting oil revenue contributed to the improvement or decrease in net loss.
Financial Instruments and Other Instruments
As of December 31, 2010, we had cash, accounts payable and accrued liabilities which are carried at approximate fair value because of the short maturity date of those instruments. Additionally, at December 31, 2010, we had derivative instruments (See Note 12 to Financial Statements), and long-term debt (discussed below) recorded at fair value. Our management believes that we are not exposed to significant interest, currency or credit risks arising from these financial instruments.
First Lien Credit Agreement
On May 24, 2010, the Company, through its wholly-owned subsidiary, Kodiak Oil & Gas (USA) Inc. ("Subsidiary"), entered into a $200 million, four-year, revolving, senior secured credit agreement (the "Credit Agreement") with Wells Fargo Bank, N.A. (the "Lender"). On November 30, 2010, the Company entered into the First Amendment to Credit Agreement (the "First Amendment") with Wells Fargo Bank, N.A., which amends that certain Credit Agreement between Subsidiary and Wells Fargo Bank, N.A., dated May 24, 2010. The outstanding principal balance of the revolving loan, together with all unpaid fees and expenses relating thereto, shall be due and payable no later than May 24, 2014. As of December 31, 2010, and, as of the time of this filing, the Company had no borrowings under the First Lien Credit Agreement.
Second Lien Credit Agreement
On November 30, 2010, Kodiak Oil & Gas (USA) Inc. entered into a second lien term loan credit agreement with an initial commitment of $40 million (the "Second Lien Credit Agreement") with Wells Fargo Energy Capital, Inc. and any other lender party thereto from time to time (collectively, the "Lenders"). The recorded value of the Company's Credit Agreement approximates its fair value as it bears interest at variable rates over the term of the loan.
Concurrently with Subsidiary's entry into the Second Lien Credit Agreement, the Company entered into a guarantee (the "Guarantee") pursuant to which the Company guarantees to the Lenders all of the obligations of Subsidiary under the Second Lien Credit Agreement and pledges a security interest in 100% of its equity interests in Subsidiary as collateral support for the Company's obligations under the Guarantee and the obligations of Subsidiary under the Second Lien Credit Agreement. Additionally, Subsidiary entered into a second lien guarantee and collateral agreement (the "Collateral Agreement") pursuant to which it granted a security interest on a second priority basis in substantially all of its assets, and Subsidiary provided second lien mortgages on at least 80% of its interests in oil and gas properties on a discounted basis.
Research and Development
As an exploration and production natural resource company, we do not normally engage in research and there were no development activities, or research and development expenditures made in the last three fiscal years.
Off-balance sheet arrangements
We have no off-balance sheet arrangements that have or are reasonably likely to have a current or future effect on our financial condition, changes in financial condition, revenues or expenses, results of operations, liquidity, capital expenditures or capital resources.
62
Contractual obligations
The following table lists as of December 31, 2010, information with respect to our known contractual obligations:
| |
(In thousands) Payments due by Period |
|||||||||||||||
|---|---|---|---|---|---|---|---|---|---|---|---|---|---|---|---|---|
| |
Total | Less than 1 year |
1 - 3 years | 3 - 5 years | More than 5 years |
|||||||||||
Contractual Obligations |
||||||||||||||||
Long-Term Obligations—Office Facilities |
$ | 2,055 | $ | 366 | $ | 791 | $ | 794 | $ | 104 | ||||||
Drilling Rig Obligations |
$ | 8,000 | $ | 5,500 | $ | 2,500 | — | — | ||||||||
Note and Interest Payable |
$ | 56,613 | $ | 4,258 | $ | 8,528 | $ | 43,827 | — | |||||||
The Company is currently subject to three drilling rig contracts. As a result of having completed the two-year drilling commitment applicable to the first drilling rig, there is no associated termination fee for this rig as of December 31, 2010. The second rig was placed into operation in March 2010 and entails a two-year drilling commitment or specific termination fees if drilling activity is cancelled prior to March 10, 2012. This contract can also be extended by mutual consent. The estimated termination fee for the second rig is $4.0 million as of December 31, 2010. The Company is currently utilizing both rigs for drilling in the Williston Basin and expects to continue utilization through their respective terms. During the second quarter of 2010, the Company entered into a contract for the use of a third drilling rig. The third rig contract entails a two-year drilling commitment or specific termination fees if the contract is terminated prior to delivery of the rig. The contract may also be extended by mutual consent. The estimated termination fee for this third rig is $4.0 million as of December 31, 2010. The Company currently expects to utilize this third rig in its operations in the Williston Basin.
Interest on the loans under our Second Lien Credit Agreement accrues based on one of the following two fluctuating reference rates in a manner prescribed under the applicable loan documents: (1) the LIBOR rate (which is primarily based on the London interbank market rate), subject to a floor of 2.5% and (2) the alternate base rate (which is primarily based on Wells Fargo's "prime" rate). Loans that accrue at the LIBOR rate, subject to the 2.5% floor, are subject to an additional margin of 8%. Loans that accrue at the alternate base rate are subject to an additional margin of 7%. The outstanding principal balance of the loan under the Second Lien Credit Agreement, together with all unpaid fees and expenses relating thereto, shall be due and payable no later than November 24, 2014 (the "Maturity Date"). Subsidiary may pre-pay the loan in whole or in part at any time after November 30, 2011, subject to the following: (i) if prepayment takes place at any time during the period commencing on November 30, 2011 through November 29, 2012, the loan may be prepaid in whole or in part so long as the principal amount is accompanied by a premium equal to 2.0% of such principal pre-payment and (ii) if prepayment takes place at any time during the period commencing on November 30, 2012 through the day prior to the Maturity Date, the loan may be prepaid in whole or in part so long as the principal amount repaid is accompanied by a premium equal to 1.0% of such principal prepayment. As of December 31, 2010, and as of the time of filing this report, there was $40 million drawn and outstanding under this agreement at an average interest rate of 10.50%.
As is customary in the oil and gas industry, the Company may at times have commitments in place to reserve or earn certain acreage positions or wells. If the Company does not meet such commitments, the acreage positions or wells may be lost.
We have not included asset retirement obligations as discussed in Note 2 of the accompanying audited financial statements, as we cannot determine with accuracy the timing of such payments.
63
Critical Accounting Policies and Estimates
The preparation of our consolidated financial statements in conformity with generally accepted accounting principles in the United States, or GAAP, requires our management to make assumptions and estimates that affect the reported amounts of assets, liabilities, revenues and expenses, as well as the disclosure of contingent assets and liabilities at the date of our financial statements and the reported amounts of revenues and expenses during the reporting period. The following is a summary of the significant accounting policies and related estimates that affect our financial disclosures.
Derivative Instruments
During 2010, the Company has entered in to swaps and "no premium" collars to reduce the effect of price changes on a portion of our future oil production. We reflect the fair market value of our derivative instruments on our balance sheet. Our estimates of fair value are determined by obtaining independent market quotes, as well as utilizing a Black-Scholes option valuation model that is based upon underlying forward price curve data, risk-free interest rates, credit adjusted discount rates and estimated volatility factors. Changes in commodity prices will result in substantially similar changes in the fair value of our commodity derivative agreements, and in substantially similar changes in the fair value of our commodity collars to the extent the changes are outside the floor or cap of our collars. We do not apply hedge accounting to any of our derivative contracts, therefore we recognize mark-to-market gains and losses in earnings currently.
Business Combinations
In November 2007, the ASC 805 guidance for business combinations was updated to provide new guidance for recognizing and measuring the assets and goodwill acquired and liabilities assumed in an acquisition. The updated guidance also broadened the definition of a business combination and requires an entity to recognize transaction costs separately from the acquisition. The Company adopted the updated guidance effective January 1, 2009 and applied it to the acquisition of its Bakken Properties Acquisition completed on November 30, 2010 (see Note 2).
Oil and Natural Gas Reserves
We follow the full cost method of accounting. All of our oil and gas properties are located within the United States, and therefore all costs related to the acquisition and development of oil and gas properties are capitalized into a single cost center referred to as a full cost pool. Depletion of exploration and development costs and depreciation of production equipment is computed using the units-of-production method based upon estimated proved oil and gas reserves. Under the full cost method of accounting, capitalized oil and gas property costs less accumulated depletion and net of deferred income taxes may not exceed an amount equal to the present value, discounted at 10%, of estimated future net revenues from proved oil and gas reserves less the future cash outflows associated with the asset retirement obligations that have been accrued on the balance sheet plus the cost, or estimated fair value if lower, of unproved properties. Should capitalized costs exceed this ceiling, impairment would be recognized. Under the SEC rules, we prepared our oil and gas reserve estimates as of December 31, 2009 and 2010, using the average, first-day-of-the-month price during the 12-month period ending December 31, 2009. In prior years, we used the year-end or quarter ended price. Prior to December 31, 2009, subsequent commodity price increases could be utilized to calculate the ceiling value.
Estimating accumulations of gas and oil is complex and is not exact because of the numerous uncertainties inherent in the process. The process relies on interpretations of available geological, geophysical, engineering and production data. The extent, quality and reliability of this technical data can vary. The process also requires certain economic assumptions, some of which are mandated by the SEC, such as gas and oil prices, drilling and operating expenses, capital expenditures, taxes and
64
availability of funds. The accuracy of a reserve estimate is a function of the quality and quantity of available data; the interpretation of that data; the accuracy of various mandated economic assumptions; and the judgment of the persons preparing the estimate.
We believe estimated reserve quantities and the related estimates of future net cash flows are the most important estimates made by an exploration and production company such as ours because they affect the perceived value of our Company, are used in comparative financial analysis ratios, and are used as the basis for the most significant accounting estimates in our financial statements, including the quarterly calculation of depletion, depreciation and impairment of our proved oil and natural gas properties. Proved oil and natural gas reserves are the estimated quantities of crude oil, natural gas, and natural gas liquids that geological and engineering data demonstrate with reasonable certainty to be recoverable in future periods from known reservoirs under existing economic and operating conditions. We determine anticipated future cash inflows and future production and development costs by applying benchmark prices and costs, including transportation, quality and basis differentials, in effect at the end of each quarter to the estimated quantities of oil and natural gas remaining to be produced as of the end of that quarter. We reduce expected cash flows to present value using a discount rate that depends upon the purpose for which the reserve estimates will be used. For example, the standardized measure calculation required by ASC Topic 932, Extractive Activities—Oil and Gas, requires us to apply a 10% discount rate. Although reserve estimates are inherently imprecise, and estimates of new discoveries and undeveloped locations are more imprecise than those of established proved producing oil and natural gas properties, we make considerable effort to estimate our reserves, including through the use of independent reserves engineering consultants. We expect that quarterly reserve estimates will change in the future as additional information becomes available or as oil and natural gas prices and operating and capital costs change. We evaluate and estimate our oil and natural gas reserves as of December 31 of each year and quarterly throughout the year. For purposes of depletion, depreciation, and impairment, we adjust reserve quantities at all quarterly periods for the estimated impact of acquisitions and dispositions. Changes in depletion, depreciation or impairment calculations caused by changes in reserve quantities or net cash flows are recorded in the period in which the reserves or net cash flow estimate changes.
Impairment of Long-lived Assets
We record our property and equipment at cost. The cost of our unproved properties is withheld from the depletion base as described above, until such a time as the properties are either developed or abandoned. We review these properties quarterly for possible impairment. We provide an impairment allowance on unproved property when we determine that the property will not be developed or the carrying value will not be realized. We evaluate the reliability of our proved properties and other long-lived assets whenever events or changes in circumstances indicate that the recording of impairment may be appropriate. Our impairment test compares the expected undiscounted future net revenue from a property, using escalated pricing, with the related net capitalized costs of the property at the end of the applicable period. When the net capitalized costs exceed the undiscounted future net revenue of a property, the cost of the property is added to the full cost pool.
Revenue Recognition
Our revenue recognition policy is significant because revenue is a key component of our results of operations and of the forward-looking statements contained in our analysis of liquidity and capital resources. We derive our revenue primarily from the sale of produced natural gas and crude oil. We report revenue as the gross amounts we receive before taking into account production taxes and transportation costs, which are reported as separate expenses. We record revenue in the month our production is delivered to the purchaser, but payment is generally received 30 to 90 days after the date of production. At the end of each month, we make estimates of the amount of production that we delivered to the purchaser and the price we will receive. We use our knowledge of our properties, their
65
historical performance, the anticipated effect of weather conditions during the month of production, NYMEX and local spot market prices and other factors as the basis for these estimates. We record the variances between our estimates and the actual amounts we receive in the month payment is received.
Asset Retirement Obligations
We are required to recognize an estimated liability for future costs associated with the abandonment of our oil and gas properties including without limitation the costs of reclamation of our drilling sites, storage and transmission facilities and access roads. We base our estimate of the liability on the industry experience of our management and on our current understanding of federal and state regulatory requirements. Our present value calculations require us to estimate the economic lives of our properties, assume what future inflation rates apply to external estimates and determine the credit- adjusted risk-free rate to use. Our estimated asset retirement obligations are reflected in our depreciation, depletion and amortization calculations over the remaining life of our oil and gas properties.
Oil and Natural Gas Properties—Full Cost Method of Accounting
We use the full cost method of accounting whereby all costs related to the acquisition and development of oil and natural gas properties are capitalized into a single cost center referred to as a full cost pool. These costs include land acquisition costs, geological and geophysical expenses, carrying charges on non-producing properties, costs of drilling and overhead charges directly related to acquisition and exploration activities.
Capitalized costs, together with the costs of production equipment, are depleted and amortized on the unit-of-production method based on the estimated gross proved reserves as determined by independent petroleum engineers. For this purpose, we convert our petroleum products and reserves to a common unit of measure.
Costs of acquiring and evaluating unproved properties are initially excluded from depletion calculations. These unevaluated properties are assessed quarterly to ascertain whether impairment has occurred. When proved reserves are assigned or the property is considered to be impaired, the cost of the property or the amount of the impairment is added to the full cost pool and becomes subject to depletion calculations.
Proceeds from the sale of oil and natural gas properties are applied against capitalized costs, with no gain or loss recognized, unless the sale would alter the rate of depletion by more than 25%. Royalties paid, net of any tax credits received, are netted against oil and natural gas sales.
In applying the full cost method, we perform a ceiling test on properties that restricts the capitalized costs, less accumulated depletion, from exceeding an amount equal to the estimated undiscounted value of future net revenues from proved oil and natural gas reserves, as determined by independent petroleum engineers. The estimated future revenues are based on sales prices achievable under existing contracts and posted average reference prices in effect at the end of the applicable period, and current costs, and after deducting estimated future general and administrative expenses, production related expenses, financing costs, future site restoration costs and income taxes. Under the full cost method of accounting, capitalized oil and natural gas property costs, less accumulated depletion and net of deferred income taxes, may not exceed an amount equal to the present value, discounted at 10%, of estimated future net revenues from proved oil and natural gas reserves, plus the cost, or estimated fair value if lower, of unproved properties. Should capitalized costs exceed this ceiling, we would recognize an impairment.
66
Stock-Based Compensation
We account for stock-based compensation under the provisions of ASC Topic 718. This guidance requires us to record expense associated with the fair value of stock-based compensation. We currently use the Black-Scholes option valuation model to calculate stock based compensation.
Foreign Currency Fluctuations
Monetary items denominated in a foreign currency, other than U.S. dollars, are converted into U.S. dollars at exchange rates prevailing at the balance sheet date. Foreign currency denomination revenue and expense items are translated at exchange rates prevailing at the transaction date. Gains or losses arising from the translations are included in operations.
ITEM 7A. QUANTITATIVE AND QUALITATIVE DISCLOSURES ABOUT MARKET RISK
Commodity Price Risk
Our primary market risk is market changes in oil and natural gas prices. The market prices for oil and natural gas have been highly volatile and are likely to continue to be highly volatile in the future, which will impact our prospective revenues from the sale of products or properties. During 2010, we began managing this commodity price risk exposure through the use of derivative financial instruments entered into with third-party counterparties. Currently, we utilize swaps and "no premium" collars to reduce the effect of price changes on a portion of our future oil production. We do not enter into derivative instruments for trading purposes.
We use costless collars to establish floor and ceiling prices on our anticipated future oil production. We neither receive nor pay net premiums when we enter into these arrangements. These contracts are settled monthly. When the settlement price (the market price for oil or natural gas on the settlement date) for a period is above the ceiling price, we pay our counterparty. When the settlement price for a period is below the floor price, our counterparty is required to pay us. All hedges are accounted for using mark-to-market accounting.
We use swaps to fix the sales price for our anticipated future oil production. Upon settlement, we receive a fixed price for the hedged commodity and pay our counterparty a floating market price, as defined in each instrument. These instruments are settled monthly. When the floating price exceeds the fixed price for a contract month, we pay our counterparty. When the fixed price exceeds the floating price, our counterparty is required to make a payment to us.
The use of derivatives involves the risk that the counterparties to such instruments will be unable to meet the financial terms of such contracts. The Company's wholly-owned subsidiary, Kodiak Oil & Gas (USA) Inc., is currently a party to derivative contracts with one counterparty, and the Company is a guarantor of Kodiak Oil & Gas (USA) Inc. The Company has netting arrangements with the counterparty that provide for the offset of payables against receivables from separate derivative arrangements with the counterparty in the event of contract termination. Although the instruments are valued using indices published by established exchanges, the instruments are traded directly with the counterparties. The derivative contracts may be terminated by a non-defaulting party in the event of default by one of the parties to the agreement.
The objective of the Company's use of derivative financial instruments is to achieve more predictable cash flows in an environment of volatile oil and gas prices and to manage its exposure to commodity price risk. While the use of these derivative instruments limits the downside risk of adverse price movements, these instruments may also limit the Company's ability to benefit from favorable price movements. The Company may, from time to time, add incremental derivatives to hedge additional production, restructure existing derivative contracts or enter into new transactions to modify the terms of current contracts in order to realize the current value of the Company's existing positions.
67
The Company's commodity derivative contracts as of December 31, 2010 are summarized below:
Contract Type
|
Counterparty | Basis(1) | Quantity(Bbl/d) | Strike Price ($/Bbl) | Term | |||||||||
|---|---|---|---|---|---|---|---|---|---|---|---|---|---|---|
Collar |
Wells Fargo Bank, N.A. | NYMEX | 400 | $ | 75.00/$89.20 | Jan 1 - Dec 31, 2011 | ||||||||
Collar |
Wells Fargo Bank, N.A. | NYMEX | 200 - 500 | $ | 70.00/$95.56 | Jan 1 - Dec 31, 2011 | ||||||||
Collar |
Wells Fargo Bank, N.A. | NYMEX | 400 | $ | 70.00/$95.56 | Jan 1 - Dec 31, 2012 | ||||||||
|
||||||||||||||
Contract Type
|
Counterparty | Basis(1) | Quantity(Bbl/d) | Swap Price ($/Bbl) | Term | ||||||||||
|---|---|---|---|---|---|---|---|---|---|---|---|---|---|---|---|
Swap |
Wells Fargo Bank, N.A. | NYMEX | 135 | $ | 84.00 | Jan 1 - Dec 31, 2011 | |||||||||
Swap |
Wells Fargo Bank, N.A. | NYMEX | 130 | $ | 90.28 | Jul 1 - Dec 31, 2011 | |||||||||
2011 Total/Average |
201 | $ | 85.85 | ||||||||||||
Swap |
Wells Fargo Bank, N.A. | NYMEX | 100 | $ | 84.00 | Jan 1 - Dec 31, 2012 | |||||||||
Swap |
Wells Fargo Bank, N.A. | NYMEX | 136 | $ | 88.30 | Jan 1 - Dec 31, 2012 | |||||||||
Swap |
Wells Fargo Bank, N.A. | NYMEX | 24 | $ | 90.28 | Jan 1 - Dec 31, 2012 | |||||||||
2012 Total/Average |
260 | $ | 86.83 | ||||||||||||
Swap |
Wells Fargo Bank, N.A. | NYMEX | 79 | $ | 84.00 | Jan 1 - Dec 31, 2013 | |||||||||
Swap |
Wells Fargo Bank, N.A. | NYMEX | 427 | $ | 88.30 | Jan 1 - Dec 31, 2013 | |||||||||
Swap |
Wells Fargo Bank, N.A. | NYMEX | 24 | $ | 90.28 | Jan 1 - Dec 31, 2013 | |||||||||
2013 Total/Average |
530 | $ | 87.75 | ||||||||||||
Swap |
Wells Fargo Bank, N.A. | NYMEX | 69 | $ | 84.00 | Jan 1 - Dec 31, 2014 | |||||||||
Swap |
Wells Fargo Bank, N.A. | NYMEX | 360 | $ | 88.30 | Jan 1 - Dec 31, 2014 | |||||||||
Swap |
Wells Fargo Bank, N.A. | NYMEX | 21 | $ | 90.28 | Jan 1 - Dec 31, 2014 | |||||||||
2014 Total/Average |
450 | $ | 87.73 | ||||||||||||
Swap |
Wells Fargo Bank, N.A. | NYMEX | 59 | $ | 84.00 | Jan 1 - Oct 31, 2015 | |||||||||
Swap |
Wells Fargo Bank, N.A. | NYMEX | 317 | $ | 88.30 | Jan 1 - Sept 30, 2015 | |||||||||
Swap |
Wells Fargo Bank, N.A. | NYMEX | 46 | $ | 90.28 | Jan 1 - Oct 31, 2015 | |||||||||
2015 Total/Average (Through October) |
390 | $ | 87.81 | ||||||||||||
- (1)
- NYMEX refers to quoted prices on the New York Mercantile Exchange.
The following table details the fair value of the derivatives financial instruments as of December 31, 2010 and December 31, 2009, by category (in thousands):
| |
|
Fair Value at | |||||||
|---|---|---|---|---|---|---|---|---|---|
Underlying Commodity
|
Location on Balance Sheet |
December 31, 2010 | December 31, 2009 | ||||||
Crude oil derivative contract |
Current liabilities | $ | 2,248 | $ | — | ||||
Crude oil derivative contract |
Noncurrent liabilities | $ | 3,495 | $ | — | ||||
Subsequent to year end 2010, we entered into additional collars as described below:
Contract Type
|
Counterparty | Basis | Quantity(Bbl/d) | Strike Price ($/Bbl) | Term | |||||||||
|---|---|---|---|---|---|---|---|---|---|---|---|---|---|---|
Collar |
Wells Fargo Bank, N.A. | NYMEX | 400 | $85.00/$117.73 | Mar 1 - Dec 31, 2011 | |||||||||
Collar |
Wells Fargo Bank, N.A. | NYMEX | 230 | $85.00/$117.73 | Jan 1 - Dec 31, 2012 | |||||||||
The Company determines the estimated fair value of derivative instruments using a market approach based on several factors, including quoted market prices in active markets, quotes from third parties, the credit rating of each counterparty, and the Company's own credit rating. The Company also performs an internal valuation to ensure the reasonableness of third-party quotes. In consideration of counterparty credit risk, the Company assessed the possibility of whether the counterparty to the derivative would default by failing to make any contractually required payments. Additionally, the Company considers that it is of substantial credit quality and has the financial resources and willingness to meet its potential repayment obligations associated with the derivative transactions. The Company was not a party to any commodity derivative contracts as of December 31, 2009. See "Item 8. Financial Statements and Supplementary Data—Note 2" for additional information regarding our derivative contracts.
68
ITEM 8. FINANCIAL STATEMENTS AND SUPPLEMENTARY DATA
REPORT OF INDEPENDENT REGISTERED PUBLIC ACCOUNTING FIRM
To
the Board of Directors and Stockholders
Kodiak Oil & Gas Corp.
We have audited the consolidated balance sheets of Kodiak Oil & Gas Corp. and subsidiaries as of December 31, 2010 and 2009, and the related consolidated statements of operations, stockholders' equity and cash flows for each of the three years in the period ended December 31, 2010. These financial statements are the responsibility of the Company's management. Our responsibility is to express an opinion on these financial statements based on our audits.
We conducted our audits in accordance with the standards of the Public Company Accounting Oversight Board (United States). Those standards require that we plan and perform the audit to obtain reasonable assurance about whether the financial statements are free of material misstatement. An audit includes examining, on a test basis, evidence supporting the amounts and disclosures in the financial statements. An audit also includes assessing the accounting principles used and significant estimates made by management, as well as evaluating the overall financial statement presentation. We believe that our audits provide a reasonable basis for our opinion.
In our opinion, the consolidated financial statements referred to above present fairly, in all material respects, the financial position of Kodiak Oil & Gas Corp. and subsidiaries as of December 31, 2010 and 2009, and the results of their operations and their cash flows for each of the three years in the period ended December 31, 2010, in conformity with U.S. generally accepted accounting principles.
We also have audited, in accordance with the standards of the Public Company Accounting Oversight Board (United States), Kodiak Oil & Gas Corp.'s and subsidiaries' internal control over financial reporting as of December 31, 2010, based on criteria established in Internal Control—Integrated Framework issued by the Committee of Sponsoring Organizations of the Treadway Commission (COSO) and our report dated March 3, 2011 expressed an unqualified opinion on the effectiveness of Kodiak Oil & Gas Corp.'s internal control over financial reporting.
/s/ HEIN & ASSOCIATES LLP
Denver,
Colorado
March 3, 2011
69
KODIAK OIL & GAS CORP.
CONSOLIDATED BALANCE SHEETS
(In thousands, except share data)
| |
December 31, 2010 |
December 31, 2009 |
|||||||||
|---|---|---|---|---|---|---|---|---|---|---|---|
ASSETS |
|||||||||||
Current Assets: |
|||||||||||
Cash and cash equivalents |
$ | 101,198 | $ | 24,885 | |||||||
Accounts receivable |
|||||||||||
Trade |
11,328 | 2,563 | |||||||||
Accrued sales revenues |
4,578 | 1,909 | |||||||||
Inventory, prepaid expenses and other |
18,212 | 7,648 | |||||||||
Total Current Assets |
135,316 | 37,005 | |||||||||
Oil and gas properties (full cost method), at cost: |
|||||||||||
Proved oil and gas properties |
205,360 | 123,259 | |||||||||
Unproved oil and gas properties |
107,254 | 12,068 | |||||||||
Wells in progress |
21,418 | 2,691 | |||||||||
Equipment and facilities |
2,429 | — | |||||||||
Less-accumulated depletion, depreciation, amortization, accretion and asset impairment |
(103,799 | ) | (95,782 | ) | |||||||
Net oil and gas properties |
232,662 | 42,236 | |||||||||
Property and equipment, net of accumulated depreciation of $377 in 2010 and $285 in 2009 |
366 | 442 | |||||||||
Deferred financing costs, net of amortization of $83 in 2010 |
1,593 | — | |||||||||
Total Assets |
$ | 369,937 | $ | 79,683 | |||||||
LIABILITIES AND STOCKHOLDERS' EQUITY |
|||||||||||
Current Liabilities: |
|||||||||||
Accounts payable and accrued liabilities |
$ | 23,179 | $ | 7,743 | |||||||
Advances from joint interest owners |
— | 952 | |||||||||
Commodity price risk management liability |
2,248 | — | |||||||||
Total Current Liabilities |
25,427 | 8,695 | |||||||||
Noncurrent Liabilities: |
|||||||||||
Long term debt |
40,000 | — | |||||||||
Commodity price risk management liability |
3,495 | — | |||||||||
Asset retirement obligation |
1,968 | 1,060 | |||||||||
Total Noncurrent Liabilities |
45,463 | 1,060 | |||||||||
Total Liabilities |
70,890 | 9,755 | |||||||||
Commitments and Contingencies—Note 7 |
|||||||||||
Stockholders' Equity: |
|||||||||||
Common stock—no par value; unlimited authorized |
|||||||||||
Issued and outstanding: 178,168,205 shares as of December 31, 2010 and 118,879,931 shares as of December 31, 2009 |
|||||||||||
Contributed surplus |
407,312 | 175,791 | |||||||||
Accumulated deficit |
(108,265 | ) | (105,863 | ) | |||||||
Total Stockholders' Equity |
299,047 | 69,928 | |||||||||
Total Liabilities and Stockholders' Equity |
$ | 369,937 | $ | 79,683 | |||||||
THE ACCOMPANYING NOTES ARE AN INTEGRAL PART OF THESE FINANCIAL STATEMENTS
70
KODIAK OIL & GAS CORP.
CONSOLIDATED STATEMENTS OF OPERATIONS
(In thousands, except share data)
| |
For the Years Ended December 31, | |||||||||||
|---|---|---|---|---|---|---|---|---|---|---|---|---|
| |
2010 | 2009 | 2008 | |||||||||
Revenues: |
||||||||||||
Gas production |
$ | 783 | $ | 625 | $ | 1,372 | ||||||
Oil production |
30,212 | 10,652 | 5,397 | |||||||||
Loss on commodity price risk management activities |
(6,146 | ) | — | — | ||||||||
Other income |
7 | 8 | — | |||||||||
Total revenue |
24,856 | 11,285 | 6,769 | |||||||||
Operating expenses: |
||||||||||||
Oil and gas production |
6,795 | 2,220 | 3,579 | |||||||||
Depletion, depreciation, amortization and accretion |
8,234 | 3,159 | 4,172 | |||||||||
Asset impairment |
— | — | 47,500 | |||||||||
General and administrative |
12,190 | 8,522 | 8,212 | |||||||||
Total operating expenses |
27,219 | 13,901 | 63,463 | |||||||||
Interest income (expense), net |
(39 | ) | 53 | 196 | ||||||||
Net loss |
$ | (2,402 | ) | $ | (2,563 | ) | $ | (56,498 | ) | |||
Net loss per common share: |
||||||||||||
Basic |
$ | (0.02 | ) | $ | (0.02 | ) | $ | (0.62 | ) | |||
Diluted |
$ | (0.02 | ) | $ | (0.02 | ) | $ | (0.62 | ) | |||
Weighted average shares outstanding: |
||||||||||||
Basic |
131,444,440 | 103,688,733 | 90,739,316 | |||||||||
Diluted |
131,444,440 | 103,688,733 | 90,739,316 | |||||||||
THE ACCOMPANYING NOTES ARE AN INTEGRAL PART OF THESE FINANCIAL STATEMENTS
71
KODIAK OIL & GAS CORP.
STATEMENTS OF STOCKHOLDERS' EQUITY
(In thousands)
| |
Common Stock Shares |
Contributed Surplus |
Accumulated Deficit |
Total Stockholders' Equity |
||||||||||
|---|---|---|---|---|---|---|---|---|---|---|---|---|---|---|
Balance December 31, 2007: |
87,993 | $ | 115,095 | $ | (46,802 | ) | $ | 68,293 | ||||||
Issuance of stocks for cash: |
||||||||||||||
—pursuant to equity offering |
6,820 | 18,755 | 18,755 | |||||||||||
—pursuant to exercise of options |
312 | 180 | 180 | |||||||||||
Share issuance costs |
(1,284 | ) | (1,284 | ) | ||||||||||
Employee stock grants |
4 | 155 | 155 | |||||||||||
Stock-based compensation |
3,397 | 3,397 | ||||||||||||
Net loss |
(56,498 | ) | (56,498 | ) | ||||||||||
Balance December 31, 2008: |
95,129 | $ | 136,298 | $ | (103,300 | ) | $ | 32,998 | ||||||
Issuance of stocks for cash: |
||||||||||||||
—pursuant to equity offering |
23,400 | 37,560 | 37,560 | |||||||||||
—pursuant to exercise of options |
351 | 333 | 333 | |||||||||||
Share issuance costs |
(1,829 | ) | (1,829 | ) | ||||||||||
Employee stock grants |
— | — | — | |||||||||||
Stock-based compensation |
3,429 | 3,429 | ||||||||||||
Net loss |
(2,563 | ) | (2,563 | ) | ||||||||||
Balance December 31, 2009: |
118,880 | $ | 175,791 | $ | (105,863 | ) | $ | 69,928 | ||||||
Issuance of stocks for cash: |
||||||||||||||
—pursuant to equity offering |
57,500 | 237,188 | 237,188 | |||||||||||
—pursuant to exercise of options |
1,688 | 3,236 | 3,236 | |||||||||||
Share issuance costs |
(12,758 | ) | (12,758 | ) | ||||||||||
Employee stock grants |
100 | 261 | 261 | |||||||||||
Stock-based compensation |
3,594 | 3,594 | ||||||||||||
Net loss |
(2,402 | ) | (2,402 | ) | ||||||||||
Balance December 31, 2010: |
178,168 | $ | 407,312 | $ | (108,265 | ) | $ | 299,047 | ||||||
THE ACCOMPANYING NOTES ARE AN INTEGRAL PART OF THESE FINANCIAL STATEMENTS
72
KODIAK OIL & GAS CORP.
CONSOLIDATED STATEMENTS OF CASHFLOWS
(In thousands)
| |
For the Years Ended December 31, | |||||||||||
|---|---|---|---|---|---|---|---|---|---|---|---|---|
| |
2010 | 2009 | 2008 | |||||||||
Cash flows from operating activities: |
||||||||||||
Net loss |
$ | (2,402 | ) | $ | (2,563 | ) | $ | (56,498 | ) | |||
Reconciliation of net income (loss) to net cash provided by operating activities: |
||||||||||||
Depletion, depreciation, amortization and accretion |
8,234 | 3,159 | 4,172 | |||||||||
Asset impairment |
— | — | 47,500 | |||||||||
Unrealized loss on commodity price risk management activities, net |
5,743 | — | — | |||||||||
Stock based compensation |
4,456 | 3,429 | 3,552 | |||||||||
Changes in current assets and liabilities: |
||||||||||||
Accounts receivable-trade |
(8,765 | ) | (628 | ) | (561 | ) | ||||||
Accounts receivable-accrued sales revenue |
(2,668 | ) | (1,392 | ) | 273 | |||||||
Prepaid expenses and other |
(544 | ) | 3,072 | (767 | ) | |||||||
Accounts payable and accrued liabilities |
6,261 | 4,319 | 155 | |||||||||
Net cash provided by (used in) operating activities |
10,315 | 9,396 | (2,174 | ) | ||||||||
Cash flows from investing activities: |
||||||||||||
Oil and gas properties |
(178,540 | ) | (24,289 | ) | (11,209 | ) | ||||||
Prepaid tubular goods |
(18,778 | ) | (3,834 | ) | (9,656 | ) | ||||||
Equipment, facilities, & other |
(2,691 | ) | (278 | ) | (55 | ) | ||||||
Restricted investment |
— | 246 | 9 | |||||||||
Net cash used in investing activities |
(200,009 | ) | (28,155 | ) | (20,911 | ) | ||||||
Cash flows from financing activities: |
||||||||||||
Borrowings under credit facility |
97,308 | — | — | |||||||||
Repayments under credit facility |
(57,308 | ) | — | — | ||||||||
Proceeds from the issuance of common shares |
240,424 | 37,893 | 18,935 | |||||||||
Debt and share issuance costs |
(14,417 | ) | (1,829 | ) | (1,284 | ) | ||||||
Net cash provided by financing activities |
266,007 | 36,064 | 17,651 | |||||||||
Increase (decrease) in cash and cash equivalents |
76,313 | 17,305 | (5,434 | ) | ||||||||
Cash and cash equivalents at beginning of the period |
24,885 |
7,581 |
13,015 |
|||||||||
Cash and cash equivalents at end of the period |
$ | 101,198 | $ | 24,886 | $ | 7,581 | ||||||
Supplemental cash flow information |
||||||||||||
Oil & gas property accrual included in Accounts payable and accrued liabilities |
$ | 9,426 | $ | 601 | $ | 1,457 | ||||||
Asset retirement obligation |
$ | 849 | $ | 178 | $ | (65 | ) | |||||
Cash paid for interest |
$ | 176 | $ | — | $ | — | ||||||
THE ACCOMPANYING NOTES ARE AN INTEGRAL PART OF THESE FINANCIAL STATEMENTS
73
KODIAK OIL & GAS CORP.
NOTES TO CONSOLIDATED FINANCIAL STATEMENTS
Note 1—Organization
Description of Operations
Kodiak Oil & Gas Corp. and its subsidiary ("Kodiak" or the "Company") is a public company listed for trading on the NYSE Amex LLC and whose corporate headquarters are located in Denver, Colorado, USA. The Company is an independent energy company engaged in the exploration, exploitation, development, acquisition and production of natural gas and crude oil entirely in the western United States.
The Company was incorporated (continued) in the Yukon Territory on September 28, 2001.
Note 2—Basis of Presentation and Significant Accounting Policies
Basis of Presentation
The consolidated financial statements include the accounts of the Company and its wholly-owned subsidiary, Kodiak Oil & Gas (USA) Inc. All significant inter-company balances and transactions have been eliminated in consolidation. The majority of the Corporation's business is transacted in US dollars and, accordingly, the financial statements are expressed in US dollars.
Use of Estimates in the Preparation of Financial Statements
The financial statements included herein were prepared from the records of the Company in accordance with generally accepted accounting principles in the United States ("GAAP") and reflect all normal recurring adjustments which are, in the opinion of management, necessary to provide a fair statement of the results of operations and financial position for the interim periods. The preparation of the financial statements in conformity with GAAP requires management to make estimates and assumptions that affect the reported amounts of oil and gas reserves, assets and liabilities and disclosure of contingent assets and liabilities at the date of the financial statements and the reported amounts of revenues and expenses during the reporting period. We evaluate our estimates on an on-going basis and base our estimates on historical experience and on various other assumptions we believe to be reasonable under the circumstances. Although actual results may differ from these estimates under different assumptions or conditions, we believe that our estimates are reasonable. Our most significant financial estimates are associated with our estimated proved oil and gas reserves.
Cash and Cash Equivalents
Cash and cash equivalents consist of all highly liquid investments that are readily convertible into cash and have original maturities of three months or less when purchased. The carrying value of cash and cash equivalents approximates fair value due to the short-term nature of these instruments.
As of December 31, 2010, the Company had approximately $50.5 million in a money market accounts with its bank. The money market accounts are limited to six withdrawals per month; however, there are no other redemption restrictions. Therefore, the Company classified the entire balance as Cash and Cash Equivalents at December 31, 2010.
Accounts Receivable
The Company records estimated oil and gas revenue receivable from third parties at its net revenue interest. The Company also reflects costs incurred on behalf of joint interest partners in
74
KODIAK OIL & GAS CORP.
NOTES TO CONSOLIDATED FINANCIAL STATEMENTS (Continued)
Note 2—Basis of Presentation and Significant Accounting Policies (Continued)
accounts receivable. Management periodically reviews accounts receivable amounts for collectability and records its allowance for uncollectible receivables under the specific identification method. The Company did not record any allowance for uncollectible receivables in 2010, 2009 or 2008.
Inventory, Prepaid Expenses and Other
Included in inventory, prepaid expenses and other are deposits made on orders of tubular goods required for the Company's drilling program. As of December 31, 2010 there was approximately $7.6 million in deposits made and recorded. As of December 31, 2009 there were no deposits made or recorded. In respect of the $7.6 million tubular goods deposit as of December 31, 2010, the Company estimates that an additional $7.6 million will be paid to complete the purchase and the deposits would be subject to forfeit if the purchases are not completed. The cost basis of the tubular goods is depreciated as a component of oil and gas properties once the inventory is used in drilling operations. The Company records tubular goods inventory at the lower of cost or market value. At December 31, 2010 and December 31, 2009 respectively, the Company's analysis of the difference between cost compared to market values for tubular goods not designated for specific wells was not deemed material.
Concentration of Credit Risk
The Company's cash equivalents and short-term investments are exposed to concentrations of credit risk. The Company manages and controls this risk by investing these funds with major financial institutions. The Company may at times have balances in excess of the federally insured limits.
The Company's receivables are comprised of oil and gas revenue receivables and joint interest billings receivable. The amounts are due from a limited number of entities. Therefore, the collectability is dependent upon the general economic conditions of the few purchasers and joint interest owners. The receivables are not collateralized. However, to date the Company has had minimal bad debts.
Significant Customers
During the year ended December 31, 2010, over 75% of the Company's production was sold to one customer, Plains Marketing LP. However, the Company does not believe that the loss of a single purchaser, including Plains Marketing LP, would materially affect the Company's business because there are numerous other purchasers in the area in which the Company sells its production. For the years ended December 31, 2010, 2009 and 2008 purchases by the following companies exceeded 10% of the total oil and gas revenues of the company.
| |
For the Years Ended December 31, |
|||||||||
|---|---|---|---|---|---|---|---|---|---|---|
| |
2010 | 2009 | 2008 | |||||||
Plains Marketing LP |
75 | % | 55 | % | 0 | % | ||||
Eighty Eight Oil LLC |
9 | % | 16 | % | 84 | % | ||||
Oil and Gas Producing Activities
The Company follows the full cost method of accounting for oil and gas operations whereby all costs related to the exploration and development of oil and gas properties are initially capitalized into a
75
KODIAK OIL & GAS CORP.
NOTES TO CONSOLIDATED FINANCIAL STATEMENTS (Continued)
Note 2—Basis of Presentation and Significant Accounting Policies (Continued)
single cost center ("full cost pool"). Such costs include land acquisition costs, geological and geophysical expenses, carrying charges on non-producing properties, costs of drilling directly related to acquisition and exploration activities. Proceeds from property sales are generally credited to the full cost pool, with no gain or loss recognized, unless such a sale would significantly alter the relationship between capitalized costs and the proved reserves attributable to these costs. A significant alteration would typically involve a sale of 25% or more of the proved reserves related to a single full cost pool.
Depletion of exploration and development costs and depreciation of production equipment is computed using the units-of-production method based upon estimated proved oil and gas reserves as determined by the Company's engineers and audited by independent petroleum engineers. Costs included in the depletion base to be amortized include (a) all proved capitalized costs including capitalized asset retirement costs net of estimated salvage values, less accumulated depletion, (b) estimated future development cost to be incurred in developing proved reserves; and (c) estimated dismantlement and abandonment costs, net of estimated salvage values, that have not been included as capitalized costs because they have not yet been capitalized as asset retirement costs. The costs of unproved properties are withheld from the depletion base until it is determined whether or not proved reserves can be assigned to the properties. The properties are reviewed quarterly for impairment. When proved reserves are assigned or the property is considered to be impaired, the cost of the property or the amount of the impairment is added to costs subject to depletion calculations.
Estimated reserve quantities and future net cash flows have the most significant impact on the Company because these reserve estimates are used in providing a measure of the Company's overall value. These estimates are also used in the quarterly calculations of depletion, depreciation and impairment of the Company's proved properties.
Estimating accumulations of gas and oil is complex and is not exact because of the numerous uncertainties inherent in the process. The process relies on interpretations of available geological, geophysical, engineering and production data. The extent, quality and reliability of this technical data can vary. The process also requires certain economic assumptions, some of which are mandated by the Securities and Exchange Commission (the "SEC"), such as gas and oil prices, drilling and operating expenses, capital expenditures, taxes and availability of funds. The accuracy of a reserve estimate is a function of the quality and quantity of available data; the interpretation of that data; the accuracy of various mandated economic assumptions; and the judgment of the persons preparing the estimate.
The optimal method of determining proved reserve estimates is based upon a decline analysis method, which consists of extrapolating future reservoir pressure and production from historical pressure decline and production data. The accuracy of the decline analysis method generally increases with the length of the production history. Most of the Company's wells have been producing for a period of less than six years and for some, less than a year. Because of this short production history, other generally less accurate methods such as volumetric analysis and analogy to the production history of wells of ours and other operators in the same reservoir were used in conjunction with the decline analysis method to determine the Company's estimates of proved reserves including developed producing, developed non-producing and undeveloped. As the Company's wells are produced over time and more data is available, the estimated proved reserves will be re-determined at least on a quarterly basis in accordance with applicable rules established by the SEC and may be adjusted based on that data.
76
KODIAK OIL & GAS CORP.
NOTES TO CONSOLIDATED FINANCIAL STATEMENTS (Continued)
Note 2—Basis of Presentation and Significant Accounting Policies (Continued)
Depletion and Impairment of Proved Oil and Gas Properties
When proved reserves are assigned or the property is considered to be impaired, the cost of the property or the amount of the impairment is added to the full cost pool and becomes subject to depletion calculations. The cost of acquiring and evaluating unproved properties are initially excluded from depletion calculations. Capitalized costs, together with the costs of production equipment, are depleted and amortized on the unit-of-production method based on the estimated gross proved reserves as determined by independent petroleum engineers. For this purpose, we convert our petroleum products and reserves to a common unit of measure. For depletion and depreciation purposes, relative volumes of oil and gas production and reserves are converted at the energy equivalent rate of six thousand cubic feet of natural gas to one barrel of crude oil. Under the full cost method of accounting, capitalized oil and gas property costs less accumulated depletion and net of deferred income taxes may not exceed an amount equal to the present value, discounted at 10%, of estimated future net revenues from proved oil and gas reserves plus the cost of unproved properties not subject to amortization (without regard to estimates of fair value), or estimated fair value, if lower of unproved properties that are subject to amortization. Should capitalized costs exceed this ceiling, an impairment is recognized. The present value of estimated future net revenues was computed by applying current prices of oil and gas to estimated future production of proved oil and gas reserves as of period-end, less estimated future expenditures to be incurred in developing and producing the proved reserves (assuming the continuation of existing economic conditions), less any applicable future taxes. As noted in Management's Discussion and Analysis under the heading "Oil and Gas Reserves" in Part II of this report, as of December 31, 2010, there was a $6.6 million tax effect in 2010 and no tax effect in 2009 as the tax basis in properties at December 31, 2009, and net operating loss exceeds the future net revenues and the Company's existing net operating losses ("NOLs"). We expect that all of our NOLs will be realized within future carryforward periods. All of the Company's operations, and resulting NOLs, are attributable to our oil and gas assets.
There were no impairment charges recognized for the years ended December 31, 2010 and 2009. The Company recorded an impairment expense of $47.5 million in 2008.
Impairment of Unproved Oil and Gas Properties
These unevaluated properties are assessed quarterly to ascertain whether impairment has occurred. The Company's unproved properties are evaluated quarterly for the possibility of potential impairment. For the years ended December 31, 2010 and 2009, respectively, no impairment was recorded. For the year ended December 31, 2008, the Company reclassified approximately $17.2 million of unproved property cost to the full cost pool which contributed to a recorded impairment expense of $47.5 million in 2008.
Wells in Progress
Wells in progress at December 31, 2010 and December 31, 2009, represent the costs associated with wells that have not reached total depth or been completed as of period end. They are classified as wells in progress and withheld from the depletion calculation and the ceiling test. The costs for these wells is then transferred to proved property when the wells reach total depth and are cased and the costs become subject to depletion and the ceiling test calculation in future periods. At December 31,
77
KODIAK OIL & GAS CORP.
NOTES TO CONSOLIDATED FINANCIAL STATEMENTS (Continued)
Note 2—Basis of Presentation and Significant Accounting Policies (Continued)
2010, the Company had six wells awaiting completion in its Williston Basin—Bakken oil play and one well waiting completion on its Vermillion Basin prospect.
Deferred Financing Costs
As of December 31, 2010, the Company recorded deferred financing costs of $1.6 million related to the closing of its credit facility (see Note 8). Deferred financing costs include origination, legal and engineering fees incurred in connection with the Company's credit facility, which are being amortized over the four-year term of the credit facility. The Company recorded amortization expense of $83,000 (which includes the expensing of all remaining deferred financing costs from the Company's previous credit facility) in the year ended December 31, 2010. The Company recorded amortization expense $25,000 as of December 31, 2009.
Capitalization of Interest
The Company capitalizes interest costs associated with the development and construction of significant properties or projects to bring them to a condition and location necessary for their intended use, which for crude oil and natural gas assets is at first production from the field. Interest is capitalized using an interest rate equivalent to the average rate we pay on our note payable. Capitalized interest is included in the cost of oil and gas assets and amortized with other costs on a unit-of-production basis. Capitalized interest totaled $470,000 in 2010, $0 million in 2009, and 2008.
Bakken Properties Acquisitions—Accounted for as a Business Combination
On November 30, 2010, the Company completed the acquisition of approximately 14,500 net acres of Bakken leasehold and related producing properties in the Williston Basin of North Dakota. The acquisition is accounted for using the acquisition method under ASC 805, which requires the acquired assets and liabilities to be recorded at fair values as of the acquisition date of November 30, 2010. The Company estimated that the total consideration under the asset purchase agreement to be $110.0 million. Through our evaluation of the fair values of the net assets acquired in the acquisition we have preliminarily determined that the adjusted purchase price was $108.6 million and the related fair value for the proved oil and gas properties was $32.2 million and unproved oil and gas properties (unevaluated acreage) was $77.2 million.
78
KODIAK OIL & GAS CORP.
NOTES TO CONSOLIDATED FINANCIAL STATEMENTS (Continued)
Note 2—Basis of Presentation and Significant Accounting Policies (Continued)
The following table summarizes the preliminary fair values of assets acquired and liabilities assumed (in thousands) as of November 30, 2010:
| |
November 30, 2010 |
|||||
|---|---|---|---|---|---|---|
Amounts recognized for fair value of assets acquired and liabilities assumed: |
||||||
Consideration Given |
||||||
Cash |
$ | 108,649 | ||||
Total consideration given |
$ | 108,649 | ||||
Proved oil and gas properties |
$ | 32,232 | ||||
Unproved oil and gas properties |
77,193 | |||||
Total fair value of oil and gas properties acquired |
109,425 | |||||
Working capital |
(541 |
) |
||||
Asset retirement obligation |
(235 | ) | ||||
Total fair value of liabilities acquired, net |
(776 | ) | ||||
Net assets acquired |
$ | 108,649 | ||||
Working capital acquired was as follows: |
||||||
Accounts receivable |
$ | 269 | ||||
Inventory |
63 | |||||
Accrued liabilities |
(873 | ) | ||||
Total working capital |
$ | (541 | ) | |||
The Company has recorded the above values as a preliminary purchase price allocation as of December 31, 2010. The preliminary purchase price allocation includes significant use of estimates. This preliminary allocation is based on information that was available to management at the time these financial statements were prepared and management has not completed its assessment of the fair values of the assets acquired and liabilities assumed. Additionally, the Company and the seller expect to complete the transaction's final settlement in early 2011. Accordingly, the purchase price and/or allocation may change as additional information becomes available and is assessed by the Company, and the impact of such changes may be material.
On December 1, 2010, the Company entered into three asset purchase agreements with private unrelated parties and completed the acquisitions of approximately 1,186 net acres of Bakken leasehold and related working interests in producing properties in the Williston Basin of North Dakota ("Additional Bakken Acquisitions") for $4.6 million. The Additional Bakken Acquisitions are geographically and operationally analogous to the acquisition completed on November 30, 2010, noted above. The Additional Bakken Acquisitions are accounted for using the acquisition method of accounting under ASC 805, which requires the acquired assets and liabilities to be recorded at fair values as of the acquisition date of December 1, 2010. The fair value of the assets acquired approximated the $4.6 million in consideration paid.
79
KODIAK OIL & GAS CORP.
NOTES TO CONSOLIDATED FINANCIAL STATEMENTS (Continued)
Note 2—Basis of Presentation and Significant Accounting Policies (Continued)
The following table summarizes the preliminary fair values of assets acquired (in thousands) as of December 1, 2010:
| |
December 1, 2010 |
|||||
|---|---|---|---|---|---|---|
Consideration Given |
||||||
Cash |
$ | 4,550 | ||||
Total consideration given |
$ | 4,550 | ||||
Proved oil and gas properties |
$ | 1,178 | ||||
Unproved oil and gas properties |
3,372 | |||||
Total fair value of oil and gas properties acquired |
4,550 | |||||
The following unaudited supplemental pro forma information presents the results of operations for the years ended December 31, 2010 and 2009, as if the acquisition and the Additional Bakken Acquisitions had occurred as of the earliest period presented, January 1, 2009. For the years ended December 31, 2010 and 2009, the pro forma information includes the effects of adjustments for depreciation and depletion expense of $1.9 million and $18,000, acquisition costs of $0 and $400,000, amortization of financing costs of $285,000 and $285,000, and interest expense of $6.1 million and $6.4 million, respectively. The pro forma results do not include any cost savings or other synergies that may result from the acquisition or Additional Bakken Acquisitions or any estimated costs that have been or will be incurred by the Company to integrate the properties acquired. The pro forma results are not necessarily indicative of what actually would have occurred if the acquisition had been completed as of the beginning of the period, nor are they necessarily indicative of future results.
| |
(In thousands) | |||||||
|---|---|---|---|---|---|---|---|---|
| |
For the years ended December 31, |
|||||||
| |
2010 | 2009 | ||||||
| |
(Unaudited) |
(Unaudited) |
||||||
Operating Revenues |
$ | 31,616 | $ | 11,344 | ||||
Net loss |
$ | (5,375 | ) | $ | (9,576 | ) | ||
Pro forma loss per common share: |
||||||||
Basic |
$ | (0.04 | ) | $ | (0.09 | ) | ||
Diluted |
$ | (0.04 | ) | $ | (0.09 | ) | ||
Additionally, included in the accompanying consolidated statement of operations the Company recognized oil and gas revenues of $747,000 and net operating income of $612,000 associated with the acquired oil & gas properties and earned subsequent to the acquisition dates.
Commodity Derivative Instrument
Through its wholly-owned affiliate Kodiak Oil & Gas (USA) Inc., the Company has entered into commodity derivative contracts, as described below. The Company has utilized swaps or "no premium" collars to reduce the effect of price changes on a portion of our future oil production. A collar requires us to pay the counterparty if the market price is above the ceiling price and requires the counterparty
80
KODIAK OIL & GAS CORP.
NOTES TO CONSOLIDATED FINANCIAL STATEMENTS (Continued)
Note 2—Basis of Presentation and Significant Accounting Policies (Continued)
to pay us if the market price is below the floor price. A swap requires us to pay the counterparty if the settlement price exceeds the strike price and the same counterparty is required to pay us if the settlement price is less than the strike price. The objective of the Company's use of derivative financial instruments is to achieve more predictable cash flows in an environment of volatile oil and gas prices and to manage its exposure to commodity price risk. While the use of these derivative instruments limits the downside risk of adverse price movements, such use may also limit the Company's ability to benefit from favorable price movements. The Company may, from time to time, add incremental derivatives to hedge additional production, restructure existing derivative contracts or enter into new transactions to modify the terms of current contracts in order to realize the current value of the Company's existing positions.
The use of derivatives involves the risk that the counterparties to such instruments will be unable to meet the financial terms of such contracts. The Company's derivative contracts are currently with one counterparty and the Company is a guarantor of Kodiak USA. The Company has netting arrangements with the counterparty that provide for the offset of payables against receivables from separate derivative arrangements with the counterparty in the event of contract termination. The derivative contracts may be terminated by a non-defaulting party in the event of default by one of the parties to the agreement.
81
KODIAK OIL & GAS CORP.
NOTES TO CONSOLIDATED FINANCIAL STATEMENTS (Continued)
Note 2—Basis of Presentation and Significant Accounting Policies (Continued)
The Company's commodity derivative contracts as of December 31, 2010 are summarized below:
Contract Type
|
Counterparty | Basis(1) | Quantity(Bbl/d) | Strike Price ($/Bbl) | Term | |||||||||||
|---|---|---|---|---|---|---|---|---|---|---|---|---|---|---|---|---|
Collar |
Wells Fargo Bank, N.A. | NYMEX | 400 | $ | 75.00/$89.20 | Jan 1 - Dec 31, 2011 | ||||||||||
Collar |
Wells Fargo Bank, N.A. | NYMEX | 200 - 500 | $ | 70.00/$95.56 | Jan 1 - Dec 31, 2011 | ||||||||||
Collar |
Wells Fargo Bank, N.A. | NYMEX | 400 | $ | 70.00/$95.56 | Jan 1 - Dec 31, 2012 | ||||||||||
|
||||||||||||||||
Contract Type
|
Counterparty | Basis(1) | Quantity(Bbl/d) | Swap Price ($/Bbl) | Term | |||||||||||
|---|---|---|---|---|---|---|---|---|---|---|---|---|---|---|---|---|
Swap |
Wells Fargo Bank, N.A. | NYMEX | 135 | $ | 84.00 | Jan 1 - Dec 31, 2011 | ||||||||||
Swap |
Wells Fargo Bank, N.A. | NYMEX | 130 | $ | 90.28 | Jul 1 - Dec 31, 2011 | ||||||||||
2011 Total/Average |
201 | $ | 85.85 | |||||||||||||
Swap |
Wells Fargo Bank, N.A. | NYMEX | 100 | $ | 84.00 | Jan 1 - Dec 31, 2012 | ||||||||||
Swap |
Wells Fargo Bank, N.A. | NYMEX | 136 | $ | 88.30 | Jan 1 - Dec 31, 2012 | ||||||||||
Swap |
Wells Fargo Bank, N.A. | NYMEX | 24 | $ | 90.28 | Jan 1 - Dec 31, 2012 | ||||||||||
2012 Total/Average |
260 | $ | 86.83 | |||||||||||||
Swap |
Wells Fargo Bank, N.A. | NYMEX | 79 | $ | 84.00 | Jan 1 - Dec 31, 2013 | ||||||||||
Swap |
Wells Fargo Bank, N.A. | NYMEX | 427 | $ | 88.30 | Jan 1 - Dec 31, 2013 | ||||||||||
Swap |
Wells Fargo Bank, N.A. | NYMEX | 24 | $ | 90.28 | Jan 1 - Dec 31, 2013 | ||||||||||
2013 Total/Average |
530 | $ | 87.75 | |||||||||||||
Swap |
Wells Fargo Bank, N.A. | NYMEX | 69 | $ | 84.00 | Jan 1 - Dec 31, 2014 | ||||||||||
Swap |
Wells Fargo Bank, N.A. | NYMEX | 360 | $ | 88.30 | Jan 1 - Dec 31, 2014 | ||||||||||
Swap |
Wells Fargo Bank, N.A. | NYMEX | 21 | $ | 90.28 | Jan 1 - Dec 31, 2014 | ||||||||||
2014 Total/Average |
450 | $ | 87.73 | |||||||||||||
Swap |
Wells Fargo Bank, N.A. | NYMEX | 59 | $ | 84.00 | Jan 1 - Oct 31, 2015 | ||||||||||
Swap |
Wells Fargo Bank, N.A. | NYMEX | 317 | $ | 88.30 | Jan 1 - Sept 30, 2015 | ||||||||||
Swap |
Wells Fargo Bank, N.A. | NYMEX | 46 | $ | 90.28 | Jan 1 - Oct 31, 2015 | ||||||||||
2015 Total/Average (Through October) |
390 | $ | 87.81 | |||||||||||||
- (1)
- NYMEX refers to quoted prices on the New York Mercantile Exchange.
Subsequent to year end 2010, we entered into additional collars as described below:
Contract Type
|
Counterparty | Basis | Quantity(Bbl/d) | Strike Price ($/Bbl) | Term | |||||||||||
|---|---|---|---|---|---|---|---|---|---|---|---|---|---|---|---|---|
Collar |
Wells Fargo Bank, N.A. | NYMEX | 400 | $ | 85.00/$117.73 | Mar 1 - Dec 31, 2011 | ||||||||||
Collar |
Wells Fargo Bank, N.A. | NYMEX | 230 | $ | 85.00/$117.73 | Jan 1 - Dec 31, 2012 | ||||||||||
The following table details the fair value of the derivatives recorded in the applicable consolidated balance sheet, by category (in thousands):
| |
|
Fair Value at | |||||||
|---|---|---|---|---|---|---|---|---|---|
Underlying Commodity
|
Location on Balance Sheet |
December 31, 2010 | December 31, 2009 | ||||||
Crude oil derivative contract |
Current liabilities | $ | 2,248 | $ | — | ||||
Crude oil derivative contract |
Noncurrent liabilities | $ | 3,495 | $ | — | ||||
82
KODIAK OIL & GAS CORP.
NOTES TO CONSOLIDATED FINANCIAL STATEMENTS (Continued)
Note 2—Basis of Presentation and Significant Accounting Policies (Continued)
The amount of gain (loss) recognized in income related to our derivative financial instruments was as follows (in thousands):
| |
For the years ended | ||||||
|---|---|---|---|---|---|---|---|
| |
December 31, 2010 |
December 31, 2009 |
|||||
Unrealized loss on oil contracts |
$ | (5,743 | ) | $ | — | ||
Realized loss on oil contracts |
(403 | ) | — | ||||
Loss on commodity price risk management activities |
$ | (6,146 | ) | $ | — | ||
Unrealized gains and losses resulting from derivatives are recorded at fair value on the consolidated balance sheet and changes in fair value are recognized in the unrealized gain (loss) on risk management activities line on the consolidated statement of operations. Realized gains and losses resulting from the contract settlement of derivatives are recorded in the commodity price risk management activities line on the consolidated statement of income.
Fair Value of Financial Instruments
The Company's financial instruments, other than the derivative instrument discussed above, including cash and cash equivalents, accounts payable and accrued liabilities are carried at cost, which approximates fair value due to the short-term maturity of these instruments. Additionally, the recorded value of the Company's long-term debt approximates its fair value as it bears interest at variable rates over the term of the loan.
Other Property and Equipment
Other property and equipment such as office furniture and equipment, vehicles, and computer hardware and software are recorded at cost. Costs of renewals and improvements that substantially extend the useful lives of the assets are capitalized. Maintenance and repair costs are expensed when incurred. Depreciation is recorded using the straight-line method over the estimated useful lives of three years for computer equipment, and five years for office equipment and vehicles. When other property and equipment is sold or retired, the capitalized costs and related accumulated depreciation are removed from the accounts.
Revenue Recognition
The Company records revenues from the sales of natural gas and crude oil when they are produced and sold. The Company may have an interest with other producers in certain properties, in which case the Company uses the sales method to account for gas imbalances. Under this method, revenue is recorded on the basis of gas actually sold by the Company. In addition, the Company records revenue for its share of gas sold by other owners that cannot be volumetrically balanced in the future due to insufficient remaining reserves. The Company also reduces revenue for other owners' gas sold by the Company that cannot be volumetrically balanced in the future due to insufficient remaining reserves. The Company's over and under produced gas balancing positions are considered in the Company's proved oil and gas revenues. Gas imbalances at December 31, 2010, and December 31, 2009 were not significant.
83
KODIAK OIL & GAS CORP.
NOTES TO CONSOLIDATED FINANCIAL STATEMENTS (Continued)
Note 2—Basis of Presentation and Significant Accounting Policies (Continued)
Asset Retirement Obligation
The Company follows accounting for asset retirement obligations in accordance with ASC 410, which requires that the fair value of a liability for an asset retirement obligation be recognized in the period in which it was incurred if a reasonable estimate of fair value could be made. The associated asset retirement costs are capitalized as part of the carrying amount of the long-lived asset. The increase in carrying value of a property associated with the capitalization of an asset retirement cost is included in proved oil and gas properties in the consolidated balance sheets. The Company depletes the amount added to proved oil and gas property costs. The future cash outflows associated with settling the asset retirement obligations that have been accrued in the accompanying balance sheets are excluded from the ceiling test calculations. The Company also depletes the estimated dismantlement and abandonment costs, net of salvage values, associated with future development activities that have not yet been capitalized as asset retirement obligations. These costs are included in the ceiling test calculation. Asset retirement obligations incurred in 2010 and 2009 are classified as Level 3 (unobservable inputs) fair value measurements. The asset retirement liability is allocated to operating expense using a systematic and rational method. As of December 31, 2010, and December 31, 2009, the Company has recorded a net asset of $1.3 million and $604,000 and a related liability of $2.0 million and $1.1 million, respectively.
The information below reconciles the value of the asset retirement obligation for the periods presented:
| |
(In thousands) | |||||||
|---|---|---|---|---|---|---|---|---|
| |
For the Year Ended December 31, 2010 |
For the Year Ended December 31, 2009 |
||||||
Balance beginning of period |
$ | 1,060 | $ | 787 | ||||
Liabilities incurred |
849 | 252 | ||||||
Liabilities settled |
(67 | ) | (74 | ) | ||||
Accretion expense |
126 | 95 | ||||||
Balance end of period |
$ | 1,968 | $ | 1,060 | ||||
84
KODIAK OIL & GAS CORP.
NOTES TO CONSOLIDATED FINANCIAL STATEMENTS (Continued)
Note 2—Basis of Presentation and Significant Accounting Policies (Continued)
Off Balance Sheet Arrangements
The Company is currently subject to three drilling rig contracts. As a result of having completed the two-year drilling commitment applicable to the first drilling rig, there is no associated termination fee for this rig as of December 31, 2010. The Company continues to operate this rig on a month-to-month basis while negotiating a contract extension. The second rig was placed into operation in March 2010 and entails a two-year drilling commitment or specific termination fees if drilling activity is cancelled prior to March 10, 2012. This contract can also be extended by mutual consent. The estimated termination fee for the second rig is $4.0 million as of December 31, 2010. The Company is currently utilizing both rigs for drilling in the Williston Basin and expects to continue utilization through their respective terms. During the second quarter of 2010, the Company entered into a contract for the use of a third drilling rig. The third rig contract entails a two-year drilling commitment or specific termination fees if the contract is terminated prior to delivery of the rig. The contract may also be extended by mutual consent. The estimated termination fee for this third rig is $4.0 million as of December 31, 2010. The Company currently expects to utilize this third rig in its operations in the Williston Basin.
As is customary in the oil and gas industry, the Company may at times have commitments in place to reserve or earn certain acreage positions or wells. If the Company does not meet such commitments, the acreage positions or wells may be lost. Other than standard operating leases, the Company did not have any off-balance sheet financing arrangements at December 31, 2010 and December 31, 2009.
Recent Accounting Pronouncements
In January 2010, the FASB issued Accounting Standards Update ("ASU") 2010-03, Extractive Activities—Oil and Gas (Topic 932), to amend existing oil and gas reserve accounting and disclosure guidance to align its requirements with the SEC's revised rules. The significant modifications involve revised definitions of oil and gas producing activities, changing the pricing used to estimate reserves at period end to a twelve month average of the first day of the month prices and additional disclosure requirements. In contrast to the applicable SEC rule, the FASB does not permit the disclosure of probable and possible reserves in the supplemental oil and gas information in the notes to the financial statements. In April 2010, the FASB issued ASU 2010-14 which amends the guidance on oil and gas reporting in ASC 932.10.S99-1 by adding the Codification SEC Regulation S-X, Rule 4-10 as amended by the SEC Final Rule 33-8995. Both ASU 2010-03 and ASU 2010-14 are effective for annual reporting periods ending on or after December 31, 2009. Application of the revised rules is prospective and companies are not required to change prior period presentation to conform to the amendments. The Company adopted the provisions of these updates for the year ended December 31, 2009.
In January 2010, the FASB issued ASU 2010-06, "Improving Disclosures About Fair Value Measurements", which provides amendments to fair value disclosures. ASU 2010-06 requires additional disclosures and clarifications of existing disclosures for recurring and nonrecurring fair value measurements. The revised guidance for transfers into and out of Level 1 and Level 2 categories, as well as increased disclosures around inputs to fair value measurement, was adopted January 1, 2010, with the amendments to Level 3 disclosures effective beginning after January 1, 2011. ASU 2010-06 concerns disclosure only. Neither the current requirements nor the amendments effective in 2011 will have a material impact on the Company's financial position or results of operations.
85
KODIAK OIL & GAS CORP.
NOTES TO CONSOLIDATED FINANCIAL STATEMENTS (Continued)
Note 2—Basis of Presentation and Significant Accounting Policies (Continued)
In December 2010, the FASB issued ASU No. 2010-29, Disclosure of Supplementary Pro Forma Information for Business Combinations (ASU 2010-29). ASU 2010-29 requires a public entity who discloses comparative pro forma information for business combinations that occurred in the current reporting period to disclose revenue and earnings of the combined entity as though the business combination(s) occurred as of the beginning of the comparable prior annual period only. This update also expands the supplemental pro forma disclosures required to include a description of the nature and amount of material, nonrecurring pro forma adjustments directly attributable to the business combination included in the reported pro forma revenue and earnings. ASU 2010-29 is effective for business combinations for which the acquisition date is on or after the beginning of the first annual reporting period beginning on or after December 15, 2010 and early adoption is permitted. The Company adopted the provisions of this update for its business combinations that occurred during 2010.
Note 3—Oil and Gas Property
The following table presents information regarding the Company's net costs incurred in the purchase of proved and unproved properties, and in the exploration and development activities:
| |
(In thousands) | |||||||||||
|---|---|---|---|---|---|---|---|---|---|---|---|---|
| |
For the Years Ended December 31, | |||||||||||
| |
2010 | 2009 | 2008 | |||||||||
Property Acquisition costs: |
||||||||||||
Proved |
$ | 33,539 | $ | — | $ | — | ||||||
Unproved |
95,572 | 463 | — | |||||||||
Exploration costs |
14,821 | 5 | 8,893 | |||||||||
Development costs |
52,081 | 26,903 | 2,163 | |||||||||
Total |
$ | 196,013 | $ | 27,371 | $ | 11,056 | ||||||
Total excluding asset retirement obligation |
$ | 195,164 | $ | 27,193 | $ | 10,909 | ||||||
Depletion expense related to the proved properties per BOE of production for the years ended December 31, 2010, 2009, and 2008 were $20.92, $13.23, and $32.18, respectively.
At December 31, 2010 and 2009, the Company's unproved properties consisted of leasehold acquisition costs in the following areas:
| |
(In thousands) | ||||||
|---|---|---|---|---|---|---|---|
| |
2010 | 2009 | |||||
Colorado |
$ | 128 | $ | 126 | |||
Montana |
127 | 911 | |||||
North Dakota |
106,006 | 9,994 | |||||
Wyoming |
993 | 1,037 | |||||
|
$ | 107,254 | $ | 12,068 | |||
86
KODIAK OIL & GAS CORP.
NOTES TO CONSOLIDATED FINANCIAL STATEMENTS (Continued)
Note 3—Oil and Gas Property (Continued)
The following table sets forth a summary of oil and gas property costs (net of divestitures) not being amortized as of December 31, 2010 by the year in which such costs were incurred:
| |
(In thousands) | |||
|---|---|---|---|---|
| |
Unproved Additions by Year | |||
Prior |
$ | 4,687 | ||
2008 |
7,298 | |||
2009 |
83 | |||
2010 |
95,186 | |||
Total |
$ | 107,254 | ||
During 2010 and 2009 no unproved land costs were determined to be impaired and reclassified to proved property and included in the ceiling test and depletion calculations.
Note 4—Wells in Progress
The following table reflects the net changes in capitalized additions to wells in progress during 2010 and 2009:
| |
(In thousands) | ||||||
|---|---|---|---|---|---|---|---|
| |
For the Year Ended December 31, 2010 |
For the Year Ended December 31, 2009 |
|||||
Beginning balance |
$ | 2,691 | $ | 728 | |||
Additions to capital wells in progress costs pending the determination of proved reserves |
36,257 | 16,128 | |||||
Reclassifications to wells, facilities, and equipment based on the determination of proved reserves to full cost pool |
(17,530 | ) | (14,165 | ) | |||
Ending balance |
$ | 21,418 | $ | 2,691 | |||
The following table provides an aging of capitalized wells in progress costs based on the date the drilling was completed and the number of projects for which wells in progress have been capitalized since the completion of drilling:
| |
(In thousands) | ||||||
|---|---|---|---|---|---|---|---|
| |
For the Years Ended December 31 | ||||||
| |
2010 | 2009 | |||||
Wells in progress capitalized for one year or less |
$ | 21,369 | $ | 2,465 | |||
Wells in progress capitalized for one year or more |
49 | 226 | |||||
Ending balance at December 31 |
$ | 21,418 | $ | 2,691 | |||
Number of projects with wells in progress that have been capitalized less than one year |
9 | 3 | |||||
87
KODIAK OIL & GAS CORP.
NOTES TO CONSOLIDATED FINANCIAL STATEMENTS (Continued)
Note 5—Common Stock
In May 2009, the Company entered into agreements to sell 9,600,000 shares of our common stock to certain institutional investors, in a non-brokered registered direct offering. The aggregate gross proceeds from the offering were $7.2 million. The Company paid $108,000 in expenses related to the offering. The net proceeds were used principally for drilling and completion activities on our leases in the Bakken oil play located in Dunn County, North Dakota and for other general corporate activities.
In October 2009, the Company issued 13,800,000 shares of common stock in a public offering for gross proceeds of $30.4 million. The Company paid $1.7 million in expenses related to the offering. The net proceeds were used principally for drilling and completion activities on the Company's leases in the Bakken oil play located in Dunn County, North Dakota and for other general corporate activities.
In August 2010, the Company closed a public offering of 28,750,000 shares of common stock, including the full exercise of the underwriters' over-allotment option of 3,750,000 shares. All shares were sold at a price of $2.75 per share. The net proceeds of the offering, after deducting underwriting discounts and commissions and our offering expenses, were approximately $74.6 million. The net proceeds were used principally for drilling and completion activities on the Company's leases in the Bakken oil play located in Dunn County, North Dakota and for other general corporate activities.
In December 2010, the Company issued 28,750,000 shares of common stock in a public offering, including the full exercise of the underwriters' over-allotment option of 3,750,000 shares. All shares were sold at a price of $5.50 per share. The net proceeds of the offering, after deducting underwriting discounts and commissions and our offering expenses, were approximately $150.0 million. Approximately $50.0 million was used for reduction of debt and the remaining net proceeds will be used for drilling and completion activities on the Company's leases in the Bakken oil play located in Dunn County, North Dakota and for other general corporate activities.
The Company may issue debt securities in the future, which the Company's wholly-owned subsidiary, Kodiak Oil & Gas (USA) Inc., may guarantee. Any such guarantee is expected to be full, unconditional and joint and several. The Company has no independent assets or operations nor does it have any other subsidiaries. There are no significant restrictions on the ability of the Company to receive funds from the Company's subsidiary through dividends, loans, advances or otherwise.
Note 6—Compensation Plan
Stock-based Compensation Plan
In 2007, the Company adopted the 2007 Stock Incentive Plan (the "2007 Plan"), which replaced the Incentive Share Option Plan. The 2007 Plan authorized the Company to issue stock options, stock appreciation rights (SARs), restricted stock and restricted stock units, performance awards, stock or property, stock awards and other stock-based awards to any employee, consultant, independent contractor, director or officer of the Company. On June 3, 2010, the shareholders of the Company approved Amendment No. 1 to the Company's 2007 Plan to increase the maximum number of shares of the Company's common stock, no par value, available for grant under the 2007 Plan from 8 million shares to 16.6 million shares through December 31, 2010. Each subsequent year, the maximum number of shares of common stock available for issuance under the 2007 Plan, as amended, will be equal to 14% of the Company's then outstanding shares of common stock. As of December 31, 2010, the Company has outstanding options to purchase 6.5 million common shares at prices from $0.36 to $6.56.
88
KODIAK OIL & GAS CORP.
NOTES TO CONSOLIDATED FINANCIAL STATEMENTS (Continued)
Note 6—Compensation Plan (Continued)
The Company granted stock options to acquire 2.9 million common shares at a weighted average exercise price of $3.26 per share and 1.2 million stock options at a weighted average exercise price of $1.18 per share during the years ended December 31, 2010 and December 31, 2009, respectively.
For the years ended December 31, 2010, 2009 and 2008, the Company recorded stock-based compensation of $4.5 million, $3.4 million, and $3.6 million respectively.
The following assumptions were used for the Black-Scholes model to calculate the stock-based compensation expense for the years presented:
| |
For the years ended, | |||||||||
|---|---|---|---|---|---|---|---|---|---|---|
| |
December 31, 2010 | December 31, 2009 | December 31, 2008 | |||||||
Risk free rates |
0.70 - 3.02 | % | 1.24 - 1.34 | % | 1.60 - 4.53 | % | ||||
Dividend yield |
0 | % | 0 | % | 0 | % | ||||
Expected volatility |
95.01 - 102.11 | % | 107.01 - 108.93 | % | 54.37 - 104.22 | % | ||||
Weighted average expected stock option life |
4.55 years | 2.97 years | 4.98 years | |||||||
The weighted average fair value at the date of grant for stock options granted is as follows: |
||||||||||
Weighted average fair value per share |
$ | 2.29 | $ | 0.77 | $ | 1.08 | ||||
Total options granted |
2,937,000 |
1,150,000 |
2,296,000 |
|||||||
Total weighted average fair value of options granted |
$ |
6,732,504 |
$ |
865,433 |
$ |
2,147,541 |
||||
A summary of the stock options outstanding is as follows:
| |
Number of Options |
Weighted Average Exercise Price |
||||||
|---|---|---|---|---|---|---|---|---|
Balance outstanding at January 1, 2009 |
7,507,499 | $ | 2.87 | |||||
Granted |
1,150,000 | 1.18 | ||||||
Canceled |
(1,946,999 | ) | 4.65 | |||||
Expired |
(775,000 | ) | 0.45 | |||||
Exercised |
(350,500 | ) | 0.95 | |||||
Balance outstanding at December 31, 2009 |
5,585,000 | $ | 2.36 | |||||
Granted |
2,937,000 | 3.26 | ||||||
Canceled |
(343,809 | ) | 2.15 | |||||
Exercised |
(1,688,274 | ) | 2.13 | |||||
Balance outstanding at December 31, 2010 |
6,489,917 | $ | 2.73 | |||||
Options exercisable at December 31, 2010 |
3,460,250 | $ | 2.66 | |||||
89
KODIAK OIL & GAS CORP.
NOTES TO CONSOLIDATED FINANCIAL STATEMENTS (Continued)
Note 6—Compensation Plan (Continued)
At December 31, 2010, stock options outstanding are as follows:
Exercise Price
|
Number of Shares | Weighted Average Remaining Contractual Life (Years) |
|||||
|---|---|---|---|---|---|---|---|
$0.36 - $1.00 |
522,000 | 7.99 | |||||
$1.01 - $2.00 |
995,917 | 3.36 | |||||
$2.01 - $3.00 |
1,175,000 | 8.66 | |||||
$3.01 - $4.00 |
3,245,000 | 3.98 | |||||
$4.01 - $5.00 |
75,000 | 9.85 | |||||
$5.01 - $6.56 |
477,000 | 7.61 | |||||
|
6,489,917 | 5.39 | |||||
The aggregate intrinsic value of both outstanding and vested options as of December 31, 2010, was $24.4 million, based on the Company's December 31, 2010 closing common stock price of $6.60. This amount would have been received by the option holders had all option holders exercised their options as of that date. The total grant date fair value of the shares vested during 2010 was $2.1 million. As of December 31, 2010, there was $3.4 million of total unrecognized compensation cost related to unamortized options. That cost is expected to be recognized over a period of three years.
On March 5, 2010, the Company granted 100,000 restricted stock awards, which vested upon grant date. The Company recognized $261,000 in compensation expense related to this grant. On December 31, 2010, the Company awarded tandem grants of 175,000 restricted stock units ("RSUs") and performance awards ("PAs") to executive officers pursuant to the Company's 2007 Plan. Subject to the satisfaction of certain performance-based conditions, the RSUs and PAs vest one-quarter per year over a four year service date and the Company will recognize compensation expense related to these grant beginning in 2011 over the vesting period. All previous awards vest on a graded-vesting basis of one-third at each anniversary date over a three year service period. The Company recognizes compensation cost over the requisite service period for the entire award with the expense recognized upon vesting. The fair value of restricted stock grants is based on the stock price on the grant date and the Company assumes no annual forfeiture rate. As of December 31, 2010, there were 183,000 unvested shares with a weighted-average grant date fair value of $6.47 per share and $1.2 million of total unrecognized compensation cost related to non-vested restricted stock which is expected to be recognized over a four year period.
Note 7—Commitments and Contingencies
The Company leases office space in Denver, Colorado and Dickinson, North Dakota under separate operating lease agreements. The Denver, Colorado lease was extended in 2010 and expires on June 30, 2016. The Dickinson, North Dakota lease expires December 31, 2013. Rent expense was $289,000 in 2010, $248,000 in 2009, and $244,000 in 2008. The Company has no other material capital leases and no other operating lease commitments.
90
KODIAK OIL & GAS CORP.
NOTES TO CONSOLIDATED FINANCIAL STATEMENTS (Continued)
Note 7—Commitments and Contingencies (Continued)
The following table shows the annual rentals per year for the life of the combined office leases:
Years ending on December 31,
|
|
|||
|---|---|---|---|---|
2011 |
$ | 366 | ||
2012 |
$ | 389 | ||
2013 |
$ | 402 | ||
2014 |
$ | 389 | ||
2015 |
$ | 406 | ||
2016 |
$ | 104 | ||
Total |
$ | 2,056 | ||
The Company is currently subject to three drilling rig contracts. As a result of having completed the two-year drilling commitment applicable to the first drilling rig, there is no associated termination fee for this rig as of December 31, 2010. The second rig was placed into operation in March 2010 and entails a two-year drilling commitment or specific termination fees if drilling activity is cancelled prior to March 10, 2012. This contract can also be extended by mutual consent. The estimated termination fee for the second rig is $4.0 million as of December 31, 2010. The Company is currently utilizing both rigs for drilling in the Williston Basin and expects to continue utilization through their respective terms. During the second quarter of 2010, the Company entered into a contract for the use of a third drilling rig. The third rig contract entails a two-year drilling commitment or specific termination fees if the contract is terminated prior to delivery of the rig. The contract may also be extended by mutual consent. The estimated termination fee for this third rig is $4.0 million as of December 31, 2010. The Company currently expects to utilize this third rig in its operations in the Williston Basin.
As is customary in the oil and gas industry, the Company may at times have commitments in place to reserve or earn certain acreage positions or wells. If the Company does not meet such commitments, the acreage positions or wells may be lost.
Note 8—Credit Agreement
First Lien Credit Agreement
On May 24, 2010, the Company, through its wholly-owned subsidiary, Kodiak Oil & Gas (USA) Inc., entered into a $200 million, four-year, revolving, senior secured credit agreement (the "Credit Agreement") with Wells Fargo Bank, N.A. (the "Lender"). On November 30, 2010, the Company entered into the First Amendment to Credit Agreement (the "First Amendment") with Wells Fargo Bank, N.A., which amends that certain Credit Agreement between Subsidiary and Wells Fargo Bank, N.A., dated May 24, 2010. The outstanding principal balance of the revolving loan, together with all unpaid fees and expenses relating thereto, shall be due and payable no later than May 24, 2014. As of December 31, 2010, and, as of the time of this filing, the Company had no borrowings under the First Lien Credit Agreement.
The First Amendment amends the Credit Agreement to, among other things: (1) increase the borrowing base of the Credit Agreement from $20 million to $50 million; (2) permit the Second Lien Credit Agreement (as defined below); (3) limit the ratio of total debt to EBITDAX (as defined in the Credit Agreement) to 4.0 to 1.0 for the four fiscal quarters ending on the last day of any fiscal quarter ending on or before December 31, 2010 and to 3.75 to 1.0 for the four fiscal quarters ending on the
91
KODIAK OIL & GAS CORP.
NOTES TO CONSOLIDATED FINANCIAL STATEMENTS (Continued)
Note 8—Credit Agreement (Continued)
last day of each fiscal quarter thereafter; (4) add a covenant requiring Subsidiary to maintain a ratio of EBITDAX to Interest Expense (each as defined in the Credit Agreement) of at least 3.0 to 1.0 for the four fiscal quarters ending on the last day of any fiscal quarter; and (5) add event of defaults to include a cross-default to the Second Lien Credit Agreement and a default as the result of the failure of the Intercreditor Agreement (as defined in the Credit Agreement) to be valid, binding and enforceable. All other material terms of the Credit Agreement remain unchanged.
Concurrent with the credit agreement, the Company entered into a guarantee pursuant to which the Company guarantees to the Lender all of the obligations of Kodiak Oil & Gas (USA) Inc. under the credit agreement and pledges a security interest in 100% of its equity interests in Kodiak Oil & Gas (USA) Inc. as collateral support for its obligations under the guaranty and the obligations of Kodiak Oil & Gas (USA) Inc. under the credit agreement. Additionally, Kodiak Oil & Gas (USA) Inc. granted a security interest in substantially all of its assets, including mortgages on at least 80% of its interests in oil and gas properties on a discounted basis. Availability under the credit agreement is subject at all times to the then applicable borrowing base, which is recalculated with scheduled redeterminations at April 1 and October 1 of each year. The Company can request two additional redeterminations per year, thereby allowing for the ability to adjust the borrowing base up to four times in a calendar year. The borrowing base was $50 million as of December 31, 2010.
The credit agreement also makes available to the Company standby letters of credit in an amount equal to the lesser of the then applicable borrowing base or $5 million and reduces availability for loans under the credit agreement on a dollar for dollar basis. The Company had $192,000 in outstanding standby letters of credit under the credit agreement as of December 31, 2010, which is considered usage (not borrowings) for purposes of calculating availability and commitment fees. Subsequent to December 31, 2010 we have not issued any new letters of credit.
Interest on the revolving loans is payable at one of the following two variable rates: the Alternate Base Rate for ABR Loans or the Adjusted LIBO Rate for Eurodollar loans, as selected by the Company, plus an additional percentage that can vary on a daily basis and is based on the daily unused portion of the facility. This additional percentage is referred to as the "Applicable Margin" and varies depending on the type of loan. The grid below shows the Applicable Margin options depending on the applicable Borrowing Base Utilization Percentage:
Borrowing Base Utilization Grid
Borrowing Base Utilization Percentage |
<25.0 | % | ³25.0% <50.0 | % | ³50.0% <75.0 | % | ³75.0% <90.0 | % | ³90.0 | % | ||||||
Eurodollar Loans |
2.25 | % | 2.50 | % | 2.75 | % | 3.00 | % | 3.25 | % | ||||||
ABR Loans |
1.25 | % | 1.50 | % | 1.75 | % | 2.00 | % | 2.25 | % | ||||||
Commitment Fee Rate |
0.50 | % | 0.50 | % | 0.50 | % | 0.50 | % | 0.50 | % |
The credit agreement contains representations, warranties, covenants, conditions and defaults customary for transactions of this type, including but not limited to: (a) covenants to comply with a current ratio of consolidated current assets (including unused borrowing capacity) to consolidated current liabilities not less than 1.0:1.0 and a ratio of total debt to EBITDAX (as defined in the Credit Agreement) to 4.0 to 1.0 for the four fiscal quarters ending on the last day of any fiscal quarter ending on or before December 31, 2010 and to 3.75 to 1.0 for the four fiscal quarters ending on the last day of each fiscal quarter thereafter; (b) limitations on liens and incurrence of debt covenants; (c) limitations on dividends, distributions, redemptions and restricted payments covenants; (d) limitations on
92
KODIAK OIL & GAS CORP.
NOTES TO CONSOLIDATED FINANCIAL STATEMENTS (Continued)
Note 8—Credit Agreement (Continued)
investments, loans and advances covenants; (e) requires the Company to maintain a ratio of EBITDAX to Interest Expense (each as defined in the Credit Agreement) of at least 3.0 to 1.0 for the four fiscal quarters ending on the last day of any fiscal quarter and (e) limitations on the sale of property, mergers, consolidations and other similar transactions covenants. As of December 31, 2010, the Company was in compliance with all covenants under the credit agreement.
Second Lien Credit Agreement
On November 30, 2010, Kodiak Oil & Gas (USA) Inc. entered into a second lien term loan credit agreement with an initial commitment of $40 million (the "Second Lien Credit Agreement") with Wells Fargo Energy Capital, Inc. and any other lender party thereto from time to time (collectively, the "Lenders").
Concurrently with Subsidiary's entry into the Second Lien Credit Agreement, the Company entered into a guarantee (the "Guarantee") pursuant to which the Company guarantees to the Lenders all of the obligations of Subsidiary under the Second Lien Credit Agreement and pledges a security interest in 100% of its equity interests in Subsidiary as collateral support for the Company's obligations under the Guarantee and the obligations of Subsidiary under the Second Lien Credit Agreement. Additionally, Subsidiary entered into a second lien guarantee and collateral agreement (the "Collateral Agreement") pursuant to which it granted a security interest on a second priority basis in substantially all of its assets, and Subsidiary provided second lien mortgages on at least 80% of its interests in oil and gas properties on a discounted basis.
Interest on the loans under the Second Lien Credit Agreement will accrue based on one of the following two fluctuating reference rates in a manner prescribed under the applicable loan documents: (1) the LIBOR rate (which is primarily based on the London interbank market rate), subject to a floor of 2.5% and (2) the alternate base rate (which is primarily based on Wells Fargo's "prime" rate). Loans that accrue at the LIBOR rate, subject to the 2.5% floor, are subject to an additional margin of 8%. Loans that accrue at the alternate base rate are subject to an additional margin of 7%.
The outstanding principal balance of the loan under the Second Lien Credit Agreement, together with all unpaid fees and expenses relating thereto, shall be due and payable no later than November 24, 2014 (the "Maturity Date"). Subsidiary may pre-pay the loan in whole or in part at any time after November 30, 2011, subject to the following: (i) if prepayment takes place at any time during the period commencing on November 30, 2011 through November 29, 2012, the loan may be prepaid in whole or in part so long as the principal amount is accompanied by a premium equal to 2.0% of such principal pre-payment and (ii) if prepayment takes place at any time during the period commencing on November 30, 2012 through the day prior to the Maturity Date, the loan may be prepaid in whole or in part so long as the principal amount repaid is accompanied by a premium equal to 1.0% of such principal prepayment.
The Second Lien Credit Agreement contains representations, warranties, covenants, conditions and defaults customary for transactions of this type, including but not limited to restrictions or requirements with respect to additional debt, liens, investments, hedging activities, acquisitions, dividends, mergers, sales of assets, transactions with affiliates and capital expenditures. In addition, the Second Lien Credit Agreement includes financial covenants substantially similar to those under the Credit Agreement, as amended by the First Amendment, and an additional covenant addressing limitations on Subsidiary's ratio of Total Proved PW10% to Total Debt (each as defined in the Second Lien Credit Agreement).
93
KODIAK OIL & GAS CORP.
NOTES TO CONSOLIDATED FINANCIAL STATEMENTS (Continued)
Note 8—Credit Agreement (Continued)
As of December 31, 2010, the Company was in compliance with all covenants under the credit agreement.
In the event of a default under the Second Lien Credit Agreement, Subsidiary's obligations may be accelerated and the Company's guarantee obligations may be enforced. Events of default include but are not limited to: failure to pay as required under the Second Lien Credit Agreement; a default under the Credit Agreement, as amended by the First Amendment; material misrepresentation; voluntary or involuntary bankruptcy proceedings; entry against Subsidiary of a judgment for the payment of money in excess of $1,000,000 (not covered by qualified third party insurance) and certain non-monetary judgments; default with respect to other indebtedness owed by Subsidiary; and certain events constituting a "change in control".
Interest Incurred Under the First and Second Lien Credit Agreement
For the years ended December 31, 2010, 2009, and 2008, the Company incurred interest expense on the credit facility of $549,000, $0, and $0, respectively. Of the total interest incurred, the Company capitalized interest costs of $470,000, $0, and $0 for the years ended December 31, 2010, 2009, and 2008, respectively.
Prior Credit Agreement
During 2008, our wholly-owned subsidiary, Kodiak Oil & Gas (USA) Inc., entered into a two-year, revolving, senior secured credit facility (the "Credit Facility") with Bank of the West, NA. The Credit Facility was terminated in March 2010 and the capitalized deferred financing costs of $50,000 related to the institution of the Credit Facility were expensed at the date of termination.
Note 9—Benefit Plans
401(k) Plan
In 2008 the Company established a 401(k) plan for the benefit of its employees. Eligible employees may make voluntary contributions not exceeding statutory limitations to the plan. The Company matches 100% of employee contributions up to 3% of the employee's salary and 50% of an additional 2% of employee contributions. Employees are vested 100% for all contributions upon participation. The matching contribution recorded in 2010 and 2009 respectively was $116,000 and $61,000.
Other Company Benefits
The Company provides a health, dental, vision, life, and disability insurance benefit to all regular full-time employees paid to a maximum of $1,000 per month per employee.
94
KODIAK OIL & GAS CORP.
NOTES TO CONSOLIDATED FINANCIAL STATEMENTS (Continued)
Note 10—Income Taxes
The Company has available a cumulative net operating loss of approximately $99.8 million that may be carried forward to reduce taxable income in future years. The net operating losses begin to expire between 2011 and 2030. The Tax Reform Act of 1986 contains provisions that limit the utilization of net operating loss carryforwards if there has been a change in ownership as described in Internal Revenue Code Section 382. During 2010, the Company completed an IRC Section 382 study and determined that its net operating loss carryforwards as of December 31, 2010 are not limited by IRC Section 382.
Significant components of the Company's future tax assets and liabilities, after applying enacted corporate income tax rates, are as follows:
| |
2010 | 2009 | 2008 | |||||||
|---|---|---|---|---|---|---|---|---|---|---|
Future income tax assets: |
||||||||||
Tax losses carried forward |
$ | 29,584 | $ | 34,201 | $ | 27,694 | ||||
Stock-based compensation |
5,138 | 3,964 | 2,952 | |||||||
Exploration and development expenses |
2,066 | (1,506 | ) | 6,120 | ||||||
Canadian net operating loss and issuance costs |
9,796 | — | — | |||||||
Derivatives (Mark to market) and other |
2,200 | 210 | (317 | ) | ||||||
|
48,784 | 36,869 | 36,449 | |||||||
Valuation allowance for future income tax assets |
$ |
(48,784 |
) |
$ |
(36,869 |
) |
$ |
(36,449 |
) |
|
Future income tax asset, net |
$ | — | $ | — | $ | — | ||||
A reconciliation of the provision (benefit) for income taxes computed at the statutory rate:
| |
2010 | 2009 | 2008 | |||||||
|---|---|---|---|---|---|---|---|---|---|---|
Federal |
35.0 | % | 35.0 | % | 35.0 | % | ||||
State |
2.7 | % | 1.8 | % | 2.1 | % | ||||
Other |
(2.5 | )% | (7.2 | )% | (1.0 | )% | ||||
Valuation Allowance (United States and Canada) |
(35.2 | )% | (29.6 | )% | (36.1 | )% | ||||
Net |
0.0 | % | 0.0 | % | 0.0 | % | ||||
The Company accounts for income taxes in accordance with ASC Topic 740, "Income Taxes", and has analyzed filing positions in all of the federal and state jurisdictions where it is required to file income tax returns, as well as all open tax years in these jurisdictions. Management does not believe that any uncertain tax positions exist that will materially impact the Company's effective tax rate in future periods.
ASC Topic 740 requires that a valuation allowance be provided if it is more likely than not that some portion or all deferred tax assets will not be realized. The Company's ability to realize the benefit of its deferred tax assets will depend on the generation of future taxable income through profitable operations. Due to the Company's history of losses and the uncertainty of future profitable operations, the Company has recorded a full valuation allowance against its deferred tax assets. The valuation allowance for deferred tax assets increased by $11.9 million in 2010.
95
KODIAK OIL & GAS CORP.
NOTES TO CONSOLIDATED FINANCIAL STATEMENTS (Continued)
Note 11—Fair Value Measurements
ASC Topic 820 establishes a hierarchy for inputs used in measuring fair value that maximizes the use of observable inputs and minimizes the use of unobservable inputs by requiring that the most observable inputs be used when available. Observable inputs are inputs that market participants would use in pricing the asset or liability developed based on market data obtained from sources independent of the Company. Unobservable inputs are inputs that reflect the Company's assumptions of what market participants would use in pricing the asset or liability developed based on the best information available in the circumstances. The hierarchy is broken down into three levels based on the reliability of the inputs as follows:
- •
- Level 1: Quoted prices are available in active markets for identical assets or liabilities;
- •
- Level 2: Quoted prices in active markets for similar assets and liabilities that are observable for
the asset or liability;
- •
- Level 3: Unobservable pricing inputs that are generally less observable from objective sources, such as discounted cash flow models or valuations.
The financial assets and liabilities are classified based on the lowest level of input that is significant to the fair value measurement. The Company's assessment of the significance of a particular input to the fair value measurement requires judgment, and may affect the valuation of the fair value of assets and liabilities and their placement within the fair value hierarchy levels.
The following table presents the Company's financial assets and liabilities that were accounted for at fair value on a recurring basis as of December 31, 2010 by level within the fair value hierarchy (in thousands):
| |
Fair Value Measurements Using | |||||||||||||
|---|---|---|---|---|---|---|---|---|---|---|---|---|---|---|
| |
Level 1 | Level 2 | Level 3 | Total | ||||||||||
Liabilities: |
||||||||||||||
Commodity price risk management liability |
— | (5,743 | ) | — | (5,743 | ) | ||||||||
The Company determines its estimate of the fair value of derivative instruments using a market approach based on several factors, including quoted market prices in active markets, quotes from third parties, the credit rating of each counterparty, and the Company's own credit rating. The Company also performs an internal valuation to ensure the reasonableness of third-party quotes. In consideration of counterparty credit risk, the Company assessed the possibility of whether each counterparty to the derivative would default by failing to make any contractually required payments. Additionally, the Company considers that it is of substantial credit quality and has the financial resources and willingness to meet its potential repayment obligations associated with the derivative transactions. At December 31, 2010, derivative instruments utilized by the Company consist of both "no cost" collars and swaps. The crude oil derivative markets are highly active. Although the Company's derivative instruments are valued using public indices, the instruments themselves are traded with third-party counterparties and are not openly traded on an exchange. As such, the Company has classified these instruments as Level 2.
Other financial instruments not measured at fair value on a recurring basis include cash and cash equivalents, accounts receivable, note receivable, accounts payable, and accrued liabilities. The financial statement carrying amounts of these items approximate their fair values due to their short-term nature.
96
KODIAK OIL & GAS CORP.
NOTES TO CONSOLIDATED FINANCIAL STATEMENTS (Continued)
Note 12—Quarterly Financial Information (Unaudited):
The Company's quarterly financial information for fiscal 2010 and 2009 is as follows:
| |
(In thousands) | ||||||||||||
|---|---|---|---|---|---|---|---|---|---|---|---|---|---|
| |
First Quarter |
Second Quarter |
Third Quarter |
Fourth Quarter |
|||||||||
Year Ended December 31, 2010 |
|||||||||||||
Total revenue |
$ | 5,599 | $ | 6,294 | $ | 6,984 | $ | 5,979 | |||||
Revenue from oil and gas operations |
5,721 | 6,121 | 8,131 | 11,022 | |||||||||
Gross profit(1) |
3,178 | 3,084 | 4,345 | 4,957 | |||||||||
Net income (loss) |
981 | 621 | 361 | (4,365 | ) | ||||||||
Basic and diluted net income (loss) per share |
$ | 0.01 | $ | 0.01 | $ | 0.00 | $ | (0.03 | ) | ||||
Year Ended December 31, 2009 |
|||||||||||||
Total revenue |
$ | 791 | $ | 2,013 | $ | 3,739 | $ | 4,794 | |||||
Revenue from oil and gas operations |
778 | 1,990 | 3,732 | 4,777 | |||||||||
Gross profit(1) |
274 | 1,114 | 1,941 | 2,592 | |||||||||
Net loss |
(1,628 | ) | (538 | ) | (9 | ) | (388 | ) | |||||
Basic and diluted net loss per share |
$ | (0.02 | ) | $ | (0.01 | ) | $ | (0.00 | ) | $ | (0.00 | ) | |
- (1)
- Excludes interest revenue, interest expense, asset impairment expense, unrealized loss on risk management activities and general and administrative expense, and (gain) on currency exchange.
Note 13—Supplemental Oil and Gas Reserve Information (Unaudited)
In January 2010, the FASB issued an ASU to amend existing oil and gas reserve accounting and disclosure guidance to align its requirements with the SEC's revised rules discussed in Note 2. The significant revisions involve revised definitions of oil and gas producing activities, changing the pricing used to estimate reserves at period end to a twelve month arithmetic average of the first day of the month prices and additional disclosure requirements. In contrast to the SEC rule, the FASB does not permit the disclosure of probable and possible reserves in the supplemental oil and gas information in the notes to the financial statements. The amendments are effective for annual reporting periods ending on or after December 31, 2009. Application of the revised rules is prospective and companies are not required to change prior period presentation to conform to the amendments. Application of the amended guidance has only resulted in changes to the prices used to determine proved reserves beginning as of December 31, 2009, which did not result in a significant change to the Company's proved oil and natural gas reserves.
The Company follows the guidelines prescribed in ASC Topic 932 for computing a standardized measure of future net cash flows and changes therein relating to estimated proved reserves. Future cash inflows and future production and development costs are determined by applying prices and costs, including transportation, quality, and basis differentials, to the year-end estimated quantities of oil and gas to be produced in the future. The resulting future net cash flows are reduced to present value amounts by applying a ten percent annual discount factor. Future operating costs are determined based on estimates of expenditures to be incurred in developing and producing the proved oil and gas reserves in place at the end of the period using year-end costs and assuming continuation of existing economic conditions, plus Company overhead incurred.
97
KODIAK OIL & GAS CORP.
NOTES TO CONSOLIDATED FINANCIAL STATEMENTS (Continued)
Note 13—Supplemental Oil and Gas Reserve Information (Unaudited) (Continued)
The assumptions used to compute the standardized measure are those prescribed by the FASB and the SEC. These assumptions do not necessarily reflect the Company's expectations of actual revenues to be derived from those reserves, nor their present value. The limitations inherent in the reserve quantity estimation process, as discussed previously, are equally applicable to the standardized measure computations since these reserve quantity estimates are the basis for the valuation process. The Company emphasizes that reserve estimates are inherently imprecise and that estimates of new discoveries and undeveloped locations are more imprecise than estimates of established proved producing oil and gas properties. Accordingly, these estimates are expected to change as future information becomes available. All of the Company's proved reserves are located in the continental United States.
The following reserve quantity and future net cash flow information for 2010, 2009 and 2008 was prepared by Netherland, Sewell & Associates, Inc. ("Netherland"), independent petroleum engineers. The 2007 information was prepared by the Company and audited by Netherland.
98
KODIAK OIL & GAS CORP.
NOTES TO CONSOLIDATED FINANCIAL STATEMENTS (Continued)
Note 13—Supplemental Oil and Gas Reserve Information (Unaudited) (Continued)
The following table sets forth information for the years ended December 31, 2010, 2009 and 2008 with respect to changes in the Company's proved (i.e. proved developed and undeveloped) reserves:
| |
Crude Oil (Bbls) |
Natural Gas (Mcf) |
||||||
|---|---|---|---|---|---|---|---|---|
December 31, 2007 |
932,031 | 2,696,152 | ||||||
Revisions of previous estimates |
(443,563 | ) | (556,350 | ) | ||||
Purchase of reserves |
— | — | ||||||
Extensions, discoveries, and other additions |
39 | 19,582 | ||||||
Sale of reserves |
(80,467 | ) | (731,539 | ) | ||||
Production |
(63,595 | ) | (209,835 | ) | ||||
December 31, 2008 |
344,445 | 1,218,010 | ||||||
Revisions of previous estimates |
(104,059 | ) | (339,481 | ) | ||||
Purchase of reserves |
— | — | ||||||
Extensions, discoveries, and other additions |
3,775,017 | 3,293,648 | ||||||
Sale of reserves |
(16,101 | ) | (103,244 | ) | ||||
Production |
(182,558 | ) | (220,455 | ) | ||||
December 31, 2009 |
3,816,744 | 3,848,478 | ||||||
Revisions of previous estimates |
329,685 | (202,720 | ) | |||||
Purchase of reserves |
3,059,473 | 2,905,941 | ||||||
Extensions, discoveries, and other additions |
3,236,756 | 2,570,610 | ||||||
Sale of reserves |
— | — | ||||||
Production |
(432,299 | ) | (162,131 | ) | ||||
December 31, 2010 |
10,010,359 | 8,960,178 | ||||||
Proved Developed Reserves, included above: |
||||||||
Balance, December 31, 2007 |
623,950 | 2,455,661 | ||||||
Balance, December 31, 2008 |
344,445 | 1,218,010 | ||||||
Balance, December 31, 2009 |
1,170,435 | 1,454,904 | ||||||
Balance, December 31, 2010 |
3,756,396 | 3,653,018 | ||||||
Proved Undeveloped Reserves, included above: |
||||||||
Balance, December 31, 2007 |
308,081 | 240,491 | ||||||
Balance, December 31, 2008 |
— | — | ||||||
Balance, December 31, 2009 |
2,646,309 | 2,393,574 | ||||||
Balance, December 31, 2010 |
6,253,963 | 5,307,160 | ||||||
As of December 31, 2010, we had estimated proved reserves of 10.0 million barrels ("MBbls") of oil and 9.0 billion cubic feet ("BCF") of natural gas and with a present value discounted at 10% of $154.6 million, net of $6.6 million in estimated future income taxes. Our reserves are comprised of 87% crude oil and 13% natural gas on an energy equivalent basis.
99
KODIAK OIL & GAS CORP.
NOTES TO CONSOLIDATED FINANCIAL STATEMENTS (Continued)
Note 13—Supplemental Oil and Gas Reserve Information (Unaudited) (Continued)
The following values for the 2010 oil and gas reserves are based on the 12 month arithmetic average first of month price January through December 31, 2010 natural gas price of $3.92 per MMBtu (Questar Rocky Mountains price) or $4.39 per MMBtu (Northern Ventura price) and crude oil price of $79.40 per barrel (West Texas Intermediate price). The values for the 2009 oil and gas reserves, based on the 12 month arithmetic average first of month price January through December 31, 2009 natural gas price of $3.02 per MMBtu (Questar Rocky Mountains price) or $3.95 per MMBtu (Northern Ventura price) and crude oil price of $61.08 per barrel (West Texas Intermediate price).. All prices are then further adjusted for transportation, quality and basis differentials.
On November 30, 2010, the Company completed the acquisition of approximately 14,500 net acres of Bakken leasehold in the Williston Basin of North Dakota which included proved reserves associated with producing properties. Included in the Company's December 31, 2010 proved reserves and classified as 'Purchase of reserves' in the table above, are 3.1 Mbls of crude oil and 2.9 BCF of natural gas reserves attributable to the acquisition.
The following summary sets forth the Company's future net cash flows relating to proved oil and gas reserves based on the standardized measure prescribed in ASC Topic 932:
| |
(In thousands) | |||||||||
|---|---|---|---|---|---|---|---|---|---|---|
| |
Year Ended December 31, | |||||||||
| |
2010 | 2009 | 2008 | |||||||
Future oil and gas sales |
$ | 737,631 | $ | 211,632 | $ | 12,882 | ||||
Future production costs |
(185,405 | ) | (56,592 | ) | (5,450 | ) | ||||
Future development costs |
(145,093 | ) | (45,911 | ) | (219 | ) | ||||
Future income tax expense |
(31,980 | ) | — | — | ||||||
Future net cash flows |
375,153 | 109,129 | 7,213 | |||||||
10% annual discount |
(220,585 | ) | (70,066 | ) | (1,885 | ) | ||||
Standardized measure of discounted future net cash flows(1) |
$ | 154,568 | $ | 39,063 | $ | 5,328 | ||||
- (1)
- Our calculations of the standardized measure of discounted future net cash flows include the effect of estimated future income tax expenses for all years reported. We expect that all of our NOLs will be realized within future carryforward periods. All of the Company's operations, and resulting NOLs, are attributable to our oil and gas assets. There were no taxes in 2008 or 2007 as the tax basis and NOL's exceeded the future net revenue.
100
KODIAK OIL & GAS CORP.
NOTES TO CONSOLIDATED FINANCIAL STATEMENTS (Continued)
Note 13—Supplemental Oil and Gas Reserve Information (Unaudited) (Continued)
The principle sources of change in the standardized measure of discounted future net cash flows are:
| |
(In thousands) | |||||||||
|---|---|---|---|---|---|---|---|---|---|---|
| |
Year ended December 31, | |||||||||
| |
2010 | 2009 | 2008 | |||||||
Balance at beginning of period |
$ | 39,063 | $ | 5,328 | $ | 36,194 | ||||
Sales of oil and gas, net |
(24,200 | ) | (9,057 | ) | (3,190 | ) | ||||
Net change in prices and production costs |
30,398 | 4,178 | (27,084 | ) | ||||||
Net change in future development costs |
(1,739 | ) | — | 5,666 | ||||||
Extensions and discoveries |
39,120 | 42,816 | 289 | |||||||
Acquisition of reserves |
42,007 | — | — | |||||||
Sale of reserves |
— | (365 | ) | (2,030 | ) | |||||
Revisions of previous quantity estimates |
4,144 | (1,611 | ) | (12,231 | ) | |||||
Previously estimated development costs incurred |
14,904 | — | 3,095 | |||||||
Net change in income taxes |
(6,560 | ) | — | — | ||||||
Accretion of discount |
3,906 | 433 | 4,547 | |||||||
Other |
13,525 | (2,659 | ) | 72 | ||||||
Balance at end of period |
$ | 154,568 | $ | 39,063 | $ | 5,328 | ||||
A variety of methodologies are used to determine our proved reserve estimates. The principal methodologies employed are reservoir simulation, decline curve analysis, volumetric, material balance, advance production type curve matching, petro-physics/log analysis and analogy. Some combination of these methods is used to determine reserve estimates in substantially all of our fields.
101
ITEM 9. CHANGES IN AND DISAGREEMENTS WITH ACCOUNTANTS ON ACCOUNTING AND FINANCIAL DISCLOSURE
None.
ITEM 9A. CONTROLS AND PROCEDURES
Disclosure Controls and Procedures
Management of the Company, including the Chief Executive Officer ("CEO") and Chief Financial Officer ("CFO"), have evaluated the effectiveness of the Company's disclosure controls and procedures as of the end of the period covered by this Form 10-K. The term "disclosure controls and procedures" means controls and other procedures established by the Company that are designed to ensure that information required to be disclosed by the Company in the reports that it files or submits under the Exchange Act is recorded, processed, summarized and reported within the time periods specified in the SEC's rules and forms. Disclosure controls and procedures include, without limitation, controls and procedures designed to ensure that information required to be disclosed by the Company in the reports that it files or submits under the Exchange Act is accumulated and communicated to the Company's management, including its CEO and CFO, as appropriate, to allow timely decisions regarding required disclosure.
Based upon their evaluation of the Company's disclosure controls and procedures, the CEO and the CFO concluded that the disclosure controls are effective to provide reasonable assurance that information required to be disclosed by the Company in the reports that it files or submits under the Exchange Act is accumulated and communicated to management, including the CEO and CFO, as appropriate, to allow timely decisions regarding required disclosure and are effective to provide reasonable assurance that such information is recorded, processed, summarized and reported within the time periods specified by the SEC's rules and forms.
The Company, including its CEO and CFO, does not expect that its internal controls and procedures will prevent or detect all error and all fraud. A control system, no matter how well conceived or operated, can provide only reasonable, not absolute, assurance that the objectives of the control system are met.
Management's Annual Report on Internal Control Over Financial Reporting
In accordance with Item 308 of SEC Regulation S-K, management is required to provide an annual report regarding internal controls over our financial reporting. This report, which includes management's assessment of the effectiveness of our internal controls over financial reporting, is found below.
Management's Report on Internal Control over Financial Reporting
Management of the Company is responsible for establishing and maintaining adequate internal control over financial reporting as defined in Rules 13a-15(f) and 15d-15(f) under the Exchange Act. Internal control over financial reporting is a process designed by, or under the supervision of, the CEO and CFO to provide reasonable assurance regarding the reliability of financial reporting and the preparation of financial statements for external purposes in accordance with generally accepted accounting principles. Internal control over financial reporting includes those policies and procedures that (i) pertain to the maintenance of records which in reasonable detail accurately and fairly reflect the transactions and dispositions of the company's assets; (ii) provide reasonable assurance that transactions are recorded as necessary to permit preparation of financial statements in accordance with generally accepted accounting principles, and that receipts and expenditures of the company are being made in accordance with authorizations of management and directors of the issuer; and (iii) provide
102
reasonable assurance regarding prevention or timely detection of unauthorized acquisition, use, or disposition of the company's assets that could have a material effect on the financial statements.
Because of its inherent limitations, internal controls over financial reporting may not prevent or detect misstatements. Also, projections of any evaluation of effectiveness to future periods are subject to the risk that controls may become inadequate because of changes in conditions, or that the degree of compliance with policies or procedures may deteriorate.
Management (with the participation of the principal executive officer and principal financial officer) conducted an evaluation of the effectiveness of the company's internal control over financial reporting as of December 31, 2010 based on the framework set forth in Internal Control—Integrated Framework issued by the Committee of Sponsoring Organizations of the Treadway Commission. Based on this evaluation, management, with the participation of the CEO and CFO, concluded that the company's internal control over financial reporting was effective as of December 31, 2010. Hein & Associates LLP, the independent registered public accounting firm that audited our consolidated financial statements included in this report, has issued an attestation report on the effectiveness of internal control over financial reporting.
Attestation Report of Registered Public Accounting Firm
The attestation report required under this Item 9A is set forth below under the caption "Report of Independent Registered Public Accounting Firm."
Changes in Internal Control Over Financial Reporting
Management, with the participation of the CEO and CFO, concluded that there were no changes in the Company's internal control over financial reporting during the quarter ended December 31, 2010 that have materially affected, or are reasonably likely to materially affect, the Company's internal control over financial reporting.
103
REPORT OF INDEPENDENT REGISTERED PUBLIC ACCOUNTING FIRM
To
the Board of Directors and Stockholders
Kodiak Oil & Gas Corp.
We have audited Kodiak Oil & Gas Corp.'s internal control over financial reporting as of December 31, 2010, based on criteria established in Internal Control—Integrated Framework issued by the Committee of Sponsoring Organizations of the Treadway Commission (COSO). Kodiak Oil & Gas Corp.'s management is responsible for maintaining effective internal control over financial reporting and for its assessment of the effectiveness of internal control over financial reporting included in the accompanying Management's Report on Internal Control Over Financial Reporting. Our responsibility is to express an opinion on the company's internal control over financial reporting based on our audit.
We conducted our audit in accordance with the standards of the Public Company Accounting Oversight Board (United States). Those standards require that we plan and perform the audit to obtain reasonable assurance about whether effective internal control over financial reporting was maintained in all material respects. Our audit included obtaining an understanding of internal control over financial reporting, assessing the risk that a material weakness exists, and testing and evaluating the design and operating effectiveness of internal control based on the assessed risk. Our audit also included performing such other procedures as we considered necessary in the circumstances. We believe that our audit provides a reasonable basis for our opinion.
A company's internal control over financial reporting is a process designed to provide reasonable assurance regarding the reliability of financial reporting and the preparation of financial statements for external purposes in accordance with generally accepted accounting principles. A company's internal control over financial reporting includes those policies and procedures that (1) pertain to the maintenance of records that, in reasonable detail, accurately and fairly reflect the transactions and dispositions of the assets of the company; (2) provide reasonable assurance that transactions are recorded as necessary to permit preparation of financial statements in accordance with generally accepted accounting principles, and that receipts and expenditures of the company are being made only in accordance with authorizations of management and directors of the company; and (3) provide reasonable assurance regarding prevention or timely detection of unauthorized acquisition, use, or disposition of the company's assets that could have a material effect on the financial statements.
Because of its inherent limitations, internal control over financial reporting may not prevent or detect misstatements. Also, projections of any evaluation of effectiveness to future periods are subject to the risk that controls may become inadequate because of changes in conditions, or that the degree of compliance with the policies or procedures may deteriorate.
In our opinion, Kodiak Oil & Gas Corp. maintained, in all material respects, effective internal control over financial reporting as of December 31, 2010, based on criteria established in Internal Control—Integrated Framework issued by COSO.
We have also audited, in accordance with the standards of the Public Company Accounting Oversight Board (United States), the consolidated balance sheets of Kodiak Oil & Gas Corp. as of December 31, 2010 and 2009, and the related consolidated statements of operations, changes in stockholders' equity, and cash flows for each of the three years in the period ended December 31, 2010, and our report dated March 3, 2011 expressed an unqualified opinion.
/s/ HEIN & ASSOCIATES LLP
Denver,
Colorado
March 3, 2011
104
Not applicable.
105
ITEM 10. DIRECTORS, EXECUTIVE OFFICERS AND CORPORATE GOVERNANCE
The information responsive to Items 401, 405, 406 and 407 of Regulation S-K to be included in our definitive Proxy Statement for our 2011 Annual Meeting of Shareholders, to be filed within 120 days of December 31, 2010, pursuant to Regulation 14A under the Securities Exchange Act of 1934, as amended (the "2010 Proxy Statement"), is incorporated herein by reference.
ITEM 11. EXECUTIVE COMPENSATION
The information responsive to Items 402 and 407 of Regulation S-K to be included in our 2010 Proxy Statement is incorporated herein by reference.
ITEM 12. SECURITY OWNERSHIP OF CERTAIN BENEFICIAL OWNERS AND MANAGEMENT AND RELATED STOCKHOLDER MATTERS
The information responsive to Items 201(d) and 403 of Regulation S-K to be included in our 2010 Proxy Statement is incorporated herein by reference.
ITEM 13. CERTAIN RELATIONSHIPS AND RELATED TRANSACTIONS, AND DIRECTOR INDEPENDENCE
The information responsive to Items 404 and 407 of Regulation S-K to be included in our 2011 Proxy Statement is incorporated herein by reference.
ITEM 14. PRINCIPAL ACCOUNTANT FEES AND SERVICES
The information responsive to Item 9(e) of Schedule 14A to be included in our 2011 Proxy Statement is incorporated herein by reference.
106
ITEM 15. EXHIBITS AND FINANCIAL STATEMENT SCHEDULES
- (a)
- Documents
Filed With This Report
- 1.
- FINANCIAL STATEMENTS
The following consolidated financial statements of the Company are filed as a part of this report:
- 2.
- FINANCIAL STATEMENT SCHEDULES
- 3.
- EXECUTIVE
COMPENSATION PLANS AND ARRANGEMENTS
None.
Kodiak Oil & Gas Corp. Incentive Stock Option Plan identified in the exhibit list below.
Kodiak Oil & Gas Corp. 2007 Stock Incentive Plan identified in the exhibit list below.
Amendment No. 1 to Kodiak Oil & Gas Corp. 2007 Stock Incentive Plan in the exhibit list below.
Executive Employment Agreement effective January 1, 2011 between Kodiak Oil & Gas Corp. and Lynn A. Peterson identified in the exhibit list below.
Executive Employment Agreement effective January 1, 2011 between Kodiak Oil & Gas Corp. and James P. Henderson identified in the exhibit list below.
Executive Employment Agreement effective January 1, 2011 between Kodiak Oil & Gas Corp. and James E. Catlin identified in the exhibit list below.
- (b)
- Exhibits
| Exhibit Number |
Description | ||
|---|---|---|---|
| 2.1 | (1) | Asset Purchase Agreement, entered into October 19, 2010, by and among Peak Grasslands, LLC, Kodiak Oil & Gas (USA) Inc., and Kodiak Oil & Gas Corp. | |
| 3.1 | (2) | Certificate of Continuance of Kodiak Oil & Gas Corp., dated September 28, 2001 | |
| 3.2 | (2) | Articles of Continuation of Kodiak Oil & Gas Corp. | |
| 3.3 | (3) | Amended and Restated By-Law No. 1 of the Company | |
| 10.1 | (2) | Kodiak Oil & Gas Corp. Incentive Share Option Plan | |
| 10.2 | (4) | Kodiak Oil & Gas Corp. 2007 Stock Incentive Plan | |
| 10.3 | (5) | Amendment No. 1 to Kodiak Oil & Gas Corp. 2007 Stock Incentive Plan | |
| 10.4 | (6) | Form of Incentive Stock Option Agreement for 2007 Stock Incentive Plan | |
107
| Exhibit Number |
Description | ||
|---|---|---|---|
| 10.5 | (6) | Form of Employee Non-incentive Stock Option Agreement for 2007 Stock Incentive Plan | |
| 10.6 | (6) | Form of Directors' Non-incentive Stock Option Agreement for 2007 Stock Incentive Plan | |
| 10.7 | (7) | Form of Non-Incentive Performance-Based Stock Option Agreement for 2007 Stock Incentive Plan | |
| 10.8 | Form of Stock Award Agreement for 2007 Stock Incentive Plan | ||
| 10.9 | Form of Restricted Stock Unit and Performance Award Agreement for 2007 Stock Incentive Plan | ||
| 10.10 | Form of Restricted Stock and Cash Award Agreement for 2007 Stock Incentive Plan | ||
| 10.11 | (6) | Form of Restricted Stock Award Agreement for 2007 Stock Incentive Plan | |
| 10.12 | (8) | Form of Stock Option Termination Agreement | |
| 10.13 | (9) | Fourth Amendment to Lease, dated February 14, 2007, between Transwestern Broadreach WTC, LLC and Kodiak Oil & Gas (USA) Inc. | |
| 10.14 | (10) | Fifth Amendment to Lease, dated May 31, 2007 between Transwestern Broadreach WTC, LLC and Kodiak Oil & Gas (USA) Inc. | |
| 10.15 | (11) | Executive Employment Agreement, effective January 1, 2011, by and among Lynn A. Peterson, Kodiak Oil & Gas (USA) Inc. and Kodiak Oil & Gas Corp. | |
| 10.16 | (11) | Executive Employment Agreement, effective January 1, 2011, by and among James E. Catlin, Kodiak Oil & Gas (USA) Inc. and Kodiak Oil & Gas Corp. | |
| 10.17 | (11) | Executive Employment Agreement, effective January 1, 2011, by and among James P. Henderson, Kodiak Oil & Gas (USA) Inc. and Kodiak Oil & Gas Corp. | |
| 10.18 | (12) | Officer Position Termination and General Release Agreement between the Company and James K. Doss, effective March 18, 2010. | |
| 10.19 | (13) | Credit Agreement dated as of May 24, 2010 among Kodiak Oil & Gas (USA) Inc., Wells Fargo Bank, N.A. and The Lenders Signatory Thereto. | |
| 10.20 | (14) | First Amendment to Credit Agreement among Kodiak Oil & Gas (USA) Inc., Wells Fargo Bank, N.A. and The Lenders Signatory Thereto, effective as of November 30, 2010. | |
| 10.21 | (13) | Guarantee and Collateral Agreement dated as of May 24, 2010 by Kodiak Oil & Gas (USA) Inc. in favor of Wells Fargo Bank, N.A. as administrative agent. | |
| 10.22 | (13) | Guarantee and Pledge Agreement dated as of May 24, 2010 by Kodiak Oil & Gas Corp. in favor of Wells Fargo Bank, N.A. as administrative agent. | |
| 10.23 | (14) | Second Lien Credit Agreement, dated as of November 30, 2010, among Kodiak Oil & Gas (USA) Inc., Wells Fargo Energy Capital, Inc. and The Lenders Party Thereto. | |
| 10.24 | (14) | Second Lien Guarantee and Pledge Agreement made by Kodiak Oil & Gas Corp. in favor of Wells Fargo Energy Capital, Inc., dated as of November 30, 2010. | |
| 10.25 | (14) | Second Lien Guarantee and Collateral Agreement made by each of the Grantors (as defined therein) in favor of Wells Fargo Energy Capital, Inc., dated as of November 30, 2010. | |
| 10.26 | (15) | Purchase and Sale Agreement, dated March 31, 2010, between Macquarie Barnett, LLC and Kodiak Oil & Gas (USA) Inc. | |
108
| Exhibit Number |
Description | ||
|---|---|---|---|
| 21.1 | Subsidiaries of the Registrant | ||
| 23.1 | Consent of Hein & Associates LLP | ||
| 23.2 | Consent of Netherland Sewell & Associates, Inc. | ||
| 31.1 | Certification of the Chief Executive Officer required by Rule 13a-14(a) or Rule 15d-14(a) | ||
| 31.2 | Certification of the Chief Financial Officer required by Rule 13a-14(a) or Rule 15d-14(a) | ||
| 32.1 | Certification of the Chief Executive Officer pursuant to 18 U.S.C. Section 1350 | ||
| 32.2 | Certification of the Chief Financial Officer pursuant to 18 U.S.C. Section 1350 | ||
| 99.1 | Reserve Estimate Report of Netherland Sewell & Associates, Inc. | ||
- (1)
- Incorporated
by reference to the Registrant's Current Report on Form 8-K, filed on October 25, 2010.
- (2)
- Incorporated
by reference to the Registrant's Registration Statement on Form 20-F, filed on November 23, 2005.
- (3)
- Incorporated
by reference to the Registrant's Quarterly Report on Form 10-Q, filed on May 9, 2008.
- (4)
- Incorporated
by reference to the Registrant's Definitive Proxy Statement, filed on April 27, 2007.
- (5)
- Incorporated
by reference to the Registrant's Definitive Proxy Statement, filed on April 30, 2010.
- (6)
- Incorporated
by Reference to the Registrant's Registration Statement on Form S-8, filed on July 26, 2007.
- (7)
- Incorporated
by reference to the Registrant's Current Report on Form 8-K, filed on March 19, 2008.
- (8)
- Incorporated
by reference to the Registrant's Current Report on Form 8-K, filed on January 6, 2010.
- (9)
- Incorporated
by reference to the Registrant's Annual Report on Form 10-K, filed on March 27, 2007.
- (10)
- Incorporated
by reference to the Registrant's Annual Report on Form 10-K, filed on March 14, 2008.
- (11)
- Incorporated
by reference to the Registrant's Current Report on Form 8-K, filed on January 6, 2011.
- (12)
- Incorporated
by reference to the Registrant's Quarterly Report on Form 10-Q, filed on May 7, 2010.
- (13)
- Incorporated
by reference to the Registrant's Current Report on Form 8-K, filed on May 27, 2010.
- (14)
- Incorporated
by reference to the Registrant's Current Report on Form 8-K, filed on December 2, 2010.
- (15)
- Incorporated by reference to the Registrant's Quarterly Report on Form 10-Q, filed on August 5, 2010.
109
The following technical terms defined in this section are used throughout this Form 10-K:
(a) "3-D seismic or 3-D data" means seismic data that is acquired and processed to yield a three-dimensional picture of the subsurface.
(b) "Bbl" means one stock tank barrel, or 42 U.S. gallons liquid volume, used in reference to oil or other liquid hydrocarbons.
(c) "BOE" means barrels of oil equivalent. Oil equivalents are determined using the ratio of six Mcf of gas (including gas liquids) to one Bbl of oil.
(d) "BOEPD" means barrels of oil equivalent per day.
(e) "Bore hole" means the wellbore itself, including the openhole or uncased portion of the well. Bore hole may refer to the inside diameter of the wellbore wall, the rock face that bounds the drilled hole.
(f) "Completion" means the installation of permanent equipment for the production of oil or natural gas.
(g) "Delay rental" means a payment made to the lessor under a non-producing oil and natural gas lease at the end of each year to continue the lease in force for another year during its primary term.
(h) "Developed acreage" means the number of acres that are allocated or assignable to producing wells or wells capable of production.
(i) "Development well" means a well drilled to a known producing formation in a previously discovered field, usually offsetting a producing well on the same or an adjacent oil and natural gas lease.
(j) "Dry hole" means a well found to be incapable of producing either oil or gas in sufficient quantities to justify completion as an oil or gas well.
(k) "Exploratory well" means a well drilled either (a) in search of a new and as yet undiscovered pool of oil or gas or (b) with the hope of significantly extending the limits of a pool already developed (also known as a "wildcat well").
(l) "Federal Unit" means acreage under federal oil and natural gas leases subject to an agreement or plan among owners of leasehold interests, which satisfies certain minimum arrangements and has been approved by an authorized representative of the U.S. Secretary of the Interior, to consolidate under a cooperative unit plan or agreement for the development of such acreage comprising a common oil and natural gas pool, field or like area, without regard to separate leasehold ownership of each participant and providing for the sharing of costs and benefits on a basis as defined in such agreement or plan under the supervision of a designated operator.
(m) "Fee land" means the most extensive interest that can be owned in land, including surface and mineral (including oil and natural gas) rights.
(n) "Field" means an area consisting of a single reservoir or multiple reservoirs all grouped on or related to the same individual geological structural feature or stratigraphic condition.
(o) "Fracturing" means mechanically inducing a crack or surface of breakage within rock not related to foliation or cleavage in metamorphic rock in order to enhance the permeability of rocks greatly by connecting pores together.
110
(p) "Gas" or "Natural gas" means the lighter hydrocarbons and associated non-hydrocarbon substances occurring naturally in an underground reservoir, which under atmospheric conditions are essentially gases but which may contain liquids.
(q) "Gross Acres" or "Gross Wells" means the total acres or wells, as the case may be, in which we have a working interest.
(r) "Hydraulic fracturing" means a procedure to stimulate production by forcing a mixture of fluid and proppant (usually sand) into the formation under high pressure. This creates artificial fractures in the reservoir rock, which increases permeability and porosity.
(s) "Horizontal drilling" means a well bore that is drilled laterally.
(t) "Landowner royalty" means that interest retained by the holder of a mineral interest upon the execution of an oil and natural gas lease which usually amounts to 1/8 of all gross revenues from oil and natural gas production unencumbered with any expenses of operation, development, or maintenance.
(u) "Leases" means full or partial interests in oil or gas properties authorizing the owner of the lease to drill for, produce and sell oil and natural gas in exchange for any or all of rental, bonus and royalty payments. Leases are generally acquired from private landowners (fee leases) and from federal and state governments on acreage held by them.
(v) "Mcf" is an abbreviation for "1,000 cubic feet," which is a unit of measurement of volume for natural gas.
(w) "Net Acres" or "Net Wells" is the sum of the fractional working interests owned in gross acres or wells, as the case may be, expressed as whole numbers and fractions thereof.
(x) "Net revenue interest" means all of the working interests less all royalties, overriding royalties, non-participating royalties, net profits interest or similar burdens on or measured by production from oil and natural gas.
(y) "NYMEX" means New York Mercantile Exchange.
(z) "Overriding royalty" means an interest in the gross revenues or production over and above the landowner's royalty carved out of the working interest and also unencumbered with any expenses of operation, development or maintenance.
(aa) "Operator" means the individual or company responsible to the working interest owners for the exploration, development and production of an oil or natural gas well or lease.
(bb) "Paid-Up Lease" means a lease for which the aggregate lease payments are paid in full on or prior to the commencement of the lease term.
(cc) "Prospect" means a geological area which is believed to have the potential for oil and natural gas production.
(dd) "PV-10 value" means the present value of estimated future gross revenue to be generated from the production of estimated net proved reserves, net of estimated production and future development costs, using prices and costs in effect as of the date indicated (unless such prices or costs are subject to change pursuant to contractual provisions), without giving effect to non-property related expenses such as general and administrative expenses, debt service and future income tax expenses or to depreciation, depletion and amortization, discounted using an annual discount rate of 10 percent. While this measure does not include the effect of income taxes as it would in the use of the standardized measure calculation, it does provide an indicative representation of the relative value of the Company on a comparative basis to other companies and from period to period.
(ee) "Productive well" means a well that is producing oil or gas or that is capable of production.
111
(ff) "Proved developed reserves" means reserves that can be expected to be recovered through existing wells with existing equipment and operating methods.
(gg) "Proved reserves" means the estimated quantities of oil, gas and gas liquids which geological and engineering data demonstrate with reasonable certainty to be recoverable in future years from known reservoirs under existing economic and operating conditions.
(hh) "Proved undeveloped reserves" means reserves that are expected to be recovered from new wells on undrilled acreage, or from existing wells where a relatively major expenditure is required for recompletion.
(ii) "Recompletion" means the completion for production from an existing wellbore in a formation other than that in which the well has previously been completed.
(jj) "Reserve life" represents the estimated net proved reserves at a specified date divided by actual production for the preceding 12-month period.
(kk) "Royalty" means the share paid to the owner of mineral rights, expressed as a percentage of gross income from oil and natural gas produced and sold unencumbered by expenses relating to the drilling, completing and operating of the affected well.
(ll) "Royalty interest" means an interest in an oil and natural gas property entitling the owner to shares of oil and natural gas production, free of costs of exploration, development and production operations.
(mm) "Undeveloped acreage" means lease acres on which wells have not been drilled or completed to a point that would permit the production of commercial quantities of oil and gas regardless of whether or not such acreage contains proved reserves.
(nn) "Undeveloped leasehold acreage" means the leased acreage on which wells have not been drilled or completed to a point that would permit the production of commercial quantities of oil and natural gas, regardless of whether such acreage contains estimated net proved reserves.
(oo) "Working interest" means an interest in an oil and natural gas lease entitling the holder at its expense to conduct drilling and production operations on the leased property and to receive the net revenues attributable to such interest, after deducting the landowner's royalty, any overriding royalties, production costs, taxes and other costs.
112
Pursuant to the requirements of Section 13 or 15(d) of the Securities Exchange Act of 1934, the registrant has duly caused this report to be signed on its behalf by the undersigned, thereunto duly authorized.
| KODIAK OIL & GAS CORP. (Registrant) |
||||
Date: March 3, 2011 |
By: |
/s/ LYNN A. PETERSON Lynn A. Peterson President and Chief Executive Officer (principal executive officer) |
||
Pursuant to the requirements of the Securities Exchange Act of 1934, this Report has been signed below by the following persons on behalf of the registrant and in the capacities and on the dates indicated.
| By: | /s/ LYNN A. PETERSON Lynn A. Peterson |
President and Chief Executive Officer (principal executive officer) | March 3, 2011 | |||
By: |
/s/ JAMES E. CATLIN James E. Catlin |
Vice President and Chief Operations Officer |
March 3, 2011 |
|||
By: |
/s/ JAMES P. HENDERSON James P. Henderson |
Chief Financial Officer, Treasurer and Secretary (principal financial officer and principal accounting officer) |
March 3, 2011 |
|||
By: |
/s/ HERRICK K. LIDSTONE, JR. Herrick K. Lidstone, Jr. |
Director |
March 3, 2011 |
|||
By: |
/s/ RODNEY D. KNUTSON Rodney D. Knutson |
Director |
March 3, 2011 |
|||
By: |
/s/ WILLIAM J. KRYSIAK William J. Krysiak |
Director |
March 3, 2011 |
113