Attached files
| file | filename |
|---|---|
| 8-K - FORM 8-K - ALMOST FAMILY INC | form8-k.htm |


Forward Looking Statements
This presentation contains, and answers given to questions that may be asked today may constitute, forward-looking
statements that are subject to a number of risks and uncertainties, many of which are outside our control. All
statements regarding our strategy, future operations, financial position, estimated revenues or losses, projected costs,
prospects, plans and objectives, other than statements of historical fact included in our prospectus, are forward-looking
statements. When used in this presentation or in answers given to questions asked today, the words “may,” “will,”
“could,” “would,” “expect,” “intend,” “plan,” “anticipate,” “believe,” “estimate,” “project,” “potential,” “continue,” and similar
expressions are intended to identify forward-looking statements, although not all forward-looking statements contain
these identifying words. You should not place undue reliance on forward-looking statements. While we believe that we
have a reasonable basis for each forward-looking statement that we make, we caution you that these statements are
based on a combination of facts and factors currently known by us and projections of future events or conditions, about
which we cannot be certain. For a more complete discussion regarding these and other factors which could affect the
Company's financial performance, refer to the Company's various filings with the Securities and Exchange
Commission, including its filing on Form 10-K for the year ended December 31, 2010 and subsequently filed Forms 10-
Q, in particular information under the headings "Special Caution Regarding Forward-Looking Statements" and “Risk
Factors.” These cautionary statements qualify all of the forward-looking statements. In addition, market and industry
statistics contained in this presentation are based on information available to us that we believe is accurate. This
information is generally based on publications that are not produced for purposes of securities offerings or economic
analysis.
All forward-looking statements speak only as of the date of this presentation. Except as required by law, we assume
no obligation to update these forward-looking statements publicly or to update the factors that could cause actual
results to differ materially, even if new information becomes available in the future.
no obligation to update these forward-looking statements publicly or to update the factors that could cause actual
results to differ materially, even if new information becomes available in the future.
2

Almost Family
Overview
Overview

Almost Family
Founded in Louisville KY - 1976
Two Home Health Segments:
- Visiting Nurse, Medicare-certified
(~85% of Revenue)
- Personal Care, primarily Medicaid-Waiver
(~15% of Revenue)
Revenue Run Rate of approximately
$340 Million
$340 Million
4
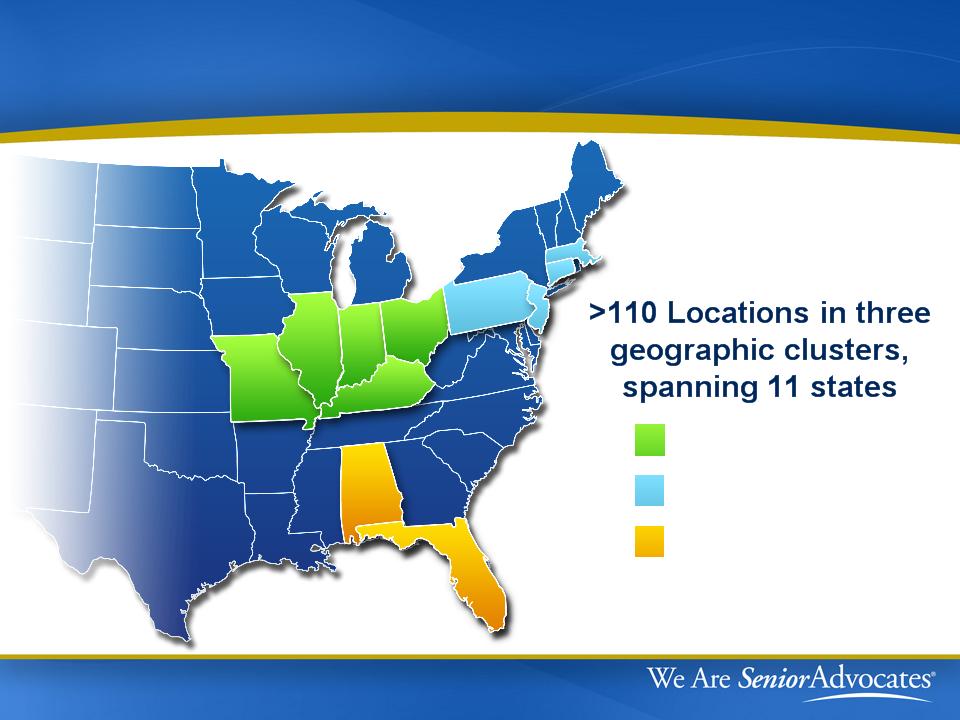
Almost Family
Northeast Cluster
Southeast Cluster
Midwest Cluster
5

Our Mission - “We Are Senior Advocates”
One Common Goal - allow
Seniors to “Age in Place”
at home
Seniors to “Age in Place”
at home
Advocates on behalf of the
sick & elderly
sick & elderly
Make lives of elderly &
chronically ill better
chronically ill better
Backbone of who we are &
how we run our business
6

Our Mission - “We Are Senior Advocates”
How do we do this?
- Focus on being Patient-centric
- Build Caregiver Culture
- Improve & create Senior programs
- Credentialing clinicians as
Geriatric Specialists
Geriatric Specialists
- Consistent delivery of highest
quality patient care
quality patient care
7

Almost Family Caregiver
Almost Family is driven by
Highly Skilled Professional
Caregivers, including:
- Skilled & Experienced Nurses
- Physical Therapists
- Occupational Therapists
- Medical Social Workers
- Home Aides
8
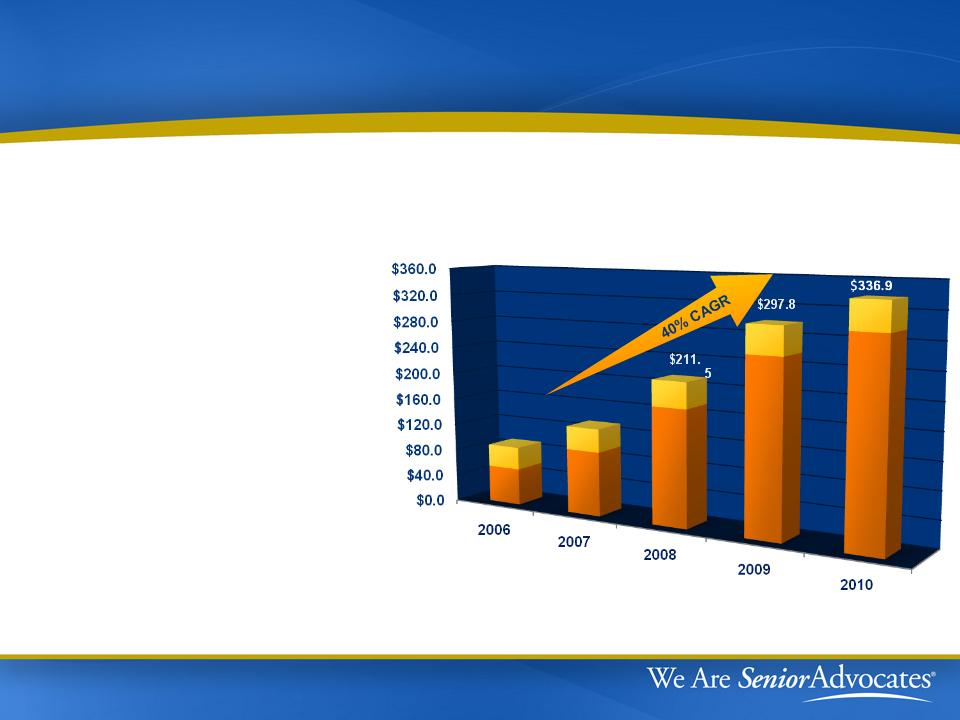
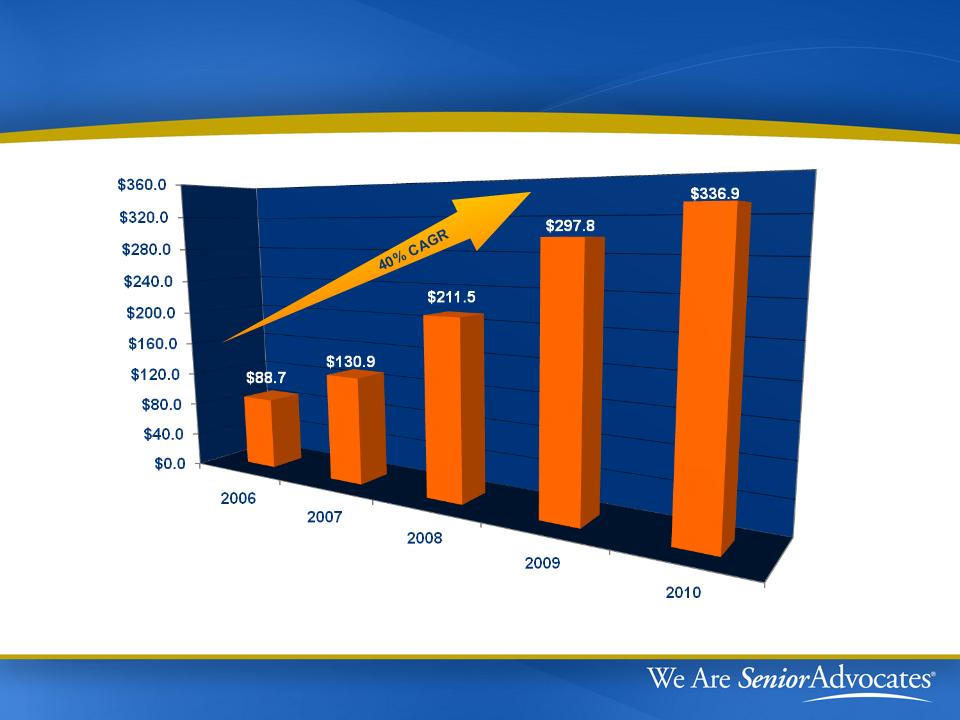
Almost Family
($Millions)
$88.7
Revenue
Track Record of
Strong Performance
- 4 Yr CAGR Revenue
40%
40%
- 4 Yr CAGR EPS 42%
- Last 36 months:
- 49% Organic Growth
- Acquired $112 Million
in Revenue
$130.9
9

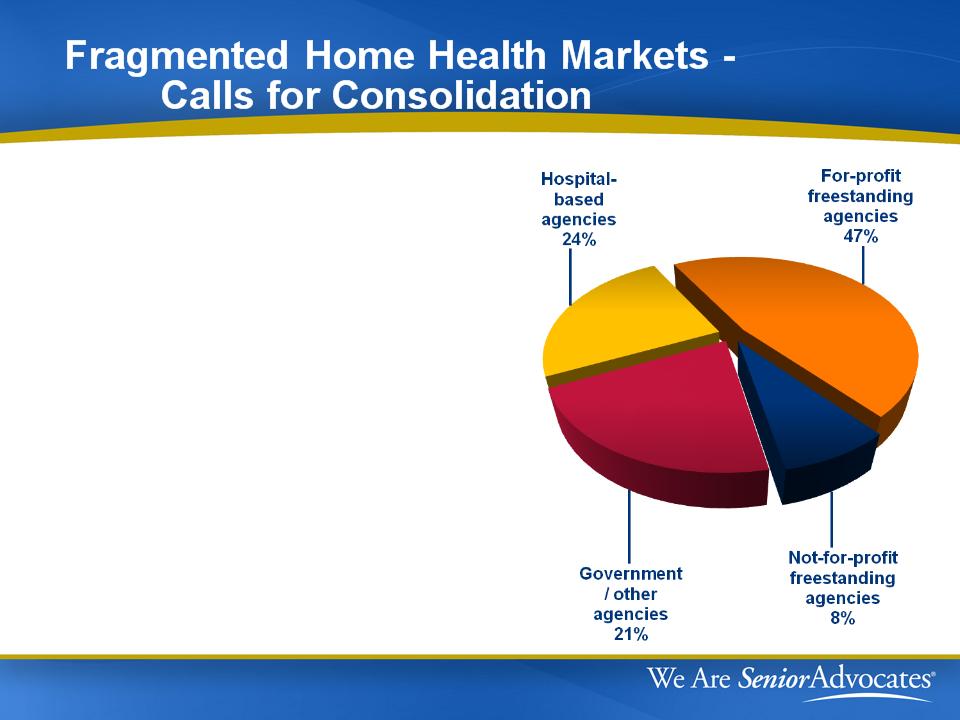
What is Home Health Care?

Home Health Industry
Aging Population is growing -
Prefer to stay at home
Home Health Care -
Bends the Cost Curve
of caring for the elderly
Industry is Fragmented -
Pipeline for Consolidation
11

Who Receives Home Health Care?
Over 3.5 million Americans
rely on home health care to stay
in their homes.
- 80+ year old, sick patients
- Chronic conditions, sickest of the sick
- Want to “Age in Place”, out of
hospitals & nursing homes
- Want to restore their ability to care
for themselves
12

Characteristics of Medicare Population
Source: Kaiser Family Foundation Medicare Primer 2009
45 million beneficiaries
- Limited Resources - 1 out of 2 have income of less than
$21,000 (near poverty level)
- 1 out of 3 - have 3 or more chronic health conditions
- 1 out of 3 - have cognitive or mental impairment
- 1 out of 3 - are in poor health
- 1 out of 5 - have significant limitations in activities
of daily living
- 1 out of 8 - is over 85 years old
- 1 out of 20 - lives in a nursing home
13
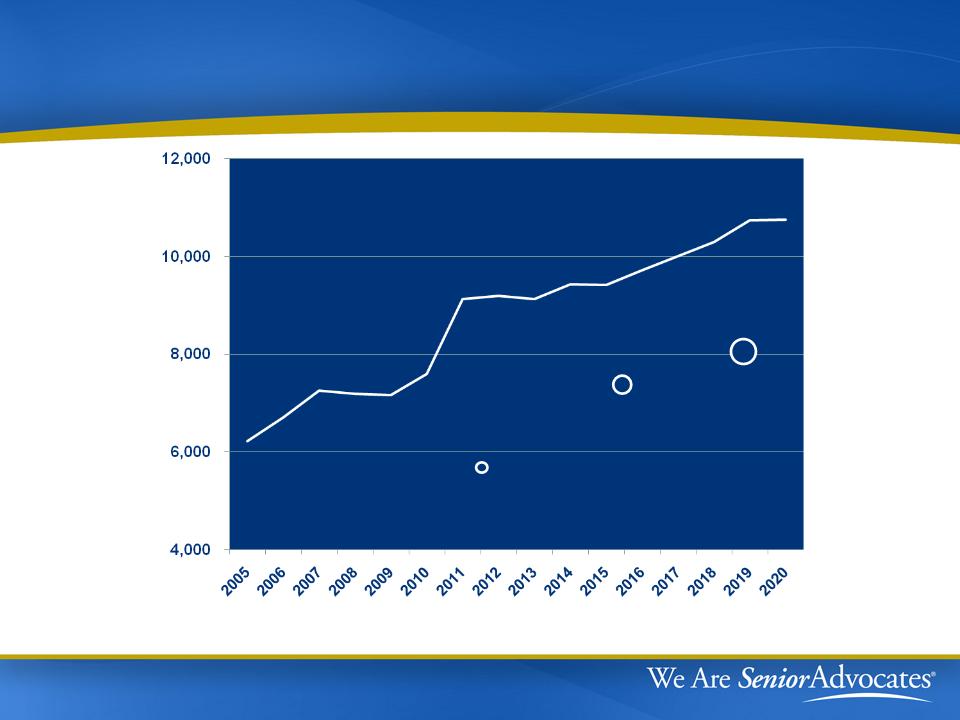
Number of New 65 Year Olds Per Day
14
2010
40.2 mil
2016
48.3 mil
2020
54.8 mil
65+ Population

The Benefits of Home Health Care
Bending the Cost Curve
- Lower cost per day vs.
hospital & nursing homes
hospital & nursing homes
- Lower costs to Medicare
Program
Program
- Prevents mild exacerbations
from escalating into critical
situations
from escalating into critical
situations
Cost per day
15
~10,000 Medicare-certified home
health agencies in U.S.
~7,000 agencies are independently-
owned operated
owned operated
$19B Annual Medicare Spend
Almost Family’s acquisition criteria
- Geography
- Multi-site, free-standing
agencies or hospital-based
agencies
agencies or hospital-based
agencies
16

Our Development
Strategy
Strategy

Our Development Strategy
Senior Advocacy
Senior Advocacy Mission
Seasoned Management Staff
Local Market Emphasis
Densification/Acquisitions
Strong Organic Growth
18

Our Experienced Management Team
Core Team Averages Over 20 Years at AFAM
William Yarmuth - CEO Todd Lyles - SVP Administration
- 29 yrs as AFAM CEO - 13 yrs as AFAM SVP
Steve Guenthner - SVP & CFO Anne Liechty - SVP VN Operations, North
- 18 yrs as AFAM CFO - 24 yrs at AFAM
Next Level Management Rich in Home Health Experience
o Average of 15 Years Experience in Home Health
19

Local Market Emphasis
Managing Successfully by:
Placing Senior Management
closer to local markets
Local “Course Knowledge”
hometown business
hometown business
Growing locally based sales &
marketing staff
marketing staff
Standard local office operating model,
with local office flexibility in
marketing & clinical programs
with local office flexibility in
marketing & clinical programs
20
Densification/Acquisitions
Branch Development
Last 5 Years
Increase density of existing
geographic clusters
geographic clusters
Make selected acquisitions to enter
states & markets contiguous to
existing operations
states & markets contiguous to
existing operations
Build on local brand with start-ups
- opened 14 start-ups in 2008
- opened 8 start-ups in 2009
- opened 7 start-ups in 2010
Optimize span of control
21

Densification Works
|
Clusters
|
# of VN Branches
|
Revenue Per Branch
(In millions)
|
||||
|
2005
|
2010
|
%
Change |
2005
|
2010
|
%
Change |
|
|
Midwest
|
13
|
36
|
177%
|
$1.4
|
$2.4
|
73%
|
|
Northeast
|
1
|
12
|
NM
|
$1.3
|
$6.2
|
391%
|
|
Southeast
|
13
|
42
|
223%
|
$1.6
|
$3.2
|
104%
|
|
Total
|
27
|
90
|
233%
|
$1.5
|
$3.3
|
123%
|
22

Regulatory Front

2011 Medicare Topics
|
Topic
|
Discussion
|
|
Reimbursement
Rate Cut |
~ 5.2% cut in national payment rate - will reduce
margins (also impacted Q4 2010) |
|
Physician Face-to-
Face Encounter |
Agencies must get documentation of encounter
90 days before or 30 days after admit |
|
Therapy
Reassessments |
April 1, 2011 must reassess therapy need visits
13 and 19 |
|
Med Pac
Recommendations |
December 2010 presentation suggests March
2011 may recommend PPS not based on therapy visits |
24

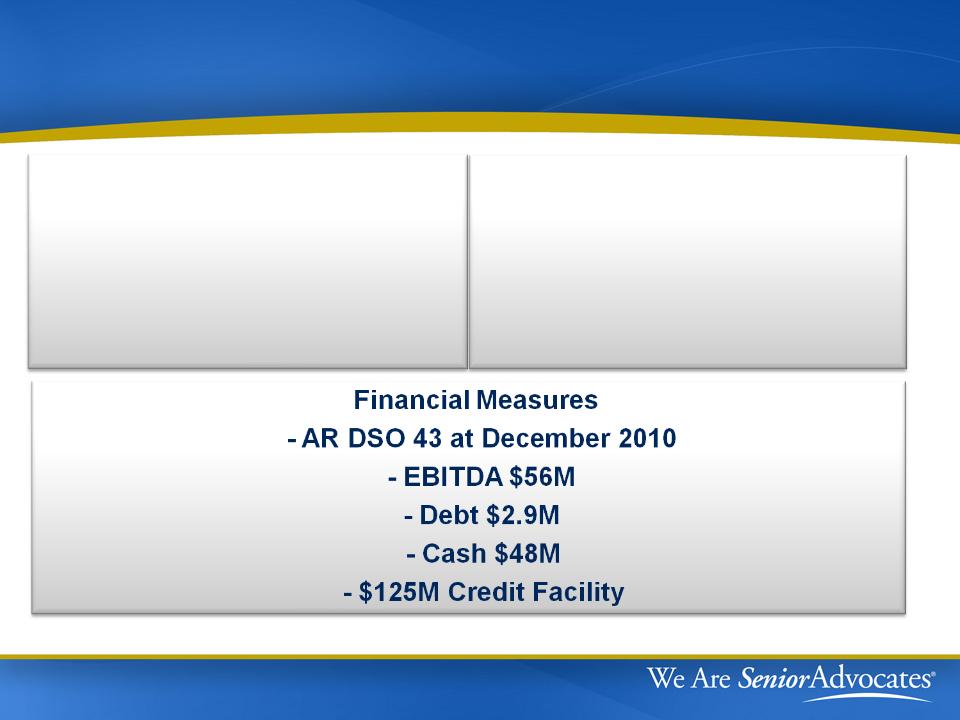
Financial Highlights

Financial Highlights
þ Long term EPS growth driven by organic volumes
þ Prudent management of capital structure with appropriate
leverage
leverage
þ Proven ability to access debt and equity
þ Scalable infrastructure keeps tight rein on operating
costs, generating strong cash flow
costs, generating strong cash flow
þ Strong track record of investing capital in accretive
acquisitions
acquisitions
26
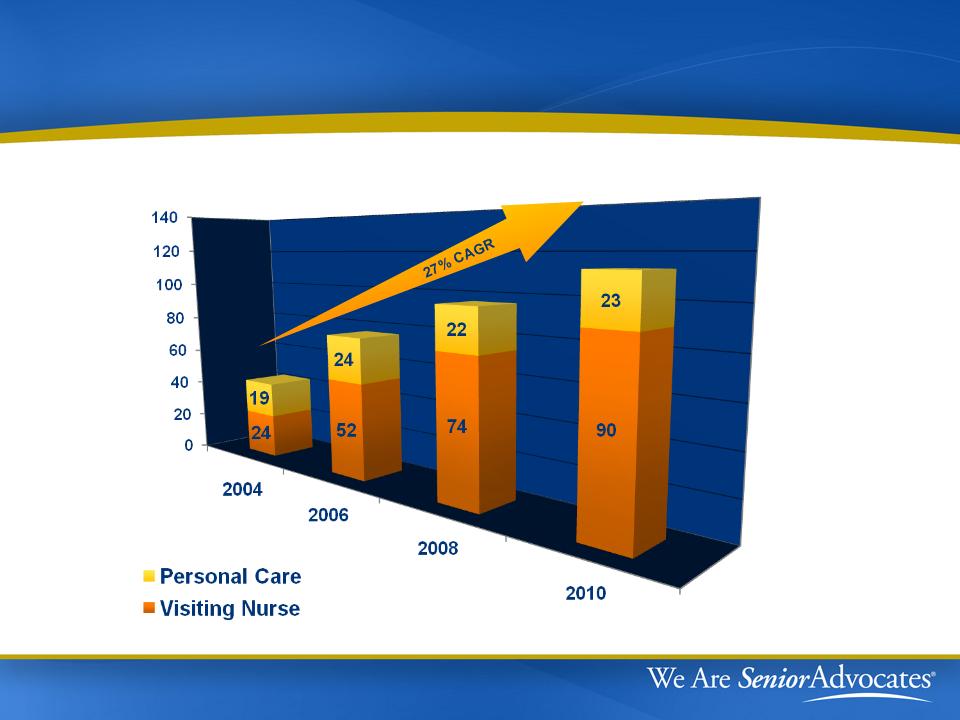
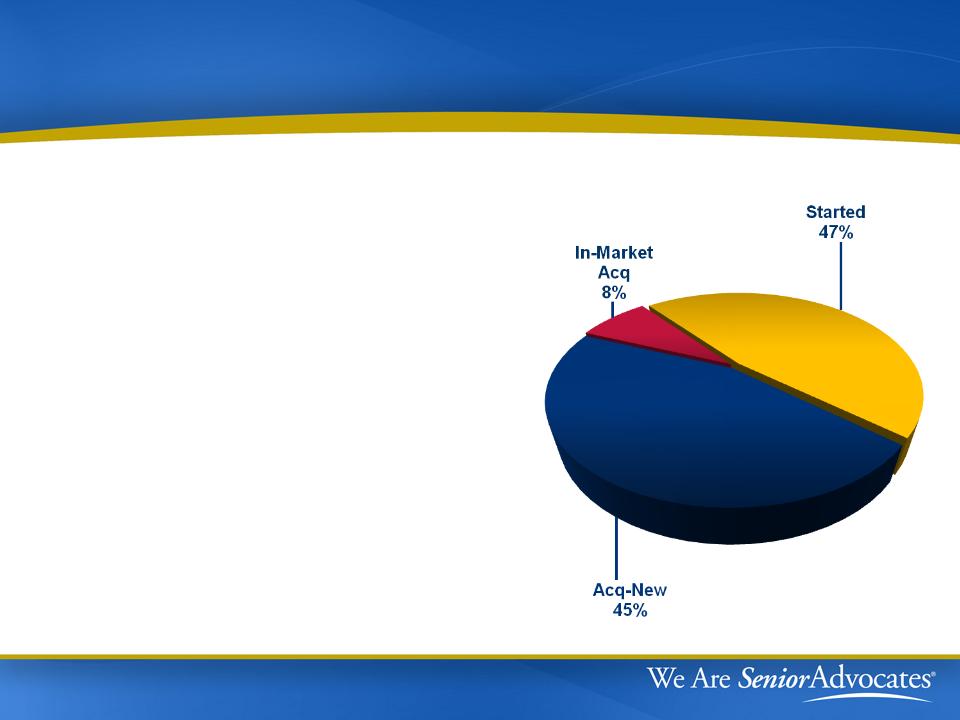
Track Record of Increasing Locations
# of Locations
76
43
96
113
27
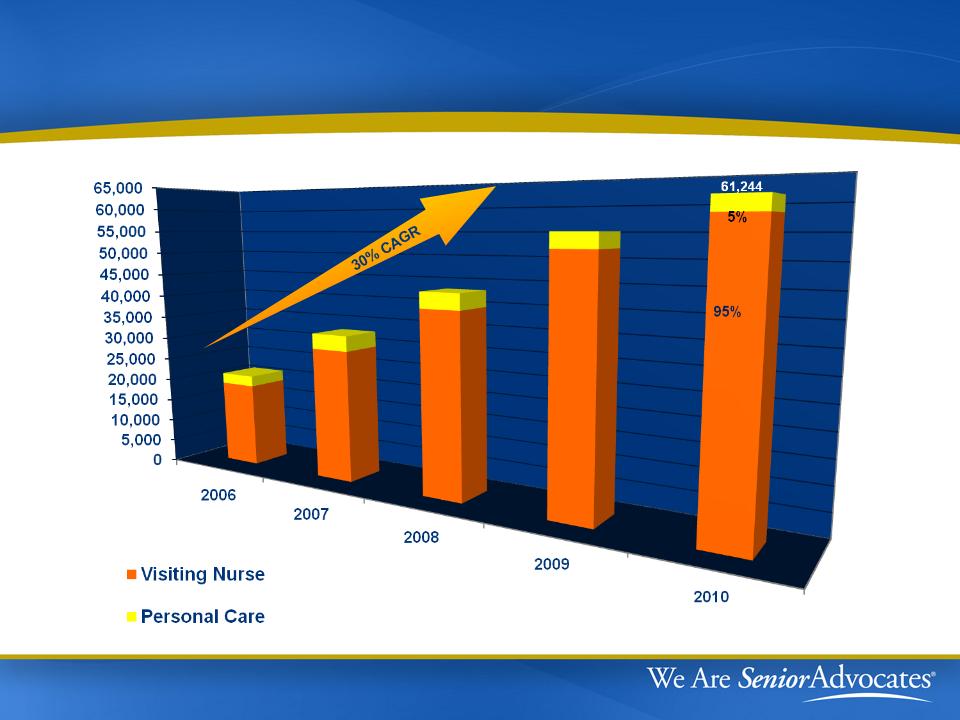
Growing Patient Admissions
21,258
55,248
32,745
43,148
Admissions
89%
90%
92%
11%
10%
8%
6%
94%
28
Proven Revenue Performance
New Service Revenue ($Millions)
29
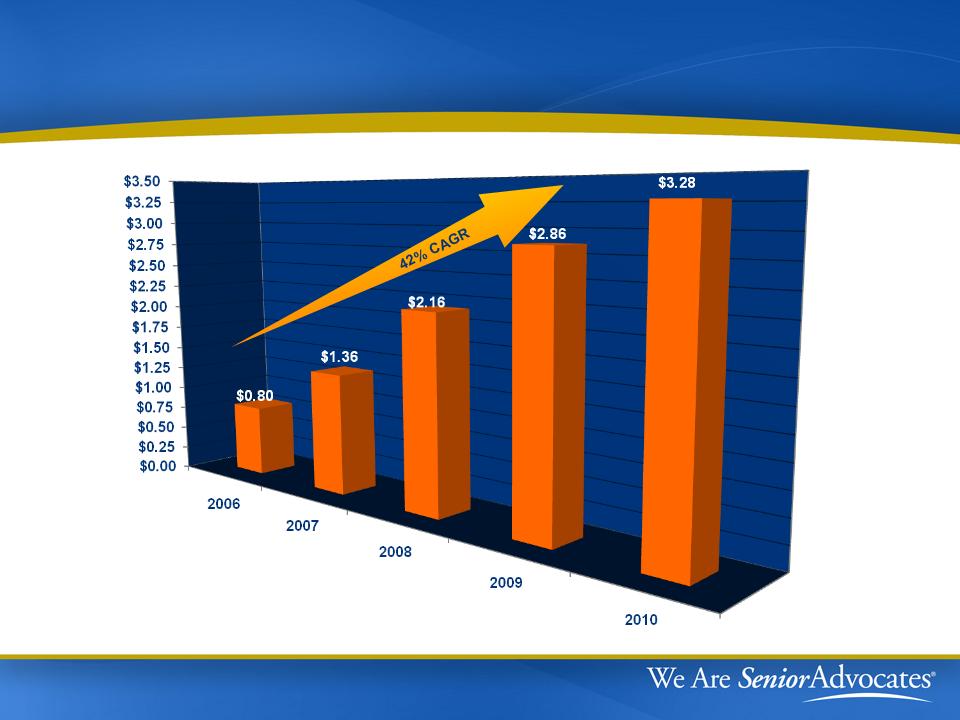
Proven EPS Growth
Diluted EPS
30
2010 Highlights
- Revenues +13%
- Diluted EPS +15%
- MCR Admissions +12%
- MCR Episodes +12%
31
Organic Medicare Growth
- Admissions +11%
- Episodes +12%

Healthcare Reform Legislation Impact
|
Topic
|
Impact
|
|
Market Basket
Updates |
Reduces updates by 1% in 2011, 2012 and 2013
|
|
Re-basing Rates
|
Begin 2014, phased in over 4 years with
adjustments limited to 3.5% per year |
|
Productivity
Adjustment |
Begin 2015
|
|
Rural Add-on
|
3% in 4/1/2010 - 2015
|
|
Outlier Cap
|
10% of revenue beginning 2011
(implemented by CMS in 2010)
|
32

Investment Thesis Remains - Long-Term EPS
Growth as Low Cost Provider
Growth as Low Cost Provider
Organic sales growth (including post-acquisition)
- 8%-12% organic volume growth
- Incremental margin 25%-30% on next dollar of same store
revenue (declining over future years with downward
margin pressure)
Favorable acquisition economics
- Agency EBITDA contribution 18%-22%, paying 4x-5x
- Incremental overhead 3%-4% of revenue
- Strong ROI, accretive investments
Follow-on startups enhance return
33

Investment Thesis Remains - Long-Term EPS
Growth as Low Cost Provider
Growth as Low Cost Provider
Earnings implications
•Volume-based incremental margin helps to offset rate cuts
•Continue emphasis on:
• Improved clinical outcomes
• Efficiency of operations
• Cash flow
•Conditions remain for long-term EPS growth as a
consolidator
consolidator
34

Investment Highlights
Annual Revenue run rate now over $340 million
Leading Regional Home Health Provider
- 40% four year revenue CAGR
- Decentralized operating model
Strong Capital Position
- $166 million immediately available
for future growth
Disciplined Approach to acquisitions driven
by Seasoned Management
Growing Force in consolidating home health care market
- 6 acquisitions in three years
- Three geographic clusters: Northeast, Southeast & Midwest
35

Contact Information
36

Non-GAAP Financial Measure
The information provided in the presentation used a non-GAAP financial measure as defined under Securities and Exchange
Commission (SEC) rules. In accordance with SEC rules, the Company has provided a reconciliation of that measure to the most
directly comparable GAAP measure.
Commission (SEC) rules. In accordance with SEC rules, the Company has provided a reconciliation of that measure to the most
directly comparable GAAP measure.
EBITDA: Earnings before interest, income tax, depreciation and amortization (EBITDA) is not a measure of financial performance
under accounting principles generally accepted in the United States of America (GAAP). It should not be considered in isolation or as
a substitute for net income, operating income, cash flows from operating, investing or financing activities, or any other measure
calculated in accordance with generally accepted accounting principles. The items excluded from EBITDA are significant components
in understanding and evaluating financial performance and liquidity. Management routinely calculates and communicates EBITDA and
believes that it is useful to investors because it is commonly used as an analytical indicator within our industry to evaluate
performance, measure leverage capacity and debt service ability, and to estimate current or prospective enterprise value. EBITDA is
also used in certain covenants contained in our credit agreement.
The following table sets forth a reconciliation of net income to EBITDA as of December 31, 2010 (in thousands):
37
|
Net income
|
$ 30,713
|
|
Add back:
|
|
|
Interest expense
|
266
|
|
Income tax expense
|
20,678
|
|
Depreciation and amortization
|
2,913
|
|
Amortization of stock-based compensation
|
1,505
|
|
EBITDA
|
$ 56,075
|