Attached files
| file | filename |
|---|---|
| 8-K - ROSE UPDATED PRESENTATION - NBL Texas, LLC | rosepres.htm |

1
Exhibit 99.1
ROSETTA RESOURCES INC.
JP Morgan Global High Yield &
Leveraged Finance Conference
March 2011

2
All statements, other than statements of historical fact, included in this presentation are forward-looking statements
within the meaning of the Private Securities Litigation Reform Act of 1995. Forward-looking statements are statements
that are not historical facts, such as expectations regarding drilling plans, changes in acreage positions, and expected
capital expenditures. The assumptions of management and the future performance of the Company are subject to a
wide range of business risks and uncertainties and there is no assurance that these statements and projections will be
met. Factors that could affect the Company's business include, but are not limited to: the risks associated with drilling of
oil and natural gas wells; the Company's ability to find, acquire, market, develop, and produce new reserves; the risk of
drilling dry holes; oil and natural gas price volatility; uncertainties in the estimation of proved, probable, and possible
reserves and in the projection of future rates of production and reserve growth; inaccuracies in the Company's
assumptions regarding items of income and expense and the level of capital expenditures; uncertainties in the timing of
exploitation expenditures; operating hazards attendant to the oil and natural gas business; drilling and completion
losses that are generally not recoverable from third parties or insurance; potential mechanical failure or
underperformance of significant wells; pipeline capacity availability and pipeline construction difficulties; climatic
conditions; availability and cost of material and equipment; the risks associated with operating in a limited number of
geographic areas; availability of capital; timing of planned divestitures; regulatory developments; environmental risks;
general economic and business conditions (including the effects of the worldwide economic recession); the amount and
expected benefit of hedging arrangements; industry trends; and other factors detailed in the Company's most recent
Form 10-K and other filings with the Securities and Exchange Commission. If one or more of these risks or uncertainties
materialize (or the consequences of such a development change), or should underlying assumptions prove incorrect,
actual outcomes may vary materially from those forecasted or expected. The Company undertakes no obligation to
publicly update or revise any forward-looking statements except as required by law.
Forward-Looking Statements

3
Cautionary Statement Concerning Resources
The United States Securities and Exchange Commission permits oil and gas companies, in their filings with the SEC, to
disclose only proved, probable and possible reserves that a company anticipates as of a given date to be economically and
legally producible by application of development projects to known accumulations. We may use certain terms in this
presentation, such as “Risked Project Inventory,” “Project Counts,” “Net Risked Resources,” “Total Resources,” “Unrisked
Potential,” “Unrisked Original Resources in Place,” and “Unrisked EUR Potential” that the SEC's guidelines strictly prohibit
us from including in filings with the SEC. These estimates are by their nature more speculative than estimates of proved
reserves and accordingly are subject to substantially greater risk of actually being realized.
For filings for year-end 2009 and forward, the SEC permits the optional disclosure of probable and possible reserves. The
Company has elected not to report probable and possible reserves in its filings with the SEC. We use the term “net risked
resources” to describe the Company’s internal estimates of volumes of natural gas and oil that are not classified as proved
reserves but are potentially recoverable through exploratory drilling or additional drilling or recovery
techniques. Estimates of unproved resources are by their nature more speculative than estimates of proved reserves and
accordingly are subject to substantially greater risk of actually being realized by the Company. Estimates of unproved
resources may change significantly as development provides additional data, and actual quantities that are ultimately
recovered may differ substantially from prior estimates.
BFIT NPV10
We use the term “BFIT NPV10” to describe the Company’s estimate of before income tax net present value discounted at
10 percent resulting from project economic evaluation. The net present value of a project is calculated by summing future
cash flows generated by a project, both inflows and outflows, and discounting those cash flows to arrive at a present
value. Inflows primarily include revenues generated from estimated production and commodity prices at the time of the
analysis. Outflows include drilling and completion capital and operating expenses. Net present value is used to analyze
the profitability of a project. Estimates of net present value may change significantly as additional data becomes
available, and with adjustments in prior estimates of actual quantities of production and recoverable reserves, commodity
prices, capital expenditures, and/or operating expenses.
Forward-Looking Statements (Cont.)

4
Rosetta Resources - 2010 Highlights
• Capital spending of $339 MM
• High return/high value programs received vast majority of funding
• Capital exceeded internal cash flows, but balanced with asset sales
beginning cash and revolver borrowings
beginning cash and revolver borrowings
• 2010 asset sales are ~$90MM
• Production growth
• Annual production rate of 138 MMcfe/d
• Exit rate of 157 MMcfe/d
• Eagle Ford exit rate of 86 MMcfe/d
• Reserve growth
• Double digit reserve growth rate
5
Rosetta Resources Key Statistics
|
|
2010
|
2009
|
Percent
Increase |
|
Proved Reserves
|
479
|
351
|
36%
|
|
Risk Adjusted Inventory (1)
|
1,897
|
812
|
134%
|
|
Average Shares Outstanding
(Diluted) |
52.1MM
|
51.0MM
|
2%
|
1) Excludes PUD’s
Reserves Inventory in BCFE

6
• $360 MM Capital Budget in 2011
• Focus on Eagle Ford
• 90% of 2011 capital allocated to Eagle Ford
• 40 wells planned
• Fracture stimulation services agreement in place
• Pipeline and processing capacity expanded
• Shift to liquids accelerates
• Southern Alberta Basin evaluation continues
• Six wells drilled
• Additional five wells to be drilled by early 2011
• Completions planned for 2011
• Additional asset sales scheduled
• DJ Basin
• Sacramento Basin
• Strong alignment with stakeholders remains fundamental driver
2011 Program
7
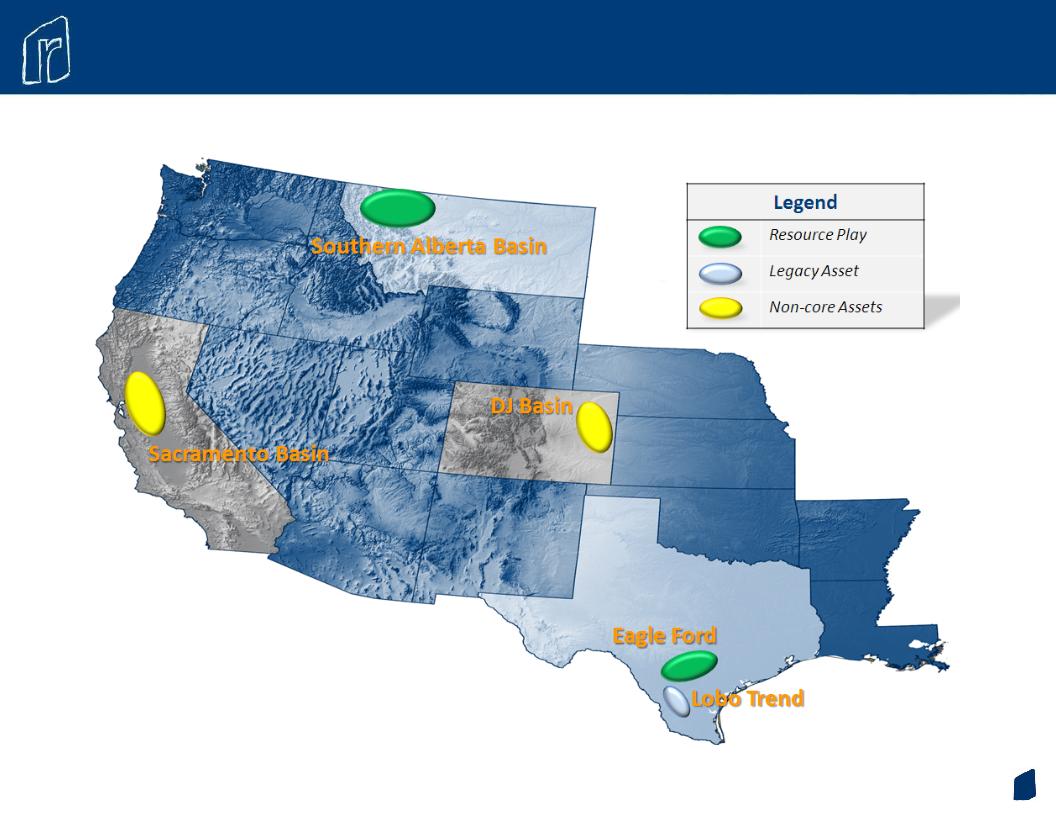
Rosetta Asset Portfolio Status

8
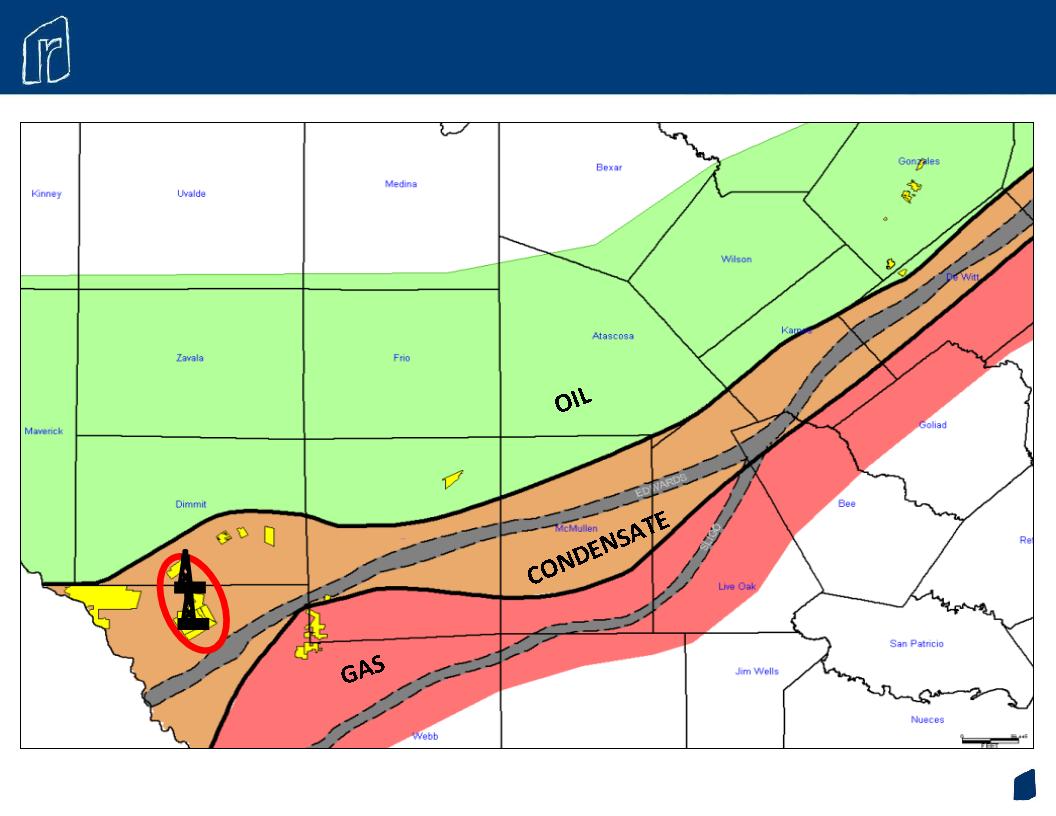
Eagle Ford

9
Rosetta’s drilling focus has been primarily on the Gates Ranch Area, however, we
have embarked on the delineation of our other liquids-rich areas…
have embarked on the delineation of our other liquids-rich areas…
|
Area
|
Hydrocarbon Window
|
Net Acres
|
|
Gates Ranch Area
|
Condensate
|
29,960
|
|
Central Dimmit
|
Oil
|
7,450
|
|
Encinal Area
|
Dry Gas
|
14,500
|
|
Gonzales Area
|
Oil
|
6,500
|
|
NE LaSalle Area
|
Oil
|
3,450
|
|
Western Webb
|
Condensate
|
3,000
|
|
Total
|
77% Liquids
|
64,860
|
10
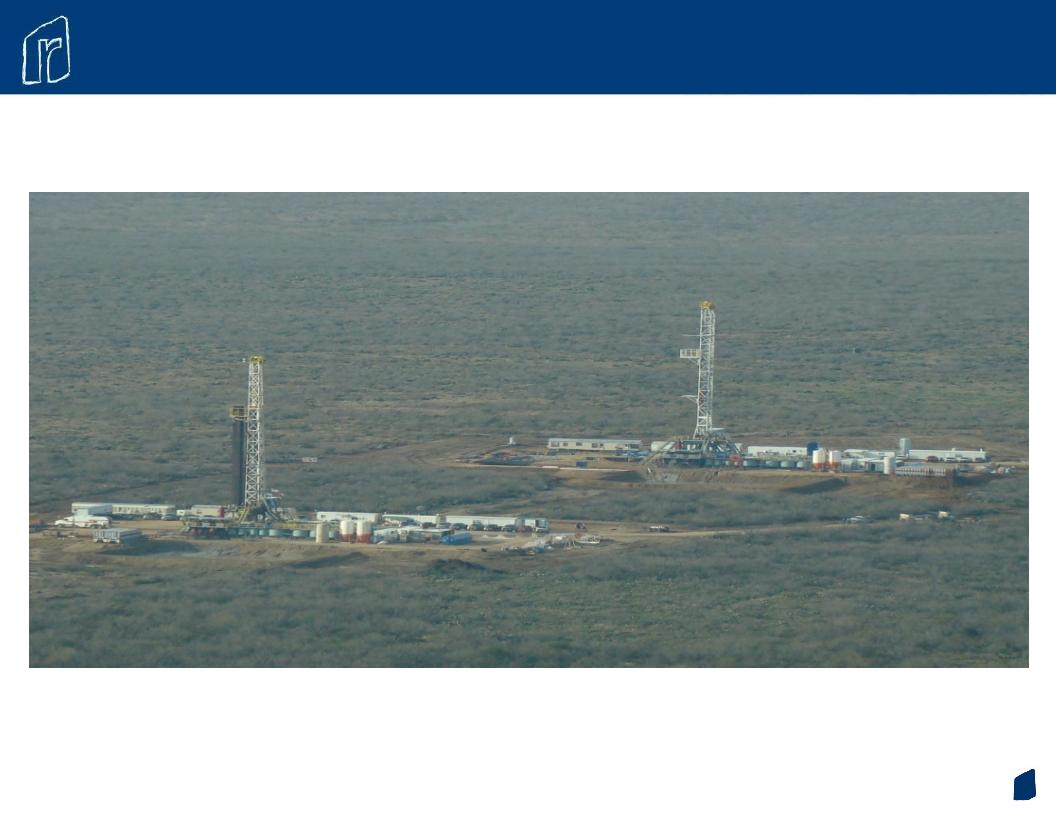
Gates Ranch Area
11
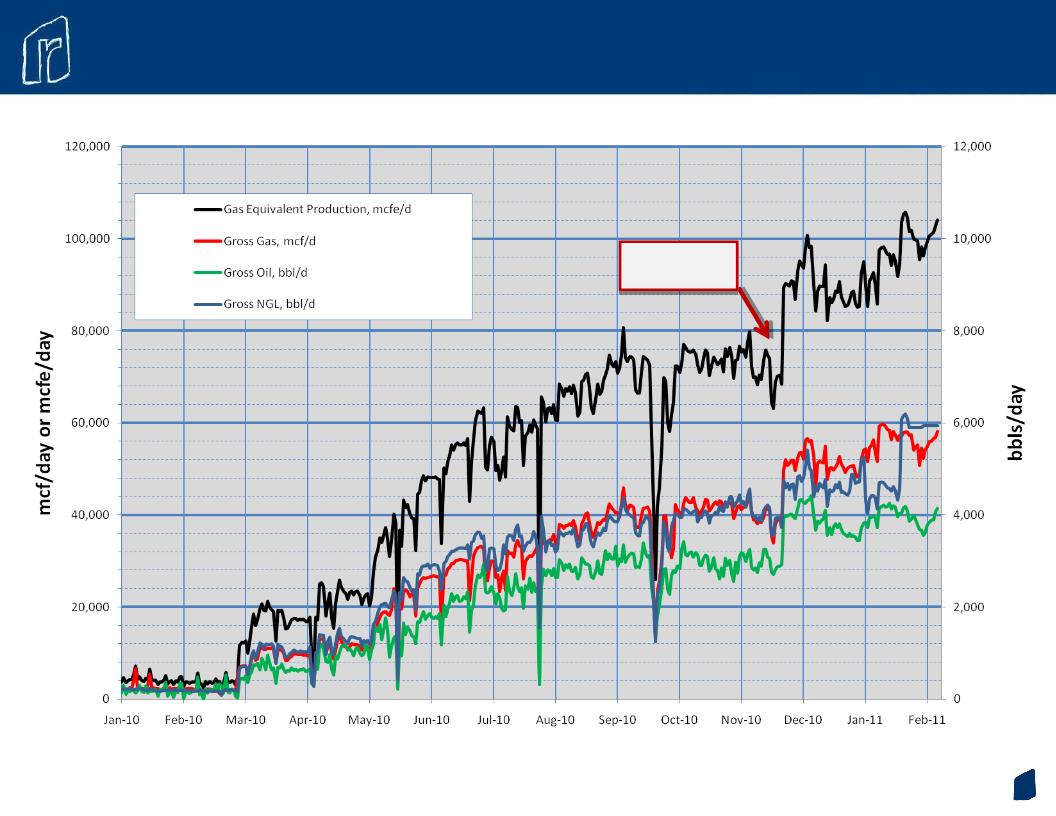
Gates Ranch-Gross Daily Production
Dos Hermanas
in service
in service
12
Eagle Ford - Gates Ranch
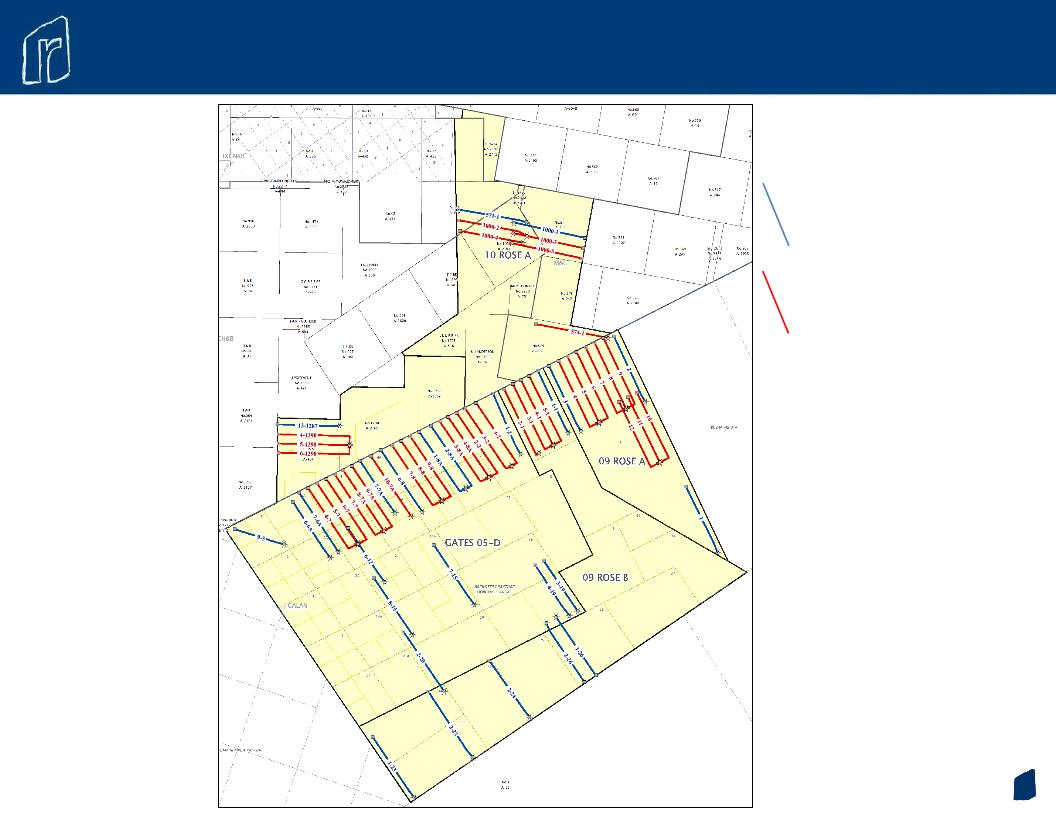
13
Gates Ranch Proper - Drilling Activities
Inception to date and planned for 2011
Wells Drilled - 2009 & 2010
Planned Wells - 2011
14
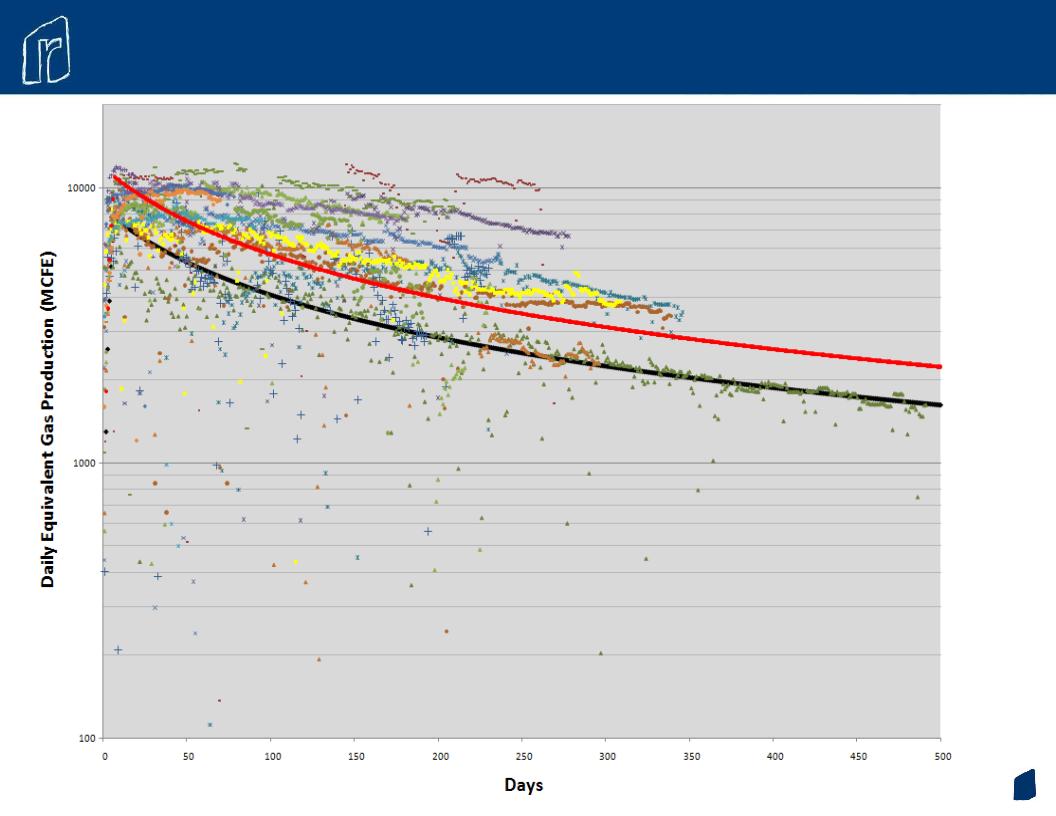
Gates Ranch Proper - Individual Well Performance
Normalized actual results versus internal 7.2 Bcfe P50 curve and P90 PUD booking curve
7.2 BCFE
(Internal model)
5.3 BCFE
(PUD booking)
15
|
Area
|
Initial
Gas Rate
(mmcfpd)
|
Initial
Oil Rate
(bopd)
|
EUR
(bcfe)
|
NPV Per
Well BFIT10
($MM)
|
Discounted
Payout
(years)
|
Post 2010
Inventory
(Net Wells)
|
NPV Per Area
BFIT10
($)
|
|
Gates North Type Curve
|
5.0
|
450
|
6.7
|
13.0
|
1.6
|
150
|
$1.950 billion
|
|
Gates South Type Curve
|
7.0
|
350
|
8.1
|
14.1
|
1.4
|
90
|
$1.269 billion
|
|
Gates Ranch Type Curve
|
5.7
|
412
|
7.2
|
13.4
|
1.5
|
240
|
$3.219 billion
|
Notes:
• Gates Ranch proper only (26,500 net acres)
• 100 acre well spacing
• $8.25 mm total well cost
• Strip pricing effective 10/26/2010
• “Per area” values are “per well” values multiplied by post 2010 net inventory
Gates Ranch Valuation
On average, a typical well has a 7.2 BCFE EUR and a BFIT NPV of $13.4 MM…
16
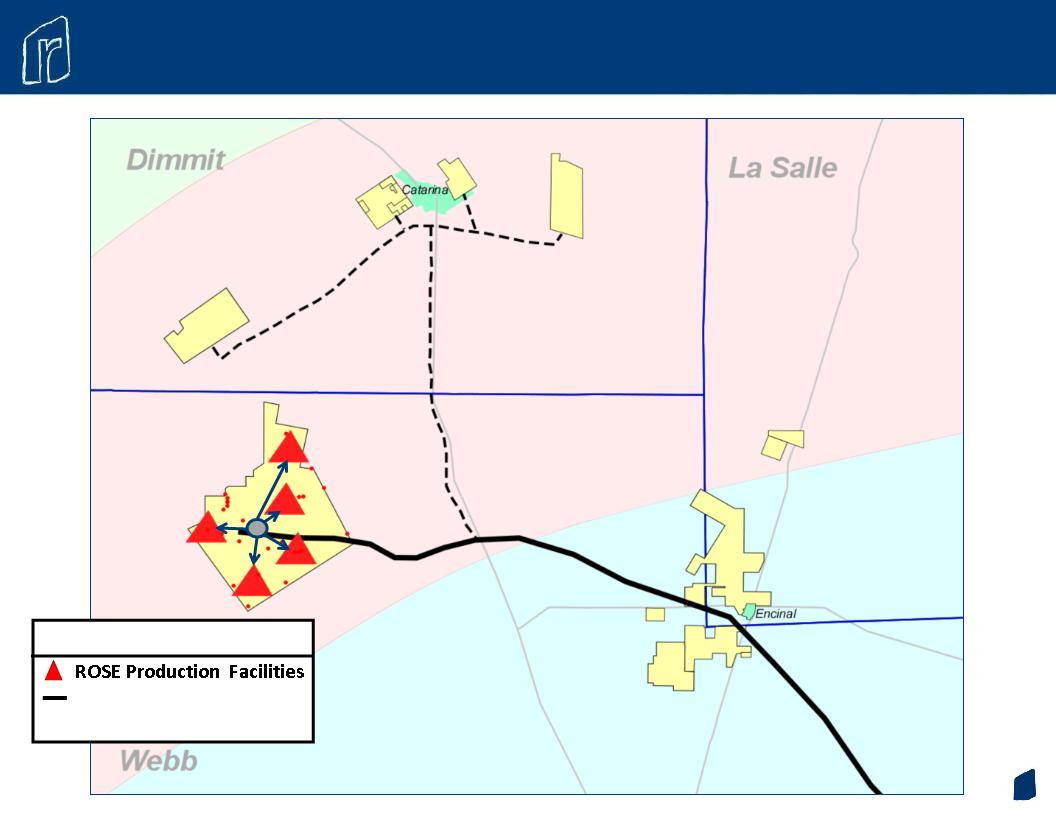
Eagle Ford Pipeline Projects
Legend
Dos Hermanas
---- Dimmit Lateral
17
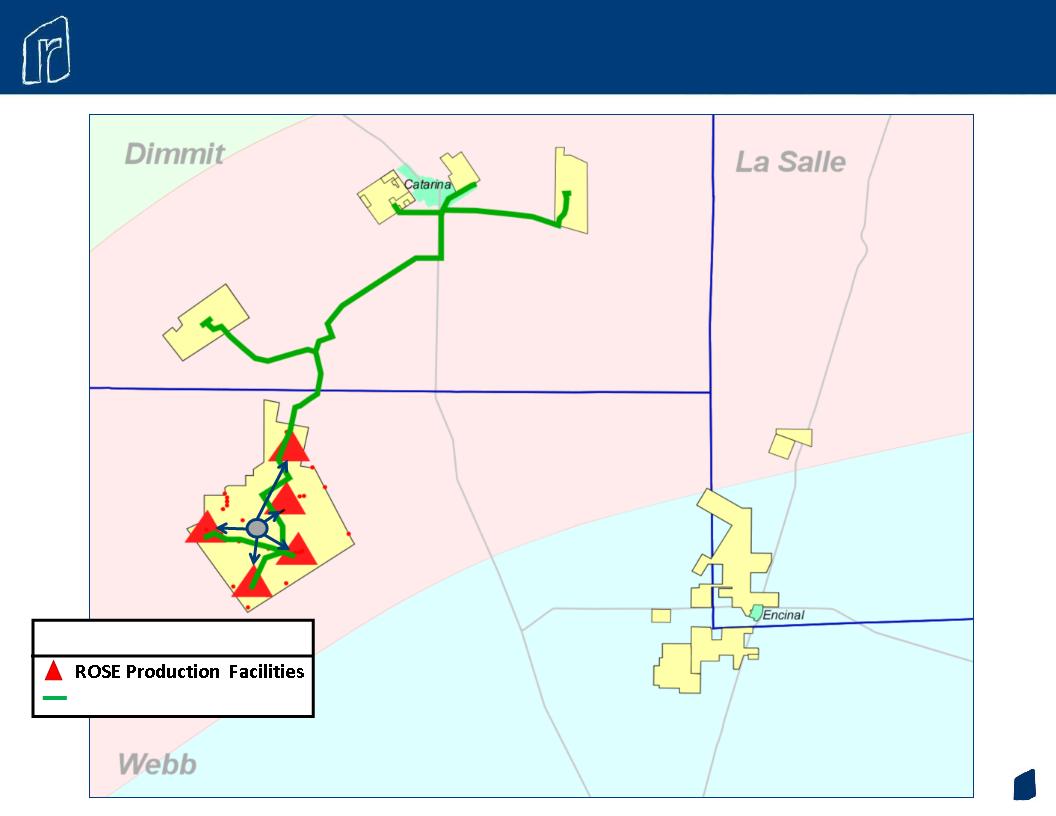
Eagle Ford Pipeline Projects (Cont.)
Legend
Velocity Liquids Line

18
• Dos Hermanas in service December 2010
• Firm gathering and processing reaches 85 MMcfe/d
• Revised agreement in place:
• Dimmit lateral in service 2nd quarter 2011
• Dos Hermanas capacity to increase by 20 MMcfe/d in 3rd
quarter 2011
quarter 2011
• Velocity oil pipeline and terminal in place January 2011
• Rosetta to access new gathering and processing in 4th
quarter 2011 with total capacity of 115 MMcf/d
quarter 2011 with total capacity of 115 MMcf/d
• Total capacity to reach 205 MMcf/d by 2013
Eagle Ford Gathering

19
Southern Alberta Basin
20
• Southern Alberta Basin specifics
• Devonian Shale oil play in NW Montana
• Williston Basin analog
• Depths ranging from 4,500’ to 7,500’ TVD
• Over-pressured reservoirs
• Rosetta’s current Southern Alberta Basin
position
position
• 300,000 undeveloped net acres
• 13 - 15 MMBoe per square mile of resource in place
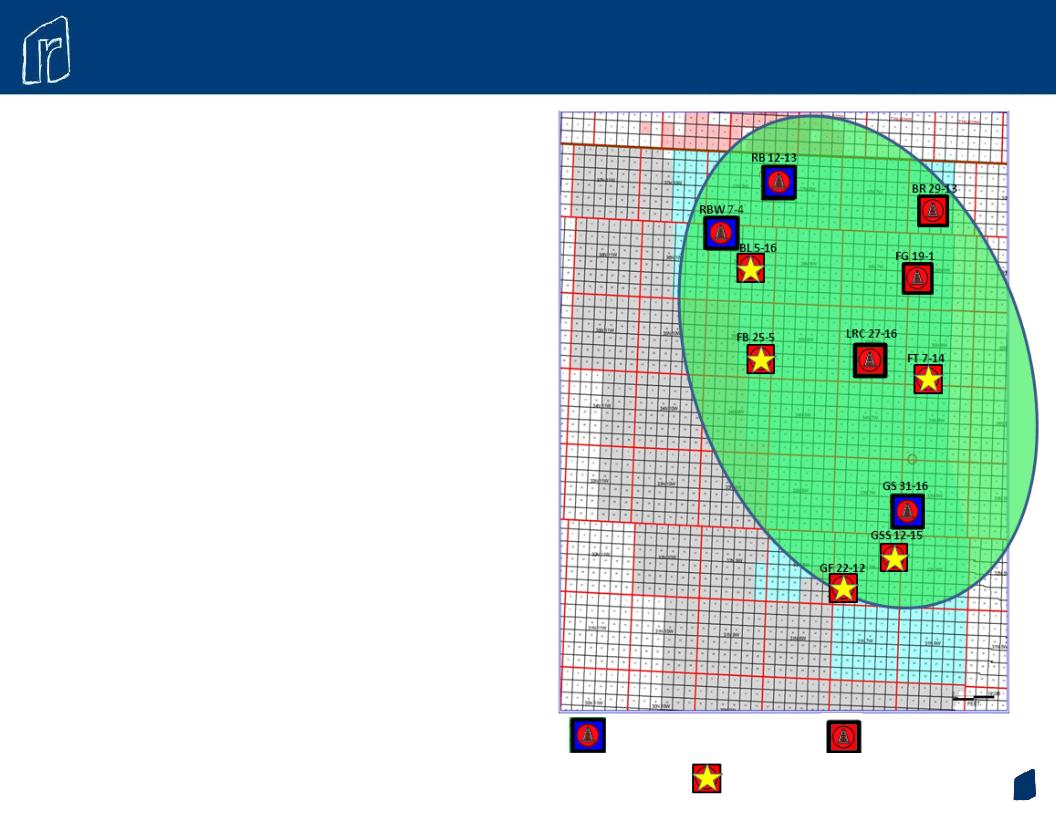
• Rosetta’s assessment to date
• Drilled 6 exploratory delineation wells
• 2 wells on strike 28 miles apart (Riverbend 12-13 and
Gunsight 31-16)
Gunsight 31-16)
• 1 well 8 miles downdip (Riverbend W 7-4)
• Drilled a north east extension and encountered thickening
Banff and Bakken intervals (Big Rock 29-13)
Banff and Bakken intervals (Big Rock 29-13)
• Drilled 2 middle of area wells which established continuity
(Little Rock Coulee 27-16 and Fee Gauge 19-1)
(Little Rock Coulee 27-16 and Fee Gauge 19-1)
• Confirmed significant oil hydrocarbons in place and
over-pressured reservoirs
over-pressured reservoirs
• Conducted vertical tests in several zones
• Multi-well vertical program underway
Southern Alberta Basin Opportunity is Unique
ROSE INTIAL WELLS
ROSE NEW WELLS
ROSE PLANNED WELLS

21
|
Acres
|
Lessor
|
Terms
|
|
200,000
|
Blackfeet Indian Nation
|
• 5 year option with 2 well per year drilling requirement for 10 well total.
• With each commercial well, Rosetta earns the right to lease 20,000 acres
surrounding that well for a 10 year term. • Continuous drilling obligation of 1 well per 9 months beginning on the 4th
year. |
|
30,000
|
WAVE Energy
|
• Terms similar to option acreage.
|
|
52,000
|
Allottee (Blackfeet Families)
|
• Typically 5 year lease terms, with option to extend term at the end of the
primary period. |
|
18,000
|
Fee Acreage
|
|
Southern Alberta Basin
Acreage Recap
Acreage Recap

22
FINANCIAL OVERVIEW

23
Financial Strategy
• Conservative and disciplined approach to financial management
• Ample debt coverage
• Debt to proved reserves of $0.72/Mcfe
• Debt to proved developed reserves of $1.46/Mcfe
• Actively manage and monitor use of debt
• Debt to book cap @ 40%
• Debt to EBITDAX < 1.75x
• Maintain high level of liquidity throughout cycles
• Asset sales to “balance” 2011 capital program
• Reinvest cash flow in business: no dividend or share repurchases
planned
planned
1 Adjusted for the high yield offering

24
Financial Strength
• High quality and low risk diversified proved asset base
• 479 Bcfe of proved reserves
• 9.8 year reserve life
• 51 % proved developed
• Financial flexibility
• Credit facility with $325MM borrowing base
• Debt to book cap @ 40%
• Borrowing capacity, including available cash of ~$240MM
1 Adjusted for the high yield offering

25
Risk Management
• Selective hedging program:
• Oil hedges of 3,200 Bbl/d in 2011/3,400 Bbl/d in 2012/2,600 in 2013
• NGL Hedges of 1,679 Bbl/d in 2011/1,950 Bbl/d in 2012
• Gas hedges of 50,000 MMBtu/d in 2011/20,000 MMBtu/d in 2012
• Fracture stimulation services/agreement in place
• 2 year term
• 3 weeks per month
• Favorable pricing
• Transportation and processing
• 115 MMcf/d capacity total in 4th quarter of 2011
• 205 MMcf/d capacity total by 2013

26
Financial Summary
1 Adjusted for the high yield offering
|
|
12/31/2010
|
|
12/31/2009
|
|
12/31/2008
|
|
Cash
|
$ 41.6
|
|
$ 61.3
|
|
$ 44.3
|
|
Other current assets
|
71.4
|
|
50.9
|
|
85.7
|
|
Property and equipment, net
|
730.0
|
|
590.6
|
|
974.3
|
|
Other assets
|
154.3
|
|
176.8
|
|
50.1
|
|
TOTAL ASSETS
|
$ 997.3
|
|
$ 879.6
|
|
$ 1,154.4
|
|
|
|
|
|
|
|
|
Current liabilities
|
$90.2
|
|
$66.5
|
|
$101.4
|
|
Long-term debt
|
350.0
|
|
288.7
|
|
300.0
|
|
Other long-term liabilities
|
28.3
|
|
31.3
|
|
26.6
|
|
TOTAL LIABILITIES
|
$ 468.5
|
|
$ 386.5
|
|
$ 428.0
|
|
|
|
|
|
|
|
|
Stockholders’ Equity
|
528.8
|
|
493.1
|
|
726.4
|
|
TOTAL LIABILITIES & STOCKHOLDERS’ EQUITY
|
$ 997.3
|
|
$ 879.6
|
|
$ 1,154.4
|
|
|
|
|
|
|
|
|
CAPITALIZATION
|
|
|
|
|
|
|
Debt
|
40%
|
|
37%
|
|
29%
|
|
Capital
|
60%
|
|
63%
|
|
71%
|
27
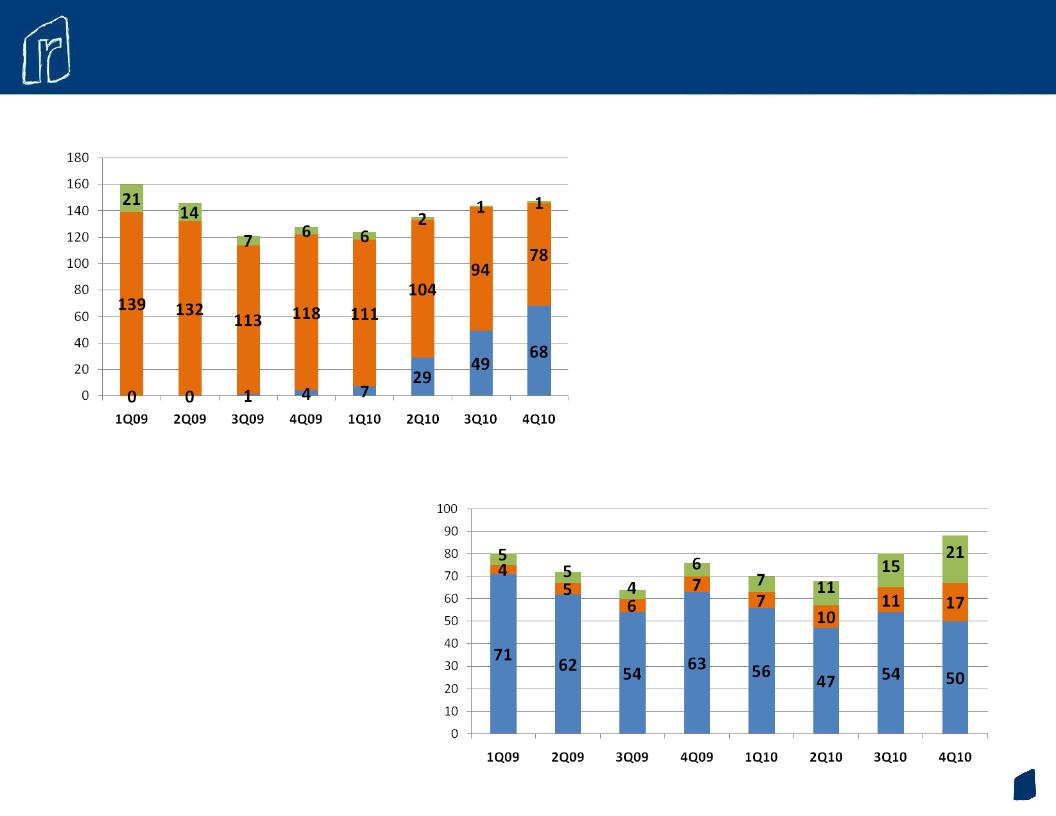
Rosetta Production & Revenue
Production
(MMcfe/d)
Revenue
($MM)
■ Gas ■ NGL ■ Oil
■ Offshore ■ Other Core ■ Eagle Ford

28
• Focus on high return Eagle Ford inventory
• Production guidance dependent on divestiture timing
• 160-170 MMcfe/d including divestment properties
• DJ Basin/California expected to produce approximately 35 MMcfe/d for full year
• 2011 exit rate, excluding divestment properties, to range from 155-165 MMcfe/d
• Divest additional legacy assets to fund development
• Simplify and reduce unit cost structure
• Focus on returns
• Test Southern Alberta Basin position
2011 Program

29