Attached files
| file | filename |
|---|---|
| EX-31.2 - EXHIBIT 31.2 - Whitestone REIT | exh31_2.htm |
| EX-23.1 - EXHIBIT 23.1 - Whitestone REIT | exh23_1.htm |
| EX-32.2 - EXHIBIT 32.2 - Whitestone REIT | exh32_2.htm |
| EX-31.1 - EXHIBIT 31.1 - Whitestone REIT | exh31_1.htm |
| EX-32.1 - EXHIBIT 32.1 - Whitestone REIT | exh32_1.htm |
| EX-21.1 - EXHIBIT 21.1 - Whitestone REIT | exht21_1.htm |
| EX-10.30 - EXHIBIT 10.30 - Whitestone REIT | exh10_30.htm |
UNITED STATES
SECURITIES AND EXCHANGE COMMISSION
Washington, D.C. 20549
____________________________________
FORM 10-K
[Mark One]
x ANNUAL REPORT PURSUANT TO SECTION 13 OR 15(d) OF THE SECURITIES EXCHANGE ACT OF 1934
For the fiscal year ended December 31, 2010
OR
o TRANSITION REPORT PURSUANT TO SECTION 13 OR 15(d) OF THE SECURITIES EXCHANGE ACT OF 1934
For the transition period from ____________ to ____________
Commission File Number: 000-50256
______________________________

(Exact Name of Registrant as Specified in Its Charter)
Maryland | 76-0594970 | |
(State or Other Jurisdiction of incorporation or | (I.R.S. Employer | |
Organization) | Identification No.) | |
2600 South Gessner, Suite 500 Houston, Texas | 77063 | |
(Address of Principal Executive Offices) | (Zip Code) |
Registrant's telephone number, including area code: (713) 827-9595
Securities registered pursuant to section 12(b) of the Act:
Title of each class | Name of each exchange on which registered | |||
Class B Common Shares of Beneficial Interest, par value $0.001 per share | NYSE Amex | |||
Securities registered pursuant to section 12(g) of the Act:
Class A Common Shares of Beneficial Interest, par value $0.001 per share
(Title of Class)
Indicate by check mark if the Registrant is a well-known seasoned issuer, as defined in Rule 405 of the Securities Act. Yes o No x
Indicate by check mark if the Registrant is not required to file reports pursuant to Section 13 or 15(d) of the Act. Yes o No x
Indicate by check mark whether the Registrant (1) has filed all reports required to be filed by Section 13 or 15(d) of the Securities Exchange Act of 1934 during the preceding 12 months (or for such shorter period that the Registrant was required to file such reports), and (2) has been subject to such filing requirements for the past 90 days. Yes x No o
Indicate by check mark whether the Registrant has submitted electronically and posted on its corporate Web site, if any, every Interactive Data File required to be submitted and posted pursuant to Rule 405 of Regulation S-T during the preceding 12 months (or for such shorter period that the Registrant was required to submit and post such files).
Yes o No o
Indicate by check mark if disclosure of delinquent filers pursuant to Item 405 of Regulation S-K is not contained herein, and will not be contained, to the best or Registrant's knowledge, in definitive proxy or information statements incorporated by reference in Part III of this Form 10-K or any amendment to this Form 10-K. o
Indicate by check mark whether the Registrant is a large accelerated filer, an accelerated filer, a non-accelerated filer or a smaller reporting company. See the definitions of “large accelerated filer,” “accelerated filer” and “smaller reporting company” in Rule 12b-2 of the Exchange Act. (Check one)
Large accelerated filer o Accelerated filer o Non-accelerated filer x Smaller reporting company o
(Do not check if smaller reporting company)
Indicate by check mark whether the Registrant is a shell company (as defined in Rule 12b-2 of the Exchange Act). Yes o No x
The aggregate market value of the voting and non-voting shares held by nonaffiliates of the Registrant as of June 30, 2010 (the last business day of the Registrant's most recently completed second fiscal quarter) was $49,594,850 assuming a market value of $15.45 per share. There was no established market for the voting and non-voting stock at such date.
As of February 28, 2011, the Registrant had 3,417,187 Class A and 2,200,000 Class B common shares of beneficial interest outstanding.
DOCUMENTS INCORPORATED BY REFERENCE: We incorporate by reference in Part III of this Annual Report on Form 10-K portions of our definitive proxy statement for our 2011 Annual Meeting of Shareholders to be filed subsequently with the Securities and Exchange Commission.
WHITESTONE REIT
FORM 10-K
Year Ended December 31, 2010
Page | |||
PART I | |||
Item 1. | |||
Item 1A. | |||
Item 1B. | |||
Item 2. | |||
Item 3. | |||
Item 4. | |||
PART II | |||
Item 5. | |||
Item 6. | |||
Item 7. | |||
Item 7A. | |||
Item 8. | |||
Item 9. | |||
Item 9A(T). | |||
Item 9B. | |||
PART III | |||
Item 10. | |||
Item 11. | |||
Item 12. | |||
Item 13. | |||
Item 14. | |||
PART IV | |||
Item 15. | |||
Unless the context otherwise requires, all references in this report to the “Company,” “we,” “us” or “our” are to Whitestone REIT and its subsidiaries.
Forward-Looking Statements
This Form 10-K contains forward-looking statements, including discussion and analysis of our financial condition, anticipated capital expenditures required to complete projects, amounts of anticipated cash distributions to our shareholders in the future and other matters. These forward-looking statements are not historical facts but are the intent, belief or current expectations of our management based on its knowledge and understanding of our business and industry. Forward-looking statements are typically identified by the use of terms such as “may,” “will,” “should,” “potential,” “predicts,” “anticipates,” “expects,” “intends,” “plans,” “believes,” “seeks,” “estimates” or the negative of such terms and variations of these words and similar expressions. These statements are not guarantees of future performance and are subject to risks, uncertainties and other factors, some of which are beyond our control, are difficult to predict and could cause actual results to differ materially from those expressed or forecasted in the forward-looking statements.
Forward-looking statements that were true at the time made may ultimately prove to be incorrect or false. You are cautioned to not place undue reliance on forward-looking statements, which reflect our management’s view only as of the date of this Form 10-K. We undertake no obligation to update or revise forward-looking statements to reflect changed assumptions, the occurrence of unanticipated events or changes to future operating results. Factors that could cause actual results to differ materially from any forward-looking statements made in this Form 10-K include:
• | the imposition of federal taxes if we fail to qualify as a REIT in any taxable year or forego an opportunity to ensure REIT status; |
• | uncertainties related to the national economy, the real estate industry in general and in our specific markets; |
• | legislative or regulatory changes, including changes to laws governing REITs; |
• | adverse economic or real estate developments in Texas, Arizona or Illinois; |
• | increases in interest rates and operating costs; |
• | inability to obtain necessary outside financing; |
• | litigation risks; |
• | lease-up risks; |
• | inability to obtain new tenants upon the expiration of existing leases; |
• | inability to generate sufficient cash flows due to market conditions, competition, uninsured losses, changes in tax or other applicable laws; and |
• | the need to fund tenant improvements or other capital expenditures out of operating cash flow. |
The forward-looking statements should be read in light of these factors and the factors identified in the “Risk Factors” section of this Form 10-K.
PART I
Item 1. Business.
General
We are a Maryland real estate investment trust (“REIT”) engaged in owning and operating commercial properties in culturally diverse markets in major metropolitan areas. Founded in 1998, we changed our state of organization from Texas to Maryland in December 2003. We have elected to be taxed as a REIT under the Internal Revenue Code of 1986, as amended (the “Code”).
We are internally managed and own a real estate portfolio of 38 properties containing approximately 3.2 million square feet of leasable space, located in Texas, Arizona and Illinois. Our portfolio has a gross book value of approximately $205 million and book equity, including noncontrolling interests, of approximately $84 million as of December 31, 2010.
Our Class B common shares of beneficial interest are currently traded on the NYSE-Amex under the ticker symbol "WSR," and our Class A common shares of beneficial interest are not currently traded on a national securities exchange. Our offices are located at 2600 South Gessner, Suite 500, Houston, Texas 77063. Our telephone number is (713) 827-9595 and we maintain a website at www.whitestonereit.com.
Our Strategy
In October 2006, our current management team joined the company and adopted a strategic plan to acquire, redevelop, own and operate Community Centered Properties. We define Community Centered Properties as visibly located properties in established or developing culturally diverse neighborhoods in our target markets. We market, lease and manage our centers to match tenants with the shared needs of the surrounding neighborhood. Those needs may include specialty retail, grocery, restaurants and medical, educational and financial services. Our goal is for each property to become a Whitestone-branded business center or retail community that serves a neighboring five-mile radius around our property. We employ and develop a diverse group of associates who understand the needs of our multicultural communities and tenants.
Our primary business objective is to increase shareholder value by acquiring, owning and operating Community Centered Properties. The key elements of our strategy include:
• | Strategically Acquiring Properties. |
◦ | Seeking High Growth Markets. We seek to strategically acquire commercial properties in high-growth markets. Our acquisition targets are located in densely populated, culturally diverse neighborhoods, primarily in and around Phoenix, Chicago, Dallas, San Antonio and Houston, five of the top 20 markets in the United States in terms of population growth. |
◦ | Diversifying Geographically. Our current portfolio is concentrated in Houston. We believe that continued geographic diversification in markets where we have substantial knowledge and experience will help offset the economic risk from a single market concentration. We intend to continue to focus our expansion efforts on the Phoenix, Chicago, Dallas and San Antonio markets. We believe our management infrastructure and capacity can accommodate substantial growth in those markets. We may also pursue opportunities in other Southwestern and Western regions that are consistent with our Community Centered Property strategy. |
◦ | Capitalizing on Availability of Distressed Assets. We believe that during the next several years there will be excellent opportunities in our target markets to acquire quality properties at historically attractive prices. We intend to acquire distressed assets directly from owners or financial institutions holding foreclosed real estate and debt instruments that are either in default or on bank watch lists. Many of these assets may benefit from our corporate strategy and our management team’s experience in turning around distressed properties, portfolios and companies. We have extensive relationships with community banks, attorneys, title companies, and others in the real estate industry with whom we regularly work to identify properties for potential acquisition. |
• | Redeveloping and Re-tenanting Existing Properties. We “turn around” properties and seek to add value through renovating and re-tenanting our properties to create Whitestone-branded Community Centered Properties. We seek to accomplish this by (1) stabilizing occupancy, with per property occupancy goals of 90% or higher; (2) adding leasable |
1
square footage to existing structures; (3) developing and building on excess land; (4) upgrading and renovating existing structures; and (5) investing significant effort in recruiting tenants whose goods and services meet the needs of the surrounding neighborhood.
• | Recycling Capital for Greater Returns. We seek to continually upgrade our portfolio by opportunistically selling properties that do not have the potential to meet our Community Centered Property strategy and redeploying the sale proceeds into properties that better fit our strategy. Some of our properties which were acquired prior to the tenure of our current management team may not fit our Community Centered Property strategy, and we may look for opportunities to dispose of these properties as we continue to execute our strategy. |
• | Prudent Management of Capital Structure. We currently have 15 properties that are not mortgaged. We may seek to add mortgage indebtedness to existing and newly acquired unencumbered properties to provide additional capital for acquisitions. As a general policy, we intend to maintain a ratio of total indebtedness to undepreciated book value of real estate assets that is less than 60%. As of December 31, 2010, our ratio of total mortgage indebtedness to undepreciated book value of real estate assets was 49%. |
• | Investing in People. We believe that our people are the heart of our culture, philosophy and strategy. We continually focus on developing associates who are self-disciplined and motivated and display at all times a high degree of character and competence. We provide them with equity incentives to align their interests with those of our shareholders. |
Our Structure
Substantially all of our business is conducted through Whitestone REIT Operating Partnership, L.P., a Delaware limited partnership organized in 1998 (the “Operating Partnership”). We are the sole general partner of the Operating Partnership. As of December 31, 2010, we owned a 75.4% interest in the Operating Partnership.
As of December 31, 2010, we owned a real estate portfolio consisting of 38 properties located in three states. As of December 31, 2010, our Operating Portfolio Occupancy Rate was 86% based on leasable square footage compared to 82% as of December 31, 2009. We define Operating Portfolio Occupancy Rate as physical occupancy on all properties (i) excluding new acquisitions and (ii) properties which are undergoing significant redevelopment or re-tenanting.
We take a very hands-on approach to ownership, and directly manage the operations and leasing of our properties. Substantially all of our revenues consist of base rents received under long-term leases. For the year ended December 31, 2010, our total revenues were approximately $31.5 million. Approximately 66% of our existing leases contain “step up” rental clauses that provide for increases in the base rental payments.
As of December 31, 2010, 2009 and 2008, we had one property that accounted for more than 10% of total gross revenue and real estate assets. Uptown Tower is an office building located in Dallas, Texas that accounted for 12.0%, 11.9% and 12.8% of our total revenue for the years ended December 31, 2010, 2009 and 2008, respectively. Uptown Tower also accounted for 10.2%, 10.9% and 11.5% of our real estate assets, net of accumulated depreciation, for the years ended December 31, 2010, 2009 and 2008, respectively. Of our 38 properties, 31 are located in the Houston, Texas metropolitan area.
Economic Factors
The recent economic recession continues to negatively impact the volume of real estate transactions, occupancy levels, tenants’ ability to pay rent and cap rates. Each of these factors could negatively impact the value of public real estate companies, including ours. However, the vast majority of our retail properties are located in densely populated metropolitan areas and are occupied by tenants that generally provide basic necessity-type items and tend to be less affected by economic changes. Furthermore, our portfolio is primarily positioned in metropolitan areas in Texas which have been impacted less by the economic slow down compared to other metropolitan areas.
Competition
All of our properties are located in areas that include competing properties. The amount of competition in a particular area could impact our ability to acquire additional real estate, sell current real estate, lease space and the amount of rent we are able to charge. We may be competing with owners, including but not limited to, other REITs, insurance companies and pension funds, with access to greater resources than those available to us.
Many of our competitors have greater financial and other resources than us and may have more operating experience than
2
us. Generally, there are other neighborhood and community retail centers within relatively close proximity to each of our properties. There is, however, no dominant competitor in the Houston, Dallas, San Antonio, Phoenix or Chicago metropolitan areas. Our retail tenants face increasing competition from outlet malls, internet discount shopping clubs, catalog companies, direct mail and telemarketing.
Compliance with Governmental Regulations
Under various federal and state environmental laws and regulations, as an owner or operator of real estate, we may be required to investigate and clean up certain hazardous or toxic substances, asbestos-containing materials, or petroleum product releases at our properties. We may also be held liable to a governmental entity or to third parties for property damage and for investigation and cleanup costs incurred by those parties in connection with the contamination. In addition, some environmental laws create a lien on the contaminated site in favor of the government for damages and costs it incurs in connection with the contamination. The presence of contamination or the failure to remediate contaminations at any of our properties may adversely affect our ability to sell or lease the properties or to borrow using the properties as collateral. We could also be liable under common law to third parties for damages and injuries resulting from environmental contamination coming from our properties.
We will not purchase any property unless we are generally satisfied with the environmental status of the property. We may obtain a Phase I environmental site assessment, which includes a visual survey of the building and the property in an attempt to identify areas of potential environmental concerns, visually observing neighboring properties to assess surface conditions or activities that may have an adverse environmental impact on the property, and contacting local governmental agency personnel and performing a regulatory agency file search in an attempt to determine any known environmental concerns in the immediate vicinity of the property. A Phase I environmental site assessment does not generally include any sampling or testing of soil, groundwater or building materials from the property.
We believe that our properties are in compliance in all material respects with all federal, state and local ordinances and regulations regarding the handling, discharge and emission of hazardous or toxic substances. During the re-financing of twenty-one of our properties in late 2008 and early 2009, Phase I environmental site assessments were completed at those properties. These assessments revealed that five of the twenty-one properties currently or previously had a dry cleaning facility as a tenant. Since release of chlorinated solvents can occur as a result of dry cleaning operations, a Phase II subsurface investigation was conducted at the five identified properties, and all such investigations revealed the presence of chlorinated solvents. Based on the findings of the Phase II subsurface investigations, we promptly applied for entry into the Texas Commission on Environmental Quality Dry Cleaner Remediation Program, or DCRP, for four of the identified properties and were accepted. Upon entry, and continued good standing with the DCRP, the DCRP administers the Dry Cleaning Remediation fund to assist with remediation of contamination caused by dry cleaning solvents. The response actions associated with the ongoing investigation and subsequent remediation, if necessary, have not been determined at this time. However, we believe that the costs of such response actions will be immaterial, and therefore no liability has been recorded to our financial statements. We have not been notified by any governmental authority, and are not otherwise aware, other than the five identified properties described above, of any material noncompliance, liability or claim relating to hazardous or toxic substances in connection with any of our present or former properties. We have not recorded in our financial statements any material liability in connection with environmental matters. Nevertheless, it is possible that the environmental assessments conducted thus far and currently available to us do not reveal all potential environmental liabilities. It is also possible that subsequent investigations will identify material contamination or other adverse conditions, that adverse environmental conditions have arisen subsequent to the performance of the environmental assessments, or that there are material environmental liabilities of which management is unaware.
Under the Americans with Disabilities Act, or ADA, all places of public accommodation are required to meet certain federal requirements related to access and use by disabled persons. Our properties must comply with the ADA to the extent that they are considered “public accommodations” as defined by the ADA. The ADA may require removal of structural barriers to access by persons with disabilities in public areas of our properties where such removal is readily achievable. We believe that our properties are in substantial compliance with the ADA and that we will not be required to make substantial capital expenditures to address the requirements of the ADA. In addition, we will continue to assess our compliance with the ADA and to make alterations to our properties as required.
Employees
As of December 31, 2010, we had 53 employees.
3
Materials Available on Our Website
Copies of our Annual Report on Form 10-K, Quarterly Reports on Form 10-Q, Current Reports on Form 8-K and amendments to those reports, as well as Reports on Forms 3, 4 and 5 regarding our officers, trustees or 10% beneficial owners, filed or furnished pursuant to Section 13(a), 15(d) or 16(a) of the Securities Exchange Act of 1934 (the “Exchange Act”) are available free of charge through our website (www.whitestonereit.com) as soon as reasonably practicable after we electronically file the material with, or furnish it to, the Securities and Exchange Commission (“SEC”). We have also made available on our website copies of our Audit Committee Charter, Compensation Committee Charter, Nominating and Governance Committee Charter, Insider Trading Compliance Policy, and Code of Business Conduct and Ethics Policy. In the event of any changes to these charters, the code or guidelines, revised copies will also be made available on our website. You may also read and copy any materials we file with the SEC at the SEC’s Public Reference Room at 100 F Street, NE, Washington, D.C. 20549. Information on the operation of the Public Reference Room may be obtained by calling the SEC at 1-800-SEC-0330. The SEC also maintains an Internet site that contains reports, proxy and information statements, and other information regarding issuers that file electronically with the SEC as we do. The website address is http://www.sec.gov. Materials on our website are not part of our Annual Report on Form 10-K.
Financial Information
Additional financial information related to Whitestone REIT is included in Item 8 “Consolidated Financial Statements and Supplementary Data.”
4
Item 1A. Risk Factors.
In addition to the other information contained in this Form 10-K, the following risk factors should be considered carefully in evaluating our business. Our business, financial condition, or results of operations could be materially adversely affected by any of these risks. Please note additional risks not presently known to us or which we currently consider immaterial may also impair our business and operations.
Risks Associated with Real Estate
The recent market disruptions may significantly and adversely affect our financial condition and results of operations.
The recent recession in the United States has resulted in increased unemployment, weakening of tenant financial condition, large-scale business failures and tight credit markets. Our results of operations may be sensitive to changes in overall economic conditions that impact tenant leasing practices. A continuation of ongoing adverse economic conditions affecting tenant income, such as employment levels, business conditions, interest rates, tax rates, fuel and energy costs and other matters, could reduce overall tenant leasing or cause tenants to shift their leasing practices. In addition, periods of economic slowdown or recession, rising interest rates or declining demand for real estate, or the public perception that any of these events may occur, could result in a general decline in rents or an increased incidence of defaults under existing leases. At this time, it is difficult to determine the breadth and duration of the economic and financial market problems and the many ways in which they may affect our tenants and our business in general. A general reduction in the level of tenant leasing could adversely affect our ability to maintain our current tenants and gain new tenants, affecting our growth and profitability. Accordingly, continuation or further worsening of these difficult financial and macroeconomic conditions could have a significant adverse effect on our cash flows, profitability and results of operations.
Real estate property investments are illiquid, and therefore we may not be able to dispose of properties when appropriate or on favorable terms.
Our strategy includes opportunistically selling properties that do not have the potential to meet our Community Centered Property strategy. However, real estate property investments generally cannot be disposed of quickly. In addition, the Code imposes restrictions on the ability of a REIT to dispose of properties that are not applicable to other types of real estate companies. Therefore, we may not be able to vary our portfolio in response to economic or other conditions promptly or on favorable terms, which could cause us to incur extended losses, reduce our cash flows and adversely affect distributions to shareholders.
We cannot predict whether we will be able to sell any property for the price or on the terms set by us or whether any price or other terms offered by a prospective purchaser would be acceptable to us. We also cannot predict the length of time needed to find a willing purchaser and to close the sale of a property. To the extent we are unable to sell any properties for our book value, we may be required to take a non-cash impairment charge or loss on the sale, either of which would reduce our net income.
We may be required to expend funds to correct defects or to make improvements before a property can be sold. We cannot assure you that we will have funds available to correct those defects or to make those improvements. We may agree to transfer restrictions that materially restrict us from selling that property for a period of time or impose other restrictions, such as a limitation on the amount of debt that can be placed or repaid on that property. These transfer restrictions would impede our ability to sell a property even if we deem it necessary or appropriate. These facts and any others that would impede our
ability to respond to adverse changes in the performance of our properties may have a material adverse effect on our business, financial condition, results of operations and our ability to make distributions to our shareholders.
Our business is dependent upon our tenants successfully operating their businesses, and their failure to do so could have a material adverse effect on our ability to successfully and profitably operate our business.
We depend on our tenants to operate the properties we own in a manner which generates revenues sufficient to allow them to meet their obligations to us, including their obligations to pay rent, maintain certain insurance coverage, pay real estate taxes and maintain the properties in a manner so as not to jeopardize their operating licenses or regulatory status. The ability of our tenants to fulfill their obligations under our leases may depend, in part, upon the overall profitability of their operations. Cash flow generated by certain tenant businesses may not be sufficient for a tenant to meet its obligations to us. Our financial position could be weakened and our ability to fulfill our obligations under our indebtedness could be limited if a number of our tenants were unable to meet their obligations to us or failed to renew or extend their relationship with us as their lease terms expire, or if we were unable to lease or re-lease our properties on economically favorable terms. These adverse developments
5
could arise due to a number of factors, including those described in the risk factors discussed in this annual report.
Turmoil in capital markets could adversely impact acquisition activities and pricing of real estate assets.
Volatility in capital markets could adversely affect acquisition activities by impacting certain factors, including the tightening of underwriting standards by lenders and credit rating agencies and the significant inventory of unsold collateralized mortgage backed securities in the market. These factors directly affect a lender’s ability to provide debt financing as well as increase the cost of available debt financing. As a result, we may not be able to obtain favorable debt financing in the future or at all. This may impair our ability to acquire properties or result in future acquisitions generating lower overall economic returns, which may adversely affect our results of operations and distributions to shareholders. Furthermore, any turmoil in the capital markets could adversely impact the overall amount of capital available to invest in real estate, which may result in price or value decreases of real estate assets.
The value of investments in our common shares will be directly affected by general economic and regulatory factors we cannot control or predict.
Investments in real estate typically involve a high level of risk as the result of factors we cannot control or predict. One of the risks of investing in real estate is the possibility that our properties will not generate income sufficient to meet operating expenses or will generate income and capital appreciation, if any, at rates lower than those anticipated or available through investments in comparable real estate or other investments. The following factors may affect income from properties and yields from investments in properties and are generally outside of our control:
• | conditions in financial markets; |
• | over-building in our markets; |
• | a reduction in rental income as the result of the inability to maintain occupancy levels; |
• | adverse changes in applicable tax, real estate, environmental or zoning laws; |
• | changes in general economic conditions; |
• | a taking of any of our properties by eminent domain; |
• | adverse local conditions (such as changes in real estate zoning laws that may reduce the desirability of real estate in the area); |
• | acts of God, such as earthquakes or floods and other uninsured losses; |
• | changes in supply of or demand for similar or competing properties in an area; |
• | changes in interest rates and availability of permanent mortgage funds, which may render the sale of a property difficult or unattractive; and |
• | periods of high interest rates and tight money supply. |
Some or all of these factors may affect our properties, which could adversely affect our operations and ability to pay dividends to shareholders.
All of our properties are subject to property taxes that may increase in the future, which could adversely affect our cash flow.
Our properties are subject to property taxes that may increase as property tax rates change and as the properties are assessed by taxing authorities. We anticipate that most of our leases will generally provide that the property taxes, or increases therein, are charged to the lessees as an expense related to the properties that they occupy. As the owner of the properties, however, we are ultimately responsible for payment of the taxes to the government. If property taxes increase, our tenants may be unable to make the required tax payments, ultimately requiring us to pay the taxes. In addition, we will generally be responsible for property taxes related to any vacant space in our properties.
6
Compliance or failure to comply with laws requiring access to our properties by disabled persons could result in substantial cost.
The ADA and other federal, state and local laws generally require public accommodations be made accessible to disabled persons. Noncompliance could result in the imposition of fines by the government or the award of damages to private litigants. These laws may require us to modify our existing properties. These laws may also restrict renovations by requiring improved access to such buildings by disabled persons or may require us to add other structural features which increase our construction costs. Legislation or regulations adopted in the future may impose further burdens or restrictions on us with respect to improved access by disabled persons. We may incur unanticipated expenses that may be material to our financial condition or results of operations to comply with ADA and other federal, state and local laws, or in connection with lawsuits brought by private litigants.
We face intense competition, which may decrease, or prevent increases of, the occupancy and rental rates of our properties.
We compete with a number of developers, owners and operators of commercial real estate, many of which own properties similar to ours in the same markets in which our properties are located. If our competitors offer space at rental rates below current market rates, or below the rental rates we currently charge our tenants, we may lose existing or potential tenants and we may be pressured to reduce our rental rates below those we currently charge or to offer more substantial rent abatements, tenant improvements, early termination rights or below-market renewal options in order to retain tenants when our tenants’ leases expire. This competitive environment could have a material adverse effect on our ability to lease our properties or any newly developed or acquired property, as well as on the rents charged.
Risks Associated with Our Operations
Because of the current lack of geographic diversification of our portfolio, an economic downturn in the Houston metropolitan area could adversely impact our operations and ability to pay dividends to our shareholders.
The majority of our assets and revenues are currently derived from properties located in the Houston metropolitan area. As of December 31, 2010, we had 75% of our gross leasable square feet in Houston. Our results of operations are directly contingent on our ability to attract financially sound commercial tenants. A significant economic downturn may adversely impact our ability to locate and retain financially sound tenants and could have an adverse impact on our tenants’ revenues, costs and results of operations and may adversely affect their ability to meet their obligations to us. Likewise, we may be required to lower our rental rates to attract desirable tenants in such an environment. Consequently, because of the lack of geographic diversity among our current assets, if the Houston metropolitan area experiences an economic downturn, our operations and ability to pay distributions to our shareholders could be adversely impacted.
We lease our properties to approximately 800 tenants, with approximately 10% to 20% of our leases expiring annually. Each year we face the risk of non-renewal of a material percentage of our leases and the cost of re-leasing a significant amount of our available space, and our failure to meet leasing targets and control the cost of re-leasing our properties could adversely affect our rental revenue, operating expenses and results of operations.
While the nature of our business model warrants shorter term leases to smaller, non-national tenants, as of December 31, 2010, approximately 36% of the aggregate gross leasable area of our properties is subject to leases that expire prior to December 31, 2012. We are subject to the risk that:
• | tenants may choose not to, or may not have the financial resources to, renew these leases; |
• | we may experience significant costs associated with re-leasing a significant amount of our available space; |
• | we may not be able to easily re-lease the space subject to these leases, which may cause us to fail to meet our leasing targets or control the costs of re-leasing; and |
• | the terms of any renewal or re-lease may be less favorable than the terms of the current leases. |
If any of these risks materialize, our rental revenue, operating expenses and results of operations could be adversely affected.
Many of our tenants are small businesses, which may have a higher risk of bankruptcy or insolvency.
7
Many of our tenants are small, local businesses with little capital that depend on cash flows from their businesses to pay their rent and are therefore at a higher risk of bankruptcy or insolvency than larger, national tenants. The bankruptcy or insolvency of a number of smaller tenants may have an adverse impact on our income and our ability to pay dividends.
We receive substantially all of our income as rent payments under leases of our properties. We have no control over the success or failure of our tenants’ businesses and, at any time, any of our tenants may experience a downturn in its business that may weaken its financial condition. As a result, our tenants may fail to make rent payments when due or declare bankruptcy. For example, on November 10, 2008, one of our tenants, Circuit City, which leased space at one of our properties and represented approximately 1.1% of our total rent for the year ended December 31, 2008, filed for reorganization under Chapter 11 of the Bankruptcy Code. The tenant elected to reject our lease.
If tenants are unable to comply with the terms of the leases, we may be forced to modify the leases in ways that are unfavorable to us. Alternatively, the failure of a tenant to perform under a lease could require us to declare a default, repossess the space and find a suitable replacement tenant. There is no assurance that we would be able to lease the space on substantially equivalent or better terms than the prior lease, or at all, or successfully reposition the space for other uses.
If any lease expires or is terminated, we could be responsible for all of the operating expenses for that portion of the property until it is re-leased. If we experience a significant number of un-leased spaces, our operating expenses could increase significantly. Any significant increase in our operating expenses may have a material adverse effect on our business, financial condition and results of operations, our ability to make distributions to our shareholders and the trading price of our common shares.
Any bankruptcy filing by or relating to one of our tenants could bar all efforts by us to collect pre-bankruptcy debts from that tenant or seize its property. A tenant bankruptcy could also delay our efforts to collect past due balances under the leases and could ultimately preclude collection of all or a portion of these sums. It is possible that we may recover substantially less than the full value of any unsecured claims we hold, if any, which may have a material adverse effect on our business, financial condition and results of operations, our ability to make distributions to our shareholders. Furthermore, dealing with a tenant’s bankruptcy or other default may divert management’s attention and cause us to incur substantial legal and other costs.
If one or more of our tenants files for bankruptcy relief, the Bankruptcy Code provides that a debtor has the option to assume or reject the unexpired lease within a certain period of time. The Bankruptcy Code generally requires that a debtor must assume or reject a contract in its entirety. Thus, a debtor cannot choose to keep the beneficial provisions of a contract while rejecting the burdensome ones; the contract must be assumed or rejected as a whole. However, where under applicable law a contract (even though it is contained in a single document) is determined to be divisible or severable into different agreements, or similarly, where a collection of documents is determined to constitute separate agreements instead of a single, integrated contract, then in those circumstances a debtor/trustee may be allowed to assume some of the divisible or separate agreements while rejecting the others.
Uninsured losses relating to real property or excessively expensive premiums for insurance coverage may adversely affect our returns.
We attempt to adequately insure all of our properties to cover casualty losses. However, there are types of losses, generally catastrophic in nature, such as losses due to wars, acts of terrorism, earthquakes, floods, hurricanes, pollution or environmental matters, which are uninsurable or not economically insurable, or may be insured subject to limitations, such as large deductibles or co-payments. Insurance risks associated with potential terrorism acts could sharply increase the premiums we pay for coverage against property and casualty claims. In some instances, we may be required to provide other financial
support, either through financial assurances or self-insurance, to cover potential losses. We cannot assure you that we will have adequate coverage for these losses. Also, to the extent we must pay unexpectedly large insurance premiums, we could suffer reduced earnings that would result in less cash to be distributed to shareholders as dividends.
Discovery of previously undetected environmentally hazardous conditions may adversely affect our operating results.
Under various federal, state and local environmental laws, ordinances and regulations, a current or previous owner or operator of real property may be liable for the cost of removal or remediation of hazardous or toxic substances on, under or in its property. The costs of removal or remediation could be substantial. These laws often impose liability whether or not the owner or operator knew of, or was responsible for, the presence of any hazardous or toxic substances. Environmental laws also may impose restrictions on the manner in which property may be used or businesses may be operated, and these restrictions may require substantial expenditures. Environmental laws provide for sanctions in the event of noncompliance and may be enforced by governmental agencies or, in certain circumstances, by private parties. Certain environmental laws and common
8
law principles could be used to impose liability for release of and exposure to hazardous substances, including asbestos containing materials into the air. In addition, third parties may seek recovery from owners or operators of real properties for personal injury or property damage associated with exposure to released hazardous substances. The cost of defending against claims of liability, of compliance with environmental regulatory requirements, of remediating any contaminated property, or of paying personal injury claims could materially adversely affect our business, assets or results of operations and, consequently, amounts available for payments of dividends to our shareholders.
We may not be successful in identifying and consummating suitable acquisitions or investment opportunities, which may impede our growth and negatively affect our results of operations.
Our ability to expand through acquisitions is integral to our business strategy and requires us to identify suitable acquisition or investment opportunities that meet our criteria and are compatible with our growth strategy. We may not be successful in identifying suitable properties or other assets that meet our acquisition criteria or in consummating acquisitions or investments on satisfactory terms or at all. Failure to identify or consummate acquisitions or investment opportunities, or to integrate successfully any acquired properties without substantial expense, delay or other operational or financial problems, would slow our growth.
Our ability to acquire properties on favorable terms may be constrained by the following significant risks:
• | competition from other real estate investors with significant capital, including other publicly-traded REITs and institutional investment funds; |
• | competition from other potential acquirers which may significantly increase the purchase price for a property we acquire, which could reduce our growth prospects; |
• | unsatisfactory results of our due diligence investigations or failure to meet other customary closing conditions; and |
• | failure to finance an acquisition on favorable terms or at all. |
If any of these risks are realized, our business, financial condition and results of operations, our ability to make distributions to our shareholders.
We may face significant competition in our efforts to acquire financially distressed properties and debt.
Our acquisition strategy is focused on distressed commercial real estate, and we could face significant competition from other investors, such as publicly-traded REITs, hedge funds, private equity funds and other private real estate investors with greater financial resources and access to capital than us. Therefore, we may not be able to compete successfully for investments. In addition, the number of entities and the amount of purchasers competing for suitable investments may increase, all of which could result in competition for accretive acquisition opportunities and adversely affect our business plan and our ability to maintain our current dividend rate.
Our success depends in part on our ability to execute our Community Centered Property strategy.
Our Community Centered Property strategy requires intensive management of a large number of small spaces and small tenant relationships. Our success will depend in part upon our management’s ability to identify potential Community Centered Properties and find and maintain the appropriate tenants to create such a property. Lack of market acceptance of our Community Centered Property strategy or our inability to successfully attract and manage a large number of tenant relationships could adversely affect our occupancy rates, operating results and dividend rate.
Loss of our key personnel, particularly our eight senior managers, could threaten our ability to execute our strategy and operate our business successfully.
We are dependent on the experience and knowledge of our key executive personnel, particularly our eight senior managers who have been instrumental in setting our strategic direction, operating our business, identifying, recruiting and training key personnel and arranging necessary financing. Losing the services of any of these individuals could adversely affect our business until qualified replacements could be found. We also believe that they could not quickly be replaced with managers of equal experience and capabilities and their successors may not be as effective.
Our systems may not be adequate to support our growth, and our failure to successfully oversee our portfolio of properties
9
could adversely affect our results of operations.
We cannot assure you that we will be able to adapt our portfolio management, administrative, accounting and operational systems, or hire and retain sufficient operational staff, to support any growth we may experience. Our failure to successfully oversee our current portfolio of properties or any future acquisitions or developments could have a material adverse effect on our results of operations and financial condition and our ability to make distributions.
There can be no assurance that we will be able to pay or maintain cash dividends or that dividends will increase over time.
There are many factors that can affect the availability and timing of cash dividends to shareholders. Dividends will be based principally on cash available from our properties, real estate securities, mortgage loans and other investments. The amount of cash available for dividends will be affected by many factors, such as our ability to buy properties, the yields on securities of other real estate programs that we invest in, and our operating expense levels, as well as many other variables. We can give no assurance that we will be able to pay or maintain dividends or that dividends will increase over time. In addition, we can give no assurance that rents from the properties will increase, that the securities we buy will increase in value or provide constant or increased dividends over time, or that future acquisitions of real properties, mortgage loans or our investments in securities will increase our cash available for dividends to shareholders. Our actual results may differ significantly from the assumptions used by our board of trustees, or our board, in establishing the dividend rate to shareholders.
If we experience decreased cash flows, we may need to use other sources of cash to fund dividends or we may be unable to pay dividends.
Actual cash available for dividends may vary substantially from estimates. If our cash dividends exceed the amount of cash available for dividends, we may need to fund the shortage out of working capital or by obtaining additional debt, which would reduce the amount of proceeds available for real estate investments.
Our assets may be subject to impairment charges.
We periodically evaluate our real estate investments and other assets for impairment indicators. The judgment regarding the existence of impairment indicators is based on factors such as market conditions, tenant performance and legal structure. If we determine that a significant impairment has occurred, we would be required to make an adjustment to the net carrying value of the asset, which could have a material adverse effect on our results of operations and funds from operations in the period in which the write-off occurs.
Recent healthcare reform legislation may affect our revenue and financial condition.
On March 23, 2010, the President signed into law the Patient Protection and Affordable Care Act of 2010 and on March 30, 2010, the President signed into law the Health Care and Education Reconciliation Act, which in part modified the Patient Protection and Affordable Care Act. Together, the two Acts serve as the primary vehicle for comprehensive health care reform in the United States. The Acts are intended to reduce the number of individuals in the United States without health insurance and effect significant other changes to the ways in which health care is organized, delivered and reimbursed. The complexities and ramifications of the new legislation are significant, and will be implemented in a phased approach beginning in 2010 and concluding in 2018. At this time, the effects of health care reform and its impact on our business, our revenues and financial condition and those of our tenants are not yet known. Accordingly, the reform could adversely affect the cost of providing healthcare coverage generally and the financial success of our tenants and consequently us.
Risks Associated with Our Indebtedness and Financing
Current market conditions could adversely affect our ability to refinance existing indebtedness or obtain additional financing for growth on acceptable terms or at all, which could adversely affect our ability to grow, our interest cost and our results of operations.
The United States credit markets have recently experienced significant dislocations and liquidity disruptions, including the bankruptcy, insolvency or restructuring of certain financial institutions. These circumstances have materially impacted liquidity in the debt markets, making financing terms for borrowers less attractive, and in certain cases have resulted in the unavailability of various types of debt financing. Reductions in our available borrowing capacity, or inability to establish a credit facility when required or when business conditions warrant, could have a material adverse effect on our business, financial condition and results of operations. In addition, we mortgage most of our properties to secure payment of indebtedness. If we are not successful in refinancing our mortgage debt upon maturity, then the property could be foreclosed
10
upon or transferred to the mortgagee, or we might be forced to dispose of some of our properties upon disadvantageous terms, with a consequent loss of income and asset value. A foreclosure or disadvantageous disposal on one or more of our properties could adversely affect our ability to grow, financial condition, interest cost, results of operations, cash flow and ability to pay dividends to our shareholders.
Furthermore, if prevailing interest rates or other factors at the time of refinancing result in higher interest rates upon refinancing, then the interest expense relating to that refinanced indebtedness would increase. Higher interest rates on newly incurred debt may negatively impact us as well. If interest rates increase, our interest costs and overall costs of capital will increase, which could adversely affect our transaction and development activity, financial condition, results of operation, cash flow, our ability to pay principal and interest on our debt and our ability to pay dividends to our shareholders.
If we invest in mortgage loans, such investments may be affected by unfavorable real estate market conditions, including interest rate fluctuations, which could decrease the value of those loans and our results of operations.
If we invest in mortgage loans, we will be at risk of defaults by the borrowers on those mortgage loans as well as interest rate risks. To the extent we incur delays in liquidating such defaulted mortgage loans, we may not be able to obtain sufficient proceeds to repay all amounts due to us under the mortgage loans. Further, we will not know whether the values of the properties securing the mortgage loans will remain at the levels existing on the dates of origination of those mortgage loans. If the values of the underlying properties fall, our risk will increase because of the lower value of the security associated with such loans.
We may incur losses on interest rate hedging arrangements.
Periodically, we have entered into agreements to reduce the risks associated with increases in interest rates, and may continue to do so. Although these agreements may partially protect against rising interest rates, they also may reduce the benefits to us if interest rates decline. If a hedging arrangement is not indexed to the same rate as the indebtedness which is hedged, we may be exposed to losses to the extent which the rate governing the indebtedness and the rate governing the hedging arrangement change independently of each other. Finally, nonperformance by the other party to the hedging arrangement may subject us to increased credit risks.
Our failure to hedge effectively against interest rate changes may adversely affect results of operations.
We currently have mortgages that bear interest at a variable rate and we may incur additional variable rate debt in the future. Accordingly, increases in interest rates on variable rate debt would increase our interest expense, which could reduce net earnings and cash available for payment of our debt obligations and distributions to our shareholders.
We may seek to manage our exposure to interest rate volatility by using interest rate hedging arrangements, such as interest cap agreements and interest rate swap agreements. These agreements involve risks, such as the risk that counterparties may fail to honor their obligations under these arrangements, that these arrangements may not be effective in reducing our exposure to interest rate changes and that a court could rule that such an agreement is not legally enforceable. In the past, we have used derivative financial instruments to hedge interest rate risks related to our variable rate borrowings. We will not use derivatives for speculative or trading purposes and intend only to enter into contracts with major financial institutions based on their credit rating and other factors, but we may choose to change this practice in the future. We may enter into interest rate swap agreements for our variable rate debt, which totals $25.4 million as of December 31, 2010. Hedging may reduce the overall returns on our investments. Failure to hedge effectively against interest rate changes may materially adversely affect our results of operations.
We currently have and may incur additional mortgage indebtedness and other borrowings, which may increase our business risks and our ability to make distributions to our shareholders.
If it is determined to be in our best interests, we may, in some instances, acquire real properties by using either existing financing or borrowing new funds. In addition, we may incur or increase our current mortgage debt to obtain funds to acquire additional properties. We may also borrow funds if necessary to satisfy the REIT distribution requirement, or otherwise as may be necessary or advisable to assure that we maintain our qualification as a REIT for federal income tax purposes.
We may incur mortgage debt on a particular property if we believe the property’s projected cash flow is sufficient to service the mortgage debt. As of December 31, 2010, we had approximately $100.9 million of mortgage debt secured by 23 of our properties. If there is a shortfall in cash flow, however, the amount available for dividends to shareholders may be affected. In addition, incurring mortgage debt increases the risk of loss because defaults on such indebtedness may result in loss of
11
property in foreclosure actions initiated by lenders. For tax purposes, a foreclosure of any of our properties would be treated as a sale of the property for a purchase price equal to the outstanding balance of the debt secured by the mortgage. If the outstanding balance of the debt secured by the mortgage exceeds our tax basis in the property, we would recognize taxable income on foreclosure, but would not receive any cash proceeds. We may give lenders full or partial guarantees for mortgage debt incurred by the entities that own our properties. When we give a guaranty on behalf of an entity that owns one of our properties, we will be responsible to the lender for satisfaction of the debt if it is not paid by that entity. If any mortgages contain cross-collateralization or cross-default provisions, there is a risk that more than one property may be affected by a default. If any of our properties are foreclosed upon due to a default, our ability to pay cash dividends to our shareholders will be adversely affected. For more discussion, see “Management’s Discussion and Analysis of Financial Condition and Results of Operations – Liquidity and Capital Resources.”
If we set aside insufficient working capital or are unable to secure funds for future tenant improvements, we may be required to defer necessary property improvements, which could adversely impact our ability to pay cash distributions to our shareholders.
When tenants do not renew their leases or otherwise vacate their space, it is possible that, in order to attract replacement tenants, we may be required to expend substantial funds for tenant improvements and tenant refurbishments to the vacated space. If we have insufficient working capital reserves, we will have to obtain financing from other sources. Because most of our leases will provide for tenant reimbursement of operating expenses, we do not anticipate that we will establish a permanent reserve for maintenance and repairs for our properties. However, to the extent that we have insufficient funds for such purposes, we may establish reserves for maintenance and repairs of our properties out of cash flow generated by operating properties or out of non-liquidating net sale proceeds. If these reserves or any reserves otherwise established are insufficient to meet our cash needs, we may have to obtain financing from either affiliated or unaffiliated sources to fund our cash requirements. We cannot assure you that sufficient financing will be available or, if available, will be available on economically feasible terms or on terms acceptable to us. Additional borrowing for working capital purposes will increase our interest expense, and therefore our financial condition and our ability to pay cash distributions to our shareholders may be adversely affected. In addition, we may be required to defer necessary improvements to our properties that may cause our properties to suffer from a greater risk of obsolescence or a decline in value, or a greater risk of decreased cash flow as a result of fewer potential tenants being attracted to our properties. If this happens, we may not be able to maintain projected rental rates for effected properties, and our results of operations may be negatively impacted.
We may structure acquisitions of property in exchange for limited partnership units in our Operating Partnership on terms that could limit our liquidity or our flexibility.
We may acquire properties by issuing limited partnership units in our Operating Partnership in exchange for a property owner contributing property to the Operating Partnership. If we enter into such transactions, in order to induce the contributors of such properties to accept units in our Operating Partnership, rather than cash, in exchange for their properties, it may be necessary for us to provide them with additional incentives. For instance, our Operating Partnership’s limited partnership agreement provides that any holder of units may exchange limited partnership units for cash, or, at our option, common shares on a one-for-one exchange basis. We may, however, enter into additional contractual arrangements with contributors of property under which we would agree to redeem a contributor’s units for our common shares or cash, at the option of the contributor, at set times. If the contributor required us to redeem units for cash pursuant to such a provision, it would limit our liquidity and thus our ability to use cash to make other investments, satisfy other obligations or pay distributions. Moreover, if we were required to redeem units for cash at a time when we did not have sufficient cash to fund the redemption, we might be required to sell one or more properties to raise funds to satisfy this obligation. Furthermore, we might agree that if distributions the contributor received as a limited partner in our Operating Partnership did not provide the contributor with a defined return, then upon redemption of the contributor’s units we would pay the contributor an additional amount necessary to achieve that return. Such a provision could further negatively impact our liquidity and flexibility. Finally, in order to allow a contributor of a property to defer taxable gain on the contribution of property to our Operating Partnership, we might agree not to sell a contributed property for a defined period of time or until the contributor exchanged the contributor’s units for cash or our common shares. Such an agreement would prevent us from selling those properties, even if market conditions made such a sale favorable to us.
Our ability to issue preferred shares may include a preference in distributions superior to our common shares and also may deter or prevent a sale of our common shares in which you could profit.
Our declaration of trust authorizes our Board to issue up to 50,000,000 shares of preferred shares. Our Board has the discretion to establish the preferences and rights, including a preference in distributions superior to our common shareholders, of any issued preferred shares. If we authorize and issue preferred shares with a distribution preference over our common
12
shares, payment of any distribution preferences of outstanding preferred shares would reduce the amount of funds available for the payment of distributions on our common shares. Further, holders of preferred shares are normally entitled to receive a preference payment in the event we liquidate, dissolve or wind up before any payment is made to our common shareholders, likely reducing the amount our common shareholders would otherwise receive upon such an occurrence. In addition, under certain circumstances, the issuance of preferred shares or a separate class or series of common shares may render more difficult or tend to discourage:
• | a merger, tender offer or proxy contest; |
• | assumption of control by a holder of a large block of our shares; or |
• | removal of incumbent management. |
Risks Associated with Income Tax Laws
If we fail to qualify as a REIT, our operations and dividends to shareholders would be adversely impacted.
We intend to continue to be organized and to operate so as to qualify as a REIT under the Code. A REIT generally is not taxed at the corporate level on income it currently distributes to its shareholders. Qualification as a REIT involves the application of highly technical and complex rules for which there are only limited judicial or administrative interpretations. The determination of various factual matters and circumstances not entirely within our control may affect our ability to continue to qualify as a REIT. In addition, new legislation, new regulations, administrative interpretations or court decisions could significantly change the tax laws, possibly with retroactive effect, with respect to qualification as a REIT or the federal income tax consequences of such qualification.
If we were to fail to qualify as a REIT in any taxable year:
• | we would not be allowed to deduct our distributions to shareholders when computing our taxable income; |
• | we would be subject to federal income tax (including any applicable alternative minimum tax) on our taxable income at regular corporate rates; |
• | we would be disqualified from being taxed as a REIT for the four taxable years following the year during which qualification was lost, unless entitled to relief under certain statutory provisions; |
• | our cash available for dividends to shareholders would be reduced; and |
• | we may be required to borrow additional funds or sell some of our assets in order to pay corporate tax obligations that we may incur as a result of our disqualification. |
If the Internal Revenue Service, or IRS, were to determine that (i) we failed the 5% asset test for the first quarter of our 2009 taxable year and (ii) our failure of that test was not attributable to reasonable cause, but rather, willful neglect, we would fail to qualify as a REIT for our 2009 taxable year, which would adversely affect our operations and our shareholders.
We recently discovered that we may have inadvertently violated the 5% asset test for the quarter ended March 31, 2009 as a result of utilizing a certain cash management arrangement with a commercial bank. If this investment in a commercial paper investment account is not treated as cash, and is instead treated as a security for purposes of the quarterly 5% asset test applicable to REITs, then we have failed that test for the first quarter of our 2009 taxable year.
If the IRS were to assert that we failed the 5% asset test for the first quarter of our 2009 taxable year and that such failure was not due to reasonable cause, and the courts were to sustain that position, our status as a REIT would terminate as of December 31, 2008. We would not be eligible to again elect REIT status until our 2014 taxable year. Consequently, we would be subject to federal income tax on our taxable income at regular corporate rates and our cash available for distributions to shareholders would be reduced.
Additionally, if we in fact failed the 5% test, but failure is considered due to reasonable cause and not willful neglect, we would be subject to a tax equal to the greater of $50,000 or 35% of the net income from the commercial paper investment account during the period in which we failed to satisfy the 5% asset test. The amount of such tax is $50,000 and we paid such tax on April 27, 2010.
13
We may need to incur additional borrowings to meet the REIT minimum distribution requirement and to avoid excise tax.
In order to maintain our qualification as a REIT, we are required to distribute to our shareholders at least 90% of our annual real estate investment trust taxable income (excluding any net capital gain and before application of the dividends paid deduction). In addition, we are subject to a 4% nondeductible excise tax on the amount, if any, by which certain distributions paid by us with respect to any calendar year are less than the sum of (i) 85% of our ordinary income for that year, (ii) 95% of our net capital gain for that year and (iii) 100% of our undistributed taxable income from prior years. Although we intend to pay dividends to our shareholders in a manner that allows us to meet the 90% distribution requirement and avoid this 4% excise tax, we cannot assure you that we will always be able to do so.
Our income consists almost solely of our share of our Operating Partnership’s income, and the cash available for distribution by us to our shareholders consists of our share of cash distributions made by our Operating Partnership. Because we are the sole general partner of our Operating Partnership, our Board determines the amount of any distributions made by it. Our Board may consider a number of factors in making distributions, including:
• | the amount of the cash available for distribution; |
• | our Operating Partnership’s financial condition; |
• | our Operating Partnership’s capital expenditure requirements; and |
• | our annual distribution requirements necessary to maintain our qualification as a REIT. |
Differences in timing between the actual receipt of income and actual payment of deductible expenses and the inclusion of income and deduction of expenses when determining our taxable income, as well as the effect of nondeductible capital expenditures and the creation of reserves or required debt amortization payments could require us to borrow funds on a short-term or long-term basis or make taxable distributions to our shareholders of our shares or debt securities to meet the REIT distribution requirement and to avoid the 4% excise tax described above. In these circumstances, we may need to borrow funds to avoid adverse tax consequences even if our management believes that the then prevailing market conditions generally are not favorable for borrowings or that borrowings would not be advisable in the absence of the tax consideration.
If our Operating Partnership were classified as a “publicly traded partnership” taxable as a corporation for federal income tax purposes under the Code, we would cease to qualify as a REIT and would suffer other adverse tax consequences.
We structured our Operating Partnership so that it would be classified as a partnership for federal income tax purposes. In this regard, the Code generally classifies “publicly traded partnerships” (as defined in Section 7704 of the Code) as associations taxable as corporations (rather than as partnerships), unless substantially all of their taxable income consists of specified types of passive income. In order to minimize the risk that the Code would classify our Operating Partnership as a “publicly traded partnership” for tax purposes, we placed certain restrictions on the transfer and/or redemption of partnership units in our Operating Partnership. If the Internal Revenue Service, or IRS, were to assert successfully that our Operating Partnership is a “publicly traded partnership,” and substantially all of its gross income did not consist of the specified types of passive income, the Code would treat our Operating Partnership as an association taxable as a corporation.
In such event, the character of our assets and items of gross income would change and would prevent us from continuing to qualify as a REIT. In addition, the imposition of a corporate tax on our Operating Partnership would reduce our amount of cash available for payment of distributions by us to our shareholders.
Complying with REIT requirements may cause us to forego otherwise attractive opportunities or liquidate otherwise attractive investments.
To qualify as a REIT for federal income tax purposes, we must continually satisfy tests concerning, among other things, the sources of our income, the nature and diversification of our assets, the amounts we distribute to our shareholders and the ownership of our shares. In order to meet these tests, we may be required to forego investments we might otherwise make. Thus, compliance with the REIT requirements may hinder our performance.
In particular, we must ensure that at the end of each calendar quarter, at least 75% of the value of our assets consists of cash, cash items, government securities and qualified real estate assets. The remainder of our investment in securities (other than government securities and qualified real estate assets) generally cannot include more than 10% of the outstanding voting
14
securities of any one issuer or more than 10% of the total value of the outstanding securities of any one issuer. In addition, in general, no more than 5% of the value of our assets (other than government securities and qualified real estate assets) can consist of the securities of any one issuer, and no more than 25% of the value of our total assets can be represented by the securities of one or more taxable REIT subsidiaries. If we fail to comply with these requirements at the end of any calendar quarter, we must correct the failure within 30 days after the end of the calendar quarter or qualify for certain statutory relief provisions to avoid losing our REIT qualification and suffering adverse tax consequences. As a result, we may be required to liquidate otherwise attractive investments. These actions could have the effect of reducing our income and amounts available for distribution to our shareholders.
We may be subject to adverse legislative or regulatory tax changes that could reduce the market price of our common shares.
At any time, the federal income tax laws governing REITs or the administrative interpretations of those laws may be amended. We cannot predict when or if any new federal income tax law, regulation, or administrative interpretation, or any amendment to any existing federal income tax law, regulation or administrative interpretation, will be adopted, promulgated or become effective and any such law, regulation, or interpretation may take effect retroactively. We and our shareholders could be adversely affected by any such change in, or any new, federal income tax law, regulation or administrative interpretation.
Dividends payable by REITs do not qualify for the reduced tax rates available for some dividends.
The maximum tax rate applicable to income from “qualified dividends” payable to U.S. shareholders that are individuals, trusts and estates has been reduced by legislation to 15% (through the end of 2010). Dividends payable by REITs, however, generally are not eligible for the reduced rates. Although this legislation does not adversely affect the taxation of REITs or dividends payable by REITs, the more favorable rates applicable to regular corporate qualified dividends could cause investors who are individuals, trusts and estates to perceive investments in REITs to be relatively less attractive than investments in the stocks of non-REIT corporations that pay dividends, which could adversely affect the value of the shares of REITs, including our common shares.
Complying with REIT requirements may limit our ability to hedge effectively and may cause us to incur tax liabilities.
The REIT provisions of the Code substantially limit our ability to hedge our liabilities. Any income from a hedging transaction that we enter into to manage risk of interest rate changes, price changes or currency fluctuations with respect to borrowings made or to be made to acquire or carry real estate assets does not constitute “gross income” for purposes of the 75% or 95% gross income tests. To the extent that we enter into other types of hedging transactions, the income from those transactions is likely to be treated as non-qualifying income for purposes of both of the gross income tests. As a result of these rules, we may need to limit our use of advantageous hedging techniques or implement those hedges through taxable REIT subsidiaries. This could increase the cost of our hedging activities because any taxable REIT subsidiary that we may form would be subject to tax on gains or expose us to greater risks associated with changes in interest rates than we would otherwise want to bear. In addition, losses in taxable REIT subsidiaries will generally not provide any tax benefit, except for being carried forward against future taxable income in the taxable REIT subsidiaries.
Risks Related to Ownership of our Common Shares
Maryland takeover statutes may deter others from seeking to acquire us and prevent you from making a profit in such transactions.
The Maryland General Corporation Law, or the MGCL, contains many provisions, such as the business combination statute and the control share acquisition statute, that are designed to prevent, or have the effect of preventing, someone from acquiring control of us. Our Board can amend our bylaws, without shareholder approval, to exempt us from the control share acquisition statute (which eliminates voting rights for certain levels of shares that could exercise control over us), and our Board has adopted a resolution opting out of the business combination statute (which, among other things, prohibits a merger or consolidation with a 10.0% shareholder for a period of time) with respect to our affiliates. However, if these provisions of Maryland law were to apply, they could delay or prevent offers to acquire us and increase the difficulty of consummating any such offers, even if such a transaction would be in our shareholders’ best interest.
The MGCL, Maryland REIT Law and our organizational documents limit your right to bring claims against our officers and trustees.
The MGCL and the Maryland REIT Law provide that a trustee will not have any liability as a trustee so long as he
15
performs his duties in good faith, in a manner he reasonably believes to be in our best interest, and with the care that an ordinarily prudent person in a like position would use under similar circumstances. In addition, our declaration of trust provides that we may indemnify our trustees and officers to the maximum extent allowed by Maryland law. Under the MGCL and the Maryland REIT law, no trustee or officer will be liable to us or to any shareholder for money damages except to the extent that (a) the trustee or officer actually received an improper benefit or profit in money, property or services, for the amount of the benefit or profit in money, property, or services actually received; or (b) a judgment or the final adjudication adverse to the trustee or officer is entered in a proceeding based on a finding in the proceeding the trustee’s or officer’s action or failure to act was the result of active and deliberate dishonesty and was material to the cause of action adjudicated in the proceeding.
Our classified Board may prevent others from effecting a change in the control of our Board.
We believe that classification of our Board will help to assure the continuity and stability of our business strategies and policies as determined by the Board. However, the classified board provision could have the effect of making the replacement of incumbent trustees more time-consuming and difficult. At least two annual meetings of shareholders, instead of one, will generally be required to effect a change in a majority of our Board. Thus, the classified board provision could increase the likelihood that incumbent trustees will retain their positions. The staggered terms of trustees may delay, defer or prevent a transaction or a change in control that might involve a premium price for our common shares or otherwise be in the best interest of the shareholders.
Additional issuances of equity securities may be dilutive to stockholders.
The interests of our stockholders could be diluted if we issue additional equity securities to finance future developments or acquisitions or to repay indebtedness. We may authorize the issuance of additional equity securities without stockholder approval. Our ability to execute our business strategy depends upon our access to an appropriate blend of debt financing, including revolving credit facilities and other forms of secured and unsecured debt, and equity financing, including the issuance of common equity.
Broad market fluctuations could negatively impact the market price of our Class B common shares.
The stock market has experienced extreme price and volume fluctuations that have affected the market price of many companies in industries similar or related to ours and that have been unrelated to these companies' operating performances. These broad market fluctuations could reduce the market price of our Class B common shares. Furthermore, our operating results and prospects may be below the expectations of public market analysts and investors or may be lower than those of companies with comparable market capitalizations. Either of these factors could lead to a material decline in the market price of our Class B common shares.
16
Item 1B. Unresolved Staff Comments
Not applicable
Item 2. Properties.
General
As of December 31, 2010, we owned 38 commercial properties, including 31 properties in Houston, two properties in Dallas, one property in Windcrest, Texas, a suburb of San Antonio, three properties in the Scottsdale and Phoenix, Arizona metropolitan areas, and one property in Buffalo Grove, Illinois, a suburb of Chicago.
Our tenants consist of national, regional and local businesses. Our properties generally attract a mix of tenants who provide basic staples, convenience items and services tailored to the specific cultures, needs and preferences of the surrounding community. These types of tenants are the core of our strategy of creating Whitestone-branded Community Centered Properties. We also believe daily sales of these basic items are less sensitive to fluctuations in the business cycle than higher priced retail items. Our largest tenant represented only 1.9% of total revenues for the year ended December 31, 2010.
We directly manage the operations and leasing of our properties. Substantially all of our revenues consist of base rents received under leases that generally have terms that range from less than one year to 15 years. Approximately 66% of our existing leases as of December 31, 2010 contain “step up” rental clauses that provide for increases in the base rental payments. The following table summarizes certain information relating to our properties as of December 31, 2010:
Commercial Properties | Leasable Square Feet | Average Occupancy as of 12/31/10 | Annualized Base Rental Revenue (in thousands) (1) | Average Annualized Base Rental Revenue Per Sq. Ft. (2) | ||||||||||
Retail | 1,188,830 | 88 | % | $ | 9,843 | $ | 9.41 | |||||||
Office/Flex | 1,201,672 | 88 | % | 7,670 | 7.25 | |||||||||
Office | 631,841 | 79 | % | 8,084 | 16.20 | |||||||||
Total - Operating Portfolio | 3,022,343 | 86 | % | 25,597 | 9.85 | |||||||||
Redevelopment, New Acquisitions (3) | 139,677 | 40 | % | 612 | 10.95 | |||||||||
Total | 3,162,020 | 84 | % | $ | 26,209 | $ | 9.87 | |||||||
(1) Calculated as the tenant's actual December 31, 2010 base rent multiplied by 12. Excludes vacant space as of December 31, 2010. Because annualized base rental revenue is not derived from historical results that were accounted for in accordance with generally accepted accounting principles, historical results differ from the annualized amounts.
(2) Calculated as annualized base rent divided by net rentable square feet leased at December 31, 2010. Excludes vacant space as of December 31, 2010.
(3) Includes (i) new acquisitions, through the earlier of attainment of 90% occupancy or 18 months of ownership, and (ii) properties which are undergoing significant redevelopment or re-tenanting.
As of December 31, 2010, we had one property that accounted for more than 10% of total gross revenue. Uptown Tower is an office building located in Dallas, Texas and accounts for 12.0%, 11.9% and 12.8% of our total revenue for the years ended December 31, 2010, 2009 and 2008, respectively. Uptown Tower also accounts for 10.2%, 10.9% and 11.5% of our real estate assets, net of accumulated depreciation, for the years ended December 31, 2010, 2009 and 2008, respectively.
Location of Properties
Of our 38 properties, 34 are located in Texas, with 31 being located in the greater Houston metropolitan statistical area. These 31 properties represent 76% of our revenue for the year ended December 31, 2010.
The Houston workforce is concentrated in energy, chemicals, information technology, aerospace sciences and medical
17
sciences. According to the United States Census Bureau, Houston ranked 4th in the largest United States cities as of July 1, 2009. In the Census Bureau’s Estimates of Population Change for Metropolitan Statistical Areas and Rankings: July 1, 2008 to July 1, 2009, Houston ranked second in population growth out of 366 metropolitan statistical areas. According to the Bureau of Labor of Statistics, the unemployment rate in Houston was less than the national average in each of the last six months of 2010.
July | Aug. | Sept. | Oct. | Nov. | Dec. | |||||||||||||
National (1) | 9.5 | % | 9.6 | % | 9.6 | % | 9.7 | % | 9.8 | % | 9.4 | % | ||||||
Houston (2) | 8.8 | 8.7 | 8.2 | 8.2 | 8.6 | 8.3 | ||||||||||||
(1) Seasonally adjusted.
(2) Not seasonally adjusted.
Source: Bureau of Labor Statistics
18
General Physical and EconomicAttributes
The following table sets forth certain information relating to each of our properties owned as of December 31, 2010.
Property Name | Location | Year Built/ Renovated | Leasable Square Feet | Percent Occupied at 12/31/10 | Annualized Base Rental Revenue (in thousands) (1) | Average Base Rental Revenue Per Sq. Ft. (2) | ||||||||||||
Retail Properties: | ||||||||||||||||||
Bellnott Square | Houston | 1982 | 73,930 | 35 | % | $ | 266 | $ | 10.28 | |||||||||
Bissonnet/Beltway | Houston | 1978 | 29,205 | 95 | % | 256 | 9.23 | |||||||||||
Centre South | Houston | 1974 | 39,134 | 82 | % | 312 | 9.72 | |||||||||||
Greens Road | Houston | 1979 | 20,507 | 85 | % | 145 | 8.32 | |||||||||||
Holly Knight | Houston | 1984 | 20,015 | 100 | % | 326 | 16.29 | |||||||||||
Kempwood Plaza | Houston | 1974 | 101,008 | 100 | % | 876 | 8.67 | |||||||||||
Lion Square | Houston | 1980 | 119,621 | 99 | % | 801 | 6.76 | |||||||||||
Providence | Houston | 1980 | 90,327 | 99 | % | 786 | 8.79 | |||||||||||
Shaver | Houston | 1978 | 21,926 | 98 | % | 239 | 11.12 | |||||||||||
South Richey | Houston | 1980 | 69,928 | 94 | % | 548 | 8.34 | |||||||||||
Spoerlein Commons | Chicago | 1987 | 41,455 | 90 | % | 733 | 19.65 | |||||||||||
SugarPark Plaza | Houston | 1974 | 95,032 | 100 | % | 935 | 9.84 | |||||||||||
Sunridge | Houston | 1979 | 49,359 | 89 | % | 429 | 9.77 | |||||||||||
Torrey Square | Houston | 1983 | 105,766 | 88 | % | 694 | 7.46 | |||||||||||
Town Park | Houston | 1978 | 43,526 | 100 | % | 758 | 17.41 | |||||||||||
Webster Point | Houston | 1984 | 26,060 | 92 | % | 269 | 11.22 | |||||||||||
Westchase | Houston | 1978 | 49,573 | 86 | % | 398 | 9.34 | |||||||||||
Windsor Park | San Antonio | 1992 | 192,458 | 76 | % | 1,072 | 7.33 | |||||||||||
1,188,830 | 88 | % | $ | 9,843 | $ | 9.41 | ||||||||||||
Office/Flex Properties: | ||||||||||||||||||
Brookhill | Houston | 1979 | 74,757 | 89 | % | $ | 257 | $ | 3.86 | |||||||||
Corporate Park Northwest | Houston | 1981 | 185,627 | 70 | % | 1,373 | 10.57 | |||||||||||
Corporate Park West | Houston | 1999 | 175,665 | 92 | % | 1,471 | 9.10 | |||||||||||
Corporate Park Woodland | Houston | 2000 | 99,937 | 92 | % | 792 | 8.61 | |||||||||||
Dairy Ashford | Houston | 1981 | 42,902 | 95 | % | 210 | 5.15 | |||||||||||
Holly Hall | Houston | 1980 | 90,000 | 100 | % | 689 | 7.66 | |||||||||||
Interstate 10 | Houston | 1980 | 151,000 | 95 | % | 693 | 4.83 | |||||||||||
Main Park | Houston | 1982 | 113,410 | 100 | % | 660 | 5.82 | |||||||||||
Plaza Park | Houston | 1982 | 105,530 | 74 | % | 650 | 8.32 | |||||||||||
Westbelt Plaza | Houston | 1978 | 65,619 | 63 | % | 347 | 8.39 | |||||||||||
Westgate | Houston | 1984 | 97,225 | 100 | % | 528 | 5.43 | |||||||||||
1,201,672 | 88 | % | $ | 7,670 | $ | 7.25 | ||||||||||||
Office Properties: | ||||||||||||||||||
9101 LBJ Freeway | Dallas | 1985 | 125,874 | 71 | % | $ | 1,462 | $ | 16.36 | |||||||||
Featherwood | Houston | 1983 | 49,760 | 87 | % | 755 | 17.44 | |||||||||||
Pima Norte | Phoenix | 2007 | 33,417 | 17 | % | 85 | 14.96 | |||||||||||
Royal Crest | Houston | 1984 | 24,900 | 70 | % | 218 | 12.51 | |||||||||||
Uptown Tower | Dallas | 1982 | 253,981 | 88 | % | 3,918 | 17.53 | |||||||||||
Woodlake Plaza | Houston | 1974 | 106,169 | 89 | % | 1,215 | 12.86 | |||||||||||
Zeta Building | Houston | 1982 | 37,740 | 77 | % | 431 | 14.83 | |||||||||||
631,841 | 79 | % | $ | 8,084 | $ | 16.20 | ||||||||||||
Total - Operating Portfolio | 3,022,343 | 86 | % | $ | 25,597 | $ | 9.85 | |||||||||||
The Citadel | Phoenix | 1985 | 28,547 | 16 | % | $ | 85 | $ | 18.61 | |||||||||
Sunnyslope Village | Phoenix | 2000 | 111,130 | 47 | % | 527 | 10.09 | |||||||||||
139,677 | 40 | % | 612 | 10.95 | ||||||||||||||
Grand Totals | 3,162,020 | 84 | % | $ | 26,209 | $ | 9.87 | |||||||||||
19
(1) Calculated as the tenant's actual December 31, 2010 base rent multiplied by 12. Excludes vacant space as of December 31, 2010. Because annualized base rental revenue is not derived from historical results that were accounted for in accordance with generally accepted accounting principles, historical results differ from the annualized amounts.
(2) Calculated as annualized base rent divided by net rentable square feet leased at December 31, 2010. Excludes vacant space at December 31, 2010.
Significant Tenants
The following table sets forth information about our fifteen largest tenants as of December 31, 2010, based upon annualized rental revenues at December 31, 2010.
Tenant Name | Location | Annualized Rental Revenue (in thousands) | Percentage of Total Annualized Base Rental Revenues | Initial Lease Date | Year Expiring | ||||||||
Sports Authority | San Antonio | $ | 495 | 1.9 | % | 1/1/2004 | 2015 | ||||||
Compass Insurance | Dallas | 367 | 1.4 | % | 9/1/2005 | 2013 | |||||||
Brockett Davis Drake Inc. | Dallas | 365 | 1.4 | % | 3/14/1994 | 2011 | |||||||
Air Liquide America, L.P. | Dallas | 363 | 1.4 | % | 8/1/2001 | 2013 | |||||||
Kroger | Houston | 265 | 1.0 | % | 9/1/1999 | 2011 | |||||||
X-Ray X-Press Corporation | Houston | 262 | 1.0 | % | 7/1/1998 | 2019 | |||||||
Petsmart, Inc | San Antonio | 255 | 1.0 | % | 1/1/2004 | 2013 | |||||||
Marshall's | Houston | 248 | 0.9 | % | 5/12/1983 | 2013 | |||||||
Rock Solid Images | Houston | 243 | 0.9 | % | 4/1/2004 | 2012 | |||||||
Merrill Corporation | Dallas | 234 | 0.9 | % | 12/10/2001 | 2014 | |||||||
Eligibility Services | Dallas | 224 | 0.9 | % | 6/6/2000 | 2012 | |||||||
River Oaks L-M, Inc. | Houston | 199 | 0.8 | % | 10/15/1993 | 2011 | |||||||
New Lifestyles, Inc. | Dallas | 192 | 0.7 | % | 5/5/1998 | 2013 | |||||||
Landworks, Inc. | Houston | 178 | 0.7 | % | 6/1/2004 | 2013 | |||||||
The University of Texas Health Science Center | Houston | 177 | 0.7 | % | 7/1/2007 | 2017 | |||||||
$ | 4,067 | 15.6 | % | ||||||||||
20
Lease Expirations
The following table lists, on an aggregate basis, all of our scheduled lease expirations over the next 10 years.
Annualized Base Rent | ||||||||||||||||
Gross Leasable Area | as of December 31, 2010 | |||||||||||||||
Year | Number of Leases | Approximate Square Feet | Percent of Total | Amount (in thousands) | Percent of Total | |||||||||||
2011 | 251 | 670,660 | 21 | % | $ | 6,641 | 25.3 | % | ||||||||
2012 | 159 | 460,412 | 15 | % | 4,898 | 18.7 | % | |||||||||
2013 | 144 | 504,510 | 16 | % | 5,394 | 20.6 | % | |||||||||
2014 | 94 | 327,413 | 10 | % | 3,492 | 13.3 | % | |||||||||
2015 | 71 | 311,924 | 10 | % | 3,026 | 11.5 | % | |||||||||
2016 | 39 | 127,213 | 4 | % | 983 | 3.8 | % | |||||||||
2017 | 8 | 43,725 | 1 | % | 407 | 1.6 | % | |||||||||
2018 | 9 | 55,581 | 2 | % | 365 | 1.4 | % | |||||||||
2019 | 6 | 50,333 | 2 | % | 569 | 2.2 | % | |||||||||
2020 | 3 | 37,907 | 1 | % | 237 | 0.9 | % | |||||||||
Total | 784 | 2,589,678 | 82 | % | $ | 26,012 | 99.3 | % | ||||||||
Insurance
We believe that we have property and liability insurance with reputable, commercially rated companies. We also believe that our insurance policies contain commercially reasonable deductibles and limits, adequate to cover our properties. We expect to maintain this type of insurance coverage and to obtain similar coverage with respect to any additional properties we acquire in the near future. Further, we have title insurance relating to our properties in an aggregate amount that we believe to be adequate.
Regulations
Our properties, as well as any other properties that we may acquire in the future, are subject to various federal, state and local laws, ordinances and regulations. They include, among other things, zoning regulations, land use controls, environmental controls relating to air and water quality, noise pollution and indirect environmental impacts such as increased motor vehicle activity. We believe that we have all permits and approvals necessary under current law to operate our properties.
Item 3. Legal Proceedings.
We are a participant in various legal proceedings and claims that arise in the ordinary course of our business. These matters are generally covered by insurance. While the resolution of these matters cannot be predicted with certainty, we believe that the final outcome of these matters will not have a material effect on our financial position, results of operations or cash flows.
Item 4. Removed and Reserved.
21
PART II
Item 5. Market for Registrant’s Common Equity, Related Shareholder Matters and Issuer Purchases of Equity Securities.
Market Information
Class A Shares
There is no established trading market for our Class A common shares of beneficial interest. As of February 28, 2011, we had 3,471,187 Class A common shares of beneficial interest outstanding held by a total of approximately 1,400 shareholders of record.
Class B Shares
The shares of our Class B common stock were issued and began trading on the NYSE-Amex on August 25, 2010 under the ticker symbol "WSR." As of January 20, 2011, we had 2.2 million Class B common shares of beneficial interest outstanding held by a total of 3,253 shareholders of record.
The following table sets forth the quarterly high, low, and closing prices per share of Class B common stock reported on the NYSE-Amex for the year ended December 31, 2010.
High | Low | Close | ||||||||||
First Quarter | N/A | N/A | N/A | |||||||||
Second Quarter | N/A | N/A | N/A | |||||||||
Third Quarter | $ | 12.03 | $ | 11.32 | $ | 11.74 | ||||||
Fourth Quarter | $ | 14.94 | $ | 11.79 | $ | 14.80 | ||||||
On February 25, 2011, the closing price of our Class B common shares reported on the NYSE-Amex was $14.25 per share.
Issuer Repurchases
We did not repurchase any of our equity securities during 2010 under a share redemption program. Our Board has approved a share redemption program that would enable shareholders to sell shares to us after holding them for at least one year under limited circumstances. Our Board could choose to amend the provisions of the share redemption program without shareholder approval. Our Board has chosen not to implement the share redemption program at this time.
Dividends
In order to remain qualified as a REIT, we are required to distribute at least 90% of our annual taxable income to our shareholders. We currently accrue dividends quarterly and pay dividends in three monthly installments following the end of the quarter. For a discussion of our cash flow as compared to dividends, see “Management’s Discussion and Analysis of Financial Condition and Results of Operations - Liquidity and Capital Resources.”
22
The following table reflects the total dividends we have paid (including the total amount paid and the amount paid per share) in each indicated quarter.
Total Dividends Paid or Payable | ||||||||
Amount Per | Total Amount | |||||||
Common Share / OP Unit | Quarter Paid | (in thousands) | ||||||
$ | 0.3375 | 03/31/2009 | $ | 1,156 | ||||
0.3375 | 06/30/2009 | 1,163 | ||||||
0.3375 | 09/30/2009 | 1,163 | ||||||
0.3375 | 12/31/2009 | 1,163 | ||||||
0.3375 | 03/31/2010 | 1,163 | ||||||
0.3375 | 06/30/2010 | 1,176 | ||||||
0.2850 | 09/30/2010 | 1,203 | ||||||
0.2850 | 12/31/2010 | 1,616 | ||||||
0.2850 | Payable | 1,615 | ||||||
Equity Compensation Plan Information
Please refer to Item 12 of this report for information concerning securities authorized under our incentive share plan.
Performance Graph
The following graph compares the total shareholder returns of WSR to the Standard & Poor's 500 Index (“S&P 500”) and to the Morgan Stanley Capital International US REIT Index ("REIT Index") from August 25, 2010 to December 31, 2010. The graph assumes that the value of the investment in our Class B common shares and in the S&P 500 and NAREIT indices was $100 at August 25, 2010 and that all dividends were reinvested. The price of our Class B common shares on August 25, 2010 (on which the graph is based) was $12.00. The past shareholder return shown on the following graph is not necessarily indicative of future performance.
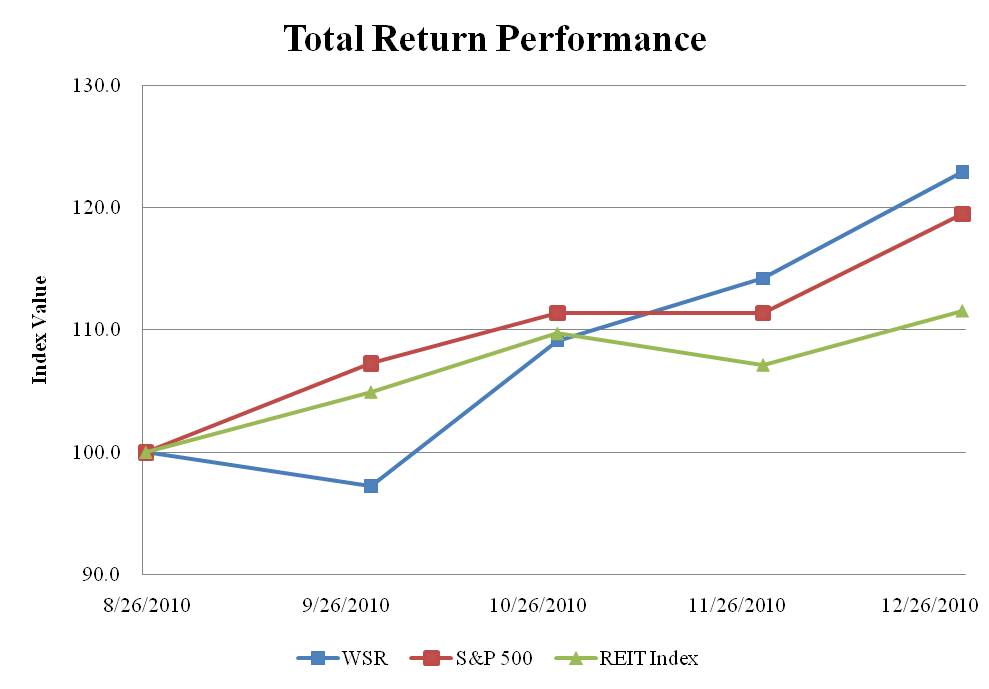
23
Item 6. Selected Financial Data.
The following table sets forth our selected consolidated financial information and should be read in conjunction with “Management’s Discussion and Analysis of Financial Condition and Results of Operations” and our audited consolidated financial statements and the notes thereto, both of which appear elsewhere in this report.
Year Ended December 31, | ||||||||||||||||||||
(in thousands, except per share data) | ||||||||||||||||||||
2010 | 2009 | 2008 | 2007 | 2006 | ||||||||||||||||
Operating Data: | ||||||||||||||||||||
Revenues | $ | 31,533 | $ | 32,685 | $ | 31,201 | $ | 29,374 | $ | 28,378 | ||||||||||
Property expenses | 12,283 | 12,991 | 12,835 | 12,236 | 11,438 | |||||||||||||||
General and administrative | 4,992 | 6,072 | 6,708 | 6,721 | 2,299 | |||||||||||||||
Property and other asset management fees to an affiliate | — | — | — | — | 1,482 | |||||||||||||||
Depreciation and amortization | 7,225 | 6,958 | 6,859 | 6,048 | 6,181 | |||||||||||||||
Involuntary conversion | (558 | ) | (1,542 | ) | 358 | — | — | |||||||||||||
Interest expense, net | 5,592 | 5,713 | 5,675 | 4,825 | 4,910 | |||||||||||||||
Other expense (income), net | — | — | — | 30 | (30 | ) | ||||||||||||||
Income (loss) from continuing operations before loss on disposal of | ||||||||||||||||||||
assets and income taxes | 1,999 | 2,493 | (1,234 | ) | (486 | ) | 2,098 | |||||||||||||
Provision for income taxes | (264 | ) | (222 | ) | (219 | ) | (217 | ) | — | |||||||||||
Loss on disposal of assets | (160 | ) | (196 | ) | (223 | ) | (9 | ) | 197 | |||||||||||
Income (loss) from continuing operations | 1,575 | 2,075 | (1,676 | ) | (712 | ) | 2,295 | |||||||||||||
Income (loss) from discontinued operations | — | — | (188 | ) | 589 | 554 | ||||||||||||||
Gain on sale of properties from discontinued operations | — | — | 3,619 | — | — | |||||||||||||||
Net income (loss) | 1,575 | 2,075 | 1,755 | (123 | ) | 2,849 | ||||||||||||||
Less: net income (loss) attributable to noncontrolling interests | 470 | 733 | 621 | (46 | ) | 1,068 | ||||||||||||||
Net income (loss) attributable to Whitestone REIT | $ | 1,105 | $ | 1,342 | $ | 1,134 | $ | (77 | ) | $ | 1,781 | |||||||||
24
Year Ended December 31, | ||||||||||||||||||||
(in thousands, except per share data) | ||||||||||||||||||||
2010 | 2009 | 2008 | 2007 | 2006 | ||||||||||||||||
Earnings per share - basic | ||||||||||||||||||||
Income (loss) from continuing operations attributable to Whitestone | ||||||||||||||||||||
REIT excluding amounts attributable to unvested restricted shares | $ | 0.27 | $ | 0.41 | $ | (0.32 | ) | $ | (0.13 | ) | $ | 0.45 | ||||||||
Income from discontinued operations attributable to Whitestone REIT | — | — | 0.67 | 0.11 | 0.10 | |||||||||||||||
Net income (loss) attributable to common shareholders excluding | ||||||||||||||||||||
amounts attributable to unvested restricted shares | $ | 0.27 | $ | 0.41 | $ | 0.35 | $ | (0.02 | ) | $ | 0.55 | |||||||||
Earnings per share - diluted | ||||||||||||||||||||
Income (loss) from continuing operations attributable to Whitestone | ||||||||||||||||||||
REIT excluding amounts attributable to unvested restricted shares | $ | 0.27 | $ | 0.40 | $ | (0.32 | ) | $ | (0.04 | ) | $ | 0.45 | ||||||||
Income from discontinued operations attributable to Whitestone REIT | — | — | 0.67 | 0.03 | 0.10 | |||||||||||||||
Net income (loss) attributable to common shareholders excluding | ||||||||||||||||||||
amounts attributable to unvested restricted shares | $ | 0.27 | $ | 0.40 | $ | 0.35 | $ | (0.01 | ) | $ | 0.55 | |||||||||
Balance Sheet Data: | ||||||||||||||||||||
Real estate (net) | $ | 165,398 | $ | 158,398 | $ | 150,847 | $ | 146,460 | $ | 141,236 | ||||||||||
Real estate (net), discontinued operations | — | — | — | 7,932 | 8,252 | |||||||||||||||
Other assets | 31,047 | 23,602 | 27,098 | 20,752 | 17,599 | |||||||||||||||
Total assets | $ | 196,445 | $ | 182,000 | $ | 177,945 | $ | 175,144 | $ | 167,087 | ||||||||||
Liabilities | $ | 112,162 | $ | 115,141 | $ | 110,773 | $ | 94,262 | $ | 76,464 | ||||||||||
Whitestone REIT shareholders' equity | 62,708 | 43,590 | 45,891 | 52,843 | 58,914 | |||||||||||||||
Noncontrolling interest in subsidiary | 21,575 | 23,269 | 21,281 | 28,039 | 31,709 | |||||||||||||||
$ | 196,445 | $ | 182,000 | $ | 177,945 | $ | 175,144 | $ | 167,087 | |||||||||||
Other Data: | ||||||||||||||||||||
Proceeds from issuance of common shares | $ | 22,970 | $ | — | $ | — | $ | 261 | $ | 9,453 | ||||||||||
Additions to real estate | 12,768 | 12,855 | 5,153 | 10,205 | 1,833 | |||||||||||||||
Dividends per share (1) | 1.17 | 1.35 | 1.59 | 1.80 | 1.89 | |||||||||||||||
Funds from operations (2) | 8,432 | 8,618 | 4,236 | 6,001 | 8,993 | |||||||||||||||
Operating Potfolio Occupancy at year end | 86 | % | 82 | % | 84 | % | 86 | % | 83 | % | ||||||||||
Average aggregate gross leasable area | 3,058,340 | 3,039,044 | 3,008,085 | 3,093,063 | 3,121,039 | |||||||||||||||
Average rent per square foot | $ | 10.31 | $ | 10.76 | $ | 10.37 | $ | 9.50 | $ | 9.09 | ||||||||||
(1) The dividends per share represent total cash payments divided by weighted average common shares. | ||||||||||
(2) We believe that Funds From Operations (“FFO”) is an appropriate supplemental measure of operating performance because it helps our investors compare our operating performance relative to other REITs. The National Association of Real Estate Investment Trusts (“NAREIT”) defines FFO as net income (loss) available to common shareholders computed in accordance with GAAP, excluding gains or losses from sales of operating properties and extraordinary items, plus depreciation and amortization of real estate assets, including our share of unconsolidated partnerships and joint ventures. We calculate FFO in a manner consistent with the NAREIT definition. | ||||||||||
Year Ended December 31, | ||||||||||||||||||||
(in thousands, except per share data) | ||||||||||||||||||||
2010 | 2009 | 2008 | 2007 | 2006 | ||||||||||||||||
Net income (loss) attributable to Whitestone REIT | $ | 1,105 | $ | 1,342 | $ | 1,134 | $ | (77 | ) | $ | 1,781 | |||||||||
Depreciation and amortization of real estate assets (1) | 6,697 | 6,347 | 5,877 | 6,108 | 6,341 | |||||||||||||||
(Gain) loss on sale or disposal of assets (1) | 160 | 196 | (3,396 | ) | 16 | (197 | ) | |||||||||||||
Net income (loss) attributable to noncontrolling interests | 470 | 733 | 621 | (46 | ) | 1,068 | ||||||||||||||
FFO | $ | 8,432 | $ | 8,618 | $ | 4,236 | $ | 6,001 | $ | 8,993 | ||||||||||
(1) Including amounts for discontinued operations.
25
Item 7. Management’s Discussion and Analysis of Financial Condition and Results of Operations.
You should read the following discussion of our financial condition and results of operations in conjunction with our audited consolidated financial statements and the notes thereto included in this annual report. For more detailed information regarding the basis of presentation for the following information, you should read the notes to our audited consolidated financial statements included in this annual report.
Overview of Our Company
We are a fully integrated real estate company that owns and operates commercial properties in culturally diverse markets in major metropolitan areas. Founded in 1998, we are internally managed with a portfolio of commercial properties in Texas, Arizona and Illinois.
In October 2006, our current management team joined the company and adopted a strategic plan to acquire, redevelop, own and operate Community Centered Properties. We define Community Centered Properties as visibly located properties in established or developing culturally diverse neighborhoods in our target markets. We market, lease, and manage our centers to match tenants with the shared needs of the surrounding neighborhood. Those needs may include specialty retail, grocery, restaurants and medical, educational and financial services. Our goal is for each property to become a Whitestone-branded business center or retail community that serves a neighboring five-mile radius around our property. We employ and develop a diverse group of associates who understand the needs of our multicultural communities and tenants.
As of December 31, 2010, we had 792 total tenants. We have a diversified tenant base with our largest tenant comprising only 1.9% of our total revenues for the year ended December 31, 2010. Lease terms for our properties range from less than one year for smaller tenants to over 15 years for larger tenants. Our leases generally include minimum monthly lease payments and tenant reimbursements for payment of taxes, insurance and maintenance. We completed 298 new and renewal leases during 2010, totaling 0.7 million square feet and $31.9 million in total lease value.
On August 24, 2010, we filed with the State Department of Assessments and Taxation of Maryland (the “SDAT”) amendments to our declaration of trust that (i) changed the name of all of our common shares of beneficial interest, par value $0.001 to Class A common shares, (ii) effected a 1-for-3 reverse share split of our Class A common shares and (iii) changed the par value of our Class A common shares to $0.001 per share after the reverse share split. In addition, we filed with the SDAT articles supplementary to our declaration of trust that created a new class of common shares of beneficial interest, par value $0.001, entitled “Class B common shares” (the “Class B common shares” and collectively with Class A common shares, the “common shares”). Share and unit counts and per share and unit amounts have been retroactively restated to reflect our 1-for-3 reverse share split in August 2010.
On August 25, 2010, in conjunction with the listing of our Class B common shares on the NYSE-Amex, we offered and subsequently issued 2.2 million Class B common shares which resulted in $23.0 million in net offering proceeds to us. As of December 31, 2010, we had 3,471,187 Class A common shares, 2,200,000 Class B common shares, and 1,814,569 OP Units, not held by us, outstanding. Each Class B common share has the following rights:
• | the right to vote together with Class A common shareholders on all matters submitted to the Company’s shareholders; |
• | one vote on all matters voted upon by the Company’s shareholders; |
• | the right to receive dividends equal to any dividends declared on the Class A common shares; and |
• | liquidation rights equal to the liquidation rights of each Class A common share. |
We employed 53 full-time employees as of December 31, 2010. As an internally managed REIT, we bear our own expenses of operations, including the salaries, benefits and other compensation of our employees, office expenses, legal, accounting and investor relations expenses and other overhead costs.
How We Derive Our Revenue
Substantially all of our revenue is derived from rents received from leases at our properties. We had rental income and tenant reimbursements of approximately $31.5 million for the year ended December 31, 2010 as compared to $32.7 million for the year ended December 31, 2009, a decrease of $1.2 million, or 4%. The twelve months ended December 31, 2009 included
26
a $0.4 million business interruption settlement that was not repeated during the year ended December 31, 2010. Additionally, tenant reimbursement revenues decreased approximately $0.7 million during the twelve months ended December 31, 2010 as compared to the twelve months ended December 31, 2009. The decrease in tenant reimbursement revenues was primarily the result of a $0.7 million decrease in total property expenses. Our Operating Portfolio Occupancy Rate as of December 31, 2010 was 86%, as compared to 82% as of December 31, 2009.
Known Trends in Our Operations; Outlook for Future Results
Rental Income
We expect our rental income to increase year-over-year due to the addition of properties. We also expect modest continued improvement in the overall economy in Houston to provide slight increases in occupancy at certain of our properties, which should result in some growth in rental income.
Scheduled Lease Expirations
We tend to lease space to smaller businesses that desire shorter term leases. As of December 31, 2010, approximately 36% of our gross leasable square footage is subject to leases that expire prior to December 31, 2012. We routinely seek to renew leases with our existing tenants prior to their expiration and typically begin discussions with tenants as many as 18 months prior to the expiration date of the existing lease. While our early renewal program and other leasing and marketing efforts target these expiring leases, and while we hope to re-lease most of that space prior to expiration of the leases at rates comparable to or slightly in excess of the current rates, market conditions, including new supply of properties, and macroeconomic conditions in Houston and nationally could adversely impact our renewal rate and/or the rental rates we are able to negotiate. If any of these risks materialize, our cash flow and ability to pay dividends could be adversely affected.
Acquisitions
We expect to actively seek acquisitions in the foreseeable future. As of December 31, 2010, we owned and operated 38 commercial properties consisting of:
Operating Portfolio
• | eighteen retail properties containing approximately 1.2 million square feet of leasable space and having a total carrying amount (net of accumulated depreciation) of $70.0 million; |
• | seven office properties containing approximately 0.6 million square feet of leasable space and having a total carrying amount (net of accumulated depreciation) of $44.9 million; and |
• | eleven office/flex properties containing approximately 1.2 million square feet of leasable space and having a total carrying amount (net of accumulated depreciation) of $41.6 million. |
Redevelopment, New Acquisitions Portfolio
• | two retail properties containing approximately 0.1 million square feet of leasable space and having a total carrying amount (net of accumulated depreciation) of $8.9 million. |
Property Acquisitions
We seek to acquire commercial properties in high-growth markets. Our acquisition targets are properties that fit our Community Centered Properties strategy. We define Community Centered Properties as visibly located properties in established or developing, culturally diverse neighborhoods in our target markets, primarily in and around Phoenix, Chicago, Dallas, San Antonio and Houston. We market, lease and manage our centers to match tenants with the shared needs of the surrounding neighborhood. Those needs may include specialty retail, grocery and medical, educational and financial services. Our goal is for each property to become a Whitestone-branded business center or retail community that serves a neighboring five-mile radius around our property.
In November 2010, we acquired a property that meets our Community Centered Property strategy, containing 111,130 leasable square feet located in central Phoenix, Arizona for approximately $6.4 million in cash and net prorations. The
27
property, Sunnyslope, a Class B community center, is situated in an ideal location across the street from John C. Lincoln Hospital, the major employer in the area, and within a quarter mile from Sunnyslope High School.
In September 2010, we acquired a property that meets our Community Centered Property strategy, containing 28,547 leasable square feet located in Scottsdale, Arizona for approximately $2.2 million in cash and net prorations. The property, The Citadel, a Class A community center, is strategically located at a prime intersection at Pinnacle Peak and Pima Roads.
In January 2009, we acquired a property that meets our Community Centered Property strategy, containing 41,455 leasable square feet located in Buffalo Grove, Illinois for approximately $9.4 million, including cash of $5.5 million, issuance of 703,912 OP units valued at approximately $3.6 million and credit for net prorations of $0.3 million. The property, Spoerlein Commons, is a two-story complex of retail, medical and professional office tenants. We acquired the property from Midwest Development Venture IV (“MDV IV”), an Illinois limited partnership controlled by James C. Mastandrea, our Chairman, President and Chief Executive Officer. Because of Mr. Mastandrea’s relationship with the seller, a special committee consisting solely of the independent trustees negotiated the terms of the transaction, which included the use of an independent appraiser to value the property.
28
Summary of Critical Accounting Policies
Our discussion and analysis of our financial condition and results of operations are based on our consolidated financial statements. We prepared these financial statements in conformity with U.S. generally accepted accounting principles, or GAAP. The preparation of these financial statements required us to make estimates and assumptions that affect the reported amounts of assets and liabilities, the disclosure of contingent liabilities at the dates of the financial statements and the reported amounts of revenues and expenses during the reporting periods. We based our estimates on historical experience and on various other assumptions we believe to be reasonable under the circumstances. Our results may differ from these estimates. Currently, we believe that our accounting policies do not require us to make estimates using assumptions about matters that are highly uncertain. You should read Note 2, “Summary of Significant Accounting Policies,” to our consolidated financial statements in conjunction with this Management’s Discussion and Analysis of Financial Condition and Results of Operations.
We have described below the critical accounting policies that we believe could impact our consolidated financial statements most significantly.
Revenue Recognition. All leases on our properties are classified as operating leases, and the related rental income is recognized on a straight-line basis over the terms of the related leases. Differences between rental income earned and amounts due per the respective lease agreements are capitalized or charged, as applicable, to accrued rent and accounts receivable. Percentage rents are recognized as rental income when the thresholds upon which they are based have been met. Recoveries from tenants for taxes, insurance, and other operating expenses are recognized as revenues in the period the corresponding costs are incurred. We have established an allowance for doubtful accounts against the portion of tenant accounts receivable which is estimated to be uncollectible.
Development Properties. Land, buildings and improvements are recorded at cost. Expenditures related to the development of real estate are carried at cost which includes capitalized carrying charges and development costs. Carrying charges, primarily interest, real estate taxes and loan acquisition costs, and direct and indirect development costs related to buildings under construction, are capitalized as part of construction in progress. The capitalization of such costs ceases when the property, or any completed portion, becomes available for occupancy. Prior to that time, we expense these costs as acquisition expense. No interest was capitalized for the years ended December 31, 2010 and 2009. Approximately $0.4 million in interest was capitalized for the year ended December 31, 2008.
Acquired Properties and Acquired Lease Intangibles. We allocate the purchase price of the acquired properties to land, building and improvements, identifiable intangible assets and to the acquired liabilities based on their respective fair values. Identifiable intangibles include amounts allocated to acquired out-of-market leases, the value of in-place leases and customer relationship value, if any. We determine fair value based on estimated cash flow projections that utilize appropriate discount and capitalization rates and available market information. Estimates of future cash flows are based on a number of factors including the historical operating results, known trends and specific market and economic conditions that may affect the property. Factors considered by management in our analysis of determining the as-if-vacant property value include an estimate of carrying costs during the expected lease-up periods considering market conditions, and costs to execute similar leases. In estimating carrying costs, management includes real estate taxes, insurance and estimates of lost rentals at market rates during the expected lease-up periods, tenant demand and other economic conditions. Management also estimates costs to execute similar leases including leasing commissions, tenant improvements, legal and other related expenses. Intangibles related to out-of-market leases and in-place lease value are recorded as acquired lease intangibles and are amortized as an adjustment to rental revenue or amortization expense, as appropriate, over the remaining terms of the underlying leases. Premiums or discounts on acquired out-of-market debt are amortized to interest expense over the remaining term of such debt.
Depreciation. Depreciation is computed using the straight-line method over the estimated useful lives of five to 39 years for the buildings and improvements. Tenant improvements are depreciated using the straight-line method over the life of the lease.
Impairment. We review our properties for impairment at least annually or whenever events or changes in circumstances indicate that the carrying amount of the assets, including accrued rental income, may not be recoverable through operations. We determine whether an impairment in value has occurred by comparing the estimated future cash flows (undiscounted and without interest charges), including the estimated residual value of the property, with the carrying cost of the property. If impairment is indicated, a loss will be recorded for the amount by which the carrying value of the property exceeds its fair value. Management has determined that there has been no impairment in the carrying value of our real estate assets as of December 31, 2010.
29
Accrued Rent and Accounts Receivable. Included in accrued rent and accounts receivable are base rents, tenant reimbursements and receivables attributable to recording rents on a straight-line basis. An allowance for the uncollectible portion of accrued rents and accounts receivable is determined based upon customer credit-worthiness (including expected recovery of our claim with respect to any tenants in bankruptcy), historical bad debt levels, and current economic trends. As of December 31, 2010 and 2009, we had an allowance for uncollectible accounts of $1.3 million and $0.9 million, respectively. As of December 31, 2010, 2009 and 2008, we recorded bad debt expense in the amount of $0.5 million, $0.9 million and $0.7 million, respectively, related to tenant receivables that we specifically identified as potentially uncollectible based on our assessment of each tenant’s credit-worthiness. Bad debt expenses and any related recoveries are included in property operation and maintenance expense.
Unamortized Lease Commissions and Loan Costs. Leasing commissions are amortized using the straight-line method over the terms of the related lease agreements. Loan costs are amortized on the straight-line method over the terms of the loans, which approximates the interest method. Costs allocated to in-place leases whose terms differ from market terms related to acquired properties are amortized over the remaining life of the respective leases.
Prepaids and Other Assets. Prepaids and other assets include escrows established pursuant to certain mortgage financing arrangements for real estate taxes and insurance and acquisition deposits which include earnest money deposits on future acquisitions.
Federal Income Taxes. We elected to be taxed as a REIT under the Code beginning with our taxable year ended December 31, 1999. As a REIT, we generally are not subject to federal income tax on income that we distribute to our shareholders. If we fail to qualify as a REIT in any taxable year, we will be subject to federal income tax on our taxable income at regular corporate rates. We believe that we are organized and operate in such a manner as to qualify to be taxed as a REIT, and we intend to operate so as to remain qualified as a REIT for federal income tax purposes.
State Taxes. In May 2006, the State of Texas adopted House Bill 3, which modified the state’s franchise tax structure, replacing the previous tax based on capital or earned surplus with one based on margin (often referred to as the “Texas Margin Tax”) effective with franchise tax reports filed on or after January 1, 2008. The Texas Margin Tax is computed by applying the applicable tax rate (1% for us) to the profit margin, which, generally, will be determined for us as total revenue less a 30% standard deduction. Although House Bill 3 states that the Texas Margin Tax is not an income tax, Financial Accounting Standards Board (“FASB”) ASC 740, “Income Taxes” (“ASC 740”) applies to the Texas Margin Tax. We have recorded a margin tax provision of $0.3 million, $0.2 million and $0.2 million for the Texas Margin Tax for each of the years ended December 31, 2010, 2009 and 2008, respectively.
Derivative Instruments. We have initiated a program designed to manage exposure to interest rate fluctuations by entering into financial derivative instruments. The primary objective of this program is to comply with debt covenants on a credit facility. We sometimes enter into interest rate swap agreements with respect to amounts borrowed under certain of our credit facilities, which effectively exchanges existing obligations to pay interest based on floating rates for obligations to pay interest based on fixed LIBOR rates.
We have adopted provisions of Accounting Standards Codification (“ASC”) 820, “Fair Value Measurements and Disclosures” (“ASC 820”) which requires for items appropriately classified as cash flow hedges, that changes in the market value of the instrument and in the market value of the hedged item be recorded as other comprehensive income or loss with the exception of the portion of the hedged items that are considered ineffective. The derivative instruments are reported at fair value as other assets or other liabilities as applicable. As of December 31, 2010 and 2009, we did not have any interest rate swaps.
30
Liquidity and Capital Resources
Our primary liquidity demands are distributions to holders of our common shares and OP units, capital improvements and repairs and maintenance for our properties, acquisition of additional properties, tenant improvements and debt repayments.
Primary sources of capital for funding our acquisitions and redevelopment programs are cash flows generated from operating activities, issuances of notes payable, sales of common shares, sales of OP Units, sales of underperforming properties and other financing opportunities including equity issuance and debt financing. We expect that our rental income will increase as we continue to acquire additional properties, subsequently increasing our cash flows generated from operating activities. We intend to continue acquiring such additional properties through equity issuance, including proceeds from our recent initial public offering of Class B common shares, and through debt financing.
Our capital structure includes non-recourse secured debt that we assumed or originated on certain properties. We may hedge the future cash flows of certain debt transactions principally through interest rate swaps with major financial institutions.
During the year ended December 31, 2010, our cash provided from operating activities was $10.4 million and our total distributions were $7.4 million. Therefore we had cash flow from operations in excess of distributions of approximately $3.1 million.
We anticipate that cash flows from operating activities and our borrowing capacity will provide adequate capital for our working capital requirements, anticipated capital expenditures and scheduled debt payments during the next 12 months. We also believe that cash flows from operating activities and our borrowing capacity will allow us to make all distributions required for us to continue to qualify to be taxed as a REIT for federal income tax purposes.
Cash and Cash Equivalents
We had cash and cash equivalents of approximately $17.6 million at December 31, 2010, as compared to $6.3 million on December 31, 2009. The increase of $11.3 million was primarily the result of the following:
Sources of Cash
• | Cash flow from operations of $10.4 million for the year ended December 31, 2010; |
• | Proceeds of $23.0 million from issuance of Class B common shares; |
• | Net proceeds of $1.3 million from issuance of notes payable net of origination costs; |
Uses of Cash
• | Payment of dividends and distributions to common shareholders and OP Unit holders of $7.4 million; |
• | Payments of loans of $3.0 million; |
• | Additions to real estate of $12.8 million; |
• | Repurchases of Class A common shares of $0.2 million. |
We place all cash in short-term, highly liquid investments that we believe provide appropriate safety of principal.
31
Debt
Mortgages and other notes payable consist of the following (in thousands):
Year Ended | ||||||||
December 31, | ||||||||
Description | 2010 | 2009 | ||||||
Fixed rate notes | ||||||||
$10.0 million 6.04% Note, due 2014 | $ | 9,498 | $ | 9,646 | ||||
$1.5 million 6.50% Note, due 2014 | 1,496 | — | ||||||
$11.2 million 6.52% Note, due 2015 | 10,908 | 11,043 | ||||||
$21.4 million 6.53% Notes, due 2013 | 20,142 | 20,721 | ||||||
$24.5 million 6.56% Note, due 2013 | 24,030 | 24,435 | ||||||
$9.9 million 6.63% Notes, due 2014 | 9,498 | 9,757 | ||||||
$0.5 million 5.05% Notes, due 2011 and 2010 | 13 | 52 | ||||||
Floating rate note | ||||||||
$26.9 million LIBOR + 2.60% Note, due 2013 | 25,356 | 26,128 | ||||||
$ | 100,941 | $ | 101,782 | |||||
Our debt was collateralized by 23 operating properties as of December 31, 2010 with a combined net book value of $110.1 million and 21 operating properties at December 31, 2009 with a combined net book value of $108.7 million. Our loans contain restrictions that would require the payment of prepayment penalties for the acceleration of outstanding debt and are secured by deeds of trust on certain of our properties and the assignment of certain rents and leases associated with those properties.
On September 10, 2010, we executed a promissory note (the "Promissory Note") in the amount of $1.5 million (the "New Loan") payable to MidFirst Bank, a federally chartered savings association ("MidFirst"), with an applicable interest rate of 6.5% per annum. Monthly payments of $11,150 began on November 1, 2010 and continue thereafter on the first day of each calendar month until February 1, 2014. The Promissory Note is secured by a second lien deed of trust on our Windsor Park retail facility located in Windcrest, Texas, a first lien deed of trust on our Brookhill office/flex building located in Houston, Texas and a first lien deed of trust on our Zeta office building located in Houston, Texas. The funds from the Promissory Note are being used for capital improvements to Windsor Park.
The loan documents executed in connection with the Promissory Note (the "Loan Documents") included a Limited Guaranty by us of the Promissory Note until the Windsor Park construction is completed. Following this event, we will remain liable for the deficiency, if any, following a foreclosure of property securing the Promissory Note; provided that upon the occurrence of certain "Full Recourse Events" defined in the Loan Documents, our obligations shall convert to a full guarantee of the New Loan.
In connection with the Promissory Note, the Loan Documents also provided for a modification of our existing loan with MidFirst in the amount of $10,000,000 (the "Existing Loan"). The Loan Documents provide that the promissory note executed in connection with the Existing Loan is modified to be secured, in part, by second liens on the Brookhill and Zeta Buildings, as well as certain other modifications for the purpose of cross collateralizing and cross-defaulting the two loans. The Existing Loan is also modified by the Modification of Promissory Note which provided that payments of $91,777 began on October 1, 2010 and continue thereafter on the first day of each calendar month until February 1, 2014. Finally, the Loan Documents include a Modification of Limited Guaranty which provided that the Limited Guaranty executed in connection with the Existing Loan is only for the deficiency, if any, following the foreclosure of property securing the Existing Loan; provided that upon the occurrence of certain "Full Recourse Events" defined in the Modification of Limited Guaranty, our obligations shall convert to a full guarantee of the Existing Loan.
Our loans are subject to customary financial covenants. As of December 31, 2010, we were in compliance with all loan covenants.
32
Annual maturities of notes payable as of December 31, 2010 are due during the following years:
Amount Due | |||
Year | (in thousands) | ||
2011 | $ | 2,459 | |
2012 | 2,579 | ||
2013 | 66,424 | ||
2014 | 19,209 | ||
2015 | 10,270 | ||
2016 and thereafter | — | ||
Total | $ | 100,941 | |
Capital Expenditures
We continually evaluate our properties’ performance and value. We may determine it is in our shareholders’ best interest to invest capital in properties we believe have potential for increasing value. We also may have unexpected capital expenditures or improvements for our existing assets. Additionally, we intend to continue investing in similar properties outside of Texas in cities with exceptional demographics to diversify market risk, and we may incur significant capital expenditures or make improvements in connection with any properties we may acquire.
Contractual Obligations
As of December 31, 2010, we had the following contractual debt obligations (see Note 8 of the Consolidated Financial Statements for further discussion regarding the specific terms of our debt):
Payment due by period (in thousands) | ||||||||||||||||||||
Contractual Obligations | Total | Less than 1 year (2011) | 1 - 3 years (2012 - 2013) | 3 - 5 years (2014 - 2015) | More than 5 years (after 2015) | |||||||||||||||
Long-Term Debt - Principal | $ | 100,941 | $ | 2,459 | $ | 69,003 | $ | 29,479 | $ | — | ||||||||||
Long-Term Debt - Fixed Interest | 13,306 | 4,233 | 7,739 | 1,334 | — | |||||||||||||||
Long-Term Debt - Variable Interest (1) | 2,017 | 714 | 1,303 | — | — | |||||||||||||||
Capital Lease Obligations | — | — | — | — | — | |||||||||||||||
Operating Lease Obligations | 93 | 47 | 41 | 5 | — | |||||||||||||||
Purchase Obligations | — | — | — | — | — | |||||||||||||||
Other Long-Term Liabilities | ||||||||||||||||||||
Reflected on the Registrant’s | ||||||||||||||||||||
Balance Sheet under GAAP | — | — | — | — | — | |||||||||||||||
Total | $ | 116,357 | $ | 7,453 | $ | 78,086 | $ | 30,818 | $ | — | ||||||||||
(1) As of December 31, 2010, we had one loan totaling $25.4 million which bore interest at a floating rate. The variable interest rate payments are based on LIBOR plus 2.6%. The information in the table above reflects our projected interest rate obligations for the floating rate payments based on one-month LIBOR as of December 31, 2010, which was 0.26%.
33
Distributions
During 2010, we paid dividends to our common shareholders and distributions to our OP Unit holders of $7.4 million, compared to $6.9 million in 2009. Common shareholders and OP Unit holders receive monthly dividends and distributions, respectively. Payments of dividends and distributions are declared quarterly and paid monthly. The dividends paid to common shareholders and distributions paid to OP Unit holders follow (in thousands):
Noncontrolling | ||||||||||||
Common | OP Unit | |||||||||||
Shareholders | Holders | Total | ||||||||||
2010 | ||||||||||||
Fourth Quarter | $ | 1,616 | $ | 514 | $ | 2,130 | ||||||
Third Quarter | 1,203 | 515 | 1,718 | |||||||||
Second Quarter | 1,176 | 610 | 1,786 | |||||||||
First Quarter | 1,163 | 610 | 1,773 | |||||||||
Total | $ | 5,158 | $ | 2,249 | $ | 7,407 | ||||||
2009 | ||||||||||||
Fourth Quarter | $ | 1,163 | $ | 610 | $ | 1,773 | ||||||
Third Quarter | 1,163 | 610 | 1,773 | |||||||||
Second Quarter | 1,163 | 530 | 1,693 | |||||||||
First Quarter | 1,156 | 531 | 1,687 | |||||||||
Total | $ | 4,645 | $ | 2,281 | $ | 6,926 | ||||||
34
Results of Operations
Year Ended December 31, 2010 Compared to Year Ended December 31, 2009
The following table provides a general comparison of our results of operations for the years ended December 31, 2010 and December 31, 2009:
Year Ended December 31, | ||||||||
2010 | 2009 | |||||||
Number of properties owned and operated | 38 | 36 | ||||||
Aggregate gross leasable area (sq. ft.)(1) | 3,162,020 | 3,039,044 | ||||||
Ending occupancy rate - operating portfolio(2) | 86 | % | 82 | % | ||||
Ending occupancy rate - all properties | 84 | % | 82 | % | ||||
Total property revenues | $ | 31,533 | $ | 32,685 | ||||
Total property expenses | 12,283 | 12,991 | ||||||
Total other expenses | 17,251 | 17,201 | ||||||
Provision for income taxes | 264 | 222 | ||||||
Loss on disposal of assets | 160 | 196 | ||||||
Net income | 1,575 | 2,075 | ||||||
Less: Net income attributable to noncontrolling interests | 470 | 733 | ||||||
Net income attributable to Whitestone REIT | $ | 1,105 | $ | 1,342 | ||||
Funds from operations (3) | $ | 8,432 | $ | 8,618 | ||||
Dividends and distributions paid on common shares and OP Units | 7,407 | 6,926 | ||||||
Per Class A common share and OP Unit | 1.25 | 1.35 | ||||||
Per Class B common share (4) | 0.38 | — | ||||||
Dividends paid as a % of funds from operations | 88 | % | 80 | % | ||||
(1) During the first quarter of 2010, we concluded that approximately 25,000 square feet at our Kempwood Plaza and Centre South locations were no longer leasable, therefore such area is no longer included in the gross leasable area.
(2) Excludes (i) new acquisitions, through the earlier of attainment of 90% occupancy or 18 months of ownership, and (ii) properties which are undergoing significant redevelopment or re-tenanting.
(3) For a reconciliation of funds from operations to net income, see "Funds From Operations" below.
(4) Dividend rate is the same as Class A, but represents a partial year for Class B common shares issued August 26, 2010.
Property revenues. We had rental income and tenant reimbursements of approximately $31.5 million for the year ended December 31, 2010 as compared to $32.7 million for the year ended December 31, 2009, a decrease of $1.2 million, or 4%. The twelve months ended December 31, 2009 included a $0.4 million business interruption settlement that was not repeated during the twelve months ended December 31, 2010. Additionally, tenant reimbursement revenues decreased approximately $0.7 million during the twelve months ended December 31, 2010 as compared to the twelve months ended December 31, 2009. The decrease in tenant reimbursement revenues was primarily the result of a $0.7 million decrease in total property expenses.
35
Property expenses. Our property expenses were $12.3 million for the year ended December 31, 2010, as compared to $13.0 million for the year ended December 31, 2009, a decrease of $0.7 million, or 5%. The primary components of total property expenses are detailed in the table below (in thousands):
Year Ended December 31, | Increase / | % Increase / | |||||||||||||
2010 | 2009 | (Decrease) | (Decrease) | ||||||||||||
Real estate taxes | $ | 3,925 | $ | 4,472 | $ | (547 | ) | (12 | )% | ||||||
Utilities | 2,277 | 2,387 | (110 | ) | (5 | )% | |||||||||
Contract services | 2,140 | 2,108 | 32 | 2 | % | ||||||||||
Repairs and maintenance | 1,403 | 1,408 | (5 | ) | 0 | % | |||||||||
Bad debt | 536 | 877 | (341 | ) | (39 | )% | |||||||||
Labor and other | 2,002 | 1,739 | 263 | 15 | % | ||||||||||
Total property expenses | $ | 12,283 | $ | 12,991 | $ | (708 | ) | (5 | )% | ||||||
Real estate taxes. Real estate taxes decreased $0.5 million, or 12%, during the twelve months ended December 31, 2010 as compared to the same period in 2009, primarily as a result of lower valuations by the various county appraisal districts. In 2010, primarily as a result of our formal protests of assessed values, the various appraisal districts agreed to lower valuations and resulting taxes by significant amounts. We work actively to keep our valuations and resulting taxes as low as possible as most of these taxes are passed through to our tenants through triple net leases.
Utilities. Utilities decreased $0.1 million, or 5%, during the twelve months ended December 31, 2010 as compared to the same period in 2009. The decrease in utility expenses was primarily attributed to the electricity usage of our six office buildings in Texas, which were charged at a lower rate per kilowatt hour during 2010 due to our new contracts with our electricity provider for lower fixed rates.
Bad debt. Bad debt for the twelve months ended December 31, 2010 decreased $0.3 million, or 39%, as compared to the same period in 2009. We vigorously pursue past due accounts, but expect collection of rents to continue to be challenging for the foreseeable future.
Labor and other. Increases of $0.3 million, or 15%, in labor and other during 2010 were the result of the internalization of many maintenance functions and increased focus on tenant service and property conditions by property management personnel. We have been able to accomplish a greater focus on tenant service and property conditions as a result of realignment of duties and reductions in administrative duties required of these individuals. This decrease in administrative duties is a result of improvements in systems, processes and reporting.
Other expenses. Our other expenses were $17.3 million for the year ended December 31, 2010, as compared to $17.2 million for the year ended December 31, 2009, an increase of $0.1 million. The primary components of other expenses, net are detailed in the table below (in thousands):
Year Ended December 31, | Increase / | % Increase / | |||||||||||||
2010 | 2009 | (Decrease) | (Decrease) | ||||||||||||
General and administrative | $ | 4,992 | $ | 6,072 | $ | (1,080 | ) | (18 | )% | ||||||
Depreciation and amortization | 7,225 | 6,958 | 267 | 4 | % | ||||||||||
Involuntary conversion | (558 | ) | (1,542 | ) | 984 | (64 | )% | ||||||||
Interest expense | 5,620 | 5,749 | (129 | ) | (2 | )% | |||||||||
Interest income | (28 | ) | (36 | ) | 8 | (22 | )% | ||||||||
Total other expenses | $ | 17,251 | $ | 17,201 | $ | 50 | 0 | % | |||||||
General and administrative. General and administrative expenses decreased approximately $1.1 million or 18% for the twelve months ended December 31, 2010 as compared to the same period in 2009. Share-based compensation expense decreased approximately $0.7 million during 2010. The majority of share-based compensation recognized during 2009
36
represented the achievement of the first performance-based target on certain share-based compensation grants. With our current asset base, management does not expect to achieve the second performance-based target, and share-based compensation was significantly lower during 2010 than 2009 because fewer unvested shares are expected to vest. Should we increase our asset base, we may achieve the next performance-based target and begin expensing the shares expected to vest upon the achievement of the second target.
Salaries and benefits, excluding share-based compensation, were approximately $0.2 million less during the twelve months ended December 31, 2010 than during the same period in 2009, primarily as a result of fewer employees and company wide salary reductions taken in October 2009. Additionally, our allocation of internal labor to properties increased $0.4 million in 2010, reducing general and administrative expense and increasing property expenses. Property management personnel have been able to achieve a greater focus on tenant service and property conditions because much of their administrative burden was removed by a realignment of duties and system and process improvements. Professional fees increased $0.2 million during the twelve months ended December 31, 2010 as compared to the same period in 2009.
Depreciation and amortization. Depreciation and amortization increased $0.3 million, or 4%, for the year ended December 31, 2010 as compared to the year ended December 31, 2009. The increase in depreciation expense was primarily comprised of tenant improvements at our Uptown Tower property located in Dallas, Texas and our West Belt Plaza and Plaza Park locations located in Houston, Texas. The Uptown Tower spending was for office tenants, while the West Belt Plaza and Plaza Park improvements were for leases that ended during 2010 with the U.S. Census Bureau. We expect depreciation and amortization to increase as we acquire properties.
Involuntary conversion. Involuntary conversion was a gain of $0.6 million for the year ended December 31, 2010, as compared to a gain of $1.5 million during the same period in 2009. The involuntary conversion gain of $0.6 million recognized during the twelve months ended December 31, 2010 represents the completion of the repairs to the 31 properties impacted by Hurricane Ike at costs that were lower than we estimated as of December 31, 2009. The estimated costs were sensitive to the scope requirements of our lenders and labor and material costs of our vendors, and the final costs incurred were more favorable than we anticipated. During the year ended December 31, 2009, we completed a settlement of our insurance claims related to our 31 properties damaged by Hurricane Ike. The settlement was $7.0 million in its entirety, with $6.5 million allocated to casualty claims and approximately $0.5 million allocated to loss of rents claims. For the twelve months ended December 31, 2009, the $6.5 million in insurance proceeds allocated to casualty losses were offset by accrued repair costs of $5.1 million resulting in a gain of $1.4 million. The remaining $0.1 million in involuntary conversion gain for the year ended December 31, 2009 was realized on an insurance settlement we completed during 2009 on a chiller unit at our Uptown Tower property in Dallas, Texas.
Interest expense. Interest expense for the year ended December 31, 2010 was $5.6 million, a decrease of $0.1 million over the same period in 2009. A decrease in our average outstanding notes payable balance of $3.2 million accounted for the decrease in interest expense for the twelve months ended December 31, 2010 as compared to the same period in 2009.
37
Result of Operations
Year Ended December 31, 2009 Compared to Year Ended December 31, 2008
The following table provides a general comparison of our results of operations for the years ended December 31, 2009 and December 31, 2008 (dollars in thousands):
Year Ended December 31, | ||||||||
2009 | 2008 | |||||||
Number of properties owned and operated | 36 | 35 | ||||||
Aggregate gross leasable area (sq. ft.) | 3,039,044 | 2,990,892 | ||||||
Ending occupancy rate - operating portfolio(1) | 82 | % | 84 | % | ||||
Ending occupancy rate - all properties | 82 | % | 84 | % | ||||
Total property revenues | $ | 32,685 | $ | 31,201 | ||||
Total property expenses | 12,991 | 12,835 | ||||||
Total other expenses | 17,201 | 19,600 | ||||||
Provision for income taxes | 222 | 219 | ||||||
Loss on disposal of assets | 196 | 223 | ||||||
Income (loss) from continuing operations | 2,075 | (1,676 | ) | |||||
Loss from discontinued operations | — | (188 | ) | |||||
Gain from sale of properties from discontinued operations | — | 3,619 | ||||||
Net income | 2,075 | 1,755 | ||||||
Less: Net income attributable to noncontrolling interests | 733 | 621 | ||||||
Net income attributable to Whitestone REIT | $ | 1,342 | $ | 1,134 | ||||
Funds from operations (2) | $ | 8,618 | $ | 4,236 | ||||
Dividends and distributions paid on common shares and OP Units | 6,926 | 8,672 | ||||||
Per Class A common share and OP Unit | 1.35 | 1.74 | ||||||
Dividends paid as a % of funds from operations | 80 | % | 205 | % | ||||
(1) Excludes (i) new acquisitions, through the earlier of attainment of 90% occupancy or 18 months of ownership, and (ii) properties which are undergoing significant redevelopment or re-tenanting.
(2) For a reconciliation of funds from operations to net income, see "Funds From Operations" below.
Property revenues. We had rental income and tenant reimbursements of approximately $32.7 million for the year ended December 31, 2009 as compared to $31.2 million for the year ended December 31, 2008, an increase of $1.5 million, or 5%. The increase was primarily attributable to the addition of our Spoerlein Commons property during January 2009.
38
Property expenses. Our property expenses were $13.0 million for the year ended December 31, 2009, as compared to $12.8 million for the year ended December 31, 2008, an increase of $0.2 million, or 1%. The primary components of total property expenses are detailed in the table below (in thousands):
Year Ended December 31, | Increase / | % Increase / | |||||||||||||
2009 | 2008 | (Decrease) | (Decrease) | ||||||||||||
Real estate taxes | $ | 4,472 | $ | 3,973 | $ | 499 | 13 | % | |||||||
Utilities | 2,387 | 2,679 | (292 | ) | (11 | )% | |||||||||
Contract services | 2,108 | 2,138 | (30 | ) | (1 | )% | |||||||||
Repairs and maintenance | 1,408 | 1,633 | (225 | ) | (14 | )% | |||||||||
Bad debt | 877 | 731 | 146 | 20 | % | ||||||||||
Labor and other | 1,739 | 1,681 | 58 | 3 | % | ||||||||||
Total property expenses | $ | 12,991 | $ | 12,835 | $ | 156 | 1 | % | |||||||
Real estate taxes. Increases during 2009 in real estate taxes of $0.5 million, or 13%, were the result of increased assessed values on our properties and the addition of the Spoerlein Commons property during January 2009.
Utilities. Utilities decreased $0.3 million, or 11%, during 2009. The majority of our utility expense is the electricity usage of our seven office buildings which were charged at a lower rate per kilowatt hour during the second half of 2009 due to our new contracts with our electricity provider for lower fixed rates in the Texas market.
Repairs and Maintenance. Repairs and maintenance decreases of $0.2 million, or 14%, during 2009 were primarily attributable to decreases in hard surface and parking lot repair costs and the internalization of many maintenance functions.
Bad debt. Bad debt for the year ended December, 31 2009 was $0.1 million, or 20%, more than in 2008. The increase in bad debt was driven by slower paying tenants and abandonments. We vigorously pursue past due accounts, but expect for collection of rents to continue to be challenging for the foreseeable future.
Labor and other. Increases of $0.1 million, or 3%, in labor and other during 2009 were the result of increased travel and marketing costs.
Other expenses. Our other expenses were $17.2 million for the year ended December 31, 2009, as compared to $19.6 million for the year ended December 31, 2008, a decrease of $2.4 million, or 12%. The primary components of other expenses, net are detailed in the table below (in thousands):
Year Ended December 31, | Increase / | % Increase / | |||||||||||||
2009 | 2008 | (Decrease) | (Decrease) | ||||||||||||
General and administrative | $ | 6,072 | $ | 6,708 | $ | (636 | ) | (9 | )% | ||||||
Depreciation and amortization | 6,958 | 6,859 | 99 | 1 | % | ||||||||||
Involuntary conversion | (1,542 | ) | 358 | (1,900 | ) | (531 | )% | ||||||||
Interest expense | 5,749 | 5,857 | (108 | ) | (2 | )% | |||||||||
Interest income | (36 | ) | (182 | ) | 146 | (80 | )% | ||||||||
Total other expenses | $ | 17,201 | $ | 19,600 | $ | (2,399 | ) | (12 | )% | ||||||
General and administrative. The decrease of $0.6 million, or 9%, in general and administrative expense was primarily due to decreased legal fees related to litigation with our former CEO and our former external advisor, offset by share-based compensation that was incurred in 2009 but not in 2008. Legal fees were $0.3 million for the year ended December 31, 2009, as compared to $1.7 million for the same period in 2008. Share-based compensation was $1.0 million and $0.0 million for the years ended December 31, 2009 and 2008, respectively.
Depreciation and amortization. Depreciation and amortization increased $0.1 million, or 1%, for the year ended
39
December 31, 2009, as compared to the year ended December 31, 2008. During 2009 depreciation increased $0.8 million, or 16%, while amortization decreased $0.7 million, or 35%. The increase in depreciation expense is the result of tenant improvements placed in service and depreciation on our Pima Norte and Spoerlein Commons properties, which were placed in service in late 2008 and early 2009, respectively. The decrease in amortization expense is primarily attributable to the loan fees which were $0.4 million during 2009 compared to $1.1 million during 2008.
Involuntary conversion. Involuntary conversion was a gain of $1.5 million for the year ended December 31, 2009, as compared to a loss of $0.4 million during the same period in 2008. During the year ended December 31, 2009, we completed a settlement of our insurance claims related to our 31 properties damaged by Hurricane Ike. The settlement was $7.0 million in its entirety, with $6.5 million allocated to casualty claims and approximately $0.5 million allocated to loss of rents claims. The $6.5 million in insurance proceeds allocated to casualty losses were offset by accrued repair costs of $5.1 million, resulting in a gain of $1.4 million. The remaining $0.1 million in involuntary conversion gain for the year ended December 31, 2009 was realized on an insurance settlement we completed during 2009 on a chiller unit at our Uptown Tower property in Dallas, Texas. Repair costs of $0.4 million expensed during the twelve months ended December 31, 2008 related to Hurricane Ike are included in the 2008 involuntary conversion loss.
Interest expense, net. Interest expense for the year ended December 31, 2009 was $5.7 million, a decrease of $0.1 million over the same period in 2008. An increase in the average outstanding note payable balance of $14.9 million accounted for approximately $1.0 million in increased interest expense during 2009, while a lower effective interest rate of 1.0% per annum (excluding amortized loan fees) accounted for approximately $1.1 million in decreased interest expense during 2009. The decrease in interest income of approximately $0.1 million is primarily due to lower interest rates of return on our deposits.
Discontinued operations. Discontinued operations are comprised of the two properties known as Garden Oaks and Northeast Square. The two properties were transferred to our former CEO and our former external advisor as part of a legal settlement on May 30, 2008. Below is a summary of income from discontinued operations (in thousands):
Year Ended December 31, | ||||||||
2009 | 2008 | |||||||
Property Revenues | ||||||||
Rental revenues | $ | — | $ | 333 | ||||
Other revenues | — | 225 | ||||||
Total property revenues | — | 558 | ||||||
Property Expenses | ||||||||
Properties operation and maintenance | — | 391 | ||||||
Real estate taxes | — | 133 | ||||||
Total property expenses | — | 524 | ||||||
Other expense | ||||||||
General and administrative | — | — | ||||||
Depreciation and amortization | — | 218 | ||||||
Total other expense | — | 218 | ||||||
Income (loss) before gain (loss) on disposal of assets and income taxes | — | (184 | ) | |||||
Gain on sale of properties | — | 3,619 | ||||||
Provision for income taxes | — | (4 | ) | |||||
Income from discontinued operations | $ | — | $ | 3,431 | ||||
40
Funds From Operations and Funds From Operations - Core
The National Association of Real Estate Investment Trusts, or NAREIT, defines funds from operations, or FFO, as net income (loss) available to common shareholders computed in accordance with GAAP, excluding gains or losses from sales of operating real estate assets and extraordinary items, plus depreciation and amortization of operating properties, including our share of unconsolidated real estate joint ventures and partnerships. We calculate FFO in a manner consistent with the NAREIT definition.
Management uses FFO as a supplemental measure to conduct and evaluate our business because there are certain limitations associated with using GAAP net income alone as the primary measure of our operating performance. Historical cost accounting for real estate assets in accordance with GAAP implicitly assumes that the value of real estate assets diminishes predictably over time. Because real estate values instead have historically risen or fallen with market conditions, management believes that the presentation of operating results for real estate companies that use historical cost accounting is insufficient by itself. In addition, securities analysts, investors and other interested parties use FFO as the primary metric for comparing the relative performance of equity REITs. There can be no assurance that FFO presented by us is comparable to similarly titled measures of other REITs.
FFO should not be considered as an alternative to net income or other measurements under GAAP as an indicator of our operating performance or to cash flows from operating, investing or financing activities as a measure of liquidity. FFO does not reflect working capital changes, cash expenditures for capital improvements or principal payments on indebtedness.
Management believes that the computation of FFO in accordance with NAREIT's definition includes certain items that are not indicative of the results provided by our operating portfolio and affect the comparability of our period-over-period performance. These items include, but are not limited to, gains and losses on insurance claim settlements, acquisition costs and certain costs paid as a result of our litigation with our former external manager.
Below is the calculation of FFO and FFO-Core and the reconciliation to net income, which we believe is the most comparable GAAP financial measure (in thousands):
Reconciliation of Non-GAAP Financial Measures
Year Ended December 31, | ||||||||||||
2010 | 2009 | 2008 | ||||||||||
Net income attributable to Whitestone REIT | $ | 1,105 | $ | 1,342 | $ | 1,134 | ||||||
Depreciation and amortization of real estate assets (1) | 6,697 | 6,347 | 5,877 | |||||||||
(Gain) loss on sale or disposal of assets (1) | 160 | 196 | (3,396 | ) | ||||||||
Net income attributable to noncontrolling interests | 470 | 733 | 621 | |||||||||
FFO | 8,432 | 8,618 | 4,236 | |||||||||
Acquisition costs | 46 | 75 | — | |||||||||
(Gain) loss on insurance settlement (2) | (558 | ) | (1,934 | ) | 358 | |||||||
Litigation costs with our former external manager | — | — | 1,491 | |||||||||
FFO-Core | $ | 7,920 | $ | 6,759 | $ | 6,085 | ||||||
(1) Including amounts for discontinued operations.
(2) $392 included in rental revenue for the twelve months ended December 31, 2009.
Taxes
We elected to be taxed as a REIT under the Internal Revenue Code beginning with our taxable year ended December 31, 1999. As a REIT, we generally are not subject to federal income tax on income that we distribute to our shareholders. If we fail to qualify as a REIT in any taxable year, we will be subject to federal income tax on our taxable income at regular corporate rates. We believe that we are organized and operate in a manner to qualify and be taxed as a REIT, and we intend to operate so as to remain qualified as a REIT for federal income tax purposes.
41
Inflation
We anticipate that the majority of our leases will continue to be triple-net leases or otherwise provide that tenants pay for increases in operating expenses and will contain provisions that we believe will mitigate the effect of inflation. In addition, many of our leases are for terms of less than five years, which allows us to adjust rental rates to reflect inflation and other changing market conditions when the leases expire. Consequently, increases due to inflation, as well as ad valorem tax rate increases, generally do not have a significant adverse effect upon our operating results.
Off-Balance Sheet Arrangements
We have no significant off-balance sheet arrangements as of December 31, 2010.
Item 7A. Quantitative and Qualitative Disclosures About Market Risk.
Market risk is the risk of loss arising from adverse changes in market rates and prices. The principal market risk to which we are exposed is the risk related to interest rate fluctuations. Based upon the nature of our operations, we are not subject to foreign exchange or commodity risk. We are exposed to changes in interest rates as a result of our debt facilities that have floating interest rates. As of December 31, 2010, we had $25.4 million of loans with floating interest rates. All of our financial instruments were entered into for other than trading purposes. As of December 31, 2010, we did not have a fixed rate hedge in place, leaving $25.4 million subject to interest rate fluctuations. The impact of a 1% increase or decrease in interest rates on our debt would result in a decrease or increase of annual net income of approximately $0.3 million, respectively.
Our interest rate risk objective is to limit the impact of interest rate fluctuations on earnings and cash flows and to lower our overall borrowing costs. To achieve this objective, we try to manage our exposure to fluctuations in market interest rates for our borrowings through the use of fixed rate debt instruments to the extent that reasonably favorable rates are obtainable.
Item 8. Financial Statements and Supplementary Data.
The information required by this Item 8 is incorporated by reference to our Financial Statements beginning on page F-1 of this Annual Report on Form 10-K.
Item 9. Changes in and Disagreements with Accountants on Accounting and Financial Disclosure.
None.
Item 9A. Controls and Procedures.
Evaluation of Disclosure Controls and Procedures
In connection with the preparation of this Form 10-K, as of December 31, 2010, an evaluation was performed under the supervision and with the participation of the Company's management, including our Chief Executive Officer (“CEO”) and Chief Financial Officer (“CFO”), of the effectiveness of the design and operation of our disclosure controls and procedures as defined in Rule 13a-15(e) under the Exchange Act. In performing this evaluation, management reviewed the selection, application and monitoring of our historical accounting policies. Based on that evaluation, the CEO and CFO concluded that as of December 31, 2010, these disclosure controls and procedures were effective and designed to ensure that the information required to be disclosed in our reports filed with the SEC is recorded, processed, summarized and reported on a timely basis. In designing and evaluating disclosure controls and procedures, management recognizes that any controls and procedures, no matter how well designed and operated, can provide only reasonable assurance of achieving the desired control objectives. Management is required to apply judgment in evaluating the cost-benefit relationship of possible controls and procedures.
Management’s Annual Report on Internal Control Over Financial Reporting
Our management is responsible for establishing and maintaining adequate internal control over financial reporting, as such term is defined in Exchange Act Rule 13a-15(f). Under the supervision and with the participation of our management, we
42
conducted an evaluation of the effectiveness of our internal control over financial reporting based on the framework in Internal Control—Integrated Framework issued by the Committee of Sponsoring Organizations of the Treadway Commission. Based on our evaluation under the framework in Internal Control—Integrated Framework, our management concluded that our internal control over financial reporting was effective as of December 31, 2010.
This annual report does not include an attestation report of the Company’s registered public accounting firm regarding internal control over financial reporting. Management’s report was not subject to attestation by the Company’s registered public accounting firm pursuant to temporary rules of the SEC that permit the Company to provide only management’s report in this annual report.
Changes in Internal Control Over Financial Reporting
There have been no changes during the Company's quarter ended December 31, 2010, in the Company's internal controls over financial reporting that have materially affected, or are reasonably likely to materially affect, the Company's internal control over financing reporting.
Item 9B. Other Information.
None.
43
PART III
Item 10. Trustees, Executive Officers and Corporate Governance.
The information required by Item 10 of Form 10-K is incorporated herein by reference to such information as set forth in the definitive proxy statement for our 2011 annual meeting of shareholders.
Item 11. Executive Compensation.
The information required by Item 11 of Form 10-K is incorporated herein by reference to such information as set forth in the definitive proxy statement for our 2011 annual meeting of shareholders.
Item 12. Security Ownership of Certain Beneficial Owners and Management and Related Shareholder Matters.
The following table provides information regarding our equity compensation plans as of December 31, 2010:
Plan Category | Number of securities to be issued upon exercise of outstanding options, warrants and rights | Weighted-average exercise price of outstanding options, warrants and rights | Number of securities remaining available for future issuance under equity compensation plans | |||||||||
Equity compensation plans approved by security holders | — | (1 | ) | $ | — | 473,814 | (2) | |||||
Equity compensation plans not approved by security holders | — | — | — | (3) | ||||||||
Total | — | $ | — | 473,814 | ||||||||
(1) Excludes 632,589 Class A common shares subject to outstanding restricted common share units granted pursuant to our 2008 Long-Term Equity Incentive Plan.
(2) Pursuant to our 2008 Long-Term Equity Incentive Ownership Plan, as amended (the “Plan”), the maximum aggregate number of Class B common shares that may be issued under the Plan will be increased upon each issuance of Class A and Class B common shares by the Company so that at any time the maximum number of shares that may be issued under the Plan shall equal 12.5% of the aggregate number of Class A and Class B common shares of the Company and OP units issued and outstanding (other than treasury shares and/or units issued to or held by the Company).
(3) Excludes 8,333 restricted Class A common shares issued to trustees outside the Plan. See Note 14 of the accompanying Consolidated Financial Statements for more information.
The remaining information required by Item 12 of Form 10-K is incorporated by reference to such information as set forth in the definitive proxy statement for our 2011 annual meeting of shareholders.
Item 13. Certain Relationships and Related Transactions, and Director Independence
The information required by Item 13 of Form 10-K is incorporated herein by reference to such information as set forth in the definitive proxy statement for our 2011 annual meeting of shareholders.
Item 14. Principal Accountant Fees and Services.
The information required by Item 14 of Form 10-K is incorporated herein by reference to such information as set forth in the definitive proxy statement for our 2011 annual meeting of shareholders.
44
PART IV
Item 15. Exhibits and Financial Statement Schedules.
1. | Financial Statements. The list of our financial statements filed as part of this Annual Report on Form 10-K is set forth on page F-1 herein. |
2. | Financial Statement Schedules. |
a. | Schedule II - Valuation and Qualifying Amounts |
b. | Schedule III - Real Estate and Accumulated Depreciation |
All other financial statement schedules have been omitted because the required information of such schedules is not present, is not present in amounts sufficient to require a schedule or is included in the consolidated financial statements.
3. | Exhibits. The list of exhibits filed as part of this Annual Report on Form 10-K in response to Item 601 of Regulation S-K is submitted on the Exhibit Index attached hereto and incorporated herein by reference. |
45
SIGNATURES
Pursuant to the requirements of Section 13 or 15(d) of the Securities Exchange Act of 1934, the Registrant has duly caused this report to be signed on its behalf by the undersigned, thereunto duly authorized.
WHITESTONE REIT | ||||
Date: | March 1, 2011 | By: | /s/ James C. Mastandrea | |
James C. Mastandrea, Chairman and CEO |
POWER OF ATTORNEY
KNOW ALL PERSONS BY THESE PRESENT, that each person whose signature appears below constitutes and appoints James C. Mastandrea and David K. Holeman, and each of them, acting individually, as his attorney-in-fact, each with full power of substitution and resubstitution, for him or her and in his or her name, place and stead, in any and all capacities, to sign any and all amendments to this Annual Report on Form 10-K, and to file the same, with all exhibits thereto, and other documents in connection therewith, with the Securities and Exchange Commission, granting unto said attorneys-in-fact and agents, and each of them, full power and authority to do and perform each and every act and thing requisite and necessary to be done in connection therewith and about the premises, as fully to all intents and purposes as he or she might or could do in person, hereby ratifying and confirming all that said attorneys-in-fact and agents, or any of them, or their or his or her substitute or substitutes, may lawfully do or cause to be done by virtue hereof.
Pursuant to the requirements of the Securities Exchange Act of 1934, this report has been signed below by the following persons on behalf of the Registrant and in the capacities and on the dates indicated.
March 1, 2011 | /s/ James C. Mastandrea | |
James C. Mastandrea, Chairman and CEO | ||
(Principal Executive Officer) | ||
March 1, 2011 | /s/ David K. Holeman | |
David K. Holeman, Chief Financial Officer | ||
(Principal Financial and Principal Accounting Officer) | ||
March 1, 2011 | /s/ Daryl J. Carter | |
Daryl J. Carter, Trustee | ||
March 1, 2011 | /s/ Daniel G. DeVos | |
Daniel G. DeVos, Trustee | ||
March 1, 2011 | /s/ Donald F. Keating | |
Donald F. Keating, Trustee | ||
March 1, 2011 | /s/ Jack L. Mahaffey | |
Jack L. Mahaffey, Trustee | ||
INDEX TO CONSOLIDATED FINANCIAL STATEMENTS
Page
All other schedules for which provision is made in the applicable accounting regulations of the Securities and Exchange Commission are not required under the related instructions or are inapplicable, and therefore have been omitted.
F- 1
Report of Independent Registered Public Accounting Firm
To the Board of Trustees and Shareholders of
Whitestone REIT
We have audited the accompanying consolidated balance sheets of Whitestone REIT and subsidiaries (the “Company”) as of December 31, 2010 and 2009, and the related consolidated statements of operations and comprehensive income, shareholders’ equity and cash flows, for each of the three years in the period ended December 31, 2010. In connection with our audits of the consolidated financial statements, we have also audited the financial statement schedules as listed in the accompanying index. These consolidated financial statements and financial statement schedules are the responsibility of the Company’s management. Our responsibility is to express an opinion on these financial statements and financial statement schedules based on our audits.
We conducted our audits in accordance with the standards of the Public Company Accounting Oversight Board (United States). Those standards require that we plan and perform the audits to obtain reasonable assurance about whether the financial statements are free of material misstatement. The Company is not required to have, nor were we engaged to perform, an audit of its internal control over financial reporting. Our audits included consideration of internal control over financial reporting as a basis for designing audit procedures that are appropriate in the circumstances, but not for the purposes of expressing an opinion on the effectiveness of the Company’s internal control over financial reporting. Accordingly, we express no such opinion. An audit also includes examining, on a test basis, evidence supporting the amounts and disclosures in the financial statements, assessing the accounting principles used and significant estimates made by management, as well as evaluating the overall financial statement presentation. We believe that our audits provide a reasonable basis for our opinion.
In our opinion, the financial statements referred to above present fairly, in all material respects, the consolidated financial position of Whitestone REIT and subsidiaries as of December 31, 2010 and 2009, and the consolidated results of their operations and their cash flows for each of the three years in the period ended December 31, 2010 in conformity with U.S. generally accepted accounting principles. Also, in our opinion, the related financial statement schedules, when considered in relation to the basic consolidated financial statements taken as a whole, present fairly, in all material respects, the information set forth therein.
/s/ PANNELL KERR FORSTER OF TEXAS, P.C.
Houston, Texas
March 1, 2011
F- 2
Whitestone REIT and Subsidiaries
CONSOLIDATED BALANCE SHEETS
( in thousands, except share data)
December 31, | ||||||||
2010 | 2009 | |||||||
ASSETS | ||||||||
Real estate assets, at cost: | ||||||||
Property | $ | 204,954 | $ | 192,832 | ||||
Accumulated depreciation | (39,556 | ) | (34,434 | ) | ||||
Total real estate assets | 165,398 | 158,398 | ||||||
Cash and cash equivalents | 17,591 | 6,275 | ||||||
Escrows and acquisition deposits | 4,385 | 8,155 | ||||||
Accrued rent and accounts receivable, net of allowance for doubtful accounts | 4,726 | 4,514 | ||||||
Unamortized lease commissions and loan costs | 3,598 | 3,973 | ||||||
Prepaid expenses and other assets | 747 | 685 | ||||||
Total assets | $ | 196,445 | $ | 182,000 | ||||
LIABILITIES AND EQUITY | ||||||||
Liabilities: | ||||||||
Notes payable | $ | 100,941 | $ | 101,782 | ||||
Accounts payable and accrued expenses | 7,292 | 9,954 | ||||||
Tenants' security deposits | 1,796 | 1,630 | ||||||
Dividends and distributions payable | 2,133 | 1,775 | ||||||
Total liabilities | 112,162 | 115,141 | ||||||
Commitments and Contingencies: | ||||||||
Equity: | ||||||||
Preferred shares, $0.001 par value per share; 50,000,000 shares authorized; none issued and | ||||||||
outstanding at December 31, 2010 and December 31, 2009, respectively | — | — | ||||||
Class A common shares, $0.001 par value per share; 50,000,000 shares authorized; 3,471,187 | ||||||||
and 3,445,769 issued and outstanding as of December 31, 2010 and December 31, 2009, | ||||||||
respectively | 3 | 10 | ||||||
Class B common shares, $0.001 par value per share; 350,000,000 shares authorized; | ||||||||
2,200,000 and 0 issued and outstanding as of December 31, 2010 and December 31, 2009, | ||||||||
respectively | 2 | — | ||||||
Additional paid-in capital | 93,357 | 69,952 | ||||||
Accumulated deficit | (30,654 | ) | (26,372 | ) | ||||
Total Whitestone REIT shareholders' equity | 62,708 | 43,590 | ||||||
Noncontrolling interest in subsidiary | 21,575 | 23,269 | ||||||
Total equity | 84,283 | 66,859 | ||||||
Total liabilities and equity | $ | 196,445 | $ | 182,000 | ||||
See notes to consolidated financial statements.
F- 3
Whitestone REIT and Subsidiaries
CONSOLIDATED STATEMENTS OF OPERATIONS AND COMPREHENSIVE INCOME
(in thousands, except per share data)
Year Ended December 31, | ||||||||||||
2010 | 2009 | 2008 | ||||||||||
Property revenues | ||||||||||||
Rental revenues | $ | 25,901 | $ | 26,449 | $ | 24,999 | ||||||
Other revenues | 5,632 | 6,236 | 6,202 | |||||||||
Total property revenues | 31,533 | 32,685 | 31,201 | |||||||||
Property expenses | ||||||||||||
Property operation and maintenance | 8,358 | 8,519 | 8,862 | |||||||||
Real estate taxes | 3,925 | 4,472 | 3,973 | |||||||||
Total property expenses | 12,283 | 12,991 | 12,835 | |||||||||
Other expenses (income) | ||||||||||||
General and administrative | 4,992 | 6,072 | 6,708 | |||||||||
Depreciation & amortization | 7,225 | 6,958 | 6,859 | |||||||||
Involuntary conversion | (558 | ) | (1,542 | ) | 358 | |||||||
Interest expense | 5,620 | 5,749 | 5,857 | |||||||||
Interest income | (28 | ) | (36 | ) | (182 | ) | ||||||
Total other expense | 17,251 | 17,201 | 19,600 | |||||||||
Income (loss) from continuing operations before loss on disposal of assets | ||||||||||||
and income taxes | 1,999 | 2,493 | (1,234 | ) | ||||||||
Provision for income taxes | (264 | ) | (222 | ) | (219 | ) | ||||||
Loss on sale or disposal of assets | (160 | ) | (196 | ) | (223 | ) | ||||||
Income (loss) from continuing operations | 1,575 | 2,075 | (1,676 | ) | ||||||||
Loss from discontinued operations | — | — | (188 | ) | ||||||||
Gain on sale of properties from discontinued operations | — | — | 3,619 | |||||||||
Net income | 1,575 | 2,075 | 1,755 | |||||||||
Less: Net income attributable to noncontrolling interests | 470 | 733 | 621 | |||||||||
Net income attributable to Whitestone REIT | $ | 1,105 | $ | 1,342 | $ | 1,134 | ||||||
See notes to consolidated financial statements.
F- 4
Whitestone REIT and Subsidiaries
CONSOLIDATED STATEMENTS OF OPERATIONS AND COMPREHENSIVE INCOME (LOSS)
(in thousands, except per share data)
Year Ended December 31, | ||||||||||||
2010 | 2009 | 2008 | ||||||||||
Earnings per share - basic | ||||||||||||
Income (loss) from continuing operations attributable to Whitestone REIT | ||||||||||||
excluding amounts attributable to unvested restricted shares | $ | 0.27 | $ | 0.41 | $ | (0.32 | ) | |||||
Income from discontinued operations attributable to Whitestone REIT | — | — | 0.67 | |||||||||
Net income attributable to common shareholders excluding amounts | ||||||||||||
attributable to unvested restricted shares | $ | 0.27 | $ | 0.41 | $ | 0.35 | ||||||
Earnings per share - diluted | ||||||||||||
Income (loss) from continuing operations attributable to Whitestone REIT | ||||||||||||
excluding amounts attributable to unvested restricted shares | $ | 0.27 | $ | 0.40 | $ | (0.32 | ) | |||||
Income from discontinued operations attributable to Whitestone REIT | — | — | 0.67 | |||||||||
Net income attributable to common shareholders excluding amounts attributable | ||||||||||||
to unvested restricted shares | $ | 0.27 | $ | 0.40 | $ | 0.35 | ||||||
Weighted average number of common shares outstanding: | ||||||||||||
Basic | 4,012 | 3,236 | 3,277 | |||||||||
Diluted | 4,041 | 3,302 | 3,277 | |||||||||
Dividends declared per Class A common share | $ | 1.19 | $ | 1.35 | $ | 1.59 | ||||||
Dividends declared per Class B common share (1) | 0.57 | — | — | |||||||||
Condensed Consolidated Statements of Comprehensive Income | ||||||||||||
Net income | $ | 1,575 | $ | 2,075 | $ | 1,755 | ||||||
Other comprehensive gain | ||||||||||||
Unrealized gain on cash flow hedging activities | — | — | 368 | |||||||||
Comprehensive income | 1,575 | 2,075 | 2,123 | |||||||||
Less: Comprehensive income attributable to noncontrolling interests | 470 | 733 | 759 | |||||||||
Comprehensive income attributable to Whitestone REIT | $ | 1,105 | $ | 1,342 | $ | 1,364 | ||||||
(1) Dividend rate is the same as Class A, but represents a partial year for Class B common shares issued August 26, 2010.
See notes to consolidated financial statements.
F- 5
Whitestone REIT and Subsidiaries
CONSOLIDATED STATEMENTS OF CHANGES IN EQUITY
(in thousands, except per share and unit data)
Accumulated | |||||||||||||||||||||||||||||||||||||||||
Class A | Class B | Additional | Other | Total | Noncontrolling | ||||||||||||||||||||||||||||||||||||
Common Shares | Common Shares | Paid-in | Accumulated | Comprehensive | Shareholders' | Interests | Total | ||||||||||||||||||||||||||||||||||
Shares | Amount | Shares | Amount | Capital | Deficit | Losss | Equity | Units | Dollars | Equity | |||||||||||||||||||||||||||||||
Balance, December 31, 2007 | 3,334 | $ | 10 | — | $ | — | $ | 72,273 | $ | (19,210 | ) | $ | (230 | ) | $ | 52,843 | 1,936 | $ | 28,039 | $ | 80,882 | ||||||||||||||||||||
Repurchase of common | |||||||||||||||||||||||||||||||||||||||||
stock and units | (98 | ) | — | — | — | (2,479 | ) | — | — | (2,479 | ) | (356 | ) | (4,762 | ) | (7,241 | ) | ||||||||||||||||||||||||
Reclassification of dividend | |||||||||||||||||||||||||||||||||||||||||
reinvestment plan shares | |||||||||||||||||||||||||||||||||||||||||
with rescission rights to | |||||||||||||||||||||||||||||||||||||||||
liabilities at $28.50 per | |||||||||||||||||||||||||||||||||||||||||
share | — | — | — | — | (606 | ) | — | — | (606 | ) | — | — | (606 | ) | |||||||||||||||||||||||||||
Dividends and distributions | — | — | — | — | — | (5,231 | ) | — | (5,231 | ) | — | (2,755 | ) | (7,986 | ) | ||||||||||||||||||||||||||
Unrealized loss on change in | |||||||||||||||||||||||||||||||||||||||||
fair value of cash flow | |||||||||||||||||||||||||||||||||||||||||
hedges | — | — | — | — | — | — | 230 | 230 | — | 138 | 368 | ||||||||||||||||||||||||||||||
Net income | — | — | — | — | — | 1,134 | — | 1,134 | — | 621 | 1,755 | ||||||||||||||||||||||||||||||
Balance, December 31, 2008 | 3,236 | 10 | — | — | 69,188 | (23,307 | ) | — | 45,891 | 1,580 | 21,281 | 67,172 | |||||||||||||||||||||||||||||
OP units issued at $15.45 per | |||||||||||||||||||||||||||||||||||||||||
per unit in connection with | |||||||||||||||||||||||||||||||||||||||||
property acquistion | — | — | — | — | — | — | — | — | 235 | 3,625 | 3,625 | ||||||||||||||||||||||||||||||
Share-based compensation | 210 | — | — | — | 764 | — | — | 764 | — | — | 764 | ||||||||||||||||||||||||||||||
Dividends and distributions | — | — | — | — | — | (4,407 | ) | — | (4,407 | ) | — | (2,370 | ) | (6,777 | ) | ||||||||||||||||||||||||||
Net income | — | — | — | — | — | 1,342 | — | 1,342 | — | 733 | 2,075 | ||||||||||||||||||||||||||||||
Balance, December 31, 2009 | 3,446 | 10 | — | — | 69,952 | (26,372 | ) | — | 43,590 | 1,815 | 23,269 | 66,859 | |||||||||||||||||||||||||||||
Change in par value of | |||||||||||||||||||||||||||||||||||||||||
common shares | — | (7 | ) | — | — | 7 | — | — | — | — | — | — | |||||||||||||||||||||||||||||
Issuance of common shares | — | — | 2,200 | 2 | 22,968 | — | — | 22,970 | — | — | 22,970 | ||||||||||||||||||||||||||||||
Share-based compensation | 41 | — | — | — | 73 | — | — | 73 | — | — | 73 | ||||||||||||||||||||||||||||||
Dividends and distributions | — | — | — | — | — | (5,387 | ) | — | (5,387 | ) | — | (2,164 | ) | (7,551 | ) | ||||||||||||||||||||||||||
Repurchase of common | |||||||||||||||||||||||||||||||||||||||||
shares (1) | (16 | ) | — | — | — | (249 | ) | — | — | (249 | ) | — | — | (249 | ) | ||||||||||||||||||||||||||
Reclassification of dividend | |||||||||||||||||||||||||||||||||||||||||
reinvestment plan shares | |||||||||||||||||||||||||||||||||||||||||
with expired rescission | |||||||||||||||||||||||||||||||||||||||||
rights to equity from | |||||||||||||||||||||||||||||||||||||||||
liabilities at $28.50 per share | — | — | — | — | 606 | — | — | 606 | — | — | 606 | ||||||||||||||||||||||||||||||
Net income | — | — | — | — | — | 1,105 | — | 1,105 | — | 470 | 1,575 | ||||||||||||||||||||||||||||||
Balance, December 31, 2010 | 3,471 | $ | 3 | 2,200 | $ | 2 | $ | 93,357 | $ | (30,654 | ) | $ | — | $ | 62,708 | 1,815 | $ | 21,575 | $ | 84,283 | |||||||||||||||||||||
(1) During the three months ended June 30, 2010, the Company acquired Class A common shares held by employees who tendered owned Common Shares to satisfy the tax withholding on the lapse of certain restrictions on restricted shares.
See notes to consolidated financial statements.
F- 6
Whitestone REIT and Subsidiary
CONSOLIDATED STATEMENTS OF CASH FLOWS
(in thousands)
Year Ended December 31, | ||||||||||||
2010 | 2009 | 2008 | ||||||||||
Cash flows from operating activities: | ||||||||||||
Net income (loss) | $ | 1,575 | $ | 2,075 | $ | (1,676 | ) | |||||
Net income from discontinued operations | — | — | 3,431 | |||||||||
1,575 | 2,075 | 1,755 | ||||||||||
Adjustments to reconcile net income (loss) to net cash provided by operating activities: | ||||||||||||
Depreciation and amortization | 7,225 | 6,958 | 6,859 | |||||||||
Loss on sale or disposal of assets | 160 | 196 | 223 | |||||||||
Bad debt expense | 536 | 877 | 731 | |||||||||
Share-based compensation | 297 | 1,013 | — | |||||||||
Changes in operating assets and liabilities: | ||||||||||||
Escrows and acquisition deposits | 3,840 | (3,700 | ) | (3,590 | ) | |||||||
Accrued rent and accounts receivable | (748 | ) | (511 | ) | (225 | ) | ||||||
Unamortized lease commissions and loan costs | (783 | ) | (634 | ) | (813 | ) | ||||||
Prepaid expenses and other assets | 446 | 527 | 417 | |||||||||
Accounts payable and accrued expenses | (2,319 | ) | 2,096 | 655 | ||||||||
Tenants' security deposits | 166 | 1 | 31 | |||||||||
Net cash provided by operating activities | 10,395 | 8,898 | 2,612 | |||||||||
Net cash provided by operating activities of discontinued operations | — | — | 8 | |||||||||
Cash flows from investing activities: | ||||||||||||
Acquisitions of real estate | (8,625 | ) | (5,619 | ) | — | |||||||
Additions to real estate | (4,143 | ) | (3,611 | ) | (5,153 | ) | ||||||
Net cash used in investing activities | (12,768 | ) | (9,230 | ) | (5,153 | ) | ||||||
Net cash used in investing activities of discontinued operations | — | — | (8 | ) | ||||||||
Cash flows from financing activities: | ||||||||||||
Dividends paid | (5,158 | ) | (4,645 | ) | (5,578 | ) | ||||||
Distributions paid to OP unit holders | (2,249 | ) | (2,281 | ) | (3,094 | ) | ||||||
Proceeds from issuance of common shares | 22,970 | — | — | |||||||||
Proceeds from notes payable | 1,430 | 9,557 | 95,053 | |||||||||
Repayments of notes payable | (2,957 | ) | (8,725 | ) | (78,990 | ) | ||||||
Payments of loan origination costs | (98 | ) | (288 | ) | (2,672 | ) | ||||||
Repurchase of common stock | (249 | ) | — | — | ||||||||
Net cash provided by (used in) financing activities | 13,689 | (6,382 | ) | 4,719 | ||||||||
Net increase (decrease) in cash and cash equivalents | 11,316 | (6,714 | ) | 2,178 | ||||||||
Cash and cash equivalents at beginning of period | 6,275 | 12,989 | 10,811 | |||||||||
Cash and cash equivalents at end of period | $ | 17,591 | $ | 6,275 | $ | 12,989 | ||||||
Supplemental disclosure of cash flow information: | ||||||||||||
Cash paid for interest | $ | 5,621 | $ | 5,535 | $ | 5,189 | ||||||
Cash paid for taxes | 262 | 223 | 224 | |||||||||
Non cash Investing and financing activities: | ||||||||||||
Disposal of fully depreciated real estate | $ | 598 | $ | 564 | $ | 698 | ||||||
Financed insurance premiums | 616 | 568 | 476 | |||||||||
Acquistion of real estate in exchange for OP units | — | 3,625 | — | |||||||||
Change in par value of Class A common shares | 7 | — | — | |||||||||
Disposal of real estate in settlement of lawsuit | — | — | 7,844 | |||||||||
Reclassification of dividend reinvestment shares with rescission rights | 606 | — | (606 | ) | ||||||||
See notes to consolidated financial statements.
F- 7
WHITESTONE REIT AND SUBSIDIARIES
Notes to Consolidated Financial Statements
December 31, 2010
1. DESCRIPTION OF BUSINESS AND NATURE OF OPERATIONS
Whitestone REIT (“Whitestone”) was formed as a real estate investment trust, pursuant to the Texas Real Estate Investment Trust Act on August 20, 1998. In July 2004, Whitestone changed its state of organization from Texas to Maryland pursuant to a merger of Whitestone directly with and into a Maryland real estate investment trust formed for the sole purpose of the reorganization and the conversion of each outstanding common share of beneficial interest of the Texas entity into 1.42857 common shares of beneficial interest of the Maryland entity. Whitestone serves as the general partner of Whitestone REIT Operating Partnership, L.P. (the “Operating Partnership” or “WROP” or “OP”), which was formed on December 31, 1998 as a Delaware limited partnership. Whitestone currently conducts substantially all of its operations and activities through the Operating Partnership. As the general partner of the Operating Partnership, Whitestone has the exclusive power to manage and conduct the business of the Operating Partnership, subject to certain customary exceptions. As of December 31, 2010, 2009 and 2008, we owned and operated 38, 36, and 35 retail, warehouse and office properties in and around Houston, Dallas, San Antonio, Chicago and Phoenix.
2. SUMMARY OF SIGNIFICANT ACCOUNTING POLICIES
Basis of Consolidation. We are the sole general partner of the Operating Partnership and possess full legal control and authority over the operations of the Operating Partnership. As of December 31, 2010, 2009 and 2008, we owned a majority of the partnership interests in the Operating Partnership. Consequently, the accompanying consolidated financial statements include the accounts of the Operating Partnership. All significant inter-company balances have been eliminated. Noncontrolling interest in the accompanying consolidated financial statements represents the share of equity and earnings of the Operating Partnership allocable to holders of partnership interests other than us. Net income or loss is allocated to noncontrolling interests based on the weighted-average percentage ownership of the Operating Partnership during the year. Issuance of additional Class A or Class B common shares of beneficial interest in Whitestone (collectively “common shares”) and units of limited partnership interest in the Operating Partnership that are convertible into cash or, at our option, Class A common shares on a one for one basis (“OP Units”) changes the ownership interests of both the noncontrolling interests and Whitestone.
Basis of Accounting. Our financial records are maintained on the accrual basis of accounting whereby revenues are recognized when earned and expenses are recorded when incurred.
Use of Estimates. The preparation of financial statements in conformity with U.S. generally accepted accounting principles requires management to make estimates and assumptions that affect the reported amounts of assets and liabilities and disclosure of contingent liabilities at the date of the financial statements and the reported amounts of revenues and expenses during the reporting period. Significant estimates that we use include the allocated purchase price of acquired properties, the estimated useful lives for depreciable and amortizable assets and costs, the estimated allowance for doubtful accounts, the estimated fair value of interest rate swaps and the estimates supporting our impairment analysis for the carrying values of our real estate assets. Actual results could differ from those estimates.
Reclassifications. We have reclassified certain prior fiscal year amounts in the accompanying consolidated financial statements in order to be consistent with the current fiscal year presentation. All of these adjustments are of a normal recurring nature with the exception of a retroactive restatement of share and unit counts and per share and unit amounts to reflect our 1-for-3 reverse share split in August 2010. For further details see Note 12, Equity.
Share-Based Compensation. From time to time we award nonvested restricted common share awards or restricted common share unit awards which may be converted into common shares, to trustees, executive officers and employees under our 2008 Long-Term Equity Incentive Ownership Plan (the “2008 Plan”). The vast majority of the awarded shares and units vest when certain performance conditions are met. We recognize compensation expense when achievement of the performance conditions is probable based on management’s most recent estimates using the fair value of the shares as of the grant date. We recognized $0.3 million and $1.0 million in share-based compensation expense for the years ended December 31, 2010 and December 31, 2009, respectively. No share-based compensation expense was recognized prior to 2009 as no awards had been granted.
F- 8
WHITESTONE REIT AND SUBSIDIARIES
Notes to Consolidated Financial Statements
December 31, 2010
Noncontrolling Interests. Noncontrolling interests is the portion of equity in a subsidiary not attributable to a parent. The ownership interests not held by the parent are considered noncontrolling interests. Accordingly, we have reported noncontrolling interests in equity on the condensed consolidated balance sheets but separate from Whitestone’s equity. On the consolidated statements of operations and comprehensive income, the subsidiaries are reported at the consolidated amount, including both the amount attributable to Whitestone and noncontrolling interests. Consolidated statements of changes in equity are included for both quarterly and annual financial statements, including beginning balances, activity for the period and ending balances for shareholders’ equity, noncontrolling interests and total equity.
Revenue Recognition. All leases on our properties are classified as operating leases, and the related rental income is recognized on a straight-line basis over the terms of the related leases. Differences between rental income earned and amounts due per the respective lease agreements are capitalized or charged, as applicable, to accrued rent receivable. Percentage rents are recognized as rental income when the thresholds upon which they are based have been met. Recoveries from tenants for taxes, insurance, and other operating expenses are recognized as revenues in the period the corresponding costs are incurred. We have established an allowance for doubtful accounts against the portion of tenant accounts receivable which is estimated to be uncollectible.
Cash and Cash Equivalents. We consider all highly liquid investments purchased with an original maturity of three months or less to be cash equivalents. Cash and cash equivalents as of December 31, 2010 and 2009 consist of demand deposits at commercial banks and brokerage accounts.
Real Estate
Development Properties. Land, buildings and improvements are recorded at cost. Expenditures related to the development of real estate are carried at cost which includes capitalized carrying charges and development costs. Carrying charges, primarily interest, real estate taxes and loan acquisition costs, and direct and indirect development costs related to buildings under construction, are capitalized as part of construction in progress. The capitalization of such costs ceases when the property, or any completed portion, becomes available for occupancy. Prior to that time, we expense these costs as acquisition expense. No interest was capitalized for the years ended December 31, 2010 and 2009. Approximately $0.4 million in interest was capitalized for the year ended December 31, 2008.
Acquired Properties and Acquired Lease Intangibles. We allocate the purchase price of the acquired properties to land, building and improvements, identifiable intangible assets and to the acquired liabilities based on their respective fair values. Identifiable intangibles include amounts allocated to acquired out-of-market leases, the value of in-place leases and customer relationship value, if any. We determine fair value based on estimated cash flow projections that utilize appropriate discount and capitalization rates and available market information. Estimates of future cash flows are based on a number of factors including the historical operating results, known trends and specific market and economic conditions that may affect the property. Factors considered by management in our analysis of determining the as-if-vacant property value include an estimate of carrying costs during the expected lease-up periods considering market conditions, and costs to execute similar leases. In estimating carrying costs, management includes real estate taxes, insurance and estimates of lost rentals at market rates during the expected lease-up periods, tenant demand and other economic conditions. Management also estimates costs to execute similar leases including leasing commissions, tenant improvements, legal and other related expenses. Intangibles related to out-of-market leases and in-place lease value are recorded as acquired lease intangibles and are amortized as an adjustment to rental revenue or amortization expense, as appropriate, over the remaining terms of the underlying leases. Premiums or discounts on acquired out-of-market debt are amortized to interest expense over the remaining term of such debt.
Depreciation. Depreciation is computed using the straight-line method over the estimated useful lives of 5 to 39 years for the buildings and improvements. Tenant improvements are depreciated using the straight-line method over the life of the improvement or remaining term of the lease, whichever is shorter.
Impairment. We review our properties for impairment at least annually or whenever events or changes in circumstances indicate that the carrying amount of the assets, including accrued rental income, may not be recoverable through operations. We determine whether an impairment in value has occurred by comparing the estimated future cash flows (undiscounted and without interest charges), including the estimated residual value of the property, with the carrying cost of the property. If impairment is indicated, a loss will be recorded for the amount by which the carrying value of the property exceeds its fair value. Management has determined that there has been no impairment in the carrying value of our real estate assets as
F- 9
WHITESTONE REIT AND SUBSIDIARIES
Notes to Consolidated Financial Statements
December 31, 2010
of December 31, 2010.
Accrued Rent and Accounts Receivable. Included in accrued rent and accounts receivable are base rents, tenant reimbursements and receivables attributable to recording rents on a straight-line basis. An allowance for the uncollectible portion of accrued rents and accounts receivable is determined based upon customer credit-worthiness (including expected recovery of our claim with respect to any tenants in bankruptcy), historical bad debt levels, and current economic trends. As of December 31, 2010 and 2009, we had an allowance for uncollectible accounts of $1.3 million and $0.9 million, respectively. During 2010, 2009 and 2008, we recorded bad debt expense in the amount of $0.5 million, $0.9 million and $0.7 million, respectively, related to tenant receivables that we specifically identified as potentially uncollectible based on our assessment of each tenant’s credit-worthiness. Bad debt expenses and any related recoveries are included in property operation and maintenance expense.
Unamortized Lease Commissions and Loan Costs. Leasing commissions are amortized using the straight-line method over the terms of the related lease agreements. Loan costs are amortized on the straight-line method over the terms of the loans, which approximates the interest method.
Prepaids and Other Assets. Prepaids and other assets include escrows established pursuant to certain mortgage financing arrangements for real estate taxes and insurance and acquisition deposits which include earnest money deposits on future acquisitions.
Federal Income Taxes. We elected to be taxed as a real estate investment trust ("REIT") under the Code beginning with our taxable year ended December 31, 1999. As a REIT, we generally are not subject to federal income tax on income that we distribute to our shareholders. If we fail to qualify as a REIT in any taxable year, we will be subject to federal income tax on our taxable income at regular corporate rates. We believe that we are organized and operate in such a manner as to qualify to be taxed as a REIT, and we intend to operate so as to remain qualified as a REIT for federal income tax purposes.
State Taxes. In May 2006, the State of Texas adopted House Bill 3, which modified the state’s franchise tax structure, replacing the previous tax based on capital or earned surplus with one based on margin (often referred to as the “Texas Margin Tax”) effective with franchise tax reports filed on or after January 1, 2008. The Texas Margin Tax is computed by applying the applicable tax rate (1% for us) to the profit margin, which, generally, will be determined for us as total revenue less a 30% standard deduction. Although House Bill 3 states that the Texas Margin Tax is not an income tax, FASB Accounting Standards Codification ("ASC") 740, “Income Taxes” applies to the Texas Margin Tax. We have recorded a margin tax provision of $0.3 million, $0.2 million and $0.2 million for the Texas Margin Tax for each of the years ended December 31, 2010, 2009 and 2008.
Derivative Instruments. We have initiated a program designed to manage exposure to interest rate fluctuations by entering into financial derivative instruments. The primary objective of this program is to comply with debt covenants on a credit facility. We sometimes enter into interest rate swap agreements with respect to amounts borrowed under certain of our credit facilities, which effectively exchanges existing obligations to pay interest based on floating rates for obligations to pay interest based on fixed LIBOR rates.
We have adopted provisions of ASC 820, “Fair Value Measurements and Disclosures” (“ASC 820”) which requires for items appropriately classified as cash flow hedges, that changes in the market value of the instrument and in the market value of the hedged item be recorded as other comprehensive income or loss with the exception of the portion of the hedged items that are considered ineffective. The derivative instruments are reported at fair value as other assets or other liabilities as applicable. As of December 31, 2010 and 2009, we did not have any interest rate swaps.
Fair Value of Financial Instruments. Our financial instruments consist primarily of cash, cash equivalents, accounts receivable, derivative instruments, accounts and notes payable. The carrying value of cash, cash equivalents, accounts receivable and accounts payable are representative of their respective fair values due to the short-term nature of these instruments. The fair value of our debt obligations is representative of its carrying value based upon current rates offered for similar types of borrowing arrangements. The fair value of interest rate swaps (used for hedging purposes) is the estimated amount that the financial institution would receive or pay to terminate the swap agreements at the reporting date, taking into account current interest rates and the current credit worthiness of the swap counterparties.
F- 10
WHITESTONE REIT AND SUBSIDIARIES
Notes to Consolidated Financial Statements
December 31, 2010
Concentration of Risk. Substantially all of our revenues are obtained from office, warehouse and retail locations in the Houston, Dallas and San Antonio, Texas metropolitan areas. We maintain cash accounts in major U.S. financial institutions. The terms of these deposits are on demand to minimize risk. The balances of these accounts sometimes exceed the federally insured limits, although no losses have been incurred in connection with these deposits.
Comprehensive Loss. In October 2007, we entered into an interest rate swap which was designated as a cash flow hedge. Amounts recorded to other comprehensive income are $0.0 million, $0.0 million and $0.4 million for the years ended December 31, 2010, 2009 and 2008, respectively. This swap matured in October 2008.
3. DERIVATIVES AND HEDGING
On September 28, 2007, we entered into an interest rate swap transaction which was designated as a cash flow hedge. The effective date of the swap transaction was October 1, 2007, which had a total notional amount of $70 million, and fixed the swap rate at 4.77% plus the LIBOR margin through October 1, 2008. The purpose of this swap was to mitigate the risk of future fluctuations in interest rates on our variable rate debt. We determined that this swap was highly effective in offsetting future variable interest cash flows on variable rate debt. During 2008, the balance in other comprehensive loss as of December 31, 2007 was amortized to interest expense.
On September 28, 2007, in conjunction with the execution of the $70 million interest rate swap transaction, we terminated an interest rate swap transaction that was initiated on March 16, 2006. This swap transaction had a total notional amount of $30 million, was at a fixed rate of 5.09% plus the LIBOR margin and was set to mature on March 11, 2008. As a result of this termination ($0.03) million is included in other income in our consolidated statements of operations for the year ended December 31, 2007.
4. REAL ESTATE
As of December 31, 2010, we owned 38 commercial properties in the Houston, Dallas, San Antonio, Phoenix and Chicago areas comprising approximately 3.2 million square feet of total area.
In November 2010, we acquired a property that meets our Community Centered Property strategy, containing 111,227 leasable square feet located in central Phoenix, Arizona for approximately $6.4 million in cash and net prorations. The property, Sunnyslope, a Class B community center, is situated in an ideal location across the street from John C. Lincoln Hospital, the major employer in the area, and within a quarter mile from Sunnyslope High School.
In September 2010, we acquired a property that meets our Community Centered Property strategy, containing 28,547 leasable square feet located in Scottsdale, Arizona for approximately $2.2 million in cash and net prorations. The property, The Citadel, a Class A community center, is strategically located at a prime intersection at Pinnacle Peak and Pima Roads.
In January 2009, we acquired a property that meets our Community Centered Property strategy, containing 41,396 leasable square feet located in Buffalo Grove, Illinois for approximately $9.4 million, including cash of $5.5 million, issuance of 703,912 OP units valued at approximately $3.6 million and credit for net prorations of $0.3 million. The property, Spoerlein Commons, is a two-story complex of retail, medical and professional office tenants. We acquired the property from Midwest Development Venture IV, an Illinois limited partnership controlled by James C. Mastandrea, our Chairman, President and Chief Executive Officer. Because of Mr. Mastandrea’s relationship with the seller, a special committee consisting solely of the independent trustees, negotiated the terms of the transaction, which included the use of an independent appraiser to value the property.
F- 11
5. ACCRUED RENT AND ACCOUNTS RECEIVABLE, NET
Accrued rent and accounts receivable, net, consists of amounts accrued, billed and due from tenants, allowance for doubtful accounts and other receivables as follows (in thousands):
December 31, | ||||||||
2010 | 2009 | |||||||
Tenant receivables | $ | 1,742 | $ | 1,770 | ||||
Accrued rent | 4,288 | 3,636 | ||||||
Allowance for doubtful accounts | (1,304 | ) | (894 | ) | ||||
Other receivables | — | 2 | ||||||
Totals | $ | 4,726 | $ | 4,514 | ||||
6. UNAMORTIZED LEASING COMMISSIONS AND LOAN COSTS
Costs which have been deferred consist of the following (in thousands):
December 31, | ||||||||
2010 | 2009 | |||||||
Leasing commissions | $ | 4,971 | $ | 4,601 | ||||
Deferred financing costs | 2,307 | 2,208 | ||||||
Total cost | 7,278 | 6,809 | ||||||
Less: leasing commissions accumulated amortization | (2,669 | ) | (2,246 | ) | ||||
Less: deferred financing cost accumulated amortization | (1,011 | ) | (590 | ) | ||||
Total cost, net of accumulated amortization | $ | 3,598 | $ | 3,973 | ||||
A summary of expected future amortization of deferred costs is as follows (in thousands):
Leasing | Deferred Financing | |||||||||||
Years Ended December 31, | Commissions | Costs | Total | |||||||||
2011 | $ | 731 | $ | 440 | $ | 1,171 | ||||||
2012 | 568 | 440 | 1,008 | |||||||||
2013 | 388 | 364 | 752 | |||||||||
2014 | 251 | 39 | 290 | |||||||||
2015 | 157 | 13 | 170 | |||||||||
Thereafter | 207 | — | 207 | |||||||||
Total | $ | 2,302 | $ | 1,296 | $ | 3,598 | ||||||
7. FUTURE MINIMUM LEASE INCOME
We lease the majority of our properties under noncancelable operating leases which provide for minimum base rentals plus, in some instances, contingent rentals based upon a percentage of the tenants’ gross receipts.
F- 12
A summary of minimum future rentals to be received (exclusive of renewals, tenant reimbursements, and contingent rentals) under noncancelable operating leases in existence at December 31, 2010 is as follows (in thousands):
Years Ended December 31, | Minimum Future Rents | |||
2011 | $ | 24,186 | ||
2012 | 20,036 | |||
2013 | 14,448 | |||
2014 | 9,972 | |||
2015 | 6,415 | |||
Thereafter | 14,536 | |||
Total | $ | 89,593 | ||
8. DEBT
Notes payable
Below is a detailed explanation of notes payable including key terms and maturities (in thousands):
Year Ended | ||||||||
December 31, | ||||||||
Description | 2010 | 2009 | ||||||
Fixed rate notes | ||||||||
$10.0 million 6.04% Note, due 2014 | $ | 9,498 | $ | 9,646 | ||||
$1.5 million 6.50% Note, due 2014 | 1,496 | — | ||||||
$11.2 million 6.52% Note, due 2015 | 10,908 | 11,043 | ||||||
$21.4 million 6.53% Notes, due 2013 | 20,142 | 20,721 | ||||||
$24.5 million 6.56% Note, due 2013 | 24,030 | 24,435 | ||||||
$9.9 million 6.63% Notes, due 2014 | 9,498 | 9,757 | ||||||
$0.5 million 5.05% Notes, due 2011 and 2010 | 13 | 52 | ||||||
Floating rate note | ||||||||
$26.9 million LIBOR + 2.86% Note, due 2013 | 25,356 | 26,128 | ||||||
$ | 100,941 | $ | 101,782 | |||||
Our debt was collateralized by 23 operating properties as of December 31, 2010 with a combined net book value of $110.1 million and 21 operating properties at December 31, 2009 with a combined net book value of $108.7 million. Our loans contain restrictions that would require the payment of prepayment penalties for the acceleration of outstanding debt and are secured by deeds of trust on certain of our properties and the assignment of certain rents and leases associated with those properties.
On September 10, 2010, we executed a promissory note (the "Promissory Note") in the amount of $1.5 million (the "New Loan") payable to MidFirst Bank, a federally chartered savings association (MidFirst), with an applicable interest rate of 6.5% per annum. Monthly payments of $10,128 began on November 1, 2010 and continue thereafter on the first day of each calendar month until February 1, 2014. The Promissory Note is secured by a second lien deed of trust on our Windsor Park retail facility located in Windcrest, Texas, a first lien deed of trust on our Brookhill office/flex building located in Houston, Texas and a first lien deed of trust on our Zeta office building located in Houston, Texas. The funds from the Promissory Note are being used for capital improvements to Windsor Park.
The loan documents executed in connection with the Promissory Note (the "Loan Documents") included a Limited Guaranty by us of the Promissory Note until the Windsor Park construction is completed. Following this event, we will remain
F- 13
WHITESTONE REIT AND SUBSIDIARIES
Notes to Consolidated Financial Statements
December 31, 2010
liable for the deficiency, if any, following a foreclosure of property securing the Promissory Note; provided that upon the occurrence of certain "Full Recourse Events" defined in the Loan Documents, our obligations shall convert to a full guarantee of the New Loan.
In connection with the Promissory Note, the Loan Documents also provided for a modification of our existing loan with MidFirst in the amount of $10,000,000 (the "Existing Loan"). The Loan Documents provide that the promissory note executed in connection with the Existing Loan is modified to be secured, in part, by second liens on the Brookhill and Zeta Buildings, as well as certain other modifications for the purpose of cross collateralizing and cross-defaulting the two loans. The Existing Loan is also modified by the Modification of Promissory Note which provide that payments of $61,773 began on October 1, 2010 and continue thereafter on the first day of each calendar month until February 1, 2014. Finally, the Loan Documents included the Modification of Limited Guaranty, which provided that the Limited Guaranty executed in connection with the Existing Loan was only for the deficiency, if any, following the foreclosure of property securing the Existing Loan; provided that upon the occurrence of certain "Full Recourse Events" defined in the Modification of Limited Guaranty, our obligations shall convert to a full guarantee of the Existing Loan.
Our loans are subject to customary financial covenants. As of December 31, 2010, we were in compliance with all loan covenants.
Annual maturities of notes payable as of December 31, 2010 are due during the following years (in thousands):
Amount Due | |||
Year | (in thousands) | ||
2011 | $ | 2,459 | |
2012 | 2,579 | ||
2013 | 66,424 | ||
2014 | 19,209 | ||
2015 | 10,270 | ||
2016 and thereafter | — | ||
Total | $ | 100,941 | |
9. EARNINGS PER SHARE
Basic earnings per share for Whitestone’s common shareholders is calculated by dividing income (loss) from continuing operations excluding amounts attributable to unvested restricted shares, income from discontinued operations, and the net income (loss) attributable to non-controlling interests by Whitestone’s weighted-average common shares outstanding during the period. Diluted earnings per share is computed by dividing the net income (loss) attributable to common shareholders excluding amounts attributable to unvested restricted shares, income from discontinued operations, and the net income (loss) attributable to non-controlling interests by the weighted-average number of common shares including any dilutive unvested restricted shares.
Certain of Whitestone’s performance restricted common shares are considered participating securities which require the use of the two-class method for the computation of basic and diluted earnings per share. During the years ended December 31, 2010, 2009 and 2008, 1,814,569, 1,814,569 and 1,579,962 OP Units, respectively, were excluded from the calculation of diluted earnings per share because their effect would be anti-dilutive.
For the year ended December 31, 2010, distributions of $251,000 were made to the holders of certain restricted common shares, $224,000 of which were charged against earnings. For the year ended December 31, 2009, distributions of $277,000 were made to holders of certain restricted common shares, $250,000 of which were charged against earnings, and no distributions were made on the performance restricted common shares prior to 2009. See Note 13 for information related to restricted common shares under the 2008 Plan.
F- 14
WHITESTONE REIT AND SUBSIDIARIES
Notes to Consolidated Financial Statements
December 31, 2010
Year Ended December 31, | ||||||||||||
(in thousands, except per share data) | 2010 | 2009 | 2008 | |||||||||
Numerator: | ||||||||||||
Income (loss) from continuing operations | $ | 1,575 | $ | 2,075 | $ | (1,676 | ) | |||||
Less: Net loss (income) attributable to noncontrolling interests | (470 | ) | (733 | ) | 627 | |||||||
Dividends paid on unvested restricted shares | (27 | ) | (27 | ) | — | |||||||
Undistributed earnings attributable to unvested restricted shares | — | — | — | |||||||||
Income (loss) from continuing operations attributable to Whitestone REIT | ||||||||||||
excluding amounts attributable to unvested restricted shares | 1,078 | 1,315 | (1,049 | ) | ||||||||
Income from discontinued operations | — | — | 3,431 | |||||||||
Less: Net income attributable to noncontrolling interests | — | — | (1,248 | ) | ||||||||
Income from discontinued operations attributable to Whitestone REIT | — | — | 2,183 | |||||||||
Net income attributable to common shareholders excluding amounts | ||||||||||||
attributable to unvested restricted shares | $ | 1,078 | $ | 1,315 | $ | 1,134 | ||||||
Denominator | ||||||||||||
Weighted average number of common shares - basic | 4,012 | 3,236 | 3,277 | |||||||||
Effect of dilutive securities: | ||||||||||||
Unvested restricted shares | 29 | 66 | — | |||||||||
Weighted average number of common shares - dilutive | 4,041 | 3,302 | 3,277 | |||||||||
Basic earnings per common share: | ||||||||||||
Income (loss) from continuing operations attributable to Whitestone REIT | ||||||||||||
excluding amounts attributable to unvested restricted shares | $ | 0.27 | $ | 0.41 | $ | (0.32 | ) | |||||
Income from discontinued operations attributable to Whitestone REIT | — | — | 0.67 | |||||||||
Net income attributable to common shareholders excluding amounts | ||||||||||||
attributable to unvested restricted shares | $ | 0.27 | $ | 0.41 | $ | 0.35 | ||||||
Diluted earnings per common share: | ||||||||||||
Income (loss) from continuing operations attributable to Whitestone REIT | ||||||||||||
excluding amounts attributable to unvested restricted shares | $ | 0.27 | $ | 0.40 | $ | (0.32 | ) | |||||
Income from discontinued operations attributable to Whitestone REIT | — | — | 0.67 | |||||||||
Net income attributable to common shareholders excluding amounts | ||||||||||||
attributable to unvested restricted shares | $ | 0.27 | $ | 0.40 | $ | 0.35 | ||||||
10. FEDERAL INCOME TAXES
Federal income taxes are not provided because we intend to and believe we qualify as a REIT under the provisions of the Internal Revenue Code and because we have distributed and intend to continue to distribute all of our taxable income to our shareholders. Our shareholders include their proportionate taxable income in their individual tax returns. As a REIT, we must distribute at least 90% of our real estate investment trust taxable income to our shareholders and meet certain income sources and investment restriction requirements. In addition, REITs are subject to a number of organizational and operational requirements. If we fail to qualify as a REIT in any taxable year, we will be subject to federal income tax (including any applicable alternative minimum tax) on our taxable income at regular corporate tax rates.
During 2010, we discovered that we may have inadvertently violated the “5% asset test,” as set forth in Section 856(c)(4)(B)(iii)(I) of the Code, for the quarter ended March 31, 2009 as a result of utilizing a certain cash management arrangement with a commercial bank. If our investment in a commercial paper investment sweep account through such cash management agreement is not treated as cash, and is instead treated as a security of a single issuer for purposes of the “5% asset test,” then we failed the “5% asset test” for the first quarter of our 2009 taxable year. We believe, however, that if we failed the “5% asset test,” our failure would be considered due to reasonable cause and not willful neglect and, therefore, we would not be disqualified as a REIT for our 2009 taxable year. We would be, however, subject to certain reporting requirements and a tax equal to the greater of
F- 15
WHITESTONE REIT AND SUBSIDIARIES
Notes to Consolidated Financial Statements
December 31, 2010
$50,000 or 35% of the net income from the commercial paper investment account during the period in which we failed to satisfy the “5% asset test.” The amount of such tax was $50,000, and we paid such tax on April 27, 2010.
If the IRS were to assert that we failed the “5% asset test” for the first quarter of our 2009 taxable year and that such failure was not due to reasonable cause, and the courts were to sustain that position, our status as a REIT would terminate as of December 31, 2008. We would not be eligible to again elect REIT status until our 2014 taxable year. Consequently, we would be subject to federal income tax on our taxable income at regular corporate rates without the benefit of the dividends-paid deduction, and our cash available for distributions to shareholders would be reduced.
Taxable income differs from net income for financial reporting purposes principally due to differences in the timing of recognition of interest, real estate taxes, depreciation and rental revenue.
For federal income tax purposes, the cash dividends distributed to shareholders are characterized as follows for the years ended December 31:
2010 | 2009 | 2008 | |||||||
Ordinary income (unaudited) | 37.8 | % | 40.5 | % | 3.8 | % | |||
Return of capital (unaudited) | 62.2 | % | 59.5 | % | 67.6 | % | |||
Capital gain distributions (unaudited) | — | % | — | % | 28.6 | % | |||
Total | 100.0 | % | 100.0 | % | 100.0 | % | |||
11. RELATED PARTY TRANSACTIONS
Spoerlein Commons Acquisition. On January 16, 2009, we, through our Operating Partnership, acquired Spoerlein Commons, a property located in Buffalo Grove, Illinois. Our Operating Partnership acquired Spoerlein Commons pursuant to the terms and conditions of the purchase, sale and contribution agreement dated December 18, 2008, between our Operating Partnership and Bank One Chicago, NA as trustee under a trust agreement dated January 29, 1986 (the “Seller”). Midwest Development Venture IV (“Midwest”) is the sole beneficiary of the Seller under the trust agreement.
An independent appraiser valued Spoerlein Commons at $9.6 million. In exchange for this property, our Operating Partnership paid the Seller $5.5 million, received credit for net prorations of $0.3 million and issued 234,637 OP Units, valued at $15.45 per unit, or an aggregate of $3.6 million, for a total purchase price of $9.4 million.
Midwest, the sole beneficiary of the Seller, was entitled to all earnings and proceeds from the sale of Spoerlein Commons. James C. Mastandrea, our Chairman, President and Chief Executive Officer, is the controlling limited partner in Midwest. Because of Mr. Mastandrea’s relationship with the Seller, a special committee of the independent trustees determined the terms of the transaction, which included the use of an independent appraiser to value Spoerlein Commons.
Our OP Units were issued in reliance on the exemption from registration provided by Section 4(2) under the Securities Act of 1933, as amended. The issuance was not effected using any form of general advertising or general solicitation, and the issuance was made to a qualified investor.
The OP Units received by Midwest were convertible on a one-for-one basis into cash or, at our option, our Class A common shares at any time after July 1, 2009 in accordance with the terms of the limited partnership agreement to our Operating Partnership. The Seller was not entitled to any distributions with respect to the OP Units prior to June 30, 2009. The results of Spoerlein Commons are included in our consolidated financial statements as of the date of the acquisition.
Executive Relocation. On July 9, 2010, upon the unanimous recommendation of our Compensation Committee, we entered into an arrangement with Mr. Mastandrea with respect to the disposition of his residence in Cleveland, Ohio. Mr. Mastandrea listed the residence in the second half of 2007 and has had no offers. In the meantime, Mr. Mastandrea has continued to pay for security, taxes, insurance and maintenance expenses related to the residence. In May 2010, we engaged a professional relocation firm to market the home and assist in moving the Mastandrea family to Houston. Since the engagement of the relocation firm, no offers on the home have been received. Under the relocation arrangement, we will pay Mr. Mastandrea the shortfall, if any, in the amount realized from the sale of the Cleveland residence, below $2,450,000, not to exceed $700,000, plus tax on the amount of such payment at the maximum federal income tax rate. The first $450,000 plus the tax on that amount will be paid in cash. Any amount payable in excess of $450,000 will be paid in common shares at the market value of the shares, as determined in the reasonable judgment of the Board, as of the time of the sale of the residence.
F- 16
The Common Shares payable to Mr. Mastandrea, if any, will be delivered over four consecutive quarters in equal installments. In addition, the arrangement requires us to continue paying the previously agreed upon cost of housing expenses for the Mastandrea family in Houston, Texas for a period of one year following the date of sale of the residence. We have previously agreed to reimburse Mr. Mastandrea for out of pocket moving costs including packing, temporary storage, transportation and moving supplies.
12. EQUITY
Under our declaration of trust, as amended, we have authority to issue up to 50 million Class A common shares of beneficial interest, $0.001 par value per share, up to 350 million Class B common shares of beneficial interest, $0.001 par value per share, and up to 50 million preferred shares of beneficial interest, $0.001 par value per share.
Recapitalization, listing and offering of Class B common shares
On August 24, 2010, we filed with the State Department of Assessments and Taxation of Maryland (the “SDAT”) amendments to our declaration of trust that (i) changed the name of all of our common shares of beneficial interest, par value $0.001 to Class A common shares, (ii) effected a 1-for-3 reverse share split of our Class A common shares and (iii) changed the par value of our Class A common shares to $0.001 per share after the reverse share split. In addition, we filed with the SDAT articles supplementary to our declaration of trust that created a new class of common shares of beneficial interest, par value $0.001, entitled “Class B common shares” (the “Class B common shares” and collectively with Class A common shares, the “common shares”). Share and unit counts and per share and unit amounts have been retroactively restated to reflect our 1-for-3 reverse share split in August 2010.
On August 25, 2010, in connection with the listing of our Class B common shares on the NYSE-Amex, we offered and subsequently issued 2.2 million Class B common shares which resulted in $23.0 million in net offering proceeds to us. As of December 31, 2010, we had 3,471,187 Class A common shares, 2,200,000 Class B common shares, and 1,814,569 OP Units, not held by us, outstanding. Each Class B common share has the following rights:
• | the right to vote together with Class A common shareholders on all matters submitted to the Company’s shareholders; |
• | one vote on all matters voted upon by the Company’s shareholders; |
• | the right to receive dividends equal to any dividends declared on the Class A common shares; and |
• | liquidation rights equal to the liquidation rights of each Class A common share. |
Operating Partnership Units
Substantially all of our business is conducted through the Operating Partnership. We are the sole general partner of the Operating Partnership. As of December 31, 2010, we owned a 75.4% interest in the Operating Partnership.
Limited partners in the Operating Partnership holding OP Units have the right to convert their OP Units into cash or, at our option, Class A common shares at a ratio of one OP Unit for one Class A common share. Distributions to OP Unit holders are paid at the same rate per unit as dividends per share of Whitestone. Subject to certain restrictions, OP Units are not convertible into Class A common shares until the later of one year after acquisition or an initial public offering of the common shares. As of December 31, 2010 and December 31, 2009, there were 7,364,943 and 5,139,541 OP Units outstanding, respectively. We owned 5,550,374 and 3,324,941 OP Units as of December 31, 2010 and December 31, 2009, respectively. The balance of the OP Units is owned by third parties, including certain trustees. Our weighted-average share ownership in the Operating Partnership was approximately 70.18%, 64.67% and 64.62% for the years ended December 31, 2010, 2009 and 2008, respectively.
F- 17
WHITESTONE REIT AND SUBSIDIARIES
Notes to Consolidated Financial Statements
December 31, 2010
Dividends and distributions
The following tables summarize the cash dividends paid or payable to holders of common shares and distributions paid or payable to holders of noncontrolling OP Units during the years ended December 31, 2010 and 2009 and the quarter ended March 31, 2010.
Class A Common Shareholders | Class B Common Shareholders | Noncontrolling OP Unit Holders | Total | |||||||||||||||||||||||||
Quarter Paid | Dividend Per Common Share | Total Amount Paid | Dividend Per Common Share | Total Amount Paid | Distribution Per OP Unit | Total Amount Paid | Total Amount Paid | |||||||||||||||||||||
2010 | ||||||||||||||||||||||||||||
Fourth Quarter | $ | 0.2850 | $ | 989 | $ | 0.2850 | $ | 627 | $ | 0.2850 | $ | 514 | $ | 2,130 | ||||||||||||||
Third Quarter | 0.2850 | 992 | 0.0960 | 211 | 0.2850 | 515 | 1,718 | |||||||||||||||||||||
Second Quarter | 0.3375 | 1,176 | — | — | 0.3375 | 610 | 1,786 | |||||||||||||||||||||
First Quarter | 0.3375 | 1,163 | — | — | 0.3375 | 610 | 1,773 | |||||||||||||||||||||
Total | $ | 1.2450 | $ | 4,320 | $ | 0.3810 | $ | 838 | $ | 1.2450 | $ | 2,249 | $ | 7,407 | ||||||||||||||
2009 | ||||||||||||||||||||||||||||
Fourth Quarter | $ | 0.3375 | $ | 1,163 | $ | — | $ | — | $ | 0.3375 | $ | 610 | $ | 1,773 | ||||||||||||||
Third Quarter | 0.3375 | 1,163 | — | — | 0.3375 | 610 | 1,773 | |||||||||||||||||||||
Second Quarter | 0.3375 | 1,163 | — | — | 0.3375 | 530 | 1,693 | |||||||||||||||||||||
First Quarter | 0.3375 | 1,156 | — | — | 0.3375 | 531 | 1,687 | |||||||||||||||||||||
Total | $ | 1.3500 | $ | 4,645 | $ | — | $ | — | $ | 1.3500 | $ | 2,281 | $ | 6,926 | ||||||||||||||
13. INCENTIVE SHARE PLAN
On July 29, 2008, our shareholders approved the 2008 Long-Term Equity Incentive Ownership Plan (the “Plan”). On December 22, 2010, our board amended the Plan to allow for the issuance of Class B common shares pursuant to the Plan. The Plan, as amended, provides that awards may be made with respect to Class B common shares of Whitestone or OP units, which may be converted into Class A common shares of Whitestone. The maximum aggregate number of Class B common shares that may be issued under the Plan is increased upon each issuance of Class A or Class B common shares by Whitestone (including issuances pursuant to the Plan) so that at any time the maximum number of shares that may be issued under the Plan shall equal 12.5% of the aggregate number of Class A and Class B common shares of Whitestone and OP units issued and outstanding (other than treasury shares and/or units issued to or held by Whitestone).
The Compensation Committee of Whitestone’s Board of Trustees administers the Plan, except with respect to awards to non-employee trustees, for which the Plan is administered by Whitestone’s Board of Trustees. The Compensation Committee is authorized to grant stock options, including both incentive stock options and non-qualified stock options, as well as stock appreciation rights, either with or without a related option. The Compensation Committee is also authorized to grant restricted Class B common shares, restricted Class B common share units, performance awards and other share-based awards.
On January 6, 2009, the Compensation Committee, pursuant to the Plan, granted to certain of our officers restricted Class A common shares and restricted Class A common share units subject to certain restrictions. The restricted Class A common shares and restricted Class A common share units will vest based on certain performance goals (as specified in the award agreement). The grantee is the record owner of the restricted Class A common shares and has all rights of a shareholder with respect to the restricted Class A common shares, including the right to vote the restricted Class A common shares and to receive dividends and distributions with respect to the restricted Class A common shares. The grantee has no rights of a shareholder with respect to the restricted Class A common share units, including no right to vote the restricted Class A common share units and no right to receive current dividends and distributions with respect to the restricted Class A common share units
F- 18
WHITESTONE REIT AND SUBSIDIARIES
Notes to Consolidated Financial Statements
December 31, 2010
until the restricted Class A common share units are fully vested and convertible to Class A common shares of Whitestone.
A summary of the share-based incentive plan activity as of and for the year ended December 31, 2010 is as follows:
Shares | Weighted-Average Grant Date Fair Value (1) | ||||||
Non-vested at January 1, 2010 | 588,564 | $ | 12.39 | ||||
Granted | 31,858 | 14.09 | |||||
Vested | (55,699 | ) | 12.48 | ||||
Forfeited | (42,282 | ) | 12.52 | ||||
Non-vested at December 31, 2010 | 522,441 | $ | 12.48 | ||||
Available for grant at December 31, 2010 | 473,814 | ||||||
(1) The fair value of the shares granted were determined based on observable market transactions occurring near the date of the grants.
A summary of our nonvested and vested shares activity for the years ended December 31, 2010, 2009 and 2008 is presented below:
Shares Granted | Shares Vested | |||||||||||||
Year Ended | Non-Vested Shares Issued | Weighted-Average Grant-Date Fair Value | Vested Shares | Total Vest-Date Fair Value | ||||||||||
(in thousands) | ||||||||||||||
2010 | 31,858 | $ | 14.09 | (55,699 | ) | $ | 695 | |||||||
2009 | 600,731 | 12.37 | — | — | ||||||||||
2008 | — | — | — | — | ||||||||||
Total compensation recognized in earnings for share-based payments for the years ended December 31, 2010 and December 31, 2009 was $0.3 million and $1.0 million, respectively, which represents achievement of the first performance-based target and anticipated vesting of certain restricted shares with time-based vesting. With our current asset base, management does not expect to achieve the next performance-based target. Should we increase our asset base, we may achieve the next performance-based target. As a result, as of December 31, 2010, there was no unrecognized compensation cost related to outstanding nonvested performance-based shares based on management’s current estimates. As of December 31, 2010, there was approximately $0.2 million in unrecognized compensation cost related to outstanding nonvested time-based shares which are expected to be recognized over a weighted-average period of approximately three years. There was no share-based compensation expense prior to 2009. The fair value of the shares granted during the years ended December 31, 2010 and 2009 was determined based on observable market transactions occurring near the date of the grants.
14. GRANTS TO TRUSTEES
On March 25, 2009, each of our five independent trustees was granted 1,667 restricted Class A common shares which vest in equal installments in 2010, 2011, and 2012. During the year ended December 31, 2010, 3,891 of these restricted shares vested. These restricted shares were granted pursuant to individual grant agreements and were not pursuant to our 2008 Plan.
The 8,333 Class A common shares granted to our five independent trustees had a weighted average grant date fair value of $14.81 per share, resulting in total unrecognized compensation cost of approximately $40,000 as of December 31, 2010, which is expected to be recognized over a weighted-average period of approximately one year. The fair value of the shares granted during 2009 was determined based on observable market transactions occurring near the date of the grants.
F- 19
15. COMMITMENTS AND CONTINGENCIES
We are a participant in various legal proceedings and claims that arise in the ordinary course of our business. These matters are generally covered by insurance. While the resolution of these matters cannot be predicted with certainty, we believe that the final outcome of these matters will not have a material effect on our financial position, results of operations, or cash flows.
Executive Relocation. On July 9, 2010, upon the unanimous recommendation of our Compensation Committee, we entered into an arrangement with Mr. Mastandrea with respect to the disposition of his residence in Cleveland, Ohio. Mr. Mastandrea listed the residence in the second half of 2007 and has had no offers. In the meantime, Mr. Mastandrea has continued to pay for security, taxes, insurance and maintenance expenses related to the residence. In May 2010 we engaged a professional relocation firm to market the home and assist in moving the Mastandrea family to Houston. Since the engagement of the relocation firm, no offers on the home have been received. Under the relocation arrangement, we will pay Mr. Mastandrea the shortfall, if any, in the amount realized from the sale of the Cleveland residence, below $2,450,000, not to exceed $700,000, plus tax on the amount of such payment at the maximum federal income tax rate. The first $450,000 plus the tax on that amount will be paid in cash. Any amount payable in excess of $450,000 will be paid in common shares at the market value of the shares, as determined in the reasonable judgment of the Board, as of the time of the sale of the residence. The common shares payable to Mr. Mastandrea, if any, will be delivered over four consecutive quarters in equal installments. In addition, the arrangement requires us to continue paying the previously agreed upon cost of housing expenses for the Mastandrea family in Houston, Texas for a period of one year following the date of sale of the residence. We have previously agreed to reimburse Mr. Mastandrea for out of pocket moving costs including packing, temporary storage, transportation and moving supplies.
16. INVOLUNTARY CONVERSION
Involuntary conversion was a gain of $0.6 million for the year ended December 31, 2010. The involuntary conversion gain of $0.6 million recognized during the year ended December 31, 2010 represents the completion of the repairs to the 31 properties impacted by Hurricane Ike at costs that were lower than we estimated as of December 31, 2009. The estimated costs were sensitive to the scope requirements of our lenders and labor and material costs of our vendors, and the final costs incurred were more favorable than we anticipated.
During the year ended December 31, 2009, we completed a settlement of our insurance claims related to our 31 properties damaged by Hurricane Ike. The settlement was $7.0 million in its entirety, with $6.5 million allocated to casualty claims and approximately $0.5 million allocated to loss of rents claims. For the year ended December 31, 2009, the $6.5 million in insurance proceeds allocated to casualty losses were offset by accrued repair costs of $5.1 million resulting in a gain of $1.4 million. The remaining $0.1 million in involuntary conversion gain for the year ended December 31, 2009 was realized on an insurance settlement we completed during 2009 on a chiller unit at our Uptown Tower property in Dallas, Texas.
Hurricane Ike-related repair costs of approximately $0.4 million included in involuntary conversion loss during the year ended December 31, 2008.
17. SEGMENT INFORMATION
Our management historically has not differentiated by property types and therefore does not present segment information.
F- 20
18. SELECT QUARTERLY FINANCIAL DATA (unaudited)
The following is a summary of our unaudited quarterly financial information for the years ended December 31, 2010 and 2009 (in thousands, except per share data):
First | Second | Third | Fourth | |||||||||||||
Quarter | Quarter | Quarter | Quarter | |||||||||||||
2010 | ||||||||||||||||
Revenues from continuing operations | $ | 7,709 | $ | 7,832 | $ | 7,933 | $ | 8,059 | ||||||||
Net income attributable to Whitestone REIT | 217 | 166 | 177 | 545 | ||||||||||||
Earnings per share: | ||||||||||||||||
Basic - Net income attributable to Whitestone REIT (1) | $ | 0.06 | $ | 0.05 | $ | 0.04 | $ | 0.10 | ||||||||
Diluted - Net income attributable to Whitestone REIT (1) | $ | 0.06 | $ | 0.05 | $ | 0.04 | $ | 0.10 | ||||||||
2009 | ||||||||||||||||
Revenues from continuing operations | $ | 8,044 | $ | 8,203 | $ | 8,484 | $ | 7,954 | ||||||||
Net income (loss) attributable to Whitestone REIT | (21 | ) | 47 | 601 | 715 | |||||||||||
Earnings per share: | ||||||||||||||||
Basic - Net income (loss) attributable to Whitestone REIT (1) | $ | (0.01 | ) | $ | 0.01 | $ | 0.18 | $ | 0.22 | |||||||
Diluted - Net income (loss) attributable to Whitestone REIT (1) | (0.01 | ) | 0.01 | 0.18 | 0.21 | |||||||||||
(1) The sum of individual quarterly basic and diluted earnings per share amounts may not agree with the year-to-date basic and diluted earning per share amounts as the result of each period's computation being based on the weighted average number of common shares outstanding during that period.
F- 21
Whitestone REIT and Subsidiaries
Schedule II - Valuation and Qualifying Accounts
December 31, 2010
(in thousands) | |||||||||||||||
Balance at | Charged to | Deductions | Balance at | ||||||||||||
Beginning | Costs and | from | End of | ||||||||||||
Description | of Period | Expense | Reserves | Period | |||||||||||
Allowance for doubtful accounts: | |||||||||||||||
Year ended December 31, 2010 | $ | 894 | $ | 536 | (126 | ) | $ | 1,304 | |||||||
Year ended December 31, 2009 | 1,497 | 877 | (1,480 | ) | 894 | ||||||||||
Year ended December 31, 2008 | 865 | 731 | (99 | ) | 1,497 | ||||||||||
F- 22
Whitestone REIT and Subsidiaries
Schedule III - Real Estate and Accumulated Depreciation
December 31, 2010
Costs Capitalized Subsequent | Gross Amount at which Carried at | |||||||||||||||||||||||||||
Initial Cost (in thousands) | to Acquisition (in thousands) | End of Period (in thousands)(1) (2) | ||||||||||||||||||||||||||
Building and | Improvements | Carrying | Building and | |||||||||||||||||||||||||
Property Name | Land | Improvements | (net) | Costs | Land | Improvements | Total | |||||||||||||||||||||
Retail Properties: | ||||||||||||||||||||||||||||
Bellnot Square | $ | 1,154 | $ | 4,638 | $ | 382 | $ | — | $ | 1,154 | $ | 5,020 | $ | 6,174 | ||||||||||||||
Bissonnet Beltway | 415 | 1,947 | 417 | — | 415 | 2,364 | 2,779 | |||||||||||||||||||||
Centre South | 481 | 1,596 | 453 | — | 481 | 2,049 | 2,530 | |||||||||||||||||||||
Greens Road | 354 | 1,284 | 137 | — | 354 | 1,421 | 1,775 | |||||||||||||||||||||
Holly Knight | 320 | 1,293 | 188 | — | 320 | 1,481 | 1,801 | |||||||||||||||||||||
Kempwood Plaza | 733 | 1,798 | 1,103 | — | 733 | 2,901 | 3,634 | |||||||||||||||||||||
Lion Square | 1,546 | 4,289 | 976 | — | 1,546 | 5,265 | 6,811 | |||||||||||||||||||||
Providence | 918 | 3,675 | 802 | — | 918 | 4,477 | 5,395 | |||||||||||||||||||||
Shaver | 184 | 633 | — | — | 184 | 633 | 817 | |||||||||||||||||||||
South Richey | 778 | 2,584 | 352 | — | 778 | 2,936 | 3,714 | |||||||||||||||||||||
Spoerlein Commons | 2,340 | 7,296 | 154 | — | 2,340 | 7,450 | 9,790 | |||||||||||||||||||||
SugarPark Plaza | 1,781 | 7,125 | 269 | — | 1,781 | 7,394 | 9,175 | |||||||||||||||||||||
Sunridge | 276 | 1,186 | 212 | — | 276 | 1,398 | 1,674 | |||||||||||||||||||||
Torrey Square | 1,981 | 2,971 | 876 | — | 1,981 | 3,847 | 5,828 | |||||||||||||||||||||
Town Park | 850 | 2,911 | 250 | — | 850 | 3,161 | 4,011 | |||||||||||||||||||||
Webster Point | 720 | 1,150 | 307 | — | 720 | 1,457 | 2,177 | |||||||||||||||||||||
Westchase | 423 | 1,751 | 2,734 | — | 423 | 4,485 | 4,908 | |||||||||||||||||||||
Windsor Park | 2,621 | 10,482 | 1,152 | — | 2,621 | 11,634 | 14,255 | |||||||||||||||||||||
$ | 17,875 | $ | 58,609 | $ | 10,764 | $ | — | $ | 17,875 | $ | 69,373 | $ | 87,248 | |||||||||||||||
Office/Flex Properties: | ||||||||||||||||||||||||||||
Brookhill | $ | 186 | $ | 788 | $ | 282 | $ | — | $ | 186 | $ | 1,070 | $ | 1,256 | ||||||||||||||
Corporate Park Northwest | 1,534 | 6,306 | 912 | — | 1,534 | 7,218 | 8,752 | |||||||||||||||||||||
Corporate Park West | 2,555 | 10,267 | 786 | — | 2,555 | 11,053 | 13,608 | |||||||||||||||||||||
Corporate Park Woodland | 652 | 5,330 | 484 | — | 652 | 5,814 | 6,466 | |||||||||||||||||||||
Dairy Ashford | 226 | 1,211 | 98 | — | 226 | 1,309 | 1,535 | |||||||||||||||||||||
Holly Hall | 608 | 2,516 | 172 | — | 608 | 2,688 | 3,296 | |||||||||||||||||||||
Interstate 10 | 208 | 3,700 | 417 | — | 208 | 4,117 | 4,325 | |||||||||||||||||||||
Main Park | 1,328 | 2,721 | 485 | — | 1,328 | 3,206 | 4,534 | |||||||||||||||||||||
Plaza Park | 902 | 3,294 | 876 | — | 902 | 4,170 | 5,072 | |||||||||||||||||||||
West Belt Plaza | 568 | 2,165 | 529 | — | 568 | 2,694 | 3,262 | |||||||||||||||||||||
Westgate | 672 | 2,776 | 418 | — | 672 | 3,194 | 3,866 | |||||||||||||||||||||
$ | 9,439 | $ | 41,074 | $ | 5,459 | $ | — | $ | 9,439 | $ | 46,533 | $ | 55,972 | |||||||||||||||
Office Properties: | ||||||||||||||||||||||||||||
9101 LBJ Freeway | $ | 1,597 | $ | 6,078 | $ | 1,107 | $ | — | $ | 1,597 | $ | 7,185 | $ | 8,782 | ||||||||||||||
Featherwood | 368 | 2,591 | 482 | — | 368 | 3,073 | 3,441 | |||||||||||||||||||||
Pima Norte | 1,086 | 7,162 | 800 | 517 | 1,086 | 8,479 | 9,565 | |||||||||||||||||||||
Royal Crest | 509 | 1,355 | 172 | — | 509 | 1,527 | 2,036 | |||||||||||||||||||||
Uptown Tower | 1,621 | 15,551 | 2,560 | — | 1,621 | 18,111 | 19,732 | |||||||||||||||||||||
Woodlake Plaza | 1,107 | 4,426 | 983 | — | 1,107 | 5,409 | 6,516 | |||||||||||||||||||||
Zeta Building | 636 | 1,819 | 297 | — | 636 | 2,116 | 2,752 | |||||||||||||||||||||
$ | 6,924 | $ | 38,982 | $ | 6,401 | $ | 517 | $ | 6,924 | $ | 45,900 | $ | 52,824 | |||||||||||||||
Total Operating Portfolio | $ | 34,238 | $ | 138,665 | $ | 22,624 | $ | 517 | $ | 34,238 | $ | 161,806 | $ | 196,044 | ||||||||||||||
The Citadel | $ | 472 | $ | 1,777 | $ | 32 | $ | — | $ | 472 | $ | 1,809 | $ | 2,281 | ||||||||||||||
Sunnyslope Village | 1,305 | 5,324 | — | — | 1,305 | 5,324 | 6,629 | |||||||||||||||||||||
$ | 1,777 | $ | 7,101 | $ | 32 | $ | — | $ | 1,777 | $ | 7,133 | $ | 8,910 | |||||||||||||||
Grand Totals | $ | 36,015 | $ | 145,766 | $ | 22,656 | $ | 517 | $ | 36,015 | $ | 168,939 | $ | 204,954 | ||||||||||||||
F- 23
Whitestone REIT and Subsidiaries
Schedule III - Real Estate and Accumulated Depreciation
December 31, 2010
Accumulated Depreciation | Date of | Date | Depreciation | |||||||||
Property Name | Encumbrances | (in thousands) | Construction | Acquired | Life | |||||||
Retail Properties: | ||||||||||||
Bellnot Square | $ | 1,161 | 1/1/2002 | 5-39 years | ||||||||
Bissonnet Beltway | 1,029 | 1/1/1999 | 5-39 years | |||||||||
Centre South | 784 | 1/1/2000 | 5-39 years | |||||||||
Greens Road | 612 | 1/1/1999 | 5-39 years | |||||||||
Holly Knight | (3) | 655 | 8/1/2000 | 5-39 years | ||||||||
Kempwood Plaza | (3) | 1,187 | 2/2/1999 | 5-39 years | ||||||||
Lion Square | (3) | 1,623 | 1/1/2000 | 5-39 years | ||||||||
Providence | (3) | 1,258 | 3/30/2001 | 5-39 years | ||||||||
Shaver | 239 | 12/17/1999 | 5-39 years | |||||||||
South Richey | (3) | 896 | 8/25/1999 | 5-39 years | ||||||||
Spoerlein Commons | 379 | 1/16/2009 | 5-39 years | |||||||||
SugarPark Plaza | (3) | 1,190 | 9/8/2004 | 5-39 years | ||||||||
Sunridge | (3) | 383 | 1/1/2002 | 5-39 years | ||||||||
Torrey Square | (3) | 1,398 | 1/1/2000 | 5-39 years | ||||||||
Town Park | (3) | 1,296 | 1/1/1999 | 5-39 years | ||||||||
Webster Point | 516 | 1/1/2000 | 5-39 years | |||||||||
Westchase | 719 | 1/1/2002 | 5-39 years | |||||||||
Windsor Park | (4) | 1,906 | 12/16/2003 | 5-39 years | ||||||||
$ | 17,231 | |||||||||||
Office/Flex Properties: | ||||||||||||
Brookhill | (5) | $ | 238 | 1/1/2002 | 5-39 years | |||||||
Corporate Park Northwest | 1,950 | 1/1/2002 | 5-39 years | |||||||||
Corporate Park West | (6) | 2,895 | 1/1/2002 | 5-39 years | ||||||||
Corporate Park Woodland | (7) | 2,024 | 11/1/2000 | 5-39 years | ||||||||
Dairy Ashford | 471 | 1/1/1999 | 5-39 years | |||||||||
Holly Hall | (7) | 664 | 1/1/2002 | 5-39 years | ||||||||
Interstate 10 | (7) | 1,839 | 1/1/1999 | 5-39 years | ||||||||
Main Park | (7) | 1,071 | 1/1/1999 | 5-39 years | ||||||||
Plaza Park | (7) | 1,350 | 1/1/2000 | 5-39 years | ||||||||
West Belt Plaza | (7) | 1,125 | 1/1/1999 | 5-39 years | ||||||||
Westgate | (7) | 792 | 1/1/2002 | 5-39 years | ||||||||
$ | 14,419 | |||||||||||
Office Properties: | ||||||||||||
9101 LBJ Freeway | (8) | $ | 1,301 | 8/10/2005 | 5-39 years | |||||||
Featherwood | 481 | 1/1/2000 | 5-39 years | |||||||||
Pima Norte | 529 | 10/4/2007 | 5-39 years | |||||||||
Royal Crest | 1,008 | 1/1/2000 | 5-39 years | |||||||||
Uptown Tower | (8) | 2,798 | 11/22/2005 | 5-39 years | ||||||||
Woodlake Plaza | (8) | 1,048 | 3/14/2005 | 5-39 years | ||||||||
Zeta Building | (5) | 707 | 1/1/2000 | 5-39 years | ||||||||
$ | 7,872 | |||||||||||
Total Operating Portflio | $ | 39,522 | ||||||||||
The Citadel | $ | 11 | 9/28/2010 | 5-39 years | ||||||||
Sunnyslope Village | 23 | 11/1/2010 | 5-39 years | |||||||||
$ | 34 | |||||||||||
Grand Total | $ | 39,556 | ||||||||||
F- 24
Whitestone REIT and Subsidiaries
Schedule III - Real Estate and Accumulated Depreciation
December 31, 2010
(1) Reconciliations of total real estate carrying value for the three years ended December 31, follows:
( in thousands) | ||||||||||||
2010 | 2009 | 2008 | ||||||||||
Balance at beginning of period | $ | 192,832 | $ | 180,397 | $ | 172,315 | ||||||
Additions during the period: | ||||||||||||
Acquisitions | 8,878 | 9,636 | — | |||||||||
Improvements | 4,142 | 3,770 | 9,402 | |||||||||
13,020 | 13,406 | 9,402 | ||||||||||
Deductions - cost of real estate sold or retired | (898 | ) | (971 | ) | (1,320 | ) | ||||||
Balance at close of period | $ | 204,954 | $ | 192,832 | $ | 180,397 | ||||||
(2) The aggregate cost of real estate (in thousands) for federal income tax purposes is $169,266.
(3) These properties secure a $21.4 million and a $9.9 million mortgage notes.
(4) This property secures a $10.0 million mortgage note.
(5) These properties secure a $1.5 million mortgage note.
(6) This property secures an $11.2 million mortgage note.
(7) These properties secure a $26.9 million mortgage note.
(8) These properties secure a $24.5 million mortgage note.
F- 25
Exhibit No. | Description |
3.1.1 | Amended and Restated Declaration of Trust of Whitestone REIT (previously filed as and incorporated by reference to Exhibit 3.1 to the Registrant’s Current Report on Form 8-K, filed on July 31, 2008) |
3.1.2 | Articles Supplementary (previously filed as and incorporated by reference to Exhibit 3(i).1 to the Registrant’s Current Report on Form 8-K, filed December 6, 2006) |
3.1.3 | Articles of Amendment (previously filed and incorporated by reference to Exhibit 3.1 to the Registrant's Current Report on Form 8-K, filed on August 24, 2010) |
3.1.4 | Articles of Amendment (previously filed and incorporated by reference to Exhibit 3.2 to the Registrant’s Current Report on Form 8-K, filed on August 24, 2010) |
3.1.5 | Articles Supplementary (previously filed and incorporated by reference to Exhibit 3.3 to the Registrant’s Current Report on Form 8-K, filed on August 24, 2010) |
3.2 | Amended and Restated Bylaws of Whitestone REIT (previously filed as and incorporated by reference to Exhibit 3.1 to the Registrant’s Current Report on Form 8-K, filed October 9, 2008) |
10.1 | Agreement of Limited Partnership of Whitestone REIT Operating Partnership, L.P. (previously filed as and incorporated by reference to Exhibit 10.1 to the Registrant’s General Form for Registration of Securities on Form 10, filed on April 30, 2003) |
10.2 | Certificate of Formation of Whitestone REIT Operating Partnership II GP, LLC (previously filed as and incorporated by reference to Exhibit 10.3 to the Registrant’s General Form for Registration of Securities on Form 10, filed on April 30, 2003) |
10.3 | Limited Liability Company Agreement of Whitestone REIT Operating Partnership II GP, LLC (previously filed as and incorporated by reference to Exhibit 10.4 to the Registrant’s General Form for Registration of Securities on Form 10, filed on April 30, 2003) |
10.4 | Agreement of Limited Partnership of Whitestone REIT Operating Partnership II, L.P. (previously filed as and incorporated by reference to Exhibit 10.6 to the Registrant’s General Form for Registration of Securities on Form 10, filed on April 30, 2003) |
10.5 | Form of Amendment to the Agreement of Limited Partnership of Whitestone REIT Operating Partnership, L.P. (previously filed in and incorporated by reference to Exhibit 10.1 to the Registrant’s Registration Statement on Form S-11, Commission File No. 333-111674, filed on December 31, 2003) |
10.6 | Promissory Note between HCP REIT Operating Company IV LLC and MidFirst Bank, dated March 1, 2007 (previously filed and incorporated by reference to Exhibit 10.25 to the Registrant’s Annual Report on Form 10-K for the year ended December 31, 2006, filed on March 30, 2007) |
10.7 | Term Loan Agreement among Whitestone REIT Operating Partnership, L.P., Whitestone Pima Norte LLC, Whitestone REIT Operating Partnership III LP, Hartman REIT Operating Partnership III LP LTD, Whitestone REIT Operating Partnership III GP LLC and KeyBank National Association, dated January 25, 2008 (previously filed as and incorporated by reference to Exhibit 10.29 to the Registrant’s Annual Report on Form 10-K for the year ended December 31, 2007, filed on March 31, 2008) |
10.8+ | Whitestone REIT 2008 Long-Term Equity Incentive Ownership Plan (previously filed and incorporated by reference to Exhibit 10.1 to the Registrant’s Current Report on Form 8-K, filed July 31, 2008) |
10.9 | Promissory Note among Whitestone Corporate Park West, LLC and MidFirst Bank dated August 5, 2008 (previously filed and incorporated by reference to Exhibit 99.1 to the Registrant’s Current Report on Form 8-K, filed August 8, 2008) |
Exhibit No. | Description |
10.10 | Promissory Note among Whitestone Centers LLC and Sun Life Assurance Company of Canada dated October 1, 2008 (previously filed and incorporated by reference to Exhibit 99.1 to the Registrant’s Current Report on Form 8-K, filed October 7, 2008) |
10.11 | Promissory Note among Whitestone Centers LLC and Sun Life Assurance Company of Canada dated October 1, 2008 (previously filed and incorporated by reference to Exhibit 99.2 to the Registrant’s Current Report on Form 8-K, filed October 7, 2008) |
10.12 | Promissory Note among Whitestone Centers LLC and Sun Life Assurance Company of Canada dated October 1, 2008 (previously filed and incorporated by reference to Exhibit 99.3 to the Registrant’s Current Report on Form 8-K, filed October 7, 2008) |
10.13 | Promissory Note among Whitestone Centers LLC and Sun Life Assurance Company of Canada dated October 1, 2008 (previously filed and incorporated by reference to Exhibit 99.4 to the Registrant’s Current Report on Form 8-K, filed October 7, 2008) |
10.14 | Promissory Note among Whitestone Centers LLC and Sun Life Assurance Company of Canada dated October 1, 2008 (previously filed and incorporated by reference to Exhibit 99.5 to the Registrant’s Current Report on Form 8-K, filed October 7, 2008) |
10.15 | Promissory Note among Whitestone Offices LLC and Nationwide Life Insurance Company dated October 1, 2008 (previously filed and incorporated by reference to Exhibit 99.6 to the Registrant’s Current Report on Form 8-K, filed October 7, 2008) |
10.16 | Promissory Note among Whitestone Industrial-Office LLC and Jackson Life Insurance Company dated October 3, 2008 (previously filed and incorporated by reference to Exhibit 10.1 to the Registrant’s Current Report on Form 8-K, filed October 9, 2008) |
10.17+ | Form of Restricted Common Share Award Agreement (Performance Vested) (previously filed and incorporated by reference to Exhibit 10.1 to the Registrant’s Current Report on Form 8-K, filed January 7, 2009) |
10.18+ | Form of Restricted Common Share Award Agreement (Time Vested) (previously filed and incorporated by reference to Exhibit 10.2 to the Registrant’s Current Report on Form 8-K, filed January 7, 2009) |
10.19+ | Form of Restricted Unit Award Agreement (previously filed and incorporated by reference to Exhibit 10.3 to the Registrant’s Current Report on Form 8-K, filed January 7, 2009) |
10.20 | Promissory Note among Whitestone Centers LLC and Sun Life Assurance Company of Canada dated February 3, 2009 (previously filed and incorporated by reference to Exhibit 10.1 to the Registrant’s Current Report on Form 8-K, filed February 10, 2009) |
10.21 | Promissory Note among Whitestone Centers LLC and Sun Life Assurance Company of Canada dated February 3, 2009 (previously filed and incorporated by reference to Exhibit 10.2 to the Registrant’s Current Report on Form 8-K, filed February 10, 2009) |
10.22 | Promissory Note among Whitestone Centers LLC and Sun Life Assurance Company of Canada dated February 3, 2009 (previously filed and incorporated by reference to Exhibit 10.3 to the Registrant’s Current Report on Form 8-K, filed February 10, 2009) |
10.23 | Promissory Note among Whitestone Centers LLC and Sun Life Assurance Company of Canada dated February 3, 2009 (previously filed and incorporated by reference to Exhibit 10.4 to the Registrant’s Current Report on Form 8-K, filed February 10, 2009) |
Exhibit No. | Description |
10.24 | Purchase, Sale and Contribution Agreement between Whitestone REIT Operating Partnership, L.P. and Bank One, Chicago, NA, as trustee for Midwest Development Venture IV dated December 18, 2008 (previously filed and incorporated by reference to Exhibit 10.8 to Registrant’s Quarterly Report on Form 10-Q, filed on May 15, 2009) |
10.25+ | Grant Agreement for Restricted Shares between Whitestone REIT and Daryl J. Carter (previously filed and incorporated by reference to Exhibit 10.9 to Registrant’s Quarterly Report on Form 10-Q, filed on May 15, 2009) |
10.26+ | Grant Agreement for Restricted Shares between Whitestone REIT and Daniel G. DeVos (previously filed and incorporated by reference to Exhibit 10.10 to Registrant’s Quarterly Report on Form 10-Q, filed on May 15, 2009) |
10.27+ | Grant Agreement for Restricted Shares between Whitestone REIT and Donald F. Keating (previously filed and incorporated by reference to Exhibit 10.11 to Registrant’s Quarterly Report on Form 10-Q, filed on May 15, 2009) |
10.28+ | Grant Agreement for Restricted Shares between Whitestone REIT and Jack L.Mahaffey (previously filed and incorporated by reference to Exhibit 10.12 toRegistrant’s Quarterly Report on Form 10-Q, filed on May 15, 2009) |
10.29+ | Grant Agreement for Restricted Shares between Whitestone REIT and Chris A.Minton (previously filed and incorporated by reference to Exhibit 10.13 toRegistrant’s Quarterly Report on Form 10-Q, filed on May 15, 2009) |
10.30 | Promissory Note dated September 10, 2010 between Whitestone REIT Operating Company IV LLC and MidFirst Bank (previously filed and incorporated by reference to Exhibit 10.1 to the Registrant's Current Report on Form 8-K, filed September 16, 2010) |
10.31 | Modification of Promissory Note dated September 10, 2010 between Whitestone REIT Operating Company IV LLC and MidFirst Bank (previously filed and incorporated by reference to Exhibit 10.2 to the Registrant's Current Report on Form 8-K, filed September 16, 2010) |
10.32 | Limited Guarantee dated September 10, 2010 between Whitestone REIT Operating Company IV LLC and MidFirst Bank (previously filed and incorporated by reference to Exhibit 10.3 to the Registrant's Current Report on Form 8-K, filed September 16, 2010) |
10.33+* | First Amendment to the Whitestone REIT 2008 Long-Term Equity Incentive Ownership Plan |
21.1* | List of subsidiaries of Whitestone REIT |
23.1* | Consent of Pannell Kerr Forster of Texas, P.C. |
24.1 | Power of Attorney (included on the Signatures page hereto) |
31.1* | Certification of Principal Executive Officer pursuant to Section 302 of the Sarbanes-Oxley Act of 2002 |
31.2* | Certification of Principal Financial Officer pursuant to Section 302 of the Sarbanes-Oxley Act of 2002 |
32.1* | Certificate of Chief Executive Officer pursuant to Section 906 of the Sarbanes-Oxley Act of 2002 |
Exhibit No. | Description |
32.2* | Certificate of Chief Financial Officer pursuant to Section 906 of the Sarbanes-Oxley Act of 2002 |
________________________
* Filed herewith.
+ Denotes management contract or compensatory plan or arrangement.