Attached files
| file | filename |
|---|---|
| 8-K - CURRENT REPORT - FIFTH THIRD BANCORP | d8k.htm |
 Fifth Third Bank | All Rights Reserved
Exhibit 99.1
KBW 2011 Bank Conference
Dan Poston
Executive Vice President & Chief Financial Officer
March 1, 2011
Please refer to earnings release dated January 19, 2011 for further information
|
 2
Fifth Third Bank | All Rights Reserved
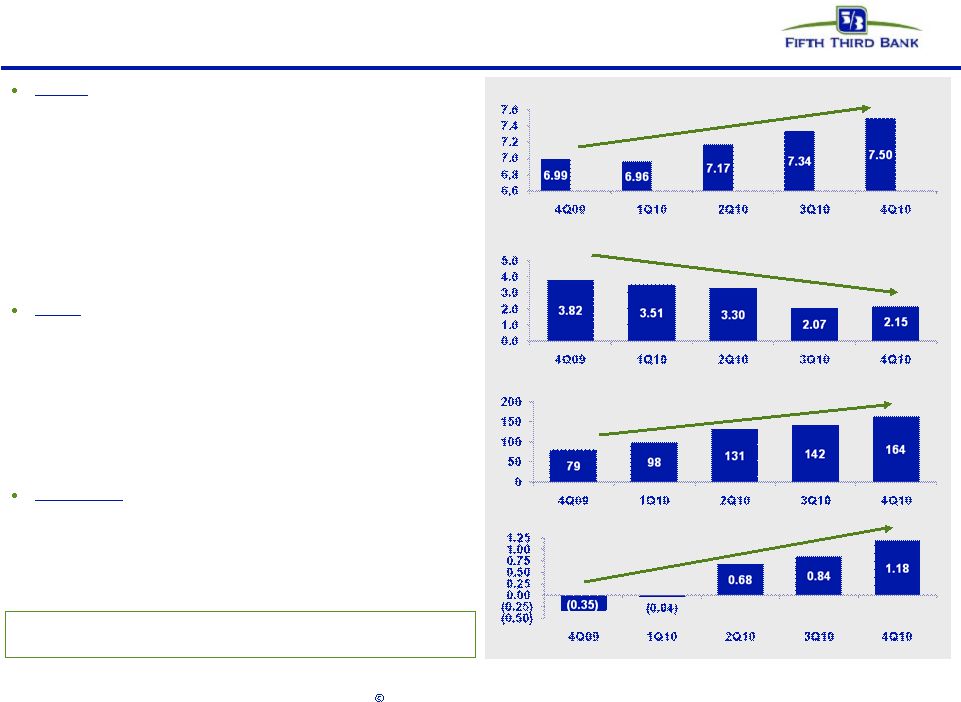
A foundation of continued growth
Capital
–
foundation for continued growth
—
Tier 1 common capital has increased 313bps or $2.6bn¹
—
Capital base transformed through series of capital actions
–
9.4% pro forma Tier 1 ratio excluding trust preferred
securities to be phased-out beginning 2013
—
Capital levels supplemented by strong reserve levels
–
Loan loss reserves 3.88% of loans and 179% of NPLs
—
9.0% pro forma Tier 1 common ratio is $1.0bn in excess of
internal 8.0% target
Credit
–
ongoing discipline driving steady improvement
—
Broad-based improvements in problem loans
–
72% reduction in 90+ day delinquent loans since 3Q09
–
NCO ratio of 1.86%, first time below 2.0% since 2Q08
–
164%
PPNR²
/
NCOs
in
4Q10
—
Balance sheet risk lowered through asset sales, resolutions
–
$1.3bn (43%) decline in NPLs since 4Q09
Profitability
–
recent results support positive momentum
—
PPNR remained stable throughout cycle
—
5 consecutive quarters of increasing earnings with 3
consecutive profitable quarters
—
Return on assets 1.18%; Return on average common equity
10.4% in 4Q10
1
Since December 31, 2008
2
Pre-provision net revenue (PPNR): net interest income plus noninterest income
minus noninterest expense; refer to reconciliation on page 25
Tier 1 common ratio (%)
NPL / Loans³
(%)
PPNR / Net charge-offs (%)
Return on assets (%)
4
Well positioned due to combination of strong PPNR trends,
robust reserves and strong Tier 1 common capital
3
Nonperforming loans and leases as a percent of portfolio loans,
leases and other assets, including other real estate owned
(excludes nonaccrual loans held-for-sale)
4
Excluding $510mm net charge-offs attributable to credit actions and $127mm in
net BOLI settlement gains |
 3
Fifth Third Bank | All Rights Reserved
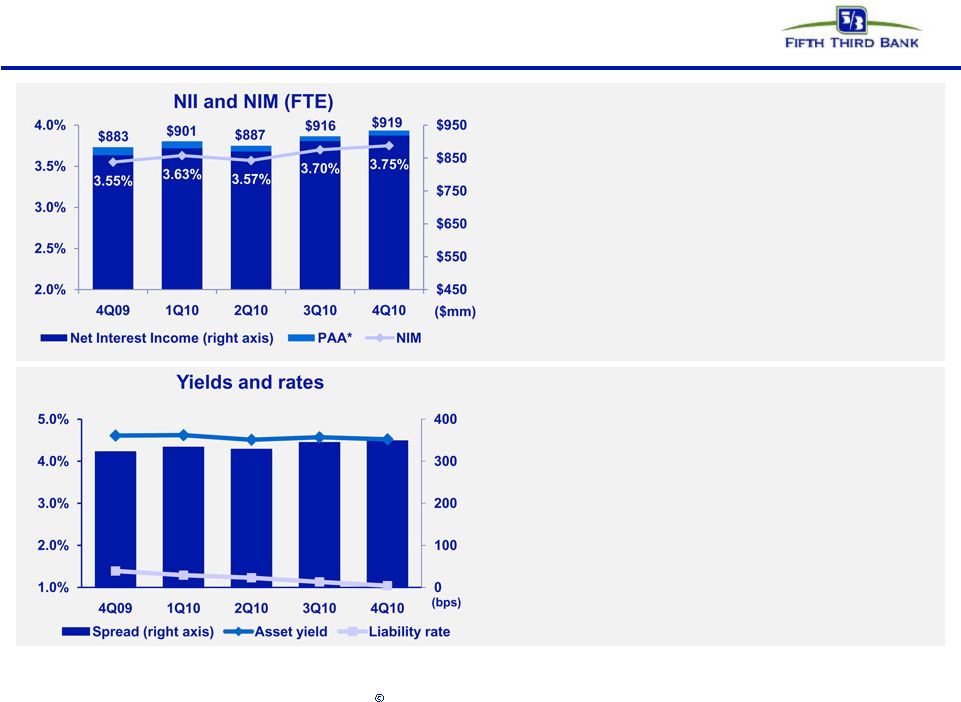
Net interest income
•
Sequential trends in net interest income and net
interest margin (FTE) reflect CD repricing,
deposit mix shift out of CDs, higher average total
loan balances and continued deposit pricing
discipline partially offset by effect of FTPS loan
refinancing
–
NII up $3mm sequentially and up $36mm,
or 4%, year-over-year
–
NIM up 5 bps sequentially and 20 bps year-
over-year
* Represents purchase accounting adjustments included in net interest income.
•
Yield on interest-earning assets down 5 bps
sequentially and down 9 bps year-over-year
–
Average loan and lease yield down 7 bps
sequentially and up 1 bp
versus prior year
•
Cost of interest-bearing liabilities down 9 bps
sequentially and down 35 bps versus prior year |
 4
Fifth Third Bank | All Rights Reserved
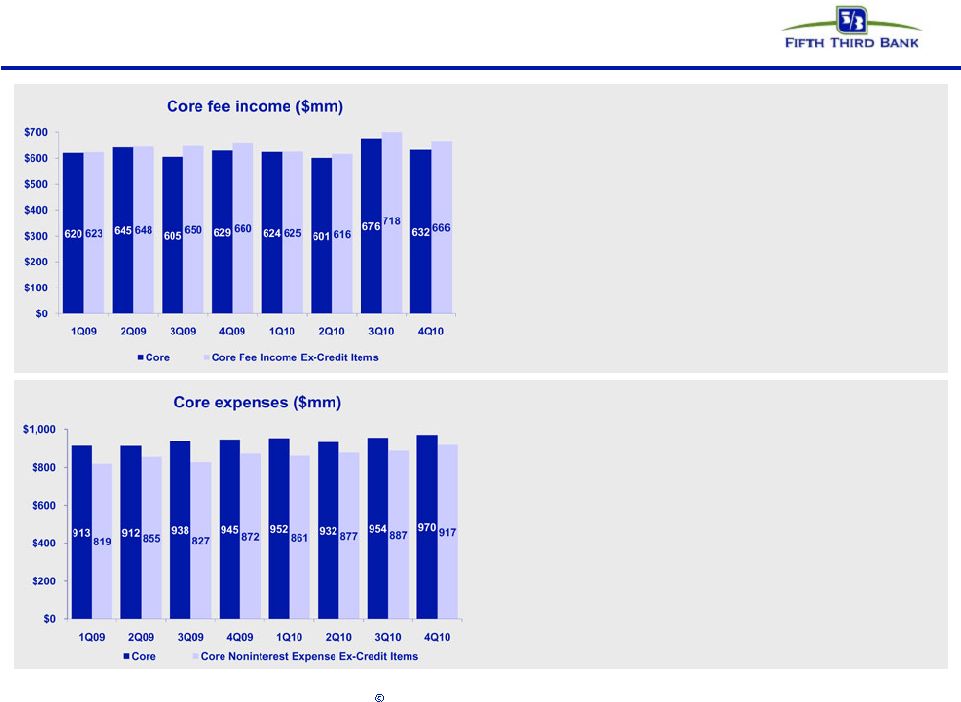
Core fee income growth and stable core expenses
•
Core noninterest income of $632mm decreased $44mm, or
7%, compared with prior quarter, primarily due to lower
mortgage banking net revenue
•
Strong mortgage banking net revenue ($149mm) driven by
originations of $7.4bn; recent mortgage activity down
significantly due to higher rates
•
Strong corporate banking revenue results (+21%)
•
Deposit service charges down just 3% sequentially despite
impact from Reg
E (estimated 4Q10 impact of $17mm, or
$68mm annualized, before effect of mitigation)
•
Credit-related costs affected fee income by $34mm in 4Q10
compared with $42mm in 3Q10 and $31mm in 4Q09
•
Expense trends continue to reflect elevated credit costs
•
Core efficiency ratio of 62.5% in 4Q10, compared with 59.9%
in 3Q10 and 62.6% in 4Q09
•
Credit-related costs declined sequentially but remained
elevated at $53mm in 4Q10 ($67mm in 3Q10 and $73mm in
4Q09)
•
Noninterest expense related to mortgage repurchases
$20mm in 4Q10 compared with $45mm in 3Q10 and $17mm
in 4Q09
* Refer to slide 25 for itemized effects of non-core fees and expenses
|
 5
Fifth Third Bank | All Rights Reserved
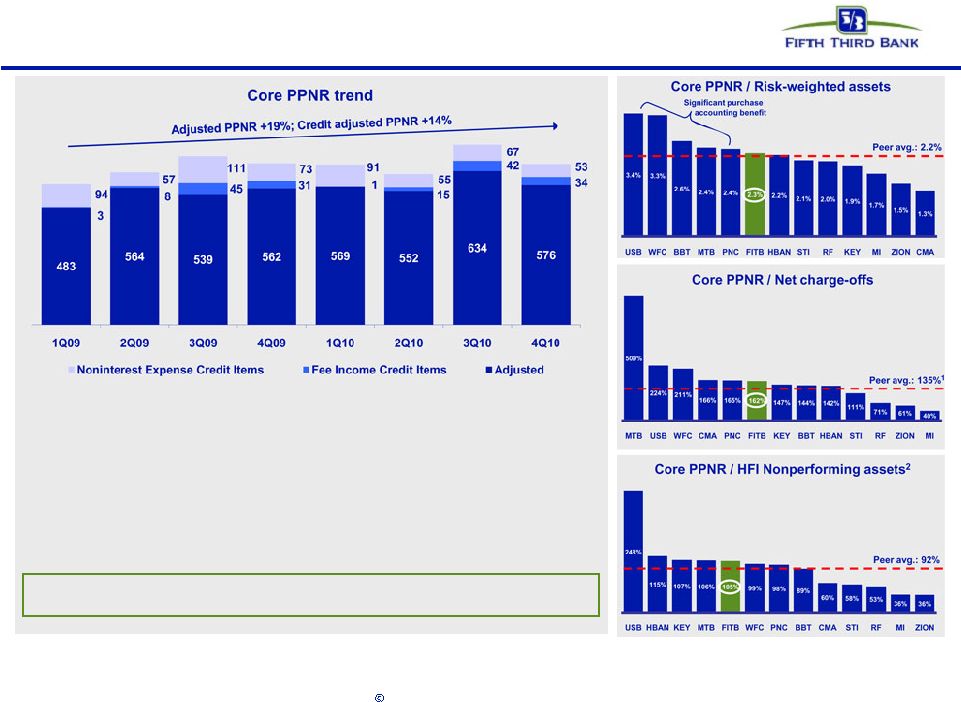
Strong pre-provision net revenue
* Pre-provision net revenue (PPNR): net interest income plus noninterest income
minus noninterest expense; refer to slide 25 for reconciliation Source: SNL
Financial and company reports. Data as of 4Q10 unless noted otherwise 1
Peer average excludes MTB
2
NPAs
exclude covered assets for BBT, USB, ZION
•
Reported PPNR of $583mm down 34% from strong 3Q10 levels, which
included higher mortgage banking revenue, and up 4% over prior year
•
Adjusted PPNR of $576mm, due to adjustments totaling ($7mm),
resulting in sequential decrease of 9% and year-over-year increase of
2%
•
Excluding the impact of credit-related adjustments ($87mm in 4Q10),
PPNR down 11% versus 3Q10; stable versus 4Q09
Robust profitability provides strong loss absorption |
 6
Fifth Third Bank | All Rights Reserved
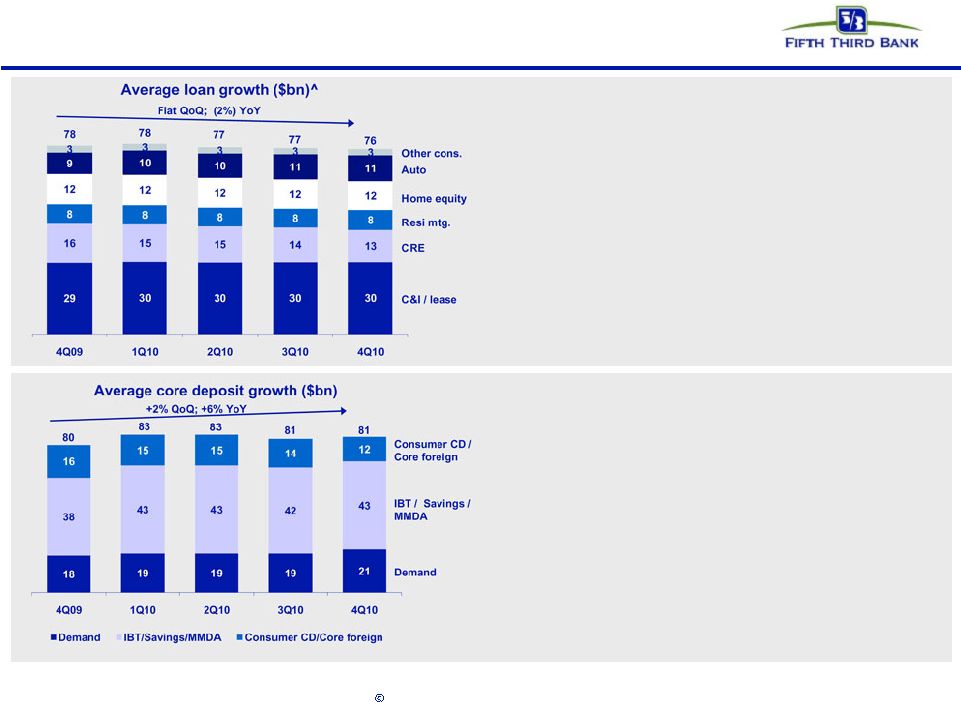
Balance sheet
•
Extended $26bn of new and renewed credit in 4Q10
•
C&I loans flat sequentially and up 2% from the previous
year
•
CRE loans down 8% sequentially and 18% from the
previous year
•
Consumer loans up 2% sequentially and up 4% from the
previous year
•
$2.3bn of warehoused residential mortgage loans held-
for-sale at quarter end
•
Core deposit to loan ratio of 100%, up from 93% in 4Q09
•
DDAs
up 9% sequentially and 16% year-over-year
•
Retail average transaction deposits up 4% sequentially
and 14% from the previous year, driven by growth in
demand deposit, savings, and interest checking account
balances
•
Commercial average transaction deposits up 5%
sequentially, driven by growth in demand deposit interest
checking account balance
–
Excluding public funds balances, commercial average
transaction deposits increased 6% sequentially and
33% over prior year
^ Excludes loans held-for-sale
Note: Numbers may not sum due to rounding |
 7
Fifth Third Bank | All Rights Reserved
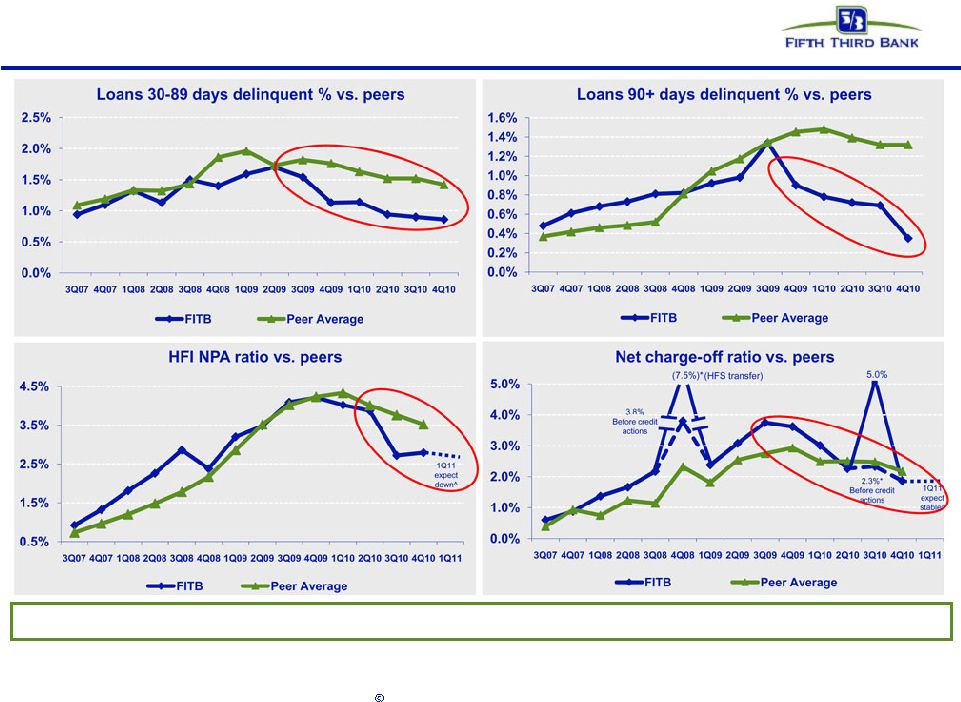
Strong relative credit trends
Source: SNL Financial and company filings. Peers include: BBT, CMA, HBAN, KEY, MI,
MTB, PNC, RF, STI, USB, WFC, and ZION. NPA and NCO ratios exclude loans
held-for-sale and covered assets for peers where appropriate..
*
4Q08
NCOs
included
$800mm
in
NCOs
related
to
commercial
loans
moved
to
held-for-sale;
3Q10
NCOs
included
$510mm
in
NCOs
related
to
loans
sold
or
moved
to
held-for-sale
^ Expected as of January 19, 2011
FITB credit metrics are now generally better than peers
|
 8
Fifth Third Bank | All Rights Reserved
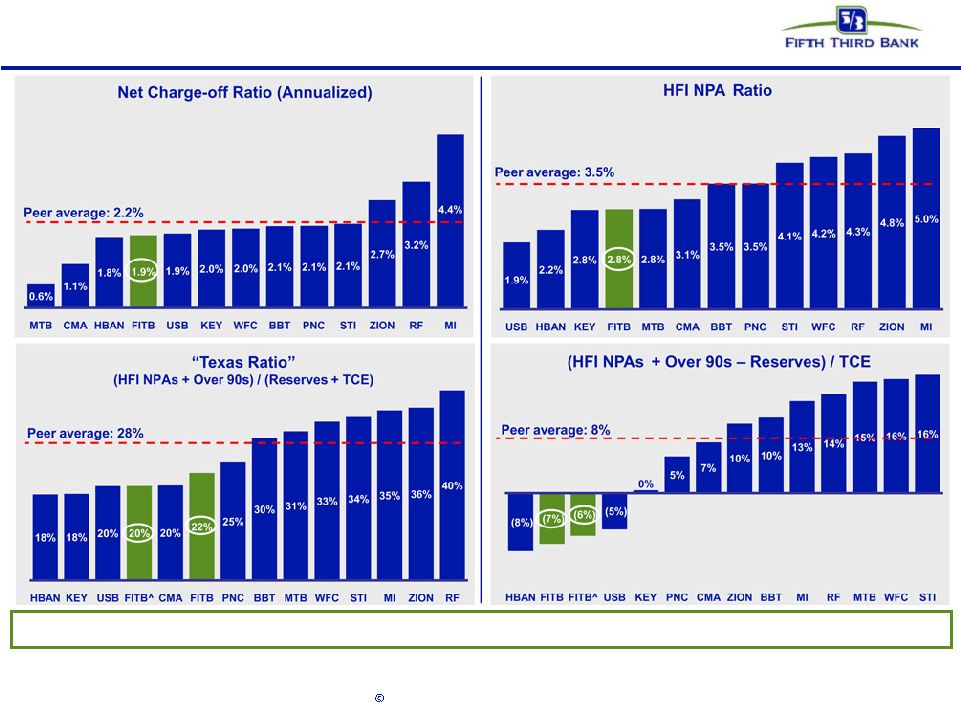
Strong credit metrics compared with peers
Source:
SNL
Financial
and
company
reports.
Data
as
of
4Q10.
HFI
NPAs
exclude
covered
assets
for
BBT,
USB,
and
ZION
^ FITB pro forma for $1.7bn common equity issuance
FITB credit metrics lower than peer average and represent position of relative
strength |
 9
Fifth Third Bank | All Rights Reserved
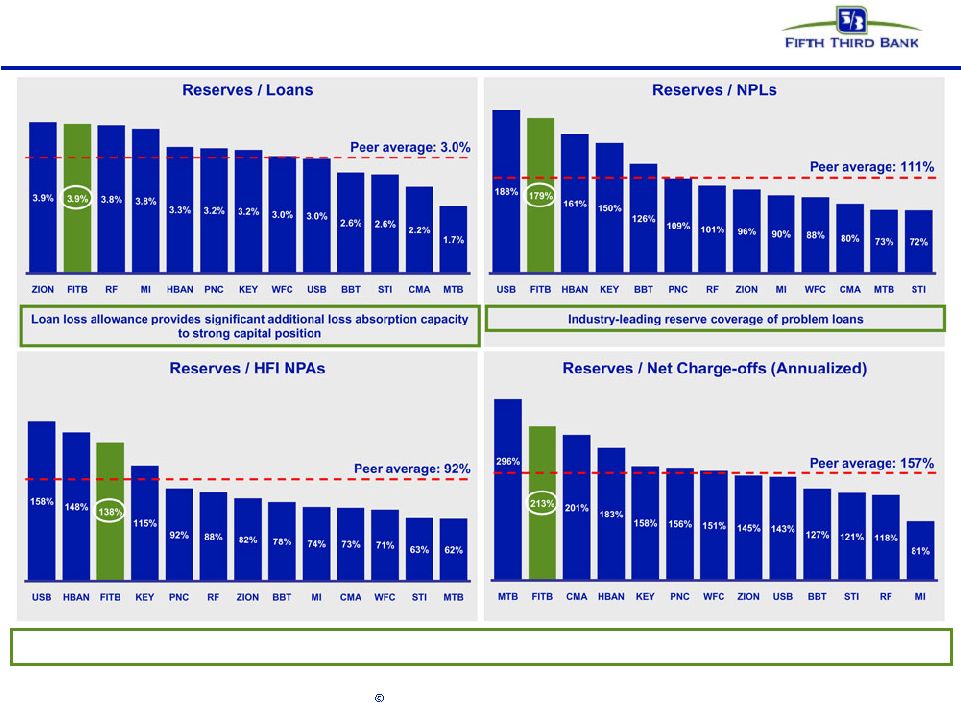
Industry leading reserve levels
Source:
SNL
Financial
and
company
reports.
Data
as
of
4Q10.
NPLs
and
NPAs
exclude
loans
held-for-sale
and
also
excludes
covered
assets
for
BBT,
USB,
and
ZION
Reserve coverage strong relative to problem assets and losses
|
 10
Fifth Third Bank | All Rights Reserved
TARP repayment
Repaid $3.408 billion TARP CPP investment on February 2, 2011
Utilized proceeds from
—
$1.7 billion common equity offering
—
$1.0 billion debt offering
—
Internally available funds
Intend
to
evaluate
repurchase
of
warrants
from
U.S.
Treasury;
if
mutually
agreeable value not reached, will evaluate participation in auction
—
Incorporated into capital plans (but not pro forma ratios)
Pro forma Tier 1 common ratio 9.0%, pro forma Tier 1 capital ratio 9.4%
—
On Basel III basis, pro forma Tier 1 common (9.3%) and Tier 1 capital
(9.7%) ratio at top of peer group
Pro forma capital structure provides additional flexibility in capital
deployment * Estimates based on current Basel III rules released by Basel
Committee, SNL Financial, company filings, and third party estimates |
 11
Fifth Third Bank | All Rights Reserved
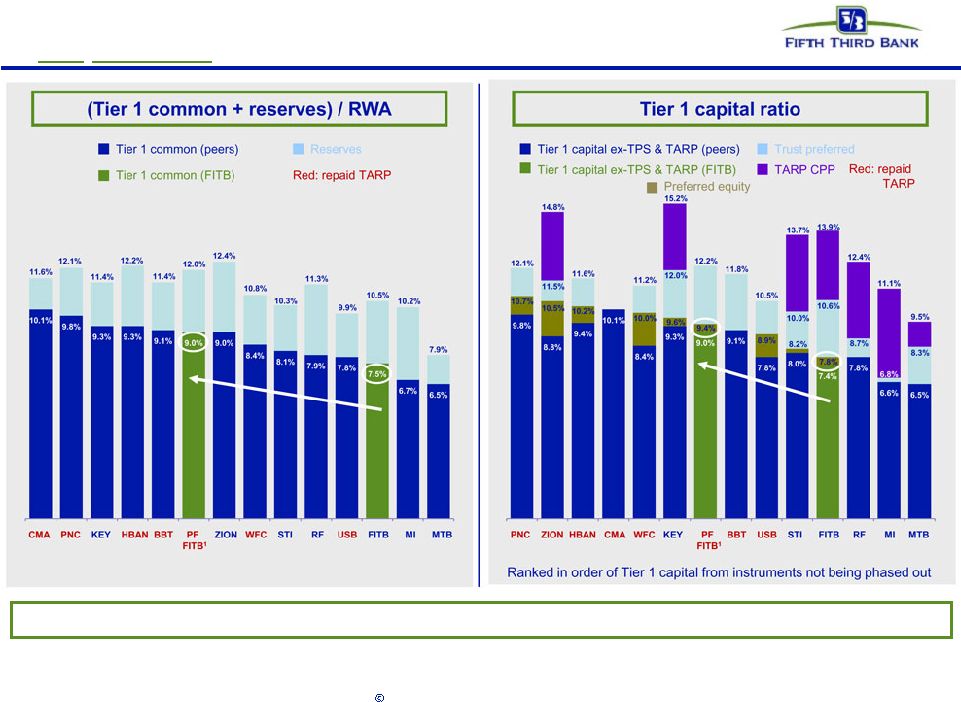
Pro forma capital position vs. peers
(not
adjusted
for Basel III)
Source:
SNL
Financial
and
company
filings
(financial
data
as
of
4Q10).
Common
equity
ratios
for
non-TARP
repayers
exclude
discount
accretion
from
attribution
of
TARP
value
(included
in
“TARP CPP”
at top of bars).
1
Pro forma for TARP redemption and issuance of $1.7bn of common equity net of
associated items. Refer to Regulation G Non-GAAP Reconciliation in appendix.
Fifth Third’s Basel I capital position will be well in excess of any established standards and most peers
|
 12
Fifth Third Bank | All Rights Reserved
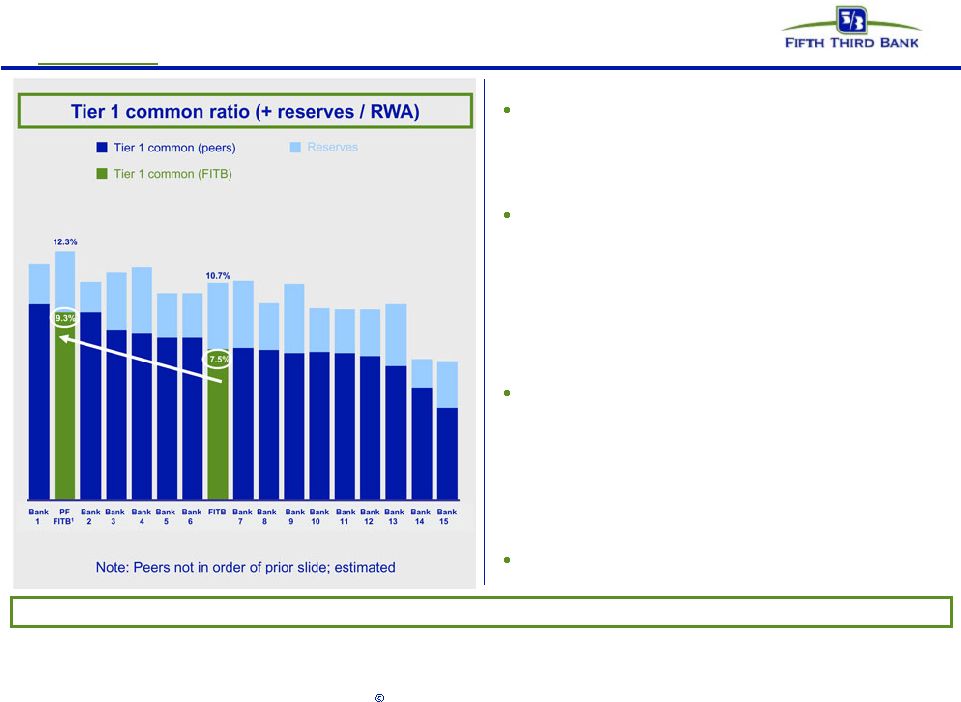
Pro forma capital position including TARP repayment
(adjusted
for Basel III*)
Source: SNL Financial, company filings, and third-party estimates. Regulatory
financial data as of 4Q10, not adjusted for potential mitigation efforts
Note: Four large peers include estimated Basel III RWA impact based on BIS
proposals * Estimates based on current Basel III rules released by the Basel
Committee ¹
Pro forma for TARP redemption, issuance of $1.7bn of common equity, net of
associated items, and phase-out of trust-preferred securities. Adjusted
for Basel III, Fifth Third’s pro forma capital position would be at top of peer group in level and quality
Unlike other SCAP commercial banks, Fifth Third
does not expect adverse effect to common
capital ratios from Basel III
—
Improvement of relative capital position
Potentially net positive impact on regulatory
capital
—
Limited deductions for mortgage servicing
rights and deferred tax assets
—
Potentially positive impact from the absence
of an adjustment for unrealized gains and
losses
Do not expect significant risk weighted assets
impact
—
Low level of financial counterparty
interconnectedness
—
Daily Value-at-Risk less than $500 thousand
—
Fifth Third is not a Basel II bank
9.7% Tier 1 capital ratio on fully phased-in basis*
|
 13
Fifth Third Bank | All Rights Reserved
Capital management philosophy
•
Return excess capital to shareholders after assessment of other capital deployment
alternatives and maintenance of buffers over targeted and required capital
levels •
Evaluate any share repurchases in context of stock price level
•
Not expected in near term
Share repurchases*
•
Prudently expand franchise or increase density in core markets via disciplined
acquisitions or de novos •
Attain top 3 market position in 65% of markets or more
Strategic opportunities*
•
Strong levels of profitability would support significantly higher dividend than
current dividend •
Subject to consideration and approval of plans submitted under CCPR**
Return to more normal dividend policy*
•
Support growth of core banking franchise
•
Improving loan demand in recovering economy
Organic growth opportunities
* Subject to Board of Directors and regulatory approval
** Comprehensive Capital Plan Review by Federal Reserve
Internal Tier 1 common equity target of 8% range |
 14
Fifth Third Bank | All Rights Reserved
Well-positioned for the future
•
Holding company cash currently sufficient for more than two years of obligations;
no holding company or Bank debt maturities until 2013
•
Bank level capital ratios significantly above most peers
•
After TARP repayment, Fifth Third has completely exited all crisis-era
government support programs –
Fifth Third is one of the few large banks that have no TLGP-guaranteed
debt Superior capital and liquidity position
•
$1.2bn problem assets addressed through loan sales and transfer to HFS in
3Q10 •
NCOs below 2%; 213% reserves / annualized NCOs
•
Substantial reduction in exposure to CRE since 1Q09; relatively low CRE exposure
versus peers Proactive approach to risk management
•
Traditional commercial banking franchise built on customer-oriented localized
operating model •
Strong market share in key markets with focus on further improving density
•
Fee income ~40% of total revenues
Diversified traditional banking platform
•
PPNR has remained strong throughout the credit cycle
•
PPNR substantially exceeds annual net charge-offs (164% PPNR / NCOs in
4Q10) •
1.18% ROAA in 4Q10
Strong industry leader in earnings power |
 15
Fifth Third Bank | All Rights Reserved
Cautionary statement
This report contains statements that we believe are “forward-looking statements” within
the meaning of Section 27A of the Securities Act of 1933, as amended, and Rule 175 promulgated
thereunder, and Section 21E of the Securities Exchange Act of 1934, as amended, and Rule
3b-6 promulgated thereunder. These statements relate to our financial condition, results of operations, plans, objectives, future
performance or business. They usually can be identified by the use of forward-looking language
such as “will likely result,” “may,” “are expected to,” “is
anticipated,” “estimate,” “forecast,” “projected,” “intends to,” or may include other similar words or phrases such as
“believes,” “plans,” “trend,” “objective,”
“continue,” “remain,” or similar expressions, or future or conditional verbs such as “will,” “would,”
“should,” “could,” “might,” “can,” or similar verbs. You
should not place undue reliance on these statements, as they are subject to risks and
uncertainties, including but not limited to the risk factors set forth in our most recent Annual
Report on Form 10-K. When considering these forward-looking statements, you should keep
in mind these risks and uncertainties, as well as any cautionary statements we may make.
Moreover, you should treat these statements as speaking only as of the date they are made and based
only on information then actually known to us.
There are a number of important factors that could cause future results to differ materially from
historical performance and these forward- looking statements. Factors that might cause such
a difference include, but are not limited to: (1) general economic conditions and weakening in
the economy, specifically the real estate market, either nationally or in the states in which Fifth Third, one or more acquired
entities and/or the combined company do business, are less favorable than expected; (2) deteriorating
credit quality; (3) political developments, wars or other hostilities may disrupt or increase
volatility in securities markets or other economic conditions; (4) changes in the interest rate
environment reduce interest margins; (5) prepayment speeds, loan origination and sale volumes, charge-offs and loan loss
provisions; (6) Fifth Third’s ability to maintain required capital levels and adequate sources of
funding and liquidity; (7) maintaining capital requirements may limit Fifth Third’s
operations and potential growth; (8) changes and trends in capital markets; (9) problems encountered
by larger or similar financial institutions may adversely affect the banking industry and/or Fifth
Third (10) competitive pressures among depository institutions increase significantly; (11)
effects of critical accounting policies and judgments; (12) changes in accounting policies or
procedures as may be required by the Financial Accounting Standards Board (FASB) or other regulatory agencies; (13) legislative or
regulatory changes or actions, or significant litigation, adversely affect Fifth Third, one or more
acquired entities and/or the combined company or the businesses in which Fifth Third, one or
more acquired entities and/or the combined company are engaged, including the recently enacted
Dodd-Frank Wall Street Reform and Consumer Protection Act; (14) ability to maintain favorable ratings from rating
agencies; (15) fluctuation of Fifth Third’s stock price; (16) ability to attract and retain key
personnel; (17) ability to receive dividends from its subsidiaries; (18) potentially dilutive
effect of future acquisitions on current shareholders’ ownership of Fifth Third; (19) effects of accounting
or financial results of one or more acquired entities; (20) difficulties in separating Fifth Third
Processing Solutions from Fifth Third; (21) loss of income from any sale or potential sale of
businesses that could have an adverse effect on Fifth Third’s earnings and future growth;(22)
ability to secure confidential information through the use of computer systems and telecommunications
networks; and (23) the impact of reputational risk created by these developments on such
matters as business generation and retention, funding and liquidity. You should refer to our periodic and current reports filed with the Securities and Exchange
Commission, or “SEC,” for further information on other factors, which could cause
actual results to be significantly different from those expressed or implied by these forward-looking
statements. |
 16
Fifth Third Bank | All Rights Reserved
Well-positioned for changed financial landscape
Fifth Third’s business model is driven by traditional banking activities
—
Largest bank headquartered within Fifth Third’s core Midwest footprint
—
Focused on expansion and development of businesses where regional leadership
matters
—
Capital investments, management talent, and added focus on businesses where
(1) regional leadership creates an advantage (i.e., retail, small business, and
mid- market commercial), and (2) select national lines where the
bank has a distinctive
element (i.e., Fifth Third Processing Solutions, Indirect Auto, Healthcare)
—
Didn’t / don’t originate / sell CDOs
or securitize loans on behalf of others; no
mortgage securitizations outstanding (except <$150mm HELOC from 2003)
—
Didn’t / don’t originate / sell subprime mortgages or Option ARMs
—
Low level of financial system “interconnectedness”
(e.g., Fifth Third loss in
Lehman bankruptcy should be less than $2mm)
—
Little to no impact from Volcker rule (de minimis
market maker in derivatives,
proprietary trading); daily VaR
less than $500 thousand
–
Small private equity portfolio ~$100mm (holding company subsidiary)
Fifth Third’s businesses have performed well through the crisis, and we expect
reintermediation
and the landscape to evolve further toward our traditional strengths
No significant business at Fifth Third impaired during crisis; core business
activities not generally limited by financial reform
|
 17
Fifth Third Bank | All Rights Reserved
Potential impact of key elements of Dodd-Frank Act
and other recent financial legislation*
Scope of activity
Potential impact**
Volcker Rule /
Derivatives
•
Vast majority of derivatives activities are exempted
(FITB generally not a market maker)
•
Any proprietary trading de minimis
•
“P/E”
fund investments ~$100mm (<1% of Tier 1
capital)
•
Expect minimal financial impact from loss of existing
revenue
•
Potentially higher compliance costs despite small levels
of non-exempt activities
Debit
Interchange
(Durbin
Amendment)
•
2010 debit interchange revenue of $204mm
•
2010 debit interchange $ volume: $15.7B
–
Signature $12.2B, PIN $3.5B
–
Signature 347mm, PIN 86mm
•
Fed has proposed limits on debt interchange; proposal
currently out for comment
•
Proposals would apply caps of $0.12 or $0.07 per transaction
(e.g., on volume which in 2010 was 433 million transactions)
•
If proposal implemented as written, we would expect
substantial mitigation of any reduction in revenue through
actions by FITB and competitors to recapture costs of providing
this service to customers and merchants
Deposit
Insurance
•
Current assessed base (Deposits): ~$78B
•
Proposed assessed base (Assets-TE): ~$97B
•
FITB rate under new industry assessment, based
upon large bank scorecard, less than rate under old
assessment
•
Lower due to reduced share of assessed base
Reg. E
•
Requires
customers
to
“opt-in”
to
allow
non-recurring
electronic overdrafts (e.g. debit, ATM) from accounts
•
Estimated 4Q10 impact of $17mm ($68mm annualized)
to deposit service charges, before effect of mitigation; in
full run-rate for 4Q10
Potential impact of these and other elements of financial regulatory reform, such as
CFPA activities and many other aspects, are unknown at this time
TRUPs
exclusion
(Collins
Amendment)
•
~280 bps of non-common Tier 1 capital in capital
structure
•
>300 bps of non-common Tier 1 currently
–
Expected to be more than needed post-Basel III
•
3-year transition period begins 2013
•
Will manage capital structure to desired composition
* Based on current understanding of legislation. ** Potential impact, as noted
above, is not intended to be inclusive of all potential impacts that may result from implementation of legislation and
does not include benefit of mitigation activities. Please refer also to cautionary
statement. •
2010 debit interchange transaction
volume: 433mm |
 18
Fifth Third Bank | All Rights Reserved
Pro forma capital ratios
Refer to Regulation G Non-GAAP Reconciliation in appendix
Note: Pro forma capital ratios net of write-off of discount accretion on TARP
preferred stock of $164mm and underwriting fees of approximately $51mm.
¹
Pro forma ratios include $1,700mm common equity issuance
²
Pro forma ratios also assume repurchase of the Bancorp’s Fixed Rate Cumulative
Perpetual Preferred Stock, Series F, issued under TARP CPP subject to U.S. Treasury approval.
3
Also includes proposed phase-out of trust preferred securities under
Dodd-Frank Act and Basel III 4
Peers include BBT, CMA, HBAN, KEY, RF, MI, MTB, PNC, STI, USB, WFC, ZION
Post-offering capital position creates foundation for future growth
TCE / TA (incl. unrealized gains)
Tier 1 common
Tier 1 capital
Total capital
7.3%
7.5%
13.9%
18.1%
4Q10
4Q10
$1.7bn offering
pro forma¹
Consolidated
Bank
Tier 1 common
Tier 1 capital
13.2%
13.2%
8.8%
9.1%
15.6%
19.8%
13.2%
13.2%
7.1%
8.7%
11.7%
15.3%
4Q10
Peer
Median
4
10.1%
10.3%
TCE / TA (excl. unrealized gains)
7.0%
8.6%
7.1%
including phase-out of TRUPS³
11.2%
12.8%
9.3%
Tier 1 leverage
12.8%
14.3%
9.4%
4Q10 TARP
redemption
pro forma²
8.7%
9.0%
12.2%
16.4%
13.2%
13.2%
8.4%
9.4%
11.2% |
 19
Fifth Third Bank | All Rights Reserved
Effects of capital plan and TARP repayment
on income statement and earnings per share
Fifth Third has not provided earnings or earnings per share guidance
The comments below relate to the effects of our capital plan on our earnings and
earnings per share. —
Write-off of discount accretion and avoidance of accretion of discount: when we
recorded the TARP preferred in our books, we were required to allocate the
$3.408 billion to the value of the preferred stock and to the associated
warrants. The amortized value of the discount assigned to the preferred stock was $149 million as of
2/2/11, the date of TARP repayment. This was written-off at the time of TARP
redemption through an increase in the “preferred dividends”
reporting line and reduced income available to common shareholders by the amount of
the write-off. We will avoid future accretion of discount ($11 million in
4Q10) —
TARP preferred dividend: The TARP preferred dividend was 5% of $3.408 billion
($170.4 million a year or $42.6 million a quarter). It represented
approximately $0.20 per common share on an annual basis and approximately
$0.05 per common share on a quarterly basis. Net income available to common
shareholders began to benefit from the elimination of this dividend at the
time of TARP repayment on 2/2/11 – accrued dividends paid were $15
million through that date.
—
Net interest income is modestly reduced by the net effect of our
capital plan and TARP repayment. This is driven
by the following factors:
–
Our common stock issuance closed on 1/25/11 and is “free funds”
from a net interest income perspective.
However, TARP preferred stock is also free funds from a net interest income
perspective. –
We funded the remainder of TARP repayment with available funds and a $1 billion
senior debt issuance. The cost of replacing available funds with other
sources of similar funding is currently very low in this interest rate
environment. The $1 billion five-year senior debt was issued on 1/25/11 at a coupon of 3.625 percent.
—
Earnings per share: Our average fully diluted share count for fourth quarter 2010
was approximately 836 million (actual shares were approximately 796 million).
We issued 121.429 million shares on 1/25/11, increasing our 4Q10 average
fully diluted share count on a pro forma basis and increasing the number of fully diluted shares by
approximately 12.5 percent (number of actual shares by approximately 13
percent). –
Issued 960 thousand shares to settle equity forward agreement associated with the
issuance of shares under greenshoe
over-allotment option |
 20
Fifth Third Bank | All Rights Reserved
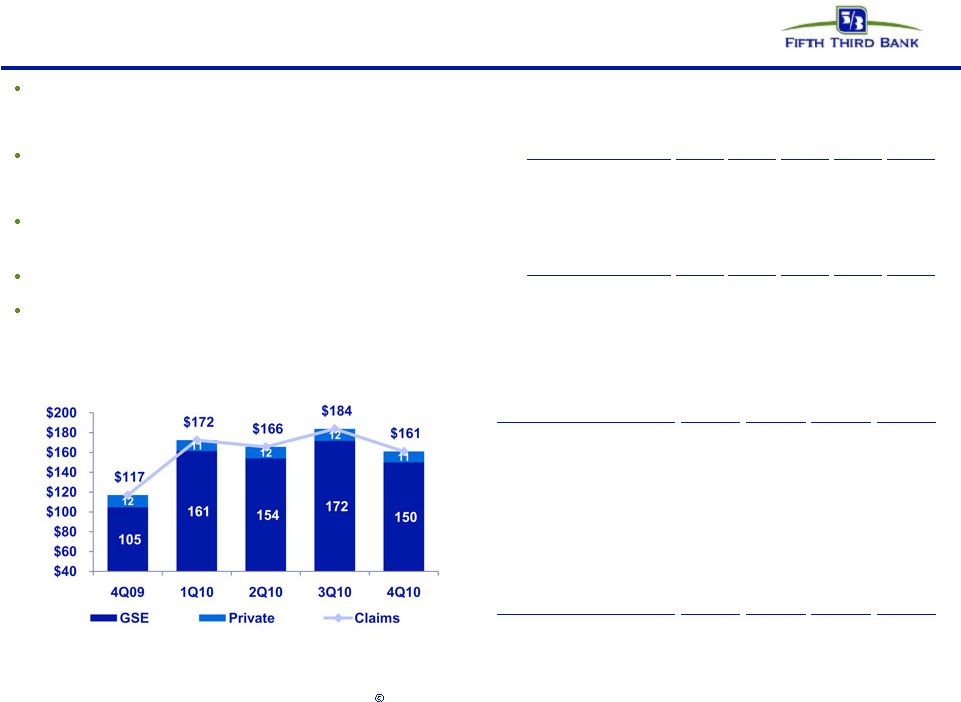
Mortgage repurchase overview
Demand requests and repurchase losses remain volatile and near-term
repurchase losses are expected to remain elevated
—
Number of outstanding demand requests (units) down 9% from 3Q10,
outstanding demand requests ($) down 13%
Virtually all sold loans and new claims relate to GSEs
or GNMA
—
98% of outstanding balance of loans sold
—
92% of outstanding claims
Majority of new claims and repurchase losses relate to 2006 through 2008
vintages
—
75% of new claims for 2010 YTD
Majority of outstanding balances of the serviced for others portfolio relates
to origination activity in 2009 and later
Claims and exposure related to whole loan sales (no outstanding first
mortgage securitizations)
Repurchase Reserves* ($ in millions)
Q4
2009
Q1
2010
Q2
2010
Q3
2010
Q4
2010
Beginning balance
$48
$58
$84
$85
$103
Net reserve additions
25
39
19
49
21
Repurchase losses
(15)
(13)
(18)
(31)
(23)
Ending balance
$58
$84
$85
$103
$101
Outstanding Counterparty Claims ($ in millions)
Outstanding Balance of Sold Loans ($ in millions)
GSE
GNMA
Private
Total
2005 and prior
$8,497
$333
$705
$9,535
2006
2,194
71
333
2,598
2007
3,591
105
285
3,981
2008
3,746
847
-
4,593
2009 and later
25,355
7,173
-
32,527
Total
$43,382
$8,529
$1,323
$53,234
* Includes reps and warranty reserve ($85mm) and reserve for loans sold with
recourse ($16mm). |
 21
Fifth Third Bank | All Rights Reserved
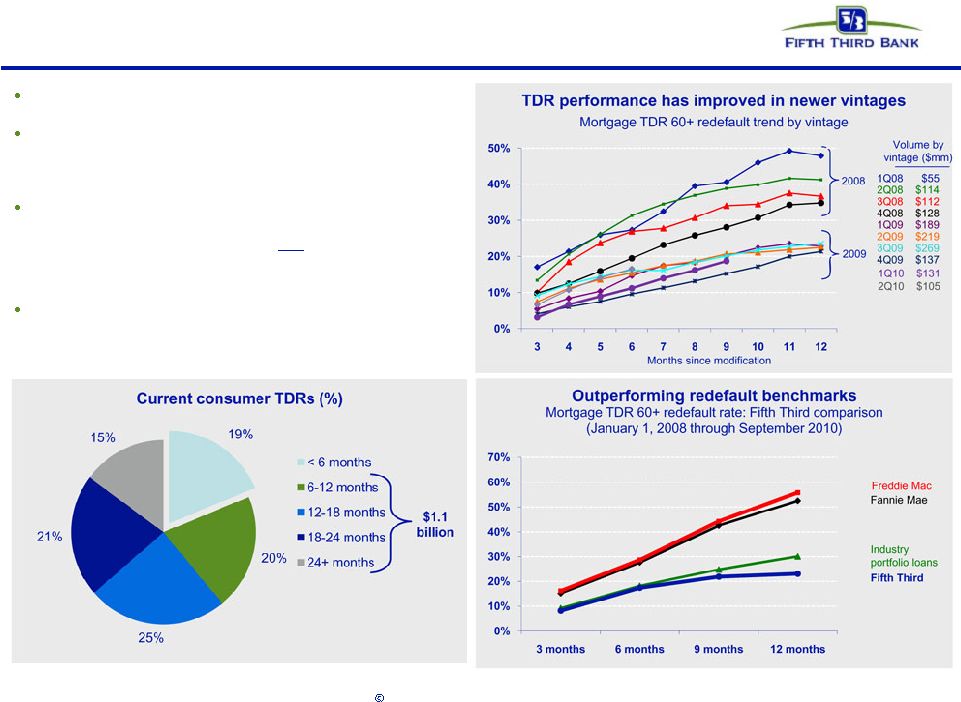
Troubled debt restructurings (TDR) overview
Successive improvement in vintage performance during 2008
and 2009, even as volume of modification increased
Fifth Third’s mortgage portfolio TDRs
have redefaulted
at a
lower rate than other bank held portfolio modifications
—
Fifth Third’s TDRs
less likely to redefault
than
modifications on GSE mortgages
Of $1.8bn in consumer TDRs, $1.6bn were on accrual status
and $206mm were nonaccruals
—
$1.1bn
of
TDRs
are
current
and
have
been
on
the
books 6 or more months; within that, nearly $800mm
of TDRs
are current and have been on the books for
more than a year
As current TDRs
season, their default propensity declines
significantly
—
We see much lower defaults on current loans after a
vintage approaches 12 months since modification
Source: Fifth Third and OCC/OTS data through 3Q10
|
 22
Fifth Third Bank | All Rights Reserved
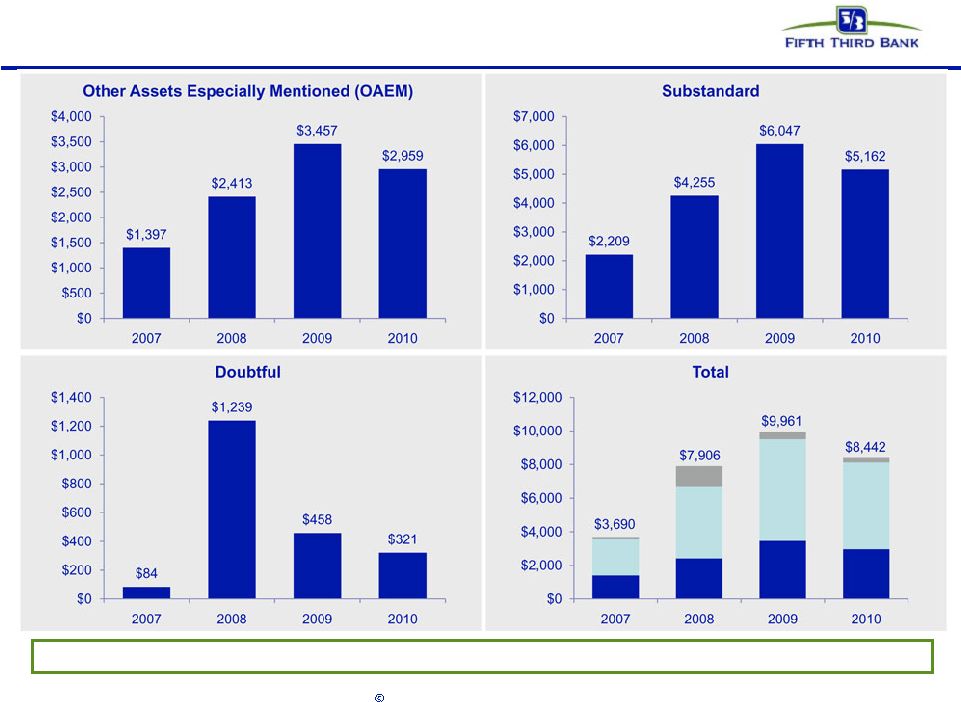
Criticized / Classified Commercial Assets
Criticized assets have declined significantly in all categories since the peak in
2009 * Criticized / Classified assets also include $2mm, $9mm, and $2mm of
loss assets in 2007, 2008, and 2009, respectively |
 23
Fifth Third Bank | All Rights Reserved
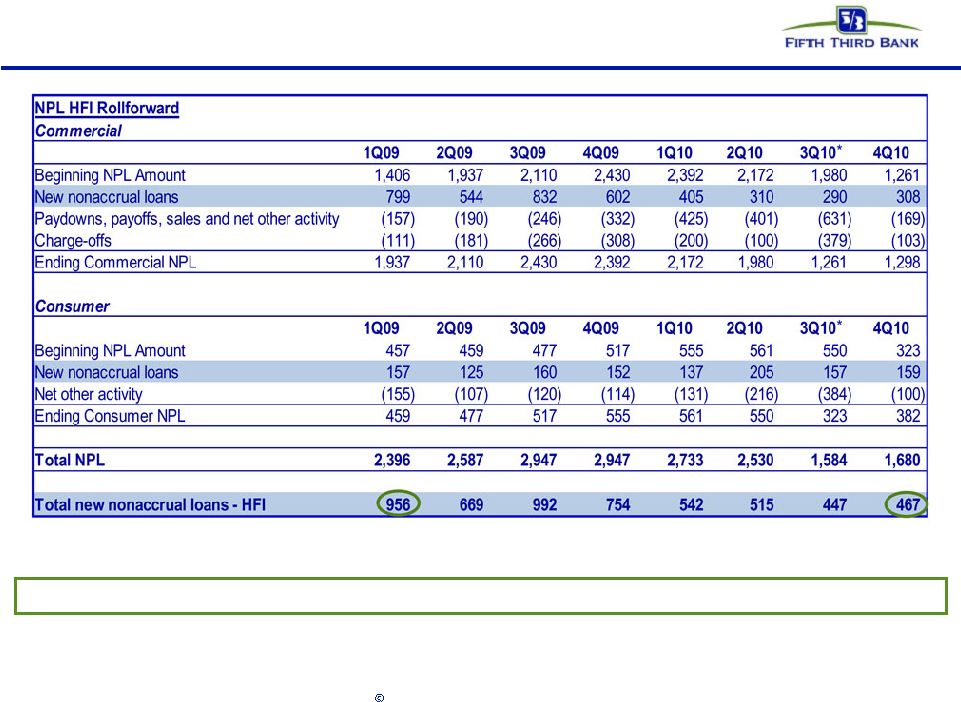
NPL Rollforward
Significant improvement in NPL inflows over past two years
* 3Q10 inflows into NPLs
HFS were $217mm, reflecting performing loans moved to held-for-sale in
3Q10 that were deemed impaired as a result of the decision to sell these loans |
 24
Fifth Third Bank | All Rights Reserved
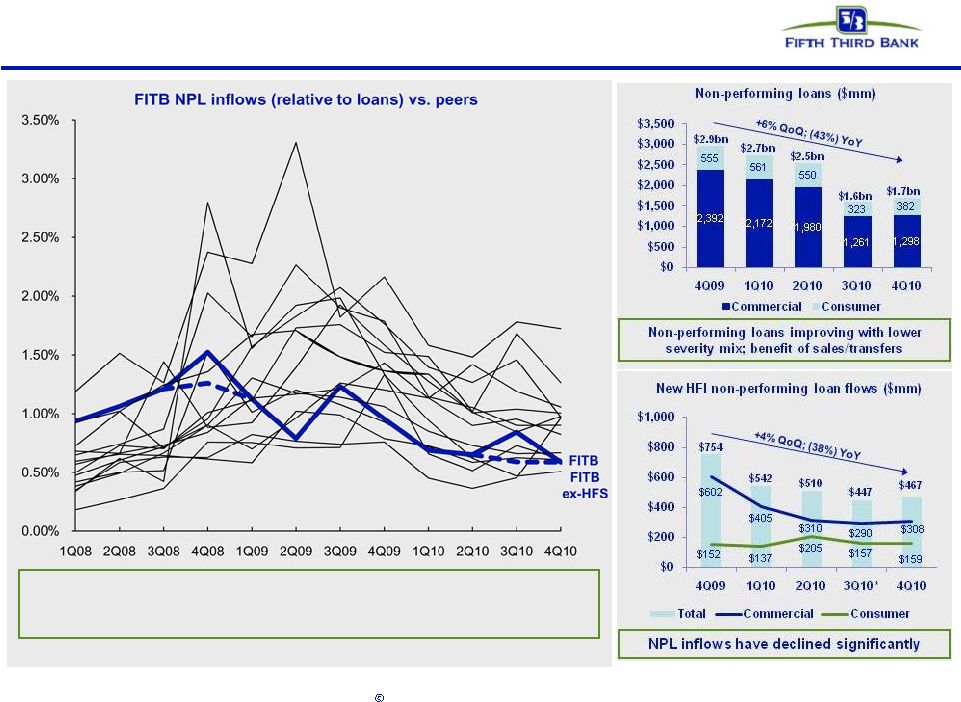
Non-performing loans
Fifth Third’s non-performing loan inflows (relative to loans) were higher
than peers throughout 2008. More recently, FITB inflows have been
proportionally lower than peers
Source: SNL Financial and company filings. Peers include: BAC, BBT, C, CMA, HBAN,
JPM, KEY, MI, MTB, PNC, RF, STI, USB, and WFC * 3Q10 inflows into NPLs HFS
were $217mm, reflecting performing loans moved to held-for-sale in 3Q10 that were deemed impaired as a result of the decision to sell these loans |
 25
Fifth Third Bank | All Rights Reserved
Pre-provision net revenue reconciliation
1Q09
2Q09
3Q09
4Q09
1Q10
2Q10
3Q10
4Q10
Reported PPNR
$511
$2,393
$844
$562
$568
$567
$760
$583
Adjustments:
BOLI
54
-
-
-
-
-
(127)
-
Gain on sale of Visa shares
-
-
(244)
-
9
-
-
-
Gain from sale of processing interest
-
(1,764)
6
-
-
-
-
-
Divested merchant and EFT revenue
(155)
(169)
2
-
-
-
-
-
Class B Visa swap fair value adjustment
-
-
-
-
-
-
-
-
Securities gains/losses
24
(5)
(8)
(2)
(14)
(8)
(4)
(21)
Litigation reserve expense
-
-
(73)
22
4
3
-
-
Extinguishment of FHLB funding
-
-
-
-
-
-
-
17
FTPS warrants + puts
-
-
-
(20)
2
(10)
5
(3)
Seasonal pension expense
-
-
10
-
-
-
-
-
FDIC special assessment
-
55
-
-
-
-
-
-
Divested merchant and EFT expense (est.)
49
54
2
-
-
-
-
-
Core PPNR
$483
$564
$539
$562
$569
$552
$634
$576
Credit related items:
OREO write-downs, FV adjs, & G/L on loan sales
3
8
45
31
1
15
42
34
Problem asset work-out expenses
94
57
111
73
91
55
67
53
Credit adjusted PPNR
$580
$630
$695
$666
$661
$622
$743
$663 |
 26
Fifth Third Bank | All Rights Reserved
Regulation G Non-GAAP reconciliation
Fifth Third Bancorp and Subsidiaries
Regulation G Non-GAAP Reconcilation
$ and shares in millions
Proforma
Proforma
(unaudited)
CS Issue, TARP
CS Issuance
December
December
December
September
June
March
December
2010
2010
2010
2010
2010
2010
2009
Total Bancorp shareholders' equity (U.S. GAAP)
12,292
15,700
14,051
13,884
13,701
13,408
13,497
Less:
Preferred stock
(398)
(3,654)
(3,654)
(3,642)
(3,631)
(3,620)
(3,609)
Goodwill
(2,417)
(2,417)
(2,417)
(2,417)
(2,417)
(2,417)
(2,417)
Intangible assets
(62)
(62)
(62)
(72)
(83)
(94)
(106)
Tangible common equity, including unrealized gains / losses (a)
9,415
9,567
7,918
7,753
7,570
7,277
7,365
Less: Accumulated other comprehensive income / loss
(314)
(314)
(314)
(432)
(440)
(288)
(241)
Tangible common equity, excluding unrealized gains / losses (b)
9,101
9,253
7,604
7,321
7,130
6,989
7,124
Add back: Preferred stock
398
3,654
3,654
3,642
3,631
3,620
3,609
Tangible equity (c)
9,499
12,907
11,258
10,963
10,761
10,609
10,733
Total assets (U.S. GAAP)
111,007
111,007
111,007
112,322
112,025
112,651
113,380
Less:
Goodwill
(2,417)
(2,417)
(2,417)
(2,417)
(2,417)
(2,417)
(2,417)
Intangible assets
(62)
(62)
(62)
(72)
(83)
(94)
(106)
Tangible assets, including unrealized gains / losses (d)
108,528
108,528
108,528
109,833
109,525
110,140
110,857
Less: Accumulated other comprehensive income / loss, before tax
(483)
(483)
(483)
(665)
(677)
(443)
(370)
Tangible assets, excluding unrealized gains / losses (e)
108,045
108,045
108,045
109,168
108,848
109,697
110,487
Total Bancorp shareholders' equity (U.S. GAAP)
12,292
15,700
14,051
13,884
13,701
13,408
13,497
Goodwill and certain other intangibles
(2,546)
(2,546)
(2,546)
(2,525)
(2,537)
(2,556)
(2,565)
Unrealized gains
(314)
(314)
(314)
(432)
(440)
(288)
(241)
Qualifying trust preferred securities
2,763
2,763
2,763
2,763
2,763
2,763
2,763
Other
11
11
11
8
(25)
(30)
(26)
Tier I capital
12,206
15,614
13,965
13,698
13,462
13,297
13,428
Less:
Preferred stock
(398)
(3,654)
(3,654)
(3,642)
(3,631)
(3,620)
(3,609)
Qualifying trust preferred securities
(2,763)
(2,763)
(2,763)
(2,763)
(2,763)
(2,763)
(2,763)
Qualifying noncontrolling interest in consolidated subsidiaries
(30)
(30)
(30)
(30)
-
-
-
Tier I common equity (f)
9,015
9,167
7,518
7,263
7,068
6,914
7,056
Common shares outstanding (g)
919
919
796
796
796
795
795
Risk-weighted assets, determined in accordance with
prescribed regulatory requirements (h)
100,193
100,193
100,193
98,904
98,604
99,281
100,933
Ratios:
Tangible equity (c) / (e)
8.79%
11.95%
10.42%
10.04%
9.89%
9.67%
9.71%
Tangible common equity (excluding unrealized gains/losses) (b) / (e)
8.42%
8.56%
7.04%
6.70%
6.55%
6.37%
6.45%
Tangible common equity (including unrealized gains/losses) (a) / (d)
8.68%
8.82%
7.30%
7.06%
6.91%
6.61%
6.64%
Tangible common equity as a percent of risk-weighted assets
(excluding unrealized gains/losses) (b) / (h)
9.08%
9.24%
7.59%
7.40%
7.23%
7.04%
7.06%
Tangible book value per share (a) / (g)
10.25
10.41
9.94
9.74
9.51
9.16
9.26
Tier I common equity (f) / (h)
9.00%
9.14%
7.50%
7.34%
7.17%
6.96%
6.99%
For the Three Months Ended |
 27
Fifth Third Bank | All Rights Reserved
Regulation G Non-GAAP reconciliation
Common offering and TARP repay
4Q10
Common share offering only
4Q10
Tier 1 Capital ratio
Tier 1 Capital ratio
Tier 1 capital
13,964,857
$
Tier 1 capital
13,964,857
$
TARP repay
(3,408,000)
$
Equity raise
1,648,830
$
Equity raise
1,648,830
$
12,205,687
$
15,613,687
$
RWA
100,193,435
$
RWA
100,193,435
$
Asset increase
-
$
Asset increase
-
$
100,193,435
$
100,193,435
$
Tier 1
13.9%
Tier 1
13.9%
Tier 1 pro forma
12.2%
Tier 1 pro forma
15.6%
Total RBC ratio
Total RBC ratio
Total RBC
18,173,452
$
Total rbc
18,173,452
$
TARP repay
(3,408,000)
$
Equity raise
1,648,830
$
Equity raise
1,648,830
$
16,414,282
$
19,822,282
$
RWA
100,193,435
$
RWA
100,193,435
$
Asset increase
-
$
Asset increase
-
$
100,193,435
$
100,193,435
$
Total RBC
18.1%
Total RBC
18.1%
Total RBC pro forma
16.4%
Total RBC
19.8%
pro forma
Tier 1 leverage
Tier 1 leverage
Tier 1 capital
13,964,857
$
Tier 1 capital
13,964,857
$
TARP repay
(3,408,000)
$
Equity raise
1,648,830
$
Equity raise
1,648,830
$
12,205,687
$
15,613,687
$
Quarterly Avg Assets
109,207,711
$
Quarterly Avg Assets
109,207,711
$
Asset increase
-
$
Asset increase
-
$
109,207,711
$
109,207,711
$
Tier 1 lev
12.8%
Tier 1 lev
12.8%
Tier 1 lev pro forma
11.2%
Tier 1 lev pro forma
14.3% |
  28
Fifth Third Bank | All Rights Reserved
Regulation G Non-GAAP reconciliation
The Bancorp considers various measures when evaluating capital utilization and
adequacy, including the tangible equity ratio, tangible common equity ratio and
tier I common equity ratio, in addition to capital ratios defined by banking
regulators. These calculations are intended to complement the capital ratios defined by
banking regulators for both absolute and comparative purposes. Because U.S. GAAP
does not include capital ratio measures, the Bancorp believes there are no
comparable U.S. GAAP financial measures to these ratios. Tier I common equity is
not formally defined by U.S. GAAP or codified in the federal banking
regulations and, therefore, is considered to be a non-GAAP financial measure.
Since analysts and banking regulators may assess the Bancorp’s capital
adequacy using these ratios, the Bancorp believes they are useful to provide
investors the ability to assess its capital adequacy on this same basis. The
Bancorp believes these non-GAAP measures are important because they reflect the level of capital available to withstand unexpected market conditions.
Additionally, presentation of these measures allows readers to compare certain
aspects of the Bancorp’s capitalization to other organizations. However, because
there are no standardized definitions for these ratios, the Bancorp’s
calculations may not be comparable with other organizations, and the usefulness of these
measures to investors may be limited. As a result, the Bancorp encourages readers
to consider its Condensed Consolidated Financial Statements in their
entirety and not to rely on any single financial measure.
Phase out of TRUPs (Equity raise)
4Q10
Tier 1 Capital ratio
Tier 1 capital
13,964,857
$
TARP repay
TRUPs
(2,762,782)
Equity raise
1,648,830
$
12,850,905
$
RWA
100,193,435
$
Asset increase
-
$
100,193,435
$
Tier 1
13.9%
Tier 1 pro forma
12.8%
Phase out of TRUPs (TARP, Equity raise)
4Q10
Tier 1 Capital ratio
Tier 1 capital
13,964,857
$
TARP repay
(3,408,000)
$
TRUPs
(2,762,782)
Equity raise
1,648,830
$
9,442,905
$
RWA
100,193,435
$
Asset increase
-
$
100,193,435
$
Tier 1
13.9%
Tier 1 pro forma
9.4%
Common share offering only
4Q10
Tangible Common Equity ratio
Tangible CE
7,603,486
$
Equity raise
1,648,830
$
9,252,316
$
Tangible Assets
108,044,298
$
Asset increase
-
$
108,044,298
$
TCE
7.0%
TCE pro forma
8.6%
Tier 1 Common
Tier 1 common
7,518,667
$
Equity raise
1,648,830
$
9,167,497
$
RWA
100,193,435
$
Asset increase
-
$
100,193,435
$
Tier 1 common
7.5%
Tier 1 common
9.1%
pro forma |