Attached files
| file | filename |
|---|---|
| EX-21 - EXHIBIT 21 - ESCALADE INC | ex_21.htm |
| EX-23.1 - EXHIBIT 23.1 - ESCALADE INC | ex23_1.htm |
| EX-32.1 - EXHIBIT 32.1 - ESCALADE INC | ex32_1.htm |
| EX-32.2 - EXHIBIT 32.2 - ESCALADE INC | ex32_2.htm |
| EX-31.1 - EXHIBIT 31.1 - ESCALADE INC | ex31_1.htm |
| EX-31.2 - EXHIBIT 31.2 - ESCALADE INC | ex31_2.htm |
| EX-23.2 - EXHIBIT 23.2 - ESCALADE INC | ex23_2.htm |
| EX-10.26 - EXHIBIT 10.26 - ESCALADE INC | ex10_26.htm |
| EX-10.27 - EXHIBIT 10.27 - ESCALADE INC | ex10_27.htm |
United States
Securities and Exchange Commission
Washington, D.C. 20549
Form 10-K
| x | ANNUAL REPORT PURSUANT TO SECTION 13 OR 15(d) OF THE SECURITIES EXCHANGE ACT OF 1934 |
For the Fiscal Year Ended December 25, 2010
Or
| o | TRANSITION REPORT PURSUANT TO SECTION 13 OR 15(d) OF THE SECURITIES EXCHANGE ACT OF 1934 |
For the transition period from _____________ to _____________
Commission File Number 0-6966
|
ESCALADE, INCORPORATED
|
|
(Exact name of registrant as specified in its charter)
|
|
Indiana
|
13-2739290
|
|
|
(State of incorporation)
|
(I.R.S. EIN)
|
|
|
817 Maxwell Ave, Evansville, Indiana
|
47711
|
|
|
(Address of Principal Executive Office)
|
(Zip Code)
|
|
812-467-4449
(Registrant’s Telephone Number)
Securities registered pursuant to Section 12(b) of the Act
|
Common Stock, No Par Value
|
The NASDAQ Stock Market LLC
|
|
|
(Title of Class)
|
(Name of Exchange on Which Registered)
|
Securities registered pursuant to section 12(g) of the Act: NONE
Indicate by check mark if the registrant is a well-known seasoned issuer, as defined in Rule 405 of the Securities
Yes o No x
Indicate by check mark if the registrant is not required to file reports pursuant to Section 13 or Section 15(d) of the Act
Yes o No x
Indicate by check mark whether the registrant (1) has filed all reports required to be filed by Section 13 or 15(d) of the Securities Exchange Act of 1934 during the preceding 12 months (or for such shorter period that the registrant was required to file such reports), and (2) has been subject to such filing requirements for the past 90 days.
Yes x No o
Indicate by check mark whether the registrant has submitted electronically and posted on its corporate Web site, if any, every Interactive Data File required to be submitted and posted pursuant to Rule 405 of Regulation S-T during the preceding 12 months (or for such shorter period that the registrant was required to submit and post such files).
Yes o No o
Indicate by check mark if disclosure of delinquent filers pursuant to Item 405 of Regulation S-K is not contained herein, and will not be contained, to the best of registrant’s knowledge, in definitive proxy or information statements incorporated by reference in Part III of this Form 10-K or any amendment to this Form 10-K. o
Indicate by check mark whether the registrant is a large accelerated filer, an accelerated filer, or a non-accelerated filer, or a smaller reporting company. See the definitions of “Large accelerated filer,” “accelerated filer” and “smaller reporting company” in Rule 12b-2 of the Exchange Act.
|
Large accelerated filer o
|
Accelerated filer o
|
|
Non-accelerated filer o (do not
|
Smaller reporting company x
|
|
check if a smaller reporting company)
|
|
Indicate by checkmark whether the registrant is a shell company (as defined in Rule 12 b-2 of the Exchange Act).
Yes o No x
Aggregate market value of common stock held by nonaffiliates of the registrant as of July 10, 2010 based on the closing sale price as reported on the NASDAQ Global Market: $42,331,650
The number of shares of Registrant’s common stock (no par value) outstanding as of February 8, 2011: 12,807,318.
DOCUMENTS INCORPORATED BY REFERENCE
Certain portions of the registrant’s Proxy Statement relating to its annual meeting of stockholders scheduled to be held on April 29, 2011 are incorporated by reference into Part III of this Report.
Escalade, Incorporated and Subsidiaries
Table of Contents
|
Page
|
||||
|
3
|
||||
|
5
|
||||
|
13
|
||||
|
13
|
||||
|
14
|
||||
|
14
|
||||
|
14
|
||||
|
16
|
||||
|
17
|
||||
|
25
|
||||
|
25
|
||||
|
25
|
||||
|
26
|
||||
|
27
|
||||
|
27
|
||||
|
27
|
||||
|
27
|
||||
|
28
|
||||
|
28
|
||||
|
28
|
||||
2
| ITEM 1 — BUSINESS |
General
Escalade, Incorporated (“Escalade” or “Company”) operates in two business segments: Sporting Goods and Information Security and Print Finishing (formerly referred to as “Office Products” as described below). Escalade and its predecessors have more than 80 years of manufacturing and selling experience in these two industries.
The following table presents the percentages contributed to Escalade’s net sales by each of its business segments:
|
2010
|
2009
|
2008
|
||||||||||
|
Sporting Goods
|
71 | % | 66 | % | 66 | % | ||||||
|
Information Security and Print Finishing
|
29 | % | 34 | % | 34 | % | ||||||
|
Total Net Sales
|
100 | % | 100 | % | 100 | % | ||||||
For additional segment information, see Note 14 – Operating Segment and Geographic Information in the consolidated financial statements.
Sporting Goods
Headquartered in Evansville, Indiana, Escalade Sports manufactures, imports, and distributes widely recognized sporting goods brands in family recreation, fitness, training, and hunting products through traditional department stores, mass merchandise retailers, and sporting goods specific retailers. Escalade is the world’s largest producer of table tennis tables. Some of the Company’s most recognized brands include:
|
Product Segment
|
Brand Names
|
|
|
Archery
|
Bear Archery®, Trophy Ridge®, Whisker Biscuit®
|
|
|
Table Tennis
|
STIGA®, Ping-Pong®
|
|
|
Basketball Backboards and Goals
|
Goalrilla™, Goaliath®, Silverback®
|
|
|
Play Systems
|
Woodplay®, Childlife®
|
|
|
Fitness
|
The STEP®, USWeight™
|
|
|
Game Tables (Hockey and Soccer)
|
Harvard Game®, Atomic®, Accudart®
|
|
|
Pool Tables and Accessories
|
Mosconi®, Mizerak®
|
In 2010, the Company has one customer in the Sporting Goods group, Dick’s Sporting Goods, which accounted for approximately 15% of total consolidated gross revenues.
Escalade Sports manufactures in the U.S.A. and Mexico and imports product from China, where the Company utilizes a number of contract manufacturers.
Certain products produced by Escalade Sports are subject to regulation by the Consumer Product Safety Commission. The Company believes it is in material compliance with all applicable regulations.
Information Security and Print Finishing
Martin Yale Group has increasingly expanded its focus on the information security requirements of larger corporate customers, governments, and strategic business partners. The Company is particularly focused on addressing information security issues including the decommissioning or destruction of data stored on optical, solid state, magnetic, and traditional media like paper to meet the increasingly strict security standards set by the National Security Administration, National Institute of Standards and Technology, Deutsches Institut fur Normung (German Institute for Standardization), the European Union, and many other governments and organizations around the world. Martin Yale Group continues to focus on the print finishing sector with a particular focus on digital print applications.
3
Reflecting the Company’s expanded focus on information security, the Martin Yale Group business segment is now referred to as “Information Security and Print Finishing” rather than as “Office Products.” Martin Yale has a worldwide presence with manufacturing facilities in Indiana and Germany and joint venture manufacturing facilities in the Czech Republic and Taiwan. Martin Yale Group has sales offices in the USA, Germany, United Kingdom, France, Spain, China, Italy, South Africa and Sweden.
Martin Yale Group products include: shredders, disintegrators, degaussers, paper folders, letter openers, and paper cutters/trimmers. The key Martin Yale Group brands include martin yale®, intimus®, and papermonster®.
Martin Yale Group products and services are sold directly to end-users as well as through retailers, wholesalers, catalogs, specialty dealers, and business partners. No single Martin Yale Group customer accounted for more than 10% of Information Security and Print Finishing sales during 2010.
Marketing and Product Development
The Company makes a substantial investment in product development and brand marketing to differentiate its product line from its competition. Each operating segment conducts market research and development efforts to design products which satisfy existing and emerging consumer needs. On a consolidated basis, the Company incurred research and development costs of approximately $1.9 million, $2.0 million, and $2.3 million in 2010, 2009 and 2008, respectively.
The Company also makes investments in brand marketing to properly communicate the specific attributes and qualities of its products. The Company advertises directly to the consumer or end user as well as through its retail partners in the form of advertising and other promotional allowances.
Competition
Escalade is subject to competition with various manufacturers in each product line produced or sold by Escalade. The Company is not aware of any other single company that is engaged in both the same industries as Escalade or that produces the same range of products as Escalade within such industries. Nonetheless, competition exists for many Escalade products within both the Sporting Goods and Information Security and Print Finishing industries. Some competitors are larger and have substantially greater resources than the Company. Escalade believes that its long-term success depends on its ability to strengthen its relationship with existing customers, attract new customers and develop new products that satisfy the quality and price requirements of Sporting Goods and Information Security and Print Finishing customers.
Licenses, Trademarks and Brand Names
The Company has an agreement and contract with Sweden Table Tennis AB for the exclusive right and license to distribute and produce table tennis equipment under the brand name STIGA® for the United States and Canada. The Company also owns several registered trademarks and brand names including but not limited to Ping-Pong®, Bear Archery®, Goalrillaä, The Step®, and Wood Play® which are used in the Sporting Goods business segment and intimus® and papermonster® which are used in the Information Security and Print Finishing business segment.
Backlog and Seasonality
Sales are based primarily on standard purchase orders and in most cases orders are shipped within the same month received. Unshipped orders at the end of the fiscal year (backlog), were not material, and therefore not an indicator of future results. Increased diversity in product categories, such as playground and basketball, over the past few years has helped the Company achieve more evenly distributed revenues in Sporting Goods. The Company does not expect Sporting Goods sales to be seasonal in the future. Demand for Information Security and Print Finishing has not been seasonal and is not expected to be so in the future.
4
Employees
The number of employees at December 25, 2010 and December 26, 2009 for each business segment were as follows:
|
2010
|
2009
|
||||||
|
Sporting Goods
|
|||||||
|
USA
|
284 | 259 | |||||
|
Mexico
|
98 | 104 | |||||
|
Asia
|
8 | 8 | |||||
| 390 | 371 | ||||||
|
Information Security and Print Finishing
|
|||||||
|
USA
|
89 | 93 | |||||
|
Europe
|
121 | 128 | |||||
|
Asia
|
8 | 8 | |||||
| 218 | 229 | ||||||
|
Total
|
608 | 600 | |||||
The I.U.E./C.W.A. (United Electrical Communication Workers of America, AFL-CIO) represents hourly rated employees at the Escalade Sports’ Evansville, Indiana distribution center. There are approximately 14 covered employees at December 25, 2010. A 3-year labor contract was negotiated and renewed in April 2009; the new agreement expires on April 30, 2012. Management believes it has satisfactory relations with its employees.
Sources of Supplies
Raw materials for Escalade’s various product lines consist of wood, steel, plastics, fiberglass and packaging. Escalade relies upon suppliers in various countries and upon various third party Asian manufacturers for certain of its game tables and non-security paper shredders. The Company believes that these sources will continue to provide adequate supplies as needed and that all other materials needed for the Company’s various operations are available in adequate quantities from a variety of domestic and foreign sources.
SEC Reports
The Company’s internet site (www.escaladeinc.com) makes available free of charge to all interested parties the Company’s annual report on Form 10-K, quarterly reports on Form 10-Q, and current reports on Form 8-K, and all amendments to those reports, as well as all other reports and schedules filed electronically with the Securities and Exchange Commission (the “Commission”), as soon as reasonably practicable after such material is electronically filed with or furnished to the Commission. Interested parties may also find reports, proxy and information statements and other information on issuers that file electronically with the Commission at the Commission’s internet site (http://www.sec.gov).
| ITEM 1A — RISK FACTORS |
Sales at Martin Yale Group declined in 2010 and could continue to decline in 2011.
Overall sales in Information Security and Print Finishing declined in 2010, as well as in 2008 and 2009. The 2010 loss is due mainly to continued weakness in the global office products channel and the government sales channel primarily in the United States and the United Kingdom and prolonged economic weakness in Spain and certain other European countries. Sales in Sporting Goods increased in 2010, reversing a decline in sales in 2006 through 2009. A significant portion of Sporting Goods 2008 and 2009 sales declines were a result of the loss of major customer. Sales in Information Security and Print Finishing may further decline in 2011 and sales in Sporting Goods may not continue to increase in 2011. Recovering or replacing these declining or lost sales will be a significant challenge. The Company cannot provide any assurance that it will be able to recover or replace all or any portion of declining or lost sales.
5
If the Company would lose significant customers in the future, the Company may have difficulty in replacing such lost revenues.
The Company has several large customers and historically has derived substantial revenues from those customers. The Company needs to continue to expand its customer base to minimize the effects of the loss of any single customer in the future. If sales to one or more significant customers would be lost or materially reduced, there can be no assurance that the Company will be able to replace such revenues, which losses could have a material adverse effect on the Company’s business, results of operations and financial condition.
Markets are highly competitive and the Company may not continue to compete successfully.
The market for sporting goods and information security and print finishing products is highly fragmented and intensely competitive. Escalade competes with a variety of regional, national and international manufacturers for customers, employees, products, services and other important aspects of the business. In Sporting Goods, the Company has historically sold a large percentage of its sporting goods products to mass merchandisers, and has increasingly attempted to expand sales to specialty retailer and dealer markets. Similarly, the Company has traditionally sold information security and print finishing products to office products retailers, specialty machine dealers and government channels. In addition to competition for sales into those distribution channels, vendors also must compete in sporting goods with large format sporting goods stores, traditional sporting goods stores and chains, warehouse clubs, discount stores and department stores, and in information security and print finishing products with office supply superstores, computer and electronics superstores, contract stationers, and others. Some of the current and potential competitors are larger than Escalade and have substantially greater financial resources that may be devoted to sourcing, promoting and selling their products, and may discount prices more heavily than the Company can afford.
If the Company is unable to predict or react to changes in consumer demand, it may lose customers and sales may decline.
Success depends in part on the ability to anticipate and respond in a timely manner to changing consumer demand and preferences regarding sporting goods and information security and print finishing products. Products must appeal to a broad range of consumers whose preferences cannot be predicted with certainty and are subject to change. The Company often makes commitments to manufacture products months in advance of the proposed delivery to customers. If Escalade misjudges the market for products, sales may decline significantly. The Company may have to take significant inventory markdowns on unpopular products that are overproduced and/or miss opportunities for other products that may rise in popularity, both of which could have a negative impact on profitability. A major shift in consumer demand away from sporting goods or information security and print finishing products could also have a material adverse effect on the Company’s business, results of operations and financial condition.
Quarterly operating results are subject to fluctuation.
Operating results have fluctuated from quarter to quarter in the past, and the Company expects that they will continue to do so in the future. Earnings may not recover to historical levels and may fall short of either a prior fiscal period or market expectations. Factors that could cause these quarterly fluctuations include the following: international, national and local general economic and market conditions; the size and growth of the overall Sporting Goods and Information Security and Print Finishing markets; intense competition among manufacturers, marketers, distributors and sellers of products; demographic changes; changes in consumer preferences; popularity of particular designs, categories of products and sports; seasonal demand for products; the size, timing and mix of purchases of products; fluctuations and difficulty in forecasting operating results; ability to sustain, manage or forecast growth and inventories; new product development and introduction; ability to secure and protect trademarks, patents and other intellectual property; performance and reliability of products; customer service; the loss of significant customers or suppliers; dependence on distributors; business disruptions; increased costs of freight and transportation to meet delivery deadlines; changes in business strategy or development plans; general risks associated with doing business outside the United States, including, without limitation: exchange rates, import duties, tariffs, quotas and political and economic instability; changes in government regulations; any liability and other claims asserted against the Company; ability to attract and retain qualified personnel; and other factors referenced or incorporated by reference in this Form 10-K and any other filings with the Securities and Exchange Commission.
6
Operating results may be impacted by changes in the economy that impact business and consumer spending.
In general, the Company’s sales depend on discretionary spending by consumers. The economic downturn experienced in both the United States and the global economy has resulted in reduced consumer demand and reduced selling price and adversely impacted sales. A continuance of this economic downturn could result in further declines in revenues and impair growth in 2011. Severely negative economic conditions could greatly impair the ability and willingness of consumers to buy products. Operating results are directly impacted by the health of the North American, European and Asian economies. Business and financial performance may be adversely affected by current and future economic conditions, including unemployment levels, energy costs, interest rates, recession, inflation, the impact of natural disasters and terrorist activities, and other matters that influence business and consumer spending.
If national and global financial markets do not improve, potential disruptions in the credit markets may adversely affect business, including the availability and cost of short-term funds for liquidity requirements and ability to meet long-term commitments, which could adversely affect results of operations, cash flows and financial condition.
If internal funds are not available from operations, the Company may be required to rely on the banking credit and equity markets to meet financial commitments and short-term liquidity needs. Disruptions in the capital and credit markets, as experienced during 2008 and continuing through 2010, could adversely affect the Company’s ability to borrow pursuant to its Credit Agreement with Chase or to borrow from other financial institutions. Access to funds under the Credit Agreement or pursuant to arrangements with other financial institutions is dependent on Chase’s or other financial institutions’ ability to meet funding commitments. Financial institutions, including Chase, may not be able to meet their funding commitments if they experience shortages of capital and liquidity or if they experience high volumes of borrowing requests from other borrowers within a short period of time. There can be no assurance that the Company would be able to replace its current Credit Agreement on favorable terms, if at all, in the event that replacement would become necessary or desirable.
Longer term disruptions in the capital and credit markets as a result of uncertainty, changing or increased regulation, reduced alternatives or failures of significant financial institutions could adversely affect access to the liquidity needed for business. Any disruption could require the Company to take measures to conserve cash until the markets stabilize or until alternative credit arrangements or other funding for our business needs can be arranged. Such measures could include deferring capital expenditures and reducing or eliminating future share repurchases, dividend payments or other discretionary uses of cash.
Current financial conditions in the United States and globally may have significant effects on customers and suppliers that would result in material adverse effects on business, operating results and stock price.
Current financial conditions in the United States and globally and the concern that the worldwide economy may enter into a prolonged recessionary period may materially adversely affect customers’ access to capital or willingness to spend capital on products and/or their levels of cash liquidity with which to pay for products that they will order or have already ordered from the Company. In addition, current financial conditions may materially adversely affect suppliers’ access to capital and liquidity with which to maintain their inventories, production levels and/or product quality could cause them to raise prices, lower production levels or result in their ceasing operations. Continuing adverse economic conditions in the Company’s markets would also likely negatively impact business, which could result in: (1) reduced demand for products; (2) increased price competition for products; (3) increased risk of excess or obsolete inventories; (4) increased risk of collectability of cash from customers; (5) increased risk in potential reserves for doubtful accounts and write-offs of accounts receivable; (6) reduced revenues; and (7) higher operating costs as a percentage of revenues.
7
All of the foregoing potential consequences of current financial conditions are difficult to forecast and mitigate. As a consequence, operating results for a particular period are difficult to predict, and, therefore, prior results are not necessarily indicative of future results to be expected in future periods. Any of the foregoing effects could have a material adverse effect on the Company’s business, results of operations and financial condition and could adversely affect stock price.
Negative economic conditions could prevent the Company from accurately forecasting demand for its products which could adversely affect its operating results or market share.
The current negative economic conditions and market instability in the United States and globally makes it increasingly difficult for the Company, customers and suppliers to accurately forecast future product demand trends, which could cause the Company to produce excess products that can increase inventory carrying costs and result in obsolete inventory. Alternatively, this forecasting difficulty could cause a shortage of products, or materials used in products, that could result in an inability to satisfy demand for products and a loss of market share.
The Company may pursue strategic acquisitions, which could have an adverse impact on its business.
In the past, the Company has made acquisitions of complementary companies or businesses, which have been part of the strategic plan and may continue to pursue acquisitions in the future from time to time. Acquisitions may result in difficulties in assimilating acquired companies, and may result in the diversion of capital and management’s attention from other business issues and opportunities. The Company may not be able to successfully integrate operations that it acquires, including personnel, financial systems, distribution, and operating procedures. If the Company fails to successfully integrate acquisitions, the Company’s business could suffer. In addition, the integration of any acquired business, and its financial results, may adversely affect operating results. Escalade will consider acquisitions in the future, but the Company currently does not have any agreements with respect to any such acquisitions.
Growth may strain resources, which could adversely affect the Company’s business and financial performance.
Both the Sporting Goods and Information Security and Print Finishing businesses have grown in the past through strategic acquisitions. Growth places additional demands on management and operational systems. If the Company is not successful in continuing to support operational and financial systems, expanding the management team and increasing and effectively managing customers and suppliers, growth may result in operational inefficiencies and ineffective management of the Company’s business, which could adversely affect its business and financial performance.
The Company’s ability to expand business will be dependent upon the availability of adequate capital.
The rate of expansion will also depend on the availability of adequate capital, which in turn will depend in large part on cash flow generated by the business and the availability of equity and debt capital. Escalade can make no assurances that it will be able to obtain equity or debt capital on acceptable terms or at all, especially considering the current disruptions in the credit markets.
Failure to improve operational efficiency and reduce administrative costs could have a material adverse effect on the Company’s liquidity, financial position and results of operations.
The Company’s ability to improve profit margins is largely dependent on the success of on-going initiatives to streamline infrastructure, improve operational efficiency and the reduction of administrative costs at every level of the Company. Failure to continue to implement these initiatives successfully, or the failure of such initiatives to result in improved profitability, could have a material adverse effect on the Company’s liquidity, results of operations and financial position.
8
The Company’s business may be adversely affected by the actions of and risks associated with third-party suppliers.
The raw materials that the Company purchases for manufacturing operations and many of the products that it sells are sourced from a wide variety of third-party suppliers. The Company cannot control the supply, design, function or cost of many of the products that are offered for sale and are dependent on the availability and pricing of key materials and products. Disruptions in the availability of raw materials used in production of these products may adversely affect sales and result in customer dissatisfaction. In addition, global sourcing of many of the products sold is an important factor in the Company’s financial performance. The ability to find qualified suppliers and to access products in a timely and efficient manner is a significant challenge, especially with respect to goods sourced outside the United States. Political instability, the financial instability of suppliers, merchandise quality issues, trade restrictions, tariffs, currency exchange rates, transport capacity and costs, inflation and other factors relating to foreign trade are beyond the Company’s control.
Historically, instability in the political and economic environments of the countries in which the Company or its suppliers obtain products and raw materials has not had a material adverse effect on operations. However, the Company cannot predict the effect that future changes in economic or political conditions in such foreign countries may have on operations. In the event of disruptions or delays in supply due to economic or political conditions in foreign countries, such disruptions or delays could adversely affect results of operations unless and until alternative supply arrangements could be made. In addition, products and materials purchased from alternative sources may be of lesser quality or more expensive than the products and materials currently purchased abroad.
Deterioration in relationships with suppliers or in the financial condition of suppliers could adversely affect liquidity, results of operations and financial position.
Access to materials, parts and supplies is dependent upon close relationships with suppliers and the ability to purchase products from the principal suppliers on competitive terms. The Company does not enter into long-term supply contracts with these suppliers, and has no current plans to do so in the future. These suppliers are not required to sell to the Company and are free to change the prices and other terms. Any deterioration or change in the relationships with, or in the financial condition of the Company’s significant suppliers, could have an adverse impact on its ability to procure materials and parts necessary to produce products for sale and distribution. If any of the significant suppliers terminated or significantly curtailed its relationship with the Company or ceased operations, the Company would be forced to expand relationships with other suppliers, seek out new relationships with new suppliers or risk a loss in market share due to diminished product offerings and availability. Any change in one or more of these suppliers’ willingness or ability to continue to supply the Company with their products could have an adverse impact on the Company’s liquidity, results of operations and financial position.
Escalade may be subject to product liability claims and the Company’s insurance may not be sufficient to cover damages related to those claims.
The Company may be subject to lawsuits resulting from injuries associated with the use of sporting goods equipment and information security and print finishing products that it sells. The Company may incur losses relating to these claims or the defense of these claims. There is a risk that claims or liabilities will exceed the Company’s insurance coverage. In addition, the Company may be unable to retain adequate liability insurance in the future. Further, the Company is subject to regulation by the Consumer Product Safety Commission and similar state regulatory agencies. If the Company fails to comply with government and industry safety standards, it may be subject to claims, lawsuits, fines, product recalls and adverse publicity that could have a material adverse effect on the Company’s business, results of operations and financial condition.
9
Intellectual property rights are valuable, and any inability to protect them could reduce the value of products.
The Company obtains patents, trademarks and copyrights for intellectual property, which represent important assets to the Company. If the Company fails to adequately protect intellectual property through patents, trademarks and copyrights, its intellectual property rights may be misappropriated by others, invalidated or challenged, and our competitors could duplicate the Company’s products or may otherwise limit any competitive design or manufacturing advantages. The Company believes that success is likely to depend upon continued innovation, technical expertise, marketing skills and customer support and services rather than on legal protection of intellectual property rights. However, the Company intends to aggressively assert its intellectual property rights when necessary.
The Company is subject to risks associated with laws and regulations related to health, safety and environmental protection.
Products, and the production and distribution of products, are subject to a variety of laws and regulations relating to health, safety and environmental protection. Laws and regulations relating to health, safety and environmental protection have been passed in several jurisdictions in which the Company operates in the United States and abroad. Although the Company does not anticipate any material adverse effects based on the nature of operations and the thrust of such laws, there is no assurance such existing laws or future laws will not have a material adverse effect on the Company’s business, results of operations and financial condition.
International operations expose the Company to the unique risks inherent in foreign operations.
The Company has operations in Mexico, Europe and Asia. Foreign operations encounter risks similar to those faced by U.S. operations, as well as risks inherent in foreign operations, such as local customs and regulatory constraints, control over product quality and content, foreign trade policies, competitive conditions, foreign currency fluctuations and unstable political and economic conditions. Economic conditions and instabilities in Mexico have hampered the Company’s efforts to sell its Reynosa, Mexico facility which has been on the market since the fourth quarter of 2008. The Company’s international operations headquartered in Germany and its business relationships in Asia further increase its exposure to these foreign operating risks, which could have an adverse impact on the Company’s international income and worldwide profitability.
The Company could be adversely affected by changes in currency exchange rates and/or the value of the United States dollar.
The Company is exposed to risks related to the effects of changes in foreign currency exchange rates and the value of the United States dollar. Changes in currency exchange rates and the value of the United States dollar can have a significant impact on earnings from international operations. While the Company carefully watches fluctuations in currency exchange rates, these types of changes can have material adverse effects on the Company’s business, results of operations and financial condition.
Failure to improve and maintain the quality of internal controls over financial reporting could materially and adversely affect the ability to provide timely and accurate financial information, which could harm the Company’s reputation and share price.
Management is responsible for establishing and maintaining adequate internal controls over financial reporting for the Company to provide reasonable assurance regarding the reliability of financial reporting and the preparation of financial statements in accordance with generally accepted accounting principles. Management cannot be certain that weaknesses and deficiencies in internal controls will not arise or be identified or that the Company will be able to correct and maintain adequate controls over financial processes and reporting in the future. Any failure to maintain adequate controls or to adequately implement required new or improved controls could harm operating results or cause failure to meet reporting obligations in a timely and accurate manner. Ineffective internal controls over financial reporting could also cause investors to lose confidence in reported financial information, which could adversely affect the trading price of the Company’s common stock.
Disclosure controls and procedures are designed to provide reasonable assurance of achieving their objectives. However, management, including the Chief Executive Officer and Chief Financial Officer, does not expect that disclosure controls and procedures will prevent all errors and all fraud. A control system, no matter how well conceived and operated, can provide only reasonable, not absolute, assurance that the objectives of the control system are met. Further, the design of a control system must reflect the fact that there are resource constraints, and the benefits of controls must be considered relative to their costs. Because of inherent limitations in all control systems, no evaluation of controls can provide absolute assurance that all control issues and instances of fraud, if any, have been detected.
10
Failure to effectively implement the Company’s global integrated information system could cause incorrect information or delays in getting information which could adversely affect the performance of the Company.
The Company replaced its Enterprise Risk Planning (ERP) system with the Oracle E-Business suite at certain locations, specifically the Martin Yale North America location and one business entity within Sporting Goods. These implementations were completed as of the beginning of 2009. The Company has been in the process of re-evaluating further roll-out of the Oracle system or replacement with another system. As of the end of 2010, the Company replaced the Oracle system at Martin Yale North America and is currently assessing potential replacement of its legacy systems and the one remaining Oracle application. Should the Company decide to fully abandon the Oracle system, the remaining book value of the Oracle system of approximately $5.2 million ($3.4 million, net of tax) would be expensed over the estimated remaining economic life of the system. A decision regarding full implementation options has not been made. There can be no assurance the Company will have the necessary funds or the staff to fully avail itself of the control features inherent in the system design. Without such utility, the Company management is faced with cumbersome and time consuming efforts to manually consolidate its financial information.
The preparation of the Company’s financial statements requires the use of estimates that may vary from actual results.
The preparation of consolidated financial statements in conformity with accounting principles generally accepted in the United States requires management to make significant estimates that may affect financial statements. Due to the inherent nature of making estimates, actual results may vary substantially from such estimates, which could materially adversely affect the Company’s business, results of operations and financial condition. For more information on the Company’s critical accounting estimates, please see the Critical Accounting Estimates section of this Form 10-K.
Changes in accounting standards could impact reported earnings and financial condition.
The accounting standard setters, including the Financial Accounting Standards Board, the International Accounting Standards Board, the Securities and Exchange Commission and the Public Company Accounting Oversight Board, periodically change the financial accounting and reporting standards that govern the preparation of the Company’s consolidated financial statements. These changes can be hard to predict and apply and can materially affect how the Company records and reports its financial condition and results of operations. In some cases, the Company could be required to apply a new or revised standard retrospectively, which may result in the restatement of prior period financial statements.
Effective tax rate may fluctuate.
The Company is a multi-national, multi-channel provider of sporting goods and information security and print finishing products. As a result, the Company’s effective tax rate is derived from a combination of applicable tax rates in the various countries, states and other jurisdictions in which the Company operates. The effective tax rate may be lower or higher than its tax rates have been in the past due to numerous factors, including the sources of income, any agreement with taxing authorities in various jurisdictions, the tax filing positions taken in various jurisdictions and changes in the political environment in the jurisdictions in which the Company operates. The Company bases estimates of an effective tax rate at any given point in time upon a calculated mix of the tax rates applicable to the Company and to estimates of the amount of business likely to be done in any given jurisdiction. The loss of one or more agreements with taxing jurisdictions, a change in the mix of business from year to year and from country to country, changes in rules related to accounting for income taxes, changes in tax laws and any of the multiple jurisdictions in which the Company operates, or adverse outcomes from tax audits that the Company may be subject to in any of the jurisdictions in which the Company operates, could result in an unfavorable change in the effective tax rate which could have an adverse effect on the Company’s business and results of operations.
11
The market price of Escalade’s common stock is likely to be highly volatile as the stock market in general can be highly volatile.
The public trading of Escalade’s common stock is based on many factors, which could cause fluctuation in the Company’s stock price. These factors may include, among other things:
|
●
|
General economic and market conditions;
|
|
|
●
|
Actual or anticipated variations in quarterly operating results;
|
|
|
●
|
Lack of research coverage by securities analysts;
|
|
|
●
|
Relatively low market capitalization resulting in low trading volume in the Company’s stock;
|
|
|
●
|
If securities analysts provide coverage, our inability to meet or exceed securities analysts’ estimates or expectations;
|
|
|
●
|
Conditions or trends in the Company’s industries;
|
|
|
●
|
Changes in the market valuations of other companies in the Company’s industries;
|
|
|
●
|
Announcements by the Company or the Company’s competitors of significant acquisitions, strategic partnerships, divestitures, joint ventures or other strategic initiatives;
|
|
|
●
|
Capital commitments;
|
|
|
●
|
Additions or departures of key personnel;
|
|
|
●
|
Sales and repurchases of the Company’s common stock; and
|
|
|
●
|
The ability to maintain listing of the Company’s common stock on the NASDAQ Global Market.
|
Many of these factors are beyond the Company’s control. These factors may cause the market price of the Company’s common stock to decline, regardless of operating performance.
Information security may be compromised.
Through sales and marketing activities, the Company collects and stores certain information that customers provide to purchase products or services or otherwise communicate and interact with the Company. Despite instituted safeguards for the protection of such information, the Company cannot be certain that all of its systems are entirely free from vulnerability to attack. Computer hackers may attempt to penetrate the Company’s network security and, if successful, misappropriate confidential customer or business information. In addition, an employee, a contractor or other third party with whom the Company does business may attempt to circumvent the Company’s security measures in order to obtain such information or inadvertently cause a breach involving such information. Loss of customer or business information could disrupt operations, damage the Company’s reputation, and expose the Company to claims from customers, financial institutions, payment card associations and other persons, any of which could have an adverse effect on the Company’s business, results of operations and financial condition. In addition, compliance with tougher privacy and information security laws and standards may result in significant expense due to increased investment in technology and the development of new operational processes.
Terrorist attacks or acts of war may seriously harm the Company’s business.
Among the chief uncertainties facing the nation and the world and, as a result, the business is the instability and conflict in the Middle East. Obviously, no one can predict with certainty what the overall economic impact will be as a result of these circumstances. Terrorist attacks may cause damage or disruption to the Company, employees, facilities and customers, which could significantly impact net sales, costs and expenses and financial condition. The potential for future terrorist attacks, the national and international responses to terrorist attacks, and other acts of war and hostility may cause greater uncertainty and cause business to suffer in ways the Company currently cannot predict.
12
These risks are not exhaustive.
Other sections of this Form 10-K may include additional factors which could adversely impact the Company’s business and financial performance. Moreover, the Company operates in a very competitive and rapidly changing environment. New risk factors emerge from time to time and it is not possible for management to predict all risk factors, nor can the Company assess the impact of all factors on business or the extent to which any factor, or combination of factors, may cause actual results to differ materially from those contained in any forward-looking statements. Given these risks and uncertainties, investors should not place undue reliance on forward-looking statements as a prediction of actual results.
| ITEM 1B — UNRESOLVED STAFF COMMENTS |
None.
| ITEM 2 — PROPERTIES |
At December 25, 2010, the Company operated from the following locations:
|
Location
|
Square
Footage |
Owned or
Leased |
Use
|
|
Sporting Goods
|
|||
|
Evansville, Indiana, USA
|
359,000
|
Owned
|
Distribution; sales and marketing; administration
|
|
Olney, Illinois, USA
|
108,500
|
Leased
|
Manufacturing and distribution
|
|
Gainesville, Florida, USA
|
154,200
|
Owned
|
Manufacturing and distribution
|
|
Rosarito, Mexico
|
66,500
|
Owned
|
Manufacturing and distribution
|
|
Rosarito, Mexico
|
108,200
|
Leased
|
Manufacturing
|
|
Reynosa, Mexico
|
126,800
|
Owned
|
Idle
|
|
Raleigh, N. Carolina, USA
|
69,800
|
Leased
|
Manufacturing and distribution
|
|
Jacksonville, Florida, USA
|
18,000
|
Leased
|
Sales and marketing
|
|
Shanghai, China
|
650
|
Leased
|
Sales and sourcing
|
|
Information Security and Print Finishing
|
|||
|
Wabash, Indiana, USA
|
141,000
|
Owned
|
Manufacturing and distribution; sales and marketing; administration
|
|
Markdorf, Germany
|
70,300
|
Owned
|
Manufacturing and distribution; sales and marketing; administration
|
|
Paris, France
|
1,335
|
Leased
|
Distribution; sales and marketing
|
|
Crawley, UK
|
8,300
|
Leased
|
Sales and marketing
|
|
Barcelona, Spain
|
8,600
|
Leased
|
Distribution; sales and marketing
|
|
Johannesburg, South Africa
|
4,800
|
Leased
|
Distribution; sales and marketing
|
|
Sollentuna, Sweden
|
1,400
|
Leased
|
Sales and marketing
|
|
Beijing, China
|
1,400
|
Leased
|
Sales and marketing
|
At the end of 2010, the Company has one idle facility. The Company completed the consolidation of the Mexican production facilities into the Rosarito, Mexico location in February 2009. The Reynosa facility is on the market to be sold; however, due to market conditions and tightened credit, the Company cannot be assured the facility will be sold within one year and has, therefore, classified the asset as held for use in the Company’s financial statements. The Company believes that its facilities are in satisfactory and suitable condition for their respective operations. The Company also believes that it is in material compliance with all applicable environmental regulations and is not subject to any proceeding by any federal, state or local authorities regarding such matters. The Company provides regular maintenance and service on its plants and machinery as required.
13
| ITEM 3 — LEGAL PROCEEDINGS |
The Company is involved in litigation arising in the normal course of its business, but the Company does not believe that the disposition or ultimate resolution of such claims or lawsuits will have a material adverse affect on the business or financial condition of the Company.
The Company is not aware of any probable or levied penalties against the Company relating to the American Jobs Creation Act.
| ITEM 4 — [RESERVED] |
| ITEM 5 — MARKET FOR THE REGISTRANT’S COMMON EQUITY, RELATED STOCKHOLDER MATTERS AND ISSUER REPURCHASES OF SECURITIES |
The Company’s common stock is traded under the symbol “ESCA” on the NASDAQ Global Market. The following table sets forth, for the calendar periods indicated, the high and low sales prices of the Common Stock as reported by the NASDAQ Global Market:
|
Prices
|
High
|
Low
|
||||||
|
2010
|
||||||||
|
Fourth quarter ended December 25, 2010
|
$ | 6.65 | $ | 4.27 | ||||
|
Third quarter ended October 2, 2010
|
5.80 | 4.14 | ||||||
|
Second quarter ended July 10, 2010
|
5.52 | 2.46 | ||||||
|
First quarter ended March 20, 2010
|
3.00 | 2.21 | ||||||
|
2009
|
||||||||
|
Fourth quarter ended December 26, 2009
|
$ | 3.07 | $ | 1.96 | ||||
|
Third quarter ended October 3, 2009
|
3.44 | 0.72 | ||||||
|
Second quarter ended July 11, 2009
|
1.48 | 0.43 | ||||||
|
First quarter ended March 21, 2009
|
1.15 | 0.30 | ||||||
|
2008
|
||||||||
|
Fourth quarter ended December 27, 2008
|
$ | 2.54 | $ | 0.48 | ||||
|
Third quarter ended October 4, 2008
|
5.40 | 2.51 | ||||||
|
Second quarter ended July 12, 2008
|
9.14 | 4.80 | ||||||
|
First quarter ended March 22, 2008
|
9.39 | 8.00 | ||||||
The closing market price on February 9, 2011 was $5.75 per share.
14
Depending on profitability and cash flows from operations, the Board of Directors issues annual dividends. Based on the Company’s 2009 performance, no dividend was declared for 2009. As a result of the 2010 performance, the Board declared a dividend in 2010 of $0.10 per share. Dividends issued/declared during 2010 and 2008 are as follows:
|
Record Date
|
Payment Date
|
Amount per Common Share
|
|||
|
March 14, 2008
|
March 21, 2008
|
$ | 0.25 | ||
|
November 22, 2010
|
December 6, 2010
|
$ | 0.10 | ||
There were approximately 188 holders of record of the Company’s Common Stock at February 8, 2011. The approximate number of stockholders, including those held by depository companies for certain beneficial owners, was 1,237.
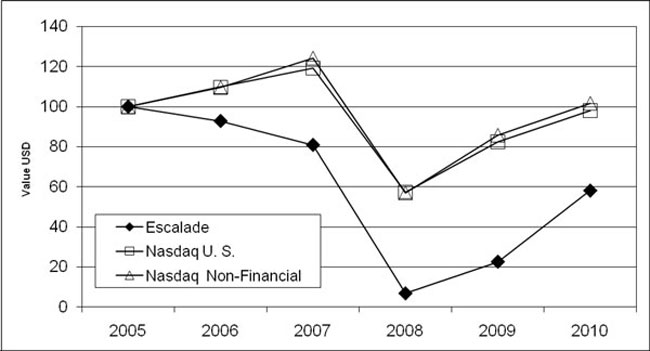
SHAREHOLDER RETURN PERFORMANCE GRAPH
Set forth below is a line graph comparing the yearly percentage change in the cumulative total shareholder return on the Company’s common stock with that of the cumulative total return on the NASDAQ US Stock Market Index and the NASDAQ Non-Financial Stocks Index for the five year period ended December 25, 2010. The following information is based on an investment of $100, on January 1, 2005, in the Company’s common stock, the NASDAQ US Stock Market Index and the NASDAQ Non-Financial Stocks Index, with dividends reinvested.
COMPARISON OF FIVE YEAR CUMULATIVE TOTAL RETURN
|
2005
|
2006
|
2007
|
2008
|
2009
|
2010
|
|||||||||||||
|
Escalade Common Stock
|
100 | 93 | 81 | 7 | 23 | 58 | ||||||||||||
|
NASDAQ US Stock Index
|
100 | 110 | 119 | 57 | 83 | 98 | ||||||||||||
|
NASDAQ Non-Financial Stock Index
|
100 | 110 | 124 | 57 | 86 | 102 | ||||||||||||
The above performance graph does not constitute soliciting material and should not be deemed filed or incorporated by reference into any other Company filing under the Securities Act of 1933 or the Securities Exchange Act of 1934, except to the extent the Company specifically incorporates the performance graph by reference therein.
15
ISSUER PURCHASES OF EQUITY SECURITIES
|
Period
|
(a) Total
Number of Shares (or Units) Purchased |
(b) Average
Price Paid per Share (or Unit) |
(c) Total
Number of Shares (or Units) Purchased as Part of Publicly Announced Plans or Programs |
(d) Maximum
Number (or Approximate Dollar Value) of Shares (or Units) that May Yet Be Purchased Under the Plans or Programs |
||||||||||
|
Share purchases prior to 10/02/2010 under the current repurchase program.
|
982,916 | $ | 8.84 | 982,916 | $ | 2,273,939 | ||||||||
|
Fourth quarter purchases:
|
||||||||||||||
|
10/03/2010 – 10/30/2010
|
None
|
None
|
None
|
No Change
|
||||||||||
|
10/31/2010 – 11/27/2010
|
None
|
None
|
None
|
No Change
|
||||||||||
|
11/28/2010 – 12/25/2010
|
None
|
None
|
None
|
No Change
|
||||||||||
|
Total share purchases under the current program
|
982,916 | $ | 8.84 | 982,916 | $ | 2,273,939 | ||||||||
The Company has one stock repurchase program which was established in February 2003 by the Board of Directors and which initially authorized management to expend up to $3,000,000 to repurchase shares on the open market as well as in private negotiated transactions. In each of February 2005 and 2006, August 2007 and February 2008 the Board of Directors increased the remaining balance on this plan to its original level of $3,000,000. The repurchase plan has no termination date and there have been no share repurchases that were not part of a publicly announced program.
| ITEM 6 — SELECTED FINANCIAL DATA |
(In thousands, except per share data)
|
At and For Years Ended
|
December 25,
2010
|
December 26,
2009
|
December 27,
2008
|
December 29,
2007
|
December 30,
2006
|
|||||||||||||||
|
Income Statement Data
|
||||||||||||||||||||
|
Net revenue
|
||||||||||||||||||||
|
Sporting Goods
|
$ | 85,815 | $ | 76,807 | $ | 98,039 | $ | 129,788 | $ | 136,733 | ||||||||||
|
Information Security and Print Finishing
|
34,841 | 39,192 | 50,647 | 55,788 | 54,732 | |||||||||||||||
|
Total net sales
|
120,656 | 115,999 | 148,686 | 185,576 | 191,465 | |||||||||||||||
|
Net income (loss)
|
6,059 | 1,657 | (7,496 | ) | 9,255 | 8,495 | ||||||||||||||
|
Weighted-average shares
|
12,726 | 12,632 | 12,684 | 12,901 | 13,012 | |||||||||||||||
|
Per Share Data
|
||||||||||||||||||||
|
Basic earnings (loss) per share
|
$ | 0.48 | $ | 0.13 | $ | (0.59 | ) | $ | 0.72 | $ | 0.65 | |||||||||
|
Cash dividends
|
$ | 0.10 | $ | — | $ | 0.25 | $ | 0.22 | $ | 0.20 | ||||||||||
|
Balance Sheet Data
|
||||||||||||||||||||
|
Working capital
|
24,132 | 9,688 | 4,842 | 31,442 | 33,125 | |||||||||||||||
|
Total assets
|
127,553 | 127,238 | 147,701 | 152,016 | 150,715 | |||||||||||||||
|
Short-term bank debt
|
11,407 | 27,644 | 46,525 | 13,033 | 10,336 | |||||||||||||||
|
Long-term bank debt
|
7,500 | — | — | 19,135 | 22,609 | |||||||||||||||
|
Total stockholders’ equity
|
87,030 | 82,764 | 78,790 | 91,742 | 85,715 | |||||||||||||||
16
Fiscal year 2010 was positively impacted by increased sales in the Sporting Goods segment, as well as continued efforts at cost reduction, and improved margins resulting from higher sales volumes.
Fiscal year 2009 was positively impacted by significant cost reductions and consolidation of certain manufacturing and distributions facilities.
Fiscal year 2008 was negatively impacted by loss of sales to Sears, a major sporting goods retailer, impairment of certain long-lived assets and a general economic downturn.
Fiscal year 2007 was positively impacted by the sale of rights to license potential future intellectual property.
Fiscal year 2006 was adversely impacted by the completion of a plan to rationalize certain products in the Information Security and Print Finishing business.
| ITEM 7 — MANAGEMENT’S DISCUSSION AND ANALYSIS OF FINANCIAL CONDITION AND RESULTS OF OPERATIONS |
The following section should be read in conjunction with Item 1: Business; Item 1A: Risk Factors; Item 6: Selected Financial Data; and Item 8: Financial Statements and Supplementary Data.
Forward-Looking Statements
This report contains forward-looking statements relating to present or future trends or factors that are subject to risks and uncertainties. These risks include, but are not limited to, the impact of competitive products and pricing, product demand and market acceptance, new product development, the continuation and development of key customer and supplier relationships, Escalade’s ability to control costs, general economic conditions, fluctuation in operating results, changes in the securities market, Escalade’s ability to obtain financing and to maintain compliance with the terms of such financing and other risks detailed from time to time in Escalade’s filings with the Securities and Exchange Commission. Escalade’s future financial performance could differ materially from the expectations of management contained herein. Escalade undertakes no obligation to release revisions to these forward-looking statements after the date of this report.
Overview
Escalade, Incorporated (“Escalade” or “Company”) manufactures and distributes products for two industries: Sporting Goods and Information Security and Print Finishing. As mentioned above in Item 1 - Business, the Martin Yale Group business segment historically referred to as “Office Products” is now referred to as “Information Security and Print Finishing” to more accurately describe this line of business. Martin Yale Group has increasingly focused its strategy on expanding this segment of its business to assist businesses and governments with their high security needs for handling sensitive customer, employee and business documents and information, in addition to Martin Yale’s traditional product offerings.
Within these industries the Company has successfully built a market presence in niche markets. This strategy is heavily dependent on expanding the customer base, barriers to entry, brand recognition and excellent customer service. A key strategic advantage is the Company’s established relationships with major customers that allow the Company to bring new products to market in a cost effective manner while maintaining a diversified product line and wide customer base. In addition to strategic customer relations, the Company has substantial manufacturing and import experience that enable it to be a low cost supplier.
17
A majority of the Company’s products are in markets that are currently experiencing low growth rates. Where the Company enjoys a commanding market position, such as table tennis tables in the Sporting Goods segment and paper folding machines in the Information Security and Print Finishing segment, revenue growth is expected to be roughly equal to general growth/decline in the economy. However, in markets that are fragmented and where the Company is not the dominant leader, such as archery in the Sporting Goods segment and data security shredders in the Information Security and Print Finishing segment, the Company anticipates growth. To enhance internal growth, the Company has a strategy of acquiring companies or product lines that complement or expand the Company’s product lines. A key objective is the acquisition of product lines with barriers to entry that the Company can take to market through its established distribution channels or through new market channels. Significant synergies are achieved through assimilation of acquired product lines into the existing company structure. Management believes that key indicators in measuring the success of this strategy are revenue growth, earnings growth and the expansion of channels of distribution. The following table sets forth the annual percentage change in revenues and net income (loss) over the past three years:
|
2010
|
2009
|
2008
|
|||||||
|
Net revenue
|
|||||||||
|
Sporting Goods
|
11.7 | % | -21.7 | % | -24.5 | % | |||
|
Information Security and Print Finishing
|
-11.1 | % | -22.6 | % | -9.2 | % | |||
|
Total
|
4.0 | % | -22.0 | % | -19.9 | % | |||
|
Net income
|
265.6 | % | 122.1 | % | -181.0 | % | |||
Results of Operations
The following schedule sets forth certain consolidated statement of operations data as a percentage of net revenue for the periods indicated:
|
2010
|
2009
|
2008
|
||||||||||
|
Net revenue
|
100.0 | % | 100.0 | % | 100.0 | % | ||||||
|
Cost of products sold
|
69.2 | % | 70.9 | % | 75.4 | % | ||||||
|
Gross margin
|
30.8 | % | 29.1 | % | 24.6 | % | ||||||
|
Selling, administrative and general expenses
|
22.9 | % | 25.4 | % | 26.8 | % | ||||||
|
Impairment of assets
|
0.0 | % | 0.0 | % | 1.8 | % | ||||||
|
Amortization
|
1.1 | % | 2.0 | % | 1.5 | % | ||||||
|
Operating income (loss)
|
6.8 | % | 1.7 | % | (5.5 | %) | ||||||
Consolidated Revenue and Gross Margin
Sales growth across most sales channels of the Sporting Goods segment resulted in an overall increase of 11.7% in Sporting Goods net revenues for 2010 compared to 2009. Revenues from the Information Security and Print Finishing business decreased 11.1% in 2010 compared to 2009. Approximately 1% of the decline in Information Security and Print Finishing revenue is due to changes in foreign exchange rates. The remaining decline is a result of continued weakness in the office products channel and the government sales channel and prolonged economic weakness in Spain and certain other European countries.
The Company continued to make productivity improvements in 2010 in the Sporting Goods segment and reduced unfavorable manufacturing variances as a result of higher sales in 2010 compared to 2009. The overall gross margin percentage in 2010 in the Sporting Goods business increased to 27.2% compared to 22.9% for 2009. The overall gross margin in 2010 decreased in the Information Security and Print Finishing business to 39.8% compared to 41.3% in 2009, primarily as a result of lower sales volume which generated under absorbed factory variances.
Consolidated Selling, General and Administrative Expenses
Consolidated selling, general and administrative expenses (“SG&A”) were $27.7 million in 2010 compared to $29.5 million in 2009, a decrease of $1.8 million or 6%. The Company was able to reduce SG&A costs and still invest additional funds in marketing efforts to promote brand recognition and new product launches.
18
Other Income
Other income decreased in 2010 compared to 2009, partially due to a reduction in dividend income. Additionally, in 2009, the Company recognized a one-time gain on the sale of marketable equity securities of approximately $0.4 million. This gain was a partial recovery of the previously recorded impairment. This gain, which was not repeated in 2010, was mostly offset by an increase in income from non-marketable equity investments of approximately $0.4 million. Income from non-marketable equity investments was $2.0 million in 2010 compared with $1.6 million in 2009.
Provision for Income Taxes
The effective income tax rate in 2010 was lower relative to 2009 primarily due to an over accrual of a potential tax audit liability which was settled in 2010. The effective tax rate for 2010 was 33.2% compared to 36.4% and 26.4% in 2009 and 2008 respectively. The Company expects its future effective tax rates to approximate the effective tax rate achieved in 2009.
Sporting Goods
Net revenues, operating income (loss), and net income (loss) for the Sporting Goods business segment for the three years ended December 25, 2010 were as follows:
|
In Thousands
|
2010
|
2009
|
2008
|
|||||||||
|
Net revenue
|
$ | 85,815 | $ | 76,807 | $ | 98,039 | ||||||
|
Operating income (loss)
|
9,171 | 4,610 | (6,250 | ) | ||||||||
|
Net income (loss)
|
4,601 | 1,273 | (5,428 | ) | ||||||||
Net revenue increased 11.7% in 2010 compared to 2009 with growth coming from most sales channels in the Sporting Goods segment. The Company continues to aggressively pursue opportunities to increase revenue through introduction of new products, expansion of product distribution, and increased investment in consumer marketing. Sales channels are predominately mass market retail customers, specialty retailers, and dealers.
Gross margin and profitability increased in 2010 compared with 2009. The gross margin ratio in 2010 improved to 27.2% in 2010 compared to 22.9% in the prior year. The improvement is due to continued focus on production efficiencies and better factory absorption resulting from increased sales volume. As a result, operating income as a percentage of net revenue increased to 10.7% in 2010 compared to 6.0% in 2009. Management anticipates that with additional sales growth in 2011, improvements in margins will continue. Net income for 2010 increased from 2009 due primarily to increased revenue.
Information Security and Print Finishing
Net revenue, operating income, and net income (loss) for the Information Security and Print Finishing business segment for the three years ended December 25, 2010 were as follows:
|
In Thousands
|
2010
|
2009
|
2008
|
|||||||||
|
Net revenue
|
$ | 34,841 | $ | 39,192 | $ | 50,647 | ||||||
|
Operating income
|
926 | 1,780 | 3,930 | |||||||||
|
Net income (loss)
|
(187 | ) | 1,077 | 1,835 | ||||||||
Sales in the Information Security and Print Finishing business declined 11.1% in 2010 compared to 2009 primarily due to the continued weakness in the global office products channel and the government channel. The Company has widened its product range to improve its opportunities in the information security and print finishing markets. Excluding the effect of changes in foreign exchange rates, 2010 sales were down 10.5% from 2009. Sales are direct to end users, including government agencies, as well as through office products retailers, wholesalers, specialty dealers, and business partners.
19
Profitability in the Information Security and Print Finishing segment decreased in 2010 as evidenced by the ratio of operating income to net revenues which declined to 2.7% in 2010 compared to 4.5% in 2009. The primary reasons for this decline in profitability are under absorbed factory variances due to low sales and changes in product mix, an increasingly competitive environment, and foreign exchange rate fluctuations. Management anticipates increased sales due to a broadening of the product portfolio and enhanced focus on sales opportunities in 2011 will help improve operating income.
Financial Condition and Liquidity
The current ratio, a basic measure of liquidity (current assets divided by current liabilities), increased to 1.8 in 2010 from 1.2 in 2009. The primary reason for the improvement in current ratio is a reduction in debt to $18.9 million in 2010 down from $27.6 million in 2009. In addition, the Company restructured a portion of debt to long-term in 2010. The remaining current assets and current liabilities increased proportionally to the increase in net revenue.
The Company’s generation of cash was principally a result of increased profits resulting from stronger sales and improvements in gross margin. The Company paid a dividend in the amount of $1.3 million in 2010. As a result of improved profits, the Company was able to reduce borrowings at year end by $8.7 million which improved total bank debt as a percent of stockholders equity to 21.7% in 2010, down from 33.4% in 2009.
In 2011, the Company expects capital expenditures to be approximately $2.0 million unless the Company resumes implementation of an integrated information system, which would require additional capital expenditures. The costs and timing of resuming this project is currently being evaluated. Should the Company decide to abandon the Oracle system, the remaining book value of the Oracle system of approximately $5.2 million ($3.4 million, net of tax) would be expensed over the estimated remaining economic life of the system.
The Company’s working capital requirements are primarily funded through cash flows from operations and revolving credit agreements with its bank. During 2010, the Company’s maximum borrowings under its primary revolving credit lines totaled $27.6 million compared to $48.8 million in 2009. Total notes payable as of the end of fiscal 2010 was $18.9 million compared with $27.6 million at the end of fiscal 2009. The overall effective interest rate in 2010 was 4.9% which was slightly higher than the effective rate of 4.4% in 2009. The Company’s Credit Agreement with JPMorgan Chase Bank, N.A. matures as of May 31, 2012. The Company also maintains a multicurrency overdraft facility with its bank. The total amount outstanding under the overdraft facility at the end of fiscal 2010 was $1.6 million compared with $0.2 million at the end of fiscal 2009.
The Company has a long standing relationship with its lender and has met all financial covenants under the new agreement which was amended as of May 31, 2010. The Company has taken significant actions to preserve cash, increase liquidity and position it to operate in very difficult economic conditions. Specifically, the Company continues to benefit from the consolidation of three manufacturing plants into one thus eliminating the burdens of excess capacity that negatively affected 2008. It has increased prices, reduced head counts, and implemented other overall expense savings. As a result, as mentioned above, the Company lowered its bank debt in 2010 by approximately 31.6% to $18.9 million, excluding the amounts outstanding under the overdraft facility of $1.6 million. The Company operates in an industry which has been adversely affected by the current economic conditions.
The Company expects improvements in its overall sales levels for fiscal year 2011, above those experienced in 2010, as a result of new product offerings and expanded customer base. The Company believes that cash generated from its projected 2011 operations, and the commitment of borrowings from its primary lender will provide it with sufficient cash flows for its operations.
It is possible that if the economic conditions deteriorate, this could have adverse effects on the Company’s ability to operate profitably during fiscal year 2011. To the extent that occurs, management intends to pursue additional cost reductions and to continue realigning its infrastructure in an effort to match the Company’s overhead and cost structure with the sales level dictated by current market conditions.
20
New Accounting Pronouncements
Refer to Note 1 to the consolidated financial statements under the sub-heading “New Accounting Pronouncements”.
Off Balance Sheet Financing Arrangements
The Company has no financing arrangements that are not recorded on the Company’s balance sheet.
Contractual Obligations
The following schedule summarizes the Company’s contractual obligations as of December 25, 2010:
|
Amounts in thousands
|
Payments Due by Period
|
|||||||||||||||||||
|
Contractual Obligations
|
Total
|
Less than 1 year
|
1 –3 years
|
3 – 5 years
|
More than 5 years
|
|||||||||||||||
|
Debt
|
$ | 18,907 | $ | 11,407 | $ | 4,000 | $ | 3,500 | $ | — | ||||||||||
|
Overdraft facility
|
1,585 | 1,585 | — | — | — | |||||||||||||||
|
Future interest payments (1)
|
2,260 | 1,360 | 650 | 250 | — | |||||||||||||||
|
Operating leases
|
1,391 | 873 | 452 | 66 | — | |||||||||||||||
|
Minimum payments under royalty and license agreements
|
3,185 | 430 | 880 | 750 | 1,125 | |||||||||||||||
|
Total
|
$ | 27,328 | $ | 15,655 | $ | 5,982 | $ | 4,566 | $ | 1,125 | ||||||||||
Notes:
(1) Assumes that the Company will not increase borrowings under its long-term credit agreements and that the effective interest rate experienced in 2010 of 4.9% will continue for the life of the agreements.
Critical Accounting Estimates
The methods, estimates and judgments used in applying the Company’s accounting policies have a significant impact on the results reported in its financial statements. Some of these accounting policies require difficult and subjective judgments, often as a result of the need to make estimates of matters that are inherently uncertain. The most critical accounting estimates are described below and in the Notes to the Consolidated Financial Statements.
Product Warranty
The Company provides limited warranties on certain of its products, for varying periods. Generally, the warranty periods range from 90 days to one year. However, some products carry extended warranties of seven-year, ten-year, and lifetime warranties. The Company records an accrued liability and expense for estimated future warranty claims based upon historical experience and management’s estimate of the level of future claims. Changes in the estimated amounts recognized in prior years are recorded as an adjustment to the accrued liability and expensed in the current year. To the extent there are product defects in current products that are unknown to management and do not fall within historical defect rates, the product warranty reserve could be understated and the Company could be required to accrue additional product warranty costs thus negatively affecting gross margin.
Inventory Valuation Reserves
The Company evaluates inventory for obsolescence and excess quantities based on demand forecasts over specified time frames, usually one year. The demand forecast is based on historical usage, sales forecasts and current as well as anticipated market conditions. All amounts in excess of the demand forecast are deemed to be potentially excess or obsolete and a reserve is established based on the anticipated net realizable value. To the extent that demand forecasts are greater than actual demand and the Company fails to reduce manufacturing output accordingly, the Company could be required to record additional inventory reserves which would have a negative impact on gross margin.
21
Allowance for Doubtful Accounts
The Company provides an allowance for doubtful accounts based upon a review of outstanding receivables, historical collection information and existing economic conditions. Accounts receivable are ordinarily due between 30 and 60 days after the issuance of the invoice. Accounts are considered delinquent when more than 90 days past due. Delinquent receivables are reserved or written off based on individual credit evaluation and specific circumstances of the customer. To the extent that actual bad debt losses exceed the allowance recorded by the Company, additional reserves would be required which would increase selling, general and administrative costs.
Advertising Subsidies
The Company enters agreements with certain retailers to pay for direct advertising programs and/or provide in-store display units. These agreements are not based on retailer purchase volumes and do not obligate the retailer to continue carrying the Company’s products in future years. The Company determines the value of the advertising services based on its own research and history of providing such services. The Company expenses these costs in the period in which they are incurred as a selling expense.
CO-OP Advertising
The Company offers co-operative advertising allowances to certain retailers to encourage product promotions. These agreements are typically based on a percentage of retailer purchases up to a maximum allowance and the Company is never directly involved with the media provider. The Company accrues the estimated cost of these programs based on the sales volume of the retailer and historical trends. As costs are accrued they are recorded as a reduction in sales. To the extent that actual co-operative advertising costs exceed the Company’s estimates, additional co-operative advertising allowances would be required which would reduce net revenues.
Volume Rebates
The Company has various rebate programs with certain retailers that are based on purchase volume. Typically these programs are based on achieving specified sales volumes and the rebate is calculated as a percentage of purchases. Based on the terms of the agreement, purchase levels and historical trends the Company accrues the estimated cost of these programs and records the same as a reduction in sales. To the extent that actual rebate program costs exceed the Company’s estimates, additional rebate program allowances would be required which would reduce net revenues.
Catalog Allowances
A number of large office supply dealers operate through catalogs distributed to businesses globally. Product content is decided by the dealer each time a new catalog is issued; typically once a year. Catalog allowances are required by the dealer as an inducement to include the Company’s products. The allowance is based on a fixed cost per page and/or a percentage of purchases by the dealer. The fixed portion of the allowance is often paid when the catalog is distributed and is recognized when incurred and the variable portion is accrued based on dealer purchases and historical trends. Catalog allowances are recorded as a reduction in sales. To the extent that actual catalog costs exceed the estimated costs associated with variable agreement provisions, additional catalog allowances would be required which would negatively impact net revenues.
Impairment of Goodwill
The Company annually tests as of the last day of its fiscal year for impairment of goodwill in accordance with guidance in FASB ASC 350, Intangibles – Goodwill and Other. Management determined the assumptions and inputs utilized in the evaluation of the fair value of the Company’s two separate reporting units, discussed below. The first phase of the goodwill impairment test requires that the fair value of the applicable reporting unit be compared with its recorded value. The Company establishes fair value by using an income approach or a combination of a market approach and an income approach. The market approach uses the guideline-companies method to estimate the fair value of a reporting unit based on reported sales of publicly-held entities engaged in the same or a similar business as the reporting unit. The income approach uses the discounted cash flow method to estimate the fair value of a reporting unit by calculating the present value of the expected future cash flows of the reporting unit. The discount rate is based on a weighted average cost of capital determined using publicly-available interest rate information on the valuation date and data regarding equity, size and country-specific risk premiums/decrements compiled and published by a commercial source. The Company uses assumptions about expected future operating performance in determining estimates of those cash flows, which may differ from actual cash flows.
22
If the recorded value of net assets of a reporting unit is less than the determined fair value, management performs a phase-two analysis that allocates the fair value of the reporting unit calculated in phase one to the specific tangible and intangible assets and liabilities of the reporting unit and results in an implied fair value of goodwill. Goodwill is reduced by any shortfall of implied goodwill to its current carrying value.
Beginning in late 2009, and continuing going forward, two of the Company’s reporting units; Martin Yale North America and Martin Yale Europe, which comprise the Information Security and Print Finishing segment, have migrated to one reporting unit as a result of consolidation of management and internal reporting. As of December 25, 2010, the Company had two reporting units that require separate goodwill impairment analysis. Those reporting units are Escalade Sports, and Martin Yale Group. These reporting units are identical to the operating segments; Sporting Goods and Information Security and Print Finishing, respectively. Significant assumptions and inputs used in each of the reporting units goodwill impairment testing are as follows:
Escalade Sports – The Company appraised the fair value of the invested capital of the Escalade Sports reporting unit using an income approach. The discount rate used in the 2010 discounted cash flow calculation was 11.5% compared to 13.0% for 2009. The reduction in the discount rate is primarily a factor of lower corporate bond and treasury rates in 2010 compared with 2009. Projected revenues and costs for 2011 and beyond reflected the Company’s best view of the current global economic situation, demand for existing products, the status of new products and product improvements, and the projected cost of raw materials and manufacturing that are deemed material in projecting future outcomes.
Martin Yale Group – The Company, with the assistance of an external valuation specialist, appraised the fair value of the combined total invested capital of Martin Yale North America and Martin Yale Europe, as a combined reporting unit. The appraisal study utilized a combination income and market approach. The market approach was weighted 25% and the income approach was weighted 75% to arrive at the final fair value determination. The discount rate used in the 2010 discounted cash flow calculation was 11.5% compared to 12% for Martin Yale North America, and 11% for Martin Yale Europe, respectively, for 2009. The change in the discount rate is primarily a factor of lower corporate bond and treasury rates in 2010 compared with 2009. The methodology used in 2010 is consistent with that used previously. Projected revenues and costs for 2011 and beyond reflected the Company’s best view of the current global economic situation, demand for existing products, the status of new products and product improvements, and the projected cost of raw materials and manufacturing that are deemed material in projecting future outcomes.
The Company’s testing determined that goodwill of each reporting unit was not impaired. Of the total recorded goodwill of $25.4 million at December 25, 2010, $12.0 million was allocated to the Escalade Sports reporting unit; and $13.4 million was allocated to the Martin Yale Group reporting unit. Based on the results of the impairment tests, the fair value of reporting unit invested capital exceeded the carrying value of reporting unit invested capital by approximately 59.9% and 2.8% for the Escalade Sports and Martin Yale Group reporting units, respectively, as of December 25, 2010. Continued protracted declines in future cash flows as well as adverse economic conditions could have a negative effect on fair value of each reporting unit.
Long Lived Assets
The Company evaluates the recoverability of certain long-lived assets whenever events or changes in circumstances indicate that the carrying amount may not be recoverable. Estimates of future cash flows used to test recoverability of long-lived assets include separately identifiable undiscounted cash flows expected to arise from the use and eventual disposition of the assets. Where estimated future cash flows are less than the carrying value of the assets, impairment losses are recognized based on the amount by which the carrying value exceeds the fair value of the assets. The fair value of certain assets was determined based on the “held for use” classification at year end. The Company may incur additional impairment charges or losses on divestitures of these assets being classified as “held for use.”
23
During 2008, the Company made the decision to consolidate Mexican operations into its Rosarito, Mexico facility. Production at the Reynosa, Mexico facility ceased at the end of February 2009. During 2008, the Company’s Sporting Goods segment recognized an impairment loss of $2.6 million and classified this asset as “held for sale.” Since the Company was unable to execute a sale of this facility within twelve months, as of December 26, 2009, the cost of the facility has been re-classified as “held for use” and the Company has resumed depreciating the facility costs although the Reynosa facility is currently on the market to be sold.
Non-Marketable Equity Method Investments
The Company has minority equity positions in companies strategically related to the Company’s business, but does not have control over these companies. The accounting method employed is dependent on the level of ownership and degree of influence the Company can exert on operations. Where the equity interest is less than 20% and the degree of influence is not significant, the cost method of accounting is employed. Where the equity interest is greater than 20% but not more than 50%, the equity method of accounting is utilized. Under the equity method, the Company’s proportionate share of net income (loss) is recorded in other income on the consolidated statements of operations. The proportionate share of net income was $2.0 million, $1.6 million and $1.1 million in 2010, 2009 and 2008, respectively. Total cash dividends received from these equity investments amounted to $0, $32 thousand, and $49 thousand in 2010, 2009 and 2008, respectively. The Company considers whether the fair values of any of its equity investments have declined below their carrying value whenever adverse events or changes in circumstances indicate that recorded values may not be recoverable. If the Company considers any such decline to be other than temporary (based on various factors, including historical financial results, product development activities and overall health of the investments’ industry), a write-down is recorded to estimated fair value. The Company believes that there were no adverse events or changes in circumstances that would indicate a decline in carrying value; therefore, the Company determined that no impairment was indicated for the years ended December 25, 2010, December 26, 2009, and December 27, 2008.
Effect of Inflation
The Company cannot accurately determine the precise effects of inflation. The Company attempts to pass on increased costs and expenses through price increases when necessary. The Company is working on reducing expenses; improving manufacturing technologies; and redesigning products to keep these costs under control.
Capital Expenditures
As of December 25, 2010, the Company had no material commitments for capital expenditures. However, in the first quarter of 2008, the Company initiated a project to implement a global integrated information system. In 2008, the Company spent $6.6 million related to this project. The Company went live with the installation at its North America Information Security and Print Finishing business entity and one division of its Sporting Goods business entity. During 2009, the Company spent an additional $0.8 million relative to the install at each of these entities. As of March 2009, the Company suspended further implementation until it has had sufficient time to assess the current installation. During 2010, the Company initiated a plan and implemented a replacement of the Oracle ERP system at its Martin Yale North America facility. The new system went live as of December 25, 2010 at an approximate cost of $0.7 million. Oracle is still in use at one location of the Sporting Goods business. The Company is currently evaluating the potential purchase of an ERP system to fully replace the Oracle system and the Company’s remaining legacy systems for all other Sporting Goods locations and for the Martin Yale European locations. The estimated cost of such expenditure has not yet been determined. Should the Company decide to completely abandon the Oracle system, the remaining book value of the Oracle system of approximately $5.2 million ($3.4 million, net of tax) would be expensed over the estimated remaining economic life of the system.
24
| ITEM 7A — QUANTITATIVE AND QUALITATIVE DISCLOSURES ABOUT MARKET RISK |
The Company is exposed to financial market risks, including changes in currency exchange rates, interest rates and marketable equity security prices. The Company attempts to minimize these risks through regular operating and financing activities and, when considered appropriate, through the use of derivative financial instruments. During fiscal 2010, there were no derivatives in use. The Company does not purchase, hold or sell derivative financial instruments for trading or speculative purposes.
Interest Rates
The Company’s exposure to market-rate risk for changes in interest rates relates primarily to its revolving variable rate bank debt which is based on both LIBOR and EURIBOR interest rates. A hypothetical 1% or 100 basis point change in interest rates would not have a significant effect on our consolidated financial position or results of operation.
Foreign Currency
The Company conducts business in various countries around the world and is therefore subject to risks associated with fluctuating foreign exchange rates. Approximately 17% of consolidated revenue is derived from sales outside of the U.S. This revenue is generated from the operations of the Company’s subsidiaries in their respective countries and surrounding geographic areas and is primarily denominated in each subsidiary’s local functional currency. These subsidiaries incur most of their expenses (other than inter-company expenses) in their local functional currency and include the Euro, Great Britain Pound Sterling, South Africa Rand, Swedish Krona, Mexican Peso and Chinese Yuan.
The geographic areas outside the United States in which the Company operates are generally not considered to be highly inflationary. Nonetheless, the Company’s foreign operations are sensitive to fluctuations in currency exchange rates arising from, among other things, certain inter-company transactions that are denominated in currencies other than the respective functional currency. Operating results as well as assets and liabilities are also subject to the effect of foreign currency translation when the operating results, assets and liabilities of our foreign subsidiaries are translated into U.S. dollars in our consolidated financial statements. The unrealized effect of foreign currency translation in 2010 resulted in a $0.8 million loss that was recorded in stockholders’ equity as a decrease of other comprehensive income, compared to a $1.6 million gain that was recorded in stockholders’ equity as an increase in other comprehensive income in 2009, and a $2.3 million loss in 2008. At December 25, 2010, a hypothetical change of 10% in foreign currency exchange rates would cause a $3.2 million change to stockholders’ equity on our consolidated balance sheet and a $12 thousand change to net income in our consolidated statement of operations.
The Company and its subsidiaries conduct substantially all their business in their respective functional currencies to avoid the effects of cross-border transactions. To protect against reductions in value and the volatility of future cash flows caused by changes in currency exchange rates, the Company carefully considers the use of transaction and balance sheet hedging programs such as matching assets and liabilities in the same currency. Such programs reduce, but do not entirely eliminate, the impact of currency exchange rate changes. The Company has evaluated the use of currency exchange hedging financial instruments but has determined that it would not use such instruments under the current circumstances. Historical trends in currency exchanges indicate that it is reasonably possible that adverse changes in exchange rates of 20% for the Euro could be experienced in the near term. A hypothetical adverse change of 20% would have resulted in a decline of 0.4% in net revenues and a 2.9% decrease in net income in 2010.
| ITEM 8 — FINANCIAL STATEMENTS AND SUPPLEMENTARY DATA |
The financial statements and supplementary data required by Item 8 are set forth in Part IV, Item 15.
| ITEM 9 — CHANGES IN AND DISAGREEMENTS WITH ACCOUNTANTS ON ACCOUNTING AND FINANCIAL DISCLOSURE |
None.
25
| ITEM 9A — CONTROLS AND PROCEDURES |
Evaluation of Disclosure Controls and Procedures
Escalade maintains disclosure controls and procedures that are designed to ensure that information required to be disclosed in the Company’s Exchange Act reports is recorded, processed, summarized, and reported within the time periods specified in the SEC’s rules and forms, and that such information is accumulated and communicated to the Company’s management, including its Chief Executive Officer and Chief Financial Officer, as appropriate, to allow timely decisions regarding required disclosure based closely on the definition of “disclosure controls and procedures” in Rule 13a-14(c). In designing and evaluating the disclosure controls and procedures, management recognized that any controls and procedures, no matter how well designed and operated, could provide only reasonable assurance of achieving the desired control objectives, and management necessarily was required to apply its judgment in evaluating the cost-benefit relationship of possible controls and procedures. Also, the Company has investments in certain unconsolidated entities. As the Company does not control or manage these entities, its disclosure controls and procedures with respect to such entities are necessarily substantially more limited than those it maintains with respect to its consolidated subsidiaries.
The Company carried out an evaluation, under the supervision and with the participation of the Company’s management, including the Company’s Chief Executive Officer and Chief Financial Officer, of the effectiveness of the design and operation of the Company’s disclosure controls and procedures as of the end of the period covered by this report. Based on the foregoing, the Company’s Chief Executive Officer and Chief Financial Officer concluded that the Company’s disclosure controls and procedures were effective.
Management’s Report on Internal Control over Financial Reporting
Escalade’s management is responsible for establishing and maintaining adequate internal control over financial reporting for the Company. Escalade’s internal control system was designed to provide reasonable assurance regarding the reliability of financial reporting and the preparation of financial statements for external purposes in accordance with generally accepted accounting principles. Internal control over financial reporting of the Company includes those policies and procedures that:
(1) pertain to the maintenance of records that in reasonable detail accurately and fairly reflect the transactions of the Company;
(2) provide reasonable assurance that transactions are recorded as necessary to permit preparation of financial statements in accordance with generally accepted accounting principles, and that receipts and expenditures of the Company are being made only in accordance with authorizations of management and directors of the Company; and
(3) provide reasonable assurance regarding prevention or timely detection of unauthorized acquisition, use or disposition of the Company’s assets that could have a material effect on the Company’s financial statements.
All internal control systems, no matter how well designed, have inherent limitations, including the possibility of human error or circumvention through collusion or improper overriding of controls. Therefore, even those internal control systems determined to be effective can provide only reasonable assurance with respect to financial statement preparation. Further, because of changes in conditions, the effectiveness of internal control may vary over time.
The management of Escalade assessed the effectiveness of the Company’s internal control over financial reporting as of December 25, 2010. In making its assessment of internal control over financial reporting, management used the criteria set forth by the Committee of Sponsoring Organizations of the Treadway Commission (COSO) in Internal Control – Integrated Framework and implemented a process to monitor and assess both the design and operating effectiveness of the Company’s internal controls. Based on this assessment, management believes that, as of December 25, 2010, the Company’s internal control over financial reporting was effective.
26
This annual report on Form 10-K does not include an attestation report of the Company’s registered public accounting firm regarding internal control over financial reporting. Management’s report regarding internal control over financial reporting is not subject to attestation by the Company’s registered public accounting firm pursuant to rules of the Securities and Exchange Commission that permit the Company to provide only management’s report in this annual report on Form 10-K. In addition, this report by management regarding internal control over financial reporting is specifically not incorporated by reference into this annual report on Form 10-K or into any other filing by the Company under the Securities Act of 1933, as amended, or the Securities Exchange Act of 1934, as amended.
|
/s/ Robert J. Keller, Chief Executive Officer
|
/s/ Deborah J. Meinert, Chief Financial Officer
|
Changes in Internal Control over Financial Reporting
Management of the Company has evaluated, with the participation of the Company’s Chief Executive Officer and Chief Financial Officer, changes in the Company’s internal controls over financial reporting (as defined in Rule 13a-15(f) and 15d-15(f) of the Exchange Act) during the fourth quarter of 2010. In connection with such evaluation, there have been no changes to the Company’s internal control over financial reporting that occurred since the beginning of the Company’s fourth quarter of 2010 that have materially affected, or are reasonably likely to materially affect, the Company’s internal control over financial reporting.
| ITEM 9B — OTHER INFORMATION |
None.
| ITEM 10 — DIRECTORS, EXECUTIVE OFFICERS AND CORPORATE GOVERNANCE |
Information required under this item with respect to Directors and Executive Officers is contained in the registrant’s Proxy Statement relating to its annual meeting of stockholders scheduled to be held on April 29, 2011 under the captions “Certain Beneficial Owners,” “Election of Directors,” “Executive Officers of the Registrant,” “Board of Directors, Its Committees, Meetings and Functions,” and “Beneficial Ownership Reporting Compliance” and is incorporated herein by reference.
| ITEM 11— EXECUTIVE COMPENSATION |
Information required under this item is contained in the registrant’s Proxy Statement relating to its annual meeting of stockholders scheduled to be held on April 29, 2011 under the captions “Compensation Discussion and Analysis,” “Compensation Committee Interlocks and Insider Participation,” “Compensation Committee Report” and “Executive Compensation” and is incorporated herein by reference, except that the information required by Item 407(e)(5) of Regulation S-K which appears under the caption “Report of Compensation Committee” is specifically not incorporated by reference into this Form 10-K or into any other filing by the registrant under the Securities Act of 1933 or the Securities Exchange Act of 1934.
| ITEM 12 — SECURITY OWNERSHIP OF CERTAIN BENEFICIAL OWNERS AND MANAGEMENT AND RELATED STOCKHOLDER MATTERS |
Except for the information required by Item 201(d) of Regulation S-K, which is included below, information required by this item is contained in the registrant’s proxy statement relating to its annual meeting of stockholders scheduled to be held on April 29, 2011 under the captions “Certain Beneficial Owners” and “Election of Directors” and is incorporated herein by reference.
27
Equity Compensation Plan Information
|
Plan Category
|
Number of
Securities to be Issued Upon Exercise of Outstanding Options, Warrants and Rights
|
Weighted-Average Exercise Price
of Outstanding Options, Warrants
and Rights
|
Number of
Securities Remaining
Available for Future
Issuance |
|||||||||
|
Equity compensation plans approved by security holders (1)
|
929,024 | $ | 2.23 | 961,610 | ||||||||
|
Equity compensation plans not approved by security holders
|
— | — | — | |||||||||
|
Total
|
929,024 | 961,610 | ||||||||||
(1) These plans include the Company’s 1997 Incentive Stock Option Plan, the 1997 Director Stock Option Plan, the Escalade, Incorporated 2007 Incentive Plan and a special grant of 10,000 options to Directors approved at the 2006 annual shareholders meeting.
| ITEM 13 — CERTAIN RELATIONSHIPS AND RELATED TRANSACTIONS |
The information required by Item 407(a) of Regulation S-K is contained in the registrant’s proxy statement relating to its annual meeting of stockholders to be held on April 29, 2011 under the captions “Election of Directors” and “Board of Directors, Its Committees, Meetings and Functions” and is incorporated herein by reference. The information required by Item 404 of Regulation S-K is: None.
| ITEM 14 — PRINCIPAL ACCOUNTING FEES AND SERVICES |
The information required by this item is contained in the registrant’s proxy statement relating to its annual meeting of stockholders scheduled to be held on April 29, 2011 under the caption “Principal Accounting Firm Fees” and is incorporated herein by reference.
| ITEM 15 — EXHIBITS, FINANCIAL STATEMENT SCHEDULES |
|
(A)
|
Documents filed as a part of this report: | |||
|
(1)
|
Financial Statements | |||
|
Report of Independent Registered Public Accounting Firm
|
||||
|
Consolidated financial statements of Escalade, Incorporated and subsidiaries:
|
||||
|
Consolidated balance sheets—December 25, 2010 and December 26, 2009
|
||||
|
Consolidated statements of operations—fiscal years ended December 25, 2010, December 26, 2009, and December 27, 2008
|
||||
|
Consolidated statements of stockholders’ equity—fiscal years ended December 25, 2010, December 26, 2009, and December 27, 2008
|
||||
|
Consolidated statements of cash flows—fiscal years ended December 25, 2010, December 26, 2009, and December 27, 2008
|
||||
|
Notes to consolidated financial statements
|
||||
28
|
All other schedules are omitted because of the absence of conditions under which they are required or because the required information is given in the consolidated financial statements or notes thereto.
|
||
|
(3)
|
Exhibits
|
|
|
3.1
|
Articles of Incorporation of Escalade, Incorporated (b)
|
|
|
3.2
|
Amended By-Laws of Escalade, Incorporated (q)
|
|
|
4.1
|
Form of Escalade, Incorporated’s common stock certificate (a)
|
|
|
10.1
|
Licensing agreement between Sweden Table Tennis AB and Indian Industries, Inc. dated January 1, 1995 (d)
|
|
|
10.2
|
Credit Agreement dated as of April 30, 2009 among Escalade, Incorporated and JPMorgan Chase Bank, N.A. (without exhibits and schedules, which Escalade has determined are not material) (k)
|
|
|
10.3
|
Pledge and Security Agreement dated as of April 30, 2009 by and between Escalade, Incorporated and JPMorgan Chase Bank, N.A. (without exhibits and schedules, which Escalade has determined are not material) (k)
|
|
|
10.4
|
Form of Pledge and Security Agreement dated as of April 30, 2009 with JPMorgan Chase Bank, N.A. (j) (l)
|
|
|
10.5
|
Form of Unlimited Continuing Guaranty dated as of April 30, 2009 in favor of JPMorgan Chase Bank, N.A. (k) (l)
|
|
|
10.6
|
First Amendment dated as of July 29, 2009 to Credit Agreement by and between Escalade, Incorporated and JPMorgan Chase Bank, N.A. (m)
|
|
|
10.7
|
Second Amendment dated as of September 30, 2009 to Credit Agreement by and between Escalade, Incorporated and JPMorgan Chase Bank, N.A. (n)
|
|
|
10.8
|
Third Amendment dated as of October 30, 2009 to Credit Agreement by and between Escalade, Incorporated and JPMorgan Chase Bank, N.A. (o)
|
|
|
10.9
|
Loan Agreement dated September 1, 1998 between Martin Yale Industries, Inc. and City of Wabash, Indiana (f)
|
|
|
10.10
|
Trust Indenture between the City of Wabash, Indiana and Bank One Trust Company, NA as Trustee dated September 1, 1998 relating to the Adjustable Rate Economic Development Revenue Refunding Bonds, Series 1998 (Martin Yale Industries, Inc. Project) (f)
|
|
|
10.11
|
Fourth Amendment dated as of March 1, 2010 to Credit Agreement by and between Escalade, Incorporated and JPMorgan Chase Bank, N.A. (p)
|
|
|
10.12
|
Fifth Amendment dated as of April 15, 2010 to Credit Agreement by and between Escalade, Incorporated and JPMorgan Chase Bank, N.A. (r)
|
|
|
10.13
|
Sixth Amendment to Credit Agreement dated as of May 31, 2010 by and between Escalade, Incorporated and JPMorgan Chase Bank, N.A., (s)
|
|
|
10.14
|
Overdraft Facility by and between Escalade, Incorporated and JPMorgan Chase Bank, N.A., London Branch (s)
|
|
|
(4)
|
Executive Compensation Plans and Arrangements | |
|
10.15
|
The Harvard Sports/Indian Industries, Inc. 401(k) Plan as amended and merged in 1993 (c)
|
|
|
10.16
|
Martin Yale Industries, Inc. 401(k) Retirement Plan as amended in 1993 (c)
|
|
|
10.17
|
Incentive Compensation Plan for Escalade, Incorporated and its subsidiaries (a)
|
|
|
10.18
|
Example of contributory deferred compensation agreement between Escalade, Incorporated and certain management employees allowing for deferral of compensation (a)
|
|
|
10.19
|
1997 Director Stock Compensation and Option Plan (e)
|
|
|
10.20
|
1997 Incentive Stock Option Plan (e)
|
|
|
10.21
|
1997 Director Stock Compensation and Option Plan Certificate (g)
|
|
|
10.22
|
1997 Incentive Stock Option Plan Certificate (g)
|
|
|
10.23
|
Escalade, Incorporated 2007 Incentive Plan, incorporated by reference herein from Annex 1 to the Registrant’s 2007 Definitive Proxy Statement. (h)
|
|
|
10.24
|
Employment offer letter dated July 23, 2007 between Robert Keller and Escalade, Inc. (i)
|
|
|
10.25
|
Form of Restricted Stock Unit Agreement utilized in Restricted Stock Unit grants pursuant to the Escalade Incorporated 2007 Incentive Plan. (j)
|
|
|
10.26
|
Escalade, Incorporated schedule of Directors Compensation
|
|
|
10.27
|
Escalade, Incorporated schedule of Executive Officers Compensation
|
|
|
10.28
|
Form of Stock Option Award Agreement utilized in Stock Option grants to employees pursuant to the Escalade, Incorporated 2007 Incentive Plan (t)
|
|
|
10.29
|
Form of Stock Option Award Agreement utilized in Stock Option grants to Directors pursuant to the Escalade, Incorporated 2007 Incentive Plan (t)
|
|
29
|
21
|
Subsidiaries of the Registrant
|
|
|
23.1
|
Consent of BKD, LLP
|
|
|
23.2
|
Consent of FALK GmbH & Co KG
|
|
|
31.1
|
Chief Executive Officer Rule 13a-14(a)/15d-14(a) Certification
|
|
|
31.2
|
Chief Financial Officer Rule 13a-14(a)/15d-14(a) Certification
|
|
|
32.1
|
Chief Executive Officer Section 1350 Certification
|
|
|
32.2
|
Chief Financial Officer Section 1350 Certification
|
|
(a)
|
Incorporated by reference from the Company’s Form S-2 Registration Statement, File No. 33-16279, as declared effective by the Securities and Exchange Commission on September 2, 1987
|
|
|
(b)
|
Incorporated by reference from the Company’s 2007 First Quarter Report on Form 10-Q
|
|
|
(c)
|
Incorporated by reference from the Company’s 1993 Annual Report on Form 10-K
|
|
|
(d)
|
Incorporated by reference from the Company’s 1995 Annual Report on Form 10-K
|
|
|
(e)
|
Incorporated by reference from the Company’s 1997 Proxy Statement
|
|
|
(f)
|
Incorporated by reference from the Company’s 1998 Third Quarter Report on Form 10-Q
|
|
|
(g)
|
Incorporated by reference from the Company’s 2004 Annual Report on Form 10-K
|
|
|
(h)
|
Incorporated by reference from the Company’s 2007 Second Quarter Report on Form 10-Q
|
|
|
(i)
|
Incorporated by reference from the Company’s 2007 Third Quarter Report on Form 10-Q
|
|
|
(j)
|
Incorporated by reference from the Company’s Form 8-K filed on February 29, 2008
|
|
|
(k)
|
Incorporated by reference from the Company’s Form 8-K filed on May 6, 2009
|
|
|
(l)
|
Each of Escalade’s eleven domestic subsidiaries has entered into the identical form of Pledge and Security Agreement and form of Unlimited Continuing Guaranty. Those eleven domestic subsidiaries are: Indian Industries, Inc.; Harvard Sports, Inc.; Martin Yale Industries, Inc.; U.S. Weight, Inc.; Bear Archery, Inc.; Escalade Sports Playground, Inc.; Schleicher & Co. America, Inc.; Olympia Business Systems, Inc.; EIM Company, Inc.; SOP Services, Inc.; and Escalade Insurance, Inc.
|
|
|
(m)
|
Incorporated by reference from the Company’s Form 8-K filed on July 30, 2009
|
|
|
(n)
|
Incorporated by reference from the Company’s Form 8-K filed on September 30, 2009
|
|
|
(o)
|
Incorporated by reference from the Company’s 2009 Third Quarter Report on Form 10-Q
|
|
|
(p)
|
Incorporated by reference from the Company’s Form 8-K filed on March 2, 2010
|
|
|
(q)
|
Incorporated by reference from the Company’s 2010 Second Quarter Report on Form 10-Q filed on August 2, 2010
|
|
|
(r)
|
Incorporated by reference from the Company’s 2010 First Quarter Report on Form 10-Q filed on April 16, 2010
|
|
|
(s)
|
Incorporated by reference from the Company’s Form 8-K filed on June 4, 2010
|
|
|
(t)
|
Incorporated by reference from the Company’s 2009 Annual Report on Form 10-K filed on March 5, 2010
|
30
Escalade, Incorporated and Subsidiaries
Index to Financial Statements
The following consolidated financial statements of the Registrant and its subsidiaries and Independent Accountants’ Reports are submitted herewith:
|
Page
|
||
| Reports of Independent Registered Public Accounting Firms |
32
|
|
| Consolidated financial statements of Escalade, Incorporated and subsidiaries: | ||
|
34
|
||
|
35
|
||
|
36
|
||
|
37
|
||
|
Notes to consolidated financial statements
|
38
|
|
31

Audit Committee, Board of Directors and Stockholders
Escalade, Incorporated
Evansville, Indiana
We have audited the accompanying consolidated balance sheets of Escalade, Incorporated (Company) as of December 25, 2010 and December 26, 2009, and the related consolidated statements of operations, stockholders’ equity and cash flows for each of the years in the three-year period ended December 25, 2010. The Company’s management is responsible for these financial statements. Our responsibility is to express an opinion on these financial statements based on our audits. We did not audit the 2010, 2009 and 2008 financial statements (consisting of the balance sheet and related statement of operations) of Martin Yale International, GmbH, a wholly owned subsidiary, which statements were presented on the basis of accounting principles generally accepted in Germany and reflect total assets of $14,913, $17,061 and $20,347 and net sales of $16,880, $20,532 and $26,991 (dollars in thousands) for 2010, 2009 and 2008, respectively, included in the related consolidated financial statement amounts as of and for the years ended December 25, 2010, December 26, 2009, and December 27, 2008. Those balance sheets and statements of operations were audited by other accountants, whose reports have been furnished to us and our opinion, insofar as it relates to the amounts included in the consolidated balance sheets and statements of operations for Martin Yale International, GmbH, is based solely on the reports of the other accountants.
Our audits also included auditing the adjustments to convert the balance sheets and statements of operations of Martin Yale International, GmbH into accounting principles generally accepted in the United States of America for purposes of consolidation. Our audits also included auditing the amounts included in the consolidated statements of cash flows and stockholders’ equity for Martin Yale International, GmbH.
We conducted our audits in accordance with the standards of the Public Company Accounting Oversight Board (United States). Those standards require that we plan and perform the audits to obtain reasonable assurance about whether the financial statements are free of material misstatement. Our audits also included examining, on a test basis, evidence supporting the amounts and disclosures in the financial statements, assessing the accounting principles used and significant estimates made by management and evaluating the overall financial statement presentation. We believe that our audits and the reports of the other accountants provide a reasonable basis for our opinion.
In our opinion, based on our audits and the reports of the other accountants, the consolidated financial statements referred to above present fairly, in all material respects, the financial position of the Company as of December 25, 2010 and December 26, 2009, and the results of its operations and its cash flows for each of the years in the three-year period ended December 25, 2010, in conformity with accounting principles generally accepted in the United States of America.
Evansville, Indiana
March 1, 2011
32
FALK & Co
Reports of Independent Registered Public Accounting Firm
To the Stockholders and Board of Directors of
Martin Yale International GmbH,
Markdorf/Germany
We have audited the accompanying balance sheet of Martin Yale International GmbH, Markdorf/Germany (the Company) as of December 31, 2010 and December 31, 2009 and the related statement of income for each of the three years in the three-year period ended December 31, 2010. The financial statements are the responsibility of the Company’s management. Our responsibility is to express an opinion on these financial statements based on our audit.
We conducted our audit in accordance with the standards of the Public Company Accounting Oversight Board (United States). Those standards require that we plan and perform the audit to obtain reasonable assurance about whether the financial statements are free of material misstatement. An audit includes examining, on a test basis, evidence supporting the amounts and disclosures in the financial statements. An audit also includes assessing the accounting principles used and significant estimates made by management, as well as evaluating the overall financial statement presentation. We believe that our audit provides a reasonable basis for our opinion.
In our opinion, based on our audit, the financial statements referred to above present fairly, in all material respects, the financial position of the Company as of December 31, 2010 and December 31, 2009 and the result of its operations for each of the three years in the three-year period ended December 31, 2010, in conformity with accounting principles generally accepted in Germany.
|
/s/ FALK GmbH & Co KG
|
|
|
Wirtschaftsprüfungsgesellschaft
|
|
|
Steuerberatungsgesellschaft
|
|
|
Heidelberg/Germany,
|
|
|
March 1, 2011
|
33
Escalade, Incorporated and Subsidiaries
|
All Amounts in Thousands Except Share Information
|
December 25,
2010 |
December 26,
2009 |
||||||
|
Assets
|
||||||||
|
Current assets
|
||||||||
|
Cash and cash equivalents
|
$ | 1,536 | $ | 3,039 | ||||
|
Time deposits
|
1,250 | 750 | ||||||
|
Receivables, less allowances of $1,204 and $1,485
|
25,458 | 23,488 | ||||||
|
Inventories
|
22,888 | 20,905 | ||||||
|
Prepaid expenses
|
1,160 | 1,617 | ||||||
|
Deferred income tax benefit
|
1,502 | 1,999 | ||||||
|
Prepaid income tax
|
1,216 | 1,138 | ||||||
|
Total current assets
|
55,010 | 52,936 | ||||||
|
Property, plant and equipment, net
|
19,844 | 21,493 | ||||||
|
Intangible assets
|
15,678 | 17,181 | ||||||
|
Goodwill
|
25,397 | 26,215 | ||||||
|
Investments
|
11,624 | 9,156 | ||||||
|
Other assets
|
— | 257 | ||||||
|
Total assets
|
$ | 127,553 | $ | 127,238 | ||||
|
Liabilities and Stockholders’ Equity
|
||||||||
|
Current liabilities
|
||||||||
|
Notes payable—bank
|
$ | 9,407 | $ | 27,644 | ||||
|
Current portion of long-term debt
|
2,000 | — | ||||||
|
Trade accounts payable
|
3,751 | 1,578 | ||||||
|
Accrued liabilities
|
15,720 | 12,738 | ||||||
|
Deferred compensation
|
— | 1,288 | ||||||
|
Total current liabilities
|
30,878 | 43,248 | ||||||
|
Long-term debt
|
7,500 | — | ||||||
|
Deferred income tax liability
|
2,145 | 1,226 | ||||||
|
Total liabilities
|
40,523 | 44,474 | ||||||
|
Commitments and contingencies
|
— | — | ||||||
|
Stockholders’ equity
|
||||||||
|
Preferred stock
|
||||||||
|
Authorized: 1,000,000 shares, no par value, none issued
|
||||||||
|
Common stock
|
||||||||
|
Authorized: 30,000,000 shares, no par value
|
||||||||
|
Issued and outstanding: 2010 —12,780,372 shares, 2009—12,656,737 shares
|
12,780 | 12,657 | ||||||
|
Retained earnings
|
70,329 | 65,341 | ||||||
|
Accumulated other comprehensive income
|
3,921 | 4,766 | ||||||
|
Total stockholders’ equity
|
87,030 | 82,764 | ||||||
|
Total liabilities and stockholders’ equity
|
$ | 127,553 | $ | 127,238 | ||||
See notes to consolidated financial statements.
34
Escalade, Incorporated and Subsidiaries
| Years Ended | ||||||||||||
|
All Amounts in Thousands Except Per Share Data
|
December 25,
2010 |
December 26,
2009 |
December 27,
2008 |
|||||||||
|
Net Sales
|
$ | 120,656 | $ | 115,999 | $ | 148,686 | ||||||
|
Costs, Expenses and Other Income
|
||||||||||||
|
Cost of products sold
|
83,475 | 82,250 | 112,138 | |||||||||
|
Selling, administrative and general expenses
|
27,704 | 29,484 | 39,883 | |||||||||
|
Long-lived asset impairment charges
|
— | — | 2,623 | |||||||||
|
Amortization
|
1,288 | 2,265 | 2,163 | |||||||||
|
Operating Income (Loss)
|
8,189 | 2,000 | (8,121 | ) | ||||||||
|
Interest expense
|
(1,163 | ) | (1,665 | ) | (2,025 | ) | ||||||
|
Other income (expense)
|
2,050 | 2,270 | (34 | ) | ||||||||
|
Income (Loss) Before Income Taxes (Benefit)
|
9,076 | 2,605 | (10,180 | ) | ||||||||
|
Provision (Benefit) for Income Taxes
|
3,017 | 948 | (2,684 | ) | ||||||||
|
Net Income (Loss)
|
$ | 6,059 | $ | 1,657 | $ | (7,496 | ) | |||||
|
Earnings (Loss) Per Share Data
|
||||||||||||
|
Basic earnings (loss) per share
|
$ | 0.48 | $ | 0.13 | $ | (0.59 | ) | |||||
|
Diluted earnings (loss) per share
|
$ | 0.46 | $ | 0.13 | $ | (0.59 | ) | |||||
See notes to consolidated financial statements.
35
Escalade, Incorporated and Subsidiaries
|
Accumulated
|
||||||||||||||||||||
|
Other
|
||||||||||||||||||||
|
Common Stock
|
Retained
|
Comprehensive
|
||||||||||||||||||
|
All Amounts in Thousands
|
Shares
|
Amount
|
Earnings
|
Income
|
Total
|
|||||||||||||||
|
Balances at December 29, 2007
|
12,673 | $ | 12,673 | $ | 73,246 | $ | 5,823 | $ | 91,742 | |||||||||||
|
Comprehensive income (loss)
|
||||||||||||||||||||
|
Net income (loss)
|
(7,496 | ) | (7,496 | ) | ||||||||||||||||
|
Foreign currency translation adjustment
|
(2,344 | ) | (2,344 | ) | ||||||||||||||||
|
Unrealized loss on interest rate swap agreement, net of tax
|
(35 | ) | (35 | ) | ||||||||||||||||
|
Realization of previously unrealized gains and losses on securities, net of tax
|
(320 | ) | (320 | ) | ||||||||||||||||
|
Total comprehensive income (loss)
|
(10,195 | ) | ||||||||||||||||||
|
Expense of stock options
|
910 | 910 | ||||||||||||||||||
|
Exercise of stock options
|
45 | 45 | 268 | 313 | ||||||||||||||||
|
Dividend paid
|
(3,174 | ) | (3,174 | ) | ||||||||||||||||
|
Stock issued to directors as compensation
|
10 | 10 | 104 | 114 | ||||||||||||||||
|
Purchase of stock
|
(112 | ) | (112 | ) | (808 | ) | (920 | ) | ||||||||||||
|
Balances at December 27, 2008
|
12,616 | $ | 12,616 | $ | 63,050 | $ | 3,124 | $ | 78,790 | |||||||||||
|
Comprehensive income
|
||||||||||||||||||||
|
Net income
|
1,657 | 1,657 | ||||||||||||||||||
|
Foreign currency translation adjustment
|
1,642 | 1,642 | ||||||||||||||||||
|
Total comprehensive income
|
3,299 | |||||||||||||||||||
|
Expense of stock options
|
588 | 588 | ||||||||||||||||||
|
Settlement of restricted stock units
|
7 | 7 | (7 | ) | — | |||||||||||||||
|
Stock issued to directors as compensation
|
34 | 34 | 53 | 87 | ||||||||||||||||
|
Balances at December 26, 2009
|
12,657 | $ | 12,657 | $ | 65,341 | $ | 4,766 | $ | 82,764 | |||||||||||
|
Comprehensive income
|
||||||||||||||||||||
|
Net income
|
6,059 | 6,059 | ||||||||||||||||||
|
Foreign currency translation adjustment
|
(845 | ) | (845 | ) | ||||||||||||||||
|
Total comprehensive income
|
5,214 | |||||||||||||||||||
|
Expense of stock options
|
177 | 177 | ||||||||||||||||||
|
Exercise of stock options
|
75 | 75 | (17 | ) | 58 | |||||||||||||||
|
Settlement of restricted stock units
|
12 | 12 | (12 | ) | — | |||||||||||||||
|
Stock option forfeiture
|
(32 | ) | (32 | ) | ||||||||||||||||
|
Dividend paid
|
(1,285 | ) | (1,285 | ) | ||||||||||||||||
|
Stock issued to directors as compensation
|
36 | 36 | 98 | 134 | ||||||||||||||||
|
Balances at December 25, 2010
|
12,780 | $ | 12,780 | $ | 70,329 | $ | 3,921 | $ | 87,030 | |||||||||||
See notes to consolidated financial statements.
36
Escalade, Incorporated and Subsidiaries
| Years Ended | ||||||||||||
|
All Amounts in Thousands
|
December 25,
2010
|
December 26,
2009
|
December 27,
2008
|
|||||||||
|
Operating Activities
|
||||||||||||
|
Net income (loss)
|
$ | 6,059 | $ | 1,657 | $ | (7,496 | ) | |||||
|
Adjustments to reconcile net income (loss) to net cash provided by (used in) operating activities
|
||||||||||||
|
Depreciation and amortization
|
4,330 | 5,965 | 5,539 | |||||||||
|
Long-lived asset impairment charges
|
— | — | 2,623 | |||||||||
|
Available for sale securities impairment charges
|
— | — | 884 | |||||||||
|
Provision for doubtful accounts
|
(247 | ) | 362 | 525 | ||||||||
|
Stock option expense
|
177 | 641 | 910 | |||||||||
|
Equity in net income of joint venture investments
|
(1,963 | ) | (1,598 | ) | (1,054 | ) | ||||||
|
Deferred income taxes
|
1,401 | 2,175 | (1,488 | ) | ||||||||
|
Provision for deferred compensation
|
— | 110 | 101 | |||||||||
|
(Gain) loss on disposals of assets
|
(1 | ) | (408 | ) | 731 | |||||||
|
Changes in
|
||||||||||||
|
Accounts receivable
|
(1,752 | ) | 3,661 | 3,028 | ||||||||
|
Inventories
|
(2,411 | ) | 9,059 | 2,639 | ||||||||
|
Prepaids
|
435 | 210 | (1,715 | ) | ||||||||
|
Other assets
|
(16 | ) | (503 | ) | 3,504 | |||||||
|
Income tax payable
|
(55 | ) | 2,739 | (4,225 | ) | |||||||
|
Accounts payable and accrued expenses
|
2,895 | (5,757 | ) | (6,418 | ) | |||||||
|
Net cash provided by (used in) operating activities
|
8,852 | 18,313 | (1,912 | ) | ||||||||
|
Investing Activities
|
||||||||||||
|
Purchase of property and equipment
|
(1,778 | ) | (1,894 | ) | (9,484 | ) | ||||||
|
Purchase of short-term time deposits
|
(500 | ) | (750 | ) | — | |||||||
|
Acquisitions, net of cash acquired
|
— | — | (467 | ) | ||||||||
|
Proceeds from sale of property and equipment
|
13 | 269 | 33 | |||||||||
|
Proceeds from sale of investments
|
— | 1,645 | 1,501 | |||||||||
|
Net cash used in investing activities
|
(2,265 | ) | (730 | ) | (8,417 | ) | ||||||
|
Financing Activities
|
||||||||||||
|
Net increase (decrease) in notes payable—bank
|
(8,237 | ) | (18,880 | ) | 33,491 | |||||||
|
Net increase (decrease) in overdraft facility
|
1,406 | — | — | |||||||||
|
Proceeds from exercise of stock options
|
58 | — | 313 | |||||||||
|
Stock option forfeiture
|
(32 | ) | — | — | ||||||||
|
Reduction of long-term debt
|
(500 | ) | — | (19,135 | ) | |||||||
|
Purchase of stock
|
— | — | (920 | ) | ||||||||
|
Cash dividend paid
|
(1,285 | ) | — | (3,174 | ) | |||||||
|
Directors compensation
|
134 | 33 | 114 | |||||||||
|
Net cash provided by (used in) financing activities
|
(8,456 | ) | (18,847 | ) | 10,689 | |||||||
|
Effect of Exchange Rate Changes on Cash and Cash Equivalents
|
366 | 686 | 449 | |||||||||
|
Increase (Decrease) in Cash and Cash Equivalents
|
(1,503 | ) | (578 | ) | 809 | |||||||
|
Cash and Cash Equivalents, Beginning of Year
|
3,039 | 3,617 | 2,808 | |||||||||
|
Cash and Cash Equivalents, End of Year
|
$ | 1,536 | $ | 3,039 | $ | 3,617 | ||||||
|
Supplemental Cash Flows Information
|
||||||||||||
|
Interest paid
|
$ | 1,161 | $ | 1,802 | $ | 2,024 | ||||||
|
Income taxes paid
|
$ | 1,832 | $ | 184 | $ | 2,167 | ||||||
See notes to consolidated financial statements.
37
| Note 1 — Nature of Operations and Summary of Significant Accounting Policies |
Nature of Operations
Escalade, Incorporated and its wholly owned subsidiaries (the “Company”) are engaged in the manufacture and sale of sporting goods and information security and print finishing products. The Company is headquartered in Evansville, Indiana and has manufacturing facilities in the United States of America, Mexico and Germany. The Company sells products to customers throughout the world.
Principles of Consolidation
The consolidated financial statements include the accounts of Escalade, Incorporated and its wholly-owned subsidiaries. All material inter-company accounts and transactions have been eliminated.
Basis of Presentation
The consolidated financial statements have been prepared in accordance with accounting principles generally accepted in the United States of America (GAAP). The books and records of Subsidiaries located in foreign countries are maintained according to generally accepted accounting principles in those countries. Upon consolidation, the Company evaluates the differences in accounting principles and determines whether adjustments are necessary to convert the foreign financial statements to the accounting principles upon which the consolidated financial statements are based. As a result of this evaluation no material adjustments were identified.
Fiscal Year End
The Company’s fiscal year is a 52 or 53 week period ending on the last Saturday in December. Fiscal 2010, 2009 and 2008 were 52 weeks long ending on December 25, 2010, December 26, 2009 and December 27, 2008 respectively.
Cash and Cash Equivalents
Highly liquid financial instruments with insignificant interest rate risk and with original maturities of three months or less are classified as cash and cash equivalents.
Accounts Receivable
Revenue from the sale of the Company’s products is recognized as products are shipped to customers and accounts receivable are stated at the amount billed to customers. Interest and late charges billed to customers are not material and because collection is uncertain, are not recognized until collected and are therefore not included in accounts receivable. The Company does not offer the right of return on any of its sales and the Company does not engage in consignment or contingency sales. The Company provides an allowance for doubtful accounts which is described in Note 2 – Certain Significant Estimates.
Inventories
Inventory cost is computed on a currently adjusted standard cost basis (which approximates actual cost on a current average or first-in, first-out basis). Work in process and finished goods inventory are determined to be saleable based on a demand forecast within a specific time horizon, generally one year or less. Inventory in excess of saleable amounts is reserved, and the remaining inventory is valued at the lower cost or market. This inventory valuation reserve totaled $1.8 million and $3.2 million at fiscal year-end 2010 and 2009, respectively. Inventories, net of the valuation reserve, at fiscal year-ends were as follows:
|
In Thousands
|
2010
|
2009
|
||||||
|
Raw materials
|
$ | 5,973 | $ | 6,357 | ||||
|
Work in process
|
2,497 | 1,142 | ||||||
|
Finished goods
|
14,418 | 13,406 | ||||||
| $ | 22,888 | $ | 20,905 | |||||
38
Property, Plant and Equipment
Property, plant and equipment are recorded at cost. Depreciation and amortization are computed for financial reporting purposes principally using the straight-line method over the following estimated useful lives: buildings, 20-30 years; leasehold improvements, term of the lease; machinery and equipment, 5-15 years; and tooling, dies and molds, 2-4 years. Property, plant and equipment consist of the following:
|
In Thousands
|
2010
|
2009
|
||||||
|
Land
|
$ | 2,381 | $ | 2,485 | ||||
|
Buildings and leasehold improvements
|
20,672 | 20,446 | ||||||
|
Machinery and equipment
|
30,581 | 31,057 | ||||||
|
Total cost
|
53,634 | 53,988 | ||||||
|
Accumulated depreciation and amortization
|
(33,790 | ) | (32,495 | ) | ||||
| $ | 19,844 | $ | 21,493 | |||||
The Company evaluates the recoverability of certain long-lived assets whenever events or changes in circumstances indicate that the carrying amount may not be recoverable. Estimates of future cash flows used to test recoverability of long-lived assets include separately identifiable undiscounted cash flows expected to arise from the use and eventual disposition of the assets. Where estimated future cash flows are less than the carrying value of the assets, impairment losses are recognized based on the amount by which the carrying value exceeds the fair value of the assets. During 2008, the Company’s Sporting Goods segment recognized an impairment loss of $2.6 million related to the Reynosa, Mexico facility and equipment. This loss is included in the long lived asset impairment charges line of the statement of operations for that year.
Investments
Investments are composed of the following:
|
In Thousands
|
2010
|
2009
|
||||||
|
Non-marketable equity investments (equity method)
|
$ | 11,624 | $ | 9,156 | ||||
Non-Marketable Equity Investments: The Company has minority equity positions in companies strategically related to the Company’s business, but does not have control over these companies. The accounting method employed is dependent on the level of ownership and degree of influence the Company can exert on operations. Where the equity interest is less than 20% and the degree of influence is not significant, the cost method of accounting is employed. Where the equity interest is greater than 20% but not more than 50%, the equity method of accounting is utilized. Under the equity method, the Company’s proportionate share of net income (loss) is recorded in other income on the consolidated statement of income. The proportionate share of net income was $2.0 million, $1.6 million and $1.1 million in 2010, 2009 and 2008, respectively. Total cash dividends received from these equity investments amounted to $0, $32 thousand, and $49 thousand in 2010, 2009 and 2008, respectively. The Company considers whether the fair value of any of its equity investments have declined below their carrying value whenever adverse events or changes in circumstances indicate that recorded values may not be recoverable. If the Company considered any such decline to be other than temporary (based on various factors, including historical financial results, product development activities and overall health of the investments’ industry), a write-down is recorded to estimated fair value. There was no impairment loss recognized on equity method investments in 2010, 2009 or 2008.
Goodwill and Intangible Assets
Goodwill represents the excess of the purchase price over fair value of net tangible and identifiable intangible assets of acquired businesses. Intangible assets consist of patents, consulting agreements, non-compete agreements, customer lists, and trademarks. Goodwill and trademarks are deemed to have indefinite lives and are not amortized, but are subject to impairment testing annually in accordance with guidance included in FASB ASC 350, Intangibles – Goodwill and Other. Other intangible assets are amortized using the straight-line method over the following lives: consulting agreements, the life of the agreement; non-compete agreements, the lesser of the term or 5 years; and patents, the lesser of the remaining life or 5 to 8 years. No impairment has been recognized on goodwill or intangible assets in 2010, 2009 or 2008.
39
Employee Incentive Plan
During 2007, the Company replaced two stock-based compensation plans with a new incentive plan more fully explained in Note 11. The Company accounts for this plan under the recognition and measurement principles of FASB ASC 505, Equity Based Payments.
Foreign Currency Translation
The functional currency for the foreign operations of Escalade is the local currency. The translation of foreign currencies into U.S. dollars is performed for balance sheet accounts using exchange rates in effect at the balance sheet dates and for revenue and expense accounts using a weighted average exchange rate during the year. The gains or losses resulting from the translation are included in Accumulated Other Comprehensive Income in the Consolidated Statements of Stockholders’ Equity and are excluded from net income (loss). Gains or losses resulting from foreign currency transactions are included in selling, general and administrative expense in the Consolidated Statements of Operations and were insignificant in fiscal years 2010, 2009, and 2008.
Cost of Products Sold
Cost of products sold are comprised of those costs directly associated with or allocated to the products sold and include materials, labor and factory overhead.
Other Income (Expense)
The components of Other Income (Expense) are as follows:
|
In Thousands
|
2010
|
2009
|
2008
|
|||||||||
|
Income from non-marketable equity investments accounted for on the equity method
|
$ | 1,963 | $ | 1,598 | $ | 1,054 | ||||||
|
Dividend and interest income from marketable equity securities available for sale
|
— | 48 | 264 | |||||||||
|
Gain (loss) on sale of marketable equity securities available for sale
|
— | 432 | (505 | ) | ||||||||
|
Royalty income from patents
|
79 | 50 | 127 | |||||||||
|
Impairment write-down on marketable securities available for sale
|
— | — | (884 | ) | ||||||||
|
Other
|
8 | 142 | (90 | ) | ||||||||
| $ | 2,050 | $ | 2,270 | $ | (34 | ) | ||||||
Income Taxes
Income tax in the consolidated statement of operations includes deferred income tax provisions or benefits for all significant temporary differences in recognizing income and expenses for financial reporting and income tax purposes. A valuation allowance is established if it is more likely than not that a deferred tax asset will not be realized.
Research and Development
Research and development costs are charged to expense as incurred. Research and development costs incurred during 2010, 2009 and 2008 were approximately $1.9 million, $2.0 million, and $2.3 million, respectively.
Reclassifications
Certain reclassifications have been made to prior year financial statements to conform to the current year financial statement presentation. These reclassifications had no effect on net earnings.
New Accounting Pronouncements
In December 2009, FASB issued Accounting Standards Update 2009-17, Improvements to Financial Reporting by Enterprises with Variable Interest Entities, to incorporate the changes made by FASB Statement No. 167 into the FASB Codification. The guidance in this update was effective for periods beginning after November 15, 2009 and thus was effective for the Company’s first quarter reporting in 2010. The adoption of this standard did not have a material impact on the Company’s consolidated financial statements.
40
In December 2009, FASB issued Accounting Standards Update 2010-02, Consolidation (Topic 810) – Accounting and Reporting for Decreases in Ownership of a Subsidiary – A Scope Clarification, which expands the disclosure requirements about deconsolidation of a subsidiary or derecognition of a group of assets. The guidance in this update was effective for periods beginning in the first interim or annual reporting period ending on or after December 15, 2009 and thus was effective for the Company’s first quarter reporting in 2010. The adoption of this standard did not have a material impact on the Company’s consolidated financial statements.
| Note 2 — Certain Significant Estimates |
The preparation of consolidated financial statements in conformity with GAAP requires management to make estimates and assumptions. These estimates and assumptions affect the reported amounts of assets and liabilities; the disclosure of contingent assets and liabilities at the date of the consolidated financial statements; and the reported amounts of revenues and expenses during the reporting period. These estimates and judgments are evaluated on an ongoing basis and are based on experience; current and expected future conditions; third party evaluations; and various other assumptions believed reasonable under the circumstances. The results of these estimates form the basis for making judgments about the carrying values of assets and liabilities as well as identifying and assessing the accounting treatment with respect to commitments and liabilities. Actual results may differ from the estimates and assumptions used in the financial statements and related notes.
Listed below are certain significant estimates and assumptions related to the preparation of the consolidated financial statements:
Product Warranty
The Company provides limited warranties on certain of its products, for varying periods. Generally, the warranty periods range from 90 days to one year. However, some products carry extended warranties of seven-year, ten-year, and lifetime warranties. The Company records an accrued liability and reduction in sales for estimated future warranty claims based upon historical experience and management’s estimate of the level of future claims. Changes in the estimated amounts recognized in prior years are recorded as an adjustment to the accrued liability and sales in the current year. A reconciliation of the liability is as follows:
|
In Thousands
|
2010
|
2009
|
2008
|
|||||||||
|
Beginning balance
|
$ | 737 | $ | 896 | $ | 1,208 | ||||||
|
Additions
|
357 | 232 | 113 | |||||||||
|
Deductions
|
(438 | ) | (391 | ) | (425 | ) | ||||||
|
Ending balance
|
$ | 656 | $ | 737 | $ | 896 | ||||||
Inventory Valuation Reserves
The Company evaluates inventory for obsolescence and excess quantities based on demand forecasts based on specified time frames; usually one year. The demand forecast is based on historical usage, sales forecasts and current as well as anticipated market conditions. All amounts in excess of the demand forecast are deemed to be excess or obsolete and a reserve is established based on the anticipated net realizable value. A reconciliation of the reserve is as follows:
|
In Thousands
|
2010
|
2009
|
2008
|
|||||||||
|
Beginning balance
|
$ | 3,152 | $ | 3,943 | $ | 3,573 | ||||||
|
Additions
|
189 | 1,042 | 1,786 | |||||||||
|
Deductions
|
(1,502 | ) | (1,833 | ) | (1,416 | ) | ||||||
|
Ending balance
|
$ | 1,839 | $ | 3,152 | $ | 3,943 | ||||||
41
Allowance for Doubtful Accounts
The Company provides an allowance for doubtful accounts based upon a review of outstanding receivables, historical collection information and existing economic conditions. Accounts receivable are ordinarily due between 30 and 60 days after the issuance of the invoice. Accounts are considered delinquent when more than 90 days past due. Delinquent receivables are reserved or written off based on individual credit evaluation and specific circumstances of the customer. A reconciliation of the allowance is as follows:
|
In Thousands
|
2010
|
2009
|
2008
|
|||||||||
|
Beginning balance
|
$ | 1,485 | $ | 1,114 | $ | 1,087 | ||||||
|
Additions
|
654 | 1,224 | 525 | |||||||||
|
Deductions
|
(935 | ) | (853 | ) | (498 | ) | ||||||
|
Ending balance
|
$ | 1,204 | $ | 1,485 | $ | 1,114 | ||||||
Advertising Subsidies
The Company enters agreements with certain retailers to pay for direct advertising programs and/or provide in-store display units. These agreements are not based on retailer purchase volumes and do not obligate the retailer to continue carrying the Company’s products. The Company determines the value of the advertising services based on its own research and history of providing such services. The Company expenses these costs in the period in which they are incurred as a reduction of sales. A reconciliation of the liability is as follows:
|
In Thousands
|
2010
|
2009
|
2008
|
|||||||||
|
Beginning balance
|
$ | 138 | $ | 504 | $ | 1,508 | ||||||
|
Additions
|
150 | 170 | 498 | |||||||||
|
Deductions
|
(224 | ) | (536 | ) | (1,502 | ) | ||||||
|
Ending balance
|
$ | 64 | $ | 138 | $ | 504 | ||||||
CO-OP Advertising
The Company offers co-operative advertising allowances to certain retailers to encourage product promotions. These agreements are typically based on a percentage of retailer purchases up to a maximum allowance and the Company is never directly involved with the media provider. The Company accrues the estimated cost of these programs based on the sales volume of the retailer and historical trends. As costs are accrued they are recorded as a reduction in sales. A reconciliation of the liability is as follows:
|
In Thousands
|
2010
|
2009
|
2008
|
|||||||||
|
Beginning balance
|
$ | 1,322 | $ | 2,648 | $ | 3,323 | ||||||
|
Additions
|
2,637 | 1,816 | 2,999 | |||||||||
|
Deductions
|
(2,643 | ) | (3,142 | ) | (3,674 | ) | ||||||
|
Ending balance
|
$ | 1,316 | $ | 1,322 | $ | 2,648 | ||||||
Volume Rebates
The Company has various rebate programs with its retailers that are based on purchase volume. Typically these programs are based on achieving specified sales volumes and the rebate is calculated as a percentage of purchases. Based on the terms of the agreement, purchase levels and historical trends the Company accrues the cost of these programs and records the same as a reduction in sales. A reconciliation of the liability is as follows:
|
In Thousands
|
2010
|
2009
|
2008
|
|||||||||
|
Beginning balance
|
$ | 926 | $ | 939 | $ | 862 | ||||||
|
Additions
|
1,023 | 1,582 | 1,673 | |||||||||
|
Deductions
|
(1,259 | ) | (1,595 | ) | (1,596 | ) | ||||||
|
Ending balance
|
$ | 690 | $ | 926 | $ | 939 | ||||||
42
Catalog Allowances
A number of large office supply dealers operate through catalogs distributed to businesses globally. Product content is decided by the dealer each time a new catalog is issued, typically once a year. Catalog allowances are required by the dealer as an inducement to include the Company’s products. The allowance is based on a fixed cost per page and/or a percentage of purchases by the dealer. The fixed portion of the allowance is often paid when the catalog is distributed and is recognized in the period incurred and the variable portion is accrued based on dealer purchases and historical trends. Catalog allowances are recorded as a reduction in sales. A reconciliation of the liability is as follows:
|
In Thousands
|
2010
|
2009
|
2008
|
|||||||||
|
Beginning balance
|
$ | 363 | $ | 532 | $ | 449 | ||||||
|
Additions
|
1,236 | 2,010 | 1,274 | |||||||||
|
Deductions
|
(1,271 | ) | (2,179 | ) | (1,191 | ) | ||||||
|
Ending balance
|
$ | 328 | $ | 363 | $ | 532 | ||||||
| Note 3 — Accrued Liabilities |
Accrued liabilities consist of the following:
|
In Thousands
|
2010
|
2009
|
||||||
|
Employee compensation
|
$ | 4,696 | $ | 3,419 | ||||
|
Customer related allowances and accruals
|
3,982 | 4,867 | ||||||
|
Other accrued items
|
7,042 | 4,452 | ||||||
| $ | 15,720 | $ | 12,738 | |||||
| Note 4 — Operating Leases |
The Company leases warehouse and office space under non-cancelable operating leases that expire at various dates through 2014. Terms of the leases, including renewals, taxes, utilities, and maintenance, vary by lease. Total rental expense included in the results of operations relating to all leases was $1.5 million, $1.7 million, and $1.7 million in 2010, 2009, and 2008, respectively.
At December 25, 2010, minimum rental payments under non-cancelable leases with terms of more than one year were as follows:
|
In Thousands
|
Amount
|
|||
|
2011
|
$ | 873 | ||
|
2012
|
348 | |||
|
2013
|
104 | |||
|
2014
|
66 | |||
|
2015
|
— | |||
| $ | 1,391 | |||
| Note 5 — Acquired Intangible Assets and Goodwill |
The carrying basis and accumulated amortization of recognized intangible assets are summarized in the following table:
|
2010
|
2009
|
|||||||||||||||
| Gross | Gross | |||||||||||||||
| Carrying | Accumulated | Carrying | Accumulated | |||||||||||||
|
In Thousands
|
Amount
|
Amortization
|
Amount
|
Amortization
|
||||||||||||
|
Patents
|
$ | 22,369 | $ | 11,978 | $ | 22,369 | $ | 10,978 | ||||||||
|
Consulting agreements
|
976 | 976 | 976 | 976 | ||||||||||||
|
Non-compete agreements
|
2,197 | 2,073 | 2,197 | 2,015 | ||||||||||||
|
Customer list
|
1,821 | 1,582 | 1,971 | 1,465 | ||||||||||||
|
Trademarks
|
5,046 | 122 | 5,224 | 122 | ||||||||||||
| $ | 32,409 | $ | 16,731 | $ | 32,737 | $ | 15,556 | |||||||||
43
Amortization expense was $1.3 million, $2.3 million and $2.2 million for 2010, 2009 and 2008, respectively.
Estimated future amortization expense for each reporting segment is summarized in the following table:
|
In Thousands
|
2011
|
2012
|
2013
|
2014
|
2015
|
Thereafter
|
||||||||||||||||||
|
Sporting Goods
|
$ | 1,729 | $ | 1,713 | $ | 1,688 | $ | 1,552 | $ | 1,546 | $ | 2,304 | ||||||||||||
|
Information Security and Print Finishing
|
131 | 74 | 18 | — | — | — | ||||||||||||||||||
| $ | 1,860 | $ | 1,787 | $ | 1,706 | $ | 1,552 | $ | 1,546 | $ | 2,304 | |||||||||||||
The changes in the carrying amount of goodwill were:
|
In Thousands
|
Sporting Goods
|
Information Security
and Print Finishing |
Total
|
|||||||||
|
Balance at December 27, 2008
|
$ | 12,017 | $ | 13,794 | $ | 25,811 | ||||||
|
Purchase price adjustment
|
— | 191 | 191 | |||||||||
|
Foreign currency translation adjustment
|
— | 213 | 213 | |||||||||
|
Balance at December 26, 2009
|
12,017 | 14,198 | 26,215 | |||||||||
|
Foreign currency translation adjustment
|
— | (818 | ) | (818 | ) | |||||||
|
Balance at December 25, 2010
|
$ | 12,017 | $ | 13,380 | $ | 25,397 | ||||||
| Note 6 — Equity Interest Investments |
The Company has a 50% interest in a joint venture, Stiga Sports AB (Stiga). The joint venture is accounted for under the equity method of accounting. Stiga, located in Sweden, is a global sporting goods company producing table tennis equipment and game products. Financial information for Stiga reflected in the table below has been translated from local currency to U.S. dollars using exchange rates in effect at the respective year-end for balance sheet amounts and using average exchange rates for income statement amounts. Certain differences exist between U.S. GAAP and local GAAP in Sweden, and the impact of these differences is not reflected in the summarized information reflected in the table below. The most significant difference relates to the accounting for goodwill for Stiga which is amortized over eight years in Sweden but is not amortized for U.S. GAAP reporting purposes. The effect on Stiga’s net assets resulting from the amortization of goodwill for the years ended 2010 and 2009 are addbacks of $7.6 million and $5.6 million, respectively. These net differences are comprised of cumulative goodwill adjustments of $10.6 million offset by the related cumulative tax effect of $3.0 million as of December 25, 2010 and cumulative goodwill adjustments of $7.9 million offset by the related cumulative tax effect of $2.3 million as of December 26, 2009. The income statement impact of these goodwill and tax adjustments and other individually insignificant U.S. GAAP adjustments for the years ended December 25, 2010, December 26, 2009, and December 27, 2008 are to increase total Stiga net income by approximately $1.7 million, $1.3 million, and $1.7 million, respectively.
In addition, the Company has a 50% interest in two joint ventures, Escalade International, Ltd. in the United Kingdom, and Neoteric Industries Inc. in Taiwan. Escalade International Ltd. is a sporting goods wholesaler, specializing in table tennis, game tables and archery products. The income and assets of Neoteric have no material impact on the Company’s financial reporting. The Company’s 50% portion of net income for Escalade International for the years ended December 25, 2010, December 26, 2009, and December 27, 2008 was $87 thousand, $123 thousand, and $58 thousand respectively, and is included in other income on the Company’s statement of operations. Additional information regarding these entities is considered immaterial and has not been included in the combined totals listed below.
44
In accordance with Rule 3-09 of Regulation S-X, the applicable financial statements and accompanying notes of Stiga will be filed subsequently as an amendment to this Form 10-K.
Summarized financial information for Stiga Sports AB balance sheets as of December 31, 2010 and 2009, and statements of operations for the years ended December 31, 2010, 2009 and 2008 is as follows:
|
In Thousands
|
2010
|
2009
|
||||||||||
|
Current assets
|
$ | 19,384 | $ | 15,085 | ||||||||
|
Non-current assets
|
11,338 | 11,826 | ||||||||||
|
Total assets
|
30,722 | 26,911 | ||||||||||
|
Current liabilities
|
9,599 | 7,508 | ||||||||||
|
Non-current liabilities
|
8,918 | 9,864 | ||||||||||
|
Total liabilities
|
18,517 | 17,372 | ||||||||||
|
Net assets
|
$ | 12,205 | $ | 9,539 | ||||||||
|
2010
|
2009 | 2008 | ||||||||||
|
Net sales
|
$ |
30,826
|
$ | 25,833 | $ | 27,519 | ||||||
|
Gross profit
|
13,953
|
12,166 | 11,295 | |||||||||
|
Net income
|
2,044
|
1,615 | 244 |
| Note 7 — Borrowings |
On May 31, 2010 the Company entered into the Sixth Amendment to its Credit Agreement with its issuing bank, JP Morgan Chase Bank, N.A. (Chase). The Sixth Amendment amends the Credit Agreement dated as of April 30, 2009, which had a maturity date of May 31, 2010. The Amendment provides for a multi-year loan facility. As amended, the Credit Agreement now makes available to the Company a senior revolving credit facility in the maximum principal amount of up to $27 million with a maturity date of May 31, 2012 and a term loan in the principal amount of $10 million with a maturity date of May 31, 2015. The term loan agreement requires the Company to make repayment of the principal balance in equal installments of $0.5 million per quarter beginning in September 2010. The Amendment also provides a Euro 2.0 million (approximately $2.6 million) overdraft facility to replace the previous Euro 1.0 million (approximately $1.3 million) overdraft facility and the revolving Euro credit facility. As of December 25, 2010 and December 26, 2009, the total amount outstanding on the overdraft facility was $1.6 million and $0.2 million, respectively. Such amounts are included in accrued liabilities on the consolidated balance sheets. A portion of the credit facility not in excess of $5 million is available for the issuance of commercial or standby letters of credit to be issued by Chase.
45
Short-Term Debt
Short-term debt at fiscal year-ends was as follows:
|
In Thousands
|
2010
|
2009
|
||||||
|
Senior secured revolving credit facility of $27.0 million with a maturity of May 31, 2012. The loan bears an interest rate of the Alternative Base Rate plus or minus the applicable ABR spread, or LIBOR plus the applicable LIBOR Spread, determined quarterly and based on the Company’s leverage ratio. Secured by substantially all assets of the Company. The interest rates at December 25, 2010 ranged between 2.5% and 3.0%.
|
$ | 6,707 | $ | 22,067 | ||||
|
Senior secured revolving credit facility of Euro 3.0 million (approximately $4.1 million), the balance due on May 31, 2010 was eliminated with the execution of the Sixth Amendment to the Credit Agreement.
|
— | 2,877 | ||||||
|
Short-term debt
|
4,700 | 2,700 | ||||||
| $ | 11,407 | $ | 27,644 | |||||
Long-Term Debt
Long-term debt at fiscal year-ends was as follows:
|
In Thousands
|
2010
|
2009
|
||||||
|
Revolving term loan of $10.0 million, executed on May 31, 2010 with a term of 5 years, with payments of $0.5 million quarterly beginning with the calendar quarter ended September 30, 2010. The loan bears an interest rate of Alternative Base Rate plus or minus the applicable ABR Spread, or LIBOR plus the applicable LIBOR Spread, determined quarterly. The interest rate at December 25, 2010, was 2.76%.
|
$ | 9,500 | $ | — | ||||
|
Mortgage payable (Wabash, Indiana Adjustable Rate Economic Development Revenue Refunding Bonds), annual installments are optional, interest varies with short-term rates and is adjustable weekly based on market conditions, maximum rate is 10.00%, rate at December 25, 2010 is 0.72%, due September 2028, secured by plant facility, machinery and equipment, and a stand-by letter of credit
|
2,700 | 2,700 | ||||||
| 12,200 | 2,700 | |||||||
|
Portion classified as short-term debt
|
(4,700 | ) | (2,700 | ) | ||||
| $ | 7,500 | $ | — | |||||
Maturities of long-term debt outstanding at December 25, 2010 are as follows: $4.7 million in 2011, $2.0 million in 2012, $2.0 million in 2013, $2.0 million in 2014 and $1.5 million in 2015.
| Note 8 — Earnings Per Share |
The shares used in the computation of the Company’s basic and diluted earnings per common share are as follows:
|
In Thousands
|
2010
|
2009
|
2008
|
|||||||||
|
Weighted average common shares outstanding
|
12,726 | 12,632 | 12,637 | |||||||||
|
Dilutive effect of stock options
|
515 | 239 | 47 | |||||||||
|
Weighted average common shares outstanding, assuming dilution
|
13,241 | 12,871 | 12,684 | |||||||||
|
Number of anti-dilutive stock options
|
— | 30 | 391 | |||||||||
46
Weighted average common shares outstanding, assuming dilution, includes the incremental shares that would be issued upon the assumed exercise of stock options outstanding.
| Note 9 — Employee Benefit Plans |
The Company has an employee profit-sharing salary reduction plan, pursuant to the provisions of Section 401(k) of the Internal Revenue Code, for non-union employees. The Company’s contribution is a matching percentage of the employee contribution as determined by the Board of Directors annually. The Company’s expense for the plan was $0.18 million, $0.13 million and $0.54 million for 2010, 2009 and 2008, respectively.
| Note 10 — Deferred Compensation Plan |
In October 1985, the Board of Directors approved the adoption of a Contributory Deferred Compensation Plan pursuant to which some recipients of incentive compensation could elect to defer receipt thereof. For each dollar of deferred compensation, the Company provided a 75% matching amount. All deferrals allowed under this plan have been made and amounts deferred earn interest at the rate of 9%. Mr. Robert Griffin, Chairman of the Board, was the only remaining participant in the Plan at the beginning of 2010. During 2010, the entire balance owed to Mr. Griffin was disbursed in cash. The payment of this liability was recognized as an expense for tax purposes in the current year.
| Note 11 — Stock Compensation Plans |
In April 2007, Shareholders approved the Escalade, Incorporated 2007 Incentive Plan (“2007 Incentive Plan”), which is an incentive plan for key employees, directors and consultants with various equity-based incentives as described in the plan document. The 2007 Incentive Plan is a replacement for the 1997 Incentive Stock Option Plan and the 1997 Director Stock Compensation and Option Plan which expired at the end of April 2007. All options issued and outstanding under the expired plans will remain in effect until exercised, expired or forfeited.
The 2007 Incentive Plan is administered by the Board of Directors or a committee thereof, which is authorized to determine, among other things, the key employees, directors or consultants who will receive awards under the plan, the amount and type of award, exercise prices or performance criteria, if applicable, and vesting schedules. Subject to various restrictions contained in the plan document, the total number of shares of common stock which may be issued pursuant to awards under the Plan may not exceed 1,405,491 shares.
Restricted Stock Units
In 2009, 2008, and 2007, the Company granted restricted stock units to certain officers and directors of the Company at fair market value on the date of grant. The restricted stock units granted to employees of the Company vest over three to four years and are dependent on certain market criteria. The restricted stock units granted to directors vest immediately or within two years. All restricted stock units are payable in shares of the Company’s common stock upon vesting, subject to the deferral election arrangement, and are subject to forfeiture if on the vesting date the employee is not employed or the director no longer holds a position with the Company.
47
The Company issued no restricted stock units to employees or directors in 2010, and no restricted stock units to employees in 2009 and 54,103 restricted stock units to directors in 2009. The following table presents a summary of non-vested restricted stock units granted to employees and directors as of December 25, 2010, and changes during the year ended December 25, 2010:
|
Number of
Shares |
Weighted-
Average Grant Date Fair Value |
|||||||
|
Non-vested restricted stock units as of December 26, 2009
|
185,250 | $ | 5.76 | |||||
|
Granted
|
— | $ | — | |||||
|
Vested
|
— | $ | — | |||||
|
Forfeited
|
(102,542 | ) | $ | 5.75 | ||||
|
Non-vested restricted stock units as of December 25, 2010
|
82,708 | $ | 5.78 | |||||
|
Vested but unsettled
|
73,840 | |||||||
|
Outstanding restricted stock units as of December 25, 2010
|
156,548 | |||||||
When vesting is dependent on certain market criteria, the fair value of restricted stock units is determined by the use of Monte Carlo techniques. The market price of the Company’s stock on the grant date is used to value restricted stock units where vesting is not contingent on market criteria. In 2010, the Company recorded the impact of pre-vesting forfeitures of certain restricted stock units. The impact of these pre-vesting forfeitures was to reduce the stock compensation expense by $259 thousand. In 2010 and 2009, the Company recognized ($48) thousand and $504 thousand, respectively in compensation expense related to restricted stock units and as of December 25, 2010 and December 26, 2009, there was $35 thousand and $354 thousand, for 2010 and 2009, respectively of unrecognized compensation expense related to restricted stock units.
Stock Options
Total compensation expense recorded in the statement of operations for 2010, 2009 and 2008 relating to stock options was $224 thousand, $84 thousand and $414 thousand, respectively.
At the February 23, 2010 meeting of the Board of Directors, the Board voted to approve director stock options of 30,000, and employee incentive stock options of 299,000. The director and employee options have a one year vesting and four year-tiered vesting, respectively, and all options expire in five years.
The following table summarizes option activity for each of the three years ended 2010:
|
Incentive Stock Options
|
Director Stock Options
|
|||||||||||
|
Granted
|
Outstanding
|
Granted
|
Outstanding
|
|||||||||
|
2010
|
299,000 | 877,500 | 30,000 | 51,524 | ||||||||
|
2009
|
682,000 | 791,000 | 30,000 | 51,600 | ||||||||
|
2008
|
— | 366,500 | — | 24,367 | ||||||||
The fair value of each option grant award is estimated on the grant date using the Black-Scholes-Merton option valuation model using the following assumptions:
|
2010
|
2009
|
2008
|
|||||||
|
Risk-free interest rates
|
1.36% |
1.15% to 1.38%
|
— | ||||||
|
Dividend yields
|
0% | 0% | — | ||||||
|
Volatility factors of expected market price of common stock
|
97.64% to 116.63%
|
81.34% to 94.93%
|
— | ||||||
|
Weighted average expected life of the options
|
1-4 years
|
1-3 years
|
— |
48
The following table summarizes stock option transactions for the three years ended 2010:
|
2010
|
2009
|
2008
|
||||||||||||||||||||||
|
Shares
|
Option
Price |
Shares
|
Option
Price |
Shares
|
Option
Price |
|||||||||||||||||||
|
Outstanding at beginning of year
|
842,600 | $0.64 to $13.40 | 390,867 | $6.99 to $19.21 | 446,343 | $6.99 to $19.21 | ||||||||||||||||||
|
Issued during year
|
329,000 | $2.56 | 712,000 | $0.64 to $0.89 | — | — | ||||||||||||||||||
|
Canceled or expired
|
(167,576 | ) | (260,267 | ) | (10,726 | ) | ||||||||||||||||||
|
Exercised during year
|
(75,000 | ) | $0.64 to $0.89 | — | (44,750 | ) | $6.99 to $9.03 | |||||||||||||||||
|
Outstanding at end of year
|
929,024 | $0.64 to $11.26 | 842,600 | $0.64 to $13.40 | 390,867 | $6.99 to $19.21 | ||||||||||||||||||
|
Exercisable at end of year
|
87,524 | 191,850 | 314,117 | |||||||||||||||||||||
|
Weighted-average fair value of options granted during the year
|
$ | 1.80 | $ | 0.38 | $ | — | ||||||||||||||||||
The following table summarizes information about stock options outstanding at December 25, 2010:
|
Options Outstanding
|
Options Exercisable
|
||||||||||
|
Range of
Exercise Prices |
Number of
Shares |
Weighted-Average
Remaining Contractual Life |
Weighted-Average
Exercise Price |
Number of
Shares |
Weighted-Average
Exercise Price |
||||||
| $0.64 - $0.89 | 522,000 |
3.3 years
|
$ 0.64 | 5,000 | $ 0.89 | ||||||
| $2.56 | 324,500 |
4.2 years
|
$ 2.56 | — | $ — | ||||||
| $9.35 - $11.26 | 82,524 |
0.3 years
|
$10.97 | 82,524 | $10.97 | ||||||
| 929,024 | 87,524 | ||||||||||
| Note 12 — Other Comprehensive Income (Loss) |
The components of other comprehensive income (loss) and related tax effects were as follows:
|
In Thousands
|
2010
|
2009
|
2008
|
|||||||||
|
Realization of previously unrealized gains on available-for-sale investments net of tax of $0, $0, and $210 in 2010, 2009 and 2008, respectively
|
$ | — | $ | — | $ | ( 320 | ) | |||||
|
Change in foreign currency translation adjustment
|
(845 | ) | 1,642 | (2,344 | ) | |||||||
|
Change in unrealized loss on interest rate swap agreement net of tax of $0, $0, and $23, in 2010, 2009 and 2008, respectively
|
— | — | (35 | ) | ||||||||
| $ | (845 | ) | $ | 1,642 | $ | (2,699 | ) | |||||
49
The components of accumulated other comprehensive income, net of tax, were as follows:
|
In Thousands
|
2010
|
2009
|
2008
|
|||||||||
|
Foreign currency translation adjustment
|
3,921 | 4,766 | 3,124 | |||||||||
| $ | 3,921 | $ | 4,766 | $ | 3,124 | |||||||
| Note 13 — Provision for Taxes |
Income before taxes and the provision for taxes consisted of the following:
|
In Thousands
|
2010
|
2009
|
2008
|
|||||||||
|
Income (loss) before taxes:
|
||||||||||||
|
United States of America (USA)
|
$ | 10,919 | $ | 3,359 | $ | (10,106 | ) | |||||
|
Non USA
|
(1,843 | ) | (754 | ) | (74 | ) | ||||||
| $ | 9,076 | $ | 2,605 | $ | (10,180 | ) | ||||||
|
Provision for taxes:
|
||||||||||||
|
Current
|
||||||||||||
|
Federal
|
$ | 118 | $ | (906 | ) | $ | (2,575 | ) | ||||
|
State
|
180 | (685 | ) | 804 | ||||||||
|
International
|
(194 | ) | 364 | 575 | ||||||||
| 104 | (1,227 | ) | (1,196 | ) | ||||||||
|
Deferred
|
||||||||||||
|
Federal
|
2,802 | 1,686 | (774 | ) | ||||||||
|
State
|
59 | 964 | (714 | ) | ||||||||
|
International
|
52 | (475 | ) | — | ||||||||
| 2,913 | 2,175 | (1,488 | ) | |||||||||
| $ | 3,017 | $ | 948 | $ | (2,684 | ) | ||||||
The Company has not provided for USA deferred taxes or foreign withholding taxes on undistributed earnings for non-USA subsidiaries where the Company intends to reinvest these earnings indefinitely in operations outside the USA.
The provision for income taxes was computed based on financial statement income. A reconciliation of the provision for income taxes to the amount computed using the statutory rate follows:
|
In Thousands
|
2010
|
2009
|
2008
|
|||||||||
|
Income tax at statutory rate
|
$ | 3,086 | $ | 886 | $ | (3,461 | ) | |||||
|
Increase (decrease) in income tax resulting from
|
||||||||||||
|
Permanent differences (investment income, dividends, and captive insurance earnings)
|
(368 | ) | (162 | ) | 117 | |||||||
|
State tax expense, net of federal effect
|
158 | 184 | (125 | ) | ||||||||
|
Effect of foreign tax rates
|
484 | (188 | ) | 391 | ||||||||
|
Other
|
(343 | ) | 228 | 394 | ||||||||
|
Recorded provision for income taxes
|
$ | 3,017 | $ | 948 | $ | (2,684 | ) | |||||
50
The provision for income taxes was computed based on financial statement income. In accordance with FASB ASC 740, the Company has recorded the following changes in uncertain tax positions:
|
In Thousands
|
2010
|
2009
|
||||||
|
Balance, beginning of year
|
$ | 536 | $ | 954 | ||||
|
Additions for current year tax positions
|
— | — | ||||||
|
Additions for prior year tax positions
|
— | — | ||||||
|
Settlements
|
(263 | ) | — | |||||
|
Reductions settlements
|
— | — | ||||||
|
Reductions for prior year tax positions
|
(53 | ) | (418 | ) | ||||
|
Balance, end of year
|
$ | 220 | $ | 536 | ||||
Interest costs and penalties related to income taxes are classified as interest expense and selling, general and administrative costs, respectively in the Company’s financial statements. The Company and its subsidiaries file income tax returns in the U.S. federal jurisdiction, and multiple state and foreign jurisdictions. The Company is subject to future examinations by federal, state and other tax authorities for all years after 2006.
The components of the net deferred tax assets are as follows:
|
In Thousands
|
2010
|
2009
|
||||||
|
Assets
|
||||||||
|
Employee benefits
|
$ | 58 | $ | 29 | ||||
|
Valuation reserves
|
1,727 | 2,034 | ||||||
|
Deferred compensation
|
— | 507 | ||||||
|
Property and equipment
|
— | 24 | ||||||
|
Stock based compensation
|
268 | 469 | ||||||
|
Federal and state credits
|
375 | 507 | ||||||
|
Net operating loss carry forward
|
7,584 | 6,914 | ||||||
|
Total assets
|
10,012 | 10,484 | ||||||
|
Liabilities
|
||||||||
|
Unrealized equity investment income
|
(1,627 | ) | (1,225 | ) | ||||
|
Goodwill and intangible assets
|
(2,184 | ) | (1,631 | ) | ||||
|
Property and equipment
|
(218 | ) | — | |||||
|
Total liabilities
|
(4,029 | ) | (2,856 | ) | ||||
|
Valuation Allowance
|
||||||||
|
Beginning balance
|
(6,855 | ) | (1,301 | ) | ||||
|
Increase (decrease) during period
|
229 | (5,554 | ) | |||||
|
Ending balance
|
(6,626 | ) | (6,855 | ) | ||||
| $ | (643 | ) | $ | 773 | ||||
Deferred tax assets are included in the consolidated balance sheets as follows:
|
In Thousands
|
2010
|
2009
|
||||||
|
Deferred income tax asset - current
|
$ | 1,502 | $ | 1,999 | ||||
|
Deferred income tax asset (liability) – long-term
|
(2,145 | ) | (1,226 | ) | ||||
| $ | (643 | ) | $ | 773 | ||||
The Company has U.S. federal unused net operating loss carry-forwards of approximately $1.8 million and state unused net operating losses of approximately $7.3 million. All operating loss carry-forwards expire in various amounts through 2029. In addition, the Company has foreign unused net operating loss carry-forwards of approximately $19.9 million of which an estimated $18.5 million has been reserved as the Company does not expect to be able to utilize these carryforwards.
51
| Note 14 — Operating Segment and Geographic Information |
|
In Thousands
|
2010
|
2009
|
2008
|
|||||||||
|
Sporting Goods
|
||||||||||||
|
Net revenue
|
$ | 85,815 | $ | 76,807 | $ | 98,039 | ||||||
|
Operating income (loss)
|
9,171 | 4,610 | (6,250 | ) | ||||||||
|
Interest expense
|
1,655 | 2,673 | 1,568 | |||||||||
|
Provision (benefit) for taxes
|
2,993 | 715 | (3,054 | ) | ||||||||
|
Net income (loss)
|
4,601 | 1,273 | (5,428 | ) | ||||||||
|
Identifiable assets
|
68,047 | 67,528 | 78,593 | |||||||||
|
Non-marketable equity investments (equity method)
|
— | — | — | |||||||||
|
Depreciation & amortization
|
2,461 | 3,217 | 3,784 | |||||||||
|
Capital expenditures
|
517 | 792 | 2,261 | |||||||||
|
Information Security and Print Finishing
|
||||||||||||
|
Net revenue
|
34,841 | 39,192 | 50,647 | |||||||||
|
Operating income
|
926 | 1,780 | 3,930 | |||||||||
|
Interest expense
|
203 | (208 | ) | (256 | ) | |||||||
|
Provision for taxes
|
913 | 988 | 2,037 | |||||||||
|
Net income (loss)
|
(187 | ) | 1,077 | 1,835 | ||||||||
|
Identifiable assets
|
37,713 | 40,105 | 44,306 | |||||||||
|
Non-marketable equity investments (equity method)
|
321 | 341 | 336 | |||||||||
|
Depreciation & amortization
|
1,114 | 1,576 | 1,755 | |||||||||
|
Capital expenditures
|
1,261 | 640 | 582 | |||||||||
|
All Other
|
||||||||||||
|
Net revenue
|
— | — | — | |||||||||
|
Operating income (loss)
|
(1,908 | ) | (4,390 | ) | (5,801 | ) | ||||||
|
Interest expense
|
(695 | ) | (800 | ) | 713 | |||||||
|
Provision (benefit) for taxes
|
(889 | ) | (755 | ) | (1,667 | ) | ||||||
|
Net income (loss)
|
1,645 | (693 | ) | (3,903 | ) | |||||||
|
Identifiable assets
|
21,793 | 19,605 | 24,802 | |||||||||
|
Non-marketable equity investments (equity method)
|
11,303 | 8,815 | 6,584 | |||||||||
|
Depreciation & amortization
|
755 | 1,172 | — | |||||||||
|
Capital expenditures
|
— | 462 | 6,641 | |||||||||
|
Total
|
||||||||||||
|
Net revenue
|
120,656 | 115,999 | 148,686 | |||||||||
|
Operating income (loss)
|
8,189 | 2,000 | (8,121 | ) | ||||||||
|
Interest expense
|
1,163 | 1,665 | 2,025 | |||||||||
|
Provision (benefit)for taxes
|
3,017 | 948 | (2,684 | ) | ||||||||
|
Net income (loss)
|
6,059 | 1,657 | (7,496 | ) | ||||||||
|
Identifiable assets
|
127,553 | 127,238 | 147,701 | |||||||||
|
Non-marketable equity investments (equity method)
|
11,624 | 9,156 | 6,920 | |||||||||
|
Depreciation & amortization
|
4,330 | 5,965 | 5,539 | |||||||||
|
Capital expenditures
|
1,778 | 1,894 | 9,484 | |||||||||
Each operating segment is individually managed and has separate financial results that are reviewed by the Company’s management. Each segment contains closely related products that are unique to the particular segment. There were no changes to the composition of segments in 2010. The accounting policies of the reportable segments are the same as those described in the summary of significant accounting policies.
The Sporting Goods segment consists of home entertainment products such as table tennis tables and accessories; basketball goals; pool tables and accessories; outdoor playsets; soccer and hockey tables; archery equipment and accessories; and fitness, arcade and darting products. Customers include retailers, dealers and wholesalers located throughout the United States and Europe.
52
The Information Security and Print Finishing segment consists of products such as high-security data shredders, disintegrators and deguassers and office machinery used in the office and graphic arts environment. Office environment products include folding machines; and paper trimmers and cutters. Customers include end-users, as well as, retailers, wholesalers, catalogs, specialty dealers and business partners.
All other segments consist of general and administrative expenses not specifically related to the operating business segments and includes investment income from equity investments.
Interest expense is allocated to operating segments based on working capital usage and the provision for taxes is allocated based on a combined federal and state statutory rate of 36% adjusted for actual taxes on foreign income. Permanent tax adjustments and timing differences are included in the all other segment.
Identifiable assets are principally those assets used in each segment. The assets in the all other segment are principally cash and cash equivalents; deferred tax assets; and investments.
The Company has one customer in 2010 in the Sporting Goods segment who accounted for 15% of consolidated total revenues and one customer in 2009 and 2008 who accounted for 15% and 6% of consolidated total revenues, respectively. No other customers accounted for 10% or more of consolidated revenues. Within the Sporting Goods segment these customers accounted for 21%, 22% and 9% of total revenues in 2010, 2009 and 2008, respectively.
As of December 25, 2010, approximately 14 employees of the Company’s labor force were covered by a collective bargaining agreement that expires April 30, 2012.
Raw materials for Escalade’s various product lines consist of wood, particleboard, slate, standard grades of steel, steel tubing, plastic, vinyl, steel cables, fiberglass and packaging. Escalade relies upon suppliers in Europe and Brazil for its requirement of billiard balls and slate utilized in the production of home pool tables and upon various Asian manufacturers for certain of its table tennis needs and other items. Escalade sources some of its game table product line in China.
Revenues by geographic region/country were as follows:
|
In Thousands
|
2010
|
2009
|
2008
|
|||||||||
|
North America
|
$ | 100,921 | $ | 95,723 | $ | 122,530 | ||||||
|
Europe
|
11,486 | 13,033 | 19,566 | |||||||||
|
Other
|
8,249 | 7,243 | 6,590 | |||||||||
| $ | 120,656 | $ | 115,999 | $ | 148,686 | |||||||
Revenues are attributed to country based on location of customer and are for continuing operations.
Identified assets by geographic region/country were as follows:
|
In Thousands
|
2010
|
2009
|
2008
|
|||||||||
|
North America
|
$ | 103,277 | $ | 100,643 | $ | 119,417 | ||||||
|
Europe
|
24,276 | 26,595 | 28,284 | |||||||||
| $ | 127,553 | $ | 127,238 | $ | 147,701 | |||||||
53
| Note 15 — Summary of Quarterly Results |
|
In thousands, except per share data (unaudited)
|
March 20
|
July 10
|
October 2
|
December 25
|
||||||||||||
|
2010
|
||||||||||||||||
|
Net sales
|
$ | 25,169 | $ | 35,737 | $ | 28,565 | $ | 31,185 | ||||||||
|
Operating income
|
1,409 | 3,450 | 2,359 | 971 | ||||||||||||
|
Net income (loss)
|
802 | 1,862 | 1,172 | 2,223 | ||||||||||||
|
Basic earnings per share
|
$ | 0.06 | $ | 0.15 | $ | 0.09 | $ | 0.18 | ||||||||
|
In thousands, except per share data (unaudited)
|
March 21
|
July 11
|
October 3
|
December 26
|
||||||||||||
|
2009
|
||||||||||||||||
|
Net sales
|
$ | 24,958 | $ | 35,641 | $ | 26,358 | $ | 29,042 | ||||||||
|
Operating income (loss)
|
(628 | ) | 1,374 | 612 | 642 | |||||||||||
|
Net income (loss)
|
(439 | ) | 366 | 618 | 1,112 | |||||||||||
|
Basic earnings per share
|
$ | (0.03 | ) | $ | 0.03 | $ | 0.05 | $ | 0.08 | |||||||
| Note 16 — Acquisitions |
All of the Company’s acquisitions have been accounted for using the purchase method of accounting.
2008
In March 2008, in addition to the 50% ownership already held by the Company, the Company acquired the remaining 50% stock shares of Action Group, which is a dealer of office supplies in South Africa. The total price of $125 thousand was paid in cash using the Company’s revolving credit lines and was composed of customer lists and goodwill.
In June 2008, the Company acquired 100% of the stock shares of Safe Tech Sweden AB, which is a distributor of office supplies. The total price of $342 thousand was paid in cash using the Company’s revolving credit lines and was composed of customer lists, goodwill and other assets.
| Note 17 — Commitments and Contingencies |
The Company has obtained a letter of credit for the benefit of a certain mortgage holder. At December 25, 2010, the balance of the letter of credit was $2.7 million. It is to be used in the event of a default in either interest or principal payments.
In the second quarter of 2010, the Company was made aware of a potential financial obligation relating to an 8,600 square foot facility the Company is sub-leasing in Spain. At this time, management is unable to estimate the potential exposure related to this matter, if any, but does not believe this will create a material adverse impact on the Company’s consolidated financial conditions.
The Company is involved in litigation arising in the normal course of its business. The Company does not believe that the disposition or ultimate resolution of existing claims or lawsuits will have a material adverse effect on the business or financial condition of the Company.
The Company has entered into various agreements whereby it is required to make royalty and license payments. At December 25, 2010, the Company had future estimated minimum non-cancelable royalty and license payments as follows:
|
In Thousands
|
Amount
|
|||
| 2011 | $ | 430 | ||
| 2012 | 530 | |||
| 2013 | 350 | |||
| 2014 | 375 | |||
| 2015 | 375 | |||
|
Thereafter
|
1,125 | |||
| $ | 3,185 | |||
54
| Note 18 — Fair Values of Financial Instruments |
The following methods were used to estimate the fair value of all financial instruments recognized in the accompanying balance sheets at amounts other than fair values.
Cash and Cash Equivalents and Time Deposits
Fair values of cash and cash equivalents and time deposits approximate cost due to the short period of time to maturity.
Notes Payable and Long-term Debt
The Company believes the carrying value of short-term debt, including current portion of long-term debt, and long-term debt adequately reflects the fair value of these instruments.
The following table presents estimated fair values of the Company’s financial instruments in accordance with FASB ASC 480 at December 25, 2010 and December 26, 2009.
|
In Thousands
|
2010 | 2009 | ||||||||||||||
|
Carrying
Amount |
Fair Value
|
Carrying
Amount |
Fair Value
|
|||||||||||||
|
Financial assets
|
||||||||||||||||
|
Cash and cash equivalents
|
$ | 1,536 | $ | 1,536 | $ | 3,039 | $ | 3,039 | ||||||||
|
Time deposits
|
$ | 1,250 | $ | 1,250 | $ | 750 | $ | 750 | ||||||||
|
Financial liabilities
|
||||||||||||||||
|
Note payable and Short-term debt
|
$ | 9,407 | $ | 9,407 | $ | 27,644 | $ | 27,644 | ||||||||
|
Current portion of Long-term debt
|
$ | 2,000 | $ | 2,000 | $ | — | $ | — | ||||||||
|
Long-term debt
|
$ | 7,500 | $ | 7,500 | $ | — | $ | — | ||||||||
55
Signatures
Pursuant to the requirements of Section 13 or 15(d) of the Securities Exchange Act of 1934, the Registrant has duly caused this report to be signed on its behalf by the undersigned, thereunto duly authorized.
|
ESCALADE, INCORPORATED
|
|
|
By:
|
|
|
/s/ Robert. Keller
|
March 1, 2011
|
|
Robert J. Keller
|
|
|
President and Chief Executive Officer
|
Pursuant to the requirements of the Securities Exchange Act of 1934, this report has been signed below by the following persons on behalf of the Registrant and in the capacities and on the dates indicated.
|
/s/ Robert E. Griffin
|
Chairman and Director
|
March 1, 2011
|
|
|
Robert E. Griffin
|
|||
|
/s/ Edward E. Williams
|
Director
|
March 1, 2011
|
|
|
Edward E. Williams
|
|||
|
/s/ Richard D. White
|
Director
|
March 1, 2011
|
|
|
Richard D. White
|
|||
|
/s/ George Savitsky
|
Director
|
March 1, 2011
|
|
|
George Savitsky
|
|||
|
/s/ Richard Baalmann, Jr.
|
Director
|
March 1, 2011
|
|
|
Richard Baalmann, Jr.
|
|||
|
/s/ Patrick Griffin
|
Director and President Martin Yale Global
|
March 1, 2011
|
|
|
Patrick Griffin
|
|||
|
/s/ Robert J. Keller
|
Director and President and Chief Executive Officer (Principal Executive Officer)
|
March 1, 2011
|
|
|
Robert J. Keller
|
|||
|
/s/ Deborah J. Meinert
|
Vice President and Chief Financial Officer (Principal Financial and Accounting Officer)
|
March 1, 2011
|
|
|
Deborah J. Meinert
|
56