Attached files
Table of Contents
UNITED STATES
SECURITIES AND EXCHANGE COMMISSION
Washington, D.C. 20549
(Mark One)
FORM 10 – K
| x | ANNUAL REPORT PURSUANT TO SECTION 13 OR 15(d) OF THE SECURITIES EXCHANGE ACT OF 1934 |
For the fiscal year ended December 31, 2010
OR
| ¨ | TRANSITION REPORT PURSUANT TO SECTION 13 OR 15(d) OF THE SECURITIES EXCHANGE ACT OF 1934 |
For the transition period from to
Commission File Number 001-34658
THE BABCOCK & WILCOX COMPANY
(Exact name of registrant as specified in its charter)
| DELAWARE | 80-0558025 | |
| (State or Other Jurisdiction of Incorporation or Organization) |
(I.R.S. Employer Identification No.) | |
| THE HARRIS BUILDING 13024 BALLANTYNE CORPORATE PLACE SUITE 700 CHARLOTTE, NORTH CAROLINA |
28277 | |
| (Address of Principal Executive Offices) | (Zip Code) | |
|
Registrant’s Telephone Number, Including Area Code: (704) 625-4900 | ||
|
Securities Registered Pursuant to Section 12(b) of the Act:
| ||
| Title of each class |
Name of each Exchange on which registered | |
| Common Stock, $0.01 par value | New York Stock Exchange | |
Securities registered pursuant to Section 12(g) of the Act: None
Indicate by check mark if the registrant is a well-known seasoned issuer, as defined in Rule 405 of the Securities Act. Yes ¨ No x
Indicate by check mark if the registrant is not required to file reports pursuant to Section 13 or Section 15(d) of the Exchange Act. Yes ¨ No x
Indicate by check mark whether the registrant (1) has filed all reports required to be filed by Section 13 or 15(d) of the Securities Exchange Act of 1934 during the preceding 12 months (or for such shorter period that the registrant was required to file such reports), and (2) has been subject to such filing requirements for the past 90 days. Yes x No ¨
*The registrant became subject to such requirements on July 8, 2010.
Indicate by check mark whether the registrant has submitted electronically and posted on its corporate Web site, if any, every Interactive Data File required to be submitted and posted pursuant to Rule 405 of Regulation S-T (§232.405 of this chapter) during the preceding 12 months (or for such shorter period that the registrant was required to submit and post such files). Yes ¨ No ¨
Indicate by check mark if disclosure of delinquent filers pursuant to Item 405 of Regulation S-K is not contained herein and will not be contained, to the best of registrant’s knowledge, in definitive proxy or information statements incorporated by reference in Part III of this Form 10-K or any amendment to this Form 10-K. ¨
Indicate by check mark whether the registrant is a large accelerated filer, an accelerated filer, a non-accelerated filer, or a smaller reporting company. See definition of “large accelerated filer,” “accelerated filer” and “smaller reporting company” in Rule 12b-2 of the Exchange Act. (Check one):
| Large accelerated filer ¨ |
Accelerated filer ¨ | |||
| Non-accelerated filer x |
Smaller reporting company ¨ |
Indicate by check mark whether the registrant is a shell company (as defined in Rule 12b-2 of the Exchange Act). Yes ¨ No x
As of June 30, 2010, the registrant’s common stock was not publicly traded. The number of shares of the registrant’s common stock outstanding at January 31, 2011 was 116,897,549.
DOCUMENTS INCORPORATED BY REFERENCE
Portions of the registrant’s proxy statement for the 2011 Annual Meeting of Stockholders are incorporated by reference into Part III of this Form 10-K.
Table of Contents
INDEX—FORM 10-K
| PAGE | ||||
| PART I | ||||
| Item 1. |
Business | 1 | ||
| 1 | ||||
| 1 | ||||
| 1 | ||||
| 4 | ||||
| 5 | ||||
| 6 | ||||
| 7 | ||||
| 7 | ||||
| 9 | ||||
| 10 | ||||
| 10 | ||||
| 11 | ||||
| 11 | ||||
| 11 | ||||
| 11 | ||||
| 13 | ||||
| 15 | ||||
| 18 | ||||
| Item 1A. |
Risk Factors | 18 | ||
| Item 1B. |
Unresolved Staff Comments | 36 | ||
| Item 2. |
Properties | 36 | ||
| Item 3. |
Legal Proceedings | 37 | ||
| Item 4. |
Reserved | 37 | ||
| PART II | ||||
| Item 5. |
Market for Registrant’s Common Equity, Related Stockholder Matters and Issuer Purchases of Equity Securities | 38 | ||
| Item 6. |
Selected Financial Data | 40 | ||
| Item 7. |
Management’s Discussion and Analysis of Financial Condition and Results of Operations | 40 | ||
| 40 | ||||
| 42 | ||||
| Year Ended December 31, 2010 Compared to Year Ended December 31, 2009 |
46 | |||
| Year Ended December 31, 2009 Compared to Year Ended December 31, 2008 |
49 | |||
| 51 | ||||
| 51 | ||||
| Item 7A. |
Quantitative and Qualitative Disclosures about Market Risk | 55 | ||
| Item 8. |
Financial Statements and Supplementary Data | 57 | ||
| 58 | ||||
| Consolidated and Combined Balance Sheets – December 31, 2010 and December 31, 2009 |
59 | |||
| Consolidated and Combined Statements of Income for the Years Ended |
61 | |||
| 62 | ||||
i
Table of Contents
ii
Table of Contents
Statements we make in this Annual Report on Form 10-K, which express a belief, expectation or intention, as well as those that are not historical fact, are forward-looking statements within the meaning of the Private Securities Litigation Reform Act of 1995. These forward-looking statements are subject to various risks, uncertainties and assumptions, including those to which we refer under the headings “Cautionary Statement Concerning Forward-Looking Statements” and “Risk Factors” in Items 1 and 1A of Part I of this report. In this annual report on Form 10-K, unless the context otherwise indicates, “we,” “us” and “our” mean The Babcock & Wilcox Company (“B&W”) and its consolidated subsidiaries.
| Item 1. | BUSINESS |
B&W is a leading technology innovator in power generation systems, a specialty constructor of nuclear components and a premier service provider in its segments, with an operating history of more than 140 years. We provide a variety of products and services to customers in the power and other steam-using industries, including electric utilities and other power generators, industrial customers in various other industries, and the United States Government. While we provide a wide range of products and services, our business segments are heavily focused on major projects. At any given time, a relatively small number of projects can represent a significant part of our operations.
We are a successor to a business founded in 1867, which was acquired by McDermott International, Inc. (“MII”) in 1978. On December 7, 2009, MII announced its plans to spin-off the businesses that comprised its then power generation systems and government operations segments into a separate independent public company. To effect the spin-off, MII incorporated B&W in Delaware in March 2010 as a direct wholly owned subsidiary of MII and in June 2010 implemented a reorganization that combined all of the entities that made up those businesses under our company.
On July 2, 2010, MII’s Board of Directors approved the spin-off of B&W through the distribution of shares of B&W common stock to holders of MII common stock. The distribution of B&W common stock was made on July 30, 2010, and consisted of one share of B&W common stock for every two shares of MII common stock to holders of MII common stock as of 5:00 p.m. New York City time on the record date, July 9, 2010. Cash was paid in lieu of any fractional shares of B&W common stock. B&W became a separate publicly traded company, and MII did not retain any ownership interest in us. B&W’s common stock is listed on the New York Stock Exchange under the trading symbol BWC.
We operate in two business segments: Power Generation Systems and Government Operations. For financial information about our segments, see Note 17 to our consolidated and combined financial statements included in this report.
Power Generation Systems
Our Power Generation Systems segment includes the business and operations of Babcock & Wilcox Power Generation Group, Inc. (“B&W PGG”) and Babcock & Wilcox Nuclear Energy, Inc. (“B&W NE”) and their respective subsidiaries. Through this segment, we supply boilers fired with fossil fuels, such as coal, oil and natural gas, or renewable fuels such as biomass, municipal solid waste and concentrated solar energy. In addition, we supply commercial nuclear steam generators and components, environmental equipment and components, and related inspection and maintenance services to customers in different regions around the world. We design, engineer, manufacture, supply, construct and service large utility and industrial power generation systems, including boilers used to generate steam in electric power plants, pulp and paper making, chemical and process applications and other industrial uses.
1
Table of Contents
This segment specializes in engineering, manufacturing, procurement, and erection of equipment used in the power generation industry and various other industries, and the provision of related services, including:
| • | engineered-to-order services, products and systems for energy conversion worldwide and related auxiliary equipment, such as burners, pulverizers, soot blowers and ash handling systems; |
| • | heavy-pressure equipment for energy conversion, such as boilers fueled by coal, oil, bitumen, natural gas, solid municipal waste, biomass and other fuels; |
| • | steam generators, heat exchangers and reactor vessel closure heads for commercial nuclear power plants; |
| • | small modular reactors for nuclear power; |
| • | outage related inspection, maintenance and construction services for nuclear generating stations; |
| • | environmental control systems, including both wet and dry scrubbers for flue gas desulfurization, modules for selective catalytic reduction of the oxides of nitrogen, equipment to capture particulate matter, such as fabric filter baghouses and wet and dry electrostatic precipitators, and similar devices; and |
| • | power plant equipment and related heavy mechanical erection services. |
For further details regarding our Power Generation Systems segment’s facilities, see Item 2, “Properties.”
We support fossil and nuclear operating plants with a wide variety of additional services, including the installation of new systems and replacement parts, engineering services, construction, inspection, maintenance and field technical services, such as condition assessments and inventory services. Our wide range of construction and installation services include erection of utility and industrial boiler plants, modifications to nuclear power plants and installations of cogeneration facilities and pollution control equipment, such as selective catalytic reduction systems and flue gas desulfurization scrubbers.
We also provide power through cogeneration, refuse-fueled power plants and other independent power-producing facilities. In this market, we own and operate proprietary facilities, supply equipment and serve as contractors for engineer-procure-construct services and operations and maintenance.
We also expect to have increased participation in commercial nuclear projects and related opportunities in the future, through B&W NE. This subsidiary was formed to consolidate our specialized engineering, services and manufacturing capabilities within a dedicated organization focused on nuclear utility customers.
To further serve the nuclear power industry, through B&W NE, we are developing the B&W mPower™ reactor, a small modular reactor design with the flexibility to provide between 125 MW to 1,000 MW of electrical power generation (in increments of 125 MW) and the capacity to operate for a four or five-year operating cycle without refueling. We intend to seek U.S. Nuclear Regulatory Commission (“NRC”) certification of the B&W mPower™ reactor in time to begin deploying this technology as early as 2020. We intend to build the nuclear reactor modules in our manufacturing facilities and transport them to customer sites for installation. The modular and scalable design of the B&W mPower™ reactor should allow us to match the generation needs of our customers with the proven performance of existing light water reactor technology. We believe the B&W mPower™ reactor will reduce risks associated with deploying nuclear power and become a flexible, cost-effective solution for meeting increasing electricity needs. Through an alliance with Bechtel Power, we intend to offer integrated nuclear power plants utilizing B&W mPower™ reactors.
Our Power Generation Systems segment’s overall activity depends mainly on the capital expenditures of electric power generating companies and other steam-using industries. Several factors influence these expenditures, including:
| • | prices for electricity, along with the cost of production and distribution; |
2
Table of Contents
| • | prices for coal and natural gas and other sources used to produce electricity; |
| • | demand for electricity, paper and other end products of steam-generating facilities; |
| • | availability of other sources of electricity, paper or other end products; |
| • | requirements for environmental improvements; |
| • | impact of potential regional, state, national and/or global requirements to significantly limit or reduce greenhouse gas emissions in the future; |
| • | level of capacity utilization at operating power plants, paper mills and other steam-using facilities; |
| • | requirements for maintenance and upkeep at operating power plants and paper mills to combat the accumulated effects of wear and tear; |
| • | ability of electric generating companies and other steam users to raise capital; and |
| • | relative prices of fuels used in boilers, compared to prices for fuels used in gas turbines and other alternative forms of generation. |
Our Power Generation Systems segment’s products and services are capital intensive. As such, customer demand is heavily affected by the variations in our customers’ business cycles and by the overall economies of the countries in which they operate.
Government Operations
Our Government Operations segment includes the business and operations of Babcock & Wilcox Nuclear Operations Group, Inc. and Babcock & Wilcox Technical Services Group, Inc. (“B&W TSG”) and their respective subsidiaries. Through this segment, we manufacture nuclear components and provide various services to the U.S. Government, including uranium processing, environmental site restoration services and management and operating services for various U.S. Government-owned facilities. These services are provided to the U.S. Department of Energy (“DOE”), including the National Nuclear Security Administration (the “NNSA”), the Office of Nuclear Energy, the Office of Science and the Office of Environmental Management.
We have over 50 years of experience in the ownership and operation of large nuclear development, production and reactor facilities. This segment’s principal operations include:
| • | providing precision manufactured naval nuclear components and reactors for the U.S. Government DOE/NNSA Naval Nuclear Propulsion Program; |
| • | managing and operating nuclear production facilities; |
| • | managing and operating environmental management sites; |
| • | managing spent nuclear fuel and transuranic waste for the DOE; |
| • | providing critical skills and resources for DOE sites; and |
| • | developing and deploying next generation technology in support of U.S. Government programs. |
For further details regarding our Government Operations segment’s facilities, see Item 2, “Properties.”
Our Government Operations segment specializes in the design and manufacture of close-tolerance and high-quality equipment for nuclear applications. In addition, we are a leading manufacturer of critical nuclear components, fuels and assemblies for government and commercial uses. We have supplied nuclear components for DOE programs since the 1950s, and we are the largest domestic supplier of research reactor fuel elements for colleges, universities and national laboratories. We also convert or downblend high-enriched uranium into low-enriched fuel for use in commercial reactors to generate electricity. In addition, we have over 100 years of experience in supplying heavy fabrications for industrial use, including components for defense applications.
3
Table of Contents
We work closely with the DOE-supported nuclear non-proliferation program. Currently, this program is assisting in the development of a high-density, low-enriched uranium fuel required for high-enriched uranium test reactor conversions. We have also been a leader in the receipt, storage, characterization, dissolution, recovery and purification of a variety of uranium-bearing materials. All phases of uranium downblending and uranium recovery are provided at our Lynchburg, Virginia and Erwin, Tennessee sites.
We manage and operate complex, high-consequence nuclear and national security operations for the DOE and the NNSA, primarily through our joint ventures, as further discussed under the caption “Joint Ventures” below. In addition, a subsidiary of B&W TSG was awarded in 2007 a contract from USEC Inc., a leading low enriched uranium supplier, to manufacture classified metal parts for the American Centrifuge Program.
We have an experienced staff of design and manufacturing engineers capable of performing full scope, prototype design work coupled with manufacturing integration. The design, engineering and other capabilities of our Government Operations segment include:
| • | steam separation equipment design and development; |
| • | thermal-hydraulic design of reactor plant components; |
| • | structural component design for precision manufacturing; |
| • | materials expertise in high-strength, low-alloy steels, and nickel-based materials; |
| • | material procurement of tubing, forgings and weld wire; and |
| • | metallographic and chemical analysis. |
Our Government Operations segment’s operations are generally capital intensive on the manufacturing side. The demand for nuclear components by the U.S. Government determines a substantial portion of this segment’s backlog. We expect that orders for nuclear components will continue to be a significant part of backlog for the foreseeable future; however, such orders are subject to defense department budget constraints.
During 2010, we completed acquisitions and our initial investment in USEC Inc. (“USEC”) for total cash costs of approximately $67.5 million net of cash acquired. During 2009, we completed acquisitions totaling approximately $8.5 million, net of cash acquired. The following is a brief description:
Acquisitions
GE Energy Businesses. In April 2010, we acquired the assets of the electrostatic precipitator aftermarket and emissions monitoring business units of GE Energy, a division of General Electric Company, for approximately $21.4 million. This acquisition includes GE Energy’s electrostatic precipitator replacement parts and mechanical components product lines, performance-enhancing hardware, controls and software, remote diagnostics equipment and emissions monitoring products and services. These products and services are used by a wide variety of power generation and industrial customers to monitor and control particulates and other emissions from power plants, factories and other facilities. These business units maintain offices in the United States in Kansas City, Missouri; Folkston, Georgia; Newport News, Virginia; and Hatfield, Pennsylvania; as well as locations in Germany and China, and operates within our Power Generation Systems segment.
Gőtaverken Miljő AB. In January 2010, a subsidiary within our Power Generation Systems segment, B&W Volund, acquired the net assets of Gőtaverken Miljő AB (GMAB), a flue gas cleaning and energy recovery company based in Gothenburg, Sweden. This business complements our B&W Volund subsidiary, which is one of the world’s leading suppliers of equipment and technologies designed to convert municipal solid waste and biomass into thermal energy.
4
Table of Contents
Instrumentacion y Mantenimiento de Calderas, S.A. In September 2009, a subsidiary within our Power Generation Systems segment, B&W de Monterrey, acquired certain assets of Instrumentacion y Mantenimiento de Calderas, S.A. This acquisition provides us with additional manufacturing capabilities in support of our Power Generation Systems segment.
Investments
USEC Inc. Investment. In May 2010, we and Toshiba Corporation signed an agreement to make a strategic investment in USEC totaling $200 million payable over three phases. In September 2010, following the satisfaction of certain conditions, including the availability to USEC’s American Centrifuge project of at least $2 billion in uncommitted funds under the DOE’s loan guarantee program for front-end nuclear fuel facilities and the establishment of a joint venture between us and USEC for supply by the joint venture of centrifuges and related equipment for the American Centrifuge project, we made a $37.5 million investment in USEC as part of a definitive agreement for us to make a total $100 million strategic investment in USEC.
In connection with our investment, we received 37,500 shares of USEC Series B-1 12.75% Convertible Preferred Stock and Warrants to purchase 3,125,000 shares of USEC Class B Common Stock at an exercise price of $7.50 per share which are exercisable between January 1, 2015 and December 31, 2016, and a seat on USEC’s board of directors.
The second phase of this strategic investment, of which our share will be $25 million, will occur when, among other things, USEC secures a conditional commitment on a $2 billion loan guarantee from the DOE. The balance of our investment, which will be $37.5 million, is conditioned, among other things, on closing the loan under the DOE’s loan guarantee program for USEC’s American Centrifuge Plant and shareholder approval of certain matters by USEC’s shareholders.
We continue to evaluate accelerated growth opportunities achievable through acquisition or consolidation, in addition to pursuing organic growth strategies.
We execute our contracts through a variety of methods, including fixed-price, cost-plus, cost-reimbursable or some combination of those methods. Contracts are usually awarded through a competitive bid process, primarily based on price. However, other factors that customers may consider include plant or equipment availability, technical capabilities of equipment and personnel, efficiency, safety record and reputation.
Fixed-price contracts are for a fixed amount to cover all costs and any profit element for a defined scope of work. Fixed-price contracts entail more risk to us because they require us to predetermine both the quantities of work to be performed and the costs associated with executing the work. See “Risk Factors – We are subject to risks associated with contractual pricing in our industries, including the risk that, if our actual costs exceed the costs we estimate on our fixed-price contracts, our profitability will decline, and we may suffer losses” in Item 1A of this report.
We have contracts that extend beyond one year. Most of our long-term contracts have provisions for progress payments. We attempt to cover anticipated increases in labor, material and service costs of our long-term contracts either through an estimate of such changes, which is reflected in the original price, or through risk-sharing mechanisms, such as escalation or price adjustments for items such as labor and commodity prices.
We generally recognize our contract revenues and related costs on a percentage-of-completion basis. Accordingly, we review contract price and cost estimates periodically as the work progresses and reflect adjustments in profit proportionate to the percentage of completion in the period when we revise those estimates. To the extent that these adjustments result in a reduction or an elimination of previously reported profits with respect to a project, we would recognize a charge against current earnings, which could be material.
5
Table of Contents
Our contracts with the U.S. Government are subject to annual funding determinations. In addition, contracts between the U.S. Government and its prime contractors usually contain standard provisions for termination at the convenience of the U. S. Government or the prime contractor. The contracts for the management and operation of U.S. Government facilities are awarded through a complex and protracted procurement process. These contracts are generally structured as five-year contracts with five-year renewal options, which are exercisable by the customer, or include provisions whereby the contract durations can be extended as a result of superior performance. These are cost-reimbursement contracts with a U.S. Government credit line with little corporate-funded working capital required. However, many new contracts currently in the bidding process and recently awarded have a different structure. While such contracts remain cost-reimbursement contracts, the contractor is required to supply working capital and be reimbursed by the U.S. Government through regular invoicing. These contracts include a fee primarily based on performance, which is evaluated annually. As a U.S. Government contractor, we are subject to federal regulations under which our right to receive future awards of new federal contracts would be unilaterally suspended or barred if we were convicted of a crime or indicted based on allegations of a violation of specific federal statutes. In addition, some of our contracts with the U.S. Government require us to provide advance notice in connection with any contemplated sale or shut down of the relevant facility. In each of those situations, the U.S. Government has an exclusive right to negotiate a mutually acceptable purchase of the facility.
Our arrangements with customers frequently require us to provide letters of credit, bid and performance bonds or guarantees to secure bids or performance under contracts. While these letters of credit, bonds and guarantees may involve significant dollar amounts, historically, there have been no material payments to our customers under these arrangements.
In the event of a contract deferral or cancellation, we generally would be entitled to recover costs incurred, settlement expenses and profit on work completed prior to deferral or termination. Significant or numerous cancellations could adversely affect our business, financial condition, results of operations and cash flows.
Backlog represents the dollar amount of revenue we expect to recognize in the future from contracts awarded and in progress. Not all of our expected revenue from a contract award is recorded in backlog for a variety of reasons, including projects awarded and completed within the same fiscal quarter.
Backlog is not a measure defined by generally accepted accounting principles, and our methodology for determining backlog may not be comparable to the methodology used by other companies in determining their backlog amounts. Backlog may not be indicative of future operating results, and projects in our backlog may be cancelled, modified or otherwise altered by customers.
We generally include expected revenue of contracts in our backlog when we receive written confirmation from our customers.
Our backlog at December 31, 2010 and 2009 was as follows:
| December 31, 2010 | December 31, 2009 | |||||||||||||||
| (Unaudited) (Dollars in millions) |
||||||||||||||||
| Power Generation Systems |
$ | 2,049 | 39 | % | $ | 1,974 | 42 | % | ||||||||
| Government Operations |
3,153 | 61 | % | 2,766 | 58 | % | ||||||||||
| Total Backlog |
$ | 5,202 | 100 | % | $ | 4,740 | 100 | % | ||||||||
6
Table of Contents
Of the December 31, 2010 backlog, we expect to recognize revenues as follows:
| 2011 | 2012 | Thereafter | ||||||||||
| (Unaudited) (In approximate millions) |
||||||||||||
| Power Generation Systems |
$ | 900 | $ | 300 | $ | 849 | ||||||
| Government Operations |
1,030 | 800 | 1,323 | |||||||||
| Total Backlog |
$ | 1,930 | $ | 1,100 | $ | 2,172 | ||||||
As of December 31, 2010, our backlog with the U.S. Government, primarily attributable to our Government Operations segment, was $3.1 billion (of which $381.1 million had not yet been funded), or approximately 60% of our total consolidated backlog. We do not include the value of our unconsolidated joint venture management and operating contracts in backlog. See Note 3 to our consolidated and combined financial statements included in this report for financial information on our equity method investments.
During the year ended December 31, 2010, the U.S. Government awarded new orders of approximately $1.4 billion to us, primarily in our Government Operations segment. New awards from the U.S. Government are typically received by our Government Operations segment during the fourth quarter of each year.
The competitive environments in which each segment operates are described below:
Power Generation Systems. With more than 140 years of experience, we are in a strong position to provide some of the most advanced steam generating equipment, emissions control equipment and services. Having supplied worldwide capacity of more than 300,000 megawatts and some of the world’s largest and most efficient steam generating systems, we have a competitive advantage in our experience and technical capability to reliably convert a wide range of fuels to steam. Our strong, installed base in North America also yields competitive advantages in after-market services, although this share of the market is pressured by lower level suppliers. Through this segment, we compete with a number of domestic and foreign-based companies specializing in steam-generating systems technology, equipment and services, including Alstom S.A., Doosan Babcock, Babcock Power, Inc., Foster Wheeler Ltd., AREVA Inc., Westinghouse, Mitsubishi Heavy Industries and Hitachi, Ltd.; a variety of engineering and construction companies with respect to the installation of steam-generating systems; a number of additional companies in the markets for environmental control equipment and related specialized industrial equipment and in the independent power-producing business; and other suppliers of replacement parts, repair and alteration services and other services required to retrofit and maintain existing steam systems. The primary bases of competition for this segment are price, technical capabilities, quality, timeliness of performance and willingness to accept project risks.
Government Operations. We have specialized technical capabilities that have allowed us to be a valued supplier of nuclear components for the U.S. Government since the 1950s. Also, through this segment, we are engaged in a highly competitive business through our management and operation of U.S. Government facilities. Many of our government contracts are bid as a joint venture, with one or more companies, in which we may have a majority or a minority position. The performance of the prime or lead contractor can impact our reputation and our future competitive position with respect to that particular project and customer. Our primary competitors in the delivery of goods and services to the U.S. Government and the operation of U.S. Government facilities include Bechtel National, Inc., URS Corporation, CH2M Hill, Inc., Fluor Corporation, Lockheed Martin Corporation, Jacobs Engineering Group, Inc., EnergySolutions, Inc. and Northrop Grumman Corporation. In this segment, we compete on the basis of price, performance and technical capabilities.
We participate in the ownership of a variety of entities with third parties, primarily through corporations, limited liability companies and partnerships, which we refer to as “joint ventures.” Our Power Generation
7
Table of Contents
Systems segment enters into joint ventures primarily to enhance its manufacturing, design and production operations. Our Government Operations segment manages and operates nuclear facilities and associated plant infrastructure, manufactures components and assembles/dismantles nuclear devices, constructs large capital facilities, provides safeguards and security for inventory and assets, supports and conducts research and development for advanced energy technology and manages environmental programs for the DOE and the NNSA through joint ventures. We generally account for our investments in joint ventures under the equity method of accounting. Certain of our joint ventures are described below.
Power Generation Systems
| • | Ebensburg Power Company & Ebensburg Investors Limited Partnership. Through these entities, which were formed by subsidiaries within our Power Generation Systems segment and ESI Energy, Inc. in 1992, we own an interest in and operate a combined solid waste and cogeneration facility located in Cambria County near Ebensburg, Pennsylvania. This facility uses bituminous waste coal for its primary fuel and sells generated electricity to a utility and steam to a hospital. |
| • | Halley & Mellowes Pty. Ltd. Diamond Power International, Inc., one of our wholly owned subsidiaries, owns an interest in this Australian company, which was formed in 1984. Halley & Mellowes Pty. Ltd. sells soot blowers, boiler cleaning equipment, valves and material handling equipment, all of which are complementary to Diamond Power’s product lines. |
| • | Babcock & Wilcox Beijing Company, Ltd. We own equal interests in this entity with Beijing Jingcheng Machinery Electric Holding Company, Ltd. Babcock & Wilcox Beijing Company, Ltd. was formed in 1986 and is located in Beijing, China. Its main activities are the design, manufacturing, production and sale of various power plant and industrial boilers. It operates the largest heavy drum shop in northern China. This entity expands our markets internationally and provides additional capacity to our Power Generation Systems segment’s boiler business. |
| • | Thermax Babcock & Wilcox Energy Solutions. In June 2010, one of our subsidiaries and Thermax Ltd., a boiler manufacturer based in India, formed a joint venture to build subcritical and highly efficient supercritical boilers and pulverizers for the Indian utility boiler market. We intend to license to the joint venture our technology for subcritical boilers 300 MW and larger, highly efficient supercritical boilers and coal pulverizers. The joint venture has purchased land on which it expects to construct a new 3,000 MW pressure parts facility in India. |
Government Operations
| • | Pantex Plant. Through Babcock & Wilcox Technical Services Pantex, LLC, a limited liability company we formed with Honeywell International Inc. and Bechtel National, Inc., we manage and operate the Pantex Plant for the DOE. The Pantex Plant is located on a 16,000-acre NNSA site near Amarillo, Texas. Key operations at this facility include evaluating, retrofitting and repairing nuclear devices; dismantling and sanitizing nuclear devices; developing, testing and fabricating high-explosive components; and handling and storing plutonium pits. |
| • | Y-12 National Security Complex. Through Babcock & Wilcox Technical Services Y-12, LLC, a limited liability company we formed with Bechtel National, Inc. and in which we own a majority interest, we manage and operate the Y-12 Complex for the DOE. Y-12 is located on an 811-acre NNSA site in Oak Ridge, Tennessee. Operations at the site focus on the production, refurbishment and dismantlement of nuclear devices, storage of nuclear material and the prevention of the proliferation of weapons of mass destruction. |
| • | Strategic Petroleum Reserve. Since 1993, this facility has been managed and operated by DM Petroleum Operations Company, an entity we co-own with DynCorp International, International-Matex Tank and Terminals and Jacobs Engineering Group, Inc. The Strategic Petroleum Reserve stores an emergency supply of crude oil at four sites in huge underground salt caverns along the Texas and Louisiana Gulf Coast. |
8
Table of Contents
| • | Los Alamos National Laboratory. Since 2006, the Los Alamos National Security, LLC, a limited liability company formed in 2005 with the University of California, Bechtel National Inc., URS Corporation and B&W Technical Services Group, Inc., has managed and operated the Los Alamos National Laboratory, a premier national security research institution, delivering scientific and engineering solutions for the nation’s most crucial and complex problems. Located in New Mexico, the Los Alamos National Laboratory conducts ongoing research and development on the measures necessary for certifying the safety and reliability of nuclear devices without the use of nuclear testing for the U.S. Government. |
| • | Lawrence Livermore National Laboratory. Lawrence Livermore National Security, LLC, a limited liability company formed in 2006 with the University of California, Bechtel National Inc., URS Corporation and B&W Technical Services Group, Inc., manages and operates Lawrence Livermore National Laboratory located in Livermore, California. The laboratory serves as a national resource in science and engineering, focused on national security, energy, the environment and bioscience, with special responsibility for nuclear devices. |
| • | Savannah River Liquid Waste Disposition Program. In July 2009, Savannah River Remediation, a limited liability company formed by URS Corporation, Bechtel National Inc., CH2M Hill Constructors, Inc. and B&W Technical Services Group, Inc., became the liquid waste contractor for the DOE’s Savannah River Site located in Aiken, South Carolina. The objective of the liquid waste contract is to achieve closure of the Savannah River Site liquid waste tanks in compliance with the Federal Facilities Agreement, utilizing the Defense Waste Processing Facility and Saltstone Facility. |
| • | Nevada Test Site. In 2006, National Security Technologies, LLC (“NSTec”), a limited liability company formed by Northrop Grumman Corporation, AECOM, CH2M Hill and Nuclear Fuel Services, Inc. (“NFS”), one of our wholly owned subsidiaries) began management and operation at the Nevada Test Site and its related facilities and laboratories for the DOE. Located in Las Vegas, Nevada, NSTec works on projects for other federal agencies such as the Defense Threat Reduction Agency, NASA, the NRC and the U.S. Air Force, Army, and Navy. Missions include defense experimentation and stockpile stewardship, homeland security and defense applications and environmental management. |
| • | Isotek Systems. Isotek Systems, LLC is a limited liability company formed by EnergySolutions, Inc., NFS and Burns and Roe Enterprises, Inc. Isotek received a contract in 2003 from the DOE to downblend enriched uranium-233 and extract isotopes that show promise in the treatment of deadly cancers at the Oak Ridge National Laboratory in Oak Ridge, Tennessee. This contract is part of an initiative to clean up Cold War legacy sites. |
| • | Decontamination & Decommissioning Services. B&W Shaw Remediation, LLC is a limited liability company formed by B&W TSG, and Shaw Environmental & Infrastructure Inc. to provide environmental remediation services for the Bechtel Marine Propulsion Corporation at the Knolls Atomic Power Laboratory in New York, the Bettis Atomic Power Laboratory in Pennsylvania, and the Naval Reactor Facility in Idaho. |
| • | Portsmouth Gaseous Diffusion Plant D&D. Fluor B&W Portsmouth, LLC is a limited liability company formed by Fluor Federal Services, Inc. and B&W TSG, to provide decontamination and decommissioning services at the Portsmouth plant in Ohio. |
| • | Uranium Conversion Operations. B&W Conversion Services, LLC is a limited liability company formed by B&W TSG, and URS Corporation to perform uranium conversion operations at the Paducah Gaseous Diffusion Plant in Kentucky, and the Portsmouth Gaseous Diffusion Plant in Ohio. |
Our Government Operations segment generates substantially all of its revenues from customers within the U.S. We have foreign operations in our Power Generation Systems segment primarily attributable to our
9
Table of Contents
Canadian operations, which serves the North American electric utility and industrial power markets, and the global nuclear utility market; our operations in Denmark, which provide comprehensive services to companies in the waste to energy sectors of power generation; and our joint venture in China, which primarily serves the power generation needs of the China domestic and other utility markets. The functional currency of these entities is not the U.S. Dollar, and as a result, we are subject to exchange rate fluctuations that impact our financial position, results of operations and cash flows. Our Power Generation Systems segment revenues, net of intersegment revenues, and income derived from operations located outside of the United States, as well as the approximate percentages of our total consolidated and combined revenues and total consolidated and combined segment income, respectively, for each of the last three years were as follows (dollars in thousands):
| Revenues | Segment Income | |||||||||||||||
| Amount | Percent of Consolidated |
Amount | Percent of Consolidated |
|||||||||||||
| Year ended December 31, 2010 |
$ | 539,548 | 20 | % | $ | 92,351 | 33 | % | ||||||||
| Year ended December 31, 2009 |
$ | 483,408 | 17 | % | $ | 72,311 | 23 | % | ||||||||
| Year ended December 31, 2008 |
$ | 526,080 | 15 | % | $ | 72,197 | 15 | % | ||||||||
For additional information on the geographic distribution of our revenues, see Note 17 to our consolidated and combined financial statements included in this report.
We provide our products and services to a diverse customer base, including utilities and other power producers, businesses in various process industries, such as pulp and paper mills, petrochemical plants, oil refineries and steel mills and the U.S. Government. Our five largest customers, as a percentage of our total consolidated and combined revenues, during the years ended December 31, 2010 and 2009 were as follows:
| Year Ended December 31, 2010: |
||||
| U. S. Government |
39 | % | ||
| American Electric Power Company, Inc. |
7 | % | ||
| First Energy Corp. |
3 | % | ||
| Bruce Power, L.P. |
3 | % | ||
| Palm Beach Energy Authority |
2 | % | ||
| Year Ended December 31, 2009: |
||||
| U. S. Government |
33 | % | ||
| American Electric Power Company, Inc. |
6 | % | ||
| First Energy Corp. |
3 | % | ||
| Bruce Power, L.P. |
3 | % | ||
| United States Enrichment Corporation |
2 | % |
The U.S. Government is the primary customer of our Government Operations segment, comprising 97% and 92% of segment revenues for the years ended December 31, 2010 and 2009, respectively.
Our non-U.S. Government customers that account for a significant portion of revenues in one year may represent an immaterial portion of revenues in subsequent years.
Our operations use raw materials, such as carbon and alloy steels in various forms and components and accessories for assembly, which are available from numerous sources. We generally purchase these raw materials and components as needed for individual contracts. Our Power Generation Systems segment does not depend on a single source of supply for any significant raw materials. Our Government Operations segment relies on several
10
Table of Contents
single-source suppliers for materials used in its products. We believe these suppliers are viable, and we and the U.S. Government expend significant effort to maintain the supplier base for our Government Operations segment.
Although shortages of some raw materials have existed from time to time, no serious shortage exists at the present time.
At December 31, 2010, we employed approximately 12,000 persons worldwide, not including approximately 10,000 joint venture employees. Approximately 3,600 of our employees were members of labor unions at December 31, 2010. Many of our operations are subject to union contracts, which we customarily renew periodically. We consider our relationships with our employees to be satisfactory.
We currently hold a large number of U.S. and foreign patents and have patent applications pending. We have acquired patents and technology licenses and granted technology licenses to others when we have considered it advantageous for us to do so. Although in the aggregate our patents and licenses are important to us, we do not regard any single patent or license or group of related patents or licenses as critical or essential to our business as a whole. In general, we depend on our technological capabilities and the application of know-how, rather than patents and licenses, in the conduct of our various businesses.
Research and Development Activities
Our principal research and development activities are managed at our research and development facility in Barberton, Ohio and are conducted primarily in Barberton, Ohio and Lynchburg, Virginia, and at our various manufacturing plants and engineering and design offices. Our Barberton facility is a world-class institution for the advancement and development of energy conversion and combustion systems, environmental emissions control processes, materials selection and manufacturing technologies for the power generation industry. Our research and development activities are related to the development and improvement of new and existing products and equipment, as well as conceptual and engineering evaluation for translation into practical applications. We charge to research and development cost the costs of research and development unrelated to specific contracts as incurred. Substantially all of these costs are in our Power Generation Systems segment and include costs related to the development of carbon capture and sequestration (“CCS”) technology and our modular nuclear reactor business, B&W mPowerTM. Research and development activities totaled $102.1 million, $78.3 million and $56.2 million in the years ended December 31, 2010, 2009 and 2008, respectively, which include amounts paid for by our customers of $32.9 million, $25.1 million and $17.7 million, respectively. We expect to continue significant spending on research and development projects, as we continue development of our CCS technology and the B&W mPowerTM reactor technology and other commercial nuclear development projects. Contractual arrangements for customer-sponsored research and development can vary on a case-by-case basis and include contracts, cooperative agreements and grants.
Our operations present risks of injury to or death of people, loss of or damage to property, and damage to the environment. We have created loss control systems to assist us in the identification and treatment of the hazard risks presented by our operations, and we endeavor to make sure these systems are effective.
As loss control measures will not always be successful, we seek to establish various means of funding losses and liability related to incidents or occurrences. We primarily seek to do this through contractual protections, including waivers of consequential damages, indemnities, caps on liability, liquidated damage provisions, and access to the insurance of other parties. We also procure insurance, operate our own captive insurance company and/or establish funded or unfunded reserves. However, none of these methods will eliminate all risks.
11
Table of Contents
Depending on competitive conditions, the nature of the work, industry custom and other factors, we may not be successful in obtaining adequate contractual protection from our customers and other parties against losses and liabilities arising out of or related to the performance of our work. The scope of the protection may be limited, may be subject to conditions and may not be supported by adequate insurance or other means of financing. In addition, we sometimes have difficulty enforcing our contractual rights with others following a material loss.
Similarly, insurance for certain potential losses or liabilities may not be available or may only be available at a cost or on terms we consider not to be economical. Insurers frequently react to market losses by ceasing to write or severely limiting coverage for certain exposures. Risks that we have frequently found difficult to cost-effectively insure against include, but are not limited to, business interruption, property losses from wind, flood and earthquake events, nuclear hazards, war and confiscation or seizure of property in some areas of the world, pollution liability, liabilities related to occupational health exposures (including asbestos), liability related to our executives participating in the management of certain outside entities, professional liability/errors and omissions coverage, the failure or unavailability of our information systems, and liability related to risk of loss of our work in progress and customer-owned materials in our care, custody and control. In cases where we place insurance, we are subject to the credit worthiness of the relevant insurer(s), the available limits of the coverage, our retention under the relevant policy, exclusions in the policy and gaps in coverage.
Our operations in designing, engineering, manufacturing, constructing and servicing nuclear power equipment and components for our commercial nuclear utility customers, subject us to various risks, including, without limitation, damage to our customer’s property and third party claims for personal injury, death and property damage. To protect against liability for damage to a customer’s property, we endeavor to obtain waivers of liability and subrogation from the customer and its insurer and are usually named as an additional insured under the utility customer’s nuclear property policy. We also attempt to cap our overall liability in our contracts. To protect against liability from claims brought by third parties, we are insured under the utility customer’s nuclear liability policies and have the benefit of the indemnity and limitation of any applicable liability provision of the Price-Anderson Act. The Price-Anderson Act limits the public liability of manufacturers and operators of licensed nuclear facilities and other parties who may be liable in respect of, and indemnifies them against, all claims in excess of a certain amount. This amount is determined by the sum of commercially available liability insurance plus certain retrospective premium assessments payable by operators of commercial nuclear reactors. For those sites where we provide environmental remediation services, we seek the same protection from our customers as we do for our other nuclear activities. The Price-Anderson Act, as amended, includes a sunset provision and requires renewal each time that it expires. Contracts that were entered into during a period of time that Price-Anderson was in full force and effect continue to receive the benefit of the Price-Anderson Act’s nuclear indemnity. The Price-Anderson Act is set to expire on December 31, 2025. We also provide nuclear fabrication and other services to the nuclear power industry in Canada. Canada’s Nuclear Liability Act generally conforms to international conventions and is conceptually similar to the Price-Anderson Act in the United States. Accordingly, indemnification protections and the possibility of exclusions under Canada’s Nuclear Liability Act are similar to those under the Price-Anderson Act in the United States.
Although we do not own or operate any nuclear reactors, we have some coverage under commercially available nuclear liability and property insurance for our facilities that are currently licensed to possess special nuclear materials. Substantially all of our Government Operations segment contracts involving nuclear materials are covered by and subject to the nuclear indemnity provisions of either the Price-Anderson Act or Public Law 85-804 which, among other things, authorizes the DOE to indemnify certain contractors when such acts would facilitate national defense. However, to the extent the value of the nuclear materials in our care, custody or control exceeds the commercially available limits of our insurance, we potentially have underinsured risk of loss for such nuclear material.
Our Government Operations segment participates in the management and operation of various U.S. Government facilities. This participation is customarily accomplished through the participation in joint ventures
12
Table of Contents
with other contractors for any given facility. These activities involve, among other things, handling nuclear devices and their components from the aging stockpile of the U.S. Government. Insurable liabilities arising from these sites are rarely protected by our or our partners’ corporate insurance programs. Instead, we rely on government contractual agreements, insurance purchased specifically for a site and certain specialized self-insurance programs funded by the U.S. Government. The U.S. Government has historically fulfilled its contractual agreement to reimburse its contractors for covered claims, and we expect it to continue this process during our participation in the administration of these facilities. However, in most of these situations in which the U.S. Government is contractually obligated to pay, the payment obligation is subject to the availability of authorized government funds. The reimbursement obligation of the U.S. Government is also conditional, and provisions of the relevant contract or applicable law may preclude reimbursement.
Our wholly owned captive insurance subsidiary provides workers’ compensation, employer’s liability, commercial general liability and automotive liability insurance to support our operations. We may also have business reasons in the future to have our insurance subsidiary accept other risks which we cannot or do not wish to transfer to outside insurance companies. These risks may be considerable in any given year or cumulatively. Our insurance subsidiary has not provided significant amounts of insurance to unrelated parties. Claims as a result of our operations could adversely impact the ability of our insurance subsidiary to respond to all claims presented.
Additionally, upon the February 22, 2006 effectiveness of the settlement relating to the Chapter 11 proceedings involving several of our subsidiaries, most of our subsidiaries contributed substantial insurance rights to the asbestos personal injury trust, including rights to (1) certain pre-1979 primary and excess insurance coverages and (2) certain of our 1979-1986 excess insurance coverage. These insurance rights provided coverage for, among other things, asbestos and other personal injury claims, subject to the terms and conditions of the policies. The contribution of these insurance rights was made in exchange for the agreement on the part of the representatives of the asbestos claimants, including the representative of future claimants, to the entry of a permanent injunction, pursuant to Section 524(g) of the U.S. Bankruptcy Code, to channel to the asbestos trust all asbestos-related claims against our subsidiaries and former subsidiaries arising out of, resulting from or attributable to their operations, and the implementation of related releases and indemnification provisions protecting those subsidiaries and their affiliates from future liability for such claims. Although we are not aware of any significant, unresolved claims against our subsidiaries and former subsidiaries that are not subject to the channeling injunction and that relate to the periods during which such excess insurance coverage related, with the contribution of these insurance rights to the asbestos personal injury trust, it is possible that we could have underinsured or uninsured exposure for non-derivative asbestos claims or other personal injury or other claims that would have been insured under these coverages had the insurance rights not been contributed to the asbestos personal injury trust.
Governmental Regulations and Environmental Matters
General
Many aspects of our operations and properties are affected by political developments and are subject to both domestic and foreign governmental regulations, including those relating to:
| • | constructing and equipping electric power and other industrial facilities; |
| • | possessing and processing special nuclear materials; |
| • | workplace health and safety; |
| • | currency conversions and repatriation; |
| • | taxation of foreign earnings and earnings of expatriate personnel; and |
| • | protecting the environment. |
13
Table of Contents
We are required by various governmental and quasi-governmental agencies to obtain certain permits, licenses and certificates with respect to our operations. The kinds of permits, licenses and certificates required in our operations depend upon a number of factors.
We cannot determine the extent to which new legislation, new regulations or changes in existing laws or regulations may affect our future operations.
Environmental
Our operations and properties are subject to a wide variety of increasingly complex and stringent foreign, federal, state and local environmental laws and regulations, including those governing discharges into the air and water, the handling and disposal of solid and hazardous wastes, the remediation of soil and groundwater contaminated by hazardous substances and the health and safety of employees. Sanctions for noncompliance may include revocation of permits, corrective action orders, administrative or civil penalties and criminal prosecution. Some environmental laws provide for strict, joint and several liability for remediation of spills and other releases of hazardous substances, as well as damage to natural resources. In addition, companies may be subject to claims alleging personal injury or property damage as a result of alleged exposure to hazardous substances. Such laws and regulations may also expose us to liability for the conduct of or conditions caused by others or for our acts that were in compliance with all applicable laws at the time such acts were performed.
These laws and regulations include the Comprehensive Environmental Response, Compensation, and Liability Act of 1980, as amended (“CERCLA”), the Clean Air Act, the Clean Water Act, the Resource Conservation and Recovery Act and similar laws that provide for responses to, and liability for, releases of hazardous substances into the environment. These laws and regulations also include similar foreign, state or local counterparts to these federal laws, which regulate air emissions, water discharges, hazardous substances and waste and require public disclosure related to the use of various hazardous substances. Our operations are also governed by laws and regulations relating to workplace safety and worker health, including the U.S. Occupational Safety and Health Act and regulations promulgated thereunder.
We are currently in the process of investigating and remediating some of our former operating sites. Although we have recorded reserves in connection with certain of these matters, due to the uncertainties associated with environmental remediation, we cannot assure you that the actual costs resulting from these remediation matters will not exceed the recorded reserves.
Our compliance with U.S. federal, state and local environmental control and protection regulations resulted in pretax charges of approximately $13.0 million in the year ended December 31, 2010. In addition, compliance with existing environmental regulations necessitated capital expenditures of $0.5 million in the year ended December 31, 2010. We expect to spend another $6.0 million on such capital expenditures over the next five years. We cannot predict all of the environmental requirements or circumstances that will exist in the future but anticipate that environmental control and protection standards will become increasingly stringent and costly. Based on our experience to date, we do not currently anticipate any material adverse effect on our business or consolidated financial condition as a result of future compliance with existing environmental laws and regulations. However, future events, such as changes in existing laws and regulations or their interpretation, more vigorous enforcement policies of regulatory agencies or stricter or different interpretations of existing laws and regulations, may require additional expenditures by us, which may be material. Accordingly, we can provide no assurance that we will not incur significant environmental compliance costs in the future.
We have been identified as a potentially responsible party at various cleanup sites under CERCLA. CERCLA and other environmental laws can impose liability for the entire cost of cleanup on any of the potentially responsible parties, regardless of fault or the lawfulness of the original conduct. Generally, however, where there are multiple responsible parties, a final allocation of costs is made based on the amount and type of wastes disposed of by each party and the number of financially viable parties, although this may not be the case with respect to any particular site. We have not been determined to be a major contributor of wastes to any of
14
Table of Contents
these sites. On the basis of our relative contribution of waste to each site, we expect our share of the ultimate liability for the various sites will not have a material adverse effect on our consolidated financial condition, results of operations or cash flows in any given year.
Environmental remediation projects have been and continue to be undertaken at certain of our current and former plant sites. During the fiscal year ended March 31, 1995, one of our subsidiaries decided to close its nuclear manufacturing facilities in Parks Township, Armstrong County, Pennsylvania (the “Parks Facilities”) and proceeded to decommission the facilities in accordance with its then-existing license from the NRC. The facilities were subsequently transferred to another subsidiary of ours in the fiscal year ended March 31, 1998, and, during the fiscal year ended March 31, 1999, that subsidiary reached an agreement with the NRC on a plan that provided for the completion of facilities dismantlement and soil restoration by 2001 and license termination in 2003. An application to terminate the NRC license for the Parks Township facility was filed, and the NRC terminated the license in 2004 and released the facility for unrestricted use. For a discussion of certain civil litigation we are involved in concerning the Parks Facilities, see Note 10 to our consolidated and combined financial statements included in this report.
We perform significant amounts of work for the U.S. Government under both prime contracts and subcontracts and operate certain facilities that are licensed to possess and process special nuclear materials. As a result of these activities, we are subject to continuing reviews by governmental agencies, including the U.S. Environmental Protection Agency (the “EPA”) and the NRC.
The NRC’s decommissioning regulations require our Government Operations segment to provide financial assurance that it will be able to pay the expected cost of decommissioning each of its facilities at the end of its service life. We provided financial assurance aggregating $41.5 million during the year ending December 31, 2010 with existing letters of credit for the ultimate decommissioning of all of these licensed facilities, except two. These two facilities, which represent the largest portion of our eventual decommissioning costs, have provisions in their government contracts pursuant to which substantially all of our decommissioning costs and financial assurance obligations are covered by the DOE, including the costs to complete the decommissioning projects underway at the Erwin facility.
The demand for power generation services and products can be influenced by state and federal governmental legislation setting requirements for utilities related to operations, emissions and environmental impacts. The legislative process is unpredictable and includes a platform that continuously seeks to increase the restrictions on power producers. Potential legislation limiting emissions from power plants, including carbon dioxide, could affect our markets and the demand for our products and services in our Power Generation Systems segment.
At December 31, 2010 and 2009, we had total environmental reserves, including provisions for the facilities discussed above, of $43.5 million and $50.3 million, respectively. Of our total environmental reserves at December 31, 2010 and 2009, $2.7 million and $2.5 million, respectively, were included in current liabilities. Inherent in the estimates of those reserves and recoveries are our expectations regarding the levels of contamination, decommissioning costs and recoverability from other parties, which may vary significantly as decommissioning activities progress. Accordingly, changes in estimates could result in material adjustments to our operating results, and the ultimate loss may differ materially from the amounts we have provided for in our consolidated and combined financial statements.
Cautionary Statement Concerning Forward-Looking Statements
We are including the following discussion to inform our existing and potential security holders generally of some of the risks and uncertainties that can affect our company and to take advantage of the “safe harbor” protection for forward-looking statements that applicable federal securities law affords.
From time to time, our management or persons acting on our behalf make forward-looking statements to inform existing and potential security holders about our company. These statements may include projections and
15
Table of Contents
estimates concerning the timing and success of specific projects and our future backlog, revenues, income and capital spending. Forward-looking statements are generally accompanied by words such as “estimate,” “project,” “predict,” “believe,” “expect,” “anticipate,” “plan,” “seek”, “goal”, “could”, “may”, or “should” or other words that convey the uncertainty of future events or outcomes. In addition, sometimes we will specifically describe a statement as being a forward-looking statement and refer to this cautionary statement.
In addition, various statements in this annual report on Form 10-K, including those that express a belief, expectation or intention, as well as those that are not statements of historical fact, are forward-looking statements. Those forward-looking statements appear in Item 1 – “Business” and Item 3 – “Legal Proceedings” in Part I of this report and in Item 7 – “Management’s Discussion and Analysis of Financial Condition and Results of Operations” and in the notes to our consolidated and combined financial statements in Item 8 of Part II of this report and elsewhere in this report.
These forward looking statements include, but are not limited to, statements that relate to, or statements that are subject to risks, contingencies or uncertainties that relate to:
| • | our business strategies; |
| • | future levels of revenues, operating margins, income from operations, net income or earnings per share; |
| • | anticipated levels of demand for our products and services; |
| • | future levels of capital, environmental or maintenance expenditures; |
| • | our beliefs regarding the timing and effects on our businesses of certain environmental legislation, rules or regulations; |
| • | the success or timing of completion of ongoing or anticipated capital or maintenance projects; |
| • | expectations regarding the acquisition or divestiture of assets and businesses; |
| • | our ability to obtain surety bonding capacity; |
| • | our ability to obtain appropriate insurance and indemnities; |
| • | timing for bringing the remaining operations of Nuclear Fuel Services, Inc. back online; |
| • | the potential effects of judicial or other proceedings on our business, financial condition, results of operations and cash flows; and |
| • | the anticipated effects of actions of third parties such as competitors, or federal, foreign, state or local regulatory authorities, or plaintiffs in litigation. |
We have based our forward-looking statements on our current expectations, estimates and projections about our industries and our company. We caution that these statements are not guarantees of future performance and you should not rely unduly on them, as they involve risks, uncertainties and assumptions that we cannot predict. In addition, we have based many of these forward-looking statements on assumptions about future events that may prove to be inaccurate. While our management considers these assumptions to be reasonable, they are inherently subject to significant business, economic, competitive, regulatory and other risks, contingencies and uncertainties, most of which are difficult to predict and many of which are beyond our control. Accordingly, our actual results may differ materially from the future performance that we have expressed or forecast in our forward-looking statements. Differences between actual results and any future performance suggested in our forward-looking statements could result from a variety of factors, including the following:
| • | general economic and business conditions and industry trends; |
| • | general developments in the industries in which we are involved; |
| • | decisions on spending by the U.S. Government and electric power generating companies; |
| • | the highly competitive nature of our businesses; |
16
Table of Contents
| • | cancellations of and adjustments to backlog and the resulting impact from using backlog as an indicator of future earnings; |
| • | our ability to perform projects on time, in accordance with the schedules established by the applicable contracts with customers; |
| • | the ability of our suppliers to deliver raw materials in sufficient quantities and in a timely manner; |
| • | volatility and uncertainty of the credit markets; |
| • | our ability to comply with covenants in our credit agreement and other debt instruments and availability, terms and deployment of capital; |
| • | the impact of our unfunded pension liabilities on liquidity, and our ability to fund such liabilities in the future, including our ability to continue being reimbursed by the U.S. Government for a portion of our pension funding obligations, which is contingent on maintaining our government contracts; |
| • | the continued availability of qualified personnel; |
| • | the operating risks normally incident to our lines of business, including the potential impact of liquidated damages; |
| • | changes in, or our failure or inability to comply with, government regulations; |
| • | adverse outcomes from legal and regulatory proceedings; |
| • | the impact of potential regional, national and/or global requirements to significantly limit or reduce greenhouse gas and other emissions in the future; |
| • | changes in, and liabilities relating to, existing or future environmental regulatory matters; |
| • | rapid technological changes; |
| • | the realization of deferred tax assets; |
| • | the consequences of significant changes in interest rates and currency exchange rates; |
| • | our ability to realize expected benefits from the spin-off; |
| • | a determination by the IRS that the spin-off or certain related transactions should be treated as a taxable transaction; |
| • | our different capital structure as an independent company, including our access to capital, credit ratings, debt and ability to raise additional financing; |
| • | difficulties we may encounter in obtaining regulatory or other necessary approvals of any strategic transactions; |
| • | the risks associated with integrating acquired businesses; |
| • | the risk we might not be successful in updating and replacing current key financial and human resources legacy systems with enterprise systems; |
| • | social, political and economic situations in foreign countries where we do business; |
| • | the possibilities of war, other armed conflicts or terrorist attacks; |
| • | the effects of asserted and unasserted claims; |
| • | our ability to obtain surety bonds, letters of credit and financing; |
| • | our ability to maintain builder’s risk, liability, property and other insurance in amounts and on terms we consider adequate and at rates that we consider economical; |
| • | our ability to successfully develop competitive new technologies and products; |
| • | the aggregated risks retained in our captive insurance subsidiary; and |
17
Table of Contents
| • | the impact of the loss of insurance rights as part of the final settlement in 2006 of the Chapter 11 proceedings involving several of our subsidiaries. |
We believe the items we have outlined above are important factors that could cause estimates in our financial statements to differ materially from actual results and those expressed in a forward-looking statement made in this report or elsewhere by us or on our behalf. We have discussed many of these factors in more detail elsewhere in this report. These factors are not necessarily all the factors that could affect us. Unpredictable or unanticipated factors we have not discussed in this report could also have material adverse effects on actual results of matters that are the subject of our forward-looking statements. We do not intend to update our description of important factors each time a potential important factor arises, except as required by applicable securities laws and regulations. We advise our security holders that they should (1) be aware that factors not referred to above could affect the accuracy of our forward-looking statements and (2) use caution and common sense when considering our forward-looking statements.
Our website address is www.babcock.com. We make available through the Investor Relations section of this website under “SEC Filings,” free of charge, our annual reports on Form 10-K, quarterly reports on Form 10-Q, current reports on Form 8-K, statements of beneficial ownership of securities on Forms 3, 4 and 5 and amendments to those reports as soon as reasonably practicable after we electronically file those materials with, or furnish those materials to, the Securities and Exchange Commission (the “SEC”). You may read and copy any materials we file with the SEC at the SEC’s Public Reference Room at 100 F Street, NE, Washington, DC 20549. You may obtain information regarding the Public Reference Room by calling the SEC at 1-800-SEC-0330. In addition, the SEC maintains a website at www.sec.gov that contains reports, proxy and information statements, and other information regarding issuers that file electronically with the SEC. We have also posted on our website our: Corporate Governance Principles; Code of Ethics for our Chief Executive Officer and Senior Financial Officers; Board of Directors Conflicts of Interest Policies and Procedures; Management, Board Members and Contact Information; By-laws; and charters for the Audit & Finance, Governance, Compensation and Safety & Security Committees of our Board.
| Item 1A. | RISK FACTORS |
Risk Factors Related to Our Business
We derive substantial revenues from electric power generating companies and other steam-using industries, with demand for our products and services depending on capital expenditures in these historically cyclical industries. Additionally, recent legislative and regulatory developments relating to greenhouse gas emissions are impacting plans for new coal-fired power plants within the United States.
The demand for power generation products and services depends primarily on the capital expenditures of electric power generating companies, paper companies and other steam-using industries. These capital expenditures are influenced by such factors as:
| • | prices for electricity, along with the cost of production and distribution; |
| • | prices for natural resources such as coal and natural gas; |
| • | demand for electricity, paper and other end products of steam-generating facilities; |
| • | availability of other sources of electricity, paper or other end products; |
| • | requirements of environmental legislation and regulation, including potential requirements applicable to carbon dioxide emissions; |
| • | levels of capacity utilization at operating power plants, paper mills and other steam-using facilities; |
| • | requirements for maintenance and upkeep at operating power plants and paper mills to combat the accumulated effects of wear and tear; |
18
Table of Contents
| • | ability of electric generating companies and other steam users to raise capital; and |
| • | total costs of electricity production using boilers compared to total costs using gas turbines and other alternative forms of generation. |
A material decline in capital expenditures by electric power generating companies, paper companies and other steam-using industries over a sustained period of time could materially and adversely affect the demand for our power generation products and services and, therefore, our financial condition, results of operations and cash flows. U.S. coal-fired power plants have been scrutinized by environmental groups and government regulators over the emissions of potentially harmful pollutants. The recent economic environment and uncertainty concerning new environmental legislation or replacement rules or regulations has caused many of our major customers, principally electric utilities, to delay making substantial capital expenditures for new plants, as well as upgrades to existing power plants. In addition, considerations surrounding greenhouse gas limits under consideration by the U.S. Congress and the EPA have delayed the construction of new coal-fired power plants in the United States. We continue to believe the EPA will revise the rules and regulations throughout 2011. We cannot predict the ultimate impact that legislative and regulatory developments in this area will have on the overall demand for our products and services.
We rely on U.S. Government contracts for a large percentage of our revenue, and some of those contracts are subject to continued appropriations by Congress and may be terminated or delayed if future funding is not made available. In addition, the U.S. Government may not renew or seek to modify our existing contracts.
For the year ended December 31, 2010, we relied on U.S. Government contracts for approximately 39% of our revenue. Government contracts are subject to various uncertainties, restrictions and regulations, including oversight audits, which could result in withholding or delaying of payments to us. In addition, some of our large, multi-year contracts with the U.S. Government are subject to annual funding determinations and the continuing availability of Congressional appropriations. Although multi-year operations may be planned in connection with major procurements, Congress generally appropriates funds on a fiscal-year basis even though a program may continue for several years. Consequently, programs often are only partially funded initially, and additional funds are committed only as Congress makes further appropriations. As a result, we are subject to ongoing uncertainties associated with U.S. Government budget restraints and other factors affecting government funding.
The U.S. Government typically can terminate or modify any of its contracts with us either for its convenience or if we default by failing to perform under the terms of the applicable contract. A termination arising out of our default could expose us to liability and have an adverse effect on our ability to compete for future contracts and orders. If any of our contracts reflected in backlog are terminated by the U.S. Government, our backlog would be reduced by the expected value of the remaining work under such contracts. In addition, on those contracts for which we are teamed with others and are not the prime contractor, the U.S. Government could terminate a prime contract under which we are a subcontractor, irrespective of the quality of our products and services as a subcontractor. The reduction or termination of funding, or changes in the timing of funding, for a U.S. Government program in which we provide products or services would result in a reduction or loss of anticipated future revenues attributable to that program and could have a negative impact on our results of operations.
We also have several significant contracts with the U.S. Government that are subject to periodic renewal and rebidding through a competitive process. If the U.S. Government fails to renew these contracts, our results of operations and cash flows would be adversely affected.
As a result of these and other factors, the termination of one or more of our significant government contracts, our suspension from government contract work, the failure of the U.S. Government to renew our existing contracts or the disallowance of the payment of our contract costs could have a material adverse effect on our financial condition, results of operations and cash flows.
19
Table of Contents
Demand for our products and services is vulnerable to economic downturns and reductions in private sector and government spending.
Demand for our products and services has been, and we expect that demand will continue to be, subject to significant fluctuations due to a variety of factors beyond our control, including economic and industry conditions. The global economic downturn that began in 2008 continued throughout 2009 and into 2010. Since 2008, concerns over inflation, energy costs, geopolitical issues, the availability and cost of credit and other market factors have contributed to increased volatility and diminished expectations for the global economy and expectations of slower global economic growth for the foreseeable future. Volatile oil prices, low business and consumer confidence and high unemployment have accompanied the global economic downturn.
As a result of the economic downturn, some of our customers have delayed, curtailed or cancelled proposed and existing projects and may continue to do so, thus decreasing the overall demand for our products and services and adversely affecting our results of operations. We have experienced delays or deferrals of proposed projects. For example, for the year ended December 31, 2010, our Power Generation Systems segment experienced a 12% decline in revenues compared to 2009. It is possible that our Power Generation Systems segment will continue to face challenges in 2011.
In addition, our Government Operations segment depends on U.S. Government funding, particularly funding levels at the DOE. Significant changes in the level of funding (for example, the annual budget of the DOE) or specifically mandated levels for individual programs that are important to our business could have an unfavorable impact on us. In addition, if Congress does not pass annual appropriations bills in a timely fashion, spending delays under our U.S. Government contracts may result. Any reduction in the level of U.S. Government funding, particularly at the DOE, may result in, among other things, a reduction in the number and scope of projects put out for bid by the U.S. Government or the curtailment of existing U.S. Government programs, either of which may result in a reduction in the number of contract award opportunities available to us, a reduction of activities at DOE sites and an increase in costs, including the costs of obtaining contract awards.
In addition, our customers may find it more difficult to raise capital in the future due to limitations on the availability of credit, increases in interest rates and other factors affecting the federal, municipal and corporate credit markets. Also, our customers may demand more favorable pricing terms and find it increasingly difficult to timely pay invoices for our services, which would impact our future cash flows and liquidity. Inflation or significant changes in interest rates could reduce the demand for our products and services. Any inability to timely collect our invoices may lead to an increase in our accounts receivables and potentially to increased write-offs of uncollectible invoices. If the economy weakens, or customer spending declines, then our backlog, revenues, net income and overall financial condition could deteriorate.
Our backlog is subject to unexpected adjustments and cancellations.
There can be no assurance that the revenues projected in our backlog will be realized or, if realized, will result in profits. Because of project cancellations or changes in project scope and schedule, we cannot predict with certainty when or if backlog will be performed. In addition, even where a project proceeds as scheduled, it is possible that contracted parties may default and fail to pay amounts owed to us or poor project performance could increase the cost associated with a project. Delays, suspensions, cancellations, payment defaults, scope changes and poor project execution could materially reduce or eliminate the revenues and profits that we actually realize from projects in backlog.
Reductions in our backlog due to cancellation or modification by a customer or for other reasons may adversely affect, potentially to a material extent, the revenues and earnings we actually receive from contracts included in our backlog. Many of the contracts in our backlog provide for cancellation fees in the event customers cancel projects. These cancellation fees usually provide for reimbursement of our out-of-pocket costs, revenues for work performed prior to cancellation and a varying percentage of the profits we would have realized had the contract been completed. However, we typically have no contractual right upon cancellation to the total
20
Table of Contents
revenues reflected in our backlog. Projects may remain in our backlog for extended periods of time. If we experience significant project terminations, suspensions or scope adjustments to contracts reflected in our backlog, our financial condition, results of operations and cash flows may be adversely impacted.
We are subject to risks associated with contractual pricing in our industries, including the risk that, if our actual costs exceed the costs we estimate on our fixed-price contracts, our profitability will decline, and we may suffer losses.
We are engaged in highly competitive industries, and we have priced a substantial number of our projects on a fixed-price basis. Our actual costs could exceed our projections. We attempt to cover the increased costs of anticipated changes in labor, material and service costs of long-term contracts, either through estimates of cost increases, which are reflected in the original contract price, or through price escalation clauses. Despite these attempts, however, the cost and gross profit we realize on a fixed-price contract could vary materially from the estimated amounts because of supplier, contractor and subcontractor performance, changes in job conditions, variations in labor and equipment productivity and increases in the cost of labor and raw materials, particularly steel, over the term of the contract. These variations and the risks generally inherent in our industries may result in actual revenues or costs being different from those we originally estimated and may result in reduced profitability or losses on projects. Some of these risks include:
| • | difficulties encountered on our large-scale projects related to the procurement of materials or due to schedule disruptions, equipment performance failures or other factors that may result in additional costs to us, reductions in revenue, claims or disputes; |
| • | our inability to obtain compensation for additional work we perform or expenses we incur as a result of customer change orders or our customers providing deficient design or engineering information or equipment or materials; |
| • | requirements to pay liquidated damages upon our failure to meet schedule or performance requirements of our contracts; and |
| • | difficulties in engaging third-party subcontractors, equipment manufacturers or materials suppliers or failures by third-party subcontractors, equipment manufacturers or materials suppliers to perform could result in project delays and cause us to incur additional costs. |
Our use of percentage-of-completion method of accounting could result in volatility in our results of operations.
We recognize revenues and profits under our long-term contracts on a percentage-of-completion basis. Accordingly, we review contract price and cost estimates periodically as the work progresses and reflect adjustments proportionate to the percentage of completion in income in the period when we revise those estimates. To the extent these adjustments result in a reduction or an elimination of previously reported profits with respect to a project, we would recognize a charge against current earnings, which could be material. Our current estimates of our contract costs and the profitability of our long-term projects, although reasonably reliable when made, could change as a result of the uncertainties associated with these types of contracts, and if adjustments to overall contract costs are significant, the reductions or reversals of previously recorded revenue and profits could be material in future periods.
Maintaining adequate bonding and letter of credit capacity is necessary for us to successfully bid on and win various contracts.
In line with industry practice, we are often required to post standby letters of credit and surety bonds to support contractual obligations to customers as well as other obligations. These letters of credit and bonds generally indemnify customers should we fail to perform our obligations under the applicable contracts. If a letter of credit or bond is required for a particular project and we are unable to obtain it due to insufficient liquidity or other reasons, we will not be able to pursue that project. We utilize bonding facilities, but, as is typically the case,
21
Table of Contents
the issuance of bonds under each of those facilities is at the surety’s sole discretion. In addition, we have limited capacity under our credit facility for letters of credit. Moreover, due to events that affect the insurance and bonding and credit markets generally, bonding and letters of credit may be more difficult to obtain in the future or may only be available at significant additional cost. There can be no assurance that letters of credit or bonds will continue to be available to us on reasonable terms. Our inability to obtain adequate letters of credit and bonding and, as a result, to bid on new work could have a material adverse effect on our business, financial condition and results of operations. As of December 31, 2010, we had $259.0 million in letters of credit and bank guarantees, and $155.1 million in surety bonds outstanding.
Volatility and uncertainty of the credit markets may negatively impact our ability to obtain financing.
We intend to finance our existing operations and initiatives with cash and cash equivalents, cash flows from operations, and potential borrowings, including under our revolving credit facility. In the past several years, the credit markets and the financial services industry have been experiencing a period of unprecedented turmoil and upheaval characterized by the bankruptcy, failure, collapse or sale of various financial institutions and an unprecedented level of intervention from the U.S. federal government. These circumstances and events have led to a scarcity of credit, tighter lending standards and higher interest rates on loans. While we believe the credit markets are improving, if adverse national and international economic conditions develop, it is possible that we may not be able to fully draw upon our revolving credit facility and we may not be able to obtain financing on favorable terms.
Our debt obligations and credit facility could restrict our operations.
The terms of our credit agreement impose various restrictions and covenants on us that could have adverse consequences, including:
| • | limiting our ability to react to changing economic, regulatory and industry conditions; |
| • | limiting our ability to compete and our flexibility in planning for, or reacting to, changes in our business and the industry; |
| • | limiting our ability to invest in joint ventures; |
| • | limiting our ability to pay dividends to our stockholders; and |
| • | limiting our ability to borrow additional funds. |
Our business strategy includes acquisitions to support our growth. Acquisitions of other businesses can create certain risks and uncertainties.
We intend to pursue growth through the acquisition of businesses or assets that we believe will enable us to strengthen our existing businesses and expand into new industries and regions. We may be unable to continue this growth strategy if we cannot identify suitable businesses or assets, reach agreement on potential strategic acquisitions on acceptable terms or for other reasons. Moreover, business acquisitions involve certain risks, including:
| • | difficulties relating to the assimilation of personnel, services and systems of an acquired business and the assimilation of marketing and other operational capabilities; |
| • | challenges resulting from unanticipated changes in customer relationships subsequent to acquisition; |
| • | additional financial and accounting challenges and complexities in areas such as tax planning, treasury management, financial reporting and internal controls; |
| • | assumption of liabilities of an acquired business, including liabilities that were unknown at the time the acquisition transaction was negotiated; |
| • | diversion of management’s attention from day-to-day operations; |
| • | failure to realize anticipated benefits, such as cost savings and revenue enhancements; |
22
Table of Contents
| • | potentially substantial transaction costs associated with business combinations; and |
| • | potential impairment of goodwill or other intangible assets resulting from the overpayment for an acquisition. |
Acquisitions may be funded by the issuance of additional equity or debt financing, which may not be available on attractive terms. Moreover, to the extent an acquisition transaction financed by non-equity consideration results in goodwill, it will reduce our tangible net worth, which might have an adverse effect on potential credit and bonding capacity.
Additionally, an acquisition may bring us into businesses we have not previously conducted and expose us to additional business risks that are different than those we have historically experienced.
Our business strategy also includes development and commercialization of new technologies to support our growth, which requires significant investment and involves various risks and uncertainties.
Our future growth will depend on our ability to continue to innovate by developing and commercializing new product and service offerings. Investments in new technologies involve varying degrees of uncertainties and risk. Commercial success depends on many factors, including the levels of innovation, the development costs and the availability of capital resources to fund those costs, the levels of competition from others developing similar or other competing technologies, our ability to obtain or maintain government permits or certifications, the effectiveness of production, distribution and marketing efforts, and the costs to customers to deploy and provide support for the new technologies. We may not achieve significant revenue from new product and service investments for a number of years, if at all. Moreover, new products and services may not be profitable, and, even if they are profitable, our operating margins from new products and services may not be as high as the margins we have experienced historically. In addition, new technologies may not be patentable and, as a result, we may face increased competition.
Among our opportunities involving new technologies, we are developing the B&W mPower™ reactor, a small modular reactor designed with the flexibility to provide between 125 MW to 1,000 MW of electrical power generation (in increments of 125 MW), and the capability to operate for a four- to five-year cycle without refueling. The development, general and administrative and capital costs to develop and commercialize this technology will require a substantial amount of investment over a period of years. We expect that funding will be authorized at major milestones based on measurable and demonstrated progress, and the funding requirements may vary significantly from period to period. We intend to continue with our plan to seek third-party funding and/or participation to pursue the development and commercialization of this technology; however, we can provide no assurance that such third-party funding or participation will be provided or that, if provided, it will be sufficient. Commercialization of this technology will require certification from the NRC, which we intend to seek in time to begin deploying this technology as early as 2020. There can be no assurance that we will be successful in addressing all the technological challenges to developing and commercializing this technology or in obtaining the required NRC certification. Furthermore, while there currently are various small reactor competitors with limited capability, the potential exists for other competitors to emerge with competing technologies, in some cases with funding readily available, and we can provide no assurance that those competitors will not develop and commercialize similar or superior technologies sooner than we can or at a significant cost or price advantage.
Our operations are subject to operating risks, which could expose us to potentially significant professional liability, product liability, warranty and other claims. Our insurance coverage may be inadequate to cover all of our significant risks or our insurers may deny coverage of material losses we incur, which could adversely affect our profitability and overall financial condition.
We engineer, construct and perform services in large industrial facilities where accidents or system failures can have significant consequences. Risks inherent in our operations include:
| • | accidents resulting in injury or the loss of life or property; |
23
Table of Contents
| • | environmental or toxic tort claims, including delayed manifestation claims for personal injury or loss of life; |
| • | pollution or other environmental mishaps; |
| • | adverse weather conditions; |
| • | mechanical failures; |
| • | property losses; |
| • | business interruption due to political action in foreign countries or other reasons; and |
| • | labor stoppages. |
Any accident or failure at a site where we have provided products or services could result in significant professional liability, product liability, warranty and other claims against us, regardless of whether our products or services caused the incident. We have been, and in the future we may be, named as defendants in lawsuits asserting large claims as a result of litigation arising from events such as those listed above.
We endeavor to identify and obtain in established markets insurance agreements to cover significant risks and liabilities. Insurance against some of the risks inherent in our operations is either unavailable or available only at rates or on terms that we consider uneconomical. Also, catastrophic events customarily result in decreased coverage limits, more limited coverage, additional exclusions in coverage, increased premium costs and increased deductibles and self-insured retentions. Risks that we have frequently found difficult to cost-effectively insure against include, but are not limited to, business interruption, property losses from wind, flood and earthquake events, nuclear hazards, war and confiscation or seizure of property in some areas of the world, pollution liability, liabilities related to occupational health exposures (including asbestos), professional liability/errors and omissions coverage, the failure, misuse or unavailability of our information systems, the failure of security measures designed to protect our information systems, and liability related to risk of loss of our work in progress and customer-owned materials in our care, custody and control. Depending on competitive conditions and other factors, we endeavor to obtain contractual protection against certain uninsured risks from our customers. When obtained, such contractual indemnification protection may not be as broad as we desire or may not be supported by adequate insurance maintained by the customer. Such insurance or contractual indemnity protection may not be sufficient or effective under all circumstances or against all hazards to which we may be subject. A successful claim for which we are not insured or for which we are underinsured could have a material adverse effect on us. Additionally, disputes with insurance carriers over coverage may affect the timing of cash flows and, if litigation with the carrier becomes necessary, an outcome unfavorable to us may have a material adverse effect on our results of operations.
Through two limited liability companies, we are also involved in management and operating activities for the U.S. Government at the Y-12 National Security Complex and Pantex Plant facilities where we are the prime contractor. These activities involve, among other things, handling nuclear devices and their components from the aging stockpile of the U.S. Government. Most insurable liabilities arising from these sites are not protected in our corporate insurance program. Instead, we rely on government contractual agreements, some insurance purchased specifically for the sites and certain specialized self-insurance programs funded by the U.S. Government. The U.S. Government has historically fulfilled its contractual agreement to reimburse for insurable claims, and we expect it to continue this process during our administration of these two facilities. However, it should be noted that, in most situations, the U.S. Government is contractually obligated to pay subject to the availability of authorized government funds. The reimbursement obligation of the U.S. Government is also conditional, and provisions of the relevant contract or applicable law may preclude reimbursement.
We have a captive insurance company subsidiary which provides us with various insurance coverages. Claims as a result of our operations could adversely impact the ability of our captive insurance company subsidiary to respond to all claims presented.
24
Table of Contents
Additionally, upon the February 22, 2006 effectiveness of the settlement relating to the Chapter 11 proceedings involving several of our subsidiaries, most of our subsidiaries contributed substantial insurance rights providing coverage for, among other things, asbestos and other personal injury claims, to an asbestos personal injury trust. With the contribution of these insurance rights to the asbestos personal injury trust, we may have underinsured or uninsured exposure for non-derivative asbestos claims or other personal injury or other claims that would have been insured under these coverages had the insurance rights not been contributed to the asbestos personal injury trust.
Our nuclear operations subject us to various environmental, regulatory, financial and other risks.
Our operations in designing, engineering, manufacturing, supplying, constructing and maintaining nuclear fuel and nuclear power equipment and components subject us to various risks, including:
| • | potential liabilities relating to harmful effects on the environment and human health resulting from nuclear operations and the storage, handling and disposal of radioactive materials; |
| • | unplanned expenditures relating to maintenance, operation, security, upgrades and repairs required by the NRC; |
| • | limitations on the amounts and types of insurance commercially available to cover losses that might arise in connection with nuclear operations; and |
| • | potential liabilities arising out of a nuclear incident, whether or not it is within our control. |
Our nuclear operations are subject to various safety-related requirements imposed by the U.S. Government, the DOE and the NRC. In the event of non-compliance, these agencies might increase regulatory oversight, impose fines or shut down our operations, depending upon the assessment of the severity of the situation. Revised security and safety requirements promulgated by these agencies could necessitate substantial capital and other expenditures.
In December 2009, we temporarily suspended the operations of NFS in consultation with the NRC following the occurrence of two separate incidents that we reported to the NRC in October and November 2009. The October 2009 incident involved the generation of excessive heat and a hazardous gas at a specialized cleaning station. The incident was caused by the processing of a small amount of uranium-aluminum material in nitric acid. This incident resulted in some damage to piping, but did not result in any injuries to personnel or offsite releases of chemical or radioactive material. The November 2009 incident involved a fire in a glove box enclosure. The incident was caused by a reaction between fluorine gas in a cylinder of uranium and the fiberglass backing of the teflon lining of a vent hose attached to the cylinder within the glovebox enclosure. This incident resulted in damage to a hose and a faceplate within the glovebox enclosure, but did not result in any injuries to personnel or offsite releases of chemical or radioactive material. Inspections conducted separately by the NRC, our existing nuclear liability underwriter and us revealed specific modifications necessary to improve NFS’s overall safety performance. The suspended operations included production operations, the commercial development line and the highly enriched uranium down-blending facility. The production operations were brought back on line through a phased restart, which we commenced in March 2010 following completion of a third-party review and NRC review of the modifications that were implemented. The production operations are now fully operational. We began bringing the highly enriched uranium downblending facility back on line, through a phased restart, in May 2010, and the facility is now fully operational. We expect to bring the commercial development line back on line during the third quarter of 2011. That line represented less than 0.5% of our combined revenues in 2009. The impact of the shutdown on operating income was approximately $10.0 million in the twelve months ended December 31, 2010. There can be no assurance that we will not have to suspend our operations in the future to implement additional changes to enhance our safety controls and processes in order to comply with applicable laws and regulations.
25
Table of Contents
Limitations or modifications to indemnification regulations of the U.S. or foreign countries could adversely affect our business.
The Price-Anderson Act partially indemnifies the nuclear industry against liability arising from nuclear incidents in the United States, while ensuring compensation for the general public. The Price-Anderson Act comprehensively regulates the manufacture, use and storage of radioactive materials, while promoting the nuclear industry by offering broad indemnification to commercial nuclear power plant operators and DOE contractors. Because we provide nuclear fabrication and other services to the DOE relating to its nuclear devices facilities and other programs and the nuclear power industry in the ongoing maintenance and modifications of its nuclear power plants, including the manufacture of equipment and other components for use in such nuclear power plants, we may be entitled to some of the indemnification protections under the Price-Anderson Act against liability arising from nuclear incidents in the United States. The indemnification authority under the Price-Anderson Act was extended through December 2025 by the Energy Policy Act of 2005. We also provide nuclear fabrication and other services to the nuclear power industry in Canada. Canada’s Nuclear Liability Act generally conforms to international conventions and is conceptually similar to the Price-Anderson Act in the United States. Accordingly, indemnification protections and the possibility of exclusions under Canada’s Nuclear Liability Act are similar to those under the Price-Anderson Act in the United States.
The Price-Anderson Act’s indemnification provisions may not apply to all liabilities that we might incur while performing services as a contractor for the DOE and the nuclear power industry. If an incident or evacuation is not covered under the Price-Anderson Act’s indemnification provisions, we could be held liable for damages, regardless of fault, which could have an adverse effect on our results of operations and financial condition. In connection with the international transportation of toxic, hazardous and radioactive materials, it is possible for a claim to be asserted which may not fall within the indemnification provided by the Price-Anderson Act. If such indemnification authority is not applicable in the future, our business could be adversely affected if the owners and operators of nuclear power plants fail to retain our services in the absence of commercially adequate insurance and indemnification.
Moreover, because we manufacture nuclear components for the U.S. Government’s defense program, we may be entitled to some of the indemnification protections afforded by Public Law 85-804 for certain of our nuclear operations risks. Public Law 85-804 authorizes certain agencies of the U.S. Government, such as the DOE and the U.S. Department of Defense, to indemnify their contractors against unusually hazardous or nuclear risks when such action would facilitate the national defense. However, because the indemnification protections afforded by Public Law 85-804 are granted on a discretionary basis, situations could arise where the U.S. Government elects not to offer such protections. In such situations, our business could be adversely affected by either our inability to obtain commercially adequate insurance or indemnification or our refusal to pursue such operations in the absence of such protections.
We are subject to government regulations that may adversely affect our future operations.
Many aspects of our operations and properties are affected by political developments and are subject to both domestic and foreign governmental regulations, including those relating to:
| • | constructing and manufacturing power generation products and nuclear components; |
| • | currency conversions and repatriation; |
| • | clean air and other environmental protection legislation; |
| • | taxation of foreign earnings and earnings of expatriate personnel; and |
| • | use of local employees and suppliers. |
In addition, a substantial portion of the demand for our products and services is from electric power generating companies and other steam-using customers. The demand for power generation products and services can be influenced by state and federal governmental legislation setting requirements for utilities related to
26
Table of Contents
operations, emissions and environmental impacts. The legislative process is unpredictable and includes a platform that continuously seeks to increase the restrictions on power producers. Potential legislation limiting emissions from power plants, including carbon dioxide, could affect our markets and the demand for our products and services related to power generation.
We cannot determine the extent to which our future operations and earnings may be affected by new legislation, new regulations or changes in existing regulations.
Our businesses require us to obtain, and to comply with, national, state and local government permits and approvals.
Our businesses are required to obtain, and to comply with, national, state and local government permits and approvals. Any of these permits or approvals may be subject to denial, revocation or modification under various circumstances. Failure to obtain or comply with the conditions of permits or approvals may adversely affect our operations by temporarily suspending our activities or curtailing our work and may subject us to penalties and other sanctions. Although existing licenses are routinely renewed by various regulators, renewal could be denied or jeopardized by various factors, including:
| • | failure to provide adequate financial assurance for decommissioning or closure; |
| • | failure to comply with environmental and safety laws and regulations or permit conditions; |
| • | local community, political or other opposition; |
| • | executive action; and |
| • | legislative action. |
In addition, if new environmental legislation or regulations are enacted or implemented, or existing laws or regulations are amended or are interpreted or enforced differently, we may be required to obtain additional operating permits or approvals. Our inability to obtain, and to comply with, the permits and approvals required for our businesses could have a material adverse effect on us.
We rely on intellectual property law and confidentiality agreements to protect our intellectual property. We also rely on intellectual property we license from third parties. Our failure to protect our intellectual property rights, or our inability to obtain or renew licenses to use intellectual property of third parties, could adversely affect our business.
Our success depends, in part, on our ability to protect our proprietary information and other intellectual property. Our intellectual property could be challenged, invalidated, circumvented or rendered unenforceable. In addition, effective intellectual property protection may be limited or unavailable in some foreign countries where we operate.
Our failure to protect our intellectual property rights may result in the loss of valuable technologies or adversely affect our competitive business position. We rely significantly on proprietary technology, information, processes and know-how that are not subject to patent or copyright protection. We seek to protect this information through trade secret or confidentiality agreements with our employees, consultants, subcontractors or other parties, as well as through other security measures. These agreements and security measures may be inadequate to deter or prevent misappropriation of our confidential information. In the event of an infringement of our intellectual property rights, a breach of a confidentiality agreement or divulgence of proprietary information, we may not have adequate legal remedies to protect our intellectual property. Litigation to determine the scope of intellectual property rights, even if ultimately successful, could be costly and could divert management’s attention away from other aspects of our business. In addition, our trade secrets may otherwise become known or be independently developed by competitors.
In some instances, we have augmented our technology base by licensing the proprietary intellectual property of third parties. In the future, we may not be able to obtain necessary licenses on commercially reasonable terms.
27
Table of Contents
Our operations involve the handling, transportation and disposal of radioactive and hazardous materials, and environmental laws and regulations and civil liability for contamination of the environment or related personal injuries may result in increases in our operating costs and capital expenditures and decreases in our earnings and cash flow.
Our operations involve the handling, transportation and disposal of radioactive and hazardous materials, including nuclear devices and their components. Failure to properly handle these materials could pose a health risk to humans or wildlife and could cause personal injury and property damage (including environmental contamination). If an accident were to occur, its severity could be significantly affected by the volume of the materials and the speed of corrective action taken by emergency response personnel, as well as other factors beyond our control, such as weather and wind conditions. Actions taken in response to an accident could result in significant costs.
Governmental requirements relating to the protection of the environment, including solid waste management, air quality, water quality, the decontamination and decommissioning of nuclear manufacturing and processing facilities and cleanup of contaminated sites, have had a substantial impact on our operations. These requirements are complex and subject to frequent change. In some cases, they can impose liability for the entire cost of cleanup on any responsible party without regard to negligence or fault and impose liability on us for the conduct of others or conditions others have caused, or for our acts that complied with all applicable requirements when we performed them. Our compliance with amended, new or more stringent requirements, stricter interpretations of existing requirements or the future discovery of contamination may require us to make material expenditures or subject us to liabilities that we currently do not anticipate. Such expenditures and liabilities may adversely affect our business, financial condition, results of operations and cash flows. In addition, some of our operations and the operations of predecessor owners of some of our properties have exposed us to civil claims by third parties for liability resulting from alleged contamination of the environment or personal injuries caused by releases of hazardous substances into the environment. See “Business—Governmental Regulations and Environmental Matters.”
In our contracts, we seek to protect ourselves from liability associated with accidents, but there can be no assurance that such contractual limitations on liability will be effective in all cases or that our or our customers’ insurance will cover all the liabilities we have assumed under those contracts. The costs of defending against a claim arising out of a nuclear incident or precautionary evacuation, and any damages awarded as a result of such a claim, could adversely affect our results of operations and financial condition.
We maintain insurance coverage as part of our overall risk management strategy and due to requirements to maintain specific coverage in our financing agreements and in many of our contracts. These policies do not protect us against all liabilities associated with accidents or for unrelated claims. In addition, comparable insurance may not continue to be available to us in the future at acceptable prices, or at all.
We conduct a portion of our operations through joint venture entities, over which we may have limited control.
We currently have equity interests in several significant joint ventures and may enter into additional joint venture arrangements in the future. We do not manage all of these entities. Even in those joint ventures that we manage, we are often required to consider the interests of our joint venture partners in connection with decisions concerning the operations of the joint ventures. In any case, differences in views among the joint venture participants may result in delayed decisions or disputes. We also cannot control the actions of our joint venture participants. We sometimes have joint and several liabilities with our joint venture partners under the applicable contracts for joint venture projects and we cannot be certain that our partners will be able to satisfy any potential liability that could arise. These factors could potentially harm the business and operations of a joint venture and, in turn, our business and operations.
Operating through joint ventures in which we are minority holders results in us having limited control over many decisions made with respect to projects and internal controls relating to projects. These joint ventures may
28
Table of Contents
not be subject to the same requirements regarding internal controls and internal control over financial reporting that we follow. As a result, internal control problems may arise with respect to the joint ventures that could adversely affect our ability to respond to requests or contractual obligations to customers or to meet the internal control requirements to which we are otherwise subject.
In addition, our arrangements involving joint ventures may restrict us from gaining access to the cash flows or assets of these entities. In some cases, our joint ventures have governmentally imposed restrictions on their abilities to transfer funds to us.
If our co-venturers fail to perform their contractual obligations on a project or if we fail to coordinate effectively with our co-venturers, we could be exposed to legal liability, loss of reputation and reduced profit on the project.
We often perform projects jointly with third parties. For example, we enter into contracting consortia and other contractual arrangements to bid for and perform jointly on large projects. Success on these joint projects depends in part on whether our co-venturers fulfill their contractual obligations satisfactorily. If any one or more of these third parties fail to perform their contractual obligations satisfactorily, we may be required to make additional investments and provide additional services in order to compensate for that failure. If we are unable to adequately address any such performance issues, then our customer may exercise its right to terminate a joint project, exposing us to legal liability, loss of reputation and reduced profit.
Our collaborative arrangements also involve risks that participating parties may disagree on business decisions and strategies. These disagreements could result in delays, additional costs and risks of litigation. Our inability to successfully maintain existing collaborative relationships or enter into new collaborative arrangements could have a material adverse effect on our results of operations.
Employee, agent or partner misconduct or our overall failure to comply with laws or regulations could weaken our ability to win contracts, lead to the suspension of our operations and result in reduced revenues and profits.
Misconduct, fraud, non-compliance with applicable laws and regulations, or other improper activities by one or more of our employees, agents or partners could have a significant negative impact on our business and reputation. Such misconduct could include the failure to comply with government procurement regulations, regulations regarding the protection of classified information, regulations regarding the pricing of labor and other costs in government contracts, regulations on lobbying or similar activities, regulations pertaining to the internal controls over financial reporting and various other applicable laws or regulations. For example, we regularly provide services that may be highly sensitive or that are related to critical national security matters; if a security breach were to occur, our ability to procure future government contracts could be severely limited. The precautions we take to prevent and detect these activities may not be effective, and we could face unknown risks or losses.
We are routinely audited and reviewed by the U.S. Government and its agencies. These agencies review our performance under our contracts, our cost structure and our compliance with applicable laws, regulations and standards, as well as the adequacy of, and our compliance with, our internal control systems and policies. Systems that are subject to review include our purchasing systems, billing systems, property management and control systems, cost estimating systems, compensation systems and management information systems. Any costs found to be improperly allocated to a specific contract will not be reimbursed or must be refunded if already reimbursed. If an audit or review uncovers improper or illegal activities, we could be subject to civil and criminal penalties and administrative sanctions, including termination of contracts, forfeiture of profits, suspension of payments, fines, loss of security clearance and suspension or debarment from contracting with the U.S. Government. In addition, we could suffer serious reputational harm if allegations of impropriety were made against us.
29
Table of Contents
We could be adversely affected by violations of the U.S. Foreign Corrupt Practices Act.
The U.S. Foreign Corrupt Practices Act (“FCPA”) generally prohibits companies and their intermediaries from making improper payments to non-U.S. officials. Our training program and policies mandate compliance with the FCPA. We operate in some parts of the world that have experienced governmental corruption to some degree, and, in certain circumstances, strict compliance with anti-bribery laws may conflict with local customs and practices. If we are found to be liable for violations of the FCPA (either due to our own acts or our inadvertence, or due to the acts or inadvertence of others, including employees of our joint ventures), we could suffer from civil and criminal penalties or other sanctions.
We may not be able to compete successfully against current and future competitors.
Some of our competitors or potential competitors have greater financial or other resources than we have. Our operations may be adversely affected if our current competitors or new market entrants introduce new products or services with better features, performance, prices or other characteristics than those of our products and services. Furthermore, we operate in industries where capital investment is critical. We may not be able to obtain as much purchasing and borrowing leverage and access to capital for investment as an independent public company, which may impair our ability to compete against competitors or potential competitors.
The loss of the services of one or more of our key personnel, or our failure to attract, assimilate and retain trained personnel in the future, could disrupt our operations and result in loss of revenues.
Our success depends on the continued active participation of our executive officers and key operating personnel. The unexpected loss of the services of any one of these persons could adversely affect our operations.
Our operations require the services of employees having the technical training and experience necessary to obtain the proper operational results. As such, our operations depend, to a considerable extent, on the continuing availability of such personnel. If we should suffer any material loss of personnel to competitors or be unable to employ additional or replacement personnel with the requisite level of training and experience to adequately operate our business, our operations could be adversely affected. While we believe our wage rates are competitive and our relationships with our employees are satisfactory, a significant increase in the wages paid by other employers could result in a reduction in our workforce, increases in wage rates, or both. If either of these events occurred for a significant period of time, our financial condition, results of operations and cash flows could be adversely impacted.
Negotiations with labor unions and possible work stoppages and other labor problems could divert management attention and disrupt operations. In addition, new collective bargaining agreements or amendments to agreements could increase our labor costs and operating expenses.
A significant number of our employees are members of labor unions. If we are unable to negotiate acceptable new contracts with our unions in the future, we could experience strikes or other work stoppages by the affected employees. If any such strikes or other work stoppages were to occur, we could experience a significant disruption of operations. In addition, negotiations with unions could divert management attention. New union contracts could result in increased operating costs, as a result of higher wages or benefit expenses, for both union and nonunion employees. If nonunion employees were to unionize, we would experience higher ongoing labor costs.
Pension and medical expenses associated with our retirement benefit plans may fluctuate significantly depending on changes in actuarial assumptions, future market performance of plan assets, future trends in health care costs and legislative or other regulatory actions.
A substantial portion of our current and retired employee population is covered by pension and post-retirement benefit plans, the costs and funding requirements of which depend on our various assumptions, including estimates of rates of return on benefit-related assets, discount rates for future payment obligations, rates
30
Table of Contents
of future cost growth and trends for future costs. Variances from these estimates could have a material adverse effect on us. In addition, funding requirements for benefit obligations of our pension and post-retirement benefit plans are subject to legislative and other government regulatory actions. As of December 31, 2010, our defined benefit pension and post-retirement benefit plans were underfunded by approximately $790 million. For additional information regarding our pension plans and postretirement benefits, see Note 6 to the consolidated and combined financial statements for the years ended December 31, 2010, 2009 and 2008 included in this report.
Our internal controls may not be sufficient to achieve all stated goals and objectives.
Our internal controls and procedures were developed through a process in which our management applied its judgment in assessing the costs and benefits of such controls and procedures, which, by their nature, can provide only reasonable assurance regarding the control objectives. You should note that the design of any system of internal controls and procedures is based in part upon various assumptions about the likelihood of future events, and we cannot assure you that any design will succeed in achieving its stated goals under all potential future conditions, regardless of how remote.
Our Government Operations segment relies on several single-source suppliers, which could, under certain circumstances, adversely affect our revenues and operating results.
Our Government Operations segment relies on several single-source suppliers for materials used in its products. If the supply of a single-sourced material is delayed or ceases, we may not be able to produce the related product in a timely manner or in sufficient quantities, if at all, which could adversely affect our revenues and operating results. In addition, a single-source supplier of a key component could potentially exert significant bargaining power over price, quality, warranty claims, or other terms relating to the single-sourced materials.
Systems and information technology interruption could adversely impact our ability to operate.
We continue to replace current key financial and human resources legacy systems with enterprise systems. This implementation subjects us to inherent costs and risks associated with replacing and changing these systems, including potential disruption of our internal control structure, substantial capital expenditures, demands on management time and other risks of delays or difficulties in transitioning to new systems or of integrating new systems into our current systems. Our systems implementations may not result in productivity improvements at the levels anticipated, or at all. In addition, the implementation of new technology systems may cause disruptions in our business operations. This disruption and any other information technology system disruptions and our ability to mitigate those disruptions, if not anticipated and appropriately mitigated, could have a material adverse effect on us.
Our international operations are subject to political, economic and other uncertainties not generally encountered in our domestic operations.
We derive a portion of our revenues from international operations. Our international operations are subject to political, economic and other uncertainties not generally encountered in our U.S. operations. These include:
| • | risks of war, terrorism and civil unrest; |
| • | expropriation, confiscation or nationalization of our assets; |
| • | renegotiation or nullification of our existing contracts; |
| • | changing political conditions and changing laws and policies affecting trade and investment; |
| • | overlap of different tax structures; and |
| • | risk of changes in foreign currency exchange rates. |
31
Table of Contents
Various foreign jurisdictions have laws limiting the right and ability of foreign subsidiaries and joint ventures to pay dividends and remit earnings to affiliated companies. Our international operations sometimes face the additional risks of fluctuating currency values, hard currency shortages and controls of foreign currency exchange.
War, other armed conflicts or terrorist attacks could have a material adverse effect on our business.
The wars in Iraq and Afghanistan and terrorist attacks and unrest have caused and may continue to cause instability in the world’s financial and commercial markets and have significantly increased political and economic instability in some of the geographic areas in which we operate. Threats of war or other armed conflict may cause further disruption to financial and commercial markets. In addition, continued unrest could lead to acts of terrorism in the United States or elsewhere, and acts of terrorism could be directed against companies such as ours. Also, acts of terrorism and threats of armed conflicts in or around various areas in which we operate could limit or disrupt our markets and operations, including disruptions from evacuation of personnel, cancellation of contracts or the loss of personnel or assets. Armed conflicts, terrorism and their effects on us or our markets may significantly affect our business and results of operations in the future.
Risks Relating to the Spin-Off
We may be unable to achieve some or all of the benefits that we expect to achieve from our separation from MII.
As an independent public company, we believe that we will be able to more effectively focus on our operations and growth strategies than we could as a subsidiary of MII. However, by separating from MII there is a risk that our results of operations and cash flows may be susceptible to greater volatility due to fluctuations in our business levels and other factors that may adversely affect our operating and financial performance. In addition, as part of the MII group of companies, we had enjoyed certain benefits from MII’s financial resources, including substantial borrowing capacity and capital for investment. As a result of the fact that MII’s other operations are no longer available to offset any volatility in our results of operations and cash flows and MII’s financial and other resources are no longer available to us, we may not be able to achieve some or all of the benefits that we expect to achieve as an independent public company.
Our historical combined financial information is not necessarily indicative of our future financial condition, future results of operations or future cash flows nor does it reflect what our financial condition, results of operations or cash flows would have been as an independent public company during the periods presented.
Our historical combined financial information we have included in this report does not reflect what our financial condition, results of operations or cash flows would have been as an independent public company during the periods presented and is not necessarily indicative of our future financial condition, future results of operations or future cash flows. This is primarily a result of the following factors:
| • | our historical combined financial results reflect allocations of expenses for services historically provided by MII, and those allocations may be significantly lower than the comparable expenses we will incur as an independent company; |
| • | our cost of debt and other capitalization may be significantly different from that reflected in our historical combined financial statements; |
| • | the historical combined financial information does not reflect the changes that will occur in our cost structure, management, financing arrangements and business operations as a result of our separation from MII, including the costs related to being an independent company; and |
| • | our historical combined financial information does not reflect the effects of certain liabilities that were assumed by us, and does reflect the effects of certain assets were transferred to, and liabilities that were assumed by, MII. |
32
Table of Contents
We do not have a recent history of operating as an independent public company, we may encounter difficulties in making the changes necessary to operate as an independent public company, and we may incur greater costs as an independent public company.
We have historically used MII’s infrastructure to support our business functions, including the following functions:
| • | accounting and financial reporting; |
| • | information technology and communications; |
| • | legal; |
| • | human resources and employee benefits; |
| • | tax administration; and |
| • | treasury and corporate finance. |
Following the spin-off, MII has continued to provide some of these services to us on a transitional basis, pursuant to transition services agreements we have entered into with MII. We have been establishing the infrastructure to perform these functions and will continue to do so in the early part of 2011. Our costs associated with performing these functions may exceed those charged by MII when we were part of MII or during the transition period. A significant increase in the costs of performing these functions could adversely affect our business, financial condition, results of operations and cash flows.
We will be subject to continuing contingent liabilities of MII following the spin-off.
After the spin-off, there will be several significant areas where the liabilities of MII may become our obligations. For example, under the Internal Revenue Code of 1986, as amended (the “Code”) and the related rules and regulations, each corporation that was a member of our consolidated tax reporting group during any taxable period or portion of any taxable period ending on or before the effective time of the spin-off is jointly and severally liable for the federal income tax liability of our entire consolidated tax reporting group for that taxable period. We have entered into a tax sharing agreement with a subsidiary of MII that allocates the responsibility for prior period taxes of our consolidated tax reporting group between us and McDermott and its subsidiaries. However, if the subsidiary of MII were unable to pay, we could be required to pay the entire amount of such taxes. Other provisions of federal law establish similar liability for other matters, including laws governing tax-qualified pension plans as well as other contingent liabilities.
The spin-off could result in substantial tax liability.
MII has obtained a private letter ruling from the IRS substantially to the effect that, for U.S. federal income tax purposes, the spin-off qualified under Section 355 of the Code and certain transactions related to the spin-off qualified under Sections 355 and/or 368 of the Code. If the factual assumptions or representations made in the private letter ruling request are inaccurate or incomplete in any material respect, then we will not be able to rely on the ruling. Furthermore, the IRS will not rule on whether a distribution such as the spin-off satisfies certain requirements necessary to obtain tax-free treatment under Section 355 of the Code. Rather, the private letter ruling is based on representations by MII that those requirements have been satisfied, and any inaccuracy in those representations could invalidate the ruling.
Under the terms of the tax sharing agreement we have entered into in connection with the spin-off, we will generally be responsible for any taxes imposed on us or MII and its subsidiaries in the event that the spin-off and/or certain related preparatory transactions were to fail to qualify for tax-free treatment. However, if the spin-off and/or certain related preparatory transactions were to fail to qualify for tax-free treatment because of actions or failures to act by MII or its subsidiaries, a subsidiary of MII would be responsible for all such taxes. If we are liable for taxes under the tax sharing agreement, that liability could have a material adverse effect on us.
33
Table of Contents
Potential indemnification liabilities to MII pursuant to the master separation agreement could materially adversely affect our company.
The master separation agreement with MII provides for, among other things, the principal corporate transactions required to effect the spin-off, certain conditions to the spin-off and provisions governing the relationship between our company and MII with respect to and resulting from the spin-off. Among other things, the master separation agreement provides for indemnification obligations designed to make our company financially responsible for substantially all liabilities that may exist relating to our business activities, whether incurred prior to or after the spin-off, as well as those obligations of MII assumed by us pursuant to the master separation agreement. If we are required to indemnify MII under the circumstances set forth in the master separation agreement, we may be subject to substantial liabilities.
In connection with our separation from MII, MII will indemnify us for certain liabilities. However, there can be no assurance that the indemnity will be sufficient to insure us against the full amount of such liabilities, or that MII’s ability to satisfy its indemnification obligation will not be impaired in the future.
Pursuant to the master separation agreement, MII has agreed to indemnify us for certain liabilities. However, third parties could seek to hold us responsible for any of the liabilities that MII has agreed to retain, and there can be no assurance that the indemnity from MII will be sufficient to protect us against the full amount of such liabilities, or that MII will be able to fully satisfy its indemnification obligations. Moreover, even if we ultimately succeed in recovering from MII any amounts for which we are held liable, we may be temporarily required to bear these losses, which could have a material adverse effect on our liquidity.
The terms of our separation from MII and the related agreements were determined in the context of a related-party transaction, and thus may not be comparable to terms that would be obtained in a transaction between unaffiliated parties.
Transactions and agreements entered into with MII on or before the closing of the spin-off present conflicts between our interests and those of MII. These transactions and agreements include the following:
| • | agreements related to the separation of our business from MII that provide for, among other things, the assumption by us of liabilities related to our business or subsidiaries, the assumption by MII of liabilities unrelated to our business, our respective rights, responsibilities and obligations with respect to taxes and tax benefits and the terms of our various interim and ongoing relationships; and |
| • | administrative support services provided by MII to us, as well as by us to MII, and other transactions with MII. |
Because the terms of our separation from MII and these agreements were entered into in the context of a related-party transaction, these terms may not be comparable to terms that would be obtained in a transaction between unaffiliated parties. We may not be able to resolve potential conflicts, and even if we do, the resolutions may be less favorable than if we were dealing with an unaffiliated third party.
Members of our board and management may have conflicts of interest because of their ownership of shares of common stock of MII or because of their continuing service on the MII board of directors.
Members of our board and management own shares of common stock of MII and/or options to purchase common stock of MII because of their current or prior relationships with MII. This share ownership and the continuing role as a director of both companies by certain directors could create, or appear to create, potential conflicts of interest when our directors and executive officers are faced with decisions that could have different implications for our company and MII.
34
Table of Contents
Risks Relating to Ownership of Our Common Stock
We have no plans to pay regular dividends on our common stock, so you may not receive funds without selling your shares of our common stock.
We have no current intent to pay a regular dividend. Our board of directors will determine the payment of future dividends on our common stock, if any, and the amount of any dividends in light of applicable law, contractual restrictions limiting our ability to pay dividends, our earnings and cash flows, our capital requirements, our financial condition, and other factors our board of directors deems relevant.
Provisions in our corporate documents and Delaware law could delay or prevent a change in control of our company, even if that change may be considered beneficial by some stockholders.
The existence of some provisions of our certificate of incorporation and bylaws and Delaware law could discourage, delay or prevent a change in control of our company that a stockholder may consider favorable. These include provisions:
| • | providing that our board of directors fixes the number of members of the board; |
| • | providing for the division of our board of directors into three classes with staggered terms; |
| • | limiting who may call special meetings of stockholders; |
| • | prohibiting stockholder action by written consent, thereby requiring stockholder action to be taken at a meeting of the stockholders; |
| • | establishing advance notice requirements for nominations of candidates for election to our board of directors or for proposing matters that can be acted on by stockholders at stockholder meetings; |
| • | establishing supermajority vote requirements for certain amendments to our certificate of incorporation and bylaws; |
| • | limiting the right of stockholders to remove directors; |
| • | authorizing a large number of shares of common stock that are not yet issued, which would allow our board of directors to issue shares to persons friendly to current management, thereby protecting the continuity of our management, or which could be used to dilute the stock ownership of persons seeking to obtain control of us; and |
| • | authorizing the issuance of “blank check” preferred stock, which could be issued by our board of directors to increase the number of outstanding shares and thwart a takeover attempt. |
In addition, we are now subject to Section 203 of the Delaware General Corporation Law, which may have an anti-takeover effect with respect to transactions not approved in advance by our board of directors, including discouraging takeover attempts that might result in a premium over the market price for shares of our common stock.
We believe these provisions protect our stockholders from coercive or otherwise unfair takeover tactics by requiring potential acquirors to negotiate with our board of directors and by providing our board of directors with more time to assess any acquisition proposal, and are not intended to make our company immune from takeovers. However, these provisions apply even if the offer may be considered beneficial by some stockholders and could delay or prevent an acquisition that our board of directors determines is not in the best interests of our company and our stockholders.
We may issue preferred stock that could dilute the voting power or reduce the value of our common stock.
Our certificate of incorporation authorizes us to issue, without the approval of our stockholders, one or more classes or series of preferred stock having such designation, powers, preferences and relative, participating,
35
Table of Contents
optional and other special rights, including preferences over our common stock respecting dividends and distributions, as our board of directors generally may determine. The terms of one or more classes or series of preferred stock could dilute the voting power or reduce the value of our common stock. For example, we could grant holders of preferred stock the right to elect some number of our directors in all events or on the happening of specified events or the right to veto specified transactions. Similarly, the repurchase or redemption rights or liquidation preferences we could assign to holders of preferred stock could affect the residual value of the common stock.
| Item 1B. | UNRESOLVED STAFF COMMENTS |
None
| Item 2. | PROPERTIES |
The following table provides the segment name, location, and general use of each of our principal properties at December 31, 2010 that we own or lease.
| Business Segment and Location |
Principal Use |
Owned/Leased (Lease Expiration) | ||
| Power Generation Systems | ||||
| Barberton, Ohio |
Manufacturing facility / administrative office | Owned(1) | ||
| Lynchburg, Virginia |
Administrative office | Leased (2015) | ||
| West Point, Mississippi |
Manufacturing facility | Owned(1) | ||
| Lancaster, Ohio |
Manufacturing facility | Owned(1) | ||
| Copley, Ohio |
Warehouse / service center | Owned(1) | ||
| Cambridge, Ontario, Canada |
Manufacturing facility | Owned | ||
| Esbjerg, Denmark |
Manufacturing facility | Owned(1) | ||
| Dumbarton, Scotland |
Manufacturing facility | Owned | ||
| Guadalupe, NL, Mexico |
Manufacturing | Leased (2024) | ||
| Melville, Saskatchewan, Canada |
Manufacturing facility | Owned | ||
| Jingshan, Hubei, China |
Manufacturing facility | Owned | ||
| Government Operations | ||||
| Lynchburg, Virginia |
Administrative office | Leased (2011) | ||
| Lynchburg, Virginia |
Manufacturing facility(3) | Owned | ||
| Barberton, Ohio |
Manufacturing facility | Owned | ||
| Euclid, Ohio |
Manufacturing facility | Owned /Leased(2) | ||
| Mount Vernon, Indiana |
Manufacturing facility | Owned | ||
| Erwin, Tennessee |
Manufacturing facility | Owned | ||
| Corporate | ||||
| Charlotte, North Carolina |
Administrative office | Leased (2018) | ||
| (1) | These properties are encumbered by liens under existing credit facilities. |
| (2) | We acquired the Euclid facilities through a bond/lease transaction facilitated by the Cleveland Cuyahoga County Port Authority (the “Port”), whereby we acquired a ground parcel and the Port issued bonds, the proceeds of which were used to acquire, improve and equip the facilities, including the acquisition of the larger facility and a 40-year prepaid ground lease for the smaller facility. We are leasing the facilities from the Port with an expiration date of 2014 but subject to certain extension options. |
| (3) | The Lynchburg, Virginia facility is our Government Operations segment’s primary manufacturing plant and is the nation’s largest commercial high-enriched uranium processing facility. The site is the recipient of the highest rating given by the NRC for license performance. The performance review determines the safe and secure conduct of operations of the facility. The site is also the largest commercial International Atomic Energy Agency-certified facility in the U.S. |
36
Table of Contents
We also own or lease a number of sales, administrative and field construction offices, warehouses and equipment maintenance centers strategically located throughout the world. We consider each of our significant properties to be suitable and adequate for its intended use.
For further details regarding our properties, see Item 1, “Business.”
| Item 3. | LEGAL PROCEEDINGS |
The information set forth under the heading “Investigations and Litigation” in Note 10 to our consolidated and combined financial statements included in this report is incorporated by reference into this Item 3.
| Item 4. | RESERVED |
37
Table of Contents
| Item 5. | MARKET FOR REGISTRANT’S COMMON EQUITY, RELATED STOCKHOLDER MATTERS AND ISSUER PURCHASES OF EQUITY SECURITIES |
Our common stock is traded on the New York Stock Exchange under the symbol BWC. The distribution of B&W common stock was made on July 30, 2010, and consisted of one share of B&W for every two shares of MII common stock as of July 9, 2010, the record date. This completed the spinoff transaction and B&W became a separate publicly traded company. We filed certifications of the Chief Executive Officer and Chief Financial Officer pursuant to Section 302 of the Sarbanes-Oxley Act of 2002 as Exhibits 32.1 and 32.2, respectively, included as exhibits to this report. The following table presents the high and low sales prices for our common stock since August 2, 2010:
YEAR ENDED DECEMBER 31, 2010
| SALES PRICE | ||||||||
| QUARTER ENDED |
HIGH | LOW | ||||||
| September 30, 2010 |
$ | 25.16 | $ | 21.22 | ||||
| December 31, 2010 |
$ | 26.52 | $ | 20.75 | ||||
We have not paid cash dividends on our common stock and our credit agreement imposes certain restrictions on our ability to pay dividends. Our Board of Directors will evaluate our cash dividend policy from time to time.
As of January 31, 2011, there were approximately 2,700 record holders of our common stock.
The following table provides information on our equity compensation plans as of December 31, 2010:
Equity Compensation Plan Information
| Plan Category |
Number of securities to be issued upon exercise of outstanding options and rights |
Weighted-average exercise price of outstanding options and rights |
Number
of securities remaining available for future issuance |
|||||||||
| Equity compensation plans approved by security holders |
1,094,678 | $ | 14.21 | 7,424,674 | ||||||||
Unregistered Sales of Equity Securities and Use of Proceeds
The following table provides information on our purchases of equity securities during the quarter ended December 31, 2010, all of which involved repurchases of common stock pursuant to the provisions of employee benefit plans that permit the repurchase of shares to satisfy statutory tax withholding obligations:
| Period |
Total number of shares purchased |
Average price paid per share |
Total number of shares purchased as part of publicly announced plans or programs |
Maximum number of shares that may yet be purchased under the plans or programs |
||||||||||||
| October 1, 2010 – October 31, 2010 |
514 | $ | 22.28 | not applicable | not applicable | |||||||||||
| November 1, 2010 – November 30, 2010 |
8,228 | $ | 23.40 | not applicable | not applicable | |||||||||||
| December 1, 2010 – December 31, 2010 |
182 | $ | 25.59 | not applicable | not applicable | |||||||||||
| Total |
8,924 | $ | 23.38 | not applicable | not applicable | |||||||||||
38
Table of Contents
The following graph provides a comparison of our five-month, cumulative total shareholder return through December 2010 to the return of S&P 500 and our custom peer group.
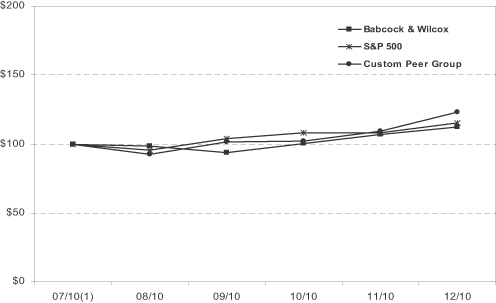
| (1) | Assumes initial investment of $100 on July 31, 2010. |
The peer group used for the five-month comparison was comprised of the following companies:
| • | AECOM Technology Corporation |
| • | Chicago Bridge & Iron Company |
| • | Curtiss-Wright Corporation |
| • | Emcor Group, Inc. |
| • | Fluor Corporation |
| • | Foster Wheeler Limited |
| • | Jacobs Engineering Group, Inc. |
| • | KBR, Inc. |
| • | MasTec, Inc. |
| • | Quanta Services, Inc. |
| • | Shaw Group, Inc. |
| • | Tetra Tech, Inc. |
| • | URS Corporation |
39
Table of Contents
| Item 6. | SELECTED FINANCIAL DATA |
| For the Years Ended | ||||||||||||||||||||
| 2010 | 2009 | 2008 | 2007 | 2006(1) | ||||||||||||||||
| (In thousands, except for per share amounts) | ||||||||||||||||||||
| Revenues |
$ | 2,688,811 | $ | 2,854,632 | $ | 3,398,574 | $ | 3,199,944 | $ | 2,517,606 | ||||||||||
| Income before Provision for Income Taxes |
$ | 235,820 | $ | 232,301 | $ | 432,739 | $ | 314,348 | $ | 216,836 | ||||||||||
| Net Income Attributable to The Babcock & Wilcox Company |
$ | 153,262 | $ | 147,764 | $ | 323,766 | $ | 215,250 | $ | 131,976 | ||||||||||
| Basic Earnings per Common Share(2): |
||||||||||||||||||||
| Net Income Attributable to The Babcock & Wilcox Company |
$ | 1.32 | $ | 1.27 | $ | 2.79 | $ | 1.85 | $ | 1.14 | ||||||||||
| Diluted Earnings per Common Share(2): |
||||||||||||||||||||
| Net Income Attributable to The Babcock & Wilcox Company |
$ | 1.30 | $ | 1.26 | $ | 2.76 | $ | 1.83 | $ | 1.12 | ||||||||||
| Total Assets |
$ | 2,500,510 | $ | 2,603,859 | $ | 2,506,841 | $ | 2,149,636 | $ | 2,222,818 | ||||||||||
| Current Maturities of Long-Term Debt |
$ | 4,790 | $ | 6,432 | $ | 9,021 | $ | 6,599 | $ | 257,492 | ||||||||||
| Long-Term Debt |
$ | 855 | $ | 4,222 | $ | 6,109 | $ | 10,609 | $ | 15,242 | ||||||||||
| (1) | Results for the year ended December 31, 2006 include approximately ten months for the principal operating subsidiaries of our Power Generation Systems segment, which were reconsolidated into our results effective February 22, 2006. We did not consolidate the results of operations of these entities in our consolidated and combined financial statements from February 22, 2000 through February 22, 2006 due to the Chapter 11 bankruptcy proceedings involving B&W PGG and certain of its subsidiaries. |
| (2) | On July 30, 2010, 116,225,732 shares of our common stock were distributed to MII shareholders to complete our spin-off from MII. For comparative purposes, and to provide a more meaningful calculation of weighted average shares, we have assumed this amount to be outstanding as of the beginning of each period presented in our calculation of basic weighted average shares. In addition, for our dilutive weighted average share calculations, we have assumed the dilutive securities outstanding at July 30, 2010 were also outstanding at each of the prior periods presented. |
Our historical combined financial information prior to July 2010 reflects our performance as a subsidiary of MII and may not provide a useful indicator of future performance. For further discussion of the factors that may affect comparability, see “Risk Factors – Risks Relating to the Spin-Off” in Item 1A of this annual report.
| Item 7. | MANAGEMENT’S DISCUSSION AND ANALYSIS OF FINANCIAL CONDITION AND RESULTS OF OPERATIONS |
Statements we make in the following discussion which express a belief, expectation or intention, as well as those that are not historical fact, are forward-looking statements that are subject to risks, uncertainties and assumptions. Our actual results, performance or achievements, or industry results, could differ materially from those we express in the following discussion as a result of a variety of factors, including the risks and uncertainties we have referred to under the headings “Cautionary Statement Concerning Forward-Looking Statements” and “Risk Factors” in Items 1 and 1A of Part I of this report.
In general, we operate in capital-intensive industries and rely on large contracts for a substantial amount of our revenues. We are currently exploring growth strategies across our segments through acquisitions to expand and complement our existing businesses. As we pursue these opportunities, we expect they would be funded by cash on hand, external financing, including debt, equity or some combination thereof.
40
Table of Contents
Spin-Off Transaction
We operate in two business segments: Power Generation Systems and Government Operations, and were a wholly owned subsidiary of MII until July 30, 2010 when MII distributed 100% of our outstanding common stock to the MII shareholders. On and prior to July 30, 2010, our financial position, operating results and cash flows consisted of The Babcock & Wilcox Operations of MII, which represented a combined reporting entity comprised of the assets and liabilities involved in managing and operating the Power Generation Systems and Government Operations segments of MII in addition to two captive insurance companies which have been combined and contributed to B&W in conjunction with the spin-off of B&W by MII.
On July 2, 2010, MII’s Board of Directors approved the spin-off of B&W through the distribution of shares of B&W common stock to holders of MII common stock. The distribution of B&W common stock was made on July 30, 2010, and consisted of one share of B&W common stock for every two shares of MII common stock to holders of MII common stock as of 5:00 p.m. New York City time on the record date, July 9, 2010. Cash was paid in lieu of any fractional shares of our common stock. As a result of the spin-off, we became a separate publicly traded company, and MII did not retain any ownership interest in us.
Outlook
Power Generation Systems
We expect the backlog of our Power Generation Systems segment of approximately $2.0 billion at December 31, 2010 to produce revenues of approximately $900 million in 2011, not including any change orders or new contracts that may be awarded during the year. Through this segment, we are actively bidding on and, in some cases, beginning preliminary work on projects that we expect will be awarded to us in 2011 subject to successful contract negotiations. These projects are not currently reflected in backlog. Our liquidity position for this segment remains strong, and we expect it to remain so throughout 2011.
Our Power Generation Systems segment’s overall activity depends mainly on the capital expenditures of electric power generating companies and other steam-using industries. This segment’s products and services are capital intensive. As such, customer demand is heavily affected by the variations in customers’ business cycles and by the overall economies of the countries in which they operate.
The recent worldwide credit and economic environment, as well as uncertainty regarding environmental regulations, has adversely affected the utility industry. We have experienced delays or deferrals of proposed projects. For example, for the year ended December 31, 2010, our Power Generation Systems segment experienced a 12% decline in revenues compared to 2009.
The recent economic environment and uncertainty concerning new environmental legislation or replacement rules or regulations has caused many of our major customers, principally electric utilities, to delay making substantial capital expenditures for new plants, as well as upgrades to existing power plants. In addition, considerations surrounding greenhouse gas limits under consideration by the U.S. Congress and the EPA have delayed the construction of new coal-fired power plants in the United States. We continue to believe the EPA will revise the rules and regulations throughout 2011, and our U.S. customers will then increase their expenditures on environmental equipment to bring their operating, coal-fired power plants into compliance with the new emissions limits. We expect that our bookings from new environmental equipment for those existing plants will begin to increase with revenue and operating income to follow normal project cycles. Instead of adding environmental equipment, some of our customers have announced plans to close down their least efficient coal-fired boilers, and, as a result, we expect our revenues and operating income from upgrade and retrofit activities from those customers may decline. Future decisions to retire boilers would impact our business in a variety of ways, including the servicing and retrofitting of operating power plants. The need to replace retired generating capacity with cleaner technologies would also create business opportunities for us. To generate energy while minimizing the emission of greenhouse gasses, we are actively researching and developing a range of products, including:
| • | non-carbon technologies, such as nuclear power plants and solar receivers for concentrating solar power plants; |
41
Table of Contents
| • | low-carbon technologies that enable clean use of fossil fuels, such as oxy-fuel combustion and regenerable solvent absorption technologies to scrub carbon dioxide from exhaust gases; and |
| • | carbon-neutral technologies, such as biomass-fueled boilers and gasifiers, which use a renewable resource where the growing biomass re-absorbs the carbon dioxide emitted during energy production. |
According to the International Energy Agency in its annual November 2010 update, their current forecast is for a 75% increase in electricity generated worldwide, from 20,183 Terawatt-hours in 2008, up to 35,336 Terrawatt-hours in 2035. While we cannot predict what impact potential future legislation and regulations concerning CO2 and other emissions will have on our results of operations, it is possible such legislation could favorably impact the environmental retrofit and service businesses of our Power Generation Systems segment.
In addition, we expect to continue our development of the B&W mPower™ reactor. We expect that funding will be authorized at major milestones based on measurable and demonstrated progress, and the funding requirements within our organization may vary significantly from period to period. We intend to continue with our plan to seek third-party funding and/or participation to pursue the development and commercialization of this technology.
Government Operations
We expect the backlog of our Government Operations segment of approximately $3.2 billion at December 31, 2010 to produce revenues of approximately $1.0 billion in 2011, not including any change orders or new contracts that may be awarded during the year. Our liquidity position for this segment remains strong, and we expect it to remain so throughout 2011.
The revenues of our Government Operations segment are largely a function of defense spending by the U.S. Government. As a supplier of major nuclear components for certain U.S. Government programs, we are a significant participant in the defense industry. With our specialized capabilities of full life-cycle management of special nuclear materials, facilities and technologies, our Government Operations segment is well-positioned to continue to participate in the continuing cleanup, operation and management of the nuclear sites and weapons complexes maintained by the DOE. We received notice of contract extensions from the NNSA for the management and operations of the Y-12 National Security Complex and Pantex Plant. We have been involved in the management and operations of these facilities for approximately 10 years. These contracts have been extended through September 30, 2011 and include two additional three-month extension options.
The production operations of NFS, which were temporarily shutdown, are now fully operational. We began bringing the highly enriched uranium downblending facility back on line, through a phased restart, in May 2010, and the facility is now fully operational. We expect to bring the commercial development line back on line during the third quarter of 2011. That line represented less than 0.5% of our combined revenues in 2009. The impact of the shutdown on operating income was approximately $10.0 million in the twelve months ended December 31, 2010.
CRITICAL ACCOUNTING POLICIES AND ESTIMATES
Our financial statements and accompanying notes are prepared in accordance with accounting principles generally accepted in the United States. Preparing financial statements requires management to make estimates and assumptions that affect the reported amounts of assets, liabilities, revenue and expenses. These estimates and assumptions are affected by management’s application of accounting policies. We believe the following are our most critical accounting policies that we apply in the preparation of our financial statements. These policies require our most difficult, subjective and complex judgments, often as a result of the need to make estimates of matters that are inherently uncertain.
42
Table of Contents
Contracts and Revenue Recognition. We determine the appropriate accounting method for each of our long-term contracts before work on the project begins. We generally recognize contract revenues and related costs on a percentage-of-completion method for individual contracts or combinations of contracts under the guidelines of FASB Topic Revenue Recognition. The use of this method is based on our experience and history of being able to prepare reasonably dependable estimates of the cost to complete our projects. Under this method, we recognize estimated contract revenue and resulting income based on costs incurred to date as a percentage of total estimated costs. Certain costs may be excluded from the cost-to-cost method of measuring progress, such as significant costs for materials and major third-party subcontractors, if it appears that such exclusion would result in a more meaningful measurement of actual contract progress and resulting periodic allocation of income. Total estimated costs, and resulting contract income, are affected by changes in the expected cost of materials and labor, productivity, scheduling and other factors. Additionally, external factors such as weather, customer requirements and other factors outside of our control may affect the progress and estimated cost of a project’s completion and, therefore, the timing of revenue and income recognition. We routinely review estimates related to our contracts, and revisions to profitability are reflected in the quarterly and annual earnings we report.
For contracts as to which we are unable to estimate the final profitability except to assure that no loss will ultimately be incurred, we recognize equal amounts of revenue and cost until the final results can be estimated more precisely. For these deferred profit recognition contracts, we recognize revenue and cost equally and only recognize gross margin when probable and reasonably estimable, which we generally determine to be when the contract is approximately 70% complete. We treat long-term construction contracts that contain such a level of risk and uncertainty that estimation of the final outcome is impractical except to assure that no loss will be incurred as deferred profit recognition contracts.
Fixed-price contracts are required to be accounted for under the completed-contract method if we are unable to reasonably forecast cost to complete at start-up. For example, if we have no experience in performing the type of work on a particular project and were unable to develop reasonably dependable estimates of total costs to complete, we would follow the completed-contract method of accounting for such projects. Generally, our management’s policy is not to enter into fixed-price contracts without an accurate estimate of cost to complete. However, it is possible that in the time between contract execution and the start of work on a project, we could lose confidence in our ability to forecast cost to complete based on intervening events, including, but not limited to, experience on similar projects, civil unrest, strikes and volatility in our expected costs. In such a situation, we would use the completed-contract method of accounting for that project. We did not enter into any contracts that we have accounted for under the completed-contract method during 2010 or 2009.
For certain parts orders and after market services activities, we recognize revenues as goods are delivered and work is performed.
For all contracts, if a current estimate of total contract cost indicates a loss on a contract, the projected loss is recognized in full when determined.
Although we continually strive to improve our ability to estimate our contract costs and profitability, adjustments to overall contract costs due to unforeseen events could be significant in future periods. We recognize claims for extra work or for changes in scope of work in contract revenues, to the extent of costs incurred, when we believe collection is probable and can be reasonably estimated. We recognize income from contract change orders or claims when formally agreed with the customer. We regularly assess the collectibility of contract revenues and receivables from customers.
Property, Plant and Equipment. We carry our property, plant and equipment at depreciated cost, reduced by provisions to recognize economic impairment when we determine impairment has occurred. Property, plant and equipment amounts are reviewed for impairment whenever events or changes in circumstances indicate that the carrying amount of an asset, or asset group, may not be recoverable. An impairment loss would be recognized when the carrying amount of an asset exceeds the estimated undiscounted future cash flows expected to result
43
Table of Contents
from the use of the asset and its eventual disposition. The amount of the impairment loss to be recorded is calculated by the excess of the assets carrying value over its fair value. Fair value is generally determined using a discounted cash flow analysis. Our estimates of cash flow may differ from actual cash flow due to, among other things, technological changes, economic conditions or changes in operating performance. Any changes in such factors may negatively affect our business segments and result in future asset impairments.
We depreciate our property, plant and equipment using the straight-line method, over estimated economic useful lives of eight to 40 years for buildings and two to 28 years for machinery and equipment. We expense the costs of maintenance, repairs and renewals, which do not materially prolong the useful life of an asset as we incur them.
Investments in Unconsolidated Affiliates. We use the equity method of accounting for affiliates in which our investment ownership ranges from 20% to 50%, unless significant economic or governance considerations indicate that we are unable to exert significant influence, in which case the cost method is used. The equity method is also used for affiliates in which our investment ownership is greater than 50% but we do not have a controlling interest. Currently, all of our material investments in affiliates that are not included in our consolidated and combined results are recorded using the equity method. Affiliates in which our investment ownership is less than 20% and where we are unable to exert significant influence are carried at cost.
Self-Insurance. We have a wholly owned insurance subsidiary that provides employer’s liability, general and automotive liability and workers’ compensation insurance and, from time to time, builder’s risk insurance within certain limits to our companies. We may also have business reasons in the future to have our insurance subsidiary accept other risks which we cannot or do not wish to transfer to outside insurance companies. When estimating our self insurance liabilities, we consider a number of factors, including historical claims experience and trend lines, projected growth patterns, inflation and exposure forecasts. The assumptions we make with respect to each of these factors represent our judgment as to the most probable cumulative impact of each factor on our future obligations. Our calculation of self insurance liabilities requires us to apply judgment to estimate the ultimate cost to settle reported claims and claims incurred but not yet reported as of the balance sheet date. We engage the services of an actuarial firm to assist us in the calculation of our liabilities for self insurance. While the actual outcome of insured claims could differ significantly from estimated amounts, these loss estimates and accruals recorded in our financial statements for claims have historically been reasonable in light of the actual amount of claims paid. Provisions for exposure to self insurance claims and the related payments of claims have historically not had a material adverse impact on our consolidated and combined financial position, results of operations and cash flows, and we do not expect these provisions to have a material impact on our self insurance programs in the future.
Pension Plans and Postretirement Benefits. We estimate income or expense related to our pension and postretirement benefit plans based on actuarial assumptions, including assumptions regarding discount rates and expected returns on plan assets. We determine our discount rate based on a review of published financial data and discussions with our actuary regarding rates of return on high-quality, fixed-income investments currently available and expected to be available during the period to maturity of our pension obligations. Based on historical data and discussions with our actuary, we determine our expected return on plan assets based on the expected long-term rate of return on our plan assets and the market-related value of our plan assets. Our pension plan assets can include assets that are difficult to value. Changes in these assumptions can result in significant changes in our estimated pension income or expense and our consolidated financial condition. We revise our assumptions on an annual basis based upon changes in current interest rates, return on plan assets and the underlying demographics of our workforce. These assumptions are reasonably likely to change in future periods and may have a material impact on future earnings. See Note 6 to our consolidated and combined financial statements included in this report for information on our pension and postretirement benefit plans.
Loss Contingencies. We estimate liabilities for loss contingencies when it is probable that a liability has been incurred and the amount of loss is reasonably estimable. We provide disclosure when there is a reasonable
44
Table of Contents
possibility that the ultimate loss will exceed the recorded provision or if such probable loss is not reasonably estimable. We are currently involved in some significant litigation, as discussed in Note 10 to our consolidated and combined financial statements included in this report. We have accrued our estimates of the probable losses associated with these matters. However, our losses are typically resolved over long periods of time and are often difficult to estimate due to the possibility of multiple actions by third parties. Therefore, it is possible future earnings could be affected by changes in our estimates related to these matters.
Goodwill. FASB Topic Intangibles – Goodwill and Other requires us to perform periodic testing for impairment. It requires a two-step impairment test to identify potential goodwill impairment and measure the amount of a goodwill impairment loss. The first step of the test compares the fair value of a reporting unit with its carrying amount, including goodwill. If the carrying amount of a reporting unit exceeds its fair value, the second step of the goodwill impairment test is performed to measure the amount of the impairment loss, if any. The second step compares the implied fair value of the reporting unit’s goodwill with the carrying amount of that goodwill. Each year, we evaluate goodwill at each reporting unit to assess recoverability and impairments, if any, are recognized in earnings. An impairment loss would be recognized in an amount equal to the excess of the carrying amount of the goodwill over the implied fair value of the goodwill. We determined that both the income and market valuation approaches provide inputs into the estimate of the fair value of our reporting units, which would be considered by market participants. Under the income valuation approach, we employ discounted cash flow model to estimate the fair value of each reporting unit. This model requires the use of significant estimates and assumptions regarding future revenues, costs, margins, capital expenditures, changes in working capital, terminal year growth rate and cost of capital. Our cash flow models are based on our forecasted results for the applicable reporting units. Actual results could differ from our projections. Under the market valuation approach, we employ the guideline publicly traded company method, which indicates the fair value of the equity of each reporting unit by comparing it to publicly traded companies in similar lines of business. After identifying and selecting guideline companies, we analyze their business and financial profiles for relative similarity. Factors such as size, growth, risk and profitability are analyzed and compared to each of our reporting units. We have completed our annual review of goodwill for each of our segments as of December 31, 2010, which indicated that we had no impairment of goodwill. The fair value of our reporting units was substantially in excess of carrying value at December 31, 2010.
Asset Retirement Obligations and Environmental Clean-up Costs. We accrue for future decommissioning of our nuclear facilities that will permit the release of these facilities to unrestricted use at the end of each facility’s life, which is a requirement of our licenses from the NRC. In accordance with the FASB Topic Asset Retirement and Environmental Obligations, we record the fair value of a liability for an asset retirement obligation in the period in which it is incurred. In estimating fair value, we use present value of cash flows expected to be incurred in settling our obligations. To the extent possible, we perform a marketplace assessment of the cost and timing of performing the retirement activities. We apply a credit-adjusted risk-free interest rate to our expected cash flows in our determination of fair value. When we initially record such a liability, we capitalize a cost by increasing the carrying amount of the related long-lived asset. Over time, the liability is accreted to its present value each period, and the capitalized cost is depreciated over the useful life of the related asset. Upon settlement of a liability, we will settle the obligation for its recorded amount or incur a gain or loss. This topic applies to environmental liabilities associated with assets that we currently operate and are obligated to remove from service. For environmental liabilities associated with assets that we no longer operate, we have accrued amounts based on the estimated costs of clean-up activities, net of the anticipated effect of any applicable cost-sharing arrangements. We adjust the estimated costs as further information develops or circumstances change. An exception to this accounting treatment relates to the work we perform for two facilities for which the U.S. Government is obligated to pay all the decommissioning costs.
Deferred Taxes. We record a valuation allowance to reduce our deferred tax assets to the amount that is more likely than not to be realized. We believe that the net deferred tax assets recorded as of December 31, 2010 are realizable through carrybacks, future reversals of existing taxable temporary differences and future taxable income. If we were to subsequently determine that we would be able to realize deferred tax assets in the future in
45
Table of Contents
excess of our net recorded amount, an adjustment to deferred tax assets would increase earnings for the period in which such determination was made. We assess the adequacy of the valuation allowance on a quarterly basis. Any changes to our estimated valuation allowance could be material to our consolidated financial condition and results of operations.
Warranty. We account for warranty costs to satisfy contractual warranty requirements as an accrued estimated expense included in cost of operations on our consolidated and combined statements of income recognized in conjunction with the associated revenue on the related contracts. In addition, we make specific provisions where we expect the actual warranty costs to significantly exceed the accrued estimates. Factors that impact our estimate of warranty costs include prior history of warranty claims and our estimates of future costs of materials and labor. Our future warranty provisions may vary from what we have experienced in the past.
Stock-Based Compensation. We account for stock-based compensation in accordance with FASB Topic Compensation – Stock Compensation. Under the fair value recognition provisions of this statement, the cost of employee services received in exchange for an award of equity instruments is measured at the grant date based on the fair value of the award. Stock-based compensation expense is recognized on a straight-line basis over the requisite service periods of the awards, which is generally equivalent to the vesting term. We use a Black-Scholes model to determine the fair value of certain share-based awards, such as stock options. The determination of the fair value of a share-based payment award on the date of grant using an option-pricing model requires the input of highly subjective assumptions, such as the expected life of the award and stock price volatility. For liability-classified awards, such as cash-settled restricted stock units and performance units, fair values are determined at grant date using the closing price of our common stock and are remeasured at the end of each reporting period through the date of settlement.
Business Combinations. Effective January 1, 2009, we became subject to the provisions of the FASB Topic Business Combinations. This topic broadens the fair value measurements and recognition of assets acquired, liabilities assumed and interests transferred as a result of business combinations. It also provides disclosure requirements to assist users of the financial statements in evaluating the nature and financial effects of business combinations.
For further discussion of recently adopted accounting standards, see Note 1 to our consolidated and combined financial statements included in this report.
YEAR ENDED DECEMBER 31, 2010 COMPARED TO YEAR ENDED DECEMBER 31, 2009
The Babcock & Wilcox Company (Consolidated and Combined)
Consolidated and combined revenues decreased approximately 6%, or $165.8 million, to $2.7 billion in the year ended December 31, 2010, compared to $2.9 billion in the year ended December 31, 2009. Our Power Generation Systems segment revenues decreased approximately 12% in the year ended December 31, 2010, as compared to 2009, primarily attributable to lower revenues in our new build environmental equipment business and our new build steam generation systems business. Our Government Operations segment revenues increased approximately 5% in the year ended December 31, 2010, compared to 2009, primarily attributable to increased volumes in the manufacturing of nuclear components for certain government programs.
Consolidated and combined operating income decreased $5.6 million from $269.6 million in 2009 to $264.0 million in 2010. Our Power Generation Systems segment operating income decreased by $57.2 million in the year ended December 31, 2010, compared to the year ended December 31, 2009, primarily attributable to the decrease in revenues discussed above. Our Government Operations segment operating income increased by $28.4 million in the year ended December 31, 2010, as compared to 2009, primarily attributable to increased contract productivity and higher volumes of manufacturing activity. Unallocated corporate expenses decreased by $23.2 million to $19.6 million in the year ended December 31, 2010 primarily attributable to lower pension expense.
46
Table of Contents
Our equity in income of investees, which is included in operating income, increased $19.0 million to $74.1 million in the year ended December 31, 2010 primarily attributable to improved results from our Power Generation Systems segment’s joint venture in China.
Power Generation Systems
Revenues decreased approximately 12%, or $214.8 million, to $1,609.7 million in the year ended December 31, 2010, compared to $1,824.5 million in the corresponding period of 2009. This decrease was primarily attributable to decreases of $96.8 million in our new build environmental equipment business, $83.1 million in our new build steam generation systems business and $70.2 million in our aftermarket services business. The main driver for this decrease in revenues was a significant decrease in North American orders over the last 12 to 18 months due to decreased electricity demand, lower capital spending by utilities, and the increased use by some customers of natural gas for power generation. The recent economic environment and uncertainty concerning new environmental legislation or replacement rules or regulations, has caused many of our major customers, principally electric utilities, to delay making substantial capital expenditures for new plants, as well as upgrades to existing power plants. In addition, considerations surrounding greenhouse gas limits under consideration by the U.S. Congress and the EPA have delayed the construction of new coal-fired power plants in the United States. We continue to believe the EPA will revise the rules and regulations throughout 2011 and our U.S. customers will then increase their expenditures on environmental equipment to bring their operating, coal-fired power plants into compliance with the new emissions limits. We expect that our bookings from new environmental equipment for those existing plants will begin to increase with revenue and operating income to follow normal project cycles. Instead of adding environmental equipment, some of our customers have announced plans to close down their least efficient coal-fired boilers, and, as a result, our revenues and operating income from upgrade and retrofit activities from those customers may decline. These decreases in revenues were partially offset by an increase in revenues of $15.9 million from our nuclear equipment operations business and $4.6 million from our nuclear projects and construction business.
Operating income decreased $57.2 million to $100.7 million in the year ended December 31, 2010 compared to $157.9 million in the corresponding period of 2009. We experienced decreases in our new build environmental equipment business totaling $27.9 million, our aftermarket services business totaling $22.6 million and in our new build steam generation systems business totaling $4.8 million, primarily attributable to the decreases in revenues discussed above. These decreases in operating income were partially offset by increases in operating income from our nuclear equipment business of $10.2 million. In addition, we experienced an increase in our selling, general and administrative expenses totaling $21.1 million, attributable to increases in our nuclear selling, general and administrative expenses due to our increased presence in nuclear energy, and to our acquisition of the electrostatic precipitator aftermarket and emissions monitoring business units of GE Energy, a division of General Electric Company. We also experienced an increase in our research and development expense totaling $13.6 million, primarily attributable to development work on the B&W mPowerTM initiative, partially offset by reduced research and development expense in our traditional fossil related activities. These factors were partially offset by lower warranty expense totaling $7.4 million in the twelve months ended December 31, 2010, compared to 2009. In addition we experienced an increase in equity in income of investees totaling $16.7 million primarily attributable to improved results in our joint venture in China from improved margins due to reductions in costs on purchases of materials, and improvements in our joint venture in Australia for material handling.
Government Operations
Revenues increased approximately 5%, or $51.6 million, to $1,083.6 million in the year ended December 31, 2010 compared to $1,032.0 million in 2009, primarily attributable to increased volumes in the manufacturing of nuclear components for certain U.S. Government programs totaling $99.1 million, and increased revenues from our management and operating contracts at government sites totaling $6.5 million. These factors were partially offset by lower volumes in the manufacture of components for a commercial uranium enrichment project due to scope reduction totaling $36.6 million, and lower volumes in commercial manufacturing totaling $16.8 million.
47
Table of Contents
Operating income increased $28.4 million to $182.9 million in the year ended December 31, 2010 compared to $154.5 million in 2009, primarily attributable to increased contract productivity and volumes in the manufacturing of nuclear components for certain U.S. Government programs totaling $55.3 million, and an $8.7 million gain attributable to a change in estimate of an environmental accrual at our NFS subsidiary. These increases were partially offset by decreases related to a downblending contract at NFS which realized favorable contract cost adjustments in the year ended December 31, 2009 totaling $23.0 million that did not reoccur in 2010. We also realized lower volumes related to a commercial uranium enrichment project due to scope reduction totaling $5.0 million for the year ended December 31, 2010 compared to 2009. Our equity in income of investees increased $2.2 million to $43.3 million in the year ended December 31, 2010, compared to $41.1 million in 2009, primarily attributable to higher fees earned at two of our government sites.
Corporate
Unallocated corporate expenses decreased by $23.2 million from $42.8 million in the year ended December 31, 2009 to $19.6 million in 2010, primarily attributable to a reduction in pension expense totaling approximately $9.5 million due to pension liabilities transferred to MII in conjunction with the spin-off. In addition, we experienced lower compensation and stock-based compensation expense in the year ended December 31, 2010 compared to 2009.
Other Income Statement Items
Interest income decreased $2.2 million to $1.2 million in the year ended December 31, 2010 compared to 2009, primarily due to reduced cash and investment balances and lower average interest rates on our investments.
Interest expense decreased $11.7 million in the year ended December 31, 2010 compared to 2009, primarily due to a decrease in interest expense attributable to forgiveness of our prior intercompany borrowings.
Other expense—net increased $0.3 million to $16.4 million in the year ended December 31, 2010 compared to 2009, primarily due to increases in foreign currency exchange losses partially offset by increased dividend income.
Provision for Income Taxes
For the year ended December 31, 2010, our provision for income taxes decreased $2.1 million to $82.3 million, while income before provision for income taxes increased $3.5 million to $235.8 million. Our effective tax rate was approximately 35% for 2010, as compared to 36% for 2009. The decrease in the overall effective tax rate was primarily attributable to a larger portion of earnings outside of the U.S. being taxed at lower rates compared to the prior year.
Income before provision for income taxes, provision for income taxes and effective tax rates for our U.S. and non-U.S. jurisdictions were as shown below:
| Income before Provision for Income Taxes |
Provision for (Benefit from) Income Taxes |
Effective Tax Rate |
||||||||||||||||||||||
| 2010 | 2009 | 2010 | 2009 | 2010 | 2009 | |||||||||||||||||||
| (In thousands) | (In thousands) | |||||||||||||||||||||||
| United States |
$ | 160,074 | $ | 164,347 | $ | 64,168 | $ | 69,279 | 40.09 | % | 42.15 | % | ||||||||||||
| Non-United States |
75,746 | 67,954 | 18,126 | 15,102 | 23.93 | % | 22.22 | % | ||||||||||||||||
| Total |
$ | 235,820 | $ | 232,301 | $ | 82,294 | $ | 84,381 | 34.90 | % | 36.32 | % | ||||||||||||
We are subject to U.S. federal income tax at a rate of 35% on our U.S. operations plus the applicable state income taxes on our profitable U.S. subsidiaries. Our non-U.S. earnings are subject to tax at various tax rates and under various tax regimes, including deemed profits tax regimes.
48
Table of Contents
During the year ended December 31, 2010, we recorded an increase in liabilities under FASB Topic Income Taxes of approximately $0.7 million, including estimated tax-related interest and penalties.
See Note 4 to our consolidated and combined financial statements included in this report for further information on income taxes.
YEAR ENDED DECEMBER 31, 2009 COMPARED TO YEAR ENDED DECEMBER 31, 2008
The Babcock & Wilcox Company (Combined)
Combined revenues decreased approximately 16%, or $544.0 million, to $2.9 billion in the year ended December 31, 2009, compared to $3.4 billion in the year ended December 31, 2008. Our Power Generation Systems segment revenues decreased approximately 28% in the year ended December 31, 2009, as compared to 2008, primarily attributable to lower revenues in our new build environmental equipment business and our new build steam generation systems business. Our Government Operations segment revenues increased approximately 21% in the year ended December 31, 2009, compared to 2008, primarily attributable to the acquisition of Nuclear Fuel Services, Inc.
Combined operating income decreased $174.9 million from $444.5 million in 2008 to $269.6 million in 2009. Our Power Generation Systems segment operating income decreased by $157.5 million in the year ended December 31, 2009, compared to the year ended December 31, 2008, primarily attributable to the decrease in revenues discussed above. Our Government Operations segment operating income increased by $4.3 million in the year ended December 31, 2009, as compared to 2008, primarily attributable to higher volumes of manufacturing activity. We also experienced increases in selling, general and administrative expenses, which are included in operating income, totaling approximately $66.0 million in the year ended December 31, 2009 compared to 2008, primarily attributable to a $14.4 million increase in selling and marketing expenses in 2009, and $36.3 million from our acquisition of NFS. Our equity in income of investees, which is included in operating income, increased $3.3 million to $55.1 million in the year ended December 31, 2009, which decrease is primarily attributable to improved results from our Power Generation Systems segment’s joint venture in China. We also realized a decrease in gains on asset disposals in the year ended 2009 compared to 2008 attributable to a gain we recognized in 2008 on the sale of our former Dumbarton, Scotland facility.
Power Generation Systems
Revenues decreased approximately 28%, or $724.4 million, to $1,824.5 million in the year ended December 31, 2009, compared to $2,548.9 million in 2008. This decrease was primarily attributable to a 54% (or $424.1 million) decrease we experienced in revenues from our new build environmental equipment business and decreased revenues in our new build steam generation systems business ($135.9 million) in 2009. The main driver for these decreases in revenues was a significant decrease in orders booked starting in the final six months of 2008. These reductions in orders booked followed a Federal Appeals Court’s overturning of the Clean Air Interstate Rule, the Clean Air Mercury Rule and the Industrial Boiler Rule on Maximum Achievable Control Technology. The overturning of these rules and regulations, along with the uncertainty concerning any new legislation or replacement rules or regulations, has caused many of our major customers, principally electric utilities, to delay making substantial capital expenditures for new plants, as well as upgrades to existing power plants. In addition, considerations surrounding greenhouse gas limits under consideration by the U.S. Congress and the EPA have delayed the construction of new coal-fired power plants in the United States. We currently believe, as the EPA finalizes the revised rules and regulations (which we anticipate may be released in final form by mid 2011), our U.S. customers will increase their expenditures on environmental equipment to bring their operating, coal-fired power plants into compliance with the new emissions limits. When the final EPA rules are released, we expect that our bookings from new environmental equipment for those existing plants will begin to increase with revenue and operating income to follow normal project cycles. It is also possible that some of our customers may elect to close down their least efficient coal-fired boilers, and, as a result, our revenues and operating income from upgrade and retrofit activities from those customers may decline. We also experienced
49
Table of Contents
lower revenues in 2009 compared to 2008 in our after market services business ($129.0 million), and decreases in revenues attributable to our nuclear equipment operations business in 2009 ($12.6 million).
Operating income decreased $157.5 million to $157.9 million in the year ended December 31, 2009, compared to $315.4 million in 2008, primarily attributable to lower volumes in our new build environmental equipment business, and our new build steam generation systems business related to the decreases in revenues discussed above, and a bonus on a contract completed in 2008, for a total reduction of $100.9 million in operating income. In addition, we experienced lower operating income in our aftermarket services business totaling $34.6 million, which was also primarily attributable to the decreases in revenues discussed above. We also experienced lower margins and volume in our nuclear equipment operations business in 2009 compared to 2008. The lower margins in our nuclear steam generator operations were attributable primarily to increased contract costs on the manufacture and delivery of two replacement once through steam generators, and our lower volumes were attributable to the decrease in revenues discussed above. We also experienced an increase in research and development expense totaling $14.0 million in 2009 compared to 2008 primarily attributable to development work on the B&W mPower™ initiative. In addition, we incurred an increase in our pension plan expense totaling approximately $40.2 million in 2009 compared to 2008, primarily from the amortization of losses on our pension plan incurred in 2008. We also experienced an increase in selling, general and administrative expenses totaling approximately $19.1 million in 2009 compared to 2008, primarily attributable to an increase of approximately $11 million in selling and marketing expenses in 2009 compared to 2008. Gains (losses) on asset disposals and impairments—net decreased $9.9 million in the year ended December 31, 2009, primarily attributable to the gain we recognized in 2008 on the sale of our former Dumbarton, Scotland facility. Equity in income of investees increased $3.6 million to $14.0 million for the year ended December 31, 2009 compared to $10.4 million in 2008, primarily attributable to our joint venture in China.
Government Operations
Revenues increased approximately 21%, or $181.0 million, to $1,032.0 million in the year ended December 31, 2009 compared to $851.0 million in 2008, primarily attributable to our acquisition of NFS ($160.7 million) and additional volumes in the manufacture of nuclear components for certain U.S. Government programs and recovery work ($20.7 million). These improvements were partially offset by lower volumes in the manufacture of components for a commercial uranium enrichment project, engineering and laboratory services and lower revenues from our management and operating contracts at several government sites.
Operating income increased $4.3 million to $154.5 million in the year ended December 31, 2009 compared to $150.2 million in 2008, primarily attributable to additional volumes in the manufacture of nuclear components for certain U.S. Government programs and recovery work, and our acquisition of NFS, which contributed $3.3 million of segment operating income. These improvements were partially offset by increased pension expense of $39.5 million in 2009 compared to 2008 from the amortization of losses on our pension plan assets in 2008. In addition, we experienced lower volumes related to a commercial uranium enrichment project and lower revenues from our management and operating contracts at several government sites.
Corporate
Unallocated corporate expenses increased $21.7 million in the year ended December 31, 2009 to $42.8 million from $21.1 million in 2008, primarily attributable to increased pension plan expense of $16.3 million in 2009 compared to 2008 from the amortization of losses on pension plan assets experienced in 2008. We also experienced an increase in information technology expenses in the year ended December 31, 2009 compared to 2008.
Other Income Statement Items
Interest income decreased $11.9 million to $3.4 million in the year ended December 31, 2009 compared to 2008, primarily due to decreases in average cash equivalents and investments and prevailing interest rates.
50
Table of Contents
Interest expense increased $1.9 million in the year ended December 31, 2009 compared to 2008, primarily due to interest expense on a note payable to an affiliate.
Other expense—net increased $11.8 million to a loss of $16.1 million in the year ended December 31, 2009, primarily due to higher currency exchange losses in 2009.
Provision for Income Taxes
For the year ended December 31, 2009, our provision for income taxes decreased $24.5 million to $84.4 million, while income before provision for income taxes decreased $200.4 million to $232.3 million. Our effective tax rate was approximately 36% for the year ended December 31, 2009, as compared to 25% for the year ended December 31, 2008. The increase in the effective tax rate was primarily attributable to non-recurring tax benefits which we recognized from the release of state valuation allowances and as a result of audit activity in 2008.
Income before provision for income taxes, provision for income taxes and effective tax rates for our U.S. and non-U.S. jurisdictions were as shown below:
| Income before Provision for Income Taxes |
Provision for (Benefit from) Income Taxes |
Effective Tax Rate | ||||||||||||||||||||||
| 2009 | 2008 | 2009 | 2008 | 2009 | 2008 | |||||||||||||||||||
| (In thousands) | (In thousands) | |||||||||||||||||||||||
| United States |
$ | 164,347 | $ | 351,398 | $ | 69,279 | $ | 89,904 | 42.15 | % | 25.58 | % | ||||||||||||
| Non-United States |
67,954 | 81,341 | 15,102 | 18,981 | 22.22 | % | 23.34 | % | ||||||||||||||||
| Total |
$ | 232,301 | $ | 432,739 | $ | 84,381 | $ | 108,885 | 36.32 | % | 25.16 | % | ||||||||||||
We are subject to U.S. federal income tax at a rate of 35% on our U.S. operations plus the applicable state income taxes on our profitable U.S. subsidiaries. Our non-U.S. earnings are subject to tax at various tax rates and under various tax regimes, including deemed profits tax regimes.
During the year ended December 31, 2009, we recorded a reduction in liabilities under FASB Topic Income Taxes of approximately $5.4 million, including estimated tax-related interest and penalties.
See Note 4 to our consolidated and combined financial statements included in this report for further information on income taxes.
EFFECTS OF INFLATION AND CHANGING PRICES
Our financial statements are prepared in accordance with generally accepted accounting principles in the United States, using historical U.S. dollar accounting (“historical cost”). Statements based on historical cost, however, do not adequately reflect the cumulative effect of increasing costs and changes in the purchasing power of the dollar, especially during times of significant and continued inflation.
In order to minimize the negative impact of inflation on our operations, we attempt to cover the increased cost of anticipated changes in labor, material and service costs, either through an estimate of those changes, which we reflect in the original price, or through price escalation clauses in our contracts. However, there can be no assurance we will be able to cover all changes in cost using this strategy.
LIQUIDITY AND CAPITAL RESOURCES
Our overall liquidity position, which we generally define as our unrestricted cash and investments plus amounts available for borrowings under our credit facility, continued to remain strong in 2010. Our liquidity
51
Table of Contents
position at December 31, 2010 increased by approximately $110 million to $930 million from December 31, 2009, mainly due to factors discussed below in connection with an increase in capacity on our new credit facility, and the changes in our cash flows from operating, investing and financing activities. We experienced net cash generated from operations in each of the years ended 2010, 2009 and 2008.
Credit Facility
On May 3, 2010, our subsidiary Babcock & Wilcox Investment Company (“BWICO”) entered into a credit agreement (the “Credit Agreement”) with a syndicate of lenders and letter of credit issuers, and Bank of America, N.A., as administrative agent. The Credit Agreement provides for revolving credit borrowings and issuances of letters of credit in an aggregate outstanding amount of up to $700 million, and the credit facility is scheduled to mature on May 3, 2014. The proceeds of the Credit Agreement are available for working capital needs and other general corporate purposes of our Government Operations and Power Generation Systems segments. The Credit Agreement includes procedures for additional financial institutions to become lenders, or for any existing lender to increase its commitment thereunder, subject to an aggregate maximum of $850 million for all revolving loan and letter of credit commitments under the Credit Agreement.
The Credit Agreement is guaranteed by substantially all of BWICO’s wholly owned domestic subsidiaries. Following the completion of the spin-off of B&W, B&W became the borrower under the Credit Agreement and substantially all of B&W’s wholly owned domestic subsidiaries (including BWICO) that were not already guarantors under the Credit Agreement became guarantors. Obligations under the Credit Agreement are secured by first-priority liens on certain assets owned by BWICO and the guarantors (other than BWXT and its subsidiaries). Following completion of the spin-off of B&W, B&W and its wholly owned domestic subsidiaries that became guarantors under the Credit Agreement granted liens on certain assets owned by them. If the corporate rating of B&W and its subsidiaries from Moody’s is Baa3 or better (with a stable outlook or better), the corporate family rating of B&W and its subsidiaries from S&P is BBB- or better (with a stable outlook or better), and certain other conditions are met, the liens securing obligations under the Credit Agreement will be released, subject to reinstatement upon the terms set forth in the Credit Agreement.
The Credit Agreement requires only interest payments on a quarterly basis until maturity. The borrower under the Credit Agreement may prepay all loans under the Credit Agreement at any time without premium or penalty (other than customary LIBOR breakage costs), subject to certain notice requirements.
The Credit Agreement contains customary financial covenants relating to leverage and interest coverage and includes covenants that restrict, among other things, debt incurrence, liens, investments, acquisitions, asset dispositions, dividends, prepayments of subordinated debt, mergers, and capital expenditures. At December 31, 2010, we were in compliance with all of the covenants set forth in the Credit Agreement. A comparison of the key financial covenants and current compliance at December 31, 2010 is as follows:
| Required | Actual | |||
| Less than | ||||
| Maximum leverage ratio |
2.5 to 1.0 | 0.2 to 1.0 | ||
| Greater than | ||||
| Minimum interest coverage ratio |
4.0 to 1.0 | 21.0 to 1.0 |
Loans outstanding under the Credit Agreement bear interest at the borrower’s option at either the Eurodollar rate plus a margin ranging from 2.50% to 3.50% per year or the base rate (the highest of the Federal Funds rate plus 0.50%, the 30-day Eurodollar rate plus 1.0%, or the administrative agent’s prime rate) plus a margin ranging from 1.50% to 2.50% per year. The applicable margin for revolving loans varies depending on the credit ratings of the Credit Agreement. The borrower under the Credit Agreement is charged a commitment fee on the unused portions of the Credit Agreement, and that fee varies between 0.375% and 0.625% per year depending on the credit ratings of the Credit Agreement. Additionally, the borrower under the Credit Agreement is charged a letter of credit fee of between 2.50% and 3.50% per year with respect to the amount of each financial letter of credit
52
Table of Contents
issued under the Credit Agreement and a letter of credit fee of between 1.25% and 1.75% per year with respect to the amount of each performance letter of credit issued under the Credit Agreement, in each case depending on the credit ratings of the Credit Agreement. The borrower under the Credit Agreement also pays customary issuance fees and other fees and expenses in connection with the issuance of letters of credit under the Credit Agreement. In connection with entering into the Credit Agreement, BWICO paid certain upfront fees to the lenders thereunder, and BWICO paid certain arrangement and other fees to the arrangers and agents of the BWICO Credit Agreement. On August 11, 2010 we borrowed $25 million against this facility for one day to meet temporary working capital needs. At December 31, 2010, there were no borrowings outstanding but letters of credit issued under the Credit Agreement totaled $236.2 million. At December 31, 2010, there was $463.8 million available for borrowings or to meet letter of credit requirements under the Credit Agreement. The applicable interest rate at December 31, 2010 under this facility was 4.75% per year.
Based on the current credit ratings of the Credit Agreement, the applicable margin for Eurodollar-rate loans is 2.50%, the applicable margin for base-rate loans is 1.50%, the letter of credit fee for financial letters of credit is 2.50%, the letter of credit fee for performance letters of credit is 1.25%, and the commitment fee for unused portions of the Credit Agreement is 0.375%. The Credit Agreement does not have a floor for the base rate or the Eurodollar rate.
Bank Guarantees (Foreign Operations)
Certain foreign subsidiaries of B&W PGG, a subsidiary in our Power Generation Systems segment, had credit arrangements with various commercial banks and other financial institutions for the issuance of bank guarantees in association with contracting activity. The aggregate value of all such bank guarantees as of December 31, 2010 was $19.2 million.
Surety Bonds
We have posted surety bonds to support contractual obligations to customers relating to certain projects. We utilize bonding facilities to support such obligations, but the issuance of bonds under those facilities is typically at the surety’s discretion. Although there can be no assurance that we will maintain our surety bonding capacity, we believe our current capacity is adequate to support our existing project requirements for the next twelve months. In addition, these bonds generally indemnify customers should we fail to perform our obligations under the applicable contracts. We, and certain of our subsidiaries, have jointly executed general agreements of indemnity in favor of surety underwriters relating to surety bonds those underwriters issue in support of some of our contracting activity. As of December 31, 2010, bonds issued and outstanding under these arrangements in support of contracts totaled approximately $155.1 million. Approximately $82.3 million of these bonds are also subject to general agreements of indemnity executed by MII and certain of our subsidiaries (including B&W PGG) prior to the spin-off. Any claim successfully asserted against a surety by a bond obligee under a bond issued by us, pursuant to the agreements of indemnity executed prior to our spin-off would likely be recoverable from MII and B&W PGG under such indemnity agreements (and we have agreed to indemnify MII from and against any such recovery from it).
Letters of Credit (Nuclear Fuel Services, Inc.)
At December 31, 2010, NFS, a subsidiary of BWXT in our Government Operations segment, had $3.6 million in letters of credit issued by various commercial banks on its behalf. The obligations to the commercial banks issuing such letters of credit are secured by cash, short-term certificates of deposit and certain real and intangible assets.
OTHER
Pension Plan
We recorded a $62.1 million reduction in stockholders’ equity at December 31, 2010, compared to a reduction of $36.9 million in stockholders’ equity at December 31, 2009. The difference is primarily attributable
53
Table of Contents
to the reduction in the discount rate for our major domestic plans from 6.00% to 5.60% at December 31, 2010, compared to a decrease in the discount rate from 6.25% to 6.00% at December 31, 2009. These decreases in the discount rate increased the pension plan obligations, resulting in net reductions in stockholders’ equity and parent equity at December 31, 2010 and 2009, respectively.
Warranty Claim (Power Generation Systems Segment)
One of our Canadian subsidiaries has received notice of a warranty claim on one of its projects on a contract executed in 1998. This situation relates to technical issues concerning components associated with nuclear steam generators. Data collection and analysis can only be performed at specific time periods when the power plant is scheduled to be off-line for maintenance. We also received a notice from the customer during October 2008, and, in November 2008, we responded to the notice by disagreeing with the matters stated in the claim and disputing the claim. In November 2010, we entered into a settlement agreement with the customer in order to resolve this matter. The settlement agreement defines our obligations for past and future costs associated with these technical issues and these anticipated costs were within amounts which had been previously accrued.
Cash, Cash Equivalents, Restricted Cash and Investments
In the aggregate, our cash and cash equivalents, restricted cash and cash equivalents and investments decreased by approximately $79.8 million to $478.5 million at December 31, 2010 from $558.3 million at December 31, 2009, primarily due a $100.0 million cash dividend paid to MII in connection with the spin-off.
Our working capital, increased by approximately $155.8 million to $227.3 million at December 31, 2010 from $71.5 million at December 31, 2009, primarily due to the increase in the net amount of contracts in progress and advance billings on contracts and the settlement of intercompany payables with MII and its subsidiaries.
Our net cash provided by operating activities was approximately $192.4 million in the year ended December 31, 2010, compared to $252.8 million in the year ended December 31, 2009. This difference was primarily attributable to changes in net contracts in progress and advance billings and accrued employee benefits.
Our net cash used in investing activities increased by approximately $22.7 million to approximately $90.3 million in the year ended December 31, 2010 from approximately $67.6 million in the year ended December 31, 2009. This increase in net cash used in investing activities was primarily attributable to acquisitions in the current year and our cash investment in USEC of $37.5 million. These increases were partially offset by a decrease in capital expenditures from the prior year and cash received from the settlement of a note receivable in 2010.
Our net cash used in financing activities increased by approximately $178.1 million to $183.7 million in the year ended December 31, 2010 from $5.6 million in the year ended December 31, 2009. This increase in net cash used in financing activities was primarily attributable to dividends paid in connection with the spin-off transaction and repayment of an intercompany loan in 2010.
At December 31, 2010, we had restricted cash and cash equivalents totaling $16.2 million, $7.5 million of which was held in restricted foreign cash accounts, $3.5 million of which was held as cash collateral for letters of credit, $4.0 million of which was held for future decommissioning of facilities (which is included in other assets on our consolidated and combined balance sheets), $0.2 million of which was held to meet reinsurance reserve requirements of our captive insurer, and $1.0 million of which was held in money market funds maintained by our captive insurer.
At December 31, 2010, we had investments with a fair value of $75.1 million. Our investment portfolio consists primarily of investments in government obligations and other highly liquid money market instruments.
Our investments are classified as available-for-sale and are carried at fair value with unrealized gains and losses, net of tax, reported as a component of other comprehensive loss. Our net unrealized gain/loss on
54
Table of Contents
investments is currently in an unrealized gain position totaling approximately $0.3 million at December 31, 2010. At December 31, 2009, we had unrealized losses on our investments totaling approximately $0.4 million. Based on our analysis of these investments, we believe that none of our available-for-sale securities were permanently impaired as of December 31, 2010.
Based on our liquidity position, we believe we have sufficient cash and letter of credit and borrowing capacity to fund our operating requirements for at least the next twelve months.
CONTRACTUAL OBLIGATIONS
Our cash requirements as of December 31, 2010 under current contractual obligations were as follows:
| Total | Less than 1 Year |
1-3 Years |
3-5 Years |
After 5 Years |
||||||||||||||||
| (In thousands) | ||||||||||||||||||||
| Long-term debt principal (a) |
$ | 5,645 | $ | 4,790 | $ | 418 | $ | 437 | $ | 0 | ||||||||||
| Operating leases |
$ | 23,821 | $ | 6,087 | $ | 8,621 | $ | 5,503 | $ | 3,610 | ||||||||||
We expect cash requirements totaling approximately $ 121.7 million for contributions to our pension plans in 2011, which includes approximately $ 65.7 million for our Power Generation Systems segment and $ 56.0million for our Government Operations segment, respectively, and $8.2 million for contributions to our other postretirement benefit plans in 2011.
| (a) | Interest payments on these borrowings as of December 31, 2010 are not significant. |
In addition to the contractual obligations summarized above, on May 25, 2010, we entered into a securities purchase agreement with USEC and Toshiba Corporation (“Toshiba”), pursuant to which we and Toshiba have each agreed to make a phased strategic investment in USEC of up to $100 million. Our investment is to be made over three phases, each of which is subject to satisfaction of specific preconditions, including regulatory approvals. We anticipate making our second investment, in the amount of $25.0 million, in the second quarter of 2011, which we intend to fund using cash on hand or cash generated by our operating activities.
Our contingent commitments under letters of credit, bank guarantees and surety bonds currently outstanding expire as follows:
| Total |
Less than 1 Year |
1-3 Years |
3-5 Years |
Thereafter | ||||
| (In thousands) | ||||||||
| $ 414,089 |
$257,603 | $124,164 | $22,216 | $10,106 | ||||
In accordance with the provisions of FASB Topic Income Taxes, we have recorded a $4.9 million liability as of December 31, 2010 for unrecognized tax benefits and the payment of related interest and penalties. Due to the uncertainties related to these tax matters, we are unable to make a reasonably reliable estimate as to when cash settlement with a taxing authority will occur. However, over the next twelve months, we expect to settle approximately $1.9 million of these liabilities in cash. We do not expect a significant increase or decrease to the total amounts of unrecognized tax benefits during the next twelve months, however, we are under regular audit by tax authorities.
| Item 7A. | QUANTITATIVE AND QUALITATIVE DISCLOSURES ABOUT MARKET RISK |
Our exposure to market risk from changes in interest rates relates primarily to our cash equivalents and our investment portfolio, which primarily consists of investments in U.S. Government obligations and highly liquid money market instruments denominated in U.S. dollars. We are averse to principal loss and seek to ensure the safety and preservation of our invested funds by limiting default risk, market risk and reinvestment risk. All our investments in debt securities are classified as available-for-sale.
55
Table of Contents
We have exposure to changes in interest rates on the Credit Agreement (see Item 7 – “Management’s Discussion and Analysis of Financial Condition and Results of Operations – Liquidity and Capital Resources”). At December 31, 2010, we had no outstanding borrowings under this facility. We have no material future earnings or cash flow exposures from changes in interest rates on our other long-term debt obligations, as substantially all of these obligations have fixed interest rates.
We have operations in many foreign locations, and, as a result, our financial results could be significantly affected by factors such as changes in foreign currency exchange rates or weak economic conditions in those foreign markets. In order to manage the risks associated with foreign currency exchange rate fluctuations, we attempt to hedge those risks with foreign currency derivative instruments. Historically, we have hedged those risks with foreign currency forward contracts. We have recently hedged some of those risks with foreign currency option contracts. We do not enter into speculative derivative positions.
Interest Rate Sensitivity
The following tables provide information about our financial instruments that are sensitive to changes in interest rates. The tables present principal cash flows and related weighted-average interest rates by expected maturity dates.
| Principal Amount by Expected Maturity | ||||||||||||||||||||||||||||||||
| (In thousands) | ||||||||||||||||||||||||||||||||
| Years Ending December 31, | Thereafter | Total | Fair Value at December 31, 2010 |
|||||||||||||||||||||||||||||
| 2011 | 2012 | 2013 | 2014 | 2015 | ||||||||||||||||||||||||||||
| At December 31, 2010: |
||||||||||||||||||||||||||||||||
| Investments |
$ | 71,129 | — | — | — | — | $ | 3,697 | $ | 74,826 | $ | 75,097 | ||||||||||||||||||||
| Average Interest Rate |
0.20 | % | — | — | — | — | 0.41 | % | ||||||||||||||||||||||||
| Long-term Debt – Fixed Rate |
$ | 4,790 | $ | 207 | $ | 211 | $ | 217 | $ | 220 | — | $ | 5,645 | $ | 5,673 | |||||||||||||||||
| Average Interest Rate |
3.72 | % | 2.78 | % | 2.78 | % | 2.78 | % | 2.78 | % | — | |||||||||||||||||||||
| Years Ending December 31, | Thereafter | Total | Fair Value at December 31, 2009 |
|||||||||||||||||||||||||||||
| 2010 | 2011 | 2012 | 2013 | 2014 | ||||||||||||||||||||||||||||
| At December 31, 2009: |
||||||||||||||||||||||||||||||||
| Investments |
$ | 70,169 | $ | 2,877 | $ | — | $ | — | $ | — | $ | 883 | $ | 73,929 | $ | 73,554 | ||||||||||||||||
| Average Interest Rate |
0.52 | % | 0.53 | % | — | — | — | 2.22 | % | |||||||||||||||||||||||
| Long-term Debt –Fixed Rate |
$ | 3,366 | $ | 4,222 | $ | — | $ | — | $ | — | $ | — | $ | 7,588 | $ | 7,588 | ||||||||||||||||
| Average Interest Rate |
1.06 | % | 0.75 | % | — | — | — | — | ||||||||||||||||||||||||
Exchange Rate Sensitivity
The following table provides information about our foreign currency forward contracts outstanding at December 31, 2010 and presents such information in U.S. dollar equivalents. The table presents notional amounts and related weighted-average exchange rates by expected (contractual) maturity dates and constitutes a forward-looking statement. These notional amounts generally are used to calculate the contractual payments to be exchanged under the contract. The average contractual exchange rates are expressed using market convention, which is dependent on the currencies being bought and sold under the forward contract.
56
Table of Contents
| Forward Contracts to Purchase Foreign Currencies in U.S. Dollars (in thousands)
|
||||||||||||
| Foreign Currency |
Year Ending December 31, 2011 |
Fair Value at December 31, 2010 |
Average Contractual Exchange Rate |
|||||||||
| Euros |
$ | 3,738 | $ | (279 | ) | 1.4466 | ||||||
| Canadian Dollars |
$ | 52,873 | $ | 1,344 | 1.0303 | |||||||
| Canadian Dollars (selling Japanese Yen) |
$ | 566 | $ | (27 | ) | 85.4144 | ||||||
| Danish Krone (selling Norwegian Krone) |
$ | 12,546 | $ | (320 | ) | 1.0787 | ||||||
| Danish Krone (selling Swedish Krona) |
$ | 49,105 | $ | (2,938 | ) | 1.2886 | ||||||
| Danish Krone |
$ | 1,252 | $ | (81 | ) | 5.2195 | ||||||
| Pound Sterling (selling Euros) |
$ | 6,797 | $ | (156 | ) | 0.8388 | ||||||
| Japanese Yen (selling Canadian Dollars) |
$ | 11,165 | $ | 1,264 | 90.2901 | |||||||
| Euros (selling Canadian Dollars) |
$ | 2,666 | $ | (68 | ) | 1.3697 | ||||||
| Euros (selling Swedish Krona) |
$ | 243 | $ | (9 | ) | 9.3700 | ||||||
| U.S. Dollars (selling Canadian Dollars) |
$ | 2,400 | $ | (137 | ) | 1.0572 | ||||||
| U.S. Dollars (selling Euros) |
$ | 57 | $ | 4 | 1.4405 | |||||||
|
Foreign Currency |
Year Ending December 31, 2012 |
Fair Value at December 31, 2010 |
Average Contractual Exchange Rate |
|||||||||
| Canadian Dollars |
$ | 23,316 | $ | 1,326 | 1.0734 | |||||||
| Japanese Yen (selling Canadian Dollars) |
$ | 6,651 | $ | 75 | 80.2946 | |||||||
| Danish Krone (selling Norwegian Krone) |
$ | 3,702 | $ | (93 | ) | 1.0967 | ||||||
| Pound Sterling (selling (Euros) |
$ | 208 | $ | 1 | 0.8675 | |||||||
| Pound Sterling (selling U.S. Dollars) |
$ | 1,237 | $ | 12 | 1.5361 | |||||||
| U.S. Dollars (selling Canadian Dollars) |
$ | 65 | $ | (4 | ) | 1.0755 | ||||||
| Danish Krone (selling Swedish Krona) |
$ | 9,916 | $ | (459 | ) | 1.2923 | ||||||
|
Foreign Currency |
Year Ending December 31, 2013 |
Fair Value at December 31, 2010 |
Average Contractual Exchange Rate |
|||||||||
| Canadian Dollars |
$ | 21,443 | $ | 1,109 | 1.0768 | |||||||
| Japanese Yen (selling Canadian Dollars) |
$ | 6.565 | $ | 38 | 78.5144 | |||||||
| Danish Krone (selling Swedish Krona) |
$ | 9,455 | $ | (464 | ) | 1.3134 | ||||||
| Foreign Currency |
Year Ending December 31, 2014 |
Fair Value at December 31, 2010 |
Strike Rate | |||||||||
| Canadian Dollars |
$ | 59,420 | $ | 2,813 | 1.0766 | |||||||
| U.S. Dollars (selling Canadian Dollars) |
$ | 468 | $ | (5 | ) | 1.0337 | ||||||
| ITEM 8. | FINANCIAL STATEMENTS AND SUPPLEMENTARY DATA |
57
Table of Contents
Report of Independent Registered Public Accounting Firm
To the Board of Directors and Stockholders of The Babcock & Wilcox Company:
We have audited the accompanying consolidated and combined balance sheets of The Babcock & Wilcox Company and subsidiaries (the “Company”) as of December 31, 2010 and 2009, and the related consolidated and combined statements of income, comprehensive income (loss), stockholders’ equity, parent equity (deficit), and cash flows for each of the three years in the period ended December 31, 2010. These consolidated and combined financial statements are the responsibility of the Company’s management. Our responsibility is to express an opinion on these consolidated and combined financial statements based on our audits.
We conducted our audits in accordance with the standards of the Public Company Accounting Oversight Board (United States). Those standards require that we plan and perform the audit to obtain reasonable assurance about whether the financial statements are free of material misstatement. An audit includes examining, on a test basis, evidence supporting the amounts and disclosures in the financial statements. An audit also includes assessing the accounting principles used and significant estimates made by management, as well as evaluating the overall financial statement presentation. We believe that our audits provide a reasonable basis for our opinion.
In our opinion, such consolidated and combined financial statements present fairly, in all material respects, the financial position of The Babcock & Wilcox Company and subsidiaries as of December 31, 2010 and 2009, and the results of their operations and their cash flows for each of the three years in the period ended December 31, 2010, in conformity with accounting principles generally accepted in the United States of America.
As discussed in Note 1 to the consolidated and combined financial statements, on and prior to July 30, 2010, the combined financial statements were prepared from the separate records maintained by the Company and may not necessarily be indicative of the conditions that would have existed or the results of operations of the Company had it been operated as an independent entity.
We have also audited, in accordance with the standards of the Public Company Accounting Oversight Board (United States), the Company’s internal control over financial reporting as of December 31, 2010, based on the criteria established in Internal Control—Integrated Framework issued by the Committee of Sponsoring Organizations of the Treadway Commission and our report dated March 1, 2011 expressed an unqualified opinion on the Company’s internal control over financial reporting.
/S/ DELOITTE & TOUCHE LLP
Charlotte, North Carolina
March 1, 2011
58
Table of Contents
CONSOLIDATED AND COMBINED BALANCE SHEETS
| December 31, | ||||||||
| 2010 | 2009 | |||||||
| (In thousands) | ||||||||
| ASSETS | ||||||||
| Current Assets: |
||||||||
| Cash and cash equivalents |
$ | 391,142 | $ | 469,468 | ||||
| Restricted cash and cash equivalents |
12,267 | 15,305 | ||||||
| Investments |
234 | 14 | ||||||
| Accounts receivable – trade, net |
289,374 | 319,861 | ||||||
| Accounts receivable – other |
64,231 | 39,289 | ||||||
| Contracts in progress |
225,448 | 245,998 | ||||||
| Inventories |
100,932 | 98,644 | ||||||
| Deferred income taxes |
90,620 | 96,680 | ||||||
| Other current assets |
34,868 | 21,456 | ||||||
| Total Current Assets |
1,209,116 | 1,306,715 | ||||||
| Property, Plant and Equipment |
968,712 | 945,298 | ||||||
| Less accumulated depreciation |
550,400 | 515,237 | ||||||
| Net Property, Plant and Equipment |
418,312 | 430,061 | ||||||
| Investments |
74,863 | 73,540 | ||||||
| Goodwill |
269,424 | 262,866 | ||||||
| Deferred Income Taxes |
236,504 | 270,002 | ||||||
| Investments in Unconsolidated Affiliates |
100,811 | 68,327 | ||||||
| Note Receivable from Affiliate |
— | 42,573 | ||||||
| Other Assets |
191,480 | 149,775 | ||||||
| TOTAL |
$ | 2,500,510 | $ | 2,603,859 | ||||
See accompanying notes to consolidated and combined financial statements.
59
Table of Contents
THE BABCOCK & WILCOX COMPANY
CONSOLIDATED AND COMBINED BALANCE SHEETS
| December 31, | ||||||||
| 2010 | 2009 | |||||||
| (In thousands) | ||||||||
| LIABILITIES AND STOCKHOLDERS’ EQUITY | ||||||||
| Current Liabilities: |
||||||||
| Notes payable and current maturities of long-term debt |
$ | 4,790 | $ | 6,432 | ||||
| Accounts payable |
185,240 | 178,350 | ||||||
| Accounts payable to McDermott International, Inc. |
— | 112,053 | ||||||
| Accrued employee benefits |
235,856 | 198,195 | ||||||
| Accrued liabilities–other |
71,242 | 74,700 | ||||||
| Advance billings on contracts |
369,644 | 537,448 | ||||||
| Accrued warranty expense |
109,588 | 115,055 | ||||||
| Income taxes payable |
5,467 | 12,943 | ||||||
| Total Current Liabilities |
981,827 | 1,235,176 | ||||||
| Long-Term Debt |
855 | 4,222 | ||||||
| Accumulated Postretirement Benefit Obligation |
84,100 | 105,484 | ||||||
| Environmental Liabilities |
40,889 | 47,795 | ||||||
| Pension Liability |
579,000 | 699,117 | ||||||
| Notes Payable to Affiliate |
— | 320,568 | ||||||
| Other Liabilities |
100,314 | 70,791 | ||||||
| Commitments and Contingencies (Note 10) |
||||||||
| Stockholders’ Equity: |
||||||||
| Common stock, par value $0.01 per share, authorized 325,000,000 shares; issued 116,963,664 and 0 shares at December 31, 2010 and December 31, 2009, respectively |
1,170 | — | ||||||
| Preferred stock, par value $0.01 per share, authorized 75,000,000 shares; 0 shares issued |
— | — | ||||||
| Capital in excess of par value |
1,067,414 | — | ||||||
| Retained earnings |
96,671 | — | ||||||
| Treasury stock at cost, 101,649 and 0 shares at December 31, 2010 and December 31, 2009, respectively |
(2,397 | ) | — | |||||
| Accumulated other comprehensive loss |
(449,999 | ) | — | |||||
| Stockholders’ Equity–The Babcock & Wilcox Company |
712,859 | — | ||||||
| Noncontrolling interest |
666 | — | ||||||
| Total Stockholders’ Equity |
713,525 | — | ||||||
| Total Parent Equity |
— | 120,706 | ||||||
| TOTAL |
$ | 2,500,510 | $ | 2,603,859 | ||||
See accompanying notes to consolidated and combined financial statements.
60
Table of Contents
CONSOLIDATED AND COMBINED STATEMENTS OF INCOME
| Year Ended December 31, | ||||||||||||
| 2010 | 2009 | 2008 | ||||||||||
| (In thousands, except per share amounts) | ||||||||||||
| Revenues |
$ | 2,688,811 | $ | 2,854,632 | $ | 3,398,574 | ||||||
| Costs and Expenses: |
||||||||||||
| Cost of operations |
2,024,034 | 2,182,131 | 2,639,477 | |||||||||
| Research and development costs |
69,167 | 53,246 | 38,458 | |||||||||
| (Gains) losses on asset disposals and impairments – net |
38 | 1,226 | (9,603 | ) | ||||||||
| Selling, general and administrative expenses |
405,682 | 403,559 | 337,551 | |||||||||
| Total Costs and Expenses |
2,498,921 | 2,640,162 | 3,005,883 | |||||||||
| Equity in Income of Investees |
74,082 | 55,094 | 51,792 | |||||||||
| Operating Income |
263,972 | 269,564 | 444,483 | |||||||||
| Other Income (Expense): |
||||||||||||
| Interest income |
1,187 | 3,439 | 15,286 | |||||||||
| Interest expense |
(12,939 | ) | (24,590 | ) | (22,740 | ) | ||||||
| Other expense – net |
(16,400 | ) | (16,112 | ) | (4,290 | ) | ||||||
| Total Other Expense |
(28,152 | ) | (37,263 | ) | (11,744 | ) | ||||||
| Income before Provision for Income Taxes |
235,820 | 232,301 | 432,739 | |||||||||
| Provision for Income Taxes |
82,294 | 84,381 | 108,885 | |||||||||
| Net Income |
$ | 153,526 | $ | 147,920 | $ | 323,854 | ||||||
| Less: Net Income attributable to Noncontrolling Interest |
(264 | ) | (156 | ) | (88 | ) | ||||||
| Net Income Attributable to The Babcock & Wilcox Company |
$ | 153,262 | $ | 147,764 | $ | 323,766 | ||||||
| Earnings per Common Share: |
||||||||||||
| Basic: |
||||||||||||
| Net Income Attributable to The Babcock & Wilcox Company |
$ | 1.32 | $ | 1.27 | $ | 2.79 | ||||||
| Diluted: |
||||||||||||
| Net Income Attributable to The Babcock & Wilcox Company |
$ | 1.30 | $ | 1.26 | $ | 2.76 | ||||||
| Shares used in the computation of earnings per share (Note 19): |
||||||||||||
| Basic |
116,260,425 | 116,067,535 | 116,067,535 | |||||||||
| Diluted |
117,626,065 | 117,423,807 | 117,423,807 | |||||||||
See accompanying notes to consolidated and combined financial statements.
61
Table of Contents
CONSOLIDATED AND COMBINED STATEMENTS OF
COMPREHENSIVE INCOME (LOSS)
| Year Ended December 31, | ||||||||||||
| 2010 | 2009 | 2008 | ||||||||||
| (In thousands) | ||||||||||||
| Net Income |
$ | 153,526 | $ | 147,920 | $ | 323,854 | ||||||
| Other Comprehensive Income (Loss): |
||||||||||||
| Foreign currency translation adjustments: |
||||||||||||
| Foreign currency translation adjustments |
7,561 | 22,103 | (24,717 | ) | ||||||||
| Unrealized gains (losses) on derivative financial instruments: |
||||||||||||
| Unrealized gains (losses) on derivative financial instruments |
6,407 | 8,134 | (14,702 | ) | ||||||||
| Reclassification adjustment for gains (losses) included in net income |
1,290 | (1,551 | ) | 752 | ||||||||
| Unrecognized losses on benefit obligations: |
||||||||||||
| Unrecognized losses arising during the period |
(62,059 | ) | (36,872 | ) | (325,846 | ) | ||||||
| Amortization of losses included in net income |
50,571 | 54,962 | 21,217 | |||||||||
| Unrealized gains (losses) on investments: |
||||||||||||
| Unrealized gains (losses) arising during the period |
523 | (339 | ) | 82 | ||||||||
| Reclassification adjustment for net gains included in net income |
122 | 30 | (147 | ) | ||||||||
| Other Comprehensive Income (Loss) |
4,415 | 46,467 | (343,361 | ) | ||||||||
| Total Comprehensive Income (Loss) |
157,941 | 194,387 | (19,507 | ) | ||||||||
| Comprehensive Income Attributable to Noncontrolling Interest |
(243 | ) | (199 | ) | (80 | ) | ||||||
| Comprehensive Income (Loss) Attributable to The Babcock & Wilcox Company |
$ | 157,698 | $ | 194,188 | $ | (19,587 | ) | |||||
See accompanying notes to consolidated and combined financial statements.
62
Table of Contents
CONSOLIDATED AND COMBINED STATEMENT OF STOCKHOLDERS’ EQUITY
(In thousands, except share amounts)
| Common Stock | Capital In Excess of Par Value |
Retained Earnings |
Accumulated Other Comprehensive Income (Loss) |
Treasury Stock |
Parent Equity |
Non- Controlling Interest |
Total Stockholders Equity |
|||||||||||||||||||||||||||||
| Shares | Par Value | |||||||||||||||||||||||||||||||||||
| Balance December 31, 2009 |
— | $ | — | $ | — | $ | — | $ | (546,574 | ) | $ | — | $ | 666,777 | $ | 503 | $ | 120,706 | ||||||||||||||||||
| Net income |
— | — | — | 96,671 | — | — | 56,591 | 264 | 153,526 | |||||||||||||||||||||||||||
| Amortization of benefit plan costs |
— | — | — | — | 50,571 | — | — | — | 50,571 | |||||||||||||||||||||||||||
| Unrealized loss on benefit obligations |
— | — | — | — | (62,059 | ) | — | — | — | (62,059 | ) | |||||||||||||||||||||||||
| Unrealized gain on investments |
— | — | — | — | 645 | — | — | — | 645 | |||||||||||||||||||||||||||
| Translation adjustments |
— | — | — | — | 7,582 | — | — | (21 | ) | 7,561 | ||||||||||||||||||||||||||
| Unrealized gain on derivatives |
— | — | — | — | 7,697 | — | — | — | 7,697 | |||||||||||||||||||||||||||
| Transfer of pension to Parent |
— | — | — | — | 95,539 | — | — | — | 95,539 | |||||||||||||||||||||||||||
| Dividend paid |
— | — | — | — | — | — | (100,000 | ) | — | (100,000 | ) | |||||||||||||||||||||||||
| Net transactions with Parent |
— | — | — | — | (3,400 | ) | — | 429,571 | — | 426,171 | ||||||||||||||||||||||||||
| Reclassification of Parent equity to capital in excess of par value |
— | — | 1,052,939 | — | — | — | (1,052,939 | ) | — | — | ||||||||||||||||||||||||||
| Issuance of common stock at spin-off |
116,225,732 | 1,162 | (1,162 | ) | — | — | — | — | — | — | ||||||||||||||||||||||||||
| Exercise of stock options |
86,004 | 1 | 3,427 | — | — | — | — | — | 3,428 | |||||||||||||||||||||||||||
| Contributions to thrift plan |
218,699 | 2 | 5,171 | — | — | — | — | — | 5,173 | |||||||||||||||||||||||||||
| Shares placed in treasury |
— | — | — | — | — | (2,397 | ) | — | — | (2,397 | ) | |||||||||||||||||||||||||
| Stock-based compensation charges |
433,229 | 5 | 7,039 | — | — | — | — | — | 7,044 | |||||||||||||||||||||||||||
| Distributions to noncontrolling interests |
— | — | — | — | — | — | — | (80 | ) | (80 | ) | |||||||||||||||||||||||||
| Balance December 31, 2010 |
116,963,664 | $ | 1,170 | $ | 1,067,414 | $ | 96,671 | $ | (449,999 | ) | $ | (2,397 | ) | $ | — | $ | 666 | $ | 713,525 | |||||||||||||||||
See accompanying notes to consolidated and combined financial statements.
63
Table of Contents
COMBINED STATEMENTS OF PARENT EQUITY (DEFICIT)
| Accumulated Other Comprehensive Income (Loss) |
Parent Equity |
Non- Controlling Interest |
Total Parent Equity (Deficit) |
|||||||||||||
| (In thousands) | ||||||||||||||||
| Balance December 31, 2007 |
$ | (249,645 | ) | $ | 217,925 | $ | 331 | $ | (31,389 | ) | ||||||
| Net income |
— | 323,766 | 88 | 323,854 | ||||||||||||
| Amortization of benefit plan costs |
21,217 | — | — | 21,217 | ||||||||||||
| Unrecognized losses on benefit obligations |
(325,846 | ) | — | — | (325,846 | ) | ||||||||||
| Unrealized gain on investments |
(65 | ) | — | — | (65 | ) | ||||||||||
| Foreign currency translation adjustments |
(24,709 | ) | — | (8 | ) | (24,717 | ) | |||||||||
| Unrealized loss on derivatives |
(13,950 | ) | — | — | (13,950 | ) | ||||||||||
| Stock-based compensation charges |
— | (18,601 | ) | — | (18,601 | ) | ||||||||||
| Distributions to noncontrolling interests |
— | — | (51 | ) | (51 | ) | ||||||||||
| Balance December 31, 2008 |
$ | (592,998 | ) | $ | 523,090 | $ | 360 | $ | (69,548 | ) | ||||||
| Net income |
— | 147,764 | 156 | 147,920 | ||||||||||||
| Amortization of benefit plan costs |
54,962 | — | — | 54,962 | ||||||||||||
| Unrecognized losses on benefit obligations |
(36,872 | ) | — | — | (36,872 | ) | ||||||||||
| Unrealized gain on investments |
(309 | ) | — | — | (309 | ) | ||||||||||
| Foreign currency translation adjustments |
22,060 | — | 43 | 22,103 | ||||||||||||
| Unrealized loss on derivatives |
6,583 | — | — | 6,583 | ||||||||||||
| Stock-based compensation charges |
— | (4,077 | ) | — | (4,077 | ) | ||||||||||
| Distributions to noncontrolling interests |
— | — | (56 | ) | (56 | ) | ||||||||||
| Balance December 31, 2009 |
$ | (546,574 | ) | $ | 666,777 | $ | 503 | $ | 120,706 | |||||||
See accompanying notes to consolidated and combined financial statements.
64
Table of Contents
CONSOLIDATED AND COMBINED STATEMENTS OF CASH FLOWS
| Year Ended December 31, | ||||||||||||
| 2010 | 2009 | 2008 | ||||||||||
| (In thousands) | ||||||||||||
| CASH FLOWS FROM OPERATING ACTIVITIES: |
||||||||||||
| Net Income |
$ | 153,526 | $ | 147,920 | $ | 323,854 | ||||||
| Non-cash items included in net income: |
||||||||||||
| Depreciation and amortization |
71,633 | 72,712 | 45,985 | |||||||||
| Income of investees, net of dividends |
(20,449 | ) | (4,450 | ) | (2,117 | ) | ||||||
| (Gains) losses on asset disposals and impairments – net |
38 | 1,226 | (9,603 | ) | ||||||||
| Provision for deferred taxes |
33,457 | 29,535 | 23,730 | |||||||||
| Amortization of pension and postretirement costs |
79,935 | 86,637 | 33,735 | |||||||||
| Excess tax benefits from stock-based compensation |
(5,276 | ) | 1,813 | (13,381 | ) | |||||||
| Changes in assets and liabilities, net of effects from acquisitions: |
||||||||||||
| Accounts receivable |
101,260 | 71,316 | (12,901 | ) | ||||||||
| Income taxes receivable |
(18,738 | ) | 11,619 | 43,024 | ||||||||
| Accounts payable |
19,882 | (40,555 | ) | (4,076 | ) | |||||||
| Net contracts in progress and advance billings |
(153,933 | ) | (63,879 | ) | (234,648 | ) | ||||||
| Income taxes |
9,239 | 10,740 | 25,808 | |||||||||
| Accrued and other current liabilities |
(9,761 | ) | (52,556 | ) | 22,503 | |||||||
| Pension liability and accrued postretirement and employee benefits |
(85,371 | ) | (378 | ) | (154,743 | ) | ||||||
| Other |
16,964 | (18,877 | ) | (27,082 | ) | |||||||
| NET CASH PROVIDED BY OPERATING ACTIVITIES |
192,406 | 252,823 | 60,088 | |||||||||
| CASH FLOWS FROM INVESTING ACTIVITIES: |
||||||||||||
| (Increase) decrease in restricted cash and cash equivalents |
3,038 | (8,189 | ) | (2,000 | ) | |||||||
| Purchases of property, plant and equipment |
(63,649 | ) | (93,725 | ) | (63,014 | ) | ||||||
| Acquisition of businesses, net of cash acquired |
(29,962 | ) | (8,497 | ) | (190,878 | ) | ||||||
| Net (increase) decrease in available-for-sale securities |
— | 45,230 | (59,200 | ) | ||||||||
| Purchases of available-for-sale securities |
(135,135 | ) | — | — | ||||||||
| Sales and maturities of available-for-sale securities |
134,276 | — | — | |||||||||
| Proceeds from asset disposals |
753 | 245 | 9,978 | |||||||||
| Investments in unconsolidated affiliates |
(42,912 | ) | (2,700 | ) | — | |||||||
| Decrease in note receivable from affiliate |
43,277 | — | — | |||||||||
| Other |
— | 1 | 551 | |||||||||
| NET CASH USED IN INVESTING ACTIVITIES |
(90,314 | ) | (67,635 | ) | (304,563 | ) | ||||||
| CASH FLOWS FROM FINANCING ACTIVITIES: |
||||||||||||
| Payment of short-term borrowings and long-term debt |
(29,914 | ) | (6,155 | ) | (4,768 | ) | ||||||
| Payment of debt issuance costs |
(9,994 | ) | — | — | ||||||||
| Increase in short-term borrowing |
25,000 | — | 1,460 | |||||||||
| Dividend paid to McDermott International, Inc. |
(100,000 | ) | — | — | ||||||||
| Capital contribution from McDermott International, Inc. |
12,501 | — | — | |||||||||
| Distribution to McDermott International, Inc. |
(43,334 | ) | — | — | ||||||||
| (Decrease) Increase in notes payable to affiliates |
(43,386 | ) | 2,368 | 49,950 | ||||||||
| Excess tax benefits from stock-based compensation |
5,276 | (1,813 | ) | 13,381 | ||||||||
| Other |
118 | — | (1 | ) | ||||||||
| NET CASH PROVIDED BY (USED IN) FINANCING ACTIVITIES |
(183,733 | ) | (5,600 | ) | 60,022 | |||||||
| EFFECTS OF EXCHANGE RATE CHANGES ON CASH |
3,315 | 10,234 | (9,867 | ) | ||||||||
| NET INCREASE (DECREASE) IN CASH AND CASH EQUIVALENTS |
(78,326 | ) | 189,822 | (194,320 | ) | |||||||
| CASH AND CASH EQUIVALENTS AT BEGINNING OF PERIOD |
469,468 | 279,646 | 473,966 | |||||||||
| CASH AND CASH EQUIVALENTS AT END OF PERIOD |
$ | 391,142 | $ | 469,468 | $ | 279,646 | ||||||
| SUPPLEMENTAL DISCLOSURES OF CASH FLOW INFORMATION: |
||||||||||||
| Cash paid (received) during the period for: |
||||||||||||
| Interest (net of amount capitalized) |
$ | 3,746 | $ | 24,728 | $ | 27,520 | ||||||
| Income taxes (net of refunds) |
$ | 27,227 | $ | (29,663 | ) | $ | 12,256 | |||||
See accompanying notes to consolidated and combined financial statements.
65
Table of Contents
NOTES TO CONSOLIDATED AND COMBINED FINANCIAL STATEMENTS
DECEMBER 31, 2010
NOTE 1—BASIS OF PRESENTATION AND SIGNIFICANT ACCOUNTING POLICIES
The Babcock & Wilcox Company (“B&W”) was a wholly owned subsidiary of McDermott International, Inc., a Panamanian corporation (“MII”), until July 30, 2010 when MII distributed 100% of our outstanding common stock to the MII shareholders. On July 2, 2010, MII’s Board of Directors approved the spin-off of B&W through the distribution of shares of B&W common stock to holders of MII common stock. The distribution of B&W common stock was made on July 30, 2010, and consisted of one share of B&W common stock for every two shares of MII common stock to holders of MII common stock as of 5:00 p.m. New York City time on the record date, July 9, 2010. Cash was paid in lieu of any fractional shares of B&W common stock. B&W became a separate publicly traded company, and MII did not retain any ownership interest in B&W. A registration statement on Form 10 describing the spin-off was filed by B&W with the Securities and Exchange Commission and was declared effective on July 8, 2010 (as amended through the time of such effectiveness).
We have presented our consolidated and combined financial statements in U.S. Dollars in accordance with accounting principles generally accepted in the United States (“GAAP”). On and prior to July 30, 2010, our financial position, operating results and cash flows consisted of The Babcock & Wilcox Operations of McDermott International, Inc., (“BWO”), which represented a combined reporting entity comprised of the assets and liabilities involved in managing and operating the Power Generation Systems and Government Operations segments of MII in addition to two captive insurance companies which have been combined and contributed to B&W in conjunction with the spin-off of B&W by MII. On our consolidated and combined balance sheets, the year ended December 31, 2010 consists of the consolidated balances of B&W, while the year ended December 31, 2009 consists of the combined results of BWO. On our consolidated and combined statements of income and cash flows, the twelve months ended December 31, 2010 include the combined results of operations for seven months of BWO and five months of the consolidated results of B&W, while the twelve months ended December 31, 2009 and 2008 consist entirely of the combined results of BWO.
We use the equity method to account for investments in entities that we do not control, but over which we have significant influence. We generally refer to these entities as “joint ventures.” We have eliminated all significant intercompany transactions and accounts.
Certain corporate and general and administrative expenses incurred before the spin-off, including those related to executive management, investor relations, tax, accounting, legal and treasury services, and certain employee benefits, have been allocated based on a level of effort calculation. Our management believes such allocations are reasonable. However, the associated expenses reflected in the accompanying consolidated and combined statements of income may not be indicative of the actual expenses that would have been incurred had the combined businesses been operating as an independent public company for the periods presented. Since the spin-off from MII, B&W has been performing these functions using internal resources or services provided by third parties, certain of which may be provided by MII during a transitional period pursuant to a transition services agreement.
Unless the context otherwise indicates, “we,” “us” and “our” mean B&W and its consolidated and combined subsidiaries.
Before our separation from MII, we entered into a master separation agreement and several other agreements with MII to effect the separation and distribution of our common stock to MII stockholders and provide a framework for B&W’s relationship with MII. These agreements govern the relationship between MII and B&W subsequent to the completion of the spin-off and provide for the allocation between B&W and MII of MII’s assets, liabilities and obligations attributable to periods prior to the spin-off. Because the terms of our
66
Table of Contents
separation from MII and these agreements were entered into in the context of a related-party transaction, these terms may not be comparable to terms that would be obtained in a transaction between unaffiliated parties.
Master Separation Agreement
The master separation agreement between us and MII contains the key provisions relating to the separation of our business from MII and the distribution of our shares of common stock. The master separation agreement identifies the assets that were transferred, liabilities that were assumed and contracts that were assigned to us by MII or by us to MII in the spin-off and describes how these transfers, assumptions and assignments occurred. Under the master separation agreement generally, we are indemnifying MII and its remaining subsidiaries against various claims and liabilities including those related to the past operation of our business and 50% of the amount of uninsured liabilities arising out of MII’s securities litigation pending as of July 30, 2010 in the United States District for the Southern District of Texas.
Tax Sharing Agreement
We and a subsidiary of MII have entered into an agreement providing for the sharing of taxes incurred before and after the distribution, various indemnification rights with respect to tax matters and restrictions to preserve the tax-free status of the distribution to MII. Under the terms of the tax sharing agreement, we are generally responsible for any taxes imposed on us or MII and its subsidiaries in the event that certain transactions related to the spin-off fail to qualify for tax-free treatment. However, if these transactions fail to qualify for tax-free treatment because of actions or failures to act by MII or its subsidiaries, a subsidiary of MII would be responsible for all such taxes.
Transition Services Agreements
Under certain transition services agreements, we and MII are providing each other certain transition services on an interim basis. Such services may include accounting, human resources, information technology, legal, risk management, tax and treasury. In consideration for such services, we and MII each pay fees to the other for the services provided, and those fees are generally in amounts intended to allow the party providing the services to recover its direct and indirect costs incurred in providing those services. The transition services agreements contain customary mutual indemnification provisions.
Business Segments
We operate in two business segments: Power Generation Systems and Government Operations. Our segments are further described as follows:
| • | Our Power Generation Systems segment supplies boilers fired with fossil fuels, such as coal, oil and natural gas, or renewable fuels such as biomass, municipal solid waste and concentrated solar energy. In addition, we supply commercial nuclear steam generators and components, environmental equipment and components, and related services to customers in different regions around the world. We design, engineer, manufacture, supply, construct and service large utility and industrial power generation systems, including boilers used to generate steam in electric power plants, pulp and paper making, chemical and process applications and other industrial uses. |
| • | Our Government Operations segment manufactures nuclear components and provides various services to the U.S. Government, including uranium processing, environmental site restoration services and management and operating services for various U.S. Government-owned facilities. These services are provided to the Department of Energy (“DOE”), including the National Nuclear Security Administration, the Office of Nuclear Energy, the Office of Science and the Office of Environmental Management. |
The consolidated and combined results of operations, financial position and cash flows for the year ended December 31, 2010 are not necessarily indicative of the results that may be expected for the year ending
67
Table of Contents
December 31, 2011. Furthermore, these results do not necessarily reflect what the consolidated and combined results of operations, financial position and cash flows would have been had the consolidated and combined businesses operated as an independent public company during the periods presented, including changes in its operations and capitalization as a result of the spin-off from MII.
Use of Estimates
We use estimates and assumptions to prepare our financial statements in conformity with GAAP. Some of our more significant estimates include our estimate of costs to complete long-term construction contracts and estimates we make in selecting assumptions related to the valuations of our pension and post employment plans, including the selection of our discount rates and expected rates of return on our pension plan assets. These estimates and assumptions affect the amounts we report in our financial statements and accompanying notes. Our actual results could differ from these estimates. Variances could result in a material effect on our financial condition and results of operations in future periods.
Earnings Per Share
We have computed earnings per common share on the basis of the weighted average number of common shares, and, where dilutive, common share equivalents, outstanding during the indicated periods. On July 30, 2010, 116,225,732 shares of our common stock were distributed to MII shareholders to complete our spin-off from MII. For comparative purposes, and to provide a more meaningful calculation of weighted average shares, we have assumed this amount to be outstanding as of the beginning of each period presented in our calculation of basic weighted average shares. In addition, for our dilutive weighted average share calculations, we have assumed the dilutive securities outstanding at July 30, 2010 were also outstanding at each of the prior periods presented.
Investments
Our investments, primarily government obligations and other highly liquid money market instruments, are classified as available-for-sale and are carried at fair value, with the unrealized gains and losses, net of tax, reported as a component of accumulated other comprehensive loss. We classify investments available for current operations in the balance sheet as current assets, while we classify investments held for long-term purposes as noncurrent assets. We adjust the amortized cost of debt securities for amortization of premiums and accretion of discounts to maturity. That amortization is included in interest income. We include realized gains and losses on our investments in other expense – net. The cost of securities sold is based on the specific identification method. We include interest on securities in interest income.
Foreign Currency Translation
We translate assets and liabilities of our foreign operations, into U.S. Dollars at current exchange rates, and we translate income statement items at average exchange rates for the periods presented. We record adjustments resulting from the translation of foreign currency financial statements as a component of accumulated other comprehensive loss. We report foreign currency transaction gains and losses in income. We have included in other expense—net transaction losses of $6.5 million, $5.4 million and $0.5 million for the years ended December 31, 2010, 2009 and 2008, respectively.
Contracts and Revenue Recognition
We generally recognize contract revenues and related costs on a percentage-of-completion method for individual contracts or combinations of contracts based on work performed, man hours, or a cost-to-cost method, as applicable to the product or activity involved. Under this method, we recognize estimated contract revenue and resulting income based on costs incurred to date as a percentage of total estimated costs. Certain costs may be excluded from the cost-to-cost method of measuring progress, such as significant costs for materials and major
68
Table of Contents
third-party subcontractors, if it appears that such exclusion would result in a more meaningful measurement of actual contract progress and resulting periodic allocation of income. We include revenues and related costs so recorded, plus accumulated contract costs that exceed amounts invoiced to customers under the terms of the contracts, in contracts in progress. We include in advance billings on contracts billings that exceed accumulated contract costs and revenues and costs recognized under the percentage-of-completion method. Most long-term contracts contain provisions for progress payments. Our unbilled receivables do not contain an allowance for credit losses as we expect to invoice customers and collect all amounts for unbilled revenues. Approximately 70% of our unbilled revenues relate to contracts with the U.S. Government, while the remaining unbilled contract revenue relates to high credit quality commercial customers. We review contract price and cost estimates periodically as the work progresses and reflect adjustments proportionate to the percentage-of-completion in income in the period when those estimates are revised. For all contracts, if a current estimate of total contract cost indicates a loss on a contract, the projected loss is recognized in full when determined.
For contracts as to which we are unable to estimate the final profitability except to assure that no loss will ultimately be incurred, we recognize equal amounts of revenue and cost until the final results can be estimated more precisely. For these deferred profit recognition contracts, we recognize revenue and cost equally and only recognize gross margin when probable and reasonably estimable, which we generally determine to be when the contract is approximately 70% complete. We treat long-term construction contracts that contain such a level of risk and uncertainty that estimation of the final outcome is impractical, except to assure that no loss will be incurred, as deferred profit recognition contracts.
Our policy is to account for fixed-price contracts under the completed-contract method if we believe that we are unable to reasonably forecast cost to complete at start-up. Under the completed-contract method, income is recognized only when a contract is completed or substantially complete.
For certain parts orders and after market services activities, we recognize revenues as goods are delivered and work is performed.
Variations from estimated contract performance could result in material adjustments to operating results for any fiscal quarter or year. We include claims for extra work or changes in scope of work to the extent of costs incurred in contract revenues when we believe collection is probable.
The following represent the components of our contracts in progress and advance billings on contracts included in our consolidated and combined balance sheets:
| December 31, | ||||||||
| 2010 | 2009 | |||||||
| (In thousands) | ||||||||
| Included in Contracts in Progress: |
||||||||
| Costs incurred less costs of revenue recognized |
$ | 63,233 | $ | 47,085 | ||||
| Revenues recognized less billings to customers |
162,215 | 198,913 | ||||||
| Contracts In Progress |
$ | 225,448 | $ | 245,998 | ||||
| Included In Advance Billings on Contracts: |
||||||||
| Billings to customers less revenues recognized |
$ | 445,076 | $ | 634,111 | ||||
| Costs incurred less costs of revenue recognized |
(75,432 | ) | (96,663 | ) | ||||
| Advance Billings on Contracts |
$ | 369,644 | $ | 537,448 | ||||
69
Table of Contents
The following amounts represent retainages on contracts:
| December 31, | ||||||||
| 2010 | 2009 | |||||||
| (In thousands) | ||||||||
| Retainages expected to be collected within one year |
$ | 75,630 | $ | 94,561 | ||||
| Retainages expected to be collected after one year |
7,192 | 16,919 | ||||||
| Total retainages |
$ | 82,822 | $ | 111,480 | ||||
We have included in accounts receivable – trade retainages expected to be collected in 2011. Retainages expected to be collected after one year are included in other assets. Of the long-term retainages at December 31, 2010, we anticipate collecting $2.7 million in 2012, $1.3 million in 2013, $2.9 million in 2014, and $0.3 million in 2015.
Comprehensive Loss
The components of accumulated other comprehensive loss included in stockholders’ and parent equity are as follows:
| December 31, | ||||||||
| 2010 | 2009 | |||||||
| (In thousands) | ||||||||
| Currency translation adjustments |
$ | 35,910 | $ | 31,728 | ||||
| Net unrealized gain (loss) on investments |
270 | (375 | ) | |||||
| Net unrealized gain (loss) on derivative financial instruments |
1,939 | (5,758 | ) | |||||
| Unrecognized losses on benefit obligations |
(488,118 | ) | (572,169 | ) | ||||
| Accumulated other comprehensive loss |
$ | (449,999 | ) | $ | (546,574 | ) | ||
Warranty Expense
We accrue estimated expense, included in cost of operations on our consolidated and combined statements of income, to satisfy contractual warranty requirements when we recognize the associated revenue on the related contracts. In addition, we make specific provisions where we expect the actual warranty costs to significantly exceed the accrued estimates. Such specific provisions could have a material effect on our consolidated financial condition, results of operations and cash flows.
The following summarizes the changes in the carrying amount of accrued warranty expense:
| Year Ended December 31, | ||||||||||||
| 2010 | 2009 | 2008 | ||||||||||
| (In thousands) | ||||||||||||
| Balance at beginning of period |
$ | 115,055 | $ | 119,722 | $ | 100,650 | ||||||
| Additions and adjustments |
5,065 | 13,475 | 27,031 | |||||||||
| Charges |
(10,532 | ) | (18,142 | ) | (7,959 | ) | ||||||
| Balance at end of period |
$ | 109,588 | $ | 115,055 | $ | 119,722 | ||||||
Our additions and adjustments to accrued warranty expense included favorable adjustments and resolutions reached with certain customers.
70
Table of Contents
Asset Retirement Obligations and Environmental Clean-up Costs
We accrue for future decommissioning of our nuclear facilities that will permit the release of these facilities to unrestricted use at the end of each facility’s life, which is a requirement of our licenses from the U.S. Nuclear Regulatory Commission (the “NRC”). In accordance with the FASB Topic Asset Retirement and Environmental Obligations, we record the fair value of a liability for an asset retirement obligation in the period in which it is incurred. When we initially record such a liability, we capitalize a cost by increasing the carrying amount of the related long-lived asset. Over time, the liability is accreted to its present value each period and the capitalized cost is depreciated over the useful life of the related asset. Upon settlement of a liability, we will settle the obligation for its recorded amount or incur a gain or loss. This topic applies to environmental liabilities associated with assets that we currently operate and are obligated to remove from service. For environmental liabilities associated with assets that we no longer operate, we have accrued amounts based on the estimated costs of clean-up activities for which we are responsible, net of any cost-sharing arrangements. We adjust the estimated costs as further information develops or circumstances change. An exception to this accounting treatment relates to the work we perform for two facilities for which the U.S. Government is obligated to pay all of the decommissioning costs.
Substantially all of our asset retirement obligations relate to the remediation of our nuclear analytical laboratory and the Nuclear Fuel Services, Inc. (“NFS”) facility in our Government Operations segment. The following table reflects our asset retirement obligations:
| Year Ended December 31, | ||||||||||||
| 2010 | 2009 | 2008 | ||||||||||
| (In thousands) | ||||||||||||
| Balance at beginning of period |
$ | 29,491 | $ | 25,647 | $ | 9,328 | ||||||
| Acquisition of Nuclear Fuel Services, Inc. (Note 2) |
— | 1,627 | 15,281 | |||||||||
| Additions |
— | 300 | — | |||||||||
| Accretion |
3,166 | 1,917 | 1,038 | |||||||||
| Balance at end of period |
$ | 32,657 | $ | 29,491 | $ | 25,647 | ||||||
Research and Development
Our research and development activities are related to the development and improvement of new and existing products and equipment, as well as conceptual and engineering evaluation for translation into practical applications. We charge to research and development cost the costs of research and development unrelated to specific contracts as incurred. Substantially all of these costs are in our Power Generation Systems segment and include costs related to the development of carbon capture and sequestration technology and our modular and nuclear reactor business, B&W mPowerTM. Contractual arrangements for customer-sponsored research and development can vary on a case-by-case basis and include contracts, cooperative agreements and grants. Research and development activities totaled $102.1 million, $78.3 million and $56.2 million in the years ended December 31, 2010, 2009 and 2008, respectively, which include amounts paid for by our customers of $32.9 million, $25.1 million and $17.7 million, respectively.
71
Table of Contents
Inventories
We carry our inventories at the lower of cost or market. We determine cost principally on the first-in, first-out basis, except for certain materials inventories of our Power Generation Systems segment, for which we use the last-in, first-out (“LIFO”) method. We determined the cost of approximately 18% and 17% of our total inventories using the LIFO method at December 31, 2010 and 2009, respectively, and our total LIFO reserve at December 31, 2010 and 2009 was approximately $6.4 million and $6.6 million, respectively. Inventories are summarized below:
| December 31, | ||||||||
| 2010 | 2009 | |||||||
| (In thousands) | ||||||||
| Raw Materials and Supplies |
$ | 72,917 | $ | 71,207 | ||||
| Work in Progress |
7,541 | 6,381 | ||||||
| Finished Goods |
20,474 | 21,056 | ||||||
| Total Inventories |
$ | 100,932 | $ | 98,644 | ||||
Property, Plant and Equipment
We carry our property, plant and equipment at depreciated cost, less any impairment provisions.
We depreciate our property, plant and equipment using the straight-line method over estimated economic useful lives of eight to 40 years for buildings and two to 28 years for machinery and equipment. Our depreciation expense was $61.1 million, $62.6 million and $41.3 million for the years ended December 31, 2010, 2009 and 2008, respectively.
We expense the costs of maintenance, repairs and renewals that do not materially prolong the useful life of an asset as we incur them.
Property, plant and equipment is stated at cost and is set forth below:
| December 31, | ||||||||
| 2010 | 2009 | |||||||
| (In thousands) | ||||||||
| Land |
$ | 11,807 | $ | 12,158 | ||||
| Buildings |
225,176 | 218,556 | ||||||
| Machinery and equipment |
684,647 | 629,950 | ||||||
| Property under construction |
47,082 | 84,634 | ||||||
| 968,712 | 945,298 | |||||||
| Less accumulated depreciation |
550,400 | 515,237 | ||||||
| Net Property, Plant and Equipment |
$ | 418,312 | $ | 430,061 | ||||
Investments in Unconsolidated Affiliates
We use the equity method of accounting for affiliates in which our investment ownership ranges from 20% to 50%, unless significant economic or governance considerations indicate that we are unable to exert significant influence, in which case the cost method is used. The equity method is also used for affiliates in which our investment ownership is greater than 50% but we do not have a controlling interest. Currently, all of our material investments in affiliates that are not consolidated are recorded using the equity method. Affiliates in which our investment ownership is less than 20% and where we are unable to exert significant influence are carried at cost.
72
Table of Contents
Goodwill
The following summarizes the changes in the carrying amount of goodwill:
| Power Generation Systems |
Government Operations |
Total | ||||||||||
| (In thousands) | ||||||||||||
| Balance at December 31, 2008 |
$ | 87,679 | $ | 175,473 | $ | 263,152 | ||||||
| Adjustment related to the acquisition of Nuclear Fuel Services, Inc. (Note 2) |
— | (8,066 | ) | (8,066 | ) | |||||||
| B&W de Monterrey Asset Acquisition (Note 2) |
7,442 | — | 7,442 | |||||||||
| Foreign currency translation adjustments |
338 | — | 338 | |||||||||
| Balance at December 31, 2009 |
$ | 95,459 | $ | 167,407 | $ | 262,866 | ||||||
| Acquisition of GE Energy Businesses (Note 2) |
4,796 | — | 4,796 | |||||||||
| Miljo Asset Acquisition (Note 2) |
3,211 | — | 3,211 | |||||||||
| Foreign currency translation adjustments and other |
(1,449 | ) | — | (1,449 | ) | |||||||
| Balance at December 31, 2010 |
$ | 102,017 | $ | 167,407 | $ | 269,424 | ||||||
Other Intangible Assets
We report our other intangible assets in other assets. We amortize those intangible assets with definite lives to operating expense using the straight-line method.
Other assets include the following other intangible assets:
| Year Ended December 31, | ||||||||||||
| 2010 | 2009 | 2008 | ||||||||||
| (In thousands) | ||||||||||||
| Amortized intangible assets: |
||||||||||||
| Gross cost: |
||||||||||||
| Customer relationships |
$ | 37,167 | $ | 30,950 | $ | 31,150 | ||||||
| Acquired backlog |
19,335 | 18,720 | 17,280 | |||||||||
| Trade name |
12,291 | 10,680 | 3,820 | |||||||||
| Unpatented technology |
5,902 | 5,600 | 5,600 | |||||||||
| Patented technology |
6,625 | 4,440 | 4,060 | |||||||||
| All other |
11,935 | 8,585 | 10,983 | |||||||||
| Total |
$ | 93,255 | $ | 78,975 | $ | 72,893 | ||||||
| Accumulated amortization: |
||||||||||||
| Customer relationships |
$ | (6,026 | ) | $ | (3,726 | ) | $ | (1,985 | ) | |||
| Acquired backlog |
(12,701 | ) | (7,746 | ) | (3,407 | ) | ||||||
| Trade name |
(4,260 | ) | (2,371 | ) | (683 | ) | ||||||
| Unpatented technology |
(1,407 | ) | (837 | ) | (277 | ) | ||||||
| Patented technology |
(2,096 | ) | (888 | ) | — | |||||||
| All other |
(6,296 | ) | (5,163 | ) | (4,459 | ) | ||||||
| Total |
$ | (32,786 | ) | $ | (20,731 | ) | $ | (10,811 | ) | |||
| Net amortized intangible assets |
$ | 60,469 | $ | 58,244 | $ | 62,082 | ||||||
| Unamortized intangible assets: |
||||||||||||
| NRC category 1 license |
$ | 43,830 | $ | 43,830 | $ | 42,370 | ||||||
| Trademarks and trade names |
1,305 | 1,305 | 7,395 | |||||||||
| Total unamortized intangible assets |
$ | 45,135 | $ | 45,135 | $ | 49,765 | ||||||
73
Table of Contents
The following summarizes the changes in the carrying amount of other intangible assets:
| Year Ended December 31, | ||||||||||||
| 2010 | 2009 | 2008 | ||||||||||
| (In thousands) | ||||||||||||
| Balance at beginning of period |
$ | 103,379 | $ | 111,847 | $ | 33,889 | ||||||
| Business acquisitions & additions |
14,280 | — | 82,630 | |||||||||
| Amortization expense |
(11,679 | ) | (9,975 | ) | (4,672 | ) | ||||||
| Foreign currency translation adjustments and other |
(376 | ) | 1,507 | — | ||||||||
| Balance at end of period |
$ | 105,604 | $ | 103,379 | $ | 111,847 | ||||||
The estimated amortization expense for the next five fiscal years is as follows (in thousands):
| Year Ending December 31, |
Amount | |||
| 2011 |
$ | 9,153 | ||
| 2012 |
$ | 8,622 | ||
| 2013 |
$ | 6,208 | ||
| 2014 |
$ | 5,119 | ||
| 2015 |
$ | 3,960 | ||
Other Non-Current Assets
We have included deferred debt issuance costs in other assets. We amortize deferred debt issuance costs as interest expense over the life of the related debt. The following summarizes the changes in the carrying amount of these assets:
| Year Ended December 31, | ||||||||||||
| 2010 | 2009 | 2008 | ||||||||||
| (In thousands) | ||||||||||||
| Balance at beginning of period |
$ | 1,898 | $ | 4,169 | $ | 6,440 | ||||||
| Additions |
9,994 | — | — | |||||||||
| Interest expense – debt issuance costs |
(3,790 | ) | (2,271 | ) | (2,271 | ) | ||||||
| Balance at end of period |
$ | 8,102 | $ | 1,898 | $ | 4,169 | ||||||
Capitalization of Interest Cost
We capitalize interest in accordance with the FASB Topic Interest. We incurred total interest of $14.8 million, $27.4 million and $24.7 million in the years ended December 31, 2010, 2009 and 2008, respectively, of which we capitalized $1.9 million, $2.8 million and $1.9 million in the years ended December 31, 2010, 2009 and 2008, respectively.
Cash and Cash Equivalents and Restricted Cash
Our cash equivalents are highly liquid investments, with maturities of three months or less when we purchase them.
We record current cash and cash equivalents as restricted when we are unable to freely use such cash and cash equivalents for our general operating purposes. At December 31, 2010, we had restricted cash and cash equivalents totaling $16.2 million, $7.5 million of which was held in restricted foreign cash accounts, $3.5 million of which was held as cash collateral for letters of credit, $4.0 million of which was held for future decommissioning of facilities (which is included in other assets on our consolidated and combined balance sheets), $0.2 million of which was held to meet reinsurance reserve requirements of our captive insurer, and $1.0 million of which was held in money market funds maintained by our captive insurer.
74
Table of Contents
Derivative Financial Instruments
Our global operations give rise to exposure to market risks from changes in foreign exchange rates. We use derivative financial instruments to reduce the impact of changes in foreign exchange rates on our operating results. We use these instruments primarily to hedge our exposure associated with revenues or costs on our long-term contracts that are denominated in currencies other than our operating entities’ functional currencies. We do not hold or issue financial instruments for trading or other speculative purposes.
We enter into derivative financial instruments primarily as hedges of certain firm purchase and sale commitments denominated in foreign currencies. We record these contracts at fair value on our consolidated and combined balance sheets. Depending on the hedge designation at the inception of the contract, the related gains and losses on these contracts are either deferred in stockholders’ equity (as a component of accumulated other comprehensive loss) until the hedged item is recognized in earnings or offset against the change in fair value of the hedged firm commitment through earnings. Any ineffective portion of a derivative’s change in fair value is immediately recognized in earnings. The gain or loss on a derivative financial instrument not designated as a hedging instrument is also immediately recognized in earnings. Gains and losses on derivative financial instruments that require immediate recognition are included as a component of other expense – net in our consolidated and combined statements of income.
Self-Insurance
We have a wholly owned insurance subsidiary that provides employer’s liability, general and automotive liability and workers’ compensation insurance and, from time to time, builder’s risk insurance (within certain limits) to our companies. We may also, in the future, have this insurance subsidiary accept other risks that we cannot or do not wish to transfer to outside insurance companies. Included in other liabilities on our consolidated and combined balance sheets are reserves for self-insurance totaling $49.0 million and $56.8 million at December 31, 2010 and 2009, respectively.
Loss Contingencies
We estimate liabilities for loss contingencies when it is probable that a liability has been incurred and the amount of loss is reasonably estimable. We provide disclosure when there is a reasonable possibility that the ultimate loss will exceed the recorded provision or if such probable loss is not reasonably estimable. We are currently involved in certain significant litigation, as discussed in Note 10. We have accrued our estimates of the probable losses associated with these matters. However, our losses are typically resolved over long periods of time and are often difficult to estimate due to various factors, including the possibility of multiple actions by third parties. Therefore, it is possible future earnings could be affected by changes in our estimates related to these matters.
Stock-Based Compensation
We expense stock-based compensation in accordance with FASB Topic Compensation – Stock Compensation. Under this topic, the fair value of equity-classified awards, such as restricted stock, performance shares and stock options, is determined on the date of grant and is not remeasured. Grant date fair values for restricted stock and performance shares are determined using the closing price of our common stock on the date of grant. Grant date fair values for stock options are determined using a Black-Scholes option-pricing model (“Black-Scholes”). The determination of the fair value of a share-based payment award on the date of grant using an option-pricing model requires the input of highly subjective assumptions, such as the expected life of the award and stock price volatility. For liability-classified awards, such as cash-settled restricted stock units and performance units, fair values are determined at grant date using the closing price of our common stock and are remeasured at the end of each reporting period through the date of settlement. Prior to August 1, 2010, all of our stock-based compensation expense was attributable to our participation in MII legacy stock-based compensation plans. Expense recognized prior to August 1, 2010 was based on the fair value of MII’s stock based compensation awards.
75
Table of Contents
Under the provisions of this FASB topic, we recognize expense based on the grant date fair value, net of an estimated forfeiture rate, for all share-based awards granted on a straight-line basis over the requisite service periods of the awards, which is generally equivalent to the vesting term. This topic requires compensation expense to be recognized, net of an estimate for forfeitures, such that compensation expense is recorded only for those awards expected to vest. We review the estimate for forfeitures periodically and record any adjustments deemed necessary for each reporting period. If our actual forfeiture rate is materially different from our estimate, the stock-based compensation expense could be significantly different from what we have recorded in the current period.
Additionally, this FASB topic amended the FASB Topic Statement of Cash Flows, to require excess tax benefits to be reported as a financing cash flow, rather than as a reduction of taxes paid. These excess tax benefits result from tax deductions in excess of the cumulative compensation expense recognized for options exercised and other equity-classified awards.
See Note 9 for a further discussion of stock-based compensation.
Recently Adopted Accounting Standards
In July 2010, the Financial Accounting Standards Board (“FASB”) issued an update to the topic Receivables. This update requires additional disclosures about the credit quality of financing receivables and the allowance for credit losses to enable financial statement users to evaluate (1) the nature of credit risk inherent in the entity’s portfolio of financing receivables, (2) how that risk is analyzed and assessed in arriving at the allowance for credit losses, and (3) the changes and reasons for those changes in the allowance for credit losses. On December 31, 2010, we adopted this revision. The adoption of this revision did not have an impact on our consolidated and combined financial statements.
In January 2010, the FASB issued an update to the topic Fair Value Measurements and Disclosures. This update adds new fair value disclosures for certain transfers of investments between Level 1 and Level 2 measurements and clarifies existing disclosures regarding valuation techniques. On January 1, 2010, we adopted this revision. The adoption of this revision did not have an impact on our consolidated and combined financial statements.
In January 2010, the FASB issued a revision to the topic Consolidation. This revision clarifies the scope of partial sale and deconsolidation provisions related to acquisitions and noncontrolling interests. On January 1, 2010, we adopted this revision. The adoption of this revision did not have an impact on our consolidated and combined financial statements.
In June 2009, the FASB issued a revision to the topic Consolidation. This revision was subsequently amended in December 2009 and February 2010. These revisions expand the scope of this topic and amend guidance for assessing and analyzing variable interest entities. These revisions were effective on January 1, 2010 and had no impact on our consolidated and combined financial statements.
New Accounting Standards
In January 2010, the FASB issued a revision to the topic Fair Value Measurements and Disclosures. This revision sets forth new rules on providing enhanced information for Level 3 measurements. The disclosure provisions under this revision will be effective for us in 2011, in both interim and annual disclosures. We do not expect the adoption of this revision to have a material impact on our consolidated and combined financial statements.
76
Table of Contents
NOTE 2—BUSINESS ACQUISITIONS AND INVESTMENTS
GE Energy Businesses
On April 2, 2010, we acquired the assets of the electrostatic precipitator aftermarket and emissions monitoring business units of GE Energy, a division of General Electric Company, for approximately $21.4 million. This acquisition includes GE Energy’s electrostatic precipitator replacement parts and mechanical components product lines, performance-enhancing hardware, controls and software, remote diagnostics equipment and emissions monitoring products and services. These products and services are used by a wide variety of power generation and industrial customers to monitor and control particulates and other emissions from power plants, factories and other facilities. These business units maintain offices in the United States in Kansas City, Missouri; Folkston, Georgia; Newport News, Virginia and Hatfield, Pennsylvania, as well as locations in Germany and China.
In connection with the GE acquisition, we recorded goodwill of $4.8 million, property, plant and equipment of $4.0 million, intangible assets of $5.5 million, and other net assets totaling $7.1 million. The intangible assets consist of the following (dollar amounts in thousands):
| Amount | Amortization Period |
|||||||
| Customer relationships |
$ | 3,700 | 10 years | |||||
| Patented technology |
$ | 1,000 | 10 years | |||||
| Backlog |
$ | 400 | 1.5 years | |||||
| Tradename |
$ | 400 | 10 years | |||||
Götaverken Miljö AB
In January 2010, we acquired the net assets of Gőtaverken Miljő AB (GMAB), a flue gas cleaning and energy recovery company based in Gothenburg, Sweden for approximately $8.6 million. In connection with this acquisition, we recorded goodwill of $3.2 million, intangible assets of $6.4 million, and other net liabilities totaling $1.0 million The intangible assets consist of the following (dollar amounts in thousands):
| Amount | Amortization Period |
|||||||
| Patented technology |
$ | 2,460 | 15 years | |||||
| Customer relationships |
$ | 2,120 | 12 years | |||||
| Tradenames and trademarks |
$ | 1,160 | 20 years | |||||
| Backlog |
$ | 610 | 0.5 years | |||||
Instrumentacion y Mantenimiento de Calderas, S.A.
In September 2009, one of our subsidiaries, B&W de Monterrey, acquired certain assets of Instrumentacion y Mantenimiento de Calderas, S.A. In connection with this acquisition, we recorded goodwill of approximately $7.4 million, property, plant and equipment of approximately $4.2 million and other current assets of approximately $0.7 million.
77
Table of Contents
Nuclear Fuel Services, Inc.
On December 31, 2008, a B&W subsidiary completed its acquisition of Nuclear Fuel Services, Inc. (“NFS”) for $157.1 million, net of cash acquired. NFS is a provider of specialty nuclear fuels and related services and is a leader in the conversion of Cold War-era government stockpiles of highly enriched uranium into commercial-grade nuclear reactor fuel. NFS also owns and operates a nuclear fuel fabrication facility licensed by the NRC in Erwin, Tennessee and has approximately 700 employees. In connection with the acquisition of NFS, we recorded goodwill of $123.5 million, none of which will be deductible for tax purposes, other intangible assets of $63.4 million, and other net liabilities totaling $29.8 million. Intangible assets consist of the following (dollar amounts in thousands):
| Amount | Amortization Period |
|||||||
| NRC category 1 license |
$ | 43,830 | Indefinite | |||||
| Backlog |
$ | 9,180 | 4 years | |||||
| Tradename |
$ | 6,860 | 6 years | |||||
| Patented technology |
$ | 4,440 | 5 years | |||||
| Non-compete agreement |
$ | 610 | 5 years | |||||
During 2009, we finalized our purchase price allocation for the NFS acquisition, which we completed on December 31, 2008. The purchase price adjustments included a reduction in goodwill of approximately $8.1 million, an increase in property, plant and equipment of approximately $16.2 million and an increase in environmental reserves of approximately $13.5 million.
The Intech Group of Companies
On July 15, 2008, certain B&W subsidiaries completed their acquisition of the Intech group of companies (“Intech”) for $20.2 million. Intech consists of Intech, Inc., Ivey-Cooper Services, L.L.C. and Intech International Inc. Intech, Inc. provides nuclear inspection and maintenance services, primarily for the U.S. market. Ivey-Cooper Services, L.L.C. provides non-destructive inspection services to fossil-fueled power plants, as well as chemical, pulp and paper, and heavy fabrication facilities. Intech International Inc. provides non-destructive testing, field engineering and repair and specialized tooling services, primarily for the Canadian nuclear power generation industry. In connection with the acquisition of Intech, we recorded goodwill of $8.2 million, other intangible assets of $10.0 million, and other net assets of $2.0 million. Intangible assets consist of the following (dollar amounts in thousands):
| Amortization | ||||||||
| Amount | Period | |||||||
| Unpatented technology |
$ | 5,600 | 10 years | |||||
| Customer relationships |
$ | 2,600 | 10 years | |||||
| Tradename |
$ | 1,800 | 10 years | |||||
Delta Power Services, LLC
On August 1, 2008, a B&W subsidiary completed its acquisition of Delta Power Services, LLC (“DPS”) for $13.5 million. DPS is a provider of operation and maintenance services for the U.S. power generation industry. Headquartered in Houston, Texas, DPS has approximately 200 employees at nine gas, biomass or coal-fired power plants in Virginia, California, Texas, Florida, Michigan and Massachusetts. In connection with the acquisition of DPS, we recorded goodwill of $3.7 million, other intangible assets of $9.3 million, and other net assets totaling $0.5 million. Intangible assets consist of the following (dollar amounts in thousands):
| Amortization | ||||||||
| Amount | Period | |||||||
| Customer relationships |
$ | 8,760 | 1.4-20 years | |||||
| Tradename |
$ | 250 | 25 years | |||||
| Non-compete agreement |
$ | 240 | 3 years | |||||
78
Table of Contents
USEC, Inc. Investment
In May of 2010, we and Toshiba Corporation signed an agreement to make a strategic investment in USEC, Inc. (“USEC”) totaling $200 million payable over three phases. On September 2, 2010, following the satisfaction of conditions, including the availability to USEC’s American Centrifuge project of at least $2 billion in uncommitted funds under the DOE’s loan guarantee program for front-end nuclear fuel facilities and the establishment of a joint venture between us and USEC for supply by the joint venture of centrifuges and related equipment for the American Centrifuge project, we made a $37.5 million investment in USEC as part of a definitive agreement for us to make a total $100 million strategic investment in USEC.
We received 37,500 shares of USEC Series B-1 12.75% Convertible Preferred Stock and Warrants to purchase 3,125,000 shares of USEC Class B Common Stock at an exercise price of $7.50 per share which are exercisable between January 1, 2015 and December 31, 2016, and a seat on USEC’s board of directors. We have accounted for the Preferred Stock as a cost method investment, and the Warrants as a derivative financial instrument. We will adjust the fair value of the Warrants on a quarterly basis through current period earnings. Both instruments are included in other assets on our consolidated and combined balance sheets and the Warrants are Level 3 in nature.
The second phase of this strategic investment, of which our share will be $25 million, will occur when, among other things, USEC secures a conditional commitment on a $2 billion loan guarantee from the DOE. The balance of our investment, which will be $37.5 million, is conditioned, among other things, on closing the loan under the DOE’s loan guarantee program for USEC’s American Centrifuge Plant and shareholder approval of certain matters by USEC shareholders.
NOTE 3—EQUITY METHOD INVESTMENTS
We have investments in entities that we account for using the equity method. The undistributed earnings of our equity method investees were $73.0 million and $44.2 million at December 31, 2010 and 2009, respectively.
Summarized below is combined balance sheet and income statement information, based on the most recent financial information, for investments in entities we accounted for using the equity method:
| December 31, | ||||||||
| 2010 | 2009 | |||||||
| (In thousands) | ||||||||
| Current assets |
$ | 391,564 | $ | 360,992 | ||||
| Noncurrent assets |
163,905 | 78,559 | ||||||
| Total Assets |
$ | 555,469 | $ | 439,551 | ||||
| Current liabilities |
$ | 288,970 | $ | 234,451 | ||||
| Noncurrent liabilities |
64,039 | 65,223 | ||||||
| Owners’ equity |
202,460 | 139,877 | ||||||
| Total Liabilities and Owners’ Equity |
$ | 555,469 | $ | 439,551 | ||||
| Year Ended December 31, | ||||||||||||
| 2010 | 2009 | 2008 | ||||||||||
| (In thousands) | ||||||||||||
| Revenues |
$ | 2,283,256 | $ | 2,199,032 | $ | 2,083,809 | ||||||
| Gross profit |
$ | 258,598 | $ | 180,205 | $ | 182,120 | ||||||
| Income before provision for income taxes |
$ | 182,482 | $ | 131,530 | $ | 139,197 | ||||||
| Provision for income taxes |
21,230 | 13,504 | 15,947 | |||||||||
| Net Income |
$ | 161,252 | $ | 118,026 | $ | 123,250 | ||||||
79
Table of Contents
Revenues of equity method investees include $1,605.0 million, $1,551.9 million and $1,584.6 million of reimbursable costs recorded by limited liability companies in our Government Operations segment at December 31, 2010, 2009 and 2008, respectively. Our investment in equity method investees was $0.3 million more than our underlying equity in net assets of those investees based on stated ownership percentages at December 31, 2010. These differences were primarily related to the timing of distribution of dividends and various adjustments under GAAP.
The provision for income taxes is based on the tax laws and rates in the countries in which our investees operate. There is no expected relationship between the provision for income taxes and income before provision for income taxes. The taxation regimes vary not only by their nominal rates, but also by the allowability of deductions, credits and other benefits. For some of our U.S. investees, U.S. income taxes are the responsibility of the respective owners.
Reconciliation of net income per combined income statement information of our investees to equity in income of investees per our consolidated and combined statements of income is as follows:
| Year Ended December 31, | ||||||||||||
| 2010 | 2009 | 2008 | ||||||||||
| (In thousands) | ||||||||||||
| Equity income based on stated ownership percentages |
$ | 77,882 | $ | 56,286 | $ | 56,420 | ||||||
| All other adjustments due to amortization of basis differences, timing of GAAP adjustments and other adjustments |
(3,800 | ) | (1,192 | ) | (4,628 | ) | ||||||
| Equity in income of investees |
$ | 74,082 | $ | 55,094 | $ | 51,792 | ||||||
Our transactions with unconsolidated affiliates include the following:
| Year Ended December 31, | ||||||||||||
| 2010 | 2009 | 2008 | ||||||||||
| (In thousands) | ||||||||||||
| Sales to |
$ | 45,321 | $ | 35,802 | $ | 23,096 | ||||||
| Purchases from |
$ | 4,693 | $ | 12,222 | $ | 39,963 | ||||||
| Dividends received |
$ | 53,633 | $ | 50,644 | $ | 49,676 | ||||||
During the year ended December 31, 2010, one of our subsidiaries formed a joint venture along with Thermax Ltd., a boiler manufacturer based in India. This joint venture will build highly efficient subcritical and supercritical boilers and pulverizers for the India utility boiler market. In connection with the formation of this joint venture, we contributed approximately $6.0 million of cash in 2010.
NOTE 4—INCOME TAXES
B&W and its subsidiaries are subject to U.S. federal income tax, and income tax of multiple state and international jurisdictions. We provide for income taxes based on the tax laws and rates in the jurisdictions in which we conduct our operations. Each of these jurisdictions has a regime of taxation that varies from the others. The taxation regimes vary not only with respect to nominal rates, but also with respect to the basis on which these rates are applied. These variances, along with variances in our mix of income from these jurisdictions, contribute to shifts in our effective tax rate.
The results of the U.S. operations of MII and/or certain of its subsidiaries were reflected in our consolidated return for U.S. federal income tax purposes and/or certain consolidated, combined and unitary returns for state, local and foreign tax purposes through June 7, 2010. The IRS has completed audits of these years through 2006.
We are currently under audit by various state and international authorities. With few exceptions, we do not have any returns under examination for years prior to 2006.
80
Table of Contents
We apply the provisions of FASB Topic Income Taxes regarding the treatment of uncertain tax positions. A reconciliation of unrecognized tax benefits follows:
| Year Ended December 31, | ||||||||||||
| 2010 | 2009 | 2008 | ||||||||||
| (In thousands) | ||||||||||||
| Balance at beginning of period |
$ | 11,842 | $ | 14,521 | $ | 28,858 | ||||||
| Increases based on tax positions taken in the current year |
6,550 | 1,322 | 3,688 | |||||||||
| Increases based on tax positions taken in the prior years |
343 | 216 | 353 | |||||||||
| Increases due to positions assumed at spin-off |
24,181 | — | — | |||||||||
| Decreases based on tax positions taken in the prior years |
(1,442 | ) | (91 | ) | (4,525 | ) | ||||||
| Decreases due to settlements with tax authorities |
(5,132 | ) | (4,126 | ) | (13,441 | ) | ||||||
| Decreases due to lapse of applicable statute of limitation |
— | — | (412 | ) | ||||||||
| Balance at end of period |
$ | 36,342 | $ | 11,842 | $ | 14,521 | ||||||
Approximately $35.2 million of the balance of unrecognized tax benefits at December 31, 2010 would reduce our effective tax rate if recognized. The remaining balance relates to positions for which the ultimate deductibility is highly certain but for which there is uncertainty about the timing of such deductibility. Because of the impact of deferred tax accounting, other than interest and penalties, the disallowance of the shorter deductibility period would not affect the annual effective tax rate but would accelerate the payment of cash to the taxing authority to an earlier period.
During 2009, we attempted to settle several years of outstanding audits with the Commonwealth of Virginia by making payments under a special tax amnesty program. The payments approximated the unrecognized tax benefits, resulting in no adjustment to tax expense. We have not yet received formal notification that the audits are closed.
In accordance with FASB Topic Income Taxes, we recognize interest and penalties related to unrecognized tax benefits in our provision for income taxes. During the year ended December 31, 2010, we recorded additional accruals of $0.3 million, and assumed an additional liability totaling $1.0 million in connection with the spin-off, resulting in recorded liabilities of approximately $4.9 million for the payment of tax-related interest and penalties. At December 31, 2009 and 2008, we recorded liabilities of approximately $3.6 million and $6.0 million, respectively, for the payment of tax-related interest and penalties.
81
Table of Contents
Deferred income taxes reflect the net tax effects of temporary differences between the financial and tax bases of assets and liabilities. Significant components of deferred tax assets and liabilities as of December 31, 2010 and 2009 were as follows:
| December 31, | ||||||||
| 2010 | 2009 | |||||||
| (In thousands) | ||||||||
| Deferred tax assets: |
||||||||
| Pension liability |
$ | 198,213 | $ | 206,757 | ||||
| Accrued warranty expense |
38,610 | 41,324 | ||||||
| Accrued vacation pay |
13,018 | 11,843 | ||||||
| Accrued liabilities for self-insurance (including postretirement health care benefits) |
45,828 | 53,121 | ||||||
| Accrued liabilities for executive and employee incentive compensation |
27,847 | 35,363 | ||||||
| Net operating loss carryforward |
920 | 6,273 | ||||||
| Environmental and products liabilities |
8,883 | 11,655 | ||||||
| Long-term contracts |
5,095 | 19,334 | ||||||
| State tax net operating loss carryforward |
28,652 | 44,781 | ||||||
| Foreign tax credit carryforward |
4,605 | 16,062 | ||||||
| Other |
20,240 | 13,143 | ||||||
| Total deferred tax assets |
391,911 | 459,656 | ||||||
| Valuation allowance for deferred tax assets |
(2,205 | ) | (28,701 | ) | ||||
| Deferred tax assets |
389,706 | 430,955 | ||||||
| Deferred tax liabilities: |
||||||||
| Property, plant and equipment |
28,344 | 28,503 | ||||||
| Investments in joint ventures and affiliated companies |
1,576 | 3,528 | ||||||
| Intangibles |
30,616 | 32,351 | ||||||
| Other |
11,105 | 4,651 | ||||||
| Total deferred tax liabilities |
71,641 | 69,033 | ||||||
| Net deferred tax assets |
$ | 318,065 | $ | 361,922 | ||||
Income before provision for income taxes was as follows:
| Year Ended December 31, | ||||||||||||
| 2010 | 2009 | 2008 | ||||||||||
| (In thousands) | ||||||||||||
| U.S. |
$ | 160,074 | $ | 164,347 | $ | 351,398 | ||||||
| Other than U.S. |
75,746 | 67,954 | 81,341 | |||||||||
| Income before provision for income taxes |
$ | 235,820 | $ | 232,301 | $ | 432,739 | ||||||
82
Table of Contents
The provision for income taxes consisted of:
| Year Ended December 31, | ||||||||||||
| 2010 | 2009 | 2008 | ||||||||||
| (In thousands) | ||||||||||||
| Current: |
||||||||||||
| U.S.–federal |
$ | 28,403 | $ | 26,689 | $ | 53,691 | ||||||
| U.S.–state and local |
8,029 | 14,749 | 16,063 | |||||||||
| Other than U.S. |
12,405 | 13,408 | 15,401 | |||||||||
| Total current |
48,837 | 54,846 | 85,155 | |||||||||
| Deferred: |
||||||||||||
| U.S.–Federal |
28,582 | 32,330 | 49,965 | |||||||||
| U.S.–State and local |
(846 | ) | (4,489 | ) | (29,815 | ) | ||||||
| Other than U.S. |
5,721 | 1,694 | 3,580 | |||||||||
| Total deferred |
33,457 | 29,535 | 23,730 | |||||||||
| Provision for income taxes |
$ | 82,294 | $ | 84,381 | $ | 108,885 | ||||||
The following is a reconciliation of the U.S. statutory federal tax rate (35%) to the consolidated and combined effective tax rate:
| Year Ended December 31, | ||||||||||||
| 2010 | 2009 | 2008 | ||||||||||
| U.S. federal statutory (benefit) rate |
35.0 | % | 35.0 | % | 35.0 | % | ||||||
| State and local income taxes |
3.0 | 3.4 | 3.8 | |||||||||
| Non-U.S. operations |
(4.6 | ) | (4.1 | ) | (2.5 | ) | ||||||
| Tax credits |
(4.1 | ) | — | — | ||||||||
| Dividends from affiliates |
8.5 | (0.1 | ) | (0.2 | ) | |||||||
| Valuation allowance for deferred tax assets |
(2.4 | ) | (0.3 | ) | (7.0 | ) | ||||||
| Audit settlements |
— | 0.3 | (4.7 | ) | ||||||||
| Other |
(0.5 | ) | 2.1 | 0.8 | ||||||||
| Effective tax rate |
34.9 | % | 36.3 | % | 25.2 | % | ||||||
At December 31, 2010, we had a valuation allowance of 2.2 million for deferred tax assets, which we expect cannot be realized through carrybacks, future reversals of existing taxable temporary differences and our estimate of future taxable income. We believe that our remaining deferred tax assets are more likely than not realizable through carrybacks, future reversals of existing taxable temporary differences and our estimate of future taxable income. Any changes to our estimated valuation allowance could be material to our consolidated financial statements.
The following is an analysis of our valuation allowance for deferred tax assets:
| Beginning Balance |
Charges To Costs and Expenses |
Charged To Other Accounts(1) |
Effect Of Spin-Off(2) |
Ending Balance |
||||||||||||||||
| (In thousands) | ||||||||||||||||||||
| Year Ended December 31, 2010 |
$ | (28,701 | ) | 6,904 | — | 19,592 | $ | (2,205 | ) | |||||||||||
| Year Ended December 31, 2009 |
$ | (32,227 | ) | 3,238 | 288 | — | $ | (28,701 | ) | |||||||||||
| Year Ended December 31, 2008 |
$ | (85,384 | ) | 53,496 | (339 | ) | — | $ | (32,227 | ) | ||||||||||
| (1) | Amounts charged to other accounts are included in other comprehensive income. |
| (2) | Effect of spin-off includes state tax valuation allowances distributed to MII in the spin-off. |
We have foreign net operating loss carryforwards of $3.4 million available to offset future taxable income in foreign jurisdictions. Of the foreign net operating loss carryforwards, $1.0 million is scheduled to expire in 2015
83
Table of Contents
to 2030. The foreign net operating losses have a valuation allowance of $0.3 million against the related deferred taxes. In addition, we have foreign tax credit carryovers of $4.6 million which will begin to expire in 2014 and alternative minimum tax credit carryovers of $8.8 million with an unlimited carryover period. We have state net operating losses of $709.7 million available to offset future taxable income in various states. Our state net operating loss carryforwards begin to expire in the year 2011. We are carrying a valuation allowance of $1.8 million against the deferred tax asset related to the state loss carryforwards.
We would be subject to withholding taxes if we were to distribute earnings from certain foreign subsidiaries. For the year ended December 31, 2010, the undistributed earnings of these subsidiaries were $268.3 million. Unrecognized deferred income tax liabilities, including withholding taxes, of approximately $20.2 million would be payable upon distribution of these earnings. We have provided $1.5 million of taxes on earnings we intend to remit. All other earnings are considered permanently reinvested.
NOTE 5—LONG-TERM DEBT AND NOTES PAYABLE
| December 31, | ||||||||
| 2010 | 2009 | |||||||
| (In thousands) | ||||||||
| Long-term debt consists of: |
||||||||
| Unsecured Debt: |
||||||||
| Other notes payable through 2012 |
$ | 1,417 | $ | 5,916 | ||||
| Secured Debt: |
||||||||
| Power Generation Systems – various notes payable |
1,201 | 1,659 | ||||||
| Other |
— | 13 | ||||||
| 2,618 | 7,588 | |||||||
| Less: Amounts due within one year |
1,763 | 3,366 | ||||||
| Long-term debt |
$ | 855 | $ | 4,222 | ||||
| Notes payable and current maturities of long-term debt consist of: |
||||||||
| Short-term lines of credit |
$ | 3,027 | $ | 3,066 | ||||
| Current maturities of long-term debt |
1,763 | 3,366 | ||||||
| Total |
$ | 4,790 | $ | 6,432 | ||||
| Interest rate on short-term borrowing |
5.3 | % | 5.3 | % | ||||
Our short-term lines of credit represent borrowings by one of our subsidiaries. We have included this amount in notes payable and current maturities of long-term debt on our consolidated and combined balance sheets. This facility is renewable annually and the interest rate associated with this line of credit was 5.3% per annum at December 31, 2010.
Maturities of long-term debt during the five years subsequent to December 31, 2010 are as follows: 2011 – $1.8 million; 2012 – $0.2 million; 2013 – $0.2 million; 2014 – $0.2 million; and 2015 – $0.2 million.
Credit Facility
On May 3, 2010, our subsidiary Babcock & Wilcox Investment Company (“BWICO”) entered into a credit agreement (the “Credit Agreement”) with a syndicate of lenders and letter of credit issuers, and Bank of America, N.A., as administrative agent. The Credit Agreement provides for revolving credit borrowings and issuances of letters of credit in an aggregate outstanding amount of up to $700.0 million, and the credit facility is scheduled to mature on May 3, 2014. The proceeds of the Credit Agreement are available for working capital needs and other general corporate purposes of our Government Operations and Power Generation Systems segments. The Credit Agreement includes procedures for additional financial institutions to become lenders, or for any existing lender to increase its commitment thereunder, subject to an aggregate maximum of $850 million for all revolving loan and letter of credit commitments under the Credit Agreement.
84
Table of Contents
The Credit Agreement is guaranteed by substantially all of BWICO’s wholly owned domestic subsidiaries. Following the completion of the spin-off of B&W, B&W became the borrower under the Credit Agreement and substantially all of B&W’s wholly owned domestic subsidiaries (including BWICO) that were not already guarantors under the Credit Agreement became guarantors. Obligations under the Credit Agreement are secured by first-priority liens on certain assets owned by BWICO and the guarantors (other than BWX Technologies, Inc. (“BWXT”) and its subsidiaries). Following completion of the spin-off of B&W, B&W and its wholly owned domestic subsidiaries that became guarantors under the Credit Agreement granted liens on certain assets owned by them. If the corporate rating of B&W and its subsidiaries from Moody’s is Baa3 or better (with a stable outlook or better), the corporate family rating of B&W and its subsidiaries from S&P is BBB- or better (with a stable outlook or better), and certain other conditions are met, the liens securing obligations under the Credit Agreement will be released, subject to reinstatement upon the terms set forth in the Credit Agreement.
The Credit Agreement requires only interest payments on a quarterly basis until maturity. The borrower under the Credit Agreement may prepay all loans under the Credit Agreement at any time without premium or penalty (other than customary LIBOR breakage costs), subject to certain notice requirements.
The Credit Agreement contains customary financial covenants relating to leverage and interest coverage and includes covenants that restrict, among other things, debt incurrence, liens, investments, acquisitions, asset dispositions, dividends, prepayments of subordinated debt, mergers, and capital expenditures. At December 31, 2010, we were in compliance with all of the covenants set forth in the Credit Agreement. A comparison of the key financial covenants and current compliance at December 31, 2010 is as follows:
| Required |
Actual | |||||
| Maximum leverage ratio |
Less than 2.5 to 1.0 | 0.2 to 1.0 | ||||
| Minimum interest coverage ratio |
Greater than 4.0 to1.0 | 21.0 to 1.0 | ||||
Loans outstanding under the Credit Agreement bear interest at the borrower’s option at either the Eurodollar rate plus a margin ranging from 2.50% to 3.50% per year or the base rate (the highest of the Federal Funds rate plus 0.50%, the 30-day Eurodollar rate plus 1.0%, or the administrative agent’s prime rate) plus a margin ranging from 1.50% to 2.50% per year. The applicable margin for revolving loans varies depending on the credit ratings of the Credit Agreement. The borrower under the Credit Agreement is charged a commitment fee on the unused portions of the Credit Agreement, and that fee varies between 0.375% and 0.625% per year depending on the credit ratings of the Credit Agreement. Additionally, the borrower under the Credit Agreement is charged a letter of credit fee of between 2.50% and 3.50% per year with respect to the amount of each financial letter of credit issued under the Credit Agreement and a letter of credit fee of between 1.25% and 1.75% per year with respect to the amount of each performance letter of credit issued under the Credit Agreement, in each case depending on the credit ratings of the Credit Agreement. The borrower under the Credit Agreement also pays customary issuance fees and other fees and expenses in connection with the issuance of letters of credit under the Credit Agreement. In connection with entering into the Credit Agreement, BWICO paid certain upfront fees to the lenders thereunder, and BWICO paid certain arrangement and other fees to the arrangers and agents of the BWICO Credit Agreement. On August 11, 2010 we borrowed $25 million against this facility for one day to meet temporary working capital needs. At December 31, 2010, there were no borrowings outstanding but letters of credit issued under the Credit Agreement totaled $236.2 million. At December 31, 2010, there was $463.8 million available for borrowings or to meet letter of credit requirements under the Credit Agreement. The applicable interest rate at December 31, 2010 under this facility was 4.75% per year.
Based on the current credit ratings of the Credit Agreement, the applicable margin for Eurodollar-rate loans is 2.50%, the applicable margin for base-rate loans is 1.50%, the letter of credit fee for financial letters of credit is 2.50%, the letter of credit fee for performance letters of credit is 1.25%, and the commitment fee for unused portions of the Credit Agreement is 0.375%. The Credit Agreement does not have a floor for the base rate or the Eurodollar rate.
85
Table of Contents
Bank Guarantees (Foreign Operations)
Certain foreign subsidiaries of Babcock & Wilcox Power Generation Group, Inc. (“B&W PGG”), a subsidiary in our Power Generation Systems segment, had credit arrangements with various commercial banks and other financial institutions for the issuance of bank guarantees in association with contracting activity. The aggregate value of all such bank guarantees as of December 31, 2010 was $19.2 million.
Surety Bonds
B&W and certain of its subsidiaries have jointly executed general agreements of indemnity in favor of surety underwriters relating to surety bonds those underwriters issue in support of some of our contracting activity. As of December 31, 2010, bonds issued and outstanding under these arrangements in support of contracts totaled approximately $155.1 million. Approximately $82.3 million of these bonds are also subject to general agreements of indemnity executed by MII and certain subsidiaries of B&W (including B&W PGG) prior to the spin-off. Any claim successfully asserted against a surety by a bond obligee under a bond issued pursuant to the agreements of indemnity executed prior to our spin-off would likely be recoverable from MII, B&W and B&W PGG under such indemnity agreements (and we have agreed to indemnify MII from and against any such recovery from it).
Letters of Credit (Nuclear Fuel Services, Inc.)
At December 31, 2010, NFS, a subsidiary of BWXT in our Government Operations segment, had $3.6 million in letters of credit issued by various commercial banks on its behalf. The obligations to the commercial banks issuing such letters of credit are secured by cash, short-term certificates of deposit and certain real and intangible assets.
NOTE 6—PENSION PLANS AND POSTRETIREMENT BENEFITS
We have historically provided defined benefit retirement benefits, primarily through noncontributory pension plans, for most of our regular employees. As of 2006, our retirement plans for U.S.-based employees were closed to new entrants for our corporate employees and were closed to new salaried plan entrants for our existing plans within our Power Generation Systems and Government Operations segments. Effective October 31, 2008, the salaried and hourly retirement plans acquired with Marine Mechanical Corporation were merged into the retirement plan for our Government Operations segment. Effective December 31, 2008, we acquired the retirement plans and postretirement benefit plans of NFS.
We do not provide retirement benefits to certain non-resident alien employees of foreign subsidiaries. Retirement benefits for salaried employees who accrue benefits in a defined benefit plan are based on final average compensation and years of service, while benefits for hourly paid employees are based on a flat benefit rate and years of service. Our funding policy is to fund the plans as recommended by the respective plan actuaries and in accordance with the Employee Retirement Income Security Act of 1974, as amended, or other applicable law. The Pension Protection Act of 2006 replaces the current funding provisions for single-employer defined benefit plans. Funding provisions under the Pension Protection Act accelerate funding requirements to ensure full funding of benefits accrued. The Pension Protection Act became effective in 2008 and had no impact on our combined financial condition or cash flows for 2008.
Prior to the spin-off, the combined statements included the pension liability of the Retirement Plan for Employees of McDermott Incorporated and Participating Subsidiary and Affiliated Companies (the “MI Plan”). In connection with the spin-off, the majority of the liability of the MI Plan, along with the subsidiary holding this liability, was transferred to MII.
Effective December 31, 2009, we adopted the disclosure provisions of FASB Topic 715, Compensation – Retirement Benefits. In accordance with the provisions of this topic, we have disclosed additional information about our assets set aside to fund our pension and postretirement benefit obligations.
We make available other benefits which include postretirement health care and life insurance benefits to certain salaried and union retirees based on their union contracts. Certain subsidiaries provide these benefits to unionized and salaried future retirees.
86
Table of Contents
Obligations and Funded Status
| Pension Benefits Year Ended December 31, |
Other Benefits Year Ended December 31, |
|||||||||||||||
| 2010 | 2009 | 2010 | 2009 | |||||||||||||
| (In thousands) | ||||||||||||||||
| Change in benefit obligation: |
||||||||||||||||
| Benefit obligation at beginning of period |
$ | 2,552,187 | $ | 2,398,965 | $ | 145,594 | $ | 141,864 | ||||||||
| Service cost |
39,176 | 36,565 | 1,069 | 958 | ||||||||||||
| Interest cost |
142,092 | 147,910 | 7,284 | 8,713 | ||||||||||||
| Plan participants’ contributions |
266 | 287 | 126 | 120 | ||||||||||||
| Effect of spin-off |
(313,150 | ) | — | (5,086 | ) | — | ||||||||||
| Amendments |
3,059 | 6,141 | (328 | ) | — | |||||||||||
| Settlements |
(223 | ) | (2,054 | ) | — | — | ||||||||||
| Actuarial loss (gain) |
179,780 | 80,860 | (14,593 | ) | 2,463 | |||||||||||
| Foreign currency exchange rate changes |
8,240 | 23,154 | 400 | 964 | ||||||||||||
| Benefits paid |
(131,644 | ) | (139,641 | ) | (8,774 | ) | (9,488 | ) | ||||||||
| Benefit obligation at end of period |
$ | 2,479,783 | $ | 2,552,187 | $ | 125,692 | $ | 145,594 | ||||||||
| Change in plan assets: |
||||||||||||||||
| Fair value of plan assets at beginning of period |
$ | 1,798,448 | $ | 1,695,445 | $ | 30,793 | $ | 27,079 | ||||||||
| Actual return on plan assets |
211,138 | 168,558 | 1,975 | 3,346 | ||||||||||||
| Plan participants’ contributions |
266 | 287 | 126 | 120 | ||||||||||||
| Company contributions |
104,295 | 49,475 | 9,269 | 9,736 | ||||||||||||
| Effect of spin-off |
(208,999 | ) | — | — | — | |||||||||||
| Foreign currency exchange rate changes |
8,544 | 24,324 | — | — | ||||||||||||
| Benefits paid |
(131,644 | ) | (139,641 | ) | (8,774 | ) | (9,488 | ) | ||||||||
| Fair value of plan assets at the end of period |
1,782,048 | 1,798,448 | 33,389 | 30,793 | ||||||||||||
| Funded status |
$ | (697,735 | ) | $ | (753,739 | ) | $ | (92,303 | ) | $ | (114,801 | ) | ||||
| Amounts recognized in the balance sheet consist of: |
||||||||||||||||
| Accrued employee benefits |
$ | (121,693 | ) | $ | (58,000 | ) | $ | (8,203 | ) | $ | (9,317 | ) | ||||
| Accumulated postretirement benefit obligation |
— | — | (84,100 | ) | (105,484 | ) | ||||||||||
| Pension liability |
(576,064 | ) | (696,584 | ) | — | — | ||||||||||
| Prepaid pension |
22 | 845 | — | — | ||||||||||||
| Accrued benefit liability, net |
$ | (697,735 | ) | $ | (753,739 | ) | $ | (92,303 | ) | $ | (114,801 | ) | ||||
| Amounts recognized in accumulated comprehensive loss: |
||||||||||||||||
| Net actuarial loss (gain) |
$ | 712,694 | $ | 776,128 | $ | (1,193 | ) | $ | 13,182 | |||||||
| Prior service cost |
20,412 | 21,746 | 289 | 473 | ||||||||||||
| Unrecognized transition obligation |
— | — | 440 | 1,055 | ||||||||||||
| Total before taxes |
$ | 733,106 | $ | 797,874 | $ | (464 | ) | $ | 14,710 | |||||||
| Supplemental information: |
||||||||||||||||
| Plans with accumulated benefit obligation in excess of plan assets |
||||||||||||||||
| Projected benefit obligation |
$ | 2,479,352 | $ | 2,448,685 | N/A | N/A | ||||||||||
| Accumulated benefit obligation |
$ | 2,353,734 | $ | 2,341,477 | $ | 125,692 | $ | 145,594 | ||||||||
| Fair value of plan assets |
$ | 1,781,624 | $ | 1,694,101 | $ | 33,389 | $ | 30,793 | ||||||||
| Plans with plan assets in excess of accumulated benefit obligation |
||||||||||||||||
| Projected benefit obligation |
$ | 431 | $ | 103,502 | N/A | N/A | ||||||||||
| Accumulated benefit obligation |
$ | 386 | $ | 92,812 | $ | — | $ | — | ||||||||
| Fair value of plan assets |
$ | 424 | $ | 104,347 | $ | — | $ | — | ||||||||
87
Table of Contents
| Pension Benefits Year Ended December 31, |
Other Benefits Year Ended December 31, |
|||||||||||||||||||||||
| 2010 | 2009(1) | 2008 | 2010 | 2009 | 2008 | |||||||||||||||||||
| (In thousands) | ||||||||||||||||||||||||
| Components of net periodic benefit cost: |
||||||||||||||||||||||||
| Service cost |
$ | 39,176 | $ | 36,565 | $ | 35,651 | $ | 1,069 | $ | 958 | $ | 282 | ||||||||||||
| Interest cost |
142,092 | 147,910 | 140,169 | 7,284 | 8,713 | 5,562 | ||||||||||||||||||
| Expected return on plan assets |
(136,364 | ) | (136,211 | ) | (170,866 | ) | (1,745 | ) | (1,504 | ) | — | |||||||||||||
| Amortization of transition obligation |
— | — | — | 283 | 257 | 281 | ||||||||||||||||||
| Amortization of prior service cost |
3,711 | 3,119 | 2,757 | 29 | 66 | 73 | ||||||||||||||||||
| Recognized net actuarial loss |
75,605 | 81,484 | 29,177 | 307 | 1,711 | 1,447 | ||||||||||||||||||
| Net periodic benefit cost |
$ | 124,220 | $ | 132,867 | $ | 36,888 | $ | 7,227 | $ | 10,201 | $ | 7,645 | ||||||||||||
|
(1) Excludes approximately $2.1 million of income attributable to settlement of previously recorded unfunded pension liabilities. |
| |||||||||||||||||||||||
Additional Information
| Pension Benefits Year Ended December 31, |
Other Benefits Year Ended December 31, |
|||||||||||||||
| 2010 | 2009 | 2010 | 2009 | |||||||||||||
| (In thousands) | ||||||||||||||||
| Increase (decrease) in accumulated other comprehensive loss due to actuarial losses – before taxes |
$ | 108,077 | $ | 54,875 | $ | (15,152 | ) | $ | 612 | |||||||
We have recognized in the current fiscal year, and expect to recognize in the next fiscal year, the following amounts in other comprehensive loss as components of net periodic benefit cost:
| Recognized in the Year Ended December 31, 2010 |
To Be Recognized in the Year Ending December 31, 2011 |
|||||||||||||||
| Pension | Other | Pension | Other | |||||||||||||
| (In thousands) | ||||||||||||||||
| Pension cost in accumulated other comprehensive loss: |
||||||||||||||||
| Net actuarial loss |
$ | 75,605 | $ | 307 | $ | 73,477 | $ | (267 | ) | |||||||
| Prior service cost |
3,711 | 29 | 3,655 | 32 | ||||||||||||
| Transition obligation |
— | 283 | — | 296 | ||||||||||||
| $ | 79,316 | $ | 619 | $ | 77,132 | $ | 61 | |||||||||
Assumptions
| Pension Benefits |
Other Benefits | |||||||||||||||
| 2010 | 2009 | 2010 | 2009 | |||||||||||||
| Weighted average assumptions used to determine net periodic benefit obligations at December 31: |
||||||||||||||||
| Discount rate |
5.56 | % | 6.03 | % | 4.91 | % | 5.57 | % | ||||||||
| Rate of compensation increase |
3.69 | % | 3.77 | % | — | — | ||||||||||
| Weighted average assumptions used to determine net periodic benefit cost for the years ended December 31: |
||||||||||||||||
| Discount rate |
6.03 | % | 6.32 | % | 5.45 | % | 6.11 | % | ||||||||
| Expected return on plan assets |
8.06 | % | 8.19 | % | 5.42 | % | — | |||||||||
| Rate of compensation increase |
3.76 | % | 4.20 | % | — | — | ||||||||||
88
Table of Contents
The expected rate of return on plan assets assumption is based on the long-term expected returns for the investment mix of assets currently in the portfolio. In setting this rate, we use a building-block approach. Historic real return trends for the various asset classes in the plan’s portfolio are combined with anticipated future market conditions to estimate the real rate of return for each class. These rates are then adjusted for anticipated future inflation to determine estimated nominal rates of return for each class. The expected rate of return on plan assets is determined to be the weighted average of the nominal returns based on the weightings of the classes within the total asset portfolio. We have been using an expected return on plan assets assumption of 8.5% for the majority of our existing pension plan assets (approximately 83% of our total pension assets at December 31, 2010), which is consistent with the long-term asset returns of the portfolio.
Our existing other benefit plans are unfunded, with the exception of the NFS postretirement benefit plans. These plans provide health benefits to certain salaried and hourly employees, as well as retired employees, of NFS. Approximately 85% of total assets for these postretirement benefit plans are contributed into a Voluntary Employees’ Beneficiary Association (“VEBA”) trust.
| 2010(1)) | 2009(1) | |||||||
| Assumed health-care cost trend rates at December 31 |
||||||||
| Health-care cost trend rate assumed for next year |
8.00 | % | 8.30% -8.50 | % | ||||
| Rates to which the cost trend rate is assumed to decline (ultimate trend rate) |
4.50 | % | 4.50 | % | ||||
| Year that the rate reaches ultimate trend rate |
2018 | 2016 - 2028 | ||||||
|
(1) At December 31, 2009, the assumed health-care cost trend rates and years that the ultimate trends are reached varied among our postretirement benefit arrangements. |
| |||||||
Assumed health-care cost trend rates have a significant effect on the amounts we report for our health-care plan. A one-percentage-point change in our assumed health-care cost trend rates would have the following effects:
| One-Percentage- Point Increase |
One-Percentage- Point Decrease |
|||||||
| (In thousands) | ||||||||
| Effect on total of service and interest cost |
$ | 574 | $ | (485 | ) | |||
| Effect on postretirement benefit obligation |
$ | 7,230 | $ | (6,187 | ) | |||
Investment Goals
General
The overall investment strategy of the pension trusts is to achieve long-term growth of principal, while avoiding excessive risk and to minimize the probability of loss of principal over the long term. The specific investment goals that have been set for the pension trusts in the aggregate are (1) to ensure that plan liabilities are met when due and (2) to achieve an investment return on trust assets consistent with a reasonable level of risk.
Allocations to each asset class for both domestic and foreign plans are reviewed periodically and rebalanced, if appropriate, to assure the continued relevance of the goals, objectives and strategies. The pension trusts for both our domestic and foreign plans employ a professional investment advisor and a number of professional investment managers whose individual benchmarks are, in the aggregate, consistent with the plan’s overall investment objectives. The goals of each investment manager are (1) to meet (in the case of passive accounts) or exceed (for actively managed accounts) the benchmark selected and agreed upon by the manager and the Trust and (2) to display an overall level of risk in its portfolio that is consistent with the risk associated with the agreed upon benchmark.
89
Table of Contents
The investment performance of total portfolios, as well as asset class components, is periodically measured against commonly accepted benchmarks, including the individual investment manager benchmarks. In evaluating investment manager performance, consideration is also given to personnel, strategy, research capabilities, organizational and business matters, adherence to discipline and other qualitative factors that may impact the ability to achieve desired investment results.
Domestic Plans
We sponsor the following domestic defined benefit plans:
| • | Retirement Plan for Employees of Babcock & Wilcox Commercial Operations (covering Power Generation Systems segment employees); |
| • | Retirement Plan for Employees of Babcock & Wilcox Governmental Operations (covering Government Operations segment employees); and |
| • | Nuclear Fuel Services, Inc. Retirement Plan for Salaried Employees and Nuclear Fuel Services, Inc. Retirement Plan for Hourly Employees acquired with NFS (the “NFS Plans”). |
The assets of the domestic pension plans were commingled for investment purposes and held by the Trustee, The Bank of New York Mellon, in the McDermott Incorporated Master Trust (the “Master Trust”) through December 31, 2009. The NFS Plans were merged into the Master Trust effective January 1, 2010. For the years ended December 31, 2010 and 2009, the investment return on domestic plan assets of the Master Trust (net of deductions for management fees) was approximately 12.5% and 9.3%, respectively. The investment return for 2009 excludes the NFS Plans.
The following is a summary of the domestic pension plans’ asset allocations at December 31, 2010 and 2009 by asset category.
| 2010 | 2009 | |||||||
| Asset Category: |
||||||||
| Commingled and Mutual Funds |
28 | % | 17 | % | ||||
| Fixed Income (excluding U. S. Government Securities) |
24 | % | 27 | % | ||||
| Equity Securities |
20 | % | 28 | % | ||||
| U.S. Government Securities |
12 | % | 10 | % | ||||
| Partnerships with Security Holdings |
9 | % | 11 | % | ||||
| Real Estate |
4 | % | 4 | % | ||||
| Other |
3 | % | 3 | % | ||||
| Total |
100 | % | 100 | % | ||||
The target allocation for 2011 for the domestic plans, by asset class, is as follows:
| Asset Class: |
||||
| Public Equity |
42.5 | % | ||
| Fixed Income |
38.0 | % | ||
| Private Equity |
10.0 | % | ||
| Real Estate |
5.0 | % | ||
| Other |
4.5 | % |
Foreign Plans
We sponsor various plans through certain of our foreign subsidiaries. These plans are the various plans of Babcock & Wilcox Canada, Ltd. (the “Canadian Plans”) and the Diamond Power Specialty Limited Retirement Benefits Plan (the “Diamond UK Plan”).
90
Table of Contents
The weighted average asset allocations of these plans at December 31, 2010 and 2009 by asset category were as follows:
| 2010 | 2009 | |||||||
| Asset Category: |
||||||||
| Equity Securities and commingled and mutual funds |
59 | % | 17 | % | ||||
| Fixed Income |
37 | % | 77 | % | ||||
| Other |
4 | % | 6 | % | ||||
| Total |
100 | % | 100 | % | ||||
The target allocation for 2011 for the foreign plans, by asset class, is as follows:
| Canadian Plans |
Diamond UK Plan |
|||||||
| Asset Class: |
||||||||
| U. S. Equity |
15 | % | 10 | % | ||||
| Global Equity |
50 | % | 45 | % | ||||
| Fixed Income |
35 | % | 45 | % | ||||
Fair Value
See Note 16 for a detailed description of fair value measurements and the hierarchy established for valuation inputs. The following is a summary of total investments for our plans measured at fair value at December 31, 2010:
| 12/31/10 | Level 1 | Level 2 | Level 3 | |||||||||||||
| (In thousands) | ||||||||||||||||
| Pension and Other Benefits: |
||||||||||||||||
| Fixed Income |
$ | 450,116 | $ | 3,189 | $ | 446,927 | $ | — | ||||||||
| Equities |
330,510 | 330,223 | — | 287 | ||||||||||||
| Commingled and Mutual Funds |
571,291 | 7,926 | 563,365 | — | ||||||||||||
| U.S. Government Securities |
192,610 | 192,610 | — | — | ||||||||||||
| Partnerships with Security Holdings |
140,358 | — | 2,421 | 137,937 | ||||||||||||
| Real Estate |
69,065 | — | 45 | 69,020 | ||||||||||||
| Cash and Accrued Items |
61,487 | 61,126 | 361 | — | ||||||||||||
| Total Assets |
$ | 1,815,437 | $ | 595,074 | $ | 1,013,119 | $ | 207,244 | ||||||||
The following is a summary of total investments for our plans measured at fair value at December 31, 2009:
| 12/31/09 | Level 1 | Level 2 | Level 3 | |||||||||||||
| (In thousands) | ||||||||||||||||
| Pension and Other Benefits: |
||||||||||||||||
| Fixed Income |
$ | 519,313 | $ | 15,690 | $ | 503,468 | $ | 155 | ||||||||
| Equities |
476,709 | 476,500 | — | 209 | ||||||||||||
| Commingled and Mutual Funds |
377,242 | 74,438 | 208,894 | 93,910 | ||||||||||||
| U.S. Government Securities |
155,832 | 155,832 | — | — | ||||||||||||
| Partnerships with Security Holdings |
179,358 | — | 2,318 | 177,040 | ||||||||||||
| Real Estate |
70,048 | — | — | 70,048 | ||||||||||||
| Cash and Accrued Items |
50,739 | 50,152 | 493 | 94 | ||||||||||||
| Total Assets |
$ | 1,829,241 | $ | 772,612 | $ | 715,173 | $ | 341,456 | ||||||||
Level 2 and level 3 investment classifications as of December 31, 2009 previously disclosed have been adjusted to correctly classify certain commingled and mutual funds as level 2 investments rather than level 3 investments. The effect of this adjustment reduced previously reported level 3 investments by $115.0 million and increased level 2 investments by $115.0 million. For the purposes of the Level 3 roll forward the 2009 beginning balance was reduced by $83.9 million. This change did not affect the total amount of investments or other notes or amounts in the 2009 combined financial statements.
91
Table of Contents
The following is a summary of the changes in the Plans’ Level 3 instruments measured on a recurring basis for the years ended December 31, 2010 and 2009:
| Year ended December 31, | ||||||||
| 2010 | 2009 | |||||||
| (In thousands) | ||||||||
| Balance at beginning of period |
$ | 341,456 | $ | 399,294 | ||||
| Issuances and acquisitions |
45,217 | 11,599 | ||||||
| Dispositions |
(180,190 | ) | (55,965 | ) | ||||
| Realized gain (loss) |
23,016 | (1,914 | ) | |||||
| Unrealized loss |
(22,255 | ) | (11,558 | ) | ||||
| Balance at end of period |
$ | 207,244 | $ | 341,456 | ||||
Our Level 3 instruments include assets with no market price but rather calculations of net asset values per share or its equivalent. When appropriate, we adjust these net asset values for contributions and distributions, if any, made during the period beginning on the latest net asset value valuation date and ending on our measurement date. We also consider available market data, relevant index returns, preliminary estimates from our investees and other data obtained through research and consultation with third party advisors in determining the fair value of our Level 3 instruments.
Cash Flows
| Domestic Plans | Foreign Plans | |||||||||||||||
| Pension Benefits |
Other Benefits |
Pension Benefits |
Other Benefits |
|||||||||||||
| (In thousands) | ||||||||||||||||
| Expected employer contributions to trusts of defined benefit plans: |
||||||||||||||||
| 2011 |
$ | 119,306 | N/A | $ | 561 | N/A | ||||||||||
| Expected benefit payments: |
||||||||||||||||
| 2011 |
$ | 125,792 | $ | 13,796 | $ | 10,713 | $ | 735 | ||||||||
| 2012 |
$ | 134,668 | $ | 13,286 | $ | 11,702 | $ | 745 | ||||||||
| 2013 |
$ | 142,110 | $ | 12,748 | $ | 12,662 | $ | 742 | ||||||||
| 2014 |
$ | 149,274 | $ | 11,739 | $ | 13,873 | $ | 741 | ||||||||
| 2015 |
$ | 154,790 | $ | 10,662 | $ | 15,743 | $ | 719 | ||||||||
| 2016-2020 |
$ | 836,975 | $ | 37,988 | $ | 102,005 | $ | 3,495 | ||||||||
The expected employer contributions to trusts for 2011 are included in current liabilities at December 31, 2010.
Defined Contribution Plans
We provide benefits under The Babcock & Wilcox Company Supplemental Executive Retirement Plan (“SERP Plan”), which is a defined contribution plan. Prior to the spin-off, we participated in the McDermott International, Inc. SERP Plan. We recorded income (expense) related to the SERP Plans of approximately $0.7 million, $0.8 million and $(1.0) million in the years ended December 31, 2010, 2009 and 2008, respectively.
We also provide benefits under the Thrift Plan for Employees of The Babcock & Wilcox Company and Participating Subsidiary and Affiliated Companies (“Thrift Plan”). The Thrift Plan generally provides for matching employer contributions of 50% of participants’ contributions up to 6 percent of compensation. These matching employer contributions are typically made in shares of BWC common stock. Prior to the spin-off, we participated in the Thrift Plan for Employees of McDermott Incorporated and Participating Subsidiary and
92
Table of Contents
Affiliated Companies (“MII Thrift Plan”). The MII Thrift Plan also provides for matching employer contributions of 50% of participants’ contributions up to 6 percent of compensation and employer contributions are typically made in shares of MII common stock. Amounts charged to expense for employer contributions under the Thrift Plan and MII Thrift Plan totaled approximately $19.7 million, $17.6 million and $15.3 million in the years ended December 31, 2010, 2009 and 2008, respectively.
Multiemployer Plans
One of the subsidiaries in our Power Generation Systems segment contributes to various multiemployer plans. The plans generally provide defined benefits to substantially all unionized workers in this subsidiary. Amounts charged to pension cost and contributed to the plans were $18.4 million, $20.6 million and $30.4 million in the years ended December 31, 2010, 2009 and 2008, respectively.
NOTE 7 – ASSET SALES AND IMPAIRMENT OF LONG-LIVED ASSETS
We had losses on asset sales of approximately $1.2 million during the year ended December 31, 2009. We had gains on the sale of assets totaling $9.6 million during the year ended December 31, 2008, primarily in our Power Generation Systems segment and associated with the sale of the former location for our Dumbarton, Scotland facility.
During the years ended December 31, 2010, 2009 and 2008, we did not record any impairments of property, plant and equipment.
NOTE 8 – CAPITAL STOCK
B&W was a wholly owned subsidiary of MII, until July 30, 2010 when MII distributed 100% of our outstanding common stock to the MII shareholders. On July 2, 2010, MII’s Board of Directors approved the spin-off of B&W through the distribution of shares of B&W common stock to holders of MII common stock. The distribution of B&W common stock was made on July 30, 2010, and consisted of one share of B&W common stock for every two shares of MII common stock to holders of MII common stock. On July 30, 2010, 116,225,732 shares of our common stock were distributed to MII shareholders to complete our spin-off from MII.
We issue shares of our common stock in connection with our 2010 Long-Term Incentive Plan, and contributions to our Thrift Plan. At December 31, 2010, 12,205,975 shares of common stock were reserved for issuance in connection with those plans.
NOTE 9 – STOCK PLANS
Prior to our spin-off from MII, we participated in MII’s long-term incentive compensation plans. These plans generally provided for a number of forms of stock-based compensation awards including incentive and non-qualified stock options, restricted stock, restricted stock units and performance shares and performance units, subject to satisfaction of specific performance goals.
In connection with the spin-off, stock-based compensation awards granted under one of MII’s legacy long-term incentive compensation plans, using methods to preserve the intrinsic value of the award as of the date of the spin-off, were in general converted to awards under the 2010 Long-Term Incentive Plan of The Babcock and Wilcox Company generally on terms which were in all material respects identical to the terms of the award it replaced. This conversion was not considered a modification of stock-based compensation awards requiring revisions to our expense recognition, nor were they considered as new awards granted to our employees.
93
Table of Contents
2010 Long-Term Incentive Plan of The Babcock & Wilcox Company
In July 2010, we established the 2010 Long-Term Incentive Plan of The Babcock & Wilcox Company (the “Plan”). Members of the Board of Directors, executive officers, key employees and consultants are eligible to participate in the plan. The Compensation Committee of the Board of Directors selects the participants for the plan. The plan provides for a number of forms of stock-based compensation, including incentive and non-qualified stock options, restricted stock, restricted stock units and performance shares and performance units, subject to satisfaction of specific performance goals. Shares subject to awards under the Plan that are cancelled, forfeited, terminated or expire unexercised, shall immediately become available for the granting of awards under this Plan. In addition, 10,000,000 shares were authorized for issuance through the Plan. Options to purchase shares are granted at not less than 100% of the fair market value closing price on the date of grant, become exercisable at such time or times as determined when granted and expire not more than seven years after the date of grant.
At December 31, 2010, we had issued 2,575,326 shares under this plan, and had a total of 7,424,674 shares of our common stock available for future awards.
In the event of a change in control of our company, the terms of the awards under the Plan contain provisions that may cause restrictions to lapse and accelerate the exercisability of outstanding options.
Total compensation expense recognized for the years ended December 31, 2010, 2009 and 2008 was as follows:
| Compensation Expense |
Tax Benefit |
Net Impact |
||||||||||
| (In thousands) | ||||||||||||
| Year Ended December 31, 2010 | ||||||||||||
| Stock Options |
$ | 2,302 | $ | (849 | ) | $ | 1,453 | |||||
| Restricted Stock |
2,930 | (1,066 | ) | 1,864 | ||||||||
| Performance Shares |
3,390 | (1,230 | ) | 2,160 | ||||||||
| Performance and Deferred Stock Units |
7,686 | (2,852 | ) | 4,834 | ||||||||
| Total |
$ | 16,308 | $ | (5,997 | ) | $ | 10,311 | |||||
| Year Ended December 31, 2009 | ||||||||||||
| Stock Options |
$ | 2,799 | $ | (999 | ) | $ | 1,800 | |||||
| Restricted Stock |
6,922 | (2,498 | ) | 4,424 | ||||||||
| Performance Shares |
14,248 | (5,162 | ) | 9,086 | ||||||||
| Performance and Deferred Stock Units |
1,922 | (686 | ) | 1,236 | ||||||||
| Total |
$ | 25,891 | $ | (9,345 | ) | $ | 16,546 | |||||
| Year Ended December 31, 2008 | ||||||||||||
| Stock Options |
$ | 498 | $ | (178 | ) | $ | 320 | |||||
| Restricted Stock |
2,202 | (805 | ) | 1,397 | ||||||||
| Performance Shares |
20,404 | (7,244 | ) | 13,160 | ||||||||
| Performance and Deferred Stock Units |
1,732 | (618 | ) | 1,114 | ||||||||
| Total |
$ | 24,836 | $ | (8,845 | ) | $ | 15,991 | |||||
Prior to August 1, 2010, all of our stock-based compensation expense was attributable to our participation in MII legacy stock-based compensation plans. Expense recognized prior to August 1, 2010 was based on the fair value of MII’s stock-based compensation awards. For the five month period August 1, 2010 to December 31, 2010 stock-based compensation expense attributable to the 2010 Long-Term Incentive Plan of The Babcock & Wilcox Company totaled $4.4 million, net of tax benefits totaling $2.6 million.
94
Table of Contents
The impact on basic earnings per share of stock-based compensation expense recognized for the years ended December 31, 2010, 2009 and 2008 was $0.09, $0.14 and $0.14 per share, respectively, and on diluted earnings per share was $0.09, $0.14 and $0.14 per share, respectively.
As of December 31, 2010, total unrecognized estimated compensation expense related to nonvested awards was $9.2 million, net of estimated tax benefits of $5.8 million. The components of the total gross unrecognized estimated compensation expense of $15.0 million and their expected weighted-average periods for expense recognition are as follows (amounts in millions; periods in years):
| Amount | Weighted- Average Period |
|||||||
| Stock options |
$ | 4.1 | 1.9 | |||||
| Restricted stock |
$ | 1.9 | 0.9 | |||||
| Restricted stock units |
$ | 9.0 | 1.7 | |||||
B&W Stock Options
The fair value of each option grant was estimated at the date of grant using Black-Scholes, with the following weighted-average assumptions:
| Year Ended December 31, 2010 |
||||
| Risk-free interest rate |
1.28 | % | ||
| Expected volatility |
.61 | |||
| Expected life of the option in years |
4.08 | |||
| Expected dividend yield |
0 | % | ||
The risk-free interest rate is based on the implied yield on a U.S. Treasury zero-coupon issue with a remaining term equal to the expected life of the option. The expected volatility is based on implied volatility from publicly traded options on our common stock, historical volatility of the price of our common stock and other factors. The expected life of the option is based on observed historical patterns. The expected dividend yield is based on the projected annual dividend payment per share divided by the stock price at the date of grant. This amount is zero because we do not expect to pay cash dividends at this time.
The following table summarizes activity for our stock options for the year ended December 31, 2010 (share data in thousands):
| Number of Shares |
Weighted- Average Exercise Price |
Weighted- Average Remaining Contractual Term |
Aggregate Intrinsic Value (in millions) |
|||||||||||||
| Outstanding at beginning of period |
— | $ | — | — | — | |||||||||||
| Converted |
1,165 | 13.42 | ||||||||||||||
| Granted |
26 | 22.39 | ||||||||||||||
| Exercised |
(86 | ) | 5.93 | |||||||||||||
| Cancelled/expired/forfeited |
(10 | ) | 15.39 | |||||||||||||
| Outstanding at end of period |
1,095 | $ | 14.21 | 5.1 Years | $ | 12.5 | ||||||||||
| Exercisable at end of period |
414 | $ | 8.77 | 4.1 Years | $ | 7.0 | ||||||||||
95
Table of Contents
The aggregate intrinsic value included in the table above represents the total pretax intrinsic value that would have been received by the option holders had all option holders exercised their options on December 31, 2010. The intrinsic value is calculated as the total number of option shares multiplied by the difference between the closing price of our common stock on the last trading day of the period and the exercise price of the options. This amount changes based on the price of our common stock.
The weighted-average fair value of the stock options granted in the year ended December 31, 2010 was $10.64.
During the year ended December 31, 2010, the total intrinsic value of stock options exercised was $1.5 million. The actual tax benefits realized related to the stock options exercised during the years ended December 31, 2010 were $0.5 million.
B&W Restricted Stock
Nonvested restricted stock awards as of December 31, 2010 and changes during the year ended December 31, 2010 were as follows (share data in thousands):
| Number of Shares |
Weighted- Average Grant Date Fair Value |
|||||||
| Nonvested at beginning of period |
— | $ | — | |||||
| Converted |
87 | 28.85 | ||||||
| Granted |
100 | 23.35 | ||||||
| Vested |
(43 | ) | 19.44 | |||||
| Cancelled/forfeited |
(1 | ) | 38.89 | |||||
| Nonvested at end of period |
143 | $ | 27.77 | |||||
The actual tax benefits realized related to the restricted stock lapsed during the years ended December 31, 2010 was $1.2 million.
B&W Restricted Stock Units
Nonvested restricted stock units as of December 31, 2010 and changes during the year ended December 31, 2010 were as follows (share data in thousands):
| Number of Shares |
Weighted- Average Grant Date Fair Value |
|||||||
| Nonvested at beginning of period |
— | $ | — | |||||
| Converted |
1,242 | 17.30 | ||||||
| Granted |
— | — | ||||||
| Vested |
(265 | ) | 15.01 | |||||
| Cancelled/forfeited |
(18 | ) | 16.81 | |||||
| Nonvested at end of period |
959 | $ | 17.94 | |||||
96
Table of Contents
B&W Cash-Based Performance and Restricted Stock Units
Nonvested cash-based performance and restricted stock unit awards as of December 31, 2010 and changes during the year ended December 31, 2010 (share data in thousands):
| Number of Units |
Aggregate Intrinsic Value |
|||||||
| Nonvested at beginning of period |
— | $ | — | |||||
| Converted |
3 | N/A | ||||||
| Granted |
— | — | ||||||
| Vested |
(3 | ) | N/A | |||||
| Cancelled/forfeited |
— | — | ||||||
| Nonvested at end of period |
— | $ | — | |||||
During the years ended December 31, 2010, 2009 and 2008, we paid $0.1 million, $1.5 million and $4.1 million, respectively, for the settlement of vested cash-based performance and restricted stock units.
Stock Options MII
The following summarizes the assumptions used for stock options granted to our employees prior to the spin-off. The fair value of each option grant was estimated at the date of grant using Black-Scholes, with the following weighted-average assumptions:
| Year Ended December 31, | ||||||||
| 2010 | 2009 | |||||||
| Risk-free interest rate |
2.18 | % | 2.03 | % | ||||
| Expected volatility |
0.55 | 0.78 | ||||||
| Expected life of the option in years |
4.79 | 4.63 | ||||||
| Expected dividend yield |
0 | % | 0 | % | ||||
The risk-free interest rate was based on the implied yield on a U.S. Treasury zero-coupon issue with a remaining term equal to the expected life of the option. The expected volatility was based on implied volatility from publicly traded options on MII’s common stock, historical volatility of the price of MII’s common stock and other factors. The expected life of the option was based on observed historical patterns. The expected dividend yield is based on the projected annual dividend payment per share divided by the stock price at the date of grant. This amount is zero because MII did not pay cash dividends in recent years. MII did not issue stock options in the year ended December 31, 2008.
Thrift Plan
On August 13, 2010, 5,000,000 of the authorized and unissued shares of B&W common stock were reserved for issuance for the employer match to the Thrift Plan. Those matching employer contributions equal 50% of the first 6% of compensation, as defined in the Thrift Plan, contributed by participants, and fully vest and are nonforfeitable after three years of service or upon retirement, death, lay-off or approved disability. The Thrift Plan allows employees to sell their interest in B&W’s common stock fund at any time, except as limited by applicable securities laws and regulations. During the year ended December 31, 2010, we issued 218,699 of B&W’s common stock as employer contributions pursuant to the Thrift Plan. At December 31, 2010, 4,781,301 shares of B&W’s common stock remained available for issuance under the Thrift Plan.
97
Table of Contents
NOTE 10 – CONTINGENCIES AND COMMITMENTS
Investigations and Litigation
On January 29, 2010, Michelle McMunn, Cara D. Steele and Yvonne Sue Robinson filed suit against B&W PGG, Babcock & Wilcox Technical Services Group, Inc., formerly known as B&W Nuclear Environmental Services, Inc. (together with B&W PGG, the “B&W Parties”) and Atlantic Richfield Company (“ARCO”) in the United States District Court for the Western District of Pennsylvania. Since January 2010, six additional suits by other parties have been filed in the United States District Court for the Western District of Pennsylvania against the B&W Parties and ARCO. The suits presently involve approximately 86 claimants alleging, among other things, that they suffered personal injuries and property damage as a result of alleged radioactive and non-radioactive releases relating to the operation, remediation and/or decommissioning of two former nuclear fuel processing facilities located in Apollo and Parks Township, Pennsylvania (collectively, the “Apollo and Parks Litigation”). Those facilities previously were owned by Nuclear Materials and Equipment Company, a former subsidiary of ARCO (“NUMEC”) which was acquired by B&W PGG. The plaintiffs in the Apollo and Parks Litigation seek compensatory and punitive damages.
At the time of ARCO’s sale of NUMEC to B&W PGG, B&W PGG received an indemnity and hold harmless agreement from ARCO from claims or liabilities arising as a result of pre-closing NUMEC or ARCO actions.
We intend to vigorously defend this matter, and believe that in the event of liability, if any, the claims alleged in the Apollo and Parks Litigation will be resolved within the limits of coverage of our insurance policies and/or the ARCO indemnity.
In April 2009, B&W PGG settled approximately 245 personal injury and wrongful death claims, as well as approximately 125 property damage claims, alleging injury and damage as a result of alleged releases relating to these two facilities. The aggregate settlement amount for these claims was $52.5 million. In connection with that settlement, the B&W Parties are pursuing recovery from their insurer, American Nuclear Insurers and Mutual Atomic Energy Liability Underwriters, of the amounts paid in settlement of that prior action, in the matter of The Babcock & Wilcox Company et al. v. American Nuclear Insurers et al. (the “ANI Litigation”). The ANI Litigation is pending before the Court of Common Pleas of Allegheny County, Pennsylvania. No trial date has been set in the matter.
Other Litigation and Settlements
Additionally, due to the nature of our business, we are, from time to time, involved in routine litigation or subject to disputes or claims related to our business activities, including, among other things:
| • | performance- or warranty-related matters under our customer and supplier contracts and other business arrangements; and |
| • | workers’ compensation claims, premises liability claims and other claims. |
Based upon our prior experience, we do not expect that any of these other litigation proceedings, disputes and claims will have a material adverse effect on our consolidated financial condition, results of operations or cash flows.
Environmental Matters
We have been identified as a potentially responsible party at various cleanup sites under the Comprehensive Environmental Response, Compensation, and Liability Act, as amended (“CERCLA”). CERCLA and other environmental laws can impose liability for the entire cost of cleanup on any of the potentially responsible parties, regardless of fault or the lawfulness of the original conduct. Generally, however, where there are multiple responsible parties, a final allocation of costs is made based on the amount and type of wastes disposed of by each party and the number of financially viable parties, although this may not be the case with respect to any
98
Table of Contents
particular site. We have not been determined to be a major contributor of wastes to any of these sites. On the basis of our relative contribution of waste to each site, we expect our share of the ultimate liability for the various sites will not have a material adverse effect on our consolidated financial condition, results of operations or cash flows in any given year.
The Department of Environmental Protection of the Commonwealth of Pennsylvania (“PADEP”) advised us in March 1994 that it would seek monetary sanctions and remedial and monitoring relief related to the Parks Facilities. The relief sought is related to potential groundwater contamination resulting from previous operations at the facilities. These facilities are currently owned by a subsidiary in our Government Operations segment. PADEP has advised us that it does not intend to assess any monetary sanctions, provided our Government Operations segment continues its remediation program for the Parks Facilities. Whether additional nonradiation contamination remediation will be required at the Parks Facilities remains unclear. Results from sampling completed by our Government Operations segment have indicated that such remediation may not be necessary. Our Government Operations segment continues to evaluate closure of the groundwater issues pursuant to applicable Pennsylvania law.
We perform significant amounts of work for the U.S. Government under both prime contracts and subcontracts and operate certain facilities that are licensed to possess and process special nuclear materials. As a result of these activities, we are subject to continuing reviews by governmental agencies, including the U.S. Environmental Protection Agency and the NRC.
The NRC’s decommissioning regulations require our Government Operations segment to provide financial assurance that it will be able to pay the expected cost of decommissioning each of its facilities at the end of its service life. We provided financial assurance aggregating $41.5 million during the year ending December 31, 2010 with existing letters of credit for the ultimate decommissioning of all of these licensed facilities, except two. These two facilities, which represent the largest portion of our eventual decommissioning costs, have provisions in their government contracts pursuant to which substantially all of our decommissioning costs and financial assurance obligations are covered by the U.S. Department of Energy, including the costs to complete the decommissioning projects underway at the facility in Erwin, Tennessee.
Our compliance with U.S. federal, state and local environmental control and protection regulations resulted in pretax charges of approximately $13.0 million in the year ended December 31, 2010. In addition, compliance with existing environmental regulations necessitated capital expenditures of $0.5 million in the year ended December 31, 2010. At December 31, 2010 and 2009, we had total environmental reserves (including provisions for the facilities discussed above) of $43.5 million and $50.3 million, respectively. Of our total environmental reserves at December 31, 2010 and 2009, $2.7 million and $2.5 million, respectively, were included in current liabilities. Inherent in the estimates of those reserves and recoveries are our expectations regarding the levels of contamination, decommissioning costs and recoverability from other parties, which may vary significantly as decommissioning activities progress. Accordingly, changes in estimates could result in material adjustments to our operating results, and the ultimate loss may differ materially from the amounts that we have provided for in our consolidated financial statements.
Operating Leases
Future minimum payments required under operating leases that have initial or remaining noncancellable lease terms in excess of one year at December 31, 2010 are as follows (in thousands):
| Fiscal Year Ending December 31, |
Amount | |||
| 2011 |
$ | 6,087 | ||
| 2012 |
$ | 4,859 | ||
| 2013 |
$ | 3,762 | ||
| 2014 |
$ | 3,443 | ||
| 2015 |
$ | 2,060 | ||
| Thereafter |
$ | 3,610 | ||
99
Table of Contents
Total rental expense for the years ended December 31, 2010, 2009 and 2008 was $10.5 million, $9.8 million and $9.2 million, respectively. These expense amounts include contingent rentals and are net of sublease income, neither of which is material.
Other
Warranty Claim (Power Generation Systems Segment)
One of our Canadian subsidiaries has received notice of a warranty claim on one of its projects on a contract executed in 1998. This situation relates to technical issues concerning components associated with nuclear steam generators. Data collection and analysis can only be performed at specific time periods when the power plant is scheduled to be off-line for maintenance. We also received a notice from the customer during October 2008, and, in November 2008, we responded to the notice by disagreeing with the matters stated in the claim and disputing the claim. In November 2010, we entered into a settlement agreement with the customer in order to resolve this matter. The settlement agreement defines our obligations for past and future costs associated with these technical issues and these anticipated costs were within amounts which had been previously accrued.
Surety Bonds (Power Generation Systems Segment)
In June 2008, MII, B&W PGG and McDermott Holding, Inc. jointly executed a general agreement of indemnity in favor of a surety underwriter relating to surety bonds that underwriter issued in support of B&W PGG’s contracting activity. As of December 31, 2010, bonds issued under this arrangement totaled approximately $82.3 million. Any claim successfully asserted against the surety by one or more of the bond obligees would likely be recoverable from MII, B&W PGG and McDermott Holdings, Inc. under the indemnity agreement.
Master Separation Agreement
The master separation agreement between us and MII contains the key provisions relating to the separation of our business from MII and the distribution of our shares of common stock. The master separation agreement identifies the assets that were transferred, liabilities that were assumed and contracts that were assigned to us by MII or by us to MII in the spin-off and describes how these transfers, assumptions and assignments occurred. Under the master separation agreement generally, we are indemnifying MII and its remaining subsidiaries against various claims and liabilities including those related to the past operation of our business and 50% of the amount of uninsured liabilities arising out of MII’s securities litigation pending as of July 30, 2010 in the United States District for the Southern District of Texas.
NOTE 11 – RELATED PARTY TRANSACTIONS
Prior to the spin-off, we were party to transactions with MII and its subsidiaries occurring in the normal course of operations.
Certain corporate and general and administrative expenses have been allocated to MII and its subsidiaries based on a level of effort calculation. We allocated expense of $20.0 million in the seven months ended July 31, 2010, which represented the period prior to our spin-off date.
We included in interest expense $8.7 million in the nine months ended September 30, 2010 and $23.6 million in the twelve months ended December 31, 2009, respectively attributable to an intercompany loan with a subsidiary of MII.
As a result of the spin-off, there were related party transactions that impacted our equity. These are discussed below.
Dividend – In June 2010, we paid a dividend of $100.0 million to MII to maintain appropriate working capital needs. This amount was based on a determination by the MII Board of Directors after a review of the MII consolidated cash position and the respective foreseeable working capital and liquidity requirements for each of MII and B&W following the spin-off.
100
Table of Contents
Net Transactions with Parent – In connection with the spin-off, capital in excess of par value increased by $429.6 million. This increase consisted primarily of the forgiveness of intercompany balances owed to MII of $178.0 million, the noncash settlement of a note payable to an MII affiliate totaling $277.8 and the distribution by B&W of certain net assets totaling $20.7 million to MII, including $43.3 million in cash. In addition to these transactions, MII paid B&W $43.3 million in cash to settle a note receivable, and B&W paid MII $43.4 million in settlement of certain intercompany amounts. In addition, MII contributed net assets to B&W which included $12.5 million in cash.
See Note 3 for additional transactions with unconsolidated affiliates.
NOTE 12 – RISKS AND UNCERTAINTIES
Percentage-of-Completion Accounting
As of December 31, 2010, in accordance with the percentage-of-completion method of accounting, we have provided for our estimated costs to complete all of our ongoing contracts. However, it is possible that current estimates could change due to unforeseen events, which could result in adjustments to overall contract costs. The risk on fixed-priced contracts is that revenue from the customer does not rise to cover increases in our costs. It is possible that current estimates could materially change for various reasons, including, but not limited to, fluctuations in forecasted labor productivity or steel and other raw material prices. Increases in costs on our fixed-price contracts could have a material adverse impact on our consolidated financial condition, results of operations and cash flows. Alternatively, reductions in overall contract costs at completion could materially improve our consolidated financial condition, results of operations and cash flows.
NOTE 13 – FINANCIAL INSTRUMENTS WITH CONCENTRATIONS OF CREDIT RISK
Our Power Generation Systems segment’s major customers are large utilities. The primary customer of our Government Operations segment is the U.S. Government, including some of its contractors. These concentrations of customers may impact our overall exposure to credit risk, either positively or negatively, in that our customers may be similarly affected by changes in economic or other conditions. In the years ended December 31, 2010 and 2009, the U.S. Government accounted for approximately 39% and 33%, respectively, of our total revenues. See Note 17 for additional information about our operations in different geographic areas.
We believe that our provision for possible losses on uncollectible accounts receivable is adequate for our credit loss exposure. At December 31, 2010 and 2009, the allowance for possible losses that we deducted from accounts receivable – trade on the accompanying balance sheet was $3.2 million and $3.3 million, respectively.
NOTE 14 – INVESTMENTS
The following is a summary of our available-for-sale securities at December 31, 2010:
| Amortized Cost |
Gross Unrealized Gains |
Gross Unrealized Losses |
Estimated Fair Value |
|||||||||||||
| (In thousands) | ||||||||||||||||
| U.S. Treasury securities and obligations of U.S. Government agencies |
$ | 70,038 | $ | 8 | $ | — | $ | 70,046 | ||||||||
| Money market instruments and short-term investments |
3,217 | 426 | — | 3,643 | ||||||||||||
| Asset-backed securities and collateralized mortgage obligations |
739 | — | (163 | ) | 576 | |||||||||||
| Corporate and foreign government bonds and notes |
832 | — | — | 832 | ||||||||||||
| Total |
$ | 74,826 | $ | 434 | $ | (163 | ) | $ | 75,097 | |||||||
101
Table of Contents
The following is a summary of our available-for-sale securities at December 31, 2009:
| Amortized Cost |
Gross Unrealized Gains |
Gross Unrealized Losses |
Estimated Fair Value |
|||||||||||||
| (In thousands) | ||||||||||||||||
| U.S. Treasury securities and obligations of U.S. Government agencies |
$ | 63,997 | $ | 44 | $ | (4 | ) | $ | 64,037 | |||||||
| Money market instruments and short-term investments |
461 | 2 | — | 463 | ||||||||||||
| Asset-backed securities and collateralized mortgage obligations |
1,169 | — | (429 | ) | 740 | |||||||||||
| Corporate and foreign government bonds and notes |
8,302 | 14 | (2 | ) | 8,314 | |||||||||||
| Total |
$ | 73,929 | $ | 60 | $ | (435 | ) | $ | 73,554 | |||||||
At December 31, 2010, our available-for-sale debt securities had contractual maturities primarily in 2011 and 2012.
Proceeds, gross realized gains and gross realized losses on sales of available-for-sale securities were as follows:
| Proceeds | Gross Realized Gains |
Gross Realized Losses |
||||||||||
| (In thousands) | ||||||||||||
| Year Ended December 31, 2010 |
$ | 134,276 | $ | — | $ | 122 | ||||||
| Year Ended December 31, 2009 |
$ | 140,203 | $ | — | $ | 30 | ||||||
| Year Ended December 31, 2008 |
$ | 367,109 | $ | 148 | $ | — | ||||||
NOTE 15 – DERIVATIVE FINANCIAL INSTRUMENTS
Our global operations give rise to exposure to market risks from changes in foreign exchange rates. We use derivative financial instruments (primarily foreign currency forward-exchange contracts) to reduce the impact of changes in foreign exchange rates on our operating results. We use these instruments primarily to hedge our exposure associated with revenues or costs on our long-term contracts and other cash flow exposures that are denominated in currencies other than our operating entities’ functional currencies. We do not hold or issue financial instruments for trading or other speculative purposes.
We enter into derivative financial instruments primarily as hedges of certain firm purchase and sale commitments denominated in foreign currencies. We record these contracts at fair value on our consolidated and combined balance sheets. Depending on the hedge designation at the inception of the contract, the related gains and losses on these contracts are either deferred in stockholders’ equity as a component of accumulated other comprehensive loss, until the hedged item is recognized in earnings, or offset against the change in fair value of the hedged firm commitment through earnings. The ineffective portion of a derivative’s change in fair value and any portion excluded from the assessment of effectiveness are immediately recognized in earnings. The gain or loss on a derivative instrument not designated as a hedging instrument is also immediately recognized in earnings. Gains and losses on derivative financial instruments that require immediate recognition are included as a component of other expense – net in our consolidated and combined statements of income.
We have designated all of our forward contracts that qualify for hedge accounting as cash flow hedges. The hedged risk is the risk of changes in functional-currency-equivalent cash flows attributable to changes in spot exchange rates of firm commitments related to long-term contracts. We exclude from our assessment of effectiveness the portion of the fair value of the forward contracts attributable to the difference between spot exchange rates and forward exchange rates. Ineffective portions of our forward contracts are recorded in other expense – net on our consolidated and combined statements of income. At December 31, 2010, we had deferred approximately $1.9 million of net gains on these derivative financial instruments in accumulated other comprehensive loss. We expect to recognize all of this amount in the next twelve months.
102
Table of Contents
At December 31, 2010, all of our derivative financial instruments consisted of foreign currency forward-exchange contracts and warrants to purchase common stock. The notional amount of our forward contracts totaled $285.9 million at December 31, 2010, with maturities extending to May 2014. These instruments consist primarily of contracts to purchase or sell Euros or Canadian Dollars. The fair value of these contracts totaled $2.9 million, all of which are Level 2 in nature (See Note 16). We are exposed to credit-related losses in the event of nonperformance by counterparties to derivative financial instruments. We attempt to mitigate this risk by using major financial institutions with high credit ratings. The counterparties to all of our derivative financial instruments are financial institutions included in our credit facility. Our hedge counterparties have the benefit of the same collateral arrangements and covenants as described under this facility.
The following tables summarize our derivative financial instruments at December 31, 2010 and 2009:
| Asset and
Liability Derivatives December 31, |
||||||||
| 2010 | 2009 | |||||||
| (In thousands) | ||||||||
| Derivatives Designated as Hedges: |
||||||||
| Foreign Exchange Contracts: |
||||||||
| Location |
||||||||
| Accounts receivable-other |
$ | 2,625 | $ | 1,582 | ||||
| Other assets |
$ | 5,360 | $ | — | ||||
| Other liabilities |
$ | 201 | $ | — | ||||
| Accounts payable |
$ | 1,234 | $ | 3,350 | ||||
| Derivatives Not Designated as Hedges: |
||||||||
| Foreign Exchange Contracts: |
||||||||
| Location |
||||||||
| Accounts payable |
$ | 2,793 | $ | — | ||||
| Other liabilities |
$ | 811 | $ | — | ||||
| Stock Warrants: |
||||||||
| Location |
||||||||
| Other assets |
$ | 3,296 | $ | — | ||||
| Foreign Currency Options: |
||||||||
| Location |
||||||||
| Other current assets |
$ | — | $ | 4,747 | ||||
103
Table of Contents
The Effect of Derivative Instruments on the Statements of Financial Performance
(In thousands)
| December 31, | ||||||||
| 2010 | 2009 | |||||||
| Derivatives Designated as Hedges: |
||||||||
| Cash Flow Hedges: |
||||||||
| Foreign Exchange Contracts: |
||||||||
| Amount of gain recognized in other comprehensive income |
$ | 8,952 | $ | 10,979 | ||||
| Income (loss) reclassified from accumulated other comprehensive loss into income: effective portion |
||||||||
| Location |
||||||||
| Revenues |
$ | 1,888 | $ | 71 | ||||
| Cost of operations |
$ | (388 | ) | $ | 1,499 | |||
| Other expense – net |
$ | 430 | $ | 624 | ||||
| Gain (loss) recognized in income: portion excluded from effectiveness testing |
||||||||
| Location |
||||||||
| Other expense – net |
$ | (1,265 | ) | $ | (4,335 | ) | ||
| Derivatives Not Designated as Hedges: |
||||||||
| Foreign Exchange Contracts: |
||||||||
| Gain (loss) recognized in income: |
||||||||
| Location |
||||||||
| Other expense – net |
$ | (3,232 | ) | $ | — | |||
| Stock Warrants: |
||||||||
| Gain (loss) recognized in income: |
||||||||
| Location |
||||||||
| Other expense – net |
$ | 682 | $ | — | ||||
NOTE 16 – FAIR VALUES OF FINANCIAL INSTRUMENTS
FASB Topic Fair Value Measurements and Disclosures defines fair value as the price that would be received to sell an asset or paid to transfer a liability (an exit price) in an orderly transaction between market participants at the measurement date. This topic also sets forth the disclosure requirements regarding fair value and establishes a hierarchy for valuation inputs that emphasizes the use of observable inputs when measuring fair value. A financial instrument’s categorization within the fair value hierarchy is based upon the lowest level of input that is significant to the fair value measurement. The fair value hierarchy established by this topic is as follows:
| • | Level 1 – inputs are based upon quoted prices for identical instruments traded in active markets. |
| • | Level 2 – inputs are based upon quoted prices for similar instruments in active markets, quoted prices for similar or identical instruments in inactive markets and model-based valuation techniques for which all significant assumptions are observable in the market or can be corroborated by observable market data for substantially the full term of the assets and liabilities. |
| • | Level 3 – inputs are generally unobservable and typically reflect management’s estimates of assumptions that market participants would use in pricing the asset or liability. The fair values are therefore determined using model-based techniques that include option pricing models, discounted cash flow models and similar valuation techniques. |
104
Table of Contents
The following sections describe the valuation methodologies we use to measure the fair values of our available-for-sale securities and derivatives.
Available-for-Sale-Securities
Investments other than derivatives primarily include U.S. Government and agency securities, money-market funds, mortgage-backed securities and corporate notes and bonds.
In general, and where applicable, we principally use a composite of observable prices and quoted prices in active markets for identical assets or liabilities to determine fair value. This pricing methodology applies to our Level 1 and 2 investments.
Our net unrealized gain/loss on investments is currently in an unrealized gain position totaling approximately $0.3 million at December 31, 2010. At December 31, 2009, we had unrealized losses on our investments totaling approximately $0.4 million. Based on our analysis of these investments, we believe that none of our available-for-sale securities were other than temporarily impaired at December 31, 2010.
Fair Value Measurements
The following is a summary of our available-for-sale securities measured at fair value at December 31, 2010:
| 12/31/10 | Level 1 | Level 2 | Level 3 | |||||||||||||
| (In thousands) | ||||||||||||||||
| Mutual funds |
$ | 3,385 | $ | — | $ | 3,385 | $ | — | ||||||||
| Certificates of deposit |
258 | — | 258 | — | ||||||||||||
| U.S. Government and agency securities |
70,046 | 70,046 | — | — | ||||||||||||
| Asset-backed securities and collateralized mortgage obligations |
576 | — | 576 | — | ||||||||||||
| Corporate notes and bonds |
832 | — | 832 | — | ||||||||||||
| Total |
$ | 75,097 | $ | 70,046 | $ | 5,051 | $ | — | ||||||||
The following is a summary of our available-for-sale securities measured at fair value at December 31, 2009:
| 12/31/09 | Level 1 | Level 2 | Level 3 | |||||||||||||
| (In thousands) | ||||||||||||||||
| Certificates of deposit |
$ | 463 | $ | — | $ | 463 | $ | — | ||||||||
| U.S. Government and agency securities |
64,037 | 63,005 | 1,032 | — | ||||||||||||
| Asset-backed/mortgage-backed securities |
740 | — | 572 | 168 | ||||||||||||
| Corporate notes and bonds |
8,314 | — | 8,314 | — | ||||||||||||
| Total |
$ | 73,554 | $ | 63,005 | $ | 10,381 | $ | 168 | ||||||||
Derivatives
Level 2 derivative assets and liabilities primarily include over-the-counter options and forwards. These currently consist of foreign exchange rate derivatives. Where applicable, the value of these derivative assets and liabilities is computed by discounting the projected future cash flow amounts to present value using market-based observable inputs, including foreign exchange forward and spot rates, interest rates and counterparty performance risk adjustments. At December 31, 2010, we had forward contracts outstanding to purchase or sell foreign currencies, primarily Euros and Canadian Dollars, with a total notional amount of $285.9 million and a total fair value of $2.9 million.
105
Table of Contents
Level 3 derivative assets include warrants to purchase common stock. The value of the warrants are computed using an option pricing model based on unobservable inputs such as estimated stock price for inactive shares, and observable inputs, including interest rates and volatility. At December 31, 2010, the warrants had a fair value of $3.3 million.
Changes in Level 3 Instrument
The following is a summary of the changes in our Level 3 instrument measured on a recurring basis for the years ended December 31, 2010 and 2009:
| Year ended December 31, | ||||||||
| 2010 | 2009 | |||||||
| (In thousands) | ||||||||
| Balance at beginning of period |
$ | 168 | $ | 167 | ||||
| Total realized and unrealized gains (losses): |
790 | 54 | ||||||
| Included in other income (expense) |
671 | — | ||||||
| Included in other comprehensive income |
119 | 54 | ||||||
| Purchases, issuances, and settlements |
2,342 | — | ||||||
| Principal repayments |
(4 | ) | (53 | ) | ||||
| Balance at end of period |
$ | 3,296 | $ | 168 | ||||
Our Level 3 instruments at December 31, 2010 consists of warrants to purchase common stock.
Other Financial Instruments
We used the following methods and assumptions in estimating our fair value disclosures for our other financial instruments, as follows:
Cash and cash equivalents and restricted cash and cash equivalents. The carrying amounts that we have reported in the accompanying consolidated and combined balance sheets for cash and cash equivalents approximate their fair values due to their highly liquid nature.
Investments. We estimate the fair value of investments based on quoted market prices. For investments for which there are no quoted market prices, we derive fair values from available yield curves for investments of similar quality and terms.
Long- and short-term debt. We base the fair values of debt instruments on quoted market prices. Where quoted prices are not available, we base the fair values on the present value of future cash flows discounted at estimated borrowing rates for similar debt instruments or on estimated prices based on current yields for debt issues of similar quality and terms.
The estimated fair values of our financial instruments are as follows:
| December 31, 2010 | December 31, 2009 | |||||||||||||||
| Carrying Amount |
Fair Value | Carrying Amount |
Fair Value | |||||||||||||
| (In thousands) | ||||||||||||||||
| Balance Sheet Instruments |
||||||||||||||||
| Cash and cash equivalents |
$ | 391,142 | $ | 391,142 | $ | 469,468 | $ | 469,468 | ||||||||
| Restricted cash and cash equivalents |
$ | 16,233 | $ | 16,233 | $ | 15,305 | $ | 15,305 | ||||||||
| Investments |
$ | 75,097 | $ | 75,097 | $ | 73,554 | $ | 73,554 | ||||||||
| Debt |
$ | 5,645 | $ | 5,673 | $ | 10,654 | $ | 10,782 | ||||||||
| Stock warrants |
$ | 3,296 | $ | 3,296 | $ | — | $ | — | ||||||||
| Forward contracts |
$ | 2,946 | $ | 2,946 | $ | (1,769 | ) | $ | (1,769 | ) | ||||||
| Foreign currency options |
$ | — | $ | — | $ | 4,747 | $ | 4,747 | ||||||||
106
Table of Contents
NOTE 17 – SEGMENT REPORTING
Our reportable segments are Power Generation Systems and Government Operations, as described in Note 1. The operations of our segments are managed separately and each has unique technology, services and customer class.
We account for intersegment sales at prices that we generally establish by reference to similar transactions with unaffiliated customers. Reportable segments are measured based on operating income exclusive of general corporate expenses, contract and insurance claims provisions, legal expenses and gains (losses) on sales of corporate assets.
1. Information about Operations in our Different Industry Segments:
| Year Ended December 31, | ||||||||||||
| 2010 | 2009 | 2008 | ||||||||||
| (In thousands) | ||||||||||||
| REVENUES (1): |
||||||||||||
| Power Generation Systems |
$ | 1,609,684 | $ | 1,824,450 | $ | 2,548,855 | ||||||
| Government Operations |
1,083,605 | 1,032,023 | 851,019 | |||||||||
| Adjustments and Eliminations |
(4,478 | ) | (1,841 | ) | (1,300 | ) | ||||||
| $ | 2,688,811 | $ | 2,854,632 | $ | 3,398,574 | |||||||
|
(1) Segment revenues are net of the following intersegment transfers and other adjustments:
|
| |||||||||||
| Power Generation Systems Transfers |
$ | 128 | $ | 2 | $ | 55 | ||||||
| Government Operations Transfers |
4,350 | 1,839 | 1,245 | |||||||||
| $ | 4,478 | $ | 1,841 | $ | 1,300 | |||||||
| Year Ended December 31, | ||||||||||||
| 2010 | 2009 | 2008 | ||||||||||
| (In thousands) | ||||||||||||
| OPERATING INCOME: |
||||||||||||
| Power Generation Systems |
$ | 100,719 | $ | 157,869 | $ | 315,397 | ||||||
| Government Operations |
182,914 | 154,542 | 150,232 | |||||||||
| $ | 283,633 | $ | 312,411 | $ | 465,629 | |||||||
| Unallocated Corporate(1) |
(19,661 | ) | (42,847 | ) | (21,146 | ) | ||||||
| Total Operating Income(2) |
$ | 263,972 | $ | 269,564 | $ | 444,483 | ||||||
| Other Income (Expense): |
||||||||||||
| Interest income |
1,187 | 3,439 | 15,286 | |||||||||
| Interest expense |
(12,939 | ) | (24,590 | ) | (22,740 | ) | ||||||
| Other expense - net |
(16,400 | ) | (16,112 | ) | (4,290 | ) | ||||||
| Total Other Expense |
(28,152 | ) | (37,263 | ) | (11,744 | ) | ||||||
| Income before Provision for Income Taxes |
$ | 235,820 | $ | 232,301 | $ | 432,739 | ||||||
|
(1) Unallocated corporate includes general corporate overhead not allocated to segments |
| |||||||||||
| (2) Included in operating income is the following:
|
| |||||||||||
| (Loss) Gain on Asset Disposals – Net: |
||||||||||||
| Power Generation Systems |
$ | 23 | $ | (272 | ) | $ | 9,606 | |||||
| Government Operations |
(61 | ) | (171 | ) | — | |||||||
| Unallocated Corporate |
— | (783 | ) | (3 | ) | |||||||
| $ | (38 | ) | $ | (1,226 | ) | $ | 9,603 | |||||
| Equity in Income of Investees: |
||||||||||||
| Power Generation Systems |
$ | 30,788 | $ | 14,043 | $ | 10,411 | ||||||
| Government Operations |
43,294 | 41,051 | 41,381 | |||||||||
| $ | 74,082 | $ | 55,094 | $ | 51,792 | |||||||
107
Table of Contents
Equity in Income of Investees of our Government Operations segment is all attributable to the management and operating activities of U.S. Government facilities by our Technical Services Group.
| Year Ended December 31, | ||||||||||||
| 2010 | 2009 | 2008 | ||||||||||
| (In thousands) | ||||||||||||
| SEGMENT ASSETS: |
||||||||||||
| Power Generation Systems |
$ | 1,422,259 | $ | 1,429,475 | $ | 1,523,488 | ||||||
| Government Operations |
795,431 | 945,806 | 711,628 | |||||||||
| Total Segment Assets |
2,217,690 | 2,375,281 | 2,235,116 | |||||||||
| Corporate Assets |
282,820 | 228,578 | 271,725 | |||||||||
| Total Assets |
$ | 2,500,510 | $ | 2,603,859 | $ | 2,506,841 | ||||||
| CAPITAL EXPENDITURES: |
||||||||||||
| Power Generation Systems |
$ | 18,107 | $ | 32,148 | $ | 33,896 | ||||||
| Government Operations |
26,622 | 45,062 | 16,348 | |||||||||
| Segment Capital Expenditures |
44,729 | 77,210 | 50,244 | |||||||||
| Corporate Capital Expenditures |
18,920 | 16,515 | 12,770 | |||||||||
| Total Capital Expenditures |
$ | 63,649 | $ | 93,725 | $ | 63,014 | ||||||
| DEPRECIATION AND AMORTIZATION: |
||||||||||||
| Power Generation Systems |
$ | 23,552 | $ | 17,859 | $ | 22,080 | ||||||
| Government Operations |
40,912 | 51,588 | 22,445 | |||||||||
| Segment Depreciation and Amortization |
64,464 | 69,447 | 44,525 | |||||||||
| Corporate Depreciation and Amortization |
7,169 | 3,265 | 1,460 | |||||||||
| Total Depreciation and Amortization |
$ | 71,633 | $ | 72,712 | $ | 45,985 | ||||||
| INVESTMENT IN UNCONSOLIDATED AFFILIATES: |
||||||||||||
| Power Generation Systems |
$ | 95,527 | $ | 64,666 | $ | 57,701 | ||||||
| Government Operations |
5,284 | 3,661 | 3,926 | |||||||||
| Total Investment in Unconsolidated Affiliates |
$ | 100,811 | $ | 68,327 | $ | 61,627 | ||||||
108
Table of Contents
2. Information about our Product and Service Lines:
| Year Ended December 31, | ||||||||||||
| 2010 | 2009 | 2008 | ||||||||||
| (In thousands) | ||||||||||||
| REVENUES: |
||||||||||||
| Power Generation Systems: |
||||||||||||
| New Build Environmental Equipment |
$ | 266,631 | $ | 363,456 | $ | 787,576 | ||||||
| New Build Steam Generation Systems |
422,756 | 505,878 | 641,798 | |||||||||
| After Market Services |
740,073 | 810,236 | 939,221 | |||||||||
| Nuclear Equipment Operations |
196,280 | 174,783 | 187,403 | |||||||||
| Eliminations/Other |
(16,056 | ) | (29,903 | ) | (7,143 | ) | ||||||
| 1,609,684 | 1,824,450 | 2,548,855 | ||||||||||
| Government Operations: |
||||||||||||
| Nuclear Component Program |
986,952 | 887,844 | 705,442 | |||||||||
| Commercial Operations |
41,119 | 98,189 | 89,857 | |||||||||
| Nuclear Environmental Services |
40,542 | 33,702 | 40,352 | |||||||||
| Management & Operation Contracts of U.S. Government Facilities |
12,933 | 13,174 | 15,779 | |||||||||
| Contract Research |
— | — | 46 | |||||||||
| Other Government Operations |
4,498 | 833 | 821 | |||||||||
| Eliminations/Other |
(2,439 | ) | (1,719 | ) | (1,278 | ) | ||||||
| 1,083,605 | 1,032,023 | 851,019 | ||||||||||
| Eliminations |
(4,478 | ) | (1,841 | ) | (1,300 | ) | ||||||
| $ | 2,688,811 | $ | 2,854,632 | $ | 3,398,574 | |||||||
109
Table of Contents
3. Information about our Operations in Different Geographic Areas:
| Year Ended December 31, | ||||||||||||
| 2010 | 2009 | 2008 | ||||||||||
| (In thousands) | ||||||||||||
| REVENUES(1): |
||||||||||||
| United States |
$ | 2,133,924 | $ | 2,300,039 | $ | 2,819,616 | ||||||
| Canada |
252,089 | 267,567 | 317,422 | |||||||||
| Sweden |
48,632 | 40,852 | 42,576 | |||||||||
| China |
48,285 | 54,192 | 50,197 | |||||||||
| Norway |
33,353 | 21,996 | 11,467 | |||||||||
| Ireland |
26,574 | 10,336 | 1,083 | |||||||||
| India |
16,277 | 5,229 | 5,794 | |||||||||
| Denmark |
15,040 | 21,965 | 31,333 | |||||||||
| Japan |
8,797 | 26,904 | 2,007 | |||||||||
| United Kingdom |
6,791 | 6,746 | 10,899 | |||||||||
| Indonesia |
6,048 | 8,834 | 7,090 | |||||||||
| France |
5,373 | 8,351 | 5,323 | |||||||||
| Belgium |
3,732 | 2,666 | 20,423 | |||||||||
| Germany |
3,464 | 15,734 | 12,893 | |||||||||
| Brazil |
2,957 | 2,131 | 4,199 | |||||||||
| Other Countries |
77,475 | 61,090 | 56,252 | |||||||||
| $ | 2,688,811 | $ | 2,854,632 | $ | 3,398,574 | |||||||
| (1) | We allocate geographic revenues based on the location of the customer’s operations. |
| PROPERTY, PLANT AND EQUIPMENT, NET: |
| |||||||||||
| United States |
$ | 345,848 | $ | 360,076 | $ | 313,006 | ||||||
| Canada |
41,959 | 40,058 | 33,524 | |||||||||
| United Kingdom |
10,401 | 11,234 | 10,661 | |||||||||
| Denmark |
8,395 | 8,852 | 8,549 | |||||||||
| Other Countries |
11,709 | 9,841 | 5,085 | |||||||||
| $ | 418,312 | $ | 430,061 | $ | 370,825 | |||||||
4. Information about our Major Customers:
In the years ended December 31, 2010, 2009 and 2008, the U.S. Government accounted for approximately 39%, 33% and 22%, respectively, of our total revenues. We have included these revenues in our Government Operations segment.
110
Table of Contents
NOTE 18 – QUARTERLY FINANCIAL DATA (UNAUDITED)
The following tables set forth selected unaudited quarterly financial information for the years ended December 31, 2010 and 2009:
| Year Ended December 31,
2010 Quarter Ended |
||||||||||||||||
| March 31, 2010 |
June 30, 2010 |
Sept. 30, 2010 |
Dec. 31, 2010 |
|||||||||||||
| (In thousands, except per share amounts) | ||||||||||||||||
| Revenues |
$ | 662,388 | $ | 688,496 | $ | 632,765 | $ | 705,162 | ||||||||
| Operating income (1) |
$ | 38,746 | $ | 85,655 | $ | 65,077 | $ | 74,494 | ||||||||
| Equity in income of investees |
$ | 14,019 | $ | 17,435 | $ | 16,986 | $ | 25,642 | ||||||||
| Net income attributable to The Babcock & Wilcox Company |
$ | 16,843 | $ | 47,640 | $ | 35,887 | $ | 52,892 | ||||||||
| Earnings per common share: |
||||||||||||||||
| Basic: |
||||||||||||||||
| Net income attributable to The Babcock & Wilcox Company |
$ | 0.15 | $ | 0.41 | $ | 0.31 | $ | 0.45 | ||||||||
| Diluted: |
||||||||||||||||
| Net income attributable to The Babcock & Wilcox Company |
$ | 0.14 | $ | 0.41 | $ | 0.31 | $ | 0.45 | ||||||||
| (1) | Includes equity in income of investees. |
| Year Ended December 31,
2009 Quarter Ended |
||||||||||||||||
| March
31, 2009 |
June
30, 2009 |
Sept. 30, 2009 |
Dec. 31, 2009 |
|||||||||||||
| (In thousands, except per share amounts) | ||||||||||||||||
| Revenues |
$ | 785,053 | $ | 732,069 | $ | 648,997 | $ | 688,513 | ||||||||
| Operating income (1) |
$ | 95,308 | $ | 90,567 | $ | 46,118 | $ | 37,571 | ||||||||
| Equity in income of investees |
$ | 10,345 | $ | 10,153 | $ | 13,646 | $ | 20,950 | ||||||||
| Net income attributable to The Babcock & Wilcox Company |
$ | 53,484 | $ | 48,417 | $ | 26,285 | $ | 19,578 | ||||||||
| Earnings per common share: |
||||||||||||||||
| Basic: |
||||||||||||||||
| Net income attributable to The Babcock & Wilcox Company |
$ | 0.46 | $ | 0.42 | $ | 0.23 | $ | 0.17 | ||||||||
| Diluted: |
||||||||||||||||
| Net income attributable to The Babcock & Wilcox Company |
$ | 0.46 | $ | 0.41 | $ | 0.22 | $ | 0.17 | ||||||||
| (1) | Includes equity in income of investees. |
Our March 31, 2010 and December 31, 2009 quarters experienced lower Net income attributable to The Babcock & Wilcox Company primarily attributable to lower operating income in our Power Generation Systems segment, primarily due to the effects of timing on the completion of long-term projects.
111
Table of Contents
NOTE 19 – EARNINGS PER SHARE
The following table sets forth the computation of basic and diluted earnings per share:
| Year Ended December 31, | ||||||||||||||
| 2010 | 2009 | 2008 | ||||||||||||
| (In thousands, except shares and per share amounts) |
||||||||||||||
| Basic: |
||||||||||||||
| Net income attributable to The Babcock & Wilcox Company | $ | 153,262 | $ | 147,764 | $ | 323,766 | ||||||||
| Weighted average common shares | 116,260,425 | 116,067,535 | 116,067,535 | |||||||||||
| Basic earnings per common share: |
||||||||||||||
| Net income attributable to The Babcock & Wilcox Company | $ | 1.32 | $ | 1.27 | $ | 2.79 | ||||||||
| Diluted: |
||||||||||||||
| Net income attributable to The Babcock & Wilcox Company | $ | 153,262 | $ | 147,764 | $ | 323,766 | ||||||||
| Weighted average common shares (basic) | 116,260,425 | 116,067,535 | 116,067,535 | |||||||||||
| Effect of dilutive securities: |
||||||||||||||
| Stock options, restricted stock and performance shares(1) |
1,365,640 | 1,356,272 | 1,356,272 | |||||||||||
| Adjusted weighted average common shares | 117,626,065 | 117,423,807 | 117,423,807 | |||||||||||
| Diluted earnings per common share: |
||||||||||||||
| Net income attributable to The Babcock & Wilcox Company | $ | 1.30 | $ | 1.26 | $ | 2.76 | ||||||||
| (1) | At December 31, 2010 we excluded from the diluted share calculation 349,744 shares related to stock options, as their effect would have been antidilutive. |
| Item 9. | CHANGES IN AND DISAGREEMENTS WITH ACCOUNTANTS ON ACCOUNTING AND FINANCIAL DISCLOSURE |
None
| Item 9A. | CONTROLS AND PROCEDURES |
Disclosure Controls and Procedures
As of the end of the period covered by this annual report, we carried out an evaluation, under the supervision and with the participation of our management, including our Chief Executive Officer and Chief Financial Officer, of the effectiveness of the design and operation of our disclosure controls and procedures (as that term is defined in Rules 13a-15(e) and 15d-15(e) adopted by the SEC under the Securities Exchange Act of 1934, as amended (the “Exchange Act”)). Our disclosure controls and procedures were developed through a process in which our management applied its judgment in assessing the costs and benefits of such controls and procedures, which, by their nature, can provide only reasonable assurance regarding the control objectives. You should note that the design of any system of disclosure controls and procedures is based in part upon various assumptions about the likelihood of future events, and we cannot assure you that any design will succeed in achieving its stated goals under all potential future conditions, regardless of how remote. Based on the evaluation referred to above, our Chief Executive Officer and the Chief Financial Officer concluded that the design and operation of our disclosure controls and procedures are effective as of December 31, 2010 to provide reasonable assurance that information required to be disclosed by us in the reports that we file or submit under the Exchange
112
Table of Contents
Act is recorded, processed, summarized and reported within the time periods specified in the rules and forms of the Securities and Exchange Commission and such information is accumulated and communicated to management, including its principal executives and principal financial officers or persons performing similar functions, as appropriate to allow timely decisions regarding required disclosure.
Management’s Report on Internal Control Over Financial Reporting
Our management is responsible for establishing and maintaining adequate internal control over financial reporting (as that term is defined in Rules 13a-15(f) and 15d-15(f) under the Securities Exchange Act of 1934) and for our assessment of the effectiveness of internal control over financial reporting.
Our internal control over financial reporting includes policies and procedures that (1) pertain to the maintenance of records that, in reasonable detail, accurately and fairly reflect the transactions and dispositions of our assets; (2) provide reasonable assurance that transactions are recorded as necessary to permit preparation of our consolidated financial statements in accordance with generally accepted accounting principles, and that receipts and expenditures are being made only in accordance with authorizations of our management and Board of Directors; and (3) provide reasonable assurance regarding prevention or timely detection of unauthorized acquisition, use or disposition of our assets that could have a material effect on the consolidated financial statements.
Because of its inherent limitations, internal control over financial reporting may not prevent or detect misstatements. Also, projections of any evaluation of effectiveness to future periods are subject to the risk that controls may become inadequate because of changes in conditions, or that the degree of compliance with the policies or procedures may deteriorate.
Our management, including our Chief Executive Officer and Chief Financial Officer, has conducted an assessment of the effectiveness of our internal control over financial reporting as of December 31, 2010, based on the framework established in Internal Control — Integrated Framework issued by the Committee of Sponsoring Organizations of the Treadway Commission (the “COSO Framework”). This assessment included an evaluation of the design of our internal control over financial reporting and testing of the operational effectiveness of those controls. Based on our assessment under the criteria described above, management has concluded that our internal control over financial reporting was effective as of December 31, 2010. Deloitte & Touche LLP has audited our internal control over financial reporting as of December 31, 2010, and their report is included in Item 9A.
Changes in Internal Control Over Financial Reporting
There has been no change in our internal control over financial reporting during the quarter ended December 31, 2010 that has materially affected, or is reasonably likely to materially affect, our internal control over financial reporting.
Report of Independent Registered Public Accounting Firm
To the Board of Directors and Stockholders of The Babcock & Wilcox Company:
We have audited the internal control over financial reporting of The Babcock & Wilcox Company and subsidiaries (the “Company”) as of December 31, 2010, based on criteria established in Internal Control — Integrated Framework issued by the Committee of Sponsoring Organizations of the Treadway Commission. The Company’s management is responsible for maintaining effective internal control over financial reporting and for its assessment of the effectiveness of internal control over financial reporting, included in the accompanying Management’s Report on Internal Control Over Financial Reporting. Our responsibility is to express an opinion on the Company’s internal control over financial reporting based on our audit.
113
Table of Contents
We conducted our audit in accordance with the standards of the Public Company Accounting Oversight Board (United States). Those standards require that we plan and perform the audit to obtain reasonable assurance about whether effective internal control over financial reporting was maintained in all material respects. Our audit included obtaining an understanding of internal control over financial reporting, assessing the risk that a material weakness exists, testing and evaluating the design and operating effectiveness of internal control based on the assessed risk, and performing such other procedures as we considered necessary in the circumstances. We believe that our audit provides a reasonable basis for our opinion.
A company’s internal control over financial reporting is a process designed by, or under the supervision of, the company’s principal executive and principal financial officers, or persons performing similar functions, and effected by the company’s board of directors, management, and other personnel to provide reasonable assurance regarding the reliability of financial reporting and the preparation of financial statements for external purposes in accordance with generally accepted accounting principles. A company’s internal control over financial reporting includes those policies and procedures that (1) pertain to the maintenance of records that, in reasonable detail, accurately and fairly reflect the transactions and dispositions of the assets of the company; (2) provide reasonable assurance that transactions are recorded as necessary to permit preparation of financial statements in accordance with generally accepted accounting principles, and that receipts and expenditures of the company are being made only in accordance with authorizations of management and directors of the company; and (3) provide reasonable assurance regarding prevention or timely detection of unauthorized acquisition, use, or disposition of the company’s assets that could have a material effect on the financial statements.
Because of the inherent limitations of internal control over financial reporting, including the possibility of collusion or improper management override of controls, material misstatements due to error or fraud may not be prevented or detected on a timely basis. Also, projections of any evaluation of the effectiveness of the internal control over financial reporting to future periods are subject to the risk that the controls may become inadequate because of changes in conditions, or that the degree of compliance with the policies or procedures may deteriorate.
In our opinion, the Company maintained, in all material respects, effective internal control over financial reporting as of December 31, 2010, based on the criteria established in Internal Control — Integrated Framework issued by the Committee of Sponsoring Organizations of the Treadway Commission.
We have also audited, in accordance with the standards of the Public Company Accounting Oversight Board (United States), the consolidated and combined financial statements as of and for the year ended December 31, 2010 of the Company and our report dated March 1, 2011 expressed an unqualified opinion on those financial statements and included an explanatory paragraph relating to the operation of The Babcock & Wilcox Company as a subsidiary of McDermott International, Inc. for 2008 and 2009 and a portion of 2010.
/S/ DELOITTE & TOUCHE LLP
Charlotte, North Carolina
March 1, 2011
| Item 9B. | OTHER INFORMATION |
Coal Mine Safety
We own an interest in and manage and operate Ebensburg Power Company, an independent power company that produces alternative electrical energy. Through one of our subsidiaries, Revloc Reclamation Service, Inc., Ebensburg Power Company operates multiple refuse sites in Western Pennsylvania (collectively, the “Revloc Sites”). At the Revloc Sites, Ebensburg Power Company utilizes previously discarded waste coal from abandoned surface mine lands to produce energy. Beyond converting the discarded waste coal to energy, Ebensburg Power Company is also taking steps to reclaim the former surface mine lands to make the land and streams more attractive for wildlife and human uses.
114
Table of Contents
The Revloc Sites are subject to regulation by the Federal Mine Safety and Health Administration (“MSHA”) under the Federal Mine Safety and Health Act of 1977 (the “Mine Safety Act”). Pursuant to Section 1503 of the Dodd-Frank Act, we are providing certain safety information regarding the Revloc Sites.
Except as set forth below, during the year ended December 31, 2010, we did not receive any citation or order from the MSHA involving the Revloc Sites relating to:
| • | a violation of mandatory health or safety standards that could significantly and substantially contribute to the cause and effect of a coal mine safety or health hazard under Section 104(a) of the Mine Safety Act; |
| • | an order issued under section 104(b) of the Mine Safety Act; |
| • | an unwarrantable failure of the mine operator to comply with mandatory health or safety standards under Section 104(d) of the Mine Safety Act; |
| • | a flagrant violation under Section 110(b) (2) of the Mine Safety Act; or |
| • | an imminent danger order issued under Section 107(a) of the Act. |
In June 2010, the Revloc Sites received one citation for a “significant and substantial” violation under Section 104(a) of the Mine Safety Act regarding the failure to provide a berm or guard along the bank of an elevated roadway. We received the proposed assessment from MSHA relating to this citation totaling $285 and have taken action to remedy the condition giving rise to the violation. This citation is pending before the Federal Mine Safety and Health Review Commission. As of December 31, 2010, we had no other matters pending before the Federal Mine Safety and Health Review Commission.
In addition, during the year ended December 31, 2010, there were no mining-related fatalities at the Revloc Sites and we did not receive any written notice from MSHA involving the Revloc Sites of a pattern of violations, or the potential to have such a pattern, of mandatory health or safety standards that are of such nature as could have significantly and substantially contributed to the cause and effect of coal mine health or safety hazards under Section 104(e) of the Mine Safety Act.
| Item 10. | DIRECTORS, EXECUTIVE OFFICERS AND CORPORATE GOVERNANCE |
The information required by this item with respect to directors and executive officers is incorporated by reference to the material appearing under the headings “Election of Directors,” “Named Executive Profiles,” and “Executive Officers” in the Proxy Statement for our 2011 Annual Meeting of Stockholders. The information required by this item with respect to compliance with section 16(a) of the Securities and Exchange Act of 1934, as amended, is incorporated by reference to the material appearing under the heading “Section 16(a) Beneficial Ownership Reporting Compliance” in the Proxy Statement for our 2011 Annual Meeting of Stockholders. The information required by this item with respect to the Audit Committee and Audit and Finance Committee financial experts is incorporated by reference to the material appearing in the “Audit and Finance Committee” sections under the heading “Corporate Governance – Board of Directors and Its Committees” in the Proxy Statement for our 2011 Annual Meeting of Stockholders.
We have adopted a Code of Business Conduct for our employees and directors, including, specifically, our chief executive officer, our chief financial officer, our chief accounting officer, and our other executive officers. Our code satisfies the requirements for a “code of ethics” within the meaning of SEC rules. A copy of the code is posted on our web site, www.babcock.com under “Investor Relations – Corporate Governance – Highlights.”
115
Table of Contents
| Item 11. | EXECUTIVE COMPENSATION |
The information required by this item is incorporated by reference to the material appearing under the headings “Compensation Discussion and Analysis,” “Compensation of Directors,” “Compensation of Executive Officers,” “Compensation Committee Interlocks and Insider Participation” and “Compensation Committee Report” in the Proxy Statement for our 2011 Annual Meeting of Stockholders.
| Item 12. | SECURITY OWNERSHIP OF CERTAIN BENEFICIAL OWNERS AND MANAGEMENT AND RELATED STOCKHOLDER MATTERS |
The information required by this item is incorporated by reference to (1) the Equity Compensation Plan Information table appearing in Item 5 – “Market for the Registrant’s Common Equity, Related Stockholder Matters and Issuer Purchases of Equity Securities” in Part II of this report and (2) the material appearing under the headings “Security Ownership of Directors and Executive Officers” and “Security Ownership of Certain Beneficial Owners” in the Proxy Statement for our 2011 Annual Meeting of Stockholders.
| Item 13. | CERTAIN RELATIONSHIPS AND RELATED TRANSACTIONS, AND DIRECTOR INDEPENDENCE |
The information in Note 11 to our consolidated and combined financial statements included in this report is incorporated by reference. Additional information required by this item is incorporated by reference to the material appearing under the heading “Corporate Governance – Director Independence” in the Proxy Statement for our 2011 Annual Meeting of Stockholders.
| Item 14. | PRINCIPAL ACCOUNTANT FEES AND SERVICES |
The information required by this item is incorporated by reference to the material appearing under the heading “Ratification of Appointment of Independent Registered Public Accounting Firm for Year Ending December 31, 2011” in the Proxy Statement for our 2011 Annual Meeting of Stockholders.
| Item 15. | EXHIBITS, FINANCIAL STATEMENT SCHEDULES |
The following documents are filed as part of this Annual Report or incorporated by reference:
116
Table of Contents
| 2. | CONSOLIDATED FINANCIAL STATEMENT SCHEDULES | |||||||||||
| All schedules for which provision is made of the applicable regulations of the SEC have been omitted because they are not required under the relevant instructions or because the required information is included in the financial statements or the related footnotes contained in this report. | ||||||||||||
| 3. |
EXHIBITS | |||||||
| Exhibit Number |
Description |
|||||||
| 2.1 | Master Separation Agreement dated as of July 2, 2010 between McDermott International, Inc. and The Babcock & Wilcox Company (incorporated by reference to Exhibit 2.1 to The Babcock & Wilcox Company’s Quarterly Report on Form 10-Q for the quarter ended June 30, 2010 (File no. 1-34658)). | |||||||
| 3.1 | Restated Certificate of Incorporation of The Babcock & Wilcox Company (incorporated by reference to Exhibit 3.1 to The Babcock & Wilcox Company’s Quarterly Report on Form 10-Q for the quarter ended June 30, 2010 (File No. 1-34658)). | |||||||
| 3.2 | Amended and Restated Bylaws of The Babcock & Wilcox Company (incorporated by reference to Exhibit 3.2 to The Babcock & Wilcox Company’s Quarterly Report on Form 10-Q for the quarter ended June 30, 2010 (File No. 1-34658)). | |||||||
| 4.1 |
Credit Agreement dated as of May 3, 2010, among Babcock & Wilcox Investment Company, the lenders and letter of credit issuers party thereto, and Bank of America, N.A., as administrative agent (incorporated by reference to Exhibit 10.16 to The Babcock & Wilcox Company’s Registration Statement on Form 10 filed on May 19, 2010 (File No. 1-34658)). | |||||||
| 4.2 |
Joinder and Reaffirmation Agreement dated as of August 6, 2010, among The Babcock & Wilcox Company (as borrower), Babcock & Wilcox Investment Company, Babcock & Wilcox India Holdings, Inc. and certain other subsidiaries of the borrower in favor of Bank of America, N.A., as administrative agent (incorporated by reference to Exhibit 4.3 to The Babcock & Wilcox Company’s Quarterly Report on Form 10-Q for the quarter ended June 30, 2010 (File No. 1-34658)). | |||||||
| 4.3 |
Pledge and Security Agreement dated as of May 3, 2010, by Babcock & Wilcox Investment Company and certain of its subsidiaries in favor of Bank of America, N.A., as administrative agent (incorporated by reference to Exhibit 10.17 to The Babcock & Wilcox Company’s Registration Statement on Form 10 filed on May 19, 2010 (File No. 1-34658)). | |||||||
| 10.1 |
Tax Sharing Agreement dated as of June 7, 2010 between J. Ray Holdings, Inc. and Babcock & Wilcox Holdings, Inc. (incorporated by reference to Exhibit 10.2 to The Babcock & Wilcox Company’s Quarterly Report on Form 10-Q for the quarter ended June 30, 2010 (File No. 1-34658)). | |||||||
| 10.2 |
Employee Matters Agreement dated as of July 2, 2010 among McDermott International, Inc., McDermott Investments LLC, The Babcock & Wilcox Company and Babcock & Wilcox Investment Company (incorporated by reference to Exhibit 10.1 to The Babcock & Wilcox Company’s Quarterly Report on Form 10-Q for the quarter ended June 30, 2010 (File No. 1-34658)). | |||||||
117
Table of Contents
| Exhibit Number |
Description |
|||||||
| 10.3 |
Amendment to the Employee Matters Agreement dated as of August 3, 2010 among McDermott International, Inc., McDermott Investments LLC, The Babcock & Wilcox Company and Babcock & Wilcox Investment Company (incorporated by reference to Exhibit 10.15 to The Babcock & Wilcox Company’s Quarterly Report on Form 10-Q for the quarter ended June 30, 2010 (File No. 1-34658)). | |||||||
| 10.4 |
Amendment No. 2 to the Employee Matters Agreement dated as of August 10, 2010 among McDermott International, Inc., McDermott Investments LLC, The Babcock & Wilcox Company and Babcock & Wilcox Investment Company (incorporated by reference to Exhibit 10.3 to The Babcock & Wilcox Company’s Quarterly Report on Form 10-Q for the quarter ended September 30, 2010 (File No. 1-34658)). | |||||||
| 10.5 |
Transition Services Agreement dated as of July 2, 2010 between McDermott International, Inc. as service provider and The Babcock & Wilcox Company as service receiver (incorporated by reference to Exhibit 10.3 to The Babcock & Wilcox Company’s Quarterly Report on Form 10-Q for the quarter ended June 30, 2010 (File No. 1-34658)). | |||||||
| 10.6 |
Transition Services Agreement dated as of July 2, 2010 between The Babcock & Wilcox Company as service provider and McDermott International, Inc. as service receiver (incorporated by reference to Exhibit 10.4 to The Babcock & Wilcox Company’s Quarterly Report on Form 10-Q for the quarter ended June 30, 2010 (File No. 1-34658)) | |||||||
| 10.7 |
Assumption and Loss Allocation Agreement dated as of May 18, 2010 by and among ACE American Assurance Company and the Ace Affiliates (as defined therein), McDermott International, Inc. and Babcock & Wilcox Holdings, Inc. (incorporated by reference to Exhibit 10.5 to The Babcock & Wilcox Company’s Registration Statement on Form 10 filed on May 19, 2010 (File No. 1-34658)). | |||||||
| 10.8 |
Novation and Assumption Agreement dated as of May 18, 2010 by and among ACE American Assurance Company and the Ace Affiliates (as defined therein), Creole Insurance Company, Ltd. and Boudin Insurance Company, Ltd. (incorporated by reference to Exhibit 10.6 to The Babcock & Wilcox Company’s Registration Statement on Form 10 filed on May 19, 2010 (File No. 1-34658)). | |||||||
| 10.9 |
Novation and Assumption Agreement dated as of May 18, 2010 by and among McDermott International, Inc., Babcock & Wilcox Holdings, Inc., Boudin Insurance Company, Ltd. and Creole Insurance Company, Ltd. (incorporated by reference to Exhibit 10.7 to The Babcock & Wilcox Company’s Registration Statement on Form 10 filed on May 19, 2010 (File No. 1-34658)). | |||||||
| 10.10 |
Securities Purchase Agreement dated as of May 25, 2010, by and among USEC Inc., Toshiba Corporation and Babcock & Wilcox Investment Company (incorporated by reference to Exhibit 10.18 to The Babcock & Wilcox Company’s Registration Statement on Form 10 filed on June 4, 2010 (File No. 1-34658)). | |||||||
| 10.11* |
2010 (File No. 1-34658)). 2010 Long-Term Incentive Plan of The Babcock & Wilcox Company, effective July 2, 2010 (incorporated by reference to Exhibit 10.8 to The Babcock & Wilcox Company’s Quarterly Report on Form 10-Q for the quarter ended June 30, 2010 (File No. 1-34658)). | |||||||
| 10.12* |
Amended and Restated 2010 Long-Term Incentive Plan of The Babcock & Wilcox Company, dated as of February 22, 2011. | |||||||
118
Table of Contents
| Exhibit Number |
Description |
|||||||
| 10.13* |
The Babcock & Wilcox Executive Incentive Compensation Plan, effective July 30, 2010 (incorporated by reference to Exhibit 10.9 to The Babcock & Wilcox Company’s Quarterly Report on Form 10-Q for the quarter ended June 30, 2010 (File No. 1-34658)). | |||||||
| 10.14* |
The Babcock & Wilcox Executive Incentive Compensation Plan, as amended and restated as of February 22, 2011. | |||||||
| 10.15* |
Supplemental Executive Retirement Plan of The Babcock & Wilcox Company, effective July 30, 2010 (incorporated by reference to Exhibit 10.10 to The Babcock & Wilcox Company’s Quarterly Report on Form 10-Q for the quarter ended June 30, 2010 (File No. 1-34658)). | |||||||
| 10.16* |
Supplemental Executive Retirement Plan of The Babcock & Wilcox Company, as amended and restated December 8, 2010 (incorporated by reference to Exhibit 10.1 to The Babcock & Wilcox Company’s Current Report on Form 8-K dated December 8, 2010 (File No. 1-34658)). | |||||||
| 10.17* |
Restructuring Transaction Retention Agreement between McDermott International, Inc. and Brandon C. Bethards dated as of December 10, 2009. | |||||||
| 10.18* |
Restructuring Transaction Retention Agreement between McDermott International, Inc. and Michael S. Taff dated as of December 10, 2009 (incorporated by reference to Exhibit 10.11 to The Babcock & Wilcox Company’s Registration Statement on Form 10 filed on April 23, 2010 (File No. 1-34658)). | |||||||
| 10.19* |
Change in Control Agreement entered into among The Babcock & Wilcox Company, Babcock & Wilcox Investment Company and Brandon C. Bethards effective as of August 11, 2010 (incorporated by reference to Exhibit 10.9 to The Babcock & Wilcox Company’s Quarterly Report on Form 10-Q for the quarter ended September 30, 2010 (File No. 1-34658)). | |||||||
| 10.20* |
Change in Control Agreement entered into among The Babcock & Wilcox Company, Babcock & Wilcox Investment Company and Michael S. Taff effective as of August 11, 2010 (incorporated by reference to Exhibit 10.10 to The Babcock & Wilcox Company’s Quarterly Report on Form 10-Q for the quarter ended September 30, 2010 (File No. 1-34658)). | |||||||
| 10.21* |
Form of Change in Control Agreement entered into among The Babcock & Wilcox Company, certain employer subsidiaries and executive officers (other than Mr. Bethards or Taff) effective as of August 11, 2010 (incorporated by reference to Exhibit 10.11 to The Babcock & Wilcox Company’s Quarterly Report on Form 10-Q for the quarter ended September 30, 2010 (File No. 1-34658)). | |||||||
| 10.22* |
Form of Change in Control Agreement entered into among The Babcock & Wilcox Company, certain employer subsidiaries and selected officers (other than executive officers) effective as of August 11, 2010 (incorporated by reference to Exhibit 10.12 to The Babcock & Wilcox Company’s Quarterly Report on Form 10-Q for the quarter ended September 30, 2010 (File No. 1-34658)). | |||||||
| 10.23* |
2011 Notice of Grant under Amended and Restated 2010 Long-Term Incentive Plan of The Babcock & Wilcox Company. | |||||||
| 10.24* |
Form of 2011 Stock Option Grant Agreement for Employees. | |||||||
| 10.25* |
Form of 2011 Restricted Stock Unit Grant Agreement for Employees. | |||||||
| 10.26* |
Form of 2011 Performance Share Grant Agreement for Employees. | |||||||
| 10.27* |
Form of Restricted Stock Award Grant Agreement for Messrs. Bethards and Taff granted pursuant to the Restructuring Transaction Retention Agreements. | |||||||
| 10.28* |
Form of 2010 Stock Option Grant Agreement for Employees. | |||||||
119
Table of Contents
| Exhibit Number |
Description |
|||||||
| 10.29* |
Form of 2010 Restricted Stock Award Grant Agreement for Employees. | |||||||
| 10.30* |
Form of 2010 Stock Option Grant Agreement for Employees converted on the spin-off from awards of stock options to purchase shares of McDermott International, Inc. common stock. | |||||||
| 10.31* |
Form of 2010 Restricted Stock Award Grant Agreement for Employees converted on the spin-off from awards of restricted shares of McDermott International, Inc. common stock. | |||||||
| 10.32* |
Form of 2010 Restricted Stock Unit Grant Agreement for Employees converted on the spin-off from awards of restricted stock units denominated in shares of McDermott International, Inc. common stock. | |||||||
| 10.33* |
Form of 2010 Restricted Stock Unit Grant Agreement for Employees converted on the spin-off from awards of performance shares denominated in shares of McDermott International, Inc. common stock. | |||||||
| 21.1 |
Significant Subsidiaries of the Registrant. | |||||||
| 23.1 |
Consent of Deloitte & Touche LLP. | |||||||
| 31.1 |
Rule 13a-14(a)/15d-14(a) certification of Chief Executive Officer. | |||||||
| 31.2 |
Rule 13a-14(a)/15d-14(a) certification of Chief Financial Officer. | |||||||
| 32.1 |
Section 1350 certification of Chief Executive Officer. | |||||||
| 32.2 |
Section 1350 certification of Chief Financial Officer. | |||||||
| * | Management contract or compensatory plan or arrangement. |
120
Table of Contents
Pursuant to the requirements of Section 13 or 15(d) of the Securities Exchange Act of 1934, the registrant has duly caused this report to be signed on its behalf by the undersigned, thereunto duly authorized.
| THE BABCOCK & WILCOX COMPANY | ||||
| By: | /s/ BRANDON C. BETHARDS | |||
| March 1, 2011 | Brandon C. Bethards | |||
| President and Chief Executive Officer | ||||
Pursuant to the requirements of the Securities Exchange Act of 1934, this report has been signed below by the following persons on behalf of the registrant and in the capacities indicated and on the date indicated.
| Signature |
Title | |
| /s/ BRANDON C. BETHARDS |
President and Chief Executive Officer | |
| Brandon C. Bethards | ||
| /s/ MICHAEL S. TAFF Michael S. Taff |
Senior Vice President and Chief Financial Officer | |
| /s/ DAVID S. BLACK David S. Black |
Vice President and Chief Accounting Officer (Principal Accounting Officer and Duly Authorized Representative) | |
| /s/ JOHN A. FEES John A. Fees |
Chairman of the Board and Director | |
| /s/ ROBERT W. GOLDMAN Robert W. Goldman
|
Director | |
| /s/ STEPHEN G. HANKS |
Director | |
| Stephen G. Hanks
|
||
| /s/ OLIVER D. KINGSLEY, JR. |
Director | |
| Oliver D. Kingsley, Jr.
|
||
| /s/ D. BRADLEY MCWILLIAMS |
Director | |
| D. Bradley McWilliams
|
||
| /s/ RICHARD W. MIES |
Director | |
| Richard W. Mies
|
||
| /s/ ANNE R. PRAMAGGIORE |
Director | |
| Anne R. Pramaggiore
|
||
| /s/ LARRY L. WEYERS |
Director | |
| Larry L. Weyers | ||
March 1, 2011
121
Table of Contents
INDEX TO EXHIBITS
| Exhibit Number |
Description |
Sequentially Numbered Pages | ||
| 2.1 |
Master Separation Agreement dated as of July 2, 2010 between McDermott International, Inc. and The Babcock & Wilcox Company (incorporated by reference to Exhibit 2.1 to The Babcock & Wilcox Company’s Quarterly Report on Form 10-Q for the quarter ended June 30, 2010 (File no. 1-34658)). | |||
| 3.1 |
Restated Certificate of Incorporation of The Babcock & Wilcox Company (incorporated by reference to Exhibit 3.1 to The Babcock & Wilcox Company’s Quarterly Report on Form 10-Q for the quarter ended June 30, 2010 (File No. 1-34658)). | |||
| 3.2 |
Amended and Restated Bylaws of The Babcock & Wilcox Company (incorporated by reference to Exhibit 3.2 to The Babcock & Wilcox Company’s Quarterly Report on Form 10-Q for the quarter ended June 30, 2010 (File No. 1-34658)). | |||
| 4.1 |
Credit Agreement dated as of May 3, 2010, among Babcock & Wilcox Investment Company, the lenders and letter of credit issuers party thereto, and Bank of America, N.A., as administrative agent (incorporated by reference to Exhibit 10.16 to The Babcock & Wilcox Company’s Registration Statement on Form 10 filed on May 19, 2010 (File No. 1-34658)). | |||
| 4.2 |
Joinder and Reaffirmation Agreement dated as of August 6, 2010, among The Babcock & Wilcox Company (as borrower), Babcock & Wilcox Investment Company, Babcock & Wilcox India Holdings, Inc. and certain other subsidiaries of the borrower in favor of Bank of America, N.A., as administrative agent (incorporated by reference to Exhibit 4.3 to The Babcock & Wilcox Company’s Quarterly Report on Form 10-Q for the quarter ended June 30, 2010 (File No. 1-34658)). | |||
| 4.3 |
Pledge and Security Agreement dated as of May 3, 2010, by Babcock & Wilcox Investment Company and certain of its subsidiaries in favor of Bank of America, N.A., as administrative agent (incorporated by reference to Exhibit 10.17 to The Babcock & Wilcox Company’s Registration Statement on Form 10 filed on May 19, 2010 (File No. 1-34658)). | |||
| 10.1 |
Tax Sharing Agreement dated as of June 7, 2010 between J. Ray Holdings, Inc. and Babcock & Wilcox Holdings, Inc. (incorporated by reference to Exhibit 10.2 to The Babcock & Wilcox Company’s Quarterly Report on Form 10-Q for the quarter ended June 30, 2010 (File No. 1-34658)). | |||
| 10.2 |
Employee Matters Agreement dated as of July 2, 2010 among McDermott International, Inc., McDermott Investments LLC, The Babcock & Wilcox Company and Babcock & Wilcox Investment Company (incorporated by reference to Exhibit 10.1 to The Babcock & Wilcox Company’s Quarterly Report on Form 10-Q for the quarter ended June 30, 2010 (File No. 1-34658)). | |||
| 10.3 |
Amendment to the Employee Matters Agreement dated as of August 3, 2010 among McDermott International, Inc., McDermott Investments LLC, The Babcock & Wilcox Company and Babcock & Wilcox Investment Company (incorporated by reference to Exhibit 10.15 to The Babcock & Wilcox Company’s Quarterly Report on Form 10-Q for the quarter ended June 30, 2010 (File No. 1-34658)). | |||
| 10.4 |
Amendment No. 2 to the Employee Matters Agreement dated as of August 10, 2010 among McDermott International, Inc., McDermott Investments LLC, The Babcock & Wilcox Company and Babcock & Wilcox Investment Company (incorporated by reference to Exhibit 10.3 to The Babcock & Wilcox Company’s Quarterly Report on Form 10-Q for the quarter ended September 30, 2010 (File No. 1-34658)). | |||
Table of Contents
| Exhibit Number |
Description |
Sequentially Numbered Pages | ||
| 10.5 |
Transition Services Agreement dated as of July 2, 2010 between McDermott International, Inc. as service provider and The Babcock & Wilcox Company as service receiver (incorporated by reference to Exhibit 10.3 to The Babcock & Wilcox Company’s Quarterly Report on Form 10-Q for the quarter ended June 30, 2010 (File No. 1-34658)). | |||
| 10.6 |
Transition Services Agreement dated as of July 2, 2010 between The Babcock & Wilcox Company as service provider and McDermott International, Inc. as service receiver (incorporated by reference to Exhibit 10.4 to The Babcock & Wilcox Company’s Quarterly Report on Form 10-Q for the quarter ended June 30, 2010 (File No. 1-34658)). | |||
| 10.7 |
Assumption and Loss Allocation Agreement dated as of May 18, 2010 by and among ACE American Assurance Company and the Ace Affiliates (as defined therein), McDermott International, Inc. and Babcock & Wilcox Holdings, Inc. (incorporated by reference to Exhibit 10.5 to The Babcock & Wilcox Company’s Registration Statement on Form 10 filed on May 19, 2010 (File No. 1-34658)). | |||
| 10.8 |
Novation and Assumption Agreement dated as of May 18, 2010 by and among ACE American Assurance Company and the Ace Affiliates (as defined therein), Creole Insurance Company, Ltd. and Boudin Insurance Company, Ltd. (incorporated by reference to Exhibit 10.6 to The Babcock & Wilcox Company’s Registration Statement on Form 10 filed on May 19, 2010 (File No. 1-34658)). | |||
| 10.9 |
Novation and Assumption Agreement dated as of May 18, 2010 by and among McDermott International, Inc., Babcock & Wilcox Holdings, Inc., Boudin Insurance Company, Ltd. and Creole Insurance Company, Ltd. (incorporated by reference to Exhibit 10.7 to The Babcock & Wilcox Company’s Registration Statement on Form 10 filed on May 19, 2010 (File No. 1-34658)). | |||
| 10.10 |
Securities Purchase Agreement dated as of May 25, 2010, by and among USEC Inc., Toshiba Corporation and Babcock & Wilcox Investment Company (incorporated by reference to Exhibit 10.18 to The Babcock & Wilcox Company’s Registration Statement on Form 10 filed on June 4, 2010 (File No. 1-34658)). | |||
| 10.11* |
2010 Long-Term Incentive Plan of The Babcock & Wilcox Company, effective July 2, 2010 (incorporated by reference to Exhibit 10.8 to The Babcock & Wilcox Company’s Quarterly Report on Form 10-Q for the quarter ended June 30, 2010 (File No. 1-34658)). | |||
| 10.12* |
Amended and Restated 2010 Long-Term Incentive Plan of The Babcock & Wilcox Company, dated as of February 22, 2011. | |||
| 10.13* |
The Babcock & Wilcox Executive Incentive Compensation Plan, effective July 30, 2010 (incorporated by reference to Exhibit 10.9 to The Babcock & Wilcox Company’s Quarterly Report on Form 10-Q for the quarter ended June 30, 2010 (File No. 1-34658)). | |||
| 10.14* |
The Babcock & Wilcox Executive Incentive Compensation Plan, as amended and restated as of February 22, 2011. | |||
| 10.15* |
Supplemental Executive Retirement Plan of The Babcock & Wilcox Company, effective July 30, 2010 (incorporated by reference to Exhibit 10.10 to The Babcock & Wilcox Company’s Quarterly Report on Form 10-Q for the quarter ended June 30, 2010 (File No. 1-34658)). | |||
| 10.16* |
Supplemental Executive Retirement Plan of The Babcock & Wilcox Company, as amended and restated December 8, 2010 (incorporated by reference to Exhibit 10.1 to The Babcock & Wilcox Company’s Current Report on Form 8-K dated December 8, 2010 (File No. 1-34658)) | |||
| 10.17* |
Restructuring Transaction Retention Agreement between McDermott International, Inc. and Brandon C. Bethards dated as of December 10, 2009. | |||
Table of Contents
| Exhibit Number |
Description |
Sequentially Numbered Pages | ||
| 10.18* |
Restructuring Transaction Retention Agreement between McDermott International, Inc. and Michael S. Taff dated as of December 10, 2009 (incorporated by reference to Exhibit 10.11 to The Babcock & Wilcox Company’s Registration Statement on Form 10 filed on April 23, 2010 (File No. 1-34658)). | |||
| 10.19* |
Change in Control Agreement entered into among The Babcock & Wilcox Company, Babcock & Wilcox Investment Company and Brandon C. Bethards effective as of August 11, 2010 (incorporated by reference to Exhibit 10.9 to The Babcock & Wilcox Company’s Quarterly Report on Form 10-Q for the quarter ended September 30, 2010 (File No. 1-34658)). | |||
| 10.20* |
Change in Control Agreement entered into among The Babcock & Wilcox Company, Babcock & Wilcox Investment Company and Michael S. Taff effective as of August 11, 2010 (incorporated by reference to Exhibit 10.10 to The Babcock & Wilcox Company’s Quarterly Report on Form 10-Q for the quarter ended September 30, 2010 (File No. 1-34658)). | |||
| 10.21* |
Form of Change in Control Agreement entered into among The Babcock & Wilcox Company, certain employer subsidiaries and executive officers (other than Mr. Bethards or Taff) effective as of August 11, 2010 (incorporated by reference to Exhibit 10.11 to The Babcock & Wilcox Company’s Quarterly Report on Form 10-Q for the quarter ended September 30, 2010 (File No. 1-34658)). | |||
| 10.22* |
Form of Change in Control Agreement entered into among The Babcock & Wilcox Company, certain employer subsidiaries and selected officers (other than executive officers) effective as of August 11, 2010 (incorporated by reference to Exhibit 10.12 to The Babcock & Wilcox Company’s Quarterly Report on Form 10-Q for the quarter ended September 30, 2010 (File No. 1-34658)). | |||
| 10.23* |
2011 Notice of Grant under Amended and Restated 2010 Long-Term Incentive Plan of The Babcock & Wilcox Company. | |||
| 10.24* |
Form of 2011 Stock Option Grant Agreement for Employees. | |||
| 10.25* |
Form of 2011 Restricted Stock Unit Grant Agreement for Employees. | |||
| 10.26* |
Form of 2011 Performance Share Grant Agreement for Employees. | |||
| 10.27* |
Form of Restricted Stock Award Grant Agreement for Messrs. Bethards and Taff granted pursuant to the Restructuring Transaction Retention Agreements. | |||
| 10.28* |
Form of 2010 Stock Option Grant Agreement for Employees. | |||
| 10.29* |
Form of 2010 Restricted Stock Award Grant Agreement for Employees. | |||
| 10.30* |
Form of 2010 Stock Option Grant Agreement for Employees converted on the spin-off from awards of stock options to purchase shares of McDermott International, Inc. common stock. | |||
| 10.31* |
Form of 2010 Restricted Stock Award Grant Agreement for Employees converted on the spin-off from awards of restricted shares of McDermott International, Inc. common stock. | |||
| 10.32* |
Form of 2010 Restricted Stock Unit Grant Agreement for Employees converted on the spin-off from awards of restricted stock units denominated in shares of McDermott International, Inc. common stock. | |||
| 10.33* |
Form of 2010 Restricted Stock Unit Grant Agreement for Employees converted on the spin-off from awards of performance shares denominated in shares of McDermott International, Inc. common stock. | |||
| 21.1 |
Significant Subsidiaries of the Registrant. | |||
| 23.1 |
Consent of Deloitte & Touche LLP. | |||
Table of Contents
| Exhibit Number |
Description |
Sequentially Numbered Pages | ||
| 31.1 |
Rule 13a-14(a)/15d-14(a) certification of Chief Executive Officer. | |||
| 31.2 |
Rule 13a-14(a)/15d-14(a) certification of Chief Financial Officer. | |||
| 32.1 |
Section 1350 certification of Chief Executive Officer. | |||
| 32.2 |
Section 1350 certification of Chief Financial Officer. | |||
| * | Management contract or compensatory plan or arrangement. |