Attached files
| file | filename |
|---|---|
| EX-24 - POWERS OF ATTORNEY - Nano Magic Holdings Inc. | appliednano_10k-ex24.htm |
| EX-11 - COMPUTATION OF LOSS PER COMMON SHARE - Nano Magic Holdings Inc. | appliednano_10k-ex11.htm |
| EX-21 - LIST OF SUBSIDIARIES - Nano Magic Holdings Inc. | appliednano_10k-ex021.htm |
| EX-3.(I).2 - CERTIFICATE OF AMENDMENT - Nano Magic Holdings Inc. | appliednano_10k-ex0301.htm |
| EX-31.1 - CERTIFICATION - Nano Magic Holdings Inc. | appliednano_10k-ex3101.htm |
| EX-32.1 - CERTIFICATION - Nano Magic Holdings Inc. | appliednano_10k-ex3201.htm |
UNITED STATES
SECURITIES AND EXCHANGE COMMISSION
Washington, D.C. 20549
FORM 10-K
|
x
|
Annual report under Section 13 or 15(d) of the Securities Exchange Act of 1934 for the fiscal year ended December 31, 2010; or
|
|
o
|
Transition report under Section 13 or 15(d) of the Securities Exchange Act of 1934
|
COMMISSION FILE NO. 1-11602
APPLIED NANOTECH HOLDINGS, INC.
(Exact name of registrant as specified in its charter)
| TEXAS | 76-0273345 |
| (State of Incorporation) | (IRS Employer Identification Number) |
3006 Longhorn Boulevard, Suite 107, Austin, Texas 78758
(Address of principal executive office, including Zip Code)
Registrant’s telephone number, including area code: (512) 339-5020
Securities registered pursuant to Section 12(b) of the Exchange Act:
| Title of each class | Name of Each Exchange on Which Registered |
| Common Stock, $0.001 par value | OTC Bulletin Board |
Securities registered pursuant to Section 12(g) of the Exchange Act: None
Indicate by check mark if the registrant is a well-known seasoned issuer as defined in Rule 405 of the Securities Act. Yes o No þ
Indicate by check mark if the registrant is not required to file reports pursuant to Section 13 or Section 15(d) of the Act. Yes o No þ
Indicate by check mark whether the registrant: (1) has filed all reports required to be filed by Section 13 or 15(d) of the Securities Exchange Act of 1934 during the past 12 months (or for such shorter period that the registrant was required to file such reports), and (2) has been subject to such filing requirements for the past 90 days. Yes þ No o
Indicate by check mark whether the registrant has submitted electronically and posted on its corporate website, if any, every Interactive Data File required to be submitted and posted pursuant to Rule 405 of Regulation S-T (232.405 of this chapter) during the preceding 12 months (or for such shorter period that the registrant was required to submit and post such files. Yes o No o
Indicate by check mark if disclosure of delinquent filers in response to Item 405 of Regulation S-K is not contained in this form and will not be contained, to the best of registrant’s knowledge, in definitive proxy or information statements incorporated by reference in Part III of this Form 10-K or any amendment to this Form 10-K. þ
Indicate by check mark whether the registrant is a large accelerated filer, an accelerated filer, a non-accelerated filer, or a smaller reporting company.
| Large Accelerated Filer o | Accelerated Filer o | ||
| Non-accelerated Filer þ | Smaller Reporting Company o |
Indicate by check mark whether the registrant is a shell company (as defined in Rule 12b-2 of the Exchange Act). Yes o No þ
The aggregate market value of the Common Stock held by non-affiliates of the Registrant, based upon the average of the closing bid and asked price of the Common Stock on the OTC Bulletin Board system on June 30, 2010 of $0.27, was approximately $29 million. As of February 24, 2011, the registrant had 110,220,060 shares of Common Stock issued and outstanding.
Documents Incorporated by Reference
No documents are incorporated by reference into this annual report on Form 10-K
TABLE OF CONTENTS
|
Page
|
|||
| PART I. | |||
|
Item 1.
|
Business
|
1
|
|
|
Item 1A.
|
Risk Factors
|
10
|
|
|
Item 1B.
|
Unresolved Staff Comments
|
15
|
|
|
Item 2.
|
Properties
|
16
|
|
|
Item 3.
|
Legal Proceedings
|
16
|
|
| PART II | |||
|
Item 5.
|
Market for Registrant’s Common Equity, Related Stockholder Matters and Issuer Purchases of Equity Securities
|
17
|
|
|
Item 6.
|
Selected Financial Data
|
20
|
|
|
Item 7.
|
Management’s Discussion and Analysis of Financial Condition and Results of Operations
|
21
|
|
|
Item 7A.
|
Quantitative and Qualitative Disclosures About Market Risk
|
27
|
|
|
Item 8.
|
Financial Statements and Supplementary Data
|
28
|
|
|
Item 9.
|
Changes in and Disagreements with Accountants on Accounting and Financial Disclosure
|
49
|
|
|
Item 9A (T).
|
Controls and Procedures
|
49
|
|
|
Item 9B.
|
Other Information
|
51
|
|
| PART III | |||
|
Item 10.
|
Directors, Executive Officers and Corporate Governance
|
52
|
|
|
Item 11.
|
Executive Compensation
|
54
|
|
|
Item 12.
|
Security Ownership of Certain Beneficial Owners and Management and Related Stockholder Matters
|
62
|
|
|
Item 13.
|
Certain Relationships and Related Transactions, and Director Independence
|
63
|
|
|
Item 14.
|
Principal Accountant Fees and Services
|
64
|
|
| PART IV | |||
|
Item 15.
|
Exhibits and Financial Statement Schedules
|
65
|
|
Important Information Concerning Forward-Looking Statements
Our disclosure and analysis in this report contains some forward-looking statements. Forward-looking statements give our current expectations or forecasts of future events. They use words such as “anticipate”, “believe”, “expect”, “estimate”, “project”, “intend”, “plan”, and other words and terms of similar meaning in connection with any discussion of future operating or financial performance. In particular, these include statements relating to future actions, prospective products or product approvals, future performance or results of current and anticipated products, sales efforts, expenses, the outcome of contingencies such as legal proceedings, and financial results. From time to time, we also may provide oral or written forward-looking statements in other materials we release to the public.
Any or all of our forward-looking statements in this report and in any other public statements we make may turn out to be wrong. They can be affected by inaccurate assumptions we might make, or by known or unknown risks or uncertainties. Many factors mentioned in the risk factors are important in determining future results. Consequently, no forward-looking statement can be guaranteed. Actual future results may vary materially.
We undertake no obligation to publicly update any forward-looking statements, whether as the result of new information, future events, or otherwise. You are advised, however, to consult any further disclosures we make on related subjects in our 10-Q, 8-K, and 10-K reports to the SEC. Also note that we include a cautionary discussion of risks, uncertainties, and possibly inaccurate assumptions relevant to our business. These are factors that we think could cause our actual results to differ materially from expected and historical results. Other factors besides those listed here could also adversely affect us.
PART I.
When used in this document, the words “anticipate”, “believe”, “expect”, “estimate”, “project”, “intend”, “plan”, and similar expressions are intended to identify forward-looking statements. Such statements are subject to certain risks, uncertainties, and assumptions. Should one or more of these risks or uncertainties materialize, or should underlying assumptions prove incorrect, actual results may vary materially from those anticipated, believed, expected, estimated, projected, intended, or planned. For additional discussion of such risks, uncertainties, and assumptions, see “Important Information Concerning Forward-Looking Statements” included at the beginning of this report and “Risk Factors” beginning on page 10 of this report.
Item 1. Business.
DESCRIPTION OF BUSINESS
General
We are a nanotechnology company engaged in research and development, with the goal of licensing and commercializing the technology that we develop. Whenever feasible, we intend to be actively involved in the commercialization of our technology in order to accelerate the process of bringing products to market. Our research is based on intellectual property and expertise that we have developed over the past 20 years. Our research is aimed at solving problems at the molecular level - in the area between the properties of matter that exist from the time several molecules are bound together until the first aggregate of the same molecules is created exhibiting the same chemical, physical and biological properties of the bulk material. The challenge of nanotechnology is how to controllably assemble fundamental nanoparticle building blocks in order to achieve new materials for new applications. Our nanotechnology research involves performing contract R&D services for others to develop products and materials for new applications. During this process we generate intellectual property, and our ultimate goal is to create sustainable recurring revenues by licensing this technology to others. Our work is currently focused primarily in the areas of Nanomaterials (primarily composites) and nanoelectronics. We also perform research in the areas of sensors, nanoecology, and electron emission activities.
We were founded in 1987, incorporated in Texas in 1989, and completed our initial public offering in 1993; however as a result of our strategic review process, we completely shifted and refocused the business in 2006. Since that time the majority of our research has been focused in two areas – the development of composites using nanotechnology, primarily in the area of carbon nanotube enhanced composites, and the development of technical inks using nanoparticles. Most of the recent research was an outgrowth of, and based on, knowledge we had gained during the first 18 years of our existence.
Business Model
We have an extensive portfolio of intellectual property that we have developed throughout the last 20 years, and we are continuing to develop new intellectual property. Our intent is to use this intellectual property to develop a portfolio of recurring revenue streams by licensing our intellectual property to others. In addition, for certain high potential products and technologies, we are exploring the possibility of forming business units around some of these technologies to allow us to participate in the commercialization process beyond simply licensing our technology to others to manufacture products. We believe that, in some instances, these business units will allow us to create greater value through broader participation in the revenue stream and potentially decrease the time required to bring products to market. In addition, having an ownership interest in an entity that may be created related to the technology allows us to participate in the value created as the technology gains market acceptance and the entity grows. We have organized internal teams to focus on the development and commercialization of these high potential technologies.
Much of our intellectual property and research relates to next-generation technologies that are not in wide current use and as such, additional development work is required before products can be manufactured using these technologies. Our research and development efforts occur across a continuum moving from concept to commercialization as follows:
Concept → Laboratory → Development → Pilot /Introduction → Commercialization
Page 1
To aid in the process of moving our technologies from concept to commercialization, we frequently perform funded research for both government entities and large multinational corporations. This enables us to focus our resources in areas that have the highest level of interest to others, and thus the highest probability for commercialization.
Research and Development
As a result of our focus on developing and protecting our intellectual property, we spend significant amounts on research and development. We spent $4,839,556; $3,662,323; and $4,614,644 on research and development in the years ended December 31, 2010, 2009, and 2008, respectively. This represents approximately 64%, 59%, and 54% of our total operating costs and expenses in each of those years. We expect to continue to invest heavily in research and development, and we expect our research and development costs for 2011 to be in excess of 60% of our operating costs and we will continue to seek to obtain funding for as much of our research as possible.
Business Segments
Our operations consist of one reportable business segment. We previously reported using three segments; however, we no longer consider that segment information to be meaningful. The business segments previously revolved around our three separate companies, described as follows:
Applied Nanotech Holdings, Inc. (“ANHI”) ANHI is the parent company, where we incur general operating overhead that is the approximate cost of being a public company, effectively the amount in excess of that which might be incurred by a private company performing these same activities.
Applied Nanotech, Inc. (“ANI”), a subsidiary of ANHI is the entire focus of our current efforts. It was incorporated in January 1997 and is developing our proprietary technologies. Our research is focused in the broad area of nanoparticle and carbon nanotube technology and its application to the materials, electronics, sensor, medical, display, and other industries. Our development plans for our technologies are discussed later in this report.
Electronic Billboard Technology, Inc. (“EBT”), a subsidiary of ANHI was incorporated in January 1997 and initially focused on developing sun-readable display products for outdoor use. EBT expanded into other display areas, but in 2002, we restructured EBT and limited ourselves to licensing EBT’s existing intellectual property. In 2006, we sold EBT’s intellectual property in two simultaneous transactions. EBT is now inactive.
Since all of the revenue is derived from ANI, EBT is inactive, and the activities of ANI and ANHI are inextricably interrelated, we now only report one segment. Separate information related to the companies is no longer distributed to the Chief Operating Officer of the Company.
Overall
We are a nanotechnology company focusing our efforts on research, development of proof of concepts and prototypes for proposed products, commercializing our technology, and licensing our technology to others. We are developing world-class technologies that generally fall under one of five technology platforms. These platforms are:
|
●
|
Functional nanomaterials, including carbon nanotube composites and thermal management;
|
|
●
|
Nanoelectronic applications;
|
|
●
|
Sensor technology;
|
|
●
|
Nanoecology; and
|
|
●
|
Electron emission activities, primarily in the display area.
|
We intend to license our technology to others to allow them to manufacture products using our technology. We have no plans to establish any significant manufacturing facilities in the foreseeable future, and manufacturing is not a part of our core strategy. To the extent that manufacturing capabilities are needed for products using our technology, we intend to use manufacturing partnerships, joint ventures, or arrange to have products manufactured through contract manufacturers. For certain high potential products and technologies, we are exploring establishing business units that would enable us to participate in, and profit from, the commercialization process beyond just licensing.
Page 2
Functional Nanomaterials
Nanocomposites
We are in the advanced stages of research into nanomaterials using carbon nanotube (“CNT”) and other composites. We believe that some of the first widespread use of nanotechnology by established companies will be in this area as they work to improve existing products, materials, and processes. A significant opportunity exists in nanomaterials for us to develop, commercialize, and license our technology. We are well versed in harnessing the unique properties of CNTs for a variety of applications. Our work with CNT composites has been in three main areas – epoxies, nylons, and glass fibers. In addition, we have recently expanded our activities into other types of resins, such as polyesters and vinyl esters.
Epoxies – Epoxies are used in industries with significant worldwide markets, with applications including adhesives, paints, coatings, and composites. The objective of our CNT epoxy program has been to create composite materials to be used as an alternative to traditional materials. We have reinforced epoxy with CNTs to take advantage of CNTs mechanical properties while reducing the weight of materials needed for specific applications. We have developed patented processes and know-how which has enabled us to uniformly disperse CNTs throughout the epoxy to create significant improvements in strength, toughness, durability, vibration dampening, and other mechanical properties.
In September 2005 we signed a development contract with Yonex Co. Ltd., a large sporting goods manufacturer, to develop nanocomposites to be used in sporting equipment. This agreement culminated in a license agreement in October 2008 that allowed Yonex to use our technology in its tennis and badminton racquets. In 2010, we completed an additional agreement with Yonex to license this technology for use in its golf shafts. This development agreement served as the foundation of our work in the CNT composites area. Yonex has announced that it will introduce golf shafts using our technology in February 2011 and badminton racquets using this technology in March 2011. We expect Yonex to also introduce tennis racquets using this technology in 2011.
Other CNT Enhanced Resins – In addition to epoxy resins, we are developing other types of resins including polyesters and vinyl esters. Our polyester resin development has been funded by the U.S. Army for applications primarily related to ballistic protection, although polyester resins enhanced by CNTs have many other applications. Vinyl esters are currently widely used in a variety of industrial applications including tanks, piping, and construction.
Nylons – The addition of CNTs to nylons can enhance certain mechanical properties and the electrical conductivity of normally insulating material. Of all the types of nylons available, Nylon 6 is the most common, with an estimated 60% of the world volume and with uses in a variety of industries including textiles, carpeting, safety belts, fishing lines, and a variety of other applications. We have developed a patented process for coating nylon pellets with CNTs to improve electrical conductivity. Nylon 6 with improved electrical conductivity can be used for its anti-static qualities, electrostatic discharge, and electromagnetic/RF shielding.
Glass Fibers – We have applied our knowledge in CNT enhanced composites to develop a strengthened fiberglass that can be used for applications with long lifetime requirements, such as wind turbine blades. Current wind blade research is focused on lowering the weight of materials to reduce overall cost and increase efficiency. Our early research has shown dramatic results in lowering the weight of materials using CNT strengthened materials, and we are continuing to apply resources with our partners, to further develop this technology.
Competition. There is a wide range of companies working with composite materials, including some working with CNT enhanced composites. Since each project is unique, our competition would come from different companies for different applications. Since we rely on patented technology, any competition would come from different composites, or different formulations of CNT composites. Some of the companies known to be working in the CNT composite area are Zyvex Performance Materials in Columbus, Ohio, GSI Creos in Tokyo, Japan, and Amroy Europe, Ltd. in Finland.
Page 3
Intellectual Property. We have developed a strong intellectual property position in the nanocomposites area with over 30 U.S. and foreign patents and patent applications pending.
Thermal Management
We are marketing a unique patented thermal management material called CarbAl™. In 2009, R&D magazine recognized CarbAl™ as one of the 100 most significant product innovations of 2009 with its R&D 100 Award. The inability to effectively control temperature is the number one cause of failure for electronics, resulting in more failures than dust, humidity, vibration, and other harmful conditions. CarbAl™ provides a passive thermal management solution for temperature control issues that plague electronics manufacturers and has the ability to reduce costs for, and extend the lives of, many electronics applications.
CarbAl™ is a carbon based metal nanocomposite comprised of 80% carbonaceous matrix and a dispersed metal component of 20% aluminum. CarbAl™ has a unique combination of low density, high thermal diffusivity, high thermal conductivity, and a low coefficient of thermal expansion that results in a material that far exceeds the capabilities of conventional passive thermal management materials. There is an extensive worldwide market for thermal management materials and CarbAl™ is ideal for applications in the electronics industry, in LED displays, and for concentrated photovoltaic solar cell systems.
We are currently seeking to secure a reliable, high quality, production source for our CarbAl™ material and are discussing possible relationships with companies in North America and Asia. Since many of the products that would benefit most from this technology are located in Asia, manufacturing in that location would be a natural choice.
Competition. Because CarbAl™ is a new patented material; its competition comes from already existing active and passive thermal management systems. For example, computer equipment includes fans, while LED Billboards include air conditioning equipment. CPV solar cells are a developing product and thermal management remains a significant problem.
Intellectual Property. In addition to some underlying patents filed throughout the world, we have a patent application pending in the U.S. and in foreign jurisdictions that we believe is a basic patent critical to manufacturing this product.
Nanoelectronics Applications
Conductive Inks
Copper Inks - As a result of the move towards flexible electronics, soldering processes are slowly disappearing, and new processes that are digital in nature are needed to allow a move directly from design to the production line. One of the areas that we have chosen to focus on is conductive inks, starting with copper. Nanotechnology will play an important role in this process because only nanoparticles are capable of producing inks that are compatible with the nozzles used in digital printing.
To facilitate our development of conductive copper inks, we entered into a research and development agreement with Ishihara Chemical Company, Ltd., a leading industrial chemical products company headquartered in Japan, to develop conductive inks that can be deposited using an additive process such as ink-jet printing, aerosol-jet printing or screen printing. The target market for these technical inks includes printed circuit boards, flexible electronics and displays, communications instrumentation, and Radio Frequency Identification tags. Our work with Ishihara started with a feasibility study in early 2006 and culminated with a license agreement for copper inks and pastes in July 2009. As a result of this partnership, we have received over $2.5 million in research funding from Ishihara and a $1.5 million up-front license payment. Ishihara is currently readying its production facility and conducting pilot and prototype manufacturing. We expect Ishihara to introduce a product by the end of 2011, or early 2012.
We chose to start this project by focusing on nanocopper inks using copper nanoparticles because of copper’s superior electrical conductivity properties, low cost, and because it is the material of choice in the printed circuit board industry. We have been able to achieve electrical conductivity properties similar to that of bulk copper with these inks. In 2010, we, along with our partner, Ishihara Chemical, won a R&D 100 award, recognizing our inkjetable copper ink as one of the 100 most significant product innovations in 2010.
Page 4
Other inks - We have since expanded our work with conductive inks to other inks including nickel, silver, aluminum, and others, as well as to various conductive pastes. As a result of funding received from the U.S. Department of Energy, in 2010 we focused on the development of aluminum inks for use in the solar industry. In September 2010, we received a $1.6 million Phase III grant to establish a small pilot manufacturing facility for these inks to facilitate accelerated development and testing by solar cell manufacturers. Aluminum inks capable of being printed in a non-contact method, such as aerosol jet, or ink jet, have the potential to significantly reduce the cost of solar cells.
Intellectual Property. We have developed a strong intellectual property position in this area with over 30 U.S. and foreign patents and patent applications pending related to copper and other conductive metallic inks.
Technical Inks Printing Solution (TIPS)
Conductive Inks have the power to revolutionize many types of electronics manufacturing. Our strategy is to provide a comprehensive solution for end users by not only developing inks, but assisting in the process from start to finish. As part of our concept, we have done extensive research on raw materials (nanoparticles). We have developed relationships with nanoparticle suppliers and are able to supply a variety of nanoparticles as a result of these relationships. In addition, we have done applications R&D on a variety of potential end user products to help develop specifications for the inks. We have also formed relationships with hardware manufacturers with the goal of providing seamless integration into high volume manufacturing for companies wishing to use conductive inks in their manufacturing processes.
We intend to develop a revenue stream that includes revenue from the sale of nano-particles, research revenue from applications development, commissions on the sale of hardware, and royalties from the sale of inks.
Competition. Numerous other companies are working with other technologies with the goal of achieving results similar to the goals of our technology. The ultimate success of products using our technology depends on the results of our research compared with results achieved by others. There are silver inks on the market today, but because of the high cost of silver relative to copper, a successful copper ink is likely to open up many additional markets.
Sensors
Overview. We have greatly expanded our work and intellectual property in the area of sensor technology in the past couple of years. We expect this to become an increasingly important part of our business. Our approach to sensor technology offers the unique advantage of manipulating materials at the molecular level at which sensing events occur. We are pursuing a multiplatform approach to address specific market needs. Some of the potential applications are as follows:
Ion Mobility Sensors. We are currently developing sensors based on Ion Mobility Sensor technology and Differential Mobility Spectroscopy. These sensors are ideal for use when both high sensitivity and high selectivity (low false positives) are required. We are also improving on existing IMS and DMS technology by developing nonradioactive gas ionization sources to replace the radioactive isotopes that are currently used in these tools. We are currently involved in projects to develop highly sensitive Mercaptan and Methane sensors for use in the natural gas industry.
We are also seeking funding for development of a breath analysis sensor for health monitoring using this technology. Breath analysis has the potential to significantly lower health care costs by providing early indications of potential changes in people’s health and providing that information digitally to health professionals.
Hydrogen Sensors. These sensors are initially targeted for use in fuel cells for automobiles and for remote monitoring of large power transformers. We developed a hydrogen sensor for use in the measurement of hydrogen in power transformer products. We have worked with two large manufacturers of instruments, controls, and monitoring systems used in the power transmission industry. We previously had an agreement with one of these companies that we terminated in 2010. We are currently exploring alternatives to maximize the value to be received from this sensor development.
Carbon Monoxide Sensors. We have developed a low-power carbon monoxide sensor that can last for 10,000 hours on a single battery. The sensor will be specific to carbon monoxide with no cross sensitivity to other gases and elements and is also easily portable and highly sensitive.
Page 5
Biosensors. Our carbon nanotube technology is ideally suited for use in biosensors. Sensors based on carbon nanotubes or other nanomaterials can be used to detect chemical, organic, or biological warfare agents, as well as explosives, hydrogen, ammonia and numerous other chemicals. We have developed several proofs of concepts demonstrating the viability of our sensor technology, and are currently seeking development partners to license the technology and integrate it into specific products.
Other Sensors. We have demonstrated that carbon nanotubes can be used to develop sensors for chemical, organic, and biological warfare agents. We have also demonstrated that carbon nanotubes and other nanodetectors can be used for the remote detection of explosives, sensors used in environmental monitoring, health care, the food industry, biotech-biopharma applications, genetic biosensors, and immunosensors. We are currently seeking funding to take our research in this area to the next level of development, which would include proofs of concept, and product development. Ideally, we would do this with a development partner that would fund the development and license the technology for manufacturing upon completion, or in conjunction with a development partner under a government funding program. We most likely would have different development partners for different sensors that may be used in different industries.
Competition. Our competition in the sensor area will come from a variety of technologies and companies depending on the purpose and use of the sensor. There are other technologies used in sensors; however, we believe carbon nanotube based sensors and other nanodetectors are more versatile, can sense a broader range of materials, and are more selective (sensitive) in their sensor results. We believe that selecting the right strategic partners for development of proof of concepts for our sensor technology is an important step in the market acceptance of sensors using our technology.
Intellectual Property. In the sensor area, we have developed intellectual property related to several types of sensors, with over 50 U.S. and foreign patents and patent applications pending.
Nano-ecology
Photoscrub® Technology. We developed a concept called Photoscrub® which is based on an air purification technology originally developed by one of our strategic partners, Andes Electric Co., Ltd. The Photoscrub® is a thin film coating on a flexible fiberglass cloth that decomposes pollutants at the molecular level in liquids and gases. We began a one year project in the amount of roughly $950,000 to further develop this technology for the U.S. Army in November 2006. Based on the results of this first phase, we were awarded a contract in the amount of $1.45 million in January 2009 and completed that project in 2010. We are currently evaluating alternatives to maximize the value that we receive from this technology.
Electron Emission Activities
Until 2006, our main focus for virtually the entire life of Applied Nanotech Holdings was on electron emission activities. We performed extensive research and accumulated significant intellectual property in this area. The bulk of that activity has centered on Field Emission Display (“FED”) technology. FED is a next generation display technology that is ideally suited for use in large flat screen televisions. We believe our intellectual property in the electron emission area is mature and well developed. We are now dependent on a manufacturer to introduce a product using our technology. As such, we are no longer devoting any resources to further develop this technology, unless funded for a specific application. We are, however, closely monitoring developments in the industry to determine if a license is needed by a manufacturer for our technology.
Our electron emission activities can be divided into display activities and non-display activities.
Display Applications
The display industry is, in general, dominated by large multinational corporations, primarily based in Asia, and participation in manufacturing products for the display market involves significant capital investments. While display applications represent potentially huge markets for the use of our technology, realization of this potential will require one of these companies to introduce a product based on our technology. Our intellectual property in this area is well developed, and we believe that any manufacturer that develops a product based on electron emission activities involving carbon will require a license to our technology; however, any products using this technology are still at present, next generation products. We believe that the successful introduction of any display products using this technology will require the participation of existing display manufacturers or component suppliers. These manufacturers and suppliers have a variety of interests and the introduction of new display products may be affected by general economic conditions as well as the impact of these new products on other areas of their business. Potential applications in the display area include: large area CNT flat screen color field emission displays, large area surface conduction color field emission displays such as the one developed by Canon and Toshiba, backlights for displays, and picture element tubes for medium resolution large area electronic billboards.
Page 6
Non-Display Applications
There is also a wide array of non-display related electron emission applications. These potential applications are spread among a much larger group of potential licensees, and the markets generally are not as large as the display markets, although the markets are still very significant and would generate substantial royalties if products are introduced. We have performed research related to lighting applications, ion sources, traveling wave tubes, and are exploring other electron emission applications. We believe these applications may have the capability of generating license revenues sooner than display applications, may be easier to integrate into existing products, and may be in wide use sooner than display applications. While the breadth (number of patents) of our display related emission activity patents is currently greater than for non-display patents, our non-display Intellectual Property is growing and our basic Raman patent is expected to cover all of our electron emission activities.
Key Intellectual Property
Our most significant patent in the electron emission area is a basic patent that we refer to as the Raman Spectrum Patent (U.S. Patent 5869922) covering emissions from a wide range of carbon forms. This patent covers field emission devices using various forms of carbon; including carbon nanotubes (CNT), carbon films, and other forms of carbon that fall within a particular range on the Ultraviolet Raman band. This basic patent is fundamental and has broad applicability and wide geographic coverage, having been issued in the U.S., China, South Korea, and has been validated in several European countries. The patent application is also pending in Japan. In addition to this basic patent, we have a wide variety of other patents that compliment this basic patent in specific situations. We believe that any company developing a product that involves the emission of electrons from carbon is likely to require a license to our technology.
Competition. Because of the strength of our intellectual property in the electron emission area, our competition comes from other technologies, rather than from other companies. For displays, this competition comes from LCD displays, Plasma displays, LED displays, and color picture tubes.
In 2009, we determined that we should begin efforts to attempt to monetize our Electron Emission Intellectual Property while it still had value and in March 2010, we included a trial package in an auction. We received no significant interest in the trial package that we submitted for auction. Following that auction, while preparing a package of our entire Electron Emission Portfolio, we were contacted by Samsung Electronics, Ltd. After extensive negotiations, we completed a combination sale/license agreement where we sold 29 patents to Samsung and licensed approximately 150 additional patents for a one-time payment of $3.75 million. This total package represented our entire electron emission portfolio, but did not include any of our other technologies. We retained our key Raman Spectrum patents to be available for license to others. In the display industry, when one manufacturer introduces a successful technology, other manufacturers often follow. If Samsung successfully introduces a product and other manufacturers follow, we intend to license our technology, including future royalties, to those manufacturers as well.
Technology Agreements
Till Keesmann. In May 2000, we licensed the rights to 6 carbon nanotube patents from Till Keesmann in exchange for a payment of $250,000 payable in shares of our common stock. Under the terms of the agreement, we received the exclusive right to license these patents to others and we were obligated to pay license fees equal to 50% of any royalties received by us specifically related to these patents to Mr. Keesmann. We were allowed to offset certain expenses, up to a maximum of $50,000 per year, against payments due under this agreement. The agreement also contained provisions related to minimum license fee payments. These minimum payments, totaling $1,000,000, have been made and as a result, we received an irrevocable license to use these patents for the life of the patents.
Despite significant efforts, no license revenues were ever received for these patents and in 2008, the Keesmann agreement was amended as part of a litigation settlement. As part of that amendment, we agreed to return the licensing rights to Mr. Keesmann in May 2010 if minimum payments equal to $1.0 million were not paid to Mr. Keesmann by that date. No license revenue was received by that date and we made the conscious decision not to make the minimum payment and we chose to allow the licensing rights to revert to Mr. Keesmann. Accordingly, the licensing rights for his specific patents reverted to Mr. Keesmann. We retain our irrevocable right to use the patents and we are entitled to 50% of any royalties generated by those patents, up to a maximum of $1.2 million.
Page 7
Intellectual Property Rights
An important part of our product development strategy is to seek, when appropriate, protection for our products and proprietary technology through the use of various United States and foreign patents. Our patent portfolio consists of over 300 patents, including 150 issued patents and over 150 patent applications pending before foreign and United States Patent and Trademark Offices. We also have several unsubmitted patent applications in process. The patents, allowances and applications relate to carbon nanotube field emission technology and other technologies. In addition, there are foreign counterparts to certain United States patents and applications. We consider our patent portfolio to be our most valuable asset.
The patenting of technology-related products and processes involves uncertain and complex legal and factual questions. To date, no consistent policy has emerged regarding the breadth of claims of such technology patents. Therefore, there is no assurance that our pending United States and foreign applications will issue, or what scope of protection any issued patents will provide, or whether any such patents ultimately will be upheld as valid by a court of competent jurisdiction in the event of a legal challenge. Interference proceedings, to determine priority of invention, also could arise in any of our pending patent applications. The costs of such proceedings would be significant and an unfavorable outcome could result in the loss of rights to the invention at issue in the proceedings. If we fail to obtain patents for our technology, and are required to rely on unpatented proprietary technology, there is no assurance that we can protect our rights in such unpatented proprietary technology, or that others will not independently develop substantially equivalent proprietary products and techniques, or otherwise gain access to our proprietary technology.
Competitors have filed applications for, or have been issued patents, and may obtain additional patents and proprietary rights relating to products or processes used in, necessary to, competitive with, or otherwise related to, our patents. The scope and validity of these patents, the extent to which we may be required to obtain licenses under these patents or under other proprietary rights and the cost and availability of licenses are unknown. This may limit our ability to license our technology. Litigation concerning these or other patents could be protracted and expensive. If suit were brought against us for patent infringement, a challenge in the suit by us as to the validity of the other patent would have to overcome a legal presumption of validity. There can be no assurance that the validity of the patent would not be upheld by the court or that, in such event, a license of the patent to us would be available. Moreover, even if a license were available, the payments that would be required are unknown and could materially reduce the value of our interest in the affected products. We do, however, consider our patents to be very strong and defendable in any action that may be brought against us. In the past, a major law firm reviewed our patent portfolio and agreed to handle litigation related to certain of our patents on a contingency basis.
We also rely upon unpatented trade secrets. No assurances can be given that others will not independently develop substantially equivalent proprietary information and techniques or otherwise gain access to our trade secrets or disclose such technology or that we can meaningfully protect our rights to our unpatented trade secrets.
We require our employees, directors, consultants, outside scientific collaborators, sponsored researchers, and other advisors to execute confidentiality agreements upon the commencement of employment or consulting relationships with us. These agreements provide that all confidential information developed or made known to the individual during the course of the relationship is to be kept confidential and not disclosed to third parties except in specific circumstances. In the case of employees, the agreements provide that all inventions conceived by the individual shall be our exclusive property. There is no assurance, however, that these agreements will provide meaningful protection for our trade secrets in the event of unauthorized use or disclosure of such information.
Page 8
Government Regulation
Products using our technology will be subject to extensive government regulation in the United States and in other countries. In order to produce and market existing and proposed products using our technology, our licensees must satisfy mandatory safety standards established by the U.S. Occupational Safety and Health Administration (“OSHA”), pollution control standards established by the U.S. Environmental Protection Agency (“EPA”) and comparable state and foreign regulatory agencies. We may also be subject to regulation under the Radiation Control for Health and Safety Act administered by the Center for Devices and Radiological Health (“CDRH”) of the U.S. Food and Drug Administration. We do not believe that carbon nanotube field emission products will present any significant occupational risks to the operators of such equipment. In addition, the carbon nanotube field emission products are not expected to produce significant hazardous or toxic waste that would require extraordinary disposal procedures. Nevertheless, OSHA, the EPA, the CDRH and other governmental agencies, both in the United States and in foreign countries, may adopt additional rules and regulations that may affect us and products using our technology. Additionally, our arrangements with our licensees and their affiliates may subject products using our technology to export and import control regulations of the U.S. and other countries. The cost of compliance with these regulations has not been significant in the past and is not expected to be material in the future.
A portion of our revenue has consisted of reimbursement of expenditures under U.S. government contracts. We recognized $2,920,030 of revenue in 2010; $1,694,082 of revenue in 2009; and $2,295,887 in 2008, related to government contracts. These reimbursements represent all or a portion of the costs associated with such contracts. As of December 31, 2010, we have several government contracts in process that have approximately $2.9 million of revenue yet to be recognized. Government contracts are subject to delays and risk of cancellation. Also, government contractors generally are subject to various kinds of audits and investigations by government agencies. These audits and investigations involve review of a contractor’s performance on its contracts, as well as its pricing practices, the costs it incurs and its compliance with all applicable laws, regulations and standards. We are, and in the future expect to be, audited by the government; however we expect the results of any government audits to have an insignificant effect on our financial statements.
Employees
As of February 24, 2011 we had 28 full-time employees, including 3 executive officers, and 2 part time employees. Within the next twelve months, based on new government contracts that we have received and expect to receive, we likely will hire two to four additional employees to support our plans for increasing research levels. We are not subject to any collective bargaining agreements, and we consider our relations with our employees to be good.
Available Information
Our website is http://www.appliednanotech.net. Our periodic reports and all amendments to those reports required to be filed or furnished pursuant to Section 13(a) or Section 15(d) of the Securities Exchange Act of 1934 are available free of charge through its website. During the period covered by this report, the Company made its periodic reports on Form 10-K, and Form 10-Q and its current reports on Form 8-K and amendments to those documents available on its website as soon as reasonably practicable after those reports were filed with or furnished electronically to the Securities and Exchange Commission at www.sec.gov. The Company will continue to make such reports and amendments to those reports available on its website as soon as reasonably practicable after those reports are filed with or furnished to the Securities and Exchange Commission. Material contained on our website is not incorporated by reference in this Annual Report on Form 10-K.
Page 9
Item 1A. Risk Factors
Our success is dependent on our principal technologies
Our technology platforms, which include nano-materials, nano-electronics, sensors, electron emission activities, and nano-ecology, are emerging technologies. Our financial condition and prospects are dependent upon commercializing our technology, licensing our intellectual property to others, and introduction of the technology into the marketplace. Additional R&D needs to be conducted on some of our technologies before others can produce products using this technology. Market acceptance of products using our technology will be dependent upon acceptance within the industries of those products of the quality, reliability, performance, efficiency, and breadth of application and cost-effectiveness of the products. There can be no assurances that these products will be able to gain commercial market acceptance.
Products using our technology may not be accepted by the market
Since our inception, we have focused our product development and R&D efforts on technologies that we believe will be a significant advancement over currently available technologies. With any new technology, there is a risk that the market may not appreciate the benefits or recognize the potential applications of the technology. Market acceptance of products using our technology will depend, in part, on the ability of our licensees to convince potential customers of the advantages of such products as compared to competitive products. It will also depend upon our ability to train manufacturers and others to use our products.
Our technology development is in its early stages and the outcome is uncertain
Some of our applications of nanotechnologies, and certain products that use these technologies, will require significant additional development, engineering, testing and investment prior to commercialization. We are exploring the use of our technology in several different types of products. We have developed proof of concepts of potential products based on our technologies. In some cases, we are developing products jointly with others based on our technology. Upon successful completion of the development process, our development partners will likely be required to license our technology to produce and sell the products. Our development partners retain all rights to any intellectual property that they develop in the process.
If any of the potential products that are being developed using our technologies are successfully developed, it may not be possible for potential licensees to produce these products in significant quantities at a price that is competitive with other similar products. At the present time, the only significant revenue that we receive related to our technology is related to reimbursed research expenditures and development fees. These revenues are identified in our quarterly filings on Form 10-Q and our annual filings on Form 10-K in the “Management’s Discussion and Analysis of Financial Condition and Results of Operations” sections. We anticipate receiving up-front license fees and royalties in 2011.
Our development partners have certain rights to jointly developed property and to license our technology
We have committed to license our technology to our development partners upon completion of certain development projects that are in process. The terms of all such licenses have not yet been finalized. Our development partners usually also have rights to any jointly developed property; however, any such jointly developed property would likely be based, at least in part, on our underlying technology which would require our partners to enter into a license agreement with us. See also “Our technology development is in its early stages and the outcome is uncertain” above for further discussion.
We have limited resources and our focus on particular products may result in our failure to capitalize on other opportunities
We have limited resources available to successfully develop and commercialize our technology. As of February 28. 2011, we had 30 full-time and part-time employees. There is a wide array of potential applications for our technology and our limited resources require us to focus on specific product areas, while ignoring others. We focus our efforts on those projects for which we can obtain external funding since the availability of funding provides an external verification of the probability of commercial success of resulting products.
Page 10
We may not be able to provide system integration
In order to prove that our technologies work and will produce a complete product; we may be required to integrate a number of highly technical and complicated subsystems into a fully integrated prototype. There is no assurance that we will be able to successfully complete the development work on some of our proposed products or that there will ultimately be any market for those products.
Many products that may be developed using our technology will need to be integrated into end-user products by manufacturers of those products. Although we intend to develop products to be integrated into existing manufacturing capabilities, manufacturers may be required to make modifications to, or expand their manufacturing capabilities. Manufacturers may elect not to integrate products using our technology into their end-user products, or they may not devote adequate resources to modifying their manufacturing capabilities so that our technologies can be successfully incorporated into their end-user products. The complexity of integration may delay the introduction of products using our technology.
Rapid technological changes could render our technology obsolete; and we may not remain competitive
The industries in which we compete are highly competitive and are characterized by rapid technological change. Our existing and proposed products will compete with other existing products and may compete against other developing technologies. Development by others of new or improved products, processes or technologies may reduce the size of potential markets for our products. There is no assurance that other products, processes or technologies will not render our proposed products obsolete or less competitive. Many of our competitors have greater financial, managerial, distribution, and technical resources than we do. We will be required to devote substantial financial resources and effort to further R&D. There is no assurance that we will successfully differentiate our technology from our competitors’ technology, or that we will adapt to evolving markets and technologies, develop new technologies, or achieve and maintain technological advantages.
We have limited manufacturing capacity and experience
We have no established commercial manufacturing facilities; and we have no intention of establishing a large scale manufacturing facility on our own. We are focusing our efforts on licensing our intellectual property to others for use in their manufacturing processes. To the extent that any of the products that we develop require manufacturing facilities, we intend to either contract with a qualified manufacturer, or enter into a joint venture or other similar arrangement. We are establishing a pilot manufacturing facility for our solar inks, under a contract with the U.S. Department of Energy, to accelerate development of the inks. Should the development proceed to the point where a production facility is required, we intend to license or contract with others for production.
The health effects of nanotechnology are unknown
There is no scientific agreement on the health effects of nanomaterials, but some scientists believe that in some cases, nanomaterials may be hazardous to an individual’s health or the environment. The science of nanotechnology is based on arranging atoms in such a way as to modify or build materials not made in nature; therefore, the effects are unknown. The Company takes appropriate precautions for its employees working with carbon nanotubes and believes that any health risks related to carbon nanotubes used in potential products can be minimized. Future research into the effects of nanomaterials in general, and carbon nanotubes in particular, on health and environmental issues may have an adverse effect on products using our technology.
The loss of key personnel could adversely affect our business
Our future success will depend on our ability to continue to attract and retain highly qualified scientific, technical and managerial personnel. Competition for such personnel may be intense. We may not be able to attract and retain all personnel necessary for the development of our business. In addition, some of the know-how and processes developed by us reside in our key scientific and technical personnel. The loss of the services of key scientific, technical and managerial personnel could have a material adverse effect on us until we are able to replace those personnel.
Page 11
We have a history of net losses
We have a history of net losses, although these losses have been decreasing and in 2010 we were profitable. From our inception through December 31, 2009, we incurred net losses of approximately $111 million. Although we were profitable in 2010, and we expect to be profitable in 2011, there is no guarantee that we will remain profitable in the future. We have incurred net income and losses for the ten preceding years as shown below:
|
Year Ended December 31
|
Net Income
(Loss)
|
|
|
2001
|
($6,047,698)
|
|
|
2002
|
($5,452,890)
|
|
|
2003
|
($4,017,374)
|
|
|
2004
|
($7,139,109)
|
|
|
2005
|
($5,818,816)
|
|
|
2006
|
($6,593,892)
|
|
|
2007
|
($4,256,891)
|
|
|
2008
|
($2,685,867)
|
|
|
2009
|
($2,152,605)
|
|
|
2010
|
411,304
|
Although we expect to continue to be profitable in the future, we may not be. Our profitability in 2011 is dependent upon a combination of signing of additional license agreements and obtaining additional research funding. We may, however, continue to incur additional operating losses for an extended period of time as we continue to develop our technologies. We do, however, expect the magnitude of those losses, if they continue, to decrease. Currently, we are primarily a contract research and development organization and are dependent on license agreements and research funding to achieve profitability. In order to continue development of our technology, we anticipate that substantial research and development expenditures will continue to be incurred. We have funded our operations to date primarily through the proceeds from the sale of our equity securities and debt offerings. Our auditors have included a going concern paragraph in their opinion on our financial statements, which could impact our ability to obtain financing, if needed. However, we expect to be profitable in 2011 and do not anticipate the need for any financing.
We have no current royalty agreements producing significant revenue
Our strategy is dependent on licensing our technology to other companies and obtaining royalties based on products that these licensees develop and sell. We have no plans to manufacture and sell any products in significant quantities ourselves, and as such, we have no product revenues. We may enter into joint ventures or other business arrangements where we collaborate with others to sell or manufacture products. While we do have existing licenses, none of the licensees are producing products at the present time, and therefore none of the licenses are producing current revenue. Successful implementation of our strategy requires royalty bearing license agreements. We expect at least three of our licensees to introduce products into the marketplace in 2011; however, there is no guarantee that products will be introduced, or that they will be successful.
We expect to license our technology to be used in many applications. See additional discussion in the risk factor above entitled “Our technology development is in its early stages and the outcome is uncertain”. It is our intention that all future license agreements will include a provision that requires the payment of ongoing royalties, although there is no assurance that will occur.
We are dependent on the availability of materials and suppliers
The materials used in producing current and future products using our technology are purchased from other vendors. We anticipate that the majority of raw materials used in products to be developed by us will be readily available to manufacturers. However, there is no assurance that the current availability of these materials will continue in the future, or if available, will be procurable at favorable prices.
Page 12
Our revenues have been dependent on government contracts in the past
In many years, a significant portion of our revenues were derived from contracts with agencies of the United States government. Following is a summary of those revenues for the past ten years:
|
Year Ended December 31
|
Revenues from
Government
Contracts
|
Percentage of
Total Revenue
|
||
|
2001
|
$466,680
|
15%
|
||
|
2002
|
$254,152
|
18%
|
||
|
2003
|
$339,790
|
44%
|
||
|
2004
|
$305,721
|
80%
|
||
|
2005
|
$208,211
|
37%
|
||
|
2006
|
$583,236
|
52%
|
||
|
2007
|
$2,328,010
|
58%
|
||
|
2008
|
$2,295,887
|
58%
|
||
|
2009
|
$1,694,082
|
42%
|
||
|
2010
|
$2,920,030
|
36%
|
We currently have commitments for future government funding of approximately $2.9 million. We do not intend to seek any government funding unless it directly relates to achievement of our strategic objectives.
Contracts involving the United States government are, or may be, subject to various risks including, but not limited to, the following:
|
●
|
Unilateral termination for the convenience of the government
|
|
●
|
Reduction or modification in the event of changes in the government’s requirements or budgetary constraints
|
|
●
|
Increased or unexpected costs causing losses or reduced profits under fixed-price contracts or unallowable costs under cost reimbursement contracts
|
|
●
|
Potential disclosure of our confidential information to third parties
|
|
●
|
The failure or inability of the prime contractor to perform its prime contract in circumstances where we are a subcontractor
|
|
●
|
The failure of the government to exercise options provided for in the contract
|
|
●
|
The right of the government to obtain a non-exclusive, royalty free, irrevocable world-wide license to technology developed under contracts funded by the government if we fail to continue to develop the technology.
|
In addition, the current political environment and current budget deficits may result in cuts in government research funding, which could have a negative impact on us.
We may be exposed to litigation liability
We have had lawsuits that arise in the normal course of business. We have been subject to litigation in the past and have settled litigation in the past that has in rare instances resulted in material payments. We expect all current lawsuits to be resolved with no material negative impact on our financial statements, and we are unaware of any other potential significant litigation. If we were to become subject to a judgment that exceeds our ability to pay, that judgment would have a material impact on our financial condition and could affect our ability to continue in existence.
We may have future capital needs and the source of that funding is uncertain
We expect to continue to incur substantial expenses for R&D, product testing, and administrative overhead. The majority of R&D expenditures are for the development of our technologies. Some of the proposed products using our technology may not be available for commercial sale or routine use in the immediate future. Commercialization of existing and proposed products that would use our technology may require additional capital in excess of that currently available to us. A shortage of capital could prevent us from achieving profitability for an extended period of time. Because the timing and receipt of revenues from the sale of products using our technology will be tied to the achievement of certain product development, testing, manufacturing and marketing objectives, which cannot be predicted with certainty, there may be substantial fluctuations in our results of operations. If revenues do not increase as rapidly as anticipated, or if product development and testing requires more funding than anticipated, we may be required to curtail our activities and/or seek additional financing from other sources. We may seek additional financing through the offer of debt, equity, or any combination of the two at any time.
Page 13
We have developed a plan to allow us to maintain operations until we are able to sustain ourselves. We attained profitability in 2010 and expect to be profitable in 2011 as well. We have the existing resources, including the investment funds to be received from Sichuan Anxian Yinhee Construction and Chemical Company to continue operations for a period through at least the end of 2012. Expected revenues, excluding any new license agreements, will extend that period. Our plan is primarily dependent on raising funds through the licensing of our technology and revenue generated from performing contract research services. We expect to sign significant license and development contracts within the next year, although there is no assurance that this will occur.
Our plan is based on current development plans, current operating plans, the current regulatory environment, historical experience in the development of electronic products and general economic conditions. Changes could occur which would cause certain assumptions on which this plan is based to be no longer valid. Our plan is primarily dependent on increasing revenues, licensing our technology, and raising additional funds through additional debt and equity offerings, only if necessary. If adequate funds were not available from operations or additional sources of financing, we may have to eliminate, or reduce substantially, expenditures for research and development, and testing of our products. We may have to obtain funds through arrangements with other entities that may require us to relinquish rights to certain of our technologies or products. These actions could materially and adversely affect us.
We may be unable to enforce or defend our ownership and use of proprietary technology
Our ability to compete effectively with other companies will depend on our ability to maintain the proprietary nature of our technology. Although we have been awarded patents, have filed applications for patents, or have licensed technology under patents that we do not own, the degree of protection offered by these patents or the likelihood that pending patents will be issued is uncertain. Competitors in both the United States and foreign countries, many of which have substantially greater resources and have made substantial investment in competing technologies, may already have, or may apply for and obtain patents that will prevent, limit or interfere with our licensee’s ability to make and sell our products using our technology. Competitors or potential licensees may also intentionally infringe on our patents. The defense and prosecution of patent suits is both costly and time-consuming, even if the outcome is favorable to us.
In foreign countries, the expenses associated with such proceedings can be prohibitive. In addition, there is an inherent unpredictability in obtaining and enforcing patents in foreign countries. An adverse outcome in the defense of a patent suit could subject us to significant liabilities to third parties. Although third parties have not asserted infringement claims against us, there is no assurance that third parties will not assert such claims in the future. In the past, a major law firm has reviewed our patent portfolio and agreed to handle litigation related to certain of our patents on a contingency basis.
Changes in patent laws could have a negative impact on us
New legislation, regulations, or rules related to obtaining or enforcing patents could significantly increase our operating costs and make it more difficult to enforce or license our patents. If new legislation, regulations, or rules are implemented by Congress, the United States Patent and Trademark Office, or the courts that impact the patent application process, the patent enforcement process, or the rights of patent holders, these changes could negatively affect our expenses and potential revenue.
We rely on unpatented proprietary technology
We also rely on unpatented proprietary technology, and there is no assurance that others will not independently develop the same or similar technology, or otherwise obtain access to our proprietary technology. To protect our rights in these areas, we require employees, consultants, advisors and collaborators to enter into confidentiality agreements. These agreements may not provide meaningful protection for our trade secrets, know-how, or other proprietary information in the event of any unauthorized use, misappropriation or disclosure of such trade secrets, know-how, or other proprietary information. While we have attempted to protect proprietary technology that we develop or acquire and will continue to attempt to protect future proprietary technology through patents, copyrights and trade secrets, we believe that our success will depend upon further innovation and technological expertise.
Page 14
We have technologies subject to licenses
In May 2000, we licensed the rights to 6 carbon nanotube patents from Till Keesmann in exchange for a payment of $250,000 payable in shares of our common stock. Under the terms of the agreement, we received the exclusive right to license these patents to others, and we were obligated to pay license fees equal to 50% of any royalties received by us specifically related to these patents. We were allowed to offset certain expenses, up to a maximum of $50,000 per year, against payments due under this agreement. The agreement also contained provisions related to minimum license fee payments. These minimum payments, totaling $1,000,000, have been made and as a result, we received an irrevocable license to use the patents for the life of the patents.
Despite significant efforts, no license revenues were ever received for these patents and in 2008, the Keesmann agreement was amended as part of a litigation settlement. As part of that amendment, we agreed to return the licensing rights to Mr. Keesmann in May 2010, if minimum payments equal to $1.0 million were not paid to Mr. Keesmann by that date. No license revenue was received by that date and we made the conscious decision not to make the minimum payment and to allow the licensing rights to revert to Mr. Keesmann. Accordingly, the licensing rights for his specific patents reverted to Mr. Keesmann. We retain our irrevocable right to use the patents and we are entitled to 50% of any royalties generated by those patents, up to a maximum of $1.2 million.
Public perception(s) of ethical and social issues may discourage the use of nanotechnology
Nanotechnology has received both positive and negative publicity and is increasingly the subject of public discussion and debate. Governments may, for social or health purposes, prohibit or regulate the use of nanotechnology. This may restrict our ability to license our technology, or the ability of our licensees to sell their products.
Our business is subject to changing regulation of corporate governance and public disclosure
Because our common stock is publicly traded, we are subject to certain rules and regulations of federal and state entities charged with the protection of investors and the oversight of companies whose securities are publicly traded. These entities have continued to develop additional regulations and requirements in response to laws enacted by Congress, most notably the Sarbanes-Oxley Act of 2002. Complying with these new regulations has resulted in, and is likely to continue to result in, increased general & administrative costs and a diversion of management time and attention from revenue generating and other business activities to compliance activities.
Our business is subject to economic uncertainties
A portion of our research revenues come from private sources, primarily large multinational corporations. In addition, our strategy is dependent upon the receipt of royalties related to the introduction of new products by these and other companies. During times of extreme economic uncertainty, some companies may cut back on spending on research projects, or delay the introduction of new products.
Item 1B. Unresolved Staff Comments
None.
Page 15
Item 2. Properties
We lease a facility in Austin that is used for our corporate headquarters and research and development activities under a lease expiring in February 2014. In 2010 we began leasing additional space in an adjacent building in the same complex to establish a pilot production facility for our solar ink technology. The lease on the second facility expires concurrently with our other lease. The lease calls for total payments of approximately $18,500 per month through February 2012, and approximately $20,000 per month for the period from March 2012 through February 2014.
We believe that these facilities are suitable for our current needs and will be adequate for our anticipated research, development, and administrative activities, at least through the end of the lease period. We continuously monitor our facility needs and may move to a different facility at the end of the lease period, if circumstances warrant it. We would expect a new facility to be similar in size to our existing facility. If we embark on new research that requires significant additional employees, we may have to establish additional facilities.
We do not currently invest in real estate or interests in real estate, real estate mortgages, or securities of or interests in persons primarily engaged in real estate activities. However, the Company has no policy, either for or against, making such investments.
Item 3. Legal Proceedings
From time to time the Company and its subsidiaries are also defendants in various lawsuits that may arise related to minor matters. It is expected that any such lawsuits would be settled for an amount no greater than the liability recorded in the financial statements for such matters. If resolution of any of these suits results in a liability greater than that recorded, it could have a material impact on us.
Item 4. [Removed and Reserved]
Page 16
PART II
Item 5. Market for Registrant’s Common Equity, Related Stockholder Matters and Issuer Purchases of Equity Securities
Our common stock, $0.001 par value, trades on the OTC Bulletin Board system under the symbol “APNT”. The following table sets forth, on a per share basis for the periods indicated, the high and low sale prices for the common stock as reported by the OTC Bulletin Board system. These quotations reflect inter-dealer prices, without retail mark-up, mark-down or commission and may not represent actual transactions.
|
High
|
Low
|
||||||
|
2009
|
First Quarter
|
$0.37
|
$0.19
|
||||
|
Second Quarter
|
$0.36
|
$0.22
|
|||||
|
Third Quarter
|
$0.35
|
$0.19
|
|||||
|
Fourth Quarter
|
$0.33
|
$0.19
|
|||||
|
2010
|
First Quarter
|
$0.37
|
$0.20
|
||||
|
Second Quarter
|
$0.35
|
$0.25
|
|||||
|
Third Quarter
|
$0.34
|
$0.23
|
|||||
|
Fourth Quarter
|
$0.46
|
$0.27
|
|||||
|
2011
|
First Quarter (through February 24, 2011)
|
$0.35
|
$0.70
|
As of February 24, 2011, the closing sale price for our common stock as reported on the OTC Bulletin Board system was $0.64. As of February 24, 2011, there were approximately 350 shareholders of record for our common stock. This does not include shareholders holding stock in street name in brokerage accounts. As of our last record of total shareholders, including those holding stock in street name, there were approximately 7,000 shareholders.
Cash Dividends
We have never paid cash dividends on our common stock, and it is unlikely that we will pay any dividends in the foreseeable future. We currently intend to invest future earnings, if any, to finance expansion of our business. Any payment of cash dividends in the future will be dependent upon our earnings, financial condition, capital requirements, and other factors deemed relevant by our board of directors.
Page 17
Performance Graph
The following graph shows a comparison, since December 31, 2005, of cumulative total return for Applied Nanotech Holdings, the NASDAQ Market Index, and an index for Commercial Physical Research (SIC code 8731).
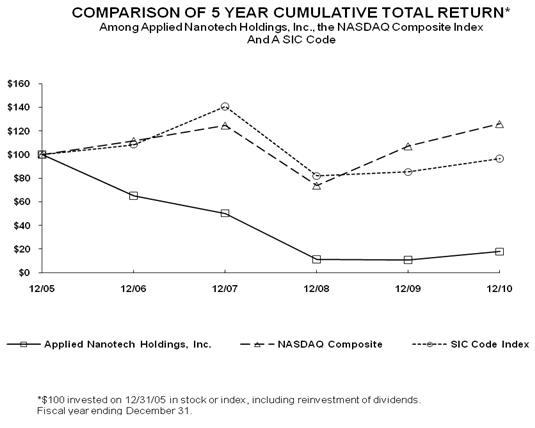
|
12/31/05
|
12/31/06
|
12/31/07
|
12/31/08
|
12/31/09
|
12/31/10
|
|||||||||||||||||||
|
Applied Nanotech Holdings, Inc.
|
100.00 | 65.12 | 50.23 | 11.16 | 10.70 | 17.91 | ||||||||||||||||||
|
NASDAQ Market Index
|
100.00 | 111.74 | 124.67 | 73.77 | 107.12 | 125.93 | ||||||||||||||||||
|
Commercial Physical Research (SIC Code 8731)
|
100.00 | 108.37 | 140.68 | 81.85 | 85.27 | 96.63 | ||||||||||||||||||
The performance graph assumes $100 invested on December 31, 2005 in our common stock, the NASDAQ Market Index, and an index based on a basket of stocks composing SIC Code 8731. The total return assumes reinvestment of dividends for the NASDAQ Market Index and the SIC Code Index. The total return is based on historical results and is not intended to indicate future performance. These dates represent arbitrary points in time and if different dates were presented, different results would be obtained.
Recent Sales of Unregistered Securities
We issued no unregistered shares of our securities in the fiscal quarter ended December 31, 2010
Page 18
SECURITIES AUTHORIZED FOR ISSUANCE UNDER EQUITY COMPENSATION PLANS
|
Equity Compensation
Plans Not Approved by
the Shareholders of
Applied Nanotech Holdings
|
Number of Securities to
be issued upon exercise
of outstanding options
|
Weighted-average
exercise price of
outstanding options
|
Number of Securities
remaining available
for future issuance under
equity compensation
plans (4)
|
|
(a)
|
(b)
|
I
|
|
|
1992 Employee Plan (1)
|
312,000
|
$0.77
|
-
|
|
1992 Outside Directors Plan (2)
|
50,000
|
$1.00
|
-
|
|
2002 Equity Compensation Plan (3)
|
5,860,972
|
$0.86
|
2,456,224
|
|
Total
|
6,222,972
|
$1.28
|
2,456,224
|
|
(1)
|
The 1992 Employee Plan was originally approved by shareholders and authorized 3.0 million shares. The plan was subsequently amended twice by the Board to increase the authorized number of shares and is therefore classified as a plan not approved by our shareholders.
|
|
(2)
|
The 1992 Outside Directors Plan was originally approved by shareholders and authorized 500,000 shares. The plan was subsequently amended by the Board to increase the authorized number of shares and is therefore classified as a plan not approved by our shareholders
|
|
(3)
|
The 2002 Equity Compensation Plan was overwhelmingly approved by a majority of the shareholders actually casting votes at each of the 2010, 2008, and 2007 annual meetings of shareholders. However, since less than 50% of the shares eligible to vote actually cast votes at each meeting, the plan does not fall into the category of plans approved by shareholders under SEC rules.
|
|
(4)
|
This column excludes securities reflected in column (a)
|
There are no equity compensation plans approved by shareholders at the present time.
The 1992 Employee Plan was created in 1992 for the purpose of granting incentive or non-qualified stock options to employees of, or contractors for, the Company. A total of 6.5 million shares were authorized under the plan. All options granted under this plan were priced at the fair market value of our common stock on the date of grant, or greater, and have a life of ten (10) years from their date of grant, subject to earlier termination as set forth in such plan. The plan expired in 2002; however, options granted prior to such plan’s expiration remain exercisable, subject to the terms of the respective option grants. All remaining outstanding options under this plan expire in 2011.
The 1992 Outside Directors’ Plan was established in 1992 for the purpose of granting non-qualified options to non-employee Directors of the Company. A total of 1.0 million options were authorized under the plan. All options granted under this plan were priced at the fair market value of our common stock or greater on the date of grant and have a life of ten (10) years from their date of grant, subject to earlier termination as set forth in such plan. The plan expired in 2002; however, options granted prior to such plan’s expiration remain exercisable, subject to the terms of the respective option grants. All remaining outstanding options under this plan expire in 2011.
In 2002, the Company’s Board of Directors established the 2002 Equity Compensation Plan for the purpose of granting incentive or non-qualified stock options to employees or directors of the Company. All options granted under this plan were priced at the fair market value of our common stock, or greater, on the date of grant and have a life of up to ten (10) years from their date of grant, subject to earlier termination as set forth in such plan. A total of 5,000,000 options were initially authorized under this plan. This plan was amended December 31, 2004 to increase the authorized shares by 3,000,000 to a total of 8,000,000 shares and again on December 12, 2007 to increase the authorized shares by another 2,000,000 to a total of 10,000,000 shares.
For a further description of each of the stock option plans described above, please see Note 9 to the Consolidated Financial Statements herein.
Page 19
Item 6. Selected Financial Data
|
2010
|
2009
|
2008
|
2007
|
2006
|
||||||||||||||||
|
Revenues
|
$ | 8,043,795 | $ | 4,052,746 | $ | 3,957,832 | $ | 3,989,803 | $ | 1,116,670 | ||||||||||
|
Net income (loss)
|
$ | 411,304 | $ | (2,152,605 | ) | $ | (2,685,867 | ) | $ | (4,256,891 | ) | $ | (6,593,892 | ) | ||||||
|
Income (loss) per share
|
$ | 0.00 | $ | (0.02 | ) | $ | (0.03 | ) | $ | (0.04 | ) | $ | (0.07 | ) | ||||||
|
Total assets
|
$ | 3,844,383 | $ | 893,367 | $ | 1,792,489 | $ | 3,744,858 | $ | 2,693,442 | ||||||||||
|
Long-term obligations
|
$ | 1,584,390 | $ | 196,958 | $ | 27,909 | $ | 30,004 | $ | — | ||||||||||
|
Net shareholders’ equity (deficit)
|
$ | 810,080 | $ | (1,070,838 | ) | $ | 858,286 | $ | 2,828,902 | $ | 642,262 | |||||||||
|
Cash dividends per common share
|
$ | — | $ | — | $ | — | $ | — | $ | — | ||||||||||
Page 20
Item 7. Management’s Discussion and Analysis of Financial Condition and Results of Operations
The following discussion should assist in understanding our financial condition, liquidity, and capital resources as of December 31, 2010, and the results of operations for the years ended December 31, 2010, 2009 and 2008. The Notes to our Consolidated Financial Statements included later in this report contain detailed information that should also be read in conjunction with this discussion.
OVERVIEW
We are engaged in research and development related to nanotechnology products. The main areas of focus in our research are on nanomaterials and nanoelectronics. We also conduct research activities related to sensors, nanoecology, and electron emission applications. Our technology, as well as many of its potential applications, is still new and in the early stages of development. Our revenue has primarily consisted of development projects involving either the U.S. government or large multinational corporations. We have also received upfront payments related to royalty agreements, but have not yet received royalties related to the sale of products produced using our technology.
OUTLOOK
We expect our total cash needs for 2011 to be approximately $6.8 million. We intend to fund those needs through revenue sources including sales, reimbursements for research, and license agreements. We anticipate increasing our revenue in 2011 over 2010 levels. We also had in excess of $2.7 million of cash on hand at December 31, 2010 as a cushion against any revenue shortfalls that might possibly occur. We believe our cash needs are adequately covered for 2011.
We were profitable in 2010, but had a history of net operating losses prior to this year. Our plan is to generate sufficient revenues in 2011 to maintain and increase the profitability that we achieved in 2010. There can be no assurances that we will be profitable in 2011 or the future; however, we believe that based on our 2010 results, our revenue backlog, and the status of discussions with potential additional revenue sources, that we will be profitable in 2011. We expect to continue our concentrated research and development of our technology in 2011, although full commercial development of our technology likely will require additional funds in the future.
Based on our plan, we believe that we have reached the point where we can sustain ourselves on our own revenue. Our plan is primarily dependent on raising funds through the licensing of our technology and through reimbursed research arrangements. Our current cash balances, when combined with expected revenues sources, are expected to be adequate to insure that we can maintain our operations at the present level. We believe that we have the ability to continue to secure short term funding, if it were needed, to enable us to continue operations until our plan can be completed if this plan takes longer than anticipated. Our auditors have included a going concern paragraph in their opinion on our financial statements, which could impact our ability to obtain financing, if needed. However, we do not anticipate needing any financing in 2011.
Our plan is based on current development plans, current operating plans, the current regulatory environment, historical experience in the development of electronic products, and general economic conditions. Changes could occur which would cause certain assumptions on which this plan is based to be no longer valid. Our plan is primarily dependent upon maintaining the increased level of revenues that we achieved in 2010. Although we do not expect funding our operations to be a problem, if adequate funds are not available from operations, or additional sources of financing, we may have to eliminate, or reduce substantially, expenditures for research and development, testing of our products, or obtain funds through arrangements with other entities that may require us to relinquish rights to certain technologies or products. Such results could materially and adversely affect us.
Critical Accounting Policies
Our significant accounting policies are summarized in the footnotes to our financial statements. Some of the most critical policies are also discussed below.
Page 21
Stock based compensation - We routinely grant stock options to employees and others. We have granted options in the past and each year all employees have the opportunity to earn additional performance-based option awards. We account for these options using the fair value method of accounting.
Other - As a matter of policy, we review our major assets for impairment. Our major operating assets are accounts receivable, and property and equipment. We depreciate our property and equipment over their estimated useful lives. We did not identify any impaired items in 2008, 2009 or 2010. We have not experienced significant bad debts expense, and we do not believe that we need an allowance for doubtful accounts for any exposure to loss in our December 31, 2010 accounts receivable.
LIQUIDITY AND CAPITAL RESOURCES
Our cash balance of approximately $2.7 million at December 31, 2010 was significantly higher than our cash balance of approximately $300,000 at December 31, 2009, as a result of both our profitability in 2010 and our decision to raise capital in 2010. We had working capital of approximately $2.2 million at December 31, 2010, compared with a working capital deficit of roughly $1.2 million at December 31, 2009. Our current assets increased by approximately $3.0 million as a result of our increase in cash and in accounts receivable. The December 31, 2010 accounts receivable balance reflects our increased revenue in 2010 and the higher level of activity associated with that increase. Our current liabilities decreased by approximately $300,000, primarily as a result of a decrease in accounts payable. The higher accounts payable balance at December 31, 2009 was primarily the result of working capital management, including delayed payments of accounts payable to preserve cash. The December 31, 2010 balance of accounts payable represents a more normal level for us.
The principal source of our liquidity has been funds received from exempt offerings of our common stock; however, in 2009 or 2008, we did not raise any equity from private placements of our common stock. We did receive proceeds of $200,000 in 2010 from the issuance of our common stock in a private placement. We also issued notes payable in 2009 and 2010, which are convertible into common stock. We expect all of these notes to be converted into common stock by the noteholders. We issued notes with a face amount of $200,000 in 2009 and notes with a face amount of $1,946,000 in 2010. We did receive proceeds of approximately $60,000, and $4,000 from the exercise of stock options by current and former employees in 2010, and 2008, respectively. We expect to receive additional option proceeds in 2011, however those likely will not be significant.
We believe that our current cash level, when combined with our backlog, expected revenue, and the investment funds to be received from Sichuan Anxian Yinhee Construction and Chemical Company, Ltd. is enough for us to operate at least through the end of 2012. We expect to be profitable in 2011 and if that occurs, we will have no need to raise funding solely to continue operations. If revenue sources do not materialize as quickly as we expect, we intend to cut expenses to a level to enable us to continue operations.
In the event that we were to need additional funds in the future, beyond the amount that we have on hand and those that we expect to receive as revenues or from other sources, we may seek to sell additional debt or equity securities. While we expect to be able to obtain any funds needed for operations, there is no assurance that any financing alternatives can be arranged on commercially acceptable terms. We believe that our success in maintaining profitability will be dependent upon the viability of products using our technology and their acceptance in the marketplace.
Net cash used in operating activities decreased from $2.3 million in 2008 to approximately $561,000 in 2009. We attained positive cash flow from operations of approximately $900,000 in 2010. The primary factor that drives our cash provided by or used in operations is net income or loss. Factors affecting net income or loss are discussed in the Results of Operations section below. In 2009, a substantial portion of the net loss was offset by management of working capital items, including reduction of accounts receivable, increase in accounts payable, and deferral of officer and board compensation resulting in an increase in accrued expenses. We plan to generate positive cash flow from operations again in 2011, based primarily on maintaining profitability.
Cash used in investing activities was the result of the purchase of capital assets in all years. We would expect minimal cash to be used in investing activities in 2011. No material commitments exist as of December 31, 2010, for future purchases of capital assets.
Our contractual obligations as of December 31, 2010 consist of notes payable (including interest), operating leases, and capital leases. The notes payable are convertible into common stock at rates of $0.20 to $0.25 per share and likely will be converted before their due date in 2012. A summary of our obligations at December 31, 2010 is as follows:
Page 22
|
Total
|
2011
|
2012
|
2013
|
2014
|
2015
|
|||||||||||||||||||
|
Capital leases
|
$ | 35,742 | $ | 20,237 | $ | 9,793 | $ | 5,712 | — | — | ||||||||||||||
|
Operating leases
|
$ | 918,842 | $ | 349,763 | $ | 259,145 | $ | 264,637 | $ | 45,297 | — | |||||||||||||
|
Convertible notes payable
|
$ | 2,335,200 | — | $ | 2,335,200 | — | — | — | ||||||||||||||||
We believe that we will have the cash available to meet our cash requirements for fiscal 2011 and we believe that all of the notes due in 2012, including both principal and interest, will be converted to common stock rather than paid in cash.
RESULTS OF OPERATIONS
Business Segments. We operate with a single reportable business segments.
Revenues. Following is a summary of key revenue categories for the three years covered by this report.
|
2010
|
2009
|
2008
|
||||||||||
|
Government Revenues
|
$ | 2,920,030 | $ | 1,694,082 | $ | 2,295,887 | ||||||
|
Other Contract Research
|
$ | 1,137,370 | $ | 1,767,144 | $ | 824,358 | ||||||
|
License Fees and Royalties
|
$ | 3,750,000 | $ | 500,000 | $ | 577,000 | ||||||
|
Total Revenues
|
$ | 8,043,795 | $ | 4,052,746 | $ | 3,957,832 | ||||||
|
Revenue backlog at December 31
|
$ | 3,361,000 | $ | 2,938,000 | $ | 3,272,000 | ||||||
Our total revenues were roughly similar in 2008 and 2009 and the majority of the revenues came from research contracts in those years. Our revenues jumped substantially in 2010, primarily as a result of license fees and royalties, but our research revenues increased in 2010 also. The key to profitability for us is the receipt of license fees and royalties. In 2010, $2.5 million of those license revenues came from Samsung Electronics Co, Ltd., $1.0 million from Ishihara Chemical Company, Ltd., and the remaining $250,000 came from Yonex Co., Ltd. The license fees in 2009 were from Ishihara, and the license fees in 2008 were from Yonex.
The revenue backlog as of December 31, 2010 results from several government programs and private contracts and is similar, but slightly higher than, prior years. The majority of these programs are currently in progress and generating revenue, with the remainder related to contracts awarded, but not yet started. The overwhelming majority of this backlog will be converted into revenue in 2011. We also have some highly likely contracts that have not yet been finalized, and therefore, are not included in the backlog numbers as of December 31, 2010. In addition, Yonex has announced the introduction of products in the first quarter of 2011 that will generate royalty revenue for us in 2011 and we expect to sign additional licenses that will generate upfront payments and possibly royalties in 2011.
We expect revenue to be higher in 2011 than in 2010. We are targeting minimum revenues in 2011 of $10.0 million. Of that, $3.4 million is already committed and in process, and we have specifically identified, and are working on, opportunities that would make up the majority of the remaining $6.6 million needed to achieve $10.0 million in revenue in 2011. There is no guarantee that these revenues will be obtained; however, we think it is equally as likely that revenues will exceed these numbers, as it is that they fall short of them. Revenues could increase above these levels as a result of unanticipated royalty agreements or additional research revenues, but there is no assurance that this will occur, or that even the targeted minimum of $10.0 million in revenue will be achieved. We are currently pursuing opportunities in several areas that could result in additional revenue in 2011.
Page 23
We expect research revenues to increase in 2011 over 2010 levels, and we expect license and royalty revenue to be similar to, or greater than, 2010 levels in 2011.
Cost of sales. Because we do not ship products or provide homogenous services, we do not incur costs of sales in the traditional sense. We do keep track of our costs on individual projects, but because there is a wide variation in cost percentages, presenting cost of sales information is not meaningful. Government sponsored research has nominal or no gross margins and is primarily just a reimbursement of costs. In some cases we charge nominal amounts for projects that have much higher costs because we are proving a concept that will be helpful to us in other areas, or are seeking a significantly larger follow up contract with the customer. In other instances we may perform research contracts that have significant positive margins because we are able to capitalize on work that we have done and knowledge that we have gained in the past. At the present stage of our development, it is more meaningful to look at total research and development costs in conjunction with revenues than to look at solely internally funded research projects and the cost of research associated with revenue producing contracts.
Research and development. Following is a summary of research and development expenditures for the past three years.
|
2010
|
2009
|
2008
|
||||||||||
|
Total Research and development
|
$ | 4,839,556 | $ | 3,662,323 | $ | 4,614,644 | ||||||
Our level of research activity increased in 2010, after decreasing from 2008 to 2009. This increase related to both an increased number of projects and an increased level of revenues in 2010. Our research costs increased more rapidly than revenue, with research costs increasing 32% and research revenues increasing 17%. Costs associated with research increased more quickly than revenues because we did preliminary work in a number of areas on unfunded projects with the goal of bringing our technology to a level that will attract funding partners or licensees.
We expect to continue to incur substantial expenses in support of additional research and development activities related to the commercial development of our technologies. We expect to incur approximately 10% more research related expenditures in 2011 than those incurred in 2010. We may, however, incur more research and development expense in 2011 than presently expected. We are pursuing numerous opportunities for research contracts and depending upon the nature of the contracts signed, we may require more research materials than expected, or we may require additional personnel. If research revenue does not materialize as expected at the present time, we would likely reduce research expenditures accordingly.
Selling, general, and administrative. Following are some key components of selling, general, and administrative expense:
|
2010
|
2009
|
2008
|
||||||||||
|
Stock based compensation
|
$ | 160,129 | $ | 131,962 | $ | 418,252 | ||||||
|
Patent expense
|
$ | 393,217 | $ | 731,422 | $ | 789,006 | ||||||
|
Patent license commission
|
$ | 460,938 | — | — | ||||||||
|
Litigation related expenses
|
$ | — | $ | — | $ | 166,278 | ||||||
|
Other S, G, & A
|
$ | 1,767,199 | $ | 1,677,432 | $ | 2,524,403 | ||||||
|
Total selling, general, and administrative
|
$ | 2,781,483 | $ | 2,540,816 | $ | 3,897,939 | ||||||
Total selling, general and administrative expense decreased significantly from 2008 to 2009, largely as a result of cost cutting measures, but increased slightly from 2009 to 2010.
Page 24
One significant component of selling, general, and administrative expense is stock based compensation. Stock based compensation is significantly impacted by two factors. First, the number of options vested, or expected to vest, each year. Second, the fair value of the options vested. For options granted at the market price, the most significant factor impacting the fair value is the underlying price of our stock. Although counterintuitive, as a general rule, options granted when the stock price is lower will have a lower fair value than options granted when the stock price is higher. Stock based compensation was lower in 2009 than 2008, both because fewer options were granted and because our stock price was lower. Our stock price remained low in 2010, but stock based compensation increased because a larger number of options were granted. We will incur stock based compensation expense in 2011. It is difficult to predict the amount because it significantly depends on the price of our stock. Stock based compensation expense is expected to increase in 2011 because of options already granted that are scheduled to vest in 2011. Many of these options were granted late in 2010 when the stock price was higher. In addition, our stock price has increased in 2011 and options granted to date in 2011 are at higher prices, resulting in a higher fair value.
We also spend a significant amount on patents. Our patent expense decreased from approximately $789,000 in 2008 to approximately $731,000 in 2009 as a result of a switch in the law firm handling our patents in the second half of the year. Patent expense decreased further in 2010 as a result of several factors. First, we did an extensive review of our portfolio and discontinued maintenance payments on old patents that we considered to no longer have value to us. Second, we had a full year with our new patent firm in 2010 as opposed to a partial year in 2009. Finally, we reached a favorable resolution in 2010 on a fee dispute with our previous patent firm that resulted in us paying less than the amount previously billed. We expect patent expense to increase in 2011 to approximately $550,000, an amount still below 2008 and 2009 levels. In addition, we are continuing to review our patent portfolio and will eliminate or sell any patents we no longer consider useful to us as part of our core strategy.
In 2010, we retained a patent broker to represent us in auctioning a portion of our electron emission patent portfolio. This broker also represented us in the transaction with Samsung Electronics. The portion of the fee allocated to the license portion of the Samsung agreement was $460,938 and is included in selling general and administrative expense. No such fees were incurred in 2008 or 2009.
Another component of selling, general, and administrative expense during the periods presented is litigation related expense. We incurred litigation expense in 2008 related to the Keesmann litigation that was settled that year. We had no litigation in expense in 2009 or 2010, and we currently have no significant litigation in process and expect litigation expense to be insignificant in 2011.
Our other selling, general, and administrative expenses decreased substantially from 2008 to 2009 as a result of significant cuts that we made in late 2008 and 2009. These were wide ranging reductions covering most areas. We combined the CEO and CFO positions in 2009 when our previous CEO resigned, saving in excess of $200,000. We also reduced our professional fees from 2008 to 2009.
Other selling, general, and administrative activities increased by about 5% from 2009 to 2010. This is primarily related to investor relations activities, including the annual shareholders meeting, in 2010 that were not incurred in 2009. We expect other selling, general and administrative expense in 2011 to remain at similar levels to 2010.
We expect total selling, general, and administrative expenses to be slightly over $2.6 million in 2011. If revenues increase above anticipated levels, or other unanticipated transactions occur, our selling, general and administrative expenses could increase above expected levels.
Gain on sale of intellectual property and other assets. In 2008, we had total gains of $1,329,571 related to the sale of intellectual property and other assets. The majority of that, $1,225,999, came from a sale of a portion of our future interest in royalties from the Keesmann patents. We also had a gain of $100,000 from the sale of certain patents which we were no longer using and which did not relate to any of our current active technology platforms. The balance of the gain in 2008 came from the sale of miscellaneous equipment.
In 2009, the gain resulted from a contingent payment received related to intellectual property sold by our EBT subsidiary in 2006.
In 2010, we also had a gain related to the sale of intellectual property. We entered into a transaction with Samsung Electronics Co., Ltd whereby we sold 29 patents (11 U.S. and 18 foreign counterparts) and licensed approximately 150 additional patents in exchange for a one-time payment of $3.75 million. The proceeds of $3.75 million were allocated between the patents sold and the patents licensed. A total of $2.5 million was allocated to the license and recorded as license revenue. A total of $1.25 million was allocated to the patents sold. The gain of $1,019,531 represents the sale proceeds of $1.25 million reduced by a prorata share of the expenses related to a patent broker associated with the transaction. The balance of the gain came from the sale of miscellaneous items.
Page 25
Other income. Following is a summary of other income for the last three fiscal years.
|
2010
|
2009
|
2008
|
||||||||||
|
Interest expense associated with capital leases
|
$ | (5,764 | ) | $ | (8,356 | ) | $ | (7,180 | ) | |||
|
Interest expense associated with notes payable
|
$ | (144,953 | ) | $ | (899 | ) | $ | — | ||||
|
Interest expense associated notes payable discount
|
$ | (270,987 | ) | $ | (834 | ) | $ | — | ||||
|
Interest Income
|
$ | 2,031 | $ | 1,877 | $ | 46,493 | ||||||
|
Miscellaneous income
|
$ | 4,707 | $ | — | $ | — | ||||||
|
Litigation settlement
|
$ | — | $ | — | $ | 500,000 | ||||||
In previous years, our interest expense was primarily associated with capital leases; however in late 2009 and early 2010, we issued convertible notes payable bearing interest at a rate of 8% and incurred $144,953 of interest expense related to that interest rate in 2010. In addition, the value of the conversion feature was recorded as a discount at the time of issuance and is being amortized to expense over the life of the notes. That amortization resulted in an additional amount of interest expense of $270,987 in 2010. If the notes remain outstanding for all of 2011, we expect over $150,000 of interest expense associated with the interest rate and a minimum of $200,000 of amortization of the discount. However, we expect the majority of these notes to be converted in 2011. This will result in a decrease in the expected rate-based interest, but an increase in the amount of discount amortized in 2011. The remaining unamortized discount at December 31, 2010 was approximately $375,000 and we expect the entire discount to be amortized in 2011 as the result of note conversions and amortization.
Our interest income is earned as a result of the investment of excess cash balances. Our interest income decreased in 2009 and 2010 as interest rates decreased. We expect our interest income in 2011 to be negligible, given the current interest rate environment. The litigation settlement in 2008 was income from our settlement with the defendants in the Keesmann litigation.
Provision for taxes. In 2010, we paid $618,750 of Korean taxes that were withheld related to the previously described transaction with Samsung. No such taxes were paid in 2008 or 2009. These Korean taxes are available to offset U.S. income taxes in the future. As a result of net operating loss carry forwards and credits available, we have no liability for U.S. income taxes in 2010 and expect no such liability in 2011.
Overview
The largest single component of cost that we incur is payroll related expense. Excluding the cost related to stock based compensation, we incurred payroll related expense of approximately $3.5 million in 2008, $3.1 million in 2009, and $3.2 million in 2010. The reduction from the 2008 level results from a decrease in the number of employees, as well as other cost reduction initiatives. We expect payroll related expense in 2011 to increase slightly to approximately $3.3 million. We expect our burn rate for 2011, excluding any revenue, to average approximately $650,000 per month. Based on this, we believe we can reach breakeven at a revenue level of $7.8 million, but there is no assurance that this will occur, or that we will achieve that level of revenue. We are, however, targeting minimum revenues of $10.0 million. The monthly burn rate of $650,000 includes approximately $100,000 per month of non-cash expenses, resulting in a cash burn rate, excluding any revenue of approximately $550,000 per month on average.
We expect expenditures will increase if additional revenue producing projects, beyond those expected, are obtained. This expenditure level is based on anticipated revenue levels. If these revenue levels are not attained, we will not incur many of these expenses, and our expense level will also be lower than anticipated.
SEASONALITY AND INFLATION
Applied Nanotech Holdings’ business is not seasonal in nature. Management believes that Applied Nanotech Holdings’ operations have not been affected by inflation.
Page 26
ACCOUNTING PRONOUNCEMENTS
There are no recently issued accounting pronouncements which have not been implemented in our financial statements that would have a material impact on our financial statements.
Item 7A. Quantitative and Qualitative Disclosures About Market Risk
We do not use any derivative financial instruments for hedging, speculative, or trading purposes. Our exposure to market risk is currently immaterial.
Page 27
Item 8. Financial Statements and Supplementary Data
INDEX TO CONSOLIDATED FINANCIAL STATEMENTS
OF APPLIED NANOTECH HOLDINGS, INC.
CONSOLIDATED FINANCIAL STATEMENTS
|
Independent Auditor’s Report
|
29
|
|
Consolidated Balance Sheets - December 31, 2010 and 2009
|
30
|
|
Consolidated Statement of Operations - Years Ended December 31, 2010, 2009, and 2008
|
31
|
|
Consolidated Statements of Shareholders’ Equity - Years Ended December 31, 2010, 2009, and 2008
|
32
|
|
Consolidated Statements of Cash Flows - Years Ended December 31, 2010, 2009, and 2008
|
33
|
|
Notes to Consolidated Financial Statements
|
34
|
Page 28
REPORT OF INDEPENDENT REGISTERED PUBLIC ACCOUNTING FIRM
To the Board of Directors and Shareholders
Applied Nanotech Holdings, Inc.
Austin, Texas
We have audited the accompanying consolidated balance sheets of Applied Nanotech Holdings, Inc. and Subsidiaries (collectively, the “Company”) as of December 31, 2010 and 2009 and the related consolidated statements of operations, shareholders’ equity and cash flows for each of the years in the three year period ended December 31, 2010. These consolidated financial statements are the responsibility of the Company’s management. Our responsibility is to express an opinion on these consolidated financial statements based on our audits.
We conducted our audits in accordance with the standards of the Public Company Accounting Oversight Board (United States). Those standards require that we plan and perform the audit to obtain reasonable assurance about whether the financial statements are free of material misstatement. An audit includes examining, on a test basis, evidence supporting the amounts and disclosures in the financial statements. An audit also includes assessing the accounting principles used and significant estimates made by management, as well as evaluating the overall financial statement presentation. We believe that our audits provide a reasonable basis for our opinion.
In our opinion, the consolidated financial statements referred to above present fairly, in all material respects, the financial position of Applied Nanotech Holdings, Inc. and Subsidiaries as of December 31, 2010 and 2009, and the results of their operations and their cash flows for each of the years in the three year period ended December 31, 2010 in conformity with accounting principles generally accepted in the United States of America.
We also have audited, in accordance with the standards of the Public Company Accounting Oversight Board (United States), the Company’s internal control over financial reporting as of December 31, 2010, based on criteria established in Internal Control-Integrated Framework issued by the Committee of Sponsoring Organizations of the Treadway Commission (COSO), and our report dated February 24, 2011 expressed an unqualified opinion on the effectiveness of internal control over financial reporting.
The accompanying consolidated financial statements have been prepared assuming that the Company will continue as a going concern. As discussed in Note 1 to the consolidated financial statements, prior to 2010, the Company has experienced recurring losses from operations and negative cash flow from operations. This raises substantial doubt about the Company’s ability to continue as a going concern. Management’s plan in regard to these matters is also described in Note 1 to the consolidated financial statements. The consolidated financial statements do not include any adjustments that might result from the outcome of this uncertainty.
/s/ Padgett, Stratemann & Co, L.L.P.
Padgett, Stratemann & Co, L.L.P.
San Antonio, Texas
February 24, 2011
Page 29
APPLIED NANOTECH HOLDINGS, INC. AND SUBSIDIARIES
CONSOLIDATED BALANCE SHEETS
|
ASSETS
|
||||||||
|
December 31,
|
||||||||
|
2010
|
2009
|
|||||||
|
Current assets:
|
||||||||
|
Cash and cash equivalents
|
$ | 2,732,570 | $ | 286,971 | ||||
|
Accounts receivable, trade – net of allowance for doubtful accounts
|
757,507 | 249,164 | ||||||
|
Prepaid expenses and other current assets
|
116,784 | 67,340 | ||||||
|
Total current assets
|
3,606,861 | 603,475 | ||||||
|
Property and equipment, net
|
215,289 | 267,008 | ||||||
|
Other assets
|
22,233 | 22,884 | ||||||
|
Total assets
|
$ | 3,844,383 | $ | 893,367 | ||||
|
LIABILITIES AND SHAREHOLDERS’ EQUITY (DEFICIT)
|
||||||||
|
Current liabilities:
|
||||||||
|
Accounts payable
|
$ | 545,973 | $ | 952,679 | ||||
|
Obligations under capital lease
|
17,317 | 21,939 | ||||||
|
Accrued liabilities
|
566,623 | 482,629 | ||||||
|
Deferred revenue
|
320,000 | 310,000 | ||||||
|
Total current liabilities
|
1,449,913 | 1,767,247 | ||||||
|
Obligations under capital lease, long-term
|
13,819 | 31,124 | ||||||
|
Convertible notes payable
|
1,570,571 | 165,834 | ||||||
|
Total liabilities
|
3,034,303 | 1,964,205 | ||||||
|
Commitments and contingencies
|
— | — | ||||||
|
Shareholders’ equity (deficit) :
|
||||||||
|
Preferred stock, $1.00 par value, 2,000,000 shares authorized; no shares issued and outstanding
|
— | — | ||||||
|
Common stock, 160,000,000 shares authorized, $.001 par value, 109,967,628 and 107,473,133 shares issued and outstanding, respectively
|
109,968 | 107,473 | ||||||
|
Additional paid-in capital
|
110,986,117 | 109,518,998 | ||||||
|
Accumulated deficit
|
(110,286,005 | ) | (110,697,309 | ) | ||||
|
Total shareholders’ equity (deficit)
|
810,080 | (1,070,838 | ) | |||||
|
Total liabilities and shareholders’ equity (deficit)
|
$ | 3,844,383 | $ | 893,367 | ||||
See notes to consolidated financial statements.
Page 30
APPLIED NANOTECH HOLDINGS, INC. AND SUBSIDIARIES
CONSOLIDATED STATEMENTS OF OPERATIONS
|
Year ended December 31,
|
||||||||||||
|
2010
|
2009
|
2008
|
||||||||||
|
|
||||||||||||
|
Revenues
|
|
|
|
|||||||||
|
Contract research
|
$ | 1,137,370 | $ | 1,767,144 | $ | 824,358 | ||||||
|
Government contracts
|
2,920,030 | 1,694,082 | 2,295,887 | |||||||||
|
License fees and royalties
|
3,750,000 | 500,000 | 577,000 | |||||||||
|
Other
|
236,395 | 91,250 | 260,587 | |||||||||
|
|
||||||||||||
|
Total revenues
|
8,043,795 | 4,052,746 | 3,957,832 | |||||||||
|
Operating costs
|
||||||||||||
|
Research and development
|
4,839,556 | 3,662,323 | 4,614,644 | |||||||||
|
Selling, general and administrative expenses
|
2,781,483 | 2,540,816 | 3,897,939 | |||||||||
|
Total operating costs
|
7,621,039 | 6,203,139 | 8,512,583 | |||||||||
|
Gain on sale of assets and other intellectual property
|
1,022,264 | 6,000 | 1,329,571 | |||||||||
|
|
||||||||||||
|
Income (Loss) from operations
|
1,445,020 | (2,144,393 | ) | (3,225,180 | ) | |||||||
|
|
||||||||||||
|
Other income (expense):
|
||||||||||||
|
Interest income
|
2,031 | 1,877 | 46,493 | |||||||||
|
Interest expense
|
(421,704 | ) | (10,089 | ) | (7,180 | ) | ||||||
|
Other
|
4,707 | — | 500,000 | |||||||||
|
|
||||||||||||
|
Total other income (expense)
|
(414,966 | ) | (8,212 | ) | 539,313 | |||||||
|
Income (loss) before taxes
|
1,030,054 | (2,152,605 | ) | (2,685,867 | ) | |||||||
|
|
||||||||||||
|
Provision for taxes
|
618,750 | — | — | |||||||||
|
Net income (loss) applicable to common shareholders
|
$ | 411,304 | $ | (2,152,605 | ) | $ | (2,685,867 | ) | ||||
|
Earnings (loss) per share
|
||||||||||||
|
Basic and diluted
|
$ | 0.00 | $ | (0.02 | ) | $ | (0.03 | ) | ||||
|
Weighted average common shares outstanding
|
||||||||||||
|
Basic
|
108,835,772 | 107,427,877 | 107,292,686 | |||||||||
|
Diluted
|
109,069,524 | 107,427,877 | 107,292,686 | |||||||||
See notes to consolidated financial statements.
Page 31
APPLIED NANOTECH HOLDINGS, INC. AND SUBSIDIARIES
CONSOLIDATED STATEMENTS OF SHAREHOLDERS’ EQUITY (DEFICIT)
|
Preferred
|
Common
|
Additional
|
Accumulated
|
|||||||||||||||||||||||||
|
Shares
|
Amount
|
Shares
|
Amount
|
Paid-In Capital
|
Deficit
|
Total
|
||||||||||||||||||||||
|
Balance December 31, 2007
|
- | $ | - | 107,173,549 | $ | 107,174 | $ | 108,580,565 | $ | (105,858,837 | ) | $ | 2,828,902 | |||||||||||||||
|
Issuance of common stock as a result of the exercise of employee stock options
|
- | - | 170,000 | 170 | 61,080 | - | 61,250 | |||||||||||||||||||||
|
Issuance of common stock options as compensation
|
- | - | - | - | 605,393 | - | 605,393 | |||||||||||||||||||||
|
Issuance of restricted common stock as compensation
|
- | - | 51,667 | 51 | 48,557 | - | 48,608 | |||||||||||||||||||||
|
Net (loss)
|
- | - | - | - | - | (2,685,867 | ) | (2,685,867 | ) | |||||||||||||||||||
|
Balance December 31, 2008
|
- | $ | - | 107,395,216 | $ | 107,395 | $ | 109,295,595 | $ | (108,544,704 | ) | $ | 858,286 | |||||||||||||||
|
Conversion rights associated with issuance of convertible notes
|
- | - | - | - | 35,000 | - | 35,000 | |||||||||||||||||||||
|
Issuance of common stock options as compensation
|
- | - | - | - | 160,505 | - | 160,505 | |||||||||||||||||||||
|
Issuance of restricted common stock as compensation
|
- | - | 77,917 | 78 | 27,898 | - | 27,976 | |||||||||||||||||||||
|
Net (loss)
|
- | - | - | - | - | (2,152,605 | ) | (2,152,605 | ) | |||||||||||||||||||
|
Balance December 31, 2009
|
- | $ | - | 107,473,133 | $ | 107,473 | $ | 109,518,998 | $ | (110,697,309 | ) | $ | (1,070,838 | ) | ||||||||||||||
|
Conversion rights associated with issuance of convertible notes
|
- | - | - | - | 612,250 | - | 612,250 | |||||||||||||||||||||
|
Issuance of common stock options as compensation
|
- | - | - | - | 227,124 | - | 227,124 | |||||||||||||||||||||
|
Issuance of restricted common stock as compensation
|
- | - | 75,118 | 75 | (75 | ) | - | - | ||||||||||||||||||||
|
Issuance of shares upon conversion of Accounts Payable
|
- | - | 352,657 | 353 | 89,647 | - | 90,000 | |||||||||||||||||||||
|
Issuance of common shares for cash
|
- | - | 1,000,000 | 1,000 | 199,000 | - | 200,000 | |||||||||||||||||||||
|
Issuance of common stock as the result of the exercise of employee stock options
|
- | - | 18,200 | 18 | 4,350 | - | 4,368 | |||||||||||||||||||||
|
Committed to be released shares
|
- | - | - | - | 126,168 | - | 126,168 | |||||||||||||||||||||
|
Conversion of notes
|
- | - | 1,048,520 | 1,049 | 208,655 | - | 209,704 | |||||||||||||||||||||
|
Net income
|
- | - | - | - | - | 411,304 | 411,304 | |||||||||||||||||||||
|
Balance December 31, 2010
|
- | $ | - | 109,967,628 | $ | 109,968 | $ | 110,986,117 | $ | (110,286,005 | ) | $ | 810,080 | |||||||||||||||
See notes to consolidated financial statements.
Page 32
APPLIED NANOTECH HOLDINGS, INC. AND SUBSIDIARIES
CONSOLIDATED STATEMENTS OF CASH FLOWS
|
Year Ended
December 31,
|
||||||||||||
|
2010
|
2009
|
2008
|
||||||||||
|
Cash flows from operating activities:
|
|
|
||||||||||
|
Net income (loss)
|
$ | 411,304 | $ | (2,152,605 | ) | $ | (2,685,867 | ) | ||||
|
Adjustments to reconcile net income ( loss) to net cash used in operating activities:
|
||||||||||||
|
Depreciation and amortization expense
|
63,356 | 64,353 | 70,536 | |||||||||
|
Stock and options issued for services
|
353,292 | 188,481 | 654,001 | |||||||||
|
Amortization of discount on debt
|
270,987 | 834 | — | |||||||||
|
Changes in assets and liabilities:
|
||||||||||||
|
Accounts receivable, trade
|
(508,343 | ) | 412,540 | (407,741 | ) | |||||||
|
Prepaid expenses and other assets
|
(48,793 | ) | 51,597 | 50,522 | ||||||||
|
Accounts payable
|
23,294 | 513,801 | (8,228 | ) | ||||||||
|
Accrued expenses
|
309,698 | 274,820 | 104,806 | |||||||||
|
Deferred revenue and other current liabilities
|
10,000 | 85,405 | (81,832 | ) | ||||||||
|
Total adjustments
|
473,491 | 1,591,831 | 382,064 | |||||||||
|
Net cash provided by (used in) operating activities
|
884,795 | (560,774 | ) | (2,303,803 | ) | |||||||
|
Cash flows from investing activities:
|
||||||||||||
|
Capital expenditures
|
(11,637 | ) | (20,901 | ) | (35,943 | ) | ||||||
|
|
||||||||||||
|
Net cash used in investing activities
|
(11,637 | ) | (20,901 | ) | (35,943 | ) | ||||||
|
Cash flows from financing activities:
|
||||||||||||
|
Proceeds from issuance of common stock
|
204,368 | — | 61,250 | |||||||||
|
Proceeds of long term debt
|
1,730,000 | 200,000 | — | |||||||||
|
Repayment of short-term notes payable
|
(340,000 | ) | — | — | ||||||||
|
Repayment of capital lease obligations
|
(21,927 | ) | (41,465 | ) | (31,489 | ) | ||||||
|
Net cash provided by financing activities
|
1,572,441 | 158,535 | 29,761 | |||||||||
|
Net increase (decrease) in cash and cash equivalents
|
2,445,599 | (423,140 | ) | (2,309,985 | ) | |||||||
|
Cash and cash equivalents, beginning of year
|
286,971 | 710,111 | 3,020,096 | |||||||||
|
Cash and cash equivalents, end of year
|
$ | 2,732,570 | $ | 286,971 | $ | 710,111 | ||||||
See notes to consolidated financial statements.
Page 33
APPLIED NANOTECH HOLDINGS, INC. AND SUBSIDIARIES
NOTES TO CONSOLIDATED FINANCIAL STATEMENTS
|
1.
|
Organization, Operations, and Liquidity:
|
Applied Nanotech Holdings, Inc. and its subsidiaries (“the Company”) are engaged in the development of products for applications using nanomaterials, sensors, nanoelectronics, and proprietary field emission technology as well as the performance of significant research in those areas. We intend to obtain development revenues for applying our technology to specific applications for our development partners and to obtain royalty revenues from licensing this technology to those partners and others. We have also developed patented electronic sign technology and sold products using that technology, but have now sold that technology. We may receive additional income from the sale of that technology based on license revenues received by the purchaser of the technology.
We were profitable in 2010, and expect to be profitable in 2011, but unless we are able to operate profitably on a continuous basis as a result of revenues from either reimbursed research or license agreements, we may be required to seek additional funds through the equity markets, or raise funds through debt instruments to allow us to maintain operations. There is no assurance that additional license agreements will be signed, that commercialization of our technology and products will result in income from operations, or that funds will be available in the equity or debt markets, if needed. Management believes it will be able to sustain profitability and if not, be able to secure additional funding, if needed.
The principal source of our liquidity since the time of our initial public offering in 1993 has been from the funds received from exempt offerings of common stock, preferred stock, and convertible debt securities, as well as license and development revenues. We may receive additional funds from the exercise of employee stock options. We may also seek to increase our liquidity through bank borrowings or other financings, although this is not likely. There can be no assurance that any of these financing alternatives can be arranged on commercially acceptable terms. We believe that our success in reaching sustained profitability will depend on the viability of our technology and products using that technology, their acceptance in the marketplace, and our ability to obtain additional debt or equity financings in the future, if needed.
A portion of our research and development has been funded by others. To the extent that other funding is not available, research and development may be internally funded by us; however, our primary objective is to focus our resources on projects for which we receive funding.
The Company has a history of net losses and negative cash flow from operations, although these net losses and negative cash flows have been decreasing. We were profitable in 2010 and had positive cash flows from operations in 2010, and we expect to be profitable and have positive cash flow from operations in 2011, as well. The accompanying financial statements have been prepared in conformity with generally accepted accounting principles, which contemplate continuation of the Company as a going concern, and do not include any adjustments that may be required if it were unable to continue as a going concern. Management believes that actions currently being taken will allow the Company to maintain profitability and allow the Company to continue as a going concern.
|
2.
|
Summary of Significant Accounting Policies:
|
Principles of consolidation
The accompanying consolidated financial statements include the accounts of the Company and its subsidiaries, Applied Nanotech, Inc. (“ANI”), and Electronic Billboard Technology, Inc. (“EBT”), after the elimination of all significant intercompany accounts and transactions. ANI is primarily involved in developing products for applications using the Company’s proprietary field emission technology, sensors, nanoelectronics, and nanomaterials which include composites. EBT was primarily involved in the commercialization of electronic digitized sign technology, but has now sold its technology and is now inactive.
Page 34
APPLIED NANOTECH HOLDINGS, INC. AND SUBSIDIARIES
NOTES TO CONSOLIDATED FINANCIAL STATEMENTS (CONTINUED)
|
2.
|
Summary of Significant Accounting Policies (continued):
|
Management’s estimates
The preparation of financial statements in conformity with generally accepted accounting principles requires management to make estimates and assumptions that affect the reported amounts of assets, liabilities, revenues, and expenses, as well as the disclosure of contingent assets and liabilities. Actual results could differ from those estimates. Significant estimates include deferred tax asset reserves, bad debt reserves, assumptions used in calculating share based compensation, and depreciation.
Revenue recognition
Our revenues include reimbursements under agreements to perform research and development for government agencies and others. We do not perform research contracts that are contingent upon successful results. Larger projects are sometimes broken down in phases to allow the customer to determine at the end of each phase if they wish to move to the next phase. The agreements with federal government agencies generally provide that, upon completion of a technology development program, the funding agency is granted a royalty-free license to use any technology developed during the course of the program for its own purposes, but not any preexisting technology that we use in connection with the program. We retain all other rights to use, develop, and commercialize the technology and recognize revenue when it is earned pursuant to the terms of the contract. Agreements with nongovernmental entities generally allow the entity the first opportunity to license the technology from us upon completion of the project.
The Company’s revenues also include royalties from licensing its technology, revenue from the sale of products, and other miscellaneous revenues. Many of the company’s projects may involve a combination of these types of revenues. Revenues are recognized as follows:
Government Contracts - Revenue from government contracts is recognized when it is earned pursuant to the terms of the contract. Long-term projects, such as SBIR Phase II grants that usually range from $500,000 to $1,000,000 in total and usually extend for a period of approximately two years, are generally based on reimbursement of costs. These projects are usually billed monthly based on costs, hours, or some other measure of activity during the month. As a general rule, we recognize revenue on these contracts based on the activity level of the contract during the period as compared with total estimated activity. This generally would be a measure of proportional performance on the contract, such as cost incurred compared with total expected cost. The recognition of revenue may not correspond with the billings allowable under the contract. To the extent that billings exceed revenue earned, a portion of the revenue is deferred until such time as it is earned. Short-term projects, such as SBIR Phase I grants that usually are less than $100,000 and usually extend for a period of approximately 6 months, are billed at periodic intervals as specified in the contract.
Other Research Contracts - Revenue from nongovernmental contracts is recognized when it is earned pursuant to the terms of the contract. Each contract is unique and tailored to the needs of the customer and goals of the project. Some contracts may call for a monthly payment for a fixed period of time. Other contracts may be for a fixed dollar amount with an unspecified time period, although there is frequently a targeted completion date. These contracts generally involve some sort of up-front payment. Some contracts may call for the delivery of samples, or may call for the transfer of equipment or other items developed during the project to the customer. As a general rule, we recognize revenue on long term contracts based on the activity level of the contract during the period as compared with total estimated activity. This generally would be a measure of proportional performance on the contract, such as cost incurred compared with total expected cost. However, to the extent there are other significant contract provisions such as the delivery of more than a nominal amount of samples or delivery of equipment, we would modify this as appropriate. For other short term contracts, generally less than $50,000, we recognize revenue when it is billed under the terms of the contract.
Page 35
APPLIED NANOTECH HOLDINGS, INC. AND SUBSIDIARIES
NOTES TO CONSOLIDATED FINANCIAL STATEMENTS (CONTINUED)
|
2.
|
Summary of Significant Accounting Policies (continued):
|
Royalty Revenue - The Company recognizes royalty revenues based on the shipment of products by a licensee at the time the underlying product upon which the royalty is based is shipped by the entity paying the royalty, if that is able to ascertained at the time. For minimum royalty payments paid by a licensee that are required for the licensee to maintain exclusivity, royalty revenue is recognized at the time the minimum royalty payment, is due, which normally corresponds somewhat with the time that the payment is received. The Company recognizes license fees due at the time of the signing of a royalty agreement when the licensee has an enforceable commitment to pay. This normally corresponds with, or is reasonably close to, the time of receipt of the payment.
Product Sales - Revenue from product sales is recognized at the time the product shipped. The Company’s primary business is research and development and the licensing of its technology, not the sale of products. Product sales are generally insignificant in number, and are usually limited to the sale of samples, proofs of concepts, prototypes, or other items resulting from its research.
Other Revenue - Other miscellaneous revenue is recognized as deemed appropriate given the facts of the situation and is generally not material.
Cash and cash equivalents
The Company considers all highly liquid investments purchased with an original maturity of three months or less to be cash equivalents.
Accounts receivable
The Company occasionally provides services or sells products to others on credit; however most services or sales are to large financially stable companies, or the U.S. Federal government. It is the Company’s policy to record reserves for potential credit losses. Since inception, the Company has experienced minimal credit losses. The Company considered no reserves to be necessary for any of the years presented.
Property and equipment
Property and equipment are recorded at cost, net of accumulated depreciation and amortization. Depreciation is provided on the straight-line method over the estimated useful lives of the assets, which range from three to seven years, or the remaining lease term for leasehold improvements, if less. Expenses for major renewals and betterments that extend the original estimated economic useful lives of the applicable assets are capitalized. Expenses for normal repairs and maintenance are charged to operations as incurred. The cost and related accumulated depreciation of assets sold or otherwise disposed of are removed from the accounts, and any gain or loss is included in income.
Impairment
At each balance sheet date, the Company evaluates the carrying amount and the amortization period for its long-lived assets. If an indicator of impairment exists, it is recorded at that time. There were no impairment charges recorded in any of the years presented in these financial statements.
Income taxes
The Company accounts for income taxes using the asset and liability method. Under this method, deferred income taxes are recorded to reflect the tax consequences on future years of temporary differences between the tax basis of the assets and liabilities and their financial amounts at year-end. The Company provides a valuation allowance to reduce deferred tax assets to their net realizable value. The Company has determined that no reserve for uncertain tax positions is required; however tax years 2007 through 2010 remain open for examination by the U.S. Internal Revenue Service.
Research and development expenses
Costs of research and development for Company-sponsored projects are expensed as incurred.
Page 36
APPLIED NANOTECH HOLDINGS, INC. AND SUBSIDIARIES
NOTES TO CONSOLIDATED FINANCIAL STATEMENTS (CONTINUED)
|
2.
|
Summary of Significant Accounting Policies (continued):
|
Disclosures about fair value of financial instruments
The following methods and assumptions were used to estimate the fair value of each class of certain financial instruments for which it is practicable to estimate that fair value. For cash equivalents and accounts receivable, the carrying amount approximates fair value because of the short-term nature of these instruments. The fair value of the Company’s capital lease obligations and notes payable is estimated based on the quoted market prices for the same, or similar issues, or on the current rates offered to the Company for obligations of the same remaining maturities with similar collateral requirements. For all years presented, the fair value of the Company’s capital lease obligations and notes payable approximate their carrying values.
Income (loss) per common share
Basic per share amounts are computed, generally, by dividing net income or loss by the weighted average number of common shares outstanding. Diluted per-share amounts assume the conversion, exercise, or issuance of all potential common stock instruments unless the effect is anti-dilutive, thereby reducing the loss or increasing the income per common share. As described in Notes 8, 9 and 10, the Company had options and warrants outstanding as indicated in the table below. In addition, the Company has convertible notes payable, which if converted, would have resulted in additional shares outstanding as indicated in the table below.
However, because of the interest expense associated with the notes payable, inclusion of the notes payable in the calculation of diluted earnings per share would have an anti-dilutive effect. In addition, since the Company incurred losses in 2008 and 2009, the inclusion of any potential common shares in the calculation of diluted loss per-share would have an anti-dilutive effect in those years. A small portion of the options outstanding have a dilutive effect and are included in the calculation of dilutive earnings per share. Because this effect is insignificant, basic and diluted per-share amounts are the same in all years presented.
|
2010
|
2009
|
2008
|
||||||||||
|
Options
|
6,222,972 | 4,430,392 | 7,889,897 | |||||||||
|
Warrants
|
1,304,353 | 1,304,353 | 1,304,353 | |||||||||
|
Weighted average exercise price
|
$ | 1.10 | $ | 1.60 | $ | 1.52 | ||||||
|
Convertible Notes Payable
|
10,180,301 | 1,004,495 | — | |||||||||
Recently issued accounting pronouncements
There are no recently issued accounting pronouncements which have not been implemented in our financial statements that would have a material impact on our financial statements.
Page 37
APPLIED NANOTECH HOLDINGS, INC. AND SUBSIDIARIES
NOTES TO CONSOLIDATED FINANCIAL STATEMENTS (CONTINUED)
|
2.
|
Summary of Significant Accounting Policies (continued):
|
Share-based payments
The Company has three stock based compensation plans described in greater detail in Note 9 to these financial statements. The Company uses the fair value method to account for stock-based compensation. The fair value of each award is estimated on the date of each grant. For restricted stock the fair market value is based on the market value of the stock granted on the date of the grant. For options, it is estimated using the Black Scholes option pricing model that uses the assumptions noted in the following table. Estimated volatilities are based on the historical volatility of the Company’s stock over the same period as the expected term of the options. The expected term of options granted represents the period of time that options granted are expected to be outstanding. The Company uses historical data to estimate option exercise behavior and to determine this term. The risk free rate used is based on the U.S. Treasury yield curve in effect at the time of the grant using a time period equal to the expected option term. The Company has never paid dividends and does not expect to pay any dividends in the future.
|
2010
|
2009
|
2008
|
||||
|
Expected dividend yield
|
0%
|
0%
|
0%
|
|||
|
Risk Free Interest Rate
|
.57%-1.40%
|
.37%-1.76%
|
1.1%- 3.3%
|
|||
|
Expected option term (in years)
|
3.5
|
2.0 - 3.5
|
0.75 - 3.5
|
|||
|
Turnover/Forfeiture Rate
|
0%
|
0%
|
0%
|
|||
|
Expected volatility
|
98% - 102%
|
95% - 100%
|
75% - 89%
|
|||
|
Weighted-average volatility
|
100%
|
98%
|
82%
|
The Black-Scholes option valuation model and other existing models were developed for use in estimating the fair value of traded options that have no vesting restrictions and are fully transferable. These option valuation models require the input of, and are highly sensitive to, subjective assumptions including the expected stock price volatility. Applied Nanotech Holdings’ stock options have characteristics significantly different from those of traded options, and changes in the subjective input assumptions could materially affect the fair value estimate.
|
3.
|
Operating Lease Obligations:
|
The Company leases various facilities and equipment under operating lease agreements having terms expiring at various dates through 2014. Rental expense was $190,697; $194,649; and $221,787 for the years ended December 31, 2010, 2009, and 2008, respectively.
Future minimum lease payments under operating leases that have initial or remaining noncancelable lease terms in excess of one year at December 31, 2010, were as follows:
|
2011
|
$ | 251,077 | ||
|
2012
|
259,145 | |||
|
2013
|
264,637 | |||
|
2014
|
45,297 | |||
|
Total future minimum lease payments
|
$ | 820,156 |
Page 38
APPLIED NANOTECH HOLDINGS, INC. AND SUBSIDIARIES
NOTES TO CONSOLIDATED FINANCIAL STATEMENTS (CONTINUED)
|
4.
|
Convertible Notes Payable:
|
Notes payable at December 31, 2010 consisted of notes payable to shareholders. The notes are 30 month unsecured notes, bearing interest at 8%, and due in lump sums from June to October 2012, if not converted earlier. These notes, including any accrued interest, are convertible into shares of common stock at the option of the note holder at rates ranging from $0.20 to $0.25 per share. The original face amount of the notes was $2,146,000, however the conversion rights were valued at $647,250 and recorded as a discount to the note at the time of issuance. $834 of that discount was amortized to interest expense as of December 31, 2009, and $271,821 of the discount was amortized to expense as of December 31, 2010. A total of $200,000 of these notes were converted to common stock in 2010. The face amount of the remaining notes outstanding is $1,946,000. Three notes with a total face value of $500,000 are secured by a blanket security interest in all assets of the company. All of the outstanding notes are expected to be converted to common stock.
|
5.
|
Capital Lease Obligations:
|
Capital leases payable at December 31, 2010 and 2009 consisted of the following:
|
|
2010
|
2009
|
||||||
|
Capital lease equipment due in monthly installments of $816 through July 2013. The equipment value and lease obligation was determined using a discount rate of 14.08%. The equipment is included in plant and equipment at December 31, 2010 at a cost of $42,040 and with accumulated amortization of $20,319.
|
$ | 25,297 | $ | 35,072 | ||||
|
Capital lease equipment due in monthly installments of $1,492 through July 2011. The equipment value and lease obligation was determined using a discount rate of 12.27%. The equipment is included in plant and equipment at December 31, 2010 at a cost of $47,120, with accumulated amortization of $9,584.
|
10,445 | 28,345 | ||||||
|
Total capital leases
|
35,742 | 63,417 | ||||||
|
Less interest
|
4,606 | 10,354 | ||||||
|
Less current portion
|
17,317 | 21,939 | ||||||
|
Capital lease obligations, long-term
|
$ | 13,819 | $ | 31,124 | ||||
These leases result in minimum payments of $20,237; $9,793; and $5,712, respectively, from 2011 to 2013.
Page 39
APPLIED NANOTECH HOLDINGS, INC. AND SUBSIDIARIES
NOTES TO CONSOLIDATED FINANCIAL STATEMENTS (CONTINUED)
|
6.
|
Details of Certain Balance Sheet Accounts:
|
Additional information regarding certain balance sheet accounts at December 31, 2010 and 2009 is as follows:
|
|
December 31,
|
|||||||
|
2010
|
2009
|
|||||||
|
Property and equipment:
|
||||||||
|
Plant and equipment
|
$ | 1,088,216 | $ | 1,088,216 | ||||
|
Furniture and office equipment
|
156,096 | 144,460 | ||||||
|
Leasehold improvements
|
19,019 | 19,019 | ||||||
|
Total carrying cost
|
1,263,331 | 1,251,695 | ||||||
|
Less accumulated depreciation
|
(1,048,042 | ) | (984,687 | ) | ||||
|
|
$ | 215,289 | $ | 267,008 | ||||
|
Accrued liabilities:
|
||||||||
|
Payroll and related accruals
|
$ | 406,475 | $ | 458,629 | ||||
|
Other
|
160,148 | 24,000 | ||||||
|
Total
|
$ | 566,623 | $ | 482,629 | ||||
Depreciation and amortization for the years ended December 31, 2010, 2009, and 2008 was $63,356; $64,353; and $70,536, respectively. Equipment held under capital leases and accumulated amortization on that equipment is included in these totals.
|
7.
|
Income Taxes:
|
The components of deferred tax assets (liabilities) at December 31, 2010 and 2009, were as follows:
|
December 31,
|
||||||||
|
2010
|
2009
|
|||||||
|
Deferred tax assets:
|
||||||||
|
Net operating loss carry forwards
|
$ | 26,076,000 | $ | 30,435,000 | ||||
|
Stock based compensation
|
2,015,000 | 1,939,000 | ||||||
|
Research and experimentation credits
|
61,000 | 125,000 | ||||||
|
Partnership asset
|
39,000 | 39,000 | ||||||
|
Capitalized intangible assets
|
27,000 | 37,000 | ||||||
|
Foreign tax credit
|
619,000 | 1,000 | ||||||
|
Accrued expenses not deductible until paid
|
110,000 | 155,000 | ||||||
|
Total deferred tax assets
|
28,947,000 | 32,731,000 | ||||||
|
Deferred tax liabilities:
|
||||||||
|
Depreciation
|
(1,000 | ) | — | |||||
|
Net deferred tax assets before valuation allowance
|
28,946,000 | 32,731,000 | ||||||
|
Valuation allowance
|
(28,946,000 | ) | (32,731,000 | ) | ||||
|
Net deferred tax asset
|
||||||||
| $ | — | $ | — | |||||
Page 40
APPLIED NANOTECH HOLDINGS, INC. AND SUBSIDIARIES
NOTES TO CONSOLIDATED FINANCIAL STATEMENTS (CONTINUED)
|
7.
|
Income Taxes (continued):
|
The following is a reconciliation of the amount of the income tax expense (benefit) that would result from applying the statutory federal income tax rates to pretax income (loss) and the reported amount of income tax expense (benefit) for the periods ended December 31, 2010, 2009, and 2008.
|
|
December 31,
|
|||||||||||
|
2010
|
2009
|
2008
|
||||||||||
|
Expected income tax expense (benefit)
|
$ | 350,000 | $ | (732,000 | ) | $ | (914,000 | ) | ||||
|
Non-deductible expenses
|
15,000 | 11,000 | 3,000 | |||||||||
|
Expiration of tax credit carryforwards
|
64,000 | 145,000 | 190,000 | |||||||||
|
Expiration of NOL carryforwards
|
3,975,000 | 2,490,000 | 2,373,000 | |||||||||
|
Foreign tax credit
|
(619,000 | ) | — | — | ||||||||
|
Foreign taxes paid
|
618,750 | — | — | |||||||||
|
Increase (decrease) in valuation allowance
|
(3,785,000 | ) | (1,914,000 | ) | (1,652,000 | ) | ||||||
|
Total tax
|
$ | 618,750 | $ | — | $ | — | ||||||
As of December 31, 2010, the Company had net operating loss carry forwards of approximately $83 million that expire from 2011 through 2029, that are available to offset future taxable income. The majority of these carry forwards expire after 2011. Additionally, the Company has tax credit carry forwards related to research and development expenditures of approximately $61,000 that expire in 2011 and foreign taxes of $619,000 that expires in 2019.
Under certain circumstances issuance of common shares can result in ownership change under Internal Revenue Code Section 382 which limits the Company’s ability to utilize carry forwards from prior to the ownership change. Any such ownership change resulting from stock issuances could limit the Company’s ability to utilize any net operating loss carry forwards or credits generated before this change in ownership. These limitations tend to relate to the timing of usage, rather than the loss of the ability to use these net operating losses.
The foreign taxes paid in 2010 represent Korean taxes associated with the patent sale/license transaction described in greater detail in Note 18 to these financial statements.
|
8.
|
Capital Stock:
|
Preferred stock
The Company has authorization for the issuance of 2,000,000 shares of $1.00 par value preferred stock. There were no shares of preferred stock outstanding for any of the years presented.
Common stock
At its 2010 shareholders meeting, the shareholders of the Company voted to increase the authorized common shares of the Company from 120,000,000 shares to 160,000,000 shares.
No shares were issued in private placements in 2009 or 2008; however, during 2010, the Company issued shares of its common stock in a private placement in an exempt offering under Regulation D of the Securities Act of 1933. These shares were issued at a price that represented a slight discount to the market price of the stock at the time of the offering. All of these shares were registered to enable the shareholder to be able to sell the shares, with the latest registration statement declared effective November 22, 2010. A total of 1,000,000 shares were issued and proceeds of $200,000 were received.
Page 41
APPLIED NANOTECH HOLDINGS, INC. AND SUBSIDIARIES
NOTES TO CONSOLIDATED FINANCIAL STATEMENTS (CONTINUED)
|
8.
|
Capital Stock (continued):
|
Committed to be released common shares
As discussed in Note 9, the Company awards restricted stock to employees as compensation. Shares awarded, but not yet issued and outstanding are accounted for as committed to be released shares.
At December 31, 2010, common stock was reserved for the following reasons:
|
Exercise of stock warrants
|
1,304,353 | |||
|
Conversion of notes payable and accrued interest
|
10,180,301 | |||
|
Committed to be released common shares
|
306,119 | |||
|
Exercise and future grants of stock options
|
8,679,196 | |||
|
Total shares reserved
|
20,469,969 |
|
9.
|
Stock Options:
|
The Company sponsors three stock-based incentive compensation plans (the “Plans”), which are described below. The compensation cost that has been charged against income for these plans for the years ended December 31, 2010, 2009, and 2008 was $353,292; $188,481; and $654,001, respectively. No income tax benefit was recognized in the income statement and no compensation was capitalized in any of the years presented.
The plans allow the Company to grant incentive stock options, non-qualified stock options, or restricted stock. The incentive stock options are exercisable for up to ten years, at an option price per share not less than the fair market value on the date the option is granted. The incentive stock options are limited to persons who have been regular full-time employees of the Company or its present and future subsidiaries for more than one (1) year and at the date of the grant of any option are in the employ of the Company or its present and future subsidiaries. Historically, the Company has not granted incentive stock options. Non-qualified options may be granted to any person, including, but not limited to, employees, independent agents, consultants and attorneys, who the Company’s Compensation Committee believes have contributed, or will contribute, to the success of the Company. Non-qualified options may be issued at option prices of less than fair market value on the date of grant and are exercisable for up to ten years from date of grant. The option vesting schedule for options granted is determined by the Compensation Committee of the Board of Directors at the time of the grant. The Plans provide for accelerated vesting of unvested options if there is a change in control, as defined in the plan.
In 1992, the Company adopted the 1992 Employees Stock Option Plan (the “Employees Plan”) and the 1992 Outside Directors’ Stock Option Plan (the “Directors Plan”), for purposes of granting incentive or non-qualified stock options. These plans were amended several times by the Company’s Board of Directors to ultimately increase the number of shares authorized under the plans to 6,500,000 for the Employees plan and 1,000,000 for the Directors Plan. Both of these plans expired in 2002; however, options granted under these plans prior to expiration remain outstanding until they are exercised, forfeited, or the exercise period expires. At December 31, 2010, no shares remained available for grant under either of these plans.
In September 2002, the Board of Directors of the Company established the 2002 Equity Compensation Plan to replace the Employees Plan and the Directors Plan, both of which expired in 2002, and reserved a total of 5,000,000 shares for issuance under the Plan. The plan was amended effective December 31, 2004 to increase the authorized shares to 8,000,000, and again effective December 12, 2007 to increase the authorized shares to 10,000,000. A total of 2,456,224 shares remain available for grant under this at December 31, 2010.
Page 42
APPLIED NANOTECH HOLDINGS, INC. AND SUBSIDIARIES
NOTES TO CONSOLIDATED FINANCIAL STATEMENTS (CONTINUED)
|
9.
|
Stock Options (continued):
|
The company issues new shares for all options exercised. It does not expect to repurchase any shares to facilitate future option exercises. The following table summarizes information about stock options outstanding, some of which are not expected to ultimately vest, and options currently exercisable under all three stock option plans at December 31, 2010:
|
Options Outstanding
|
Options Exercisable
|
|||||
|
Range of
Exercise Prices
|
Number
Outstanding
at 12/31/10
|
Wgtd. Avg.
Remaining
Contractual
Life
|
Wgtd. Avg.
Exercise Price
|
Number
Exercisable
at 12/31/10
|
Wgtd. Avg.
Remaining
Contractual
Life
|
Wgtd. Avg.
Exercise Price
|
|
|
||||||
|
$0.00 - $0.50
|
3,921,356
|
8.7 Years
|
$0.34
|
2,330,733
|
8.0Years
|
$0.30
|
|
$0.51 - $1.00
|
559,750
|
1.2 Years
|
$0.84
|
559,750
|
1.2 Years
|
$0.84
|
|
$1.01 - $2.00
|
621,825
|
5.9 Years
|
$1.30
|
621,825
|
5.9 Years
|
$1.30
|
|
$2.01 - $3.00
|
1,120,041
|
3.7 Years
|
$2.42
|
1,120,041
|
3.7 Years
|
$2.42
|
|
|
|
|||||
|
Total
|
6,222,972
|
6.9 Years
|
$0.86
|
4,632,349
|
5.9 Years
|
$1.01
|
|
Aggregate intrinsic value
|
$217,934
|
$203,091
|
||||
The following is a summary of stock option activity under all of the plans:
|
Number of
Shares
|
Wgtd. Ave.
Exercise
Price
|
||
|
Options outstanding at December 31, 2007
|
6,897,180
|
$1.52
|
|
|
Granted
|
1,623,129
|
$0.57
|
|
|
Exercised
|
(170,000)
|
$0.36
|
|
|
Cancelled
|
(460,412)
|
$1.25
|
|
|
Options outstanding at December 31, 2008
|
7,889,897
|
$1.36
|
|
|
Granted
|
658,065
|
$0.45
|
|
|
Exercised
|
—
|
—
|
|
|
Cancelled
|
(4,117,570)
|
$1.31
|
|
|
Options outstanding at December 31, 2009
|
4,430,392
|
$1.28
|
|
|
Granted
|
2,803,538
|
$0.37
|
|
|
Exercised
|
(18,200)
|
$0.24
|
|
|
Cancelled
|
(992,758)
|
$1.35
|
|
|
Options outstanding at December 31, 2010
|
6,222,972
|
$0.86
|
Page 43
APPLIED NANOTECH HOLDINGS, INC. AND SUBSIDIARIES
NOTES TO CONSOLIDATED FINANCIAL STATEMENTS (CONTINUED)
|
9.
|
Stock Options (continued):
|
The weighted-average grant-date fair value of options granted during the years ended December 31, 2010, 2009, and 2008 was $0.24, $0.13, and $0.28, respectively. The total intrinsic value of options exercised during the years ended December 31, 2010, and 2008 was $2,002, and $131,245 respectively. No options were exercised in the year ended December 31, 2009. As of December 31, 2010, there was a total of $421,304 of unrecognized compensation cost related to 1,590,623 non-vested options granted under the plan. These unvested options all vest based on the passage of time over a two year period. A total of $239,844 of this expense will be recognized in 2011 and the balance in 2012. The fair value of shares vested during the years ended December 31, 2010, 2009, and 2008 was $227,124; $160,505; and $605,393, respectively.
The 2002 Equity Compensation Plan also allows the issuance of restricted shares of common stock. We issued shares of restricted stock in connection with our compensation of outside Directors. We granted 59,167 shares and 45,000 shares of restricted stock to Directors in 2009 and 2008, respectively. The shares issued in 2008 vested quarterly over a one year time period starting with the date of the grant. All shares are now vested. The shares granted in 2009 were fully vested at the date of the grant are issued and outstanding at December 31, 2010. The shares granted in 2009 had a fair value of $15,383 and were granted at a price of $0.26. The shares granted in 2008 had a fair value of $45,000 and were granted at prices ranging from $0.91 to $1.15. We recognized expense in the financial statements of $27,976 and $48,609 in the years ended December 31, 2009 and 2008, respectively. The weighted average fair value of shares granted and vested during 2009 was $0.26. There were no shares unvested at December 31, 2009. The weighted average fair value of shares granted during 2008, vested during 2008, and unvested at December 31, 2008 was $1.00, $1.02, and $1.01, respectively. No restricted shares were granted to outside Directors in 2010
In 2010, we also granted restricted stock to non-officer employees as part of their compensation. We granted a total of 381,237 shares with a value of $126,168, which represents the market price at the date of grant. A total of 75,118 have been issued to employees and are included in issued and outstanding shares at December 31, 2010. The remaining 306,119 shares are classified as committed to be released shares at December 31, 2010.
In November 2009, we offered a voluntary option exchange program to all non-officer employees of the Company. Employees were able to exchange higher priced options for options with an exercise price of $0.30 share. Employees received a fraction of the number of shares exchanged in a ratio equal to $0.30 divided by the original exercise price of the options. A total of 889,917 options were exchanged for 222,768 shares with an exercise price of $0.30 per share. This resulted in a reduction of option expense of $25,664.
During 2008, we repriced the exercise price of 200,000 options held by the Company’s then CEO, from $1.19 per share to $0.75 per share in connection with a simultaneous reduction in his compensation. The expense associated with this repricing was $10,510 and was being recognized over the vesting term of the options. A total of $2,366 was recognized in 2008. An additional $2,366 in expense was recognized up until the time of his resignation in May 2009. The balance was associated with options that never vested and therefore will not be recognized.
The Company also adjusted the price of certain non-officer options issued in 2008. The Company has a performance based option program covering all non-officer employees. The options are granted early in the year and vest as of December 31, if certain goals are achieved. A total of 229,997 were granted under this program in 2008. The original exercise price of these options was to be $1.19 per share, however the exercise price was adjusted to be equal to the market price of the stock on the date of vesting, December 31, 2008. The effect of this adjustment in exercise price, which effectively amounts to a repricing, was an expense of $18,114, which was fully recorded in 2008.
Page 44
APPLIED NANOTECH HOLDINGS, INC. AND SUBSIDIARIES
NOTES TO CONSOLIDATED FINANCIAL STATEMENTS (CONTINUED)
|
10.
|
Stock Warrants:
|
Common stock warrants
In 2007, we issued 1,304,353 warrants in connection with a private placement of the Company’s stock. These warrants enable the holder to purchase shares of the Company’s common stock at a price of $2.50 per share through the earlier of April 2011, or the date that the shares acquired in the private placement are sold by the shareholder. It is unlikely any of these warrants will be exercised prior to the expiration date.
The following is a summary of outstanding warrants:
|
|
Number of
Shares
|
Exercise Price
|
|
|
|
|
||
|
Warrants outstanding at December 31, 2007
|
1,304,353
|
$2.50
|
|
|
Issued
|
—
|
—
|
|
|
Expired
|
—
|
—
|
|
|
Warrants outstanding at December 31, 2008
|
1,304,353
|
$2.50
|
|
|
Expired
|
—
|
—
|
|
|
Warrants outstanding at December 31, 2009
|
1,304,353
|
$2.50
|
|
|
Expired
|
—
|
—
|
|
|
Warrants outstanding at December 31, 2010
|
1,304,353
|
$2.50
|
|
11.
|
Supplemental Cash Flow Information:
|
Cash paid for interest was $5,764; $8,356; and $7,180 for 2010, 2009, and 2008, respectively. Cash paid for income taxes in 2010 was $618,750. No cash was paid for income taxes in either 2008 or 2009. The following non-cash transactions have been excluded from the accompanying consolidated statement of cash flows:
|
2010
|
2009
|
2008
|
||||||||||
|
Non-cash financing activities:
|
||||||||||||
|
Issuance of common shares in payment of accounts payable
|
$ | 90,000 | $ | — | $ | — | ||||||
|
Issuance of note payable in payment of accounts payable
|
$ | 340,000 | $ | — | $ | — | ||||||
|
Conversion of notes payable and accrued interest
|
$ | 209,704 | $ | — | $ | — | ||||||
|
Issuance of notes payable to Officers and Directors in payment of accrued expenses
|
$ | 216,000 | $ | — | $ | — | ||||||
|
Capital lease transactions
|
$ | — | $ | 31,607 | $ | 34,990 | ||||||
|
12.
|
Retirement Plan:
|
The Company sponsors a defined contribution 401(k) profit sharing plan. Company contributions are discretionary and no company contributions were made in any of the years presented.
Page 45
APPLIED NANOTECH HOLDINGS, INC. AND SUBSIDIARIES
NOTES TO CONSOLIDATED FINANCIAL STATEMENTS (CONTINUED)
|
13.
|
Commitments and Contingencies:
|
Till Keesmann Agreement
In May 2000, we licensed the rights, including the exclusive right to sublicense, to 6 carbon nanotube patents from Till Keesmann. The agreement was amended in 2008 and in May 2010, the sublicensing rights to the patent reverted to Mr. Keesmann. We will receive 50% of any licensing revenue received by Mr. Keesmann up to a maximum of $1.2 million of revenue to us.
In 2008, we also sold a portion of our potential future royalty stream related to the Keesmann patents to IP Verwertungs GmbH (“IPV”) for $1.4 million. A total of $1.226 million has been received and the remaining $174,000 will be offset against future royalties due IPV. IPV will receive 25% of our portion of the Keesmann royalties, if any are received. If we received the maximum potential amount of $1.2 million from Mr. Keesmann, we would be obligated to pay IPV $126,000.
Research and development commitments
As of December 31, 2010, the Company had several research contracts pending and in process. The total amount of those contracts is $8,838,468. Of that total, $5,477,015 has been recognized as revenue and $3,361,453 will be recognized in the future. The revenue to be recognized from these research contracts in 2011 is expected to exceed the cost of this research.
Government contracts
Governmental contractors are subject to many levels of audit and investigation. Among United States agencies that oversee contract performance are: the Defense Contract Audit Agency, the Inspector General, the Defense Criminal Investigative Service, the General Accounting Office, the Department of Commerce, the Department of Justice and Congressional Committees. The Company’s management believes that an audit or investigation, if any, as a result of such oversight would not have any material adverse effect upon the Company’s financial condition or results of operations.
Legal proceedings
On July 20, 1998, TFI Telemark, Inc. filed a complaint in the County Court at Law No. 2 of Travis County, Texas against the Company for debts of its now defunct subsidiary, Plasmatron. The Company was served with notice of this suit on August 5, 1998. The Company believes that no amounts are due to TFI; however, all amounts claimed as owing by TFI are recorded as liabilities in the consolidated financial statements of the Company. There has been no activity on this case in the last year. The Company believes the ultimate resolution of this matter will not have a material impact on the consolidated financial statements of the Company.
From time to time the Company and its subsidiaries are also defendants in various lawsuits that may arise related to minor matters. It is expected that all such lawsuits will be settled for an amount no greater than the liability recorded in the financial statements for such matters. If resolution of any of these suits results in a liability greater than that recorded, it could have a material impact on the Company.
|
14.
|
Research and Development Contracts:
|
The Company makes significant expenditures for research and development. We seek funding for our research and development costs to reduce the cost of such expenditures to the Company. We only seek funding for projects that fit within our strategic vision. A substantial portion of our funded research has been from government contracts. Under government contracts, the government has the right to utilize the results for its purposes and we have the right to utilize the technology for commercial purposes. Generally, when we contract with other entities, the entity is also conducting its own internal research related to application of our technology to its products and such expenditures by the entity frequently exceeds the amount of funding provided to the Company. Usually the entity has the first opportunity to license the technology at the conclusion of the project, if they desire. The costs of a particular research program may exceed the funding received, however since the goal of the research is to ultimately lead to a license, our willingness to share part of the development cost is evaluated on a case by case basis.
Page 46
APPLIED NANOTECH HOLDINGS, INC. AND SUBSIDIARIES
NOTES TO CONSOLIDATED FINANCIAL STATEMENTS (CONTINUED)
|
14.
|
Research and Development Contracts (continued):
|
The following schedule summarizes certain information with respect to research and development contracts:
|
2010
|
2009
|
2008
|
||||||||||
|
Contract research revenues
|
$ | 4,057,400 | $ | 3,461,226 | $ | 3,120,245 | ||||||
|
Direct costs incurred included in research and development expense
|
$ | 2,224,885 | $ | 1,595,216 | $ | 2,200,603 | ||||||
|
Amount of additional funding commitments at December 31
|
$ | 3,361,453 | $ | 2,937,796 | $ | 3,271,805 | ||||||
|
15.
|
Concentrations of Credit Risk:
|
The Company’s financial instruments that are exposed to concentrations of credit risk consist of cash and cash equivalents and receivables. The Company places its cash and cash equivalents with high credit quality financial institutions; however for periods of time during the year, bank balances on deposit were in excess of the Federal Deposit Insurance Corporation insurance limit. At December 31, 2010, the Company had $1,351,982 in excess of the FDIC insurance limit on deposit at JP Morgan Chase & Co. There were no funds in excess of the FDIC limit at December 31, 2009 and 2008. At December 31, 2010 and 2008, the Company held $720 and $103,603, respectively, in excess of the Securities Investor Protection Corporation limits in an account at Charles Schwab & Co. Inc.
The Company’s receivables are uncollateralized and result primarily from its research and development projects performed primarily for U.S. Federal Government Agencies and services performed for large U.S. and multinational corporations. The Company has not incurred any material losses on these receivables.
|
16.
|
Significant Customers:
|
Applied Nanotech, Inc. received research and development revenues from the U.S. Government in the three years as disclosed on the income statement. In addition to the U.S. Government, the Company had three customers from which it has received in excess of 10% of its consolidated revenues in one or more of the past three years as set forth in the following table.
|
Year ended December 31
|
||||||||||||
|
Customer
|
2010
|
2009
|
2008
|
|||||||||
|
Ishihara Chemical Company, Ltd.
|
1,265,370 | 1,675,000 | 633,250 | |||||||||
|
Yonex Co., Ltd.
|
520,630 | 180,000 | 663,108 | |||||||||
|
Samsung Electronics Co., Ltd.
|
2,500,000 | — | — | |||||||||
|
17.
|
Related Party Transactions:
|
We raised money in 2010 through the use of convertible notes payable. A portion of those notes were issued to Officers and Directors of the company. A total of $2,146,000 was raised from December 2009 through March 2010. Of this amount, $216,000 was from Officers and Directors of the Company. The $1,930,000 raised from outsiders, all of whom are believed to be shareholders, is convertible to common stock at a rate of $0.20 per share, a discount to the market price of the common stock at the time. The $216,000 payable to Officers and Directors is convertible to common stock at a price of $0.25 per share, the market price of the stock at the time. No discount to market was allowed for Officers and Directors.
Page 47
APPLIED NANOTECH HOLDINGS, INC. AND SUBSIDIARIES
NOTES TO CONSOLIDATED FINANCIAL STATEMENTS (CONTINUED)
|
18.
|
Quarterly Financial Information (Unaudited):
|
|
First
|
Second
|
Third
|
Fourth
|
Total
|
||||||||||||||||
|
Quarter
|
Quarter
|
Quarter
|
Quarter
|
Year
|
||||||||||||||||
|
2010
|
||||||||||||||||||||
|
Revenues
|
$ | 1,009,636 | $ | 1,865,939 | $ | 949,233 | $ | 4,218,987 | $ | 8,043,795 | ||||||||||
|
Operating income (loss)
|
(520,811 | ) | 525,949 | (939,541 | ) | 1,839,564 | 1,445,020 | |||||||||||||
|
Net income (loss)
|
(569,940 | ) | 418,786 | (1,053,997 | ) | 1,616,455 | 411,304 | |||||||||||||
|
Earnings (loss) per share
|
||||||||||||||||||||
|
Basic and Diluted
|
(0.01 | ) | 0.00 | (0.01 | ) | 0.01 | 0.00 | |||||||||||||
|
2009
|
||||||||||||||||||||
|
Revenues
|
$ | 824,525 | $ | 922,097 | $ | 1,506,673 | $ | 799,451 | $ | 4,052,746 | ||||||||||
|
Operating income (loss)
|
(831,466 | ) | (652,735 | ) | (2,750 | ) | (657,442 | ) | (2,144,393 | ) | ||||||||||
|
Net (loss)
|
(833,114 | ) | (654,027 | ) | (4,435 | ) | (661,029 | ) | (2,152,605 | ) | ||||||||||
|
Earnings (loss) per share
|
||||||||||||||||||||
|
Basic and Diluted
|
(0.01 | ) | (0.01 | ) | (0.00 | ) | (0.01 | ) | (0.02 | ) | ||||||||||
|
2008
|
||||||||||||||||||||
|
Revenues
|
$ | 870,014 | $ | 853,234 | $ | 891,853 | $ | 1,342,731 | $ | 3,957,832 | ||||||||||
|
Operating income (loss)
|
(1,267,391 | ) | (1,357,688 | ) | (79,386 | ) | (520,715 | ) | (3,225,180 | ) | ||||||||||
|
Net (loss)
|
(747,579 | ) | (1,345,041 | ) | (74,577 | ) | (518,670 | ) | (2,685,867 | ) | ||||||||||
|
Earnings (loss) per share
|
||||||||||||||||||||
|
Basic and Diluted
|
(0.01 | ) | (0.01 | ) | (0.00 | ) | (0.01 | ) | (0.03 | ) | ||||||||||
Annual Earnings (loss) per share may not equal the sum of the four quarterly amounts due to rounding.
|
19.
|
Gain on Sale of Intellectual Property and Other Assets:
|
In 2010, we entered into a transaction with Samsung Electronics Co., Ltd whereby we sold 29 patents (11 U.S. and 18 foreign counterparts) and licensed approximately 150 additional patents in exchange for a payment of $3.75 million. The proceeds of $3.75 million were allocated between the patents sold and the patents licensed. A total of $2.5 million was allocated to the license and recorded as license revenue. A total of $1.25 million was allocated to the patents sold. The gain of $1,019,531 represents the sale proceeds of $1.25 million reduced by a prorata share of the expenses associated with the transaction.
In 2008, we had a gain of $100,000 from the sale of patents which did not relate to any of our current active technology platforms. We had an additional gain of $1,225,999 from the sale of a portion of our interest in any future royalties received from sublicensing the Keesmann patents as described in more detail in Note 13.
|
20.
|
Subsequent events:
|
From January 1, 2011 through February 28, 2011, we issued 157,895 shares of common stock to our patent attorney in payment of an accounts payable of $60,000 and we received proceeds of $19,791 and issued 80,537 shares of common stock in connection with the exercise of options by former employees. We also issued 14,000 of the committed to be released shares. In addition, we signed a subscription agreement to issue 6,578,947 of common stock in exchange for $2.5 million to be received in March 2011.
Page 48
Item 9. Changes in and Disagreements with Accountants on Accounting and Financial Disclosure.
None
Item 9A(T). Controls and Procedures.
Management is responsible for establishing and maintaining effective disclosure controls and procedures, as defined under Rule 13a-15 of the Securities Exchange Act of 1934, that are designed to cause the material information required to be disclosed by Applied Nanotech Holdings in the reports it files or submits under the Securities Exchange Act of 1934 to be recorded, processed, summarized, and reported to the extent applicable within the time periods required by the Securities and Exchange Commission’s rules and forms. In designing and evaluating the disclosure controls and procedures, management recognized that a control system, no matter how well designed and operated, can provide only reasonable, not absolute, assurance that the objectives of the control system are met. Because of the inherent limitations in all control systems, no evaluation of controls can provide absolute assurance that all control issues and instances of fraud, if any, with a company have been detected.
As of the end of the period covered by this report, Applied Nanotech Holdings performed an evaluation under the supervision and with the participation of management, including the Chief Executive Officer and Chief Financial Officer, of the effectiveness of the design and operation of its disclosure controls and procedures pursuant to Rule 13a-15 of the Securities Exchange Act of 1934. Based upon that evaluation, the Chief Executive Officer and Chief Financial Officer concluded that the disclosure controls and procedures were effective at the reasonable assurance level.
Report on Management’s Assessment of Internal Control over Financial Reporting
The management of Applied Nanotech Holdings, Inc. is responsible for establishing and maintaining adequate internal control over financial reporting. Internal control over financial reporting is defined under applicable Securities and Exchange Commission rules as a process designed under the supervision of the Company’s Chief Executive Officer and Chief Financial Officer and effected by the Company’s Board of Directors, management and other personnel to provide reasonable assurance regarding the reliability of financial reporting and the preparation of the Company’s financial statements for external purposes in accordance with U.S. generally accepted accounting principles. The Company’s internal control over financial reporting includes those policies and procedures that:
|
●
|
Pertain to the maintenance of records that, in reasonable detail, accurately and fairly reflect the transactions and dispositions of the assets of the Company;
|
|
●
|
Provide reasonable assurance that transactions are recorded as necessary to permit preparation of financial statements in accordance with U.S. generally accepted accounting principles, and that receipts and expenditures of the Company are being made only in accordance with authorizations of management and the directors of the Company; and
|
|
●
|
Provide reasonable assurance regarding prevention or timely detection of unauthorized acquisition, use or disposition of the Company’s assets that could have a material effect on the financial statements.
|
Because of its inherent limitations, internal control over financial reporting may not prevent or detect misstatements. Also, projections of any evaluation of effectiveness to future periods are subject to the risk that controls may become inadequate because of changes in conditions, or that the degree of compliance with the policies or procedures may deteriorate.
As of December 31, 2010, management, with the participation of the Company’s Chief Executive Officer and Chief Financial Officer, assessed the effectiveness of the Company’s internal control over financial reporting based on the criteria for effective internal control over financial reporting established in “Internal Control — Integrated Framework,” issued by the Committee of Sponsoring Organizations (COSO) of the Treadway Commission. Based on the assessment, management determined that the Company’s internal control over financial reporting was effective as of December 31, 2010. Our independent auditors, Padgett Stratemann & Co., LLC have issued an attestation report, which is included below, on our internal control.
Page 49
Changes in Internal Control over Financial Reporting
No changes were made to the Company’s internal control over financial reporting (as defined in Rule 13a-15 under the Securities Exchange Act of 1934) during the last fiscal quarter that materially affected, or are reasonably likely to materially affect, the Company’s internal control over financial reporting.
Report of Independent Registered Public Accounting Firm
To the Board of Directors and Stockholders of Applied Nanotech Holdings, Inc.:
We have audited the internal control over financial reporting of Applied Nanotech Holdings, Inc. (the Company) as of December 31, 2010, based on criteria established in Internal Control—Integrated Framework issued by the Committee of Sponsoring Organizations of the Treadway Commission (COSO). The Company’s management is responsible for maintaining effective internal control over financial reporting and for its assessment of the effectiveness of internal control over financial reporting included in the accompanying Report on Management’s Assessment of Internal Control over Financial Reporting. Our responsibility is to express an opinion on the Company's internal control over financial reporting based on our audit.
We conducted our audit in accordance with the standards of the Public Company Accounting Oversight Board (United States). Those standards require that we plan and perform the audit to obtain reasonable assurance about whether effective internal control over financial reporting was maintained in all material respects. Our audit included obtaining an understanding of internal control over financial reporting, assessing the risk that a material weakness exists, and testing and evaluating the design and operating effectiveness of internal control based on the assessed risk. Our audit also included performing such other procedures as we considered necessary in the circumstances. We believe that our audit provides a reasonable basis for our opinion.
A company's internal control over financial reporting is a process designed to provide reasonable assurance regarding the reliability of financial reporting and the preparation of financial statements for external purposes in accordance with generally accepted accounting principles. A company's internal control over financial reporting includes those policies and procedures that (1) pertain to the maintenance of records that, in reasonable detail, accurately and fairly reflect the transactions and dispositions of the assets of the company; (2) provide reasonable assurance that transactions are recorded as necessary to permit preparation of financial statements in accordance with generally accepted accounting principles, and that receipts and expenditures of the company are being made only in accordance with authorizations of management and directors of the company; and (3) provide reasonable assurance regarding prevention or timely detection of unauthorized acquisition, use, or disposition of the company's assets that could have a material effect on the financial statements.
Because of its inherent limitations, internal control over financial reporting may not prevent or detect misstatements. Also, projections of any evaluation of effectiveness to future periods are subject to the risk that controls may become inadequate because of changes in conditions, or that the degree of compliance with the policies or procedures may deteriorate.
In our opinion, Applied Nanotech Holdings, Inc. maintained, in all material respects, effective internal control over financial reporting as of December 31, 2010, based on criteria established in Internal Control—Integrated Framework issued by the Committee of Sponsoring Organizations of the Treadway Commission (COSO).
We have also audited, in accordance with the standards of the Public Company Accounting Oversight Board (United States), the consolidated balance sheets and the related consolidated statements of operations, shareholders equity and cash flows of Applied Nanotech Holdings, Inc and our report dated February 24, 2011 expressed an unqualified opinion with an explanatory paragraph about the Company’s ability to continue as a going concern.
Padgett, Stratemann & Co., L.L.P.
San Antonio, TX
February 24, 2011
Page 50
Item 9B. Other Information.
None
Page 51
PART III
Item 10. Directors, Executive Officers and Corporate Governance
The following sets forth the names, ages and certain information concerning the Directors and Executive Officers of Applied Nanotech Holdings.
|
Name
|
Age
|
Position
|
Director/Officer Since
|
Term Expires
|
|
|
|
|
|
|
|
Dr. Zvi Yaniv
|
64
|
Director, President,
Chief Operating Officer
|
July 1996
|
2011
|
|
Douglas P. Baker
|
54
|
Director, Chief Executive
Officer, Chief Financial Officer
|
June 1996
|
2011
|
|
Ronald J. Berman
|
54
|
Director
|
May 1996
|
2011
|
|
Dr. Robert Ronstadt
|
69
|
Director, Chairman
|
January 2003
|
2011
|
|
Howard Westerman
|
58
|
Director
|
May 2007
|
2011
|
|
Tracy K. Bramlett
|
55
|
Director
|
September 2007
|
2011
|
|
Paul F. Rocheleau
|
57
|
Director, Vice Chairman
|
May 2009
|
2011
|
|
Clinton J. Everton
|
37
|
Director
|
October 2008
|
2011
|
|
Dr. Richard Fink
|
51
|
Vice President
|
January 2008
|
N/A
|
______________
Dr. Zvi Yaniv has served as the Company’s President and Chief Operating Officer and a Director since July 1996. Dr. Yaniv has degrees in physics, mathematics, and electro-optics as well as a Ph.D. in Physics. Prior to joining the Company, in May 1996, Dr. Yaniv operated a consulting practice and previously was President and CEO of Optical Imaging Systems Inc., a supplier of flat panel color liquid crystal displays to the avionics and defense industries.
Douglas P. Baker joined the Company as CFO in June 1996, has been a Director since May 2006, and CEO since May 2009. Mr. Baker is a Certified Public Accountant and has both a Bachelors in Business Administration and a Masters in Business Administration. Prior to joining the Company, Mr. Baker had prior experience in public accounting, as CFO of a privately held company, and as a divisional controller at a large publicly held Company. Mr. Baker is also Chairman of the Board of Directors of Total Health Care, Inc., a non-profit Health Maintenance Organization and has been a member of the Board of Directors of that organization since 1987.
Ronald J. Berman has been a Director since May 1996. Mr. Berman co-founded BEG Enterprises, Inc. and was its President from 1989 until 1998. Mr. Berman currently is President of R.J. Berman Enterprises, Ltd., a real estate development company, Inergi Fitness, and Walkers Warehouse. Mr. Berman also has a law degree.
Dr. Robert Ronstadt has been a Director since January 2003 and Chairman of the Board of Directors since May 2009. He holds a doctorate in international business and management of technology. Prior to retiring in 2005, Dr. Ronstadt was Vice President of Technology Commercialization for Boston University and Director of Boston University’s Technology Commercialization Institute. He previously held positions as a special advisor to the Chancellor of Boston University, Director of the IC2 Institute at the University of Texas in Austin and the J. Marion West Chair of Constructive Capitalism, professor of entrepreneurship at the Pepperdine University School of Business Management, and at Babson College in Wellesley Massachusetts.
Howard Westerman is the Chief Executive Officer of JW Operating Company, a privately held energy development and energy services company headquartered in Dallas, Texas. Mr. Westerman joined JW Operating Company in 1978 and became CEO in 1999. Under his leadership as CEO, the Company’s revenues increased from approximately $70 million to $1 Billion. Mr. Westerman is also a member of the Board of Directors of Peerless Manufacturing Company, a global provider of environmental and separation filtration products, listed on the NASDAQ Global Market Exchange. Mr. Westerman also serves on numerous charitable and community boards.
Page 52
Tracy K. Bramlett is President of Industrial Hygiene and Safety Technology, Inc. (IHST), a full service industrial hygiene consulting company that he formed in 1987. IHST specializes in Indoor Environmental Quality issues. Prior to forming IHST, Mr. Bramlett was a corporate industrial hygienist for Burlington Northern Railroad.
Paul F. Rocheleau has been a Director of the Company since May 2009, and Vice Chairman of the Board since October 2009. He is Chairman of the Board and Chief Investment Officer of Virginia Life Science Investments, LLC. Prior to that he was a managing director at Cary Street Partners, a regional investment banking firm based in Richmond, Virginia. Mr. Rocheleau also serves on the Board of Directors of four specialty materials and medical device companies, and the advisory Board of Apex systems, an IT staffing company.
Clinton J. Everton has been a Director of the Company since October 2008, and is currently President of the Margrave Group, a company that he founded in 2008. Prior to that, from 2001 to 2007, he held a variety of roles at Thompson NETg, including Vice President, Chief Technology Officer, and SVP Product operations before becoming President in 2005. Prior to Thompson NETg, Mr. Everton was President of Knowledge Communication, a pioneer in the e-learning field.
Dr. Richard Fink is Vice President of Engineering for Applied Nanotech, Inc.; a subsidiary of Applied Nanotech Holdings, Inc. Dr. Fink has a Bachelor in Science degree from South Dakota State University and a Masters in Science and Ph.D. in Physics from the University of Illinois and has worked for the Company since 1995. Dr. Fink is also the co-founder of the Nanomaterials Applications Center at Texas State University – San Marcos, and has been chairman of the Texas Chapter of the Society for Information Display since 2004.
All members of the Board of Directors attended greater than 75% of the meetings of the board of directors and meetings of the committees of the board on which they served with the exception of Mr. Rocheleau, who attended less than 75% of such meetings in 2010.
Shareholder Director Nominating Procedures
The Company has a procedure in place for holders of the Company’s common stock to recommend nominees to the Company’s Board of Directors. These procedures are set forth in Article 9(b) of the Company’s Restated Articles of Incorporation (the “Restated Articles”), a copy of which is filed as Exhibit 3(I) to this Annual Report on Form 10-K. Nominations of persons for election to the Board of Directors of the Company may be made at a meeting of shareholders by or at the direction of the Board of Directors or by any shareholder of the Company entitled to vote for the election of Directors at the meeting who complies with the notice procedures set forth in Article 9(b). Such nominations, other than those made by or at the direction of the Board of Directors, shall be made pursuant to timely notice in writing to the Secretary of the Corporation. To be timely, a shareholder’s notice shall be delivered to or mailed and received at the principal executive offices of the Company not less than 60 days nor more than 90 days prior to the meeting; provided, however, that in the event that less than 70 days’ notice or prior public disclosure of the date of the meeting is given or made to shareholders, notice by the shareholder to be timely must be so received not later than the close of business on the 10th day following the date on which such notice of the date of the meeting was mailed or such public disclosure was made. Such shareholder’s notice shall set forth (i) as to each person whom the shareholder proposes to nominate for election or re-election as a Director, (A) the name, age, business address and residence address of such person, (B) the principal occupation or employment of such person, (C) the class and number of shares of the Company which are beneficially owned by such person, and (D) any other information relating to such person that is required to be disclosed in solicitations of proxies for election of Directors, or is otherwise required, in each case pursuant to Regulation 14A under the Securities Exchange Act of 1934, as amended (including without limitation such person’s written consent to being named in the proxy statement as a nominee and to serve as a Director if elected); and (ii) as to the shareholder giving the notice, (1) the name and address, as they appear on the Company’s books, of such shareholder and (2) the class and number of shares of the Company which are beneficially owned by such shareholder. No person shall be eligible for election as a Director of the Company unless nominated in accordance with the procedures set forth in Article 9(b) of the Restated Articles. The Chairman of the meeting shall, if the facts warrant, determine and declare to the meeting that a nomination was not made in accordance with the procedures prescribed herein, and if he should so determine, he shall so declare to the meeting and the defective nomination shall be disregarded.
Page 53
Committees
The Board of Directors has three formal committees. The audit committee consists of Mr. Everton, Mr. Westerman and Mr. Rocheleau. The audit committee operates without a chairman and met four times in 2010. The compensation committee consists of Mr. Berman, Mr. Bramlett, and Mr. Rocheleau. Mr. Berman is chairman of the compensation committee, which met five times in 2010. The nominating committee consists of Mr. Everton, Mr. Westerman, and Mr. Bramlett. The nominating committee operates without a chairman and met once during 2010.
Audit Committee Financial Expert
The Board of Directors has determined that Mr. Westerman and Mr. Rocheleau each qualify as an “audit committee financial expert” under applicable SEC rules and that all members of our audit committee qualify as “independent” as defined under applicable SEC rules.
Code of Ethics
We have adopted a Code of Ethics within the meaning of Item 406(b) of Regulation S-K of the Securities Exchange Act of 1934. This Code of Ethics applies to all directors, officers, and employees of the Company. A copy of this Code of Ethics is publicly available on our website at www.appliednanotech.net.
Section 16(a) Beneficial Ownership Reporting Compliance
Section 16(a) of the Securities of Exchange Act of 1934 requires Applied Nanotech Holdings’ officers, Directors, and persons who beneficially own more than 10 % of a registered class of Applied Nanotech Holdings’ common stock, to file reports of ownership and changes in ownership with the Securities and Exchange Commission. Officers, Directors, and beneficial owners of more than 10% of Applied Nanotech Holdings’ common stock are required by the Securities and Exchange Commission regulations to furnish Applied Nanotech Holdings with copies of all Section 16(a) forms that they file.
Based solely on review of the copies of such reports furnished to us, or written representations that no reports were required, we believe that for the period from January 1, 2010 through December 31, 2010, all Officers, Directors, and greater than 10% beneficial owners complied with all Section 16(a) filing requirements applicable to them.
Item 11. Executive Compensation
Compensation Discussion and Analysis
Objectives of Compensation Program
The primary objective of our compensation program for all employees, including for executive officers, is to attract, retain, and motivate qualified individuals and reward them in a manner that is fair to all stakeholders. We strive to provide incentives for every employee that rewards them for their contribution to the Company, while at the same time promoting an ownership mentality.
Elements of Compensation
There are three main components to our compensation package - base salaries, bonuses (non-equity based incentives), and stock based compensation. A fourth, less significant component is other benefits and perquisites. Our compensation program is designed to be competitive with other employment opportunities and to align the interests of all employees, including executive officers, with the long-term interests of our shareholders. For our executive officers, we link a much higher percentage of total compensation to incentive compensation such as bonus and stock based compensation than we do for other employees.
Base Salaries
We provide our executive officers with a level of cash compensation that is designed to facilitate an appropriate lifestyle and provide a reasonable minimum compensation. We make this determination based on a variety of factors including professional accomplishments, level of education, past experience and scope of responsibilities. The actual amount of base salary earned by each named executive officer is set forth in the Summary Compensation Table included later in this section.
Page 54
The salary level for our executive officers has been basically frozen from 2008 to 2010. As of January 1, 2008 the salaries were CEO - $300,000; COO - $275,000; CFO - $225,000; and VP of Engineering - $125,000. When Mr. Baker, the CFO at the time, assumed the CEO duties in May 2009 as a result of the resignation of the previous CEO, his salary was adjusted to $275,000 the same as the COO, and it remained at that level through December 2010. The salary of the COO remained unchanged from January 2008 through December 2010. The salary of the VP of engineering remained unchanged from at $125,000 from January 2008 to November 2010, when it was adjusted retroactively to July 1, 2010, to a rate of $145,000 per year. In addition, to the freeze, a significant portion of officer salaries from 2008 through 2010 were deferred, and a significant portion of those deferred salaries were invested in the convertible note offering in 2010. As of December 31, 2010, all deferred salaries had either been invested in the note offering, or paid. No additional deferral remained unpaid at December 31, 2010. As discussed more below, the following officer salaries for 2011 became effective January 1, 2011 – CEO - $325,000; COO - $325,000; and VP Engineering - $175,000.
Bonuses (Non-Equity Incentives)
We have a formula bonus plan covering all employees, including executive officers. This plan was originally established in 2004 and is based solely on the profitability of the company. This plan is designed to reward all employees when we are successful in reaching profitability. No bonuses were ever paid under this plan from 2004 to 2009, since we incurred losses in each of those years since adoption of the plan. We attained profitability in 2010, and as result, payments of $78,574 are due to each of the CEO and the COO, and a payment of $40,000 is due the VP of engineering. The maximum bonuses payable under this plan are $250,000 for the chief executive officer and for the chief operating officer. The maximum amounts would be payable if our pretax income is equal to, or exceeds $10 million. For purposes of this plan, pretax income is calculated using the accounting principles in effect at the time the plan was adopted, meaning stock based compensation using fair value is excluded from the calculation. There are no minimum amounts payable under the plan and the target amounts are equal to the maximum amounts payable. The compensation committee of the board of the directors also has the power to award discretionary bonuses; however, no such bonuses were granted in any of the years covered by this report.
Stock Based Compensation
All of our employees participate in our stock based compensation plans and receive awards of non-qualified stock options annually. We use non-qualified options because of the favorable tax treatment to us and the near universal expectation by employees in our industry that they will receive stock options. Historically, the majority of these awards have been performance based awards that only vest upon achievement of specific goals. For non-executive officer employees, these goals tend to be operational oriented goals relating to specific projects or potential projects. For executive officers, these goals are broader in nature and involve more substantial accomplishments. In 2010, we granted more time-based options, in total, than performance based options. All employees, including officers, had participated in salary reductions and accordingly we granted more time-based options in 2010, to recognize this sacrifice. Following is a discussion of the option grants to executive officers.
In 2007, the compensation committee adopted a multiyear option program for executive officers covering the years 2008 to 2010. This program included a mixture of time based option and performance based options. The majority of these grants were performance based options with goals related to modified cashflow from operations and various earnings per share targets. Dr. Fink received options as part of this program; however, Dr. Fink became an executive officer effective December 31, 2007 and was not an executive officer at the time of the grant.
A portion of the goals related to options granted in 2007 were tied to cash flow goals for 2008. These options expired unvested as of December 31, 2008. In 2008 and 2009, the executive officers were granted performance based options that vested based on cash flow from operations goals. None of these goals were achieved and none of the options granted in 2008 and 2009 vested. In 2010, the officers were granted performance based options that vested if the company achieved positive cash flow from operations for 2010. We did achieve positive cash flow from operations and those options vested in 2010. We grant performance based options to align the interests of the executive officers with those of the shareholders.
Page 55
We also granted time-based options to executive officers in 2010. This was the first time since 2007 that we granted options to executive officers that were not performance based. Officer salaries had effectively been frozen since January 2008, with a significant amount of the frozen amount being deferred, so we felt it appropriate to grant non-performance based options.
At the present time, we have no formal policy related to stock ownership for executive officers, other than for those officers that are also members of the Board of Directors and are covered under the Board policy, which is described later in this section. In establishing grant levels, we do not consider the equity ownership levels of the executive officer. In general, we do not consider the existence of fully vested prior awards when establishing new grants. However, with newer executive officers, we may consider the lack of prior awards in establishing a higher level of new grants.
Timing of Option Grants
We do not have a formal written policy related to the timing of option grants; however we do have certain time periods when options are normally granted. At the present time, we do not have any analysts that follow our stock and the release of our quarterly financial reports normally has no noticeable impact on the price of our stock. As such, we do not have trading windows, nor do we limit option grants to any sort of windows. There are two normal situations where options are granted. The first would be at the time a new employee, including an executive officer, is hired. If a new employee receives options as part of starting employment, those options are granted either at, or shortly after, the employment start date.
Historically, the majority of options granted are performance based awards granted on an annual basis as part of a budgeting/goal setting process. For executive officers, the compensation committee meets annually to establish compensation levels, including salary, bonus, and options, for the year. This meeting normally occurs in late November or early December prior to the start of the new year - for example in December 2009 for 2010 compensation. It could, however, occur as early as November or as late as January. For 2011, the meeting occurred in January 2011. For all other employees, the goal setting process starts in December, but since it involves many more distinct goals and many more individuals; it is a longer process and as a result usually is not ready for submission to the Compensation Committee until January or later. Performance based awards for employees other than executive officers are generally annual awards that must either vest by the end of the calendar year, or they will expire unvested. At the time of the proposed award, we consider whether there are any known upcoming significant events, and have in the past delayed awards as a result of expected positive events.
All option grants for employees are approved by the compensation committee of the Board of Directors. The compensation committee has authorized the executive officers to grant limited amounts of options to new hires without seeking additional compensation committee approval. The compensation committee does not delegate any of its powers for granting options to others, except that it has granted the CEO the power to grant up to 20,000 options to new hires without the specific approval of the compensation committee.
Other Benefits and Perquisites
Since we have not yet reached profitability on a consistent basis, we take a relatively bare-bones approach to benefits for all employees, including executive officers. There are no benefit plans available to executive officers that are not available to all employees. Executive officers participate in the same benefit plans covering other employees. These benefits include limited health and dental insurance, and group term life insurance. The only retirement plan that we maintain is a 401K plan funded entirely by employee elective deferrals. We have no company funded retirement plans or deferred compensation plans. We also do not provide any of the perquisites common at larger companies. The only perq that we provide is an auto allowance. Our CEO and COO receive an auto allowance of $1,000 per month and our CFO received an auto allowance of $500 per month up until the time that he became CEO in 2009. The amounts paid as auto allowances are considered in setting the overall level of compensation for the executive officer.
Page 56
Compensation Approval Process
The Compensation Committee of the Board of Directors approves all compensation and awards to executive officers. The CEO provides recommendations to the compensation committee for the other executive officers, all of which directly or indirectly report to him, and regarding most compensation matters, including executive compensation, provides information to the Compensation Committee. However, the Compensation Committee does not delegate any of its functions to others in setting compensation. We did not make formal use of any compensation consultants in determining executive compensation levels for any of the executive officers.
In 2006 we used an executive search firm in connection with our search for a new CEO that year. That firm, Christian & Timbers, indicated that at the time our CEO salary was at the low end of the acceptable range for similar companies, although when considering an extensive option package, total compensation fell within the normal range of CEO compensation. In November 2007, we performed a compensation analysis to benchmark our compensation package against other similar companies. We did not use an outside compensation consultant for this study, but rather performed the analysis internally. We selected the following companies: Nanogen (NGEN), Nanosphere (NSPH), Harris & Harris (TINY), Nanosys (NNSY), Acacia Research/Acacia Technologies (ACTG), Arrowhead Research (ARWR), and Symyx Technologies (SMMX). In selecting these companies, we considered such factors as nanotechnology involvement, market capitalization, revenue levels, profitability, and line of business. While no particular company is a perfect match, we believe that overall this is a representative mix of companies to use as a comparison. We gathered data on these companies from publicly available data, including SEC filings. In general, there was a lag related to these filings, so the most recent data available for these companies was from 2006 or prior.
The results of our benchmarking study showed that the compensation paid to executive officers at Applied Nanotech Holdings, Inc. was well below average for the peer group selected. Salaries were at or near the bottom of the range. In the case of the CEO and COO, all but one of the comparison companies paid higher salaries and in the case of the CFO, all of the comparison companies paid higher salaries. The majority of the comparison companies paid bonuses despite the existence of net operating losses. While the Applied Nanotech Holdings officers had the potential for larger option grants, based on options actually vested, on average the comparison companies also had higher levels of options granted.
When setting compensation levels for 2008, we considered the result of this study. Salaries were set at the previously disclosed levels for 2008 based on this study and in consideration of the fact that salary levels had been unchanged for three years. These new salary levels were, in general, still below average for the comparison companies. Until such time as the company attains profitability, we believe it reasonable for salaries to continue to be below average. When the company reaches profitability, it is anticipated that salaries will be adjusted to closer to market levels. Our bonus plan based on profitability remains in place, and it is anticipated that future bonuses will only be paid when we attain profitability. Finally, as previously described, we granted options performance based options, none of which vested, to the executive officers in 2008.
We updated the previously mentioned compensation study at the end of 2008 and found that in general, compensation levels had increased at the comparison companies. We, however, left compensation unchanged for our executive officers for 2009. Since we had no intention of increasing salaries in 2010, we did not update our compensation study in 2010, but left salaries at 2009 levels.
We updated the study again in 2010 and, as expected, found that our executive officers remained at the bottom of the range in salary and compensation. Effective January 1, 2011, we adjusted officer salaries as follows: CEO - $325,000; COO - $325,000; and VP of Engineering - $175,000. This was based on several factors, including the fact that salaries had been frozen at previous levels for three years and that salaries remain below market. In addition, the total annualized salaries set for executive officers, now at $825,000, is still lower than the comparable amount of $925,000 in 2008. When the previous CEO left in 2009 and Mr. Baker assumed the position of CEO as well as CFO, both Mr. Baker and Dr. Yaniv assumed additional duties. The Company is now operating with one less executive officer than it did back in 2008. In addition, this simply reinstates the CEO level salary to approximately the same level as it was for the prior CEO in January 2008. While the salary was $300,000 at the time, it was set at that level taking into account that the Company incurred an extra $24,000 in rent to maintain an office for the prior CEO in Dallas. The new rate of $325,000 for Mr. Baker and Dr. Yaniv, results in basically the same cost as for the prior CEO in 2008.
In order to insure that the Company maintains sufficient cash balances, the majority of these 2011 increases will be deferred by the officers. Mr. Baker and Dr. Fink are deferring the entire increase, and Dr. Yaniv is deferring $35,000 of the $50,000 increase. These increases will be deferred until such time as either the sum of 2011 revenue, plus the backlog expected to be recognized in 2011, equals or exceeds $7.0 million, or until the Company has a month end balance of $4.0 million cash in the bank.
Page 57
We believe our total compensation package mitigates unreasonable risk-taking by our senior executives. In this regard, we strike a balance between short-term and long-term cash and equity awards. A significant portion of our executives’ pay is linked to the achievement of financial goals directly aligned to stockholder interests. Our long-term equity awards incent executives to take a long term view of the company and to assume reasonable risks to develop new products, explore new markets and expand existing business.
Compensation Committee Report
We have reviewed and discussed with management certain Compensation Discussion and Analysis provisions to be included in the Company’s 2010 Annual Report on Form 10-K for the fiscal year ended December 31, 2010, filed pursuant to Section 13 or 15(d) of the Securities Exchange Act of 1934 (“Form 10-K”). Based on the reviews and discussions referred to above, we recommend to the Board of Directors that the Compensation Discussion and Analysis referred to above be included in the Company’s Form 10-K.
Compensation Committee
Ronald J. Berman, Chairman; Paul F. Rocheleau; Tracy Bramlett
The following table sets forth the total cash compensation paid or to be paid, as well as certain other compensation paid or accrued, for services rendered during the fiscal years ended December 31, 2010, 2009 and 2008 by all individuals that served as Chief Executive Officer during 2010, the Chief Financial Officer, all individuals that were Named Executive Officers as of the end of the previous year, and all executive officers whose total annual salary and bonus exceeded $100,000 for the fiscal year ended December 31, 2010 (the “Named Executive Officers”):
SUMMARY COMPENSATION TABLE
|
Name &
Principal Position
|
Year
|
Salary (1)
|
Option
Awards (2)
|
Non-Equity
Incentive Plan Compensation (3)
|
All Other Compensation (4)
|
Total
|
||||||||||||||||
|
Douglas P. Baker (5)
|
2010
|
$ | 275,000 | $ | 69,958 | $ | 78,574 | $ | 12,000 | $ | 435,532 | |||||||||||
|
Chief Executive Officer
|
2009
|
$ | 251,956 | $ | 0 | $ | 0 | $ | 9,833 | $ | 261,789 | |||||||||||
|
Chief Financial Officer
|
2008
|
$ | 225,000 | $ | 8,550 | $ | 0 | $ | 6,000 | $ | 239,550 | |||||||||||
|
Dr. Zvi Yaniv
|
2010
|
$ | 275,000 | $ | 77,227 | $ | 78,574 | $ | 12,000 | $ | 442,801 | |||||||||||
|
Chief Operating Officer
|
2009
|
$ | 275,000 | $ | 0 | $ | 0 | $ | 12,000 | $ | 287,000 | |||||||||||
|
2008
|
$ | 275,000 | $ | 13,680 | $ | 0 | $ | 12,000 | $ | 300,680 | ||||||||||||
|
Dr. Richard Fink
|
2010
|
$ | 135,000 | $ | 22,269 | $ | 40,000 | $ | 0 | $ | 197,269 | |||||||||||
|
2009
|
$ | 125,000 | $ | 0 | $ | 0 | $ | 0 | $ | 125,000 | ||||||||||||
|
2008
|
$ | 125,000 | $ | 3,420 | $ | 0 | $ | 0 | $ | 128,420 | ||||||||||||
__________________
(1) Salary amounts for all years for all officers reflect amounts earned during the year. Effective August 1, 2008, the officers began deferring a portion of their salaries as part of the Company’s cost reduction/cash conservation initiatives. The amount of 2008 and 2009 salaries still payable as of December 31, 2009 were $85,641 for Mr. Baker, $58,443 for Dr. Yaniv, and $26,568 for Dr. Fink. The entire amount of this deferred salary, plus additional funds, was invested by the officers in the 2010 convertible note payable fundraising.
(2) Amounts included in the option awards column are calculated using fair value accounting. See Note 9 of the consolidated financial statements included in this annual report for the assumptions underlying valuation of equity awards. The amounts are calculated based on options granted during the year that are expected to vest. As discussed in the Compensation Discussion and Analysis, many of options granted are performance based options associated with specific goals. To the extent that the goals are not achieved, the options do not vest. The options issued in 2008 to all officers were performance based options that were expected to vest at the time of grant; however, all options granted to officers in 2008 expired unvested in 2009.
(3) Amounts included in this column represent payments due under the company’s non-equity incentive plan and are payable in March 2011.
(4) The amounts included in the “All Other Compensation” column represent automobile allowances in all years.
(5) Mr. Baker became CEO, effective May 11, 2009 upon the resignation of the previous CEO.
Page 58
GRANTS OF PLAN-BASED AWARDS TABLE
|
Estimated Future Payouts Under
Non-Equity Incentive Plan
Awards ($)(1)
|
Estimated Future Payouts Under
Equity Incentive Plan
Awards (Shares) (2)
|
|||||||||||||||||||||||||||||||
|
Name
|
Grant Date
|
Approval Date
|
Threshold
|
Target
|
Maximum
|
Threshold
|
Target
|
Maximum
|
All Other Option Awards;
Number of Shares Underlying Options (3)
|
Exercise
Price of
Option Awards
|
Market Price on Date of Grant
|
|||||||||||||||||||||
|
Douglas P. Baker
|
03/08/10
|
03/03/10
|
0 | 100,000 | 100,000 | 0 | $ | 0.33 | $ | 0.33 | ||||||||||||||||||||||
|
03/08/10
|
03/03/10
|
0 | 0 | 0 | 200,000 | $ | 0.33 | $ | 0.33 | |||||||||||||||||||||||
|
03/08/10
|
03/03/10
|
0 | 0 | 0 | 17,600 | $ | 0.33 | $ | 0.33 | |||||||||||||||||||||||
|
03/03/10
|
03/03/10
|
0 | 78,574 | 250,000 | ||||||||||||||||||||||||||||
|
Dr. Zvi Yaniv
|
03/08/10
|
03/03/10
|
0 | 100,000 | 100,000 | 0 | $ | 0.33 | $ | 0.33 | ||||||||||||||||||||||
|
03/08/10
|
03/03/10
|
0 | 0 | 0 | 200,000 | $ | 0.33 | $ | 0.33 | |||||||||||||||||||||||
|
03/08/10
|
03/03/10
|
0 | 0 | 0 | 50,600 | $ | 0.33 | $ | 0.33 | |||||||||||||||||||||||
|
03/03/10
|
03/03/10
|
0 | 78,574 | 250,000 | ||||||||||||||||||||||||||||
|
Dr. Richard Fink
|
03/08/10
|
03/03/10
|
0 | 25,000 | 25,000 | 0 | $ | 0.33 | $ | 0.33 | ||||||||||||||||||||||
|
03/08/10
|
03/03/10
|
0 | 0 | 0 | 75,000 | $ | 0.33 | $ | 0.33 | |||||||||||||||||||||||
|
03/08/10
|
03/03/10
|
0 | 0 | 0 | 1,100 | $ | 0.33 | $ | 0.33 | |||||||||||||||||||||||
|
03/03/10
|
03/03/10
|
0 | 40,000 | 100,000 | ||||||||||||||||||||||||||||
__________________
|
(1)
|
Non-Equity Incentive plan is described in greater detail in the Compensation Discussion and Analysis.
|
|
(2)
|
Performance-based option awards that vest upon the achievement of positive cash flow from operations in 2010. All vested in 2010.
|
|
(3)
|
First grant listed for each officer vests quarterly over a two year period. Second grant listed for each officer was fully vested on date of grant.
|
Page 59
OUTSTANDING EQUITY AWARDS AT FISCAL YEAR-END TABLE
The following table sets forth information concerning the outstanding equity awards held by the Named Executive Officers at December 31, 2010.
|
Option Awards
|
||||||||
|
Name
|
Number of Securities Underlying Unexercised Options - Number Exercisable
|
Equity Incentive Plan Awards: Number of Securities Underlying Unexercised Unearned Options
|
Option
Exercise Price
|
Option Expiration
Date
|
||||
|
Dr. Zvi Yaniv
|
30,000
|
-
|
$0.96
|
07/28/2013
|
||||
|
250,000
|
-
|
$2.73
|
12/31/2013
|
|||||
|
250,000
|
-
|
$2.17
|
12/31/2014
|
|||||
|
180,000
|
-
|
$1.19
|
12/03/2017
|
|||||
|
150,600
|
-
|
$0.33
|
03/08/2020
|
|||||
|
75,000
|
125,000
|
$0.33
|
03/08/2020
|
|||||
|
Douglas P. Baker (1)
|
60,000
|
-
|
$0.63
|
03/02/2011
|
||||
|
100,000
|
-
|
$0.92
|
07/16/2011
|
|||||
|
150.000
|
-
|
$0.73
|
12/05/2011
|
|||||
|
13,000
|
-
|
$0.96
|
07/28/2013
|
|||||
|
200,000
|
-
|
$2.73
|
12/31/2013
|
|||||
|
150,000
|
-
|
$2.17
|
12/31/2014
|
|||||
|
112,500
|
-
|
$1.19
|
12/03/2017
|
|||||
|
117,600
|
-
|
$0.33
|
03/08/2020
|
|||||
|
75,000
|
125,000
|
$0.33
|
03/08/2020
|
|||||
|
Dr. Richard Fink
|
2,000
|
-
|
$0.58
|
02/16/2011
|
||||
|
32,750
|
-
|
$1.00
|
12/31/2012
|
|||||
|
6,875
|
-
|
$0.50
|
03/20/2013
|
|||||
|
21,000
|
-
|
$0.56
|
04/16/2013
|
|||||
|
19,881
|
-
|
$2.50
|
03/10/2014
|
|||||
|
15,906
|
-
|
$2.17
|
01/01/2015
|
|||||
|
3,487
|
-
|
$2.17
|
02/14/2016
|
|||||
|
10,112
|
-
|
$2.25
|
04/11/2016
|
|||||
|
16,713
|
-
|
$1.28
|
01/29/2017
|
|||||
|
45,000
|
-
|
$1.19
|
12/03/2017
|
|||||
|
26,100
|
-
|
$0.33
|
03/08/2020
|
|||||
|
28,125
|
46,875
|
$0.33
|
03/08/2020
|
|||||
______________________
(1) Includes options still outstanding that were previously transferred by gift and reported on Form 4 by the Named Executive Officer. For Mr. Baker, these options are the 60,000 options expiring 03/02/2011.
OPTION EXERCISE AND STOCK VESTED TABLE
Named executive officers exercised no options and received no vested stock awards in 2010.
Page 60
PENSION BENEFITS TABLE
We maintain no retirement plans covering Named Executive Officers or other employees, except for a 401K plan funded solely by elective employee contributions. As such no pension benefits table is included.
NON-QUALIFIED DEFERRED COMPENSATION TABLE
We do not maintain any non-qualified deferred compensation plans covering Named Executive Officers or other employees. As such, no deferred compensation table is included.
POTENTIAL PAYMENTS UPON TERMINATION OR CHANGE IN CONTROL
None of the named executive officers have formal written employment contracts, and therefore, there are no formal payments due on a change in control or other employment termination. Our 2002 Equity Compensation Plan, which includes all employees, including executive officers, includes a provision which accelerates the vesting of all unvested options upon certain change in control events. Any unvested options held by Named Executive Officers as of December 31, 2010 are reflected in the Outstanding Equity Awards at Fiscal Year-End Table included in this item.
It is our policy to pay severance upon termination when termination is initiated by us and is for other than cause. We have no formal guidelines, but rather each case is handled on an individual basis. Factors considered include position, length of service, reason for termination, possible future relationships, as well as other potential factors. Payments may be made in a lump sum or in periodic installments and are usually accompanied by a severance agreement that includes a release, a non-disparagement clause, and possibly a non-compete agreement. In the case of executive officers, the minimum severance due, unless alternative amounts are negotiated is one month of severance for each year or partial year of service at the Company, with a minimum of six months. In the case of the existing executive officers, that would equate to fifteen months for Dr. Yaniv and Mr. Baker, and sixteen months for Dr. Fink. This could be viewed as the minimum potential pay out upon termination; however, upon mutual agreement of the parties, a lower amount could be negotiated.
DIRECTOR COMPENSATION
|
Name
|
Fees Earned or
Paid in Cash
|
Option
Awards (1)
|
Total
|
|||
|
Dr. Robert Ronstadt
|
$ 9,200
|
$10,897
|
$ 20,097
|
|||
|
Howard Westerman
|
$ 300
|
$ 8,915
|
$ 9,215
|
|||
|
Ronald J. Berman
|
$ 300
|
$ 9,906
|
$ 10,206
|
|||
|
Tracy K. Bramlett
|
$ 300
|
$ 8,915
|
$ 9,215
|
|||
|
Clinton J. Everton
|
$ 300
|
$ 8,915
|
$ 9,215
|
|||
|
Paul F. Rocheleau
|
$ 200
|
$ 9,906
|
$ 10,106
|
____________________
|
(1)
|
Amounts included in the option awards column are calculated using fair value accounting. See Note 9 of the consolidated financial statements included in this annual report for the assumptions underlying valuation of equity awards.
|
In January 2010, at the initiation of the Outside Directors, the Board of Directors changed its compensation policy for Outside Directors. Compensation was changed from a mix of cash and restricted stock to a program based primarily on options. Each Director now receives an annual grant of 45,000 options in July. Committee chairman and the Vice Chairman receive an additional 5,000 options and the Chairman of the Board of Directors receives an additional 10,000 options. Meeting fees are set at $100 per telephonic Board meeting per Director and an Independent Chairman will receive an annual fee of $9,000, paid at a rate of $750 per month. No fees are paid for in person meetings or committee meetings. The Board believes this option based compensation program offers greater potential gains for the Board Members and will better compensate Directors for their efforts. The Directors also believe that this program will be easier for the Company from a cash standpoint, until such time that it can afford more significant cash payments to Directors.
Page 61
All of the Directors have retained the right to pursue additional business activities that are not competitive with the business of Applied Nanotech Holdings, and do not adversely affect their performance as Directors. If conflicts of interest arise, the nature of the conflict must be fully disclosed to the Board of Directors, and the person who is subject to the conflict must abstain from participating in any decision that may impact on his conflict of interest. Except for this disclosure and abstention policy, the Directors will not be in breach of any fiduciary duties owed to Applied Nanotech Holdings or the shareholders by virtue of their participation in such additional business activities.
Director Ownership Requirements
We also have a policy related to stock ownership requirements that covers all Directors - both outside Directors and employee Directors. All Directors are required to own a minimum of 20,000 shares of Applied Nanotech Holdings, Inc. common stock. There is no time limit in which a new director must meet those requirements; however, until a Director owns a minimum of 20,000 shares, the Director is not allowed to sell any shares. Furthermore, if a Director owns in excess of 20,000 shares, that Director is not allowed to sell shares, whether owned or received as a result of the exercise of options, if at the completion of the transaction, it will result in an ownership position of less than 20,000 shares. All current Directors currently meet this ownership requirement with the exception of Director Rocheleau.
In January 2010, the Board adopted a policy whereby Directors are prohibited from selling shares of the Company’s stock, except during two window periods that will occur each year in the last two full calendar weeks in March and the first two calendar weeks in October, or pursuant to a 10b-5(1) plan adopted during those periods. The Board can grant exceptions to this policy in the case of hardship.
Compensation Committee Interlocks and Insider Participation
The Compensation Committee currently consists of Mr. Berman, Mr. Bramlett, and Mr. Rocheleau. None of them is or has been an officer or employee of Applied Nanotech Holdings, Inc. nor do any of them have any relationships requiring disclosure under Item 404 of Regulation S-K. No interlocking relationship existed during the fiscal year ended December 31, 2010, between Applied Nanotech Holdings’ Board of Directors or Compensation Committee and the board of directors or compensation committee of any other company.
Item 12. Security Ownership of Certain Beneficial Owners and Management and Related Stockholder Matters.
CERTAIN BENEFICIAL OWNERS
There are no persons or entities known to be the beneficial owner of 5% or more of the outstanding voting stock of the common stock of Applied Nanotech Holdings, Inc. stock as of February 28, 2011. This information is based on public filings as of December 31, 2010. For the purposes of this Annual Report on Form 10-K, beneficial ownership of securities is defined in accordance with the rules of the SEC to mean generally the power to vote or dispose of securities, regardless of any economic interest therein.
Page 62
SECURITY OWNERSHIP OF MANAGEMENT
Set forth below is certain information with respect to beneficial ownership of Applied Nanotech Holdings’ common stock as of February 28, 2011, by each Director, each Named Executive Officer and by the directors and executive officers as a group. Unless otherwise indicated, each person or member of the group listed has sole voting and investment power with respect to the shares of common stock listed.
|
Name
|
Options Included
in Beneficial
Ownership (1)
|
Shares Related to Convertible Note Payable (2)
|
Common
Shares
Owned
|
Common Stock
Beneficial
Ownership
|
Percentage
of Class
|
|||||||||||||||
|
Douglas P. Baker
|
1,124,100 | 432,000 | 59,500 | 1,615,600 | 1.45 | |||||||||||||||
|
Dr. Zvi Yaniv
|
960,600 | 280,800 | 160,000 | 1,401,400 | 1.26 | |||||||||||||||
|
Dr. Richard Fink
|
238,324 | 129,600 | - | 367,924 | * | |||||||||||||||
|
Ronald J. Berman
|
- | - | 461,592 | 461,592 | * | |||||||||||||||
|
Howard Westerman
|
45,000 | - | 208,707 | 253,707 | * | |||||||||||||||
|
Dr. Robert Ronstadt
|
230,000 | 51,840 | 40,617 | 322,457 | * | |||||||||||||||
|
Clinton J. Everton
|
45,000 | 38,880 | 37,500 | 121,380 | * | |||||||||||||||
|
Tracy Bramlett
|
45,000 | - | 28,333 | 73,333 | * | |||||||||||||||
|
Paul F. Rocheleau
|
50,000 | - | 1,667 | 51,667 | * | |||||||||||||||
|
All Executive Officers and
Directors as a group (9 persons)
|
2,738,024 | 933,120 | 997,916 | 4,669,060 | 4.10% | |||||||||||||||
|
*
|
Less than 1%
|
|
(1)
|
This column lists shares that are subject to options exercisable within sixty (60) days of February 28, 2011, and are included in common stock beneficial ownership pursuant to Rule 13d-3(d)(1) of the Exchange Act.
|
|
(2)
|
This column lists shares that are obtainable as result of conversion of convertible notes payable at February 28, 2011.
|
Item 13. Certain Relationships and Related Transactions, and Director Independence
It is our written policy that all material related party transactions be approved by the Board of Directors, with any member of the Board affect by the related party transaction abstaining from the vote.
In 2010, Directors Baker, Yaniv, Ronstadt, and Everton, as well as named executive officer Dr. Fink participated in a fundraising round consisting of convertible notes payable. The notes bear interest at a rate of 8% annually and for participants that were not affiliates of the Company, the notes are convertible to common stock at a conversion rate of $0.20 per share, which represented a slight discount to market at the time of the issuance. For Directors and Officers, the conversion rate was $0.25, which was greater than or equal to the market price of the stock at the time of commitment. The face of the notes was as follows: Baker - $100,000; Yaniv - $65,000; Fink - $30,000; Ronstadt - $12,000; Everton – $9,000.
Page 63
Item 14. Principal Accountant Fees and Services
Audit Fees
The aggregate fees billed to the Company by Padgett, Stratemann & Co., L.L.P. for the audit of Applied Nanotech Holdings’ annual financial statements and for the review of the financial statements included in its quarterly reports on Form 10-Q for the Fiscal Years ended December 31, 2010, 2009 and 2008 were $65,275, $60,500 and $62,500.
Audit-Related Fees
Applied Nanotech Holdings did not incur or pay any fees to Padgett, Stratemann & Co. L.L.P. and Padgett, Stratemann & Co. L.L.P. did not provide any services related to audit-related fees in the last two fiscal years.
Tax Fees
There were no fees billed to Applied Nanotech Holdings by Padgett, Stratemann & Co. L.L.P. or for services rendered to Applied Nanotech Holdings during the last two fiscal years for tax compliance, tax advice, or tax planning.
All Other Fees
There were no fees billed to Applied Nanotech Holdings by Padgett, Stratemann & Co. L.L.P. for services rendered to Applied Nanotech Holdings during the last two fiscal years, other than the services described above under “Audit Fees.”
It is the audit committee’s policy to pre-approve all services provided by the Company’s auditors. All services provided by Padgett Stratemann & Co. L.L.P. in 2010, 2009 and 2008 were pre-approved by the audit committee.
As of the date of this filing, Applied Nanotech Holdings current policy is to not engage Padgett, Stratemann & Co., L.L.P. to provide, among other things, bookkeeping services, appraisal or valuation services, or internal audit services. The policy provides that Applied Nanotech Holdings engage Padgett, Stratemann & Co., L.L.P. to provide audit, tax, and other assurance services, such as review of SEC reports or filings.
The Audit Committee considered and determined that the provision of the services other than the services described under “Audit Fees” is compatible with maintaining the independence of the independent auditors.
Page 64
PART IV
Item 15. Exhibits and Financial Statement Schedules
|
(a)
|
The following documents are filed as part of this Annual Report on Form 10-K:
|
|
|
(1)
|
All Financial Statements
|
The response to this portion of Item 15 is set forth in Item 8 of Part II hereof.
|
|
(2)
|
Financial Statement Schedules
|
Schedules for which provision is made in the applicable accounting regulations of the Securities and Exchange Commission are not required under the related instructions or are inapplicable, and therefore have been omitted.
|
|
(3)
|
Exhibits
|
See accompanying Index to Exhibits on page 67 for a descriptive response to this item. The Company will furnish to any shareholder, upon written request, any exhibit listed in the accompanying Index to Exhibits upon payment by such shareholder of the Company’s reasonable expenses in furnishing any such exhibit.
|
(b)
|
Reference is made to Item 15(a) (3) above.
|
|
(c)
|
Reference is made to Item 15(a) (2) above.
|
Page 65
SIGNATURES
Pursuant to the requirements of Section 13 or 15(d) of the Securities Exchange Act of 1934, the registrant has caused this report to be signed on its behalf by the undersigned, thereunto duly authorized.
|
APPLIED NANOTECH HOLDINGS, INC.
|
|||
|
By:
|
/s/ Douglas P. Baker
|
||
|
Douglas P. Baker, Chief Executive Officer,
Chief Financial Officer
March 1, 2011
|
|||
Pursuant to the requirements of the Securities Exchange Act of 1934, this report has been signed by the following persons on behalf of the registrant and in the capacities and on the dates indicated.
|
Signature
|
Title
|
Date
|
|
/s/ Douglas P. Baker
|
Chief Executive Officer and Chief Financial Officer
|
March 1, 2011
|
| Douglas P. Baker |
(Principal Executive Officer. Principal Financial Officer, Principal Accounting Officer, and Director)
|
|
|
Dr. Robert Ronstadt*
Clinton J. Everton*
Ronald J. Berman*
Dr. Zvi Yaniv*
Howard Westerman*
Tracy Bramlett*
Paul F. Rocheleau*
|
Directors
|
March 1, 2011
|
|
*By:
|
/s/ Douglas P. Baker
|
|||
|
(Douglas P. Baker,
Attorney-in-Fact)
|
Page 66
INDEX TO EXHIBITS
The exhibits indicated by an asterisk (*) have been previously filed with the Securities
and Exchange Commission and are incorporated herein by reference.
|
EXHIBIT
NUMBER
|
DESCRIPTION OF EXHIBIT
|
|
3(i).1*
|
Restated Articles of Incorporation of Company, as filed with the Secretary of State for the State of Texas. (Exhibit 3(i).1 to the Company’s Current Report on Form 8-K dated as of December 12, 2007).
|
|
3(i).2
|
Certificate of Amendment to the Restated Articles of Incorporation, as filed with the Secretary of State for the State of Texas
|
|
3(ii).1*
|
Amended and Restated Bylaws of the Company. (Exhibit 3(ii).1 to the Company’s Current Report on Form 8-K dated as of December 12, 2007).
|
|
4.1 *
|
Form of Certificate for shares of the Company’s common stock (Exhibit 4.1 to the Company’s Registration Statement on Form SB-2[No.33-51446-FW] dated January 7, 1993).
|
|
4.2*
|
Amended and Restated Rights Agreement dated as of November 16, 2000, between the Company and American Securities Transfer, Incorporated, as Rights Agent, which includes as Exhibit A the form of Statement of Resolution establishing and designating series of preferred stock as “Series H Junior Participating Preferred Stock” and fixing and determining the relative rights and preferences thereof, as Exhibit B the form of Rights Certificate, and as Exhibit C the Summary of Rights to Purchase Preferred Shares. (Exhibit 4.1 to the Company’s Current Report on Form 8-K dated as of November 16, 2000).
|
|
4.3*
|
Form of Term sheet for Convertible Notes Payable (Exhibit 99.1 to the Company’s Current Report on Form 8-K dated as of February 19, 2010)
|
|
4.4*
|
Form of Convertible Note Payable (Exhibit 4.4 to the Company’s Annual Report on Form 10-K for the fiscal year ended December 31, 2009).
|
|
4.5*
|
Regulation D Subscription agreement by and between the Company and Sichuan Anxian Yinhee Construction and Chemical Group., Ltd. (Exhibit 4.1 to the Company’s Current Report on Form 8-K dated as of February 13, 2011)
|
|
10.1*
|
Amended and Restated 1992 Outside Directors’ Stock Option Plan (Exhibit 4.2 to the Company’s Registration Statement on Form S-8 [No. 333-56547] dated June 9, 1998).
|
|
10.2*
|
Amended and Restated 1992 Stock Option Plan (Exhibit 4.1 to the Company’s Registration Statement on Form S-8 [No. 333-56457] dated June 9, 1998)
|
|
10.3*
|
Amended and Restated 2002 Equity Compensation Plan. (Exhibit 99.1 to the Company’s Current Report on Form 8-K dated as of December 12, 2007).
|
|
10.4*
|
Applied Nanotech Holdings, Inc. Audit Committee Charter (Exhibit 10.23 to the Company’s Annual Report on Form 10-KSB for the fiscal year ended December 31, 2002)
|
|
10.5*
|
Applied Nanotech Holdings, Inc. Compensation Committee Charter (Exhibit 10.18 to the Company’s Current Report on Form 10-K for the fiscal year ended December 31, 2005).
|
|
10.6*
|
Applied Nanotech Holdings, Inc. Nominating Committee Charter (Exhibit 10.19 to the Company’s Current Report on Form 10-K for the fiscal year ended December 31, 2005).
|
|
14 *
|
Applied Nanotech Holdings, Inc. Code of Ethics (Exhibit 14 to the Company’s Annual Report on Form 10-KSB for the fiscal year ended December 31, 2004)
|
|
11
|
Computation of Income (Loss) per Common Share
|
|
21
|
Subsidiaries of the Company
|
|
24
|
Powers of Attorney
|
|
31.1
|
Rule 13a-14(a)/15d-14(a) Certificate of Douglas P. Baker, Chief Executive Officer and Chief Financial Officer
|
|
32.1
|
Section 1350 Certificate of Douglas P. Baker, Chief Executive Officer and Chief Financial Officer
|
Page 67