Attached files
Table of Contents
UNITED STATES
SECURITIES AND EXCHANGE COMMISSION
Washington, D.C. 20549
FORM 10-K
| x | ANNUAL REPORT PURSUANT TO SECTION 13 OR 15(d) OF THE SECURITIES EXCHANGE ACT OF 1934 |
For the fiscal year ended December 31, 2010 or
| ¨ | TRANSITION REPORT PURSUANT TO SECTION 13 OR 15(d) OF THE SECURITIES EXCHANGE ACT OF 1934 |
For the transition period from to
Commission file number 2-40764
KANSAS CITY LIFE INSURANCE COMPANY
(Exact name of registrant as specified in its charter)
| Missouri | 44-0308260 | |
| (State or other jurisdiction of incorporation or organization) |
(I.R.S. Employer Identification No.) | |
| 3520 Broadway, Kansas City, Missouri |
64111-2565 | |
| (Address of principal executive offices) | (Zip Code) | |
816-753-7000
Registrant’s telephone number, including area code
Securities registered pursuant to Section 12(b) of the Act:
| Title of each class | Name of each exchange on which registered | |
| $1.25 par value common stock | NASDAQ Capital Market LLC |
Securities registered pursuant to section 12(b) of the Act:
None
(Title of class)
Indicate by check mark if the registrant is a well-known seasoned issuer, as defined in Rule 405 of the Securities Act.
Yes ¨ No x
Indicate by check mark if the registrant is not required to file reports pursuant to Section 13 or Section 15(d) of the Act.
Yes ¨ No x
Indicate by check mark whether the registrant (1) has filed all reports required to be filed by Section 13 or 15(d) of the Securities Exchange Act of 1934 during the preceding 12 months (or for such shorter period that the registrant was required to file such reports), and (2) has been subject to such filing requirements for the past 90 days.
Yes x No ¨
Indicate by check mark whether the registrant has submitted electronically and posted on it corporate Web site, if any, every Interactive Data File required to be submitted and posted pursuant to Rule 405 of Regulation S-T (§232.405 of this chapter) during the preceding 12 months (or for such shorter period that the registrant was required to submit and post such files).
Yes ¨ No ¨
Indicate by check mark if disclosure of delinquent filers pursuant to Item 405 of Regulation S-K (§229.405 of this chapter) is not contained herein, and will not be contained, to the best of registrant’s knowledge, in definitive proxy or information statements incorporated by reference in Part III of this Form 10-K or any amendment to this Form 10-K. ¨
Indicate by check mark whether the registrant is a large accelerated filer, an accelerated filer, or a non-accelerated filer, or a smaller reporting company. See the definitions of “large accelerated filer, “accelerated filer” and “smaller reporting company” in Rule 12b-2 of the Exchange Act.
| Large accelerated filer ¨ |
Accelerated filer x |
Non-accelerated filer ¨ |
Smaller reporting company ¨ |
Indicate by check mark whether the registrant is a shell company (as defined in Rule 12b-2 of the Act).
Yes ¨ No x
As of December 31, 2010, 11,467,105 shares of Kansas City Life Insurance Company’s common stock par value $1.25 were outstanding, and the aggregate market value of the common stock (based upon the average of bid and ask price according to Company records) on June 30, 2010 of Kansas City Life Insurance Company held by non-affiliates was approximately $103,641,615.
Table of Contents
KANSAS CITY LIFE INSURANCE COMPANY
TABLE OF CONTENTS
2
Table of Contents
Amounts are stated in thousands, except share data, or as otherwise noted.
General
Kansas City Life Insurance Company (Kansas City Life) was incorporated under the assessment laws of Missouri in 1895 as the Bankers Life Association. In 1900, its present corporate title was adopted and it was reorganized as a stock life insurance company in 1903. Kansas City Life operates in 48 states and the District of Columbia.
Kansas City Life, the parent company, and wholly owned insurance subsidiaries Sunset Life Insurance Company of America (Sunset Life) and Old American Insurance Company (Old American) comprise the consolidated entity (the Company). The Company offers investment and broker-dealer services through its subsidiary Sunset Financial Services (SFS) for both proprietary and non-proprietary variable insurance products, mutual funds and other securities. The Company also has several non-insurance subsidiaries that individually and collectively are not material.
In 1974, the Company acquired Sunset Life in a stock acquisition transaction. Sunset Life is a life insurance company that was organized in 1937 that marketed and sold business in the western region of the United States. In 2006, the Sunset Life sales force was integrated into the Kansas City Life sales force by appointing Sunset Life agents as agents of Kansas City Life. All of Sunset Life’s operations, administration, and accounting are consolidated as part of the Company’s home office operations. Sunset Life maintains its closed block of business, but does not solicit new sales. Sunset Life is included in the Individual Insurance segment and its individual insurance products include traditional life, immediate annuity and interest sensitive products, including universal life and fixed deferred annuity products. Sunset Life operates in 43 states and the District of Columbia.
In 1991, the Company acquired Old American in a stock acquisition transaction. Old American is a life insurance company that was organized in 1939. Old American sells final expense traditional life insurance products primarily to the senior market, as well as a term product targeted at younger individuals. These products are marketed nationwide through a general agency system with exclusive territories, using direct response marketing to supply agents with leads. Old American’s administrative and accounting operations are part of the Company’s home office, but it operates and maintains a separate and independent field force and is identified as a separate segment. Old American operates in 46 states and the District of Columbia.
In 1997, the Company entered into a coinsurance reinsurance assumption and servicing agreement with another insurer to acquire a block of traditional life and universal life products. Under this agreement, the Company assumed the policy liabilities as defined in the contract. Investments equal to the policy reserves are held in a trust to secure payment of the estimated liabilities relating to the policies. This closed block of policies continues to make a significant contribution to the Company’s results, which are included in the Individual Insurance segment.
In 2003, the Company acquired GuideOne Life Insurance Company (GuideOne). GuideOne principally marketed traditional life and annuity products, as well as universal life and fixed deferred annuity products. In addition, the Company entered into a marketing arrangement with GuideOne Mutual Insurance Company, which allows GuideOne Mutual’s agents to sell the Company’s various traditional, interest sensitive and variable life and annuity products. Subsequent to the purchase, the Company merged GuideOne into Kansas City Life as a closed block of policies.
In 2006, the Company entered into a Master General Agent and Marketing Agreement which enables American Republic Insurance Company (American Republic) agents to market Kansas City Life’s insurance products. This agreement offers the Company additional distribution opportunities, while offering American Republic’s agents competitive life and annuity products to strengthen their portfolio of available products in which to serve their clients.
Business Segments
The Company has three reportable business segments, which are generally defined based on the nature of the products and services offered: Individual Insurance, Group Insurance and Old American.
The Individual Insurance segment consists of individual insurance products for both Kansas City Life and Sunset Life. Products are marketed through a nationwide sales force of independent general agents, agents and third-party marketing arrangements. Kansas City Life’s general agents and agents are contracted individually and are not exclusive with Kansas City Life. The Company does not restrict general agents or agents to designated sales territories. Kansas City Life provides
3
Table of Contents
commissions and allowances based primarily on sales results. In addition, the Company has two primary third-party arrangements, as described above, with GuideOne Mutual and American Republic. The Company has had selected occasions to use third-party arrangements for limited short-term product specific or market niche sales opportunities. The Individual Insurance segment consists of individual traditional life and immediate annuity products, as well as interest sensitive, deposit and investment products. Investment products include variable life and annuity products. The Individual Insurance segment generated approximately 54% of consolidated insurance revenues for the years ended December 31, 2010 and 2009 and 53% for the year ended December 31, 2008.
The Group Insurance segment is marketed through a nationwide sales force of independent general agents and agents, group brokers and third-party marketing arrangements. The Group segment consists of sales of group life and group accident and health products, composed of dental, long-term and short-term disability and vision products. This segment generated approximately 20% of consolidated insurance revenues for the years ended December 31, 2010 and 2009 and 21% for the year ended December 31, 2008. The Group Insurance segment is administratively operated as part of Kansas City Life and its administrative and accounting operations are part of the Company’s home office.
The Old American segment is marketed through a nationwide general agency sales force with exclusive territories, using direct response marketing to supply agents with leads. The Company manages the territories based upon production and directly supports and subsidizes general agent managers and agents with marketing leads and allowances based upon sales results. The Old American segment consists of individual insurance products designed primarily as final expense products for the senior market. The Old American segment accounted for 26% of consolidated insurance revenues for the years ended December 31, 2010, 2009 and 2008.
For more information concerning the Company’s business segments, please see Note 11 – Segment Information in the Notes to Consolidated Financial Statements and the Operating Results by Segment in the Management’s Discussion and Analysis of Financial Condition and Results of Operations section.
Marketing and Distribution
Kansas City Life, its insurance affiliates and its broker-dealer market individual life insurance and annuity products, including traditional, interest sensitive and variable products through its sales force and third-party marketing arrangements. The Company’s group insurance products are marketed through its sales force, group brokers and third-party marketing arrangements tailored toward group products. Kansas City Life markets traditional insurance products, consisting of term insurance, whole life insurance, life disability products and immediate annuities, including various supplementary contract options. The interest sensitive products are universal life, variable universal life, fixed deferred annuities and variable annuities. The group products marketed by the Company include life, dental, vision and long-term and short-term disability products. The Company offers investment products and broker-dealer services through its subsidiary SFS for both proprietary and non-proprietary variable life insurance and annuity products, mutual funds and other securities.
4
Table of Contents
The following table details the Company’s premiums and deposits by product mix for the years ended December 31.
| 2010 | % of Total |
2009 | % of Total |
|||||||||||||
| Product: |
||||||||||||||||
| Individual life insurance |
$ | 112,502 | 26% | $ | 109,696 | 25% | ||||||||||
| Immediate annuities |
22,342 | 5% | 22,141 | 5% | ||||||||||||
| Group life insurance |
10,676 | 3% | 10,964 | 2% | ||||||||||||
| Group accident & health insurance |
47,608 | 11% | 46,047 | 11% | ||||||||||||
| Other |
1,659 | - | 1,951 | 1% | ||||||||||||
| Total premiums |
194,787 | 45% | 190,799 | 44% | ||||||||||||
| Universal life insurance |
98,294 | 23% | 96,623 | 23% | ||||||||||||
| Variable universal life insurance |
12,779 | 3% | 14,062 | 3% | ||||||||||||
| Fixed deferred annuities |
99,894 | 23% | 103,141 | 24% | ||||||||||||
| Variable annuities |
27,246 | 6% | 25,816 | 6% | ||||||||||||
| Total deposits |
238,213 | 55% | 239,642 | 56% | ||||||||||||
| Total |
$ | 433,000 | 100% | $ | 430,441 | 100% | ||||||||||
The following table provides the geographic distribution of premiums and deposits by state greater than 5% of the total for the years ended December 31.
| State: | 2010 | State: | 2009 | |||||||
| Missouri |
9% | Texas | 10% | |||||||
| Texas |
9% | Missouri | 9% | |||||||
| Colorado |
6% | California | 7% | |||||||
| California |
6% | Kansas | 6% | |||||||
| Washington |
6% | Washington | 5% | |||||||
| Kansas |
5% | Colorado | 5% | |||||||
| All others |
59% | All others | 58% | |||||||
| Total |
100% | Total | 100% | |||||||
Individual Insurance
The Individual Insurance segment is comprised of sales of non-group products from Kansas City Life and the closed blocks of Sunset Life, GuideOne Life, and the reinsurance transaction originated in 1997. This segment also includes sales from third-party marketing arrangements, including American Republic and GuideOne Mutual. This segment offers an array of traditional whole life, term life and universal life products, along with fixed deferred and immediate annuity products and variable universal life and annuity products.
More specifically, Kansas City Life offers universal life products for individuals or for key employee coverage. This product has the ability to deliver flexibility in coverage and competitive long-term cash values or premiums that guarantee coverage for a desired period or through the insured’s lifetime. Kansas City Life also offers return-of-premium life products, traditional whole life products and products geared towards juveniles that offer additional coverage as the child ages. In addition, Kansas City Life offers multiple term life insurance products for a wide range of ages and coverage. Kansas City Life also offers variable universal life products that allow the policyholder to participate in equity market growth potential. Variable universal life combines the advantages of a range of investment options with life insurance.
Kansas City Life offers multiple fixed deferred annuity products that afford the policyholder options as to minimum single premium deposits or monthly contribution options. In addition, Kansas City Life offers immediate annuity products with a broad variety of payout options, including guaranteed specified amounts and life contingencies. Kansas City Life also offers variable annuity products which allow the policyholder to participate in equity market growth potential. These options include either single or flexible-premium contracts combined with the advantages of a range of investment options and the advantages of an annuity.
Finally, in both the individual life insurance products and annuity products, selected riders are also available for added coverage and protection.
5
Table of Contents
The following table details premiums and deposits by product mix for the Individual Insurance segment for the years ended December 31.
| 2010 | % of Total |
2009 | % of Total |
|||||||||||||
| Product: |
||||||||||||||||
| Individual life insurance |
$ | 46,280 | 15% | $ | 46,237 | 15% | ||||||||||
| Immediate annuities |
22,342 | 7% | 22,141 | 7% | ||||||||||||
| Other |
529 | - | 614 | - | ||||||||||||
| Total premiums |
69,151 | 22% | 68,992 | 22% | ||||||||||||
| Universal life insurance |
98,294 | 32% | 96,623 | 31% | ||||||||||||
| Variable universal life insurance |
12,779 | 4% | 14,062 | 5% | ||||||||||||
| Fixed deferred annuities |
99,894 | 33% | 103,141 | 34% | ||||||||||||
| Variable annuities |
27,246 | 9% | 25,816 | 8% | ||||||||||||
| Total deposits |
238,213 | 78% | 239,642 | 78% | ||||||||||||
| Total |
$ | 307,364 | 100% | $ | 308,634 | 100% | ||||||||||
The following table provides the geographic distribution of premiums and deposits by state greater than 5% of the total for the Individual Insurance segment for the years ended December 31.
| State: | 2010 | State: | 2009 | |||||||
| Texas |
9% | Texas | 11% | |||||||
| Missouri |
9% | Missouri | 8% | |||||||
| Colorado |
8% | California | 8% | |||||||
| California |
7% | Washington | 6% | |||||||
| Washington |
7% | Kansas | 6% | |||||||
| Florida |
6% | Colorado | 6% | |||||||
| Kansas |
6% | All others | 55% | |||||||
| All others |
48% | Total | 100% | |||||||
| Total |
100% | |||||||||
Closed Blocks
The Company has three sizable closed blocks of business, including Sunset Life and GuideOne which were acquired through the purchase of these companies and have since discontinued new sales. In addition, the Company has one block acquired as a direct reinsurance and servicing agreement. These closed blocks of business are declining in premiums and deposits and in force, and the Company seeks to conserve this business. The types of products included in these closed blocks are traditional life, immediate annuity, universal life and fixed deferred annuity policies and contracts.
Group Insurance
Kansas City Life offers a broad range of group products. The group portfolio has two primary markets, groups with 2 to 9 employees and groups with 10 or more employees. This segment’s marketing focus is to create a full range of products in the group life, dental, long-term and short-term disability areas, as well as vision products. This segment primarily uses three marketing approaches. The first is to market business using Kansas City Life’s internal sales representatives and an independent general agent and agent field force. The second is through an independent marketing third-party arrangement that primarily sells disability and group life products. These sales are predominantly reinsured with this segment receiving fees as a percentage of gross premiums. Business sold through this arrangement is administered through a separate third-party arrangement. Finally, this segment sells through other third-party arrangements that focus primarily on dental sales and long-term disability products and provides virtually all of the administration for the business that it sells. The Company accepts the risk for the dental sales in the Group segment, but the disability sales are mostly reinsured.
The Group Insurance segment tailors products and services to employees’ needs depending on among other things:
| • | Employer contributions towards the cost of coverage; |
| • | Employee participation levels; |
| • | Benefits desired versus product cost; |
| • | Number of employees; and |
| • | Plan design features, such as coinsurance percentages, deductibles, waiting periods, plan maximums and more. |
6
Table of Contents
This segment also assists employers using its flexible plan design for its group life product, which can include many features such as:
| • | Spouse and dependent benefits; |
| • | Annual enrollments; |
| • | Accidental death and dismemberment and waiver of premium benefit coverage; and |
| • | Policy conversion and portability privileges. |
The following table details premiums by product mix for the Group Insurance segment for the years ended December 31.
| 2010 | % of Total |
2009 | % of Total |
|||||||||||||
| Product: |
||||||||||||||||
| Group life insurance |
$ | 10,676 | 18% | $ | 10,964 | 19% | ||||||||||
| Group dental insurance |
31,850 | 55% | 32,060 | 56% | ||||||||||||
| Group disability insurance |
13,618 | 23% | 11,786 | 21% | ||||||||||||
| Other group insurance |
2,140 | 4% | 2,201 | 4% | ||||||||||||
| Total |
$ | 58,284 | 100% | $ | 57,011 | 100% | ||||||||||
The following table provides the geographic distribution of premiums by state greater than 5% of the total for the Group Insurance segment for the years ended December 31.
| State: | 2010 | State: | 2009 | |||||||
| Missouri |
12% | Missouri | 14% | |||||||
| Texas |
9% | Texas | 9% | |||||||
| North Carolina |
9% | North Carolina | 9% | |||||||
| Indiana |
6% | Indiana | 5% | |||||||
| All others |
64% | Kansas | 5% | |||||||
| Total |
100% | All others | 58% | |||||||
| Total | 100% | |||||||||
Old American
Old American sells final expense traditional life insurance products through a general agency system, with exclusive territories, using direct response marketing to supply agents with leads. Agents primarily market to individuals in the age range of 50 to 85, principally through final arrangements planning.
Old American offers several products geared primarily towards supporting policyholders’ final expense needs. This segment offers final expense products, including preferred products with guaranteed level death benefits for individuals in good health and sub-standard products with graded or increasing benefits for those individuals who cannot qualify for standard or preferred risk due to health issues. Old American also offers a juvenile product designed for parents or grandparents to insure children ages 0-15. In addition, Old American recently began offering a 20-Year Level Term life insurance product to individuals ages 20 – 65. Old American also offers several riders, including accidental death and dismemberment and waiver of premium. All of Old American’s products are traditional individual life insurance products.
Old American has focused on expanding its sales territories, recruiting and agent productivity for its general agencies in order to effectively meet the sales goals of the Company. Furthermore, this segment recently expanded its traditional product offerings by introducing a level term product to reach a younger target market along with enhancing its core whole life products. Finally, a main driving force behind Old American’s sales efforts is the approach to support its field force through its lead generation efforts.
7
Table of Contents
The following table provides the geographic distribution of premiums by state greater than 5% of the total for the Old American segment for the years ended December 31.
| State: | 2010 | State: | 2009 | |||||||
| Missouri |
7% | Missouri | 8% | |||||||
| Texas |
6% | Texas | 6% | |||||||
| Illinois |
6% | Illinois | 6% | |||||||
| Kansas |
5% | Kansas | 5% | |||||||
| California |
5% | Kentucky | 5% | |||||||
| All others |
71% | All others | 70% | |||||||
| Total |
100% | Total | 100% | |||||||
Reinsurance
Consistent with the general practice of the life insurance industry, the Company enters into traditional agreements of indemnity reinsurance with other insurance companies to support sales of new products and the in force business. The reinsurance arrangements have taken various forms over the years. The Company has reinsurance in force on all of the following bases: automatic and facultative; yearly renewable term (YRT) and coinsurance; and excess and quota share basis. For additional information pertaining to the Company’s significant reinsurers, along with additional information pertaining to reinsurance, please see Note 13 – Reinsurance in the Notes to Consolidated Financial Statements.
Currently, new sales of traditional life and universal life products are reinsured on a YRT basis in excess of the Company’s retention limits while sales of certain term life insurance products are reinsured on a quota share (a portion of each policy is reinsured), coinsurance basis. Sales of group disability income products are reinsured on a quota share coinsurance basis. New sales of group life are reinsured on an excess of retention basis with the accidental death and dismemberment benefits being 100% reinsured. The Company’s maximum retention limit on individual life insurance products is three hundred fifty thousand dollars and on group life business is one hundred thousand dollars.
In addition to reinsurance coverage for new business, the Company has also engaged in various reinsurance arrangements for in force blocks of business:
| • | In 1991, the Company purchased Old American Insurance Company. Old American had an existing coinsurance agreement in place that ceded on a 100% coinsurance basis certain whole life policies issued by Old American prior to December 1, 1986. These policies had life insurance in force of $36.8 million as of December 31, 2010 (2009 – $40.9 million) with a ceded reserve for future policy benefits under this agreement of $20.1 million (2009 – $21.9 million). |
| • | In 1997, the Company acquired a block of traditional life and universal life products by way of a coinsurance and servicing agreement with another insurer. Investments equal to the policy reserves are held in a trust to secure payment of the estimated liabilities relating to the policies. At December 31, 2010, the block had $1.4 billion of life insurance in force (2009 – $1.5 billion) and a reserve of $215.4 million (2009 – $221.6 million). |
| • | In 1998, Old American executed a coinsurance agreement ceding 100% of its retained risk on a closed block of individual accident and health business. At December 31, 2010, the reserve credit on these policies was $13.1 million (2009 – $13.7 million). |
| • | In 2002, Sunset Life entered into a yearly renewal term bulk reinsurance agreement whereby it ceded 80% of its retained mortality risk on traditional and universal life policies. This was accomplished through a reinsurance pool involving four primary reinsurers. As of December 31, 2010, the ceded insurance in force was approximately $1.4 billion (2009 – $1.7 billion) with reserves of $4.7 million (2009 – $4.7 million). |
Governmental Regulations
The Company is subject to state regulations in its states of domicile and in the states in which it does business. Although the federal government generally does not regulate the business of insurance, federal initiatives often have an impact on the business in a variety of ways, including the taxation of insurance companies and the tax treatment of insurance products. In addition, the Company is a stock life insurance company and is subject to the rules and regulations of the United States Securities and Exchange Commission (SEC). SFS is a registered broker-dealer, which is regulated by the Financial Industry Regulatory Authority (FINRA) and the SEC.
8
Table of Contents
State Regulation
State insurance laws establish extensive regulation and supervisory agencies with broad regulatory authority, including the power to:
| • | Grant and revoke licenses to companies to transact business and to license agents; |
| • | Regulate and supervise trade practices and market conduct; |
| • | Establish guaranty associations which levy mandatory fees used for insurers with solvency issues; |
| • | Approve policy forms; |
| • | Establish reserve requirements; |
| • | Prescribe the form and content of required financial statements and reports; |
| • | Determine the reasonableness and adequacy of statutory capital and surplus; |
| • | Perform financial, market conduct and other examinations; |
| • | Define acceptable accounting principles for statutory reporting purposes; |
| • | Regulate the type and amount of permitted investment activity; and |
| • | Limit the amount of dividends that can be paid without regulatory approval. |
The Company’s life insurance entities are subject to periodic examinations by state regulatory authorities. These examinations are performed on a basis other than GAAP, namely statutory accounting principles. The most recently completed examination performed by the State of Missouri occurred as of December 31, 2005 for Kansas City Life, Sunset Life and Old American. As previously disclosed in other public filings, there were no adjustments recommended to any of the insurance companies as a result of that examination. By statute, the State of Missouri is required to periodically perform such examinations and accordingly, is currently finalizing a financial examination as of December 31, 2009.
The National Association of Insurance Commissioners (NAIC) has received regulatory authority by the respective state departments of insurance. Accordingly, the NAIC has been able to establish more consistency for insurers with regard to financial reporting requirements. In one such measure, the NAIC has adopted risk-based capital (RBC) guidelines to assist in the evaluation of the adequacy of statutory capital and surplus in relation to an insurance company’s risks. RBC requirements are intended to be used by insurance regulators as an early warning tool to identify deteriorating or weakly capitalized insurance companies for the purpose of initiating regulatory action. RBC guidelines consist of target statutory surplus levels based on the relationship of statutory capital and surplus to the sum of weighted risk exposures. While state insurance regulations prohibit an insurance company from making public statements or representations with regard to risk-based capital level, based upon these current guidelines, the insurance Company’s risk-based capital results are not expected to have a negative regulatory impact. At December 31, 2010 and 2009, the statutory capital and surplus of each of the Company’s insurance entities was substantially above the required levels. The NAIC continues to assess solvency issues and makes recommendations to enhance the existing guidelines.
Under insurance solvency or guaranty laws in most states in which the Company operates, insurers doing business can be assessed for policyholder losses related to insolvencies of other insurance companies. The amount and timing of any future assessments on the Company under these laws cannot be reasonably estimated and are beyond the control of the Company. For the three years ended December 31, 2010, the Company’s assessments, net of related premium tax credits, were not material.
Federal Regulation
The federal government does not directly regulate the business of insurance. However, the federal government does regulate through legislation and administrative policies several aspects of the business including but not limited to:
| • | The Sarbanes-Oxley Act (SOX) regarding financial reporting internal controls; |
| • | Pension regulations; |
| • | Certain employer hiring considerations, specifically including but not limited to race, age and sexual discrimination; |
| • | The sale of securities and investment-related products; |
| • | Corporate and individual taxation; |
| • | Prescribe the form and content of required financial statements and reports; |
| • | Define acceptable accounting principles for reporting purposes; |
| • | Health care reform; and |
| • | Other federal initiatives. |
In addition, legislation which has been passed and is also being contemplated could result in the federal government assuming some role in the regulation or oversight of insurance companies. Specifically, the Dodd-Frank Wall Street Reform and Consumer Protection Act may enhance and expand the federal government’s role in insurance company regulation.
9
Table of Contents
As a stock life insurance entity, the Company is also subject to the SEC’s regulations for such items as financial reporting requirements, accounting rules, public disclosure of accounting practices and policies, internal control regulations as defined under SOX, a wide variety of Board of Directors and company management issues promulgated under proxy statements and proxy disclosure related matters, and other items as may be enacted by legislation. These regulations place an expanded burden on insurance companies both in financial aspects as well as the timely filing and reporting of items covered under each of these requirements. In addition, future enactments may have a material impact on the Company, depending upon the regulation and its requirements.
Life insurance companies are taxed under the life insurance company provisions of the Internal Revenue Code of 1986, as amended (the Code). Provisions of the Code have various impacts on the Company and changes to the Code that may be enacted in the future could also negatively impact the Company’s net income and stockholders’ equity.
Competition and Ratings
The Company operates in the life insurance sector of the financial services industry in the United States. This industry is highly competitive with respect to products, pricing, selection of products and quality of service. No single competitor or any small group of competitors dominates any of the markets in which the Company operates. General economic conditions may affect future results. Many of the Company’s competitors are considerably larger and have substantially greater financial resources, have higher ratings from rating agencies, have broader and more diversified product lines and have more agency relationships.
The Company’s insurance products compete with a wide variety of other products, including products from other insurance companies, financial intermediaries and other institutions. In addition, competition arises from a number of features, including crediting rates, policy terms and conditions, service provided to distribution channels and policyholders, ratings reputation and agent compensation. Insurance products also compete with products offered from mutual funds, traditional bank investments and other investment and retirement funding alternatives offered by asset managers, banks and broker-dealers.
The sales agents for the Company’s products use the financial strength ratings assigned to an insurer by independent rating agencies as one factor in their sales materials. The market has generally been influenced by those insurers with the highest ratings. However, the degree to which ratings and changes in ratings affect sales and persistency cannot be definitively measured.
Following is a summary of the Company’s insurance ratings for the three insurance companies, as assigned by the A. M. Best Company, which is an independent rating agency.
| 2010 | 2009 | 2008 | ||||
| Kansas City Life |
A (Excellent) Stable | A (Excellent) Stable | A (Excellent) Stable | |||
| Sunset Life |
A (Excellent) Stable | A (Excellent) Stable | A (Excellent) Stable | |||
| Old American |
B++(Good) Positive | B++(Good) Stable | B++(Good) Stable |
Financial strength ratings generally involve quantitative and qualitative evaluations by rating agencies of a company’s financial condition and operating performance. Generally, rating agencies base their ratings upon information furnished to them by the insurer and upon their own investigations, studies and assumptions. Ratings are based upon factors of concern to policyholders, agents and intermediaries and are not directed toward the protection of investors and are not recommendations to buy, sell or hold securities.
In addition to the financial strength ratings, rating agencies use an “outlook statement” to indicate a medium or long-term trend which, if continued, may lead to a rating change. A positive outlook indicates a rating may be raised and a negative outlook indicates a rating may be lowered. A stable outlook is assigned when ratings are not likely to be changed. Outlook statements should not be confused with expected stability of the issuer’s financial or economic performance. A rating may have a stable outlook to indicate that the rating is not expected to change, but a stable outlook does not preclude a rating agency from changing a rating at any time without notice.
A. M. Best Company ratings currently range from “A++” (Superior) to “F” (In Liquidation), and include 16 separate ratings categories. Within these categories, “A++” (Superior) and “A+” (Superior) are the highest, followed by “A” (Excellent) and “A-” (Excellent) then followed by “B++” (Good) and “B+” (Good). A. M. Best Company reviews its ratings of insurance companies from time to time. There can be no assurance that any particular rating will continue or that it will not be changed or withdrawn entirely if, in their judgment, circumstances so warrant.
10
Table of Contents
Employees
The Company had 446 full-time employees as of December 31, 2010. The Company experienced no work stoppages or strikes and considers relations with its employees to be good. None of the Company’s employees are represented by a union.
Access to Public Filings
Additional information about the Company beyond what is included in this Form 10-K is available at the Company’s website: www.kclife.com. You may also read and copy these materials at the SEC’s Public Reference Room at 100 F Street, NE, Washington, DC 20549, or obtain them by calling the SEC at 1-800-SEC-0330. The SEC also maintains an Internet website that contains reports, proxy and other information statements and other information regarding issuers that file electronically with the SEC at www.sec.gov. You may also access the SEC website through a link on the Company’s website. The Company will provide a copy of any of those reports free of charge upon request.
None of the information on the Company’s website that is not otherwise expressly set forth or incorporated by reference in the Form 10-K is a part of this Form 10-K.
11
Table of Contents
The operating results of life insurance companies have historically been subject to significant fluctuations. The factors which could affect the Company’s future results include, but are not limited to, general economic conditions and the known trends and uncertainties which are discussed more fully below.
The Company operates in a mature, highly competitive industry, which could limit its ability to grow sales or maintain its position in the industry and negatively affect profitability.
Life insurance is a mature and highly competitive industry. The Company encounters significant competition in all lines of business from other insurance companies, many of which have greater financial resources, a greater market share, a broader range of products, lower product prices, better name recognition, greater actual or perceived financial strength, higher claims-paying ratings, the ability to assume a greater level of risk, lower operating or financing costs, or lower profitability expectations.
Changes in the business environment and competition could negatively affect the Company’s ability to maintain or increase its profitability.
In recent years, there has been substantial consolidation and convergence among companies in the financial services industry, resulting in increased competition from large, well-capitalized financial services firms. Furthermore, many of these larger competitors may have lower operating costs and an ability to absorb greater risk while maintaining their financial strength ratings, thereby allowing them to price their products more competitively. The Company expects consolidation to continue, thereby increasing competitive pressures.
Changes in demographics, particularly the aging of the population and the decline in the number of agents in the industry, affect the demand for life insurance products. Also, as technology evolves, customers and agents may be able to compare products of any particular company with any other, which could lead to increased competition as well as changes in agent or customer behavior, including persistency that differs from past behavior.
The Company may be unable to attract agencies and sales representatives.
The Company sells insurance and annuity products through independent agents and agencies. These agencies and sales representatives are not captive and may sell products of the Company’s competitors. The Company’s ability to compete is dependent upon, among other things, its ability to attract agents and agencies to market its insurance products, its ability to develop competitive and profitable products, its ability to maintain low unit costs, and its maintenance of strong financial strength ratings. Sales and the results of operations and financial condition could be adversely affected if the Company is unsuccessful in attracting agencies and sales representatives.
The Company’s ability to retain agents and sales representatives is dependent upon a number of factors including: the ability of the Company to maintain a competitive compensation system while also offering products that offer competitive features and benefits for policyholders; the ability to maintain a level of service that effectively supports the agent and sales representative needs; and the ability to approve and monitor agent and sales representative sales and business practices that are consistent with regulatory requirements and expectations of the Company.
The Company’s ability to maintain competitive unit costs is dependent upon the level of new sales.
The Company’s ability to maintain competitive unit costs is dependent upon a number of factors, such as the level of new sales, persistency (continuation or renewal) of existing business, and expense management. A decrease in sales or the amount of total existing business or deterioration in the profitability of the existing business without a corresponding reduction in expenses may result in higher unit costs, which would affect the Company’s operating results.
The Company’s ability to grow depends in large part upon the continued availability of capital.
The Company deploys significant amounts of capital to support its sales and acquisition efforts. Although the Company believes it has sufficient capital to fund its immediate growth and capital needs, the amount of capital available could vary in the future due to a variety of circumstances, some of which are neither predictable nor foreseeable, nor within the Company’s control. A lack of sufficient capital could impair the Company’s ability to grow.
12
Table of Contents
Adverse capital and credit market conditions may significantly affect the Company’s ability to meet liquidity needs, as well access to capital and cost of capital.
The capital and credit markets experienced extreme volatility and disruption in recent periods. The volatility and disruption reached unprecedented levels and the markets exerted downward pressure on availability of liquidity and credit for certain issuers. Although the Company has not issued new equity or debt securities in recent years, including 2010 and 2009, the Company’s results of operations, financial condition, cash flows and statutory capital position could be materially adversely affected by future disruptions in the capital and credit markets.
The Company’s level of cash and investments, along with expected cash inflows from investments and operations, is believed to be adequate to meet anticipated short-term and long-term benefit and expense payment obligations. However, withdrawal and surrender levels may differ from anticipated levels for a variety of reasons, such as changes in economic conditions, changes in policyholder behavior, changes in agent practices, or changes in the Company’s claims-paying ability or financial strength ratings. A rating downgrade in the Company’s financial strength or credit ratings may increase policy surrenders and withdrawals, reduce new sales and may result in terminated relationships with distributors such as agents, general agents and third-party administrators. A downgrade could also impact existing liabilities and increase the Company’s cost of capital. Any of these occurrences could adversely affect the Company’s profitability and financial condition. In the event that the Company’s current internal sources of liquidity do not satisfy the needs, additional financing may be required and, in such case, the Company may not be able to successfully obtain additional financing on favorable terms, or at all. The availability of additional financing will depend on a variety of factors such as market conditions, the general availability of credit, the volume of trading activities, the overall availability of credit to the financial services industry, the Company’s credit ratings and credit capacity, as well as the possibility that customers or lenders could develop a negative perception of long- or short-term financial prospects if the Company incurs large realized or unrealized investment losses or if the level of business activity is decreased due to a market downturn. Similarly, access to funds may be impaired if regulatory authorities or rating agencies take negative actions against the Company.
Disruptions, uncertainty or volatility in the capital and credit markets may also limit the Company’s access to external sources of liquidity, which could be required to operate its business. Such market conditions could limit the Company’s ability to replace, in a timely manner, maturing liabilities; satisfy capital requirements; fund redemption requests on insurance or other financial products; generate fee income and market-related revenue; meet liquidity needs, and access the capital necessary to grow the business. As such, the Company could be forced to delay raising capital, utilize available internal resources or bear an unattractive cost of capital, which could decrease the Company’s profitability and significantly reduce financial flexibility and liquidity.
The Company may be unable to complete additional acquisitions.
One of the Company’s growth strategies is to acquire other life insurance companies and/or blocks of business. The Company’s previous acquisitions have increased earnings by allowing the Company to realize certain operating efficiencies or increase sales. There can be no assurance, however, that suitable acquisitions that present opportunities for continued growth and operating efficiencies will continue to be available to the Company. Further, sufficient capital to fund acquisitions may not be available at the time opportunities become available.
The Company may not realize its anticipated financial results from its acquisitions.
The completion of an acquisition may be more costly or take longer than expected. There may be unforeseen liabilities that arise in connection with businesses that the Company acquires. Additionally, in connection with its acquisitions, the Company assumes or otherwise becomes responsible for the obligations of policies and other liabilities of other insurers. Any regulatory, legal, financial, or other adverse development affecting the other insurer could also have an adverse effect on the Company.
The Company’s policy claims fluctuate from period to period, resulting in earnings volatility.
The Company’s financial results may fluctuate from period to period due to fluctuations in policy claims incurred by the Company. However, the Company reinsures a significant amount of the mortality risk on fully underwritten and newly issued individual life insurance contracts. The Company regularly reviews retention limits for continued appropriateness and they may be changed in the future. If the Company was to experience significant adverse mortality or morbidity experience, a significant portion of that expense would be reimbursed by reinsurers.
Significant adverse mortality experience may result in the loss of, or higher prices for, reinsurance.
Prolonged or severe adverse mortality or morbidity experience could result in increased reinsurance costs, and ultimately, reinsurers not being willing to offer coverage. If the Company was unable to maintain its current level of reinsurance or purchase new reinsurance protection in amounts considered sufficient, the Company would either have to be willing to accept an increase in net exposures or revise pricing to reflect higher reinsurance premiums. If this were to occur, the Company may be exposed to reduced profitability and cash flow strain or may not be able to price new business at competitive rates.
13
Table of Contents
The Company’s results may be negatively affected should actual experience differ from management’s assumptions and estimates.
In the conduct of business, the Company makes certain assumptions regarding the mortality, persistency, expenses, interest rates, tax liability, business mix, policyholder behavior or other factors appropriate to the type of business it expects to experience in future periods. These assumptions are also used to estimate the amounts of deferred policy acquisition costs, value of business acquired, policy reserves and accruals, future earnings and various components of the Company’s balance sheet. These assumptions are used in the operations of the Company’s business in making decisions crucial to the success of the Company, including the pricing of products and expense structures relating to products. The Company’s actual experience and changes in estimates are reflected in the Company’s financial statements. The Company’s actual experience may vary from period to period, and from established assumptions, potentially resulting in variability in the financial statements.
The Company’s reserves for future policy benefits may prove to be inadequate.
The Company establishes and carries as a liability reserves based on estimates of how much will be needed to pay for future benefits and claims. The assumptions and estimates used in connection with establishing and carrying reserves are inherently uncertain and in some cases are mandated by regulators. If actual experience is significantly different from assumptions or estimates or if regulators decide to increase or change regulations, reserves may prove to be inadequate in relation to estimated future benefits and claims. As a result, a charge to earnings would be incurred in the quarter in which the Company increases reserves.
The pattern of amortizing Deferred Acquisition Costs (DAC) and Value of Business Acquired (VOBA) may change, impacting both the level of the asset and the timing of the Company’s net income (loss).
Amortization of DAC and VOBA depend on the actual and expected profits generated by the lines of business that incurred the costs. Expected profits are dependent on assumptions regarding a number of factors, including investment returns, benefit payments, expenses, mortality and policy lapse. Due to the uncertainty associated with establishing these assumptions, the Company cannot determine the exact pattern of profit emergence. As a result, amortization of DAC and VOBA will vary from period-to-period as actual profits replace expected profits and future expected profits are re-projected based on the current status of the lines of business. To the extent that actual experience emerges less favorably than expected or expectations for future profits decrease, the DAC and VOBA assets may be reduced. This would likely result in reduced profitability in the current period.
Assumptions and estimates involve judgment and are subject to changes and revision over time.
The calculations the Company uses to estimate various components of its financial statements are necessarily complex and involve analyzing and interpreting large quantities of data. The Company employs various techniques for such calculations and, from time to time, will develop and implement more sophisticated systems and procedures capable of facilitating the calculation of more precise estimates. Accordingly, the Company’s results may be affected, positively or negatively, by actual results differing from assumptions, by changes in estimates, and by changes resulting from implementing new administrative systems and procedures that facilitate the calculation of more precise estimates.
The Company’s reinsurers could fail to meet assumed obligations or be subject to adverse developments that could affect the Company.
The Company follows the insurance practice of reinsuring a portion of the risks under the policies written by the Company (known as ceding). The Company cedes significant amounts of insurance to other insurance companies through reinsurance. This reinsurance makes the assuming reinsurer liable to the Company for the reinsured portion of the risk. However, reinsurance does not discharge the Company from its primary obligation to pay policyholders for losses insured under the policies that are issued. Therefore, the Company is subject to the credit risk of reinsurers and the failure of one or more of the Company’s reinsurers could negatively impact the Company’s earnings and financial position.
The Company’s ability to compete is dependent on the availability of reinsurance, cost of reinsurance or other substitute capital market solutions.
Premium rates charged by the Company are based, in part, on the assumption that reinsurance will be available at a certain cost. Under certain reinsurance agreements, the reinsurer may increase the rate it charges the Company for the reinsurance. Therefore, if the cost of reinsurance were to increase for existing business, or if reinsurance were to become unavailable for new business, or if alternatives to reinsurance were not available, the Company could be adversely affected.
14
Table of Contents
Recently, access to reinsurance has become more costly for the Company, as well as the insurance industry in general. In recent years, the number of life reinsurers has decreased as the reinsurance industry has consolidated. The decreased number of participants in the life reinsurance market results in increased concentration risk for insurers, including the Company. If the reinsurance market further contracts, the Company’s ability to continue to offer its products on terms favorable to the Company could be adversely impacted.
The use of reinsurance introduces variability in the Company’s financial statements.
The timing of premium payments to and receipt of expense allowances from reinsurers may differ from the Company’s receipt of customer premium or deposit payments and incurrence of expenses. Reinsurance may introduce variability in certain components of the Company’s financial statements.
The Company’s investments are subject to market and credit risks.
The Company’s invested assets, primarily including fixed income securities, are subject to customary risks of credit defaults and changes in fair value. The value of the Company’s commercial mortgage loan and real estate portfolios also depends on the financial condition of the tenants occupying the properties which the Company has financed. Factors that may affect the overall default rate on and fair value of the Company’s invested assets include interest rate levels and changes, availability and cost of liquidity, financial market performance, and general economic conditions, as well as particular circumstances affecting the businesses of individual borrowers and tenants.
Interest rate fluctuations could negatively affect the Company’s spread income or otherwise impact its business.
Because the profitability of fixed annuity and interest-sensitive whole life, universal life and the fixed portion of variable universal life insurance business depends in part on interest rate spreads, interest rate fluctuations could negatively affect profitability. Changes in interest rates may reduce both the profitability and the return on invested capital.
Some of the Company’s products, principally fixed annuities and interest-sensitive whole life, universal life and the fixed portion of variable universal life insurance, have interest rate guarantees that expose the Company to the risk that changes in interest rates will reduce the spread, or the difference between the amounts the Company is required to credit to policyholder contracts and the amounts earned by the Company on general account investments. Declines in spread or instances where the returns on the general account investments are not sufficient to support the interest rate guarantees on these products could have a material adverse effect on the results of operations. In periods of increasing interest rates, the Company may not be able to replace the assets in the general account with higher yielding assets needed to fund the higher crediting rates that may be necessary to keep interest sensitive products competitive. The Company, therefore, may have to accept a lower spread and profitability or face a decline in sales and loss of existing contracts from non-renewed maturities or early withdrawals or surrenders. In periods of declining interest rates, the Company has to reinvest the cash received from interest or return of principal on investments in lower yielding instruments then available. Moreover, issuers of fixed-income securities and borrowers may prepay these obligations in order to borrow at lower market rates, which exacerbates the risk for the Company of having to reinvest at lower rates.
The Company is entitled to reset the interest rates it credits on fixed-rate annuities but only at limited, pre-established intervals. Because many of the Company’s policies have guaranteed minimum interest or crediting rates, spreads could decrease and potentially become negative. Increases in interest rates may cause increased surrenders and withdrawals of insurance products. In periods of increasing interest rates, policy loans and surrenders and withdrawals of life insurance policies and annuity contracts may increase as policyholders seek to buy products with higher returns. These outflows may require investment assets to be sold at a time when the prices of those assets are lower because of the increase in market interest rates, which may result in realized investment losses.
Changes in interest rates may also impact the business in other ways. Lower interest rates may result in lower sales of certain of the Company’s insurance products. Higher interest rates may create a less favorable environment for the origination of mortgage loans. Higher interest rates may also result in lower sales of variable products. Further, higher interest rates may result in significant unrealized losses on investments, which could cause changes in agent and policy retention and new product sales.
While the Company develops and maintains asset/liability management programs and procedures designed to mitigate the effect on spread income in rising or falling interest rate environments, no assurance can be given that changes in interest rates will not affect such spreads. Additionally, the Company’s asset/liability management programs incorporate assumptions about the relationship between short-term and long-term interest rates (i.e., the slope of the yield curve) and relationships between risk-adjusted and risk-free interest rates, market liquidity, and policyholder behavior in periods of changing interest rates and other factors. The effectiveness of the Company’s asset/liability management programs and procedures may be negatively affected whenever actual results differ from these assumptions.
15
Table of Contents
The Company’s valuation of fixed maturity and equity securities may include methodologies, estimations and assumptions which are subject to differing interpretations and could result in changes to investment valuations that may have a material adverse effect on the results of operations or financial condition.
Fixed maturity securities, equity securities, and short-term investments are reported at fair value on the consolidated balance sheets and represent the majority of total cash and invested assets. Financial Accounting Standards Board (FASB) Accounting Standards Codification (ASC) 820 establishes a three-level hierarchy that prioritizes the inputs to valuation techniques used to measure fair value. The level in the fair value hierarchy is based on the priority of the inputs to the respective valuation technique. The fair value hierarchy gives the highest priority to quoted prices in active markets for identical assets or liabilities (Level 1) and lowest priority to unobservable inputs (Level 3). An asset or liability’s classification within the fair value hierarchy is based on the lowest level of significant input to its valuation.
During periods of market disruption, including periods of significantly rising or high interest rates, rapidly widening credit spreads or illiquidity, it may be difficult to value certain securities if trading becomes less frequent and/or market data becomes less observable. There may be certain asset classes such as certain residential mortgage-backed securities, collateralized debt obligations and asset-backed securities that were previously acquired and valued in active markets with significant observable data and that are required to be valued in illiquid markets with little observable data. In such cases, more securities may be classified in Level 3 and, therefore, require more subjectivity and management judgment. As such, valuations may include inputs and assumptions that are less observable or require greater estimation as well as valuation methods which are more complex or require increased estimation, thereby resulting in values which may have greater variance from the value at which the investments may or could be ultimately sold. Further, rapidly changing credit and equity market conditions could materially impact the valuation of securities as reported with the consolidated financial statements, and the period-to-period changes in value could vary significantly. Decreases in value could have a material adverse effect on the Company’s results of operations or financial condition.
Equity market volatility could negatively impact the Company’s profitability.
The Company is exposed to equity market volatility in the following ways:
| • | The Company has exposure to equity price risk but it is limited due to the relatively small equity portfolio held during the periods presented. |
| • | The Company earns investment management fees and mortality and expense fee income based upon the value of the Company’s separate accounts. Revenues from these sources fluctuate with changes in the fair value of the separate accounts. |
| • | Volatility in equity markets may discourage purchasers of variable separate account products that have returns linked to the performance of the equity markets and may also result in existing customers withdrawing cash values or reducing investments in those products. |
| • | The Company has equity price risk to the extent that it may affect the liability recognized under guaranteed minimum death benefits and guaranteed minimum withdrawal benefit provisions of the variable contracts. Periods of significant and sustained downturns in equity markets, increased equity volatility or reduced interest could result in an increase in the valuation of the future policy benefit or policyholder account balance liabilities associated with such products which ultimately results in a reduction to net income. |
| • | The amortization of deferred acquisition costs relating to variable products can fluctuate with changes in the performance of the underlying separate accounts. |
The determination of the amount of realized and unrealized impairments and allowances established on the Company’s investments is highly subjective and could materially impact results of operations or financial position.
The determination of the amount of impairments and allowances vary by investment type and is based upon the Company’s evaluation and assessment of known and inherent risks associated with the respective asset class. Such evaluations and assessments are revised as conditions change and new information becomes available. There can be no assurance that the assumptions, methodologies and judgments employed in these evaluations and assessments will be accurate or sufficient in later periods. As a result, additional impairments may need to be realized or allowances provided in future periods. Further, historical trends may not be indicative of future impairments or allowances.
16
Table of Contents
Additionally, the Company considers a wide range of factors about security issuers and uses its best judgment in evaluating the cause of the decline in the fair value of the security and in assessing the prospects for recovery. Inherent in management’s evaluation of the security are assumptions and estimates about the operations of the issuer, its future earnings potential and the ability and timeliness of the security’s recovery in fair value.
The Company could be forced to sell investments at a loss to meet policyholder withdrawals.
Many of the products offered by the Company allow policyholders and contract holders to withdraw their funds under defined circumstances. The Company manages liabilities and configures the investment portfolio so as to provide and maintain sufficient liquidity to support anticipated withdrawal demands and contract benefits and maturities. While the Company owns a significant amount of liquid assets, a certain portion of investment assets are relatively illiquid. If the Company experiences unanticipated withdrawal or surrender activity, the Company could exhaust all other sources of liquidity and be forced to liquidate assets, perhaps on unfavorable terms. If the Company is forced to dispose of assets on unfavorable terms, it could have an adverse effect on the Company’s results of operations and financial condition.
The Company invests in certain low income housing real estate properties specifically to generate state and federal tax credits. These tax credits have become targets of regulatory bodies to reduce the available tax credits. Additionally, economic forces may negatively impact the ongoing performance of these investments.
In recent periods, both the state and federal governments have offered selected tax credits for low income housing real estate properties. These tax credits have become the targets of certain regulators to either reduce or to eliminate the available credits that companies can receive. The willingness of regulators to reduce or eliminate these available credits could have a negative impact to the Company’s tax strategy. In addition, the economic environment may negatively impact the operating performance of these properties and result in either losses for these properties or tax credit recapture to the holders of these credits. Accordingly, these items may negatively impact or impair the value of the properties or the current or future ability to realize or maintain tax credits previously recognized or tax credits to be realized in the future.
The Company may be exposed to environmental liability from its commercial loan and real estate investments.
The Company customarily conducts environmental assessments prior to making commercial mortgage loans secured by real estate and before taking title to real estate. Based on the Company’s environmental assessments made through the date of the financial statements, the Company believes that any compliance costs associated with environmental laws and regulations or any remediation of affected properties would not have a material adverse effect on the Company’s results of operations or financial condition. However, no assurance can be provided that material compliance costs will not be incurred by the Company in future periods.
The Company’s mortgage loan investments in the pacific region of the United States may subject it to losses resulting from certain natural catastrophes in this area.
The Company has a sizeable concentration of commercial mortgage loans in the pacific region of the United States. This concentration exposes the Company to potential losses resulting from certain natural catastrophes, such as earthquakes and fires, which may occur in the region. While the Company diversifies its commercial mortgage loan portfolio in this region by both location and type of property in an effort to reduce catastrophic exposure, such diversification does not eliminate the risk of such losses, which could have a material adverse effect on the Company’s business, financial position, results of operations or cash flows.
The Company’s mortgage loan investments in regions with significant concentration may subject it to losses resulting from the impact of the economic downturn in that region.
The Company has a sizeable concentration of commercial mortgage loans in certain regions of the United States. The pacific region, among others, has been particularly negatively impacted by the economic downturn. If economic conditions in these regions continue to decline, it could have a material adverse effect on the Company’s business, financial position, results of operations or cash flows.
Unauthorized disclosure of sensitive or confidential corporate or customer information through a breach of the Company’s computer systems or otherwise could severely harm the Company.
As part of the Company’s normal course of business, it collects, processes, and retains sensitive and confidential corporate and customer information. Despite the security measures the Company has in place, its facilities and systems may be vulnerable to security breaches, acts of vandalism, computer viruses, misplaced or lost data, programming and/or human error, or other similar events. Any security breach involving the misappropriation, loss or other unauthorized disclosure of confidential information by the Company could severely damage its reputation, expose it to an increase in the risk of litigation, disrupt its operations, incur significant technical, legal and operating expenses or otherwise harm its business.
17
Table of Contents
Insurance companies are highly regulated and are subject to numerous legal restrictions and regulations.
The Company is subject to government regulation in each of the states in which business is conducted. Such regulation is vested in state agencies having broad administrative and, in some instances, discretionary power dealing with many aspects of the Company’s business. This may include, among other things, premium rates and increases thereto, reserve requirements, marketing practices, advertising, privacy, policy forms, reinsurance reserve requirements, acquisitions, mergers, and capital adequacy. Government regulation of insurers is concerned primarily with the protection of policyholders and other customers rather than share owners. Interpretations of regulations by regulators may change and statutes, regulations and interpretations may be applied with retroactive impact, particularly in areas such as accounting or reserve requirements.
The Company cannot predict whether or in what manner regulatory reforms will be enacted and, if so, whether the enacted reforms will positively or negatively affect the Company or whether any effects will be material. Moreover, although with respect to some financial regulations and guidelines, states defer to the interpretation of the insurance department of the state of domicile, neither the action of the domiciliary state nor action of the National Association of Insurance Commissioners (NAIC) is binding on a state. Accordingly, a state could choose to follow a different interpretation.
Other types of regulation that could affect the Company include insurance company investment laws and regulations, state statutory accounting practices, anti-trust laws, minimum solvency requirements, state securities laws, federal privacy laws, insurable interest laws, federal money laundering and anti-terrorism laws. Further, because the Company owns and operates real property, state, federal and local environmental laws could affect the Company. The Company cannot predict what form any future changes in these or other areas of regulation affecting the insurance industry might take or what effect, if any, such proposals might have on the Company if enacted into law.
The Company is also subject to government regulation at the federal level. One such regulation is the Dodd-Frank Wall Street Reform and Consumer Protection Act, which was passed in July of 2010. This Act focuses on financial reform and may result in significant changes to the regulation of institutions operating in the financial services industry, including the Company. Legislative or regulatory requirements imposed by or promulgated in connection with this Act may make it more expensive for the Company to conduct its business, may have a material adverse effect on the overall business climate and could materially affect the profitability of the results of operations and financial condition of financial institutions. The Company is uncertain as to all of the impacts that this new legislation will have and cannot provide assurance that it will not adversely affect its results of operations and financial condition. In general, government regulation at the federal level may increase and may result in unpredictable consequences for the Company.
Publicly held companies in general and the financial services industry, in particular, are sometimes the target of law enforcement investigations and the focus of increased regulatory scrutiny.
The financial services industry has become the focus of increased scrutiny by regulatory and law enforcement authorities relating to allegations of improper special payments, price-fixing, bid-rigging and other alleged misconduct, including payments made by insurers and other financial services providers to brokers and the practices surrounding the placement of insurance business and sales of other financial products.
New accounting rules or changes to existing accounting rules could negatively impact the Company.
Like all publicly traded companies, the Company is required to comply with U.S. generally accepted accounting principles (GAAP). A number of organizations are instrumental in the development and interpretation of GAAP, such as the SEC, the Public Company Accounting Oversight Board (PCAOB), the FASB, and the American Institute of Certified Public Accountants (AICPA).
GAAP is subject to constant review by these organizations and others in an effort to address emerging accounting rules and issue interpretative accounting guidance on a continual basis. The implementation of new accounting guidance could result in substantial costs and or changes in assumptions or estimates, which could negatively impact the results of operations for the Company. Accordingly, the Company can give no assurance that future changes to GAAP or the required adherence to International Financial Reporting Standards (IFRS) will not have a negative impact on the Company.
In addition, the Company is required to comply with statutory accounting principles (SAP). SAP and various components of SAP, such as statutory actuarial reserving methodology, are subject to constant review by the NAIC, NAIC taskforces and committees, as well as state insurance departments to address emerging issues and otherwise improve or alter financial reporting. Various proposals are typically pending before committees and taskforces of the NAIC. If enacted, some of these may negatively affect the Company and some could positively impact the Company. The NAIC also typically works to reform state regulation in various areas, including reforms relating to life insurance reserves and the accounting for such reserves. The Company cannot predict whether or in what manner reforms will be enacted and, if so, whether the enacted reforms will positively or negatively affect the Company. Although states generally defer to the interpretation of the insurance department of the state of domicile with regards to regulations and guidelines, neither the action of the domiciliary state nor action of the NAIC is binding on a state. Accordingly, a state could choose to follow a different interpretation. The Company can give no assurance that future changes to SAP or components of SAP will not have a negative impact on the Company.
18
Table of Contents
Changes to tax law or interpretations of existing tax law could adversely affect the Company and its ability to compete with non-insurance products or reduce the demand for certain insurance products.
Under the Internal Revenue Code of 1986, as amended (the Code), income tax payable by policyholders on investment earnings is deferred during the accumulation period of certain life insurance and annuity products. This favorable tax treatment may give certain of the Company’s products a competitive advantage over other non-insurance products. To the extent that the Code is revised to reduce the tax-deferred status of life insurance and annuity products or to increase the tax-deferred status of competing products, all life insurance companies, including the Company, would be adversely affected with respect to their ability to sell such products. Further, depending upon grandfathering provisions, life insurance companies would be affected by the surrenders of existing annuity contracts and life insurance policies. Changes in tax law, which have reduced the federal income tax rates on corporate dividends in certain circumstances, could make the tax advantages of investing in certain life insurance or annuity products less attractive. Additionally, changes in tax law based on proposals to establish new tax-advantaged retirement and life savings plans, if enacted, could reduce the tax advantage of investing in certain life insurance or annuity products. The Company cannot predict what changes to tax law or interpretations of existing tax law may ultimately be enacted or whether such changes could adversely affect the Company.
A rating downgrade could adversely affect the Company’s ability to compete and increase the number or value of policies surrendered.
The Company’s financial strength rating, which is intended to measure its ability to meet policyholder obligations, is an important factor affecting public confidence in most of the Company’s products and, as a result, the Company’s competitiveness. Rating organizations periodically review the financial performance and condition of insurers, including the Company, and downgrades of insurance companies occur frequently.
A downgrade in the Company’s rating could adversely affect the Company’s ability to sell its products, retain existing business, and compete for attractive acquisition opportunities. Rating organizations assign ratings based upon several factors. While most of the factors relate to the rated company, some of the factors relate to the views of the rating organization, general economic conditions and circumstances outside the rated company’s control. In addition, rating organizations use various models and formulas to assess the strength of a rated company, and from time to time rating organizations have, in their discretion, altered the models. Changes to the models could impact the rating organizations’ judgment of the rating to be assigned to the rated company. The Company cannot predict what actions rating organizations may take or what actions the Company may be required to take in response to the actions of the rating organizations, which could adversely affect the Company.
Financial services companies are frequently the targets of litigation, including class action litigation, which could result in substantial judgments.
A number of civil jury verdicts have been returned against insurers, broker-dealers, and other providers of financial services involving sales or claims practices, alleged agent misconduct, failure to properly supervise representatives, relationships with agents or other persons with whom the insurer does business, and other matters. Often these lawsuits have resulted in the award of substantial judgments that are disproportionate to the actual damages, including material amounts of punitive non-economic compensatory damages. In some states, juries, judges, and arbitrators have substantial discretion in awarding punitive and non-economic compensatory damages, which creates the potential for unpredictable material adverse judgments or awards in any given lawsuit or arbitration. Arbitration awards are subject to very limited appellate review. In addition, in some class actions and other lawsuits, companies have made material settlement payments.
The Company, like other financial services companies, is involved in litigation and arbitration in the ordinary course of business. Although the Company cannot predict the outcome of any litigation or arbitration, the results could have a negative impact on the financial condition or results of operations of the Company.
19
Table of Contents
The Company is exposed to the risks of climate change, natural disasters, pandemics or other acts that could adversely affect the Company’s operations.
While the Company has implemented risk management and contingency plans and taken preventive measures and other precautions, no predictions of specific scenarios can be made nor can assurance be given that there are not scenarios that could have an adverse effect on the Company. Climate change, a natural disaster, a pandemic, or an outbreak of an easily communicable disease could adversely affect the mortality or morbidity experience of the Company or its reinsurers. A pandemic could also have an adverse effect on lapses and surrenders of existing policies, as well as sales of new policies. In addition, a pandemic could result in large areas being subject to quarantine, with the result that economic activity slows or ceases, adversely affecting the marketing or administration of the Company’s business. These effects, in turn, could have an adverse financial effect on the Company. The possible macroeconomic effects of climate change, natural disasters or pandemics could also adversely affect the Company’s asset portfolio, as well as many other variables.
The Company is dependent on the performance of others.
The Company’s results may be affected by the performance of others because the Company has entered into various arrangements involving other parties. For example, most of the Company’s products are sold through independent distribution channels, and variable annuity deposits are invested in funds managed by third parties. Additionally, the Company’s operations are dependent on various technologies, some of which are provided by other parties.
As with all financial services companies, the Company’s ability to conduct business is dependent upon consumer confidence in the industry and its products. Actions of competitors and financial difficulties of other companies in the industry could undermine consumer confidence and adversely affect retention of existing business and future sales of the Company’s insurance and investment products.
Risk management policies and procedures may leave the Company exposed to unidentified or unanticipated risk, which could negatively affect business or result in losses.
The Company has devoted significant resources to develop risk management policies and procedures and will continue to do so in the future. However, the Company’s policies and procedures used to identify, monitor and manage risks may not be fully effective. Many of the methods of managing risk and exposures are based upon the use of observed historical market behavior or statistics based on historical models. As a result, these methods may not effectively identify or evaluate the magnitude of existing or future exposures, which could be significantly greater than the historical measures indicate. An example of such risks includes the risk of pandemics, which could cause a large number of deaths. Other risk management methods depend upon the evaluation of information regarding markets, agents, clients, catastrophe occurrence or other matters that are publicly available or otherwise accessible to us, which may not always be accurate, complete, up-to-date or properly evaluated. Management of operational, legal and regulatory risks requires, among other things, policies and procedures to record properly and verify a large number of transactions and events, and these policies and procedures may not be fully effective. Additional risks and uncertainties not currently known or that the Company currently deems to be immaterial, may adversely affect the business, financial condition and/or operating results.
Item 1B. Unresolved Staff Comments
None.
The Company’s home office is located at 3520 Broadway in Kansas City, Missouri. The Company owns and wholly occupies two five-story buildings on an eight-acre site.
The Company owns various other properties held for investment.
The life insurance industry, including the Company and its subsidiaries, has been subject to an increase in litigation in recent years. Such litigation has been pursued on behalf of purported classes of insurance purchasers, often questioning the conduct of insurers in the marketing of their products.
In addition to the above, the Company and its subsidiaries are defendants in, or subject to, other claims or legal actions. Some of these claims and legal actions are in jurisdictions where juries are given substantial latitude in assessing damages, including punitive damages. Although no assurances can be given and no determinations can be made at this time, management believes that the ultimate liability, if any, with respect to these other claims and legal actions would not have a material effect on the Company’s business, results of operations or financial position.
20
Table of Contents
Item 4. Removed and Reserved by the Securities and Exchange Commission
21
Table of Contents
Item 5. Market for Registrant’s Common Equity, Related Stockholder Matters and Issuer Purchases of Equity Securities
Stockholder Information
Corporate Headquarters
Kansas City Life Insurance Company
3520 Broadway
Post Office Box 219139
Kansas City, Missouri 64121-9139
Telephone: (816) 753-7000
Fax: (816) 753-4902
Internet: http://www.kclife.com
E-mail: kclife@kclife.com
Notice of Annual Meeting
The annual meeting of stockholders will be held at 9 a.m. on Thursday, April 21, 2011 at Kansas City Life’s corporate headquarters.
Transfer Agent
Janice Poe, Stock Agent and Assistant Secretary
Kansas City Life Insurance Company
Post Office Box 219139
Kansas City, Missouri 64121-9139
10-K Request
Stockholders may request a free copy of Kansas City Life’s Form 10-K, as filed with the Securities and Exchange Commission, by writing to Secretary, Kansas City Life Insurance Company.
Security Holders
As of January 31, 2011, Kansas City Life had approximately 2,500 security holders, including individual participants in security position listings.
22
Table of Contents
Stock and Dividend Information
The following table presents the high and low prices for the Company’s common stock for the periods indicated and the dividends declared per share and paid during such periods. The Company’s common stock is traded on the NASDAQ Capital Market under the symbol “KCLI.”
| High | Low | Dividend Paid |
||||||||||
| 2010 |
||||||||||||
| First quarter |
$ | 33.50 | $ | 24.86 | $ | 0.27 | ||||||
| Second quarter |
35.85 | 27.84 | 0.27 | |||||||||
| Third quarter |
32.63 | 28.58 | 0.27 | |||||||||
| Fourth quarter |
33.77 | 30.42 | 0.27 | |||||||||
| $ | 1.08 | |||||||||||
| 2009 |
||||||||||||
| First quarter |
$ | 44.63 | $ | 15.20 | $ | 0.27 | ||||||
| Second quarter |
40.22 | 19.70 | 0.27 | |||||||||
| Third quarter |
37.75 | 25.39 | 0.27 | |||||||||
| Fourth quarter |
33.31 | 25.00 | 0.27 | |||||||||
| $ | 1.08 | |||||||||||
A quarterly dividend of $0.27 per share was paid February 9, 2011.
NASDAQ market quotations are compiled according to Company records and may reflect inter-dealer prices, without markup, markdown or commission and may not necessarily represent actual transactions.
The Company has determined at this time that all compensation shall be paid in cash. As a result, the Company currently offers no equity compensation or equity compensation plan to its employees.
23
Table of Contents
Performance Comparison
The following graph provides a comparison of the cumulative total return on Kansas City Life’s common stock over the last five fiscal years to the S&P 500 Index (“S&P 500”) and to a peer comparison group (“Peer Group”). The graph assumes that $100 was invested on December 31, 2005, and that all dividends were reinvested on the last day of each quarter. Points on the graph represent performance as of the last business day of each of the years indicated.
Comparison of 5 Year Cumulative Total Return
Among Kansas City Life, the S&P 500 and a Peer Group
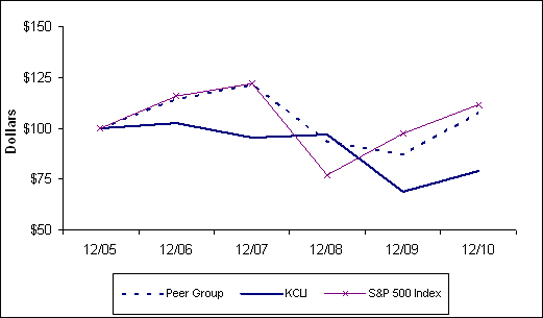
| 2005 | 2006 | 2007 | 2008 | 2009 | 2010 | |||||||||||||||||||
| Kansas City Life |
$ | 100.00 | $ | 102.32 | $ | 95.26 | $ | 97.04 | $ | 68.98 | $ | 79.27 | ||||||||||||
| S&P 500 |
$ | 100.00 | $ | 115.76 | $ | 122.11 | $ | 77.00 | $ | 97.31 | $ | 111.95 | ||||||||||||
| Peer Group |
$ | 100.00 | $ | 114.40 | $ | 121.55 | $ | 93.29 | $ | 87.24 | $ | 107.52 | ||||||||||||
The Peer Group index weights individual company returns for stock market capitalization. The companies included in the Peer Group index are the same as those companies used in the compensation comparator group identified in the Compensation Disclosure and Analysis section of the Company’s Proxy Statement. The companies included in the Peer Group index are shown in the following table.
| American Equity Investment Life Holding Co. | Presidential Life Corporation | |
| Delphi Financial Group, Inc. | Protective Life Corporation | |
| FBL Financial Group, Inc. | StanCorp Financial Group, Inc. | |
| Harleysville Group Inc. | Torchmark Corporation | |
| Horace Mann Educators Corp. | United Fire and Casualty | |
| National Western Life Insurance Co. | Unitrin, Inc. | |
| Phoenix Companies, Inc., The | Universal American Corp. |
The Peer Group index has changed during the five-year period. Both Amerus Group Co. and Jefferson-Pilot Corp. were removed from the Peer Group index in 2006 due to their having been acquired. Great American Financial Resources, Inc. was removed in 2007 and Nationwide Financial Services, Inc. was removed in 2009 due to being fully acquired. The chart above only includes the data from the current peer group member companies listed above.
The disclosure set forth above under the caption “Performance Comparison” shall not be deemed to be soliciting material and is not incorporated by reference into any of the Company’s prior filings under the Securities Act of 1933 or the Securities Exchange Act of 1934, as amended, that incorporated future filings or portions thereof.
24
Table of Contents
Issuer Purchases of Equity Securities
| Period |
Total Number of Shares Purchased Open Market/ Benefit Plans |
Average Purchase Price Paid per Share |
Total Number of Shares Purchased as a Part of Publicly Announced Plans or Programs |
Maximum Number of Shares that May Yet be Purchased Under the Plans or Programs |
||||||||||||
| 1/01/10 - 1/31/10 |
42,137 | 1 | $ | 30.72 | 42,137 | 957,863 | ||||||||||
| 927 | 2 | 28.55 | ||||||||||||||
| 2/1/10 - 2/28/10 |
- | 1 | - | - | 957,863 | |||||||||||
| - | 2 | - | ||||||||||||||
| 3/1/10 - 3/31/10 |
26,040 | 1 | 30.82 | 26,040 | 931,823 | |||||||||||
| - | 2 | - | ||||||||||||||
| 4/01/10 - 4/30/10 |
18,734 | 1 | 33.38 | 18,734 | 913,089 | |||||||||||
| 286 | 2 | 31.58 | ||||||||||||||
| 5/1/10 - 5/31/10 |
10,020 | 1 | 32.14 | 10,020 | 903,069 | |||||||||||
| - | 2 | - | ||||||||||||||
| 6/1/10 - 6/30/10 |
- | 1 | - | - | 903,069 | |||||||||||
| - | 2 | - | ||||||||||||||
| 7/01/10 - 7/31/10 |
- | 1 | - | - | 903,069 | |||||||||||
| - | 2 | - | ||||||||||||||
| 8/1/10 - 8/31/10 |
- | 1 | - | - | 903,069 | |||||||||||
| - | 2 | - | ||||||||||||||
| 9/1/10 - 9/30/10 |
- | 1 | - | - | 903,069 | |||||||||||
| - | 2 | - | ||||||||||||||
| 10/01/10 - 10/31/10 |
- | 1 | - | - | 903,069 | |||||||||||
| 868 | 2 | 31.19 | ||||||||||||||
| 11/1/10 - 11/30/10 |
- | 1 | - | - | 903,069 | |||||||||||
| - | 2 | - | ||||||||||||||
| 12/1/10 - 12/31/10 |
- | 1 | - | - | 903,069 | |||||||||||
| - | 2 | - | ||||||||||||||
| Total |
99,012 | 96,931 | ||||||||||||||
| 1 | On January 25, 2010, the Company’s Board of Directors authorized the repurchase of up to 1,000,000 shares of its common stock. Under this program in 2010, the Company acquired 96,931 shares at an average price of $31.41. Under a similar program, the Company purchased 84,173 shares in 2009 at an average price of $27.58; and 181,661 shares in 2008 at an average price of $45.38. The 2010 repurchase program expired January 23, 2011. On January 24, 2011, the Company’s Board of Directors authorized the repurchase of up to 1,000,000 shares of its common stock through January 22, 2012. |
25
Table of Contents
| 2 | Included in this column are the total shares purchased from the employee stockownership plan (ESOP) sponsored by the Company, during the consecutive months of January through December of 2010. The ESOP held 28,346 shares of the Company’s stock at December 31, 2010. |
26
Table of Contents
Item 6. Selected Financial Data
Amounts in thousands, except per share data.
| Year Ended December 31 | ||||||||||||||||||||
| 2010 | 2009 | 2008 | 2007 | 2006 | ||||||||||||||||
| Income Statement Data: |
||||||||||||||||||||
| Revenues: |
||||||||||||||||||||
| Insurance revenues |
$ | 245,830 | $ | 242,802 | $ | 236,173 | $ | 231,894 | $ | 235,264 | ||||||||||
| Net investment income |
175,859 | 177,428 | 177,419 | 190,405 | 196,280 | |||||||||||||||
| Realized investment gains (losses) |
535 | (10,076 | ) | (52,271 | ) | 5,426 | 5,621 | |||||||||||||
| Other revenues |
9,139 | 10,491 | 13,005 | 11,499 | 11,349 | |||||||||||||||
| Total revenues |
$ | 431,363 | $ | 420,645 | $ | 374,326 | $ | 439,224 | $ | 448,514 | ||||||||||
| Net income (loss) |
$ | 22,302 | $ | 10,732 | $ | (17,050 | ) | $ | 35,661 | $ | 36,918 | |||||||||
| Per Common Share Data: |
||||||||||||||||||||
| Net income (loss), basic and diluted |
$ | 1.95 | $ | 0.93 | $ | (1.47 | ) | $ | 3.01 | $ | 3.11 | |||||||||
| Cash dividends to stockholders |
$ | 1.08 | $ | 1.08 | $ | 1.08 | $ | 3.08 | $ | 1.08 | ||||||||||
| Stockholders’ equity |
$ | 59.25 | $ | 54.33 | $ | 46.11 | $ | 58.17 | $ | 57.72 | ||||||||||
| December 31 | ||||||||||||||||||||
| 2010 | 2009 | 2008 | 2007 | 2006 | ||||||||||||||||
| Balance Sheet Data: |
||||||||||||||||||||
| Assets |
$ | 4,333,282 | $ | 4,176,185 | $ | 3,967,091 | $ | 4,352,108 | $ | 4,457,795 | ||||||||||
| Notes payable |
- | - | 2,900 | 10,400 | 14,700 | |||||||||||||||
| Stockholders’ equity |
679,472 | 628,363 | 527,107 | 684,401 | 684,304 | |||||||||||||||
| Life insurance in force |
29,708,102 | 30,683,571 | 30,300,286 | 31,135,142 | 31,261,016 | |||||||||||||||
27
Table of Contents
Item 7. Management’s Discussion and Analysis of Financial Condition and Results of Operations
Amounts are stated in thousands, except share data, or as otherwise noted.
Management’s Discussion and Analysis of Financial Condition and Results of Operations for the three years ended December 31, 2010 is intended to provide in narrative form the perspective of the management of Kansas City Life Insurance Company (the Company) on its financial condition, results of operations, liquidity and certain other factors that may affect its future results. This discussion should be read in conjunction with the consolidated financial statements and accompanying notes included in this document.
Overview
Kansas City Life Insurance Company is a financial services company that is predominantly focused on the underwriting, sales and administration of life insurance and annuity products. The consolidated entity (the Company) primarily consists of three life insurance companies. Kansas City Life Insurance Company (Kansas City Life) is the parent company. Sunset Life Insurance Company of America (Sunset Life) and Old American Insurance Company (Old American) are wholly-owned subsidiaries.
Kansas City Life markets individual insurance products, including traditional, interest sensitive and variable products through a nationwide sales force of independent general agents and third-party marketing arrangements. Kansas City Life also markets group insurance products, which include life, dental, vision and disability products through its sales force of independent general agents, group brokers and third-party marketing arrangements. Kansas City Life operates in 48 states and the District of Columbia.
Sunset Life is a life insurance company that maintains its current block of business, but does not solicit new sales. Sunset Life is included in the Individual Insurance segment and its individual insurance products include traditional and interest sensitive products. Sunset Life operates in 43 states and the District of Columbia.
Old American sells final expense life insurance products, as well as a term product targeted to younger individuals. Old American markets its products nationwide through a general agency system, with exclusive territories, using direct response marketing to supply agents with leads. Old American’s administrative and accounting operations are part of the Company’s home office but it operates and maintains a separate marketing function and independent field force. Old American operates in 46 states and the District of Columbia.
The Company offers investment products and broker-dealer services through its subsidiary Sunset Financial Services, Inc. (SFS) for both proprietary and non-proprietary variable insurance products, mutual funds and other securities.
The Company operates in the life insurance sector of the financial services industry in the United States. This industry is highly competitive with respect to pricing, selection of products and quality of service. No single competitor or any small group of competitors dominates any of the markets in which the Company operates.
The Company earns revenues primarily from premiums received from the sale of life, immediate annuity and accident and health policies, from earnings on its investment portfolio and from the sale of investment assets. Revenues from the sale of traditional life insurance and immediate annuity products and accident and health products are reported as premium income for financial statement purposes. Considerations for supplementary contracts with life contingencies are reported as part of other revenues. However, deposits received from the sale of interest sensitive products, namely universal life insurance products, fixed deferred annuities, variable universal life, variable annuities and supplementary contracts without life contingencies, are not reported as premium revenues, but are instead reported as additions to the policyholders’ account balances and are reflected as deposits in the Consolidated Statements of Cash Flows. Accordingly, revenues on these products are recognized over time in the form of contract charges assessed against policyholder account balances, charges assessed on the early surrender of policyholder account balances and other charges deducted from policyholders’ balances.
The Company’s profitability depends on many factors, which include but are not limited to:
| • | The sale of life, annuity and accident and health products; |
| • | The rate of mortality, lapse and surrenders of future policy benefits and policyholder account balances; |
| • | The rate of morbidity, disability and incurrence of other policyholder benefits; |
| • | Persistency of existing insurance policies; |
| • | Interest rates credited to policyholders; |
28
Table of Contents
| • | The effectiveness of reinsurance programs; |
| • | The amount of investment assets under management; |
| • | Investment spreads earned on policyholder account balances; |
| • | The ability to maximize other investment returns and minimize risks such as interest rate risk, credit risk and equity risk; |
| • | Timely and cost-effective access to liquidity; and |
| • | Management of distribution costs and operating expenses. |
Strong sales competition, highly competitive products and a challenging economic environment present significant challenges to the Company from a new sales perspective. The Company’s primary emphasis is on expanding sales of individual life insurance products. The Company’s continued focus is on delivering competitive products for a reasonable cost, prompt customer service, excellent financial strength and effective sales and marketing support to the field force.
The Company generates cash largely through premiums collected from the sale of insurance products, deposits through the sale of universal life-type and deposit-type products and through investment activity. The principal uses of cash are for the insurance operations, including the purchase of investments, payment of insurance benefits and other withdrawals from policyholder accounts, operating expenses, premium taxes and costs related to acquiring new business. In addition, cash is used to pay income taxes and stockholder dividends, as well as to fund potential acquisition opportunities.
General economic conditions may affect future results. Market fluctuations, often extreme in nature, in recent periods have significantly impacted the financial markets and the Company’s investments and revenues. The interest rate and credit environments have presented significant challenges to the financial markets as a whole and specifically to companies invested in fixed maturity and equity securities. These conditions have improved in the most recent reporting periods, but the improvements have been uneven and the stressed economic and market environment may persist into the future. The Company is broadly diversified and has high quality investments, as 94% of all fixed maturity securities were investment grade at December 31, 2010.
Business Changes
The Company did not have any significant business changes in the three years ended December 31, 2010.
Cautionary Statement on Forward-Looking Information
This report reviews the Company’s financial condition and results of operations, and historical information is presented and discussed. Where appropriate, factors that may affect future financial performance are also identified and discussed. Certain statements made in this report include “forward-looking statements” that fall within the meaning of the Private Securities Litigation Reform Act of 1995. Forward-looking statements include any statement that may predict, forecast, indicate or imply future results, performance or achievements rather than historical facts and may contain words like “believe,” “expect,” “estimate,” “project,” “forecast,” “anticipate,” “plan,” “will,” “shall” and other words, phrases or expressions with similar meaning.
Forward-looking statements are subject to known and unknown risks, uncertainties and other factors that may cause actual results to differ materially from those contemplated by the forward-looking statements. Factors that could cause the Company’s future results to differ materially from expected results include, but are not limited to:
| • | Changes in general economic conditions, including the performance of financial markets and interest rates; |
| • | Increasing competition and changes in consumer behavior, which may affect the Company’s ability to sell its products and retain business; |
| • | Increasing competition in the recruiting of new agents and agent practices; |
| • | Customer and agent response to new products, distribution channels and marketing initiatives; |
| • | Fluctuations in experience regarding current mortality, morbidity, persistency and interest rates relative to expected amounts used in pricing the Company’s products; |
| • | Changes in assumptions related to deferred acquisition costs and the value of business acquired; |
| • | Regulatory, accounting or tax changes that may affect the cost of, or the demand for, the Company’s products or services; and |
| • | Unanticipated changes in industry trends and ratings assigned by nationally recognized rating organizations. |
The Company cannot give assurances that such statements will prove to be correct. Given these risks and uncertainties, investors should not place undue reliance on forward-looking statements as a prediction of actual results.
29
Table of Contents
Critical Accounting Policies and Estimates
The accounting policies below have been identified as critical to the understanding of the results of operations and financial position. The application of these critical accounting policies in preparing the financial statements requires management to use a variety of assumptions and estimates, in particular expectations of current and future mortality, morbidity, persistency, expenses, interest rates and equity market performance. Actual results may differ from these estimates under different assumptions or conditions. The profitability of life insurance and annuity products is dependent on actual experience, and differences between actual experience and pricing assumptions may result in variability of net income (loss) in amounts which may be material. On an ongoing basis, the Company evaluates the estimates, assumptions and judgments based on historical experience and other information that the Company believes to be reasonable under the circumstances. A detailed discussion of significant accounting policies is provided in Note 1 – Nature of Operations and Significant Accounting Policies in the Notes to Consolidated Financial Statements.
Valuation of Investments
The Company’s principal investments are in fixed maturity securities, mortgage loans and real estate; all of which are exposed to three primary sources of investment risk: credit, interest rate and liquidity. Credit risk is the risk that the value of the investment may decline due to deterioration in the financial strength of the issuer and that the timely or ultimate payment of principal or interest might not occur. A default by an issuer usually involves some loss of principal to the investor. Losses can be mitigated by timely sales of affected securities or by active involvement in a restructuring process. However, there can be no assurance that the efforts of an investor will lead to favorable outcomes in a bankruptcy or restructuring. Interest rate risk arises from the price sensitivity of investments to changes in interest rates. Interest and dividend income represent the greatest portion of an investment’s total return for most fixed income instruments in stable interest rate environments. The changes in the fair market price of such investments are inversely related to changes in market interest rates. As interest rates fall, the interest and dividend streams of existing fixed-rate investments become more valuable and market values rise. As interest rates rise, the opposite effect occurs. In addition, the Company is exposed to liquidity risk. Liquidity risk refers to the risk that investments cannot be converted into cash when needed or that the terms for conversion have a negative effect on the Company.
Securities
Fixed maturity securities, which are classified as available for sale, are carried at their fair value in the Company’s Consolidated Balance Sheets, with unrealized gains or losses recorded in accumulated other comprehensive income (loss). The unrealized gains or losses are recorded net of the adjustment to policyholder account balances and deferred acquisition costs to reflect what would have been earned had those gains or losses been realized and the proceeds reinvested. The Company’s fair value of fixed maturity and equity securities are derived from external pricing services, brokers, and internal matrices and calculations. At December 31, 2010, approximately 96% of the carrying value of these investments was from external pricing services and 4% was derived from brokers and internal matrices or calculations. The investment portfolio is monitored regularly to ensure that investments which may be other-than-temporarily impaired are identified in a timely fashion and properly valued. Other-than-temporary impairments that are determined to be due to credit are charged against earnings as realized investment losses. The valuation of the investment portfolio involves a variety of assumptions and estimates.
The Company monitors the various markets in which its investments are traded. The Company utilizes a primary independent third-party pricing service to determine the majority of its fair values. At December 31, 2010 the Company used a second independent third-party pricing service to validate the fair market values provided by the primary pricing service. The Company also used the second pricing service to determine the fair value of certain securities for which the primary pricing service was unable to provide. At December 31, 2010, 95% of the value of the Company’s fixed maturity and equity securities were from the primary third-party pricing service and 1% was from the second independent pricing service. The Company reviews values received from independent pricing sources for validity. In addition, the Company tests a limited number of securities from the primary pricing service each reporting period to further validate reliance on the fair values provided. When fair values are not available from external service providers, where possible, the Company utilizes quotes from brokers who are believed to have expertise in the markets in which the subject securities are traded. When the Company cannot obtain reliable broker pricing, a fair value is determined based upon an assessment of several factors appropriate for the specific issue, including but not limited to: the issuer’s industry; liquidity; cash flows; marketability, ratings and the ability of the issuer to satisfy the obligation; government intervention or regulations; fair value of comparable securities in actively traded or quoted markets; or other factors. The Company creates a matrix of factors from which to calculate an estimable value. However, all factors may not be known or publicly available from which to determine a value and, as such, the fair value used by the Company may not be truly indicative of the actual value available in an active market or an actual exit price if the Company were to sell the security in the current market.
30
Table of Contents
The Company has a policy and process in place to identify securities that could potentially have an impairment that is other- than-temporary. This process involves monitoring market events and other items that could impact issuers. The evaluation includes but is not limited to such factors as the issuer’s stated intent and ability to make all principal and interest payments when due, near-term business prospects, cash flow and liquidity, credit ratings, business climate, management changes and litigation and government actions. This process also involves monitoring late payments, downgrades by rating agencies, key financial ratios, financial statements, revenue forecasts, asset quality and cash flow projections as indicators of credit issues.
At the end of each quarter, all securities are reviewed to determine whether impairments exist and whether other-than-temporary impairments should be recorded. This quarterly process includes an assessment of the credit quality of each investment in the entire securities portfolio. Additional reporting and review procedures are conducted for those securities where fair value is less than 90% of amortized cost. Further, detailed analysis is performed for each issue or issues having experienced a formal restructuring or where the security has experienced material deterioration in fair value or where the fair value is less than 80% of amortized cost for six months or more.
The Company considers relevant facts and circumstances in evaluating whether the impairment of a security is other-than-temporary. Relevant facts and circumstances considered include but are not limited to:
| • | The current fair value of the security as compared to cost; |
| • | The credit rating of the security; |
| • | The extent and the length of time the fair value has been below amortized cost; |
| • | The financial position of the issuer, including the current and future impact of any specific events, material declines in the issuer’s revenues, margins, cash positions, liquidity issues, asset quality, debt levels and income results; |
| • | Significant management or organizational changes; |
| • | Significant uncertainty regarding the issuer’s industry; |
| • | Violation of financial covenants; |
| • | Consideration of information or evidence that supports timely recovery; |
| • | The Company’s intent and ability to hold an equity security until it recovers in value; |
| • | Whether the Company intends to sell a debt security and whether it is more likely than not that the Company will be required to sell a debt security before recovery of the amortized cost basis; and |
| • | Other business factors related to the issuer’s industry. |
To the extent the Company determines that a fixed maturity security is deemed to be other-than-temporarily impaired, the portion of the impairment that is deemed to be due to credit is charged to the Consolidated Statements of Income and the cost basis of the underlying investment is reduced. The portion of the impairment that is deemed to be non-credit is charged to other comprehensive income (loss). Equity securities that are determined to be other-than-temporarily impaired are written down to fair value and the impairment is charged to the Consolidated Statements of Income.
There are a number of significant risks and uncertainties inherent in the process of monitoring impairments, determining if an impairment is other-than-temporary and determining the portion of an other-than-temporary impairment that is due to credit. These risks and uncertainties include but are not limited to:
| • | The risk that the Company’s assessment of an issuer’s ability to meet all of its contractual obligations will change based on changes in the credit characteristics of that issuer; |
| • | The risk that the economic outlook will be worse than expected or have more of an impact on the issuer than anticipated; |
| • | The risk that the performance of the underlying collateral for securities could deteriorate in the future and the Company’s credit enhancement levels and recovery values do not provide sufficient protection to the Company’s contractual principal and interest; |
| • | The risk that fraudulent, inaccurate or misleading information could be provided to the Company’s credit, investment and accounting professionals who determine the fair value estimates and accounting treatment for securities; |
| • | The risk that actions of trustees, custodians or other parties with interests in the security may have an unforeseen adverse impact on the Company’s investments; |
| • | The risk that new information obtained by the Company or changes in other facts and circumstances may lead the Company to change its intent to sell the security before it recovers in value; |
| • | The risk that facts and circumstances change such that it becomes more likely than not that the Company will be required to sell the investment before recovery of the amortized cost basis; and |
| • | The risk that the methodology or assumptions used to develop estimates of the portion of impairments due to credit prove, over time, to be inaccurate or insufficient. |
31
Table of Contents
Any of these situations could result in a charge to income in a future period.
The Company may selectively determine that it no longer intends to hold a specific issue to its maturity. If the Company makes this determination and the fair value is less than the cost basis, an analysis of the fair value of the investment is performed and the investment is written down to the fair value and an other-than-temporary impairment is recorded on this particular position. Subsequently, the Company seeks to obtain the best possible outcome available for this specific issue and records an investment gain or loss at the disposal date.
The Company has exposure to the municipal bond market. The Company’s investments in municipal bonds present unique considerations in evaluating other-than-temporary impairments. Judgments regarding whether a municipal debt security is other-than-temporarily impaired include analyzing a number of rather unique characteristics pertaining to the issuer. Municipalities possess unique powers, along with special legal standing and protections. These powers include the sovereign power to tax, access to one-time revenue sources, capacity to issue or restructure debt and the ability to shift spending to other authorities. In addition, state governments often provide secondary support to local governments in times of financial stress and the federal government has also provided assistance to state governments as well.
The evaluation of loan-backed and similar asset-backed securities, particularly including residential mortgage-backed securities, with significant indications of potential other-than-temporary impairment requires considerable use of estimates and judgment. Specifically, the Company performs discounted cash flow projections on these securities to evaluate whether the value of the investment is expected to be fully realized. Projections of expected future cash flows are based upon considerations of the performance of the actual underlying assets, including historical delinquencies, defaults, severity of losses incurred, and prepayments, along with the Company’s estimates of future results for these factors. The Company’s estimates of future results are based upon actual historical performance of the underlying assets relative to historical, current and expected general economic conditions, specific conditions related to the underlying assets, industry data, and other factors that are believed to be relevant. If the present value of the projected expected future cash flows are determined to be below the Company’s carrying value, the Company recognizes an other-than-temporary impairment on the portion of the carrying value that exceeds the projected expected future cash flows. To the extent that the loan-backed or other asset-backed securities remain high quality investments and do not otherwise demonstrate characteristics of impairment, the Company performs other initial evaluations to determine whether other-than-temporary cash flow evaluations need to be performed.
Mortgage Loans
Investments in mortgage loans totaled $559.2 million at December 31, 2010 ($457.6 million – December 31, 2009). The Company’s mortgage loans are mostly secured by commercial real estate and are carried net of an allowance for loss of $3.4 million ($3.4 million - 2009). The allowance for loss on mortgage loans is maintained at a level believed by management to be adequate to absorb potential future credit losses. Management’s periodic evaluation and assessment of the adequacy of the reserve is based on known and inherent risks in the portfolio, historical and industry data, current economic conditions and other relevant factors. Over the past three years, the Company has had one mortgage loan default, which occurred in the fourth quarter of 2010. The Company completed the foreclosure on this loan in the fourth quarter of 2010 with no impairment recorded due to the fair value of the equity in the property being greater than its book value. Two loans were delinquent for 30 days at December 31, 2010, but payments were received and both loans were brought current in January 2011. No loans were restructured during 2010. No mortgage loans were restructured or delinquent for more than 90 days or foreclosed upon and transferred to real estate investments during 2009.
At December 31, 2010, the Company had 16% of its invested assets in mortgage loans, up from 14% at December 31, 2009. In addition to the subject collateral underlying the mortgage, the Company typically requires some amount of recourse from borrowers as another potential source of repayment. The recourse requirement is determined as part of the underwriting requirements of each loan. The Company added 69 new loans to the portfolio during 2010, and 54 or 78% of these loans had some amount of recourse requirement. The Company added $84.6 million in purchased mortgage loans from another institutional lender during 2010. These purchased loans are seasoned performing loans having characteristics of property type, geographical diversification, term, underwriting and cash flows that are similar to the Company’s portfolio of originated loans. In addition, the Company purchased one $1.9 million loan during the fourth quarter of 2010 from a separate originator. At December 31, 2010, 15% of the Company’s commercial mortgage portfolio was acquired and not originated by the Company. During 2009, the Company added 26 new loans and 100% of these loans included some amount of recourse. The average loan to value ratio for the overall portfolio was 49% at both December 31, 2010 and December 31, 2009, based upon the underwriting and appraisal of value at the time the loan was originated or acquired.
32
Table of Contents
The tables below identify mortgage loans by geographic location and type of loan as of December 31, 2010 and December 31, 2009.
| 2010 | 2009 | |||||||
| Carrying Amount |
Carrying Amount |
|||||||
| Geographic region: |
||||||||
| Pacific |
$ | 134,892 | $ | 101,648 | ||||
| West north central |
122,228 | 113,997 | ||||||
| West south central |
106,093 | 106,625 | ||||||
| Mountain |
72,871 | 64,142 | ||||||
| South atlantic |
50,454 | 31,966 | ||||||
| East north central |
30,905 | 19,783 | ||||||
| Middle atlantic |
22,975 | 6,776 | ||||||
| East south central |
22,159 | 16,055 | ||||||
| Allowance for loss |
(3,410 | ) | (3,410 | ) | ||||
| Total |
$ | 559,167 | $ | 457,582 | ||||
| Property type: |
||||||||
| Industrial |
$ | 263,621 | $ | 248,397 | ||||
| Office |
227,772 | 179,517 | ||||||
| Medical |
35,223 | 27,873 | ||||||
| Other |
35,961 | 5,205 | ||||||
| Allowance for loss |
(3,410 | ) | (3,410 | ) | ||||
| Total |
$ | 559,167 | $ | 457,582 | ||||
The table below identifies mortgage loans by maturity as of December 31, 2010 and December 31, 2009.
| 2010 | 2009 | |||||||
| Mortgage loans by maturity: |
||||||||
| Due in one year or less |
$ | 33,703 | $ | 10,486 | ||||
| Due after one year through five years |
177,182 | 164,691 | ||||||
| Due after five years through ten years |
235,566 | 204,754 | ||||||
| Due after ten years |
116,126 | 81,061 | ||||||
| Allowance for loss |
(3,410 | ) | (3,410 | ) | ||||
| Total |
$ | 559,167 | $ | 457,582 | ||||
The table below identifies the commercial mortgage portfolio by current loan balance as of years ending December 31.
| 2010 | 2009 | |||||||||||||||
| Amount | % of Total | Amount | % of Total | |||||||||||||
| $5.0 million or greater |
$ | 73,003 | 13% | $ | 16,801 | 4% | ||||||||||
| $4.0 million to less than $5.0 million |
26,821 | 5% | 22,497 | 5% | ||||||||||||
| $3.0 million to less than $4.0 million |
71,147 | 13% | 55,359 | 12% | ||||||||||||
| $2.0 million to less than $3.0 million |
116,046 | 21% | 93,863 | 21% | ||||||||||||
| $1.0 million to less than $2.0 million |
184,324 | 33% | 176,744 | 38% | ||||||||||||
| Less than $1.0 million |
91,236 | 16% | 95,728 | 21% | ||||||||||||
| Allowance for loss |
(3,410) | (1%) | (3,410) | (1%) | ||||||||||||
| Total |
$ | 559,167 | 100% | $ | 457,582 | 100% | ||||||||||
33
Table of Contents
The table below identifies the commercial mortgage portfolio by current loan balance as a percentage of value at the time of origination as of years ending December 31.
| 2010 | 2009 | |||||||||||||||
| Amount | % of Total | Amount | % of Total | |||||||||||||
| 70% or greater |
$ | 50,807 | 9% | $ | 44,712 | 10% | ||||||||||
| 50% to 69% |
325,854 | 59% | 267,085 | 58% | ||||||||||||
| Less than 50% |
185,916 | 33% | 149,195 | 33% | ||||||||||||
| Allowance for loss |
(3,410) | (1%) | (3,410) | (1%) | ||||||||||||
| Total |
$ | 559,167 | 100% | $ | 457,582 | 100% | ||||||||||
Deferred Acquisition Costs
Deferred acquisition costs (DAC), principally agent commissions and other selling, selection and issue costs, which vary with and are directly related to the production of new business, are capitalized as incurred. At least annually, the Company reviews its DAC capitalization policy and the specific items which are capitalized with existing guidance. These deferred costs for life insurance products are generally deferred and amortized over the premium paying period. Policy acquisition costs that relate to interest sensitive and variable insurance products are deferred and amortized with interest in relation to the estimated gross profits to be realized over the lives of the contracts. DAC is reviewed on an ongoing basis to determine that the unamortized portion does not exceed the expected recoverable amounts.
For interest sensitive and variable insurance products, estimated gross profits are composed of net interest income, net realized investment gains and losses, fees, surrender charges, expenses, and mortality gains and losses. At the issuance of policies, projections of estimated gross profits are made which are then replaced by actual gross profits over the lives of the policies. In addition to other factors, emerging experience may lead to a revised outlook for the remaining estimated gross profits. Accordingly, DAC may be recalculated using these new assumptions and any resulting adjustment is included in income. The Company considers the following assumptions to be of significance when evaluating future estimated gross profits: mortality, interest rates and spreads, surrender and withdrawal rates and expense margins.
At least annually, a review is performed of the models and the assumptions used to develop expected future profits, related to the profit expectations for interest sensitive and variable insurance products. This review is based upon management’s current view of future events. Management’s view primarily reflects Company experience but can also reflect emerging trends within the industry. Short-term deviations in experience affect the amortization of DAC in the period, but do not necessarily indicate that a change to the long-term assumptions of future experience is warranted. If it is determined that it is appropriate to change the assumptions of future experience, then an unlocking adjustment is recognized for the block of business being evaluated. Certain assumptions, such as interest spreads and surrender rates, may be interrelated. As such, unlocking adjustments often reflect revisions to multiple assumptions. The balance of DAC is immediately impacted by any assumption changes, with the change reflected through the income statement as an unlocking adjustment in the amount of DAC amortized. These adjustments can be positive or negative with adjustments reducing amortization limited to amounts previously deferred plus interest accrued through the date of the adjustment. The impact of unlocking adjustments from the changes in estimates for the periods reported are included in the Consolidated Results of Operations and Operating Results by Segment sections of the Management’s Discussion and Analysis of Financial Condition and Results of Operations contained within this document.
In addition, the Company may consider refinements in estimates due to improved capabilities resulting from administrative or actuarial system upgrades. The Company considers such enhancements to determine whether and to what extent they are associated with prior periods or simply improvements in the projection of future expected gross profits due to improved functionality. To the extent they represent such improvements, these items are applied to the appropriate financial statement line items in a manner similar to unlocking adjustments.
Value of Business Acquired
When a new block of business is acquired or when an insurance company is purchased, a portion of the purchase price is allocated to a separately identifiable intangible asset, called the value of business acquired (VOBA). VOBA is established as the actuarially determined present value of future gross profits of the business acquired and is amortized with interest in proportion to future premium revenues or the expected future profits, depending on the type of business acquired. Similar to DAC, the assumptions regarding future experience can affect the carrying value of VOBA, including interest spreads, mortality, expense margins and policy and premium persistency experience. Significant changes in these assumptions can impact the carrying balance of VOBA and produce changes that are reflected in the current period’s income as an unlocking adjustment to the amortization of the VOBA amortization. VOBA amortization is included in operating expenses in the Consolidated Statements of Income. VOBA is reviewed on an ongoing basis to determine that the unamortized portion does not exceed the expected recoverable amounts.
34
Table of Contents
Profit expectations are based upon assumptions of future interest spreads, mortality margins, expense margins and policy and premium persistency experience. Mortality relates to the occurrence of death. Interest spreads are the difference between the investment returns earned and the crediting rates of interest applied to policyholder account balances. Surrender rates relate to the relative volume of policy terminations. Expense margins involve the expenses incurred for maintaining and servicing in force policies. These assumptions involve judgment and are compared to actual experience on an ongoing basis. If it is determined that the assumptions related to the profit expectations for interest sensitive and variable insurance products should be revised, the impact of the change is reported in the current period’s income as an unlocking adjustment. The Company considers the following assumptions to be of significance when evaluating the amortization of VOBA: expected mortality, interest spreads, surrender rates and expense margins.
At least annually, a review is performed of the models and the assumptions used to develop expected future profits, based upon management’s current view of future events. Management’s view primarily reflects Company experience but can also reflect emerging trends within the industry. Short-term deviations in experience affect the amortization of VOBA in the period, but do not necessarily indicate that a change to the long-term assumptions of future experience is warranted. If it is determined that it is appropriate to change the assumptions of future experience, then an unlocking adjustment is recognized for the block of business being evaluated. Certain assumptions, such as interest spreads and surrender rates, may be interrelated. As such, unlocking adjustments often reflect revisions to multiple assumptions. The balance of VOBA is immediately impacted by any assumption changes, with the change reflected through the income statement as an unlocking adjustment in the amount of VOBA amortized. These adjustments can be positive or negative with adjustments reducing amortization limited to amounts previously deferred plus interest accrued through the date of the adjustment. The impact of unlocking adjustments from the changes in estimates for the periods reported are included in the Consolidated Results of Operations and Operating Results by Segment sections of the Management’s Discussion and Analysis of Financial Condition and Results of Operations contained within this document.
In addition, the Company may consider refinements in estimates due to improved capabilities resulting from administrative or actuarial system upgrades. The Company considers such enhancements to determine whether and to what extent they are associated with prior periods or simply improvements in the projection of future expected gross profits due to improved functionality. To the extent they represent such improvements, these items are applied to the appropriate financial statement line items in a manner similar to unlocking adjustments.
35
Table of Contents
The following tables reflect the estimated pre-tax impact to DAC and VOBA on universal life, variable universal life, and fixed and variable deferred annuity products that could occur in a twelve-month period for an unlocking adjustment due to reasonably likely changes in significant assumptions. Changes in assumptions of the same magnitude in the opposite direction would have an impact of a similar magnitude but opposite direction of the examples provided.
| Critical Accounting Estimate |
Determination Methodology |
Potential One-Time Effect on DAC and
Related | ||||
| Mortality Experience |
Based on Company mortality experience. Industry experience and trends are also considered. |
A 2.5% increase in expected mortality experience for all future years would result in a reduction in DAC and an increase in current period amortization expense of $2.9 million. | ||||
| Surrender Rates |
Based on Company surrender experience. Industry experience and trends are also considered. |
A 10% increase in expected surrender rates for all future years would result in a reduction in DAC and an increase in current period amortization expense of $1.3 million. | ||||
| Interest Spreads |
Based on expected future investment returns and expected future crediting rates applied to policyholder account balances; future crediting rates include constraints imposed by policy guarantees. |
A 10 basis point reduction in future interest rate spreads would result in a reduction in DAC and an increase in current period amortization expense of $2.9 million. | ||||
| Maintenance Expenses |
Based on Company experience using an internal expense allocation methodology. |
A 10% increase in future maintenance expenses would result in a reduction in DAC and an increase in current period amortization expense of $2.0 million. | ||||
| Critical Accounting Estimate |
Determination Methodology |
Potential One-Time Effect on VOBA and | ||||
| Mortality Experience |
Based on Company mortality experience. Industry experience and trends are also considered. |
A 2.5% increase in expected mortality experience for all future years would result in a reduction in VOBA and an increase in current period amortization expense of $1.1 million. | ||||
| Surrender Rates |
Based on Company surrender experience. Industry experience and trends are also considered. |
A 10% increase in expected surrender rates for all future years would result in a reduction in VOBA and an increase in current period amortization expense of $0.9 million. | ||||
| Interest Spreads |
Based on expected future investment returns and expected future crediting rates applied to policyholder account balances; future crediting rates include constraints imposed by policy guarantees. |
A 10 basis point reduction in future interest rate spreads would result in a reduction in VOBA and an increase in current period amortization expense of $0.7 million. | ||||
| Maintenance Expenses |
Based on Company experience using an internal expense allocation methodology. |
A 10% increase in future maintenance expenses would result in a reduction in VOBA and an increase in current period amortization expense of $0.2 million. | ||||
Reinsurance
A variety of reinsurance vehicles are currently in use, including individual and bulk arrangements on both coinsurance and mortality/morbidity-only basis. Reinsurance supports a multitude of corporate objectives, including managing statutory capital, reducing volatility and surplus strain and is an actively managed tool for the Company. At the customer level, reinsurance increases the Company’s capacity, provides access to additional underwriting expertise, and generally makes it possible for the Company to offer products at competitive levels that could not otherwise be made available.
36
Table of Contents
The Company remains contingently liable if the reinsurer should be unable to meet obligations assumed under the reinsurance contract. The Company monitors the relative financial strength and viability of its reinsurance partners.
Reinsurance receivables include amounts related to paid benefits and estimated amounts related to unpaid policy and contract claims, future policy benefits and policyholder account balances.
Future Policy Benefits
The Company establishes liabilities for amounts payable under insurance policies, including traditional life insurance, annuities and accident and health insurance. Generally, amounts are payable over an extended period of time. Liabilities for future policy benefits of traditional life insurance have been computed by a net level premium method based upon estimates at the time of issue for investment yields, mortality and withdrawals. These estimates include provisions for experience less favorable than initially expected. Mortality assumptions are based on Company experience expressed as a percentage of standard mortality tables. The 2001 Valuation Basic Table and the 1975-1980 Select and Ultimate Basic Table serve as the basis for most mortality assumptions.
Liabilities for future policy benefits of immediate annuities and supplementary contracts with life contingencies are computed by calculating an actuarial present value of future policy benefits, based upon estimates for investment yields and mortality at the time of issue. Liabilities for future policy benefits of immediate annuities and supplementary contracts with life contingencies are also computed by a net level premium method, based upon estimates at the time of issue for investment yields and mortality.
Liabilities for future policy benefits of accident and health insurance represent estimates of payments to be made on reported insurance claims, as well as claims incurred but not yet reported. These liabilities are estimated using actuarial analyses and case basis evaluations that are based upon past claims experience, claim trends and industry experience.
Policyholder Account Balances
Policyholder account balances include universal life insurance, fixed deferred annuity contracts and investment-type contracts. Liabilities for these policyholder account balances are included without reduction for potential surrender charges and deferred front-end contract charges. The account balances for universal life contracts are equal to cumulative deposits, less contract charges and withdrawals, plus interest credited. The account balances for fixed deferred annuities and investment-type contracts are equal to the cumulative deposits, less any applicable contract charges and withdrawals, plus interest credited. Front-end contract charges are deferred and amortized over the term of the policies. Policyholder benefits incurred in excess of related policyholder account balances are charged to policyholder benefits expense. Interest on policyholder account balances is credited as earned.
On an ongoing basis, the Company performs testing and analysis on its blocks of business to ensure that both the assumptions made when the Company purchases a block of business or when the Company sells new policies remain viable. The Company also periodically performs sensitivity testing on these blocks of business to ensure it maintains the capacity to meet an increase in demand in policyholder benefits, namely increased surrenders, policy loans or other policyholder elective withdrawals, especially when financial markets become volatile.
Pensions and Other Postretirement Benefits
The measurement of pension and other postretirement benefit obligations and costs depends on a variety of assumptions. Assumptions are made regarding the discount rate, expected long-term rate of return on plan assets, employee turnover, expected compensation increases, health care claim costs, heath care cost trends, retirement rates and mortality. The discount rate and the expected return on plan assets have the most significant impact on the level of cost. See Note 9 – Pensions and Other Postretirement Benefits in the Notes to Consolidated Financial Statements for further details.
In addition, the Company recognizes the funded status of its defined benefit pension and postretirement plans, measured as the difference between plan assets at fair value and the benefit obligation, on the balance sheet. Changes in the funded status that arise during the period but are not recognized as components of net periodic benefit cost are recognized within other comprehensive income (loss), net of income taxes.
The Kansas City Life Cash Balance Pension Plan (the Plan) was amended effective December 31, 2010 to provide that participants’ accrued benefits will be frozen as of, and that no further benefits or accruals will be earned after, December 31, 2010. Although participants will no longer accrue additional benefits under the Plan as of December 31, 2010, participants will continue to earn years of service for vesting purposes under the Plan with respect to their benefits accrued through December 31, 2010. In addition, the cash balance account will continue to earn annual interest.
37
Table of Contents
Recognition of Revenues
Premiums for traditional life insurance products are reported as revenue when due. Premiums on accident and health, disability and dental insurance are reported as earned ratably over the contract period in proportion to the amount of insurance protection provided. A reserve is provided for the portion of premiums written which relate to unexpired terms of coverage.
Deposits related to universal life, fixed deferred annuity contracts and investment-type products are credited to policyholder account balances. Revenues from such contracts consist of amounts assessed against policyholder account balances for mortality, policy administration and surrender charges, and are recognized in the period in which the benefits and services are provided in contract charges in the Consolidated Statements of Income. The cash flows from deposits are credited to policyholder account balances. Deposits are not recorded as revenue. Deposits are shown as a Financing Activity in the Consolidated Statements of Cash Flows.
The Company measures its sales or new business production with two components: new premiums recorded and new deposits received and then by general product type. New premiums and new deposits are considered to be first year and single receipts. Premiums and deposits are subdivided into two categories: new and renewal. New premiums and deposits are measures of sales or new business production. Renewal premiums and deposits occur as continuing business from existing customers.
Income Taxes
Deferred income taxes are recorded on the differences between the tax bases of assets and liabilities and the amounts at which they are reported in the consolidated financial statements. Recorded amounts are adjusted to reflect changes in income tax rates and other tax law provisions as they become enacted. Deferred income tax assets are subject to ongoing evaluation of whether such assets will be realized. The ultimate realization of deferred income tax assets generally depends on the reversal of deferred tax liabilities and the generation of future taxable income and realized gains during the periods in which temporary differences become deductible. Deferred income taxes include future deductible differences relating to unrealized losses on investment securities. The Company evaluates the character and timing of unrealized gains and losses to determine whether sufficient future taxable amounts are sufficient to offset future deductible amounts. A valuation allowance against deferred income tax assets may be required if future taxable income of the correct character is not expected.
Consolidated Results of Operations
Summary of Results
The Company earned net income of $22.3 million in 2010 compared to $10.7 million in 2009 and a net loss of $17.1 million in 2008. Net income per share was $1.95 in 2010 versus $0.93 per share in 2009 and a net loss of $1.47 per share in 2008. The increase in 2010 net income compared to one year earlier largely resulted from a net realized investment gain versus net realized investment losses in prior years. The Company experienced a $0.5 million net realized investment gain in 2010 compared to $10.1 million and $52.3 million in net realized investment losses in 2009 and 2008, respectively. Other factors contributing to the increase in net income in 2010 were higher individual life and accident and health premiums, lower operating expenses and a decrease in amortization of deferred acquisition costs. Partially offsetting these favorable items were a decrease in net investment income, an increase in policyholder benefits and higher income tax expense. The increase in 2009 net income as compared to 2008 was largely attributed to a reduction in realized investment losses and higher insurance revenues, which were partially offset by an increase in operating expenses.
Sales
The Company measures sales in terms of new premiums and deposits. Sales of traditional life insurance, immediate annuities and accident and health products are reported as premium income for financial statement purposes. Deposits received from the sale of interest sensitive products, namely universal life insurance, fixed deferred annuities, variable universal life, variable annuities and supplementary contracts without life contingencies are reflected as deposits in the Consolidated Statements of Cash Flows.
The Company’s marketing plan for individual products focuses on providing financial security with respect to life insurance, accumulation and retirement income needs. The primary emphasis is on the growth of individual life insurance business, including new premiums for individual life products and new deposits for universal life and variable universal life products.
38
Table of Contents
Sales are primarily made through the Company’s existing sales force. The Company is emphasizing growth of the sales force with the addition of new general agents and agents. The Company believes that increasing both the number and productivity of general agents and agents is essential to increasing new sales. The Company has also placed an emphasis on training and direct support within the field. As alternative sales opportunities arise, the Company selectively utilizes third-party marketing arrangements to enhance its sales objectives. The marketing plan allows the Company the flexibility to identify niches or pursue unique avenues in the existing market environment and to react quickly to be able to take advantage of short-term opportunities when they occur.
The Company also markets an array of group products. These products include group life, dental, disability, and vision products. The primary growth strategies for these products include increased productivity of the existing group representatives, planned expansion of the group distribution system and to selectively utilize third-party marketing arrangements. Further, growth is to be supported by the addition of new products to the portfolio, particularly voluntary-type products.
The following table reconciles premiums included in insurance revenues and provides detail by new and renewal business over the three years ended December 31. New premiums are also detailed by product.
| 2010 | % Change | 2009 | % Change | 2008 | ||||||||||||||||
| New premiums: |
||||||||||||||||||||
| Individual life insurance |
$ | 16,494 | 16 | $ | 14,182 | 10 | $ | 12,926 | ||||||||||||
| Immediate annuities |
22,313 | 1 | 22,113 | 75 | 12,612 | |||||||||||||||
| Group life insurance |
2,280 | 43 | 1,599 | (23 | ) | 2,084 | ||||||||||||||
| Group accident and health insurance |
12,606 | 18 | 10,648 | (2 | ) | 10,889 | ||||||||||||||
| Total new premiums |
53,693 | 11 | 48,542 | 26 | 38,511 | |||||||||||||||
| Renewal premiums |
141,094 | (1 | ) | 142,257 | - | 142,271 | ||||||||||||||
| Total premiums |
194,787 | 2 | 190,799 | 6 | 180,782 | |||||||||||||||
| Reinsurance ceded |
(54,976 | ) | 2 | (53,732 | ) | - | (53,616 | ) | ||||||||||||
| Premiums, net |
$ | 139,811 | 2 | $ | 137,067 | 8 | $ | 127,166 | ||||||||||||
Consolidated total premiums increased $4.0 million or 2% in 2010 compared to 2009, as total new premiums increased $5.2 million or 11% and total renewal premiums decreased $1.2 million or 1%. The two largest contributors to the increase in new premiums were a $2.3 million or 16% increase in new individual life insurance premiums and a $2.0 million or 18% increase in new group accident and health insurance premiums. The increase in new individual life premiums was largely the result of a $2.6 million or 29% increase in new individual life premiums in the Old American segment. The increase in new group accident and health premiums reflected increases in disability and dental premiums. In addition, new group life insurance premiums increased $0.7 million or 43% compared to one year earlier. The decrease in renewal premiums was largely due to a 10% decrease in group life premiums and a 1% decrease in group accident and health premiums, primarily in the dental product line. These were partially offset by a 1% increase in renewal individual life premiums.
Consolidated total premiums increased $10.0 million or 6% in 2009 compared to 2008, as total new premiums increased $10.0 million or 26% and total renewal premiums were flat. The increase in new premiums was driven by a $9.5 million or 75% increase in immediate annuity premiums. This improvement reflected a continuing demand for guaranteed benefit and retirement income products by consumers and an increase in sales from a third-party arrangement. In addition, new individual life insurance premiums increased $1.3 million or 10%. This increase largely resulted from a 20% increase in new premiums in the Old American segment. The increase in new premiums from the Old American segment reflected a combination of expanded distribution and improved agency productivity. New group life insurance premiums decreased $0.5 million or 23% and new group accident and health premiums decreased $0.2 million or 2%. While total renewal premiums were flat compared to 2008, a $1.4 million increase in renewal dental premiums was offset by a $1.2 million decrease in renewal individual life premiums and a $0.3 million decrease in renewal individual accident and health premiums.
39
Table of Contents
The following table reconciles deposits with the Consolidated Statements of Cash Flows and provides detail by new and renewal deposits over the three years ended December 31. New deposits are also detailed by product.
| 2010 | % Change | 2009 | % Change | 2008 | ||||||||||||||||
| New deposits: |
||||||||||||||||||||
| Universal life insurance |
$ | 13,330 | 35 | $ | 9,873 | (10 | ) | $ | 10,913 | |||||||||||
| Variable universal life insurance |
1,226 | 19 | 1,031 | (47 | ) | 1,942 | ||||||||||||||
| Fixed deferred annuities |
67,709 | (12 | ) | 76,612 | 152 | 30,413 | ||||||||||||||
| Variable annuities |
18,121 | 13 | 16,078 | (37 | ) | 25,496 | ||||||||||||||
| Total new deposits |
100,386 | (3 | ) | 103,594 | 51 | 68,764 | ||||||||||||||
| Renewal deposits |
137,827 | 1 | 136,048 | 3 | 131,701 | |||||||||||||||
| Total deposits |
$ | 238,213 | (1 | ) | $ | 239,642 | 20 | $ | 200,465 | |||||||||||
Total new deposits decreased $3.2 million or 3%, following a $34.8 million or 51%, increase in 2009. The decrease in 2010 was due to an $8.9 million or 12% decrease in new fixed deferred annuity deposits. This decline can largely be contributed to the comparison with the higher sales of this product in 2009. Partially offsetting this, new universal life deposits increased $3.5 million or 35%, new variable annuity deposits increased $2.0 million or 13% and new variable universal life deposits increased $0.2 million or 19%. These improvements can be attributed to the expanded distribution from the successful recruitment of new general agents and agents in selected areas and to the improving economy. The increase in 2009 was due to a $46.2 million or 152% increase in new fixed deferred annuity deposits. This increase can be attributed to consumer preferences for fixed-rate products, resulting from the volatility of the equity markets. This volatility, along with the general effects of the recessionary environment, was also reflected in the reduction in sales of new universal life deposits, new variable universal life deposits and new variable annuities, which declined 10%, 47% and 37%, respectively.
Renewal deposits increased $1.8 million or 1% in 2010 compared to a $4.3 million or 3% increase in 2009. The increase during 2010 was due to a $5.7 million or 21% increase in renewal fixed deferred annuity deposits, largely resulting from the increased sales experienced during 2009. This was partially offset by a $1.8 million decline in renewal universal life deposits, a $1.5 million or 11% decrease in variable universal life deposits and a $0.6 million or 6% decline in variable annuity deposits. The increase in 2009 resulted from higher fixed deferred annuity deposits, which increased $9.3 million or 54% compared to one year ago. This increase was partially offset by declines in the following products: $2.9 million or 3% in universal life deposits, $1.2 million or 8% in variable universal life deposits and $0.8 million or 8% in variable annuity deposits.
Insurance Revenues
Insurance revenues consist of premiums and contract charges less reinsurance ceded. Insurance revenues increased $3.0 million or 1% to $245.8 million in 2010, compared to a $6.6 million or 3% increase in 2009. The improvement in 2010 was largely due to a $4.0 million or 2% increase in premiums, largely due to increased premiums in the Old American segment. Total life premiums increased $2.5 million or 2%, and total accident and health premiums increased $1.3 million or 3%. These were partially offset by a $1.2 million or 2% increase in reinsurance ceded. The improvement in 2009 resulted from a $10.0 million or 6% increase in premiums. Total annuity premiums increased $9.5 million or 75%, and total accident and health premiums increased $1.0 million or 2%. The improvement in premiums was partially offset by a $3.3 million or 3% decrease in contract charges.
Insurance revenues are affected by the level of new sales, the type of products sold, the persistency of policies, general economic conditions and competitive forces. The Company strives to provide a portfolio of products with safety and competitive return objectives. The Company offers a broad range of products, including variable insurance products, which allow policyholders to participate in both the equity and fixed income markets. Interest sensitive and traditional insurance products combine safety of principal with competitive interest returns.
Contract charges consist of cost of insurance, expense loads, amortization of unearned revenues and surrender charges. Certain contract charges for universal life, deposit or investment products are not recognized in income immediately but are deferred as unearned revenues and are amortized into income in a manner similar to the amortization of DAC. These contract charges, which are recorded as unearned revenues, are recognized into income in proportion to the expected future gross profits of the business. In the same manner as DAC, profit expectations are based upon assumptions of future interest spreads, mortality margins, expense margins and policy and premium persistency experience. At least annually, a review is performed of the assumptions related to profit expectations. If it is determined the assumptions should be revised, the impact is recorded as a change in the revenue reported in the current period as an unlocking adjustment.
40
Table of Contents
Contract charges were essentially flat in 2010 versus one year earlier, compared to a 3% decrease in 2009. The results in 2010 reflected a decrease in cost of insurance charges, largely due to the runoff of closed blocks, and a decrease in surrender charges resulting from lower surrenders of variable and universal life products. Offsetting these changes, expense loads increased due to higher account values of variable annuities from the sale of universal life products. In addition, deferred revenue increased, largely due to unlocking that occurred during 2010, as discussed below. The decline in 2009 can largely be attributed to three factors: lower account balances on variable contracts, lower surrender charges due to a decline in policy surrenders on certain products and the runoff of closed blocks. Included in total contract charges are blocks of policies and companies that the Company has purchased with the intent of servicing these blocks to achieve long-term purchased profit streams but without additional marketing for further new sales. Total contract charges on these closed blocks equaled 36% of total consolidated contract charges during 2010, compared to 37% in 2009. Total contract charges on closed blocks declined 4% in 2010 compared to 2009, reflecting the runoff of this business. Total contract charges on open blocks of business increased 3% in 2010 compared to 2009, reflecting the growing blocks of new and existing products.
One component of contract charges is the recognition over time of the DRL from certain universal life policies. This liability arises from front-end loads on such policies and is recognized into the income statement in concert with the future expected gross profits, as is similarly the case with amortization of DAC. In 2010, the Company completed the upgrade and enhancement of its projection modeling capabilities resulting in a refinement in methodology and in a change in estimate. The effect of the refinement on the DRL was an increase in the liability and a reduction to contract charges of $0.9 million during 2010. No refinements in methodology occurred during 2009 or 2008.
At least annually, a review is performed regarding the assumptions related to profit expectations. If it is determined that the assumptions should be revised, an adjustment may be recorded to contract charge deferred revenues in the current period as an unlocking adjustment. The Company had an unlocking in the DRL in 2010 related to changes in assumptions. The impact of the unlocking on DRL was a decrease in the liability and a corresponding increase in the recognition of deferred revenue in 2010 in the amount of $1.1 million. No unlocking adjustments were identified on the DRL during 2009. Unlocking that occurred during 2008 resulted in an increase to the deferred revenue liability and a corresponding decrease in the recognition of deferred revenue in the amount of $0.8 million.
The Company uses reinsurance as a means to mitigate its risks and to reduce the earnings volatility from claims. Reinsurance ceded premiums increased $1.2 million to $55.0 million in 2010 from $53.7 million in 2009. In 2008, reinsurance ceded was $53.6 million. The increase in 2010 was largely in the Group Insurance segment, reflecting an increase in sales from a third-party arrangement that is 100% reinsured.
Investment Revenues
Net investment income decreased 1% in 2010 compared to 2009 and was flat in 2009 versus 2008. Net investment income was $175.9 million in 2010 compared to $177.4 million in both 2009 and 2008. While average invested assets increased during 2010, this was offset by a decline in yields earned on investments. Net investment income results in 2009 were impacted by a decline in the Company’s invested asset base and a slight improvement in yields from the portfolio. In addition, expenses associated with investment income increased during 2010 compared to a decline in 2009.
Gross investment income is largely composed of interest, dividends and other earnings on fixed maturity securities, equity securities, short-term investments, mortgage loans, real estate and policy loans. Gross investment income was essentially flat in 2010 compared to one year earlier. During 2010, an increase in average invested assets was offset by declines in yields earned on investments, largely due to lower interest rates and yields available in the fixed-income market. Gross investment income was flat in 2009 compared with 2008, as a decline in investment assets was mostly offset by an increase in investment yields. The decline in investment assets largely reflected declines in book value due to sales, maturities and calls. The increase in investment yields was largely due to a higher return on an alternative investment fund compared to the prior year. In 2009, this investment added gross investment income of $2.2 million. However, as a result of the significant decline in the economic environment experienced in 2008, this investment resulted in a decline in gross investment income of $4.0 million in the prior year.
41
Table of Contents
Investments in mortgage loans totaled $559.2 million at December 31, 2010, an increase of $101.6 million from December 31, 2009. Mortgage loans are stated at cost, adjusted for amortization of premium and accrual of discount, less an allowance for potential future losses. A loan is considered to be impaired if it is probable that contractual amounts due will not be collected. Loans in foreclosure and loans considered to be impaired are placed on a non-accrual status. The mortgage loan allowance was $3.4 million at December 31, 2010, unchanged from December 31, 2009. The allowance for loss on mortgage loans is maintained at a level believed by management to be adequate to absorb potential future credit losses. Management’s periodic evaluation and assessment of the adequacy of the reserve is based on known and inherent risks in the portfolio, historical and industry data, current economic conditions and other relevant factors. Over the past three years, the Company has had one mortgage loan default, which occurred in the fourth quarter of 2010. The Company completed the foreclosure on this loan in the fourth quarter of 2010 with no impairment recorded due to the fair value of the equity in the property being greater than its book value. Two loans were delinquent for 30 days at December 31, 2010, payments were received and both were brought current in January 2011. No mortgage loans were restructured during 2010. No mortgage loans were restructured or delinquent for more than 90 days or foreclosed upon and transferred to real estate investments during 2009 or 2008. Mortgage loans comprised 16% of the investment portfolio at December 31, 2010, up from 14% at the end of 2009. The increase in mortgage loans during 2010 was due to the purchase of $86.5 million of commercial mortgage loans during the year. These mortgage loans purchased by the Company were seasoned performing commercial mortgages with characteristics similar to the portfolio of loans originated by the Company. The majority of all of the mortgages were commercial loans on industrial warehouses and office properties at both December 31, 2010 and 2009. Investment income from mortgage loans increased $1.9 million in 2010 and decreased $0.4 million or 1% in 2009 compared to the same periods one year earlier. The increase in 2010 was largely the result of higher mortgage loan portfolio volume in 2010 compared to 2009. The decline in 2009 was largely due to lower prepayment penalties and assumption fees, as well as lower rates earned on new loans.
Real estate investments were $119.9 million at December 31, 2010 and $114.1 million at December 31, 2009. Real estate investments consist principally of industrial warehouses, office buildings, land and investments in multi-family and single-family residential properties, including affordable housing properties. The primary monetary benefit received from investments in affordable housing properties is in the form of tax credits, which primarily serve to reduce current and future tax expense rather than increase investment revenues. The Company also invests in unimproved land for future development. Investments have been made through individual purchases, build-to-suit and speculative development, along with investments in joint ventures. The Company generally maintains its ownership interest in these properties on a direct and joint venture basis with the long-term intention of earning positive cash flow and income by leasing the properties, along with the expectation of realizing capital appreciation upon sale. The Company periodically sells certain real estate assets when management believes that the market and timing are perceived to be advantageous. Real estate investments comprised 3% of the investment portfolio at both December 31, 2010 and 2009. Investment income on real estate increased 13% in 2010, following a 9% increase in 2009. The improvement in both years primarily resulted from an increase in occupancy in certain real estate properties.
Short-term investments totaled $15.7 million at December 31, 2010, down from $138.7 million at December 31, 2009. Short-term invested assets consist primarily of money-market funds. The holdings of short-term investments at year-end 2009 reflected proceeds from sales and renewals of life and annuity products, along with sales and maturities of long-term investments which had not been reinvested. The decrease during 2010 reflected the reinvestment of those funds. Income from short-term investments declined $0.1 million or 30% in 2010 and $0.7 million or 73% in 2009. The decline in 2010 was due to reduced short-term investments due to reinvestment and lower short-term yields. The decline experienced in 2009 was primarily the result of a decline in yields.
The Company offers policy loans as a benefit to its policyholders. These loans are payable at the policyholder’s discretion but are secured by the cash value of the policy. Policy loans totaled $84.3 million at December 31, 2010, down $1.3 million from December 31, 2009. Investment income from policy loans declined 1% in 2010 and 5% in 2009. The declines in both years were largely due to reduced balances of policy loans outstanding.
Net investment income is stated net of investment expenses. Investment expenses increased $0.6 million or 6% in 2010 compared to 2009. This increase can largely be attributed to increased real estate investment expenses. Investment expenses decreased $0.4 million or 3% in 2009 versus one year earlier. Interest expense on short-term notes payable decreased in 2009 compared to the prior year. The Company has an investment in the Federal Home Loan Bank from which it is able to borrow money at favorable interest rates, as it did during parts of 2009 and 2008. The 2009 borrowings were less than those in 2008, resulting in reduced interest expense in 2009. The Company periodically borrows and subsequently reinvests these proceeds. The Company had increased its borrowings during the first quarter of 2008 and subsequently reduced these borrowings. The Company had no notes payable outstanding at December 31, 2010 and 2009. Partially offsetting the decline in investment expenses during 2009 was an increase in real estate expenses in 2009 compared to 2008.
42
Table of Contents
The following table provides asset class detail of the investment portfolio. Fixed maturity and equity securities represented 77% of the entire investment portfolio at December 31, 2010, down from 76% at December 31, 2009.
| 2010 | 2009 | |||||||||||||||
| Amount | % of Total |
Amount | % of Total |
|||||||||||||
| Fixed maturity securities |
$ | 2,648,888 | 76% | $ | 2,469,272 | 75% | ||||||||||
| Equity securities |
38,321 | 1% | 36,876 | 1% | ||||||||||||
| Mortgage loans |
559,167 | 16% | 457,582 | 14% | ||||||||||||
| Real estate |
119,909 | 4% | 114,076 | 3% | ||||||||||||
| Policy loans |
84,281 | 2% | 85,585 | 3% | ||||||||||||
| Short-term investments |
15,713 | 1% | 138,704 | 4% | ||||||||||||
| Other investments |
5,009 | - | 6,379 | - | ||||||||||||
| Total |
$ | 3,471,288 | 100% | $ | 3,308,474 | 100% | ||||||||||
The Company realizes investment gains and losses from several sources, including write-downs of investments and sales of investment securities and real estate. Many securities purchased by the Company contain call provisions, which allow the issuer to redeem the securities at a particular price. Depending upon the terms of the call provision and price at which the security was purchased, a gain or loss may be realized.
The following table provides detail concerning realized investment gains and losses over the three years ended December 31.
| 2010 | 2009 | 2008 | ||||||||||
| Gross gains resulting from: |
||||||||||||
| Sales of investment securities |
$ | 2,545 | $ | 9,886 | $ | 653 | ||||||
| Investment securities called and other |
2,139 | 674 | 2,300 | |||||||||
| Sales of real estate |
- | 661 | 5,154 | |||||||||
| Total gross gains |
4,684 | 11,221 | 8,107 | |||||||||
| Gross losses resulting from: |
||||||||||||
| Sales of investment securities |
(67 | ) | (313 | ) | (1,115 | ) | ||||||
| Investment securities called and other |
(253 | ) | (88 | ) | - | |||||||
| Total gross losses |
(320 | ) | (401 | ) | (1,115 | ) | ||||||
| Amortization of DAC and VOBA |
(9 | ) | 159 | 3,430 | ||||||||
| Net realized investment gains, exluding impairment losses |
4,355 | 10,979 | 10,422 | |||||||||
| Net impairment losses recognized in earnings: |
||||||||||||
| Other-than-temporary impairment losses on fixed maturity and equity securities |
(4,129 | ) | (35,011 | ) | (62,693 | ) | ||||||
| Other-than-temporary impairment losses on real estate |
- | (2,114 | ) | - | ||||||||
| Total other-than-temporary impairment losses |
(4,129 | ) | (37,125 | ) | (62,693 | ) | ||||||
| Portion of loss recognized in other comprehensive income (loss) |
309 | 16,070 | - | |||||||||
| Net impairment losses recognized in earnings |
(3,820 | ) | (21,055 | ) | (62,693 | ) | ||||||
| Realized investment gains (losses) |
$ | 535 | $ | (10,076 | ) | $ | (52,271 | ) | ||||
The Company recorded a net realized investment gain of $0.5 million in 2010 and net realized investment losses of $10.1 million in 2009 and $52.3 million in 2008. During 2010, investment losses of $3.8 million were due to write-downs of investment securities that were considered other-than-temporarily impaired. No investment securities were written down during the fourth quarter of 2010. These write-downs were offset by $2.5 million in gains resulting from sales of investment securities and $2.1 million in gains from securities called and other. The gain on sales of investment securities included $0.5 million realized on the sale of a security that had been previously written down due to other-than-temporary impairment. In the above table, investment securities called and other includes, but is not limited to, principal paydowns and sinking funds. During 2009, investment losses of $21.1 million were due to write-downs of investment securities and investments in affordable housing funds that were considered other-than-temporarily impaired. These were partially offset by $9.9 million in gains on the sale of investment securities, $0.7 million of investment gains realized on securities called and other, and $0.7 million of investment gains on the sale of real estate. During both 2009 and 2008, the financial markets were significantly affected by economic pressures and the residential mortgage crisis. These pressures resulted in large price dislocations that affected many securities and companies, particularly in the financial sector. These economic pressures have eased during 2010, as reflected in the reduced number and magnitude of other-than-temporary impairments recognized.
43
Table of Contents
In the fourth quarter of 2009, the Company experienced impairment losses on the Company’s real estate joint ventures, specifically attributable to investments in affordable housing funds. The Company is a limited partner in several joint ventures whose underlying investments are in affordable housing properties. These properties generate federal and/or state tax credits and have a residual value in the properties that requires the funds to operate as a real estate joint venture investment. In one property fund, an impairment of $1.6 million resulted from the transfer of the residual interest in certain properties in exchange for contingent future benefits. An additional impairment of $0.3 million was recorded due to the foreclosure of certain properties in a second property fund. The Company also wrote down two affordable housing investments by $0.3 million, when it determined that there were no remaining future benefits expected from these investments.
The Company reviews and analyzes its securities on an ongoing basis to determine whether impairments exist that are other-than-temporary. Based upon these analyses, specific securities’ credit impairments may be written down through earnings as a realized investment loss if the security’s fair value is considered to be other-than-temporarily impaired. Non-credit impairments are charged to other comprehensive income (loss).
The following table summarizes securities with other-than-temporary impairments recognized in earnings during the four quarters of 2010 by asset class:
| First Quarter |
Second Quarter |
Third Quarter |
Fourth Quarter |
Total | ||||||||||||||||
| Bonds: |
||||||||||||||||||||
| Corporate private-labeled residential mortgage-backed securities |
$ | 846 | $ | 384 | $ | 274 | $ | - | $ | 1,504 | ||||||||||
| Other |
740 | 940 | 636 | - | 2,316 | |||||||||||||||
| Total |
$ | 1,586 | $ | 1,324 | $ | 910 | $ | - | $ | 3,820 | ||||||||||
The following table provides detail regarding individual investment securities that were written down through earnings during 2010 exceeding $0.5 million.
| Security |
Impairment Loss |
Description | ||||
| Securitization of U.S. government guaranteed student loans |
$964 | Liquidation of the security by the trustees, at the direction of a majority of bondholders. | ||||
| Mortgage-backed security |
582 | Decline in the subprime and non-conforming mortgage markets and the specific performance of the underlying collateral caused cash flow projections to be less than the amortized cost of the security. | ||||
| Other - 10 securities |
2,274 | |||||
| Total |
$3,820 | |||||
44
Table of Contents
The following table summarizes securities with other-than-temporary impairments recognized in earnings during the four quarters of 2009 by asset class:
| First Quarter |
Second Quarter |
Third Quarter |
Fourth Quarter |
Total | ||||||||||||||||
| Bonds: |
||||||||||||||||||||
| Corporate obligations: |
||||||||||||||||||||
| Industrial |
$ | 2,656 | $ | - | $ | - | $ | 555 | $ | 3,211 | ||||||||||
| Communications |
- | 1,010 | 229 | - | 1,239 | |||||||||||||||
| Financial |
1,546 | 2,704 | 1,772 | 5,680 | 11,702 | |||||||||||||||
| Consumer |
1,235 | - | - | - | 1,235 | |||||||||||||||
| Total corporate obligations |
5,437 | 3,714 | 2,001 | 6,235 | 17,387 | |||||||||||||||
| Corporate private-labeled residential mortgage-backed securities |
681 | 143 | 318 | 135 | 1,277 | |||||||||||||||
| Other |
- | 165 | - | 112 | 277 | |||||||||||||||
| Total |
$ | 6,118 | $ | 4,022 | $ | 2,319 | $ | 6,482 | $ | 18,941 | ||||||||||
The following table provides detail regarding individual investment securities that were written down through earnings during 2009 exceeding $0.5 million.
| Security |
Impairment Loss |
Description | ||||
| Financial guarantee insurance company |
$5,174 | Two securities, one issuer a parent of the other, had significant reductions in capital and liquidity positions coupled with declines in value due to the credit crisis. | ||||
| Financing company for real estate |
2,694 | Acceptance of a tender offer resulted in an impairment to fair value. | ||||
| Trucking company |
2,191 | Reduced shipping volume from the recession, new credit restrictions due to renegotiation of debt covenants, the need to retire longer-term debt and additional stress on cash resources. | ||||
| Mortgage and financial guaranty insurer |
1,546 | Mortgage delinquencies and defaults coupled with rating downgrades and the need to raise additional capital to meet future needs. | ||||
| Financial institution |
1,445 | Company experienced large losses in its real estate portfolio and had an increase in non-performing loans. | ||||
| Developer and manufacturer of imaging products |
1,235 | Sales decrease from economic decline, declining revenues and declining liquidity position. | ||||
| Print media company |
1,239 | Company filed for bankruptcy in 2008 and a subsequent impairment was recognized due to reorganization. | ||||
| Printing and publishing company |
1,020 | Acceptance of a tender offer resulted in an impairment to fair value. | ||||
| Global finance company |
843 | Negative effect of credit crisis, forcing reduced access to liquidity and higher borrowing costs. | ||||
| Other - 8 securities |
1,554 | |||||
| Total |
$18,941 | |||||
45
Table of Contents
The following table summarizes securities with other-than-temporary impairments recognized in earnings during the four quarters of 2008 by asset class:
| First Quarter |
Second Quarter |
Third Quarter |
Fourth Quarter |
Total | ||||||||||||||||
| Bonds: |
||||||||||||||||||||
| Corporate obligations: |
||||||||||||||||||||
| Industrial |
$ | - | $ | - | $ | 2,105 | $ | - | $ | 2,105 | ||||||||||
| Communications |
- | 1,833 | 1,080 | 360 | 3,273 | |||||||||||||||
| Financial |
- | 3,347 | 17,766 | 2,661 | 23,774 | |||||||||||||||
| Consumer |
- | 2,262 | - | 3,789 | 6,051 | |||||||||||||||
| Total corporate obligations |
- | 7,442 | 20,951 | 6,810 | 35,203 | |||||||||||||||
| Corporate private-labeled residential mortgage-backed securities |
- | - | - | 4,164 | 4,164 | |||||||||||||||
| Other |
- | 2,783 | 5,075 | 5,296 | 13,154 | |||||||||||||||
| Redeemable preferred stocks |
- | - | - | 1,747 | 1,747 | |||||||||||||||
| Fixed maturity securities |
- | 10,225 | 26,026 | 18,017 | 54,268 | |||||||||||||||
| Equity securities |
- | - | 6,436 | 1,989 | 8,425 | |||||||||||||||
| Total |
$ | - | $ | 10,225 | $ | 32,462 | $ | 20,006 | $ | 62,693 | ||||||||||
46
Table of Contents
The following table provides detail regarding individual investment securities that were written down through earnings during 2008 exceeding $0.5 million.
| Security |
Impairment Loss |
Description | ||||
| Financial guarantee insurance company |
$4,944 | Two securities, one issuer a parent of the other, experienced declines in value related to the mortgage credit crisis and had been downgraded to a negative outlook. | ||||
| Financing company for real estate |
2,806 | Company experienced a rating decline to below investment grade, combined with price deterioration. | ||||
| Preferred stocks of government-sponsored agencies that buy and hold mortgages and issue and sell guaranteed residential mortgage-backed securities |
6,803 | Operated in conservatorship by the U.S. Government and their common and preferred stock were severely diluted. Dividend payments were suspended, driving the fair value of these securities down. | ||||
| Radio and advertising company |
2,501 | Company experienced a decline in price, a rating agency downgrade and completed a leveraged buyout transaction during 2008. | ||||
| Media company |
4,243 | Company experienced a decline in price, a rating agency downgrade and completed a leveraged buyout transaction during 2008. This security was sold during the fourth quarter of 2008. | ||||
| Four collateralized debt obligations |
13,154 | Impacted by the rapid rise in delinquencies and foreclosures in the sub-prime and Alt-A mortgage markets, along with a decline in the fair value of securities issued by financial institutions. | ||||
| Originator and servicer of residential prime, Alt-A and subprime mortgages |
4,207 | Rating agency downgrades and a debt restructuring during 2008. This security was sold during the fourth quarter of 2008. | ||||
| Residential and commercial outsourcing services company |
1,808 | Decline in price that had persisted for a period longer than the Company considered temporary. | ||||
| Originator of residential prime, Alt-A and subprime mortgages |
4,164 | Significant decline in the subprime and non-conforming mortgage markets. | ||||
| Designer, manufacturer and servicer of cars and trucks that provides vehicle-related financing, leasing, and insurance |
1,207 | Decline in the U. S. automotive industry. | ||||
| Financial services company involved in automotive and real estate financing and mortgage lending |
595 | Decline in the U. S automotive industry. This security was sold during the fourth quarter of 2008. | ||||
| Two perpetual preferred securities |
2,829 | Negatively impacted by housing and mortgage credit crisis and received TARP (Troubled Assets Relief Program) funds. | ||||
| Investment banking firm |
9,194 | Two securities from one issuer that filed for bankruptcy during 2008 and was impacted by the mortgage credit crisis. | ||||
| Supplier of auto parts for light trucks and sport- utility vehicles |
2,105 | Deteriorating truck and sport-utility vehicle markets of the auto industry, and declines in value and ratings. | ||||
| Bank holding company |
821 | Holding company filed for bankruptcy. Parent of a large nationwide bank that had been taken over by the Office of Thrift Supervision and the Federal Deposit Insurance Corporation was appointed as its receiver. | ||||
| Entertainment media company |
772 | Decline in price, rating agency downgrade and leveraged buyout transaction. | ||||
| Other - 2 securities |
540 | |||||
| Total |
$62,693 | |||||
47
Table of Contents
Investment Accounting Policy and Analysis of Investments
The Company seeks to protect policyholders’ benefits and achieve a desired level of organizational profitability by optimizing risk and return on an ongoing basis through managing asset and liability cash flows, monitoring credit risk, avoiding high levels of investments that may be redeemed by the issuer, maintaining sufficiently liquid investments and avoiding undue asset concentrations through diversification, among other things. The Company has three primary sources of investment risk:
| • | Credit risk, relating to the uncertainty associated with the continued ability of a given obligor to make timely payments of principal and interest; |
| • | Interest rate risk, relating to the market price and/or cash flow associated with changes in market yield and curves; and |
| • | Liquidity risk, relating to the risk that investments cannot be converted into cash when needed or that the terms for conversion have a negative effect on the Company. |
The Company’s ability to manage these risks is essential to the success of the organization. In particular, the Company devotes considerable resources to the credit analysis of each new investment and the ongoing credit positions. The majority of the Company’s investments are exposed to varying degrees of credit risk. Credit risk is the risk that the value of the investment may decline due to deterioration in the financial strength of the issuer and that the timely or ultimate payment of principal or interest might not occur. A default by an issuer usually involves some loss of principal to the investor. Losses can be mitigated by timely sales of affected securities or by active involvement in a restructuring process. However, there can be no assurance that the efforts of an investor will lead to favorable outcomes in a bankruptcy or restructuring. Credit risk is managed primarily through industry, issuer, structure and asset diversification.
For additional information regarding the Company’s asset/liability management program, please see the Asset/Liability Management section within Item 7A: Quantitative and Qualitative Disclosures About Market Risk.
48
Table of Contents
The following table provides information regarding fixed maturity and equity securities by asset class as of December 31, 2010.
| Total Fair Value |
% of Total |
Fair Value of Securities with Gross Unrealized Gains |
Gross Unrealized Gains |
Fair Value of Securities with Gross Unrealized Losses |
Gross Unrealized Losses |
|||||||||||||||||||
| U.S. Treasury securities and obligations of U.S. Government |
$ | 135,142 | 5% | $ | 125,273 | $ | 7,180 | $ | 9,869 | $ | 318 | |||||||||||||
| Federal agencies 1 |
26,095 | 1% | 26,095 | 1,951 | - | - | ||||||||||||||||||
| Federal agency issued residential mortgage-backed securities 1 |
138,056 | 5% | 137,759 | 9,740 | 297 | 2 | ||||||||||||||||||
| Subtotal |
299,293 | 11% | 289,127 | 18,871 | 10,166 | 320 | ||||||||||||||||||
| Corporate obligations: |
||||||||||||||||||||||||
| Industrial |
432,518 | 16% | 352,700 | 26,255 | 79,818 | 2,930 | ||||||||||||||||||
| Energy |
178,511 | 7% | 170,663 | 15,498 | 7,848 | 224 | ||||||||||||||||||
| Communications and technology |
172,946 | 6% | 134,184 | 9,243 | 38,762 | 796 | ||||||||||||||||||
| Financial |
350,659 | 13% | 261,745 | 14,161 | 88,914 | 5,022 | ||||||||||||||||||
| Consumer |
430,504 | 16% | 347,883 | 28,725 | 82,621 | 2,373 | ||||||||||||||||||
| Public utilities |
324,800 | 12% | 296,241 | 27,640 | 28,559 | 1,466 | ||||||||||||||||||
| Subtotal |
1,889,938 | 70% | 1,563,416 | 121,522 | 326,522 | 12,811 | ||||||||||||||||||
| Corporate private-labeled residential mortgage-backed securities |
195,055 | 7% | 98,474 | 2,352 | 96,581 | 16,826 | ||||||||||||||||||
| Municipal securities |
151,831 | 6% | 62,887 | 1,319 | 88,944 | 3,301 | ||||||||||||||||||
| Other |
98,002 | 4% | 38,135 | 5,194 | 59,867 | 7,739 | ||||||||||||||||||
| Redeemable preferred stocks |
14,769 | 1% | 9,818 | 342 | 4,951 | 440 | ||||||||||||||||||
| Fixed maturities |
2,648,888 | 99% | 2,061,857 | 149,600 | 587,031 | 41,437 | ||||||||||||||||||
| Equity securities |
38,321 | 1% | 36,287 | 2,165 | 2,034 | 137 | ||||||||||||||||||
| Total |
$ | 2,687,209 | 100% | $ | 2,098,144 | $ | 151,765 | $ | 589,065 | $ | 41,574 | |||||||||||||
| 1 | Federal agency securities are not backed by the full faith and credit of the U.S. Government. |
49
Table of Contents
The following table provides information regarding fixed maturity and equity securities by asset class as of December 31, 2009.
| Total Fair Value |
% of Total |
Fair Value of Securities with Gross Unrealized Gains |
Gross Unrealized Gains |
Fair Value of Securities with Gross Unrealized Losses |
Gross Unrealized Losses |
|||||||||||||||||||
| U.S. Treasury securities and obligations of U.S. Government |
$ | 122,597 | 5% | $ | 88,941 | $ | 4,755 | $ | 33,656 | $ | 1,021 | |||||||||||||
| Federal agencies 1 |
28,321 | 1% | 28,321 | 681 | - | - | ||||||||||||||||||
| Federal agency issued residential mortgage-backed securities 1 |
175,858 | 7% | 168,304 | 7,474 | 7,554 | 55 | ||||||||||||||||||
| Subtotal |
326,776 | 13% | 285,566 | 12,910 | 41,210 | 1,076 | ||||||||||||||||||
| Corporate obligations: |
||||||||||||||||||||||||
| Industrial |
366,389 | 15% | 291,860 | 14,653 | 74,529 | 2,574 | ||||||||||||||||||
| Energy |
172,167 | 7% | 156,642 | 9,562 | 15,525 | 731 | ||||||||||||||||||
| Communications and technology |
136,076 | 5% | 101,545 | 5,933 | 34,531 | 1,786 | ||||||||||||||||||
| Financial |
339,621 | 14% | 191,311 | 8,667 | 148,310 | 14,776 | ||||||||||||||||||
| Consumer |
371,577 | 15% | 299,582 | 18,570 | 71,995 | 3,206 | ||||||||||||||||||
| Public utilities |
313,871 | 13% | 251,158 | 16,888 | 62,713 | 2,590 | ||||||||||||||||||
| Subtotal |
1,699,701 | 69% | 1,292,098 | 74,273 | 407,603 | 25,663 | ||||||||||||||||||
| Corporate private-labeled residential mortgage-backed securities |
196,660 | 8% | 19,528 | 135 | 177,132 | 42,930 | ||||||||||||||||||
| Municipal securities |
54,442 | 2% | 18,305 | 730 | 36,137 | 2,610 | ||||||||||||||||||
| Other |
178,092 | 7% | 36,214 | 3,619 | 141,878 | 19,367 | ||||||||||||||||||
| Redeemable preferred stocks |
13,601 | - | 5,098 | 98 | 8,503 | 1,363 | ||||||||||||||||||
| Fixed maturities |
2,469,272 | 99% | 1,656,809 | 91,765 | 812,463 | 93,009 | ||||||||||||||||||
| Equity securities |
36,876 | 1% | 34,890 | 1,657 | 1,986 | 186 | ||||||||||||||||||
| Total |
$ | 2,506,148 | 100% | $ | 1,691,699 | $ | 93,422 | $ | 814,449 | $ | 93,195 | |||||||||||||
| 1 | Federal agency securities are not backed by the full faith and credit of the U.S. Government. |
At December 31, 2010, the Company’s unrealized losses on fixed maturities and equity securities had decreased to $41.6 million and were offset by $151.8 million in gross unrealized gains. At December 31, 2009, the Company had $93.2 million in gross unrealized losses on fixed maturities and equity securities which were offset by $93.4 million in gross unrealized gains. At December 31 2010, 78% of the fixed maturities and equity securities portfolio had unrealized gains, a significant improvement from 68% at December 31, 2009. At December 31, 2010, 31% of the total gross unrealized losses were in the category of corporate obligations. The financial sector was the single largest contributor to this category, at 39%, primarily due to the direct and indirect impact of the troubled residential real estate and mortgage markets. In addition, corporate private-labeled residential mortgage-backed securities, also related to the residential real estate and mortgage industries, accounted for 40% of the total gross unrealized losses at December 31, 2010. The category of corporate private-labeled residential mortgage-backed securities was the area with the greatest decrease in unrealized losses for the two comparative year-end dates, as this figure decreased from $42.9 million to $16.8 million.
50
Table of Contents
The following table identifies fixed maturity securities available for sale by rating.
| December 31, 2010 | December 31, 2009 | |||||||||||||||
| Equivalent S&P Rating |
Fair Value |
% of Total |
Fair Value |
% of Total |
||||||||||||
| AAA |
$ | 511,854 | 19% | $ | 601,262 | 24% | ||||||||||
| AA |
278,850 | 11% | 150,543 | 6% | ||||||||||||
| A |
780,919 | 30% | 696,861 | 29% | ||||||||||||
| BBB |
905,540 | 34% | 866,902 | 35% | ||||||||||||
| Total investment grade |
2,477,163 | 94% | 2,315,568 | 94% | ||||||||||||
| BB |
56,973 | 2% | 78,996 | 3% | ||||||||||||
| B and below |
114,752 | 4% | 74,708 | 3% | ||||||||||||
| Total below investment grade |
171,725 | 6% | 153,704 | 6% | ||||||||||||
| $ | 2,648,888 | 100% | $ | 2,469,272 | 100% | |||||||||||
Reflecting the high quality of securities maintained by the Company, 94% of all fixed maturity securities were investment grade as of December 31, 2010 and 2009. Changes in the mix of percent of total of investment grade securities for the comparative year-end dates include a decline of 5% in AAA-rated securities and a 5% increase in AA-rated securities.
The Company’s residential mortgage-backed securities, commercial mortgage-backed securities and asset-backed securities that were rated below investment grade at year-end 2010 were 12% of the total, compared to 4% at year-end 2009. More of these securities moved into the below investment grade category during 2010 due to ratings downgrades resulting from the troubled housing market.
Analysis of Unrealized Losses on Securities
The Company reviews all security investments, and particular attention is given to those having unrealized losses. Further, the Company specifically assesses all investments with greater than 10% declines in fair value and, in general, monitors all security investments as to ongoing risk. These risks are fundamentally evaluated through both a qualitative and quantitative analysis of the issuer. The Company also prepares a formal review document no less often than quarterly of all investments where fair value is less than 80% of amortized cost for six months or more, as well as selected investments that have experienced significant changes in fair value from a previous period and that have a decline in fair value greater than 10% of amortized cost.
The Company has a policy and process in place to identify securities that could potentially have an impairment that is other-than-temporary. This process involves monitoring market events and other items that could impact issuers such as:
| • | Intent and ability to make all principal and interest payments when due; |
| • | Near-term business prospects; |
| • | Cash flow and liquidity; |
| • | Credit ratings; |
| • | Business climate; |
| • | Management changes; |
| • | Litigation and government actions; and |
| • | Other similar factors. |
This process also involves monitoring several factors including late payments, downgrades by rating agencies, asset quality, key financial ratios, financial statements, revenue forecasts and cash flow projections as indicators of credit issues.
All securities are reviewed to determine whether other-than-temporary impairments should be recorded. This process includes an assessment of the credit quality of each investment in the entire securities portfolio. Additional reporting and review procedures are conducted for those securities where fair value is less than 90% of amortized cost. Further, detailed analysis is performed for each issue or issues having experienced a formal restructuring or where the security has experienced material deterioration in fair value or where the fair value is less than 80% of amortized cost for six months or more.
The Company considers relevant facts and circumstances in evaluating whether the impairment of a security is other-than-temporary. Relevant facts and circumstances considered include but are not limited to:
| • | The current fair value of the security as compared to cost; |
51
Table of Contents
| • | The credit rating of the security; |
| • | The extent and the length of time the fair value has been below amortized cost; |
| • | The financial position of the issuer, including the current and future impact of any specific events, material declines in the issuer’s revenues, margins, cash positions, liquidity issues, asset quality, debt levels and income results; |
| • | Significant management or organizational changes; |
| • | Significant uncertainty regarding the issuer’s industry; |
| • | Violation of financial covenants; |
| • | Consideration of information or evidence that supports timely recovery; |
| • | The Company’s intent and ability to hold an equity security until it recovers in value; |
| • | Whether the Company intends to sell a debt security and whether it is more likely than not that the Company will be required to sell a debt security before recovery of the amortized cost basis; and |
| • | Other business factors related to the issuer’s industry. |
To the extent the Company determines that a fixed maturity security is deemed to be other-than-temporarily impaired, the portion of the impairment that is deemed to be due to credit is charged to the Consolidated Statements of Income and the cost basis of the underlying investment is reduced. The portion of the impairment that is deemed to be non-credit is charged to other comprehensive income (loss). Equity securities that are determined to be other-than-temporarily impaired are written down to fair value and the impairment is charged to the Consolidated Statements of Income.
There are a number of significant risks and uncertainties inherent in the process of monitoring impairments, determining if an impairment is other-than-temporary and determining the portion of an other-than-temporary impairment that is due to credit. These risks and uncertainties include but are not limited to:
| • | The risk that the Company’s assessment of an issuer’s ability to meet all of its contractual obligations will change based on changes in the credit characteristics of that issuer; |
| • | The risk that the economic outlook will be worse than expected or have more of an impact on the issuer than anticipated; |
| • | The risk that the performance of the underlying collateral for securities could deteriorate in the future and the Company’s credit enhancement levels and recovery values do not provide sufficient protection to the Company’s contractual principal and interest; |
| • | The risk that fraudulent, inaccurate or misleading information could be provided to the Company’s credit, investment and accounting professionals who determine the fair value estimates and accounting treatment for securities; |
| • | The risk that actions of trustees, custodians or other parties with interests in the security may have an unforeseen adverse impact on the Company’s investments; |
| • | The risk that new information obtained by the Company or changes in other facts and circumstances may lead the Company to change its intent to sell the security before it recovers in value; |
| • | The risk that the facts and circumstances change such that it becomes more likely than not that the Company will be required to sell the investment before recovery of the amortized cost basis; and |
| • | The risk that the methodology or assumptions used to develop estimates of the portion of impairments due to credit prove, over time, to be inaccurate or insufficient. |
Any of these situations could result in a charge to income in a future period.
The Company may selectively determine that it no longer intends to hold a specific issue to its maturity. If the Company makes this determination and the fair value is less than the cost basis, the investment is written down to the fair value and an other-than-temporary impairment is recorded on this particular position. Subsequently, the Company seeks to obtain the best possible outcome available for this specific issue and records an investment gain or loss at the disposal date.
The Company has exposure to the municipal bond market. The Company’s investments in municipal bonds present unique considerations in evaluating other-than-temporary impairments. Judgments regarding whether a municipal debt security is other-than-temporarily impaired include analyzing a number of rather unique characteristics pertaining to the issuer. Municipalities possess unique powers, along with special legal standing and protections. These powers include the sovereign power to tax, access to one-time revenue sources, capacity to issue or restructure debt and the ability to shift spending to other authorities. In addition, state governments often provide secondary support to local governments in times of financial stress and the federal government has also provided assistance to state governments as well.
52
Table of Contents
The evaluation of loan-backed and similar asset-backed securities, particularly including residential mortgage-backed securities, with significant indications of potential other-than-temporary impairment requires considerable use of estimates and judgment. Specifically, the Company performs discounted cash flow projections on these securities to evaluate whether the value of the investment is expected to be fully realized. Projections of expected future cash flows are based upon considerations of the performance of the actual underlying assets, including historical delinquencies, defaults, severity of losses incurred, and prepayments, along with the Company’s estimates of future results for these factors. The Company’s estimates of future results are based upon actual historical performance of the underlying assets relative to historical, current and expected general economic conditions, specific conditions related to the underlying assets, industry data, and other factors that are believed to be relevant. If the present value of the projected expected future cash flows are determined to be below the Company’s carrying value, the Company recognizes an other-than-temporary impairment on the portion of the carrying value that exceeds the projected expected future cash flows. To the extent that the loan-backed or other asset-backed securities remain high quality investments and do not otherwise demonstrate characteristics of impairment, the Company performs other initial evaluations to determine whether other-than-temporary cash flow evaluations need to be performed.
The discounted future cash flow calculation typically becomes the primary determinant of whether any portion and to what extent an unrealized loss is due to credit on loan-backed and similar asset-backed securities with significant indications of potential other-than-temporary impairment. Such indications typically include below investment grade ratings and significant unrealized losses for an extended period of time, among other factors. The Company identified 12 and 13 non-U.S. Agency mortgage-backed securities that had such indications as of December 31, 2010 and December 31, 2009, respectively. Discounted future cash flow analysis was performed for each of these securities to determine if any portion of the impairment was due to credit and deemed to be other-than-temporary. The discount rate used in calculating the present value of future cash flows was the investment yield at the time of purchase for each security. The initial default rates were assumed to remain constant over a 24-month time frame and grade down thereafter, reflecting the general perspective of a more stabilized residential housing environment in the future.
The following tables present the range of significant assumptions used in projecting the future cash flows as of December 31, 2010 and 2009, respectively. The Company believes that the assumptions below are reasonable because they are based upon the actual results of the underlying security collateral.
| 2010 | ||||||||||||||||||||||||
| Initial Default Rate | Initial Severity Rate | Prepayment Speed | ||||||||||||||||||||||
| Vintage |
Low | High | Low | High | Low | High | ||||||||||||||||||
| 2004 | 4.6% | 4.6% | 45% | 45% | 10.0% | 10.0% | ||||||||||||||||||
| 2005 | 4.9% | 12.3% | 46% | 69% | 6.0% | 11.0% | ||||||||||||||||||
| 2006 | 18.0% | 18.0% | 84% | 84% | 8.0% | 8.0% | ||||||||||||||||||
| 2007 | 8.7% | 8.7% | 60% | 60% | 8.0% | 8.0% | ||||||||||||||||||
| 2009 | ||||||||||||||||||||||||
| Initial Default Rate | Initial Severity Rate | Prepayment Speed | ||||||||||||||||||||||
| Vintage |
Low | High | Low | High | Low | High | ||||||||||||||||||
| 2004 | 3.5% | 3.8% | 40% | 40% | 10.0% | 12.0% | ||||||||||||||||||
| 2005 | 2.1% | 11.1% | 40% | 70% | 8.0% | 11.0% | ||||||||||||||||||
| 2006 | 18.0% | 18.0% | 95% | 95% | 7.0% | 7.0% | ||||||||||||||||||
| 2007 | 11.3% | 11.3% | 50% | 50% | 8.0% | 8.0% | ||||||||||||||||||
The determination of any amount of impairment that is due to credit is based upon a comparison of the present value of the projected future cash flows on the security to the amortized cost. If any portion of the impairment is determined to be due to credit, based upon the present value of projected future cash flows being less than the amortized cost of the security, this amount is recognized as a realized loss in the Company’s Consolidated Statements of Income and the carrying value of the security is written down by the same amount. The portion of an impairment that is determined not to be due to credit is recorded as a component of accumulated other comprehensive income (loss) (AOCI) in the Consolidated Balance Sheets.
53
Table of Contents
Following is a summary of the results of the analysis of present values of projected cash flows for non-U.S. Agency mortgage-backed securities as part of the analysis of potential other-than-temporary-impairment of securities as of December 31, 2010:
| Amortized Cost as of December 31, 2010 After OTTI |
OTTI Recognized During 2010 |
Cumulative OTTI Recognized |
Cumulative Non-Credit Impairment Recorded in AOCI as of December 31, 2010 |
|||||||||||||
| Written down |
$ | 68,274 | $ | 1,936 | $ | 16,802 | $ | 13,476 | ||||||||
| Not written down |
$ | 167,044 | $ | - | $ | - | $ | 6,046 | ||||||||
Following is a summary of the results of the analysis of present values of projected cash flows for non-U.S. Agency mortgage-backed securities as part of the analysis of potential other-than-temporary-impairment of securities as of December 31, 2009.
| Amortized Cost as of December 31, 2009 After OTTI |
OTTI Recognized During 2009 |
Cumulative OTTI Recognized |
Cumulative Non-Credit Impairment Recorded in AOCI as of December 31, 2009 |
|||||||||||||
| Written down |
$ | 57,515 | $ | 1,390 | $ | 14,558 | $ | 13,168 | ||||||||
| Not written down |
$ | 212,080 | $ | - | $ | - | $ | 38,725 | ||||||||
Significant unrealized losses on securities can continue for extended periods of time, particularly for certain individual securities. While this can be an indication of potential credit impairments, it can also be an indication of illiquidity in a particular sector or security. In addition, the fair value of an individual security can be heavily influenced by the complexities of varying market sentiment or uncertainty regarding the prospects for an individual security. This has been the situation in the non-U.S. Agency mortgage-backed securities market in recent periods. Based upon the process described above, the Company is best able to determine if and to what extent credit impairment may exist in these securities by performing present value calculations of projected future cash flows at the conclusion of each reporting period. By reviewing the most recent data available regarding the security and other relevant industry and market factors, the Company can modify assumptions used in the cash flow projections and determine the best estimate of the portion of any impairment that is due to credit at the conclusion of each period.
The Company closely monitors its investments in securities classified as subprime. Subprime securities include all bonds or portions of bonds where the underlying collateral is made up of home equity loans or first mortgage loans to borrowers whose credit scores at the time of origination were lower than the level recognized in the market as prime. The Company’s classification of subprime does not include Alt-A or jumbo loans, unless the collateral otherwise meets the preceding definition. At December 31, 2010, the fair value of investments with subprime residential mortgage exposure was $19.6 million with a related $4.9 million unrealized loss. At December 31, 2009, the fair value of investments with subprime residential mortgage exposure was $20.9 million with a related $8.0 million unrealized loss. This exposure amounted to less than 1% of the Company’s invested assets at both December 31, 2010 and 2009. These investments are included in the Company’s normal process for evaluation of other-than-temporarily impaired securities.
The Company has a significant level of non-U.S. Agency structured securities. Structured securities include asset-backed, residential mortgage-backed securities, along with collateralized debt obligations, collateralized mortgage obligations and other collateralized obligations. The Company monitors these securities through a combination of an analysis of vintage, credit ratings and other means.
54
Table of Contents
Identified below are tables that divide these investment types among vintage and credit ratings as of December 31, 2010.
| Fair Value |
Amortized Cost |
Unrealized Gains (Losses) |
||||||||||
| Residential & Non-agency MBS 1 |
||||||||||||
| Investment Grade: |
||||||||||||
| Vintage 2003 and earlier |
$ | 57,811 | $ | 55,929 | $ | 1,882 | ||||||
| 2004 |
72,031 | 74,725 | (2,694 | ) | ||||||||
| 2005 |
4,107 | 4,559 | (452 | ) | ||||||||
| 2006 |
- | - | - | |||||||||
| 2007 |
- | - | - | |||||||||
| Total investment grade |
133,949 | 135,213 | (1,264 | ) | ||||||||
| Below Investment Grade: |
||||||||||||
| Vintage 2003 and earlier |
- | - | - | |||||||||
| 2004 |
- | - | - | |||||||||
| 2005 |
70,721 | 86,382 | (15,661 | ) | ||||||||
| 2006 |
6,314 | 8,079 | (1,765 | ) | ||||||||
| 2007 |
4,812 | 5,644 | (832 | ) | ||||||||
| Total below investment grade |
81,847 | 100,105 | (18,258 | ) | ||||||||
| Other Structured Securities: |
||||||||||||
| Investment grade |
20,143 | 19,229 | 914 | |||||||||
| Below investment grade |
55,189 | 53,347 | 1,842 | |||||||||
| Total other |
75,332 | 72,576 | 2,756 | |||||||||
| Total structured securities |
$ | 291,128 | $ | 307,894 | $ | (16,766 | ) | |||||
| 1 | This chart accounts for all vintages owned by the Company. |
55
Table of Contents
Identified below are tables that divide these investment types among vintage and credit ratings as of December 31, 2009.
| Fair Value |
Amortized Cost |
Unrealized Gains (Losses) |
||||||||||
| Residential & Non-agency MBS 1 |
||||||||||||
| Investment Grade: |
||||||||||||
| Vintage 2003 and earlier |
$ | 78,263 | $ | 80,303 | $ | (2,040 | ) | |||||
| 2004 |
67,494 | 80,074 | (12,580 | ) | ||||||||
| 2005 |
30,729 | 42,761 | (12,032 | ) | ||||||||
| 2006 |
3,706 | 4,318 | (612 | ) | ||||||||
| 2007 |
- | - | - | |||||||||
| Total investment grade |
180,192 | 207,456 | (27,264 | ) | ||||||||
| Below Investment Grade: |
||||||||||||
| Vintage 2003 and earlier |
- | - | - | |||||||||
| 2004 |
- | - | - | |||||||||
| 2005 |
30,897 | 50,565 | (19,668 | ) | ||||||||
| 2006 |
2,669 | 5,715 | (3,046 | ) | ||||||||
| 2007 |
3,944 | 5,859 | (1,915 | ) | ||||||||
| Total below investment grade |
37,510 | 62,139 | (24,629 | ) | ||||||||
| Other Structured Securities: |
||||||||||||
| Investment grade |
106,822 | 110,327 | (3,505 | ) | ||||||||
| Below investment grade |
42,659 | 44,965 | (2,306 | ) | ||||||||
| Total other |
149,481 | 155,292 | (5,811 | ) | ||||||||
| Total structured securities |
$ | 367,183 | $ | 424,887 | $ | (57,704 | ) | |||||
| 1 | This chart accounts for all vintages owned by the Company. |
Total unrealized losses on non-U.S. Agency structured securities decreased from $57.7 million at December 31, 2009 to $16.8 million at December 31, 2010. Total unrealized losses on these securities as a percent of total amortized cost improved from 14% at year-end 2009 to 5% at year-end 2010.
56
Table of Contents
The following table provides information regarding fixed maturity and equity security investments available for sale with unrealized losses by length of time, as of December 31, 2010.
| Less Than 12 Months | 12 Months or Longer | Total | ||||||||||||||||||||||
| Fair Value |
Unrealized Losses |
Fair Value |
Unrealized Losses |
Fair Value |
Unrealized Losses |
|||||||||||||||||||
| U.S. Treasury securities and obligations of U.S. Government |
$ | 7,663 | $ | 286 | $ | 2,206 | $ | 32 | $ | 9,869 | $ | 318 | ||||||||||||
| Federal agency issued residential mortgage-backed securities 1 |
16 | 1 | 281 | 1 | 297 | 2 | ||||||||||||||||||
| Subtotal |
7,679 | 287 | 2,487 | 33 | 10,166 | 320 | ||||||||||||||||||
| Corporate obligations: |
||||||||||||||||||||||||
| Industrial |
76,795 | 2,825 | 3,023 | 105 | 79,818 | 2,930 | ||||||||||||||||||
| Energy |
7,848 | 224 | - | - | 7,848 | 224 | ||||||||||||||||||
| Communications and technology |
38,762 | 796 | - | - | 38,762 | 796 | ||||||||||||||||||
| Financial |
50,744 | 900 | 38,170 | 4,122 | 88,914 | 5,022 | ||||||||||||||||||
| Consumer |
67,690 | 1,444 | 14,931 | 929 | 82,621 | 2,373 | ||||||||||||||||||
| Public utilities |
24,165 | 1,204 | 4,394 | 262 | 28,559 | 1,466 | ||||||||||||||||||
| Total corporate obligations |
266,004 | 7,393 | 60,518 | 5,418 | 326,522 | 12,811 | ||||||||||||||||||
| Corporate private-labeled residential mortgage-backed securities |
- | - | 96,581 | 16,826 | 96,581 | 16,826 | ||||||||||||||||||
| Municipal securities |
81,799 | 2,537 | 7,145 | 764 | 88,944 | 3,301 | ||||||||||||||||||
| Other |
5,379 | 182 | 54,488 | 7,557 | 59,867 | 7,739 | ||||||||||||||||||
| Redeemable preferred stocks |
618 | 8 | 4,333 | 432 | 4,951 | 440 | ||||||||||||||||||
| Fixed maturity securities |
361,479 | 10,407 | 225,552 | 31,030 | 587,031 | 41,437 | ||||||||||||||||||
| Equity securities |
- | - | 2,034 | 137 | 2,034 | 137 | ||||||||||||||||||
| Total |
$ | 361,479 | $ | 10,407 | $ | 227,586 | $ | 31,167 | $ | 589,065 | $ | 41,574 | ||||||||||||
| 1 | Federal agency securities are not backed by the full faith and credit of the U.S. Government. |
57
Table of Contents
The following table provides information regarding investment securities with unrealized losses on fixed maturity and equity security investments available for sale, as of December 31, 2009.
| Less Than 12 Months | 12 Months or Longer | Total | ||||||||||||||||||||||
| Fair Value |
Unrealized Losses |
Fair Value |
Unrealized Losses |
Fair Value |
Unrealized Losses |
|||||||||||||||||||
| Bonds: |
||||||||||||||||||||||||
| U.S. Treasury securities and obligations of U.S. Government |
$ | 30,616 | $ | 913 | $ | 3,040 | $ | 108 | $ | 33,656 | $ | 1,021 | ||||||||||||
| Federal agency issued residential mortgage-backed securities 1 |
1,363 | 4 | 6,191 | 51 | 7,554 | 55 | ||||||||||||||||||
| Subtotal |
31,979 | 917 | 9,231 | 159 | 41,210 | 1,076 | ||||||||||||||||||
| Corporate obligations: |
||||||||||||||||||||||||
| Industrial |
53,908 | 603 | 20,621 | 1,971 | 74,529 | 2,574 | ||||||||||||||||||
| Energy |
8,603 | 130 | 6,922 | 601 | 15,525 | 731 | ||||||||||||||||||
| Communications and technology |
6,365 | 120 | 28,166 | 1,666 | 34,531 | 1,786 | ||||||||||||||||||
| Financial |
32,267 | 503 | 116,043 | 14,273 | 148,310 | 14,776 | ||||||||||||||||||
| Consumer |
26,740 | 921 | 45,255 | 2,285 | 71,995 | 3,206 | ||||||||||||||||||
| Public utilities |
37,896 | 769 | 24,817 | 1,821 | 62,713 | 2,590 | ||||||||||||||||||
| Total corporate obligations |
165,779 | 3,046 | 241,824 | 22,617 | 407,603 | 25,663 | ||||||||||||||||||
| Corporate private-labeled residential mortgage-backed securities |
18,319 | 2,266 | 158,813 | 40,664 | 177,132 | 42,930 | ||||||||||||||||||
| Municipal securities |
25,385 | 787 | 10,752 | 1,823 | 36,137 | 2,610 | ||||||||||||||||||
| Other |
362 | 153 | 141,516 | 19,214 | 141,878 | 19,367 | ||||||||||||||||||
| Redeemable preferred stocks |
831 | 2 | 7,672 | 1,361 | 8,503 | 1,363 | ||||||||||||||||||
| Fixed maturity securities |
242,655 | 7,171 | 569,808 | 85,838 | 812,463 | 93,009 | ||||||||||||||||||
| Equity securities |
- | - | 1,986 | 186 | 1,986 | 186 | ||||||||||||||||||
| Total |
$ | 242,655 | $ | 7,171 | $ | 571,794 | $ | 86,024 | $ | 814,449 | $ | 93,195 | ||||||||||||
| 1 | Federal agency securities are not backed by the full faith and credit of the U.S. Government. |
Gross unrealized losses on fixed maturity and equity security investments attributable to securities having gross unrealized losses of 12 months or longer decreased from $86.0 million at December 31, 2009 to $31.2 million at December 31, 2010. The largest component of this decrease was from the corporate private-labeled residential mortgage-backed securities category, which decreased $23.8 million during 2010. Further, $10.4 million or 25% of the gross unrealized losses on fixed maturity and equity security investments was attributable to securities having gross unrealized losses of less than 12 months. This compares to $7.2 million or 8% at December 31, 2009. The corporate obligations category of securities accounted for the largest portion of this increase. In addition, all of the Company’s equity securities at both December 31, 2010 and 2009 were in the financial sector.
In addition, the Company also considers as part of its monitoring and evaluation process the length of time a security is below cost. At December 31, 2010, the Company had unrealized losses on its investment portfolio for fixed maturities and equity securities as follows:
| • | 130 security issues representing 69% of the issues with unrealized losses, including 94% being rated as investment grade, were below cost for less than one year; |
| • | 18 security issues representing 10% of the issues with unrealized losses, including 56% being rated as investment grade, were below cost for one year or more and less than three years; and |
| • | 39 security issues representing 21% of the issues with unrealized losses, including 49% being rated as investment grade, were below cost for three years or more. |
At December 31, 2009, the Company had unrealized losses on its investment portfolio for fixed maturities and equity securities as follows:
| • | 84 security issues representing 36% of the issues with unrealized losses, including 93% being rated as investment grade, were below cost for less than one year; |
| • | 96 security issues representing 41% of the issues with unrealized losses, including 80% being rated as investment grade, were below cost for one year or more and less than three years; and |
58
Table of Contents
| • | 52 security issues representing 23% of the issues with unrealized losses, including 81% being rated as investment grade, were below cost for three years or more. |
The total number of fixed maturities and equity securities with unrealized losses decreased from 232 at December 31, 2009 to 187 at December 31, 2010. These results were primarily due to two factors. First, the Company has and continues to purchase high quality investments. Second, the economy and financial markets have continued to improve and interest rates have moved lower since December 31, 2009.
The following tables summarize the Company’s investments in securities available for sale with unrealized losses as of December 31, 2010 and December 31, 2009.
| December 31, 2010 | ||||||||||||
| Amortized Cost |
Fair Value |
Gross Unrealized Losses |
||||||||||
| Securities owned without realized impairment: |
||||||||||||
| Unrealized losses of 10% or less |
$ | 480,498 | $ | 465,414 | $ | 15,084 | ||||||
| Unrealized losses of 20% or less and greater than 10% |
71,101 | 61,718 | 9,383 | |||||||||
| Subtotal |
551,599 | 527,132 | 24,467 | |||||||||
| Unrealized losses greater than 20%: |
||||||||||||
| Investment grade |
||||||||||||
| Less than twelve months |
- | - | - | |||||||||
| Twelve months or greater |
5,908 | 4,458 | 1,450 | |||||||||
| Total investment grade |
5,908 | 4,458 | 1,450 | |||||||||
| Below investment grade |
||||||||||||
| Less than twelve months |
- | - | - | |||||||||
| Twelve months or greater |
- | - | - | |||||||||
| Total below investment grade |
- | - | - | |||||||||
| Unrealized losses greater than 20% |
5,908 | 4,458 | 1,450 | |||||||||
| Subtotal |
557,507 | 531,590 | 25,917 | |||||||||
| Securities owned with realized impairment: |
||||||||||||
| Unrealized losses of 10% or less |
5,642 | 5,217 | 425 | |||||||||
| Unrealized losses of 20% or less and greater than 10% |
16,073 | 14,009 | 2,064 | |||||||||
| Subtotal |
21,715 | 19,226 | 2,489 | |||||||||
| Unrealized losses greater than 20%: |
||||||||||||
| Investment grade |
||||||||||||
| Less than twelve months |
- | - | - | |||||||||
| Twelve months or greater |
- | - | - | |||||||||
| Total investment grade |
- | - | - | |||||||||
| Below investment grade |
||||||||||||
| Less than twelve months |
13,366 | 10,629 | 2,737 | |||||||||
| Twelve months or greater |
38,051 | 27,620 | 10,431 | |||||||||
| Total below investment grade |
51,417 | 38,249 | 13,168 | |||||||||
| Unrealized losses greater than 20% |
51,417 | 38,249 | 13,168 | |||||||||
| Subtotal |
73,132 | 57,475 | 15,657 | |||||||||
| Total |
$ | 630,639 | $ | 589,065 | $ | 41,574 | ||||||
59
Table of Contents
| December 31, 2009 | ||||||||||||
| Amortized Cost |
Fair Value |
Gross Unrealized Losses |
||||||||||
| Securities owned without realized impairment: |
||||||||||||
| Unrealized losses of 10% or less |
$ | 633,514 | $ | 608,280 | $ | 25,234 | ||||||
| Unrealized losses of 20% or less and greater than 10% |
109,379 | 94,348 | 15,031 | |||||||||
| Subtotal |
742,893 | 702,628 | 40,265 | |||||||||
| Unrealized losses greater than 20%: |
||||||||||||
| Investment grade |
||||||||||||
| Less than twelve months |
38,538 | 29,448 | 9,090 | |||||||||
| Twelve months or greater |
34,906 | 22,225 | 12,681 | |||||||||
| Total investment grade |
73,444 | 51,673 | 21,771 | |||||||||
| Below investment grade |
||||||||||||
| Less than twelve months |
4,654 | 2,954 | 1,700 | |||||||||
| Twelve months or greater |
15,139 | 11,139 | 4,000 | |||||||||
| Total below investment grade |
19,793 | 14,093 | 5,700 | |||||||||
| Unrealized losses greater than 20% |
93,237 | 65,766 | 27,471 | |||||||||
| Subtotal |
836,130 | 768,394 | 67,736 | |||||||||
| Securities owned with realized impairment: |
||||||||||||
| Unrealized losses of 10% or less |
4,850 | 4,634 | 216 | |||||||||
| Unrealized losses of 20% or less and greater than 10% |
10,594 | 8,720 | 1,874 | |||||||||
| Subtotal |
15,444 | 13,354 | 2,090 | |||||||||
| Unrealized losses greater than 20%: |
||||||||||||
| Investment grade |
||||||||||||
| Less than twelve months |
- | - | - | |||||||||
| Twelve months or greater |
17,937 | 12,298 | 5,639 | |||||||||
| Total investment grade |
17,937 | 12,298 | 5,639 | |||||||||
| Below investment grade |
||||||||||||
| Less than twelve months |
6,373 | 4,306 | 2,067 | |||||||||
| Twelve months or greater |
31,760 | 16,097 | 15,663 | |||||||||
| Total below investment grade |
38,133 | 20,403 | 17,730 | |||||||||
| Unrealized losses greater than 20% |
56,070 | 32,701 | 23,369 | |||||||||
| Subtotal |
71,514 | 46,055 | 25,459 | |||||||||
| Total |
$ | 907,644 | $ | 814,449 | $ | 93,195 | ||||||
The following table provides information on fixed maturity securities with gross unrealized losses by rating as of December 31, 2010.
| Equivalent S&P Rating |
Fair Value |
% of Total |
Gross Unrealized Losses |
% of Total |
||||||||||||
| AAA |
$ | 101,883 | 17% | $ | 5,105 | 12% | ||||||||||
| AA |
99,017 | 17% | 4,260 | 10% | ||||||||||||
| A |
113,304 | 19% | 4,486 | 11% | ||||||||||||
| BBB |
156,809 | 27% | 6,881 | 17% | ||||||||||||
| Total investment grade |
471,013 | 80% | 20,732 | 50% | ||||||||||||
| BB |
16,456 | 3% | 1,399 | 3% | ||||||||||||
| B and below |
99,562 | 17% | 19,306 | 47% | ||||||||||||
| Total below investment grade |
116,018 | 20% | 20,705 | 50% | ||||||||||||
| $ | 587,031 | 100% | $ | 41,437 | 100% | |||||||||||
60
Table of Contents
The following table provides information on fixed maturity securities with gross unrealized losses by rating as of December 31, 2009.
| Equivalent S&P Rating |
Fair Value |
% of Total |
Gross Unrealized Losses |
% of Total |
||||||||||||
| AAA |
$ | 273,810 | 34% | $ | 24,801 | 27% | ||||||||||
| AA |
38,618 | 5% | 3,023 | 3% | ||||||||||||
| A |
148,706 | 18% | 11,041 | 12% | ||||||||||||
| BBB |
235,671 | 29% | 24,047 | 26% | ||||||||||||
| Total investment grade |
696,805 | 86% | 62,912 | 68% | ||||||||||||
| BB |
49,136 | 6% | 4,032 | 4% | ||||||||||||
| B and below |
66,522 | 8% | 26,065 | 28% | ||||||||||||
| Total below investment grade |
115,658 | 14% | 30,097 | 32% | ||||||||||||
| $ | 812,463 | 100% | $ | 93,009 | 100% | |||||||||||
As of December 31, 2010, 80% of the fair value of fixed maturity securities with gross unrealized losses was investment grade compared to 86% at December 31, 2009. In addition, 50% of gross unrealized losses on fixed maturity securities with unrealized losses were from investment grade securities as of December 31, 2010, compared to 68% at December 31, 2009. These declines largely reflect the decline in total fixed maturity securities in an unrealized loss position during 2010.
The following tables provide the distribution of maturities for fixed maturity securities available for sale with unrealized losses as of December 31, 2010 and December 31, 2009. Expected maturities may differ from these contractual maturities since borrowers may have the right to call or prepay obligations.
| December 31, 2010 | ||||||||
| Fair Value |
Gross Unrealized Losses |
|||||||
| Fixed maturity security securities available for sale: |
||||||||
| Due in one year or less |
$ | 28 | $ | - | ||||
| Due after one year through five years |
75,560 | 1,948 | ||||||
| Due after five years through ten years |
166,658 | 6,005 | ||||||
| Due after ten years |
242,949 | 16,217 | ||||||
| Total |
485,195 | 24,170 | ||||||
| Securities with variable principal payments |
96,885 | 16,828 | ||||||
| Redeemable preferred stocks |
4,951 | 439 | ||||||
| Total |
$ | 587,031 | $ | 41,437 | ||||
| December 31, 2009 | ||||||||
| Fair Value |
Gross Unrealized Losses |
|||||||
| Fixed maturity security securities available for sale: |
||||||||
| Due in one year or less |
$ | 10,483 | $ | 26 | ||||
| Due after one year through five years |
65,359 | 4,842 | ||||||
| Due after five years through ten years |
220,600 | 12,402 | ||||||
| Due after ten years |
295,339 | 30,521 | ||||||
| Total |
591,781 | 47,791 | ||||||
| Securities with variable principal payments |
212,179 | 43,855 | ||||||
| Redeemable preferred stocks |
8,503 | 1,363 | ||||||
| Total |
$ | 812,463 | $ | 93,009 | ||||
61
Table of Contents
The following is a discussion of all non-residential mortgage-backed securities whose fair value had been less than 80% of amortized cost for at least six consecutive months at December 31, 2010. The Company has considered a wide variety of factors to determine that these positions were not other-than-temporarily impaired.
| Security |
Description | |
| Two financial institutions |
Institutions impacted by housing and mortgage crisis. Securities continue to perform within contractual obligations. | |
| Collateralized debt obligation |
Impacted by delinquencies and foreclosures in subprime and Alt-A markets and extreme declines in market valuations regardless of individual security performance. There continues to be overcollateralization within the structure and the investment continues to perform within contractual obligations. | |
The Company has written down certain investments in previous periods. Securities written down and still owned at December 31, 2010 had a fair value of $70.5 million with a net unrealized loss of $12.2 million, including the impact of the cumulative effect of change in accounting principle. Comparatively, securities written down and still owned at December 31, 2009 had a carrying value of $40.7 million and a net unrealized loss of $17.2 million.
The Company evaluated the current status of all investments previously written-down to determine whether the Company continues to believe that these investments were still credit-impaired to the extent previously recorded. The Company’s evaluation process is similar to its impairment evaluation process. If evidence exists that the Company believes that it will receive all or a materially greater portion of its contractual maturities from securities previously written down, the accretion of income is adjusted. The Company did not change its evaluation of any investments under this process during 2010. However, the Company changed its evaluation of two investments during 2009. The Company believed that it would receive all contractual maturities due on these investments. During the second quarter of 2009, the Company changed its evaluation of one security that matured in less than one year from an issuer that designs, manufactures and services cars and trucks and provides vehicle-related financing, leasing and insurance. In the fourth quarter of 2009, the Company changed the evaluation of one investment that matured in nine years from an issuer that operates a television network, several cable channels, radio and television stations and outdoor advertising.
The Company does not have a material amount of direct or indirect guarantees for the securities in its investment portfolio. The Company did not have any direct exposure to financial guarantors at December 31, 2010 or December 31, 2009. The Company’s indirect exposure to financial guarantors at December 31, 2010 totaled $41.9 million, which was 1% of the Company’s investment assets. Total unrealized losses on these investments totaled $1.8 million at December 31, 2010. The Company’s indirect exposure to financial guarantors at December 31, 2009 totaled $47.2 million, which was less than 2% of the Company’s investment assets. Total unrealized losses on these investments totaled $5.8 million at December 31, 2009.
Other Revenues
Other revenues consist primarily of supplementary contract considerations, policyholder dividends left with the Company to accumulate, income received on the sale of low income housing tax credit (LIHTC) investments by a subsidiary of the Company and fees charged on products and sales from the Company’s broker-dealer subsidiary. Other revenues decreased $1.4 million or 13% in 2010 compared to 2009. This decline was largely due to a decrease in supplementary contract considerations and a reduction in income on the sale of LIHTC investments due to timing. Other revenues decreased $2.5 million or 19% in 2009 versus 2008. This decrease was largely due to a reduction in income from reduced volumes of sales of LIHTC investments and broker-dealer transactions. Also, revenue from supplementary contract considerations increased, but was offset by a reduction in dividends left to accumulate.
Policyholder Benefits
Policyholder benefits consist of death benefits (mortality), immediate annuity benefits, accident and health benefits, surrenders, interest, dividends, supplementary contracts and the associated increase or decrease in reserves for future policy benefits. The largest component of policyholder benefits was death benefits for the periods presented. Death benefits reflect mortality results, after consideration of the impact of reinsurance. Mortality will fluctuate from period-to-period but has remained within pricing expectations for the periods presented.
Policyholder benefits increased $4.0 million or 2% in 2010 compared to 2009. The largest factor in this increase was a $3.9 million increase in benefit and contract reserves. This increase was largely due to higher traditional life reserves due to the increase in sales of this product and to the change in the fair value of the guaranteed minimum withdrawal benefit (GMWB) riders. The fair value of the GMWB riders declined $1.2 million during 2010 compared to a decline of $2.4 million during 2009. Partially offsetting these items, surrenders declined $1.1 million versus one year earlier. The decrease in surrenders was largely on traditional life policies. Policyholder benefits increased $0.2 million or less than 1% in 2009 compared to 2008. Benefit and contract reserves increased due to higher annuity sales, as reserves are established virtually on a one-for-one basis with premiums. Partially offsetting this was a decrease in benefit and contract reserves for the GMWB.
62
Table of Contents
The Company has a GMWB rider for variable annuity contracts that is considered to be a financial derivative and, as such, is accounted for at fair value. The Company determines the fair value of the GMWB rider using a risk-neutral valuation method. This method is a probability measure that results when the current value of all financial assets is assumed to equal the expected value of the future payoff of the asset discounted at the risk-free rate. The value of the riders will fluctuate depending on market conditions. At December 31, 2010, the fair value of these riders decreased $1.2 million compared to the fair value at December 31, 2009. This fluctuation can be attributed to favorable returns and lower volatility in the capital markets, partially offset by decreases in risk-free swap rates and decreases in issuer discount spreads. In addition, the Company has a guaranteed minimum death benefit (GMDB) on certain products. The benefit reserve for GMDB was $0.3 million at December 31, 2010, down slightly from December 31, 2009.
Policyholder benefits for the group accident and health product line were flat in 2010 compared to 2009 and increased $0.2 million or 1% in 2009 compared to 2008. The increase that occurred during 2009 was largely the result of an increase in group dental benefits.
Interest Credited to Policyholder Account Balances
Interest is credited to policyholder account balances according to terms of the policies or contracts. Interest is credited to policyholder account balances for universal life, fixed deferred annuities and other investment-type products. There are minimum levels of interest crediting assumed in certain policies or contracts, as well as allowances for adjustments to be made to reflect current market conditions in certain policies or contracts. Accordingly, the Company reviews and adjusts crediting rates as necessary and appropriate. Amounts credited are a function of account balances and current period crediting rates. As account balances fluctuate, so will the amount of interest credited to policyholder account balances. Interest credited to policyholder account balances decreased $0.8 million or 1% in 2010 and $0.2 million or less than 1% in 2009. While total policyholder account balances increased during 2010 compared to 2009, this increase was offset by a decline in crediting rates. The Company lowered crediting rates on in force funds at the beginning of 2010 and on new deposits as market rates declined during the year. Total policyholder account balances increased $17.1 million or 1% in 2010, following an $18.2 million or 1% increase during 2009. The 2009 results were largely the result of two factors. First, while policyholder account balances declined in early 2009, the balances steadily increased during the year. Second, crediting rates increased on certain products, such as deferred annuities, but decreased on others. The average interest rate credited to policyholder account balances was 4.14% in 2010, 4.26% in 2009 and 4.28% in 2008.
Amortization of Deferred Acquisition Costs
Deferred acquisition costs (DAC), principally agent commissions and other selling, selection and issue costs, which vary with and are directly related to the production of new business, are capitalized as incurred. At least annually, the Company reviews its DAC capitalization policy and the specific items which are capitalized with existing guidance. These deferred costs for life insurance products are generally deferred and amortized over the premium paying period. Policy acquisition costs that relate to interest sensitive and variable insurance products are deferred and amortized with interest in relation to the estimated gross profits to be realized over the lives of the contracts. At least annually, a review is performed of the assumptions related to profit expectations. If it is determined the assumptions should be revised, the impact of the changes is recorded as a change in DAC amortization in the current period due to an unlocking adjustment.
The amortization of DAC was $27.0 million in 2010, compared with $35.1 million in 2009 and $35.0 million in 2008. The decrease in 2010 was primarily the result of a refinement in methodology due to upgrades and enhancements to the Company’s modeling systems and the unlocking of certain assumptions, principally mortality. The refinement in methodology resulted in a change in estimate. The refinement and unlocking adjustment both caused a reduction in DAC amortization. The effect of the refinement was an increase in the DAC asset and a reduction in DAC amortization of $1.8 million. The impact of unlocking was an increase in the DAC asset and a corresponding decrease in the amortization of DAC of $5.8 million. While total DAC amortization did not fluctuate significantly between 2009 and 2008, two components of the balances did change. While no unlocking adjustment was made during 2009, DAC amortization was reduced by $3.0 million due to unlocking during 2008. This was mostly offset by a decline in amortization resulting from lower expected gross profits in 2009 and an increase in amortization resulting from a significant decrease in the fair value of variable products in 2008.
Reinsurance
The Company reinsures certain risks with unaffiliated insurance companies under traditional indemnity reinsurance arrangements. These arrangements include yearly renewable term agreements and coinsurance agreements. The Company enters into these agreements to assist in diversifying risks and to limit the maximum loss from risks on certain policies. The ceded reinsurance agreements do not relieve the Company of its obligations to its policyholders. As such, the Company monitors the ongoing ability of the reinsurers to perform under the terms of the reinsurance agreements.
63
Table of Contents
Premiums are reported net of premiums ceded under reinsurance agreements. Policyholder benefits and expenses are reported net of reinsurance ceded and equaled $59.7 million, $53.1 million and $69.1 million for the years ended December 31, 2010, 2009 and 2008, respectively.
Future policy benefits and other related assets and liabilities are not reduced for reinsurance in the balance sheet. A reinsurance receivable is established for such balance sheet items. Reinsurance related to policy and claim reserves ceded of $167.5 million and $166.5 million were included in the reinsurance receivables as of December 31, 2010 and 2009, respectively. Ceded benefits recoverable from reinsurers were $19.6 million and $16.3 million as of December 31, 2010 and 2009, respectively.
The Company’s overall reinsurance strategy has not changed during the periods addressed in this report.
Operating Expenses
Operating expenses consist of incurred commission expense from the sale of insurance products, net of the deferral and capitalization of certain commissions and certain expenses directly associated with the attainment of new business, expenses from the Company’s operations, the amortization of value of business acquired and other expenses. Capitalized commissions consist primarily of commissions and non-recurring expenses related to the sale of business. In total, operating expenses decreased $2.7 million or 3% in 2010, following an increase of $3.5 million or 3% in 2009 compared to one year earlier. The two largest factors contributing to the 2010 decrease were a $5.5 million reduction in salaries and employee benefits and a $1.8 million decline in legal expenses. These were partially offset by a $0.6 million increase in premium taxes, a $2.3 million increase in the amortization of value of business acquired and $1.1 million in commission expense growth exceeding the growth in the deferral in capitalized acquisition costs. The largest factors in the 2009 increase were a $4.2 million increase in pension expense and $3.1 million in separation costs associated with a reduction in staffing. Also contributing to the increase in 2009 were legal and incentive compensation expenses. Partially offsetting these increases were decreases in salaries, travel expenses and outside labor and services.
The amortization of value of business acquired (VOBA) is included in operating expenses. VOBA is amortized in concert with each purchased block of business. Generally, as policies run off, the amortization will decline over time. In addition, VOBA is evaluated for unlocking adjustments on an ongoing basis. If necessary, adjustments are made in the current period VOBA amortization. The amortization of VOBA was $6.8 million in 2010, $4.5 million in 2009 and $7.1 million in 2008. The increase in 2010 was largely due to a refinement in methodology and an unlocking that occurred in 2009. The refinement in methodology reduced VOBA amortization in the amount of $2.5 million in 2009, while the unlocking reduced VOBA amortization by an additional $0.2 million in 2009. The decrease in 2009 was largely due to two factors. First, the Company refined its method for calculating VOBA from a premium-based method to a volume-based method for certain traditional life products during 2009. Since the establishment of the VOBA, the measure of premium in force has fluctuated from period to period. This has resulted in a corresponding volatile amortization of the VOBA unrelated to the actual run off of the in force policies. Second, the unlocking adjustment on interest-sensitive products in the 2009 decreased VOBA amortization by $0.2 million, whereas the unlocking adjustment in 2008 increased VOBA amortization by $0.2 million. The unlocking adjustment in 2009 was related to improvements in the ultimate earned rates for certain products. The unlocking adjustment in 2008 was related to a change in the policy surrender assumptions.
Income Taxes
The Company recorded income tax expense of $12.5 million or 36% of income before tax in 2010, compared to income tax expense of $5.7 million or 35% of income before tax in 2009. The increase in tax expense in 2010 versus 2009 was primarily due to higher income before tax and unfavorable changes in low income housing tax credit investments. Partially offsetting these increases was the impact of a decrease in tax contingency. In 2008, the Company recorded an income tax benefit of $9.2 million or 35% of income before tax. The increase in tax expense in 2009 versus 2008 was primarily due to higher income before tax and a decrease in low income housing tax credit benefits. Income taxes will fluctuate depending upon items such as net income, realized investment gains and losses, and affordable housing tax credits.
The Company’s investments in affordable housing increased tax expense in 2010, 2009, and 2008 due to the equity adjustment related to the affordable housing investments exceeding the tax credits earned and the recapture of tax credits previously recognized. In 2010, the effect of the investments in affordable housing on the effective tax rate was a tax expense of $1.8 million or 5%, resulting from $1.3 million in current-year equity adjustments exceeding tax credits earned and $0.5 million of recapture tax credits previously recognized. The effect of the investments in affordable housing on the effective tax rate was a tax expense of $1.0 million or 6% in 2009, resulting from $0.7 million in current-year equity adjustments exceeding the tax credits earned and $0.3 million of recaptured tax credits previously recognized. In 2008, equity adjustments offset tax credits earned, resulting in tax expense of $0.1 million or less than 1%.
64
Table of Contents
The Company establishes contingent tax assets or liabilities, when appropriate, to provide for potential challenges by taxing jurisdictions. In 2010, the Company’s income tax expense was reduced $1.3 million, due to a net decrease in contingent tax liabilities relating to the 2006 through 2010 tax years. The Company’s income tax expense was decreased $0.1 million in 2009 and increased $0.1 million in 2008 due to the net change in contingent tax liabilities.
Operating Results by Segment
The Company has three reportable business segments, which are defined based on the nature of the products and services offered: Individual Insurance, Group Insurance and Old American. The Individual Insurance segment consists of individual insurance products for both Kansas City Life and Sunset Life. The Individual Insurance segment is marketed through a nationwide sales force of independent general agents and third-party marketing arrangements. The Group Insurance segment consists of sales of group life, group disability, dental and vision products. This segment is marketed through a nationwide sales force of independent general agents, group brokers and third-party marketing arrangements. Old American consists of individual insurance products designed largely as final expense products. These products are marketed through a nationwide general agency sales force with exclusive territories, using direct response marketing to supply agents with leads. For more information, refer to Note 11 – Segment Information in the Notes to Consolidated Financial Statements.
65
Table of Contents
Individual Insurance
The following table presents financial data for the Individual Insurance business segment for the years ended December 31.
| 2010 | 2009 | 2008 | ||||||||||
| Insurance revenues: |
||||||||||||
| Premiums, net |
$ | 25,755 | $ | 26,372 | $ | 17,473 | ||||||
| Contract charges |
106,019 | 105,735 | 109,007 | |||||||||
| Total insurance revenues |
131,774 | 132,107 | 126,480 | |||||||||
| Investment revenues: |
||||||||||||
| Net investment income |
162,997 | 164,133 | 164,243 | |||||||||
| Realized investment gains, excluding impairment losses |
3,687 | 10,561 | 10,107 | |||||||||
| Net impairment losses recognized in earnings: |
||||||||||||
| Total other-than-temporary impairment losses |
(3,828 | ) | (32,731 | ) | (60,094 | ) | ||||||
| Portion of impairment losses recognized in other comprehensive income (loss) |
343 | 13,949 | - | |||||||||
| Net impairment losses recognized in earnings |
(3,485 | ) | (18,782 | ) | (60,094 | ) | ||||||
| Total investment revenues |
163,199 | 155,912 | 114,256 | |||||||||
| Other revenues |
8,978 | 10,323 | 12,734 | |||||||||
| Total revenues |
303,951 | 298,342 | 253,470 | |||||||||
| Policyholder benefits |
106,523 | 102,499 | 101,275 | |||||||||
| Interest credited to policyholder account balances |
85,949 | 86,713 | 86,899 | |||||||||
| Amortization of deferred acquisition costs |
14,976 | 24,023 | 24,304 | |||||||||
| Operating expenses |
60,141 | 67,908 | 65,641 | |||||||||
| Total benefits and expenses |
267,589 | 281,143 | 278,119 | |||||||||
| Income (loss) before income tax expense (benefit) |
36,362 | 17,199 | (24,649 | ) | ||||||||
| Income tax expense (benefit) |
12,855 | 5,981 | (8,724 | ) | ||||||||
| Net income (loss) |
$ | 23,507 | $ | 11,218 | $ | (15,925 | ) | |||||
The net income for this segment in 2010 was $23.5 million, compared to net income of $11.2 million in 2009 and a net loss of $15.9 million in 2008. The largest factor in the increase in net income in 2010 was a net realized investment gain of $0.2 million in 2010 compared to an $8.2 million net realized investment loss in 2009. Other factors contributing to the increase were lower operating expenses and a decrease in amortization of deferred acquisition costs. Partially offsetting these favorable items were a decrease in net investment income and higher income tax expense. The largest factor in the increase in income in 2009 versus 2008 was a $41.8 million reduction in net realized investment losses. Partially offsetting these improvements, operating expenses increased $2.3 million and contract charges declined $3.3 million. Although premiums increased significantly in 2009, the growth was primarily in immediate annuities. These new premiums are largely offset by increased reserves in policyholder benefits, having little impact on net income in the current period.
This segment’s insurance revenues (total insurance revenues excluding reinsurance ceded) are primarily derived from premiums on traditional insurance products and contract charges. In 2010 and 2009, this segment received 39% of its insurance revenues from premiums on traditional products, compared to 36% in 2008.
Total insurance revenues were flat in 2010 compared to a 4% increase in 2009. In 2010, gross premiums and contract charges both increased less than 1%, which were offset by a 2% increase in reinsurance ceded. The increase in insurance revenues in 2009 was due to a 15% increase in premiums, as immediate annuity sales increased 75% compared to 2008. This was partially offset by a 3% decline in contract charges, resulting from lower account balances on variable contracts, lower surrender charges due to a decline in policy surrenders on certain products and the runoff of closed blocks.
This segment’s products are primarily marketed through a nationwide sales force of independent general agents. The Individual Insurance segment is central to the Company’s overall performance and produced 54% of consolidated insurance revenues for the years ended December 31, 2010 and 2009 and 53% for the year ended December 31, 2008.
66
Table of Contents
The following table presents gross premiums included in insurance revenues and provides detail by new and renewal business for the three years ended December 31. New premiums are also detailed by product.
| 2010 | % Change | 2009 | % Change | 2008 | ||||||||||||||||
| New premiums: |
||||||||||||||||||||
| Individual life insurance |
$ | 5,171 | (5 | ) | $ | 5,423 | (4 | ) | $ | 5,632 | ||||||||||
| Immediate annuities |
22,313 | 1 | 22,113 | 75 | 12,612 | |||||||||||||||
| Total new premiums |
27,484 | - | 27,536 | 51 | 18,244 | |||||||||||||||
| Renewal premiums |
41,667 | 1 | 41,456 | (1 | ) | 41,916 | ||||||||||||||
| Total premiums |
69,151 | - | 68,992 | 15 | 60,160 | |||||||||||||||
| Reinsurance ceded |
(43,396 | ) | 2 | (42,620 | ) | - | (42,687 | ) | ||||||||||||
| Premiums, net |
$ | 25,755 | (2 | ) | $ | 26,372 | 51 | $ | 17,473 | |||||||||||
Total premiums for this segment were flat in 2010 compared to a 15% increase in 2009. Total new premiums were also flat, as a $0.2 million or 1% increase in new immediate annuity premiums was offset by a $0.3 million or 5% decrease in new individual life premiums. Total new premiums increased $9.3 million or 51% in 2009, as new immediate annuity premiums increased $9.5 million or 75%. The increase in immediate annuity sales represented a demand for guaranteed benefit and retirement income products by consumers and an increase in sales from a third-party arrangement. Total renewal premiums increased $0.2 million or 1% in 2010, reflecting a $0.3 million or 1% increase in renewal individual life premiums. Total renewal premiums decreased $0.5 million or 1% in 2009, largely due to a $0.3 million or 1% decline in renewal individual life premiums.
The following table reconciles deposits with the Consolidated Statements of Cash Flows and provides detail by new and renewal deposits for the three years ended December 31. New deposits are also detailed by product.
| 2010 | % Change | 2009 | % Change | 2008 | ||||||||||||||||
| New deposits: |
||||||||||||||||||||
| Universal life insurance |
$ | 13,330 | 35 | $ | 9,873 | (10 | ) | $ | 10,913 | |||||||||||
| Variable universal life insurance |
1,226 | 19 | 1,031 | (47 | ) | 1,942 | ||||||||||||||
| Fixed deferred annuities |
67,709 | (12 | ) | 76,612 | 152 | 30,413 | ||||||||||||||
| Variable annuities |
18,121 | 13 | 16,078 | (37 | ) | 25,496 | ||||||||||||||
| Total new deposits |
100,386 | (3 | ) | 103,594 | 51 | 68,764 | ||||||||||||||
| Renewal deposits |
137,827 | 1 | 136,048 | 3 | 131,701 | |||||||||||||||
| Total deposits |
$ | 238,213 | (1 | ) | $ | 239,642 | 20 | $ | 200,465 | |||||||||||
Total new deposits declined $3.2 million or 3% in 2010, following a $34.8 million or 51% increase in 2009. The decline in 2010 was due to an $8.9 million or 12% decrease in new fixed deferred annuity deposits. This decline can largely be contributed to the comparison with the higher sales of this product in 2009. Partially offsetting the decrease in new deposits in 2010 were the following improvements: new universal life deposits increased $3.5 million or 35%, new variable annuity deposits increased $2.0 million or 13% and new variable universal life deposits increased $0.2 million or 19%. The increase in new deposits in 2009 was due to a $46.2 million or 152% increase in new fixed deferred annuity deposits. This improvement was partially offset by declines in the following products: $1.0 million or 10% in new universal life deposits, $0.9 million or 47% in new variable universal life deposits and $9.4 million or 37% in new variable annuity deposits.
Total renewal deposits increased $1.8 million or 1% in 2010, due to a $5.7 million or 21% increase in fixed deferred annuity deposits. This increase largely resulted from higher sales of this product experienced during 2009. Partially offsetting the increase in renewal deposits in 2010, universal life deposits decreased $1.8 million or 2%, variable universal life deposits declined $1.5 million or 11% and variable annuity deposits declined $0.6 million or 6%. Total renewal deposits increased 3% in 2009, as a 54% increase in fixed deferred annuity deposits was partially offset by a 3% decrease in universal life deposits, an 8% decrease in variable universal life deposits and an 8% decrease in variable annuity deposits. The increases in sales of fixed deferred annuities during 2009 were attributed to consumer preferences for fixed-rate products resulting from the volatility in the equity markets. This volatility and the difficult economic environment were also significant factors in the declines in sales of variable annuities, variable universal life and universal life.
67
Table of Contents
Contract charges were flat in 2010 compared to a $3.3 million decline in 2009. The results in 2010 reflected a decrease in cost of insurance charges, largely due to the runoff of closed blocks and a decrease in surrender charges resulting from lower surrenders of variable and universal life products. Offsetting these, expense loads increased due to higher account values of variable annuities and more loads realized on the sale of universal life products. In addition, deferred revenue increased, largely due to unlocking that occurred during 2010, as identified below. The decline in 2009 can largely be attributed to three factors: lower account balances on variable contracts, lower surrender charges due to a decline in policy surrenders on certain products and the runoff of closed blocks.
The Company essentially maintains two separate books of business. The Company has closed blocks of business associated with the purchase of companies which have been merged into the Company, purchased blocks of business through such things as assumption reinsurance and closed blocks associated with products or distribution avenues that the Company no longer pursues. The Company also maintains ongoing blocks of business for which there is ongoing marketing of new sales. Total contract charges on closed blocks totaled 36% of total consolidated contract charges during 2010 versus 37% in 2009. Total contract charges on closed blocks declined 4% in 2010 compared to 2009, reflecting the runoff of this business. Total contract charges on open blocks of business increased by 3% during 2010, reflecting the growing blocks of new and existing products.
One component of contract charges is the recognition over time of the DRL from certain universal life policies. This liability arises from front-end loads on such policies and is recognized into the income statement in concert with the future expected gross profits, as is similarly the case with amortization of DAC. In 2010, the Company completed the upgrade and enhancement of its projection modeling capabilities resulting in a refinement in methodology and a change in estimate. The effect of the refinement on the DRL was an increase in the liability and a reduction to contract charges of $0.9 million during 2010. No refinements in methodology occurred during 2009 or 2008.
At least annually, a review is performed regarding the assumptions related to profit expectations. If it is determined that the assumptions should be revised, an adjustment may be recorded to contract charge deferred revenues in the current period as an unlocking adjustment. The Company had an unlocking in the DRL in 2010 related to changes in assumptions. The impact of the unlocking on DRL was a decrease in the liability and a corresponding increase in the recognition of deferred revenue in 2010 in the amount of $1.1 million. No unlocking adjustments were identified on the DRL during 2009. Unlocking that occurred during 2008 resulted in an increase to the deferred revenue liability and a corresponding decrease to deferred revenue in the amount of $0.8 million.
Net investment income was flat in both 2010 and 2009. Investment income is primarily driven by changes in interest rates, asset levels and investment expenses. In 2010, average invested assets increased while yields earned on investments declined. The results for 2009 reflected a decline in investment assets that was mostly offset by an increase in investment yields. The decline in investment assets largely reflected lower book value due to sales, maturities and calls. The increase in investment yields was largely due to a higher return on an alternative investment fund compared to the prior year. In 2009, this investment added gross investment income of $2.1 million. However, as a result of the significant decline in the economic environment, this investment resulted in a decline in gross investment income of $3.7 million in 2008.
In the fourth quarter of 2009, the Company experienced $1.9 million of net impairment losses on the Company’s real estate joint ventures, specifically attributable to investments in affordable housing funds. The Company is a limited partner in several joint ventures whose underlying investments are in affordable housing properties. These properties generate federal and/or state tax credits and have a residual value in the properties that requires the funds to operate as a real estate joint venture investment. In one property fund, an impairment of $1.6 million resulted from the transfer of the residual interest in certain properties in exchange for contingent future benefits. An additional impairment of $0.3 million was recorded due to the foreclosure of certain properties in a second property fund.
68
Table of Contents
The following table summarizes securities with other-than-temporary impairments recognized in earnings during the four quarters of 2010 by asset class:
| First Quarter |
Second Quarter |
Third Quarter |
Fourth Quarter |
Total | ||||||||||||||||
| Bonds: |
||||||||||||||||||||
| Corporate private-labeled residential mortgage-backed securities |
$ | 737 | $ | 366 | $ | 242 | $ | - | $ | 1,345 | ||||||||||
| Other |
740 | 807 | 593 | - | 2,140 | |||||||||||||||
| Total |
$ | 1,477 | $ | 1,173 | $ | 835 | $ | - | $ | 3,485 | ||||||||||
The following table provides detail regarding individual investment securities that were written down through earnings during 2010 exceeding $0.5 million.
| Security |
Impairment Loss |
Description | ||||
| Securitization of U.S. government guaranteed student loans |
$964 | Liquidation of the security by the trustees, at the direction of a majority of bondholders. | ||||
| Other - 10 securities |
2,521 | |||||
| Total |
$3,485 | |||||
The following table summarizes securities with other-than-temporary impairments recognized in earnings during the four quarters of 2009 by asset class:
| First Quarter |
Second Quarter |
Third Quarter |
Fourth Quarter |
Total | ||||||||||||||||
| Bonds: |
||||||||||||||||||||
| Corporate obligations: |
||||||||||||||||||||
| Industrial |
$ | 2,656 | $ | - | $ | - | $ | 555 | $ | 3,211 | ||||||||||
| Communications |
- | 1,010 | 229 | - | 1,239 | |||||||||||||||
| Financial |
1,546 | 2,276 | 1,410 | 4,546 | 9,778 | |||||||||||||||
| Consumer |
1,235 | - | - | - | 1,235 | |||||||||||||||
| Total corporate obligations |
5,437 | 3,286 | 1,639 | 5,101 | 15,463 | |||||||||||||||
| Corporate private-labeled residential mortgage-backed securities |
598 | 126 | 293 | 135 | 1,152 | |||||||||||||||
| Other |
- | 165 | - | 112 | 277 | |||||||||||||||
| Total |
$ | 6,035 | $ | 3,577 | $ | 1,932 | $ | 5,348 | $ | 16,892 | ||||||||||
69
Table of Contents
The following table provides detail regarding individual investment securities that were written down through earnings during 2009 exceeding $0.5 million.
| Security |
Impairment Loss |
Description | ||||
| Financial guarantee insurance company |
$4,139 | Two securities, one issuer a parent of the other, had significant reductions in capital and liquidity positions coupled with declines in value due to the credit crisis. | ||||
| Financing company for real estate |
2,167 | Acceptance of a tender offer resulted in an impairment to fair value. | ||||
| Trucking company |
2,191 | Reduced shipping volume from the recession, new credit restrictions due to renegotiation of debt covenants, the need to retire longer-term debt and additional stress on cash resources. | ||||
| Mortgage and financial guaranty insurer |
1,546 | Mortgage delinquencies and defaults coupled with rating downgrades and the need to raise additional capital to meet future needs. | ||||
| Financial institution |
1,084 | Company experienced large losses in its real estate portfolio and had an increase in non-performing loans. | ||||
| Developer and manufacturer of imaging products |
1,235 | Sales decrease from economic decline, declining revenues and declining liquidity position. | ||||
| Print media company |
1,239 | Company filed for bankruptcy in 2008 and a subsequent impairment was recognized due to reorganization. | ||||
| Printing and publishing company |
1,020 | Acceptance of a tender offer resulted in an impairment to fair value. | ||||
| Global finance company |
843 | Negative effect of credit crisis, forcing reduced access to liquidity and higher borrowing costs. | ||||
| Other - 8 securities |
1,428 | |||||
| Total |
$16,892 | |||||
The following table summarizes securities with other-than-temporary impairments recognized in earnings during the four quarters of 2008 by asset class:
| First Quarter |
Second Quarter |
Third Quarter |
Fourth Quarter |
Total | ||||||||||||||||
| Bonds: |
||||||||||||||||||||
| Corporate obligations: |
||||||||||||||||||||
| Industrial |
$ | - | $ | - | $ | 2,105 | $ | - | $ | 2,105 | ||||||||||
| Communications |
- | 1,679 | 1,080 | 360 | 3,119 | |||||||||||||||
| Financial |
- | 3,347 | 16,228 | 2,661 | 22,236 | |||||||||||||||
| Consumer |
- | 2,074 | - | 3,446 | 5,520 | |||||||||||||||
| Total corporate obligations |
- | 7,100 | 19,413 | 6,467 | 32,980 | |||||||||||||||
| Corporate private-labeled residential mortgage-backed securities |
- | - | - | 4,164 | 4,164 | |||||||||||||||
| Other |
- | 2,601 | 5,075 | 5,102 | 12,778 | |||||||||||||||
| Redeemable preferred stocks |
- | - | - | 1,747 | 1,747 | |||||||||||||||
| Fixed maturity securities |
- | 9,701 | 24,488 | 17,480 | 51,669 | |||||||||||||||
| Equity securities |
- | - | 6,436 | 1,989 | 8,425 | |||||||||||||||
| Total |
$ | - | $ | 9,701 | $ | 30,924 | $ | 19,469 | $ | 60,094 | ||||||||||
70
Table of Contents
The following table provides detail regarding individual investment securities that were written down through earnings during 2008 exceeding $0.5 million.
| Security |
Impairment Loss |
Description | ||||
| Financial guarantee insurance company |
$3,955 | Two securities, one issuer a parent of the other, experienced declines in value related to the mortgage credit crisis and had been downgraded to a negative outlook. | ||||
| Financing company for real estate |
2,257 | Company experienced a rating decline to below investment grade, combined with price deterioration. | ||||
| Preferred stocks of government-sponsored agencies that buy and hold mortgages and issue and sell guaranteed residential mortgage-backed securities |
6,803 | Operated in conservatorship by the U.S. Government and their common and preferred stock were severely diluted. Dividend payments were suspended, driving the fair value of these securities down. | ||||
| Radio and advertising company |
2,501 | Company experienced a decline in price, a rating agency downgrade and completed a leveraged buyout transaction during 2008. | ||||
| Media company |
3,712 | Company experienced a decline in price, a rating agency downgrade and completed a leveraged buyout transaction during 2008. This security was sold during the fourth quarter of 2008. | ||||
| Four collateralized debt obligations |
12,779 | Impacted by the rapid rise in delinquencies and foreclosures in the sub-prime and Alt-A mortgage markets, along with a decline in the fair value of securities issued by financial institutions. | ||||
| Originator and servicer of residential prime, Alt-A and subprime mortgages |
4,207 | Rating agency downgrades and a debt restructuring during 2008. This security was sold during the fourth quarter of 2008. | ||||
| Residential and commercial outsourcing services company |
1,808 | Decline in price that had persisted for a period longer than the Company considered temporary. | ||||
| Originator of residential prime, Alt-A and subprime mortgages |
4,164 | Significant decline in the subprime and non-conforming mortgage markets. | ||||
| Designer, manufacturer and servicer of cars and trucks that provides vehicle-related financing, leasing, and insurance |
1,207 | Decline in the U.S. automotive industry. | ||||
| Financial services company involved in automotive and real estate financing and mortgage lending |
595 | Decline in the U.S. automotive industry. This security was sold during the fourth quarter of 2008. | ||||
| Two perpetual preferred securities |
2,829 | Negatively impacted by housing and mortgage credit crisis and received TARP (Troubled Assets Relief Program) funds. | ||||
| Investment banking firm |
9,194 | Two securities from one issuer that filed for bankruptcy during 2008 and was impacted by the mortgage credit crisis. | ||||
| Supplier of auto parts for light trucks and sport- utility vehicles |
2,105 | Deteriorating truck and sport-utility vehicle markets of the auto industry, and declines in value and ratings. | ||||
| Bank holding company |
821 | Holding company filed for bankruptcy. Parent of a large nationwide bank that had been taken over by the Office of Thrift Supervision and the Federal Deposit Insurance Corporation was appointed as its receiver. | ||||
| Entertainment media company |
617 | Decline in price, rating agency downgrade and leveraged buyout transaction. | ||||
| Other - 2 securities |
540 | |||||
| Total |
$60,094 | |||||
Other revenues decreased $1.3 million or 13% in 2010, largely due to a decrease in supplementary contract considerations and a reduction in income on the sale of LIHTC investments due to timing. Other revenues decreased $2.4 million or 19% in 2009, largely due to a reduction in income from reduced volumes of sales of LIHTC investments from a subsidiary and broker-dealer transactions.
71
Table of Contents
Policyholder benefits increased $4.0 million or 4% in 2010 compared to a $1.2 million or 1% increase in 2009. The largest factor in the increase in 2010 was a $3.5 million increase in benefit and contract reserves. This increase was largely due to higher traditional life reserves from the increase in sales of this product and to the change in the fair value of the guaranteed minimum withdrawal benefit (GMWB) riders. The fair value of the GMWB riders declined $1.2 million during 2010 compared to a decline of $2.4 million during 2009. Policyholder benefits were also favorably affected by reduced surrenders on traditional life policies. The largest factor in the 2009 increase was higher benefit and contract reserves. This increase can largely be attributed to higher immediate annuity sales, as reserves are established virtually on a one-for-one basis with premiums. Partially offsetting this was a decrease in benefit and contract reserves for the GMWB and decreases in death benefits and other benefits. The decline in death benefits reflected favorable mortality, and the decline in other benefits was largely due to lower accumulated dividends and interest thereon.
The Company has a GMWB rider for variable annuity contracts that is considered to be a financial derivative and, as such, is accounted for at fair value. The Company determines the fair value of the GMWB rider using a risk-neutral valuation method. This method is a probability measure that results when the current value of all financial assets is assumed to equal the expected value of the future payoff of the asset discounted at the risk-free rate. The value of the riders will fluctuate depending on market conditions. At December 31, 2010, the fair value of these riders decreased $1.2 million compared to the fair value at December 31, 2009. This fluctuation can be attributed to favorable returns and reduced volatility in the capital markets, partially offset by decreases in risk-free swap rates and decreases in issuer discount spreads. In addition, the Company has a guaranteed minimum death benefit (GMDB) on certain products. The benefit reserve for GMDB was $0.3 million at December 31, 2010, down slightly from December 31, 2009.
Interest is credited to policyholder account balances according to terms of the policy. There are minimum rates of crediting prescribed in certain policies, as well as adjustments that can be made to the initial crediting rate. Accordingly, the Company reviews and, as necessary, adjusts crediting rates on policies. Interest credited to policyholder account balances decreased $0.8 million or 1% in 2010 compared to a $0.2 million or less than 1% decrease in 2009. While total policyholder account balances increased during 2010 compared to 2009, this increase was offset by a decline in crediting rates. During 2010, the Company lowered crediting rates on in force funds at the beginning of the year and on new deposits as market rates declined during the year. The results in 2009 were largely the result of two factors. First, while policyholder account balances declined in early 2009, the balances steadily increased during the year. Second, crediting rates increased on certain products, such as deferred annuities, but decreased on others.
The amortization of DAC decreased 38% in 2010 compared to a 1% decline in 2009. The decrease in 2010 was primarily the result of a refinement in methodology and an unlocking, which both had the effect of reducing DAC amortization. The effect of the refinement was an increase in the DAC asset and a reduction in DAC amortization of $1.8 million. The impact of unlocking was an increase in the DAC asset and a corresponding decrease in the amortization of DAC of $5.8 million. The decline in 2009 was largely due to lower expected gross profits in 2009 and an increase in amortization resulting from a significant decrease in the fair value of variable products in 2008. Mostly offsetting this was the difference in unlocking in 2009 compared to 2008. While no unlocking adjustment was made during 2009, DAC amortization was reduced by $3.0 million due to unlocking in 2008. This was mostly offset by a decline in amortization resulting from lower expected gross profits in 2009 and an increase in amortization resulting from a significant decrease in the fair value of variable products in 2008.
Operating expenses consist of commissions net of the capitalization of commissions, expenses from the Company’s operations, the amortization of value of business acquired and other expenses. Capitalized commissions consist primarily of commissions and non-recurring expenses related to the sale of business. In total, operating expenses decreased $7.8 million or 11% in 2010, following a 3% increase in 2009. The largest factors in the decrease in 2010 were a $6.3 million decrease in salaries and benefits and a $1.9 million decrease in legal expenses. These were partially offset by a $2.3 million increase in the amortization of value of business acquired. The largest factors in the increase in 2009 were a $4.2 million increase in pension expense, $3.1 million in separation costs associated with a reduction in staffing, along with increased legal and incentive compensation expenses. Partially offsetting these increases were decreases in salaries, travel expenses and outside labor and services.
The amortization of value of business acquired (VOBA) is included in operating expenses. VOBA is amortized in concert with each purchased block of business. Accordingly, as policies run off, the amortization will decline over time. In addition, VOBA is evaluated for unlocking adjustments on an ongoing basis. If necessary, adjustments are made in the current period VOBA amortization. VOBA amortization more than doubled in 2010 compared to the prior year and decreased 58% in 2009 compared to 2008. The increase in 2010 was largely due to a refinement in methodology that occurred in 2009. The Company refined is method for calculating VOBA from a premium-based method to a volume-based method for certain traditional life products during 2009. Since the establishment of VOBA, the measure of premium in force has fluctuated from period to period. This has resulted in a corresponding volatile amortization of VOBA unrelated to the actual run off of the in force policies. The refinement in methodology reduced VOBA amortization in the amount of $2.5 million in 2009. Additionally, an unlocking adjustment reduced VOBA amortization by an additional $0.2 million in 2009. An unlocking adjustment in 2008 increased VOBA amortization by $0.2 million.
72
Table of Contents
The Company recorded income tax expense of $12.9 million or 35% of income before tax in 2010, compared to income tax expense of $6.0 million or 35% of income before tax in 2009. The increase in tax expense in 2010 versus 2009 was primarily due to higher income before tax and unfavorable changes in low income housing tax credit investments. Partially offsetting these increases was the impact of a decrease in tax contingency. In 2008, the Company recorded an income tax benefit of $8.7 million or 35% of income before tax. The increase in tax expense in 2009 versus 2008 was primarily due to higher income before tax and a decrease in low income housing tax credit benefits. Income taxes will fluctuate depending upon items such as net income, realized investment gains and losses, and affordable housing tax credits.
73
Table of Contents
Group Insurance
The following table presents financial data for the Group Insurance business segment for the years ended December 31.
| 2010 | 2009 | 2008 | ||||||||||
| Insurance revenues: |
||||||||||||
| Premiums, net |
$ | 49,355 | $ | 48,980 | $ | 48,763 | ||||||
| Total insurance revenues |
49,355 | 48,980 | 48,763 | |||||||||
| Investment revenues: |
||||||||||||
| Net investment income |
553 | 554 | 525 | |||||||||
| Other revenues |
156 | 167 | 268 | |||||||||
| Total revenues |
50,064 | 49,701 | 49,556 | |||||||||
| Policyholder benefits |
32,131 | 33,799 | 32,956 | |||||||||
| Operating expenses |
21,917 | 19,479 | 18,950 | |||||||||
| Total benefits and expenses |
54,048 | 53,278 | 51,906 | |||||||||
| Loss before income tax benefit |
(3,984 | ) | (3,577 | ) | (2,350 | ) | ||||||
| Income tax benefit |
(1,394 | ) | (1,252 | ) | (845 | ) | ||||||
| Net loss |
$ | (2,590 | ) | $ | (2,325 | ) | $ | (1,505 | ) | |||
The Company offers several insurance products in the Group Insurance segment: dental, group life, vision and short- and long-term disability. The Group Insurance segment markets its group products primarily to small and mid-size organizations. Products are sold through group representatives targeting a nationwide network of independent general agents and group brokers, along with the Company’s career general agents. This sales network is this segment’s core distribution system. Additionally, the Company enters into selective third-party marketing arrangements to market group products. This segment generated 20% of the Company’s consolidated insurance revenues in both 2010 and 2009 and 21% in 2008.
The group market is highly competitive. Accordingly, group policies are periodically reviewed to ensure they conform to target claim, expense and profit objectives. Group products are generally contracted on a yearly renewal basis. Renewal terms that meet target pricing objectives are communicated to the group policyholder for renewal consideration.
The Group Insurance segment experienced net losses in each of the three years presented. The net loss increased $0.3 million in 2010. This increase was largely the result of an increase in operating expenses, which was partially offset by both a decrease in policyholder benefits and an increase in insurance revenues. The net loss for this segment increased $0.8 million in 2009, largely the result of increases in policyholder benefits and operating expenses.
The following table presents gross premiums included in insurance revenues and provides detail by new and renewal business for the three years ended December 31. New premiums are also detailed by product.
| 2010 | % Change | 2009 | % Change | 2008 | ||||||||||||||||
| New premiums: |
||||||||||||||||||||
| Group life insurance |
$ | 2,280 | 43 | $ | 1,599 | (23 | ) | $ | 2,084 | |||||||||||
| Group dental insurance |
7,813 | 8 | 7,266 | (19 | ) | 8,968 | ||||||||||||||
| Group disability insurance |
4,665 | 46 | 3,201 | 93 | 1,657 | |||||||||||||||
| Other group insurance |
128 | (29 | ) | 181 | (31 | ) | 264 | |||||||||||||
| Total new premiums |
14,886 | 22 | 12,247 | (6 | ) | 12,973 | ||||||||||||||
| Renewal premiums |
43,398 | (3 | ) | 44,764 | 4 | 43,235 | ||||||||||||||
| Total premiums |
58,284 | 2 | 57,011 | 1 | 56,208 | |||||||||||||||
| Reinsurance ceded |
(8,929 | ) | 11 | (8,031 | ) | 8 | (7,445 | ) | ||||||||||||
| Premiums, net |
$ | 49,355 | 1 | $ | 48,980 | - | $ | 48,763 | ||||||||||||
74
Table of Contents
New group premiums increased $2.6 million or 22% in 2010, following a $0.7 million or 6% decrease in 2009. The increase in 2010 was due to a $1.5 million or 46% increase in new group disability premiums, a $0.7 million or 43% increase in new group life premiums and a $0.5 million or 8% increase in new group dental premiums. The improvements in the group life and dental product lines reflect expanded distribution of group representatives. The improvement in group disability products is the result of a third-party arrangement that provides a significant portion of the new disability premiums and accounts for about 60% of the new disability sales. The premiums provided from the third-party arrangement are significantly reinsured. New premiums decreased 6% in 2009, largely the result of a $1.7 million or 19% decrease in new group dental premiums and a $0.5 million or 23% decrease in new group life premiums. These declines occurred in comparison with 2008, which experienced higher premiums. The 2009 declines in new dental and life premiums were partially offset by a $1.5 million or 93% increase in new group disability premiums.
Renewal premiums decreased $1.4 million or 3% in 2010. This decline reflected decreases in renewal group life premiums, renewal dental premiums and renewal long-term disability premiums. The decrease in dental premiums was largely due to increased competition for this product. Partially offsetting these declines was an increase in short-term disability premiums. Renewal premiums increased $1.5 million or 4% in 2009, primarily due to the improved sales in 2008 and 2007 from the group dental product.
The Company has used reinsurance in several of its group product lines to help mitigate risk. Reinsurance on premiums increased $0.9 million or 11% in 2010, following a $0.6 million or 8% increase in 2009. The 2010 increase was primarily due to the short-term disability business that is highly reinsured. The 2009 increase was largely due to short- and long-term disability business sold through the third-party arrangement.
Policyholder benefits consist of death benefits (mortality), accident and health benefits and the associated increase or decrease in reserves for future policy benefits. Policyholder benefits decreased $1.7 million or 5% in 2010, largely due to a decrease in group life claims compared to 2009. Policyholder benefits increased $0.8 million or 3% in 2009, due to an increase in group life claims compared to 2008.
The policyholder benefit ratio (policyholder benefits divided by total revenues) for the Group Insurance segment was 64% at December 31, 2010 compared to 68% at December 31, 2009 and 67% at December 31, 2008. The decrease in 2010 occurred as total revenues increased while policyholder benefits decreased. The policyholder benefit ratio improved in the group life product as well as in the short-term disability product line.
Operating expenses consist of commissions, fees to third-party marketing and administrative organizations, and expenses from the Company’s operations. Operating expenses in this segment increased 13% in 2010 and 3% in 2009. The increase in 2010 was largely due to increases in commissions and production allowances resulting from the improved sales from new business mentioned above. In addition, the increase in operating expenses reflected an increase in administrative support costs and in increase in payments to third-party administrators reflecting the segment’s increased use of these third-party administrators. This increase in use of third-party administrators resulted from staffing reductions associated with business administration and the increase related to growth in new business, primarily in the disability products. The increase in 2009 was largely due to increases in commissions and production allowances.
Improvement efforts for this segment continue to be focused in three primary areas. First, emphasis is being placed on stronger pricing for the dental product and on retention of its in force block through renewals of existing business. Second, initiatives for this segment will be to target reductions in dental claims costs. Third, improvement in administrative efficiency is targeted through the increased use of technology, which should ultimately reduce expenses.
75
Table of Contents
Old American
The following table presents financial data for the Old American business segment for the years ended December 31.
| 2010 | 2009 | 2008 | ||||||||||
| Insurance revenues: |
||||||||||||
| Premiums, net |
$ | 65,229 | $ | 62,261 | $ | 61,517 | ||||||
| Total insurance revenues |
65,229 | 62,261 | 61,517 | |||||||||
| Investment revenues: |
||||||||||||
| Net investment income |
12,309 | 12,741 | 12,651 | |||||||||
| Realized investment gains, excluding impairment losses |
668 | 418 | 315 | |||||||||
| Net impairment losses recognized in earnings: |
||||||||||||
| Total other-than-temporary impairment losses |
(301 | ) | (4,394 | ) | (2,599 | ) | ||||||
| Portion of impairment losses recognized in other comprehensive income (loss) |
(34 | ) | 2,121 | - | ||||||||
| Net impairment losses recognized in earnings |
(335 | ) | (2,273 | ) | (2,599 | ) | ||||||
| Total investment revenues |
12,642 | 10,886 | 10,367 | |||||||||
| Other revenues |
5 | 1 | 3 | |||||||||
| Total revenues |
77,876 | 73,148 | 71,887 | |||||||||
| Policyholder benefits |
44,343 | 42,692 | 44,518 | |||||||||
| Amortization of deferred acquisition costs |
12,057 | 11,103 | 10,685 | |||||||||
| Operating expenses |
19,095 | 16,523 | 15,899 | |||||||||
| Total benefits and expenses |
75,495 | 70,318 | 71,102 | |||||||||
| Income before income tax expense |
2,381 | 2,830 | 785 | |||||||||
| Income tax expense |
996 | 991 | 405 | |||||||||
| Net income |
$ | 1,385 | $ | 1,839 | $ | 380 | ||||||
The Old American segment sells final expense insurance products nationwide through its general agency system with exclusive territories. The segment provides agents with sales leads using direct response marketing. The segment produced 26% of consolidated insurance revenues in 2010, 2009 and 2008.
Net income for this segment decreased $0.5 million or 25% in 2010 to $1.4 million, following a $1.5 million improvement in net income in 2009. The decline in net income for 2010 was due to increased operating expenses, policyholder benefits and amortization of deferred acquisition costs along with a reduction in net investment income. These were partially offset by increased insurance revenues and realized investment gains. The increase in net income for 2009 was primarily due to a decline in policyholder benefits, increased insurance revenues and a reduction in realized investment losses. Partially offsetting these changes was an increase in operating expenses.
The following table presents gross premiums included in insurance revenues and provides detail by new and renewal business for the three years ended December 31.
| 2010 | % Change | 2009 | % Change | 2008 | ||||||||||||||||
| New individual life premiums |
$ | 11,323 | 29 | $ | 8,759 | 20 | $ | 7,294 | ||||||||||||
| Renewal premiums |
56,557 | - | 56,583 | (2 | ) | 57,707 | ||||||||||||||
| Total premiums |
67,880 | 4 | 65,342 | 1 | 65,001 | |||||||||||||||
| Reinsurance ceded |
(2,651 | ) | (14 | ) | (3,081 | ) | (12 | ) | (3,484 | ) | ||||||||||
| Premiums, net |
$ | 65,229 | 5 | $ | 62,261 | 1 | $ | 61,517 | ||||||||||||
Total new premiums increased 29% in 2010 and 20% in 2009. Total renewal premiums were flat in 2010 and decreased 2% in 2009. The increase in new premiums reflects a combination of expanded distribution efforts and improved agency productivity. Old American continues to focus on the recruitment and development of new agencies and agents, with positive results, along with improved production from existing agencies and agents.
76
Table of Contents
Net investment income decreased 3% in 2010, following a 1% improvement in 2009. The decrease in 2010 primarily reflects a reduction in yields available in the market along with reduced average investment assets. The decline from lower yields was largely due to lower interest rates and yields available in the fixed-income market. The increase in 2009 reflected a decrease in investment assets that was offset by higher yields earned on the investment portfolio. The increase in yields was largely due to an increase in income from an alternative investment fund.
In the fourth quarter of 2009, the Company experienced write-downs on two of the Company’s real estate joint ventures within the Old American segment. These investments were affordable housing investment funds, which were written down by $0.3 million when the Company determined that there were no remaining future benefits expected from these investments.
The following table summarizes securities with other-than-temporary impairments recognized in earnings during the four quarters of 2010 by asset class:
| First Quarter |
Second Quarter |
Third Quarter |
Fourth Quarter |
Total | ||||||||||||||||
| Bonds: |
||||||||||||||||||||
| Corporate private-labeled residential mortgage-backed securities |
$ | 109 | $ | 18 | $ | 32 | $ | - | $ | 159 | ||||||||||
| Other |
- | 133 | 43 | - | 176 | |||||||||||||||
| Total |
$ | 109 | $ | 151 | $ | 75 | $ | - | $ | 335 | ||||||||||
None of the individual investment securities that were written down through earnings during 2010 exceeded $0.5 million.
The following table summarizes securities with other-than-temporary impairments recognized in earnings during the four quarters of 2009 by asset class:
| First Quarter |
Second Quarter |
Third Quarter |
Fourth Quarter |
Total | ||||||||||||||||
| Bonds: |
||||||||||||||||||||
| Corporate obligations: |
||||||||||||||||||||
| Financial |
$ | - | $ | 428 | $ | 362 | $ | 1,134 | $ | 1,924 | ||||||||||
| Total corporate obligations |
- | 428 | 362 | 1,134 | 1,924 | |||||||||||||||
| Corporate private-labeled residential mortgage-backed securities |
83 | 17 | 25 | - | 125 | |||||||||||||||
| Total |
$ | 83 | $ | 445 | $ | 387 | $ | 1,134 | $ | 2,049 | ||||||||||
77
Table of Contents
The following table provides detail regarding individual investment securities that were written down through earnings during 2009 exceeding $0.5 million.
| Security |
Impairment Loss |
Description | ||||
| Financial guarantee insurance company |
$1,035 | Two securities, one issuer a parent of the other, had significant reductions in capital and liquidity positions coupled with declines in value due to the credit crisis. | ||||
| Financing company for real estate |
528 | Acceptance of a tender offer resulted in an impairment to fair value. | ||||
| Other - 2 securities |
486 | |||||
| Total |
$2,049 | |||||
The following table summarizes securities with other-than-temporary impairments recognized in earnings during the four quarters of 2008 by asset class:
| First Quarter |
Second Quarter |
Third Quarter |
Fourth Quarter |
Total | ||||||||||||||||
| Bonds: |
||||||||||||||||||||
| Corporate obligations: |
||||||||||||||||||||
| Communications |
$ | - | $ | 154 | $ | - | $ | - | $ | 154 | ||||||||||
| Financial |
- | - | 1,538 | - | 1,538 | |||||||||||||||
| Consumer |
- | 188 | - | 343 | 531 | |||||||||||||||
| Total corporate obligations |
- | 342 | 1,538 | 343 | 2,223 | |||||||||||||||
| Other |
- | 182 | - | 194 | 376 | |||||||||||||||
| Total |
$ | - | $ | 524 | $ | 1,538 | $ | 537 | $ | 2,599 | ||||||||||
The following table provides detail regarding individual investment securities that were written down through earnings during 2008 exceeding $0.5 million.
| Security |
Impairment Loss |
Description | ||||
| Financial guarantee insurance company |
$989 | Two securities, one issuer a parent of the other, experienced declines in value related to the mortgage credit crisis and had been downgraded to a negative outlook. | ||||
| Financing company for real estate |
549 | Company experienced a rating decline to below investment grade, combined with price deterioration. | ||||
| Media company |
530 | Company experienced a decline in price, a rating agency downgrade and completed a leveraged buyout transaction during 2008. This security was sold during the fourth quarter of 2008. | ||||
| Other - 2 securities |
531 | |||||
| Total |
$2,599 | |||||
Policyholder benefits consist of death benefits (mortality), accident and health benefits, surrenders and the associated increase or decrease in reserves for future policy benefits. Policyholder benefits increased 4% in 2010, following a 4% decrease in 2009. The increase in 2010 was largely due to higher death benefits and an increase in benefit and contract reserves. The increase in death benefits reflected less favorable mortality experienced during 2010 relative to 2009. The decline in 2009 was largely due to lower death benefits. The increase in benefit and contract reserves was largely the result of the increase in sales and less reserves released due to death. While mortality results were different for 2010 and 2009, both years were within the range of anticipated mortality.
78
Table of Contents
The policyholder benefit ratio (policyholder benefits divided by total revenues, excluding realized investment gains and losses) remained flat in 2010 compared to 2009, and both years were lower than 2008. The ratio was consistent in 2010, as both total revenues and policyholder benefits increased during the year. The increase in total revenues was due to an increase in premiums, while the increase in policyholder benefits reflected higher death benefits and an increase in benefit and contract reserves. Higher revenues, primarily from an increase in new premiums and lower death benefits, contributed to the decrease in the policyholder benefits ratio in 2009.
| 2010 | 2009 | 2008 | ||||||||||
| Total revenue |
$ | 77,876 | $ | 73,148 | $ | 71,887 | ||||||
| Less: Realized investment gains (losses) |
333 | (1,855 | ) | (2,284 | ) | |||||||
| Revenue excluding realized investment gains (losses) |
77,543 | 75,003 | 74,171 | |||||||||
| Policyholder benefits |
44,343 | 42,692 | 44,518 | |||||||||
| Policyholder benefit ratio |
57% | 57% | 60% | |||||||||
Amortization of deferred acquisition costs increased $1.0 million or 9% and $0.4 million or 4% in 2010 and 2009, respectively, compared to the prior year. The increase in both years was primarily due to the increase in sales for this segment. DAC is established at the time of new sales. Accordingly, as Old American’s sales have significantly increased, expectations are that the DAC asset and corresponding amortization will reflect the increases.
Operating expenses consist of commissions net of the capitalization of commissions, expenses from the Company’s operations, the amortization of value of business acquired and other expenses. Capitalized commissions consist primarily of commissions and non-recurring expenses related to the sale of business. Operating expenses increased 16% in 2010 and 4% in 2009. The increase in 2010 was largely due to increased administrative support costs and agent-related costs. Also contributing to the increase was an unfavorable comparison to 2009, which included a $0.9 million reduction in operating expenses due to a lease reimbursement.
Liquidity and Capital Resources
Liquidity
The Company meets liquidity requirements primarily through positive cash flows from operations. Management believes that the Company has sufficient sources of liquidity and capital resources to satisfy operational requirements and to finance expansion plans and strategic initiatives. Primary sources of cash flow are premiums, other insurance considerations and deposits, receipts for policyholder accounts, investment sales and maturities, investment income and access to credit from other financial institutions. In addition, the Company has credit facilities that are available for additional working capital needs or investment opportunities. The principal uses of cash are for the insurance operations, including the purchase of investments, payment of insurance benefits, operating expenses, policyholder and shareholder dividends, income taxes, withdrawals from policyholder accounts and costs related to acquiring new business. There can be no assurance that the Company will continue to generate cash flows at or above current levels or that the ability to borrow under the current credit facilities will be maintained.
The Company performs cash flow testing and adds various levels of stress testing to potential surrender and policy loan levels in order to assess current and near-term cash and liquidity needs. In the event of increased surrenders and other cash needs, the Company has several sources of cash flow, as mentioned above, to meet these needs.
Cash provided from operating activities in each of the three years ended 2010, 2009 and 2008 was $20.3 million, $31.7 million, and $16.1 million, respectively. Cash provided from operating activities decreased $11.4 million in 2010 compared to 2009, primarily the result of a decrease in investment income collected of $9.5 million and an increase in commissions paid of $7.8 million. Partially offsetting these were increased premium receipts of $4.9 million and decreased expenses paid of $4.8 million. The increase in 2009 compared to 2008 was primarily due to increased premium receipts of $7.2 million, a decrease in cash benefit payments of $3.1 million and decrease in Federal income tax payments of $1.4 million.
79
Table of Contents
Net cash used for investing activities was $63.5 million and $72.4 million in 2010 and 2009, respectively, and net cash provided from investing activities was $45.2 million in 2008. The Company’s new investments in fixed maturity and equity securities were $424.5 million in 2010, compared to $326.5 million during 2009 and $259.4 million during 2008. New investments in mortgage loans were $155.8 million in 2010, $59.7 million in 2009, and $49.3 million in 2008. In 2010 short- term investments declined $123.0 million, as cash was used to fund new long-term investments. In 2009, short-term investments increased $103.6 million due to sales of fixed maturity securities. In 2008, short-term investments declined $1.4 million. Sales and maturities of fixed maturity and equity securities decreased $36.8 million in 2010 compared to 2009 from $387.5 million to $350.7 million. During 2010, the Company decreased its purchases of real estate investments to $12.2 million, down from $22.1 million in 2009 and $31.0 million in 2008. Approximately 13% of the securities portfolio was sold, called or matured in 2010, compared with 15% in 2009 and 12% in 2008. The Company had $54.2 million in mortgage loan maturities and principal pay downs in 2010, compared with $47.5 million in 2009 and $54.0 million in 2008. During 2010, the Company had no sales of real estate investments, compared with $2.1 million in 2009 and $30.0 million in 2008.
Net cash provided by financing activities was $43.7 million and $36.0 in 2010 and 2009, respectively, and net cash used in financing activities was $63.7 million in 2008. There were no net borrowings in 2010, versus net repayments of $2.9 million in 2009 and $7.5 million in 2008. Deposits on policyholder account balances equaled $238.2 million in 2010, $239.6 million in 2009 and $200.5 million in 2008. Withdrawals on policyholder account balances were $189.3 million in 2010, $201.7 million in 2009 and $243.4 million in 2008. The decrease in withdrawals can be attributed to the volatility in the equity markets and is consistent with lower interest rates. The net acquisition of treasury stock totaled $3.1 million in 2010, compared to a net disposition $0.3 million in 2009 and net acquisition of $16.8 million in 2008. The net acquisition of treasury stock in 2010 reflected $3.0 million of open market purchases under the stock repurchase program and less than $0.1 million in net purchases from employee benefit plans. The net disposition of treasury stock in 2009 reflected net sales from employee benefit plans of $2.6 million and $2.3 million of open market purchases. Finally, the Company’s stockholder dividends were $12.4 million in 2010 and $12.5 in both 2009 and 2008.
Separate Accounts
At December 31, 2010, the Company had $339.0 million in separate account assets. This was an increase of $26.2 million from $312.8 million at December 31, 2009. Investment performance increased separate accounts by $43.1 million in 2010 versus an increase of $70.1 million in 2009. Deposits in separate accounts increased slightly from $35.2 million in 2009 to $36.1 million in 2010. Policyholder withdrawals increased $1.6 million from $38.6 million in 2009 to $40.2 million in 2010. In addition, contract charges were $12.7 million and $12.4 million in 2010 and 2009, respectively.
Debt and Short-Term Borrowing
The Company and certain subsidiaries have access to borrowing capacity through their membership affiliation with the Federal Home Loan Bank of Des Moines (FHLB). At December 31, 2010, there were no outstanding balances with the FHLB, and there were no outstanding balances at year-end 2009. The Company has access to unsecured revolving lines of credit of $60.0 million with two major commercial banks with no balances outstanding. These lines of credit will expire on June 30, 2011. The Company anticipates renewing these lines of credit as they come due.
Capital Resources
The Company considers existing capital resources to be adequate to support the current level of business activities.
The following table shows the capital adequacy of the Company at December 31.
| 2010 | 2009 | |||||||
| Total assets less separate accounts |
$ | 3,994,253 | $ | 3,863,361 | ||||
| Total stockholders’ equity |
679,472 | 628,363 | ||||||
| Ratio of stockholders’ equity to assets less separate accounts |
17% | 16% | ||||||
The ratio of equity to assets less separate accounts increased by 1% in 2010. Stockholders’ equity increased $51.1 million from year-end 2009. The increase was largely due to increases in unrealized investment gains. Stockholders’ equity per share, or book value, equaled $59.25 for year-end 2010, a 9% increase for the year.
Unrealized gains on available for sale securities, which are included as a component of stockholders’ equity (net of securities gains and losses, related taxes, policyholder account balances and deferred acquisition costs), totaled $43.7 million at December 31, 2010. This represents an improvement of $42.9 million from the $0.8 million unrealized investment gain position at December 31, 2009.
The Company’s statutory equity exceeds the minimum capital deemed necessary to support its insurance business, as determined by the risk-based capital calculations and guidelines established by the National Association of Insurance Commissioners. The Company believes these statutory limitations impose no practical restrictions on its dividend payment plans.
80
Table of Contents
The Company has defined contribution plans for employees and agents. Prior to the third quarter of 2009, the Company made contributions to these plans through Company stock. These transactions were accounted for as purchases and sales of treasury stock. During the third quarter of 2009, the Company discontinued purchase and sale transactions of the Company’s common stock with employee and agent benefit plans sponsored by the Company except for the employee stock ownership plan (ESOP). With the exception of the ESOP, the Company’s benefit plans instead conduct such transactions in the open market. Accordingly, the benefit plans purchased 2,081 shares of treasury stock for $0.1 million (2009 – 312,648 for $9.6 million) and sold 1,026 shares of treasury stock for less than $0.1 million (2009 – 526,708 for $12.2 million).
The stock repurchase program was extended by the Board of Directors through January 2012 to permit the purchase of up to one million of the Company’s shares on the open market, which would represent approximately 9% of the shares currently outstanding. During 2010, the Company purchased 96,931 of its shares under the stock repurchase program for $3.0 million (2009 – 84,173 for $2.3 million).
On January 24, 2011, the Board of Directors declared a quarterly dividend of $0.27 per share that was paid February 9, 2011 to stockholders of record as of February 3, 2011. On January 25, 2010, the Board of Directors declared a quarterly dividend of $0.27 per share, which was paid on February 10, 2010 to shareholders of record as of February 4, 2010.
The Company cannot predict whether current legislative activities will have a significant impact on the ongoing operations of the Company.
Contractual Obligations
The following table summarizes (in millions) the Company’s contractual obligations by due date and expiration date as of December 31, 2010. Contractual obligations of the Company are those obligations fixed by agreement as to dollar amount and date of payment.
| Total | Less than 1 year |
1-3 years | 4-5 years | After 5 years | ||||||||||||||||
| Borrowings (1) |
$ | - | $ | - | $ | - | $ | - | $ | - | ||||||||||
| Operating lease obligations (2) |
4.0 | 2.5 | 1.3 | 0.2 | - | |||||||||||||||
| Purchase obligations (3) |
0.6 | 0.6 | - | - | - | |||||||||||||||
| Mortgage loan commitments and other investments (4) |
21.4 | 13.0 | 8.4 | - | - | |||||||||||||||
| Annuity certain contracts (5) |
58.0 | 12.8 | 20.8 | 12.4 | 12.0 | |||||||||||||||
| Insurance liabilities (6) |
2,892.3 | 287.1 | 563.0 | 540.1 | 1,502.1 | |||||||||||||||
| Total contractual obligations |
$ | 2,976.3 | $ | 316.0 | $ | 593.5 | $ | 552.7 | $ | 1,514.1 | ||||||||||
| (1) | The Company had no outstanding borrowings as of December 31, 2010. Borrowings include short-term debt as described in the previous section – Debt and Short-Term Borrowing. |
| (2) | The Company leases its mainframe computer and certain related support equipment. |
| (3) | Purchase obligations include contracts where the Company has a non-cancelable commitment to purchase goods and services. |
| (4) | The Company’s mortgage loan commitments provide funding to originate commercial mortgage loans. Mortgage loan commitments generally do not extend beyond 90 days. Other investments are primarily commitments to fund affordable housing project obligations and to fund two construction loans. |
| (5) | Annuity certain contracts are those insurance liabilities (included in future policy benefits and policyholder account balances on the balance sheet) which do not have life contingencies and have scheduled payments. Annuity certain contracts without life contingencies consist of single premium immediate annuities, supplementary contracts and structured settlements. |
| (6) | Insurance liabilities consist primarily of future policy benefits and policyholder account balances for which the timing of cash flows is uncertain and which have life contingencies. The schedule of payments for these liabilities can vary significantly because of the uncertainty of the timing of cash flows, which depend upon insurable events or policyholder surrenders. |
81
Table of Contents
Item 7A: Quantitative and Qualitative Disclosures About Market Risk
The Company holds a diversified portfolio of investments that primarily includes cash, bonds, preferred stocks, residential mortgage-backed securities, commercial mortgages, real estate and alternative investments. Each of these investments is subject, in varying degree, to market risks that can affect their return and their fair value. A majority of these assets are debt issues of corporations, securitized residential mortgage-backed or other asset-backed securities, U.S. Treasury securities, or U.S. Government Sponsored Enterprises (GSE) and are considered fixed income investments. Thus, the primary market risks affecting the Company’s portfolio are interest rate risk, credit risk and liquidity risk.
The Company’s investment portfolio moved from a small net unrealized gain position in 2009 to a net unrealized gain of $110.2 million at December 31, 2010. The change was primarily attributable to the improved stability within the overall financial markets, particularly including lower interest rates and improvements in credit markets. The improved economic environment affected the broad financial markets, including many markets that were considered distressed during the recent economic downturn, and resulted in price improvement in virtually every sector.
Interest rate risk arises from the price sensitivity of investments to changes in interest rates. Interest and dividend income represent the greatest portion of an investment’s total return for most fixed income instruments in stable interest rate environments. The changes in the fair market price of such investments are inversely related to changes in market interest rates. As interest rates fall, the interest and dividend streams of existing fixed-rate investments become more valuable and market values rise. As interest rates rise, the opposite effect occurs.
Due to the complex nature of interest rate movements and their uneven effects on the value of fixed income investments, the Company uses industry-recognized computer programs to help consider potential changes in the value of the portfolio. Assuming that changes occur equally over the entire term structure of interest rates or yield curve, it is estimated that a 100 basis point increase in rates would translate to a $143.7 million loss of fair value for the $2.7 billion securities portfolio. Conversely, a 100 basis point rate decrease would translate to a $149.3 million increase in fair value.
Market changes rarely follow a linear pattern in one direction for any length of time. Within any diversified portfolio, an investor will likely find embedded options, both puts and calls, that change the structure of the cash flow stream. Residential mortgage-backed securities are particularly sensitive to interest rate changes. As long-term interest rates fall, homeowners typically become more likely to refinance their mortgage or move up to a larger home, causing a prepayment of the outstanding mortgage principal, which must then be reinvested at a lower rate. Should interest rates rise suddenly, prepayments expected by investors may decrease, extending the duration of a mortgage pool. This represents a further interest rate risk to investors.
As interest rates rise, policyholders may become more likely to surrender policies, take partial withdrawals from policies, or to borrow against cash values, often to meet sudden needs in an inflationary environment or to invest in higher yielding opportunities elsewhere. These policyholder options represent risk to the Company and are difficult to model or quantify with precision, largely due to the complex behavioral reactions individual policyholders may face in changing economic environments. The Company believes that general agent and agent relationships with policyholders may have an impact on policyholder financial decision-making and behavior in such changing environments. Further, the Company expects that general agent and agent relationships and actions with policyholders may help mitigate the risk of disintermediation, particularly during periods of rapidly rising interest rates or other forms of economic stress. However, the complex behavioral reactions of individual policyholders and the independent, non-exclusive relationship the Company maintains with general agents and agents causes the risk of disintermediation to be a significant factor in the Company’s investment risk-taking activities and positions.
This risk of disintermediation may force the Company to liquidate parts of its portfolio at a time when the fair value of fixed income investments is falling. If interest rates fall, the Company may also be forced to invest new cash receipts at levels below the minimum guaranteed rates payable to policyholders, eroding profit margins. The Company can usually adapt to small sudden changes in interest rates or even large changes that occur over longer periods of time. However, cash flow may increase or decrease over the course of the business cycle. Therefore, the Company takes steps to ensure that adequate liquidity is available to meet obligations in a timely manner. To this end, the Company utilizes an asset/liability management program, and the Company maintains lines of credit with commercial banks and other short-term borrowing arrangements with financial institutions.
The Company’s investments are also exposed to varying degrees of credit risk. Credit risk is the risk that the value of the investment may decline due to deterioration in the financial strength of the issuer and that the timely or ultimate payment of principal or interest might not occur. A default by an issuer usually involves some loss of principal to the investor. Losses can be mitigated by timely sales of affected securities or by active involvement in a restructuring process. However, there can be no assurance that the efforts of an investor will lead to favorable outcomes in a bankruptcy or restructuring. Information about the write-down of investment securities is provided in the table of Realized Investment Gains and Losses, under the section Consolidated Results of Operations in Item 7. Management’s Discussion and Analysis of Financial Condition and Results of Operations.
82
Table of Contents
The Company mitigates credit risk by diversifying the investment portfolio across a broad range of issuers, investment sectors and security types, and by limiting the amount invested in any particular entity. With the exception of U.S. Treasury securities and certain GSEs, there is no exposure to any single corporate issuer greater than one percent of assets on a book value basis. The Company also invests in securities collateralized or supported by physical assets, guarantees by insurers or other providers of financial strength, and other sources of secondary or contingent payment. These securities can improve the likelihood of payment according to contractual terms and increase recovery amounts in the case of issuer default, bankruptcy or restructuring.
The Company currently holds $168.9 million of foreign bonds. The foreign securities do not expose the Company directly to foreign currency risk, as the securities are denominated in U.S. dollars. As a result, the foreign currency risk lies with the issuer of the securities and may expose the issuer to fluctuations in the foreign currency market.
As market interest rates fluctuate, so will the value of the Company’s investment portfolio and its stockholders’ equity. At December 31, 2010, the Company had an unrealized investment gain of $43.7 million (net of related taxes, and amounts allocable to policyholder account balances and deferred acquisition costs), compared to an $0.8 million gain at year-end 2009. This change was primarily the result of overall improvement in the market value of investment securities.
The Company also invests in certain equity securities and alternative investments, such as hedge funds, that generate equity risk and other forms of market risk. The total fair value of preferred stock investments was $6.0 million and $5.6 million as of December 31, 2010 and 2009, respectively. The total fair value of all other equity and alternative investments was $32.3 million and $31.3 million as of the same respective dates. The market risks associated with these investments are managed primarily through diversification and selection of investments that have historically exhibited changes in values that are not highly correlated to the Company’s other investments or risk positions.
The Company markets certain variable products. The policyholder assumes essentially all the investment earnings risk for the portion of the account balance invested in the separate accounts. However, the Company assesses certain charges based on the policy account values and changes to the account values can affect the Company’s earnings. The portion of the policyholder’s account balance invested in the fixed general account, if any, is affected by many factors, including the absolute level of interest rates, relative performance of the fixed income and equity markets, spreads between interest yields on investments and rates credited to the policyholder’s accounts, and changes in consumer preferences.
Asset/Liability Management
The Company’s asset/liability management programs and procedures involve the monitoring of asset and liability durations for various product lines, cash flow testing under various interest rate scenarios to evaluate the potential sensitivity of assets and liabilities to interest rate movements, and the continuous rebalancing of assets and liabilities with respect to yield, risk, and cash flow characteristics.
The Company believes its asset/liability management programs and procedures, along with certain product features, provide protection for the Company against the effects of changes in interest rates under various scenarios.
Cash flows and effective durations of the asset and liability portfolios are measured at points in time and are affected by changes in the level and term structure of interest rates, as well as changes in policyholder behavior. Further, durations are managed on an individual product level, and an aggregate portfolio basis. As a result, differences typically exist between the duration, cash flows and yields of assets versus liabilities on an individual portfolio and aggregate basis. The Company’s asset/liability management programs and procedures enable management to monitor the changes, which have both positive and negative correlations among certain portfolios, and to make adjustments to asset mix, liability crediting rates and product terms so as to manage risk and profitability over time.
The Company aggregates similar policyholder liabilities into portfolios and then matches specific investments with these liability portfolios. In 2010 and 2009, all of the Company’s portfolios had investment yields that exceeded the crediting rates on the matched liabilities. The Company was not required to invest at levels below minimum guaranteed rates payable to policyholders in 2010 or 2009. However, the Company periodically elected to purchase certain individual investments with yields less than the minimum guaranteed rates on a portion of the Company’s policyholder liabilities, while continuing to ensure that the investment portfolio yields were in excess of the matched liabilities. Such investments are made due to unique characteristics or timing of the investments, the effects of which were minimal and are not expected to be significant in the future. The Company monitors the risk to portfolio investment margins on an ongoing basis. Should the Company be required to invest at rates that fall below the Company’s minimum guaranteed portfolio rates, the Company would assess the facts and conditions available at that time and develop an appropriate plan to suit that environment.
83
Table of Contents
The Company performs cash flow scenario testing through models of its in force business. These models reflect specific product characteristics and include assumptions based on current and anticipated experience regarding the relationships between short-term and long-term interest rates (i.e., the slope of the yield curve), credit spreads, market liquidity and other factors, including policyholder behavior in certain market conditions. In addition, these models include asset cash flow projections, reflecting interest payments, sinking fund payments, scheduled principal payments, and optional bond calls and prepayments.
The Company has a risk that the asset or liability portfolio performance may differ from forecasted results as a result of unforeseen economic circumstances, estimates or assumptions that prove incorrect, unanticipated policyholder behavior or other factors. The result of such deviation of actual versus expected performance could include excess or insufficient liquidity in future periods. Excess liquidity, in turn, could result in reduced profitability on one or more product lines. Insufficient liquidity could result in the need to generate liquidity through borrowing, asset sales or other means. The Company believes that its asset/liability management programs will provide sufficient liquidity to enable it to fulfill its obligation to pay benefits under its various insurance and deposit contracts. On a historical basis, the Company has not needed to liquidate assets to ensure sufficient cash flows. The Company maintains borrowing lines on a secured and unsecured basis to provide additional liquidity, if needed.
Expected Cash Flows
The table below details (in millions) the nature of expected cash flows from the securities portfolio, including the cash flows from residential mortgage-backed securities pools, corporate bonds and commercial mortgages. Calls and prepayments represent the principal amount expected to return to the Company. Total principal equals invested cash scheduled to return in each year, including maturities, calls, sinking funds and prepayments.
| 2011 | 2012 | 2013 | 2014 | 2015 | There- after |
Total Principal |
Fair Value |
|||||||||||||||||||||||||
| Fixed maturity securities: |
||||||||||||||||||||||||||||||||
| Corporate bonds currently callable |
$ | 28 | $ | 1 | $ | 5 | $ | 5 | $ | 3 | $ | 89 | $ | 131 | $ | 133 | ||||||||||||||||
| Average interest rate |
6.39% | 6.86% | 7.66% | 7.21% | 6.27% | 5.84% | 6.10% | |||||||||||||||||||||||||
| Residential mortgage-backed securities and CMOs |
57 | 48 | 42 | 43 | 33 | 186 | 409 | 363 | ||||||||||||||||||||||||
| Average interest rate |
5.23% | 5.71% | 5.68% | 5.73% | 5.71% | 5.99% | 5.77% | |||||||||||||||||||||||||
| All other securities |
114 | 132 | 164 | 164 | 194 | 1,272 | 2,040 | 2,153 | ||||||||||||||||||||||||
| Average interest rate |
5.41% | 6.25% | 5.76% | 5.67% | 4.90% | 5.87% | 5.75% | |||||||||||||||||||||||||
| Total fixed maturity securities |
199 | 181 | 211 | 212 | 230 | 1,547 | 2,580 | 2,649 | ||||||||||||||||||||||||
| Average interest rate |
5.50% | 6.11% | 5.79% | 5.72% | 5.03% | 5.88% | 5.77% | |||||||||||||||||||||||||
| Mortgages |
77 | 40 | 66 | 53 | 75 | 251 | 562 | 593 | ||||||||||||||||||||||||
| Average interest rate |
6.80% | 6.67% | 6.50% | 6.46% | 6.22% | 6.54% | 6.53% | |||||||||||||||||||||||||
| Total |
$ | 276 | $ | 221 | $ | 277 | $ | 265 | $ | 305 | $ | 1,798 | $ | 3,142 | $ | 3,242 | ||||||||||||||||
| Average interest rate |
5.86% | 6.21% | 5.96% | 5.87% | 5.33% | 5.97% | 5.91% | |||||||||||||||||||||||||
84
Table of Contents
Item 8. Financial Statements and Supplementary Data
Amounts in thousands, except share data, or as otherwise noted
Kansas City Life Insurance Company
Consolidated Balance Sheets
| December 31 | ||||||||
| 2010 | 2009 | |||||||
| ASSETS |
||||||||
| Investments: |
||||||||
| Fixed maturity securities available for sale, at fair value (amortized cost: 2010 - $2,540,725; 2009 - $2,470,516) |
$ | 2,648,888 | $ | 2,469,272 | ||||
| Equity securities available for sale, at fair value (cost: 2010 - $36,293; 2009 - $35,405) |
38,321 | 36,876 | ||||||
| Mortgage loans |
559,167 | 457,582 | ||||||
| Real estate |
119,909 | 114,076 | ||||||
| Policy loans |
84,281 | 85,585 | ||||||
| Short-term investments |
15,713 | 138,704 | ||||||
| Other investments |
5,009 | 6,379 | ||||||
| Total investments |
3,471,288 | 3,308,474 | ||||||
| Cash |
5,445 | 4,981 | ||||||
| Accrued investment income |
35,742 | 32,989 | ||||||
| Deferred acquisition costs |
192,943 | 209,495 | ||||||
| Reinsurance receivables |
187,123 | 179,365 | ||||||
| Property and equipment |
23,514 | 24,393 | ||||||
| Other assets |
78,198 | 103,664 | ||||||
| Separate account assets |
339,029 | 312,824 | ||||||
| Total assets |
$ | 4,333,282 | $ | 4,176,185 | ||||
| LIABILITIES |
||||||||
| Future policy benefits |
$ | 884,380 | $ | 866,889 | ||||
| Policyholder account balances |
2,065,878 | 2,048,828 | ||||||
| Policy and contract claims |
44,046 | 33,484 | ||||||
| Other policyholder funds |
145,560 | 137,847 | ||||||
| Other liabilities |
174,917 | 147,950 | ||||||
| Separate account liabilities |
339,029 | 312,824 | ||||||
| Total liabilities |
3,653,810 | 3,547,822 | ||||||
| STOCKHOLDERS’ EQUITY |
||||||||
| Common stock, par value $1.25 per share |
||||||||
| Authorized 36,000,000 shares, issued 18,496,680 shares |
23,121 | 23,121 | ||||||
| Additional paid in capital |
41,085 | 41,068 | ||||||
| Retained earnings |
767,126 | 757,225 | ||||||
| Accumulated other comprehensive income (loss) |
7,807 | (36,477 | ) | |||||
| Treasury stock, at cost (2010 - 7,029,575 shares; 2009 - 6,931,589 shares) |
(159,667 | ) | (156,574 | ) | ||||
| Total stockholders’ equity |
679,472 | 628,363 | ||||||
| Total liabilities and stockholders’ equity |
$ | 4,333,282 | $ | 4,176,185 | ||||
See accompanying Notes to Consolidated Financial Statements
85
Table of Contents
Kansas City Life Insurance Company
Consolidated Statements of Income
| Year Ended December 31 | ||||||||||||
| 2010 | 2009 | 2008 | ||||||||||
| REVENUES |
||||||||||||
| Insurance revenues: |
||||||||||||
| Premiums, net |
$ | 139,811 | $ | 137,067 | $ | 127,166 | ||||||
| Contract charges |
106,019 | 105,735 | 109,007 | |||||||||
| Total insurance revenues |
245,830 | 242,802 | 236,173 | |||||||||
| Investment revenues: |
||||||||||||
| Net investment income |
175,859 | 177,428 | 177,419 | |||||||||
| Realized investment gains, excluding impairment losses |
4,355 | 10,979 | 10,422 | |||||||||
| Net impairment losses recognized in earnings: |
||||||||||||
| Total other-than-temporary impairment losses |
(4,129 | ) | (37,125 | ) | (62,693 | ) | ||||||
| Portion of impairment losses recognized in other comprehensive income (loss) |
309 | 16,070 | - | |||||||||
| Net impairment losses recognized in earnings |
(3,820 | ) | (21,055 | ) | (62,693 | ) | ||||||
| Total investment revenues |
176,394 | 167,352 | 125,148 | |||||||||
| Other revenues |
9,139 | 10,491 | 13,005 | |||||||||
| Total revenues |
431,363 | 420,645 | 374,326 | |||||||||
| BENEFITS AND EXPENSES |
||||||||||||
| Policyholder benefits |
182,997 | 178,990 | 178,749 | |||||||||
| Interest credited to policyholder account balances |
85,949 | 86,713 | 86,899 | |||||||||
| Amortization of deferred acquisition costs |
27,033 | 35,126 | 34,989 | |||||||||
| Operating expenses |
100,625 | 103,364 | 99,903 | |||||||||
| Total benefits and expenses |
396,604 | 404,193 | 400,540 | |||||||||
| Income (loss) before income tax expense (benefit) |
34,759 | 16,452 | (26,214 | ) | ||||||||
| Income tax expense (benefit) |
12,457 | 5,720 | (9,164 | ) | ||||||||
| NET INCOME (LOSS) |
$ | 22,302 | $ | 10,732 | $ | (17,050 | ) | |||||
| Comprehensive income (loss), net of taxes: |
||||||||||||
| Change in net unrealized gains and (losses) on securities available for sale |
$ | 42,862 | $ | 89,709 | $ | (89,921 | ) | |||||
| Change in benefit plan obligations |
1,422 | 11,212 | (21,067 | ) | ||||||||
| Other comprehensive income (loss) |
44,284 | 100,921 | (110,988 | ) | ||||||||
| COMPREHENSIVE INCOME (LOSS) |
$ | 66,586 | $ | 111,653 | $ | (128,038 | ) | |||||
| Basic and diluted earnings per share: |
||||||||||||
| Net income (loss) |
$ | 1.95 | $ | 0.93 | $ | (1.47 | ) | |||||
See accompanying Notes to Consolidated Financial Statements
86
Table of Contents
Kansas City Life Insurance Company
Consolidated Statement of Stockholders’ Equity
| Year Ended December 31 | ||||||||||||
| 2010 | 2009 | 2008 | ||||||||||
| COMMON STOCK, beginning and end of year |
$ | 23,121 | $ | 23,121 | $ | 23,121 | ||||||
| ADDITIONAL PAID IN CAPITAL |
||||||||||||
| Beginning of year |
41,068 | 36,281 | 30,244 | |||||||||
| Excess of proceeds over cost of treasury stock sold |
17 | 4,787 | 6,037 | |||||||||
| End of year |
41,085 | 41,068 | 36,281 | |||||||||
| RETAINED EARNINGS |
||||||||||||
| Beginning of year |
757,225 | 750,600 | 780,133 | |||||||||
| Cummulative effect of change in accounting principle (See Note 15) |
- | 8,399 | - | |||||||||
| Net income (loss) |
22,302 | 10,732 | (17,050 | ) | ||||||||
| Stockholder dividends of $1.08 per share (2009 - $1.08; 2008 - $1.08) |
(12,401 | ) | (12,506 | ) | (12,483 | ) | ||||||
| End of year |
767,126 | 757,225 | 750,600 | |||||||||
| ACCUMULATED OTHER COMPREHENSIVE INCOME (LOSS), net of taxes |
||||||||||||
| Beginning of year |
(36,477 | ) | (130,799 | ) | (19,811 | ) | ||||||
| Cummulative effect of change in accounting principle (See Note 15) |
- | (6,599 | ) | - | ||||||||
| Other comprehensive income (loss) |
44,284 | 100,921 | (110,988 | ) | ||||||||
| End of year |
7,807 | (36,477 | ) | (130,799 | ) | |||||||
| TREASURY STOCK, at cost |
||||||||||||
| Beginning of year |
(156,574 | ) | (152,096 | ) | (129,286 | ) | ||||||
| Cost of 99,012 shares acquired (2009 - 396,821 shares; 2008 - 557,424 shares) |
(3,108 | ) | (11,957 | ) | (25,972 | ) | ||||||
| Cost of 1,026 shares sold (2009 - 526,708 shares; 2008 -222,687 shares) |
15 | 7,479 | 3,162 | |||||||||
| End of year |
(159,667 | ) | (156,574 | ) | (152,096 | ) | ||||||
| TOTAL STOCKHOLDERS’ EQUITY |
$ | 679,472 | $ | 628,363 | $ | 527,107 | ||||||
See accompanying Notes to Consolidated Financial Statements
87
Table of Contents
Kansas City Life Insurance Company
Consolidated Statements of Cash Flows
| Year Ended December 31 | ||||||||||||
| 2010 | 2009 | 2008 | ||||||||||
| OPERATING ACTIVITIES |
||||||||||||
| Net income (loss) |
$ | 22,302 | $ | 10,732 | $ | (17,050 | ) | |||||
| Adjustments to reconcile net income (loss) to net cash provided by operating activities: |
||||||||||||
| Amortization of investment premium |
3,263 | 3,838 | 5,114 | |||||||||
| Depreciation |
2,786 | 2,919 | 3,008 | |||||||||
| Acquisition costs capitalized |
(37,017 | ) | (33,557 | ) | (27,804 | ) | ||||||
| Amortization of deferred acquisition costs |
27,033 | 35,575 | 34,989 | |||||||||
| Realized investment (gains) losses |
(535 | ) | 10,076 | 52,271 | ||||||||
| Changes in assets and liabilities: |
||||||||||||
| Reinsurance receivables |
(7,758 | ) | (10,975 | ) | (6,050 | ) | ||||||
| Future policy benefits |
10,391 | 13,433 | 1,633 | |||||||||
| Policyholder account balances |
(34,944 | ) | (22,122 | ) | (17,378 | ) | ||||||
| Income taxes payable and deferred |
22,255 | 10,733 | (29,978 | ) | ||||||||
| Other, net |
12,515 | 11,028 | 17,321 | |||||||||
| Net cash provided |
20,291 | 31,680 | 16,076 | |||||||||
| INVESTING ACTIVITIES |
||||||||||||
| Purchases of investments: |
||||||||||||
| Fixed maturity securities |
(423,039 | ) | (322,508 | ) | (251,136 | ) | ||||||
| Equity securities |
(1,471 | ) | (4,025 | ) | (8,300 | ) | ||||||
| Mortgage loans |
(155,818 | ) | (59,650 | ) | (49,273 | ) | ||||||
| Real estate |
(12,238 | ) | (22,130 | ) | (31,091 | ) | ||||||
| Policy loans |
(16,765 | ) | (17,244 | ) | (17,496 | ) | ||||||
| Other investments |
(644 | ) | (214 | ) | (2,208 | ) | ||||||
| Sales of investments: |
||||||||||||
| Fixed maturity securities |
81,441 | 134,810 | 33,499 | |||||||||
| Equity securities |
584 | 4,781 | 8,811 | |||||||||
| Real estate |
- | 2,066 | 30,035 | |||||||||
| Other investments |
858 | - | - | |||||||||
| Net sales (purchases) of short-term investments |
122,991 | (103,566 | ) | 1,384 | ||||||||
| Maturities and principal paydowns of investments: |
||||||||||||
| Fixed maturity securities |
268,669 | 247,925 | 254,950 | |||||||||
| Mortgage loans |
54,233 | 47,458 | 54,031 | |||||||||
| Policy loans |
18,069 | 19,963 | 21,995 | |||||||||
| Net disposition (acquisition) of property and equipment |
(406 | ) | (68 | ) | 3 | |||||||
| Net cash provided (used) |
(63,536 | ) | (72,402 | ) | 45,204 | |||||||
See accompanying Notes to Consolidated Financial Statements
88
Table of Contents
Kansas City Life Insurance Company
Consolidated Statements of Cash Flows (Continued)
| Year Ended December 31 | ||||||||||||
| 2010 | 2009 | 2008 | ||||||||||
| FINANCING ACTIVITIES |
||||||||||||
| Proceeds from borrowings |
$ | 8,000 | $ | 1,500 | $ | 100,962 | ||||||
| Repayment of borrowings |
(8,000 | ) | (4,400 | ) | (108,462 | ) | ||||||
| Deposits on policyholder account balances |
238,213 | 239,642 | 200,465 | |||||||||
| Withdrawals from policyholder account balances |
(189,326 | ) | (201,711 | ) | (243,438 | ) | ||||||
| Net transfers from separate accounts |
7,177 | 7,271 | 11,486 | |||||||||
| Change in other deposits |
3,122 | 5,878 | 4,525 | |||||||||
| Cash dividends to stockholders |
(12,401 | ) | (12,506 | ) | (12,483 | ) | ||||||
| Net disposition (acquisition) of treasury stock |
(3,076 | ) | 309 | (16,773 | ) | |||||||
| Net cash provided (used) |
43,709 | 35,983 | (63,718 | ) | ||||||||
| Increase (decrease) in cash |
464 | (4,739 | ) | (2,438 | ) | |||||||
| Cash at beginning of year |
4,981 | 9,720 | 12,158 | |||||||||
| Cash at end of year |
$ | 5,445 | $ | 4,981 | $ | 9,720 | ||||||
See accompanying Notes to Consolidated Financial Statements
89
Table of Contents
Kansas City Life Insurance Company
Notes to Consolidated Financial Statements
1. Nature of Operations and Significant Accounting Policies
Business
Kansas City Life Insurance Company is a Missouri domiciled stock life insurance company which, with its subsidiaries, is licensed to sell insurance products in 49 states and the District of Columbia. The Company offers a diversified portfolio of individual insurance, annuity and group products through three life insurance companies. The consolidated entity (the Company) primarily consists of three life insurance companies. Kansas City Life Insurance Company (Kansas City Life) is the parent company. Sunset Life Insurance Company of America (Sunset Life) and Old American Insurance Company (Old American) are wholly-owned subsidiaries.
Basis of Presentation
The accompanying consolidated financial statements have been prepared on the basis of accounting principles generally accepted in the United States of America (GAAP) and include the accounts of Kansas City Life and its subsidiaries, principally Sunset Life and Old American. Significant intercompany transactions have been eliminated in consolidation and certain immaterial reclassifications have been made to the prior period results to conform with the current period’s presentation.
Use of Estimates
The preparation of the consolidated financial statements requires management of the Company to make estimates and assumptions relating to the reported amounts of assets and liabilities, the disclosure of contingent assets and liabilities at the date of the consolidated financial statements, and the reported amounts of revenue and expenses during the period. These estimates are inherently subject to change and actual results could differ from these estimates. Included among the material (or potentially material) reported amounts and disclosures that require extensive use of estimates are the fair value of certain invested assets, deferred acquisition costs, value of business acquired, future policy benefits, policy and contract claim liabilities, pension and other postretirement benefits and the valuation allowance on deferred income tax assets.
Business Changes
The Company has not had any significant business changes in the three years ended December 31, 2010.
Significant Accounting Policies
Presented below is a summary of significant accounting policies used by the Company.
Investments
Investment income is recognized when earned. Premiums and discounts on fixed maturity securities are amortized over the life of the related security as an adjustment to yield using the effective interest method. Realized gains and losses on the sale of investments are determined on the basis of specific security identification recorded on the trade date. Securities available for sale are stated at fair value. Unrealized gains and losses, net of adjustments to deferred acquisition costs (DAC), value of business acquired (VOBA), policyholder account balances and deferred income taxes, are reported as a separate component of accumulated other comprehensive income (loss) in stockholders’ equity. Unrealized losses represent the difference between amortized cost and fair value on the valuation date. The adjustments to DAC and VOBA represent changes in the amortization of DAC and VOBA that would have been required as a charge or credit to income had such unrealized amounts been realized. The adjustment to policyholder account balances represents the increase from using a discount rate that would have been required if such unrealized gains or losses had been realized and the proceeds reinvested at current market interest rates, which were lower than the then-current effective portfolio rate.
The Company’s fair value of fixed maturity and equity securities are derived from external pricing sources, brokers, and internal matrices and calculations. At December 31, 2010, approximately 96% of the carrying value of these investments was from external pricing services and 4% was derived from brokers, internal matrices and calculations. The investment portfolio is monitored regularly to ensure that investments which may be other-than-temporarily impaired are identified in a timely fashion and properly valued. Other-than-temporary impairments that are determined to be due to credit are charged against earnings as realized investment losses. See Note 3 – Investments for further details.
90
Table of Contents
Kansas City Life Insurance Company
Notes to Consolidated Financial Statements–(Continued)
Investment income on residential mortgage-backed securities is initially based upon yield, cash flow, and prepayment assumptions at the date of purchase. Subsequent revisions in those assumptions are recorded using the retrospective method, except for adjustable rate residential mortgage-backed securities where the prospective method is used. Under the retrospective method, the amortized cost of the security is adjusted to the amount that would have existed had the revised assumptions been in place at the time of purchase. Under the prospective method, future cash flows are estimated and interest income is recognized going forward using the new effective yield to maturity. The adjustments to amortized cost under both methods are recorded as a charge or credit to net investment income. The Company bases its historical results from individual securities and internal assessments of likely future results for these securities. These results are based upon validations and comparisons to similar securities provided by third parties such as rating agency analysis.
Mortgage loans are stated at cost, adjusted for amortization of premium and accrual of discount, less an allowance for potential future losses. A loan is considered impaired if it is probable that contractual amounts due will not be collected. The allowance for loss on mortgage loans is maintained at a level believed by management to be adequate to absorb potential future credit losses. Management’s periodic evaluation and assessment of the adequacy of the reserve is based on known and inherent risks in the portfolio, historical and industry data, current economic conditions and other relevant factors. Loans in foreclosure and loans considered to be impaired are placed on a non-accrual status.
Real estate consists of directly owned investments and real estate joint ventures. Real estate that is directly owned is carried at depreciated cost. Real estate joint ventures consist primarily of office buildings, industrial warehouses, unimproved land for future development and low income housing tax credit (LIHTC) investments. Real estate joint ventures are consolidated when required or are valued at cost, adjusted for the Company’s equity in earnings.
Policy loans are carried at cost, less principal payments received. Short-term investments are stated at cost, adjusted for amortization of premium and accrual of discount.
Valuation of Investments
The Company’s principal investments are in fixed maturity securities, mortgage loans and real estate; all of which are exposed to three primary sources of investment risk: credit, interest rate and liquidity. The fixed maturity securities, which are all classified as available for sale, are carried at their fair value in the Company’s Consolidated Balance Sheets, with unrealized gains or losses recorded in accumulated other comprehensive income (loss). The unrealized gains or losses are recorded net of the adjustment to policyholder account balances and deferred acquisition costs to reflect what would have been earned had those gains or losses been realized and the proceeds reinvested.
The Company has a policy and process in place to identify securities that could potentially have an impairment that is other-than-temporary. This process involves monitoring market events and other items that could impact issuers’ credit ratings, business climate, management changes, litigation and government actions, and other similar factors. This process also involves monitoring late payments, downgrades by rating agencies, key financial ratios, financial statements, revenue forecasts, asset quality and cash flow projections as indicators of credit issues.
The Company monitors the various markets in which its investments are traded. The Company utilizes a primary independent third-party pricing service to determine the majority of its fair values. The Company uses a second third-party pricing service to validate the fair market values provided by the primary pricing service. The Company also uses the second pricing service to determine the fair value of certain securities for which the primary pricing service was unable to provide. The Company reviews values received from independent pricing sources for unusual fluctuations. In addition, the Company tests a limited number of securities from the primary independent pricing service each reporting period to further validate reliance on the fair values provided. When fair values are not available from external service providers, where possible, the Company pursues external pricing from brokers. Generally, the Company pursues and utilizes only one broker quote per security. In doing so, the Company solicits only brokers which have previously demonstrated knowledge and experience of the subject security. When the Company cannot obtain reliable broker pricing, a fair value is determined based upon an assessment of several factors appropriate for the specific issue, including but not limited to: the issuer’s industry; liquidity; cash flows; marketability, ratings and the ability of the issuer to satisfy the obligation; government intervention or regulations; fair value of comparable securities in actively traded or quoted markets; or other factors. The Company creates a matrix of factors from which to calculate an estimable value. However, all factors may not be known or publicly available from which to determine a value and, as such, the fair value used by the Company may not be truly indicative of the actual value available in an active market or an actual exit price if the Company were to sell the security in the current market.
At the end of each quarter, all securities are reviewed to determine whether impairments exist and whether other-than-temporary impairments should be recorded. This quarterly process includes an assessment of the credit quality of each investment in the entire securities portfolio. Additional reporting and review procedures are conducted for those securities where fair value is less than 90% of amortized cost. The Company prepares a formal review document no less often than quarterly of all investments where fair value is less than 80% of amortized cost for six months or more and selected investments that have changed significantly from a previous period and that have a decline in fair value greater than 10% of amortized cost.
91
Table of Contents
Kansas City Life Insurance Company
Notes to Consolidated Financial Statements–(Continued)
The Company considers relevant facts and circumstances in evaluating whether the impairment of a security is other-than-temporary. Relevant facts and circumstances considered include but are not limited to:
| • | The current fair value of the security as compared to amortized cost; |
| • | The credit rating of the security; |
| • | The extent and the length of time the fair value has been below amortized cost; |
| • | The financial position of the issuer, including the current and future impact of any specific events, material declines in the issuer’s revenues, margins, cash positions, liquidity issues, asset quality, debt levels and income results; |
| • | Significant management or organizational changes; |
| • | Significant uncertainty regarding the issuer’s industry; |
| • | Violation of financial covenants; |
| • | Consideration of information or evidence that supports timely recovery; |
| • | The Company’s intent and ability to hold an equity security until it recovers in value; |
| • | Whether the Company intends to sell a debt security and whether it is more likely than not that the Company will be required to sell a debt security before recovery of the amortized cost basis; and |
| • | Other business factors related to the issuer’s industry. |
To the extent the Company determines that a fixed maturity security is deemed to be other-than-temporarily impaired, the portion of the impairment that is deemed to be due to credit is charged to the Consolidated Statements of Income and the cost basis of the underlying investment is reduced. The portion of the impairment that is deemed to be non-credit is charged to other comprehensive income (loss). Equity securities that are determined to be other-than-temporarily impaired are written down to fair value and the impairment is charged to the Consolidated Statements of Income.
There are a number of significant risks and uncertainties inherent in the process of monitoring impairments, determining if an impairment is other-than-temporary and determining the portion of an other-than-temporary impairment that is due to credit. These risks and uncertainties include but are not limited to:
| • | The risk that the Company’s assessment of an issuer’s ability to meet all of its contractual obligations will change based on changes in the credit characteristics of that issuer; |
| • | The risk that the economic outlook will be worse than expected or have more of an impact on the issuer than anticipated; |
| • | The risk that the performance of the underlying collateral for securities could deteriorate in the future and the Company’s credit enhancement levels and recovery values do not provide sufficient protection to the Company’s contractual principal and interest; |
| • | The risk that fraudulent, inaccurate or misleading information could be provided to the Company’s credit, investment and accounting professionals who determine the fair value estimates and accounting treatment for securities; |
| • | The risk that actions of trustees, custodians or other parties with interests in the security may have an unforeseen adverse impact on the Company’s investments; |
| • | The risk that new information obtained by the Company or changes in other facts and circumstances may lead the Company to change its intent to sell the security before it recovers in value; |
| • | The risk that facts and circumstances change such that it becomes more likely than not that the Company will be required to sell the investment before recovery of the amortized cost basis; and |
| • | The risk that the methodology or assumptions used to develop estimates of the portion of impairments due to credit prove, over time, to be inaccurate or insufficient. |
Any of these situations could result in a charge to income in a future period.
The Company may selectively determine that it no longer intends to hold a specific issue to its maturity. If the Company makes this determination and the fair value is less than the cost basis, an analysis of the fair value of the investment is performed and the investment is written down to the fair value and an other-than-temporary impairment is recorded on this particular position. Subsequently, the Company seeks to obtain the best possible outcome available for this specific issue and records an investment gain or loss at the disposal date.
92
Table of Contents
Kansas City Life Insurance Company
Notes to Consolidated Financial Statements–(Continued)
The Company has exposure to the municipal bond market. The Company’s investments in municipal bonds present unique considerations in evaluating other-than-temporary impairments. Judgments regarding whether a municipal debt security is other-than-temporarily impaired include analyzing a number of rather unique characteristics pertaining to the issuer. Municipalities possess unique powers, along with special legal standing and protections. These powers include the sovereign power to tax, access to one-time revenue sources, capacity to issue or restructure debt and the ability to shift spending to other authorities. In addition, state governments often provide secondary support to local governments in times of financial stress and the federal government has also provided assistance to state governments as well.
The evaluation of loan-backed and similar asset-backed securities, particularly including residential mortgage-backed securities, with significant indications of potential other-than-temporary impairment requires considerable use of estimates and judgment. Specifically, the Company performs discounted cash flow projections on these securities to evaluate whether the value of the investment is expected to be fully realized. Projections of expected future cash flows are based upon considerations of the performance of the actual underlying assets, including historical delinquencies, defaults, severity of losses incurred, and prepayments, along with the Company’s estimates of future results for these factors. The Company’s estimates of future results are based upon actual historical performance of the underlying assets relative to historical, current and expected general economic conditions, specific conditions related to the underlying assets, industry data, and other factors that are believed to be relevant. If the present value of the projected expected future cash flows are determined to be below the Company’s carrying value, the Company recognizes an other-than-temporary impairment on the portion of the carrying value that exceeds the projected expected future cash flows. To the extent that the loan-backed or other asset-backed securities were high quality investments at the time of acquisition, and they remain high quality investments and do not otherwise demonstrate characteristics of impairment, the Company performs other initial evaluations to determine whether other-than-temporary cash flow evaluations need to be performed.
The discounted future cash flow calculation typically becomes the primary determinant of whether any portion and to what extent an unrealized loss is due to credit on loan-backed and similar asset-backed securities with significant indications of potential other-than-temporary impairment. Such indications typically include below investment grade ratings and significant unrealized losses for an extended period of time, among other factors. The Company identified 12 and 13 non-U.S. Agency mortgage-backed securities that had such indications as of December 31, 2010 and December 31, 2009, respectively. Discounted future cash flow analysis was performed for each of these securities to determine if any portion of the impairment was due to credit and deemed to be other-than-temporary. The discount rate used in calculating the present value of future cash flows was the investment yield at the time of purchase for each security. The initial default rates were assumed to remain constant over a 24-month time frame and grade down thereafter, reflecting the general perspective of a more stabilized residential housing environment in the future.
The determination of any amount of impairment that is due to credit is based upon a comparison of the present value of the projected future cash flows on the security to the amortized cost. If any portion of the impairment is determined to be due to credit, based upon the present value of projected future cash flows being less than the amortized cost of the security, this amount is recognized as a realized loss in the Company’s Consolidated Statements of Income and the carrying value of the security is written down by the same amount. The portion of an impairment that is determined not to be due to credit is recorded as a component of accumulated other comprehensive income (loss) in the Consolidated Balance Sheets.
Significant unrealized losses on securities can continue for extended periods of time, particularly for certain individual securities. While this can be an indication of potential credit impairments, it can also be an indication of illiquidity in a particular sector or security. In addition, the fair value of an individual security can be heavily influenced by the complexities of varying market sentiment or uncertainty regarding the prospects for an individual security. This has been the situation in the non-U.S. Agency mortgage-backed securities market in recent periods. Based upon the process described above, the Company is best able to determine if and to what extent credit impairment may exist in these securities by performing present value calculations of projected future cash flows at the conclusion of each reporting period. By reviewing the most recent data available regarding the security and other relevant industry and market factors, the Company can modify assumptions used in the cash flow projections and determine the best estimate of the portion of any impairment that is due to credit at the conclusion of each period.
Financing Receivables
The Company has financing receivables as defined in the newly issued and adopted guidance Accounting Standards Update No. 2010-20 “Disclosures about the Credit Quality of Financing Receivables and the Allowance for Credit Losses.”
93
Table of Contents
Kansas City Life Insurance Company
Notes to Consolidated Financial Statements–(Continued)
The Company has several categories of receivables, not all of which meet the definition of a financing receivable as defined under the guidance. The Company has both long-term receivables and short-term receivables which might otherwise meet the definition, except that short-term receivables are specifically excluded under the guidance. To qualify as a financing receivable, a receivable must have both a specific maturity date, either on demand or on a fixed or determinable date, and it must be recognized as an asset in the Company’s statement of financial position. In addition, certain investments in mortgage loans and policy loans were also be evaluated to determine whether they meet the definition of a financing receivable. The Company’s financing receivables are defined as follows:
| • | The Company has mortgage loans which are identified as financing receivables. Mortgage loans at December 31, 2010 totaled $559.2 million, net of the allowance for loss. Please see the mortgage loan section contained in Note 3 – Investments for further details. |
| • | The Company has agent receivables which are classified as financing receivables and which are reduced by an allowance for doubtful accounts. These receivables are long-term in nature, are trade receivables with the Company’s sales force, contain specifically agreed contracts and are specifically assessed as to the collectability of each receivable. The Company’s gross agent receivables totaled $2.8 million at December 31, 2010 and the Company maintained an allowance for doubtful accounts totaling $0.6 million. The Company has two types of agent receivables included in this category as follows: |
| • | Agent specific loans. These loans totaled $0.3 million with a minimal allowance for doubtful accounts. |
| • | Various agent commission advances and other commission receivables. Gross agent receivables in this category totaled $2.5 million, and the Company maintained an allowance for doubtful accounts of $0.6 million. |
The table below identifies the Company’s financing receivables by classification amount as of December 31, 2010.
| Receivables: |
||||
| Agent receivables, net (uncollectible allowance $644) |
$ | 2,120 | ||
| Investment-related financing receivables: |
||||
| Mortgage loans, net (allowance $3,410) |
559,167 | |||
| Total financing receivables |
$ | 561,287 | ||
Deferred Acquisition Costs
Deferred acquisition costs (DAC), principally agent commissions and other selling, selection and issue costs, which vary with and are directly related to the production of new business, are capitalized as incurred. At least annually, the Company reviews its DAC capitalization policy and the specific items which are capitalized with existing guidance. These deferred costs for life insurance products are generally deferred and amortized over the premium paying period. Policy acquisition costs that relate to interest sensitive and variable insurance products are deferred and amortized with interest in relation to the estimated gross profits to be realized over the lives of the contracts.
For interest sensitive and variable insurance products, estimated gross profits are composed of net interest income, net realized investment gains and losses, fees, surrender charges, expenses, and mortality gains and losses. At the issuance of policies, projections of estimated gross profits are made which are then replaced by actual gross profits over the lives of the policies. In addition to other factors, emerging experience may lead to a revised outlook for the remaining estimated gross profits. Accordingly, DAC may be recalculated using these new assumptions and any resulting adjustment is included in income. The Company considers the following assumptions to be of significance when evaluating future estimated gross profits: mortality, interest rates and spreads, surrender and withdrawal rates and expense margins.
DAC is also reviewed on an ongoing basis to determine that the unamortized portion does not exceed the expected recoverable amounts. If it is determined from emerging experience that the premium margins or expected gross profits are insufficient to amortize deferred acquisition costs, then the asset will be adjusted downward with the adjustment recorded as an expense in the current period. No impairment adjustments have been recorded in the years presented. The DAC asset is also adjusted at each reporting date to reflect the impact of unrealized gains and losses on fixed maturity and equity securities available for sale as though such gains and losses had been realized.
The Company may consider refinements in estimates due to improved capabilities resulting from administrative or actuarial system upgrades. The Company considers such enhancements to determine whether and to what extent they are associated with prior periods or simply improvements in the projection of future expected gross profits due to improved functionality. To the extent they represent such improvements, these items are applied to the appropriate financial statement line items in a manner similar to unlocking adjustments.
94
Table of Contents
Kansas City Life Insurance Company
Notes to Consolidated Financial Statements–(Continued)
The amortization of DAC decreased $8.1 million or 23% in 2010 compared to one year ago. This decrease was primarily the result of a refinement in methodology (resulting in a change in estimate) and an unlocking of certain assumptions. The Company refined its estimate as a result of the implementation of an actuarial system upgrade. This upgrade allowed the Company to refine its projection of future expected gross profits on investment-type contracts which impacted the calculation of DAC amortization. The effect of the change in estimate was an increase in the DAC asset and a reduction in current period DAC amortization of $1.8 million. There was no material refinement in either 2009 or 2008.
The other factor impacting the amortization of DAC was an unlocking that occurred in 2010. The unlocking primarily related to a change in the estimated future gross profits associated with the mortality assumption for certain universal life and variable universal life products. This unlocking adjustment reflects actual experience from mortality results that have emerged and which have been better than assumed in expected future profits previously established. The unlocking of the mortality assumption on the variable universal life product included a change to a more recent mortality table. This table is also currently used by the Company in the mortality assumption for universal life and allows the Company enhanced consistency with mortality assumptions on other interest-sensitive products. In addition, the Company also unlocked an interest rate assumption on selected fixed deferred annuity products. The impact of unlocking was an increase in the DAC asset and a corresponding decrease in the amortization of DAC of $5.8 million. While no material DAC unlocking or change in estimate occurred in 2009, DAC amortization was reduced by $3.0 million due to unlocking during 2008.
The following table identifies the effects of the DAC change in estimate and unlocking in the Consolidated Statements of Income for the years ended December 31.
| 2010 | 2009 | 2008 | ||||||||||
| Change in estimate |
$ | 1,795 | $ | 6 | $ | - | ||||||
| Unlocking |
5,831 | - | 2,974 | |||||||||
| Total |
$ | 7,626 | $ | 6 | $ | 2,974 | ||||||
The DAC asset is adjusted to reflect the impact of unrealized gains and losses on fixed maturity securities available for sale, as described in the Investments section of Note 1. The change in DAC from unrealized losses on fixed maturity securities was $(26.5) million for year ended 2010 (2009 - $(52.1) million; 2008 - $51.2 million).
The following table provides information about DAC at December 31.
| 2010 | 2009 | 2008 | ||||||||||
| Balance at beginning of year |
$ | 209,495 | $ | 263,756 | $ | 217,512 | ||||||
| Cumulative effect of change in accounting principle (See Note 15) |
- | (450 | ) | - | ||||||||
| Capitalization of commissions, sales and issue expenses |
37,017 | 33,557 | 27,804 | |||||||||
| Gross amortization |
(38,896 | ) | (46,678 | ) | (46,411 | ) | ||||||
| Accrual of interest |
11,863 | 11,552 | 11,422 | |||||||||
| Amortization due to realized investment (gains) losses |
(67 | ) | (177 | ) | 2,243 | |||||||
| Change in DAC due to unrealized investment (gains) losses |
(26,469 | ) | (52,065 | ) | 51,186 | |||||||
| Balance at end of year |
$ | 192,943 | $ | 209,495 | $ | 263,756 | ||||||
Value of Business Acquired
When a new block of business is acquired or when an insurance company is purchased, a portion of the purchase price is allocated to a separately identifiable intangible asset, called the value of business acquired (VOBA). VOBA is established as the actuarially determined present value of future gross profits of the business acquired and is amortized with interest in proportion to future premium revenues or the expected future profits, depending on the type of business acquired. VOBA is reported as a component of other assets with related amortization included in operating expenses. Amortization of VOBA occurs with interest over the anticipated lives of the underlying business to which it relates, initially 15 to 30 years. Similar to DAC, the assumptions regarding future experience can affect the carrying value of VOBA, including interest spreads, mortality, expense margins and policy and premium persistency experience. Significant changes in these assumptions can impact the carrying balance of VOBA and produce changes that are reflected in the current period’s income as an unlocking adjustment. Profit expectations are based upon assumptions of future interest spreads, mortality margins, expense margins and policy and premium persistency experience. Mortality relates to the occurrence of death. Interest spreads are the difference between the investment returns earned and the crediting rates of interest applied to policyholder account balances. Surrender rates relate to the relative volume of policy terminations. Expense margins involve the expenses incurred for maintaining and servicing in force policies. These assumptions involve judgment and are compared to actual experience on an ongoing basis. If it is determined that the assumptions related to the profit expectations for interest sensitive and variable insurance products should be revised, the impact of the change is reported in the current period’s income as an unlocking adjustment.
95
Table of Contents
Kansas City Life Insurance Company
Notes to Consolidated Financial Statements–(Continued)
At least annually, a review is performed of the models and the assumptions used to develop expected future profits, based upon management’s current view of future events. VOBA is reviewed on an ongoing basis to determine that the unamortized portion does not exceed the expected recoverable amounts. Management’s view primarily reflects Company experience but can also reflect emerging trends within the industry. Short-term deviations in experience affect the amortization of VOBA in the period, but do not necessarily indicate that a change to the long-term assumptions of future experience is warranted. If it is determined that it is appropriate to change the assumptions related to future experience, then an unlocking adjustment is recognized for the block of business being evaluated. Certain assumptions, such as interest spreads and surrender rates, may be interrelated. As such, unlocking adjustments often reflect revisions to multiple assumptions. The VOBA balance is immediately impacted by any assumption changes, with the change reflected through the income statement as an unlocking adjustment in the amount of VOBA amortized. These adjustments can be positive or negative with adjustments reducing amortization limited to amounts previously deferred plus interest accrued through the date of the adjustment.
In addition, the Company may consider refinements in estimates due to improved capabilities resulting from administrative or actuarial system upgrades. The Company considers such enhancements to determine whether and to what extent they are associated with prior periods or simply improvements in the projection of future expected gross profits due to improved functionality. To the extent they represent such improvements, these items are applied to the appropriate financial statement line items in a manner similar to unlocking adjustments.
VOBA is also reviewed on an ongoing basis to determine that the unamortized portion does not exceed the expected recoverable amounts. If it is determined from emerging experience that the premium margins or gross profits are insufficient to amortize deferred acquisition costs, then the asset will be adjusted downward with the adjustment recorded as an expense in the current period. No impairment adjustments have been recorded in the years presented.
The amortization of VOBA increased $2.2 million in 2010 compared to the same period in the prior year. This increase was due primarily to two factors, both which occurred in the prior year. First, in 2009, the Company refined its method for calculating VOBA from a premium-based method to a volume-based method for certain traditional life products. Since the Company’s establishment of VOBA, it had used the measure of premium in force which had been inconsistent from period to period due to the way the premium in force was identified and captured. This resulted in a corresponding volatile amortization of VOBA that was inconsistent when related to the actual run off of the in force policies. Accordingly, the Company refined its method of estimating VOBA to the use of volume in force. This refinement in estimate reduced VOBA amortization $2.5 million in 2009. Second, the Company had an unlocking adjustment on interest-sensitive products, which decreased VOBA amortization $0.2 million in 2009. There was no unlocking or refinement in methodology in 2010 (2008 – increased amortization $0.2 million).
The following table identifies the effects of the VOBA change in estimate and unlocking in the Consolidated Statements of Income for the years ended December 31.
| 2010 | 2009 | 2008 | ||||||||||
| Change in estimate |
$ | - | $ | 2,477 | $ | - | ||||||
| Unlocking |
- | 163 | (180 | ) | ||||||||
| Total |
$ | - | $ | 2,640 | $ | (180 | ) | |||||
The VOBA asset is adjusted to reflect the impact of unrealized gains and losses on fixed maturity securities available for sale, as described in the Investments section of Note 1. The change in VOBA asset from unrealized losses on fixed maturity securities in 2010 was $(10.1) million (2009 - $(12.4) million; 2008 - $15.2 million).
96
Table of Contents
Kansas City Life Insurance Company
Notes to Consolidated Financial Statements–(Continued)
The following table provides information about VOBA at December 31.
| 2010 | 2009 | 2008 | ||||||||||
| Balance at beginning of year |
$ | 66,114 | $ | 82,855 | $ | 73,517 | ||||||
| Cumulative effect of change in accounting principle (See Note 15) |
- | (135 | ) | - | ||||||||
| Gross amortization |
(10,432 | ) | (8,644 | ) | (11,704 | ) | ||||||
| Accrual of interest |
3,654 | 4,115 | 4,610 | |||||||||
| Amortization due to realized investment (gains) losses |
58 | 336 | 1,187 | |||||||||
| Change in VOBA due to unrealized investment (gains) losses |
(10,123 | ) | (12,413 | ) | 15,245 | |||||||
| Balance at end of year |
$ | 49,271 | $ | 66,114 | $ | 82,855 | ||||||
The accrual of interest for Old American VOBA was calculated at a 13.0% interest rate for the life block and a 7.0% rate for the accident and health block. In 2010, interest was accrued on the GuideOne acquisition VOBA at the rates of 4.5% on the interest sensitive life block, 4.1% on the deferred annuity block and 5.3% on the traditional life block. The VOBA on a separate acquired block of business used a 7.0% interest rate on the traditional life portion and a 5.4% interest rate on the interest sensitive portion. The interest rates used in the calculation of VOBA are based on rates appropriate at the time of acquisition. The expected amortization of VOBA each year over the next five years, 2011 through 2015, is $9,925, $7,272, $6,783, $6,136, and $5,725, respectively.
Contract Charges
Contract charges consist of cost of insurance, expense loads, the amortization of unearned revenues and surrender charges. Cost of insurance relates to charges for mortality. These charges are applied to the excess of the mortality benefit over the account value for universal life policies. Expense loads are amounts that are assessed against the policyholder balance as consideration for origination and maintenance of the contract. Surrender charges are fees imposed on policyholders upon cancellation of a policy.
One component of contract charges is the recognition over time of the deferred revenue liability (DRL) from certain universal life policies. This liability arises from front-end loads on such policies and is recognized into the Consolidated Statements of Income in concert with the future expected gross profits, similar to the amortization of DAC. In 2010, the Company had a refinement in methodology resulting in a change in estimate. The Company refined its methodology primarily as a result of the implementation of an actuarial system upgrade. This upgrade allowed the Company to refine its calculation of the DRL liability. The effect of the refinement in estimate on the DRL was an increase in the liability and a reduction to contract charges of $0.9 million. No refinements of the DRL calculation occurred during 2009 or 2008.
Unlocking or other events may also have an impact on products and policies. If it is determined that it is appropriate to change the assumptions of future experience, then an unlocking adjustment is recognized for the block of business being evaluated. Certain assumptions, such as interest spreads and surrender rates, may be interrelated. As such, unlocking adjustments often reflect revisions to multiple assumptions. In addition, the Company may also consider refinements in estimates for other unusual or one-time occurrences for events such as administrative or actuarial system upgrades. These items are applied to the appropriate financial statement line items similar to unlocking adjustments.
At least annually, a review is performed regarding the assumptions related to profit expectations consistent with those performed for DAC and VOBA. If it is determined that the assumptions should be revised, an adjustment may be recorded to contract charge deferred revenues in the current period as an unlocking adjustment. The Company had an unlocking in the DRL in 2010. The 2010 unlocking adjustment reflects actual experience from mortality results, premium persistency, and surrender rates that have emerged. The impact of the unlocking on DRL was a decrease in the liability and a corresponding increase in the recognition of deferred revenue in the current period of $1.1 million. While there was no unlocking affecting the DRL in 2009, there was an increase in the liability of $0.8 million due to unlocking.
97
Table of Contents
Kansas City Life Insurance Company
Notes to Consolidated Financial Statements–(Continued)
The following table identifies the effect of the deferred revenue change in estimate and unlocking recognized in contract charges in the Consolidated Statements of Income.
| 2010 | 2009 | 2008 | ||||||||||
| Change in estimate |
$ | (922 | ) | $ | - | $ | - | |||||
| Unlocking |
1,107 | - | (811 | ) | ||||||||
| Total |
$ | 185 | $ | - | $ | (811 | ) | |||||
Reinsurance
Consistent with the general practice of the life insurance industry, the Company enters into traditional agreements of indemnity reinsurance with other insurance companies to support sales of new products and the in force business. The reinsurance arrangements have taken various forms over the years. The Company has reinsurance in force on all of the following bases: automatic and facultative; yearly renewable term (YRT) and coinsurance; and excess and quota share basis. For additional information pertaining to the Company’s significant reinsurers, along with additional information pertaining to reinsurance, please see Note 13 - Reinsurance in the Notes to Consolidated Financial Statements.
Currently, new sales of traditional life and universal life products are reinsured on a YRT basis in excess of the Company’s retention limits while sales of certain term life insurance products are reinsured on a quota share (a portion of each policy is reinsured), coinsurance basis. Sales of group disability income products are reinsured on a quota share coinsurance basis. New sales of group life are reinsured on an excess of retention basis with the accidental death and dismemberment benefits being 100% reinsured. The Company’s maximum retention limit on individual life insurance products is three hundred fifty thousand dollars and on group life business is one hundred thousand dollars.
Reinsurance receivables include amounts related to paid benefits and estimated amounts related to unpaid policy and contract claims, future policy benefits and policyholder account balances. All insurance related revenues, benefits and expenses are reported net of reinsurance ceded. Policies and contracts assumed are accounted for in a manner similar to that followed for direct business.
Separate Accounts
Separate account assets and liabilities arise from the sale of variable universal life insurance and variable annuity products. The separate account represents funds segregated for the benefit of certain policyholders who bear the investment risk. The assets are legally segregated and are not subject to claims which may arise from any other business of the Company. The separate account assets and liabilities, which are equal, are recorded at fair value based upon net asset value (NAV). Policyholder account deposits and withdrawals, investment income and realized investment gains and losses are excluded from the amounts reported in the Consolidated Statements of Income. Revenues to the Company from separate accounts consist principally of contract charges, which include maintenance charges, administrative fees and mortality and risk charges.
The following table provides a reconciliation of activity within separate account liabilities at December 31.
| 2010 | 2009 | 2008 | ||||||||||
| Balance at beginning of year |
$ | 312,824 | $ | 258,565 | $ | 420,393 | ||||||
| Deposits on variable policyholder contracts |
36,062 | 35,180 | 48,994 | |||||||||
| Transfers to general account |
(7,177 | ) | (7,271 | ) | (11,486 | ) | ||||||
| Investment performance |
43,096 | 70,096 | (135,280 | ) | ||||||||
| Policyholder benefits |
(33,066 | ) | (31,347 | ) | (49,863 | ) | ||||||
| Contract charges |
(12,710 | ) | (12,399 | ) | (14,193 | ) | ||||||
| Balance at end of year |
$ | 339,029 | $ | 312,824 | $ | 258,565 | ||||||
The Company has a guaranteed minimum withdrawal benefit (GMWB) rider that can be added to new or existing variable annuity contracts. The rider provides an enhanced withdrawal benefit that guarantees a stream of income payments to an owner or annuitant, regardless of the contract account value. The value of variable annuity separate accounts with the GMWB rider was $80.3 million at December 31, 2010 (2009—$57.9 million) and the guarantee liability was $(2.8) million at December 31, 2010 (2009—$(1.6) million). The value of the GMWB rider is recorded at fair value. The change in this value is included in policyholder benefits in the Consolidated Statements of Income. The value of variable annuity separate accounts with the GMWB rider is recorded in separate account liabilities and the value of the rider is included in other policyholder funds in the Consolidated Balance Sheets. The determination of fair value of the GMWB liability requires models that use actuarial and financial market assumptions, which reflect the assumptions market participants would use in pricing the contract, including adjustments for risk and issuer non-performance. The Company refined its process in 2010 to incorporate an index from an industry-recognized actuarial consulting firm that the Company believes is more consistent with the attributes of the product and better matches the volatility measure with the expected life of the underlying contracts.
98
Table of Contents
Kansas City Life Insurance Company
Notes to Consolidated Financial Statements–(Continued)
The total separate account assets were $339.0 million as of December 31, 2010. Variable universal life and variable annuity assets comprised 29% and 71% of this amount, respectively. A guaranteed minimum death benefit (GMDB) rider is available on certain variable universal life contracts, and GMDB are provided on all variable annuities. The GMDB rider for variable universal life and variable annuity contracts guarantees the death benefit for specified periods of time, regardless of investment performance, provided cumulative premium requirements are met.
As of December 31, 2010, separate account balances for variable annuity contracts were $240.6 million. The total reserve held for variable annuity GMDB was $0.3 million. Additional information related to the GMDB and related separate account balances and net amount at risk (the amount by which the GMDB exceeds the account balance) as of December 31, 2010 and 2009 is provided below:
| 2010 | 2009 | |||||||||||||||
| Separate Account Balance |
Net Amount at Risk |
Separate Account Balance |
Net Amount at Risk |
|||||||||||||
| Return of net deposits |
$ | 206,227 | $ | 3,431 | $ | 193,870 | $ | 8,932 | ||||||||
| Return of the greater of the highest anniversary contract value or net deposits |
4,546 | 239 | 4,580 | 485 | ||||||||||||
| Return of the greater of every fifth year highest anniversary contract value or net deposits |
6,234 | 215 | 6,078 | 593 | ||||||||||||
| Return of the greater of net deposits accumulated annually at 5% or the highest anniversary contract value |
23,615 | 3,715 | 17,195 | 2,995 | ||||||||||||
| Total |
$ | 240,622 | $ | 7,600 | $ | 221,723 | $ | 13,005 | ||||||||
The following table presents the GMDB for the variable annuity incurred and paid death benefits for the three years ended December 31.
| 2010 | 2009 | 2008 | ||||||||||
| Variable annuity incurred death benefits |
$ | 1,955 | $ | 5,778 | $ | 4,426 | ||||||
| Variable annuity paid death benefits |
$ | 1,808 | $ | 5,899 | $ | 4,528 | ||||||
The following table presents the aggregate fair value of assets by major investment asset category supporting the variable annuity separate accounts with guaranteed benefits at December 31.
| 2010 | 2009 | 2008 | ||||||||||
| Money market |
$ | 6,727 | $ | 8,358 | $ | 10,256 | ||||||
| Fixed income |
22,340 | 18,066 | 13,827 | |||||||||
| Balanced |
52,792 | 51,935 | 45,089 | |||||||||
| International equity |
26,818 | 23,540 | 17,258 | |||||||||
| Intermediate equity |
69,373 | 63,083 | 50,389 | |||||||||
| Aggressive equity |
62,572 | 56,741 | 45,495 | |||||||||
| Total |
$ | 240,622 | $ | 221,723 | $ | 182,314 | ||||||
Future Policy Benefits
The Company establishes liabilities for amounts payable under insurance policies, including traditional life insurance, immediate annuities with life contingencies, supplementary contracts with life contingencies and accident and health insurance. Generally, amounts are payable over an extended period of time. Liabilities for future policy benefits of traditional life insurance have been computed by a net level premium method based upon estimates at the time of issue for investment yields, mortality and withdrawals. These estimates include provisions for experience less favorable than initially expected. Mortality assumptions are based on Company experience expressed as a percentage of standard mortality tables. The 2001 Valuation Basic Table and the 1975-1980 Select and Ultimate Basic Table serve as the bases for most mortality assumptions.
99
Table of Contents
Kansas City Life Insurance Company
Notes to Consolidated Financial Statements–(Continued)
Liabilities for future policy benefits of immediate annuities and supplementary contracts with life contingencies are computed by calculating an actuarial present value of future policy benefits, based upon estimates for investment yields and mortality at the time of issue.
Liabilities for future policy benefits of accident and health insurance represent estimates of payments to be made on reported insurance claims, as well as claims incurred but not yet reported. These liabilities are estimated using actuarial analyses and case basis evaluations that are based upon past claims experience, claim trends and industry experience.
The following table provides detail about future policy benefits at December 31.
| 2010 | 2009 | |||||||
| Life insurance |
$ | 618,961 | $ | 617,247 | ||||
| Immediate annuities and supplementary contracts with life contingencies |
218,645 | 201,554 | ||||||
| Total |
837,606 | 818,801 | ||||||
| Accident and health insurance |
46,774 | 48,088 | ||||||
| Total future policy benefits |
$ | 884,380 | $ | 866,889 | ||||
Policyholder Account Balances
Policyholder account balances include universal life insurance, fixed deferred annuity contracts and investment-type contracts. Liabilities for these policyholder account balances are included without reduction for potential surrender charges and deferred front-end contract charges. The account balances for universal life contracts are equal to cumulative deposits, less contract charges and withdrawals, plus interest credited. The account balances for fixed deferred annuities and investment-type contracts are equal to the cumulative deposits, less any applicable contract charges and withdrawals, plus interest credited. Front-end contract charges are deferred and amortized over the term of the policies. Policyholder benefits incurred in excess of related policyholder account balances are charged to policyholder benefits expense. Interest on policyholder account balances is credited as earned.
Crediting rates for universal life insurance and fixed deferred annuity products ranged from 2.00% to 5.50% in 2010 (2009 – 3.00% to 5.50%; 2008 – 3.00% to 5.50%).
The following table provides detail about policyholder account balances at December 31.
| 2010 | 2009 | |||||||
| Universal life insurance |
$ | 970,535 | $ | 989,929 | ||||
| Fixed deferred annuities |
1,037,331 | 999,500 | ||||||
| Supplementary contracts without life contingencies |
58,012 | 59,399 | ||||||
| Policyholder account balances |
$ | 2,065,878 | $ | 2,048,828 | ||||
Recognition of Revenues
Premiums for traditional life insurance products are reported as revenue when due. Premiums on accident and health, disability and dental insurance are reported as earned ratably over the contract period in proportion to the amount of insurance protection provided. A reserve is provided for the portion of premiums written which relate to unexpired terms of coverage.
Deposits related to universal life, fixed deferred annuity contracts and investment-type products are credited to policyholder account balances. Revenues from such contracts consist of amounts assessed against policyholder account balances for mortality, policy administration and surrender charges, and are recognized in the period in which the benefits and services are provided. The cash flows from deposits are credited to policyholder account balances. Deposits are not recorded as revenue. Deposits are shown as a Financing Activity in the Consolidated Statements of Cash Flows.
100
Table of Contents
Kansas City Life Insurance Company
Notes to Consolidated Financial Statements–(Continued)
The Company measures its sales or new business production with two components: new premiums recorded and new deposits received. Premiums and deposits are subdivided into two categories: new and renewal. New premiums and deposits are measures of sales or new business production. Renewal premiums and deposits occur as continuing business from existing customers.
Income Taxes
Deferred income taxes are recorded on the differences between the tax bases of assets and liabilities and the amounts at which they are reported in the consolidated financial statements. Recorded amounts are adjusted to reflect changes in income tax rates and other tax law provisions as they become enacted.
Deferred income tax assets are subject to ongoing evaluation of whether such assets will be realized. The ultimate realization of deferred income tax assets generally depends on the reversal of deferred tax liabilities and the generation of future taxable income and realized gains during the periods in which temporary differences become deductible. Deferred income taxes include future deductible differences relating to unrealized losses on investment securities. The Company evaluates the character and timing of unrealized gains and losses to determine whether sufficient future taxable amounts are sufficient to offset future deductible amounts. A valuation allowance against deferred income tax assets may be required if future taxable income of the correct character is not expected.
The Company and its subsidiaries file a consolidated federal income tax return that includes both life insurance companies and non-life insurance companies.
Comprehensive Income (Loss)
Comprehensive income (loss) is comprised of net income (loss) and other comprehensive income (loss). Other comprehensive income (loss) includes the unrealized investment gains or losses on securities available for sale (net of adjustments for realized investment gains or losses) net of adjustments to DAC, VOBA and policyholder account balances. In addition, other comprehensive income (loss) includes the change in the liability for benefit plan obligations. Other comprehensive income (loss) reflects these items net of tax.
Income (Loss) Per Share
Due to the Company’s capital structure and the absence of other potentially dilutive securities, there is no difference between basic and diluted earnings per common share for any of the years reported. The average number of shares outstanding during 2010 was 11,486,306 shares (2009 – 11,550,016 shares; 2008 – 11,568,635 shares). The number of shares outstanding at year-end 2010 was 11,467,105 (2009 – 11,565,091).
Participating Policies
The Company has some insurance contracts where the policyholder is entitled to share in the earnings through dividends that reflect the difference between the premium charged and the actual experience. Participating business at year-end 2010 approximated 4% of statutory premiums and 5% of the life insurance in force. The amount of dividends to be paid is determined annually by the Board of Directors. Provision has been made in the liability for future policy benefits to allocate amounts to participating policyholders on the basis of dividend scales contemplated at the time the policies were issued. Additional provisions have been made for policyholder dividends in excess of the original scale, which have been declared by the Board of Directors.
New Accounting Pronouncements
In September 2006, the FASB issued new guidance to provide a single definition of fair value, together with a framework for measuring it, and required additional disclosure about the use of fair value to measure assets and liabilities. The FASB emphasized that fair value is a market-based measurement, not an entity-specific measurement, and it established a fair value hierarchy with the highest priority being the quoted price in active markets. This guidance became effective for years beginning after November 15, 2007. The Company adopted it on January 1, 2008 with no material impact to the consolidated financial statements.
In February 2007, the FASB issued new guidance to permit an entity to measure certain financial assets and liabilities at fair value. Under this guidance, entities that elect the fair value option report unrealized gains and losses in earnings at each subsequent reporting date. The fair value option may be elected on an instrument-by-instrument basis, with a few exceptions, as long as it is applied to the instrument in its entirety. Once adopted, the fair value option election is irrevocable, unless a new election date occurs. This guidance became effective for years beginning after November 15, 2007. The Company adopted it on January 1, 2008 with no material impact to the consolidated financial statements. The Company elected to not measure financial assets and liabilities at fair value other than those already prescribed.
101
Table of Contents
Kansas City Life Insurance Company
Notes to Consolidated Financial Statements–(Continued)
In March 2008, the FASB issued new guidance to require companies with derivative instruments to disclose information about how and why an entity uses derivative instruments, how derivative instruments and related hedged items are accounted for, and how derivative instruments and related hedged items affect an entity’s financial position, financial performance, and cash flows. This guidance became effective for financial statements issued for fiscal years beginning after November 15, 2008. The Company adopted it on January 1, 2009 with no material impact on the consolidated financial statements.
In October 2008, the FASB issued new guidance to clarify the application of fair value accounting in a market that is not active and to provide an example to illustrate key considerations in determining the fair value of a financial asset when the market for that financial asset is not active. The Company adopted this guidance upon issuance, with no material impact to the consolidated financial statements.
In December 2008, the FASB issued new guidance regarding employers’ disclosures about postretirement benefit plan assets. It requires entities to provide disclosures about employer’s defined benefit plans and other post retirement plans that would help users of the financial statements understand how investment allocation decisions are made, the major categories of plan assets, the inputs and the valuation techniques used to measure the fair value of plan assets, the effect of fair value measurements using significant unobservable inputs (Level 3) on changes in plan assets for the period, and significant concentrations of risk within plan assets. This guidance became effective for financial statements issued for fiscal years ending after December 15, 2009. The Company adopted this guidance on January 1, 2009 with no material impact to the consolidated financial statements.
In April 2009, the FASB issued new guidance to clarify fair valuation in inactive markets and includes all assets and liabilities subject to fair valuation measurements. Enhanced disclosures related to the fair value of assets and liabilities became required. This guidance became effective for financial statements issued for interim and annual periods ending after June 15, 2009. The Company elected early adoption effective for the period ended March 31, 2009 with retroactive application effective January 1, 2009 with no material impact to the consolidated financial statements.
In April 2009, the FASB issued new guidance regarding other-than-temporary impairment of debt securities and changes in the recognition and presentation of debt securities determined to be other-than-temporarily impaired. The guidance requires an enterprise to bifurcate any other-than-temporary impairment between credit and non-credit impairments and then establish accounting treatment for each aspect, in current and subsequent periods. Retroactive application became required to other-than-temporary impairments recorded in prior periods by making a cumulative-effect adjustment to the opening balance of retained earnings and accumulated other comprehensive income (loss) in the period of adoption. This guidance became effective for financial statements issued for interim and annual periods ending after June 15, 2009. The Company elected early adoption effective for the period ended March 31, 2009 with retroactive application effective January 1, 2009. For additional information pertaining to this guidance, please see Note 15 – Accumulated Effect of Change in Accounting Principle.
In April 2009, the FASB issued new guidance to expand the fair value disclosures required for financial instruments for interim periods. The guidance also requires entities to disclose the methods and significant assumptions used to estimate the fair value of financial instruments in financial statements on an interim and annual basis and to highlight any changes from prior periods. This guidance became effective for financial statements issued for interim and annual periods ending after June 15, 2009. The Company elected early adoption effective for the period ended March 31, 2009 with retroactive application effective January 1, 2009 with no material impact to the consolidated financial statements.
In May 2009, the FASB issued new guidance that established general accounting standards and disclosure for events occurring subsequent to the balance sheet date but before the financial statements are issued. This guidance became effective for interim and annual accounting periods ending after June 15, 2009. The Company adopted it upon issuance, with no material impact to the consolidated financial statements.
In June 2009, the FASB issued new guidance to improve the information that a reporting entity provides in its financial reports related to a transfer of financial assets. It addresses the effects of a transfer on financial position, financial performance, cash flows and a transferor’s continuing involvement in transferred financial assets. In addition, this guidance also eliminates the concept of a qualifying special-purpose entity. This guidance became effective for interim and annual accounting periods beginning after November 15, 2009. The Company adopted it on January 1, 2010 with no material impact to the consolidated financial statements.
102
Table of Contents
Kansas City Life Insurance Company
Notes to Consolidated Financial Statements–(Continued)
In June 2009, the FASB issued new guidance to improve financial reporting by enterprises involved with variable interest entities (VIEs). This guidance changes the approach to determining a VIE’s primary beneficiary and requires companies to continuously reassess whether investments in VIEs must be consolidated. This guidance became effective for interim and annual accounting periods beginning after November 15, 2009. The Company adopted it on January 1, 2010 with no material impact to the consolidated financial statements.
In June 2009, the FASB issued new guidance to establish the FASB ASC as the source of authoritative accounting principles recognized by the FASB to be applied by non-governmental entities in the preparation of financial statements in conformity with GAAP. This guidance replaced previous guidance related to the same issue and became effective for interim and annual reporting periods ending after September 15, 2009. The Company adopted it upon issuance, with no material impact to the consolidated financial statements.
In January 2010, the FASB issued amendments to existing guidance regarding accounting and reporting for decreases in ownership of a subsidiary. The amendments affect entities that experience a decrease in ownership in a subsidiary that is a business or nonprofit activity. The amendments also affect entities that exchange a group of assets that constitutes a business or nonprofit activity for an equity interest in another entity. This guidance became effective for interim and annual reporting periods ending after December 15, 2009 for the Company since it had previously adopted SFAS No. 160, “Noncontrolling Interests in Consolidated Financial Statements.” The Company adopted the amendment on January 1, 2010 with no material impact to the consolidated financial statements.
In January 2010, the FASB issued new guidance to improve disclosures about fair value measurements. This guidance requires new disclosures and clarification of existing disclosures regarding Levels 1, 2 and 3 in the fair value hierarchy. The majority of this guidance became effective for interim and annual reporting periods beginning after December 15, 2009. However, disclosures about purchases, sales, issuances, and settlements in the roll forward of activity in Level 3 fair value measurements will become effective for fiscal years beginning after December 15, 2010 and for interim periods within those years. The Company adopted the guidance on January 1, 2010 with no material impact to the consolidated financial statements.
In July 2010, the FASB issued guidance to expand existing disclosures about the credit quality of financing receivables and the related allowance for credit losses. As a result of these amendments, an entity is required to disaggregate by portfolio segment or class certain existing disclosures and provide certain new disclosures about its financing receivables and related allowance for credit losses. For public entities, the disclosures as of the end of a reporting period are effective for interim and annual reporting periods ending on or after December 15, 2010. The disclosures about activity that occurs during a reporting period are effective for interim and annual reporting periods beginning on or after December 15, 2010. The Company adopted this new guidance on December 15, 2010 with no material impact to the consolidated financial statements.
In October 2010, the FASB issued guidance that modifies the types of costs incurred by insurance entities that can be capitalized when issuing or renewing insurance contracts. The guidance requires costs to be incremental or directly related to the successful acquisition of new or renewal contracts in order to be capitalized as a deferred acquisition cost. This guidance will be effective for interim and annual periods beginning after December 15, 2011, with either prospective or retrospective application permitted. The Company is currently evaluating this new guidance and its materiality to the consolidated financial statements.
All other new accounting standards and updates of existing standards issued during 2010 did not relate to accounting policies and procedures pertinent to the Company at this time.
Other Regulatory Activity
Health Care Reform
The Company has assessed, based upon the information available, the Affordable Care Act, as passed in the first quarter of 2010. The Company has considered its medical and dental plans provided for employees, agents and retirees. While the Company will incur additional costs associated with the implementation of this Act, it does not believe these costs or ongoing costs associated with this Act will have a material impact to the consolidated financial statements. The Company does not provide a separate prescription drug plan to its retirees. In addition, the Company does not sell any medical insurance or prescription drug coverage. However, the Company does sell dental and vision insurance but believes that the impact of this Act is immaterial to these products. The Company will continue to assess the information contained in this Act as additional guidance becomes available and as additional implications are understood or clarified.
103
Table of Contents
Kansas City Life Insurance Company
Notes to Consolidated Financial Statements–(Continued)
Financial Reform
The Dodd-Frank Wall Street Reform and Consumer Protection Act was passed in July of 2010. This Act focuses on financial reform, specifically changes to derivatives regulation, regulatory framework for executive pay, corporate governance, investor protection, clawback provisions, mortgage reform, and numerous other issues. The Company will continue to assess the information contained in this Bill as additional guidance becomes available and as additional implications are clarified. The Company expects that additional disclosures will become required and additional costs may be associated with this Act. However, the Company does not believe they will have a material impact to the consolidated financial statements.
2. Fair Value Measurements
Fair Values Hierarchy
The Company groups its financial assets and liabilities measured at fair value in three levels, based on the inputs and assumptions used to determine the fair value. These levels are as follows:
Level 1 – Valuations are based upon quoted prices for identical instruments traded in active markets.
Level 2 – Valuations are based upon quoted prices for similar instruments in active markets, quoted prices for identical or similar instruments in markets that are not active, and model-based valuation techniques for which all significant assumptions are observable in the market. Valuations are obtained from third-party pricing services or inputs that are observable or derived principally from or corroborated by observable market data.
Level 3 – Valuations are generated from techniques that use significant assumptions not observable in the market. These unobservable assumptions reflect the Company’s assumptions that market participants would use in pricing the asset or liability. Valuation techniques include the use of discounted cash flow models, spread-based models, and similar techniques, using the best information available in the circumstances.
Determination of Fair Value
Under U.S. GAAP, fair value represents the price that would be received to sell an asset (exit price) or paid to transfer a liability in an orderly transaction between market participants at the measurement date. It is the Company’s policy to maximize the use of observable inputs and minimize the use of unobservable inputs when developing fair value measurements. Accordingly, the Company utilizes a primary independent third-party pricing service to determine the majority of its fair values on investment securities available for sale. At December 31, 2010, the Company used a second independent third-party pricing service to validate the fair market values provided by the primary pricing service. The Company also used the second pricing service to determine the fair value of certain securities for which the primary pricing service was unable to provide.
The Company reviews prices received from service providers for unusual fluctuations but generally accepts the price identified from the primary pricing service. However, if the primary pricing service does not provide a price, the Company utilizes the price provided by the second pricing service if a price is available. In the event a price is not available from either third-party pricing service, the Company pursues external pricing from brokers. Generally, the Company pursues and utilizes only one broker quote per security. In doing so, the Company solicits only brokers which have previously demonstrated knowledge and experience of the subject security. If a broker price is not available, the Company determines a carrying value through various valuation techniques that may include discounted cash flows, spread-based models or similar techniques depending upon the specific security to be priced. These techniques are primarily applied to private placement securities. The Company utilizes available market information, wherever possible, to identify inputs into the fair value determination, primarily including prices and spreads on comparable securities.
The Company performs an analysis on the prices received from third-party security pricing services and independent brokers to ensure that the prices represent a reasonable estimate of the fair value. The Company corroborates and validates the primary pricing sources through a variety of procedures that include but are not limited to comparison to additional independent third-party pricing services or brokers, where possible, a review of third-party pricing service methodologies, back testing and comparison of prices to actual trades for specific securities where observable data exists. In addition, the Company analyzes the primary third-party pricing service’s methodologies and related inputs and also evaluates the various types of securities in its investment portfolio to determine an appropriate fair value hierarchy.
Fair value measurements for assets and liabilities where there exists limited or no observable market data are calculated using the Company’s own estimates, based on current interest rates, credit spreads, liquidity premium or discount, the economic and competitive environment, unique characteristics of the asset or liability and other pertinent factors. Therefore, the results cannot be determined with precision and may not be realized in an actual sale or immediate settlement of the asset or liability. Additionally, there may be inherent weaknesses in any calculation technique. Further, changes in the underlying assumptions used, including discount rates and estimates of future cash flows, could significantly affect the results of current or future values.
104
Table of Contents
Kansas City Life Insurance Company
Notes to Consolidated Financial Statements–(Continued)
The Company’s own estimates of fair value are derived in a number of ways, including but not limited to: 1) pricing provided by brokers, where the price indicates reliability as to value; 2) fair values of comparable securities, incorporating a spread adjustment for maturity differences, collateralization, credit quality, liquidity and other items, if applicable; 3) discounted cash flow models and margin spreads; 4) bond yield curves; 5) observable market prices and exchange transaction information not provided by external pricing services; and 6) statement values provided to the Company by fund managers.
Following is a description of valuation methodologies used for assets and liabilities recorded at fair value and for estimating fair value for financial instruments not recorded at fair value but for which fair value is disclosed.
Assets
Securities Available for Sale
Fixed maturities and equity securities available for sale are recorded at fair value on a recurring basis. Fair value measurement is based upon quoted prices, if available. If quoted prices are not available, fair values are determined as described in the preceding paragraphs.
Short-Term Financial Assets
Short-term financial assets include cash and other short-term investments and are carried at historical cost. The carrying amount is a reasonable estimate of the fair value because of the relatively short time between the purchase of the instrument and its expected repayment or maturity.
Loans
The Company does not record loans at fair value. As such, valuation techniques discussed herein for loans are primarily for estimating fair value for purpose of disclosure.
Fair values of mortgage loans on real estate properties are calculated by discounting contractual cash flows, using discount rates based on current industry pricing or the Company’s estimate of an appropriate risk-adjusted discount rate for loans of similar size, type, remaining maturity, likelihood of prepayment, and repricing characteristics.
The Company also has loans made to policyholders. These loans cannot exceed the cash surrender value of the policy. Fair value is calculated by discounting contractual cash flows, using discount rates based on the Company’s estimate of appropriate risk-adjusted discount rates for these loans.
Liabilities
Investment-Type Liabilities Included in Policyholder Account Balances and Other Policyholder Funds
Fair values for liabilities under investment-type insurance contracts are based upon account value. The fair values of investment-type insurance contracts included with policyholder account balances for fixed deferred annuities and other policyholder funds for supplementary contracts without life contingencies are estimated to be their cash surrender values. The fair values of deposits with no stated maturity are equal to the amount payable on demand at the measurement date.
Guaranteed Minimum Withdrawal Benefits (GMWB)
The Company offers a GMWB rider that can be added to new or existing variable annuity contracts. The rider provides an enhanced withdrawal benefit that guarantees a stream of income payments to an owner or annuitant, regardless of the contract account value. Fair value for GMWB rider contracts results in a Level 3 valuation, as it is based on models which utilize significant unobservable inputs. These models require actuarial and financial market assumptions, which reflect the assumptions market participants would use in pricing the contract, including adjustments for risk and issuer non-performance.
Notes Payable
The Company had no borrowings at December 31, 2010 or December 31, 2009.
105
Table of Contents
Kansas City Life Insurance Company
Notes to Consolidated Financial Statements–(Continued)
Categories Reported at Fair Value
The following tables present categories reported at fair value on a recurring basis.
| December 31, 2010 | ||||||||||||||||
| Assets: | Level 1 | Level 2 | Level 3 | Total | ||||||||||||
| U.S. Treasury securities and obligations of U.S. Government |
$ | 11,544 | $ | 119,624 | $ | 3,974 | $ | 135,142 | ||||||||
| Federal agencies 1 |
- | 26,095 | - | 26,095 | ||||||||||||
| Federal agency issued residential mortgage-backed securities 1 |
- | 138,056 | - | 138,056 | ||||||||||||
| Subtotal |
11,544 | 283,775 | 3,974 | 299,293 | ||||||||||||
| Corporate obligations: |
||||||||||||||||
| Industrial |
- | 430,283 | 2,235 | 432,518 | ||||||||||||
| Energy |
- | 176,220 | 2,291 | 178,511 | ||||||||||||
| Communications and technology |
- | 172,946 | - | 172,946 | ||||||||||||
| Financial |
- | 347,884 | 2,775 | 350,659 | ||||||||||||
| Consumer |
- | 408,592 | 21,912 | 430,504 | ||||||||||||
| Public utilities |
- | 324,800 | - | 324,800 | ||||||||||||
| Subtotal |
- | 1,860,725 | 29,213 | 1,889,938 | ||||||||||||
| Corporate private-labeled residential mortgage-backed securities |
- | 195,055 | - | 195,055 | ||||||||||||
| Municipal securities |
146,083 | 5,748 | 151,831 | |||||||||||||
| Other |
- | 81,136 | 16,866 | 98,002 | ||||||||||||
| Redeemable preferred stocks |
14,769 | - | - | 14,769 | ||||||||||||
| Fixed maturity securities |
26,313 | 2,566,774 | 55,801 | 2,648,888 | ||||||||||||
| Equity securities |
3,871 | 33,270 | 1,180 | 38,321 | ||||||||||||
| Total |
$ | 30,184 | $ | 2,600,044 | $ | 56,981 | $ | 2,687,209 | ||||||||
| Percent of Total |
1% | 97% | 2% | 100% | ||||||||||||
| Liabilities: |
||||||||||||||||
| Other policyholder funds |
||||||||||||||||
| Guaranteed minimum withdrawal benefits |
$ | - | $ | - | $ | (2,799 | ) | $ | (2,799 | ) | ||||||
| Total |
$ | - | $ | - | $ | (2,799 | ) | $ | (2,799 | ) | ||||||
| 1 | Federal agency securities are not backed by the full faith and credit of the U.S. Government. |
106
Table of Contents
Kansas City Life Insurance Company
Notes to Consolidated Financial Statements–(Continued)
| December 31, 2009 | ||||||||||||||||
| Assets: | Level 1 | Level 2 | Level 3 | Total | ||||||||||||
| U.S. Treasury securities and obligations of U.S. Government |
$ | 9,939 | $ | 98,383 | $ | 14,275 | $ | 122,597 | ||||||||
| Federal agencies 1 |
- | 28,321 | - | 28,321 | ||||||||||||
| Federal agency issued residential mortgage-backed securities 1 |
- | 175,858 | - | 175,858 | ||||||||||||
| Subtotal |
9,939 | 302,562 | 14,275 | 326,776 | ||||||||||||
| Corporate obligations: |
||||||||||||||||
| Industrial |
- | 362,735 | 3,654 | 366,389 | ||||||||||||
| Energy |
- | 172,167 | - | 172,167 | ||||||||||||
| Communications and technology |
- | 136,076 | - | 136,076 | ||||||||||||
| Financial |
- | 336,781 | 2,840 | 339,621 | ||||||||||||
| Consumer |
- | 348,981 | 22,596 | 371,577 | ||||||||||||
| Public utilities |
- | 313,871 | - | 313,871 | ||||||||||||
| Subtotal |
- | 1,670,611 | 29,090 | 1,699,701 | ||||||||||||
| Corporate private-labeled residential mortgage-backed securities |
- | 196,660 | - | 196,660 | ||||||||||||
| Municipal securities |
- | 48,056 | 6,386 | 54,442 | ||||||||||||
| Other |
- | 175,369 | 2,723 | 178,092 | ||||||||||||
| Redeemable preferred stocks |
13,601 | - | - | 13,601 | ||||||||||||
| Fixed maturity securities |
23,540 | 2,393,258 | 52,474 | 2,469,272 | ||||||||||||
| Equity securities |
3,400 | 32,439 | 1,037 | 36,876 | ||||||||||||
| Total |
$ | 26,940 | $ | 2,425,697 | $ | 53,511 | $ | 2,506,148 | ||||||||
| Percent of Total |
1% | 97% | 2% | 100% | ||||||||||||
| Liabilities: |
||||||||||||||||
| Other policyholder funds |
||||||||||||||||
| Guaranteed minimum withdrawal benefits |
$ | - | $ | - | $ | (1,642 | ) | $ | (1,642 | ) | ||||||
| Total |
$ | - | $ | - | $ | (1,642 | ) | $ | (1,642 | ) | ||||||
| 1 | Federal agency securities are not backed by the full faith and credit of the U.S. Government. |
The following table presents the fair value of fixed maturities and equity securities available for sale by pricing source and fair value hierarchy level.
| December 31, 2010 | ||||||||||||||||
| Level 1 | Level 2 | Level 3 | Total | |||||||||||||
| Fixed maturities available for sale: |
||||||||||||||||
| Priced from external pricing services |
$ | 26,313 | $ | 2,537,287 | $ | - | $ | 2,563,600 | ||||||||
| Priced from independent broker quotations |
- | 29,487 | - | 29,487 | ||||||||||||
| Priced from internal matrices and calculations |
- | - | 55,801 | 55,801 | ||||||||||||
| Subtotal |
26,313 | 2,566,774 | 55,801 | 2,648,888 | ||||||||||||
| Equity securities available for sale: |
||||||||||||||||
| Priced from external pricing services |
3,871 | 7,125 | - | 10,996 | ||||||||||||
| Priced from independent broker quotations |
- | - | - | - | ||||||||||||
| Priced from internal matrices and calculations |
- | 26,145 | 1,180 | 27,325 | ||||||||||||
| Subtotal |
3,871 | 33,270 | 1,180 | 38,321 | ||||||||||||
| Total |
$ | 30,184 | $ | 2,600,044 | $ | 56,981 | $ | 2,687,209 | ||||||||
| Percent of Total |
1% | 97% | 2% | 100% | ||||||||||||
107
Table of Contents
Kansas City Life Insurance Company
Notes to Consolidated Financial Statements–(Continued)
| December 31, 2009 | ||||||||||||||||
| Level 1 | Level 2 | Level 3 | Total | |||||||||||||
| Fixed maturities available for sale: |
||||||||||||||||
| Priced from external pricing services |
$ | 23,540 | $ | 2,277,303 | $ | - | $ | 2,300,843 | ||||||||
| Priced from independent broker quotations |
- | 111,587 | - | 111,587 | ||||||||||||
| Priced from internal matrices and calculations |
- | 4,368 | 52,474 | 56,842 | ||||||||||||
| Subtotal |
23,540 | 2,393,258 | 52,474 | 2,469,272 | ||||||||||||
| Equity securities available for sale: |
||||||||||||||||
| Priced from external pricing services |
3,400 | 7,419 | - | 10,819 | ||||||||||||
| Priced from independent broker quotations |
- | - | - | - | ||||||||||||
| Priced from internal matrices and calculations |
- | 25,020 | 1,037 | 26,057 | ||||||||||||
| Subtotal |
3,400 | 32,439 | 1,037 | 36,876 | ||||||||||||
| Total |
$ | 26,940 | $ | 2,425,697 | $ | 53,511 | $ | 2,506,148 | ||||||||
| Percent of Total |
1% | 97% | 2% | 100% | ||||||||||||
The changes in Level 1 assets measured at fair value on a recurring basis for the year ended December 31, 2010 are summarized below:
| 2010 | ||||||||||||||||||||||||||||
| Beginning Balance as of December 31, 2009 |
Included in Earnings |
Included in Other Comprehensive Income (Loss) |
Purchases and Dispositions |
Net Transfers In (Out) |
Ending Balance as of December 31, 2010 |
Net Unrealized Gains (Losses) at December 31, 2010 |
||||||||||||||||||||||
| Assets: |
||||||||||||||||||||||||||||
| Fixed maturities available for sale |
$ | 23,540 | $ | (5 | ) | $ | 1,335 | $ | 145 | $ | 1,298 | $ | 26,313 | $ | 1,469 | |||||||||||||
| Equity securities available for sale |
3,400 | - | 298 | 173 | - | 3,871 | 298 | |||||||||||||||||||||
| Total |
$ | 26,940 | $ | (5 | ) | $ | 1,633 | $ | 318 | $ | 1,298 | $ | 30,184 | $ | 1,767 | |||||||||||||
The changes in Level 2 assets measured at fair value on a recurring basis for the year ended December 31, 2010 are summarized below:
| 2010 | ||||||||||||||||||||||||||||
| Beginning Balance as of December 31, 2009 |
Included in Earnings |
Included in Other Comprehensive Income (Loss) |
Purchases and Dispositions |
Net Transfers In (Out) |
Ending Balance as of December 31, 2010 |
Net Unrealized Gains (Losses) at December 31, 2010 |
||||||||||||||||||||||
| Assets: |
||||||||||||||||||||||||||||
| Fixed maturities available for sale |
$ | 2,393,258 | $ | 254 | $ | 107,131 | $ | 72,999 | $ | (6,868 | ) | $ | 2,566,774 | $ | 103,635 | |||||||||||||
| Equity securities available for sale |
32,439 | 2 | 116 | 713 | - | 33,270 | 189 | |||||||||||||||||||||
| Total |
$ | 2,425,697 | $ | 256 | $ | 107,247 | $ | 73,712 | $ | (6,868 | ) | $ | 2,600,044 | $ | 103,824 | |||||||||||||
108
Table of Contents
Kansas City Life Insurance Company
Notes to Consolidated Financial Statements–(Continued)
The changes in Level 3 assets and liabilities measured at fair value on a recurring basis for the years ended December 31 are summarized below:
| 2010 | ||||||||||||||||||||||||||||
| Beginning Balance as of December 31, 2009 |
Included in Earnings |
Included in Other Comprehensive Income (Loss) |
Purchases and Dispositions |
Net Transfers In (Out) |
Ending Balance as of December 31, 2010 |
Net Unrealized Gains (Losses) at December 31, 2010 |
||||||||||||||||||||||
| Assets: |
||||||||||||||||||||||||||||
| Fixed maturities available for sale |
$ | 52,474 | $ | (4 | ) | $ | 920 | $ | (3,159 | ) | $ | 5,570 | $ | 55,801 | $ | 922 | ||||||||||||
| Equity securities available for sale |
1,037 | - | 143 | - | - | 1,180 | 143 | |||||||||||||||||||||
| Total |
$ | 53,511 | $ | (4 | ) | $ | 1,063 | $ | (3,159 | ) | $ | 5,570 | $ | 56,981 | $ | 1,065 | ||||||||||||
| 2009 | ||||||||||||||||||||||||||||
| Beginning Balance as of December 31, 2008 |
Included in Earnings |
Included in Other Comprehensive Income (Loss) |
Purchases and Dispositions |
Net Transfers In (Out) |
Ending Balance as of December 31, 2009 |
Net Unrealized Gains (Losses) at December 31, 2009 |
||||||||||||||||||||||
| Assets: |
||||||||||||||||||||||||||||
| Fixed maturities available for sale |
$ | 89,499 | $ | (1,172 | ) | $ | 3,100 | $ | (1,985 | ) | $ | (36,968 | ) | $ | 52,474 | $ | 2,533 | |||||||||||
| Equity securities available for sale |
- | - | 229 | - | 808 | 1,037 | 228 | |||||||||||||||||||||
| Total |
$ | 89,499 | $ | (1,172 | ) | $ | 3,329 | $ | (1,985 | ) | $ | (36,160 | ) | $ | 53,511 | $ | 2,761 | |||||||||||
The Company had $18.6 million transfers into Level 3 and $13.0 million transfers out of Level 3 for the year ended December 31, 2010. The Company did not exclude any realized or unrealized gains or losses on items transferred into Level 3. Depending upon the availability of Level 1 or Level 2 pricing, specific securities may transfer into or out of Level 3.
The table below is a summary of fair value estimates as of December 31, 2010 and December 31, 2009 for financial instruments. The Company has not included assets and liabilities that are not financial instruments in this disclosure. The total of the fair value calculations presented do not represent, and should not be construed to represent, the underlying value of the Company.
| December 31, 2010 | December 31, 2009 | |||||||||||||||
| Carrying Value |
Fair Value |
Carrying Value |
Fair Value |
|||||||||||||
| Assets: |
||||||||||||||||
| Investments: |
||||||||||||||||
| Fixed maturities available for sale |
$ | 2,648,888 | $ | 2,648,888 | $ | 2,469,272 | $ | 2,469,272 | ||||||||
| Equity securities available for sale |
38,321 | 38,321 | 36,876 | 36,876 | ||||||||||||
| Mortgage loans |
559,167 | 593,418 | 457,582 | 456,819 | ||||||||||||
| Policy loans |
84,281 | 84,281 | 85,585 | 85,585 | ||||||||||||
| Cash and short-term investments |
21,158 | 21,158 | 143,685 | 143,685 | ||||||||||||
| Separate account assets |
339,029 | 339,029 | 312,824 | 312,824 | ||||||||||||
| Liabilities: |
||||||||||||||||
| Individual and group annuities |
1,037,331 | 1,017,135 | 999,500 | 977,573 | ||||||||||||
| Supplementary contracts without life contingencies |
58,012 | 56,514 | 59,399 | 57,023 | ||||||||||||
| Separate account liabilities |
339,029 | 339,029 | 312,824 | 312,824 | ||||||||||||
109
Table of Contents
Kansas City Life Insurance Company
Notes to Consolidated Financial Statements–(Continued)
3. Investments
Investment Revenues
The following table provides investment revenues by major category for the years ended December 31.
| 2010 | 2009 | 2008 | ||||||||||
| Net investment income: |
||||||||||||
| Fixed maturity securities |
$ | 140,600 | $ | 143,514 | $ | 147,600 | ||||||
| Equity securities |
1,636 | 2,822 | (2,599 | ) | ||||||||
| Mortgage loans |
31,261 | 29,361 | 29,735 | |||||||||
| Real estate |
6,840 | 5,673 | 5,678 | |||||||||
| Policy loans |
5,827 | 5,897 | 6,210 | |||||||||
| Short-term investments |
177 | 272 | 1,043 | |||||||||
| Other |
652 | 436 | 673 | |||||||||
| 186,993 | 187,975 | 188,340 | ||||||||||
| Less investment expenses |
(11,134 | ) | (10,547 | ) | (10,921 | ) | ||||||
| $ | 175,859 | $ | 177,428 | $ | 177,419 | |||||||
The following table provides realized investment gains (losses) and net impairment losses by major category for the years ended December 31. Realized gains and losses on the sale of investments are determined on the basis of specific security identification.
| 2010 | 2009 | 2008 | ||||||||||
| Realized investment gains (losses): |
||||||||||||
| Fixed maturity securities |
$ | 542 | $ | (9,685 | ) | $ | (50,682 | ) | ||||
| Equity securities |
2 | 903 | (10,173 | ) | ||||||||
| Real estate |
- | (1,453 | ) | 5,154 | ||||||||
| 544 | (10,235 | ) | (55,701 | ) | ||||||||
| Amortization of DAC and VOBA |
(9 | ) | 159 | 3,430 | ||||||||
| $ | 535 | $ | (10,076 | ) | $ | (52,271 | ) | |||||
Contractual Maturities
The following tables provide the distribution of maturities for fixed maturity securities available for sale as of December 31. Expected maturities may differ from these contractual maturities since borrowers may have the right to call or prepay obligations.
| December 31, 2010 | ||||||||
| Amortized Cost |
Fair Value |
|||||||
| Due in one year or less |
$ | 93,283 | $ | 95,392 | ||||
| Due after one year through five years |
590,868 | 625,121 | ||||||
| Due after five years through ten years |
884,404 | 948,239 | ||||||
| Due after ten years |
523,608 | 530,365 | ||||||
| Securities with variable principal payments |
433,696 | 435,002 | ||||||
| Redeemable preferred stocks |
14,866 | 14,769 | ||||||
| $ | 2,540,725 | $ | 2,648,888 | |||||
110
Table of Contents
Kansas City Life Insurance Company
Notes to Consolidated Financial Statements–(Continued)
| December 31, 2009 | ||||||||
| Amortized Cost |
Fair Value |
|||||||
| Due in one year or less |
$ | 88,137 | $ | 89,563 | ||||
| Due after one year through five years |
524,283 | 544,819 | ||||||
| Due after five years through ten years |
816,117 | 842,457 | ||||||
| Due after ten years |
521,780 | 505,466 | ||||||
| Securities with variable principal payments |
505,333 | 473,366 | ||||||
| Redeemable preferred stocks |
14,866 | 13,601 | ||||||
| $ | 2,470,516 | $ | 2,469,272 | |||||
111
Table of Contents
Kansas City Life Insurance Company
Notes to Consolidated Financial Statements–(Continued)
Realized Gains (Losses)
The following table provides detail concerning realized investment gains and losses by asset class for the three years ended December 31.
| 2010 | 2009 | 2008 | ||||||||||
| Gross gains resulting from: |
||||||||||||
| Sales of investment securities: |
||||||||||||
| Federal agencies |
$ | 51 | $ | 1,381 | $ | - | ||||||
| Federal agency issued residential mortgage-backed securities 1 |
- | 261 | - | |||||||||
| Corporate obligations: |
||||||||||||
| Industrial |
342 | 2,454 | - | |||||||||
| Communications and technology |
315 | 1,006 | 573 | |||||||||
| Financial |
258 | 3,162 | - | |||||||||
| Consumer |
981 | 1,390 | 35 | |||||||||
| Public utility |
- | 232 | 45 | |||||||||
| Municipal securities |
53 | - | - | |||||||||
| Other |
545 | - | - | |||||||||
| Investment securities called and other: |
||||||||||||
| Federal agencies |
77 | 191 | 416 | |||||||||
| Corporate obligations: |
||||||||||||
| Industrial |
817 | 149 | 18 | |||||||||
| Energy |
53 | - | 1,020 | |||||||||
| Communications and technology |
586 | 5 | 35 | |||||||||
| Consumer |
92 | 38 | - | |||||||||
| Public utility |
44 | - | 372 | |||||||||
| Corporate private-labeled residential mortgage-backed securities |
34 | 1 | - | |||||||||
| Other |
436 | 290 | 439 | |||||||||
| Sales of real estate |
- | 661 | 5,154 | |||||||||
| Total gross gains |
4,684 | 11,221 | 8,107 | |||||||||
| Gross losses resulting from: |
||||||||||||
| Sales of investment securities |
||||||||||||
| Corporate obligations: |
||||||||||||
| Industrial |
- | (21 | ) | (445 | ) | |||||||
| Communications and technology |
(63 | ) | - | - | ||||||||
| Financial |
- | (290 | ) | (510 | ) | |||||||
| Consumer |
- | (2 | ) | (160 | ) | |||||||
| Municipal securities |
(4 | ) | - | - | ||||||||
| Investment securities called and other: |
||||||||||||
| Financial |
- | (73 | ) | - | ||||||||
| Other |
(253 | ) | (15 | ) | - | |||||||
| Total gross losses |
(320 | ) | (401 | ) | (1,115 | ) | ||||||
| Amortization of DAC and VOBA |
(9 | ) | 159 | 3,430 | ||||||||
| Realized investment gains, excluding impairment losses |
$ | 4,355 | $ | 10,979 | $ | 10,422 | ||||||
112
Table of Contents
Kansas City Life Insurance Company
Notes to Consolidated Financial Statements–(Continued)
| 2010 | 2009 | 2008 | ||||||||||
| Net other-than-temporary impairment losses recognized in earnings: |
||||||||||||
| Federal agencies |
$ | - | $ | - | $ | (6,803 | ) | |||||
| Corporate obligations: |
||||||||||||
| Industrial |
- | (4,886 | ) | (2,105 | ) | |||||||
| Communications and technology |
- | (1,239 | ) | (3,273 | ) | |||||||
| Financial |
- | (12,466 | ) | (27,142 | ) | |||||||
| Consumer |
- | (1,697 | ) | (6,051 | ) | |||||||
| Corporate private-labeled residential mortgage-backed securities |
(1,821 | ) | (14,403 | ) | (4,164 | ) | ||||||
| Municipal securities |
(65 | ) | - | - | ||||||||
| Other |
(2,243 | ) | (320 | ) | (13,155 | ) | ||||||
| Real estate |
- | (2,114 | ) | - | ||||||||
| Total other-than-temporary impairment losses |
(4,129 | ) | (37,125 | ) | (62,693 | ) | ||||||
| Portion of impairment losses recognized in other comprehensive income (loss): |
||||||||||||
| Corporate obligations: |
||||||||||||
| Industrial |
- | 1,676 | - | |||||||||
| Financial |
- | 764 | - | |||||||||
| Consumer |
- | 462 | - | |||||||||
| Corporate private-labeled residential mortgage-backed securities |
317 | 13,124 | - | |||||||||
| Other |
(8 | ) | 44 | - | ||||||||
| Net impairment losses recognized in earnings |
(3,820 | ) | (21,055 | ) | (62,693 | ) | ||||||
| Realized investment gains (losses) |
$ | 535 | $ | (10,076 | ) | $ | (52,271 | ) | ||||
| 1 | Federal agency securities are not backed by the full faith and credit of the U.S. Government. |
113
Table of Contents
Kansas City Life Insurance Company
Notes to Consolidated Financial Statements–(Continued)
The following table provides amortized cost and fair value of securities by asset class at December 31, 2010.
| Amortized Cost |
Gross Unrealized |
Fair Value |
||||||||||||||
| Gains | Losses | |||||||||||||||
| U.S. Treasury securities and obligations of U.S. Government |
$ | 128,280 | $ | 7,180 | $ | 318 | $ | 135,142 | ||||||||
| Federal agencies 1 |
24,144 | 1,951 | - | 26,095 | ||||||||||||
| Federal agency issued residential mortgage-backed securities 1 |
128,318 | 9,740 | 2 | 138,056 | ||||||||||||
| Subtotal |
280,742 | 18,871 | 320 | 299,293 | ||||||||||||
| Corporate obligations: |
||||||||||||||||
| Industrial |
409,193 | 26,255 | 2,930 | 432,518 | ||||||||||||
| Energy |
163,237 | 15,498 | 224 | 178,511 | ||||||||||||
| Communications and technology |
164,499 | 9,243 | 796 | 172,946 | ||||||||||||
| Financial |
341,520 | 14,161 | 5,022 | 350,659 | ||||||||||||
| Consumer |
404,152 | 28,725 | 2,373 | 430,504 | ||||||||||||
| Public utilities |
298,626 | 27,640 | 1,466 | 324,800 | ||||||||||||
| Subtotal |
1,781,227 | 121,522 | 12,811 | 1,889,938 | ||||||||||||
| Corporate private-labeled residential mortgage-backed securities |
209,529 | 2,352 | 16,826 | 195,055 | ||||||||||||
| Municipal securities |
153,813 | 1,319 | 3,301 | 151,831 | ||||||||||||
| Other |
100,548 | 5,193 | 7,739 | 98,002 | ||||||||||||
| Redeemable preferred stocks |
14,866 | 343 | 440 | 14,769 | ||||||||||||
| Fixed maturity securities |
2,540,725 | 149,600 | 41,437 | 2,648,888 | ||||||||||||
| Equity securities |
36,293 | 2,165 | 137 | 38,321 | ||||||||||||
| Total |
$ | 2,577,018 | $ | 151,765 | $ | 41,574 | $ | 2,687,209 | ||||||||
| 1 | Federal agency securities are not backed by the full faith and credit of the U.S. Government. |
114
Table of Contents
Kansas City Life Insurance Company
Notes to Consolidated Financial Statements–(Continued)
The following table provides amortized cost and fair value for securities by asset class at December 31, 2009.
| Amortized Cost |
Gross Unrealized |
Fair Value |
||||||||||||||
| Gains | Losses | |||||||||||||||
| U.S. Treasury securities and obligations of U.S. Government |
$ | 118,863 | $ | 4,755 | $ | 1,021 | $ | 122,597 | ||||||||
| Federal agencies 1 |
27,640 | 681 | - | 28,321 | ||||||||||||
| Federal agency issued residential mortgage-backed securities1 |
168,439 | 7,474 | 55 | 175,858 | ||||||||||||
| Subtotal |
314,942 | 12,910 | 1,076 | 326,776 | ||||||||||||
| Corporate obligations: |
||||||||||||||||
| Industrial |
354,310 | 14,653 | 2,574 | 366,389 | ||||||||||||
| Energy |
163,336 | 9,562 | 731 | 172,167 | ||||||||||||
| Communications and technology |
131,929 | 5,933 | 1,786 | 136,076 | ||||||||||||
| Financial |
345,730 | 8,667 | 14,776 | 339,621 | ||||||||||||
| Consumer |
356,213 | 18,570 | 3,206 | 371,577 | ||||||||||||
| Public utilities |
299,573 | 16,888 | 2,590 | 313,871 | ||||||||||||
| Subtotal |
1,651,091 | 74,273 | 25,663 | 1,699,701 | ||||||||||||
| Corporate private-labeled residential mortgage-backed securities |
239,455 | 135 | 42,930 | 196,660 | ||||||||||||
| Municipal securities |
131,929 | 5,933 | 1,786 | 136,076 | ||||||||||||
| Other |
118,233 | (1,584 | ) | 20,191 | 96,458 | |||||||||||
| Redeemable preferred stocks |
14,866 | 98 | 1,363 | 13,601 | ||||||||||||
| Fixed maturity securities |
2,470,516 | 91,765 | 93,009 | 2,469,272 | ||||||||||||
| Equity securities |
35,405 | 1,657 | 186 | 36,876 | ||||||||||||
| Total |
$ | 2,505,921 | $ | 93,422 | $ | 93,195 | $ | 2,506,148 | ||||||||
| 1 | Federal agency securities are not backed by the full faith and credit of the U.S. Government. |
Unrealized Gains and Losses
The Company reviews all security investments, with particular attention given to those having unrealized losses. Further, the Company specifically assesses all investments with greater than 10% declines in fair value and, in general, monitors all security investments as to ongoing risk. These risks are fundamentally evaluated through both a qualitative and quantitative analysis of the issuer. The Company also prepares a formal review document no less often than quarterly of all investments where fair value is less than 80% of amortized cost for six months or more and selected investments that have changed significantly from a previous period and that have a decline in fair value greater than 10% of amortized cost.
The Company has a policy and process in place to identify securities that could potentially have an impairment that is other-than-temporary. This process involves monitoring market events and other items that could impact issuers. The evaluation includes but is not limited to such factors as the issuer’s stated intent and ability to make all principal and interest payments when due, near-term business prospects, cash flow and liquidity, credit ratings, business climate, management changes and litigation and government actions. This process also involves monitoring several factors, including late payments, downgrades by rating agencies, key financial ratios, financial statements, revenue forecasts, asset quality and cash flow projections, as indicators of credit issues.
The Company considers relevant facts and circumstances in evaluating whether the impairment of a security is other-than-temporary. Relevant facts and circumstances considered are described in the Valuation of Investments section of Note 1 – Nature of Operations and Significant Accounting Policies.
To the extent the Company determines that a fixed maturity security is deemed to be other-than-temporarily impaired, the portion of the impairment that is deemed to be due to credit is charged to the Consolidated Statements of Income and the cost basis of the underlying investment is reduced. The portion of the impairment that is deemed to be non-credit is charged to other comprehensive income (loss). Equity securities that are determined to be other-than-temporarily impaired are written down to fair value and the impairment is charged to the Consolidated Statements of Income.
115
Table of Contents
Kansas City Life Insurance Company
Notes to Consolidated Financial Statements–(Continued)
There are a number of significant risks and uncertainties inherent in the process of monitoring impairments, determining if an impairment is other-than-temporary and determining the portion of an other-than-temporary impairment that is due to credit. These risks and uncertainties are described in the Valuation of Investments Section of Note 1.
At December 31, 2010, the Company had gross unrealized losses of $41.6 million on investment securities, including fixed maturity and equity securities that had a fair value of $589.1 million. In addition, included in the gross unrealized losses are securities that the Company determined had other-than-temporary impairments. Accordingly, the Company bifurcated these impairments between credit and non-credit impairments. As identified in the Consolidated Statements of Income, the Company had non-credit impairments recognized in other comprehensive income (loss) of $0.3 million and $16.1 million on securities considered to be impaired for the years ended December31, 2010 and 2009, respectively. As of December 31, 2009, the Company had gross unrealized losses of $93.2 million on investment securities, including fixed maturity and equity securities that had a fair value of $814.4 million. The decrease in unrealized losses was primarily attributable to lower interest rates, along with decreased credit and liquidity risk discounts in the pricing of financial assets. Although these changes affected the broad financial markets, specific sectors, security issuers and security issues were affected differently.
Once a security is determined to have met certain of the criteria for consideration as being other-than-temporarily impaired, further information is gathered and evaluated pertaining to the particular security. If the security is an unsecured obligation, the additional research is a top-down approach with particular emphasis on the likelihood of the issuer to meet the contractual terms of the obligation. If the security is secured by an asset or guaranteed by another party, the value of the underlying secured asset or the financial ability of the third-party guarantor is evaluated as a secondary source of repayment. Such research is based upon a top-down approach, narrowing to the specific estimates of value and cash flow of the underlying secured asset or guarantor. If the security is a collateralized obligation, such as a mortgage-backed or other asset-backed instrument, research is also conducted to obtain and analyze the performance of the collateral relative to expectations at the time of acquisition and with regard to projections for the future. Such analyses are based upon historical results, trends, comparisons to collateral performance of similar securities and analyses performed by third parties. This information is used to develop projected cash flows that are compared to the amortized cost of the security.
If a determination is made that an unsecured security, secured security or security with a guaranty of payment by a third-party is other-than-temporarily impaired, an estimate is developed of the portion of such impairment that is due to credit. The estimate of the portion of impairment due to credit is based upon a comparison of ratings and maturity horizon for the security and relative historical default probabilities from one or more nationally recognized rating organizations. When appropriate for any given security, sector or period in the business cycle, the historical default probability is adjusted to reflect periods or situations of distress by adding to the default probability increments of standard deviations from mean historical results. The credit impairment analysis is supplemented by estimates of potential recovery values for the specific security, including the potential impact of the value of any secured assets, in the event of default. This information is used to determine the Company’s best estimate, derived from probability-weighted cash flows.
The Company has exposure to the municipal bond market. The Company’s investments in municipal bonds present unique considerations in evaluating other-than-temporary impairments. Judgments regarding whether a municipal debt security is other-than-temporarily impaired include analyzing a number of rather unique characteristics pertaining to the issuer. Municipalities possess unique powers, along with special legal standing and protections. These powers include the sovereign power to tax, access to one-time revenue sources, capacity to issue or restructure debt and the ability to shift spending to other authorities. In addition, state governments often provide secondary support to local governments in times of financial stress and the federal government has also provided assistance to state governments as well.
The evaluation of loan-backed and similar asset-backed securities, particularly including residential mortgage-backed securities, with significant indications of potential other-than-temporary impairment requires considerable use of estimates and judgment. Specifically, the Company performs discounted cash flow projections on these securities to evaluate whether the value of the investment is expected to be fully realized. Projections of expected future cash flows are based upon considerations of the performance of the actual underlying assets, including historical delinquencies, defaults, severity of losses incurred, and prepayments, along with the Company’s estimates of future results for these factors. The Company’s estimates of future results are based upon actual historical performance of the underlying assets relative to historical, current and expected general economic conditions, specific conditions related to the underlying assets, industry data, and other factors that are believed to be relevant. If the present value of the projected expected future cash flows are determined to be below the Company’s carrying value, the Company recognizes an other-than-temporary impairment on the portion of the carrying value that exceeds the projected expected future cash flows. To the extent that the loan-backed or other asset-backed securities remain high quality investments and do not otherwise demonstrate characteristics of impairment, the Company performs other initial evaluations to determine whether other-than-temporary cash flow evaluations need to be performed.
116
Table of Contents
Kansas City Life Insurance Company
Notes to Consolidated Financial Statements–(Continued)
The discounted future cash flow calculation typically becomes the primary determinant of whether any portion and to what extent an unrealized loss is due to credit on loan-backed and similar asset-backed securities with significant indications of potential other-than-temporary impairment. Such indications typically include below investment grade ratings and significant unrealized losses for an extended period of time, among other factors. The Company identified 12 and 13 non-U.S. Agency mortgage-backed securities that had such indications as of December 31, 2010 and December 31, 2009, respectively. Discounted future cash flow analysis was performed for each of these securities to determine if any portion of the impairment was due to credit and deemed to be other-than-temporary. The discount rate used in calculating the present value of future cash flows was the investment yield at the time of purchase for each security. The initial default rates were assumed to remain constant over a 24-month time frame and grade down thereafter, reflecting the general perspective of a more stabilized residential housing environment in the future.
The determination of any amount of impairment that is due to credit is based upon a comparison of the present value of the projected future cash flows on the security to the amortized cost. If any portion of the impairment is determined to be due to credit, based upon the present value of projected future cash flows being less than the amortized cost of the security, this amount is recognized as a realized loss in the Company’s Consolidated Statements of Income and the carrying value of the security is written down by the same amount. The portion of an impairment that is determined not to be due to credit is recorded as a component of accumulated other comprehensive income (loss) in the Consolidated Balance Sheets.
If the discounted cash flow for a collateralized security is determined to be less than the amortized cost, the difference is recorded as an other-than-temporary impairment due to credit in the Consolidated Statements of Income.
The total impairment for any security that is deemed to have an other-than-temporary impairment is recorded in the Consolidated Statements of Income as a net realized loss from investments. The portion of such impairment that is determined to be non-credit-related is deducted from net realized loss in the Consolidated Statements of Income and reflected in other comprehensive income (loss) and accumulated other comprehensive income (loss), which is a component of stockholders’ equity in the Consolidated Balance Sheets.
As part of the required accounting for unrealized gains and losses, the Company also adjusts the DAC and VOBA assets to recognize the adjustment to those assets as if the unrealized gains and losses from securities classified as available-for-sale actually had been realized.
The following table provides the net unrealized gains (losses) reported in accumulated other comprehensive income (loss) on the Company’s investments in securities available for sale, at December 31.
| 2010 | 2009 | 2008 | ||||||||||
| Net unrealized gains (losses) |
$ | 110,191 | $ | 227 | $ | (192,114 | ) | |||||
| Amounts resulting from: |
||||||||||||
| DAC and VOBA |
(35,538 | ) | 1,055 | 65,534 | ||||||||
| Policyholder account balances |
(7,430 | ) | - | - | ||||||||
| Deferred income taxes |
(23,528 | ) | (449 | ) | 44,303 | |||||||
| $ | 43,695 | $ | 833 | $ | (82,277 | ) | ||||||
The following table provides the change in the net unrealized gains (losses) reported in other comprehensive income (loss), net of tax.
| 2010 | 2009 | 2008 | ||||||||||
| Change in net unrealized gains (losses) during the year: |
||||||||||||
| Fixed maturity securities |
$ | 42,645 | $ | 82,208 | $ | (89,106 | ) | |||||
| Equity securities |
217 | 902 | (815 | ) | ||||||||
| $ | 42,862 | $ | 83,110 | $ | (89,921 | ) | ||||||
117
Table of Contents
Kansas City Life Insurance Company
Notes to Consolidated Financial Statements–(Continued)
The following table provides information regarding fixed maturity and equity security investments available for sale with unrealized losses by length of time as of December 31, 2010.
| Less Than 12 Months | 12 Months or Longer | Total | ||||||||||||||||||||||
| Fair Value |
Unrealized Losses |
Fair Value |
Unrealized Losses |
Fair Value |
Unrealized Losses |
|||||||||||||||||||
| U.S. Treasury securities and obligations of U.S. Government |
$ | 7,663 | $ | 286 | $ | 2,206 | $ | 32 | $ | 9,869 | $ | 318 | ||||||||||||
| Federal agency issued residential mortgage-backed securities 1 |
16 | 1 | 281 | 1 | 297 | 2 | ||||||||||||||||||
| Subtotal |
7,679 | 287 | 2,487 | 33 | 10,166 | 320 | ||||||||||||||||||
| Corporate obligations: |
||||||||||||||||||||||||
| Industrial |
76,795 | 2,825 | 3,023 | 105 | 79,818 | 2,930 | ||||||||||||||||||
| Energy |
7,848 | 224 | - | - | 7,848 | 224 | ||||||||||||||||||
| Communications and technology |
38,762 | 796 | - | - | 38,762 | 796 | ||||||||||||||||||
| Financial |
50,744 | 900 | 38,170 | 4,122 | 88,914 | 5,022 | ||||||||||||||||||
| Consumer |
67,690 | 1,444 | 14,931 | 929 | 82,621 | 2,373 | ||||||||||||||||||
| Public utilities |
24,165 | 1,204 | 4,394 | 262 | 28,559 | 1,466 | ||||||||||||||||||
| Total corporate obligations |
266,004 | 7,393 | 60,518 | 5,418 | 326,522 | 12,811 | ||||||||||||||||||
| Corporate private-labeled residential mortgage-backed securities |
- | - | 96,581 | 16,826 | 96,581 | 16,826 | ||||||||||||||||||
| Municipal securities |
81,799 | 2,537 | 7,145 | 764 | 88,944 | 3,301 | ||||||||||||||||||
| Other |
5,379 | 182 | 54,488 | 7,557 | 59,867 | 7,739 | ||||||||||||||||||
| Redeemable preferred stocks |
618 | 8 | 4,333 | 432 | 4,951 | 440 | ||||||||||||||||||
| Fixed maturity securities |
361,479 | 10,407 | 225,552 | 31,030 | 587,031 | 41,437 | ||||||||||||||||||
| Equity securities |
- | - | 2,034 | 137 | 2,034 | 137 | ||||||||||||||||||
| Total |
$ | 361,479 | $ | 10,407 | $ | 227,586 | $ | 31,167 | $ | 589,065 | $ | 41,574 | ||||||||||||
| 1 | Federal agency securities are not backed by the full faith and credit of the U.S. Government. |
118
Table of Contents
Kansas City Life Insurance Company
Notes to Consolidated Financial Statements–(Continued)
The following table provides information regarding fixed maturity and equity security investments available for sale with unrealized losses by length of time as of December 31, 2009.
| Less Than 12 Months | 12 Months or Longer | Total | ||||||||||||||||||||||
| Fair Value |
Unrealized Losses |
Fair Value |
Unrealized Losses |
Fair Value |
Unrealized Losses |
|||||||||||||||||||
| U.S. Treasury securities and obligations of U.S. Government |
$ | 30,616 | $ | 913 | $ | 3,040 | $ | 108 | $ | 33,656 | $ | 1,021 | ||||||||||||
| Federal agency issued residential mortgage-backed securities 1 |
1,363 | 4 | 6,191 | 51 | 7,554 | 55 | ||||||||||||||||||
| Subtotal |
31,979 | 917 | 9,231 | 159 | 41,210 | 1,076 | ||||||||||||||||||
| Corporate obligations: |
||||||||||||||||||||||||
| Industrial |
53,908 | 603 | 20,621 | 1,971 | 74,529 | 2,574 | ||||||||||||||||||
| Energy |
8,603 | 130 | 6,922 | 601 | 15,525 | 731 | ||||||||||||||||||
| Communications and technology |
6,365 | 120 | 28,166 | 1,666 | 34,531 | 1,786 | ||||||||||||||||||
| Financial |
32,267 | 503 | 116,043 | 14,273 | 148,310 | 14,776 | ||||||||||||||||||
| Consumer |
26,740 | 921 | 45,255 | 2,285 | 71,995 | 3,206 | ||||||||||||||||||
| Public utilities |
37,896 | 769 | 24,817 | 1,821 | 62,713 | 2,590 | ||||||||||||||||||
| Total corporate obligations |
165,779 | 3,046 | 241,824 | 22,617 | 407,603 | 25,663 | ||||||||||||||||||
| Corporate private-labeled residential mortgage-backed securities |
18,319 | 2,266 | 158,813 | 40,664 | 177,132 | 42,930 | ||||||||||||||||||
| Municipal securities |
25,385 | 787 | 10,752 | 1,823 | 36,137 | 2,610 | ||||||||||||||||||
| Other |
362 | 153 | 141,516 | 19,214 | 141,878 | 19,367 | ||||||||||||||||||
| Redeemable preferred stocks |
831 | 2 | 7,672 | 1,361 | 8,503 | 1,363 | ||||||||||||||||||
| Fixed maturity securities |
242,655 | 7,171 | 569,808 | 85,838 | 812,463 | 93,009 | ||||||||||||||||||
| Equity securities |
- | - | 1,986 | 186 | 1,986 | 186 | ||||||||||||||||||
| Total |
$ | 242,655 | $ | 7,171 | $ | 571,794 | $ | 86,024 | $ | 814,449 | $ | 93,195 | ||||||||||||
| 1 | Federal agency securities are not backed by the full faith and credit of the U.S. Government. |
As of December 31, 2010, the Company had gross unrealized losses of $41.6 million on investment securities, including fixed maturity and equity securities, that had a fair value of $589.1 million. As of December 31, 2009, the Company had gross unrealized losses of $93.2 million on investment securities, including fixed maturity and equity securities that had a fair value of $814.4 million. The decrease in unrealized losses was primarily attributable to the improved economy and financial markets, along with a decline in interest rates during the twelve months ended December 31, 2010. These changes affected the broad financial markets and resulted in price improvements in virtually every sector. At December 31, 2010, approximately 25% of the gross unrealized losses were attributable to securities having gross unrealized losses of less than 12 months. This compares to approximately 8% at December 31, 2009. At December 31, 2010, unrealized losses on investments available for sale were primarily due to $16.8 million in unrealized losses on corporate private-labeled residential mortgage-backed securities. In addition, unrealized losses on corporate securities totaled $12.8 million. Based, in part, on the Company’s assessment of the performance of the underlying collateral compared to the credit enhancement, the Company concluded that these securities were not other-than-temporarily impaired at December 31, 2010.
In addition, the Company also considers as part of its monitoring and evaluation process the length of time a security is below cost. At December 31, 2010, the Company had unrealized losses on its investment portfolio for fixed maturities and equity securities as follows:
| • | 130 security issues representing 69% of the issues with unrealized losses, including 94% being rated as investment grade, were below cost for less than one year; |
| • | 18 security issues representing 10% of the issues with unrealized losses, including 56% being rated as investment grade, were below cost for one year or more and less than three years; and |
| • | 39 security issues representing 21% of the issues with unrealized losses, including 49% being rated as investment grade, were below cost for three years or more. |
119
Table of Contents
Kansas City Life Insurance Company
Notes to Consolidated Financial Statements–(Continued)
At December 31, 2009, the Company had unrealized losses on its investment portfolio for fixed maturities and equity securities as follows:
| • | 84 security issues representing 36% of the issues with unrealized losses, including 93% being rated as investment grade, were below cost for less than one year; |
| • | 96 security issues representing 41% of the issues with unrealized losses, including 80% being rated as investment grade, were below cost for one year or more and less than three years; and |
| • | 52 security issues representing 23% of the issues with unrealized losses, including 81% being rated as investment grade, were below cost for three years or more. |
The following tables provide the distribution of maturities for fixed maturity securities available for sale with unrealized losses as of December 31, 2010 and December 31, 2009. Expected maturities may differ from these contractual maturities since borrowers may have the right to call or prepay obligations.
| December 31, 2010 | ||||||||
| Fair Value |
Gross Unrealized Losses |
|||||||
| Fixed maturity security securities available for sale: |
||||||||
| Due in one year or less |
$ | 28 | $ | - | ||||
| Due after one year through five years |
75,560 | 1,948 | ||||||
| Due after five years through ten years |
166,658 | 6,005 | ||||||
| Due after ten years |
242,949 | 16,217 | ||||||
| Total |
485,195 | 24,170 | ||||||
| Securities with variable principal payments |
96,885 | 16,828 | ||||||
| Redeemable preferred stocks |
4,951 | 439 | ||||||
| Total |
$ | 587,031 | $ | 41,437 | ||||
| December 31, 2009 | ||||||||
| Fair Value |
Gross Unrealized Losses |
|||||||
| Fixed maturity security securities available for sale: |
||||||||
| Due in one year or less |
$ | 10,483 | $ | 26 | ||||
| Due after one year through five years |
65,359 | 4,842 | ||||||
| Due after five years through ten years |
220,600 | 12,402 | ||||||
| Due after ten years |
295,339 | 30,521 | ||||||
| Total |
591,781 | 47,791 | ||||||
| Securities with variable principal payments |
212,179 | 43,855 | ||||||
| Redeemable preferred stocks |
8,503 | 1,363 | ||||||
| Total |
$ | 812,463 | $ | 93,009 | ||||
120
Table of Contents
Kansas City Life Insurance Company
Notes to Consolidated Financial Statements–(Continued)
The following tables summarize the Company’s investments in securities available for sale with unrealized losses as of December 31, 2010 and December 31, 2009.
| December 31, 2010 | ||||||||||||
| Amortized Cost |
Fair Value |
Gross Unrealized Losses |
||||||||||
| Securities owned without realized impairment: |
||||||||||||
| Unrealized losses of 10% or less |
$ | 480,498 | $ | 465,414 | $ | 15,084 | ||||||
| Unrealized losses of 20% or less and greater than 10% |
71,101 | 61,718 | 9,383 | |||||||||
| Subtotal |
551,599 | 527,132 | 24,467 | |||||||||
| Unrealized losses greater than 20%: |
||||||||||||
| Investment grade |
||||||||||||
| Less than twelve months |
- | - | - | |||||||||
| Twelve months or greater |
5,908 | 4,458 | 1,450 | |||||||||
| Total investment grade |
5,908 | 4,458 | 1,450 | |||||||||
| Below investment grade |
||||||||||||
| Less than twelve months |
- | - | - | |||||||||
| Twelve months or greater |
- | - | - | |||||||||
| Total below investment grade |
- | - | - | |||||||||
| Unrealized losses greater than 20% |
5,908 | 4,458 | 1,450 | |||||||||
| Subtotal |
557,507 | 531,590 | 25,917 | |||||||||
| Securities owned with realized impairment: |
||||||||||||
| Unrealized losses of 10% or less |
5,642 | 5,217 | 425 | |||||||||
| Unrealized losses of 20% or less and greater than 10% |
16,073 | 14,009 | 2,064 | |||||||||
| Subtotal |
21,715 | 19,226 | 2,489 | |||||||||
| Unrealized losses greater than 20%: |
||||||||||||
| Investment grade |
||||||||||||
| Less than twelve months |
- | - | - | |||||||||
| Twelve months or greater |
- | - | - | |||||||||
| Total investment grade |
- | - | - | |||||||||
| Below investment grade |
||||||||||||
| Less than twelve months |
13,366 | 10,629 | 2,737 | |||||||||
| Twelve months or greater |
38,051 | 27,620 | 10,431 | |||||||||
| Total below investment grade |
51,417 | 38,249 | 13,168 | |||||||||
| Unrealized losses greater than 20% |
51,417 | 38,249 | 13,168 | |||||||||
| Subtotal |
73,132 | 57,475 | 15,657 | |||||||||
| Total |
$ | 630,639 | $ | 589,065 | $ | 41,574 | ||||||
121
Table of Contents
Kansas City Life Insurance Company
Notes to Consolidated Financial Statements–(Continued)
| December 31, 2009 | ||||||||||||
| Amortized Cost |
Fair Value |
Gross Unrealized Losses |
||||||||||
| Securities owned without realized impairment: |
||||||||||||
| Unrealized losses of 10% or less |
$ | 633,514 | $ | 608,280 | $ | 25,234 | ||||||
| Unrealized losses of 20% or less and greater than 10% |
109,379 | 94,348 | 15,031 | |||||||||
| Subtotal |
742,893 | 702,628 | 40,265 | |||||||||
| Unrealized losses greater than 20%: |
||||||||||||
| Investment grade |
||||||||||||
| Less than twelve months |
38,538 | 29,448 | 9,090 | |||||||||
| Twelve months or greater |
34,906 | 22,225 | 12,681 | |||||||||
| Total investment grade |
73,444 | 51,673 | 21,771 | |||||||||
| Below investment grade |
||||||||||||
| Less than twelve months |
4,654 | 2,954 | 1,700 | |||||||||
| Twelve months or greater |
15,139 | 11,139 | 4,000 | |||||||||
| Total below investment grade |
19,793 | 14,093 | 5,700 | |||||||||
| Unrealized losses greater than 20% |
93,237 | 65,766 | 27,471 | |||||||||
| Subtotal |
836,130 | 768,394 | 67,736 | |||||||||
| Securities owned with realized impairment: |
||||||||||||
| Unrealized losses of 10% or less |
4,850 | 4,634 | 216 | |||||||||
| Unrealized losses of 20% or less and greater than 10% |
10,594 | 8,720 | 1,874 | |||||||||
| Subtotal |
15,444 | 13,354 | 2,090 | |||||||||
| Unrealized losses greater than 20%: |
||||||||||||
| Investment grade |
||||||||||||
| Less than twelve months |
- | - | - | |||||||||
| Twelve months or greater |
17,937 | 12,298 | 5,639 | |||||||||
| Total investment grade |
17,937 | 12,298 | 5,639 | |||||||||
| Below investment grade |
||||||||||||
| Less than twelve months |
6,373 | 4,306 | 2,067 | |||||||||
| Twelve months or greater |
31,760 | 16,097 | 15,663 | |||||||||
| Total below investment grade |
38,133 | 20,403 | 17,730 | |||||||||
| Unrealized losses greater than 20% |
56,070 | 32,701 | 23,369 | |||||||||
| Subtotal |
71,514 | 46,055 | 25,459 | |||||||||
| Total |
$ | 907,644 | $ | 814,449 | $ | 93,195 | ||||||
122
Table of Contents
Kansas City Life Insurance Company
Notes to Consolidated Financial Statements–(Continued)
The following table provides information regarding fixed maturity securities by asset class at December 31, 2010.
| Total Fair Value |
% of Total |
Fair Value of Securities with Gross Unrealized Gains |
Gross Unrealized Gains |
Fair Value of Securities with Gross Unrealized Losses |
Gross Unrealized Losses |
|||||||||||||||||||
| U.S. Treasury securities and obligations of U.S. Government |
$ | 135,142 | 5% | $ | 125,273 | $ | 7,180 | $ | 9,869 | $ | 318 | |||||||||||||
| Federal agencies 1 |
26,095 | 1% | 26,095 | 1,951 | - | - | ||||||||||||||||||
| Federal agency issued residential mortgage-backed securities 1 |
138,056 | 5% | 137,759 | 9,740 | 297 | 2 | ||||||||||||||||||
| Subtotal |
299,293 | 11% | 289,127 | 18,871 | 10,166 | 320 | ||||||||||||||||||
| Corporate obligations: |
||||||||||||||||||||||||
| Industrial |
432,518 | 16% | 352,700 | 26,255 | 79,818 | 2,930 | ||||||||||||||||||
| Energy |
178,511 | 7% | 170,663 | 15,498 | 7,848 | 224 | ||||||||||||||||||
| Communications and technology |
172,946 | 6% | 134,184 | 9,243 | 38,762 | 796 | ||||||||||||||||||
| Financial |
350,659 | 13% | 261,745 | 14,161 | 88,914 | 5,022 | ||||||||||||||||||
| Consumer |
430,504 | 16% | 347,883 | 28,725 | 82,621 | 2,373 | ||||||||||||||||||
| Public utilities |
324,800 | 12% | 296,241 | 27,640 | 28,559 | 1,466 | ||||||||||||||||||
| Subtotal |
1,889,938 | 70% | 1,563,416 | 121,522 | 326,522 | 12,811 | ||||||||||||||||||
| Corporate private-labeled residential mortgage-backed securities |
195,055 | 7% | 98,474 | 2,352 | 96,581 | 16,826 | ||||||||||||||||||
| Municipal securities |
151,831 | 6% | 62,887 | 1,319 | 88,944 | 3,301 | ||||||||||||||||||
| Other |
98,002 | 4% | 38,135 | 5,194 | 59,867 | 7,739 | ||||||||||||||||||
| Redeemable preferred stocks |
14,769 | 1% | 9,818 | 342 | 4,951 | 440 | ||||||||||||||||||
| Fixed maturities |
2,648,888 | 99% | 2,061,857 | 149,600 | 587,031 | 41,437 | ||||||||||||||||||
| Equity securities |
38,321 | 1% | 36,287 | 2,165 | 2,034 | 137 | ||||||||||||||||||
| Total |
$ | 2,687,209 | 100% | $ | 2,098,144 | $ | 151,765 | $ | 589,065 | $ | 41,574 | |||||||||||||
| 1 | Federal agency securities are not backed by the full faith and credit of the U.S. Government. |
123
Table of Contents
Kansas City Life Insurance Company
Notes to Consolidated Financial Statements–(Continued)
The following table provides information regarding fixed maturity securities by asset class at December 31, 2009.
| Total Fair Value |
% of Total |
Fair Value of Securities with Gross Unrealized Gains |
Gross Unrealized Gains |
Fair Value of Securities with Gross Unrealized Losses |
Gross Unrealized Losses |
|||||||||||||||||||
| U.S. Treasury securities and obligations of U.S. Government |
$ | 122,597 | 5% | $ | 88,941 | $ | 4,755 | $ | 33,656 | $ | 1,021 | |||||||||||||
| Federal agencies 1 |
28,321 | 1% | 28,321 | 681 | - | - | ||||||||||||||||||
| Federal agency issued residential mortgage-backed securities 1 |
175,858 | 7% | 168,304 | 7,474 | 7,554 | 55 | ||||||||||||||||||
| Subtotal |
326,776 | 13% | 285,566 | 12,910 | 41,210 | 1,076 | ||||||||||||||||||
| Corporate obligations: |
||||||||||||||||||||||||
| Industrial |
366,389 | 15% | 291,860 | 14,653 | 74,529 | 2,574 | ||||||||||||||||||
| Energy |
172,167 | 7% | 156,642 | 9,562 | 15,525 | 731 | ||||||||||||||||||
| Communications and technology |
136,076 | 5% | 101,545 | 5,933 | 34,531 | 1,786 | ||||||||||||||||||
| Financial |
339,621 | 14% | 191,311 | 8,667 | 148,310 | 14,776 | ||||||||||||||||||
| Consumer |
371,577 | 15% | 299,582 | 18,570 | 71,995 | 3,206 | ||||||||||||||||||
| Public utilities |
313,871 | 13% | 251,158 | 16,888 | 62,713 | 2,590 | ||||||||||||||||||
| Subtotal |
1,699,701 | 69% | 1,292,098 | 74,273 | 407,603 | 25,663 | ||||||||||||||||||
| Corporate private-labeled residential mortgage-backed securities |
196,660 | 8% | 19,528 | 135 | 177,132 | 42,930 | ||||||||||||||||||
| Municipal securities |
54,442 | 2% | 18,305 | 730 | 36,137 | 2,610 | ||||||||||||||||||
| Other |
178,092 | 7% | 36,214 | 3,619 | 141,878 | 19,367 | ||||||||||||||||||
| Redeemable preferred stocks |
13,601 | - | 5,098 | 98 | 8,503 | 1,363 | ||||||||||||||||||
| Fixed maturities |
2,469,272 | 99% | 1,656,809 | 91,765 | 812,463 | 93,009 | ||||||||||||||||||
| Equity securities |
36,876 | 1% | 34,890 | 1,657 | 1,986 | 186 | ||||||||||||||||||
| Total |
$ | 2,506,148 | 100% | $ | 1,691,699 | $ | 93,422 | $ | 814,449 | $ | 93,195 | |||||||||||||
| 1 | Federal agency securities are not backed by the full faith and credit of the U.S. Government. |
The Company held two non-income producing securities with a carrying value of $2.8 million at December 31, 2010 (2009 – one security with a carrying value of $2.7 million). These securities were previously written down due to other-than-temporary impairments and placed on non-accrual status.
The Company did not hold securities of any corporation and its affiliates that exceeded 10% of stockholders’ equity at December 31, 2010 or December 31, 2009.
No derivative financial instruments were held during the three years ended December 31, 2010.
The Company is exposed to risk that issuers of securities owned by the Company will default or that interest rates or credit spreads will change and cause a decrease in the value of its investments. With residential mortgage-backed securities, the Company is also exposed to prepayment and extension risks. As interest rates change, the rate at which these securities pay down principal may change. These risks are mitigated by investing in high-grade securities and managing the maturities and cash flows of investments and liabilities.
Subprime securities include all bonds or portion of bonds where the underlying collateral is made up of home equity loans or first mortgage loans to borrowers whose credit scores at the time of origination were lower than the level recognized in the market at prime. The Company’s classification of subprime does not include Alt-A or jumbo loans, unless the collateral otherwise meets the preceding definition. At December 31, 2010, the Company had investments with subprime residential mortgage exposure of $19.6 million and a related $4.9 million unrealized loss. At December 31, 2009, the Company had investments with subprime residential mortgage exposure of $20.9 million and a related $8.0 million unrealized loss. This exposure amounted to less than 1% of the Company’s invested assets at both December 31, 2010 and 2009.
124
Table of Contents
Kansas City Life Insurance Company
Notes to Consolidated Financial Statements–(Continued)
The following table provides a reconciliation of credit losses recognized in earnings on fixed maturity securities held by the Company for which a portion of the other-than-temporary loss was recognized in other comprehensive income (loss).
| Credit losses on securities held at beginning of year in other comprehensive income (loss) |
$ | 8,179 | ||
| Additions for credit losses not previously recognized in other-than-temporary impairment |
1,911 | |||
| Additions for increases in the credit loss for which an other-than-temporary impairment previously recognized when there was no intent to sell the security before recovery of its amortized cost basis |
1,909 | |||
| Reductions for securities sold during the period (realized) |
- | |||
| Reductions for securities previously recognized in other comprehensive income (loss) because of intent to sell the security before recovery of its amortized cost basis |
- | |||
| Reductions for increases in cash flows expected to be collected that are recognized over the remaining life of the security |
(432 | ) | ||
| Credit losses on securities held at the end of year in other comprehensive income (loss) |
$ | 11,567 | ||
Proceeds From Sales of Investment Securities
The table below provides sales of investment securities available for sale, excluding maturities and calls, for the three years ended December 31.
| 2010 | 2009 | 2008 | ||||||||||
| Proceeds |
$ | 82,025 | $ | 139,591 | $ | 42,310 | ||||||
| Gross realized gains |
2,545 | 9,886 | 811 | |||||||||
| Gross realized losses |
67 | 313 | 1,115 | |||||||||
Mortgage Loans
Investments in mortgage loans totaled $559.2 million at December 31, 2010 ($457.6 million – December 31, 2009). The Company’s mortgage loans are mostly secured by commercial real estate and are stated at cost, adjusted for amortization of premium and accrual of discount, less an allowance for potential future losses. The allowance for mortgage loans is maintained at a level believed by management to be adequate to absorb estimated credit losses and was $3.4 million as of December 31, 2010 and 2009. Management’s periodic evaluation and assessment of the adequacy of the allowance is based on known and inherent risks in the portfolio, historical experience, industry data, current economic conditions and other relevant factors. One mortgage loan has been foreclosed upon and transferred to real estate investments during the past three years. Also, there were two delinquent mortgage loans at December 31, 2010 (none in 2009), although payments were subsequently received in January 2011 to bring these loans current. The Company does not hold mortgage loans of any single borrower that exceeds 5% of stockholders’ equity.
At December 31, 2010, the Company had 16% of its invested assets in mortgage loans, up from 14% at December 31, 2009. The Company originates and services fixed-rate commercial mortgage loans for its investment portfolio. New commercial loans were $146.1 million, $61.2 million and $54.4 million for 2010, 2009 and 2008, respectively. The level of new commercial mortgage loans in any year is influenced by market conditions, as the Company responds to changes in interest rates, available spreads and borrower demand. In addition to the subject collateral underlying the mortgage, the Company typically requires some amount of recourse from borrowers as another potential source of repayment. The recourse requirement is determined as part of the underwriting requirements of each loan.
The Company added 69 new loans to the portfolio during 2010 of which 54 or 78% of these loans had some amount of recourse requirement. A total of 38 new loans or $86.5 million were purchased from institutional lenders during 2010 and 15% of the Company’s commercial mortgage portfolio having been acquired rather than originated by the Company. The purchased loans are seasoned performing loans having characteristics of property type, geographical diversification, term, underwriting and cash flows that are similar to the Company’s portfolio of originated loans. The average loan to value ratio for the overall portfolio was 49% at December 31, 2010 and 2009, based upon the appraisal of value at the time the loan was originated or acquired. The average loan balance was approximately $1.5 million at December 31, 2010.
125
Table of Contents
Kansas City Life Insurance Company
Notes to Consolidated Financial Statements–(Continued)
The following table summarizes the amount of mortgage loans held by the Company at December 31, 2010, segregated by origination year. The 2010 amount includes the seasoned mortgage loans purchased from institutional lenders, as previously discussed.
| Carrying Amount |
% of Total |
|||||||
| Prior to 2002 |
$ | 61,897 | 12% | |||||
| 2003 |
47,240 | 8% | ||||||
| 2004 |
39,078 | 7% | ||||||
| 2005 |
62,500 | 11% | ||||||
| 2006 |
54,890 | 10% | ||||||
| 2007 |
40,975 | 7% | ||||||
| 2008 |
45,968 | 8% | ||||||
| 2009 |
57,073 | 10% | ||||||
| 2010 |
152,956 | 28% | ||||||
| Allowance for loss |
(3,410 | ) | (1% | ) | ||||
| Total |
$ | 559,167 | 100% | |||||
The tables below identify mortgage loans by geographic location and property type as of December 31.
| 2010 | 2009 | |||||||
| Carrying Amount |
Carrying Amount |
|||||||
| Geographic region: |
||||||||
| Pacific |
$ | 134,892 | $ | 101,648 | ||||
| West north central |
122,228 | 113,997 | ||||||
| West south central |
106,093 | 106,625 | ||||||
| Mountain |
72,871 | 64,142 | ||||||
| South atlantic |
50,454 | 31,966 | ||||||
| East north central |
30,905 | 19,783 | ||||||
| Middle atlantic |
22,975 | 6,776 | ||||||
| East south central |
22,159 | 16,055 | ||||||
| Allowance for loss |
(3,410 | ) | (3,410 | ) | ||||
| Total |
$ | 559,167 | $ | 457,582 | ||||
| Property type: |
||||||||
| Industrial |
$ | 263,621 | $ | 248,397 | ||||
| Office |
227,772 | 180,417 | ||||||
| Medical |
35,223 | 27,873 | ||||||
| Other |
35,961 | 4,305 | ||||||
| Allowance for loss |
(3,410 | ) | (3,410 | ) | ||||
| Total |
$ | 559,167 | $ | 457,582 | ||||
126
Table of Contents
Kansas City Life Insurance Company
Notes to Consolidated Financial Statements–(Continued)
The following table identifies the concentration of mortgage loans by state greater than 5% as of December 31.
| 2010 | 2009 | |||||||||||||||
| Carrying Amount |
% of Total |
Carrying Amount |
% of Total |
|||||||||||||
| California |
$ | 115,766 | 21% | $ | 87,013 | 19% | ||||||||||
| Texas |
81,903 | 15% | 81,534 | 18% | ||||||||||||
| Minnesota |
56,537 | 10% | 60,992 | 13% | ||||||||||||
| Florida |
28,770 | 5% | 26,278 | 6% | ||||||||||||
| All others |
279,601 | 50% | 205,175 | 45% | ||||||||||||
| Allowance for loss |
(3,410 | ) | (1% | ) | (3,410 | ) | (1% | ) | ||||||||
| Total |
$ | 559,167 | 100% | $ | 457,582 | 100% | ||||||||||
The table below identifies mortgage loans by maturity as of December 31.
| 2010 | 2009 | |||||||
| Mortgage loans by maturity: |
||||||||
| Due in one year or less |
$ | 33,703 | $ | 10,486 | ||||
| Due after one year through five years |
177,182 | 164,691 | ||||||
| Due after five years through ten years |
235,566 | 204,754 | ||||||
| Due after ten years |
116,126 | 81,061 | ||||||
| Allowance for loss |
(3,410 | ) | (3,410 | ) | ||||
| Total |
$ | 559,167 | $ | 457,582 | ||||
Commercial mortgage loans in California accounted for 21% of the Company’s commercial mortgage loan portfolio at December 31, 2010. The next largest concentration by state was 15% in Texas. Through this concentration in California, along with other states included in the pacific region, the Company is exposed to potential losses from a regional economic downturn and certain catastrophes, such as earthquakes and fires that may affect certain areas of the region. The Company requires borrowers to maintain fire insurance coverage to provide reimbursement for any losses due to fire. The Company diversifies its commercial mortgage loan portfolio both geographically and by property type to reduce certain catastrophe and economic exposure. However, diversification may not always sufficiently mitigate the risk of such losses. Historically, the delinquency rate of the Company’s pacific region commercial mortgage loans has been substantially below the industry average and consistent with the Company’s experience in other states. The Company does not require earthquake insurance for properties on which it makes commercial mortgage loans. However, the Company does consider the potential for earthquake loss if the property lies within areas believed by the Company to be seismically active submarkets and structural information specific to each property. The Company does not expect catastrophe or earthquake damage or economic downturn in the pacific region to have a material adverse effect on its business, financial position, results of operations or cash flows. However, the Company cannot provide assurance that such risks could not have such material adverse effects.
Under the laws of certain states, environmental contamination of a property may result in a lien on the property to secure recovery of the costs of cleanup. In some states, such a lien has priority over the lien of an existing mortgage against such property. As a commercial mortgage lender, the Company customarily conducts environmental assessments prior to making commercial mortgage loans secured by real estate and before taking title on real estate. Based on the Company’s environmental assessments, the Company believes that any compliance costs associated with environmental laws and regulations or any remediation of affected properties would not have a material adverse effect on the Company’s business, financial position, results of operations or cash flows. However, the Company cannot provide assurance that material compliance costs will not be incurred.
In the normal course of business, the Company commits to fund commercial mortgage loans generally up to 120 days in advance. The Company had commitments to originate mortgage loans of $6.6 million at December 31, 2010 with fixed interest rates ranging from 5.25% to 6.25%. These commitments generally have fixed expiration dates. A small percentage of commitments expire due to the borrower’s failure to deliver the requirements of the commitment by the expiration date. In these cases, the Company will retain the commitment fee. The commitments in place at December 31, 2010 were funded in January and February 2011, $5.3 million and $1.3 million, respectively.
127
Table of Contents
Kansas City Life Insurance Company
Notes to Consolidated Financial Statements–(Continued)
In December 2009, a construction-to-permanent loan in the amount of $16.0 million was executed. In the second quarter of 2010 the Company issued a second construction-to-permanent loan in the amount of $1.8 million. At December 31, 2010, $12.6 million had been disbursed for the two construction loans, with an unfunded amount of $5.2 million. Both projects are scheduled for completion by mid-2011. At completion and fulfillment of occupancy requirements, the loans will convert to long-term, fixed rate permanent loans.
Financing Receivables – Mortgage Loans
The Company considers its mortgage loan portfolio to be long-term financing receivables. Mortgage loans are stated at cost net of allowance for potential future losses. Mortgage loan interest income is recognized on an accrual basis with any premium or discount amortized over the life of the loan. Prepayment and late fees are recorded on the date of collection. Loans in foreclosure, loans considered impaired or loans past due 90 days or more are placed on a non-accrual status.
If a mortgage loan is determined to be on non-accrual status, the mortgage loan does not accrue any revenue into the Consolidated Statements of Income. The loan is independently monitored and evaluated as to potential impairment or foreclosure. This evaluation includes assessing the probability of receiving future cash flows, along with consideration of many of the factors described below. If delinquent payments are made and the loan is brought current, then the Company returns the loan to active status and accrues income accordingly.
Generally, the Company considers its mortgage loans to be a portfolio segment. The Company considers its primary class to be property type. The Company primarily uses loan-to-value as its credit risk quality indicator but also monitors additional secondary risk factors, such as geographic distribution both on a regional and specific state basis. The mortgage loan portfolio segment is presented by property-type in a table in this section. In addition, geographic distribution for both regional and significant state concentrations are also presented. These measures are also supplemented with various other analytics targeted to provide specific additional information concerning a mortgage loan and supports management’s assessment of each financing receivable.
The following table presents an aging schedule for delinquent payments for both principal and interest as of December 31, 2010 and December 31, 2009, by class.
| Amount of Payments Past Due | ||||||||||||||||||||
| Book Value | 30-59 Days | 60-89 Days | > 90 Days | Total | ||||||||||||||||
| December 31, 2010 |
||||||||||||||||||||
| Industrial |
$ | 1,187 | $ | 11 | $ | - | $ | - | $ | 11 | ||||||||||
| Medical |
- | - | - | - | - | |||||||||||||||
| Office |
2,219 | 22 | - | - | 22 | |||||||||||||||
| Other |
- | - | - | - | - | |||||||||||||||
| Total |
$ | 3,406 | $ | 33 | $ | - | $ | - | $ | 33 | ||||||||||
| December 31, 2009 |
||||||||||||||||||||
| Industrial |
$ | - | $ | - | $ | - | $ | - | - | |||||||||||
| Medical |
- | - | - | - | - | |||||||||||||||
| Office |
- | - | - | - | - | |||||||||||||||
| Other |
- | - | - | - | - | |||||||||||||||
| Total |
$ | - | $ | - | $ | - | $ | - | $ | - | ||||||||||
As of December 31, 2010, there were two mortgage loans that were 30 days past due. Subsequently, payments were received on both of these loans and the loans were brought current in January 2011.
The allowance for losses on mortgage loans is maintained at a level believed by management to be adequate to absorb estimated credit losses. Management’s periodic evaluation and assessment of the adequacy of the reserve is based on known and inherent risks in the portfolio, historical and industry data, current economic conditions and other relevant factors. A loan is considered impaired if it is probable that contractual amounts due will not be collected.
The allowance for loss is monitored and evaluated with a process that includes, but is not limited to, the following factors:
| • | Monthly monitoring of the payment history of each borrower; |
| • | Annual monitoring of each loan’s property financial statement including net operating income, debt service coverage and occupancy level; |
128
Table of Contents
Kansas City Life Insurance Company
Notes to Consolidated Financial Statements–(Continued)
| • | Analysis of the Company’s loan portfolio based on loan size concentrations, geographic concentrations, property type concentrations, maturity concentrations, origination loan-to-value concentrations and borrower concentrations; |
| • | Analysis of the loan originations for the year; |
| • | Analysis of the Company’s own historical loss experiences over the last several years; |
| • | Analysis of current industry conditions that are affecting the market, including rental and vacancy rates; |
| • | Analysis of the markets and sub markets in which the Company has mortgage loans; and |
| • | Analysis of industry historical loss experience. |
These categories are generally monitored on an individual and aggregate basis to determine that the appropriate level of allowance is maintained. The Company’s allowance for credit losses was $3.4 million at December 31, 2010. Generally, the Company establishes the allowance for credit losses using the collectively evaluated impairment methodology. The Company has not acquired any mortgage loans with deteriorated credit quality.
There are a number of significant risks and uncertainties inherent in the process of monitoring impairments on loans, determining if impairment is other-than-temporary and determining the amount of an other-than-temporary impairment. These risks include but are not limited to:
| • | The risk that the Company’s assessment of a borrower to meet all of its contractual obligations will change based on changes in the credit characteristics of the borrower or property; |
| • | The risk that the economic outlook will be worse than expected or have more of an impact on the borrower than anticipated; |
| • | The risk that the performance of the underlying property could deteriorate in the future; |
| • | The risk that fraudulent, inaccurate or misleading information could be provided to the Company; |
| • | The risk that the methodology or assumptions used to develop estimates of the portion of the impairment of the loan prove over time to be inaccurate; and |
| • | The risk that other facts and circumstances change such that it becomes more likely than not that the Company will not obtain all of it contractual payments. |
To the extent the Company determines a loan is impaired, that amount will be charged to the allowance for loss and the loan balance will be reduced. In the event the property is foreclosed upon, the carrying value will be written down to the lesser of the current fair value less costs to sell, or book value of the property with a charge to the allowance for loss and a corresponding reduction to the mortgage loan asset.
Over the past three years, the Company has had one mortgage loan default, which occurred in the fourth quarter of 2010. The Company completed the foreclosure on this loan in the fourth quarter of 2010 with no impairment recorded due to the fair value of the equity in the property being greater than its book value. Based in part on the above factors, the Company has determined that it does not have any impairments in its portfolio. The Company had no loans that were restructured or modified in 2010.
129
Table of Contents
Kansas City Life Insurance Company
Notes to Consolidated Financial Statements–(Continued)
The following chart details the activity of the collectively evaluated allowance for loss as of December 31.
| 2010 | 2009 | 2008 | ||||||||||
| Beginning of year |
$ | 3,410 | $ | 3,410 | $ | 3,410 | ||||||
| Additions |
- | - | - | |||||||||
| Deductions |
- | - | - | |||||||||
| End of year |
$ | 3,410 | $ | 3,410 | $ | 3,410 | ||||||
The Company purchased $84.6 million of seasoned mortgage loans in 2010. These purchases resulted in an addition to the Company’s mortgage loan portfolio with a weighted average net yield of 6.6%. These loans were all performing loans which met or exceeded all of the Company’s normal underwriting criteria. Additionally in 2010, the Company purchased one $1.9 million loan in December 2010 from a separate originator.
Real Estate
Investments in real estate totaled $119.9 million at December 31, 2010 ($114.1 million at December 31, 2009). The table below provides information concerning the Company's real estate investments by major category as of December 31.
| 2010 | 2009 | |||||||
| Land |
$ | 17,850 | $ | 17,370 | ||||
| Buildings |
66,961 | 63,704 | ||||||
| Less accumulated depreciation |
(21,566 | ) | (21,809 | ) | ||||
| Real estate, commercial |
63,245 | 59,265 | ||||||
| Real estate, joint ventures |
56,664 | 54,811 | ||||||
| $ | 119,909 | $ | 114,076 | |||||
Investment real estate is depreciated on a straight-line basis over periods ranging from 3 to 60 years.
The Company had non-income producing real estate of $29.7 million, consisting of vacant properties and properties under development, at December 31, 2010 (2009 - $28.1 million).
The Company had no commitments to buy or sell real estate investments at December 31, 2010. The Company had commitments to fund affordable housing project obligations of $9.6 million at December 31, 2010 (2009 - $7.4 million).
4. Variable Interest Entities
The Company invests in certain affordable housing and real estate joint ventures which are considered to be variable interest entities (VIEs). The assets held in affordable housing real estate joint venture VIEs are primarily residential real estate properties that are restricted to provide affordable housing under federal or state programs for varying periods of time. The restrictions primarily apply to the rents that may be paid by tenants residing in the properties during the term of an agreement to remain in the affordable housing program. Investments in real estate joint ventures are equity interests in partnerships or limited liability corporations that may or may not participate in profits or residual value. In certain cases, the Company may issue fixed-rate senior mortgage loan investments secured by properties controlled by VIEs. These investments are classified as mortgage loans in the Consolidated Balance Sheets, and the income received from such investments is recorded as investment income in the Consolidated Statements of Income.
Investments in the affordable housing real estate joint ventures and real estate joint ventures are interests that will absorb portions of the VIE’s expected losses or receive portions of expected residual returns of the VIE’s net assets exclusive of variable interests. The Company makes an initial assessment of whether it is the primary beneficiary of a VIE at the time of the initial investment and on an ongoing basis thereafter. The Company considers many factors when making this determination based upon a review of the underlying investment agreement and other information related to the specific investment. The first factor is whether the Company has the ability to direct the activities of a VIE that most significantly impact the VIE’s economic performance. The power to direct the activities of the VIE is generally vested in the managing general partner or managing member of the VIE, which is not the position held by the Company in these investments. Other factors include the entity’s equity investment at risk, decision-making abilities, obligations to absorb economic risks and the right to receive economic rewards of the entity; and the extent to which the Company shares in the VIE’s expected losses and residual returns.
130
Table of Contents
Kansas City Life Insurance Company
Notes to Consolidated Financial Statements–(Continued)
Most of the Company’s investment interests in VIEs not in the form of a fixed-rate senior mortgage debt investment are recorded using the equity method, with cash distributions from the VIE and cash contributions to the VIE recorded as decreases or increases, respectively, in the carrying value of the VIE. Certain other equity investments in VIEs, where permitted, are recorded on an amortized cost basis. The operating performance of investments in the VIE is recorded in the Consolidated Statements of Income as investment income or as a component of income tax expense, depending upon the nature and primary design of the investment. The Company evaluates the carrying value of VIEs for impairment on an ongoing basis to assess whether the carrying value is expected to be realized during the anticipated life of the investment. Fixed-rate senior mortgage debt investments secured by properties controlled by VIEs are classified as commercial mortgages, and income received from such investments is recorded as investment income.
The following table presents the carrying amount and maximum exposure to loss relating to VIEs for which the Company holds a variable interest, but is not the primary beneficiary, and which have not been consolidated at December 31, 2010 and December 31, 2009. The table includes investments in 10 real estate joint ventures and 28 affordable housing real estate joint ventures as of December 31, 2010 and investments in nine real estate joint ventures and 26 affordable housing real estate joint ventures as of December 31, 2009.
| 2010 | 2009 | |||||||||||||||
| Carrying Amount |
Maximum Exposure to Loss |
Carrying Amount |
Maximum Exposure to Loss |
|||||||||||||
| Real estate joint ventures |
$ | 35,089 | $ | 35,089 | $ | 35,265 | $ | 35,265 | ||||||||
| Affordable housing real estate joint ventures |
21,129 | 63,444 | 19,546 | 72,590 | ||||||||||||
| Total |
$ | 56,218 | $ | 98,533 | $ | 54,811 | $ | 107,855 | ||||||||
The maximum exposure to loss relating to the real estate joint ventures and affordable housing real estate joint ventures, as shown in the table above, is equal to the carrying amounts plus any unfunded equity commitments, exposure to potential recapture of tax credits, guarantees of debt or other obligations of the VIE with recourse to the Company. Unfunded equity and loan commitments typically require financial or operating performance by other parties and have not yet become due or payable but which may become due in the future. The Company had contingent commitments to fund additional equity contributions to certain affordable housing real estate joint venture VIEs, as of December 31, 2010 and 2009 of $9.2 and $7.0 million, respectively, which could result in additional exposure to loss.
In addition, the maximum exposure to loss on affordable housing joint ventures as of December 31, 2010 and 2009 includes $12.0 million and $33.5 million, respectively, of losses which could be realized if the tax credits received by the VIEs were recaptured. Recapture events would cause the Company to reverse some or all of the benefit previously recognized by the Company or third parties to whom the tax credit interests were transferred. A recapture event can occur at any time during a 15-year required compliance period. The principal causes of recapture include financial default and non-compliance with affordable housing program requirements by the properties controlled by the VIE. The potential exposure due to recapture may be mitigated by guarantees from the managing member or managing partner in the VIE, insurance contracts, or changes in the residual value accruing to the Company’s interests in the VIEs.
131
Table of Contents
Kansas City Life Insurance Company
Notes to Consolidated Financial Statements–(Continued)
5. Unpaid Accident and Health Claims Liability
The liability for unpaid accident and health claims is included with policy and contract claims on the Consolidated Balance Sheets. Claim adjustment expenditures are expensed as incurred and were not material in any year presented. Activity in the liability follows.
| 2010 | 2009 | 2008 | ||||||||||
| Gross liability at beginning of year |
$ | 8,667 | $ | 7,006 | $ | 7,089 | ||||||
| Less reinsurance recoverable |
(4,774 | ) | (3,495 | ) | (3,826 | ) | ||||||
| Net liability at beginning of year |
3,893 | 3,511 | 3,263 | |||||||||
| Incurred benefits related to: |
||||||||||||
| Current year |
27,481 | 27,602 | 26,411 | |||||||||
| Prior years 1 |
(441 | ) | (448 | ) | 271 | |||||||
| Total incurred benefits |
27,040 | 27,154 | 26,682 | |||||||||
| Paid benefits related to: |
||||||||||||
| Current year |
24,114 | 23,764 | 23,178 | |||||||||
| Prior years |
3,328 | 3,008 | 3,256 | |||||||||
| Total paid benefits |
27,442 | 26,772 | 26,434 | |||||||||
| Net liability at end of year |
3,491 | 3,893 | 3,511 | |||||||||
| Reinsurance recoverable |
4,400 | 4,774 | 3,495 | |||||||||
| Gross liability at end of year |
$ | 7,891 | $ | 8,667 | $ | 7,006 | ||||||
| 1 | The incurred benefits related to prior years’ unpaid accident and health claims reflect the change in these liabilities. |
6. Notes Payable
The Company had no notes payable at December 31, 2010 or December 31, 2009.
As a member of the FHLB with a capital investment of $4.8 million, the Company has the ability to borrow on a collateralized basis from the FHLB. The Company received annual dividends on the capital investment in the FHLB equal to $0.1 million (2009 - $0.1 million; 2008 - $0.3 million).
The Company has unsecured revolving lines of credit of $60.0 million with two major commercial banks with no balances outstanding and which are at variable interest rates based upon short-term indices. These lines of credit will expire in June of 2011. The Company anticipates renewing these lines as they come due.
Interest paid on all borrowings was less than $0.1 million in 2010 (2009 - less than $0.1 million; 2008 - $1.1 million).
7. Statutory Information and Stockholder Dividends Restriction
The table below provides Kansas City Life’s net gain from operations, net income (loss) and capital and surplus (stockholders' equity), on the statutory basis used to report to regulatory authorities for the years ended December 31.
| 2010 | 2009 | 2008 | ||||||||||
| (unaudited | ) | |||||||||||
| Net gain from operations |
$ | 13,400 | $ | 24,979 | $ | 27,301 | ||||||
| Net income (loss) |
12,748 | 19,455 | (20,114 | ) | ||||||||
| Capital and surplus |
322,459 | 336,615 | 306,247 | |||||||||
132
Table of Contents
Kansas City Life Insurance Company
Notes to Consolidated Financial Statements–(Continued)
Stockholder dividends may not exceed statutory unassigned surplus. Additionally, under Missouri law, the Company must have the prior approval of the Missouri Director of Insurance in order to pay dividends in any consecutive twelve-month period exceeding the greater of statutory net gain from operations for the preceding year or 10% of statutory stockholders' equity at the end of the preceding year. The maximum stockholder dividends payable in 2011 without prior approval is $32.2 million, 10% of 2010 capital and surplus. The Company believes these statutory limitations impose no practical restrictions on its dividend payment plans.
The Company is required to deposit a defined amount of assets with state regulatory authorities. Such assets had a statutory carrying value of $12.0 million at December 31, 2010 (2009 – $11.6 million; 2008 – $12.1 million).
8. Income Taxes
The following tables provide information about income taxes and a reconciliation of the federal income tax rate to the Company’s effective income tax rate for the years ended December 31.
| 2010 | 2009 | 2008 | ||||||||||
| Current income tax expense (benefit) |
$ | 4,872 | $ | 476 | $ | (1,386 | ) | |||||
| Deferred income tax expense (benefit) |
7,585 | 5,244 | (7,778 | ) | ||||||||
| Total income tax expense (benefit) |
$ | 12,457 | $ | 5,720 | $ | (9,164 | ) | |||||
| 2010 | 2009 | 2008 | ||||||||||
| Federal income tax rate |
35% | 35% | 35% | |||||||||
| Tax credits, net of equity adjustment |
5 | 6 | - | |||||||||
| Permanent differences |
(5 | ) | (3 | ) | 1 | |||||||
| Prior year taxes |
1 | (3 | ) | (1 | ) | |||||||
| Effective income tax rate |
36% | 35% | 35% | |||||||||
133
Table of Contents
Kansas City Life Insurance Company
Notes to Consolidated Financial Statements–(Continued)
Presented below are tax effects of temporary differences that result in significant deferred tax assets and liabilities at December 31.
| 2010 | 2009 | |||||||
| Deferred tax assets: |
||||||||
| Future policy benefits |
$ | 44,487 | $ | 41,248 | ||||
| Employee retirement benefits |
20,990 | 26,154 | ||||||
| Tax carryovers |
874 | 938 | ||||||
| Gross and net deferred tax assets |
66,351 | 68,340 | ||||||
| Deferred tax liabilities: |
||||||||
| Basis differences between tax and |
||||||||
| GAAP accounting for investments |
7,871 | 7,782 | ||||||
| Unrealized investment gains |
38,567 | 79 | ||||||
| Capitalization of deferred acquisition costs, net of amortization |
32,431 | 37,902 | ||||||
| Value of business acquired |
17,245 | 23,140 | ||||||
| Property and equipment, net |
6,961 | 7,290 | ||||||
| Other |
16,557 | 13,998 | ||||||
| Gross deferred tax liabilities |
119,632 | 90,191 | ||||||
| Net deferred tax liability |
53,281 | 21,851 | ||||||
| Current tax (receivable) liability |
216 | (8,784 | ) | |||||
| Income taxes payable |
$ | 53,497 | $ | 13,067 | ||||
A valuation allowance must be established for any portion of the deferred tax asset which is believed not to be realizable. Based predominately upon review of the Company’s anticipated future earnings, reversal of future taxable differences, the available capital loss carryback period, tax planning strategies that are prudent and feasible, and our ability and intent to hold securities until their recovery, in management's opinion it is more likely than not that the Company will realize the benefit of its deferred tax assets.
Federal income taxes paid during 2010 were $4.0 million (2009 – $6.5 million; 2008 – $9.9 million).
The Company and its subsidiaries file income tax returns in the U.S. federal jurisdiction and various state jurisdictions. In general, the Company is no longer subject to U.S. federal, state or local income tax examinations by tax authorities for years prior to 2007. The Company is not currently under examination by the Internal Revenue Service.
A reconciliation of the beginning and ending amounts of unrecognized tax benefits for the years ended December 31 is as follows:
| 2010 | 2009 | |||||||
| Beginning of year |
$ | 6,636 | $ | 6,268 | ||||
| Additions based on tax positions related to the current year |
- | 720 | ||||||
| Additions for tax positions of prior years |
- | 56 | ||||||
| Reductions for tax positions of prior years |
(6,499 | ) | (294 | ) | ||||
| Reductions for statute of limitations lapse |
(137 | ) | (114 | ) | ||||
| End of year |
$ | - | $ | 6,636 | ||||
The total amount of unrecognized tax benefits, if recognized, that would impact the effective tax rate was $0.6 million as of December 31, 2009. The decrease in unrecognized tax benefits in 2010 is primarily attributable to an accounting method change that was approved by the IRS during 2010.
134
Table of Contents
Kansas City Life Insurance Company
Notes to Consolidated Financial Statements–(Continued)
The Company recognizes interest and penalties accrued related to unrecognized tax benefits in income tax expense (benefit). During the years ended December 31, 2010, 2009, and 2008, the Company recognized expense (benefit) of approximately ($0.7) million, ($0.2) million, and $0.1 million in interest and penalties, respectively. The Company did not have any accrued interest and penalties at December 31, 2010 and $0.7 million for the payment of interest and penalties accrued at December 31, 2009.
The income tax expense is recorded in various places in the Company's financial statements, as detailed below, for the years ended December 31.
| 2010 | 2009 | 2008 | ||||||||||
| Income tax expense (benefit) |
$ | 12,457 | $ | 5,720 | $ | (9,164 | ) | |||||
| Stockholders’ equity: |
||||||||||||
| Related to: |
||||||||||||
| Unrealized gains (losses), net |
23,080 | 49,274 | (48,419 | ) | ||||||||
| Change in benefit plan obligations |
766 | 6,037 | (11,343 | ) | ||||||||
| Total income tax expense (benefit) included in financial statements |
$ | 36,303 | $ | 61,031 | $ | (68,926 | ) | |||||
9. Pension and Other Postretirement Benefits
The Company has pension and other postretirement benefit plans covering substantially all its employees for which the measurement date is December 31.
The Kansas City Life Cash Balance Pension Plan (the Plan) was amended effective December 31, 2010 to provide that participants’ accrued benefits will be frozen as of, and that no further benefits or accruals will be earned after December 31, 2010. Although participants will no longer accrue additional benefits under the Plan as of December 31, 2010, participants will continue to earn years of service for vesting purposes under the Plan with respect to their benefits accrued through December 31, 2010. In addition, the cash balance account will continue to earn annual interest. Plan benefits are based on a cash balance account consisting of credits to the account based upon an employee’s years of service, compensation and interest credits on account balances calculated using the greater of the average 30-year Treasury bond rate for November of each year or 5.5%. The benefits expected to be paid in each year from 2011 through 2015 are $9.8 million, $9.9 million, $9.4 million, $10.4 million, and $10.9 million, respectively. The aggregate benefits expected to be paid in the five years from 2016 through 2020 are $51.4 million. The expected benefits to be paid are based on the same assumptions used to measure the Company’s benefit obligation at December 31, 2010 and include estimated future employee service. The 2011 contribution for the plan has not been determined.
The asset allocation of the fair value of pension plan assets at December 31 was:
| Plan Assets | Target |
|||||||||||
| 2010 | 2009 | Allocation | ||||||||||
| Debt securities |
35% | 39% | 26% - 42% | |||||||||
| Equity securities |
65% | 60% | 56% - 76% | |||||||||
| Cash equivalents |
0% | 1% | 0% - 2% | |||||||||
Certain of the Company’s pension plan assets consist of investments in pooled separate accounts offered by the Plan. Net asset value (NAV) of the separate accounts is calculated in a manner consistent with U.S. GAAP for investments companies and is determinative of their fair value. Several of the separate accounts invest in publicly quoted mutual funds or actively managed stocks. The fair value of the underlying mutual funds or stock is used to determine the NAV of the separate account, which is not publicly quoted. Some of the separate accounts also invest in fixed income securities. The fair value of the underlying securities is based on quoted prices of similar assets and used to determine the NAV of the separate account. Sale of plan assets may be at values less than NAV and certain redemption restrictions may apply.
Plan fiduciaries set investment policies and strategies and oversee its investment allocation, which includes selecting investment managers, commissioning periodic asset-liability studies and setting long-term strategic targets. Long-term strategic investment objectives include preserving the funded status of the plan and balancing risk and return. Target allocation ranges are guidelines, not limitations, and occasionally plan fiduciaries will approve allocations above or below a target range. The Plan does not expect to return any plan assets to the Company during 2011.
135
Table of Contents
Kansas City Life Insurance Company
Notes to Consolidated Financial Statements–(Continued)
The current assumption for the expected long-term rate of return on plan assets is 8.0%. This assumption is determined by analyzing: 1) historical average returns, 2) historical data on the volatility of returns, 3) current yields available in the marketplace, 4) actual returns on plan assets, and 5) current and anticipated future allocation among asset classes. The asset classes used for this analysis are domestic and international equities, investment grade corporate bonds, alternative assets, and cash. The overall rate is derived as a weighted average of the estimated long-term returns on the asset classes represented in the investment portfolio of the plan.
The assumed discount rates used to determine the benefit obligation for pension benefits and postretirement benefits are 5.02% and 5.59%, respectively. The discount rates were determined by reference to the Citigroup Pension Liability Yield Curve on December 31, 2010. Specifically, the spot rate curve represents the rates on zero coupon securities of the quality and type included in the pension index at various maturities. By discounting benefit cash flows at these rates, a notional amount equal to the fair value of a cash flow defeasing portfolio of bonds was determined. The discount rate for benefits was calculated as a single rate giving the same discounted value as the notional amount.
The postretirement medical plans for eligible employees, agents, and their dependents are contributory with contributions adjusted annually. The benefits expected to be paid in each year from 2011 through 2014 are $1.1 million each year and $1.2 million for 2015. The aggregate benefits expected to be paid in the five years from 2016 through 2020 are $6.6 million. The expected benefits to be paid are based on the same assumptions used to measure the Company’s benefit obligation at December 31, 2010. The 2011 contribution for the plan is estimated to be $1.1 million. The Company pays these medical costs as they become due and the plan incorporates cost-sharing features. The postretirement plan disclosures included herein do not include the potential impact from the Medicare Act (the Act) that became law in December 2003. The Act introduced a new federal subsidy to sponsors of certain retiree healthcare plans that provide a benefit that is at least actuarially equivalent to Medicare. Since the Company does not provide benefits that are actuarially equivalent to Medicare, the Act did not impact the Company’s disclosures.
The postretirement life insurance plan is non-contributory with level annual payments over the participants' expected service periods. The plan covers only those employees with at least one year of service as of December 31, 1997. The benefits in this plan are frozen, using the employees' years of service and compensation as of December 31, 1997.
Non-contributory defined contribution retirement plans for eligible general agents and sales agents provide supplemental payments based upon earned agency first year individual life and annuity commissions. Contributions to these plans in 2010 were $0.1 million (2009 - $0.1 million; 2008 - $0.1 million). Non-contributory deferred compensation plans for eligible agents based upon earned first year commissions are also offered. Contributions to these plans in 2010 were $0.3 million (2009 - $0.3 million; 2008 - $0.4 million).
Savings plans for eligible employees and agents match employee and agent contributions up to 6% of salary and 2.5% of agents’ prior year paid commissions, respectively. Contributions to the plan in 2010 were $1.2 million (2009 – $1.3 million; 2008 – $1.8 million). Effective January 1, 2011 the plan was amended, increasing the employer match from 6% to 8%. The Company may contribute an additional profit sharing amount up to 4% of salary for eligible employees, depending upon corporate profits. The Company made no profit sharing contribution in 2010 or in the prior two years.
A non-contributory trusteed employee stock ownership plan covers substantially all salaried employees. No contributions have been made to this plan since 1992.
The Company recognizes the funded status of its defined pension and postretirement plans, measured as the difference between plan assets at fair value and the projected benefit obligation, on the Consolidated Balance Sheets. Changes in the funded status that arise during the period, but are not recognized as components of net periodic benefit cost, are recognized within other comprehensive income (loss) net of taxes.
136
Table of Contents
Kansas City Life Insurance Company
Notes to Consolidated Financial Statements–(Continued)
| Pension Benefits | Other Benefits | |||||||||||||||
| 2010 | 2009 | 2010 | 2009 | |||||||||||||
| Change in projected benefit obligation: |
||||||||||||||||
| Benefit obligation at beginning of year |
$ | 136,686 | $ | 137,492 | $ | 28,013 | $ | 29,738 | ||||||||
| Service cost |
2,115 | 2,059 | 594 | 730 | ||||||||||||
| Interest cost |
7,554 | 7,922 | 1,432 | 1,590 | ||||||||||||
| Curtailments and plan changes |
(5,159 | ) | - | (460 | ) | - | ||||||||||
| Actuarial (gain) loss |
10,370 | 2,044 | (922 | ) | (3,309 | ) | ||||||||||
| Benefits paid |
(8,362 | ) | (12,831 | ) | (889 | ) | (736 | ) | ||||||||
| Benefit obligation at end of year |
$ | 143,204 | $ | 136,686 | $ | 27,768 | $ | 28,013 | ||||||||
| Change in plan assets: |
||||||||||||||||
| Fair value of plan assets at beginning of year |
$ | 107,946 | $ | 94,832 | $ | 618 | $ | 836 | ||||||||
| Return on plan assets |
11,446 | 19,865 | 33 | 38 | ||||||||||||
| Company contributions |
6,062 | 6,080 | - | - | ||||||||||||
| Benefits paid |
(8,362 | ) | (12,831 | ) | (32 | ) | (256 | ) | ||||||||
| Fair value of plan assets at end of year |
$ | 117,092 | $ | 107,946 | $ | 619 | $ | 618 | ||||||||
| Unfunded status at end of year |
$ | 26,112 | $ | 28,740 | $ | 27,149 | $ | 27,395 | ||||||||
| Amounts recognized in accumulated other comprehensive income (loss): |
||||||||||||||||
| Net loss |
$ | 55,971 | $ | 57,614 | $ | 452 | $ | 1,390 | ||||||||
| Prior service cost |
- | (602 | ) | (1,209 | ) | (1,001 | ) | |||||||||
| Total accumulated other comprehensive income (loss) |
$ | 55,971 | $ | 57,012 | $ | (757 | ) | $ | 389 | |||||||
| Pension | Other | |||||||||||||||
| 2010 | 2009 | 2010 | 2009 | |||||||||||||
| Other changes in plan assets and benefit obligations |
||||||||||||||||
| recognized in other comprehensive income (loss): |
||||||||||||||||
| Unrecognized actuarial loss |
$ | 2,178 | $ | (10,432 | ) | $ | (922 | ) | $ | (3,307 | ) | |||||
| Unrecognized prior service cost |
- | - | (460 | ) | - | |||||||||||
| Amortization of net gain |
(3,821 | ) | (4,594 | ) | (16 | ) | (11 | ) | ||||||||
| Amortization of prior service cost |
602 | 706 | 252 | 389 | ||||||||||||
| Total recognized in other comprehensive income (loss) |
$ | (1,041 | ) | $ | (14,320 | ) | $ | (1,146 | ) | $ | (2,929 | ) | ||||
137
Table of Contents
Kansas City Life Insurance Company
Notes to Consolidated Financial Statements–(Continued)
| Pension Benefits | Other Benefits | |||||||||||||||
| 2010 | 2009 | 2010 | 2009 | |||||||||||||
| Plans with underfunded accumulated benefit obligation: |
||||||||||||||||
| Projected benefit obligation |
$ | 143,204 | $ | 136,686 | - | - | ||||||||||
| Accumulated benefit obligation |
143,204 | 132,070 | - | - | ||||||||||||
| Fair value of plan assets |
117,092 | 107,946 | - | - | ||||||||||||
| Weighted average assumptions used to determine benefit obligations at December 31: |
||||||||||||||||
| Discount rate |
5.02% | 5.62% | 5.59% | 6.01% | ||||||||||||
| Expected return on plan assets |
8.00% | 8.00% | 5.50% | 5.50% | ||||||||||||
| Rate of compensation increase |
3.00% | 3.00% | - | - | ||||||||||||
| Weighted average assumptions used to determine net periodic benefit cost for years ended December 31: |
||||||||||||||||
| Discount rate |
5.62% | 6.00% | 6.01% | 5.75% | ||||||||||||
| Expected return on plan assets |
8.00% | 8.00% | 5.50% | 5.50% | ||||||||||||
| Rate of compensation increase |
3.00% | 3.38% | - | - | ||||||||||||
The following table presents the fair value of each major category of pension plan and other postretirement assets as of December 31:
| Pension Plan | Other Benefits | |||||||||||||||
| 2010 | 2009 | 2010 | 2009 | |||||||||||||
| Assets, at fair value: |
||||||||||||||||
| Cash and cash equivalents |
$ | 40 | $ | 89 | $ | 619 | $ | 618 | ||||||||
| Equity securities |
5,323 | 4,614 | - | - | ||||||||||||
| Investment funds: |
||||||||||||||||
| Stock and bond funds |
71,391 | 65,355 | - | - | ||||||||||||
| Money market funds |
1,142 | 76 | - | - | ||||||||||||
| Hedge funds |
15,643 | 16,346 | - | - | ||||||||||||
| Fixed maturity securities: |
||||||||||||||||
| U.S. Treasury securities and obligations of U.S. Government |
2,211 | 2,621 | - | - | ||||||||||||
| Corporate obligations |
20,981 | 18,488 | - | - | ||||||||||||
| Mineral rights |
78 | 71 | - | - | ||||||||||||
| Real estate |
19 | 19 | - | - | ||||||||||||
| Other |
264 | 267 | - | - | ||||||||||||
| Fair value of assets at end of year |
$ | 117,092 | $ | 107,946 | $ | 619 | $ | 618 | ||||||||
138
Table of Contents
Kansas City Life Insurance Company
Notes to Consolidated Financial Statements–(Continued)
The following table discloses the level within the fair value hierarchy in which the pension plan and other postretirement assets fall.
| Pension Plan | ||||||||||||||||
| Level 1 | Level 2 | Level 3 | Total | |||||||||||||
| Assets, at fair value as of December 31, 2010 |
||||||||||||||||
| Equity securities |
$ | 5,323 | $ | - | $ | - | $ | 5,323 | ||||||||
| Investment funds: |
||||||||||||||||
| Stock and bond funds |
- | 71,391 | - | 71,391 | ||||||||||||
| Money market funds |
1,142 | 1,142 | ||||||||||||||
| Hedge funds |
- | 15,643 | - | 15,643 | ||||||||||||
| Fixed maturity securities: |
||||||||||||||||
| U.S. Treasury securities and obligations of U.S. Government |
- | 2,211 | - | 2,211 | ||||||||||||
| Corporate obligations |
- | 19,910 | 1,071 | 20,981 | ||||||||||||
| Other assets |
304 | - | 97 | 401 | ||||||||||||
| Total |
$ | 6,769 | $ | 109,155 | $ | 1,168 | $ | 117,092 | ||||||||
| Other Benefits | ||||||||||||||||
| Level 1 | Level 2 | Level 3 | Total | |||||||||||||
| Cash and cash equivalents |
619 | - | - | 619 | ||||||||||||
| Total |
$ | 619 | $ | - | $ | - | $ | 619 | ||||||||
| Pension Plan | ||||||||||||||||
| Level 1 | Level 2 | Level 3 | Total | |||||||||||||
| Assets, at fair value as of December 31, 2009 |
||||||||||||||||
| Equity securities |
$ | 4,614 | $ | - | $ | - | $ | 4,614 | ||||||||
| Investment funds: |
||||||||||||||||
| Stock and bond funds |
- | 65,355 | - | 65,355 | ||||||||||||
| Money market funds |
76 | - | - | 76 | ||||||||||||
| Hedge funds |
- | 16,346 | - | 16,346 | ||||||||||||
| Fixed maturity securities: |
||||||||||||||||
| U.S. Treasury securities and obligations of U.S. Government |
- | 2,621 | - | 2,621 | ||||||||||||
| Corporate obligations |
- | 18,378 | 110 | 18,488 | ||||||||||||
| Other assets |
356 | - | 90 | 446 | ||||||||||||
| Total |
$ | 5,046 | $ | 102,700 | $ | 200 | $ | 107,946 | ||||||||
| Other Benefits | ||||||||||||||||
| Level 1 | Level 2 | Level 3 | Total | |||||||||||||
| Cash and cash equivalents |
618 | - | - | 618 | ||||||||||||
| Total |
$ | 618 | $ | - | $ | - | $ | 618 | ||||||||
The following table discloses the changes in Level 3 assets measured at fair value on a recurring basis for the years ended December 31:
| Pension Plan | Other Benefits | |||||||||||||||
| 2010 | 2009 | 2010 | 2009 | |||||||||||||
| Plan assets: |
||||||||||||||||
| Balance, beginning of period |
$ | 200 | $ | 1,213 | $ | - | $ | - | ||||||||
| Gains (losses) realized and unrealized |
40 | (92 | ) | - | - | |||||||||||
| Transfers in |
1,038 | - | - | - | ||||||||||||
| Transfers out |
(110 | ) | (921 | ) | - | - | ||||||||||
| Balance, end of period |
$ | 1,168 | $ | 200 | $ | - | $ | - | ||||||||
139
Table of Contents
Kansas City Life Insurance Company
Notes to Consolidated Financial Statements–(Continued)
The following table provides the components of net periodic benefit cost for the years ended December 31.
| Pension Benefits | Other Benefits | |||||||||||||||||||||||
| 2010 | 2009 | 2008 | 2010 | 2009 | 2008 | |||||||||||||||||||
| Service cost |
$ | 2,115 | $ | 2,059 | $ | 2,405 | $ | 594 | $ | 731 | $ | 821 | ||||||||||||
| Interest cost |
7,554 | 7,922 | 7,662 | 1,432 | 1,590 | 1,599 | ||||||||||||||||||
| Expected return on plan assets |
(8,413 | ) | (7,389 | ) | (9,986 | ) | (34 | ) | (41 | ) | (51 | ) | ||||||||||||
| Amortization of: |
||||||||||||||||||||||||
| Unrecognized actuarial loss |
3,821 | 4,594 | 2,375 | 16 | 11 | 172 | ||||||||||||||||||
| Unrecognized prior service cost |
(602 | ) | (706 | ) | (646 | ) | (252 | ) | (389 | ) | (222 | ) | ||||||||||||
| Net periodic benefit cost |
4,475 | 6,480 | 1,810 | 1,756 | 1,902 | 2,319 | ||||||||||||||||||
| Total recognized in other comprehensive income (loss) |
(1,041 | ) | (14,320 | ) | 31,951 | (1,146 | ) | (2,929 | ) | 459 | ||||||||||||||
| Total recognized in net periodic benefit cost and other comprehensive income (loss) |
$ | 3,434 | $ | (7,840 | ) | $ | 33,761 | $ | 610 | $ | (1,027 | ) | $ | 2,778 | ||||||||||
The following table provides the estimated net loss and prior service cost for the pension plan and other postretirement plans that will be amortized from accumulated other comprehensive income (loss) into net periodic benefit cost in 2011.
| Pension Benefits |
Other Benefits |
|||||||
| Actuarial gain (loss) |
$ | 3,583 | $ | - | ||||
| Prior service cost (credit) |
- | (252 | ) | |||||
The assumed growth rate of health care costs has a significant effect on the benefit amounts reported, as the table below demonstrates.
| One Percentage Point Change in the Growth Rate |
||||||||
| Increase | Decrease | |||||||
| Service and interest cost components |
$ | 401 | $ | (327 | ) | |||
| Postretirement benefit obligation |
4,881 | (3,976 | ) | |||||
For measurement purposes a 10.0% annual increase in the per capita cost of covered health care benefits was assumed to decrease gradually to 6.0% in 2018 and thereafter.
10. Share-Based Payment
The Company has a long-term incentive plan for senior management that provides a cash award to participants for the increase in the share price of the Company’s common stock through units (phantom shares) assigned by the Board of Directors. The cash award is calculated over a three-year interval on a calendar year basis. At the conclusion of each three-year interval, participants will receive a cash award based on the increase in the share price during a defined measurement period, times the number of units. The increase in the share price will be determined based on the change in the share price from the beginning to the end of the three-year interval. Dividends are accrued and paid at the end of each three-year interval to the extent that they exceed negative stock price appreciation. Plan payments are contingent on the continued employment of the participant unless termination is due to a qualifying event such as death, disability or retirement. The Company does not make payments in shares, warrants or options.
The following table provides information about the outstanding three-year intervals as of December 31, 2010.
| Defined |
Number of Units |
Grant Price |
||||||
| 2008-2010 | 178,133 | $ | 44.33 | |||||
| 2009-2011 | 170,417 | $ | 44.93 | |||||
| 2010-2012 | 223,968 | $ | 30.04 | |||||
| 2011-2013 | 200,061 | $ | 32.45 | |||||
140
Table of Contents
Kansas City Life Insurance Company
Notes to Consolidated Financial Statements–(Continued)
No payments were made during 2010 for the three-year interval ended December 31, 2009. Also, no payments were made during 2009 for the three-year interval ended December 31, 2008. During 2008, the plan made a payment of $0.1 million to plan participants for the three-year interval ended December 31, 2007. The cost of compensation charged as an operating expense during 2010 was $0.3 million, net of tax. The change in accrual for share-based compensation that reduced operating expense during 2009 was $0.1 million, net of tax. The cost of compensation charged as an operating expense during 2008 was $0.1 million, net of tax.
11. Segment Information
The Company has three reportable business segments, which are defined based on the nature of the products and services offered: Individual Insurance, Group Insurance and Old American. The Individual Insurance segment consists of individual insurance products for both Kansas City Life and Sunset Life. The Individual Insurance segment is marketed through a nationwide sales force of independent general agents and third-party marketing arrangements. The Group Insurance segment consists of sales of group life, dental, vision and long-term and short-term disability products. This segment is marketed through a nationwide sales force of independent general agents, group brokers and third-party marketing arrangements. The Old American segment consists of individual insurance products designed largely as final expense products. These products are marketed through a nationwide general agency sales force with exclusive territories, using direct response marketing to supply agents with leads.
Insurance revenues, as shown in the Consolidated Statements of Income, consist of premiums and contract charges, less reinsurance ceded. Insurance revenues are defined as “customer revenues” for segment reporting purposes. Other revenues consist primarily of supplementary contract considerations, policyholder dividends left with the Company to accumulate, income received on the sale of low income housing tax credits by a subsidiary of the Company, and fees charged on products and sales from the Company’s broker-dealer subsidiary. Customer revenues are added to other revenues, net investment income and realized investment gains (losses) to reconcile to the Company’s total revenues. Benefits and expenses are specifically and directly identified and recorded by segment. Certain expenses may also be allocated as necessary.
Separate investment portfolios are maintained for each of the three life insurance companies. However, investment assets and income are allocated to the Group Insurance segment based upon its cash flows and future policy benefit liabilities. Home office functions are fully integrated for all segments in order to maximize economies of scale. Therefore, operating expenses are allocated to the segments based upon internal cost studies, which are consistent with industry cost methodologies.
Inter-segment revenues are not material. The Company operates solely in the United States and no individual customer accounts for 10% or more of the Company's revenue.
141
Table of Contents
Kansas City Life Insurance Company
Notes to Consolidated Financial Statements–(Continued)
| Individual Insurance |
Group Insurance |
Old American |
Intercompany Eliminations 1 |
Total | ||||||||||||||||
| 2010: |
||||||||||||||||||||
| Insurance revenues (customer revenues) |
$ | 131,774 | $ | 49,355 | $ | 65,229 | $ | (528 | ) | $ | 245,830 | |||||||||
| Net investment income |
162,997 | 553 | 12,309 | - | 175,859 | |||||||||||||||
| Realized investment gains |
202 | - | 333 | - | 535 | |||||||||||||||
| Other revenues |
8,978 | 156 | 5 | - | 9,139 | |||||||||||||||
| Total revenues |
303,951 | 50,064 | 77,876 | (528 | ) | 431,363 | ||||||||||||||
| Policyholder benefits |
106,523 | 32,131 | 44,343 | - | 182,997 | |||||||||||||||
| Interest credited to policyholder account balances |
85,949 | - | - | - | 85,949 | |||||||||||||||
| Amortization of deferred acquisition costs |
14,976 | - | 12,057 | - | 27,033 | |||||||||||||||
| Operating expenses |
60,141 | 21,917 | 19,095 | (528 | ) | 100,625 | ||||||||||||||
| Total benefits and expenses |
267,589 | 54,048 | 75,495 | (528 | ) | 396,604 | ||||||||||||||
| Income (loss) before income tax expense (benefit) |
36,362 | (3,984 | ) | 2,381 | - | 34,759 | ||||||||||||||
| Income tax expense (benefit) |
12,855 | (1,394 | ) | 996 | - | 12,457 | ||||||||||||||
| Segment net income (loss) |
$ | 23,507 | $ | (2,590 | ) | $ | 1,385 | $ | - | $ | 22,302 | |||||||||
| Segment assets |
$ | 3,956,901 | $ | 10,268 | $ | 366,113 | $ | - | $ | 4,333,282 | ||||||||||
| Interest expense |
$ | 1 | $ | - | $ | - | $ | - | $ | 1 | ||||||||||
| 2009: |
||||||||||||||||||||
| Insurance revenues (customer revenues) |
$ | 132,107 | $ | 48,980 | $ | 62,261 | $ | (546 | ) | $ | 242,802 | |||||||||
| Net investment income |
164,133 | 554 | 12,741 | - | 177,428 | |||||||||||||||
| Realized investment losses |
(8,221 | ) | - | (1,855 | ) | - | (10,076 | ) | ||||||||||||
| Other revenues |
10,323 | 167 | 1 | - | 10,491 | |||||||||||||||
| Total revenues |
298,342 | 49,701 | 73,148 | (546 | ) | 420,645 | ||||||||||||||
| Policyholder benefits |
102,499 | 33,799 | 42,692 | - | 178,990 | |||||||||||||||
| Interest credited to policyholder account balances |
86,713 | - | - | - | 86,713 | |||||||||||||||
| Amortization of deferred acquisition costs |
24,023 | - | 11,103 | - | 35,126 | |||||||||||||||
| Operating expenses |
67,908 | 19,479 | 16,523 | (546 | ) | 103,364 | ||||||||||||||
| Total benefits and expenses |
281,143 | 53,278 | 70,318 | (546 | ) | 404,193 | ||||||||||||||
| Income (loss) before income tax expense (benefit) |
17,199 | (3,577 | ) | 2,830 | - | 16,452 | ||||||||||||||
| Income tax expense (benefit) |
5,981 | (1,252 | ) | 991 | - | 5,720 | ||||||||||||||
| Segment net income (loss) |
$ | 11,218 | $ | (2,325 | ) | $ | 1,839 | $ | - | $ | 10,732 | |||||||||
| Segment assets |
$ | 3,808,909 | $ | 9,949 | $ | 357,327 | $ | - | $ | 4,176,185 | ||||||||||
| Interest expense |
$ | - | $ | - | $ | 4 | $ | - | $ | 4 | ||||||||||
| 1 | Elimination entries to remove intercompany transactions for life and accident and health insurance were as follows: insurance revenues from the Group Insurance segment and operating expenses from the Individual Insurance segment to arrive at Consolidated Statements of Income. |
142
Table of Contents
Kansas City Life Insurance Company
Notes to Consolidated Financial Statements–(Continued)
| Individual Insurance |
Group Insurance |
Old American |
Intercompany Eliminations 1 |
Total | ||||||||||||||||
| 2008: |
||||||||||||||||||||
| Insurance revenues (customer revenues) |
$ | 126,480 | $ | 48,763 | $ | 61,517 | $ | (587 | ) | $ | 236,173 | |||||||||
| Net investment income |
164,243 | 525 | 12,651 | - | 177,419 | |||||||||||||||
| Realized investment losses |
(49,987 | ) | - | (2,284 | ) | - | (52,271 | ) | ||||||||||||
| Other revenues |
12,734 | 268 | 3 | - | 13,005 | |||||||||||||||
| Total revenues |
253,470 | 49,556 | 71,887 | (587 | ) | 374,326 | ||||||||||||||
| Policyholder benefits |
101,275 | 32,956 | 44,518 | - | 178,749 | |||||||||||||||
| Interest credited to policyholder account balances |
86,899 | - | - | - | 86,899 | |||||||||||||||
| Amortization of deferred acquisition costs |
24,304 | - | 10,685 | - | 34,989 | |||||||||||||||
| Operating expenses |
65,641 | 18,950 | 15,899 | (587 | ) | 99,903 | ||||||||||||||
| Total benefits and expenses |
278,119 | 51,906 | 71,102 | (587 | ) | 400,540 | ||||||||||||||
| Income (loss) before income tax expense (benefit) |
(24,649 | ) | (2,350 | ) | 785 | - | (26,214 | ) | ||||||||||||
| Income tax expense (benefit) |
(8,724 | ) | (845 | ) | 405 | - | (9,164 | ) | ||||||||||||
| Segment net income (loss) |
$ | (15,925 | ) | $ | (1,505 | ) | $ | 380 | $ | - | $ | (17,050 | ) | |||||||
| Segment assets |
$ | 3,618,510 | $ | 8,780 | $ | 339,801 | $ | - | $ | 3,967,091 | ||||||||||
| Interest expense |
$ | 928 | $ | - | $ | 118 | $ | - | $ | 1,046 | ||||||||||
| 1 | Elimination entries to remove intercompany transactions for life and accident and health insurance were as follows: insurance revenues from the Group Insurance segment and operating expenses from the Individual Insurance segment to arrive at Consolidated Statements of Income. |
The following table provides information about the Company’s customer revenues for the years ended December 31.
| 2010 | 2009 | 2008 | ||||||||||
| Customer revenues by line of business: |
||||||||||||
| Traditional individual insurance products, net |
$ | 90,456 | $ | 88,087 | $ | 78,403 | ||||||
| Interest sensitive products |
90,568 | 89,458 | 89,828 | |||||||||
| Variable life insurance and annuities |
15,451 | 16,277 | 19,179 | |||||||||
| Group life and disability products, net |
49,355 | 48,980 | 48,763 | |||||||||
| Insurance revenues |
$ | 245,830 | $ | 242,802 | $ | 236,173 | ||||||
12. Property and Equipment
Property and equipment are stated at cost and depreciated over estimated useful lives using the straight-line method. The home office is depreciated over 25 to 50 years and furniture and equipment is depreciated over 3 to 10 years. The table below provides information as of December 31.
| 2010 | 2009 | |||||||
| Land |
$ | 766 | $ | 766 | ||||
| Home office complex |
20,638 | 20,365 | ||||||
| Furniture and equipment |
45,096 | 44,803 | ||||||
| 66,500 | 65,934 | |||||||
| Accumulated depreciation |
(42,986 | ) | (41,541 | ) | ||||
| $ | 23,514 | $ | 24,393 | |||||
143
Table of Contents
Kansas City Life Insurance Company
Notes to Consolidated Financial Statements–(Continued)
13. Reinsurance
The table below provides information about reinsurance for the years ended December 31.
| 2010 | 2009 | 2008 | ||||||||||
| Life insurance in force (in millions) : |
||||||||||||
| Direct |
$ | 28,329 | $ | 29,201 | $ | 28,691 | ||||||
| Ceded |
(14,116 | ) | (14,190 | ) | (14,492 | ) | ||||||
| Assumed |
1,379 | 1,482 | 1,609 | |||||||||
| Net |
$ | 15,592 | $ | 16,493 | $ | 15,808 | ||||||
| Premiums: |
||||||||||||
| Life insurance: |
||||||||||||
| Direct |
$ | 142,235 | $ | 139,418 | $ | 130,008 | ||||||
| Ceded |
(46,133 | ) | (45,508 | ) | (46,205 | ) | ||||||
| Assumed |
3,285 | 3,383 | 3,773 | |||||||||
| Net |
$ | 99,387 | $ | 97,293 | $ | 87,576 | ||||||
| Accident and health: |
||||||||||||
| Direct |
$ | 49,267 | $ | 47,998 | $ | 47,001 | ||||||
| Ceded |
(8,843 | ) | (8,224 | ) | (7,411 | ) | ||||||
| Assumed |
- | - | - | |||||||||
| Net |
$ | 40,424 | $ | 39,774 | $ | 39,590 | ||||||
Old American has a coinsurance agreement that reinsures certain whole life policies issued by Old American prior to December 1, 1986. These policies had a face value of $36.8 million as of December 31, 2010 (2009 - $40.9 million). The reserve for future policy benefits ceded under this agreement at December 31, 2010 was $20.1 million at December 31, 2010 (2009 - $21.9 million).
Kansas City Life acquired a block of traditional life and universal life products in 1997. As of December 31, 2010, the block had $1.4 billion of life insurance in force (2009 - $1.5 billion). The block generated life insurance premiums of $3.0 million in 2010 (2009 - $3.2 million; 2008 - $3.4 million) and had reinsurance ceded of $0.8 million in 2010 (2009 - $1.0 million; 2008 - $1.0 million).
Sunset Life entered into a yearly renewable term reinsurance agreement January 1, 2002, whereby it ceded 80% of its retained mortality risk on traditional and universal life policies. As of December 31, 2010, the insurance in force ceded approximated $1.4 billion (2009 - $1.7 billion) and premiums totaled $8.9 million (2009 - $8.9 million; 2008 - $8.9 million).
Reinsurance receivables were $187.1 million at year end 2010, consisting of reserves ceded of $170.1 million and claims ceded of $17.0 million. Reinsurance receivables were $179.3 million at year end 2009, consisting of reserves ceded of $165.7 million and claims ceded of $13.6 million.
The maximum retention on any one life is three hundred fifty thousand dollars for ordinary life plans and one hundred thousand dollars for group coverage. A contingent liability exists with respect to reinsurance, which may become a liability of the Company in the unlikely event that the reinsurers should be unable to meet obligations assumed under reinsurance contracts. The solvency of reinsurers is reviewed annually.
144
Table of Contents
Kansas City Life Insurance Company
Notes to Consolidated Financial Statements–(Continued)
The following table reflects the Company’s significant reinsurance partners along with their A. M. Best credit rating and the amount of reinsurance recoverable and their related percent of recoverable at December 31, 2010.
| A. M. Best Rating |
Reinsurance Recoverable |
% of Recoverable |
||||||||||
| TransAmerica Life Insurance Company |
A+ | $ | 34,616 | 19% | ||||||||
| Security Life of Denver |
A | 26,095 | 14% | |||||||||
| Employers Reassurance Corporation |
A- | 19,952 | 11% | |||||||||
| RGA Reinsurance Company |
A+ | 16,643 | 9% | |||||||||
| Swiss Re America Corporation |
A | 13,822 | 7% | |||||||||
| UNUM Life Insurance Company of America |
A | 13,822 | 7% | |||||||||
| Hartford Life & Accident Insurance Company |
A | 11,971 | 6% | |||||||||
| Lewer Life Insurance Company |
B | 9,487 | 5% | |||||||||
| Union Security Insurance Company |
A- | 9,268 | 5% | |||||||||
| Other (19 Companies) |
31,447 | 17% | ||||||||||
| Total |
$ | 187,123 | 100% | |||||||||
The Company monitors several factors that it considers relevant to satisfy itself as to the ongoing ability of a reinsurer to meet all obligations of the reinsurance agreements. These factors include the credit rating of the reinsurer, the financial strength of the reinsurer, significant changes or events of the reinsurer, and any other relevant factors. If the Company believes that any reinsurer would not be able to satisfy its obligations with the Company, a separate contingency reserve may be established. As of year-end 2010 and 2009, no reinsurer met these conditions.
The reinsurance recoverable is composed of reinsurance ceded receipts due from policyholder benefit payments of $17.0 million and reserves for life and accident and health business of $170.1 million at December 31, 2010.
14. Comprehensive Income (Loss)
Comprehensive income (loss) is comprised of net income (loss) and other comprehensive income (loss). Other comprehensive income (loss) includes the unrealized investment gains or losses on securities available for sale (net of adjustments for realized investment gains or losses) net of adjustments to DAC, VOBA and policyholder account balances. In addition, other comprehensive income (loss) includes the change in the liability for benefit plan obligations. Other comprehensive income (loss) reflects these items net of tax.
145
Table of Contents
Kansas City Life Insurance Company
Notes to Consolidated Financial Statements–(Continued)
The tables below provide information about comprehensive income (loss) for the years ended December 31.
| Unrealized Gain (Loss) on Securities |
Pension and Other Benefits |
Total | ||||||||||
| 2010: |
||||||||||||
| Net unrealized gains (losses) arising during the year |
$ | 110,508 | $ | - | $ | 110,508 | ||||||
| Less: |
||||||||||||
| Net realized investment gains (losses), excluding impairment losses |
4,364 | - | 4,364 | |||||||||
| Other-than-temporary impairment losses recognized in earnings |
(4,129 | ) | - | (4,129 | ) | |||||||
| Other-than-temporary impairment losses recognized in other comprehensive income (loss) |
309 | - | 309 | |||||||||
| Net unrealized gains (losses) excluding impairment losses |
109,964 | - | 109,964 | |||||||||
| Change in benefit plan obligations |
- | 2,187 | 2,187 | |||||||||
| Effect on DAC and VOBA |
(36,593 | ) | - | (36,593 | ) | |||||||
| Policyholder account balances |
(7,430 | ) | - | (7,430 | ) | |||||||
| Deferred income taxes |
(23,079 | ) | (765 | ) | (23,844 | ) | ||||||
| Other comprehensive income |
$ | 42,862 | $ | 1,422 | 44,284 | |||||||
| Net income |
22,302 | |||||||||||
| Comprehensive income |
$ | 66,586 | ||||||||||
| Unrealized Gain (Loss) on Securities |
Pension and Other Benefits |
Total | ||||||||||
| 2009: |
||||||||||||
| Net unrealized gains (losses) arising during the year |
$ | 197,065 | $ | - | $ | 197,065 | ||||||
| Less: |
||||||||||||
| Net realized investment gains (losses), excluding impairment losses |
10,159 | - | 10,159 | |||||||||
| Other-than-temporary impairment losses recognized in earnings |
(35,011 | ) | - | (35,011 | ) | |||||||
| Other-than-temporary impairment losses recognized in other comprehensive income (loss) |
16,070 | - | 16,070 | |||||||||
| Net unrealized gains (losses) excluding impairment losses |
205,847 | - | 205,847 | |||||||||
| Change in benefit plan obligations |
- | 17,249 | 17,249 | |||||||||
| Effect on DAC and VOBA |
(67,833 | ) | - | (67,833 | ) | |||||||
| Deferred income taxes |
(48,305 | ) | (6,037 | ) | (54,342 | ) | ||||||
| Other comprehensive income |
$ | 89,709 | $ | 11,212 | 100,921 | |||||||
| Net income |
10,732 | |||||||||||
| Comprehensive income |
$ | 111,653 | ||||||||||
146
Table of Contents
Kansas City Life Insurance Company
Notes to Consolidated Financial Statements–(Continued)
| Unrealized Gain (Loss) on Securities |
Pension and Other Benefits |
Total | ||||||||||
| 2008: |
||||||||||||
| Net unrealized losses arising during the year |
$ | (266,176 | ) | $ | - | $ | (266,176 | ) | ||||
| Less: Realized losses included in net loss |
(60,856 | ) | - | (60,856 | ) | |||||||
| Net unrealized loss |
(205,320 | ) | - | (205,320 | ) | |||||||
| Change in benefit plan obligations |
- | (32,410 | ) | (32,410 | ) | |||||||
| Effect on DAC |
51,187 | - | 51,187 | |||||||||
| Effect on VOBA |
15,245 | - | 15,245 | |||||||||
| Policyholder account balances |
548 | - | 548 | |||||||||
| Deferred income taxes |
48,419 | 11,343 | 59,762 | |||||||||
| Other comprehensive loss |
$ | (89,921 | ) | $ | (21,067 | ) | (110,988 | ) | ||||
| Net loss |
(17,050 | ) | ||||||||||
| Comprehensive loss |
$ | (128,038 | ) | |||||||||
The following table provides accumulated balances related to each component of accumulated other comprehensive income (loss) at December 31.
| Unrealized Gain (Loss) on Non-Impaired Securities |
Unrealized Gain (Loss) on Impaired Securities |
Benefit Plan Obligations |
DAC/ VOBA Impact |
Policyholder Account Balances |
Tax Effect | Total | ||||||||||||||||||||||
| 2010: |
||||||||||||||||||||||||||||
| Beginning of year |
$ | 22,795 | $ | (22,566 | ) | $ | (57,402 | ) | $ | 1,055 | $ | - | $ | 19,641 | $ | (36,477 | ) | |||||||||||
| Other comprehensive income (loss) |
99,629 | 10,335 | 1,422 | (36,593 | ) | (7,430 | ) | (23,079 | ) | 44,284 | ||||||||||||||||||
| End of year |
$ | 122,424 | $ | (12,231 | ) | $ | (55,980 | ) | $ | (35,538 | ) | $ | (7,430 | ) | $ | (3,438 | ) | $ | 7,807 | |||||||||
| 2009: |
||||||||||||||||||||||||||||
| Beginning of year |
$ | (189,916 | ) | $ | (2,197 | ) | $ | (74,650 | ) | $ | 65,534 | $ | - | $ | 70,430 | $ | (130,799 | ) | ||||||||||
| Cumulative effect of change in accounting principle |
- | (13,507 | ) | - | 3,355 | - | 3,553 | (6,599 | ) | |||||||||||||||||||
| Other comprehensive income (loss) |
212,711 | (6,862 | ) | 17,248 | (67,834 | ) | - | (54,342 | ) | 100,921 | ||||||||||||||||||
| End of year |
$ | 22,795 | $ | (22,566 | ) | $ | (57,402 | ) | $ | 1,055 | $ | - | $ | 19,641 | $ | (36,477 | ) | |||||||||||
15. Accumulated Effect of Change in Accounting Principle
Effective for the period ended March 31, 2009, the Company adopted FASB guidance related to the recognition and presentation of other-than-temporary impairments. Pursuant to this guidance, the Company reviewed all previously-recorded other-than-temporary impairments of securities and developed an estimate of the portion of such impairments using a methodology consistent with that applied to the current period other-than-temporary bifurcation of credit and non-credit as of January 1, 2009. As a result, the Company determined that $13.5 million in previously recorded other-than-temporary impairments had been due to non-credit impairments as of January 1, 2009.
The process used by the Company in estimating the portion of previously recorded other-than-temporary impairments due to credit as of January 1, 2009 was consistent with the methodology currently employed for those securities determined to be other-than-temporarily impaired. Specifically, if the security is unsecured, secured by an asset or includes a guaranty of payment by a third-party, the estimate of the portion of impairment due to credit was based upon a comparison of ratings and maturity horizon for the security relative to historical default probabilities from one or more nationally recognized rating organizations. When appropriate for any given security, sector or period in the business cycle, the historical default probability was adjusted to reflect periods or situations of distress by adding to the default probability increments of standard deviations from mean historical results. The credit impairment analysis was supplemented by estimates of potential recovery values for the specific security, including the potential impact of the value of any secured assets, in the event of default. This information was used to determine the Company’s best estimate, derived from probability-weighted cash flows.
147
Table of Contents
Kansas City Life Insurance Company
Notes to Consolidated Financial Statements–(Continued)
Estimates of impairment due to credit involving collateralized securities were based upon review of projected cash flows relative to amortized cost at the time the security was determined to be other-than-temporarily impaired. The credit component of the impairment for these securities was determined to be the difference between the amortized cost of the security and the projected cash flows.
In addition, as an insurance enterprise, the Company must also consider the impact of DAC and VOBA on any realized and unrealized loss and the appropriate tax effect. The establishment of non-credit impairments to accumulated other comprehensive income (loss) in accordance with the guidance from retained earnings also requires a netting of applicable DAC and VOBA and income taxes. The methodology by which DAC and VOBA are calculated and applied to realized gains and losses is different than the methodology employed to calculate DAC and VOBA charges on unrealized gains and losses and results in differences among the transfer between retained earnings and accumulated other comprehensive income (loss).
In the implementation of this guidance at March 31, 2009, the Company recorded an opening balance adjustment that increased retained earnings in the amount of $8.4 million and increased accumulated other comprehensive loss in the amount of $6.6 million. The adjustment to retained earnings consisted of an increase of $8.8 million related to non-credit impairments taken in prior periods, net of tax. This adjustment also included a $0.4 million decrease due to offsetting adjustments to DAC and VOBA, net of tax. The adjustment to accumulated other comprehensive loss consisted of a decrease of $8.8 million related to non-credit impairments taken in prior periods, net of tax. This adjustment also included a $2.2 million increase due to offsetting adjustments to DAC and VOBA, net of tax.
16. Quarterly Consolidated Financial Data (unaudited)
The unaudited quarterly results of operations for the years ended December 31, 2010 and 2009 are summarized in the table below.
| First | Second | Third | Fourth | |||||||||||||
| 2010: |
||||||||||||||||
| Total revenues |
$ | 107,082 | $ | 106,580 | $ | 108,125 | $ | 109,576 | ||||||||
| Net income |
963 | 10,060 | 4,456 | 6,823 | ||||||||||||
| Per common share, basic and diluted |
0.08 | 0.88 | 0.39 | 0.60 | ||||||||||||
| 2009: |
||||||||||||||||
| Total revenues |
$ | 101,632 | $ | 101,728 | $ | 112,734 | $ | 104,551 | ||||||||
| Net income (loss) |
(4,548 | ) | 8,044 | 5,181 | 2,055 | |||||||||||
| Per common share, basic and diluted |
(0.40 | ) | 0.70 | 0.45 | 0.18 | |||||||||||
17. Commitments
In the normal course of business, the Company has open purchase and sale commitments. At December 31, 2010, the Company had purchase commitments to fund mortgage loans and affordable housing projects of $16.2 million. At December 31, 2010, the Company also had commitments to fund two construction-to-permanent loans of $5.2 million that are subject to the borrower’s performance.
Subsequent to December 31, 2010, the company entered into commitments to fund additional mortgage loans of $14.4 million and real estate and joint venture investments of $1.1 million and to sell real estate investments for $0.4 million. The Company has funded $2.4 million of the commitments on the two construction-to-permanent loans that were outstanding at December 31, 2010 as well as funded $1.1 million of the affordable housing purchases. In addition, the Company also has entered into a commitment to fund another construction-to-permanent loan of $2.8 million that is subject to the borrower’s performance.
148
Table of Contents
Kansas City Life Insurance Company
Notes to Consolidated Financial Statements–(Continued)
18. Contingent Liabilities
The life insurance industry, including the Company, has been subject to an increase in litigation in recent years. Such litigation has been pursued on behalf of purported classes of policyholders and other claims and legal actions in jurisdictions where juries often award punitive damages, which may be grossly disproportionate to actual damages.
Although no assurances can be given and no determinations can be made at this time, management believes that the ultimate liability, if any, with respect to these claims and actions, would not have a material effect on the Company’s business, results of operations or financial position.
19. Guarantees and Indemnifications
The Company is subject to various indemnification obligations issued in conjunction with certain transactions, primarily assumption reinsurance agreements, stock purchase agreements, mortgage servicing agreements, tax credit assignment agreements, construction and lease guarantees and borrowing agreements whose terms range in duration and often are not explicitly defined. Generally, a maximum obligation is not explicitly stated. Therefore, the overall maximum amount of the obligation under the indemnifications cannot be reasonably estimated. The Company is unable to estimate with certainty the ultimate legal and financial liability with respect to these indemnifications. The Company believes that the likelihood is remote that material payments would be required under such indemnifications and therefore such indemnifications would not result in a material adverse effect on the financial position or results of operations.
20. Subsequent Events
On January 24, 2011, the Kansas City Life Board of Directors declared a quarterly dividend of $ 0.27 per share, paid on February 9, 2011 to stockholders of record on February 3, 2011.
149
Table of Contents
Kansas City Life Insurance Company and Subsidiaries
Summary of Investments – Other Than Investments in Related Parties
December 31, 2010
| Type of Investment |
Cost | Fair Value | Amount Recognized in Consolidated Balance Sheets |
|||||||||
| Fixed maturity securities, available for sale: |
||||||||||||
| Bonds: |
||||||||||||
| United States government and government agencies and authorities |
$ | 56,576 | $ | 59,346 | $ | 59,346 | ||||||
| Residential mortgage-backed securities |
433,695 | 435,002 | 435,002 | |||||||||
| Public utilities |
298,626 | 324,800 | 324,800 | |||||||||
| Corporate |
1,482,602 | 1,565,138 | 1,565,138 | |||||||||
| All other bonds |
254,360 | 249,833 | 249,833 | |||||||||
| Redeemable preferred stocks |
14,866 | 14,769 | 14,769 | |||||||||
| Total |
2,540,725 | $ | 2,648,888 | 2,648,888 | ||||||||
| Equity securities, available for sale: |
||||||||||||
| Common stocks |
31,339 | 32,319 | 32,319 | |||||||||
| Perpetual preferred stocks |
4,954 | 6,002 | 6,002 | |||||||||
| Total |
36,293 | $ | 38,321 | 38,321 | ||||||||
| Mortgage loans |
559,167 | 559,167 | ||||||||||
| Real estate |
119,909 | 119,909 | ||||||||||
| Policy loans |
84,281 | 84,281 | ||||||||||
| Short-term investments |
15,713 | 15,713 | ||||||||||
| Other investments |
5,009 | 5,009 | ||||||||||
| Total investments |
$ | 3,361,097 | $ | 3,471,288 | ||||||||
See accompanying Report of Independent Registered Public Accounting Firm
150
Table of Contents
Kansas City Life Insurance Company
Condensed Financial Information of Registrant
Balance Sheets
| December 31 | ||||||||
| 2010 | 2009 | |||||||
| ASSETS |
||||||||
| Investments: |
||||||||
| Fixed maturity securities available for sale, at fair value |
$ | 2,124,791 | $ | 1,965,759 | ||||
| Equity securities available for sale, at fair value |
||||||||
| Investment in unconsolidated subsidiaries |
168,460 | 163,629 | ||||||
| Other |
31,660 | 30,481 | ||||||
| Mortgage loans |
493,699 | 400,320 | ||||||
| Real estate |
116,443 | 110,044 | ||||||
| Policy loans |
64,173 | 66,017 | ||||||
| Short-term investments |
11,052 | 117,968 | ||||||
| Total investments |
3,010,278 | 2,854,218 | ||||||
| Cash |
3,884 | 3,025 | ||||||
| Accrued investment income |
28,918 | 26,297 | ||||||
| Deferred acquisition costs |
92,689 | 105,956 | ||||||
| Reinsurance receivables |
116,412 | 104,813 | ||||||
| Property and equipment |
23,501 | 24,383 | ||||||
| Other assets |
74,756 | 95,078 | ||||||
| Separate account assets |
339,029 | 312,824 | ||||||
| Total assets |
$ | 3,689,467 | $ | 3,526,594 | ||||
| LIABILITIES |
||||||||
| Future policy benefits |
$ | 595,708 | $ | 576,394 | ||||
| Policyholder account balances |
1,777,547 | 1,751,663 | ||||||
| Policy and contract claims |
34,799 | 23,584 | ||||||
| Other policyholder funds |
125,898 | 118,344 | ||||||
| Other liabilities |
137,014 | 115,422 | ||||||
| Separate account liabilities |
339,029 | 312,824 | ||||||
| Total liabilities |
3,009,995 | 2,898,231 | ||||||
| STOCKHOLDERS' EQUITY |
||||||||
| Common stock, par value $1.25 per share |
||||||||
| Authorized 36,000,000 shares, issued 18,496,680 shares |
23,121 | 23,121 | ||||||
| Additional paid in capital |
41,085 | 41,068 | ||||||
| Retained earnings |
767,126 | 757,225 | ||||||
| Accumulated other comprehensive income (loss) |
7,807 | (36,477 | ) | |||||
| Treasury stock, at cost (2010 - 7,029,575 shares; 2009 - 6,931,589 shares) |
(159,667 | ) | (156,574 | ) | ||||
| Total stockholders' equity |
679,472 | 628,363 | ||||||
| Total liabilities and stockholders' equity |
$ | 3,689,467 | $ | 3,526,594 | ||||
See accompanying Report of Independent Registered Public Accounting Firm
151
Table of Contents
Schedule II
(continued)
Kansas City Life Insurance Company
Condensed Financial Information of Registrant
Statements of Income
| Year Ended December 31 | ||||||||||||
| 2010 | 2009 | 2008 | ||||||||||
| REVENUES |
||||||||||||
| Insurance revenues: |
||||||||||||
| Premiums, net |
$ | 84,038 | $ | 83,971 | $ | 74,788 | ||||||
| Contract charges |
89,990 | 88,831 | 90,944 | |||||||||
| Total insurance revenues |
174,028 | 172,802 | 165,732 | |||||||||
| Investment revenues: |
||||||||||||
| Net investment income |
142,327 | 142,570 | 142,020 | |||||||||
| Realized investment gains, excluding impairment losses |
2,953 | 9,540 | 9,794 | |||||||||
| Net impairment losses recognized in earnings: |
||||||||||||
| Total other-than-temporary impairment losses |
(3,481 | ) | (28,802 | ) | (57,071 | ) | ||||||
| Portion of impairment losses recognized in other comprehensive income (loss) |
262 | 12,337 | - | |||||||||
| Net impairment losses recognized in earnings |
(3,219 | ) | (16,465 | ) | (57,071 | ) | ||||||
| Total investment revenues |
142,061 | 135,645 | 94,743 | |||||||||
| Other revenues |
4,662 | 4,644 | 5,495 | |||||||||
| Total revenues |
320,751 | 313,091 | 265,970 | |||||||||
| BENEFITS AND EXPENSES |
||||||||||||
| Policyholder benefits |
135,077 | 131,479 | 129,514 | |||||||||
| Interest credited to policyholder account balances |
73,640 | 74,136 | 73,742 | |||||||||
| Amortization of deferred acquisition costs |
11,156 | 19,712 | 20,064 | |||||||||
| Operating expenses |
74,447 | 79,436 | 76,000 | |||||||||
| Total benefits and expenses |
294,320 | 304,763 | 299,320 | |||||||||
| Income (loss) before income tax expense (benefit) and equity in undistributed net income of subsidiaries |
26,431 | 8,328 | (33,350 | ) | ||||||||
| Income tax expense (benefit) |
9,799 | 3,603 | (10,662 | ) | ||||||||
| Income (loss) before equity in undistributed net income of subsidiaries |
16,632 | 4,725 | (22,688 | ) | ||||||||
| Equity in undistributed net income of subsidiaries |
5,670 | 6,007 | 5,638 | |||||||||
| NET INCOME (LOSS) |
$ | 22,302 | $ | 10,732 | $ | (17,050 | ) | |||||
| Comprehensive income (loss), net of taxes: |
||||||||||||
| Change in net unrealized gains and (losses) on securities available for sale |
$ | 32,057 | $ | 71,240 | $ | (69,328 | ) | |||||
| Change in benefit plan obligations |
1,422 | 11,212 | (21,067 | ) | ||||||||
| Other comprehensive income (loss) of subsidiaries |
10,805 | 18,469 | (20,593 | ) | ||||||||
| Other comprehensive income (loss) |
44,284 | 100,921 | (110,988 | ) | ||||||||
| COMPREHENSIVE INCOME (LOSS) |
$ | 66,586 | $ | 111,653 | $ | (128,038 | ) | |||||
See accompanying Report of Independent Registered Public Accounting Firm
152
Table of Contents
Schedule II
(continued)
Kansas City Life Insurance Company
Condensed Financial Statement of Registrant
Statements of Cash Flows
| Year Ended December 31 | ||||||||||||
| 2010 | 2009 | 2008 | ||||||||||
| OPERATING ACTIVITIES |
||||||||||||
| Net income (loss) |
$ | 22,302 | $ | 10,732 | $ | (17,050 | ) | |||||
| Equity in undistributed net income of subsidiaries |
(5,670 | ) | (6,007 | ) | (5,638 | ) | ||||||
| Adjustments to reconcile net income (loss) to net cash provided by operating activities: |
||||||||||||
| Amortization of investment premium |
2,579 | 3,348 | 4,026 | |||||||||
| Depreciation |
2,786 | 2,919 | 3,008 | |||||||||
| Acquisition costs capitalized |
(19,712 | ) | (18,267 | ) | (16,021 | ) | ||||||
| Amortization of deferred acquisition costs |
11,156 | 20,124 | 20,064 | |||||||||
| Realized investment gains |
266 | 6,925 | 47,277 | |||||||||
| Changes in assets and liabilities: |
||||||||||||
| Reinsurance receivables |
(11,599 | ) | (5,643 | ) | (7,599 | ) | ||||||
| Future policy benefits |
12,214 | 5,646 | 5,548 | |||||||||
| Policyholder account balances |
(21,537 | ) | (16,266 | ) | (10,721 | ) | ||||||
| Income taxes payable and deferred |
21,499 | 11,176 | (27,895 | ) | ||||||||
| Other, net |
8,386 | 6,182 | 12,511 | |||||||||
| Net cash provided |
22,670 | 20,869 | 7,510 | |||||||||
| INVESTING ACTIVITIES |
||||||||||||
| Purchases of investments: |
||||||||||||
| Fixed maturity securities |
(360,579 | ) | (256,429 | ) | (202,499 | ) | ||||||
| Equity securities |
(1,270 | ) | (3,214 | ) | (6,097 | ) | ||||||
| Mortgage loans |
(136,512 | ) | (55,920 | ) | (47,121 | ) | ||||||
| Real estate |
(12,238 | ) | (22,130 | ) | (31,091 | ) | ||||||
| Policy loans |
(11,953 | ) | (12,992 | ) | (8,473 | ) | ||||||
| Sales of investments: |
||||||||||||
| Fixed maturity securities |
66,972 | 108,721 | 26,245 | |||||||||
| Equity securities |
4,537 | 11,152 | 7,102 | |||||||||
| Real estate |
- | 2,066 | 30,035 | |||||||||
| Net sales (purchases) of short-term investments |
106,916 | (93,108 | ) | (6,086 | ) | |||||||
| Maturities and principal paydowns of investments: |
||||||||||||
| Fixed maturity securities |
219,607 | 196,859 | 208,824 | |||||||||
| Mortgage loans |
43,133 | 37,569 | 44,974 | |||||||||
| Policy loans |
13,797 | 15,045 | 12,617 | |||||||||
| Net acquisition of property and equipment |
(403 | ) | (309 | ) | (242 | ) | ||||||
| Net cash provided (used) |
(67,993 | ) | (72,690 | ) | 28,188 | |||||||
See accompanying Report of Independent Registered Public Accounting Firm
153
Table of Contents
Schedule II
(continued)
Kansas City Life Insurance Company
Condensed Financial Statement of Registrant
Statements of Cash Flows (Continued)
| Year Ended December 31 | ||||||||||||
| 2010 | 2009 | 2008 | ||||||||||
| FINANCING ACTIVITIES |
||||||||||||
| Proceeds from borrowings |
$ | 5,000 | $ | - | $ | 77,500 | ||||||
| Repayment of borrowings |
(5,000 | ) | - | (84,700 | ) | |||||||
| Deposits on policyholder account balances |
216,794 | 216,567 | 179,988 | |||||||||
| Withdrawals from policyholder account balances |
(172,911 | ) | (177,350 | ) | (211,384 | ) | ||||||
| Net transfers from separate accounts |
7,177 | 7,271 | 11,486 | |||||||||
| Change in other deposits |
2,954 | 4,572 | 1,269 | |||||||||
| Cash dividends to stockholders |
(12,401 | ) | (12,506 | ) | (12,483 | ) | ||||||
| Dividends from subsidiaries |
7,645 | 12,145 | 15,165 | |||||||||
| Net disposition (acquisition) of treasury stock |
(3,076 | ) | 309 | (16,773 | ) | |||||||
| Net cash provided (used) |
46,182 | 51,008 | (39,932 | ) | ||||||||
| Increase (decrease) in cash |
859 | (813 | ) | (4,234 | ) | |||||||
| Cash at beginning of year |
3,025 | 3,838 | 8,072 | |||||||||
| Cash at end of year |
$ | 3,884 | $ | 3,025 | $ | 3,838 | ||||||
See accompanying Report of Independent Registered Public Accounting Firm
154
Table of Contents
Kansas City Life Insurance Company and Subsidiaries
Supplementary Insurance Information
| Segment |
Deferred acquisition costs |
Future policy benefits, policy- holder account balances, and policy and contract claims |
Unearned premiums |
Other policyholder funds |
||||||||||||
| December 31, 2010: |
||||||||||||||||
| Individual |
$ | 108,997 | $ | 2,715,154 | $ | 401 | $ | 140,253 | ||||||||
| Group |
- | 31,640 | 1,030 | - | ||||||||||||
| Old American |
83,946 | 247,510 | 175 | 3,701 | ||||||||||||
| Total |
$ | 192,943 | $ | 2,994,304 | $ | 1,606 | $ | 143,954 | ||||||||
| December 31, 2009: |
||||||||||||||||
| Individual |
$ | 130,641 | $ | 2,669,521 | $ | 392 | $ | 132,599 | ||||||||
| Group |
- | 31,027 | 650 | - | ||||||||||||
| Old American |
78,854 | 248,653 | 184 | 4,022 | ||||||||||||
| Total |
$ | 209,495 | $ | 2,949,201 | $ | 1,226 | $ | 136,621 | ||||||||
See accompanying Report of Independent Registered Public Accounting Firm
155
Table of Contents
Schedule III
(continued)
Kansas City Life Insurance Company and Subsidiaries
Supplementary Insurance Information
| Segment |
Premium revenue2 |
Net investment income3 |
Policyholder benefits and interest credited to policyholder account balances |
Amortization of deferred policy acquisition costs |
Operating expenses 4 |
|||||||||||||||
| Year Ended December 31, 2010: |
||||||||||||||||||||
| Individual |
$ | 25,755 | $ | 162,997 | $ | 192,472 | $ | 14,976 | $ | 60,141 | ||||||||||
| Group |
49,355 | 553 | 32,131 | - | 21,917 | |||||||||||||||
| Old American |
65,229 | 12,309 | 44,343 | 12,057 | 19,095 | |||||||||||||||
| Intercompany eliminations 1 |
(528 | ) | - | - | - | (528 | ) | |||||||||||||
| Total |
$ | 139,811 | $ | 175,859 | $ | 268,946 | $ | 27,033 | $ | 100,625 | ||||||||||
| Year Ended December 31, 2009: |
||||||||||||||||||||
| Individual |
$ | 26,372 | $ | 164,133 | $ | 189,212 | $ | 24,023 | $ | 67,908 | ||||||||||
| Group |
48,980 | 554 | 33,799 | - | 19,479 | |||||||||||||||
| Old American |
62,261 | 12,741 | 42,692 | 11,103 | 16,523 | |||||||||||||||
| Intercompany eliminations 1 |
(546 | ) | - | - | - | (546 | ) | |||||||||||||
| Total |
$ | 137,067 | $ | 177,428 | $ | 265,703 | $ | 35,126 | $ | 103,364 | ||||||||||
| Year Ended December 31, 2008: |
||||||||||||||||||||
| Individual |
$ | 17,473 | $ | 164,243 | $ | 188,174 | $ | 24,304 | $ | 65,641 | ||||||||||
| Group |
48,763 | 525 | 32,956 | - | 18,950 | |||||||||||||||
| Old American |
61,517 | 12,651 | 44,518 | 10,685 | 15,899 | |||||||||||||||
| Intercompany eliminations 1 |
(587 | ) | - | - | - | (587 | ) | |||||||||||||
| Total |
$ | 127,166 | $ | 177,419 | $ | 265,648 | $ | 34,989 | $ | 99,903 | ||||||||||
| 1 | Elimination entries to remove intercompany transactions for life and accident and health insurance were as follows: insurance revenues from the Group Insurance segment and operating expenses from the Individual Insurance segment to arrive at Consolidated Statements of Income. |
| 2 | Premium revenue includes direct premiums and premiums from reinsurance assumed, reduced by premiums on reinsurance ceded. |
| 3 | Separate investment portfolios are maintained for each of the three life insurance companies. However, investment income is allocated to the Group Insurance segment based upon its cash flows and future policy benefit liabilities. |
| 4 | Operating expenses are allocated to the segments based upon internal cost studies, which are consistent with industry cost methodologies. |
156
Table of Contents
Kansas City Life Insurance Company and Subsidiaries
Reinsurance Information
Years Ended December 31
| Life Insurance Premiums | Accident and Health Premiums | |||||||||||||||||||||||
| 2010 | 2009 | 2008 | 2010 | 2009 | 2008 | |||||||||||||||||||
| Direct: |
||||||||||||||||||||||||
| Individual |
$ | 65,337 | $ | 64,994 | $ | 55,667 | $ | 529 | $ | 614 | $ | 720 | ||||||||||||
| Group |
10,676 | 10,964 | 11,445 | 47,608 | 46,047 | 44,763 | ||||||||||||||||||
| Old American |
66,540 | 63,788 | 63,239 | 1,340 | 1,555 | 1,762 | ||||||||||||||||||
| Intercompany Eliminations 1 |
(318 | ) | (328 | ) | (343 | ) | (210 | ) | (218 | ) | (244 | ) | ||||||||||||
| Total |
142,235 | 139,418 | 130,008 | 49,267 | 47,998 | 47,001 | ||||||||||||||||||
| Ceded: |
||||||||||||||||||||||||
| Individual |
(42,757 | ) | (41,869 | ) | (41,934 | ) | (639 | ) | (750 | ) | (753 | ) | ||||||||||||
| Group |
(1,613 | ) | (1,582 | ) | (1,905 | ) | (7,316 | ) | (6,449 | ) | (5,540 | ) | ||||||||||||
| Old American |
(1,763 | ) | (2,057 | ) | (2,366 | ) | (888 | ) | (1,025 | ) | (1,118 | ) | ||||||||||||
| Total |
(46,133 | ) | (45,508 | ) | (46,205 | ) | (8,843 | ) | (8,224 | ) | (7,411 | ) | ||||||||||||
| Assumed: |
||||||||||||||||||||||||
| Individual |
3,285 | 3,383 | 3,773 | - | - | - | ||||||||||||||||||
| Group |
- | - | - | - | - | - | ||||||||||||||||||
| Old American |
- | - | - | - | - | - | ||||||||||||||||||
| Total |
3,285 | 3,383 | 3,773 | - | - | - | ||||||||||||||||||
| Net |
$ | 99,387 | $ | 97,293 | $ | 87,576 | $ | 40,424 | $ | 39,774 | $ | 39,590 | ||||||||||||
| % of Assumed to Net |
3 | 3 | 4 | - | - | - | ||||||||||||||||||
| 1 | Elimination entries to remove intercompany transactions for life and accident and health insurance were as follows: insurance revenues from the Group Insurance segment to arrive at Consolidated Statements of Income. |
All other information required by this Schedule is shown in Note 13 - Reinsurance in the Notes to Consolidated Financial Statements.
See accompanying Report of Independent Registered Public Accounting Firm
157
Table of Contents
Schedule IV
(continued)
Kansas City Life Insurance Company and Subsidiaries
Reinsurance Information
Years Ended December 31
| Life Insurance In Force | ||||||||||||
| 2010 | 2009 | 2008 | ||||||||||
| (in millions) | ||||||||||||
| Direct: |
||||||||||||
| Individual |
$ | 23,849 | $ | 23,992 | $ | 24,524 | ||||||
| Group |
3,549 | 4,317 | 3,299 | |||||||||
| Old American |
931 | 892 | 868 | |||||||||
| Total |
28,329 | 29,201 | 28,691 | |||||||||
| Ceded: |
||||||||||||
| Individual |
(13,653 | ) | (13,714 | ) | (14,012 | ) | ||||||
| Group |
(426 | ) | (435 | ) | (434 | ) | ||||||
| Old American |
(37 | ) | (41 | ) | (46 | ) | ||||||
| Total |
(14,116 | ) | (14,190 | ) | (14,492 | ) | ||||||
| Assumed: |
||||||||||||
| Individual |
1,379 | 1,482 | 1,609 | |||||||||
| Group |
- | - | - | |||||||||
| Old American |
- | - | - | |||||||||
| Total |
1,379 | 1,482 | 1,609 | |||||||||
| Net |
$ | 15,592 | $ | 16,493 | $ | 15,808 | ||||||
| % of Assumed to Net |
9 | 9 | 10 | |||||||||
All other information required by this Schedule is shown in Note 13 - Reinsurance in the Notes to Consolidated Financial Statements.
See accompanying Report of Independent Registered Public Accounting Firm
158
Table of Contents
Kansas City Life Insurance Company and Subsidiaries
Valuation and Qualifying Accounts
| Year Ended December 31 | ||||||||||||
| 2010 | 2009 | 2008 | ||||||||||
| Mortgage loan allowance for loss: |
||||||||||||
| Beginning of year |
$ | 3,410 | $ | 3,410 | $ | 3,410 | ||||||
| Additions |
- | - | - | |||||||||
| Deductions |
- | - | - | |||||||||
| End of year |
$ | 3,410 | $ | 3,410 | $ | 3,410 | ||||||
| Allowance for uncollectible accounts: |
||||||||||||
| Beginning of year |
$ | 1,306 | $ | 2,853 | $ | 2,853 | ||||||
| Additions |
227 | - | 13 | |||||||||
| Deductions |
(889 | ) | (1,547 | ) | (13 | ) | ||||||
| End of year |
$ | 644 | $ | 1,306 | $ | 2,853 | ||||||
See accompanying Report of Independent Registered Public Accounting Firm
159
Table of Contents
Report of Independent Registered Public Accounting Firm
The Board of Directors and Stockholders
Kansas City Life Insurance Company
We have audited the accompanying consolidated balance sheets of Kansas City Life Insurance Company and subsidiaries as of December 31, 2010 and 2009, and the related consolidated statements of income, stockholders’ equity, and cash flows for each of the years in the three-year period ended December 31, 2010. In connection with our audits of the consolidated financial statements, we also have audited financial schedules I-V. We also have audited the Company’s internal control over financial reporting as of December 31, 2010, based on criteria established in Internal Control – Integrated Framework issued by the Committee of Sponsoring Organizations of the Treadway Commission (COSO). The Company’s management is responsible for these consolidated financial statements, for financial statement schedules, for maintaining effective internal control over financial reporting, and for its assessment of the effectiveness of internal control over financial reporting, included in the accompanying Management’s Assessment of Internal Control over Financial Reporting. Our responsibility is to express an opinion on these consolidated financial statements and financial schedules and an opinion on the Company’s internal control over financial reporting based on our audits.
We conducted our audits in accordance with the standards of the Public Company Accounting Oversight Board (United States). Those standards require that we plan and perform the audits to obtain reasonable assurance about whether the financial statements are free of material misstatement and whether effective internal control over financial reporting was maintained in all material respects. Our audits of the consolidated financial statements included examining, on a test basis, evidence supporting the amounts and disclosures in the financial statements, assessing the accounting principles used and significant estimates made by management, and evaluating the overall financial statement presentation. Our audit of internal control over financial reporting included obtaining an understanding of internal control over financial reporting, assessing the risk that a material weakness exists, and testing and evaluating the design and operating effectiveness of internal control based on the assessed risk. Our audits also included performing such other procedures as we considered necessary in the circumstances. We believe that our audits provide a reasonable basis for our opinions.
A company’s internal control over financial reporting is a process designed to provide reasonable assurance regarding the reliability of financial reporting and the preparation of financial statements for external purposes in accordance with generally accepted accounting principles. A company’s internal control over financial reporting includes those policies and procedures that (1) pertain to the maintenance of records that, in reasonable detail, accurately and fairly reflect the transactions and dispositions of the assets of the company; (2) provide reasonable assurance that transactions are recorded as necessary to permit preparation of financial statements in accordance with generally accepted accounting principles, and that receipts and expenditures of the company are being made only in accordance with authorizations of management and directors of the company; and (3) provide reasonable assurance regarding prevention or timely detection of unauthorized acquisition, use, or disposition of the company’s assets that could have a material effect on the financial statements.
Because of its inherent limitations, internal control over financial reporting may not prevent or detect misstatements. Also, projections of any evaluation of effectiveness to future periods are subject to the risk that controls may become inadequate because of changes in conditions, or that the degree of compliance with the policies or procedures may deteriorate.
In our opinion, the consolidated financial statements referred to above present fairly, in all material respects, the financial position of Kansas City Life Insurance Company and subsidiaries as of December 31, 2010 and 2009, and the results of their operations and their cash flows for each of the years in the three-year period ended December 31, 2010, in conformity with U.S. generally accepted accounting principles. Also, in our opinion, the related financial statement schedules, when considered in relation to the basic consolidated financial statements taken as a whole, present fairly, in all material respects, the information set forth therein. Also in our opinion, Kansas City Life Insurance Company and subsidiaries maintained, in all material respects, effective internal control over financial reporting as of December 31, 2010, based on criteria established in Internal Control – Integrated Framework issued by the Committee of Sponsoring Organizations of the Treadway Commission.
As discussed in note 1 to the consolidated financial statements, effective January 1, 2009, the Company changed its method of accounting for other-than-temporary impairments of debt securities due to the adoption of Financial Accounting Standards Board Accounting Standards Codification 320.
/s/ KPMG LLP
KPMG LLP
Kansas City, MO
February 28, 2011
160
Table of Contents
Item 9. Changes In and Disagreements With Accountants on Accounting and Financial Disclosure
None.
Item 9A. Controls and Procedures
As required by Exchange Act Rule 13a-15(b), Kansas City Life Insurance Company management, including the Chief Executive Officer and Chief Financial Officer, conducted an evaluation as of the end of the period covered by this report, of the effectiveness of the Company’s disclosure controls and procedures as defined in Exchange Act Rule 13a-15(e). Based on that evaluation, the Chief Executive Officer and Chief Financial Officer concluded that the Company’s disclosure controls and procedures were effective as of the end of the period covered by this report. As required by Exchange Act 13a-15(d), Kansas City Life Insurance Company management, including the Chief Executive Officer and Chief Financial Officer, also conducted an evaluation of the Company’s internal control over financial reporting to determine whether any changes occurred during the period covered by this report that materially affected, or are reasonably likely to materially affect the Company’s internal control over financial reporting. Based on that evaluation, there has been no such change during the period covered by this report. The independent registered public accounting firm that audited the financial statements included in the annual report containing the disclosure required by this Item has issued an attestation report on the registrant’s internal control over financial reporting.
Management’s Assessment of Internal Control Over Financial Reporting
Management of Kansas City Life Insurance Company and subsidiaries (the Company) is responsible for establishing and maintaining effective internal control over financial reporting. Management of the Company has conducted an assessment of the Company’s internal control over financial reporting at December 31, 2010 based on the criteria established in Internal Control – Integrated Framework issued by the Committee of Sponsoring Organizations of the Treadway Commission (COSO). Based upon that assessment, Management concluded that the Company’s internal control over financial reporting was effective at December 31, 2010.
Limitations on the Effectiveness of Controls
The Company’s internal control over financial reporting is a process designed to provide reasonable assurance regarding the reliability of financial reporting and the preparation of financial statements for external purposes in accordance with U.S. generally accepted accounting principles. The Company’s internal control over financial reporting includes those policies and procedures that (1) pertain to the maintenance of records that, in reasonable detail, accurately and fairly reflect the transactions and dispositions of the assets of the Company; (2) provide reasonable assurance that transactions are recorded as necessary to permit preparation of financial statements in accordance with generally accepted accounting principles, and that receipts and expenditures of the Company are being made only in accordance with authorizations of management and directors of the Company; and (3) provide reasonable assurance regarding prevention or timely detection of unauthorized acquisition, use, or disposition of the Company’s assets that could have a material effect on the financial statements.
Because of its inherent limitations, internal control over financial reporting cannot provide absolute assurance of achieving financial reporting objectives, and may not prevent or detect misstatements. Also, projections of any evaluation of effectiveness to a future period are subject to the risk that controls may become inadequate because of changes in conditions, or that the degree of compliance with the policies or procedures may deteriorate.
| 3520 Broadway, Kansas City, MO 64111 |
Contact: | Tracy W. Knapp, Chief Financial Officer, | ||
| (816) 753-7299, Ext. 8216 |
For Immediate Release: February 28, 2011, press release reporting financial results for the fourth quarter of 2010.
Kansas City Life Announces Fourth Quarter 2010 Results
Kansas City Life Insurance Company recorded net income of $6.8 million or $0.60 per share in the fourth quarter of 2010, an increase of $4.8 million or $0.42 per share over the same quarter in the prior year. The increase in earnings was primarily due to a $4.1 million change in realized investment gains and losses, moving to a realized gain in the current period from a realized loss in the prior year. Also contributing to the improved earnings were increases in insurance revenues and lower amortization of deferred acquisition costs (DAC) and operating expenses. Partially offsetting these improvements was an increase in policyholder benefits, principally from higher death benefits paid.
161
Table of Contents
Net income for 2010 was $22.3 million or $1.95 per share, an increase from $10.7 million or $0.93 per share for the same period in 2009. The changes that impacted the quarter were also consistent for the year, including a $10.6 million change in realized investment gains and losses, growth in insurance revenues, and lower amortization of DAC and operating expenses. Partially offsetting these improvements was an increase in policyholder benefits, primarily due to an increase in benefit and contract reserves.
Total life insurance premiums increased $0.8 million or 3% and $2.5 million or 2% for the fourth quarter and twelve months, respectively, compared to the prior year. New life insurance premiums increased $0.4 million or 11% and $2.3 million or 16% for the same respective periods. The growth for both periods was largely driven by increases of 21% for the quarter and 29% for the year in life insurance premiums from new sales in the Old American segment. In addition to the growth in new sales, total life insurance premiums improved from increases in renewal premiums in the fourth quarter from individual life insurance and group accident and health products, primarily in the short-term disability line. Likewise, renewal premiums also increased for the year from individual life insurance products. Deposits from new universal life and variable universal life products increased $2.2 million or 25% and $3.7 million or 33% for the same respective periods. The growth in overall new life insurance sales is primarily attributable to positive results being attained from the recruiting and improved productivity of general agents and agents, along with an improving economy.
Investment revenues were flat for the fourth quarter but declined 1% for the year. Gross investment income continued to be negatively affected by the low interest rate environment. The Company experienced realized investment gains of $1.3 million and $0.5 million in the fourth quarter and twelve months, respectively. These represented significant improvements from the realized losses recognized in the fourth quarter and twelve months one year earlier. Improvements in the overall investment environment, particularly including the credit markets, along with the stabilization of fair values on many previously distressed sectors contributed to the favorable changes during the year. In addition, the low interest rate and improving overall credit environment resulted in improved values within the Company’s investment portfolio. Specifically, the investment portfolio had a net unrealized gain position of $110.2 million at December 31, 2010, an improvement of $110.0 million from December 31, 2009.
Policyholder benefits increased $2.8 million and $4.0 million during the fourth quarter and twelve months, respectively. The increase for the quarter was due to an unfavorable change in mortality relative to the prior year, as net death benefits increased. The increase for the twelve months was primarily the result of greater benefit and contract reserves, which was largely the result of increased premiums in life insurance, immediate annuities and accident and health.
The amortization of DAC decreased $1.6 million or 18% for the fourth quarter and $8.1 million or 23% for the twelve months. The Company unlocked the assumptions of the DAC asset and had a change in estimate, which resulted in the recognition of $0.7 million in reduced amortization in the fourth quarter and $6.9 million earlier in the year. The assumptions regarding the DAC asset are reassessed no less often than annually, and unlocking occurs when the reassessment concludes that the historical results are no longer consistent with the current assumptions about product performance.
Finally, operating expenses declined $1.1 million or 4% for the fourth quarter and $2.7 million or 3% for the year compared with the prior year. The decrease in the fourth quarter reflected decreases in legal costs, pension expenses and separation costs. The decrease for the year reflected reduced salaries and benefits, including separation costs associated with staffing changes that were made in 2009, reduced pension expense and reduced legal costs.
On January 24, 2011, the Kansas City Life Board of Directors declared a quarterly dividend of $0.27 per share that was paid on February 9, 2011 to stockholders of record on February 3, 2011.
The Company extends its appreciation and best wishes to Mr. Daryl D. Jensen. Mr. Jensen announced his upcoming retirement from the Board of Directors. Mr. Jensen had been with the Company since 1973, serving as Sunset Life Insurance Company’s President and Chief Executive Officer until his retirement from that position in 1999. Mr. Jensen has also served on the Kansas City Life Board of Directors since 1978. Mr. Jensen was chairman of the Board’s Compensation Committee and also served on the Company’s Audit Committee. Mr. Jensen’s deep knowledge and understanding of the insurance industry, along with his management and financial experience, offered valuable support and perspective throughout the many years of his association with the Company. Mr. Jensen will be missed by the Company’s Board of Directors, and we offer our most sincere appreciation for his service and commitment to Kansas City Life Insurance Company.
Kansas City Life Insurance Company (NASDAQ: KCLI) was established in 1895 and is based in Kansas City, Missouri. The Company’s primary business is providing financial protection through the sale of life insurance and annuities. The Company’s revenues were $431.4 million in 2010, and assets and life insurance in force were $4.3 billion and $29.7 billion, respectively, as of December 31, 2010. The Company operates in 49 states and the District of Columbia. For more information, please visit www.kclife.com.
162
Table of Contents
KANSAS CITY LIFE INSURANCE COMPANY
CONDENSED CONSOLIDATED INCOME STATEMENT
(amounts in thousands, except share data)
| Quarter ended December 31 |
Year ended December 31 |
|||||||||||||||
| 2010 | 2009 | 2010 | 2009 | |||||||||||||
| Revenues |
$ | 109,576 | $ | 104,551 | $ | 431,363 | $ | 420,645 | ||||||||
| Net income |
$ | 6,823 | $ | 2,055 | $ | 22,302 | $ | 10,732 | ||||||||
| Net income per share, basic and diluted |
$ | 0.60 | $ | 0.18 | $ | 1.95 | $ | 0.93 | ||||||||
| Dividends paid |
$ | 0.27 | $ | 0.27 | $ | 1.08 | $ | 1.08 | ||||||||
| Average number of shares outstanding |
11,467,204 | 11,611,468 | 11,486,306 | 11,550,016 | ||||||||||||
163
Table of Contents
Item 10. Directors, Executive Officers and Corporate Governance
The information required by Item 10 is incorporated into Part III of this Annual Report on Form 10-K by reference to the Company’s definitive Proxy Statement for the Annual Meeting of Stockholders scheduled to be held on April 21, 2011.
The Company has adopted a Code of Ethics for Officers, Directors and Employees. Copies are available on the Company’s website at http://www.kclife.com and a copy may be obtained without charge upon written request to the Company Secretary, 3520 Broadway, Kansas City, MO 64111.
Item 11. Executive Compensation
The information required by Item 11 is incorporated into Part III of this Annual Report on Form 10-K by reference to the Company’s definitive Proxy Statement for the Annual Meeting of Stockholders scheduled to be held on April 21, 2011.
Item 12. Security Ownership of Certain Beneficial Owners and Management and Related Stockholder Matters
The information required by Item 12 is incorporated into Part III of this Annual Report on Form 10-K by reference to the Company’s definitive Proxy Statement for the Annual Meeting of Stockholders scheduled to be held on April 21, 2011.
Item 13. Certain Relationships and Related Transactions, and Director Independence
The information required by Item 13 is incorporated into Part III of this Annual Report on Form 10-K by reference to the Company’s definitive Proxy Statement for the Annual Meeting of Stockholders scheduled to be held on April 21, 2011.
Item 14. Principal Accounting Fees and Services
The information required by Item 14 is incorporated into Part III of this Annual Report on Form 10-K by reference to the Company’s definitive Proxy Statement for the Annual Meeting of Stockholders scheduled to be held on April 21, 2011.
Item 15. Exhibits, Financial Statement Schedules
| Page Number |
||||
| (a)(1) FinancialStatements (See Item 8: Financial Statements and Supplementary Data) |
85 | |||
| (a)(2) SupplementaryData and Financial Statement Schedules |
||||
Schedules are included at the following pages:
| Page Number |
||||
| I - Summary of Investments - Other than Investments in Related Parties, December 31, 2010 |
150 | |||
| II - Condensed Financial Information of Registrant, Years ended December 31, 2010, 2009 and 2008 |
151 | |||
| III - Supplementary Insurance Information, Years ended December 31, 2010, 2009 and 2008 |
155 | |||
| IV - Reinsurance Information, Years ended December 31, 2010, 2009 and 2008 |
157 | |||
| V - Valuation and Qualifying Accounts, Years ended December 31, 2010, 2009 and 2008 |
159 | |||
All other schedules are omitted as the required information is inapplicable or the information is presented in the financial statements or related notes.
164
Table of Contents
| (b) | Exhibits |
| Exhibit |
Basic Documents: | |
| 3(a) | Articles of Incorporation (as Restated in 1986 and Amended in 1999). [Filed as Exhibit 3(a) to the Company’s 10-Q Report for the quarter ended September 30, 1999 and incorporated herein by reference] | |
| 3(b) | Bylaws as Amended and Restated October 29, 2007. [Filed as Exhibits 3.1 and 3.2 to the Company's 8-K Report for October 30, 2007 and incorporated herein by reference] | |
| 4(a) | Specimen copy of Stock Certificate. [Filed as Exhibit 4(a) to the Company’s 10-Q Report for the quarter ended September 30, 1999 and incorporated herein by reference] | |
| 10(a) | Kansas City Life Deferred Compensation Plan, as amended and restated effective July 10, 2009, and as further amended effective September 1, 2009. [Filed as Exhibit 10(a) to the Company’s 10-K Report for 2009 and incorporated herein by reference] | |
| 10(b) | Kansas City Life Insurance Company Savings and Profit Sharing Plan, as amended and restated January 1, 2009, and further amended on December 30, 2009, and as further amended on December 30, 2010. [The January 1, 2009 amended and restated plan and the amendment dated December 30, 2009 were filed as filed Exhibit 10(b) to the Company’s 10-K Report for 2009 and incorporated herein by reference] | |
| 10(c) | Kansas City Life Employee Stock Plan, as amended and restated effective January 1, 2001, and as further amended effective January 1, 2006 and on December 1, 2006. [The amended and restated Plan was filed as Exhibit 10(c) to the Company’s 10-K Report for 2001 and incorporated herein by reference, the amendment effective January 1, 2006 was filed as Exhibit 10(c) to the Company’s 10-K Report for 2005 and incorporated herein by reference] | |
| 10(d) | Fourth Amendment, Kansas City Life Excess Benefit Plan, as amended and restated December 30, 2010. | |
| 10(e) | The Coinsurance Agreement between Kansas City Life Insurance Company and Transamerica Occidental Life Insurance Company of Cedar Rapids, Iowa effective January 19, 2005. [Filed as Exhibit 10(e) to the Company’s 2009 10-K/A and incorporated herein by reference]1 | |
| 10(f) | The Automatic YRT Reinsurance Agreement between Sunset Life Insurance Company of America and RGA Reinsurance Company effective January 1, 2002. [Filed as Exhibit 10(f) to the Company’s 2009 10-K/A and incorporated herein by reference]1 | |
| 10(g) | The Automatic and Facultative Reinsurance Agreement (Coinsurance Basis) between Kansas City Life Insurance Company and Security Life of Denver Insurance Company effective May 1, 2002. [Filed as Exhibit 10(g) to the Company’s 2009 10-K/A and incorporated herein by reference]1 | |
| 10(h) | The Automatic and Facultative Coinsurance Reinsurance Agreement between Kansas City Life Insurance Company and RGA Reinsurance Company effective May 1, 2002. [Filed as Exhibit 10(h) to the Company’s 2009 10-K/A and incorporated herein by reference]1 | |
| 10(i) | The Coinsurance Life Reinsurance Agreement between Old American Insurance Company and Employers Reassurance Corporation effective December 1, 1989. [Filed as Exhibit 10(i) to the Company’s 2009 10-K/A and incorporated herein by reference]1 | |
| 10(j) | Kansas City Life Insurance Company Voting Agreement. [Filed in the Company’s 8-K Report on November 3, 2004 and incorporated herein by reference] | |
| 10(k) | Kansas City Life Insurance Company Annual Incentive Plan Agreement. | |
165
Table of Contents
| 10(l) | Kansas City Life Insurance Company Long Term Incentive Plan Agreement. [Filed as Exhibit 10(l) to the Company’s 2009 10-K/A and incorporated herein by reference] | |
| 10(m) | Kansas City Life Insurance Company Severance Plan. | |
| 10(n) | Third and Fourth Amendments, Kansas City Life Insurance Company Cash Balance Pension Plan. | |
| 10(o) | Kansas City Life Insurance Company Employee Medical Plan. [Filed as Exhibit 10(o) to the Company’s 2009 10-K/A and incorporated herein by reference] | |
| 14 | Kansas City Life Insurance Company Code of Ethics for Officers, Directors and Employees. | |
| 21 | Subsidiaries. | |
| 23 | Consent of Independent Registered Public Accounting Firm. | |
| 31(a) | Section 302 Certification. | |
| 31(b) | Section 302 Certification. | |
| 32(a) | Section 1350 Certification. | |
| 99(a) | Prospectus for Kansas City Life Insurance Company Savings and Investment Plan. [Filed as Exhibit 99(e) to the Company’s 10-K Report for 2009 and incorporated herein by reference] | |
| 1 | Certain portions of this Exhibit have been omitted pursuant to an application for confidential treatment filed with the Securities and Exchange Commission. |
166
Table of Contents
Pursuant to the requirements of Section 13 or 15(d) of the Securities Exchange Act of 1934, the Registrant has duly caused this report to be signed on its behalf by the undersigned, thereunto duly authorized.
| KANSAS CITY LIFE INSURANCE COMPANY | ||
| By: |
/s/ David A. Laird | |
| David A. Laird | ||
| Vice President and Controller | ||
| (Principal Accounting Officer) | ||
| Date: February 28, 2011 | ||
Pursuant to the requirements of the Securities Exchange Act of 1934, this report has been signed below by the following persons on behalf of the Registrant and in the capacities and on the dates indicated.
| By: /s/ R. Philip Bixby |
By: /s/ Tracy W. Knapp | |
| R. Philip Bixby |
Tracy W. Knapp | |
| Director; President, Chief |
Director; Senior Vice President, Finance | |
| Executive Officer and Chairman |
(Principal Financial Officer) | |
| of the Board |
Date: February 28, 2011 | |
| (Principal Executive Officer) |
||
| Date: February 28, 2011 |
By: /s/ William A. Schalekamp | |
| William A. Schalekamp | ||
| By: /s/ Walter E. Bixby |
Director | |
| Walter E. Bixby |
Date: February 28, 2011 | |
| Director and Vice Chairman |
||
| of the Board |
By: /s/ Cecil R. Miller | |
| Date: February 28, 2011 |
Cecil R. Miller | |
| Director | ||
| By: /s/ John C. Cozad |
Date: February 28, 2011 | |
| John C. Cozad |
||
| Director |
By: /s/ Michael Braude | |
| Date: February 28, 2011 |
Michael Braude | |
| Director | ||
| By: /s/ Kevin G. Barth |
Date: February 28, 2011 | |
| Kevin G. Barth |
||
| Director |
||
| Date: February 28, 2011 |
||
| By: /s/ Mark A. Milton |
||
| Mark A. Milton |
||
| Director; Senior Vice President, Actuary |
||
| Date: February 28, 2011 |
||
167