Attached files
| file | filename |
|---|---|
| 8-K - FORM 8-K - Bancorp, Inc. | d8k.htm |
 Follow-On Offering of Common Stock
NASDAQ: TBBK
February / March 2011
Exhibit 99.1 |
 1
Forward Looking Statements
Safe Harbor Regarding Forward-Looking Statements
This presentation may contain forward-looking information about The Bancorp,
Inc. (“the Company”) that is intended to be covered by
the
safe
harbor
for
forward-looking
statements
provided
by
the
Private
Securities
Litigation
Reform
Act
of
1995.
Actual
results
and trends could differ materially from those set forth in such statements due to
various risks, uncertainties and other factors. Such risks,
uncertainties and other factors that could cause actual results and experience to differ from those projected include, but are
not limited to, the following: ineffectiveness of the Company’s business
strategy due to changes in current or future market conditions;
the
effects
of
competition,
and
of
changes
in
laws
and
regulations,
including
industry
consolidation
and
development
of
competing financial products and services; interest rate movements; changes in
credit quality; volatilities in the securities markets; and deteriorating
economic conditions, and other risks and uncertainties, including those detailed in the Company’s filings with the
Securities and Exchange Commission. The statements are valid only as of the
date hereof and the Company disclaims any obligation to update this
information except as may be required by applicable law. Free Writing
Prospectus Statement The Company has filed a registration statement
(including a prospectus and a related prospectus supplement) with the SEC (File
No. 333-170613) for the offering to which this communication relates.
Before you invest, you should read the prospectus and the prospectus
supplement in that registration statement, the preliminary prospectus supplement and other documents that the
Company has filed with the SEC for more complete information about the Company and
the offering. You may obtain these documents
without
charge
by
visiting
EDGAR
on
the
SEC
website
at
www.sec.gov.
Alternatively,
copies
of
the
preliminary
prospectus supplement and the prospectus relating to the offering may be obtained
from UBS Securities LLC, 299 Park Avenue, New York, NY 10171, Attention:
Prospectus Department, (888) 827-7275, or Sandler O'Neill + Partners, L.P., 919 Third Avenue, 6th
Floor, New York, NY 10022, (866) 805-4128. |
 2
Offering Summary
Issuer:
The Bancorp, Inc. (“The Bancorp”
or the "Company")
Ticker/Exchange:
TBBK / NASDAQ Global Select Market
Offering:
Follow-on Public Offering
Type of Security:
Common Stock
Transaction Size:
Approximately $50 million
Over-Allotment Option:
15%
Use of Proceeds:
General corporate purposes
Joint Book-Running Managers:
UBS Securities LLC
Sandler O’Neill + Partners, L.P.
Co-Manager:
Sterne, Agee & Leach, Inc. |
 Offering Rationale:
–
Increase
tangible
common
equity
(TCE/TA¹
to
9.7%)
and
regulatory
capital
ratios
(TRBC¹
to
16.0%)
to
further
enable
balance sheet
growth and profitability enhancement through continued business line expansion and
organic growth opportunities Strategic Goal:
–
Create and grow a stable, profitable institution with the optimum reliance on
capital, risk management and technology, and manage it with knowledgeable
and experienced management and senior officers Tactical Approach:
–
Deposits –
Utilize a branchless banking network to gather scalable deposits through strong
contractual relationships at costs significantly below peers
–
Assets –
Focus on asset classes, including loans and securities, appropriate to our
expertise to deliver the requisite risk-adjusted returns to achieve
above-peer net interest margins –
Non-Interest
Income
–
Generate
non-interest
income,
through
our
deposit
and
asset
approaches,
sufficient
to
offset
non-interest
expenses
3
Planning for Growth with Safety and Soundness
(1) Assumes (i) net proceeds received in the offering of $47.0 million and (ii) new
assets risk-weighted at 20%; please reference non-GAAP reconciliation on page
25 for TCE/TA reconciliation |
 4
Unprecedented Market Opportunity for Growth
The Bancorp is uniquely positioned to take advantage of recent industry trends,
regulatory changes, and competitor dislocation, all of which will enable
strong growth for The Bancorp and create a compelling use of capital in the
near and longer term Industry trends are from "paper to plastic",
"credit to debit", and "manual to electronic", all of which support The
Bancorp's continued strong growth and are unique strengths of The Bancorp's unique
market positioning Through The Bancorp's affinity relationships, the company
will continue to provide fee based services and aggregate low-cost
deposit bases as more financial services firms turn to partners with scale, strong regulatory
standing and compliance records, and niche experience
The Bancorp’s ability to leverage large affinity relationships for the
distribution of its products and services provides outsized forward growth
opportunity Recent
legislative
changes
will
push
larger
companies
to
partner
with
firms
like
The
Bancorp
to
protect
current
revenue
Because of these strong growth trends and favorable industry dynamics, The
Bancorp's competitive position has improved dramatically over the last
several years through enhanced scale, reputation, personnel and
capabilities |
 5
Investment Highlights
Experienced senior management team with significant inside ownership of more than
13% and a track record of performance and shareholder returns at previous
institutions The Company has experienced considerable growth through
strategic initiatives and targeted acquisitions and is well-positioned
to further leverage its existing infrastructure to capitalize on
opportunities in its markets of operation
–
In 2010, The Bancorp’s deposits grew 22%
–
Low-cost, stable funding base through multi-channel deposit gathering
strategy in niche products Weighted
average
cost
of
deposits
of
0.58%
for
the
quarter
ended
December
31,
2010
Asset quality compares favorably to peers due to disciplined underwriting and
long-standing relationships with a significant percentage of the
Company's borrowers –
Community bank assets originated by experienced lenders in relatively stable
markets –
Non-accrual
loans
represent
0.94%
of
total
loans
at
12/31/2010,
compared
to
2.04%
for
regional
peers
(1)
Solid capital position and asset quality permits the Company to be on the offensive
and forward-thinking at a time when many competitors are forced to
operate in a reactionary manner (1) Publicly-traded Mid-Atlantic
commercial banks with assets between $1 billion and $4 billion as of December 31, 2010
Source: SNL Financial |
 6
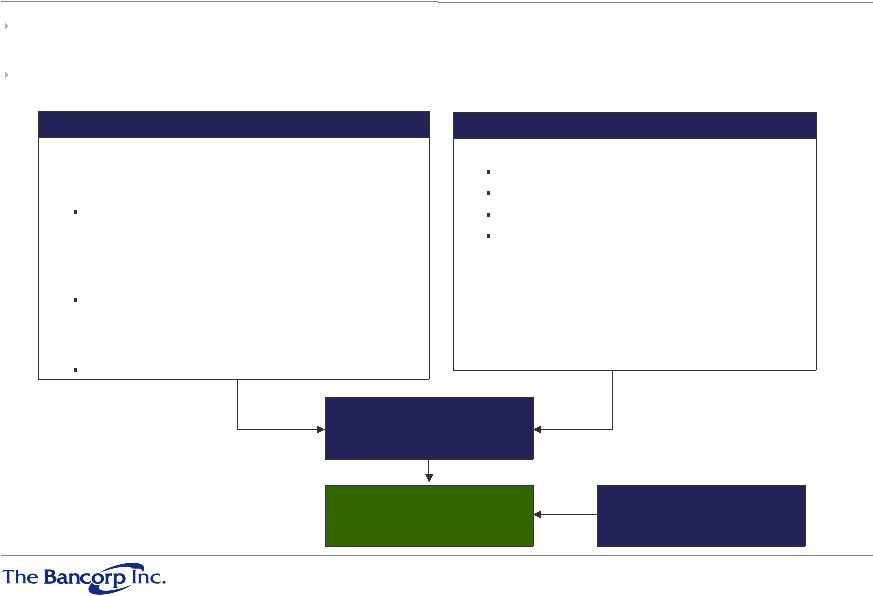
DEPOSITS
•
Private-Label Banking: stable, lower-cost core deposits
Healthcare
Merchant Processing
Prepaid Cards
Wealth Management
•
Community Bank
Net Interest Margin
INCOME
Non-Interest Income:
Stored value, leasing and
merchant processing
Business Model: A Distinct Business
Strategy A commercial bank founded in 2000 headquartered in Wilmington,
Delaware with approximately $2.4 billion in assets, $1.6 billion in
outstanding loan balances and $2.0 billion of deposits at 12/31/2010
Employs a primarily branchless deposit strategy that delivers a full array of
commercial and consumer banking services both locally and nationally through
private label banking products ASSETS
•
Above-peer credit quality, well-collateralized loans
to businesses and individuals in the Philadelphia/Wilmington
market area:
Commercial lending, commercial & residential
real estate, construction lending
•
Automobile Fleet Leasing
•
Wealth Management Lending:
Securities backed loans
•
SBA Guaranteed Lending Program for National Franchises
•
Securities Portfolio:
Primarily highly rated government obligations |
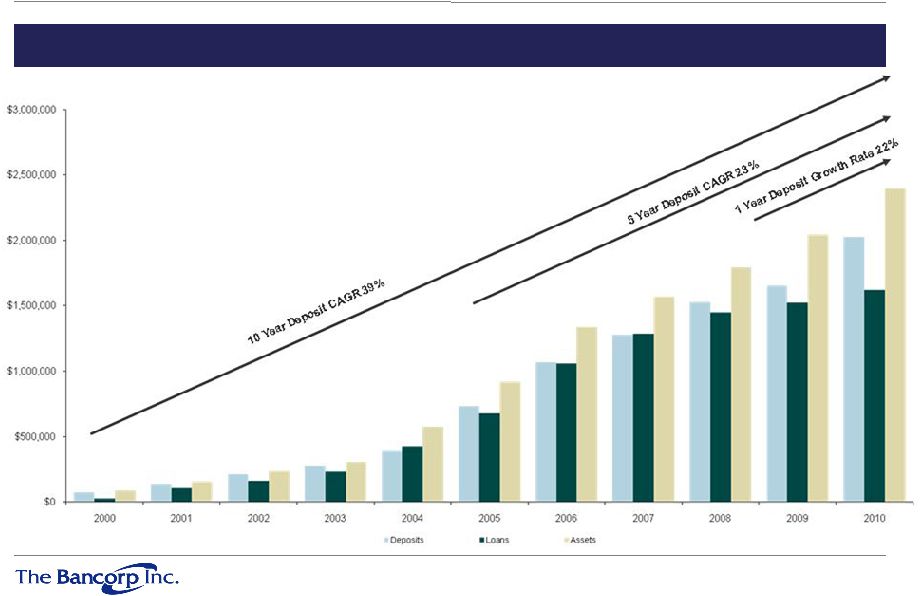 7
Track Record of Significant Growth Since Inception
Since 2005, The Bancorp has grown total assets at a compound annual growth rate of
over 20% |
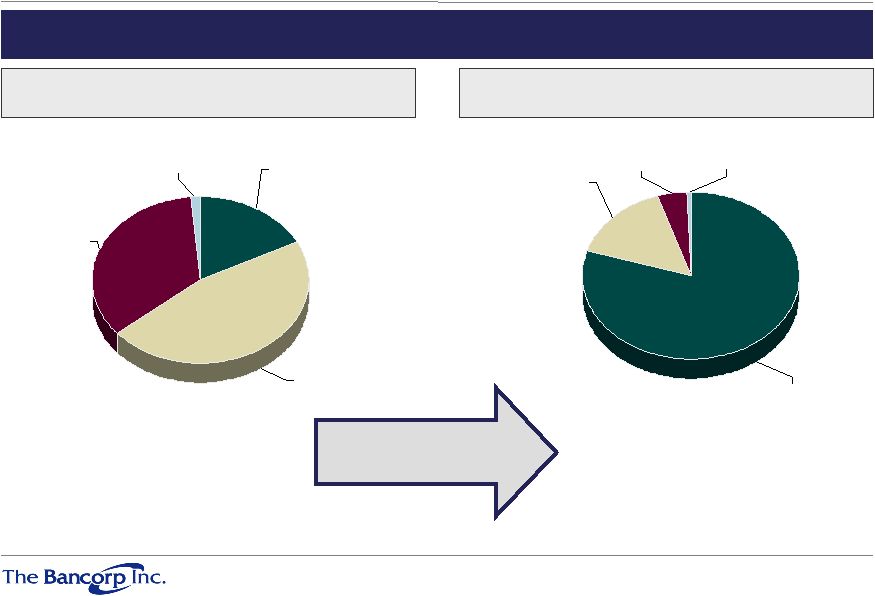 8
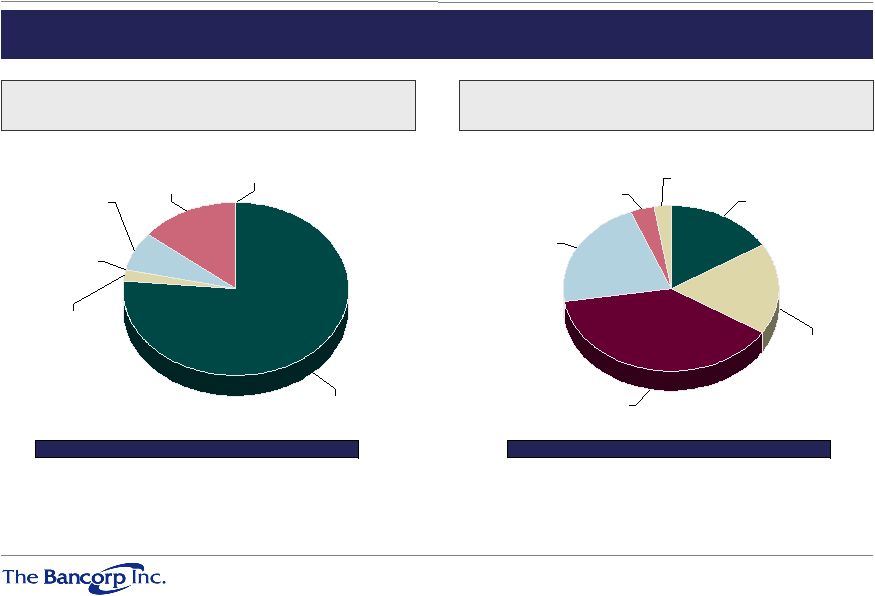
The
Bancorp
has
leveraged
its
private
label
partnerships
to
grow
core
deposits
meaningfully
in
recent
periods and expects that business to continue to grow through increased market
penetration December 31, 2005
December 31, 2010
Transaction
17.6%
MMDA &
Savings
46.3%
CDs < $100k
34.8%
CDs > $100k
1.3%
Transaction
79.7%
MMDA &
Savings
15.2%
CDs < $100k
4.5%
CDs > $100k
0.6%
Total Deposits: $0.732bn
YTD Average Cost: 2.43%
Peer¹
Average Cost: 1.67%
Total Deposits: $2.0bn
YTD Average Cost: 0.67%
Peer¹
Average Cost: 0.79%
34% CAGR of non-CD deposits
Significant reduction in average
cost of deposits
Growth Engine: Strong Growth in Deposit
Business Lines at Low Cost (1) Publicly-traded Mid-Atlantic
commercial banks with assets between $1 billion and $4 billion at December 31, 2010
Source: SNL Financial |
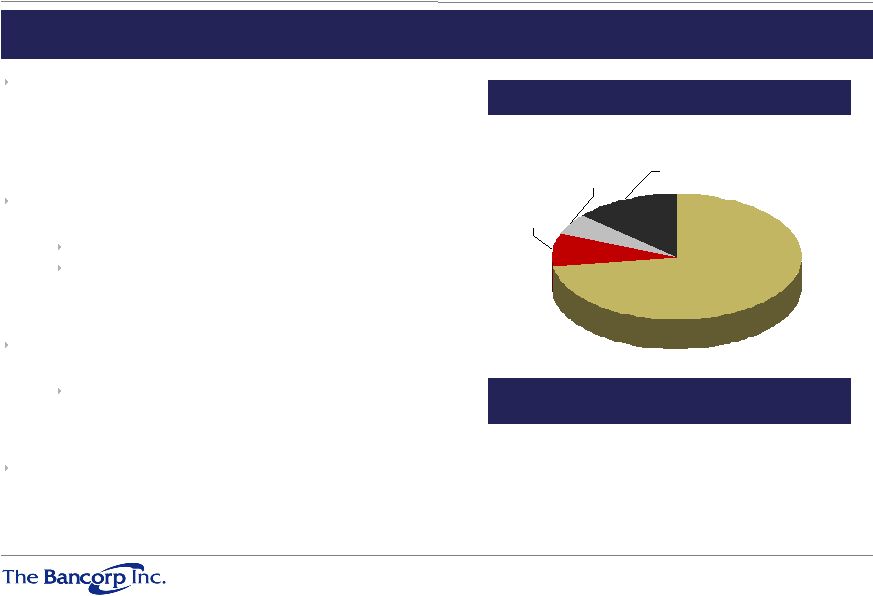
 9
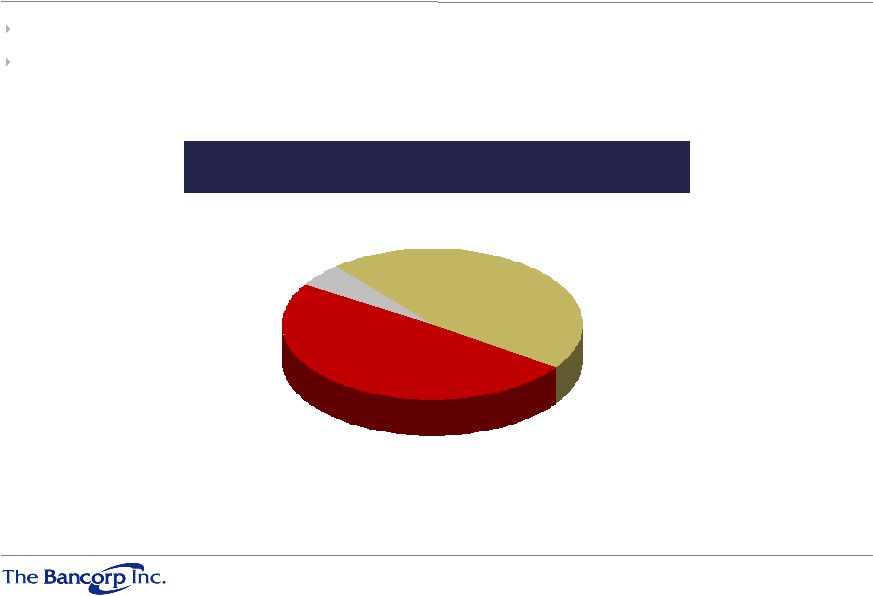
Significant growth in stored value, health care and other deposit business lines
support decreasing average cost of deposits
1031 Exchange,
0.0%
Community Bank,
76.4%
Stored Value,
0.0%
Wealth
Management,
7.1%
Health Care, 2.3%
Merchant
Processing,
14.2%
Growth Engine: Strong Growth in Deposit
Business Lines at Low Cost Stored Value
38.6%
Health Care
17.8%
Community
Bank
16.1%
1031
Exchange
2.5%
Merchant
Processing
3.7%
Wealth
Management
21.3%
December 31, 2005
December 31, 2010
Category
Balance
Average Cost
Community Bank
$559mm
2.32%
Merchant Processing
$104mm
2.29%
Wealth Management
$52mm
3.70%
Health Care
$17mm
2.21%
Stored Value
$0mm
NA
10/31 Exchange
$0mm
NA
Category
Balance
Average Cost
Stored Value
$781mm
0.11%
Wealth Management
$431mm
0.73%
Health Care
$360mm
1.12%
Community Bank
$327mm
0.58%
Merchant Processing
$75mm
0.41%
10/31 Exchange
$50mm
1.21% |
 10
Deposit-Generating Strategies: Sticky
and Long-Term
3 < > 5
years
5%
1 < > 3
years
49%
< 1 year
46%
The Bancorp has long-term, often exclusive agreements in place with its
private-label banking partners We have retained 99% of maturing
contracts Private Label Agreements by Remaining Contractual Term
|
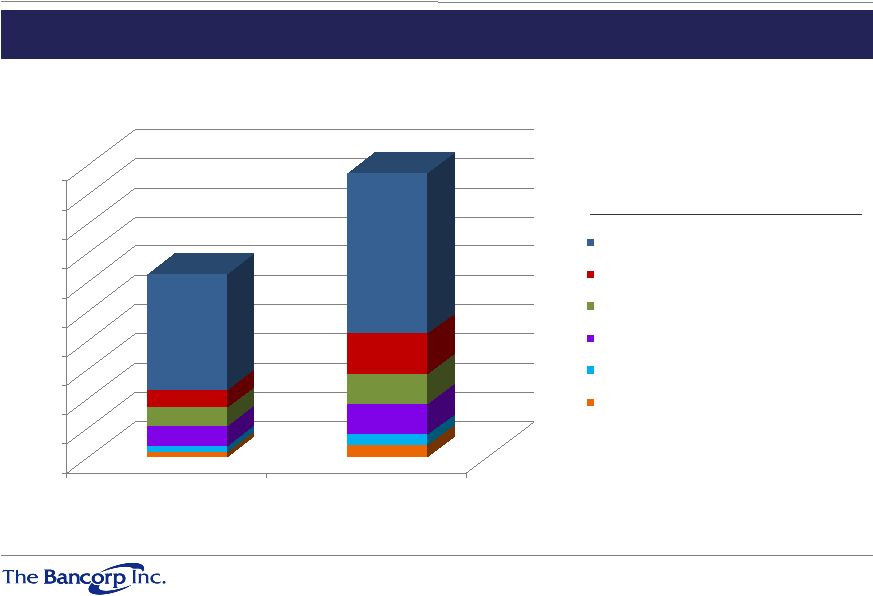 $0.0
$2.0
$4.0
$6.0
$8.0
$10.0
$12.0
$14.0
$16.0
$18.0
$20.0
2009
2010
Stored value income: 38%
Leasing income: 133%
Merchant income: 65%
Deposit Service fees: 56%
Debit card income: 48%
Other: 153%
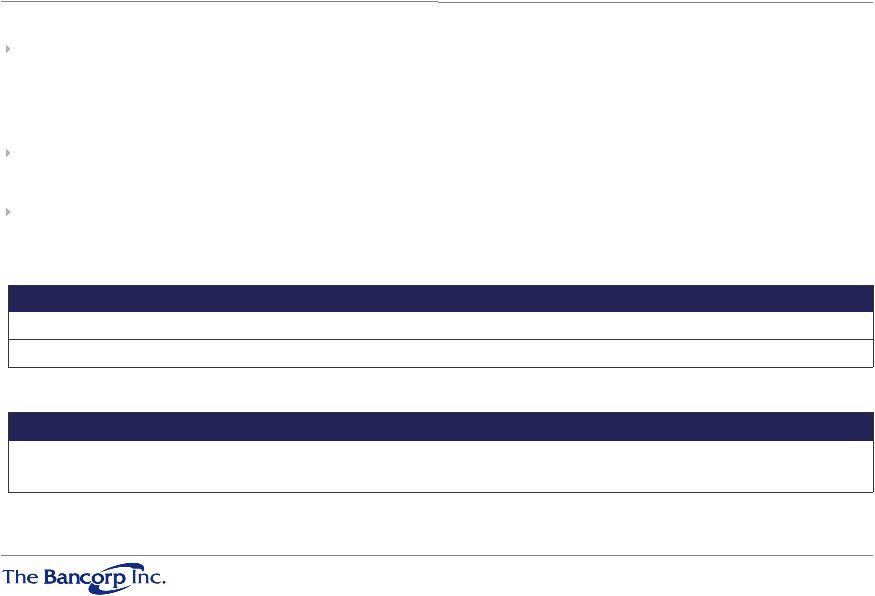
11
Non-Interest Income-Generating Strategies: Growth and Sustainability
Continued
growth
in
non-interest
income
(1)
from
all
business
segments
(1)
Excludes
a
gain
of
$1.1
million
on
sale
of
investments
and
$2.2
million
of
securities
impairments
in
2009
and
a
$1.2
million
gain
on
sale
of
investments
and
$0.135 million of securities impairments in 2010
Year-over-Year Percentage Growth
Dollars in millions |
 12
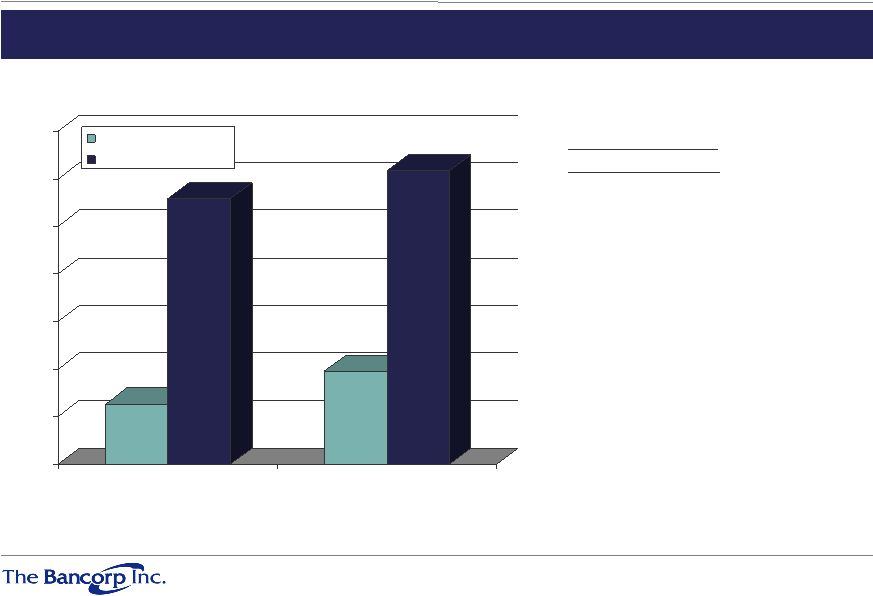
Non-Interest Income-Generating Strategies: Growth and Sustainability
Continued growth in non-interest income
(1)
relative to non-interest expense
$0.0
$10.0
$20.0
$30.0
$40.0
$50.0
$60.0
$70.0
2009
2010
Non-interest Income
Non-interest Expense
Non-interest Income /
Non-interest Expense
2009:
23%
2010:
32%
Dollars in millions
(1) Excludes a gain of $1.1 million on sale of investments and $2.2 million of
securities impairments in 2009 and a $1.2 million gain on sale of
investments and $0.135 million of securities impairments in 2010
|
 13
Primary Asset-Generating Strategies:
Business Line Overview
Category
Balance
(in thousands)
Avg. Yield
Community Bank
$ 1,358,349
4.92%
Wealth Management
$ 157,471
3.36%
Leasing Portfolio
$ 103,289
8.93%
Investment Securities
$ 252,529
4.30%
Community
Bank
Lending
72.6%
Wealth
Management
Lending
8.4%
Leasing
Portfolio
5.5%
Investment
Securities
13.5%
December 31, 2010
Community Bank
–
Offers traditional community banking products and
services
targeting the highly fragmented Philadelphia/Wilmington
banking market
Leasing Portfolio
–
Well-collateralized automobile fleet leasing
Primarily Eastern United States
Average transaction: 8-15 automobiles, $350,000
–
50% of portfolio leased by state and federal agencies
Wealth Management
–
16 partners, managing $200 billion in assets
SEI Investments, Legg Mason
–
Generates securities-backed loans and other loans
Securities
–
High credit quality tax-exempt municipal obligations
–
U.S. Government agency securities
As with funding, The Bancorp employs a multi-channel growth strategy for loan
origination, with the primary driver being its regional commercial banking
operations |
 14
Well-Positioned in Attractive, Stable Markets
Home Prices 3Q2007 to 3Q2010
Home Prices 3Q2009 to 3Q2010
United States
(1)
-24.7%
-1.5%
Philadelphia, PA
(1)
-8.4%
-1.0%
1st
Quarter 2010
US
NJ
DE
PA
% of Homes with Negative
Equity
(2)
22.5%
15.2%
13.3%
7.4%
Commercial lending is substantially all in greater Philadelphia/Wilmington
metropolitan area –
Consists of the 12 counties surrounding Philadelphia and Wilmington, including
Philadelphia, Delaware, Chester, Montgomery, Bucks and Lehigh Counties in
Pennsylvania; New Castle County in Delaware; and Mercer, Burlington, Camden, Ocean and
Cape May Counties in New Jersey
Philadelphia/Wilmington and the surrounding markets encompass a large population,
stable economic activity and attractive demographics
Throughout the current down cycle and in prior cycles, the Philadelphia region has
exhibited relative stability, which is reflected in a lesser reduction in
housing prices and negative equity compared to the rest of the nation, as
shown below (1) Fiserv, Inc., February 2011
(2) CoreLogic |
 15
Historical Loan Portfolio Overview
Proven track record of originating high quality loans
–
Loan
/
Deposit
ratio
stands
at
approximately
80%
at
December
31,
2010
–
Non-accrual / Loans of 0.94% at December 31, 2010
(1) Loans balances exclude deferred loan costs
(2) Prior to December 31, 2007, construction loans were not broken out by category
Robust growth through strong community relationships, while maintaining
conservative underwriting standards
110,930
107,096
142,171
140,129
Construction: Commercial, Acquisition and
Development
26.1%
194,320
178,608
157,446
144,882
108,374
61,017
Security-Backed Loans and Other
29.9%
441,799
402,232
353,219
325,166
199,397
119,654
Commercial & Industrial
(Dollar Values in Thousands)
2005
2006
2007
2008
2009
2010
CAGR
Commercial Mortgage
190,153
327,639
369,124
488,986
569,434
580,780
25.0%
Construction
168,149
275,079
307,614
305,889
207,184
203,120
3.9%
Direct Financing Leases, Net
81,162
92,947
89,519
85,092
78,802
103,289
4.9%
Residential Mortgage
62,378
62,413
50,193
57,636
85,759
93,004
8.3%
Total Loans
(1)
682,513
1,065,849
1,286,498
1,448,268
1,522,019
1,616,312
18.8%
Supplemental loan data
(2)
Construction: 1-4 Family
167,485
163,718
100,088
92,190
Total Construction
307,614
305,889
207,184
203,120 |
 0.00%
0.50%
1.00%
1.50%
2.00%
2.50%
2007
2008
2009
Mar-10
Jun-10
Sep-10
Dec-10
TBBK
Regional Peers
0.60%
0.70%
0.80%
0.90%
1.00%
1.10%
1.20%
1.30%
1.40%
1.50%
1.60%
2007
2008
2009
Mar-10
Jun-10
Sep-10
Dec-10
TBBK
Regional Peers
40%
60%
80%
100%
120%
140%
160%
2007
2008
2009
Mar-10
Jun-10
Sep-10
Dec-10
TBBK
Regional Peers
0.0%
5.0%
10.0%
15.0%
20.0%
25.0%
2007
2008
2009
Mar-10
Jun-10
Sep-10
Dec-10
TBBK
Regional Peers
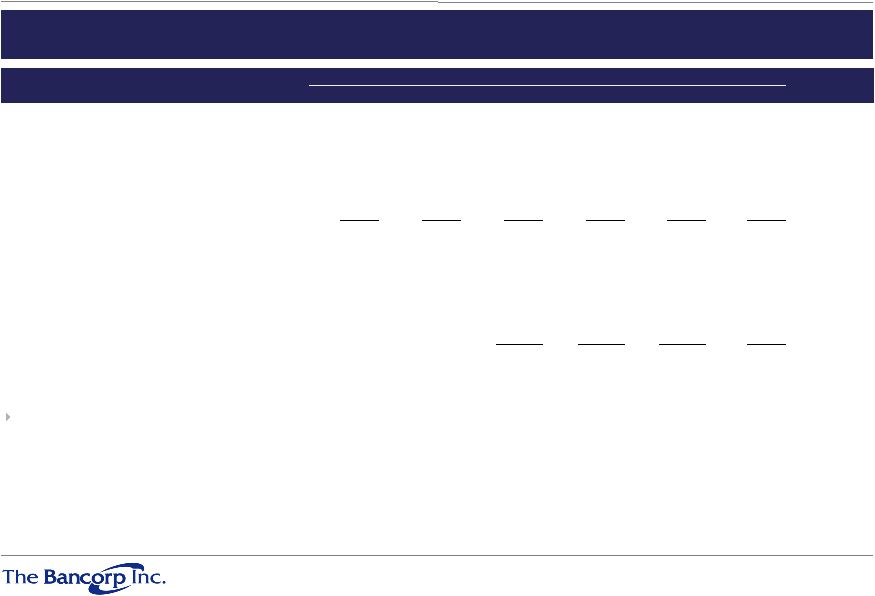
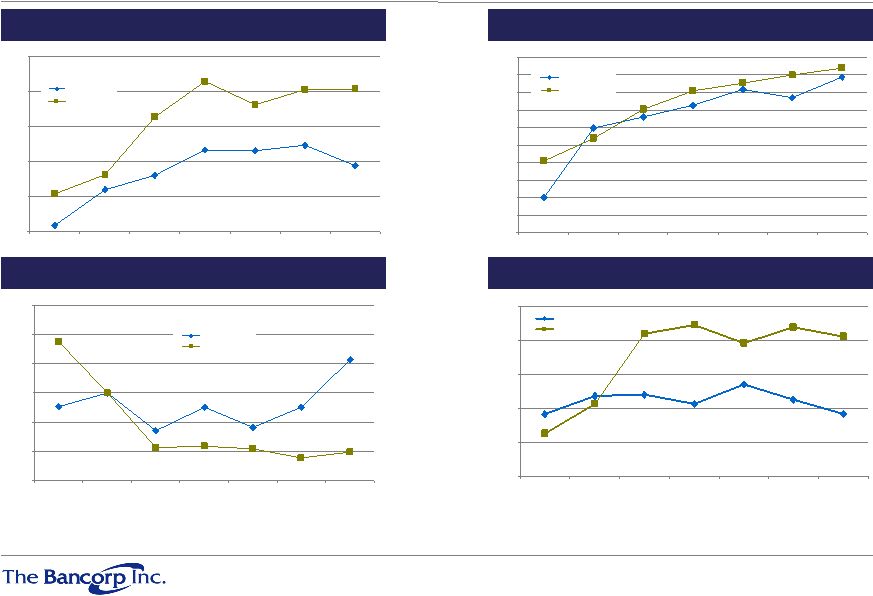
16
Asset Quality Review
Non-accrual Loans / Total Loans
(1)
Reserves / Gross Loans
(1)
Reserves / NPAs
(1)(2)
(1) Regional peers include publicly traded Mid-Atlantic commercial banks with
assets between $1 billion and $4 billion as of December 31, 2010; graphs represent median values
(2) NPAs
include non-accrual loans, loans 90+days past due, restructured loans and
OREO (3)
Texas
Ratio
=
(Non-accrual
Loans
+
Restructured
Loans
+
Loans
90+PD
+
OREO)
/
(Loan
Loss
Reserves
+
Tangible
Common
Equity)
Source: SNL Financial
Texas Ratio
(1)(3) |
 17
Investment Highlights
Experienced senior management team with significant inside ownership of more than
13% and a track record of performance and shareholder returns at previous
institutions The Company has experienced considerable growth through
strategic initiatives and targeted acquisitions and is well-positioned
to further leverage its existing infrastructure to capitalize on
opportunities in its markets of operation
–
In 2010, The Bancorp’s deposits grew 22%
–
Low-cost, stable funding base through multi-channel deposit gathering
strategy in niche products Weighted
average
cost
of
deposits
of
0.58%
for
the
quarter
ended
December
31,
2010
Asset quality compares favorably to peers due to disciplined underwriting and
long-standing relationships with a significant percentage of the
Company's borrowers –
Community bank assets originated by experienced lenders in relatively stable
markets –
Non-accrual
loans
represent
0.94%
of
total
loans
at
12/31/2010,
compared
to
2.04%
for
regional
peers
(1)
Solid capital position and asset quality permits the Company to be on the offensive
and forward-thinking at a time when many competitors are forced to
operate in a reactionary manner (1) Publicly-traded Mid-Atlantic
commercial banks with assets between $1 billion and $4 billion as of December 31, 2010
Source: SNL Financial |
| Appendix
*
*
*
*
* |
 19
Strong Senior Management Team with a Wealth of Experience
Highly experienced senior management team with an aggregate of over 140 years of
experience providing middle market banking services
–
Management
has
a
significant
history
together
as
most
are
former
executives
of
a
prior
bank
which
was
sold
in
November
1999
Inside ownership over 13% (fully diluted)
Executive
Title
Banking Experience
Betsy Z. Cohen (6% Ownership)
Chief Executive Officer, Chairman of Bancorp Bank
36 Years
Frank M. Mastrangelo
President & Chief Operating Officer
18 Years
Paul Frenkiel
Executive Vice President & Chief Financial Officer
20 Years
Donald F. McGraw, Jr
Executive Vice President & Chief Credit Officer
33 Years
Arthur M. Birenbaum
Executive Vice President, Commercial Lending
30 Years
Scott R. Megargee
Executive Vice President, Consumer Lending
26 Years
Peter Chiccino
Chief Information Officer
16 Years
Jeremy Kuiper
Managing Director (Stored Value Solutions)
16 Years |
 20
Historical Financial Performance
12/31/2005
12/31/2006
12/31/2007
12/31/2008
12/31/2009
12/31/2010
6/30/2010
9/30/2010
12/31/2010
Balance Sheet ($000)
Total Assets
917,471
1,334,838
1,568,382
1,792,375
2,043,534
2,395,723
2,123,870
2,659,676
2,395,723
Total Net Loans
676,069
1,056,419
1,276,556
1,431,988
1,504,599
1,595,132
1,554,189
1,568,709
1,595,132
Total Deposits
732,588
1,069,255
1,278,317
1,525,362
1,654,509
2,024,097
1,881,607
2,422,387
2,024,097
Total Equity
134,947
148,908
176,259
180,403
245,203
198,906
203,778
201,432
198,906
Profitability (%)’
Net Income ($000)
7,447
12,500
14,340
(42,380)
4,102
5,222
407
588
2,041
ROAA
1.02
1.19
1.04
(2.49)
0.22
0.23
0.07
0.10
0.34
ROAE
5.69
8.90
9.15
(23.64)
1.99
2.45
0.76
1.15
4.01
Net Interest Margin
4.57
4.32
3.90
3.44
3.74
3.28
3.44
3.26
3.37
Efficiency Ratio
62.37
51.72
51.77
68.17
70.94
70.39
71.95
72.86
69.37
Balance Sheet Ratios/ Capital (%)’
Loans/ Deposits
92.93
99.59
100.66
95.36
92.10
80.00
83.79
65.66
80.00
Tangible Common Equity/ Tangible Assets
14.19
10.80
7.50
7.26
9.63
7.96
9.19
7.25
7.96
Tier 1 Ratio
17.94
13.50
10.15
11.72
15.81
11.99
12.82
12.25
11.99
Risk-based Capital Ratio
18.69
14.28
10.95
12.87
17.06
13.24
14.07
13.51
13.24
Leverage Ratio (Bank, BHC Only)
15.90
12.28
9.18
10.10
12.68
8.37
9.76
8.67
8.37
Asset Quality (%)’
Non-accrual Loans + Restructured Loans + OREO/ Assets
0.00
0.00
0.07
0.73
0.62
0.73
0.88
0.75
0.73
Loan Loss Reserves/ Gross Loans
0.81
0.79
0.80
1.20
1.26
1.49
1.42
1.37
1.49
Reserves/ Non-accrual Loans + OREO
NM
NM
875.28
130.25
150.23
138.19
119.75
109.73
138.19
For the Year Ended
For the Quarter Ended |
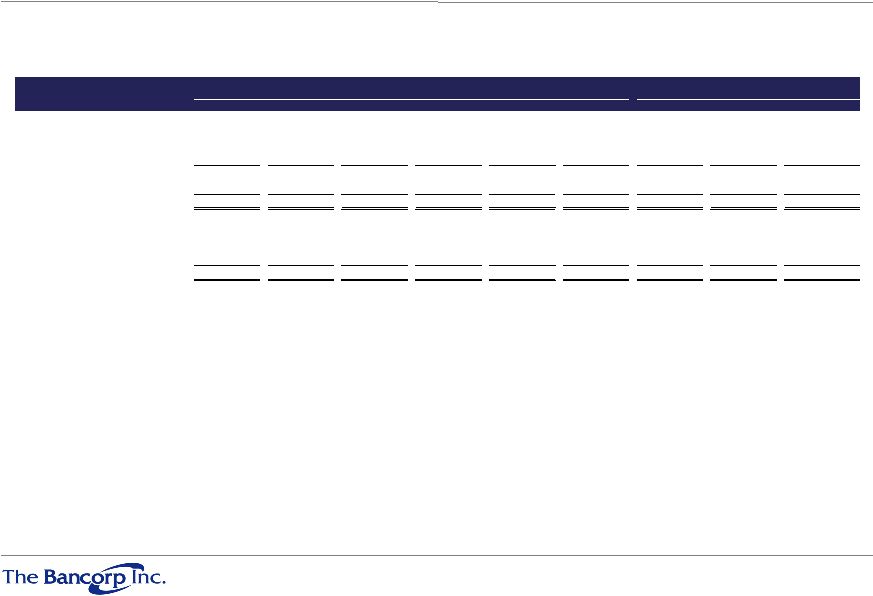
 21
Current Loan Portfolio and Asset Quality Overview at 12/31/2010
(185)
12
332
-
0.06%
960
12%
194,320
Securities backed loans and other
25
285
100
-
0.14%
2,280
27%
441,799
Commercial & Industrial
Category
Balance
(in
thousands)
% of Total
Loans
Nonaccrual
Loans
(in
thousands)
Nonaccrual/
Total Loans
OREO
(in
thousands)
30-89 Days
Delinquent
(in
thousands)
90+ Days
Delinquent
(in
thousands)
Quarter
Charge-offs
(net in
thousands)
Commercial mortgage
$580,780
36%
$1,650
0.10%
$1,890
$774
$824
$(1,229)
Construction
203,120
13%
4,881
0.30%
-
391
-
-
Direct financing leases (auto leases)
103,289
6%
-
0.00%
-
1,008
49
(3)
Residential mortgage
93,004
6%
5,526
0.34%
225
-
1,050
(493)
Total
$1,616,312
100%
$15,297
0.94%
$2,115
$2,605
$2,220
$(1,885) |
 22
Asset Quality Trends
30 - 89 Days
90+ Days
Delinquent
Non-Accrual
Total 90+ PD,
(Dollar Values in Thousands)
Past Due
Past Due
Loans
Loans
OREO
NA Loans & OREO
December 31, 2008
23,883
4,054
27,937
8,729
4,600
17,383
December 31, 2009
9,463
12,995
22,458
12,270
459
25,724
December 31, 2010
2,605
2,220
4,825
15,297
2,115
19,632
(Dollar Values in Thousands)
30 - 89 Days Past Due
90 Days+ Past Due
Non-Accrual Loans
Category
12/31/07
12/31/08
12/31/09
12/31/10
12/31/07
12/31/08
12/31/09
12/31/10
12/31/07
12/31/08
12/31/09
12/31/10
Commercial
97
500
0
100
0
0
1,161
285
1,169
373
3,765
2,280
Commercial Mortgage
1,530
11,769
1,649
774
168
2,493
5,980
824
0
1,719
2,310
1,650
Construction
0
7,357
2,970
391
0
499
2,612
0
0
4,841
4,521
4,881
Direct Financing Leases, Net
1,421
3,618
2,358
1,008
506
541
47
49
0
0
0
0
Residential Mortgae
592
0
2,486
332
6,400
0
0
12
0
1,796
149
960
Security-Backed Loans and Other
2,923
639
0
0
1,599
521
3,195
1,050
0
0
1,525
5,526
Total Loans
$6,563
$23,883
$9,463
$2,605
$8,673
$4,054
$12,995
$2,220
$1,169
$8,729
$12,270
$15,297 |
 23
Deposit-Generating Strategies: Grow
Market Share in Expanding Markets Healthcare Affinity
Relationships As of January 10, 2010 we were the 6th largest financial
institution in the Health Savings Account (HSA) space based on
total deposits
(1)
We service insurance carriers, third-party administrators and
large brokerage firms for distribution of HSAs
and related
accounts
Dynamics of the healthcare insurance industry are generating
rapid growth in the HSA market:
–
For the year ended January 10 ,2010, there was a 24%
increase
in
HSA
balances
nationally
(1)
–
During that same period, HSA custodians and administrators
reported
that
the
number
of
HSAs
grew
by
26%
(1)
–
Since 2003, the number of Americans with HSAs
and High
Deductible Health Plans (HDHPs) has grown to over 8
million,
from
a
base
of
3
million
(2)
–
Growth trends are projected to continue with banks holding
$25
billion
in
assets
by
2015
(1)
Prepaid Card Affinity Relationships
We are a market leader in a rapidly growing market for open loop
prepaid debit cards:
–
5th
largest
prepaid
bank
card
issuer
(3)
–
17th largest overall Visa and Mastercard
commercial card
issuer
in
the
U.S.
(3)
Prepaid card growth rates have been in excess of 31% annually,
with some segments growing significantly more:
–
Open-Loop products are projected to have $549.7 billion
loaded in 2012 compared to $124.64 billion loaded in 2009,
or
an
annual
growth
rate
of
64%
(4)
–
The Open-Loop Gift Card market grew by 31% in 2009 and
we believe will continue that trajectory
We
are
the
industry’s
largest
Agent
Bank
gift
card
issuer
(5)
We serve clients such as Western Union, Intuit, Deluxe Check
Printers, Digital, Incomm
and Univision
(1) Consumer Health Savings Update 2010 ,Consumer Driven Market Report
Industry Data (2) AHIP’s
Center for Policy and Research, January 2009 census HSA/High-Deductible Health
Plans (3) Nilson
Report, June 2010
(4) Mercator Advisory Group
(5) There is no independent survey of which we are aware, this conclusion is based
on our knowledge of the industry |
 24
Deposit-Gathering Strategies: Grow
Market Share in Expanding Markets Wealth Management Affinity
Relationships Wealth management deposit and lending services to wealth
management platforms and firms –
including limited-purpose
trust companies, broker/dealers and TPAs/record keepers:
Wealth Management Bank Affinities:
–
Currently 16 relationships with firms having approximately
$200 billion in assets under management
–
Over 7,000 investment advisors serving more than 280,000
clients
–
SEI, Legg Mason, Commonfund
Master Demand Account (MDA) –
DTC/NSCC-traded ERISA-
qualified bank deposit account:
–
Trades on the DTC/NSCC like Money Market Mutual Funds
–
FDIC insurance passed through to 401(k) participant
–
Schwab, Matrix, SunGard, Ascensus, Great-West
–
Growth potential due to growing demographics of retirement
market
Safe Harbor IRA Rollovers:
–
Rollover Systems, WMSI
Merchant Processing Relationships
Top
20
Acquiring
Bank
for
credit
and
debit
card
processing
(1)
Top
50
Originating
Bank
for
ACH
processing
(2)
Combined
annual
processing
volume
of
$25
billion
(3)
Numerous third-party channels, including: Fiserv, FIS, TSYS,
BankServ, Heartland, Planet Payment and HealthEquity
(1)
Management
believes,
based
upon
increased
volume
in
2010
and
independent
rankings
for
2009,
that
The
Bancorp
would
rank
in
the
top
20
nationally
of
acquiring banks
(2)
NACHA
–
The
Electronics
Payments
Association,
The
Top
50
Originators,
2010
(3) The Nilson
Report, March 2010 |
 25
Non-GAAP Reconciliation
Dollars in thousands
2005
2006
2007
2008
2009
2010
6/30/2010
9/30/2010
12/31/2010
Shareholders' Equity
$134,947
$148,908
$176,259
$180,403
$245,203
$198,906
$203,778
$201,432
$198,906
Goodwill
(3,951)
(3,951)
(50,173)
0
0
0
0
0
0
Intangible Assets
0
0
(12,006)
(11,005)
(10,005)
(9,005)
(9,505)
(9,255)
(9,005)
Tangible Equity
130,996
144,957
114,080
169,398
235,198
189,901
194,273
192,177
189,901
Preferred Equity
(1,330)
(1,186)
(1,116)
(40,109)
(39,411)
0
0
0
0
Tangible Common Equity
$129,666
$143,771
$112,964
$129,289
$195,787
$189,901
$194,273
$192,177
$189,901
Total Assets
$917,471
$1,334,838
$1,568,382
$1,792,375
$2,043,534
$2,395,723
$2,123,870
$2,659,676
$2,395,723
Goodwill
(3,951)
(3,951)
(50,173)
0
0
0
0
0
0
Intangible Assets
0
0
(12,006)
(11,005)
(10,005)
(9,005)
(9,505)
(9,255)
(9,005)
Tangible Assets
$913,520
$1,330,887
$1,506,203
$1,781,370
$2,033,529
$2,386,718
$2,114,365
$2,650,421
$2,386,718
Tangible Common Equity / Tangible Assets
14.19%
10.80%
7.50%
7.26%
9.63%
7.96%
9.19%
7.25%
7.96%
For the Year Ended December 31,
For the Quarter Ended |