Attached files
| file | filename |
|---|---|
| 8-K - 8-K - Antero Resources Finance Corp | a11-6548_28k.htm |
Exhibit 99.1
|
|
February 28, 2011 J.P. Morgan Global High Yield & Leveraged Finance Conference CONFIDENTIAL |
|
|
1 This presentation contains forward-looking statements within the meaning of Section 27A of the Securities Act of 1933 and Section 21E of the Securities Exchange Act of 1934. All statements, other than statements of historical facts, included in this presentation that address activities, events or developments that Antero Resources LLC and its subsidiaries (collectively, the “Company”) expects, believes or anticipates will or may occur in the future are forward-looking statements. The words “believe,” “expect,” “anticipate,” “plan,” “intend,” “foresee,” “should,” “would,” “could,” or other similar expressions are intended to identify forwardlooking statements, which are generally not historical in nature. However, the absence of these words does not mean that the statements are not forward-looking. Without limiting the generality of the foregoing, forward-looking statements contained in this presentation specifically include estimates of the Company’s reserves, expectations of plans, strategies, objectives and anticipated financial and operating results of the Company, including as to the Company’s drilling program, production, hedging activities, capital expenditure levels and other guidance included in this presentation. These statements are based on certain assumptions made by the Company based on management’s experience and perception of historical trends, current conditions, anticipated future developments and other factors believed to be appropriate. Such statements are subject to a number of assumptions, risks and uncertainties, many of which are beyond the control of the Company, which may cause actual results to differ materially from those implied or expressed by the forward-looking statements. These include the factors discussed or referenced in the Company’s filings with the SEC. Any forward-looking statement speaks only as of the date on which such statement is made and the Company undertakes no obligation to correct or update any forward-looking statement, whether as a result of new information, future events or otherwise, except as required by applicable law. Forward Looking Statements Forward Looking Statements |
|
|
2 The U.S. Securities and Exchange Commission (SEC) permits oil and gas companies, in their filings with the SEC, to disclose only proved, probable and possible reserve estimates. Antero has provided internally generated estimates for probable and possible reserves in this presentation in accordance with SEC guidelines and definitions. The estimates of probable and possible reserves included in this presentation have not been prepared or reviewed by Antero’s third-party engineers. Antero’s estimate of probable and possible reserves was prepared by Antero’s internal reserve engineers and is provided in this presentation because management believes it is useful information that is widely used by the investment community in the valuation, comparison and analysis of companies. Antero does not plan to include probable and possible reserve estimates in its filings with the SEC. We use certain other terms in this presentation relating to estimates of hydrocarbon volumes that the SEC’s guidelines prohibit us from including in filings with the SEC. These estimates are by their nature more speculative than estimates of proved, possible or probable reserves as defined by SEC regulations and accordingly are substantially less certain and no discount or other adjustment is included in the presentation of such numbers. Actual quantities that may be ultimately recovered from Antero’s interests may differ substantially from the estimates in this presentation. Factors affecting ultimate recovery include the scope of our ongoing drilling program, which will be directly affected by commodity prices, the availability of capital, drilling and production costs, availability of drilling services and equipment, drilling results, lease expirations, transportation constraints, regulatory approvals and other factors; and actual drilling results, including geological and mechanical factors affecting recovery rates. In this presentation: “3P reserves” refer to Antero’s estimated aggregate proved, probable and possible reserves as of December 31, 2010. The SEC prohibits companies from aggregating proved, probable and possible reserves in filings with the SEC due to the different levels of certainty associated with each reserve category. “EUR,” or Estimated Ultimate Recovery, refers to Antero’s internal estimates of per well hydrocarbon quantities that may be potentially recovered from a hypothetical future well completed as a producer in the area. These quantities do not necessarily constitute or represent reserves within the meaning of the Society of Petroleum Engineer’s Petroleum Resource Management System or the SEC’s oil and natural gas disclosure rules. Cautionary Note Regarding Hydrocarbon Cautionary Note Regarding Hydrocarbon Quantities Quantities |
|
|
3 Presenters Presenters • Glen C. Warren, Jr. – President and Chief Financial Officer, Board of Directors – Co-founder • Chad Green – Finance Manager |
|
|
4 Company Overview |
|
|
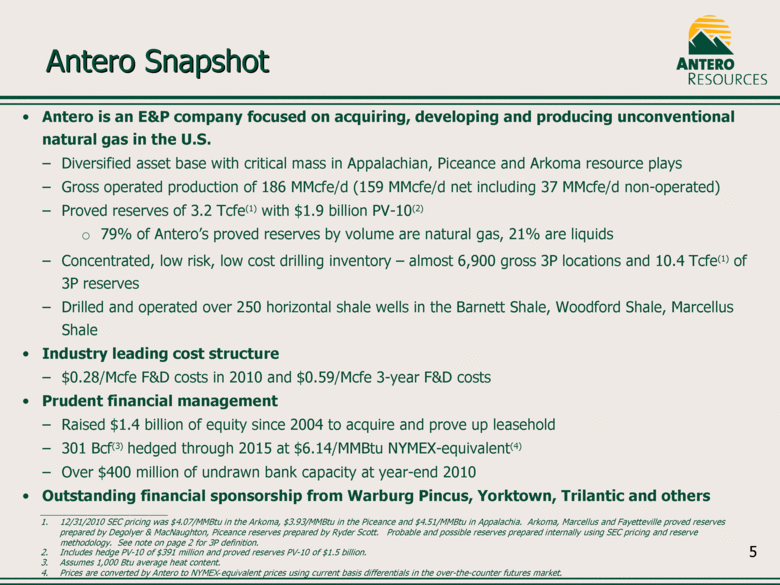
5 Antero Snapshot Antero Snapshot • Antero is an E&P company focused on acquiring, developing and producing unconventional natural gas in the U.S. – Diversified asset base with critical mass in Appalachian, Piceance and Arkoma resource plays – Gross operated production of 186 MMcfe/d (159 MMcfe/d net including 37 MMcfe/d non-operated) – Proved reserves of 3.2 Tcfe(1) with $1.9 billion PV-10(2) o 79% of Antero’s proved reserves by volume are natural gas, 21% are liquids – Concentrated, low risk, low cost drilling inventory – almost 6,900 gross 3P locations and 10.4 Tcfe(1) of 3P reserves – Drilled and operated over 250 horizontal shale wells in the Barnett Shale, Woodford Shale, Marcellus Shale • Industry leading cost structure – $0.28/Mcfe F&D costs in 2010 and $0.59/Mcfe 3-year F&D costs • Prudent financial management – Raised $1.4 billion of equity since 2004 to acquire and prove up leasehold – 301 Bcf(3) hedged through 2015 at $6.14/MMBtu NYMEX-equivalent(4) – Over $400 million of undrawn bank capacity at year-end 2010 • Outstanding financial sponsorship from Warburg Pincus, Yorktown, Trilantic and others ___________________________ 1. 12/31/2010 SEC pricing was $4.07/MMBtu in the Arkoma, $3.93/MMBtu in the Piceance and $4.51/MMBtu in Appalachia. Arkoma, Marcellus and Fayetteville proved reserves prepared by Degolyer & MacNaughton, Piceance reserves prepared by Ryder Scott. Probable and possible reserves prepared internally using SEC pricing and reserve methodology. See note on page 2 for 3P definition. 2. Includes hedge PV-10 of $391 million and proved reserves PV-10 of $1.5 billion. 3. Assumes 1,000 Btu average heat content. 4. Prices are converted by Antero to NYMEX- equivalent prices using current basis differentials in the over-the-counter futures market. |
|
|
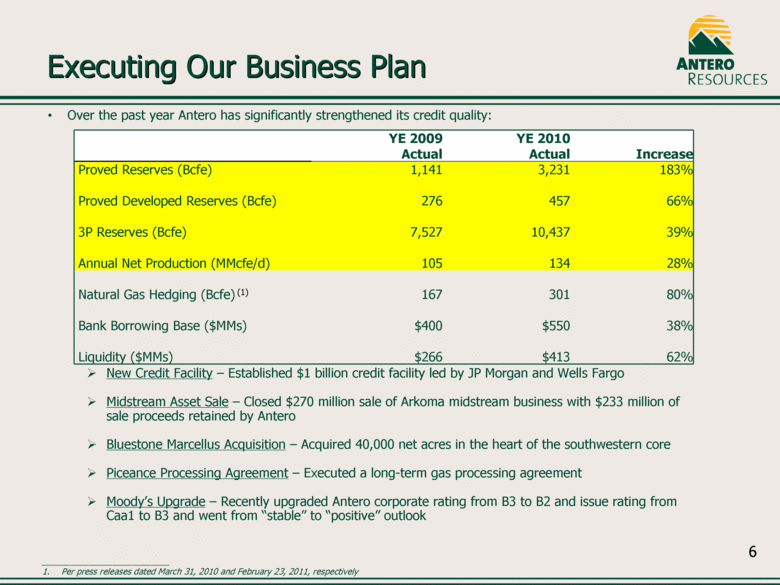
6 • Over the past year Antero has significantly strengthened its credit quality: New Credit Facility – Established $1 billion credit facility led by JP Morgan and Wells Fargo Midstream Asset Sale – Closed $270 million sale of Arkoma midstream business with $233 million of sale proceeds retained by Antero Bluestone Marcellus Acquisition – Acquired 40,000 net acres in the heart of the southwestern core Piceance Processing Agreement – Executed a long-term gas processing agreement Moody’s Upgrade – Recently upgraded Antero corporate rating from B3 to B2 and issue rating from Caa1 to B3 and went from “stable” to “positive” outlook Executing Our Business Plan Executing Our Business Plan YE 2009 Actual YE 2010 Actual Increase Proved Reserves (Bcfe) 1,141 3,231 183% Proved Developed Reserves (Bcfe) 276 457 66% 3P Reserves (Bcfe) 7,527 10,437 39% Annual Net Production (MMcfe/d) 105 134 28% Natural Gas Hedging (Bcfe) (1) 167 301 80% Bank Borrowing Base ($MMs) $400 $550 38% Liquidity ($MMs) $266 $413 62% ___________________________ 1. Per press releases dated March 31, 2010 and February 23, 2011, respectively |
|
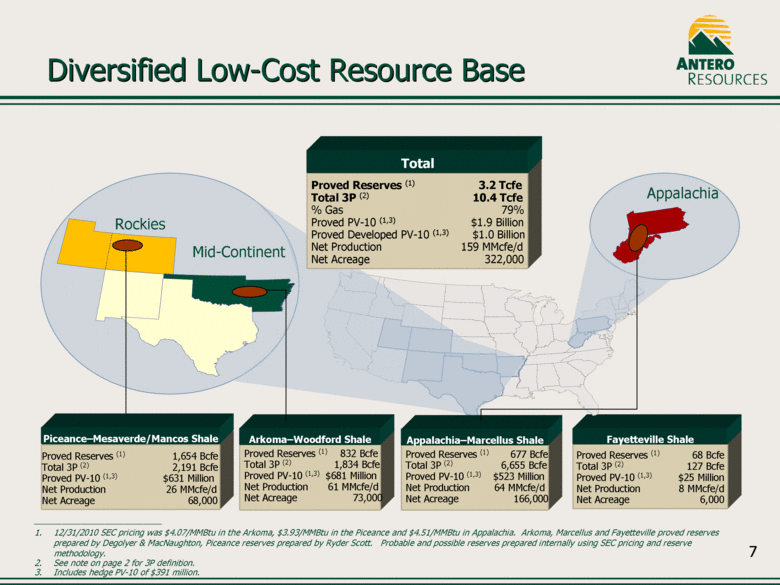
|
7 Proved Reserves (1) 68 Bcfe Total 3P (2) 127 Bcfe Proved PV-10 (1,3) $25 Million Net Production 8 MMcfe/d Net Acreage 6,000 Fayetteville Shale Proved Reserves (1) 1,654 Bcfe Total 3P (2) 2,191 Bcfe Proved PV-10 (1,3) $631 Million Net Production 26 MMcfe/d Net Acreage 68,000 Piceance–Mesaverde/Mancos Shale Proved Reserves (1) 677 Bcfe Total 3P (2) 6,655 Bcfe Proved PV-10 (1,3) $523 Million Net Production 64 MMcfe/d Net Acreage 166,000 Proved Reserves (1) 832 Bcfe Total 3P (2) 1,834 Bcfe Proved PV-10 (1,3) $681 Million Net Production 61 MMcfe/d Net Acreage 73,000 Arkoma–Woodford Shale Appalachia Rockies Mid-Continent Proved Reserves (1) 3.2 Tcfe Total 3P (2) 10.4 Tcfe % Gas 79% Proved PV-10 (1,3) $1.9 Billion Proved Developed PV-10 (1,3) $1.0 Billion Net Production 159 MMcfe/d Net Acreage 322,000 Total ___________________________ 1. 12/31/2010 SEC pricing was $4.07/MMBtu in the Arkoma, $3.93/MMBtu in the Piceance and $4.51/MMBtu in Appalachia. Arkoma, Marcellus and Fayetteville proved reserves prepared by Degolyer & MacNaughton, Piceance reserves prepared by Ryder Scott. Probable and possible reserves prepared internally using SEC pricing and reserve methodology. 2. See note on page 2 for 3P definition. 3. Includes hedge PV-10 of $391 million. Appalachia–Marcellus Shale Diversified Low Diversified Low-Cost Resource Base Cost Resource Base |
|
|
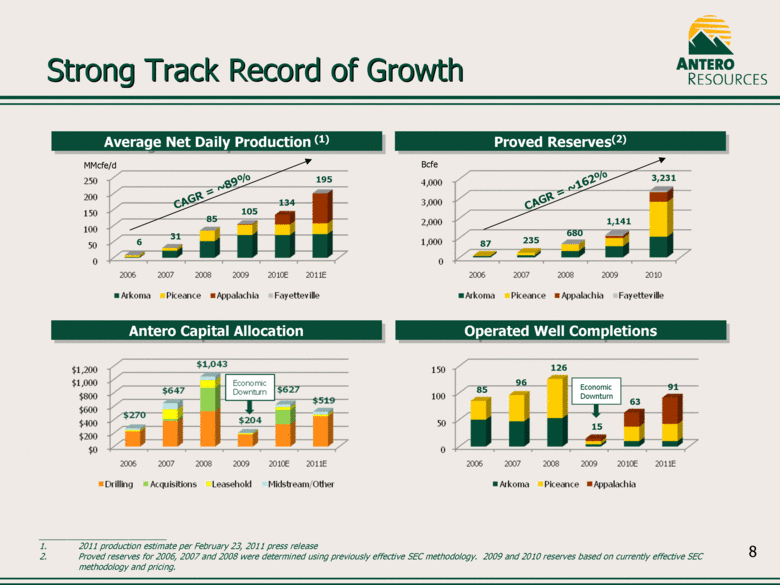
8 Strong Track Record of Growth Strong Track Record of Growth ___________________________ 1. 2011 production estimate per February 23, 2011 press release 2. Proved reserves for 2006, 2007 and 2008 were determined using previously effective SEC methodology. 2009 and 2010 reserves based on currently effective SEC methodology and pricing. 31 85 6 105 CAGR = ~89% 85 96 126 87 235 680 CAGR = ~162% Antero Capital Allocation Operated Well Completions Average Net Daily Production (1) Proved Reserves(2) 1,141 15 134 3,231 63 MMcfe/d Bcfe 195 91 Economic Downturn |
|
|
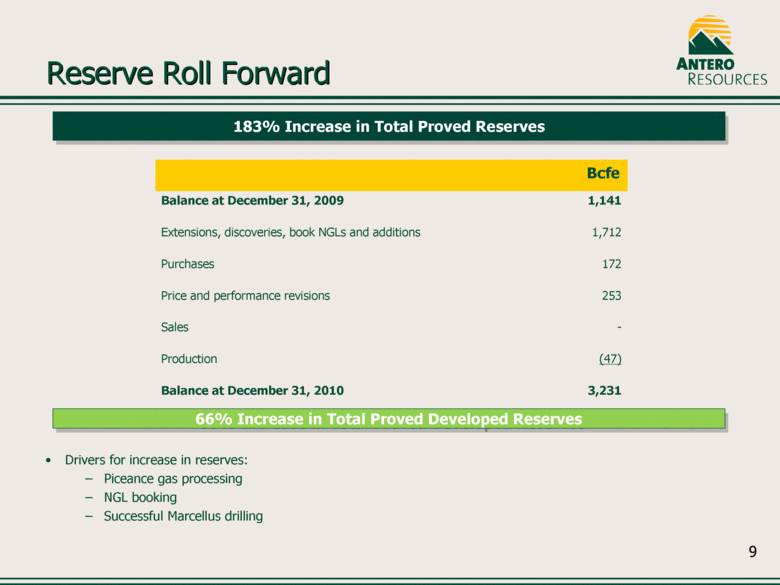
9 Reserve Roll Forward Reserve Roll Forward 183% Increase in Total Proved Reserves Bcfe Balance at December 31, 2009 1,141 Extensions, discoveries, book NGLs and additions 1,712 Purchases 172 Price and performance revisions 253 Sales - Production (47) Balance at December 31, 2010 3,231 66% Increase in Total Proved Developed Reserves • Drivers for increase in reserves: - Piceance gas processing - NGL booking - Successful Marcellus drilling |
|
|
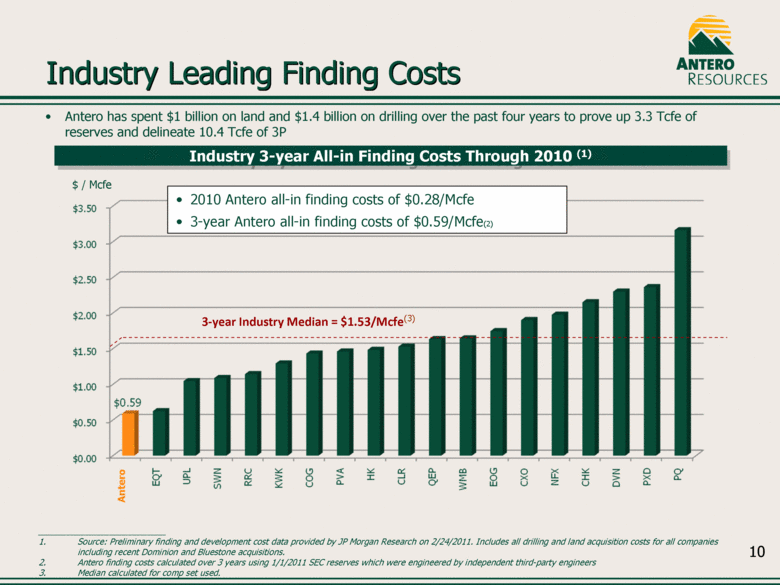
10 Industry Leading Finding Costs Industry Leading Finding Costs Industry 3-year All-in Finding Costs Through 2010 (1) ___________________________ 1. Source: Preliminary finding and development cost data provided by JP Morgan Research on 2/24/2011. Includes all drilling and land acquisition costs for all companies including recent Dominion and Bluestone acquisitions. 2. Antero finding costs calculated over 3 years using 1/1/2011 SEC reserves which were engineered by independent third-party engineers 3. Median calculated for comp set used. 3-year Industry Median = $1.53/Mcfe(3) • 2010 Antero all-in finding costs of $0.28/Mcfe • 3-year Antero all-in finding costs of $0.59/Mcfe(2) $ / Mcfe • Antero has spent $1 billion on land and $1.4 billion on drilling over the past four years to prove up 3.3 Tcfe of reserves and delineate 10.4 Tcfe of 3P Antero |
|
|
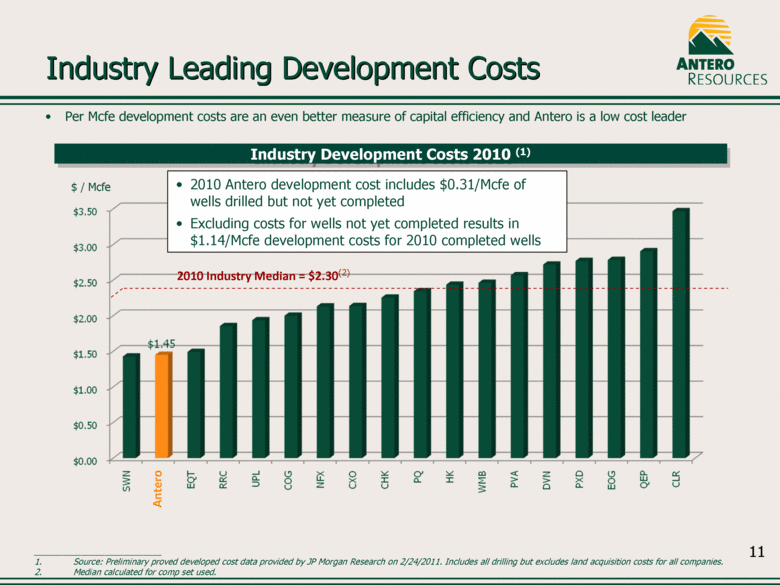
11 Industry Leading Development Costs Industry Leading Development Costs Industry Development Costs 2010 (1) ___________________________ 1. Source: Preliminary proved developed cost data provided by JP Morgan Research on 2/24/2011. Includes all drilling but excludes land acquisition costs for all companies. 2. Median calculated for comp set used. Antero 2010 Industry Median = $2.30(2) • 2010 Antero development cost includes $0.31/Mcfe of wells drilled but not yet completed • Excluding costs for wells not yet completed results in $1.14/Mcfe development costs for 2010 completed wells $ / Mcfe • Per Mcfe development costs are an even better measure of capital efficiency and Antero is a low cost leader |
|
|
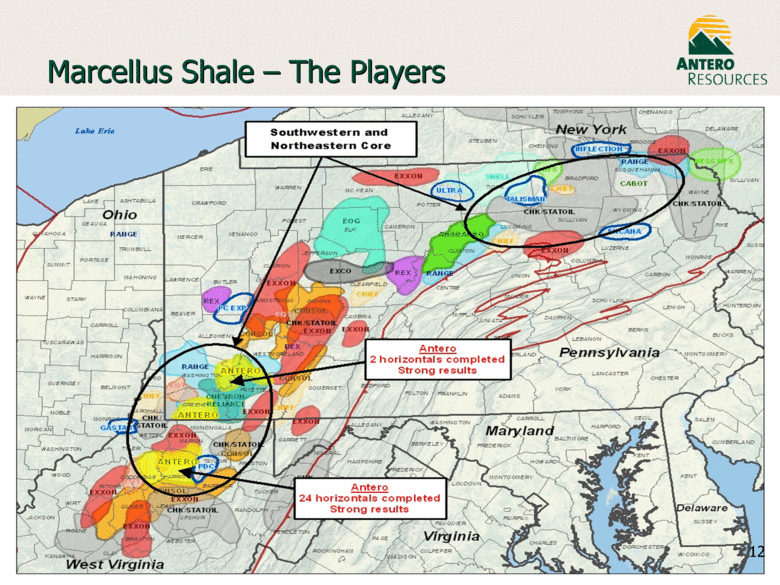
12 Marcellus Shale Marcellus Shale – The Players The Players |
|
|
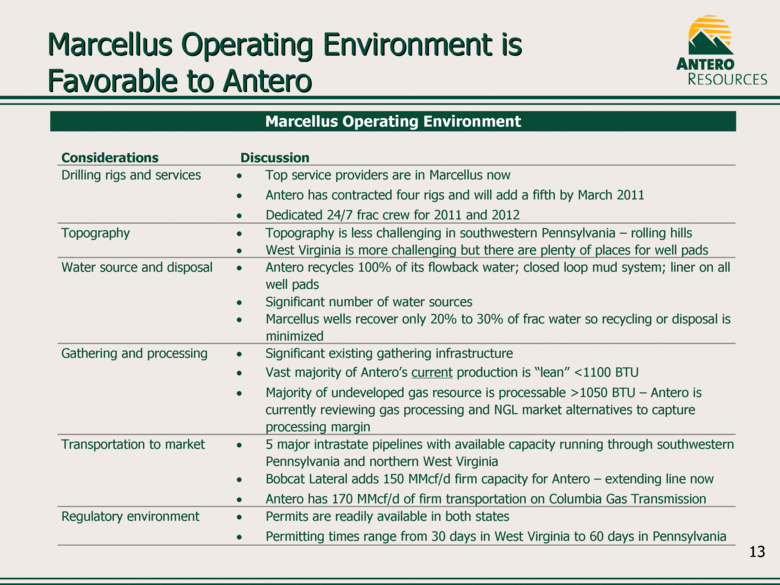
13 Marcellus Operating Environment is Marcellus Operating Environment is Favorable to Antero Favorable to Antero Marcellus Operating Environment Considerations Discussion Drilling rigs and services • Top service providers are in Marcellus now • Antero has contracted four rigs and will add a fifth by March 2011 • Dedicated 24/7 frac crew for 2011 and 2012 Topography • Topography is less challenging in southwestern Pennsylvania – rolling hills • West Virginia is more challenging but there are plenty of places for well pads Water source and disposal • Antero recycles 100% of its flowback water; closed loop mud system; liner on all well pads • Significant number of water sources • Marcellus wells recover only 20% to 30% of frac water so recycling or disposal is minimized Gathering and processing • Significant existing gathering infrastructure • Vast majority of Antero’s current production is “lean” <1100 BTU • Majority of undeveloped gas resource is processable >1050 BTU – Antero is currently reviewing gas processing and NGL market alternatives to capture processing margin Transportation to market • 5 major intrastate pipelines with available capacity running through southwestern Pennsylvania and northern West Virginia • Bobcat Lateral adds 150 MMcf/d firm capacity for Antero – extending line now • Antero has 170 MMcf/d of firm transportation on Columbia Gas Transmission Regulatory environment • Permits are readily available in both states • Permitting times range from 30 days in West Virginia to 60 days in Pennsylvania |
|
|
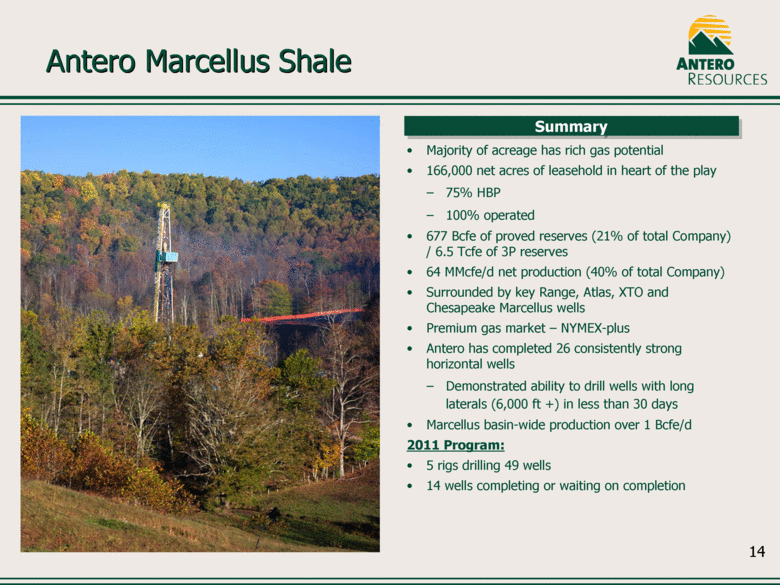
14 • Majority of acreage has rich gas potential • 166,000 net acres of leasehold in heart of the play – 75% HBP – 100% operated • 677 Bcfe of proved reserves (21% of total Company) / 6.5 Tcfe of 3P reserves • 64 MMcfe/d net production (40% of total Company) • Surrounded by key Range, Atlas, XTO and Chesapeake Marcellus wells • Premium gas market – NYMEX-plus • Antero has completed 26 consistently strong horizontal wells – Demonstrated ability to drill wells with long laterals (6,000 ft +) in less than 30 days • Marcellus basin-wide production over 1 Bcfe/d 2011 Program: • 5 rigs drilling 49 wells • 14 wells completing or waiting on completion Antero Marcellus Shale Antero Marcellus Shale Summary |
|
|
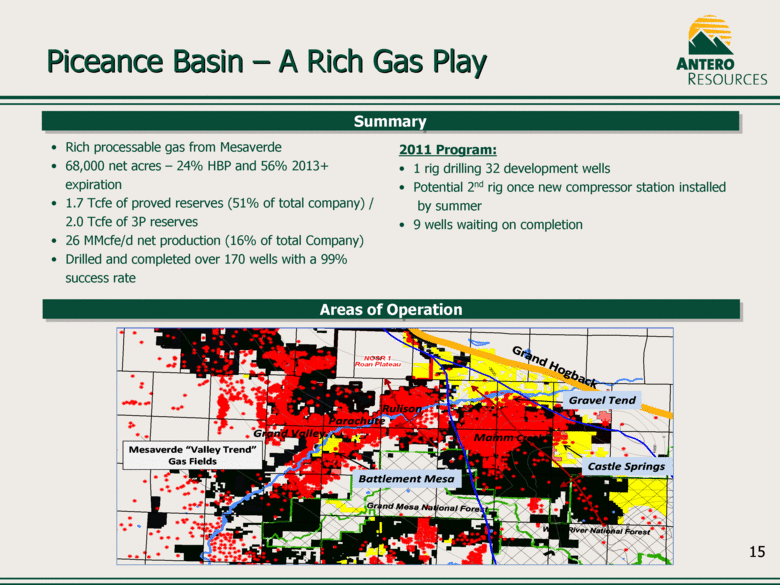
15 Piceance Basin Piceance Basin – A Rich Gas Play A Rich Gas Play • Rich processable gas from Mesaverde • 68,000 net acres – 24% HBP and 56% 2013+ expiration • 1.7 Tcfe of proved reserves (51% of total company) / 2.0 Tcfe of 3P reserves • 26 MMcfe/d net production (16% of total Company) • Drilled and completed over 170 wells with a 99% success rate Summary 2011 Program: • 1 rig drilling 32 development wells • Potential 2nd rig once new compressor station installed by summer • 9 wells waiting on completion Roan Plateau NOSR 1 White River National Forest Grand Mesa National Forest White River National Forest 1000 1000 0001 0 003- - 4000 - 2000 2000 2000 0004 0001- 0001- 0001- 0005 0055 5000 0 0 0 Grand Hogback Gravel Tend Battlement Mesa Grand Valley Parachute MammCreek Rulison Castle Springs Mesaverde “Valley Trend” Gas Fields 1000 0003- 2000 Areas of Operation |
|
|
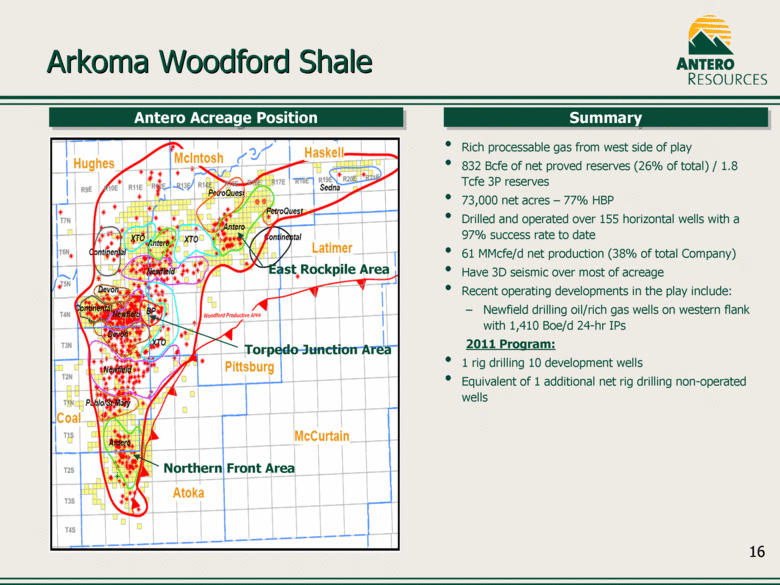
16 Arkoma Woodford Shale Arkoma Woodford Shale • Rich processable gas from west side of play • 832 Bcfe of net proved reserves (26% of total) / 1.8 Tcfe 3P reserves • 73,000 net acres – 77% HBP • Drilled and operated over 155 horizontal wells with a 97% success rate to date • 61 MMcfe/d net production (38% of total Company) • Have 3D seismic over most of acreage • Recent operating developments in the play include: – Newfield drilling oil/rich gas wells on western flank with 1,410 Boe/d 24-hr IPs 2011 Program: • 1 rig drilling 10 development wells • Equivalent of 1 additional net rig drilling non-operated wells ___________________________ Antero Acreage Position Summary East Rockpile Area Torpedo Junction Area Northern Front Area |
|
|
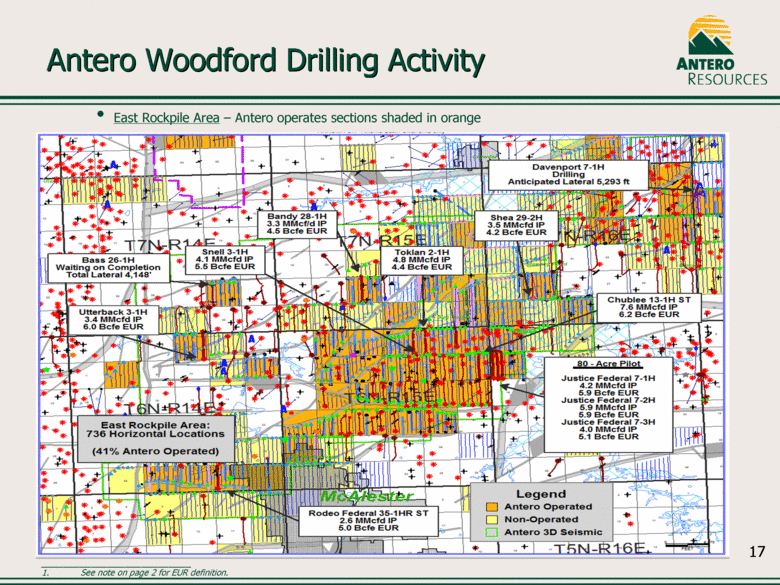
17 Antero Woodford Drilling Activity Antero Woodford Drilling Activity • East Rockpile Area – Antero operates sections shaded in orange ___________________________ 1. See note on page 2 for EUR definition. |
|
|
18 Conservative Financial Philosophy Conservative Financial Philosophy • Antero has historically employed a sound and disciplined financial philosophy • Antero credit objectives: – Target net debt / EBITDAX of 2.0x to 3.0x (3.1x pro forma 9/30/2010) – Target net debt / proved reserves of $0.25 to $0.75 / Mcfe ($0.18/Mcfe pro forma 9/30/2010) – Target net debt / proved developed reserves of $1.00 to $1.50 / Mcfe ($1.24/Mcfe pro forma 9/30/2010) • Invest well within cash flow plus liquidity while balancing capital efficiency and drilling economics • Continue our active/opportunistic hedging strategy to protect cash flow and returns, insulating our capital program – 301 Bcfe(1) hedged through 2015 at approximately $6.14/MMBtu NYMEX – Strong counterparties – all collateralized, all in bank group • Maintain strong bank group – Led by JPMorgan with 12 other banks • Term out bank debt in bond market over time • Antero is comfortable spending beyond its cash flow over the next couple of years due to its strong liquidity, large fixed-price hedge position and de-risked, diversified, low cost reserve base ___________________________ 1. Assumes 1,000 Btu average heat content. |
|
|
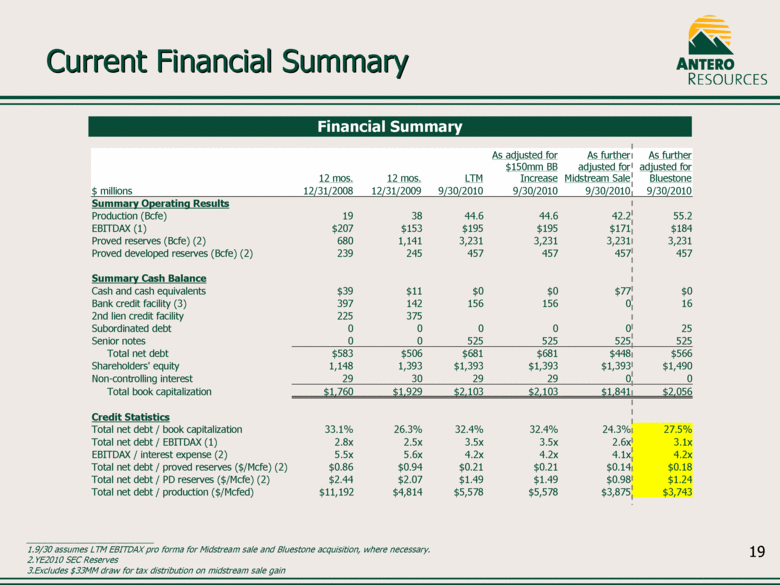
19 12 mos. 12 mos. LTM As adjusted for $150mm BB Increase As further adjusted for Midstream Sale As further adjusted for Bluestone $ millions 12/31/2008 12/31/2009 9/30/2010 9/30/2010 9/30/2010 9/30/2010 Summary Operating Results Production (Bcfe) 19 38 44.6 44.6 42.2 55.2 EBITDAX (1) $207 $153 $195 $195 $171 $184 Proved reserves (Bcfe) (2) 680 1,141 3,231 3,231 3,231 3,231 Proved developed reserves (Bcfe) (2) 239 245 457 457 457 457 Summary Cash Balance Cash and cash equivalents $39 $11 $0 $0 $77 $0 Bank credit facility (3) 397 142 156 156 0 16 2nd lien credit facility 225 375 Subordinated debt 0 0 0 0 0 25 Senior notes 0 0 525 525 525 525 Total net debt $583 $506 $681 $681 $448 $566 Shareholders' equity 1,148 1,393 $1,393 $1,393 $1,393 $1,490 Non-controlling interest 29 30 29 29 0 0 Total book capitalization $1,760 $1,929 $2,103 $2,103 $1,841 $2,056 Credit Statistics Total net debt / book capitalization 33.1% 26.3% 32.4% 32.4% 24.3% 27.5% Total net debt / EBITDAX (1) 2.8x 2.5x 3.5x 3.5x 2.6x 3.1x EBITDAX / interest expense (2) 5.5x 5.6x 4.2x 4.2x 4.1x 4.2x Total net debt / proved reserves ($/Mcfe) (2) $0.86 $0.94 $0.21 $0.21 $0.14 $0.18 Total net debt / PD reserves ($/Mcfe) (2) $2.44 $2.07 $1.49 $1.49 $0.98 $1.24 Total net debt / production ($/Mcfed) $11,192 $4,814 $5,578 $5,578 $3,875 $3,743 Current Financial Summary Current Financial Summary Financial Summary ___________________________ 1.9/30 assumes LTM EBITDAX pro forma for Midstream sale and Bluestone acquisition, where necessary. 2.YE2010 SEC Reserves 3.Excludes $33MM draw for tax distribution on midstream sale gain |
|
|
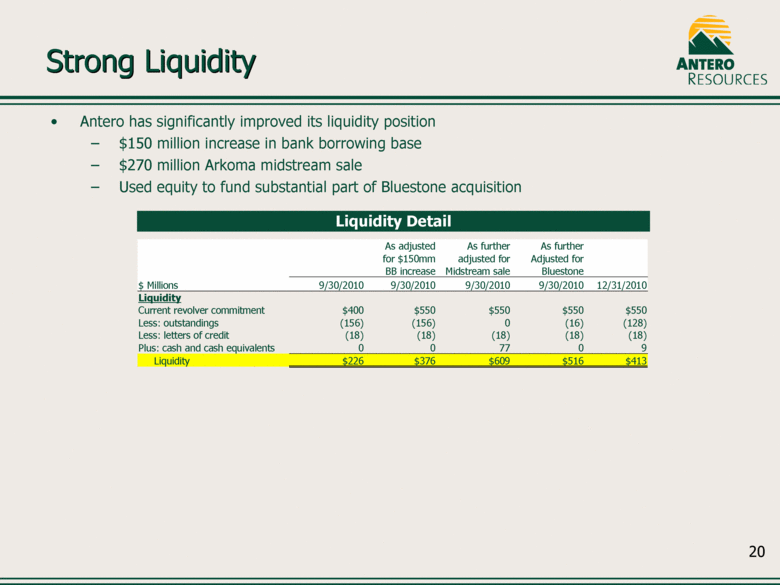
20 Strong Liquidity Strong Liquidity Liquidity Detail As adjusted As further As further for $150mm adjusted for Adjusted for BB increase Midstream sale Bluestone $ Millions 9/30/2010 9/30/2010 9/30/2010 9/30/2010 12/31/2010 Liquidity Current revolver commitment $400 $550 $550 $550 $550 Less: outstandings (156) (156) 0 (16) (128) Less: letters of credit (18) (18) (18) (18) (18) Plus: cash and cash equivalents 0 0 77 0 9 Liquidity $226 $376 $609 $516 $413 • Antero has significantly improved its liquidity position - $150 million increase in bank borrowing base - $270 million Arkoma midstream sale - Used equity to fund substantial part of Bluestone acquisition |
|
|
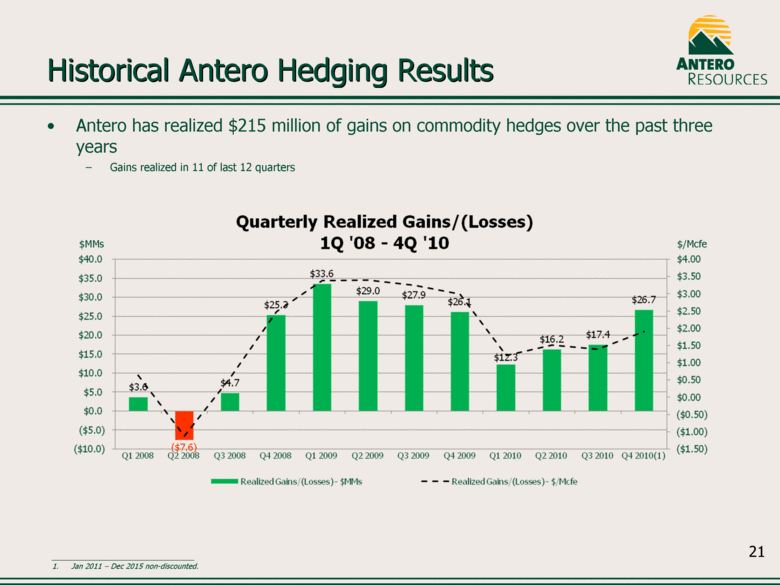
21 • Antero has realized $215 million of gains on commodity hedges over the past three years – Gains realized in 11 of last 12 quarters ___________________________ 1. Jan 2011 – Dec 2015 non-discounted. $MMs $/Mcfe Historical Antero Hedging Results Historical Antero Hedging Results |
|
|
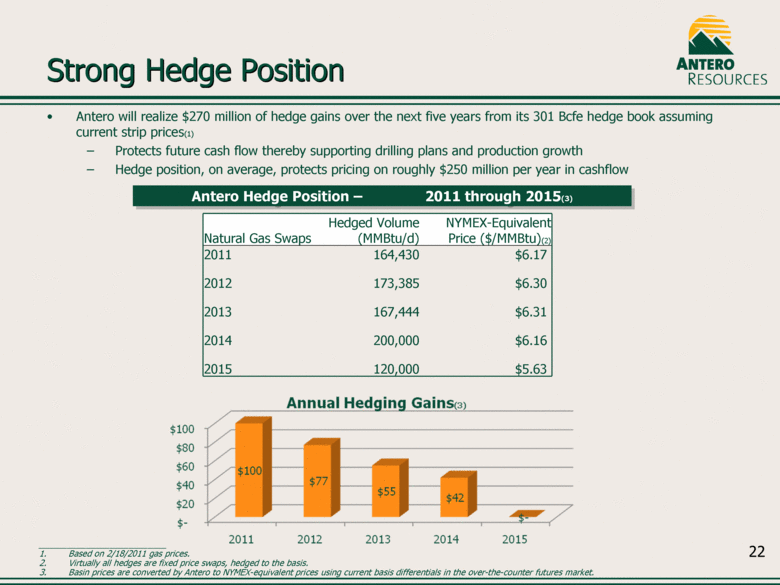
22 Strong Hedge Position Strong Hedge Position • Antero will realize $270 million of hedge gains over the next five years from its 301 Bcfe hedge book assuming current strip prices(1) - Protects future cash flow thereby supporting drilling plans and production growth - Hedge position, on average, protects pricing on roughly $250 million per year in cashflow Antero Hedge Position – 2011 through 2015(3) Natural Gas Swaps Hedged Volume (MMBtu/d) NYMEX-Equivalent Price ($/MMBtu)(2) 2011 164,430 $6.17 2012 173,385 $6.30 2013 167,444 $6.31 2014 200,000 $6.16 2015 120,000 $5.63 ___________________________ 1. Based on 2/18/2011 gas prices. 2. Virtually all hedges are fixed price swaps, hedged to the basis. 3. Basin prices are converted by Antero to NYMEX-equivalent prices using current basis differentials in the over-the-counter futures market. |
|
|
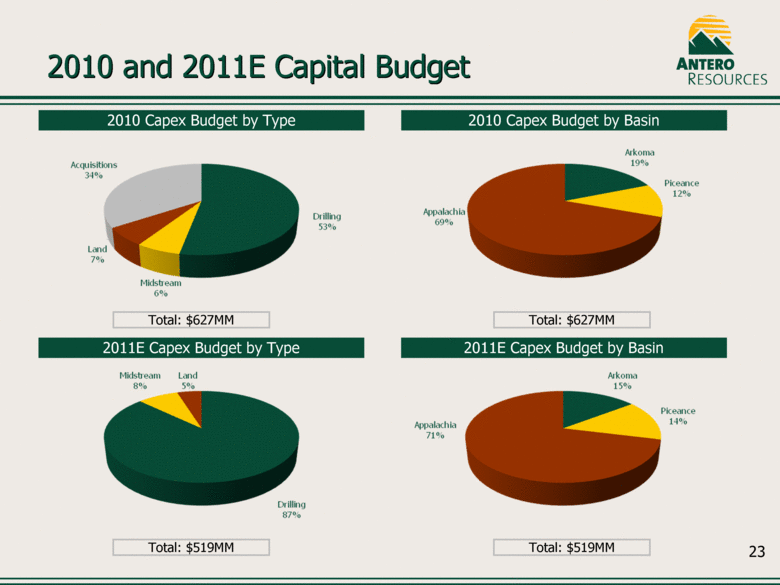
23 2010 Capex Budget by Type 2010 Capex Budget by Basin Total: $627MM Total: $627MM 2011E Capex Budget by Type 2011E Capex Budget by Basin Total: $519MM Total: $519MM 2010 and 2011E Capital Budget 2010 and 2011E Capital Budget |
|
|
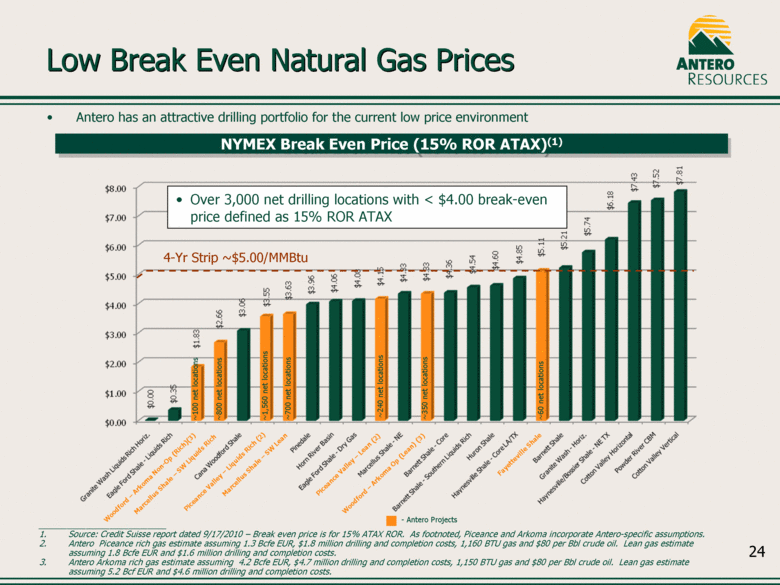
24 Woodford – Arkoma Op (Lean) (3) Low Break Even Natural Gas Prices Low Break Even Natural Gas Prices • Antero has an attractive drilling portfolio for the current low price environment NYMEX Break Even Price (15% ROR ATAX)(1) - Antero Projects 4-Yr Strip ~$5.00/MMBtu Marcellus Shale – SW Liquids Rich Piceance Valley – Liquids Rich (2) Marcellus Shale – SW Lean Fayetteville Shale ~800 net locations ~700 net locations ~1,560 net locations ~350 net locations ~60 net locations Piceance Valley – Lean (2) Woodford – Arkoma Non-Op (Rich)(3) ~240 net locations ~100 net locations ___________________________ 1. Source: Credit Suisse report dated 9/17/2010 – Break even price is for 15% ATAX ROR. As footnoted, Piceance and Arkoma incorporate Antero-specific assumptions. 2. Antero Piceance rich gas estimate assuming 1.3 Bcfe EUR, $1.8 million drilling and completion costs, 1,160 BTU gas and $80 per Bbl crude oil. Lean gas estimate assuming 1.8 Bcfe EUR and $1.6 million drilling and completion costs. 3. Antero Arkoma rich gas estimate assuming 4.2 Bcfe EUR, $4.7 million drilling and completion costs, 1,150 BTU gas and $80 per Bbl crude oil. Lean gas estimate assuming 5.2 Bcf EUR and $4.6 million drilling and completion costs. • Over 3,000 net drilling locations with < $4.00 break-even price defined as 15% ROR ATAX |
|
|
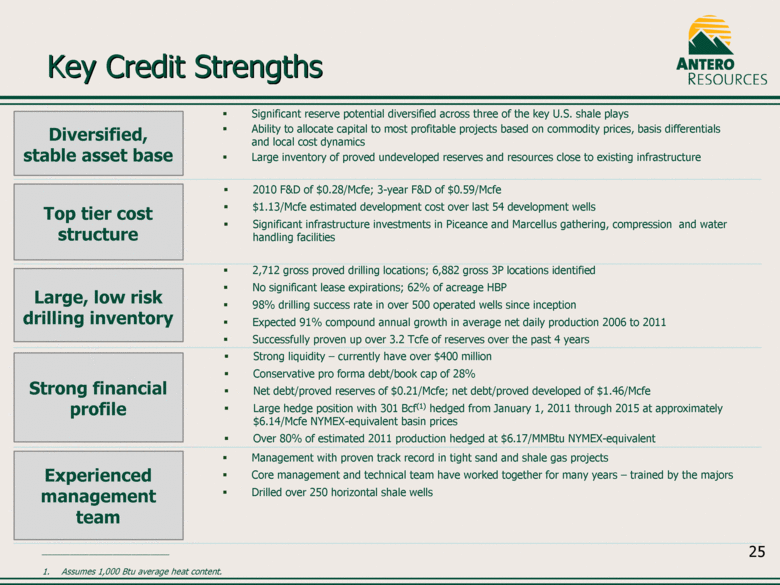
25 Key Credit Strengths Key Credit Strengths Significant reserve potential diversified across three of the key U.S. shale plays Ability to allocate capital to most profitable projects based on commodity prices, basis differentials and local cost dynamics Large inventory of proved undeveloped reserves and resources close to existing infrastructure Diversified, stable asset base 2,712 gross proved drilling locations; 6,882 gross 3P locations identified No significant lease expirations; 62% of acreage HBP 98% drilling success rate in over 500 operated wells since inception Expected 91% compound annual growth in average net daily production 2006 to 2011 Successfully proven up over 3.2 Tcfe of reserves over the past 4 years Top tier cost structure Strong liquidity – currently have over $400 million Conservative pro forma debt/book cap of 28% Net debt/proved reserves of $0.21/Mcfe; net debt/proved developed of $1.46/Mcfe Large hedge position with 301 Bcf(1) hedged from January 1, 2011 through 2015 at approximately $6.14/Mcfe NYMEX-equivalent basin prices Over 80% of estimated 2011 production hedged at $6.17/MMBtu NYMEX-equivalent Large, low risk drilling inventory Management with proven track record in tight sand and shale gas projects Core management and technical team have worked together for many years – trained by the majors Drilled over 250 horizontal shale wells Experienced management team 2010 F&D of $0.28/Mcfe; 3-year F&D of $0.59/Mcfe $1.13/Mcfe estimated development cost over last 54 development wells Significant infrastructure investments in Piceance and Marcellus gathering, compression and water handling facilities Strong financial profile ___________________________ 1. Assumes 1,000 Btu average heat content. |