Attached files
Table of Contents
UNITED STATES
SECURITIES AND EXCHANGE COMMISSION
Washington, D.C. 20549
FORM 10-K
ANNUAL REPORT PURSUANT TO SECTION 13 OR 15(d)
OF THE SECURITIES EXCHANGE ACT OF 1934
For the Year Ended December 31, 2010

QEP RESOURCES, INC.
(Exact name of registrant as specified in its charter)
| STATE OF DELAWARE | 001-34778 | 87-0287750 | ||
| (State or other jurisdiction of incorporation) |
(Commission File No.) | (I.R.S. Employer Identification No.) |
1050 17th Street, Suite 500, Denver, Colorado 80265
(Address of principal executive offices)
Registrant’s telephone number, including area code: 303-672-6900
Securities registered pursuant to Section 12(b) of the Act:
| Title of each class |
Name of each exchange on which registered | |
| Common stock, $0.01 par value | New York Stock Exchange |
Securities registered pursuant to Section 12(g) of the Act: None
Indicate by check mark if the registrant is a well-known seasoned issuer, as defined in Rule 405 of the Securities Act. Yes x No ¨
Indicate by check mark if the registrant is not required to file reports pursuant to Section 13 or Section 15(d) of the Act. Yes ¨ No x
Indicate by check mark whether the registrant (1) has filed all reports required to be filed by Section 13 or 15(d) of the Securities Exchange Act of 1934 during the preceding 12 months (or for such shorter period that the registrant was required to file such reports), and (2) has been subject to such filing requirements for the past 90 days. Yes x No ¨
Indicate by check mark whether the registrant has submitted electronically and posted on its corporate website, if any, every Interactive Data File required to be submitted and posted pursuant to Rule 405 of Regulation S-T (Section 232.405 of this chapter) during the preceding 12 months (or for such shorter period that the registrant was required to submit and post such files). Yes x No ¨
Indicate by check mark if disclosure of delinquent filers pursuant to Item 405 of Regulation S-K is not contained herein, and will not be contained, to the best of registrant’s knowledge, in definitive proxy or information statements incorporated by reference in Part III of this Form 10-K or any amendment to this Form 10-K. x
Indicate by check mark whether the registrant is a large accelerated filer, an accelerated filer, a non-accelerated filer, or a smaller reporting company. See definitions of “large accelerated filer,” “accelerated filer” and “smaller reporting company” in Rule 12b-2 of the Exchange Act.
| Large accelerated filer | ¨ | Accelerated filer | ¨ | |||||
| Non-accelerated filer | x | (Do not check if a smaller reporting company) | Smaller reporting company | ¨ | ||||
Indicate by check mark whether the registrant is a shell company (as defined in Rule 12b-2 of the Exchange Act). Yes ¨ No x
State the aggregate market value of the voting and non-voting common equity held by non-affiliates computed by reference to the price at which the common equity was last sold, or the average bid and asked price of such common equity, as of the last business day of the registrant’s most recently completed second fiscal quarter. (June 30, 2010): $0.
At February 18, 2011, there were 176,305,256 shares of the registrant’s $0.01 par value common stock outstanding.
DOCUMENTS INCORPORATED BY REFERENCE
Part III is incorporated by reference from the registrant’s Definitive Proxy Statement for its 2011 Annual Meeting of Stockholders to be filed, pursuant to Regulation 14A, no later than 120 days after the close of the registrant’s fiscal year.
Table of Contents
| Page No. | ||||||
| 4 | ||||||
| 4 | ||||||
| 5 | ||||||
| PART I | ||||||
| Item 1. | 8 | |||||
| 8 | ||||||
| 9 | ||||||
| 10 | ||||||
| 11 | ||||||
| 11 | ||||||
| 12 | ||||||
| Item 1A. | 13 | |||||
| Item 1B. | 20 | |||||
| Item 2. | 21 | |||||
| 21 | ||||||
| 24 | ||||||
| 24 | ||||||
| Item 3. | 25 | |||||
| Item 4. | 25 | |||||
| PART II | ||||||
| Item 5. | 26 | |||||
| Item 6. | 28 | |||||
| Item 7. | MANAGEMENT’S DISCUSSION AND ANALYSIS OF FINANCIAL CONDITION AND RESULTS OF OPERATIONS |
|
30 |
| ||
| Item 7A. | 45 | |||||
| Item 8. | 47 | |||||
| Item 9. | CHANGES IN AND DISAGREEMENTS WITH ACCOUNTANTS ON ACCOUNTING AND FINANCIAL DISCLOSURE |
|
87 |
| ||
| Item 9A. | 87 | |||||
| Item 9B. | 89 | |||||
2
Table of Contents
| Page No. | ||||||
| PART III | ||||||
| Item 10. | 89 | |||||
| Item 11. | 89 | |||||
| Item 12. | SECURITY OWNERSHIP OF CERTAIN BENEFICIAL OWNERS AND MANAGEMENT AND RELATED STOCKHOLDER MATTERS |
89 | ||||
| Item 13. | CERTAIN RELATIONSHIPS AND RELATED TRANSACTIONS AND DIRECTOR INDEPENDENCE |
89 | ||||
| Item 14. | 89 | |||||
| PART IV | ||||||
| Item 15. | 90 | |||||
| 94 | ||||||
3
Table of Contents
Where You Can Find More Information
QEP Resources, Inc. (QEP or the Company) files annual, quarterly, and current reports with the Securities and Exchange Commission (SEC). Prior to QEP’s Spin-off from Questar Corporation (described in more detail in the Explanatory Note in Item 1 of Part I of this Annual Report on Form 10-K), QEP’s predecessor, Questar Market Resources, Inc., filed annual, quarterly and current reports with the SEC. QEP also regularly files proxy statements and other documents with the SEC. These reports and other information can be read and copied at the SEC’s Public Reference Room at 100 F Street, N.E., Washington, D.C. 20549-0213. Please call the SEC at 1-800-SEC-0330 for further information on the operation of the Public Reference Room. The SEC also maintains an internet site at http://www.sec.gov that contains reports, proxy and information statements and other information regarding issuers that file electronically with the SEC, including QEP.
Investors can also access financial and other information via QEP’s website at www.qepres.com. QEP makes available, free of charge through the website copies of Annual Reports on Form 10-K, Quarterly Reports on Form 10-Q, Current Reports on Form 8-K, and any amendments to such reports and all reports filed by executive officers and directors under Section 16 of the Exchange Act reporting transactions in QEP securities. Access to these reports is provided as soon as reasonably practical after such reports are electronically filed with the SEC. Information contained on or connected to QEP’s website which is not directly incorporated by reference into the Company’s Annual Report on Form 10-K should not be considered part of this report or any other filing made with the SEC.
QEP’s website also contains copies of charters for various board committees, including the Audit Committee, Corporate Governance Guidelines and QEP’s Business Ethics and Compliance Policy.
Finally, you may request a copy of filings other than an exhibit to a filing unless that exhibit is specifically incorporated by reference into that filing, at no cost by writing or calling QEP, 1050 17th Street, Suite 500, Denver, CO 80265 (telephone number: 1-303-672-6900).
This Annual Report contains or incorporates by reference information that includes or is based upon “forward-looking statements” within the meaning of Section 27A of the Securities Act of 1933, as amended, and Section 21E of the Securities Exchange Act of 1934, as amended. Forward-looking statements give expectations or forecasts of future events. You can identify these statements by the fact that they do not relate strictly to historical or current facts. They use words such as “anticipate,” “estimate,” “expect,” “project,” “intend,” “plan,” “believe,” and other words and terms of similar meaning in connection with a discussion of future operating or financial performance. Forward-looking statements include statements relating to, among other things:
| • | plans to drill or participate in wells; |
| • | expenses; |
| • | the outcome of contingencies such as legal proceedings; |
| • | trends in operations; |
| • | forecasted capital expenditures for 2011; |
| • | the importance of adjusted EBITDA as a measure of cash flow and liquidity; |
| • | the ability of QEP to use derivative instruments to manage commodity price risk; |
| • | acquisition plans; |
| • | growth strategy; |
| • | climate change; and |
| • | the impact of regulatory changes on exploration and development costs; |
4
Table of Contents
Any or all forward-looking statements may turn out to be incorrect. They can be affected by inaccurate assumptions or by known or unknown risks and uncertainties. Many such factors will be important in determining actual future results. These statements are based on current expectations and the current economic environment. They involve a number of risks and uncertainties that are difficult to predict. These statements are not guarantees of future performance. Actual results could differ materially from those expressed or implied in the forward-looking statements. Factors that could cause actual results to differ materially include, but are not limited to the following:
| • | the risk factors discussed in Part I, Item 1A of this Annual Report; |
| • | general economic conditions, including the performance of financial markets and interest rates; |
| • | changes in industry trends; |
| • | changes in laws or regulations; and |
| • | other factors, most of which are beyond the Company’s control. |
QEP undertakes no obligation to publicly correct or update the forward-looking statements in this Annual Report, in other documents, or on the website to reflect future events or circumstances. All such statements are expressly qualified by this cautionary statement.
Glossary of Commonly Used Terms
B Billion.
bbl Barrel, which is equal to 42 U.S. gallons and is a common measure of volume of crude oil and other liquid hydrocarbons.
basis The difference between a reference or benchmark commodity price and the corresponding sales price at various regional sales points.
basis-only swap A derivative that “swaps” the basis (defined above) between two sales points from a floating price to a fixed price for a specified commodity volume over a specified time period. Typically used to fix the price relationship between a geographic sales point and a NYMEX reference price.
Btu One British thermal unit – a measure of the amount of energy required to raise the temperature of a one-pound mass of water one degree Fahrenheit at sea level.
cash flow hedge A derivative instrument that complies with Financial Accounting Standards Board (FASB) Accounting Standards Codification (ASC) 815 and is used to reduce the exposure to variability in cash flows from the forecasted physical sale of gas and oil production whereby the gains (losses) on the derivative transaction are anticipated to offset the losses (gains) on the forecasted physical sale.
cf Cubic foot or feet is a common unit of gas measurement. One standard cubic foot equals the volume of gas in one cubic foot measured at standard conditions – a temperature of 60 degrees Fahrenheit and a pressure of 30 inches of mercury (approximately 14.7 pounds per square inch).
cfe Cubic foot or feet of natural gas equivalents.
developed reserves Reserves of any category that can be expected to be recovered through existing wells with existing equipment and operating methods or in which the cost of the required equipment is relatively minor compared to the cost of a new well. See 17 C.F.R. Section 4-10(a)(6).
development well A well drilled into a known producing formation in a previously discovered field.
5
Table of Contents
dry hole A well drilled and found to be incapable of producing hydrocarbons in sufficient quantities such that proceeds from the sale of production exceed expenses and taxes.
equity production Production at the wellhead attributed to QEP’s ownership.
exploratory well A well drilled into a previously untested geologic prospect to determine the presence of gas or oil.
frac spread The difference between the market value for natural gas liquids (NGL) extracted from the natural gas stream and the market value of the Btu-equivalent volume of natural gas required to replace the extracted liquids.
futures contract A contract to buy or sell a standard quantity and quality of a commodity at a specified future date and price.
gal U.S. gallon.
gas All references to “gas” in this report refer to natural gas.
gross “Gross” natural gas and oil wells or “gross” acres are the total number of wells or acres in which the Company has a working interest.
hedging The use of commodity and interest-rate derivative instruments to reduce financial exposure to commodity price and interest-rate volatility.
M Thousand.
MM Million.
natural gas equivalents Oil and NGL volumes are converted to natural gas equivalents using the ratio of one barrel of crude oil, condensate or NGL to 6,000 cubic feet of natural gas.
natural gas liquids (NGL) Liquid hydrocarbons that are extracted from the natural gas stream. NGL products include ethane, propane, butane, natural gasoline and heavier hydrocarbons.
net “Net” gas and oil wells or “net” acres are determined by the sum of the fractional ownership working interest the Company has in those gross wells or acres.
net revenue interest A share of production after all burdens, such as royalties and overriding royalties, have been deducted from the working interest. It is the percentage of production that each owner is entitled to receive.
NYMEX The New York Mercantile Exchange.
proved reserves Those quantities of natural gas, oil, condensate and NGL which, by analysis of geoscience and engineering data, can be estimated with reasonable certainty to be economically producible from known reservoirs under existing economic conditions, operating methods and government regulations. See 17 C.F.R. Section 4-10(a)(22).
reserves Estimated remaining quantities of natural gas, oil and related substances anticipated to be economically producible by application of development projects to known accumulations. In addition, there must exist, or there must be a reasonable expectation that there will exist, the legal right to produce. See 17 C.F.R. Section 4-10(a)(26).
6
Table of Contents
reservoir A porous and permeable underground formation containing a natural accumulation of producible natural gas and/or oil that is confined by impermeable rock or water barriers and is individual and separate from other reservoirs.
royalty An interest in a gas and oil lease that gives the owner the right to receive a portion of the production from the leased acreage (or of the proceeds of the sale thereof), but generally does not require the owner to pay any portion of the costs of drilling or operating the wells on the leased acreage. Royalties may be either landowner’s royalties, which are reserved by the owner of the minerals at the time the lease is granted, or overriding royalties, which are usually reserved by an owner of the leasehold in connection with a transfer to a subsequent owner.
seismic data/survey An exploration method of sending energy waves or sound waves into the earth and recording the wave reflections to indicate the type, size, shape and depth of a subsurface rock formation. 2-D seismic provides two-dimensional information and 3-D seismic provides three-dimensional views.
T Trillion.
undeveloped reserves Reserves of any category that are expected to be recovered from new wells on undrilled acreage, or from existing wells where a relatively major expenditure is required for recompletion. See 17 C.F.R. Section 4-10(a)(31).
working interest An interest in a gas and oil lease that gives the owner the right to drill, produce and conduct operating activities on the leased acreage and receive a share of any production.
workover Operations on a producing well to restore or increase production.
7
Table of Contents
FORM 10-K
ANNUAL REPORT 2010
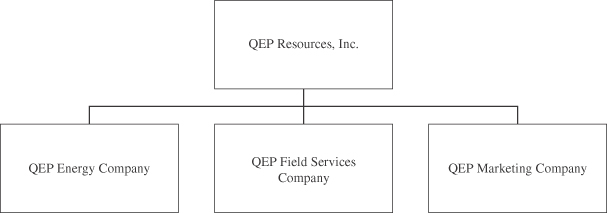
QEP Resources, Inc. (QEP or the Company), is an independent natural gas and oil exploration and production company. QEP is a holding company with three major lines of business – gas and oil exploration and production, midstream field services, and energy marketing – which are conducted through three principal subsidiaries:
| • | QEP Energy Company (QEP Energy) acquires, explores for, develops and produces natural gas, oil, and natural gas liquids (NGL); |
| • | QEP Field Services Company (QEP Field Services) provides midstream field services including natural gas gathering, processing and treating services for affiliates and third parties; and |
| • | QEP Marketing Company (QEP Marketing) markets equity and third-party natural gas and oil, provides risk-management services, and owns and operates an underground gas-storage reservoir. |
QEP operates in the Rocky Mountain and Midcontinent regions of the United States and is headquartered in Denver, Colorado. Principal offices are located in Denver, Colorado; Salt Lake City, Utah; Oklahoma City, Oklahoma; and Tulsa, Oklahoma.
The corporate-organization structure and principal subsidiaries are depicted below:
EXPLANATORY NOTE
Effective May 18, 2010, Questar Market Resources, Inc., (Market Resources) then a wholly-owned subsidiary of Questar Corporation (Questar), merged with and into a newly-formed, wholly-owned subsidiary, QEP Resources, Inc., a Delaware corporation in order to reincorporate in the State of Delaware (Reincorporation Merger). The Reincorporation Merger was effected pursuant to an Agreement and Plan of Merger entered into between Market Resources and QEP. The Reincorporation Merger was approved by the boards of directors of Market Resources and QEP and submitted to a vote of, and approved by, the Board of Directors of Questar, as sole shareholder of Market Resources, and by Market Resources, as sole shareholder of QEP on May 18, 2010.
On June 30, 2010, Questar distributed all of the shares of common stock of QEP held by Questar to Questar shareholders in a tax-free, pro rata dividend (the Spin-off). Each Questar shareholder received one share of QEP
8
Table of Contents
common stock for each one share of Questar common stock held (including fractional shares) at the close of business on the record date. In connection therewith, QEP distributed Wexpro Company (Wexpro), a wholly-owned subsidiary of QEP at the time, to Questar. In addition, Questar contributed $250.0 million of equity to QEP prior to the Spin-off.
In connection with the reorganization, QEP renamed its subsidiaries as follows:
| • | QEP Energy Company (formerly Questar Exploration and Production Company), |
| • | QEP Field Services Company (formerly Questar Gas Management Company), and |
| • | QEP Marketing Company (formerly Questar Energy Trading Company). |
The financial information presented in this Form 10-K presents QEP’s financial results as an independent company separate from Questar and reflects Wexpro’s financial condition and operating results as discontinued operations for all periods presented. A summary of discontinued operations can be found in Note 3 to the consolidated financial statements in Item 8 of this Annual Report on Form 10-K.
EXPLORATION AND PRODUCTION – QEP Energy Company
General: QEP’s exploration and production business is conducted through QEP Energy, which generated approximately 72% of the Company’s operating income in 2010. QEP Energy operates in two core regions – the Rocky Mountain region (including the states of Wyoming, Utah, Colorado, New Mexico and North Dakota) and the Midcontinent region (including the states of Oklahoma, Texas and Louisiana). QEP Energy reported production of 229.0 Bcfe compared to 189.5 Bcfe in 2009. The Midcontinent region contributed approximately 53% of 2010 production while the Rocky Mountain region contributed the remaining 47%. QEP Energy reported 3,030.7 Bcfe of estimated proved reserves as of December 31, 2010, of which approximately 61%, or 1,860.2 Bcfe, were located in the Rocky Mountain region, while the remaining 39%, or 1,170.5 Bcfe, were located in the Midcontinent region. Approximately 53% of the proved reserves reported by QEP Energy at year-end 2010 were developed, while 47% were categorized as proved undeveloped. Natural gas comprised about 86% of the total proved reserves at year-end 2010. The SEC amended its definitions of oil and natural gas reserves effective December 31, 2009. Key revisions impacting the Company include a change in the pricing used to determine estimated proved reserves from year-end prices to first-of-the-month prior 12-month average prices, changes in reserve category definitions, and the allowance of the application of reliable technologies in the determination of proved reserves. See Item 2 of Part I and Note 16 to the consolidated financial statements included in Item 8 of Part II of this Annual Report for more information on the Company’s proved reserves.
QEP Energy has a large inventory of identified development drilling locations, primarily on the Pinedale Anticline in western Wyoming, in northwestern Louisiana, in western Oklahoma and in western North Dakota. QEP Energy continues to conduct exploratory drilling to determine the commerciality of its inventory of undeveloped leaseholds. The Company seeks to acquire, develop and produce natural gas and oil from so-called “resource plays” in its core areas. Resource plays are characterized by continuous, aerially extensive hydrocarbon accumulations in tight sand, shale and coal reservoirs. Since the existence and distribution of hydrocarbons in resource plays is well understood, development of these accumulations has lower exploration risk than conventional discrete hydrocarbon accumulations. Resource plays typically require many wells, drilled at high density, to fully develop and produce the hydrocarbon accumulations. Development of QEP Energy’s resource play accumulations requires expertise in drilling large numbers of complex, highly deviated or horizontal wells to depths in excess of 13,000 feet and the application of advanced well completion techniques, including hydraulic fracture stimulation, to achieve economic production. QEP Energy seeks to maintain geographical and geological diversity with its two core regions. The Company has in the past and may in the future pursue acquisition of producing properties through the purchase of assets or corporate entities to expand its presence in its core areas or to create new core areas.
9
Table of Contents
Competition and Customers: QEP Energy faces competition in every part of its business, including the acquisition of producing properties and undeveloped leasehold, the marketing of natural gas and oil, and obtaining goods, services and labor. Its longer-term growth strategy depends, in part, on its ability to acquire reasonably-priced acreage containing reserves and identify and develop them in a low-cost and efficient manner.
QEP Energy, both directly and through QEP Marketing, sells natural gas production to a variety of customers, including gas-marketing firms, industrial users and local-distribution companies. QEP Energy regularly evaluates counterparty credit and may require financial guarantees or prepayments from parties that fail to meet its credit criteria.
Regulation: QEP Energy operations are subject to various government controls and regulation at the federal, state and local levels. QEP Energy must obtain permits to drill and produce wells; maintain required bonds to drill and operate wells; submit and implement spill-prevention plans; and file notices relating to the presence, use, and release of specified contaminants incidental to gas and oil drilling, completion and production. QEP Energy is also subject to various conservation matters, including the regulation of the size of drilling and spacing units, the number of wells that may be drilled in a unit and the unitization or pooling of gas and oil properties.
Most of QEP Energy’s leasehold acreage in the Rocky Mountain region is held under leases granted by the United States and administered by federal agencies, principally the Bureau of Land Management (BLM). Current federal regulations restrict activities during certain times of the year on significant portions of QEP Energy leasehold due to wildlife activity and/or habitat. QEP Energy has worked with federal and state officials in Wyoming to obtain authorization for limited winter-drilling activities on the Pinedale Anticline and has developed measures, such as drilling multiple wells from a single pad location, to minimize the impact of its activities on wildlife and wildlife habitat. Various wildlife species inhabit QEP Energy leaseholds at Pinedale and in other areas. The presence of wildlife or plants, including species and types that are protected under the federal Endangered Species Act, could limit access to leases held by QEP Energy on public lands.
In September 2008, the BLM issued a Record of Decision (ROD) on the Final Supplemental Environmental Impact Statement (FSEIS) for long-term development of natural gas resources in the Pinedale Anticline Project Area (PAPA). Under the ROD, QEP Energy is allowed to drill and complete wells year-round in one of five Concentrated Development Areas defined in the PAPA. The ROD contains additional requirements and restrictions on development of the PAPA.
MIDSTREAM FIELD SERVICES – QEP Field Services Company
General: QEP Field Services generated approximately 27% of the Company’s operating income in 2010. QEP Field Services owns various natural gas gathering, treating and processing facilities in the Rocky Mountain and Midcontinent regions as well as 78% of Rendezvous Gas Services, LLC, (RGS), a partnership that operates gas gathering facilities in western Wyoming. QEP Field Services also owns 38% of Uintah Basin Field Services, LLC (UBFS) and 50% of Three Rivers Gathering, LLC (Three Rivers). These partnerships operate natural gas gathering facilities in eastern Utah. The FERC-regulated Rendezvous Pipeline Co., LLC (Rendezvous Pipeline), a wholly owned subsidiary of QEP Field Services, operates a 21-mile, 20-inch-diameter pipeline between QEP Field Services’ Blacks Fork gas-processing plant and the Muddy Creek compressor station owned by Kern River Gas Transmission Co. (Kern River Pipeline). RGS gathers natural gas for Pinedale Anticline and Jonah Field producers for delivery to various interstate pipelines.
Fee-based gathering and processing revenues were 78% of QEP Field Services’ net operating revenues (revenues less plant shrink) during 2010. Approximately 36% of QEP Field Services’ 2010 net gas-processing revenues (processing revenues less plant shrink) were derived from fee-based processing agreements. The remaining revenues were derived from keep-whole processing agreements. A keep-whole contract exposes QEP Field Services to frac-spread risk while a fee-based contract eliminates commodity price exposure. To further reduce volatility associated with keep-whole contracts, QEP Field Services may enter into forward-sales contracts for NGL or hedge NGL prices and equivalent gas volumes with the intent to lock in a processing margin.
10
Table of Contents
Competition and Customers: QEP faces regional competition with varying competitive factors in each basin. QEP’s gathering and processing business competes with other midstream companies, interstate and intrastate pipelines, producers and independent gatherers and processors. Numerous factors impact a customer’s choice of a gathering or processing services provider, including rate, location, term, pressure obligations, timeliness of services, and contract structure. QEP Field Services provides natural gas gathering, processing and treating services to affiliates and third-party producers who own producing natural gas fields in the Rocky Mountain region and in northwest Louisiana. Most of QEP Field Services’ gas gathering, processing and treating services are provided under long-term agreements.
ENERGY MARKETING—QEP Marketing Company
General: QEP Marketing provides wholesale marketing and sales of affiliate and third-party natural gas, oil and NGL and generated approximately 1% of the Company’s operating income in 2010. As a wholesale marketing entity, QEP Marketing concentrates on markets in the Rocky Mountains, Pacific Northwest and Midcontinent that are either close to affiliate reserves and production or accessible by major pipelines. QEP Marketing contracts for firm-transportation capacity on pipelines and firm-storage capacity at Clay Basin, a large baseload-storage facility. QEP Marketing, through its subsidiary Clear Creek Storage Company, LLC, operates an underground gas-storage reservoir in southwestern Wyoming. QEP Marketing uses owned and leased storage capacity together with firm-transportation capacity to manage seasonal swings in prices in the Rocky Mountain region.
Competition and Customers: QEP Marketing competes directly with large independent energy marketers, marketing affiliates of regulated pipelines and utilities and natural gas producers. QEP Marketing also competes with brokerage houses, energy hedge funds and other energy-based companies offering similar services. QEP Marketing sells QEP Energy natural gas and volumes purchased from third parties to wholesale marketers, industrial end-users and utilities. QEP Marketing sells QEP Energy crude oil volume to refiners, remarketers and other companies, including some with pipeline facilities near company producing properties. In the event pipeline facilities are not available, QEP Marketing arranges transportation of crude oil by truck or rail to storage, refining or pipeline facilities. QEP Marketing uses derivative instruments to manage commodity price risk, primarily fixed-price swaps to secure a known price for a specific volume of production. QEP Marketing does not engage in speculative hedging transactions. See Item 7A and Notes 1 and 7 to the consolidated financial statements included in Item 8 of Part II of this Annual Report for additional information relating to hedging activities.
At December 31, 2010, QEP Resources, Inc. had 823 employees, including 603 in QEP Energy, 198 in QEP Field Services and 22 in QEP Marketing.
11
Table of Contents
Executive Officers of the Registrant
Primary Positions Held with the Company
and Affiliates, Other Business Experience
| Charles B. Stanley | 52 | President, Chief Executive Officer, QEP (2010 to present). Previous titles with Questar: Chief Operating Officer (2008 to 2010); Executive Vice President and Director (2003 to 2010); President, Chief Executive Officer and Director, Market Resources and Market Resources subsidiaries (2002 to 2010). | ||
| Richard J. Doleshek | 52 | Executive Vice President and Chief Financial Officer, QEP (2010 to present). Previous titles with Questar: Executive Vice President and Chief Financial Officer (2009 to 2010). Prior to joining Questar, Mr. Doleshek was Executive Vice President and Chief Financial Officer, Hilcorp Energy Company (2001 to 2009). | ||
| Jay B. Neese | 52 | Executive Vice President, QEP (2010 to present). Previous titles with Questar: Senior Vice President (2005 to 2010); Executive Vice President, Market Resources and Market Resources subsidiaries (2005 to 2010); Vice President, Market Resources and Market Resources subsidiaries (2003 to 2005); Assistant Vice President (2001 to 2003). | ||
| Perry H. Richards | 50 | Senior Vice President – Field Services (2010 to present). Previous title with Questar: Vice President, Questar Gas Management (2005 to 2010). | ||
| Eric L. Dady | 56 | Vice President and General Counsel, QEP (2010 to present). Previous title with Questar: General Counsel Market Resources (2005 to 2010). | ||
| Abigail L. Jones | 50 | Vice President, Compliance, Corporate Secretary and Assistant General Counsel, QEP (2010 to present). Previous titles with Questar: Vice President Compliance (2007 to 2010); Corporate Secretary (2005 to 2010); Assistant Secretary (2004 to 2005). | ||
There is no “family relationship” between any of the listed officers or between any of them and the Company’s directors. The executive officers serve at the pleasure of the Board of Directors. There is no arrangement or understanding under which the officers were selected.
12
Table of Contents
Investors should read carefully the following factors as well as the cautionary statements referred to in “Forward-Looking Statements” herein. If any of the risks and uncertainties described below or elsewhere in this Annual Report actually occur, the Company’s business, financial condition or results of operations could be materially adversely affected.
Risks Inherent in the Company’s Business
The future prices for natural gas, oil and NGL are volatile, and a decline in such prices could adversely affect QEP’s results, stock price and growth plans. Historically natural gas, oil and NGL prices have been volatile and will likely continue to be volatile in the future. U.S. natural gas prices in particular are significantly influenced by weather. Any significant or extended decline in commodity prices would impact the Company’s future financial condition, revenue, operating results, cash flow, return on invested capital, and rate of growth. In addition, significant and extended declines in commodity prices could limit QEP’s access to sources of capital or cause QEP to delay or postpone some of its capital projects. Because a significant portion of QEP Energy’s future production is natural gas, the Company’s financial results are substantially more sensitive to changes in natural gas prices than to changes in oil prices.
QEP cannot predict the future price of natural gas, oil and NGL because of factors beyond its control, including but not limited to:
| • | changes in domestic and foreign supply of natural gas, oil and NGL; |
| • | changes in local, regional, national and global demand for natural gas, oil, and NGL; |
| • | regional price differences resulting from available pipeline transportation capacity or local demand; |
| • | the level of imports of, and the price of, foreign natural gas, oil and NGL; domestic and global economic conditions; |
| • | the potential long-term impact of an abundance of natural gas from unconventional sources on the global gas supply; |
| • | domestic political developments; |
| • | weather conditions; |
| • | domestic government regulations and taxes; |
| • | technological advances affecting energy consumption and energy supply; |
| • | conservation efforts; |
| • | the price, availability and acceptance of alternative fuels; |
| • | storage levels of natural gas, oil, and NGL; and |
| • | the quality of natural gas and oil produced. |
In addition, lower commodity prices may result in asset impairment charges from reductions in the carrying values of QEP’s natural gas and oil properties.
The Company may not be able to economically find and develop new reserves. The Company’s profitability depends not only on prevailing prices for natural gas, oil and NGL, but also its ability to find, develop and acquire gas and oil reserves that are economically recoverable. Producing natural gas and oil reservoirs are generally characterized by declining production rates that vary depending on reservoir characteristics. Because of the initial high-rate production decline profile of several of the Company’s producing areas, substantial capital expenditures are required to find, develop and acquire gas and oil reserves to replace those depleted by production.
13
Table of Contents
Gas and oil reserve estimates are imprecise and subject to revision. QEP’s proved natural gas and oil reserve estimates are prepared annually by independent reservoir-engineering consultants. Gas and oil reserve estimates are subject to numerous uncertainties inherent in estimating quantities of proved reserves, projecting future rates of production and timing of development expenditures. The accuracy of these estimates depends on the quality of available data and on engineering and geological interpretation and judgment. Reserve estimates are imprecise and will change as additional information becomes available. Estimates of economically recoverable reserves and future net cash flows prepared by different engineers, or by the same engineers at different times, may vary significantly. Results of subsequent drilling, testing and production may cause either upward or downward revisions of previous estimates. In addition, the estimation process also involves economic assumptions relating to commodity prices, operating costs, severance and other taxes, capital expenditures and remediation costs. Actual results most likely will vary from the estimates. Any significant variance from these assumptions could affect the recoverable quantities of reserves attributable to any particular properties, the classifications of reserves, the estimated future net cash flows from proved reserves and the present value of those reserves.
Investors should not assume that QEP’s presentation of the Standardized Measure of Discounted Future Net Cash Flows Relating to Proved Reserves in this Annual Report is the current market value of the estimated natural gas and oil reserves. In accordance with SEC disclosure rules, the estimated discounted future net cash flows from QEP’s proved reserves are based on the first-of-the-month prior 12-month average prices and current costs on the date of the estimate, holding the prices and costs constant throughout the life of the properties and using a discount factor of 10 percent per year. Actual future prices and costs may differ materially from those used in the current estimate, and future determinations of the Standardized Measure of Discounted Future Net Cash Flows using similarly determined prices and costs may be significantly different from the current estimate.
Shortages of oilfield equipment, services and qualified personnel could impact results of operations. The demand for qualified and experienced field personnel to drill wells and conduct field operations, geologists, geophysicists, engineers and other professionals in the oil and gas industry can fluctuate significantly, often in correlation with natural gas and oil prices, causing periodic shortages. There have also been regional shortages of drilling rigs and other equipment, as demand for specialized rigs and equipment has increased along with the number of wells being drilled. These factors also cause increases in costs for equipment, services and personnel. These cost increases could impact profit margin, cash flow and operating results or restrict the ability to drill wells and conduct operations, especially during periods of lower natural gas and oil prices.
Operations involve numerous risks that might result in accidents and other operating risks and costs. Drilling of natural gas and oil wells is potentially a high-risk activity. Risks include:
| • | fire, explosions and blow-outs; |
| • | unexpected drilling conditions such as abnormally pressured formations; |
| • | pipe, cement or casing failures; |
| • | pipeline accidents and failures; and |
| • | environmental accidents such as oil spills, natural gas leaks, ruptures or discharges of toxic gases, brine water or well fluids (including groundwater contamination). |
The Company could incur substantial losses as a result of injury or loss of life; pollution or other environmental damage; damage to or destruction of property and equipment; regulatory investigation; fines or curtailment of operations; or attorney’s fees and other expenses incurred in the prosecution or defense of litigation. As a working interest owner in wells operated by other companies, the Company may also be exposed to the risks enumerated above that are not within its care, custody or control.
There are also inherent operating risks and hazards in the Company’s gas and oil production and gas gathering, processing and treating operations that could cause substantial financial losses. In addition, these risks could result in personal injury or loss of human life, significant damage to property, environmental pollution,
14
Table of Contents
impairment of operations and substantial losses. The location of pipelines near populated areas, including residential areas, commercial business centers and industrial sites could increase the level of damages resulting from these risks. Certain segments of the Company’s pipelines run through such areas. In spite of the Company’s precautions, an event could cause considerable harm to people or property, and could have a material adverse effect on the financial position and results of operations, particularly if the event is not fully covered by insurance. Accidents or other operating risks could further result in lost business activity. Such circumstances could adversely impact the Company’s ability to meet contractual obligations.
As is customary in the gas and oil industry, the Company maintains insurance against some, but not all, of these potential risks and losses. Although QEP believes the coverages and amounts of insurances that it carries are adequate and consistent with industry practice, QEP does not have insurance protection against all risks that it faces, because QEP chooses not to insure certain risks, insurance is not available at a level that balances the costs of insurance and QEP’s desired rates of return, or actual losses exceed coverage limits. Losses and liabilities arising from uninsured or underinsured events could have a material adverse effect on QEP’s financial condition, results of operations and cash flows.
Disruption of, capacity constraints in, or proximity to pipeline systems could impact results of operations. QEP transports natural gas, crude oil and NGL to market by utilizing pipelines owned by others. If pipelines do not exist near producing wells, if pipeline capacity is limited or if pipeline capacity is unexpectedly disrupted, sales could be reduced or shut in, reducing profitability. If pipeline quality requirements change, the company might be required to install additional treating or processing equipment which could increase costs.
QEP is dependent on its revolving credit facility and continued access to capital markets to successfully execute its operating strategies. If QEP is unable to obtain needed capital or financing on satisfactory terms, QEP may experience a decline in its natural gas and oil reserves. QEP is partially dependent on external capital sources to provide financing for certain projects. The availability and cost of these capital sources is cyclical, and these capital sources may not remain available, or the Company may not be able to obtain financing at a reasonable cost in the future. Over the last few years, conditions in the global capital markets have deteriorated, making terms for certain financings less attractive, and in certain cases, resulting in the unavailability of certain types of financing. If QEP’s revenues decline as a result of lower natural gas, oil and NGL prices, operating difficulties, declines in production or for any other reason, QEP may have limited ability to obtain the capital necessary to sustain its operations at current levels. The Company utilizes its revolving credit facility, provided by a group of financial institutions, to meet short-term funding needs. All of QEP’s debt under its revolving credit facility is floating-rate debt. From time to time, the Company may use interest-rate derivatives to fix the rate on a portion of its floating-rate debt. The interest rates on debt under the Company’s revolving credit facility are tied to QEP’s debt ratings which are published by Standard & Poor’s and Moody’s. Under QEP’s revolving credit agreement, a downgrade of credit ratings will increase the interest cost of borrowings under the revolving credit facility. In addition, a downgrade of credit ratings may make it more difficult or expensive to raise capital from financial institutions or other sources. QEP’s failure to obtain additional financing could result in a curtailment of its operations relating to exploration and development of its prospects, which in turn could lead to a possible reduction in QEP’s natural gas or oil reserves and its revenues, and could negatively impact its results of operations.
QEP is exposed to counterparty credit risk as a result of QEP’s receivables and commodity derivative transactions. QEP has significant credit exposure to outstanding accounts receivable from joint interest and working interest owners as well as customers in all segments of its business. Because QEP is the operator on a majority of its large joint venture development projects, QEP pays joint venture expenses and makes cash calls on its non-operating partners for their respective shares of joint venture costs. These projects are capital intensive and, in some cases, a non-operating partner may experience a delay in obtaining financing for its share of the joint venture costs. Counterparty liquidity problems could result in a delay in QEP receiving proceeds from commodity sales or reimbursement of joint venture costs. Credit enhancements, such as financial guarantees or prepayments, have been obtained from some but not all parties. Nonperformance by a trade creditor or joint
15
Table of Contents
venture partner could result in financial losses. In addition, QEP’s commodity derivative transactions expose it to risk of financial loss if a counterparty fails to perform under a contract. During periods of falling commodity prices, QEP’s hedge receivable positions increase, which increases its counterparty exposure.
Risks Related to Strategy
QEP’s use of derivative instruments to manage exposure to uncertain prices could result in financial losses or reduce its income. QEP uses commodity-price derivative arrangements to reduce, or hedge, exposure to volatile natural gas, oil, and NGL prices and to protect cash flow, returns on capital, net income and credit ratings from downward commodity price movements. To the extent the Company hedges commodity price exposure, it may forgo some or all of the benefits of commodity price increases. Additionally, there are proposed financial regulations which may change our reporting and margining requirements relating to such instruments.
QEP enters into commodity-price derivative arrangements with creditworthy counterparties (banks and energy-trading firms) that do not require collateral deposits. QEP is exposed to the risk of counterparties not performing. The amount of credit available may vary depending on the credit ratings assigned to the Company’s debt securities.
QEP faces significant competition and certain of its competitors have resources in excess of QEP’s available resources. QEP operates in the highly competitive areas of natural gas and oil exploration, exploitation, acquisition and production. QEP faces intense competition from:
| • | large multi-national, integrated oil companies; |
| • | US independent oil and gas companies; |
| • | service companies engaging in oil and gas exploration and production activities; and |
| • | private oil and gas equity funds. |
QEP faces competition in a number of areas such as:
| • | acquiring desirable producing properties or new leases for future exploration; |
| • | marketing its natural gas, oil and NGL production; |
| • | acquiring the equipment and expertise necessary to operate and develop properties; and |
| • | attracting and retaining employees with certain skills. |
Certain of QEP’s competitors have financial and other resources in excess of those available to QEP. Such companies may be able to pay more for seismic and lease rights on natural gas and oil properties and exploratory prospects and to define, evaluate, bid for and purchase a greater number of properties and prospects than QEP’s financial or human resources permit. This highly competitive environment could have an adverse impact on QEP’s business.
QEP may be subject to risks in connection with acquisitions and organizational changes. The acquisition of gas and oil properties requires the assessment of recoverable reserves; future gas and oil sales prices and basis differentials; operating costs; and potential environmental and other liabilities. The accuracy of these assessments is inherently uncertain. QEP may not be able to identify attractive acquisition opportunities. Even if QEP does identify attractive opportunities, it may not be able to complete the acquisitions due to capital constraints. If QEP acquires an additional business, QEP could have difficulty integrating the operations, systems, management and other personnel and technology of the acquired business with QEP’s own, or could assume unidentified or unforeseeable liabilities, resulting in a loss of value.
16
Table of Contents
Organizational modifications due to acquisitions, divestitures or other strategic changes can alter the risk and control environments, disrupt ongoing business, distract management and employees, increase expenses and adversely affect results of operations. Even if these challenges can be dealt with successfully, the anticipated benefits of any acquisition, divestiture or other strategic change may not be realized.
Failure of our controls and procedures to detect error or fraud could seriously harm our business and results of operations. Our management, including our Chief Executive Officer and Chief Financial Officer, does not expect that our internal controls and disclosure controls will prevent all possible error and all fraud. A control system, no matter how well conceived and operated, can provide only reasonable, not absolute, assurance that the objectives of the control system are met. In addition, the design of a control system must reflect the fact that there are resource constraints and the benefit of controls must be relative to their costs. Because of the inherent limitations in all control systems, no evaluation of our controls can provide absolute assurance that all control issues and instances of fraud, if any, in our Company have been detected. The design of any system of controls is based in part upon the likelihood of future events, and there can be no assurance that any design will succeed in achieving its intended goals under all potential future conditions. Over time, a control may become inadequate because of changes in conditions or the degree of compliance with its policies or procedures may deteriorate. Because of inherent limitations in a cost-effective control system, misstatements due to error or fraud may occur without detection.
Risks Related to Regulation
QEP is subject to complex federal, state, local and other laws and regulations that could adversely affect its cost of doing business and recording of proved reserves. The Company is subject to federal, state and local tax, environmental, health and safety laws and regulations. Environmental laws and regulations are complex, change frequently and tend to become more onerous over time. In addition to the costs of compliance, substantial costs may be incurred to take corrective actions at both owned and previously-owned facilities. Accidental spills and leaks requiring cleanup may occur in the ordinary course of business. As standards change, the Company may incur significant costs in cases where past operations followed practices that were considered acceptable at the time but now require remedial work to meet current standards. Failure to comply with these laws and regulations may result in fines, significant costs for remedial activities, or injunctions.
QEP must comply with numerous and complex federal and state regulations governing activities on federal and state lands, notably the National Environmental Policy Act, the Endangered Species Act, the Clean Air Act, and the National Historic Preservation Act and similar state laws. The United States Fish and Wildlife Service may designate critical habitat areas for certain listed threatened or endangered species. A critical habitat designation could result in further material restrictions to federal land use and private land use and could delay or prohibit land access or development. The listing of certain species, such as the sage grouse, as threatened and endangered, could have a material impact on the Company’s operations in areas where such species are found. The Clean Water Act and similar state laws regulate discharges of storm water, wastewater, oil, and other pollutants to surface water bodies, such as lakes, rivers, wetlands, and streams. Failure to obtain permits for such discharges could result in civil and criminal penalties, orders to cease such discharges, and other costs and damages. These laws also require the preparation and implementation of Spill Prevention, Control, and Countermeasure Plans in connection with on-site storage of significant quantities of oil.
Federal and state regulatory agencies frequently impose conditions on the Company’s activities. These restrictions have become more stringent over time and can limit or prevent exploration and production on the Company’s leasehold. Certain environmental groups oppose drilling on some of QEP’s federal and state leases. These groups sometimes sue federal and state regulatory agencies for alleged procedural violations in an attempt to stop, limit or delay natural gas and oil development on public lands.
In addition, the Company is subject to federal and state hazard communications and community right-to-know statutes and regulations such as the Emergency Planning and Community Right-to-Know Act that require certain record keeping and reporting of the use and release of hazardous substances.
17
Table of Contents
Various federal agencies within the U.S. Department of the Interior, particularly the Bureau of Land Management and the Bureau of Indian Affairs, along with potentially each Native American tribe, promulgate and enforce regulations pertaining to gas and oil operations on Native American tribal lands. These regulations include such matters as lease provisions, drilling and production requirements, environmental standards and royalty considerations. In addition, under prevailing legal precedent each Native American tribe has limited attributes of sovereignty including the right to enforce laws and regulations independent from federal, state and local statutes and regulations so long as not inconsistent with federal law and regulation. These tribal laws and regulations include various taxes, fees, requirements to employ Native American tribal members and other conditions that apply to lessees, operators and contractors conducting operations on Native American tribal lands. Lessees and operators conducting operations on tribal lands may be subject to the Native American tribal court system. One or more of these factors may increase the Company’s costs of doing business on Native American tribal lands and have an impact on the viability of its gas and oil exploration, production, gathering, processing and transportation operations on such lands.
The Federal Energy Regulatory Commission (FERC) regulates interstate natural gas transportation and oversees natural gas marketing. FERC has issued a number of orders related to market transparency (e.g., price reporting indices, capacity release, standards of conduct, transportation capacity, general compliance) that extend FERC oversight to QEP. Since the enactment of the Energy Policy Act of 2005, granting FERC increased penalty authority for non compliance, FERC has targeted various issues in the natural gas industry for compliance audits and investigations. QEP owns three facilities that are directly regulated by FERC as either an interstate pipeline or a natural gas storage facility connected to interstate pipelines.
QEP may not be able to obtain the permits and approvals necessary to continue and expand its operations. Regulatory authorities exercise considerable discretion in the timing and scope of permit issuance. Requirements imposed by these authorities may be costly and time consuming and may result in delays in the commencement or continuation of the Company’s exploration and production and midstream field services operations. Further, the public may comment on and otherwise seek to influence the permitting process, including through intervention in the courts. Accordingly, needed permits may not be issued, or if issued, may not be issued in a timely fashion, or may involve requirements that restrict QEP’s ability to conduct its operations or to do so profitably.
QEP may incur more taxes if certain federal income tax deductions currently available with respect to natural gas and oil exploration and development are eliminated as a result of future legislation. Our activities are subject to regulation by various federal, state and local tax laws and regulations and government agencies, including the Internal Revenue Service. The need to comply with new or revised tax laws or regulations, or new or changed interpretations or enforcement of existing tax laws or regulations, may have a material adverse effect on our business and results of operations. Federal budget proposals could potentially increase and accelerate the payment of federal income taxes for independent producers of natural gas and oil. The repeal of expensing of intangible drilling costs, percentage of depletion allowance and increased amortization periods for geological and geophysical expenses are some of the proposals that would have a significant impact on us. If enacted, these changes will increase the cost of exploration and development of natural gas and oil resources.
Federal or state hydraulic fracturing legislation could increase QEP’s costs and restrict its access to natural gas and oil reserves. All wells drilled in tight gas sand and shale reservoirs require hydraulic fracture stimulation to achieve economic production rates and recoverable reserves. A significant portion of the Company’s current and future production and reserve potential is derived from reservoirs that require hydraulic fracture stimulation to be commercially viable. Hydraulic fracture stimulation involves pumping fluid at high pressure into tight sand or shale reservoirs to artificially induce fractures. The artificially induced fractures allow better connection between the wellbore and the surrounding reservoir rock, thereby enhancing productive capacity and ultimate hydrocarbon recovery of each well. The fracture stimulation fluid is typically comprised of over 99 percent water and sand, with the remaining constituents consisting of additives designed to optimize the fracture stimulation treatment and production from the reservoir. The Company does not use diesel fuel in any of its fracturing
18
Table of Contents
operations. QEP obtains water for fracture stimulations from a variety of sources including industrial water wells and surface sources. When technically and economically feasible, the Company recycles flow-back and produced water, which reduces water consumption from surface and groundwater sources. The Company believes that the employment of fracture stimulation technology does not present any unique risks other than the inherent risks associated with natural gas and oil drilling and production operations described above. Currently, all well construction activities, including hydraulic fracture stimulation, are regulated by state agencies that review and approve all aspects of gas and oil well design and operation. New environmental initiatives, proposed federal and state legislation and rulemaking pertaining to hydraulic fracture stimulation could include additional permitting, and reporting and disclosure requirements and potential restrictions on the use of hydraulic fracture stimulation that could materially affect the Company’s ability to develop and produce gas and oil reserves.
The adoption of greenhouse gas emission or other environmental legislation could result in increased operating costs, delays in obtaining air pollution permits for new or modified facilities, and reduced demand for the natural gas, oil and NGL that QEP produces. Federal and state courts and administrative agencies are considering the scope and scale of climate-change regulation under various laws pertaining to the environment, energy use and development, and greenhouse gas emissions. QEP’s ability to access and develop new natural gas reserves may be restricted by climate-change regulation. In recent legislative sessions bills have been pending in Congress that would regulate greenhouse gas emissions through a cap-and-trade system under which emitters would be required to buy allowances for offsets of emissions of greenhouse gases. The Environmental Protection Agency (EPA) has adopted final regulations for the measurement and reporting of greenhouse gases emitted from certain large facilities (25,000 tons/year of carbon dioxide (CO2) equivalent) beginning with operations in 2010. The first report is to be filed with the EPA by March 31, 2011. In addition, several of the states in which QEP operates are considering various greenhouse gas registration and reduction programs. Carbon dioxide regulation could increase the price of natural gas, restrict access to or the use of natural gas, and/or reduce natural gas demand. Federal, state and local governments may also pass laws mandating the use of alternative energy sources, such as wind power and solar energy, which may reduce demand for natural gas. While future climate-change regulation is possible, it is too early to predict how such regulation would affect QEP’s business, operations or financial results. It is uncertain whether QEP’s operations and properties, located in the Rocky Mountain and Midcontinent regions of the United States, are exposed to possible physical risks, such as severe weather patterns, due to climate change that may or may not be the result of man-made greenhouse gases. However, management does not believe such physical risks are reasonably likely to have a material effect on the company’s financial condition or results of operations.
Derivatives regulation could increase QEP’s liquidity risks by restricting its use of derivative instruments. The Dodd-Frank Wall Street Reform and Consumer Protection Act (Dodd-Frank Act), which was passed by Congress and signed into law in July 2010, contains significant derivatives regulation, including a requirement that certain derivative transactions be cleared on exchanges, a requirement to post cash collateral (commonly referred to as “margin”) for such derivative transactions, and strong business conduct standards. The Dodd-Frank Act provides for a potential exception from clearing and cash collateral requirements for commercial end-users. The availability of this “end-user exemption” depends on how the Commodities Futures and Trading Commission (CFTC) defines a number of terms that will be used in determining how this exception applies to particular derivative transactions and the parties to those transactions. The CFTC is in the process of proposing definitions to determine which entities will face additional requirements for clearing, trading and posting of margin.
Depending on the rules and definitions adopted by the CFTC, the Dodd-Frank Act could require that QEP post significant amounts of cash collateral with its dealer counterparties for QEP’s derivative transactions. A sudden, unexpected margin call triggered by rising commodity prices would have an immediate negative impact on QEP’s liquidity, forcing QEP to divert capital from exploration, development and production activities. Requirements to post cash collateral could not only cause significant liquidity issues by reducing the Company’s flexibility in using its cash and other sources of funds, such as its revolving credit facility, but could also cause QEP to incur additional debt. In addition, a requirement for QEP’s counterparties to post cash collateral would likely result in additional costs being passed on to QEP, thereby decreasing the effectiveness of its commodity
19
Table of Contents
derivatives and its profitability. If the costs of complying with the clearing and margin requirements and business conduct rules under the Dodd-Frank Act significantly increase the costs of entering into commodity derivative transactions, QEP may reduce its commodity derivative program, which could increase its exposure to fluctuating commodity prices.
Other Risks
General economic and other conditions impact QEP’s results. QEP’s results may also be negatively affected by: changes in global economic conditions; changes in regulation; availability and economic viability of gas and oil properties for sale or exploration; creditworthiness of counterparties; rate of inflation and interest rates; assumptions used in business combinations; weather and natural disasters; changes in customers’ credit ratings; competition from other forms of energy, other pipelines and storage facilities; effects of accounting policies issued periodically by accounting standard-setting bodies; terrorist attacks or acts of war; changes in business or financial condition; changes in credit ratings; and availability of financing for QEP.
The underfunded status of our pension plans may require large contributions which may divert funds from other uses. Approximately one-quarter of our employees participate in defined benefit pension plans, although effective January 1, 1997, we closed participation in the QEP Retirement Plan. Over time, periods of declines in interest rates and pension asset values may result in a reduction in the funded status of our pension plans. As of December 31, 2010, our pension plans were $47.1 million underfunded. The underfunded status of our pension plans may require us to make large contributions to such plans. We made cash contributions of $1.6 million in 2010 to our defined benefit pension plans and expect to make contributions of approximately $11.9 million to such plans in 2011. However, we cannot predict whether changing economic conditions, the future performance of assets in the plans or other factors will require us to make contributions in excess of our current expectations, diverting funds we would otherwise apply to other uses.
ITEM 1B. UNRESOLVED STAFF COMMENTS
None
20
Table of Contents
Reserves – QEP Energy
QEP Energy’s reserve estimates are prepared by Ryder Scott Company, L.P., independent reservoir-engineering consultants. The estimates of proved reserves at December 31, 2010, were made in accordance with amended reserves definitions included in the SEC’s rules for the Modernization of Oil and Gas Reporting, that were adopted December 31, 2009. The most significant amendments affecting the Company include, allowing the use of reliable technologies to estimate and categorize reserves and using the arithmetic average of the price on the first day of each month within the 12-month period prior to the end of the reporting period (unless contractual arrangements designate the price) to be used to calculate economic producibility of reserves and the discounted cash flows reported as the Standardized Measure of Future Net Cash Flows Relating to Proved Reserves. Refer to Note 16 of the consolidated financial statements included in Item 8 of Part II of this Annual Report for additional information regarding estimates of proved reserves and the preparation of such estimates.
At December 31, 2010, approximately 88% of QEP Energy’s estimated proved reserves were Company operated. Proved developed reserves represented 53% of the Company’s total proved reserves at December 31, 2010 while the remaining 47% of reserves were proved undeveloped. All reported reserves are located in the United States. QEP Energy does not have any long-term supply contracts with foreign governments, reserves of equity investees or reserves of subsidiaries with a significant minority interest. QEP Energy’s estimated reserves are summarized as follows:
| December 31, 2010 | ||||||||||||
| Natural Gas |
Oil and NGL |
Natural Gas Equivalents(1) |
||||||||||
| (Bcf) | (MMbbl) | (Bcfe) | ||||||||||
| Proved developed reserves |
1,404.8 | 34.4 | 1,611.5 | |||||||||
| Proved undeveloped reserves |
1,208.1 | 35.2 | 1,419.2 | |||||||||
| Total proved reserves |
2,612.9 | 69.6 | 3,030.7 | |||||||||
| (1) | Oil and NGLs are converted to natural gas at the ratio of one bbl of oil or NGL to six Mcf of natural gas. |
QEP Energy’s reserve statistics for the years ended December 31, 2008 through 2010, are summarized below:
| Year | Year End Reserves (Bcfe) | Natural Gas and Oil Production (Bcfe) |
Reserve Life Index(1) (Years) | |||
| 2008 |
2,218.1 | 171.4 | 12.9 | |||
| 2009 |
2,746.9 | 189.5 | 14.5 | |||
| 2010 |
3,030.7 | 229.0 | 13.2 |
| (1) | Reserve life index is calculated by dividing year-end proved reserves by production for such year. |
QEP Energy’s proved reserves in major operating areas at December 31, 2010 and 2009 are summarized below:
| 2010 | 2009 | |||||||||||||||
| (Bcfe) | (% of total) | (Bcfe) | (% of total) | |||||||||||||
| Midcontinent |
1,170.5 | 39 | 1,100.5 | 40 | ||||||||||||
| Pinedale Anticline |
1,348.9 | 44 | 1,300.7 | 47 | ||||||||||||
| Uinta Basin |
212.8 | 7 | 197.7 | 7 | ||||||||||||
| Rockies Legacy |
298.5 | 10 | 148.0 | 6 | ||||||||||||
| Total QEP Energy |
3,030.7 | 100 | 2,746.9 | 100 | ||||||||||||
Estimates of proved gas and oil reserves have been completed in accordance with professional engineering standards and the Company’s established internal controls, which includes the compliance oversight of a multi-
21
Table of Contents
functional reserves review committee responsible to the Company’s board of directors. QEP Energy’s estimated proved reserves have been prepared by Ryder Scott Company, L.P., independent reservoir engineering consultants, in accordance with the SEC’s Regulation S-X and ASC 932 as amended. The individuals performing reserves estimates possess professional qualifications and demonstrate competency in reserves estimation and evaluation. Refer to Note 16 of the consolidated financial statements included in Item 8 of Part II of this Annual Report for additional information pertaining to QEP Energy’s proved reserves as of the end of each of the last three years.
In addition to this filing, QEP Energy will file reserves estimates as of December 31, 2010, with the Energy Information Administration of the Department of Energy on Form EIA-23. Although companies use the same technical and economic assumptions when they prepare the EIA-23, they are obligated to report reserves for all wells they operate, not for all wells in which they have an interest, and to include the reserves attributable to other owners in such wells.
Production
The following table sets forth the net production volumes, the average net realized prices per Mcf of natural gas, per bbl of oil and NGL produced, and the operating expenses per Mcfe for the years ended December 31, 2010, 2009 and 2008.
| Year Ended December 31, | ||||||||||||
| 2010 | 2009 | 2008 | ||||||||||
| QEP Energy |
||||||||||||
| Volumes produced and sold |
||||||||||||
| Natural gas (Bcf) |
203.8 | 168.7 | 151.9 | |||||||||
| Oil and NGL (MMbbl) |
4.2 | 3.5 | 3.3 | |||||||||
| Total production (Bcfe) |
229.0 | 189.5 | 171.4 | |||||||||
| Average net realized price, net to the well(1) |
||||||||||||
| Natural gas (per Bcf) |
$ | 4.74 | $ | 6.39 | $ | 7.56 | ||||||
| Oil and NGL (per bbl) |
56.80 | 45.91 | 72.96 | |||||||||
| Lifting costs (per Mcfe) |
||||||||||||
| Lease operating expense |
$ | 0.56 | $ | 0.67 | $ | 0.73 | ||||||
| Production taxes |
0.34 | 0.31 | 0.61 | |||||||||
| Total lifting costs |
$ | 0.90 | $ | 0.98 | $ | 1.34 | ||||||
| (1) | Includes the impact of all settled commodity price derivatives |
Productive Wells
The following table summarizes the Company’s productive wells as of December 31, 2010. All wells are located in the United States.
| Gas | Oil | Total | ||||||||||
| Gross |
4,844 | 2,121 | 6,965 | |||||||||
| Net |
2,224 | 436 | 2,660 | |||||||||
Although many wells produce both gas and oil, a well is categorized as either a gas or an oil well based upon the ratio of gas to oil produced. Each gross well completed in more than one producing zone is counted as a single well. At the end of 2010, the Company had 94 gross wells with multiple completions.
The Company also holds numerous overriding-royalty interests in gas and oil wells, a portion of which are convertible to working interests after recovery of certain costs by third parties. After converting to working interests, these wells with overriding-royalty interests will be included in the gross and net-well count.
22
Table of Contents
Leasehold Acreage
The following table summarizes developed and undeveloped-leasehold acreage in which the Company owns a working interest or mineral interest as of December 31, 2010. “Undeveloped Acreage” includes leasehold interests that already may have been classified as containing proved undeveloped reserves and unleased mineral-interest acreage owned by the Company. Excluded from the table is acreage in which the Company’s interest is limited to royalty, overriding-royalty and other similar interests. All leasehold acres are located in the United States.
| Developed Acres(1) | Undeveloped Acres(2) | Total Acres | ||||||||||||||||||||||
| Gross | Net | Gross | Net | Gross | Net | |||||||||||||||||||
| Arkansas |
32,642 | 9,260 | 5,498 | 3,594 | 38,140 | 12,854 | ||||||||||||||||||
| Colorado |
155,000 | 105,625 | 158,025 | 53,839 | 313,025 | 159,464 | ||||||||||||||||||
| Kansas |
29,822 | 12,922 | 52,459 | 17,245 | 82,281 | 30,167 | ||||||||||||||||||
| Louisiana |
55,812 | 45,215 | 24,106 | 22,975 | 79,918 | 68,190 | ||||||||||||||||||
| Montana |
15,094 | 7,706 | 307,134 | 53,027 | 322,228 | 60,733 | ||||||||||||||||||
| New Mexico |
96,969 | 70,756 | 32,939 | 12,618 | 129,908 | 83,374 | ||||||||||||||||||
| North Dakota |
12,068 | 3,681 | 237,877 | 96,121 | 249,945 | 99,802 | ||||||||||||||||||
| Oklahoma |
1,596,688 | 293,403 | 261,769 | 148,474 | 1,858,457 | 441,877 | ||||||||||||||||||
| South Dakota |
— | — | 204,398 | 107,151 | 204,398 | 107,151 | ||||||||||||||||||
| Texas |
133,409 | 46,424 | 56,416 | 50,959 | 189,825 | 97,383 | ||||||||||||||||||
| Utah |
162,820 | 130,788 | 273,359 | 184,458 | 436,179 | 315,246 | ||||||||||||||||||
| Wyoming |
289,270 | 181,211 | 383,248 | 276,154 | 672,518 | 457,365 | ||||||||||||||||||
| Other |
2,429 | 735 | 158,475 | 43,350 | 160,904 | 44,085 | ||||||||||||||||||
| Total |
2,582,023 | 907,726 | 2,155,703 | 1,069,965 | 4,737,726 | 1,977,691 | ||||||||||||||||||
| (1) | Developed acreage is acreage assigned to productive wells. |
| (2) | Undeveloped acreage is leased acreage on which wells have not been drilled or completed to a point that would permit the production of commercial quantities of natural gas and oil regardless of whether such acreage contains proved reserves. |
A portion of the leases summarized in the preceding table will expire at the end of their respective primary terms unless the existing leases are renewed or production has been established from the acreage subject to the lease prior to that date. Leases held by production remain in effect until production ceases. The following table sets forth the gross and net acres subject to leases summarized in the preceding table that will expire during the periods indicated:
Leaseholds Expiring
| Undeveloped Acres Expiring | ||||||||
| Gross | Net | |||||||
| 12 months ending December 31, |
||||||||
| 2011 |
125,647 | 80,786 | ||||||
| 2012 |
68,154 | 45,760 | ||||||
| 2013 |
140,959 | 77,445 | ||||||
| 2014 |
57,707 | 46,779 | ||||||
| 2015 and later |
241,770 | 220,340 | ||||||
23
Table of Contents
Drilling Activity
The following table summarizes the number of development and exploratory wells drilled on acreage owned by QEP during the years indicated.
| Year Ended December 31, | ||||||||||||||||||||||||
| Productive | Dry | |||||||||||||||||||||||
| 2010 | 2009 | 2008 | 2010 | 2009 | 2008 | |||||||||||||||||||
| Net Wells Completed |
||||||||||||||||||||||||
| Exploratory |
16.2 | 3.7 | 2.3 | 1.9 | — | 0.9 | ||||||||||||||||||
| Development |
170.5 | 154.5 | 219.2 | — | — | 6.3 | ||||||||||||||||||
| Gross Wells Completed |
||||||||||||||||||||||||
| Exploratory |
33 | 12 | 10 | 2 | — | 2 | ||||||||||||||||||
| Development |
516 | 273 | 456 | — | 1 | 13 | ||||||||||||||||||
MIDSTREAM FIELD SERVICES – QEP Field Services
QEP Field Services owns 1,855 miles of gathering lines in Utah, Wyoming, Colorado and Louisiana. At December 31, 2010 QEP Field Services also owns processing plants, which remove NGL from the natural gas stream, that have an aggregate processing capacity, of 800 MMcf per day of unprocessed natural gas. In addition, QEP Field Services owns treating facilities in northwest Louisiana, which remove CO2 from the natural gas stream, that have an aggregate treating capacity of 530 MMcf per day of untreated natural gas. QEP Field Services also owns compression facilities and field dehydration and measurement systems. The 21-mile, 20-inch diameter pipeline owned by Rendezvous Pipeline can deliver up to 300 MMcf of natural gas per day to the Kern River Pipeline. QEP Field Services partnership facilities include the RGS system, consisting of 330 miles of gathering lines and associated field equipment, the UBFS system, which consists of 76 miles of gathering lines and associated field equipment and the Three Rivers system, which consists of 57 miles of gathering lines and associated field equipment.
In January 2011, QEP Field Services put into service the 150 MMcf per day cryogenic Iron Horse processing plant expansion of its Stagecoach processing complex in the Uinta Basin of eastern Utah. Also, during the fourth quarter of 2011, QEP Field Services expects to commission its 420 MMcf per day cryogenic processing plant expansion of its Blacks Fork processing complex located in the Green River Basin of southwestern Wyoming.
ENERGY MARKETING – QEP Marketing
QEP Marketing, through its wholly owned subsidiary Clear Creek Storage Company, LLC, owns and operates an underground gas-storage reservoir in southwestern Wyoming. The reservoir has a gas storage capacity of 8 Bcf, comprised of an inventory of approximately 4 Bcf of QEP Marketing-owned cushion gas and working gas storage of 4 Bcf.
24
Table of Contents
QEP is involved in various commercial and regulatory claims and litigation and other legal proceedings that arise in the ordinary course of its business. Management does not believe any of them will have a material adverse effect on the Company’s financial position, results of operations or cash flows. A liability is recorded for a loss contingency when its occurrence is probable and damages can be reasonably estimated based on the anticipated most likely outcome. Disclosures are provided for contingencies reasonably likely to occur which would have a material adverse effect on the Company’s financial position, results of operations or cash flows. Some of the claims involve highly complex issues relating to liability, damages and other matters subject to substantial uncertainties and, therefore, the probability of liability or an estimate of loss cannot be reasonably determined.
Environmental Claims
United States of America v. QEP Field Services, Civil No. 208CV167, U.S. District Court for Utah. The U.S. Environmental Protection Agency (EPA) alleges that QEP Field Services (f/k/a Questar Gas Management) violated the Clean Air Act (CAA) and seeks substantial penalties and a permanent injunction involving the manner of operation of five compressor stations located in the Uinta Basin of eastern Utah. EPA contends that the potential to emit, on a hypothetically uncontrolled basis, for these facilities renders them “major sources” of emissions for criteria and hazardous air pollutants even though controls were installed. Categorization of the facilities as “major sources” affects the particular regulatory program and requirements applicable to those facilities. EPA claims that QEP Field Services failed to obtain the necessary major source pre-construction or modification permits, and failed to comply with hazardous air-pollutant regulations for testing and reporting, among other requirements. QEP Field Services contends that its facilities have pollution controls installed that reduce their actual air emissions below major source thresholds, rendering them subject to different regulatory requirements applicable to non-major sources. QEP Field Services has vigorously defended EPA’s claims, and believes that the major source permitting and regulatory requirements at issue can be legally avoided by applying Utah’s CAA program or EPA’s prior permitting practice for similar facilities elsewhere in Indian Country, among other defenses. Because of the complexities and uncertainties of this legal dispute, it is difficult to predict all reasonably possible outcomes; however, management believes the Company has accrued a reasonable loss contingency that is an immaterial amount, for the anticipated most likely outcome. The Ute Indian Tribe and individual members of its Business Committee have now intervened as co-plaintiffs asserting the same CAA claims as the federal government.
QEP Energy v. U.S. Environmental Protection Agency, No. 09-9538, U.S. Court of Appeals for the 10th Circuit. On July 10, 2009 QEP Energy filed a petition with the U.S. 10th Circuit Court of Appeals challenging an administrative compliance order dated May 12, 2009 (Order), issued by EPA which asserts that QEP Energy’s Flat Rock 14P well in the Uinta Basin and associated equipment is a major source of hazardous air pollutants and its operation fails to comply with certain regulations of the CAA. The Order required immediate compliance. QEP Energy denies that the drilling and operation of the 14P well and associated equipment violates any provisions of the CAA and intends to vigorously defend this claim.
25
Table of Contents
ITEM 5. MARKET FOR REGISTRANT’S COMMON EQUITY, RELATED STOCKHOLDER MATTERS AND ISSUER PURCHASES OF EQUITY SECURITIES
QEP’s common stock is listed and traded on the New York Stock Exchange (NYSE:QEP). As of February 18, 2011, QEP had 8,322 shareholders of record. The declaration and payment of dividends are at the discretion of QEP’s Board of Directors and the amount thereof will depend on QEP’s results of operations, financial condition, contractual restrictions, cash requirements, future prospects and other factors deemed relevant by the Board of Directors. Following is a summary of the high and low sales price per share of QEP’s common stock on the NYSE and quarterly dividends paid per share:
| High price | Low price | Dividend | ||||||||||
| (per share) | ||||||||||||
| 2010 |
||||||||||||
| First quarter(1) |
$ | — | $ | — | $ | — | ||||||
| Second quarter(1) |
— | — | — | |||||||||
| Third quarter |
35.15 | 27.90 | 0.02 | |||||||||
| Fourth quarter |
$ | 38.33 | $ | 29.54 | 0.02 | |||||||
| $ | 0.04 | |||||||||||
| (1) | Public trading of the common shares of the Company commenced on July 1, 2010. |
Stockholder Return Performance Presentation
The performance presentation shown below is being furnished as required by applicable rules of the SEC and was prepared using the following assumptions:
| • | A $100 investment was made in QEP common, the S&P 500 Index and our peer group as of July 1, 2010, which is the date when our common stock began trading on the New York Stock Exchange; |
| • | Investment in our peer group was weighted based on the stock market capitalization of each individual company within the peer group at the beginning of the period; and |
| • | Dividends were reinvested on the relevant payment dates. |
26
Table of Contents
Our peer group, as defined, consists of the following companies: Cabot Oil & Gas Corporation, Cimarex Energy Company, Denbury Resources Inc., EOG Resources, Inc., Forest Oil Corporation, Newfield Exploration Company, Noble Energy, Inc., Petrohawk Energy Corporation, Pioneer Natural Resources Company, Plains Exploration & Production Company, Quicksilver Resources, Inc., Range Resources Corporation, Southwestern Energy Company, Ultra Petroleum Corporation and Whiting Petroleum Corporation. Management believes this peer group provides a meaningful comparison based upon our review of asset size, geographic location of assets, market capitalization, revenues, culture and performance, among other things.
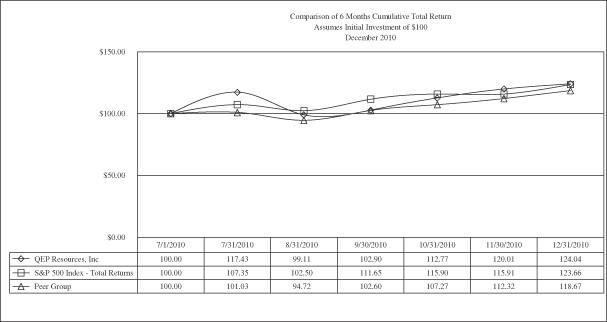
Changes in Securities, Use of Proceeds and Issuer Purchases of Equity Securities
QEP had no unregistered sales of equity during the fourth quarter of 2010. QEP repurchased shares in conjunction with tax-payment elections under the Company’s Long-term Stock Incentive Plan and rollover shares used in exercising stock options.
The following table sets forth the Company’s purchases of common stock registered under Section 12 of the Exchange Act that occurred during the quarter ended December 31, 2010.
| 2010 |
Number of Shares Purchased |
Average Price per Share |
Total Number of Shares Purchased as Part of Publicly Announced Plans |
Maximum Number of Shares that May Yet Be Purchased Under the Plans |
||||||||||||
| October |
13,450 | $ | 31.39 | — | — | |||||||||||
| November |
30,722 | 34.43 | — | — | ||||||||||||
| December |
44,924 | 36.65 | — | — | ||||||||||||
| Total |
89,096 | $ | 35.09 | |||||||||||||
27
Table of Contents
ITEM 6. SELECTED FINANCIAL DATA
Selected financial data for the five years ended December 31, 2010, is provided in the table below. Refer to Item 7 and Item 8 in Part II of this annual report for discussion of facts affecting the comparability.
| Year Ended December 31, | ||||||||||||||||||||
| 2010 | 2009 | 2008 | 2007 | 2006 | ||||||||||||||||
| (in millions, except per-share amounts) | ||||||||||||||||||||
| Results Of Operations(1) |
||||||||||||||||||||
| Revenues |
$ | 2,246.4 | $ | 1,972.5 | $ | 2,318.8 | $ | 1,688.1 | $ | 1,685.7 | ||||||||||
| Operating income |
545.3 | 585.5 | 933.2 | 584.1 | 511.7 | |||||||||||||||
| Income from continuing operations |
285.9 | 215.4 | 520.6 | 361.6 | 306.1 | |||||||||||||||
| Discontinued operations net of income tax |
43.2 | 80.7 | 73.9 | 59.2 | 50.0 | |||||||||||||||
| Net income attributable to QEP |
326.2 | 293.5 | 585.5 | 420.8 | 356.1 | |||||||||||||||
| Earnings per common share attributable to QEP |
||||||||||||||||||||
| Basic from continuing operations |
$ | 1.61 | $ | 1.23 | $ | 2.96 | $ | 2.11 | $ | 1.79 | ||||||||||
| Basic from discontinued operations |
0.25 | 0.46 | 0.43 | 0.34 | 0.29 | |||||||||||||||
| Basic total |
$ | 1.86 | $ | 1.69 | $ | 3.39 | $ | 2.45 | $ | 2.08 | ||||||||||
| Diluted from continuing operations |
$ | 1.60 | $ | 1.21 | $ | 2.90 | $ | 2.05 | 1.74 | |||||||||||
| Diluted from discontinued operations |
0.24 | 0.46 | 0.42 | 0.34 | 0.29 | |||||||||||||||
| Diluted total |
$ | 1.84 | $ | 1.67 | $ | 3.32 | $ | 2.39 | $ | 2.03 | ||||||||||
| Weighted-average common shares outstanding |
||||||||||||||||||||
| Used in basic calculation |
175.3 | 174.1 | 172.8 | 172.0 | 170.9 | |||||||||||||||
| Used in diluted calculation |
177.3 | 176.3 | 176.1 | 175.9 | 175.2 | |||||||||||||||
| Financial Position |
||||||||||||||||||||
| Total Assets at December 31, |
$ | 6,785.3 | $ | 6,481.4 | $ | 6,342.7 | $ | 3,821.6 | $ | 3,261.8 | ||||||||||
| Capitalization at December 31, |
||||||||||||||||||||
| Long-term debt |
1,530.8 | 1,348.7 | 1,299.1 | 499.3 | 399.2 | |||||||||||||||
| Total equity |
3,063.1 | 2,808.7 | 2,779.4 | 1,860.1 | 1,544.8 | |||||||||||||||
| Total Capitalization |
$ | 4,593.9 | $ | 4,157.4 | $ | 4,078.5 | $ | 2,359.4 | $ | 1,944.0 | ||||||||||
| Cash Flow From Continuing Operations |
||||||||||||||||||||
| Net cash provided by operating activities |
$ | 997.5 | $ | 1,149.4 | $ | 1,224.7 | $ | 807.0 | $ | 654.8 | ||||||||||
| Capital expenditures |
(1,469.0 | ) | (1,198.4 | ) | (2,136.7 | ) | (838.9 | ) | (670.0 | ) | ||||||||||
| Net cash used in investing activities |
(1,390.5 | ) | (1,146.4 | ) | (2,021.0 | ) | (867.9 | ) | (621.9 | ) | ||||||||||
| Net cash provided by (used in) financing activities |
373.7 | (8.8 | ) | 818.7 | 44.1 | (17.2 | ) | |||||||||||||
| Non-GAAP Measures |
||||||||||||||||||||
| Adjusted EBITDA(2) |
$ | 1,140.5 | $ | 1,165.5 | $ | 1,310.7 | $ | 890.7 | $ | 737.7 | ||||||||||
| (1) | QEP completed a Spin-off from Questar in June 2010 as discussed in more detail in the Explanatory Note in Part I, Item 1 of this Annual Report on Form 10-K. As a result of the Spin-off, Wexpro’s financial results have been reflected as discontinued operations and all prior periods have been recast. |
| (2) | Adjusted EBITDA is a non-GAAP measure. Management defines Adjusted EBITDA as net income before the following items: discontinued operations, unrealized gain and losses on basis-only swaps, gains and losses from assets sales, interest and other income, income taxes interest expense, separations costs, loss on early extinguishment of debt, depreciation, depletion and amortization, abandonment and impairment, and exploration expense. Management believes Adjusted EBITDA is an important measure of the Company’s cash flow and liquidity and an important measure for comparing the Company’s financial performance to other gas and oil producing companies. |
28
Table of Contents
The following table reconciles QEP Resources’ net income to Adjusted EBITDA:
| Year Ended December 31, | ||||||||||||||||||||
| 2010 | 2009 | 2008 | 2007 | 2006 | ||||||||||||||||
| (in millions) | ||||||||||||||||||||
| Adjusted EBITDA |
||||||||||||||||||||
| Net income attributable to QEP |
$ | 326.2 | $ | 293.5 | $ | 585.5 | $ | 420.8 | $ | 356.1 | ||||||||||
| Net income attributable to noncontrolling interest |
2.9 | 2.6 | 9.0 | — | — | |||||||||||||||
| Net income |
329.1 | 296.1 | 594.5 | 420.8 | 356.1 | |||||||||||||||
| Discontinued operations, net of tax |
(43.2 | ) | (80.7 | ) | (73.9 | ) | (59.2 | ) | (50.0 | ) | ||||||||||
| Income from continuing operations |
285.9 | 215.4 | 520.6 | 361.6 | 306.1 | |||||||||||||||
| Unrealized gain / (loss) basis-only swaps |
(121.7 | ) | 164.0 | 79.2 | (5.7 | ) | 1.9 | |||||||||||||
| Net (gain) loss from asset sales |
(12.1 | ) | (1.5 | ) | (60.4 | ) | 0.6 | (25.3 | ) | |||||||||||
| Interest and other income |
(2.3 | ) | (4.5 | ) | (10.2 | ) | (7.8 | ) | (4.5 | ) | ||||||||||
| Income taxes |
167.0 | 117.6 | 283.6 | 211.3 | 180.6 | |||||||||||||||
| Interest expense |
84.4 | 70.1 | 61.7 | 33.6 | 33.4 | |||||||||||||||
| Separation costs |
13.5 | — | — | — | — | |||||||||||||||
| Loss from early extinguishment of debt |
13.3 | — | — | — | 1.7 | |||||||||||||||
| Depreciation, depletion and amortization |
643.4 | 559.1 | 361.5 | 263.9 | 201.9 | |||||||||||||||
| Abandonment and impairment |
46.1 | 20.3 | 45.4 | 11.2 | 7.5 | |||||||||||||||
| Exploration |
23.0 | 25.0 | 29.3 | 22.0 | 34.4 | |||||||||||||||
| Adjusted EBITDA |
$ | 1,140.5 | $ | 1,165.5 | $ | 1,310.7 | $ | 890.7 | $ | 737.7 | ||||||||||
29
Table of Contents
ITEM 7. MANAGEMENT’S DISCUSSION AND ANALYSIS OF FINANCIAL CONDITION AND RESULTS OF OPERATIONS
Management’s Discussion and Analysis of Financial Condition and Results of Operations (MD&A) is intended to provide a reader of the financial statements with a narrative from the perspective of management on the financial condition, results of operations, liquidity and certain other factors that may affect the results. MD&A should be read in conjunction with the Consolidated Financial Statements and related notes included in Item 8 of this Annual Report on Form 10-K.
The following information updates the discussion of QEP’s financial condition provided in its 2009 Form 10-K filing, and analyzes the changes in the results of operations between the years ended December 31, 2010 versus December 31, 2009 and December 31, 2009 versus December 31, 2008.
OVERVIEW
QEP Resources, Inc. (QEP or the Company), is an independent natural gas and oil exploration and production company. QEP is a holding company with three major lines of business – gas and oil exploration and production, midstream field services, and energy marketing – which are conducted through three principal subsidiaries:
| • | QEP Energy Company (QEP Energy) acquires, explores for, develops and produces natural gas, oil, and natural gas liquids (NGL); |
| • | QEP Field Services Company (QEP Field Services) provides midstream field services including natural gas gathering, processing and treating services for affiliates and third parties; and |
| • | QEP Marketing Company (QEP Marketing) markets equity and third-party natural gas and oil, provides risk-management services, and owns and operates an underground gas-storage reservoir. |
Highlights
QEP’s net income increased 11% in 2010 compared with 2009 due to unrealized mark-to-market gains on basis-only swaps, higher production, higher net realized crude oil and NGL prices and higher gathering and processing margins at QEP Field Services, partially offset by lower net realized natural gas prices. QEP reported record production of 229.0 Bcfe in 2010 and all divisions, other than the Uinta Basin, recorded production that was greater than in 2009. Year-end proved reserves increased by 10% over the prior year to 3.03 Tcfe.
On June 30, 2010, all of the shares of common stock of QEP were distributed through a tax-free, pro rata dividend to Questar shareholders. Each Questar shareholder received one share of QEP common stock for each share of Questar common stock held (including fractional shares). In conjunction with the Spin-off, QEP distributed the common stock of its wholly-owned subsidiary, Wexpro, to Questar. In addition, Questar contributed $250.0 million of equity to QEP prior to the Spin-off.
In the third quarter of 2010, QEP completed the refinancing of senior notes that were tendered to the Company as a result of the Spin-off. In total, QEP purchased $638.0 million principal amount of senior notes using proceeds from its term loan and revolving credit facilities. In August, QEP issued $625.0 million principal amount of senior notes due 2021 to refinance a portion of the indebtedness under its revolving credit facility and all the outstanding indebtedness under the term loan and terminated all of the commitments under the term loan. At December 31, 2010, QEP had five issues of senior notes totaling $1,137.0 million principal amount outstanding compared to $1,150.0 million principal amount outstanding at June 30, 2010.
30
Table of Contents
Strategies
We create value for our shareholders through returns-focused growth, superior execution, and a low cost structure. To achieve these objectives we will strive to:
| • | Attract and retain the best people |
| • | Allocate capital to the projects that generate the best returns |
| • | Maintain a sustainable inventory of low-cost, high margin resource plays |
| • | Be in the best parts of the best plays |
| • | Build contiguous acreage positions to drive efficiencies |
| • | Be the operator of our assets whenever possible |
| • | Be the low-cost driller and producer in each area where we operate |
| • | Own and operate midstream infrastructure in our core producing areas to control our future and capture value downstream of the wellhead |
| • | Build gas processing plants to extract liquids from our gas streams |
| • | Gather, compress and treat our production to drive down costs |
| • | Actively market our equity production to maximize value |
| • | Utilize commodities derivatives to hedge against a decline in the realized prices of our natural gas and oil production and lock in acceptable cash flows to support future capital expenditures |
| • | Operate in a safe and environmentally responsible manner |
| • | Maintain a strong balance sheet and financial flexibility that allows us to take advantage of both organic growth and acquisition opportunities |
RESULTS OF OPERATIONS
Following are comparisons of net income from continuing operations attributable to QEP by line of business:
| Year Ended December 31, | Change | |||||||||||||||||||
| 2010 | 2009 | 2008 | 2010 vs. 2009 | 2009 vs. 2008 | ||||||||||||||||
| (in millions, except per-share amounts) | ||||||||||||||||||||
| QEP Energy |
$ | 203.9 | $ | 134.9 | $ | 408.0 | $ | 69.0 | $ | (273.1 | ) | |||||||||
| QEP Field Services |
91.1 | 69.4 | 81.5 | 21.7 | (12.1 | ) | ||||||||||||||
| QEP Marketing and other |
6.7 | 8.5 | 22.1 | (1.8 | ) | (13.6 | ) | |||||||||||||
| Certain costs of separation and early extinguishment of debt |
(18.7 | ) | — | — | (18.7 | ) | — | |||||||||||||
| Net income from continuing operations attributable to QEP |
$ | 283.0 | $ | 212.8 | $ | 511.6 | $ | 70.2 | $ | (298.8 | ) | |||||||||
| Earnings per diluted share from continuing operations |
$ | 1.60 | $ | 1.21 | $ | 2.90 | $ | 0.39 | $ | (1.69 | ) | |||||||||
| Average diluted shares |
177.3 | 176.3 | 176.1 | 1.0 | 0.2 | |||||||||||||||
31
Table of Contents
QEP ENERGY
QEP Energy reported net income of $203.9 million in 2010, an increase of 51% from $134.9 million in 2009, but lower than 2008 net income of $408.0 million when natural gas prices were significantly higher. Unrealized mark-to-market gains on natural gas basis-only swaps, higher production of 229.0 Bcfe and higher net realized crude oil and NGL prices were the main drivers for this increase. These factors were partially offset by lower net realized natural gas prices. Unrealized mark-to-market gains and losses on natural gas basis-only swaps increased pre-tax income $121.7 million in 2010 compared to a net pre-tax loss of $164.0 million for these items in 2009. Net gains from sales of assets increased pre-tax income by $13.7 million in 2010 compared to a net pre-tax gain of $1.6 million in 2009. Following is a summary of QEP Energy financial and operating results:
| Year Ended December 31, | Change | |||||||||||||||||||
| 2010 | 2009 | 2008 | 2010 vs. 2009 | 2009 vs. 2008 | ||||||||||||||||
| (in millions) | ||||||||||||||||||||
| QEP Energy Operating Income |
||||||||||||||||||||
| REVENUES |
||||||||||||||||||||
| Natural gas sales |
$ | 1,086.9 | $ | 1,103.9 | $ | 1,147.7 | $ | (17.0 | ) | $ | (43.8 | ) | ||||||||
| Oil and NGL sales |
238.9 | 158.5 | 237.5 | 80.4 | (79.0 | ) | ||||||||||||||
| Other |
5.0 | 4.9 | 6.9 | 0.1 | (2.0 | ) | ||||||||||||||
| Total Revenues |
1,330.8 | 1,267.3 | 1,392.1 | 63.5 | (124.8 | ) | ||||||||||||||
| OPERATING EXPENSES |
||||||||||||||||||||
| Lease operating expenses |
127.3 | 127.5 | 125.4 | (0.2 | ) | 2.1 | ||||||||||||||
| General and administrative |
78.0 | 68.0 | 55.8 | 10.0 | 12.2 | |||||||||||||||
| Production and property taxes |
77.8 | 58.3 | 104.0 | 19.5 | (45.7 | ) | ||||||||||||||
| Depreciation, depletion and amortization |
592.5 | 512.8 | 330.9 | 79.7 | 181.9 | |||||||||||||||
| Exploration expenses |
23.0 | 25.0 | 29.3 | (2.0 | ) | (4.3 | ) | |||||||||||||
| Abandonment and impairment |
46.1 | 20.3 | 44.6 | 25.8 | (24.3 | ) | ||||||||||||||
| Natural gas purchases |
— | — | 0.5 | — | (0.5 | ) | ||||||||||||||
| Total Operating Expenses |
944.7 | 811.9 | 690.5 | 132.8 | 121.4 | |||||||||||||||
| Net gain (loss) from asset sales |
13.7 | 1.6 | 60.4 | 12.1 | (58.8 | ) | ||||||||||||||
| Operating Income |
399.8 | 457.0 | 762.0 | (57.2 | ) | (305.0 | ) | |||||||||||||
| Interest and other income |
2.1 | 3.9 | 7.5 | (1.8 | ) | (3.6 | ) | |||||||||||||
| Income from unconsolidated affiliates |
0.2 | 0.1 | 0.5 | 0.1 | (0.4 | ) | ||||||||||||||
| Unrealized and realized gain (loss) on basis-only swaps |
— | (189.6 | ) | (79.2 | ) | 189.6 | (110.4 | ) | ||||||||||||
| Interest Expense |
(78.5 | ) | (63.9 | ) | (58.3 | ) | (14.6 | ) | (5.6 | ) | ||||||||||
| INCOME FROM CONTINUING OPERATIONS BEFORE INCOME TAXES |
323.6 | 207.5 | 632.5 | 116.1 | (425.0 | ) | ||||||||||||||
| Income Taxes |
(119.7 | ) | (72.6 | ) | (224.5 | ) | (47.1 | ) | 151.9 | |||||||||||
| NET INCOME ATTRIBUTABLE TO QEP Energy |
$ | 203.9 | $ | 134.9 | $ | 408.0 | $ | 69.0 | $ | (273.1 | ) | |||||||||
32
Table of Contents
Production
QEP Energy production totaled 229.0 Bcfe in 2010 compared to 189.5 Bcfe in 2009 and 171.4 Bcfe in 2008. On an energy-equivalent basis, natural gas comprised approximately 89% of 2010 production. A summary of natural gas-equivalent production by major operating area is shown in the following table:
| Year Ended December 31, | Change | |||||||||||||||||||
| 2010 | 2009 | 2008 | 2010 vs. 2009 | 2009 vs. 2008 | ||||||||||||||||
| QEP Energy production by operating area |
(in Bcfe) | |||||||||||||||||||
| Midcontinent |
120.4 | 87.8 | 67.8 | 32.6 | 20.0 | |||||||||||||||
| Pinedale Anticline |
68.5 | 61.8 | 56.8 | 6.7 | 5.0 | |||||||||||||||
| Uinta Basin |
21.4 | 23.2 | 26.9 | (1.8 | ) | (3.7 | ) | |||||||||||||
| Rockies Legacy |
18.7 | 16.7 | 19.9 | 2.0 | (3.2 | ) | ||||||||||||||
| Total production |
229.0 | 189.5 | 171.4 | 39.5 | 18.1 | |||||||||||||||
| QEP Energy production volumes |
||||||||||||||||||||
| Natural gas (Bcf) |
203.8 | 168.7 | 151.9 | 35.1 | 16.8 | |||||||||||||||
| Oil and NGL (MMbbl) |
4.2 | 3.5 | 3.3 | 0.7 | 0.2 | |||||||||||||||
| Total production (Bcfe) |
229.0 | 189.5 | 171.4 | 39.5 | 18.1 | |||||||||||||||
| Average daily production (MMcfe) |
627.4 | 519.1 | 468.3 | 108.3 | 50.8 | |||||||||||||||
Net production in the Midcontinent grew 37% to 120.4 Bcfe in 2010 compared to 87.8 Bcfe in 2009. Midcontinent production growth was driven by the ongoing development drilling in the Haynesville Shale play in Elm Grove, Thorn Lake and Woodardville fields in northwest Louisiana, continued development of the Granite Wash/Atoka play in the Texas Panhandle, and the Woodford “Cana” Shale horizontal gas play in the Anadarko Basin of western Oklahoma.
Net production from the Pinedale Anticline in western Wyoming grew 11% to 68.5 Bcfe in 2010 as a result of ongoing development drilling. Historically, seasonal access restrictions imposed by the Bureau of Land Management have limited the ability to drill and complete wells at Pinedale during the mid-November to early May period. In September 2008, the BLM issued a Record of Decision (ROD) on the Final Supplemental Environmental Impact Statement for long-term development of natural gas resources in the Pinedale Anticline Project Area (PAPA). Under the ROD, QEP Energy is allowed to drill and complete wells year-round in one of the five Concentrated Development Areas defined in the PAPA. The ROD contains additional requirements and restrictions on development of the PAPA.
In the Uinta Basin, net production decreased 8% to 21.4 Bcfe in 2010. Production volumes were adversely impacted by decreased drilling activity in response to low natural gas prices.
Rockies Legacy net production in 2010 increased 12% to 18.7 Bcfe, 2.0 Bcfe higher than the year-ago period due to increased drilling activity in the Bakken play in North Dakota. QEP Energy Rockies Legacy properties include all Rocky Mountain region properties except the Pinedale Anticline and the Uinta Basin.
33
Table of Contents
Pricing
Realized prices for natural gas at QEP Energy were lower in 2010 than in 2009 and 2008, while 2010 realized oil and NGL prices were higher than in 2009 but lower than in 2008. A regional comparison of QEP Energy’s average realized prices, including the impact of hedges, are shown in the following table:
| Year Ended December 31, | Change | |||||||||||||||||||
| 2010 | 2009 | 2008 | 2010 vs. 2009 | 2009 vs. 2008 | ||||||||||||||||
| Natural gas (per Mcf) |
||||||||||||||||||||
| Midcontinent |
$ | 5.85 | $ | 7.01 | $ | 8.63 | $ | (1.16 | ) | $ | (1.62 | ) | ||||||||
| Rocky Mountains |
4.73 | 6.12 | 6.85 | (1.39 | ) | (0.73 | ) | |||||||||||||
| Volume-weighted average |
5.33 | 6.54 | 7.56 | (1.21 | ) | (1.02 | ) | |||||||||||||
| Oil and NGL (per bbl) |
||||||||||||||||||||
| Midcontinent |
$ | 50.63 | $ | 46.05 | $ | 72.82 | $ | 4.58 | $ | (26.77 | ) | |||||||||
| Rocky Mountains |
61.09 | 45.82 | 73.05 | 15.27 | (27.23 | ) | ||||||||||||||
| Volume-weighted average |
56.80 | 45.91 | 72.96 | 10.89 | (27.05 | ) | ||||||||||||||
A comparison of net realized average natural gas prices, including realized losses on basis-only swaps which did not qualify for hedge accounting and are therefore not included in revenue, are shown in the following table.
| Year Ended December 31, | Change | |||||||||||||||||||
| 2010 | 2009 | 2008 | 2010 vs. 2009 | 2009 vs. 2008 | ||||||||||||||||
| Average field-level natural gas price ($ per Mcf) |
$ | 3.60 | $ | 2.99 | $ | 6.73 | $ | 0.61 | $ | (3.74 | ) | |||||||||
| Natural gas hedging impact ($ per Mcf) |
1.73 | 3.55 | 0.83 | (1.82 | ) | 2.72 | ||||||||||||||
| Average revenue ($ per Mcf)(1) |
5.33 | 6.54 | 7.56 | (1.21 | ) | (1.02 | ) | |||||||||||||
| Realized losses on basis-only swaps ($ per Mcf)(2) |
(0.59 | ) | (0.15 | ) | — | (0.44 | ) | (0.15 | ) | |||||||||||
| Net realized natural gas price ($ per Mcf) |
$ | 4.74 | $ | 6.39 | $ | 7.56 | $ | (1.65 | ) | $ | (1.17 | ) | ||||||||
| Average field-level oil and NGL price ($ per bbl) |
$ | 58.87 | $ | 45.45 | $ | 82.74 | $ | 13.42 | $ | (37.29 | ) | |||||||||
| Oil and NGL hedging impact ($ per bbl) |
(2.07 | ) | 0.46 | (9.78 | ) | (2.53 | ) | 10.24 | ||||||||||||
| Net realized oil and NGL price ($ per bbl)(1) |
$ | 56.80 | $ | 45.91 | $ | 72.96 | $ | 10.89 | $ | (27.05 | ) | |||||||||
| (1) | Reported in revenues in the consolidated income statement. |
| (2) | Reported below operating income in the consolidated income statement. |
Realized losses on basis-only swaps of $121.7 million in 2010 and $25.6 million in 2009 are reported after operating income in the Consolidated Statements of Income.
34
Table of Contents
Commodity Derivatives Impact
The impact of QEP’s commodity derivative transactions on the Company’s financial statements is presented below. The net effect of the portion of natural gas basis-only swaps that do not qualify for hedge accounting is reported in the Consolidated Statements of Income below operating income. Derivative positions as of December 31, 2010, are summarized in Note 8 to the consolidated financial statements in Item 8 of this Annual Report on Form 10-K.
| Volumes subject to commodity derivatives as a percent of gas production |
Year Ended December 31, | |||||||||||||||||||
| 2010 | 2009 | 2008 | ||||||||||||||||||
| Fixed-price swaps |
74 | % | 77 | % | 82 | % | ||||||||||||||
| Collars |
3 | % | — | — | ||||||||||||||||
| Basis-only swaps |
15 | % | 3 | % | ||||||||||||||||
| Volumes subject to commodity derivatives as a percent of oil production |
||||||||||||||||||||
| Fixed-price swaps |
31 | % | 42 | % | 50 | % | ||||||||||||||
| Collars |
24 | % | — | — | ||||||||||||||||
| Impact of hedges on financial statements (millions) | Change | |||||||||||||||||||
| 2010 vs. 2009 | 2009 vs. 2008 | |||||||||||||||||||
| Natural gas sales |
$ | 353.8 | $ | 599.3 | $ | 125.8 | $ | (245.5 | ) | $ | 473.5 | |||||||||
| Oil and NGL sales |
(8.7 | ) | 1.6 | (31.9 | ) | (10.3 | ) | 33.5 | ||||||||||||
| Impact of commodity derivatives that do not qualify for hedge accounting (millions) |
||||||||||||||||||||
| Unrealized gain (loss) on basis-only swaps |
$ | 121.7 | $ | (164.0 | ) | $ | (79.2 | ) | $ | 285.7 | $ | (84.8 | ) | |||||||
| Realized (loss) on basis-only swaps |
(121.7 | ) | (25.6 | ) | — | (96.1 | ) | (25.6 | ) | |||||||||||
The change in unrealized gains and losses on natural gas basis-only swaps increased 2010 net income $76.3 million compared to a loss of $103.3 million in the year-earlier period. As of December 31, 2009, all of the Company’s basis-only swaps had been paired with NYMEX gas fixed-price swaps or price-collars and re-designated as cash flow hedges. Changes in the fair value of these derivative instruments subsequent to their re-designation were recorded in Accumulated Other Comprehensive Income (AOCI), however, changes in the fair value of these derivative instruments occurring prior to their re-designation were recorded in the Consolidated Statement of Income.
Operating Expenses
In 2010, QEP Energy operating expenses (the sum of depreciation, depletion and amortization expense, lease operating expense, general and administrative expense, allocated-interest expense and production taxes) per Mcfe of production decreased 5% to $4.17 per Mcfe versus $4.39 per Mcfe in 2009. Operating expenses are summarized in the following table:
| Year Ended December 31, | Change | |||||||||||||||||||
| 2010 | 2009 | 2008 | 2010 vs. 2009 | 2009 vs. 2008 | ||||||||||||||||
| (per Mcfe) | ||||||||||||||||||||
| Depreciation, depletion and amortization |
$ | 2.59 | $ | 2.71 | $ | 1.93 | $ | (0.12 | ) | $ | 0.78 | |||||||||
| Lease operating expenses |
0.56 | 0.67 | 0.73 | (0.11 | ) | (0.06 | ) | |||||||||||||
| General and administrative expense |
0.34 | 0.36 | 0.33 | (0.02 | ) | 0.03 | ||||||||||||||
| Allocated-interest expense |
0.34 | 0.34 | 0.34 | — | — | |||||||||||||||
| Production taxes |
0.34 | 0.31 | 0.61 | 0.03 | (0.30 | ) | ||||||||||||||
| Total Operating expenses |
$ | 4.17 | $ | 4.39 | $ | 3.94 | $ | (0.22 | ) | $ | 0.45 | |||||||||
35
Table of Contents
In 2010, production volume-weighted per-unit depreciation, depletion and amortization (DD&A) expense decreased compared to 2009 primarily as a result of increased proved reserves related to higher field-level natural gas and oil prices compared to a year ago. Lease operating expenses per Mcfe were lower primarily due to higher production volumes combined with flat operating expenses. General and administrative expenses per Mcfe were slightly lower as a result of increased production volumes partially offset by higher expenses. The increase in general and administrative expenses was primarily related to higher labor, benefits and stock based compensation expenses. Allocated interest expense per Mcfe of production was unchanged. Production taxes per Mcfe increased slightly in 2010 as the result of higher field-level natural gas and oil sales prices. In most states, the Company pays production taxes based on a percentage of field level sales prices.
Exploration expense decreased $2.0 million or 8% in 2010 compared to 2009, despite an $8.7 million charge associated with an unsuccessful exploratory well drilled on the Borie Niobrara prospect in southeastern Wyoming. The overall decrease was due to lower geological, geophysical and other exploratory expenses in 2010 compared with 2009. Abandonment and impairment expense increased $25.8 million or 127% in 2010 compared to 2009. The increase is primarily due to higher impairment costs associated with our unproven acreage, which we amortize on a straight-line basis over the primary term of the lease. A significant amount of costs associated with such leases were added in 2009. Additionally, a $7.6 million impairment of an acreage block associated with the Borie Niobrara exploratory well discussed above contributed to this increase.
Other Items
QEP Energy completed the sale of properties located in Arkansas, Mississippi and other non-core locations and recognized a pre-tax gain of $13.7 million during the third quarter of 2010.
Major Operating Areas
Midcontinent
QEP Energy’s Midcontinent properties are distributed over a large area, including the Anadarko Basin of Oklahoma and the Texas Panhandle, the Arkoma Basin of Oklahoma and western Arkansas, and the Ark-La-Tex region of Arkansas, Louisiana and Texas. Excluding northwest Louisiana, the Granite Wash/Atoka Wash play in the Texas Panhandle and the Woodford Shale “Cana” play in western Oklahoma, QEP Energy Midcontinent leasehold interests are fragmented, with no significant concentration of property interests. In aggregate, Midcontinent properties contributed 120.4 Bcfe or 53% of 2010 production and comprised 1,170.5 Bcfe or 39% of QEP Energy total proved reserves at December 31, 2010.
QEP Energy has approximately 49,600 net acres of Haynesville Shale lease rights in northwest Louisiana. The true vertical depth to the top of the Haynesville Shale ranges from approximately 10,500 feet to 12,500 feet across QEP Energy’s leasehold. The Haynesville Shale underlies the Hosston and Cotton Valley formations that QEP Energy has been developing in northwest Louisiana for over a decade. QEP Energy continues drilling in the Haynesville Shale and intends to drill or participate in up to 80 gross (operated and non-operated) horizontal Haynesville Shale wells in 2011 compared to 86 gross wells in 2010. As of December 31, 2010, QEP Energy had six operated rigs drilling in the project area and had working interests in 121 gross Haynesville Formation wells and a total of 716 gross producing wells in northwest Louisiana compared to 31 gross Haynesville Formation wells and a total of 610 gross producing wells at December 31, 2009.
QEP Energy has approximately 68,000 net acres of Woodford Shale lease rights in western Oklahoma. The true vertical depth to the top of the Woodford Shale ranges from approximately 10,500 feet to 14,500 feet across QEP Energy’s leasehold. QEP Energy intends to drill or participate in up to 64 gross horizontal Woodford Shale wells in 2011 compared to 54 gross wells in 2010. As of December 31, 2010, QEP Energy had two operated rigs drilling in the project area and had working interests in 102 gross producing Woodford Shale wells in western Oklahoma compared to 49 gross wells at December 31, 2009.
36
Table of Contents
QEP Energy has approximately 41,000 net acres of Granite Wash/Atoka Wash lease rights in the Texas Panhandle and western Oklahoma and has been drilling vertical Granite Wash/Atoka Wash wells for over a decade. In the past year, QEP and other operators have drilled a number of successful horizontal wells in the Granite Wash/Atoka Wash play. The true vertical depth to the top of the Granite Wash/Atoka Wash interval ranges from approximately 11,100 feet to 15,900 feet across QEP Energy’s leasehold. As of December 31, 2010, QEP Energy had three rigs drilling horizontal Granite Wash/Atoka Wash wells in the Texas Panhandle and had working interests in 48 gross producing horizontal Granite Wash/Atoka Wash wells in the Texas Panhandle and western Oklahoma compared to 15 gross wells at December 31, 2009. QEP Energy intends to drill or participate in up to 35 gross horizontal Granite Wash/Atoka Wash wells in 2011 compared to 33 gross wells in 2010.
Pinedale Anticline
As of December 31, 2010, QEP Energy had working interests in 529 gross producing wells on the Pinedale Anticline compared to 426 gross wells at December 31, 2009. Of the 529 gross producing wells, QEP Energy has working interests in 508 wells and overriding royalty interests in an additional 21 wells. The Pinedale Anticline contributed 68.5 Bcfe or 30% of QEP Energy 2010 production and comprised 1,348.9 Bcfe or 44% of QEP Energy total proved reserves at December 31, 2010.
In 2005, the Wyoming Oil and Gas Conservation Commission (WOGCC) approved 10-acre-density drilling for Lance Pool wells on about 12,700 acres of QEP Energy’s 17,872-acre (gross) Pinedale leasehold. The area approved for increased density corresponds to the currently estimated productive limits of QEP Energy core acreage in the field. In January 2008, the WOGCC approved five-acre-density drilling for Lance Pool wells on about 4,200 gross acres of QEP Energy’s Pinedale leasehold. The true vertical depth to the top of the Lance Pool tight gas sand reservoir interval ranges from 8,500 to 9,500 feet across QEP Energy’s acreage. If five-acre-density development is appropriate for a majority of its leasehold, the Company currently estimates that up to 1,300 additional wells will be required to fully develop the Lance Pool on its acreage.
Uinta Basin
As of December 31, 2010, QEP Energy had a working interest in 2,098 gross producing wells in the Uinta Basin of eastern Utah, compared to 2,334 gross wells at December 31, 2009. At December 31, 2010, properties in the Uinta Basin contributed 21.4 Bcfe or 9% of 2010 production and comprised 212.8 Bcfe or 7% of QEP Energy total proved reserves at December 31, 2010. Uinta Basin proved reserves are found in a series of vertically stacked, laterally discontinuous reservoirs at depths of 5,000 feet to deeper than 18,000 feet. QEP Energy owns interests in approximately 290,000 net leasehold acres in the Uinta Basin.
Rockies Legacy
The remainder of QEP Energy Rocky Mountain region leasehold interests, productive wells and proved reserves are distributed over a number of fields and properties managed as the Company’s Rockies Legacy division. Most of the properties are located in the Greater Green River Basin of western Wyoming. In aggregate, Rockies Legacy properties contributed 18.7 Bcfe or 8% of 2010 production and comprised 298.5 Bcfe or 10% of QEP Energy total proved reserves at December 31, 2010. Exploration and development activity for 2011 includes wells in the Powder River, Greater Green River and Williston Basins.
QEP Energy has approximately 90,000 net acres of lease rights in the Williston Basin in western North Dakota where the company is targeting the Bakken and Three Forks formations. The true vertical depth to the top of the Bakken Formation ranges from approximately 9,500 feet to 10,000 feet across QEP Energy’s leasehold. The Three Forks Formation lies approximately 60 to 70 feet below the Middle Bakken Formation and is also a target for horizontal drilling. QEP Energy intends to drill or participate in 53 gross Bakken or Three Forks horizontal wells in 2011 compared to 29 gross wells in 2010. As of December 31, 2010, QEP Energy had two operated rigs drilling in the project area and had working interests in 55 gross producing Bakken or Three Forks wells in North Dakota compared to working interests in 26 gross wells at December 31, 2009.
37
Table of Contents
QEP FIELD SERVICES
QEP Field Services activities reported net income of $91.1 million in 2010 compared to $69.4 million in 2009, a 31% increase. QEP Field Services net income was $81.5 million in 2008. Net income increased in 2010 due to improved gathering margins driven by higher gathering volumes and higher processing margins. Net income decreased in 2009 compared to 2008 as the result of decreased processing margins and increased depreciation expense. Following is a summary of QEP Field Services’ financial and operating results:
| Year Ended December 31, | Change | |||||||||||||||||||
| 2010 | 2009 | 2008 | 2010 vs. 2009 | 2009 vs. 2008 | ||||||||||||||||
| (in millions) | ||||||||||||||||||||
| QEP Field Services Operating Income |
||||||||||||||||||||
| REVENUES |
||||||||||||||||||||
| NGL sales |
$ | 94.8 | $ | 71.9 | $ | 106.0 | $ | 22.9 | $ | (34.1 | ) | |||||||||
| Processing |
35.2 | 32.6 | 31.0 | 2.6 | 1.6 | |||||||||||||||
| Gathering |
152.5 | 127.3 | 121.0 | 25.2 | 6.3 | |||||||||||||||
| Other gathering |
36.7 | 32.8 | 32.2 | 3.9 | 0.6 | |||||||||||||||
| Total Revenues |
319.2 | 264.6 | 290.2 | 54.6 | (25.6 | ) | ||||||||||||||
| OPERATING EXPENSES |
||||||||||||||||||||
| Processing |
11.9 | 10.3 | 10.2 | 1.6 | 0.1 | |||||||||||||||
| Processing plant shrinkage |
32.6 | 28.1 | 48.7 | 4.5 | (20.6 | ) | ||||||||||||||
| Gathering |
37.6 | 36.6 | 36.1 | 1.0 | 0.5 | |||||||||||||||
| General and administrative |
31.6 | 25.0 | 23.7 | 6.6 | 1.3 | |||||||||||||||
| Property taxes |
4.4 | 4.6 | 2.6 | (0.2 | ) | 2.0 | ||||||||||||||
| Depreciation, depletion and amortization |
48.9 | 44.3 | 28.7 | 4.6 | 15.6 | |||||||||||||||
| Abandonment and impairments |
— | — | 0.8 | — | (0.8 | ) | ||||||||||||||
| Total Operating Expenses |
167.0 | 148.9 | 150.8 | 18.1 | (1.9 | ) | ||||||||||||||
| Net loss from asset sales |
(1.6 | ) | (0.1 | ) | — | (1.5 | ) | (0.1 | ) | |||||||||||
| Operating Income |
150.6 | 115.6 | 139.4 | 35.0 | (23.8 | ) | ||||||||||||||
| Interest and other income |
0.1 | (0.2 | ) | — | 0.3 | (0.2 | ) | |||||||||||||
| Income from unconsolidated affiliates |
2.8 | 2.6 | 1.2 | 0.2 | 1.4 | |||||||||||||||
| Interest expense |
(7.6 | ) | (6.0 | ) | (3.6 | ) | (1.6 | ) | (2.4 | ) | ||||||||||
| INCOME FROM CONTINUING OPERATIONS BEFORE INCOME TAXES |
145.9 | 112.0 | 137.0 | 33.9 | (25.0 | ) | ||||||||||||||
| Income taxes |
(51.9 | ) | (40.0 | ) | (46.5 | ) | (11.9 | ) | 6.5 | |||||||||||
| INCOME FROM CONTINUING OPERATIONS |
94.0 | 72.0 | 90.5 | 22.0 | (18.5 | ) | ||||||||||||||
| Net income attributable to noncontrolling interest |
(2.9 | ) | (2.6 | ) | (9.0 | ) | (0.3 | ) | 6.4 | |||||||||||
| NET INCOME ATTRIBUTABLE TO QEP FIELD SERVICES |
$ | 91.1 | $ | 69.4 | $ | 81.5 | $ | 21.7 | $ | (12.1 | ) | |||||||||
Depreciation expense increased $4.6 million during 2010 compared with 2009 due to the addition of new facilities. Approximately 78% of Field Services 2010 net operating revenue was derived from fee-based contracts, compared to 82% in 2009.
Gathering
The primary driver of increased gathering margin (gathering revenue minus gathering expense) in 2010 was the transfer of the northwest Louisiana gathering system assets from QEP Energy to QEP Field Services in January 2010. The transfer of the northwest Louisiana gathering system is also the driver for the increase in system throughput volume along with increased drilling activity within the Haynesville Shale. Gathering margins also increased at the Black Fork Hub reflecting growing Pinedale production volumes and declining operating expenses.
38
Table of Contents
Following is a summary of QEP Field Services’ gathering related financial and operating results:
| Year Ended December 31, |
Change | |||||||||||||||||||
| 2010 | 2009 | 2008 | 2010 vs. 2009 |
2009 vs. 2008 | ||||||||||||||||
| (in millions) | ||||||||||||||||||||
| Gathering Margin |
||||||||||||||||||||
| Gathering |
$ | 152.5 | $ | 127.3 | $ | 121.0 | $ | 25.2 | $ | 6.3 | ||||||||||
| Other gathering |
36.7 | 32.8 | 32.2 | 3.9 | 0.6 | |||||||||||||||
| Gathering (expense) |
(37.6 | ) | (36.6 | ) | (36.1 | ) | (1.0 | ) | (0.5 | ) | ||||||||||
| Gathering Margin |
$ | 151.6 | $ | 123.5 | $ | 117.1 | $ | 28.1 | $ | 6.4 | ||||||||||
| Operating Statistics |
||||||||||||||||||||
| Natural gas gathering volumes (in millions of MMBtu) |
||||||||||||||||||||
| For unaffiliated customers |
276.8 | 301.2 | 278.3 | (24.4 | ) | 22.9 | ||||||||||||||
| For affiliated customers |
198.9 | 112.6 | 114.2 | 86.3 | (1.6 | ) | ||||||||||||||
| Total Gas Gathering Volumes |
475.7 | 413.8 | 392.5 | 61.9 | 21.3 | |||||||||||||||
| Average gas gathering revenue (per MMBtu) |
$ | 0.32 | $ | 0.31 | $ | 0.31 | $ | 0.01 | $ | — | ||||||||||
Processing
Processing margin (processing revenue minus processing expenses and processing plant shrinkage) increased in 2010 compared with 2009 due to improved NGL prices and lower natural gas (shrink) costs. The increase in processing volumes in 2010 was driven by increased throughput at QEP Field Services’ Stagecoach plant in eastern Utah.
Following is a summary of QEP Field Services’ processing related financial and operating results:
| Year Ended December 31, |
Change | |||||||||||||||||||
| 2010 | 2009 | 2008 | 2010 vs. 2009 |
2009 vs. 2008 |
||||||||||||||||
| (in millions) | ||||||||||||||||||||
| Processing Margin |
||||||||||||||||||||
| NGL sales |
$ | 94.8 | $ | 71.9 | $ | 106.0 | $ | 22.9 | $ | (34.1 | ) | |||||||||
| Processing (fee based) |
35.2 | 32.6 | 31.0 | 2.6 | 1.6 | |||||||||||||||
| Processing (expense) |
(11.9 | ) | (10.3 | ) | (10.2 | ) | (1.6 | ) | (0.1 | ) | ||||||||||
| Processing plant shrinkage (expense) |
(32.6 | ) | (28.1 | ) | (48.7 | ) | (4.5 | ) | 20.6 | |||||||||||
| Processing Margin |
$ | 85.5 | $ | 66.1 | $ | 78.1 | $ | 19.4 | $ | (12.0 | ) | |||||||||
| Frac spread (NGL sales – Processing plant shrinkage) |
$ | 62.2 | $ | 43.8 | $ | 57.3 | $ | 18.4 | $ | (13.5 | ) | |||||||||
| Operating Statistics |
||||||||||||||||||||
| Natural gas processing volumes |
||||||||||||||||||||
| NGL sales (MMgal) |
100.2 | 101.6 | 89.5 | (1.4 | ) | 12.1 | ||||||||||||||
| Average NGL sales price (per gal) |
$ | 0.95 | $ | 0.71 | $ | 1.18 | $ | 0.24 | $ | (0.47 | ) | |||||||||
| Fee-based processing volumes (in millions of MMBtu) |
||||||||||||||||||||
| For unaffiliated customers |
116.8 | 110.6 | 97.0 | 6.2 | 13.6 | |||||||||||||||
| For affiliated customers |
109.4 | 99.4 | 104.5 | 10.0 | (5.1 | ) | ||||||||||||||
| Total Fee-Based Processing Volumes |
226.2 | 210.0 | 201.5 | 16.2 | 8.5 | |||||||||||||||
| Average fee-based processing revenue (per MMBtu) |
$ | 0.16 | $ | 0.15 | $ | 0.14 | $ | 0.01 | $ | 0.01 | ||||||||||
39
Table of Contents
QEP MARKETING
QEP Marketing net income was $6.7 million in 2010, a decrease of 21% compared to 2009 net income of $8.5 million. QEP Marketing net income was $22.1 million in 2008. The decreases in 2010 and 2009 were a result of lower marketing and storage margins due to an overall decrease in natural gas price volatility. Revenues from unaffiliated customers were $598.8 million in 2010 compared to $442.5 million in 2009, a 35% increase, the result of higher natural gas prices and increased sales volumes. The weighted-average natural gas sales price increased 20% in 2010 to $3.95 per MMBtu, compared to $3.29 per MMBtu in 2009. The gas sales volumes increased 7% in 2010 to 201.9 MMBtu compared to 189.3 MMBtu in 2009. Higher revenue was more than offset by increased cost of gas purchased from third-parties that was later resold.
CONSOLIDATED RESULTS BELOW OPERATING INCOME
Separation costs
QEP reported expenses of $13.5 million during 2010 related to the Spin-off of QEP Resources, Inc. from Questar Corporation on June 30, 2010. The expenses consisted primarily of QEP’s share of certain fees and expenses for financial, legal and tax advisory services and for severance expenses for terminated employees.
Loss on early extinguishment of debt
QEP reported $13.3 million in losses on early extinguishment of debt in 2010 related to the purchase of $638.0 million principal amount of senior notes and the termination of commitments under the $500.0 million term loan. The purchase of $638.0 million principal amount of senior notes in August 2010 was a result of QEP’s offer to purchase the notes related to the Spin-off pursuant to the change of control provisions in the senior notes’ indenture. As a result of the issuance of $625.0 million principal amount of senior notes in August 2010, all the outstanding debt under the term loan was repaid and commitments under the term loan were terminated.
Interest and Other Income
Interest and other income decreased $2.2 million in 2010 compared with 2009 due primarily to a valuation adjustment on pipe inventory. Interest and other income decreased $5.7 million in 2009 compared with 2008 due to less activity in sales of inventory.
Realized and unrealized gain (loss) on basis-only swaps
In the past, the Company has used basis-only swaps to manage the risk of widening basis differentials. Basis-only swaps do not qualify for hedge accounting. As of December 31, 2009, all of the Company’s basis-only swaps had been paired with NYMEX gas fixed-price swaps or price-collars and re-designated as cash flow hedges. Fair value changes occurring prior to re-designation were recorded in the Consolidated Statements of Income. Changes in the fair value of the derivative instruments subsequent to the re-designation were recorded in AOCI. Upon settlement, the portion of the settlement attributed to the period prior to re-designation is reported as an unrealized gain (loss) and offsets prior period’s impact on the Consolidated Statement of Income. The Company recognized unrealized gains of $121.7 million in 2010, and unrealized losses of $164.0 million in 2009 and $79.2 million in 2008. The Company realized losses of $121.7 million in 2010 and $25.6 million in 2009 on settlements of basis-only swaps, which were reported after operating income in the Consolidated Statements of Income.
Interest expense
Interest expense rose 20% in 2010 compared with 2009 and 14% in 2009 compared to 2008 due primarily to financing activities associated with the issuance of the new bonds in 2010, higher interest rates under QEP’s amended credit facility, and higher debt levels related to the purchase of natural gas development properties in northwest Louisiana in 2008.
40
Table of Contents
Income taxes
The Company’s effective combined federal and state income tax rate was 36.9% in 2010 compared with 35.3% in 2009 and 2008.
LIQUIDITY AND CAPITAL RESOURCES
QEP anticipates that its cash capital expenditures, which were $1,469.0 million in 2010, will be approximately $1,200.0 million in 2011. QEP expects to fund its 2011 capital expenditure budget primarily with cash flow from operations, supplemented with additional sources of liquidity, if needed, including bank financings, and proceeds from the issuance of long-term debt and/or equity securities. QEP’s ability to raise funds in the capital markets will be impacted by its financial condition, interest rates, market conditions, and industry conditions.
Operating Activities
Net cash provided by operating activities from continuing operations decreased 13% in 2010 compared to 2009. The decrease from 2009 compared to 2008 was 6%. Cash sources from operating assets and liabilities were lower in 2010 primarily due to reductions in accounts receivable during 2009 and a decrease in current federal income taxes payable due to bonus depreciation. Noncash adjustments to net income consisted primarily of depreciation, depletion and amortization, and deferred income taxes. Net cash provided by operating activities is presented below:
| Year Ended December 31, | Change | |||||||||||||||||||
| 2010 | 2009 | 2008 | 2010 vs. 2009 | 2009 vs. 2008 | ||||||||||||||||
| (in millions) | ||||||||||||||||||||
| Net income |
$ | 329.1 | $ | 296.1 | $ | 594.5 | $ | 33.0 | $ | (298.4 | ) | |||||||||
| Noncash adjustments to net income |
741.3 | 782.3 | 692.6 | (41.0 | ) | 89.7 | ||||||||||||||
| Changes in operating assets and liabilities |
(72.9 | ) | 71.0 | (62.4 | ) | (143.9 | ) | 133.4 | ||||||||||||
| Net cash provided from continuing operating activities |
$ | 997.5 | $ | 1,149.4 | $ | 1,224.7 | $ | (151.9 | ) | $ | (75.3 | ) | ||||||||
Investing Activities
A comparison of capital expenditures, including exploratory dry hole expense, from continuing operations in 2010 and 2009 and a forecast for 2011 are shown in the table below:
| Year Ended December 31, | ||||||||||||
| 2011 Forecast |
2010 | 2009 | ||||||||||
| (in millions) | ||||||||||||
| QEP Energy |
$ | 1,050.0 | $ | 1,205.0 | $ | 1,108.6 | ||||||
| QEP Field Services |
150.0 | 262.1 | 88.3 | |||||||||
| QEP Marketing and other |
— | 1.9 | 1.5 | |||||||||
| Total cash capital expenditures from continuing operations |
$ | 1,200.0 | 1,469.0 | 1,198.4 | ||||||||
| Changes in accruals |
16.9 | (90.0 | ) | |||||||||
| Total accrued capital expenditures from continuing operations |
$ | 1,485.9 | $ | 1,108.4 | ||||||||
Net cash used in investing activities on the Consolidated Statements of Cash Flows also includes proceeds from the disposition of assets of $25.6 million in 2010 and $14.2 million in 2009, as well as reductions in notes receivable of $52.9 million and $37.8 million in 2010 and 2009, respectively.
41
Table of Contents
QEP Energy
QEP Energy capital expenditures were higher in 2010 compared to 2009 due to an increased drilling program in 2010. The 2010 net drilling-success rate was 99.0%. There were 191 gross wells in progress at year-end.
QEP Field Services
QEP Field Services increased investment in its gathering, processing and treating facilities to expand capacity in western Wyoming, eastern Utah and northwest Louisiana.
Financing Activities
For 2010, net cash used in investing activities of $1,390.5 exceeded net cash provided by operating activities of $997.5 by $393.0 million. During 2010, the Company increased its drilling activities primarily to hold acreage by establishing production on expiring leases. In 2009, as a result of the economic downturn, the Company limited capital expenditures to approximate internally generated cash flow. In 2009, net cash provided by operating activities of $1,149.4 million exceeded net cash used in investing activities of $1,146.4 million by $3.0 million reflecting the strategy.
For 2010, long-term debt increased by a net change of $123.6 million while short-term debt increased by $19.2 million. In 2009, long-term debt increased by a net change of $47.0 million and short-term debt decreased by a net change of $50.1 million. At December 31, 2010, long-term debt consisted of $400.0 million outstanding under QEP’s revolving credit facility and $1,130.8 million in senior notes (including $6.1 million of net original issue discount), which includes $58.5 million of senior notes that mature in March 2011. All intercompany loans between Questar and QEP, which have been historically reported as notes payable in the Consolidated Balance Sheets, were repaid on June 30, 2010, in conjunction with the Spin-off. QEP’s consolidated capital structure consisted of 34% combined short- and long-term debt and 66% common shareholders’ equity at December 31, 2010 and 2009.
In June 2010, in conjunction with the Spin-off, QEP amended its existing revolving credit agreement. The amendment increased the amount of commitments from $800.0 million to $1.0 billion, increased commitment fees, increased the applicable margin used in calculating interest rates and added financial covenants that limit the amount of funded indebtedness the Company may incur, as well as modifying other immaterial provisions of the agreement. In addition, QEP entered into a $500.0 million, 364-day term loan agreement (term loan) with substantially the same initial pricing and terms as its revolving credit agreement.
In August 2010, the Company purchased $638.0 million principal amount of its senior notes and paid required premium and accrued interest pursuant to the requirement in the notes’ indenture relating to a change of control. The Company used cash on hand and proceeds from its $1.0 billion revolving credit facility and $500.0 million term loan to purchase all of the tendered notes. Subsequent to the purchase of the tendered notes, the Company issued $625.0 million principal amount of senior notes due 2021. The notes were issued at a discount, resulting in gross proceeds of $619.2 million which were used to pay fees and expenses associated with the issuance and to refinance a portion of the indebtedness incurred under the term loan and revolving credit facilities to purchase the tendered senior notes. Upon repayment of the term loan, commitments under the term loan were terminated. The Company’s senior notes outstanding as of December 31, 2010 totaled $1,137.0 million in principal and are comprised of five issues as follows:
| • | $58.5 million 7.50% Senior Notes due March 2011 |
| • | $176.8 million 6.05% Senior Notes due September 2016 |
| • | $138.6 million 6.80% Senior Notes due April 2018 |
| • | $138.0 million 6.80% Senior Notes due March 2020 |
| • | $625.0 million 6.875% Senior Notes due March 2021 |
42
Table of Contents
At February 18, 2011 QEP had $441.0 million outstanding under its revolving credit facility and $5.6 million of letters of credit issued. At December 31, 2010, accounting for the outstanding letters of credit, QEP had unused capacity of $594.4 million on its revolving-credit facility.
Contractual Cash Obligations and Other Commitments
In the course of ordinary business activities, QEP enters into a variety of contractual cash obligations and other commitments. The following table summarizes the significant contractual cash obligations as of December 31, 2010:
| Payments Due by Year | ||||||||||||||||||||||||||||
| Total | 2011 | 2012 | 2013 | 2014 | 2015 | After 2015 |
||||||||||||||||||||||
| (in millions) | ||||||||||||||||||||||||||||
| Long-term debt |
$ | 1,536.9 | $ | 58.5 | $ | — | $ | 400.0 | $ | — | $ | — | $ | 1,078.4 | ||||||||||||||
| Interest on fixed-rate long-term debt |
652.6 | 73.2 | 72.5 | 72.5 | 72.5 | 72.5 | 289.4 | |||||||||||||||||||||
| Drilling contracts |
58.1 | 54.0 | 4.1 | — | — | — | — | |||||||||||||||||||||
| Transportation contracts |
447.6 | 45.4 | 45.2 | 43.6 | 42.5 | 42.4 | 228.5 | |||||||||||||||||||||
| Operating leases |
15.1 | 5.0 | 4.5 | 3.4 | 1.0 | 1.1 | 0.1 | |||||||||||||||||||||
| Total |
$ | 2,710.3 | $ | 236.1 | $ | 126.3 | $ | 519.5 | $ | 116.0 | $ | 116.0 | $ | 1,596.4 | ||||||||||||||
Critical Accounting Policies, Estimates and Assumptions
QEP’s significant accounting policies are described in Note 1 to the consolidated financial statements included in Item 8 of Part II of its Annual Report. The Company’s consolidated financial statements are prepared in accordance with U.S. generally accepted accounting principles. The preparation of consolidated financial statements requires management to make assumptions and estimates that affect the reported results of operations and financial position. The following accounting policies may involve a higher degree of complexity and judgment on the part of management.
Gas and Oil Reserves
Gas and oil reserve estimates require significant judgments in the evaluation of all available geological, geophysical, engineering and economic data. The data for a given field may change substantially over time as a result of numerous factors including, but not limited to, additional development activity, production history, economic assumptions relating to commodity prices, operating expenses, severance and other taxes, capital expenditures and remediation costs. The subjective judgments and variances in data for various fields make these estimates less precise than other estimates included in the financial statement disclosures. See Note 16 to the consolidated financial statements included in Item 8 of this Report on Form 10-K for more information on the Company’s estimated proved reserves.
Successful Efforts Accounting for Gas and Oil Operations
The Company follows the successful efforts method of accounting for gas and oil property acquisitions, exploration, development and production activities. Under this method, the acquisition costs of proved and unproved properties, successful exploratory wells and development wells are capitalized. Other exploration costs, including geological and geophysical costs, the delay rental and administrative costs associated with unproved property and unsuccessful exploratory well costs are expensed. Costs to operate and maintain wells and field equipment are expensed as incurred.
The capitalized costs of unproved properties are generally combined and amortized over the expected holding period for such properties. Individually significant unproved properties are periodically reviewed for impairment. Capitalized costs of unproved properties are reclassified as proved property when related proved reserves are determined or charged against the impairment allowance when abandoned.
43
Table of Contents
Capitalized proved-property-acquisition costs are amortized by field using the unit-of-production method based on proved reserves. Capitalized exploratory well and development costs are amortized similarly by field based on proved developed reserves. The calculation takes into consideration estimated future equipment dismantlement, surface restoration and property abandonment costs, net of estimated equipment-salvage values. Other property and equipment are generally depreciated using the straight-line method over estimated useful lives or the unit-of-production method for certain processing plants. A gain or loss is generally recognized only when an entire field is sold or abandoned, or if the unit-of-production amortization rate would be significantly affected.
QEP Energy engages an independent reservoir engineering consultant to prepare estimates of the proved gas and oil reserves. Reserve estimates are based on a complex and highly interpretive process that is subject to continuous revision as additional production and development drilling information becomes available.
Long-lived assets are assessed for impairment whenever changes in facts and circumstances indicate a possible significant deterioration in the future cash flows expected to be generated on a field-by-field basis. Impairment is indicated when a triggering event occurs and the sum of estimated undiscounted future net cash flows of the evaluated asset is less than the asset’s carrying value. The asset value is written down to estimated fair value, which is determined using discounted future net cash flows.
Accounting for Derivative Contracts
The Company uses derivative contracts, typically fixed-price swaps and costless collars, to hedge against a decline in the realized prices of its natural gas and oil production. Accounting rules for derivatives require marking these instruments to fair value at the balance-sheet reporting date. The change in fair value is reported either in net income or AOCI depending on the structure of the derivative. The Company has historically structured the majority of its energy derivative instruments as cash flow hedges as defined in ASC 815 “Derivatives and Hedging.” Changes in the fair value of cash flow hedges are recorded on the balance sheet and in AOCI until the underlying gas or oil is produced. When a derivative is terminated before its contract expires, the associated gain or loss is recognized in income over the life of the previously hedged production. Changes in the fair value of derivative contracts that do not qualify for hedge accounting are included as part of operating income in the Consolidated Statement of Income.
Revenue Recognition
Revenues are recognized in the period that services are provided or products are delivered. QEP Energy uses the sales method of accounting whereby revenue is recognized for all gas, oil and NGL sold to purchasers. Revenues include estimates for the two most recent months using published commodity-price indexes and volumes supplied by field operators. A liability is recorded to the extent that QEP Energy has an imbalance in excess of its share of remaining reserves in an underlying property. QEP Marketing presents revenues on a gross revenue basis. QEP Marketing does not engage in speculative hedging transactions, nor does it buy and sell energy contracts with the objective of generating profits on short-term differences in prices.
Recent Accounting Developments
There have been no recent accounting pronouncements that were adopted in 2010 or are under consideration that would have a material impact on QEP’s results of operations or financial condition.
44
Table of Contents
ITEM 7A. QUANTITATIVE AND QUALITATIVE DISCLOSURES ABOUT MARKET RISK
QEP’s primary market-risk exposure arises from changes in the market price for natural gas, oil and NGL, and volatility in interest rates. QEP Energy and QEP Marketing have long-term contracts for pipeline capacity and are obligated to pay for transportation services with no guarantee that they will be able to fully utilize the contractual capacity of these transportation commitments.
Commodity Price Risk Management
QEP’s subsidiaries use commodity-price derivative instruments in the normal course of business to reduce the risk of adverse commodity price movements. However, these same arrangements typically limit future gains from favorable price movements.
As of December 31, 2010, QEP held commodity-price derivative contracts for 247.5 million MMBtu of natural gas and 1.1 million barrels of oil. As of December 31, 2009, QEP held derivative contracts for 409.6 million MMBtu of natural gas and 2.7 million barrels of oil. A table reconciling the net fair value of the Company’s derivative positions for equity production as of December 31, 2010, is shown below:
| Cash flow Hedges |
Basis-only Swaps |
Total | ||||||||||
| (in millions) | ||||||||||||
| Net fair value of gas- and oil-derivative contracts outstanding at Dec. 31, 2009 |
$ | 138.5 | $ | (239.4 | ) | $ | (100.9 | ) | ||||
| Contracts realized or otherwise settled |
(348.2 | ) | 121.7 | (226.5 | ) | |||||||
| Change in gas and oil prices on futures markets |
564.4 | — | 564.4 | |||||||||
| Contracts added |
1.5 | — | 1.5 | |||||||||
| Net Fair Value Of Gas- and Oil-Derivative Contracts Outstanding at Dec. 31, 2010 |
$ | 356.2 | $ | (117.7 | ) | $ | 238.5 | |||||
A table of the net fair value of gas- and oil-derivative contracts that are scheduled to settle over the next three years as of December 31, 2010, is shown below. Derivatives representing about 50% of the net fair value will settle in the next 12 months and will be reclassified from AOCI:
| Cash flow Hedges |
Basis-only Swaps |
Total | ||||||||||
| (in millions) | ||||||||||||
| Contracts maturing by Dec. 31, 2011 |
$ | 235.7 | $ | (117.7 | ) | $ | 118.0 | |||||
| Contracts maturing between Jan. 1, 2012 and Dec. 31, 2012 |
59.6 | — | 59.6 | |||||||||
| Contracts maturing between Jan. 1, 2013 and Dec. 31, 2013 |
60.9 | — | 60.9 | |||||||||
| Net Fair Value Of Gas- and Oil-Derivative Contracts Outstanding at Dec. 31, 2010 |
$ | 356.2 | $ | (117.7 | ) | $ | 238.5 | |||||
The following table shows the sensitivity of the net fair value of gas- and oil-derivative contracts to changes in the market price of gas and oil and basis differentials:
| At December 31, | ||||||||
| 2010 | 2009 | |||||||
| (in millions) | ||||||||
| Net fair value – asset (liability) |
$ | 238.5 | $ | (100.9 | ) | |||
| Value if market prices of gas and oil and basis differentials decline by 10% |
356.2 | 174.2 | ||||||
| Value if market prices of gas and oil and basis differentials increase by 10% |
132.1 | (375.8 | ) | |||||
45
Table of Contents
Credit Risk
QEP requests credit support and, in some cases, financial guarantees, letters of credit or prepayment from companies that pose unfavorable credit risks. The Company’s five largest customers are Sempra Energy Trading Corp., Chevron USA Inc., Enterprise Products Operating, Macquarie Energy LLC. and BP Energy Company. Sales to these companies accounted for 27% of QEP revenues before elimination of intercompany transactions in 2010, and their accounts were current at December 31, 2010.
Interest-Rate Risk
The Company’s ability to borrow and the rates quoted by lenders can be adversely affected by the illiquid credit markets as described in Item 1A. Risk Factors of Part I of this Annual Report on Form 10-K. The Company’s credit facility has floating interest rates and as such, exposes QEP to interest rate risk. If interest rates were to increase 10% over their average 2010 and 2009 levels and at our average level of borrowing for those years, our annualized interest expense would increase by $0.5 million and $0.3 million, respectively, or less than 1% in either year.
46
Table of Contents
ITEM 8. FINANCIAL STATEMENTS AND SUPPLEMENTARY DATA
Financial Statements:
All other schedules are omitted because they are not applicable or the required information is shown in the consolidated financial statements or Notes thereto.
47
Table of Contents
Report of Independent Registered Public Accounting Firm
The Board of Directors and Shareholders of
QEP Resources, Inc.
We have audited the accompanying consolidated balance sheets of QEP Resources, Inc. as of December 31, 2010 and 2009, and the related consolidated statements of income, shareholders’ equity, and cash flows for each of the three years in the period ended December 31, 2010. Our audits also included the financial statement schedule listed in the Index at Item 8. These financial statements and schedule are the responsibility of the Company’s management. Our responsibility is to express an opinion on these financial statements and schedule based on our audits.
We conducted our audits in accordance with the standards of the Public Company Accounting Oversight Board (United States). Those standards require that we plan and perform the audit to obtain reasonable assurance about whether the financial statements are free of material misstatement. An audit includes examining, on a test basis, evidence supporting the amounts and disclosures in the financial statements. An audit also includes assessing the accounting principles used and significant estimates made by management, as well as evaluating the overall financial statement presentation. We believe that our audits provide a reasonable basis for our opinion.
In our opinion, the financial statements referred to above present fairly, in all material respects, the consolidated financial position of QEP Resources, Inc. at December 31, 2010 and 2009, and the consolidated results of its operations and its cash flows for each of the three years in the period ended December 31, 2010, in conformity with U.S. generally accepted accounting principles. Also, in our opinion, the related financial statement schedule, when considered in relation to the basic financial statements taken as a whole, presents fairly in all material respects the information set forth therein.
As discussed in Note 1 to the consolidated financial statements, during 2009, the Company adopted a new accounting standard relating to the presentation of noncontrolling interests in consolidated subsidiaries and the Company adopted new oil and gas reserve estimation and disclosure requirements.
We also have audited, in accordance with the standards of the Public Company Accounting Oversight Board (United States), QEP Resources Inc.’s internal control over financial reporting as of December 31, 2010, based on criteria established in Internal Control-Integrated Framework issued by the Committee of Sponsoring Organizations of the Treadway Commission and our report dated February 25, 2011, expressed an unqualified opinion thereon.
Ernst & Young LLP
Denver, Colorado
February 25, 2011
48
Table of Contents
CONSOLIDATED STATEMENTS OF INCOME
| Year Ended December 31, | ||||||||||||
| 2010 | 2009 | 2008 | ||||||||||
| (in millions, except per-share amounts) | ||||||||||||
| REVENUES |
||||||||||||
| Natural gas sales |
$ | 1,086.9 | $ | 1,103.9 | $ | 1,147.7 | ||||||
| Oil and NGL sales |
238.9 | 158.5 | 237.5 | |||||||||
| Gathering, processing and other |
322.6 | 268.3 | 297.0 | |||||||||
| Marketing sales |
598.0 | 441.8 | 636.6 | |||||||||
| Total Revenues |
2,246.4 | 1,972.5 | 2,318.8 | |||||||||
| OPERATING EXPENSES |
||||||||||||
| Marketing purchases |
589.3 | 427.8 | 604.6 | |||||||||
| Lease operating expenses |
125.0 | 125.5 | 124.0 | |||||||||
| Gathering, processing and other |
83.2 | 76.2 | 96.2 | |||||||||
| General and administrative |
107.2 | 91.7 | 78.1 | |||||||||
| Separation costs |
13.5 | — | — | |||||||||
| Production and property taxes |
82.5 | 62.9 | 106.9 | |||||||||
| Depreciation, depletion and amortization |
643.4 | 559.1 | 361.5 | |||||||||
| Exploration expenses |
23.0 | 25.0 | 29.3 | |||||||||
| Abandonment and impairment |
46.1 | 20.3 | 45.4 | |||||||||
| Total Operating Expenses |
1,713.2 | 1,388.5 | 1,446.0 | |||||||||
| Net gain from asset sales |
12.1 | 1.5 | 60.4 | |||||||||
| OPERATING INCOME |
545.3 | 585.5 | 933.2 | |||||||||
| Interest and other income |
2.3 | 4.5 | 10.2 | |||||||||
| Income from unconsolidated affiliates |
3.0 | 2.7 | 1.7 | |||||||||
| Unrealized and realized (loss) on basis-only swaps |
— | (189.6 | ) | (79.2 | ) | |||||||
| Loss from early extinguishment of debt |
(13.3 | ) | — | — | ||||||||
| Interest expense |
(84.4 | ) | (70.1 | ) | (61.7 | ) | ||||||
| INCOME FROM CONTINUING OPERATIONS BEFORE INCOME TAXES |
452.9 | 333.0 | 804.2 | |||||||||
| Income taxes |
(167.0 | ) | (117.6 | ) | (283.6 | ) | ||||||
| INCOME FROM CONTINUING OPERATIONS |
285.9 | 215.4 | 520.6 | |||||||||
| Discontinued operations, net of income tax |
43.2 | 80.7 | 73.9 | |||||||||
| NET INCOME |
329.1 | 296.1 | 594.5 | |||||||||
| Net income attributable to noncontrolling interest |
(2.9 | ) | (2.6 | ) | (9.0 | ) | ||||||
| NET INCOME ATTRIBUTABLE TO QEP |
$ | 326.2 | $ | 293.5 | $ | 585.5 | ||||||
| Earnings Per Common Share Attributable To QEP |
||||||||||||
| Basic from continuing operations |
$ | 1.61 | $ | 1.23 | $ | 2.96 | ||||||
| Basic from discontinued operations |
0.25 | 0.46 | 0.43 | |||||||||
| Basic total |
$ | 1.86 | $ | 1.69 | $ | 3.39 | ||||||
| Diluted from continuing operations |
$ | 1.60 | $ | 1.21 | $ | 2.90 | ||||||
| Diluted from discontinued operations |
0.24 | 0.46 | 0.42 | |||||||||
| Diluted total |
$ | 1.84 | $ | 1.67 | $ | 3.32 | ||||||
| Weighted-average common shares outstanding |
||||||||||||
| Used in basic calculation |
175.3 | 174.1 | 172.8 | |||||||||
| Used in diluted calculation |
177.3 | 176.3 | 176.1 | |||||||||
See notes accompanying the consolidated financial statements
49
Table of Contents
CONSOLIDATED BALANCE SHEETS
| December 31, | ||||||||
| 2010 | 2009 | |||||||
| (in millions) | ||||||||
| ASSETS |
||||||||
| Current Assets |
||||||||
| Cash and cash equivalents |
$ | — | $ | 19.3 | ||||
| Notes receivable from Questar |
— | 52.9 | ||||||
| Accounts receivable, net |
269.9 | 219.8 | ||||||
| Fair value of derivative contracts |
257.3 | 128.2 | ||||||
| Inventories, at lower of average cost or market |
||||||||
| Gas and oil storage |
16.4 | 17.5 | ||||||
| Materials and supplies |
65.4 | 74.3 | ||||||
| Prepaid expenses and other |
45.2 | 29.2 | ||||||
| Deferred income taxes – current |
— | 21.2 | ||||||
| Current assets of discontinued operations |
— | 42.8 | ||||||
| Total Current Assets |
654.2 | 605.2 | ||||||
| Property, Plant and Equipment – successful efforts method of accounting for gas and oil properties |
||||||||
| Proved properties |
6,874.3 | 5,721.5 | ||||||
| Unproved properties, not being depleted |
322.0 | 389.6 | ||||||
| Midstream field services |
1,360.5 | 1,037.5 | ||||||
| Marketing and other |
44.5 | 42.4 | ||||||
| Total Property, Plant and Equipment |
8,601.3 | 7,191.0 | ||||||
| Less accumulated depreciation, depletion and amortization |
||||||||
| Exploration and production |
2,454.4 | 1,890.9 | ||||||
| Midstream field services |
244.6 | 198.7 | ||||||
| Marketing and other |
12.3 | 10.1 | ||||||
| Total Accumulated Depreciation, Depletion and Amortization |
2,711.3 | 2,099.7 | ||||||
| Net property, plant and equipment of discontinued operations |
— | 593.9 | ||||||
| Net Property, Plant and Equipment |
5,890.0 | 5,685.2 | ||||||
| Investment in unconsolidated affiliates |
44.5 | 43.9 | ||||||
| Other Assets |
||||||||
| Goodwill |
59.6 | 60.1 | ||||||
| Fair value of derivative contracts |
120.8 | 61.2 | ||||||
| Other noncurrent assets |
16.2 | 10.0 | ||||||
| Noncurrent assets of discontinued operations |
— | 15.8 | ||||||
| Total Other Assets |
196.6 | 147.1 | ||||||
| TOTAL ASSETS |
$ | 6,785.3 | $ | 6,481.4 | ||||
50
Table of Contents
LIABILITIES AND EQUITY
| December 31, | ||||||||
| 2010 | 2009 | |||||||
| (in millions) | ||||||||
| Current Liabilities |
||||||||
| Checks outstanding in excess of cash balances |
$ | 19.5 | $ | — | ||||
| Notes payable to Questar |
— | 39.3 | ||||||
| Account payable and accrued expenses |
332.2 | 313.0 | ||||||
| Federal income taxes payable |
— | 13.5 | ||||||
| Production and property taxes |
18.9 | 34.2 | ||||||
| Interest payable |
28.1 | 26.3 | ||||||
| Fair value of derivative contracts |
139.3 | 149.7 | ||||||
| Deferred income taxes – current |
27.8 | — | ||||||
| Current portion long-term debt |
58.5 | — | ||||||
| Current liabilities of discontinued operations |
— | 88.9 | ||||||
| Total Current Liabilities |
624.3 | 664.9 | ||||||
| Long-term debt |
1,472.3 | 1,348.7 | ||||||
| Deferred income taxes |
1,377.7 | 1,175.8 | ||||||
| Asset retirement obligations |
148.3 | 124.7 | ||||||
| Fair value of derivative contracts |
0.3 | 140.6 | ||||||
| Other long-term liabilities |
99.3 | 42.5 | ||||||
| Noncurrent liabilities of discontinued operations |
— | 175.5 | ||||||
| Commitments and contingencies – Note 11 |
||||||||
| EQUITY |
||||||||
| Common stock – par value $0.01 per share; |
||||||||
| 500.0 million shares authorized; 175.9 million and 174.6 million shares issued and outstanding at December 31, 2010 and 2009, respectively. |
1.8 | 1.7 | ||||||
| Additional paid-in capital |
394.2 | 126.8 | ||||||
| Retained earnings |
2,420.0 | 2,538.2 | ||||||
| Accumulated other comprehensive income |
194.3 | 87.1 | ||||||
| Total Common Shareholders’ Equity |
3,010.3 | 2,753.8 | ||||||
| Noncontrolling interest |
52.8 | 54.9 | ||||||
| Total Equity |
3,063.1 | 2,808.7 | ||||||
| TOTAL LIABILITIES AND EQUITY |
$ | 6,785.3 | $ | 6,481.4 | ||||
See notes accompanying the consolidated financial statements
51
Table of Contents
CONSOLIDATED STATEMENTS OF EQUITY
| Common Stock |
Additional Paid-in Capital |
Retained Earnings |
Accum. Other Comprehensive Income (Loss) |
Non- controlling Interest |
Comprehensive Income (Loss) |
|||||||||||||||||||
| (in millions) | ||||||||||||||||||||||||
| Balances at January 1, 2008 |
$ | 1.7 | $ | 133.5 | $ | 1,693.9 | $ | 31.0 | $ | — | $ | — | ||||||||||||
| 2008 net income |
— | — | 585.5 | — | 9.0 | 594.5 | ||||||||||||||||||
| Dividends paid |
— | — | (17.3 | ) | — | — | — | |||||||||||||||||
| Share-based compensation |
— | 11.0 | — | — | — | — | ||||||||||||||||||
| Consolidation of noncontrolling interest |
— | — | — | — | 29.8 | — | ||||||||||||||||||
| Distribution of noncontrolling interest |
— | — | — | — | (9.3 | ) | — | |||||||||||||||||
| Other comprehensive income |
— | — | — | — | — | — | ||||||||||||||||||
| Change in unrealized fair value of derivatives |
— | — | — | 494.0 | — | 494.0 | ||||||||||||||||||
| Income taxes |
— | — | — | (183.4 | ) | — | (183.4 | ) | ||||||||||||||||
| Total comprehensive income |
— | — | — | — | — | $ | 905.1 | |||||||||||||||||
| Balances at December 31, 2008 |
1.7 | 144.5 | 2,262.1 | 341.6 | 29.5 | |||||||||||||||||||
| 2009 net income |
— | — | 293.5 | — | 2.6 | $ | 296.1 | |||||||||||||||||
| Dividends paid |
— | — | (17.4 | ) | — | — | — | |||||||||||||||||
| Share-based compensation |
— | 13.9 | — | — | — | — | ||||||||||||||||||
| Consolidation of noncontrolling interest |
— | (28.5 | ) | — | — | 28.5 | — | |||||||||||||||||
| Tax on equity adjustment |
— | (3.1 | ) | — | — | — | — | |||||||||||||||||
| Distribution of noncontrolling interest |
— | — | — | — | (5.7 | ) | — | |||||||||||||||||
| Other comprehensive income |
— | — | — | — | — | — | ||||||||||||||||||
| Change in unrealized fair value of derivatives |
— | — | — | (405.1 | ) | — | (405.1 | ) | ||||||||||||||||
| Income taxes |
— | — | — | 150.6 | — | 150.6 | ||||||||||||||||||
| Total comprehensive income |
— | — | — | — | — | $ | 41.6 | |||||||||||||||||
| Balances at December 31, 2009 |
1.7 | 126.8 | 2,538.2 | 87.1 | 54.9 | |||||||||||||||||||
| 2010 net income |
— | — | 326.2 | — | 2.9 | $ | 329.1 | |||||||||||||||||
| Dividends paid |
— | — | (15.9 | ) | — | — | — | |||||||||||||||||
| Share-based compensation |
0.1 | 19.4 | — | — | — | — | ||||||||||||||||||
| Equity from Questar |
— | 250.0 | — | — | — | — | ||||||||||||||||||
| Transfer Wexpro to Questar |
— | (2.0 | ) | (428.5 | ) | — | — | — | ||||||||||||||||
| Distribution of noncontrolling interest |
— | — | — | — | (5.0 | ) | — | |||||||||||||||||
| Other comprehensive income |
— | — | — | — | — | — | ||||||||||||||||||
| Change in unrealized fair value of derivatives |
— | — | — | 217.7 | — | 217.7 | ||||||||||||||||||
| Change in pension and postretirement liability |
— | — | — | (47.8 | ) | — | (47.8 | ) | ||||||||||||||||
| Income taxes |
— | — | — | (62.7 | ) | — | (62.7 | ) | ||||||||||||||||
| Total comprehensive income |
— | — | — | — | — | $ | 436.3 | |||||||||||||||||
| Balances at December 31, 2010 |
$ | 1.8 | $ | 394.2 | $ | 2,420.0 | $ | 194.3 | $ | 52.8 | ||||||||||||||
See notes accompanying the consolidated financial statements
52
Table of Contents
CONSOLIDATED STATEMENTS OF CASH FLOWS
| Year Ended December 31, | ||||||||||||
| 2010 | 2009 | 2008 | ||||||||||
| (in millions) | ||||||||||||
| OPERATING ACTIVITIES |
||||||||||||
| Net income |
$ | 329.1 | $ | 296.1 | $ | 594.5 | ||||||
| Discontinued operations, net of income tax |
(43.2 | ) | (80.7 | ) | (73.9 | ) | ||||||
| Adjustments to reconcile net income to net cash provided by operating activities: |
||||||||||||
| Depreciation, depletion and amortization |
645.8 | 560.3 | 362.5 | |||||||||
| Deferred income taxes |
188.2 | 103.3 | 319.8 | |||||||||
| Abandonment and impairment |
46.1 | 20.3 | 45.4 | |||||||||
| Share-based compensation |
16.1 | 13.4 | 10.5 | |||||||||
| Exploration expense |
9.6 | 4.7 | 9.7 | |||||||||
| Net (gain) from asset sales |
(12.1 | ) | (1.5 | ) | (60.4 | ) | ||||||
| (Income) from unconsolidated affiliates |
(3.0 | ) | (2.7 | ) | (1.7 | ) | ||||||
| Distributions from unconsolidated affiliates and other |
2.2 | 1.2 | 1.5 | |||||||||
| Loss on early extinguishment of debt |
13.3 | — | — | |||||||||
| Unrealized (gain) loss on basis-only swaps |
(121.7 | ) | 164.0 | 79.2 | ||||||||
| Changes in operating assets and liabilities |
||||||||||||
| Accounts receivable |
(32.6 | ) | 42.6 | (16.4 | ) | |||||||
| Inventories |
10.1 | 13.7 | (52.5 | ) | ||||||||
| Prepaid expenses |
(16.2 | ) | (3.1 | ) | (9.4 | ) | ||||||
| Accounts payable and accrued expenses |
4.2 | 9.9 | 13.8 | |||||||||
| Federal income taxes |
(30.9 | ) | 21.2 | (7.6 | ) | |||||||
| Other |
(7.5 | ) | (13.3 | ) | 9.7 | |||||||
| Net Cash Provided By Operations From Continuing Operations |
997.5 | 1,149.4 | 1,224.7 | |||||||||
| INVESTING ACTIVITIES |
||||||||||||
| Property, plant and equipment additions including dry exploratory well expense |
(1,359.7 | ) | (975.4 | ) | (1,345.2 | ) | ||||||
| Acquisitions of proven and unproven reserves |
(109.3 | ) | (221.5 | ) | (770.0 | ) | ||||||
| Other investments |
— | (1.5 | ) | (21.5 | ) | |||||||
| Total capital expenditures |
(1,469.0 | ) | (1,198.4 | ) | (2,136.7 | ) | ||||||
| Proceeds from disposition of assets |
25.6 | 14.2 | 103.2 | |||||||||
| Change in note receivable |
52.9 | 37.8 | 12.5 | |||||||||
| Net Cash Used In Investing Activities From Continuing Operations |
(1,390.5 | ) | (1,146.4 | ) | (2,021.0 | ) | ||||||
| FINANCING ACTIVITIES |
||||||||||||
| Checks outstanding in excess of cash balances |
19.5 | — | — | |||||||||
| Change in notes payable |
(39.3 | ) | (50.1 | ) | 31.8 | |||||||
| Long-term debt issued, net of issuance costs |
1,034.4 | 424.5 | 1,395.2 | |||||||||
| Long-term debt issuance costs paid |
(16.6 | ) | (2.5 | ) | — | |||||||
| Current portion Long-term debt repaid |
(91.5 | ) | — | — | ||||||||
| Long-term debt repaid |
(761.5 | ) | (375.0 | ) | (600.0 | ) | ||||||
| Long-term debt extinguishment costs |
(4.9 | ) | — | — | ||||||||
| Equity contribution |
250.0 | — | — | |||||||||
| Other capital contributions |
2.8 | — | — | |||||||||
| Dividends paid |
(7.0 | ) | — | — | ||||||||
| Distribution to Questar |
(7.2 | ) | — | — | ||||||||
| Distribution to noncontrolling interest |
(5.0 | ) | (5.7 | ) | (9.3 | ) | ||||||
| Other |
— | — | 1.0 | |||||||||
| Net Cash Provided By (Used In) Financing Activities From Continuing Operations |
373.7 | (8.8 | ) | 818.7 | ||||||||
| CASH (USED IN) PROVIDED BY CONTINUING OPERATIONS |
(19.3 | ) | (5.8 | ) | 22.4 | |||||||
| Cash provided by operations from discontinued operations |
68.6 | 174.4 | 129.4 | |||||||||
| Cash used in investing activities from discontinued operations |
(39.9 | ) | (116.2 | ) | (143.6 | ) | ||||||
| Cash provided by financing activities from discontinued operations |
(26.9 | ) | (53.4 | ) | 12.1 | |||||||
| Effect of change in cash and cash equivalents of discontinued operations |
(1.8 | ) | (4.8 | ) | 2.1 | |||||||
| Change in cash and cash equivalents |
(19.3 | ) | (5.8 | ) | 22.4 | |||||||
| Beginning cash and cash equivalents |
19.3 | 25.1 | 2.7 | |||||||||
| Ending cash and cash equivalents |
$ | — | $ | 19.3 | $ | 25.1 | ||||||
| Supplemental Disclosure of Cash Paid (Received) During the Year for: |
||||||||||||
| Interest |
$ | 83.3 | $ | 62.2 | $ | 55.3 | ||||||
| Income taxes |
14.0 | (10.0 | ) | (21.9 | ) | |||||||
See notes accompanying the consolidated financial statements
53
Table of Contents
QEP RESOURCES, INC.
NOTES ACCOMPANYING THE CONSOLIDATED FINANCIAL STATEMENTS
Note 1 – Summary of Significant Accounting Policies
Nature of Business
QEP Resources, Inc. (QEP or the Company) is a leading independent natural gas and oil exploration and production company. QEP is a holding company with three major lines of business – gas and oil exploration and production, midstream field services, and energy marketing – which are conducted through its three principal subsidiaries:
| • | QEP Energy Company, (QEP Energy) acquires, explores for, develops and produces natural gas, oil, and NGL; |
| • | QEP Field Services Company (QEP Field Services) provides midstream field services including natural gas gathering and processing, compressing and treating services for affiliates and third parties; and |
| • | QEP Marketing Company (QEP Marketing) markets equity and third-party gas and oil, provides risk-management services, and owns and operates an underground gas-storage reservoir. |
Operations are focused in the Rocky Mountain and Midcontinent regions of the United States. Headquarters are in Denver, Colorado. Shares of QEP common stock trade on the New York Stock Exchange (NYSE:QEP).
Accounting Standards References
In July 2009, the Financial Accounting Standards Board (FASB) completed a revision of non-governmental U.S. generally accepted accounting principles (GAAP) into a single authoritative source and issued a codification of accounting rules and references. Authoritative standards included in the codification are designated by their Accounting Standards Codification (ASC) topical reference, and revised standards are designated as Accounting Standards Updates (ASU), with a year and assigned sequence number. The codification effort, while not creating or changing accounting rules, changed how users would cite accounting regulations. Citations in financial statements must identify the sections within the new codification. The codification is effective for interim and annual periods ending after September 15, 2009. The Company is complying with the new codification standards.
Principles of Consolidation
The consolidated financial statements contain the accounts of QEP and its majority-owned or controlled subsidiaries. The consolidated financial statements were prepared in accordance with GAAP and with the instructions for annual reports on Form 10-K and Regulations S-X and S-K. All significant intercompany accounts and transactions have been eliminated in consolidation.
On January 1, 2009, QEP adopted “Noncontrolling Interests in Consolidated Financial Statements” (ASC 810-10-65-1) for the accounting, reporting and disclosure of noncontrolling interests. The new guidance requires that noncontrolling interest, previously known as minority interest, be clearly identified, labeled, and presented in the consolidated financial statements separate from the parent’s equity; the amount of consolidated net income attributable to the parent and to the noncontrolling interest be clearly identified and presented in the consolidated income statement; changes in a parent’s ownership interest while the parent retains its controlling financial interest in its subsidiary be accounted for consistently; and any retained noncontrolling equity investment in a former subsidiary be initially measured at fair value. The new provisions are applied prospectively from the date of adoption, except for the presentation and disclosure requirements, which are applied retrospectively for all periods presented.
54
Table of Contents
Effective May 18, 2010, Questar Market Resources, Inc., (Market Resources) then a wholly-owned subsidiary of Questar Corporation (Questar), merged with and into a newly-formed, wholly-owned subsidiary, QEP Resources, Inc., a Delaware corporation in order to reincorporate in the State of Delaware (Reincorporation Merger). The Reincorporation Merger was effected pursuant to an Agreement and Plan of Merger entered into between Market Resources and QEP. The Reincorporation Merger was approved by the boards of directors of Market Resources and QEP and submitted to a vote of, and approved by, the Board of Directors of Questar, as sole shareholder of Market Resources, and by Market Resources, as sole shareholder of QEP on May 18, 2010.
On June 30, 2010, Questar distributed all of the shares of common stock of QEP held by Questar to Questar shareholders in a tax-free, pro rata dividend. Each Questar shareholder received one share of QEP common stock for each one share of Questar common stock held (including fractional shares) at the close of business on the record date. In connection therewith, QEP distributed Wexpro, a wholly-owned subsidiary of QEP at the time, to Questar. In addition, Questar contributed $250.0 million of equity to QEP prior to the Spin-off.
The financial information presented in this Annual Report on Form 10-K presents QEP’s financial results as an independent company separate from Questar and reflects Wexpro financial condition and operating results as discontinued operations for all periods presented. A summary of discontinued operations can be found in Note 3.
SEC’s Modernization of Oil and Gas Reporting Requirements
In December 2008, the SEC issued Release No. 33-8995, “Modernization of Oil and Gas Reporting,” which amended the oil and gas disclosures for oil and gas producers contained in Regulations S-K and S-X. The goal of Release No. 33-8995 was to provide investors with a more meaningful and comprehensive understanding of oil and gas reserves. The most significant amendments affecting the Company include the following: (i) economic producibility of reserves and discounted cash flows are to be based on the arithmetic average of the price on the first day of each month within the 12-month period prior to the end of the reporting period, unless contractual arrangements designate the price to be used; and (ii) reserves may be estimated and categorized through the use of reliable technologies. Release No. 33-8995 is effective for financial statements for fiscal years ending on or after December 31, 2009.
Investment in Unconsolidated Affiliates
QEP uses the equity method to account for investment in unconsolidated affiliates where it does not have control, but has significant influence. Generally, the investment in unconsolidated affiliates on the Company’s consolidated balance sheets equals the Company’s proportionate share of equity reported by the unconsolidated affiliates. Investment is assessed for possible impairment when events indicate that the fair value of the investment may be below the Company’s carrying value. When such a condition is deemed to be other than temporary, the carrying value of the investment is written down to its fair value, and the amount of the write-down is included in the determination of net income.
The principal unconsolidated affiliates and QEP’s ownership percentage as of December 31, 2010, were Uintah Basin Field Services, LLC, (38%) and Three Rivers Gathering, LLC, (50%), both limited liability companies engaged in gathering and compressing natural gas.
Use of Estimates
The preparation of consolidated financial statements and notes in conformity with GAAP requires that management formulate estimates and assumptions that affect the reported amounts of assets, liabilities, revenues and expenses and the disclosure of contingent assets and liabilities. The Company also incorporates estimates of proved developed and proved gas and oil reserves in the calculation of depreciation, depletion and amortization rates of its gas and oil properties. Changes in estimated quantities of its reserves could impact the Company’s reported financial results as well as disclosures regarding the quantities and value of proved gas and oil reserves. Actual results could differ from these estimates.
55
Table of Contents
Revenue Recognition
QEP subsidiaries recognize revenues in the period that services are provided or products are delivered. Revenues reflect the impact of price-hedging instruments. Revenues associated with the sale of natural gas and oil are accounted for using the sales method, whereby revenue is recognized as gas and oil is sold to purchasers. A liability is recorded to the extent that the Company has sold volumes in excess of its share of remaining gas and oil reserves in an underlying property. QEP’s imbalance obligations at December 31, were $4.4 million in 2010 and $4.2 million in 2009.
QEP Marketing reports revenues on a gross basis because, in the judgment of management, the nature and circumstances of its marketing transactions are consistent with guidance for gross revenue reporting. QEP Marketing markets equity and third-party natural gas, oil and NGL volumes. QEP Marketing uses derivatives to secure a known price for a specific volume over a specific time period. QEP Marketing does not engage in speculative hedging transactions, nor does it buy and sell energy contracts with the objective of generating profits on short-term differences in price. QEP Marketing has not engaged in buy/sell arrangements, as described in ASC 845-10-25-4 “Accounting for Purchases and Sales of Inventory with the Same Counterparty.”
Regulation of Underground Storage
QEP through Clear Creek Storage Company, LLC, operates an underground gas-storage facility under the jurisdiction of the Federal Energy Regulatory Commission (FERC). The FERC establishes rates for the storage of natural gas. The FERC also regulates, among other things, the extension and enlargement or abandonment of jurisdictional natural gas facilities. Regulation is intended to permit the recovery, through rates, of the cost of service, including a return on investment.
Cash and Cash Equivalents
Cash equivalents consist principally of repurchase agreements with maturities of three months or less. In almost all cases, the repurchase agreements are highly liquid investments in overnight securities made through commercial-bank accounts that result in available funds the next business day.
Notes Receivable from or Payable to Questar Corporation
Prior to the Spin-off, Questar centrally managed cash. Notes receivable from or payable to Questar represented interest bearing demand notes for cash loaned to or borrowed from Questar until needed for operations. Amounts loaned to Questar earned an interest rate that was identical to the interest rate paid by the Company for borrowings from Questar. All intercompany loans between Questar and QEP were repaid on June 30, 2010, in conjunction with the Spin-off.
Property, Plant and Equipment
Property, plant and equipment balances are stated at historical cost. Maintenance and repair costs are expensed as incurred with the exception of compressor maintenance costs, which are capitalized and depreciated.
Gas and oil properties
QEP Energy uses the successful efforts method to account for gas and oil properties. The costs of acquiring leaseholds, drilling development wells, drilling successful exploratory wells, purchasing related support equipment and facilities are capitalized. Geological and geophysical studies and other exploratory activities are expensed as incurred. Costs of production and general- corporate activities are expensed in the period incurred. A gain or loss is generally recognized only when an entire field is sold or abandoned, or if the unit-of-production depreciation, depletion and amortization rate would be significantly affected.
56
Table of Contents
Capitalized costs of unproved properties are generally combined and amortized over the expected holding period for such properties. Capitalized costs of unproved properties are reclassified as proved property when related proved reserves are determined or charged against the impairment allowance when abandoned.
Capitalized exploratory well costs
The Company capitalizes exploratory well costs until it determines whether an exploratory well is commercial or noncommercial. If the Company deems the well commercial, capitalized costs are depreciated on a field basis using the unit-of-production method and the estimated proved developed gas and oil reserves. If the Company concludes that the well is noncommercial, well costs are immediately charged to exploration expense. Exploratory-well costs capitalized for a period greater than one year since the completion of drilling are expensed unless the Company remains engaged in substantial activities to assess whether the well is commercial.
Depreciation, depletion and amortization
Capitalized proved leasehold costs are depleted on a field-by-field basis using the unit-of-production method and the estimated proved gas and oil reserves. Oil and NGL volumes are converted to natural gas equivalents using the ratio of one barrel of crude oil, condensate or NGL to 6,000 cubic feet of natural gas. Capitalized costs of exploratory wells that have found proved gas and oil reserves and capitalized development costs are depreciated using the unit-of-production method based on estimated proved developed reserves on a field basis. The Company capitalizes an estimate of the fair value of future abandonment costs. Future abandonment costs, less estimated future salvage values, are depreciated over the life of the related asset using a unit-of-production method. The volume-weighted average depreciation, depletion and amortization rates of the Company’s capitalized costs: per Mcfe were $2.59 in 2010, $2.71 in 2009 and $1.93 in 2008.
Depreciation, depletion and amortization for the remaining Company properties is based upon rates that will systematically charge the costs of assets against income over the estimated useful lives of those assets using either a straight-line or unit-of-production method. Investment in gas gathering and processing fixed assets is charged to expense using either the straight-line or unit-of-production method depending upon the facility.
Impairment of Long-Lived Assets
Proved gas and oil properties are evaluated on a field-by-field basis for potential impairment. Other properties are evaluated on a specific-asset basis or in groups of similar assets, as applicable. Impairment is indicated when a triggering event occurs and the sum of the estimated undiscounted future net cash flows of an evaluated asset is less than the asset’s carrying value. Triggering events could include, but are not limited to, an impairment of gas and oil reserves caused by mechanical problems, faster-than-expected decline of reserves, lease-ownership issues, other-than-temporary decline in gas and oil prices and changes in the utilization of pipeline assets. If impairment is indicated, fair value is calculated using a discounted-cash flow approach. Cash flow estimates require forecasts and assumptions for many years into the future for a variety of factors, including commodity prices and operating costs.
The Company also performs periodic assessments of individually significant unproved gas and oil properties for impairment and recognizes a loss at the time of impairment. In determining whether a significant unproved property is impaired the Company considers numerous factors including, but not limited to, current exploration plans, favorable or unfavorable exploration activity on adjacent leaseholds, in-house geologists’ evaluations of the lease, and the remaining lease term.
Goodwill and Other Intangible Assets
Goodwill represents the excess of the amount paid over the fair value of net assets acquired in a business combination and is not subject to amortization. Goodwill and indefinite lived intangible assets are tested for impairment at a minimum of once a year or when a triggering event occurs. If a triggering event occurs, the
57
Table of Contents
undiscounted net cash flows of the intangible asset or entity to which the goodwill relates are evaluated. Impairment is indicated if undiscounted cash flows are less than the carrying value of the assets. The amount of the impairment is measured using a discounted-cash flow model considering future revenues, operating costs, a risk-adjusted discount rate and other factors.
Capitalized Interest
The Company capitalizes interest costs during the construction phase of large capital projects that meet certain criteria. Capitalized interest was $3.1 million in 2010 and $4.9 million in 2008. There was no capitalized interest during 2009.
Derivative Instruments
In November 2008, the Company adopted the updated disclosure provisions of ASC 815 “Derivatives and Hedging” and modified the disclosures accordingly. The Company may elect to designate a derivative instrument as a hedge of exposure to changes in fair value or cash flows. If the hedged exposure is a fair-value exposure, the gain or loss on the derivative instrument is recognized in earnings in the period of the change together with the offsetting gain or loss from the change in fair value of the hedged item. If the hedged exposure is a cash flow exposure, the effective portion of the gain or loss on the derivative instrument is reported initially as a component of AOCI and subsequently reclassified into earnings when the forecasted transaction affects earnings. Any amount excluded from the assessment of hedge effectiveness, as well as the ineffective portion of the gain or loss, is reported in the current period income statement. A derivative instrument qualifies as a cash flow hedge if all of the following tests are met:
| • | The item to be hedged exposes the Company to price risk. |
| • | The derivative reduces the risk exposure and is designated as a hedge at the time the Company enters into the contract. |
| • | At the inception of the hedge and throughout the hedge period, there is a high correlation between changes in the market value of the derivative instrument and the fair value of the underlying hedged item. |
When the designated item associated with a derivative instrument matures, is sold, extinguished or terminated, derivative gains or losses are included in income in the same period that the underlying production or other contractual commitment is delivered. When a derivative instrument is associated with an anticipated transaction that is no longer probable, the gain or loss on the derivative is reclassified from other comprehensive income and recognized currently in the results of operations. When a derivative is terminated before its contract expires, the associated gain or loss is recognized in income over the life of the previously hedged production.
Physical Contracts
Physical hedge contracts have a nominal quantity and a fixed price. Contracts representing both purchases and sales settle monthly based on quantities valued at a fixed price. Purchase contracts fix the purchase price paid and are recorded as cost of sales in the month the contracts are settled. Sales contracts fix the sales price received and are recorded as revenues in the month they are settled. Due to the nature of the physical market, there is a one-month delay for the cash settlement. QEP accrues for the settlement of contracts in the current month’s revenues and cost of sales.
Financial Contracts
Financial contracts are contracts that are net settled in cash without delivery of product. Financial contracts also have a nominal quantity and exchange an index price for a fixed price, and are net settled with the brokers as the price bulletins become available. Financial contracts are recorded in revenues or cost of sales in the month of settlement.
58
Table of Contents
Basis-Only Swaps
Basis-only swaps are used to manage the risk of widening basis differentials. These contracts are marked to market monthly with any change in the valuation recognized in the determination of income.
Credit Risk
The Rocky Mountain and Midcontinent regions constitute the Company’s primary market areas. Exposure to credit risk may be affected by the concentration of customers in these regions due to changes in economic or other conditions. Customers include individuals and numerous commercial and industrial enterprises that may react differently to changing conditions. Management believes that its credit-review procedures, loss reserves, customer deposits and collection procedures have adequately provided for usual and customary credit-related losses. Commodity-based hedging arrangements also expose the Company to credit risk. The Company monitors the creditworthiness of its counterparties, which generally are major financial institutions and energy companies. Loss reserves are periodically reviewed for adequacy and may be established on a specific case basis. QEP requests credit support and, in some cases, fungible collateral from companies with unacceptable credit risks. The Company has master-netting agreements with some counterparties that allow the offsetting of receivables and payables in a default situation.
Bad debt expense associated with accounts receivable for the year ended December 31, 2010 was a credit of $0.3 million compared with expense of $0.4 million in 2009 and 2008. The allowance for bad-debt expenses was $2.3 million at December 31, 2010, and $3.0 million at December 31, 2009.
Income Taxes
Prior to the Spin-off, Questar and its subsidiaries filed consolidated federal income tax returns. QEP accounts for income tax expense on a separate-return basis and records tax benefits as they are generated. Deferred income taxes are provided for the temporary differences arising between the book and tax carrying amounts of assets and liabilities. These differences create taxable or tax-deductible amounts for future periods. The Company records interest earned on income tax refunds in interest and other income and records penalties and interest charged on tax deficiencies in interest expense.
ASC 740 “Income Taxes” specifies the accounting for uncertainty in income taxes by prescribing a minimum recognition threshold for a tax position to be reflected in the financial statements. If recognized, the tax benefit is measured as the largest amount of tax benefit that is more-likely-than-not to be realized upon ultimate settlement. Management has considered the amounts and the probabilities of the outcomes that could be realized upon ultimate settlement and believes that it is more-likely-than-not that the Company’s recorded income tax benefits will be fully realized. There were no unrecognized tax benefits at the beginning or at the end of the twelve-month periods ended December 31, 2010, 2009 and 2008. The federal income tax return for 2009 is currently under examination by the Internal Revenue Service. Income tax returns for 2010 have not yet been filed. Most state tax returns for 2007 and subsequent years remain subject to examination.
Earnings Per Share
Basic earnings per share (EPS) are computed by dividing net income attributable to QEP by the weighted-average number of common shares outstanding during the reporting period. Diluted EPS includes the potential increase in the number of outstanding shares that could result from the exercise of in-the-money stock options. During the first quarter of 2009, the Company adopted the updated provisions of ASC 260, “Earnings Per Share.” ASC 260 addresses whether instruments granted in share-based payment transactions are participating securities and therefore have a potential dilutive effect on EPS. The adoption was applied retrospectively and did not have a material effect on the Company’s EPS calculations. See Note 2 for further discussion on EPS.
59
Table of Contents
Share-Based Compensation
QEP issued stock options and restricted shares to certain officers, employees and non-employee directors under its Long-Term Stock Incentive Plan (LTSIP). QEP uses the Black-Scholes-Merton mathematical model to estimate the fair value of stock options for accounting purposes. The granting of restricted shares results in recognition of compensation cost measured at the grant-date market price. QEP uses an accelerated method in recognizing share-based compensation costs with graded-vesting periods. See Note 12 for further discussion on share-based compensation.
Comprehensive Income
Comprehensive income is the sum of net income attributable to QEP as reported in the Consolidated Statements of Income and Other Comprehensive Income. Other comprehensive income includes changes in the market value of commodity-based derivative instruments that qualify for hedge accounting and recognition of the changes in the under-funded position of the defined benefit pension plans and other postretirement benefits plans. These transactions are not the culmination of the earnings process but result from periodically adjusting historical balances to fair value. Income or loss associated with commodity-based derivative instruments that qualify for hedge accounting is realized when the gas, oil or NGL underlying the derivative instrument is sold. Comprehensive income attributable to QEP is shown below:
| Year Ended December 31, | ||||||||
| 2010 | 2009 | |||||||
| (in millions) | ||||||||
| Balance at January 1, |
$ | 87.1 | $ | 341.6 | ||||
| Realized or otherwise settled |
(218.6 | ) | (271.0 | ) | ||||
| Change due to commodity price changes |
136.7 | (38.3 | ) | |||||
| Net fair value of hedges added during the year |
218.6 | 54.8 | ||||||
| Change in pension and postretirement liability |
(29.5 | ) | — | |||||
| Balance at December 31, |
$ | 194.3 | $ | 87.1 | ||||
Income taxes allocated to each component of other comprehensive income (loss) for the year are shown in the table below: Expenses are enclosed in parentheses.
| Year Ended December 31, | ||||||||||||
| 2010 | 2009 | 2008 | ||||||||||
| (in millions) | ||||||||||||
| Unrealized gain (loss) on derivatives |
$ | (81.0 | ) | $ | 150.6 | $ | (183.4 | ) | ||||
| Pension liability |
12.6 | — | — | |||||||||
| Postretirement benefits liability |
5.7 | — | — | |||||||||
| Income taxes |
$ | (62.7 | ) | $ | 150.6 | $ | (183.4 | ) | ||||
Business Segments
Line of business information is presented according to senior management’s basis for evaluating performance considering differences in the nature of products, services and regulation.
Recent Accounting Developments
There have been no recent accounting pronouncements that were adopted in 2010 or are under consideration that would have a material impact on QEP’s results of operations or financial condition.
All dollar and share amounts in this Form 10-K are in millions, except per-share information and where otherwise noted.
60
Table of Contents
Note 2 – Earnings Per Share (EPS) and Common Stock
Basic EPS is computed by dividing net income attributable to QEP by the weighted-average number of common shares outstanding during the reporting period. Diluted EPS includes the potential increase in the number of outstanding shares that could result from the exercise of in-the-money stock options. A reconciliation of the components of basic and diluted shares used in the EPS calculation follows:
| Year Ended December 31, | ||||||||||||
| 2010 | 2009 | 2008 | ||||||||||
| (in millions) | ||||||||||||
| Weighted-average basic common shares outstanding |
175.3 | 174.1 | 172.8 | |||||||||
| Potential number of shares issuable under the LTSIP |
2.0 | 2.2 | 3.3 | |||||||||
| Average diluted common shares outstanding |
177.3 | 176.3 | 176.1 | |||||||||
Long-Term Stock Incentive Plan
QEP issues stock options and restricted shares to certain officers, directors, and employees under its Long-Term Stock Incentive Plan (LTSIP). Stock options for participants have terms ranging from five to ten years with a majority issued with a seven to ten-year term. Options held by employees generally vest in three or four equal, annual installments. Options granted to non-employee directors generally vest in one installment six months after grant. Restricted shares vest in equal installments over a specified number of years after the grant date with the majority vesting in three or four years. Non-vested restricted shares have voting and dividend rights; however, sale or transfer is restricted. At the time of the Spin-off, all outstanding options and restricted stock were bifurcated. As of December 31, 2010 certain Questar officers, employees and non-employee directors held a total of approximately 2.5 million QEP stock options and approximately 243 thousand shares of restricted stock. For a summary of LTSIP transactions see Note 12—Share-Based Compensation.
Note 3 – Discontinued Operations
Wexpro’s operating results are reflected in this Annual Report on Form 10-K as discontinued operations and summarized below:
| Year Ended December 31, | ||||||||||||
| 2010 | 2009 | 2008 | ||||||||||
| (in millions, except per share amounts) |
||||||||||||
| Revenues |
$ | 131.2 | $ | 242.9 | $ | 241.0 | ||||||
| Income before income taxes |
67.4 | 126.9 | 115.2 | |||||||||
| Income taxes |
(24.2 | ) | (46.2 | ) | (41.3 | ) | ||||||
| Discontinued operations, net of income taxes |
$ | 43.2 | $ | 80.7 | $ | 73.9 | ||||||
| Earnings Per Common Share Attributable To QEP |
||||||||||||
| Basic from discontinued operations |
$ | 0.25 | $ | 0.46 | $ | 0.43 | ||||||
| Diluted from discontinued operations |
$ | 0.24 | 0.46 | 0.42 | ||||||||
61
Table of Contents
Note 4 – Property, Plant and Equipment
The details of property, plant and equipment and accumulated depreciation, depletion and amortization follow:
| December 31, | ||||||||
| 2010 | 2009 | |||||||
| (in millions) | ||||||||
| Property, plant and equipment |
||||||||
| QEP Energy |
||||||||
| Proved properties |
$ | 6,874.3 | $ | 5,721.5 | ||||
| Unproved properties, not being depleted |
322.0 | 389.6 | ||||||
| QEP Energy total |
7,196.3 | 6,111.1 | ||||||
| QEP Field Services |
1,360.5 | 1,037.5 | ||||||
| QEP Marketing and other |
44.5 | 42.4 | ||||||
| Total property, plant and equipment |
$ | 8,601.3 | $ | 7,191.0 | ||||
| Accumulated depreciation, depletion and amortization |
||||||||
| QEP Energy |
$ | 2,454.4 | $ | 1,890.9 | ||||
| QEP Field Services |
244.6 | 198.7 | ||||||
| QEP Marketing and other |
12.3 | 10.1 | ||||||
| Total accumulated depreciation, depletion and amortization |
2,711.3 | 2,099.7 | ||||||
| Net Property, Plant and Equipment of Discontinued Operations |
— | 593.9 | ||||||
| Net Property, Plant and Equipment |
$ | 5,890.0 | $ | 5,685.2 | ||||
QEP Energy proved and unproved leaseholds had a net book value of $1,130.5 million at December 31, 2010, and $1,152.2 million at December 31, 2009.
Note 5 – Asset Retirement Obligations
QEP records asset retirement obligations (ARO) when there are legal obligations associated with the retirement of tangible long-lived assets. The Company’s ARO liability applies primarily to abandonment costs associated with gas and oil wells, production facilities and certain other properties. The fair values of such costs are estimated by Company personnel based on abandonment costs of similar properties and depreciated over the life of the related assets. Revisions to ARO estimates result from changes in expected cash flows or material changes in estimated asset retirement costs. The ARO liability is adjusted to present value each period through an accretion calculation using a credit-adjusted risk-free interest rate. Income or expense resulting from the settlement of ARO liabilities is included in net gain or (loss) from asset sales in the Consolidated Statements of Income. Changes in ARO were as follows:
| 2010 | 2009 | |||||||
| (in millions) | ||||||||
| ARO liability at January 1, |
$ | 124.7 | $ | 116.7 | ||||
| Accretion |
8.8 | 7.7 | ||||||
| Liabilities incurred |
17.0 | 2.3 | ||||||
| Liabilities settled |
(2.2 | ) | (2.0 | ) | ||||
| ARO liability at December 31, |
$ | 148.3 | $ | 124.7 | ||||
62
Table of Contents
Note 6 – Capitalized Exploratory Well Costs
Net changes in capitalized exploratory well costs are presented in the table below and exclude amounts that were capitalized and subsequently expensed in the period. All of these costs have been capitalized for less than one year.
| 2010 | 2009 | 2008 | ||||||||||
| (in millions) | ||||||||||||
| Balance at January 1, |
$ | 51.7 | $ | 17.0 | $ | 1.5 | ||||||
| Additions to capitalized exploratory well costs pending the determination of proved reserves |
12.2 | 51.7 | 17.0 | |||||||||
| Reclassifications to property, plant and equipment after the determination of proved reserves |
(50.3 | ) | (14.3 | ) | — | |||||||
| Capitalized exploratory well costs charged to expense |
— | (2.7 | ) | (1.5 | ) | |||||||
| Balance at December 31, |
$ | 13.6 | $ | 51.7 | $ | 17.0 | ||||||
Note 7—Fair Value Measurements
Beginning in 2008, QEP adopted the effective provisions of ASC 820 “Fair Value Measurements and Disclosures.” ASC 820 defines fair value in applying GAAP, establishes a framework for measuring fair value and expands disclosures about fair-value measurements. ASC 820 does not change existing guidance as to whether or not an instrument is carried at fair value. ASC 820 establishes a fair-value hierarchy. Level 1 inputs are quoted prices (unadjusted) for identical assets or liabilities in active markets that the Company has the ability to access at the measurement date. Level 2 inputs are inputs other than quoted prices included within Level 1 that are observable for the asset or liability, either directly or indirectly. Level 3 inputs are unobservable inputs for the asset or liability. The Level 2 fair value of derivative contracts (see Note 8) is based on market prices posted on the NYMEX on the last trading day of the reporting period and industry-standard discounted cash flow models. The Level 3 fair value of derivative contracts is based on NYMEX market prices in combination with unobservable volatility inputs and industry-standard option pricing models.
QEP primarily applies the market approach for recurring fair value measurements and maximizes its use of observable inputs and minimizes its use of unobservable inputs. QEP considers bid and ask prices for valuing the majority of its assets and liabilities measured and reported at fair value. In addition to using market data, QEP makes assumptions in valuing its assets and liabilities, including assumptions about risk and the risks inherent in the inputs to the valuation technique.
Certain of QEP’s derivative instruments, however, are valued using industry-standard models that consider various inputs, including quoted forward prices for commodities, time value, volatility, and current market and contractual prices for the underlying instruments, as well as other relevant economic measures. Substantially all of these inputs are observable in the marketplace throughout the full term of the instrument, can be derived from observable data or are supported by observable prices at which transactions are executed in the marketplace. The determination of fair value for derivative assets and liabilities also incorporates nonperformance risk for counterparties and for QEP. Derivative contract fair values are reported on a net basis to the extent a legal right of offset with a counterparty exists.
63
Table of Contents
In February 2008, the FASB delayed the effective date of ASC 820 for one year for certain nonfinancial assets and nonfinancial liabilities, except those recognized or disclosed at fair value in the financial statements on a recurring basis. On January 1, 2009, QEP adopted, without material impact on the Consolidated Financial Statements, the delayed provisions of ASC 820 related to nonfinancial assets and nonfinancial liabilities that are not required or permitted to be measured at fair value on a recurring basis. QEP did not have any assets or liabilities measured at fair value on a non-recurring basis at December 31, 2010. The fair values of assets and liabilities at December 31, 2010, are shown in the table below:
| Fair Value Measurements December 31, 2010 |
||||||||||||||||
| Level 2 | Level 3 | Netting Adjustments |
Total | |||||||||||||
| (in millions) | ||||||||||||||||
| Assets |
||||||||||||||||
| Derivative contracts—short term |
$ | 374.6 | $ | 37.9 | $ | (155.2 | ) | $ | 257.3 | |||||||
| Derivative contracts—long term |
121.1 | — | (0.3 | ) | 120.8 | |||||||||||
| Total assets |
$ | 495.7 | $ | 37.9 | $ | (155.5 | ) | $ | 378.1 | |||||||
| Liabilities |
||||||||||||||||
| Derivative contracts—short term |
$ | 292.9 | $ | 1.6 | $ | (155.2 | ) | $ | 139.3 | |||||||
| Derivative contracts—long term |
0.6 | — | (0.3 | ) | 0.3 | |||||||||||
| Total liabilities |
$ | 293.5 | $ | 1.6 | $ | (155.5 | ) | $ | 139.6 | |||||||
The change in the fair value of Level 3 assets and liabilities is shown below:
| Change in Level 3 Fair Value |
||||
| 2010 | ||||
| (in millions) | ||||
| Balance at January 1, |
$ | 5.5 | ||
| Realized gains and losses included in revenues |
5.0 | |||
| Unrealized gains and losses included in other comprehensive income |
30.8 | |||
| Settlements |
(5.0 | ) | ||
| Balance at December 31, |
$ | 36.3 | ||
The fair values of assets and liabilities at December 31, 2009, are shown in the table below:
| Fair Value Measurements December 31, 2009 |
||||||||||||||||
| Level 2 | Level 3 | Netting Adjustments |
Total | |||||||||||||
| (in millions) | ||||||||||||||||
| Assets |
||||||||||||||||
| Derivative contracts—short term |
$ | 312.6 | $ | 2.4 | $ | (186.8 | ) | $ | 128.2 | |||||||
| Derivative contracts—long term |
194.3 | 16.1 | (149.2 | ) | 61.2 | |||||||||||
| Total assets |
$ | 506.9 | $ | 18.5 | $ | (336.0 | ) | $ | 189.4 | |||||||
| Liabilities |
||||||||||||||||
| Derivative contracts—short term |
$ | 334.4 | $ | 2.1 | $ | (186.8 | ) | $ | 149.7 | |||||||
| Derivative contracts—long term |
278.9 | 10.9 | (149.2 | ) | 140.6 | |||||||||||
| Total liabilities |
$ | 613.3 | $ | 13.0 | $ | (336.0 | ) | $ | 290.3 | |||||||
64
Table of Contents
The change in the fair value of Level 3 assets and liabilities is shown below:
| Change in Level 3 Fair Value |
||||
| 2009 | ||||
| (in millions) | ||||
| Balance at January 1, |
$ | — | ||
| Realized gains and losses included in revenues |
— | |||
| Unrealized gains and losses included in other comprehensive income |
5.5 | |||
| Settlements |
— | |||
| Balance at December 31, |
$ | 5.5 | ||
The following table discloses the fair value and related carrying amount of certain financial instruments not disclosed in other notes to the Consolidated Financial Statements in this Report on Form 10-K:
| Carrying Amount |
Estimated Fair Value |
Carrying Amount |
Estimated Fair Value |
|||||||||||||
| December 31, 2010 | December 31, 2009 | |||||||||||||||
| (in millions) | ||||||||||||||||
| Financial assets |
||||||||||||||||
| Cash and cash equivalents |
$ | — | $ | — | $ | 19.3 | $ | 19.3 | ||||||||
| Notes receivable |
— | — | 52.9 | 52.9 | ||||||||||||
| Financial liabilities |
||||||||||||||||
| Checks outstanding in excess of cash balances |
19.5 | 19.5 | — | — | ||||||||||||
| Notes payable |
— | — | 39.3 | 39.3 | ||||||||||||
| Long-term debt |
$ | 1,530.8 | $ | 1,575.8 | $ | 1,348.7 | $ | 1,394.1 | ||||||||
The carrying amounts of cash and cash equivalents, notes receivable, checks outstanding in excess of cash balances, and notes payable approximate fair value. The fair value of fixed-rate long-term debt is based on the trading levels and dollar prices for the Company’s debt at the end of the year. The carrying amount of variable-rate long-term debt approximates fair value.
Note 8 – Derivative Contracts
QEP uses commodity-price derivative instruments in the normal course of business. QEP has established policies and procedures for managing commodity-price risks through the use of derivative instruments. On January 1, 2009, the Company adopted a revision to ASC 815 “Derivatives and Hedging,” which requires more detailed information about hedging transactions including the location and effect on the primary consolidated financial statements.
QEP uses derivative instruments to support rate of return and cash flow targets and protect earnings from downward movements in commodity prices. However, these same instruments typically limit future gains from favorable price movements. The volume of production with associated derivative instruments and the mix of the instruments are frequently evaluated and adjusted by management in response to changing market conditions. QEP may match derivative contracts with up to 100% of forecast production from proved reserves when prices meet earnings and cash flow objectives. QEP does not enter into derivative instruments for speculative purposes.
QEP uses derivative instruments known as fixed-price swaps and costless collars to realize a known price or range of prices for a specific volume of production delivered into a regional sales point. Collars are combinations of put and call options that have a floor price and a ceiling price and payments are made or received only if the settlement price is outside the range between the floor and ceiling prices. QEP’s derivative instruments do not
65
Table of Contents
require the physical transfer of natural gas or crude oil between the parties at settlement. Swap and collar transactions are settled in cash with one party paying the other for the net difference in prices, multiplied by the relevant volume, for the settlement period. In the past, QEP Energy has also used natural gas basis-only swaps to protect rate of return targets and protect cash flows from widening natural gas-price basis differentials. However, natural gas basis-only swaps expose the Company to losses from narrowing natural gas price-basis differentials. As of December 31, 2009, all of the Company’s natural gas basis-only swaps had been paired with NYMEX gas fixed-price swaps or price collars and re-designated as cash flow hedges. Changes in the fair value of these derivative instruments subsequent to their re-designation were recorded in AOCI, while changes in their fair value occurring prior to their re-designation were recorded in the Consolidated Statement of Income.
QEP enters into derivative instruments that do not have margin requirements or collateral provisions that would require payments prior to the scheduled cash settlement dates. Derivative-arrangement counterparties are normally financial institutions and energy-trading firms with investment-grade credit ratings. QEP routinely monitors and manages its exposure to counterparty risk by requiring specific minimum credit standards for all counterparties and by transacting with multiple counterparties.
All derivative instruments are required to be recorded on the balance sheet as either assets or liabilities measured at their fair values. The designation of a derivative instrument as a hedge and its ability to meet hedge accounting criteria determines how the change in fair value of the derivative instrument is reflected in the consolidated financial statements. A derivative instrument qualifies for hedge accounting, if at inception, the derivative is expected to be highly effective in offsetting the underlying hedged cash flows. Generally, QEP’s derivative instruments are matched to equity gas and oil production and are highly effective, thus qualifying as cash flow hedges. Changes in the fair value of effective cash flow hedges are recorded as a component of AOCI in the Consolidated Balance Sheets and reclassified to earnings as gas and oil sales when the underlying physical transactions occur. Gas hedges are typically structured as fixed-price swaps into regional pipelines, locking in basis and hedge effectiveness. Costless collars qualify for cash flow hedge accounting. A basis-only swap does not qualify for hedge accounting treatment. QEP regularly reviews the effectiveness of derivative instruments. The ineffective portion of cash flow hedges and the mark to market adjustment of basis-only swaps are recognized in the determination of net income. The effect of derivative transactions is summarized in the tables below:
| Year Ended December 31 |
||||||||
| 2010 | 2009 | |||||||
| (in millions) | ||||||||
| Effect of derivative instruments designated as cash flow hedges |
||||||||
| Gains (losses) recognized in AOCI for the effective portion of hedges |
$ | 565.8 | $ | 214.4 | ||||
| Gains (losses) reclassified from AOCI into income for the effective portion of hedges |
||||||||
| Natural gas sales |
353.8 | 599.3 | ||||||
| Oil and NGL sales |
(8.7 | ) | 1.6 | |||||
| Marketing sales |
— | 27.8 | ||||||
| Marketing purchases |
3.1 | (9.2 | ) | |||||
| Gain (loss) recognized in income for the ineffective portion of hedges Interest and other income |
0.2 | (0.1 | ) | |||||
| Effect of derivative instruments not designated as cash flow hedges |
||||||||
| Unrealized gain (loss) on basis-only swaps |
121.7 | (164.0 | ) | |||||
| Realized (loss) on basis-only swaps |
(121.7 | ) | (25.6 | ) | ||||
66
Table of Contents
Based on December 31, 2010 prices, it is estimated that $148.1 million will be settled and reclassified from AOCI to the Consolidated Statements of Income during the next 12 months. The following table discloses the fair value of derivative contracts on a gross-contract basis as opposed to the net-contract basis presentation in the Consolidated Balance Sheets.
| December 31, | ||||||||
| 2010 | 2009 | |||||||
| (in millions) | ||||||||
| Assets |
||||||||
| Fixed-price swaps |
$ | 374.6 | $ | 312.6 | ||||
| Option contracts |
37.9 | 2.4 | ||||||
| Fair value of derivative instruments – short term |
$ | 412.5 | $ | 315.0 | ||||
| Fixed-price swaps |
$ | 121.1 | $ | 194.3 | ||||
| Option contracts |
— | 16.1 | ||||||
| Fair value of derivative instruments – long term |
$ | 121.1 | $ | 210.4 | ||||
| Liabilities |
||||||||
| Fixed-price swaps |
$ | 175.2 | $ | 212.7 | ||||
| Option contracts |
1.6 | 2.1 | ||||||
| Basis-only swaps |
117.7 | 121.7 | ||||||
| Fair value of derivative instruments – short term |
$ | 294.5 | $ | 336.5 | ||||
| Fixed-price swaps |
$ | 0.6 | $ | 161.2 | ||||
| Option contracts |
— | 10.9 | ||||||
| Basis-only swaps |
— | 117.7 | ||||||
| Fair value of derivative instruments – long term |
$ | 0.6 | $ | 289.8 | ||||
The following table sets forth QEP Energy’s volumes and average net-to-the-well prices for its commodity derivative contracts as of December 31, 2010:
| Year |
Time Periods |
Quantity | Average hedge price per Mcf or bbl, net to the well(1) (estimated) |
|||||||||
| Gas (Bcf) Fixed-price Swaps | ||||||||||||
| 2011 |
12 months | 103.1 | $4.85 | |||||||||
| 2012 |
12 months | 50.4 | 5.30 | |||||||||
| 2013 |
12 months | 50.3 | 5.51 | |||||||||
| Gas (Bcf) Collars | ||||||||||||
| Floor - Ceiling | ||||||||||||
| 2011 |
12 months | 27.9 | $4.58 - $6.59 | |||||||||
| Oil (Mbbl) Collars | ||||||||||||
| Floor - Ceiling | ||||||||||||
| 2011 |
12 months | 1,095 | $51.73 - $102.10 | |||||||||
| (1) | The fixed-price swap and collar prices are reduced by gathering costs and adjusted for product quality to determine the net-to-the-well price. |
67
Table of Contents
The following table sets forth QEP Marketing’s volumes and swap prices for its commodity derivative contracts as of December 31, 2010:
| Year |
Time Periods |
Quantity | Average price per MMBtu | |||||||||
| Gas Sales (millions of MMBtu) Fixed-price Swaps | ||||||||||||
| 2011 |
12 months | 5.1 | $ | 4.74 | ||||||||
| 2012 |
12 months | 0.4 | 4.63 | |||||||||
| Gas Purchases (millions of MMBtu) Fixed-price Swaps | ||||||||||||
| 2011 |
12 months | 1.2 | $ | 4.47 | ||||||||
| 2012 |
12 months | 0.1 | 4.07 | |||||||||
Note 9 – Debt
As of the indicated dates, the principal amount of QEP’s debt consisted of the following:
| December 31, | ||||||||
| 2010 | 2009 | |||||||
| (in millions) | ||||||||
| Revolving-credit facility, 2.71% at December 31, 2010, due 2013 |
$ | 400.0 | $ | 200.0 | ||||
| 7.50% notes due 2011 |
58.5 | 150.0 | ||||||
| 6.05% notes due 2016 |
176.8 | 250.0 | ||||||
| 6.80% notes due 2018 |
138.6 | 450.0 | ||||||
| 6.80% notes due 2020 |
138.0 | 300.0 | ||||||
| 6.875% notes due 2021 |
625.0 | — | ||||||
| Total long-term debt outstanding |
1,536.9 | 1,350.0 | ||||||
| Less unamortized-debt discount |
(6.1 | ) | (1.3 | ) | ||||
| Total long-term debt outstanding |
$ | 1,530.8 | $ | 1,348.7 | ||||
Maturities of long-term debt for the five years following December 31, 2010, are $58.5 million in 2011 and $400 million in 2013.
Credit Arrangements
QEP has a revolving credit facility which provides for loan commitments of $1.0 billion from a syndicate of financial institutions. The facility matures March 2013. The credit facility has restrictive covenants that limit the amount of funded indebtedness that QEP may incur. At December 31, 2010, QEP was in compliance with all of its debt covenants.
In conjunction with the Spin-off, QEP entered into a $500.0 million, 364-day term loan agreement with substantially the same initial pricing and terms as its revolving credit agreement. Commitments under the term loan were terminated in August 2010 in conjunction with the issuance of $625.0 million of senior notes.
In August 2010, the Company purchased $638.0 million principal amount of its senior notes and paid required premium and accrued interest pursuant to the requirement in the notes’ indenture relating to a change of control. The Company used cash on hand and proceeds from its revolving credit facility and term loan to purchase all of the tendered notes. Subsequent to the purchase of the tendered notes, the Company issued $625.0 million principal amount of senior notes due 2021 to refinance a portion of the indebtedness incurred to purchase the tendered senior notes. Proceeds from the senior notes offering were used to repay all of the borrowings outstanding under the term loan and a portion of outstanding borrowings under the Company’s revolving credit.
68
Table of Contents
Senior Notes
The company has $1,137.0 million principal amount of senior notes outstanding with maturities ranging from March 2011 to March 2021 and coupons ranging from 6.05% to 7.50%. The senior notes pay interest semi-annually, are unsecured and senior obligations and rank equally with all of our other existing and future unsecured and senior obligations. We may redeem some or all of our senior notes at any time before their maturity at a redemption price based on a make-whole amount plus accrued and unpaid interest to the date of redemption. The indenture governing our senior notes contains customary events of default and covenants that may limit our ability to, among other thing, place liens on our property or assets.
Note 10 – Income Taxes
Details of income tax expenses and deferred income taxes from continuing operations are provided in the following tables. The components of income tax expenses were as follows:
| Year Ended December 31, | ||||||||||||
| 2010 | 2009 | 2008 | ||||||||||
| (in millions) | ||||||||||||
| Federal |
||||||||||||
| Current |
$ | (16.6 | ) | $ | 11.5 | $ | (32.6 | ) | ||||
| Deferred |
172.9 | 101.3 | 308.1 | |||||||||
| State |
||||||||||||
| Current |
(4.7 | ) | 2.6 | (3.6 | ) | |||||||
| Deferred |
15.4 | 2.2 | 11.7 | |||||||||
| Total income tax expense |
$ | 167.0 | $ | 117.6 | $ | 283.6 | ||||||
The difference between the statutory federal income tax rate and the Company’s effective income tax rate is explained as follows:
| Year Ended December 31, |
||||||||||||
| 2010 | 2009 | 2008 | ||||||||||
| Federal income taxes statutory rate |
35.0 | % | 35.0 | % | 35.0 | % | ||||||
| Increase (decrease) in rate as a result of: |
||||||||||||
| State income taxes, net of federal income tax benefit |
1.5 | 0.9 | 0.7 | |||||||||
| Non-deductible Spin-off costs |
0.5 | — | — | |||||||||
| Other |
(0.1 | ) | (0.6 | ) | (0.4 | ) | ||||||
| Effective income tax rate |
36.9 | % | 35.3 | % | 35.3 | % | ||||||
69
Table of Contents
Significant components of the Company’s deferred income taxes were as follows:
| December 31, | ||||||||
| 2010 | 2009 | |||||||
| (in millions) | ||||||||
| Deferred tax liabilities |
||||||||
| Property, plant and equipment |
$ | 1,458.9 | $ | 1,217.5 | ||||
| Energy-price derivatives |
44.8 | — | ||||||
| Total deferred tax liabilities |
1,503.7 | 1,217.5 | ||||||
| Deferred tax assets |
||||||||
| NOL and tax credit carryforwards |
93.7 | — | ||||||
| Energy-price derivatives |
— | 29.5 | ||||||
| Employee benefits and compensation costs |
32.3 | 12.2 | ||||||
| Total deferred tax assets |
126.0 | 41.7 | ||||||
| Deferred income taxes – noncurrent |
$ | 1,377.7 | $ | 1,175.8 | ||||
| Deferred income taxes – current |
||||||||
| Energy-price derivatives |
$ | (43.9 | ) | $ | 8.0 | |||
| Other |
16.1 | 13.2 | ||||||
| Deferred income taxes – current asset (liability) |
$ | (27.8 | ) | $ | 21.2 | |||
The amounts and expiration dates of operating loss and tax credit carryforwards at December 31, 2010:
| Expiration Dates |
Amounts | |||||||
| (in millions) | ||||||||
| U.S. federal net operating loss carryforwards |
2030 | $ | 70.0 | |||||
| State net operating loss and credit carryforwards |
2014-2030 | 14.5 | ||||||
| U.S. alternative minimum tax credit |
Indefinite | 9.2 | ||||||
| Total |
$ | 93.7 | ||||||
Note 11 – Commitments and Contingencies
QEP is involved in various commercial and regulatory claims and litigation and other legal proceedings that arise in the ordinary course of its business. Management does not believe any of them will have a material adverse effect on the Company’s financial position, results of operations or cash flows. A liability is recorded for a loss contingency when its occurrence is probable and damages can be reasonably estimated based on the anticipated most likely outcome. Disclosures are provided for contingencies reasonably likely to occur which would have a material adverse effect on the Company’s financial position, results of operations or cash flows. Some of the claims involve highly complex issues relating to liability, damages and other matters subject to substantial uncertainties and, therefore, the probability of liability or an estimate of loss cannot be reasonably determined.
Environmental Claims
United States of America v. QEP Field Services, Civil No. 208CV167, U.S. District Court for Utah. The U.S. Environmental Protection Agency (EPA) alleges that QEP Field Services (f/k/a QGM) violated the Clean Air Act (CAA) and seeks substantial penalties and a permanent injunction involving the manner of operation of five compressor stations located in the Uinta Basin of eastern Utah. EPA contends that the potential to emit, on a hypothetically uncontrolled basis, for these facilities renders them “major sources” of emissions for criteria and hazardous air pollutants even though controls were installed. Categorization of the facilities as “major sources” affects the particular regulatory program and requirements applicable to those facilities. EPA claims that QEP
70
Table of Contents
Field Services failed to obtain the necessary major source pre-construction or modification permits, and failed to comply with hazardous air-pollutant regulations for testing and reporting, among other requirements. QEP Field Services contends that its facilities have pollution controls installed that reduce their actual air emissions below major source thresholds, rendering them subject to different regulatory requirements applicable to minor sources. QEP Field Services has vigorously defended EPA’s claims, and believes that the major source permitting and regulatory requirements at issue can be legally avoided by applying Utah’s CAA program or EPA’s prior permitting practice for similar facilities elsewhere in Indian Country, among other defenses. Because of the complexities and uncertainties of this legal dispute, it is difficult to predict all reasonably possible outcomes; however, management believes the Company has accrued a reasonable loss contingency that is an immaterial amount, for the anticipated most likely outcome. The Ute Indian Tribe and individual members of its Business Committee have now intervened as co-plaintiffs asserting the same CAA claims as the federal government.
QEP Energy v. U.S. Environmental Protection Agency, No. 09-9538, U.S. Court of Appeals for the 10th Circuit. On July 10, 2009 QEP Energy filed a petition with the U.S. Court of Appeals challenging an administrative compliance order dated May 12, 2009 (Order), issued by EPA which asserts that QEP Energy’s Flat Rock 14P well in the Uinta Basin and associated equipment is a major source of hazardous air pollutants and its operation fails to comply with certain regulations of the CAA. The Order required immediate compliance. QEP Energy denies that the drilling and operation of the 14P well and associated equipment violates any provisions of the CAA and intends to vigorously defend this claim.
Commitments
Subsidiaries of QEP have contracted for firm-transportation services with various third-party pipelines through 2040. Market conditions, drilling activity and competition may prevent full utilization of the contractual capacity. Annual payments and the corresponding years are as follows:
| (in millions) | ||||
| 2011 |
$ | 45.4 | ||
| 2012 |
45.2 | |||
| 2013 |
43.6 | |||
| 2014 |
42.5 | |||
| 2015 |
42.4 | |||
| After 2015 |
228.5 | |||
QEP rents office space throughout its scope of operations from third-party lessors. Rental expense amounted to $4.5 million in 2010, $4.0 million in 2009 and $3.4 million in 2008. Minimum future payments under the terms of long-term operating leases for the Company’s primary office locations are as follows:
| (in millions) | ||||
| 2011 |
$ | 5.0 | ||
| 2012 |
4.5 | |||
| 2013 |
3.4 | |||
| 2014 |
1.0 | |||
| 2015 |
1.1 | |||
| After 2015 |
0.1 | |||
Note 12 – Share-Based Compensation
QEP issues stock options and restricted shares to certain officers, employees and non-employee directors under its Long-Term Stock Incentive Plan (LTSIP). Prior to the Spin-off, Questar granted share-based compensation to certain QEP employees using Questar common stock as the basis. Stock options or restricted stock awards outstanding as of the Distribution Date were adjusted in order to generally preserve the benefits or potential benefits intended to be made available under the LTSIP. All such stock options were divided into two separate
71
Table of Contents
options, one relating to Questar common stock and one relating to QEP common stock. Each holder of Questar restricted stock was issued additional restricted shares of QEP common stock on a pro rata basis. The exercise price of options and the grant-day prices of restricted shares were modified using the ratio of the June 30, 2010, closing prices of Questar and QEP were $14.66 or 32.23% and $30.83 or 67.77%, respectively.
QEP recognizes expense over time as the stock options or restricted shares vest. Share-based compensation expense amounted to $16.1 million in 2010 compared to $13.4 million in 2009 and $10.5 million in 2008. Deferred share-based compensation, representing the unvested value of restricted share awards, amounted to $17.8 million at December 31, 2010. Deferred share-based compensation is included in additional paid-in capital in the Condensed Consolidated Balance Sheets. There were 14.7 million shares available for future grants at December 31, 2010.
QEP uses the Black-Scholes-Merton mathematical model in estimating the fair value of stock options for accounting purposes. Fair-value calculations rely upon subjective assumptions used in the mathematical model and may not be representative of future results. The Black-Scholes-Merton model was intended for measuring the value of options traded on an exchange. The calculated fair value of options granted and major assumptions used in the model at the date of grant are listed below:
| 2010 | 2009 | 2008 | ||||
| Stock Option Variables |
Range of Stock Option Variables |
Range of Stock Option Variables | ||||
| Fair value of options at grant date |
$27.55 | $31.06 - $35.38 | $28.58 - $53.83 | |||
| Risk-free interest rate |
2.30% | 1.78% - 2.51% | 2.72% - 3.20% | |||
| Expected price volatility |
30.3% | 28.1% - 29.9% | 20.3% - 32.3% | |||
| Expected dividend yield |
1.18% | 1.39% - 1.61% | 0.91% - 1.72% | |||
| Expected life in years |
5.2 | 5.0 - 5.0 | 5.0 - 5.0 |
Unvested stock options decreased by 151,045 shares to 731,950 in 2010. As of December 31, 2010, $1.6 million of compensation cost related to unvested stock options granted under the LTSIP remained to be recognized. Stock-option transactions under the terms of the LTSIP for the three years ended December 31, 2010, are summarized below:
| Options Outstanding |
Price Range | Weighted- Average Price |
||||||||||
| Balance at January 1, 2008 |
1,196,484 | $ | 5.08 -$27.84 | $ | 12.36 | |||||||
| Granted |
287,500 | 19.37 | 19.37 | |||||||||
| Exercised |
(82,454 | ) | 5.08 - 11.89 | 7.75 | ||||||||
| Employee transfer |
(58,210 | ) | 5.08 - 9.49 | 8.40 | ||||||||
| Balance at December 31, 2008 |
1,343,320 | 5.08 - 27.84 | 14.24 | |||||||||
| Granted |
493,000 | 23.98 | 23.98 | |||||||||
| Exercised |
(128,826 | ) | 5.08 - 9.49 | 7.63 | ||||||||
| Employee transfer |
6,000 | 7.78 - 9.19 | 8.95 | |||||||||
| Forfeited |
(60,000 | ) | 19.37 - 23.98 | 19.76 | ||||||||
| Balance at December 31, 2009 |
1,653,494 | 5.08 - 27.84 | 17.43 | |||||||||
| Granted |
219,800 | 27.55 | 27.55 | |||||||||
| Exercised |
(24,372 | ) | 5.08 - 23.98 | 19.44 | ||||||||
| Employee transfer |
81,000 | 5.08 - 23.98 | 29.36 | |||||||||
| Forfeited |
(15,000 | ) | 23.98 | 23.98 | ||||||||
| Balance at December 31, 2010 |
1,914,922 | $ | 7.78 -$27.84 | $ | 19.02 | |||||||
72
Table of Contents
| Options Outstanding | Options Exercisable | Unvested Options | ||||||||||||||||||||||||||
| Range of exercise prices |
Number outstanding at Dec. 31, 2010 |
Weighted- average remaining term in years |
Weighted- average exercise price |
Number exercisable at Dec. 31, 2010 |
Weighted- average exercise price |
Number unvested at Dec. 31, 2010 |
Weighted- average exercise price |
|||||||||||||||||||||
| $7.78 - $9.49 |
610,682 | 1.5 | 8.55 | 610,682 | 8.55 | — | $ | — | ||||||||||||||||||||
| $10.07 - $19.37 |
255,774 | 4.6 | 18.44 | 178,280 | 18.04 | 77,494 | 19.37 | |||||||||||||||||||||
| $22.95 - $27.84 |
1,048,466 | 4.7 | 25.26 | 394,010 | 25.47 | 654,456 | 25.14 | |||||||||||||||||||||
| 1,914,922 | 3.7 | $ | 19.02 | 1,182,972 | $ | 15.62 | 731,950 | $ | 24.53 | |||||||||||||||||||
Restricted-share grants typically vest in equal installments over a three- or four-year period from the grant date. Transactions involving restricted shares under the terms of the LTSIP are summarized below:
| Restricted Shares Outstanding |
Price Range | Weighted- Average Price |
||||||||||
| Balance at January 1, 2008 |
541,892 | $ | 11.83 - $38.40 | $ | 26.79 | |||||||
| Granted |
226,140 | 17.03 - 47.53 | 36.57 | |||||||||
| Distributed |
(170,161 | ) | 11.83 - 38.40 | 23.32 | ||||||||
| Employee transfer |
(26,916 | ) | 17.28 - 47.53 | 32.06 | ||||||||
| Forfeited |
(866 | ) | 11.83 - 24.91 | 18.25 | ||||||||
| Balance at December 31, 2008 |
570,089 | 17.03 - 47.53 | 31.48 | |||||||||
| Granted |
204,250 | 19.86 - 25.00 | 23.80 | |||||||||
| Distributed |
(196,066 | ) | 17.03 - 47.53 | 27.03 | ||||||||
| Employee transferred |
966 | 17.28 - 36.48 | 29.75 | |||||||||
| Forfeited |
(29,854 | ) | 23.88 - 42.36 | `32.31 | ||||||||
| Balance at December 31, 2009 |
549,385 | 17.03 - 47.53 | 30.16 | |||||||||
| Granted |
635,170 | 27.55 - 35.54 | 28.70 | |||||||||
| Distributed |
(254,170 | ) | 17.03 - 47.53 | 29.08 | ||||||||
| Employee transferred |
61,919 | 22.95 - 42.71 | 22.97 | |||||||||
| Forfeited |
(25,343 | ) | 22.59 - 47.53 | 29.26 | ||||||||
| Balance at December 31, 2010 |
966,961 | $ | 17.03 - $47.28 | $ | 29.05 | |||||||
As of December 31, 2010, $17.8 million of compensation cost related to unvested restricted shares granted under the LTSIP remained to be recognized. The cost is expected to be recognized over a weighted-average period of 18 months.
At the time of the Spin-off, all outstanding options and restricted stock were bifurcated. QEP assumed responsibility for expensing approximately 819,000 unvested Questar stock option shares with a weighted-average price of $11.43 per share and approximately 614,000 unvested Questar restricted shares with a weighted-average price of $13.73 per share. QEP will recognize expense in future periods for these unvested share-based awards.
Note 13 – Employee Benefits
Defined Benefit Pension Plans and Other Postretirement Benefits
In association with the Spin-off, the Company established defined-benefit pension and postretirement medical plans providing coverage to approximately one-quarter of its employees. QEP only retained active employees and all retired employees remained participants in Questar’s retirement plans. On the Distribution Date, Questar transferred certain assets and liabilities from its defined-benefit pension and postretirement medical plans related to QEP employees into QEP’s newly established plans. The transfer resulted in the establishment of liabilities of
73
Table of Contents
$38.7 million related to the unfunded portions of the defined-benefit pension plans and other postretirement benefits with corresponding amounts in AOCI. During the third quarter of 2010, the liabilities related to the defined-benefit pension and other postretirement benefit plans were increased by approximately $16.2 million due to changes in the actuarial assumptions, including the discount rate and future benefit payments, used in estimating future benefits under the plans. These changes have been reflected in other long-term liabilities, deferred income taxes and accumulated other comprehensive income.
The Company’s Employee Benefits Committee (EBC) has oversight over investment of retirement-plan assets. The EBC uses a third-party asset manager to assist in setting targeted-policy ranges for the allocation of assets among various investment categories. The majority of retirement-benefit assets were invested as follows:
| Actual Allocation | Target Allocation | |||||||
| Year Ended December 31, | ||||||||
| 2010 | 2010 | |||||||
| Total domestic equity securities |
40 | % | 40 | % | ||||
| Foreign equity securities |
||||||||
| Developed market foreign equity securities |
25 | % | 25 | % | ||||
| Emerging market foreign equity securities |
5 | % | 5 | % | ||||
| Total foreign securities |
30 | % | 30 | % | ||||
| Debt securities |
||||||||
| Investment grade intermediate term debt |
15 | % | 15 | % | ||||
| Investment grade long-term debt |
15 | % | 15 | % | ||||
| Total debt securities |
30 | % | 30 | % | ||||
| Cash and short-term investments |
— | % | — | % | ||||
At the end of 2010, approximately two-thirds of the domestic equity assets were invested in a stock index fund, and one-third was invested in an actively managed product. Together, the goal of these investments is to be diversified, while representative of the whole U.S. stock market. Developed market foreign equity assets were invested in a fund that holds a diversified portfolio of common stocks of corporations in developed countries outside the United States. These investments are benchmarked against the Morgan Stanley Capital International Europe Australasia and Far East (or MSCI EAFE) index (net of dividends). Emerging market foreign equity assets are invested in a fund that holds a diversified portfolio of common stocks of corporations in emerging countries outside the United States. This investment is benchmarked against the MSCI EAFE Emerging Markets index (net of dividends). Investment grade intermediate-term debt assets are invested in funds holding a diversified portfolio of debt of governments, corporations and mortgage borrowers with average maturities of 5 to 10 years and investment grade credit ratings. The investments are benchmarked against the Barclay’s Aggregate Bond index. Investment grade long-term debt assets are invested in a diversified portfolio of debt of corporate and non-corporate issuers, with an average maturity of more than ten years and investment grade credit ratings. These assets are benchmarked against the Barclay’s Capital U.S. Long Credit Bond Index. Although there is not a policy target allocation to cash or short-term investments, cash may be held from time to time if deemed necessary for operational aspects of the retirement plan. Is such cases, cash is invested in a high-quality, short-term temporary investment fund that purchases investment-grade quality short-term debt issued by governments and corporations.
The EBC allocates pension-plan assets among broad asset categories and reviews the asset allocation at least annually. Asset-allocation decisions consider risk and return, future-benefit requirements, participant growth and other expected cash flows. These characteristics affect the level, risk and expected growth of postretirement-benefit assets. The EBC uses asset-mix guidelines that include targets for each asset category, return objectives for each asset group and the desired level of diversification and liquidity. These guidelines may change from time to time based on the committee’s ongoing evaluation of each plan’s risk tolerance. The EBC estimates an
74
Table of Contents
expected overall long-term rate of return on assets by weighting expected returns of each asset class by its targeted asset allocation percentage. Expected return estimates are developed from analysis of past performance and forecasts of long-term return expectations by third-parties.
Responsibility for individual security selection rests with each investment manager, who is subject to guidelines specified by the EBC. These guidelines are designed to ensure consistency with overall plan objectives. The EBC made the decision to invest all of the retirement plan assets in commingled funds as these funds typically have lower expense ratios and are more tax efficient than mutual funds. While commingled funds are classified as Level 3 assets because there are calculations involved in determining the net asset value of the funds, the underlying assets can be traced back to observable asset values and these commingled funds are audited annually by an independent accounting firm.
The EBC sets performance objectives for each investment manager that are expected to be met over a three-year period or a complete market cycle, whichever is shorter. Performance and risk levels are regularly monitored to confirm policy compliance and that results are within expectations.
Pension-plan guidelines prohibit transactions between a fiduciary and parties in interest unless specifically provided for in ERISA. No restricted securities, such as letter stock or private placements, may be purchased for any investment fund. QEP securities may be considered for purchase at an investment manager’s discretion, but within limitations prescribed by ERISA and other laws. There was no direct investment in QEP shares for the periods disclosed. Use of derivative securities by any investment managers is prohibited except where the committee has given specific approval or where commingled funds are utilized that have previously adopted permitting guidelines.
The fair value measurement provision of ASC 820 “Fair Value Measurements and Disclosures” defines fair value in applying generally accepted accounting principles as well as establishes a framework for measuring fair value and for making disclosures about fair-value measurements. Fair value measurement establishes a fair-value hierarchy. Level 1 inputs are unadjusted quoted prices in active markets for identical assets or liabilities that are accessible at the measurement date. Level 2 inputs are inputs other than quoted prices included within Level 1 that are observable for an asset, either directly or indirectly. Level 3 inputs are unobservable inputs for an asset. Following is a description of the valuation methodologies used at December 31, 2010 used to value pension and post retirement assets at December 31, 2010.
Commingled funds: These investments are public investment vehicles valued using the net asset value (NAV) of the fund. The NAV is based on the value of the underlying assets owned by the fund excluding transaction costs, and minus liabilities.
The following table sets forth by level, within the fair value hierarchy, the fair value of pension and postretirement benefit assets.
| Investments at Fair Value | ||||||||||||||||
| December 31, 2010 | ||||||||||||||||
| Level 1 | Level 2 | Level 3 | Total | |||||||||||||
| (in millions) | ||||||||||||||||
| Commingled funds |
$ | — | $ | — | $ | 30.9 | $ | 30.9 | ||||||||
| Total |
$ | — | $ | — | $ | 30.9 | $ | 30.9 | ||||||||
75
Table of Contents
| Change in the Fair Value of Level 3 Investments | ||||||||
| 2010 | ||||||||
| Commingled Funds | Total Level 3 | |||||||
| (in millions) | ||||||||
| Balance at January 1, |
$ | — | $ | — | ||||
| Transfer due to Spin-off |
25.2 | 25.2 | ||||||
| Employer contributions |
1.6 | 1.6 | ||||||
| Unrealized gains and losses |
4.1 | 4.1 | ||||||
| Balance at December 31, |
$ | 30.9 | $ | 30.9 | ||||
Pension-plan benefits are based on the employee’s age at retirement, years of service and highest earnings in a consecutive 72 semimonthly pay period during the 10 years preceding retirement. QEP pension plans include a qualified and a nonqualified retirement plan. Postretirement health-care and life insurance benefits are provided only to employees hired before January 1, 1997. The Company pays a portion of the costs of health-care benefits determined by an employee’s years of service.
The pension projected-benefit obligation and postretirement benefit accumulated benefit obligation were measured using a 5.8% discount rate at December 31, 2010. Plan assets reflect the fair value of assets at December 31, 2010. The pension plans accumulated benefit obligation was $57.4 million at December 31, 2010. Plan obligations and fair value of plan assets are shown in the following table:
| Pension | Post Retirement Benefits |
|||||||
| 2010 | 2010 | |||||||
| (in millions) | ||||||||
| Change in benefit obligation |
||||||||
| Benefit obligation at January 1, |
$ | — | $ | — | ||||
| Service cost |
1.3 | 0.1 | ||||||
| Interest cost |
2.1 | 0.1 | ||||||
| Change in plan assumptions |
(1.1 | ) | (0.1 | ) | ||||
| Transfer due to Spin-off |
75.7 | 4.4 | ||||||
| Actuarial loss (gain) |
— | — | ||||||
| Benefit obligation at December 31, |
$ | 78.0 | $ | 4.5 | ||||
| Change in plan assets |
||||||||
| Fair value of plan assets at January 1, |
$ | — | $ | — | ||||
| Actual gain (loss) on plan assets |
4.1 | — | ||||||
| Company contributions to the plan |
1.6 | — | ||||||
| Transfer due to Spin-off |
25.2 | — | ||||||
| Fair value of plan assets at December 31, |
30.9 | — | ||||||
| Underfunded status (current and long-term) |
$ | (47.1 | ) | $ | (4.5 | ) | ||
76
Table of Contents
The projected 2011 pension funding is expected to be $11.9 million. Estimated benefit-plan payments for the five years following 2010 and the subsequent five years aggregated are as follows:
| Pension | Post Retirement Benefits |
|||||||
| (in millions) | ||||||||
| 2011 |
$ | 0.4 | $ | — | ||||
| 2012 |
0.9 | 0.1 | ||||||
| 2013 |
1.3 | 0.1 | ||||||
| 2014 |
1.8 | 0.1 | ||||||
| 2015 |
2.4 | 0.2 | ||||||
| 2016 through 2020 |
$ | 22.6 | $ | 1.4 | ||||
The components of pension and post retirement benefits expense are as follows. The pension expense includes costs of both qualified and nonqualified pension plans:
| Pension | Post Retirement Benefits |
|||||||
| Year Ended December 31, | ||||||||
| 2010 | 2010 | |||||||
| (in millions) | ||||||||
| Service cost |
$ | 1.3 | $ | 0.1 | ||||
| Interest cost |
2.1 | 0.1 | ||||||
| Expected return on plan assets |
(1.0 | ) | — | |||||
| Amortization of prior service costs |
2.6 | 0.2 | ||||||
| Recognized net actuarial loss |
— | — | ||||||
| Periodic expense |
$ | 5.0 | $ | 0.4 | ||||
Assumptions at July 1, used to calculate pension and postretirement benefits expense for the years, were as follows:
| 2010 | ||||
| Discount rate |
5.70% | |||
| Rate of increase in compensation |
3.60% | |||
| Long-term return on assets |
7.50% | |||
| Health care inflation rate |
|
8.0% decreasing to 5.0% in 2013 |
| |
The 2011 estimated pension expense is $10.1 million. In 2011, $5.3 million of prior service cost for the pension plans will be amortized from AOCI. The 2011 estimated post-retirement expense is $0.8 million. In 2011, $0.4 million of prior service cost for the postretirement benefit plans will be amortized from AOCI.
Service costs and interest costs may be sensitive to changes in the health-care inflation rate. A 1% increase in the health-care inflation rate would increase the yearly service and interest costs and the accumulated postretirement-benefit obligation by negligible amounts. A 1% decrease in the health-care inflation rate would decrease the yearly service cost and interest cost and the accumulated postretirement-benefit obligation by negligible amounts.
Postretirement Benefits Other Than Pensions
Postretirement health care benefits and life insurance are provided only to employees hired before January 1, 1997. The Company has capped its exposure to increasing medical care and life insurance costs by paying a fixed dollar monthly contribution toward these retiree benefits. The Company contribution is prorated based on an
77
Table of Contents
employee’s years of service at retirement; only those employees with 25 or more years of service receive the maximum Company contribution. A third party consultant calculates the projected benefit obligation. The cost of postretirement benefits other than pensions was $0.4 million in 2010. At December 31, 2010, QEP’s accumulated benefit obligation exceeded the fair value of plan assets as the plan is unfunded.
Employee Investment Plan
QEP employees may participate in the QEP Employee Investment Plan (EIP). The EIP allows eligible employees to purchase shares of QEP common stock or other investments through payroll deduction at the current fair market value on the transaction date. The Company currently contributes an overall match of 100% of employees’ contribution up to a maximum of 6% of their qualifying earnings. The EIP trustee purchases QEP shares on the open market with cash received. The Company recognizes expense equal to its yearly contributions, which amounted to $4.2 million in 2010.
78
Table of Contents
Note 14 – Operations by Line of Business
QEP’s lines of business include gas and oil exploration and production (QEP Energy), midstream field services (QEP Field Services) and marketing (QEP Marketing). Line of business information is presented according to senior management’s basis for evaluating performance including differences in the nature of products, services and regulation. Following is a summary of operations by line of business for the three years ended December 31, 2010:
| QEP Consolidated |
Interco Transactions |
QEP Energy |
QEP Field Services |
QEP Marketing & Other |
Separation & Extinguishment |
|||||||||||||||||||
| (in millions) | ||||||||||||||||||||||||
| 2010 | ||||||||||||||||||||||||
| Revenues |
||||||||||||||||||||||||
| From unaffiliated customers |
$ | 2,246.4 | $ | — | $ | 1,330.8 | $ | 316.8 | $ | 598.8 | $ | — | ||||||||||||
| From affiliated companies |
(502.1 | ) | — | 2.4 | 499.7 | |||||||||||||||||||
| Total Revenues |
2,246.4 | (502.1 | ) | 1,330.8 | 319.2 | 1,098.5 | — | |||||||||||||||||
| Operating expenses |
||||||||||||||||||||||||
| Marketing purchases |
589.3 | (493.5 | ) | — | — | 1,082.8 | — | |||||||||||||||||
| Lease operating expense, gathering, processing and other |
208.2 | (2.3 | ) | 127.3 | 82.1 | 1.1 | — | |||||||||||||||||
| General and administrative |
107.2 | (6.3 | ) | 78.0 | 31.6 | 3.9 | — | |||||||||||||||||
| Separation costs |
13.5 | — | — | — | — | 13.5 | ||||||||||||||||||
| Production and property taxes |
82.5 | — | 77.8 | 4.4 | 0.3 | — | ||||||||||||||||||
| Depreciation, depletion and amortization |
643.4 | — | 592.5 | 48.9 | 2.0 | — | ||||||||||||||||||
| Other operating expenses |
69.1 | — | 69.1 | — | — | — | ||||||||||||||||||
| Total operating expenses |
1,713.2 | (502.1 | ) | 944.7 | 167.0 | 1,090.1 | 13.5 | |||||||||||||||||
| Net gain (loss) from asset sales |
12.1 | — | 13.7 | (1.6 | ) | — | — | |||||||||||||||||
| Operating income |
545.3 | — | 399.8 | 150.6 | 8.4 | (13.5 | ) | |||||||||||||||||
| Interest and other income |
2.3 | (87.1 | ) | 2.1 | 0.1 | 87.2 | — | |||||||||||||||||
| Income from unconsolidated affiliates |
3.0 | — | 0.2 | 2.8 | — | — | ||||||||||||||||||
| Loss on early extinguishment of debt |
(13.3 | ) | — | — | — | — | (13.3 | ) | ||||||||||||||||
| Interest expense |
(84.4 | ) | 87.1 | (78.5 | ) | (7.6 | ) | (85.4 | ) | — | ||||||||||||||
| Income tax expense |
(167.0 | ) | — | (119.7 | ) | (51.9 | ) | (3.5 | ) | 8.1 | ||||||||||||||
| Income from continuing operations |
285.9 | — | 203.9 | 94.0 | 6.7 | (18.7 | ) | |||||||||||||||||
| Income from continuing operations attributable to noncontrolling interest |
(2.9 | ) | — | — | (2.9 | ) | — | — | ||||||||||||||||
| Income from continuing operations attributable to QEP |
$ | 283.0 | — | $ | 203.9 | $ | 91.1 | $ | 6.7 | $ | (18.7 | ) | ||||||||||||
| Adjusted EBITDA(1) |
$ | 1,140.5 | — | $ | 926.2 | $ | 203.9 | $ | 10.4 | |||||||||||||||
| Identifiable assets |
6,785.3 | — | 5,391.9 | 1,197.5 | 195.9 | |||||||||||||||||||
| Investment in unconsolidated affiliates |
44.5 | — | — | 44.5 | — | |||||||||||||||||||
| Cash capital expenditures |
1,469.0 | — | 1,205.0 | 262.1 | 1.9 | |||||||||||||||||||
| Accrued capital expenditures |
1,485.9 | — | 1,215.8 | 268.2 | 1.9 | |||||||||||||||||||
| Goodwill |
59.6 | — | 59.6 | — | — | |||||||||||||||||||
79
Table of Contents
| QEP Consolidated |
Interco Transactions |
QEP Energy |
QEP Field Services |
QEP Marketing & Other |
||||||||||||||||
| (in millions) | ||||||||||||||||||||
| 2009 | ||||||||||||||||||||
| Revenues |
||||||||||||||||||||
| From unaffiliated customers |
$ | 1,972.5 | $ | — | $ | 1,267.3 | $ | 262.7 | $ | 442.5 | ||||||||||
| From affiliated companies |
— | (370.0 | ) | — | 1.9 | 368.1 | ||||||||||||||
| Total Revenues |
1,972.5 | (370.0 | ) | 1,267.3 | 264.6 | 810.6 | ||||||||||||||
| Operating expenses |
||||||||||||||||||||
| Marketing purchases |
427.8 | (362.8 | ) | — | — | 790.6 | ||||||||||||||
| Lease operating expense, gathering, processing and other |
201.7 | (2.0 | ) | 127.5 | 75.0 | 1.2 | ||||||||||||||
| General and administrative |
91.7 | (5.2 | ) | 68.0 | 25.0 | 3.9 | ||||||||||||||
| Production and property taxes |
62.9 | — | 58.3 | 4.6 | — | |||||||||||||||
| Depreciation, depletion and amortization |
559.1 | — | 512.8 | 44.3 | 2.0 | |||||||||||||||
| Other operating expenses |
45.3 | — | 45.3 | — | — | |||||||||||||||
| Total operating expenses |
1,388.5 | (370.0 | ) | 811.9 | 148.9 | 797.7 | ||||||||||||||
| Net gain (loss) from asset sales |
1.5 | — | 1.6 | (0.1 | ) | — | ||||||||||||||
| Operating income |
585.5 | — | 457.0 | 115.6 | 12.9 | |||||||||||||||
| Interest and other income |
(185.1 | ) | (70.7 | ) | (185.7 | ) | (0.2 | ) | 71.5 | |||||||||||
| Income from unconsolidated affiliates |
2.7 | — | 0.1 | 2.6 | — | |||||||||||||||
| Interest expense |
(70.1 | ) | 70.7 | (63.9 | ) | (6.0 | ) | (70.9 | ) | |||||||||||
| Income tax expense |
(117.6 | ) | — | (72.6 | ) | (40.0 | ) | (5.0 | ) | |||||||||||
| Income from continuing operations |
215.4 | — | 134.9 | 72.0 | 8.5 | |||||||||||||||
| Income from continuing operations attributable to noncontrolling interest |
(2.6 | ) | — | — | (2.6 | ) | — | |||||||||||||
| Income from continuing operations attributable to QEP |
$ | 212.8 | — | $ | 134.9 | $ | 69.4 | $ | 8.5 | |||||||||||
| Adjusted EBITDA(1) |
$ | 1,165.5 | — | $ | 988.0 | $ | 162.6 | $ | 14.9 | |||||||||||
| Identifiable assets |
5,828.9 | — | 4,633.0 | 929.2 | 266.7 | |||||||||||||||
| Investment in unconsolidated affiliates |
43.9 | — | — | 43.9 | — | |||||||||||||||
| Cash capital expenditures |
1,198.4 | — | 1,108.6 | 88.3 | 1.5 | |||||||||||||||
| Accrued capital expenditures |
1,108.4 | — | 1,033.7 | 73.3 | 1.4 | |||||||||||||||
| Goodwill |
60.1 | 60.1 | ||||||||||||||||||
80
Table of Contents
| QEP Consolidated |
Interco Transactions |
QEP Energy |
QEP Field |
QEP Marketing & |
||||||||||||||||
| 2008 | ||||||||||||||||||||
| Revenues |
||||||||||||||||||||
| From unaffiliated customers |
$ | 2,318.8 | — | $ | 1,392.1 | $ | 288.8 | $ | 637.9 | |||||||||||
| From affiliated companies |
— | $ | (806.1 | ) | — | 1.4 | 804.7 | |||||||||||||
| Total Revenues |
2,318.8 | (806.1 | ) | 1,392.1 | 290.2 | 1,442.6 | ||||||||||||||
| Operating expenses |
||||||||||||||||||||
| Marketing purchases |
604.6 | (800.3 | ) | 0.5 | 1,404.4 | |||||||||||||||
| Lease operating expense, gathering, processing and other |
220.2 | (1.4 | ) | 125.4 | 95.0 | 1.2 | ||||||||||||||
| General and administrative |
78.1 | (4.4 | ) | 55.8 | 23.7 | 3.0 | ||||||||||||||
| Production and property taxes |
106.9 | — | 104.0 | 2.6 | 0.3 | |||||||||||||||
| Depreciation, depletion and amortization |
361.5 | — | 330.9 | 28.7 | 1.9 | |||||||||||||||
| Other operating expenses |
74.7 | — | 73.9 | 0.8 | — | |||||||||||||||
| Total operating expenses |
1,446.0 | (806.1 | ) | 690.5 | 150.8 | 1,410.8 | ||||||||||||||
| Net gain (loss) from asset sales |
60.4 | — | 60.4 | |||||||||||||||||
| Operating income |
933.2 | — | 762.0 | 139.4 | 31.8 | |||||||||||||||
| Interest and other income |
(69.0 | ) | (66.4 | ) | (71.7 | ) | — | 69.1 | ||||||||||||
| Income from unconsolidated affiliates |
1.7 | — | 0.5 | 1.2 | — | |||||||||||||||
| Interest expense |
(61.7 | ) | 66.4 | (58.3 | ) | (3.6 | ) | (66.2 | ) | |||||||||||
| Income tax expense |
(283.6 | ) | — | (224.5 | ) | (46.5 | ) | (12.6 | ) | |||||||||||
| Income from continuing operations |
520.6 | — | $ | 408.0 | 90.5 | 22.1 | ||||||||||||||
| Income from continuing operations attributable to noncontrolling interest |
(9.0 | ) | — | — | (9.0 | ) | — | |||||||||||||
| Income from continuing operations attributable to QEP |
$ | 511.6 | — | $ | 408.0 | $ | 81.5 | $ | 22.1 | |||||||||||
| Adjusted EBITDA(1) |
$ | 1,310.7 | — | $ | 1,106.9 | $ | 170.1 | $ | 33.7 | |||||||||||
| Identifiable assets |
5,741.0 | — | 4,516.2 | 918.5 | 306.3 | |||||||||||||||
| Investment in unconsolidated affiliates |
40.8 | — | 40.8 | |||||||||||||||||
| Cash capital expenditures |
2,136.7 | — | 1,777.3 | 357.9 | 1.5 | |||||||||||||||
| Accrued capital expenditures |
2,230.5 | — | 1,855.9 | 373.0 | 1.6 | |||||||||||||||
| Goodwill |
60.2 | — | 60.2 | |||||||||||||||||
| (1) | Adjusted EBITDA is an important non-GAAP measure that is further described in Item 6 of Part II of this Annual Report on Form 10-K. |
81
Table of Contents
Note 15 – Quarterly Financial Information (Unaudited)
Following is a summary of unaudited quarterly financial information:
| First Quarter |
Second Quarter |
Third Quarter |
Fourth Quarter |
Year | ||||||||||||||||
| (in millions, except per share information) | ||||||||||||||||||||
| 2010 | ||||||||||||||||||||
| Revenues |
$ | 580.2 | $ | 529.6 | $ | 564.6 | $ | 572.0 | $ | 2,246.4 | ||||||||||
| Operating income |
142.9 | 127.6 | 149.3 | 125.5 | 545.3 | |||||||||||||||
| Income from continuing operations |
78.7 | 69.5 | 71.9 | 65.8 | 285.9 | |||||||||||||||
| Discontinued operations, net of tax |
21.2 | 22.0 | — | — | 43.2 | |||||||||||||||
| Net income attributable to QEP |
99.3 | 90.8 | 71.1 | 65.0 | 326.2 | |||||||||||||||
| Per share information attributable to QEP |
||||||||||||||||||||
| Basic EPS from continuing operations |
$ | 0.45 | $ | 0.39 | $ | 0.40 | $ | 0.37 | $ | 1.61 | ||||||||||
| Basic EPS attributable to QEP |
0.57 | 0.52 | 0.40 | 0.37 | 1.86 | |||||||||||||||
| Diluted EPS from continuing operations |
0.44 | 0.39 | 0.40 | 0.37 | 1.60 | |||||||||||||||
| Diluted EPS attributable to QEP |
0.56 | 0.51 | 0.40 | 0.37 | 1.84 | |||||||||||||||
| 2009 | ||||||||||||||||||||
| Revenues |
$ | 482.1 | $ | 442.7 | $ | 487.9 | $ | 559.8 | $ | 1,972.5 | ||||||||||
| Operating income |
155.1 | 118.6 | 147.4 | 164.4 | 585.5 | |||||||||||||||
| Income from continuing operations |
2.4 | 45.5 | 72.0 | 95.5 | 215.4 | |||||||||||||||
| Discontinued operations, net of tax |
18.8 | 19.8 | 20.6 | 21.5 | 80.7 | |||||||||||||||
| Net income attributable to QEP |
20.7 | 64.7 | 92.0 | 116.1 | 293.5 | |||||||||||||||
| Per share information attributable to QEP |
||||||||||||||||||||
| Basic EPS from continuing operations |
$ | 0.01 | $ | 0.26 | $ | 0.41 | $ | 0.55 | $ | 1.23 | ||||||||||
| Basic EPS attributable to QEP |
0.12 | 0.37 | 0.53 | 0.67 | 1.69 | |||||||||||||||
| Diluted EPS from continuing operations |
0.01 | 0.26 | 0.40 | 0.54 | 1.21 | |||||||||||||||
| Diluted EPS attributable to QEP |
0.12 | 0.37 | 0.52 | 0.66 | 1.67 | |||||||||||||||
Note 16 – Supplemental Gas and Oil Information (Unaudited)
The Company is making the following supplemental disclosures of gas and oil producing activities, in accordance with ASC 932 “Extractive Activities – Oil and Gas” as amended by ASU 2010-03 “Oil and Gas Reserve Estimation and Disclosures” and SEC Regulation S-X.
The Company uses the successful efforts accounting method for its gas and oil exploration and development activities. All properties are located in the United States.
Capitalized Costs
The aggregate amounts of costs capitalized for gas and oil exploration and development activities and the related amounts of accumulated depreciation, depletion and amortization are shown below:
| December 31, | ||||||||
| 2010 | 2009 | |||||||
| (in millions) | ||||||||
| Proved properties |
$ | 6,874.3 | $ | 5,721.5 | ||||
| Unproved properties |
322.0 | 389.6 | ||||||
| 7,196.3 | 6,111.1 | |||||||
| Accumulated depreciation, depletion and amortization |
(2,454.4 | ) | (1,890.9 | ) | ||||
| Net capitalized costs |
$ | 4,741.9 | $ | 4,220.2 | ||||
82
Table of Contents
Costs Incurred
The costs incurred in gas and oil exploration and development activities are displayed in the table below. Development costs incurred reflect accrued capital costs of $10.8 million and ARO expenses of $15.2 million in 2010. The costs incurred to develop proved undeveloped reserves were $434.2 million in 2010, $216.1 million in 2009 and $219.9 million in 2008.
| Year Ended December 31, | ||||||||||||
| 2010 | 2009 | 2008 | ||||||||||
| (in millions) | ||||||||||||
| Property acquisition |
||||||||||||
| Unproved |
$ | 109.1 | $ | 215.1 | $ | 167.3 | ||||||
| Proved |
0.2 | 6.4 | 602.7 | |||||||||
| Exploration (capitalized and expensed) |
146.4 | 92.9 | 58.7 | |||||||||
| Development |
988.8 | 741.1 | 1,061.2 | |||||||||
| Total costs incurred |
$ | 1,244.5 | $ | 1,055.5 | $ | 1,889.9 | ||||||
Results of Operations
Following are the results of operations of QEP Energy gas and oil exploration and development activities, before allocated corporate overhead and interest expenses.
| Year Ended December 31, | ||||||||||||
| 2010 | 2009 | 2008 | ||||||||||
| (in millions) | ||||||||||||
| Revenues |
$ | 1,330.8 | $ | 1,267.3 | $ | 1,392.1 | ||||||
| Production costs |
205.1 | 185.8 | 229.4 | |||||||||
| Exploration expenses |
23.0 | 25.0 | 29.3 | |||||||||
| Depreciation, depletion and amortization |
592.5 | 512.8 | 330.9 | |||||||||
| Abandonment and impairment |
46.1 | 20.3 | 44.6 | |||||||||
| Total expenses |
866.7 | 743.9 | 634.2 | |||||||||
| Revenues less expenses |
464.1 | 523.4 | 757.9 | |||||||||
| Income taxes |
(171.8 | ) | (183.2 | ) | (269.1 | ) | ||||||
| Results of operation from producing activities excluding allocated corporate overhead and interest expenses |
$ | 292.3 | $ | 340.2 | $ | 488.8 | ||||||
Estimated Quantities of Proved Gas and Oil Reserves
Estimates of proved gas and oil reserves have been completed in accordance with professional engineering standards and the Company’s established internal controls, which includes the compliance oversight of a multi-functional reserves review committee responsible to the Company’s board of directors. QEP Energy’s estimated proved reserves have been prepared by Ryder Scott Company, L.P., independent reservoir engineering consultants, in accordance with the SEC’s Regulation S-X and ASC 932 as amended. The individuals performing reserves estimates possess professional qualifications and demonstrate competency in reserves estimation and evaluation.
83
Table of Contents
| Natural Gas | Oil and NGL | Natural Gas Equivalents |
||||||||||
| (Bcf) | (MMbbl) | (Bcfe) | ||||||||||
| Proved Reserves |
||||||||||||
| Balance at January 1, 2008 |
1,668.5 | 33.2 | 1,867.6 | |||||||||
| Revisions - |
||||||||||||
| Previous estimates |
(128.5 | ) | (4.0 | ) | (152.9 | ) | ||||||
| Pinedale increased-density(1) |
154.5 | 1.2 | 161.8 | |||||||||
| Extensions and discoveries |
208.0 | 5.2 | 239.1 | |||||||||
| Purchase of reserves in place |
289.8 | 0.4 | 292.4 | |||||||||
| Sale of reserves in place |
(11.9 | ) | (1.1 | ) | (18.5 | ) | ||||||
| Production |
(151.9 | ) | (3.3 | ) | (171.4 | ) | ||||||
| Balance at December 31, 2008 |
2,028.5 | 31.6 | 2,218.1 | |||||||||
| Revisions— previous estimates |
(318.9 | ) | 3.4 | (298.8 | ) | |||||||
| Extensions and discoveries(1) |
982.4 | 5.4 | 1,014.6 | |||||||||
| Purchase of reserves in place |
1.7 | 0.1 | 2.5 | |||||||||
| Sale of reserves in place |
— | — | — | |||||||||
| Production |
(168.7 | ) | (3.5 | ) | (189.5 | ) | ||||||
| Balance at December 31, 2009 |
2,525.0 | 37.0 | 2,746.9 | |||||||||
| Revisions—previous estimates |
46.3 | 5.4 | 78.6 | |||||||||
| Extensions and discoveries(1) |
248.4 | 32.2 | 441.8 | |||||||||
| Purchase of reserves in place |
0.2 | — | 0.2 | |||||||||
| Sale of reserves in place |
(3.2 | ) | (0.8 | ) | (7.8 | ) | ||||||
| Production |
(203.8 | ) | (4.2 | ) | (229.0 | ) | ||||||
| Balance at December 31, 2010 |
2,612.9 | 69.6 | 3,030.7 | |||||||||
| Proved Developed Reserves |
||||||||||||
| Balance at January 1, 2008 |
987.4 | 26.7 | 1,147.4 | |||||||||
| Balance at December 31, 2008 |
1,128.1 | 23.6 | 1,269.4 | |||||||||
| Balance at December 31, 2009 |
1,178.7 | 27.4 | 1,342.8 | |||||||||
| Balance at December 31, 2010 |
1,404.8 | 34.4 | 1,611.5 | |||||||||
| Proved Undeveloped Reserves |
||||||||||||
| Balance at January 1, 2008 |
681.1 | 6.5 | 720.2 | |||||||||
| Balance at December 31, 2008 |
900.4 | 8.0 | 948.7 | |||||||||
| Balance at December 31, 2009 |
1,346.3 | 9.6 | 1,404.1 | |||||||||
| Balance at December 31, 2010 |
1,208.1 | 35.2 | 1,419.2 | |||||||||
| (1) | Estimates of the quantity of proved reserves from the Company’s Pinedale Anticline leasehold in western Wyoming have changed substantially over time as a result of numerous factors including, but not limited to, additional development drilling activity, producing well performance and the development and application of reliable technologies. The continued analysis of new data has led to progressive increases in estimates of original gas-in-place at Pinedale and to a better understanding of the appropriate well density to maximize the economic recovery of the in-place volumes. With the application of the amendments of ASC 932 in ASU 2010-03, reserves associated with Pinedale increased density drilling are included in extensions and discoveries for the years ended December 31, 2010 and 2009, because each new well drilled recovers incremental reserves that would otherwise be unrecoverable. |
84
Table of Contents
| 2010 | ||||
| (Bcfe) | ||||
| Proved undeveloped reserves at January 1, |
1,404.1 | |||
| Transferred to proved developed reserves |
(256.3 | ) | ||
| Revisions-previous estimates |
12.1 | |||
| Extensions and discoveries(1) |
259.3 | |||
| Proved undeveloped reserves at December 31,(2) |
1,419.2 | |||
| (1)) | Extensions and discoveries include 139 Bcfe resulting from the application of the amendments of ASC 932 in ASU 2010-03 relative to booking proved undeveloped reserves for locations more than one location away from an existing producing well when reliable technology can be demonstrated. Such additions are based on empirical data including subsurface well control, long-term well performance, pressure testing and pressure studies, core data, and ongoing pilot programs of increased density development, which have confirmed with reasonable certainty the areal extent and continuity of the subject hydrocarbon accumulations. The Company routinely applies multi-stage hydraulic fracture stimulation technology and in some instances horizontal drilling combined with multi-stage fracture stimulation technology in development of its reserves. Empirical data has also been incorporated in detailed reservoir models supported by three dimensional seismic data and numerical simulation studies to further corroborate such conclusions. |
| (2) | All of QEP Energy’s proved undeveloped reserves at December 31, 2010, are scheduled to be developed within five years from the date such locations were initially disclosed as proved undeveloped reserves, except for 458 Bcfe located within the northern portion of the Company’s Pinedale Anticline leasehold in western Wyoming. As discussed in Item 7 of Part I of this Report on Form 10-K, long-term development of natural gas reserves in the PAPA is governed by the BLM’s September 2008, ROD on the FSEIS. Under the ROD, QEP Energy is allowed to drill and complete wells year-round in designated concentrated development areas defined in the PAPA. The ROD contains additional requirements and restrictions on the sequence of development of the PAPA, which requires the Company to develop its leasehold from the south to the north. These restrictions result in protracted, phased development of the PAPA that is beyond the control of the Company. The Company has an ongoing development plan for the PAPA and the financial capability to continue development in the manner estimated. |
Standardized Measure of Future Net Cash Flows Relating to Proved Reserves
Future net cash flows were calculated at December 31, 2010 and 2009 by applying prices, which were the simple average of the first-of-the-month prices for the 12-months of 2010 and 2009 with consideration of known contractual price changes. Future net cash flow calculations for years prior to 2009 used year-end prices and known contract-price changes. The prices used do not include any impact of QEP’s commodity derivative portfolio. The average price per Mcf used to calculate proved natural gas reserves was $3.85 in 2010, $3.06 in 2009 and $4.62 in 2008. The aggregate average price per barrel of proved oil and NGL reserves used to calculate reserves was $59.23 in 2010, $45.54 in 2009 and $28.41 in 2008. Year-end operating expenses, development costs and appropriate statutory income tax rates, with consideration of future tax rates, were used to compute the future net cash flows. All cash flows were discounted at 10% to reflect the time value of cash flows, without regard to the risk of specific properties. The estimated future costs to develop booked proved undeveloped reserves are $534.3 million in 2011, $490.4 million in 2012 and $491.2 million in 2013. At the end of the five-year period ending December 31, 2015, the Company expects to have evaluated 100% of the current booked proved undeveloped reserves.
The assumptions used to derive the standardized measure of future net cash flows are those required by accounting standards and do not necessarily reflect the Company’s expectations. The information may be useful for certain comparative purposes, but should not be solely relied upon in evaluating QEP or its performance. Furthermore, information contained in the following table may not represent realistic assessments of future cash flows, nor should the standardized measure of future net cash flows be viewed as representative of the current
85
Table of Contents
value of the Company’s reserves. Management believes that the following factors should be considered when reviewing the information below:
| • | Future commodity prices received for selling the Company’s net production will probably differ from those required to be used in these calculations. |
| • | Future operating and capital costs will probably differ from those required to be used in these calculations. |
| • | Future market conditions, government regulations and reservoir conditions may cause production rates in future years to vary significantly from those rates used in the calculations. |
| • | Future revenues may be subject to different production, severance and property taxation rates. |
| • | The selection of a 10% discount rate is arbitrary and may not be a reasonable factor in adjusting for future economic conditions or in considering the risk that is part of realizing future net cash flows from the reserves. |
The standardized measure of future net cash flows relating to proved reserves is presented in the table below:
| Year Ended December 31, | ||||||||||||
| 2010 | 2009 | 2008 | ||||||||||
| (in millions) | ||||||||||||
| Future cash inflows |
$ | 14,174.8 | $ | 9,419.3 | $ | 10,263.4 | ||||||
| Future production costs |
(3,701.8 | ) | (2,841.8 | ) | (2,717.6 | ) | ||||||
| Future development costs |
(2,275.9 | ) | (2,252.7 | ) | (1,884.0 | ) | ||||||
| Future income tax expenses |
(1,957.6 | ) | (674.0 | ) | (1,241.3 | ) | ||||||
| Future net cash flows |
6,239.5 | 3,650.8 | 4,420.5 | |||||||||
| 10% annual discount for estimated timing of net cash flows |
(3,533.9 | ) | (2,207.8 | ) | (2,418.6 | ) | ||||||
| Standardized measure of discounted future net cash flows |
$ | 2,705.6 | $ | 1,443.0 | $ | 2,001.9 | ||||||
The principal sources of change in the standardized measure of future net cash flows relating to proved reserves is presented in the table below:
| Year Ended December 31, | ||||||||||||
| 2010 | 2009 | 2008 | ||||||||||
| (in millions) | ||||||||||||
| Balance at January 1, |
$ | 1,443.0 | $ | 2,001.9 | $ | 2,834.0 | ||||||
| Sales of gas and oil produced during the period, net of production costs |
(1,125.7 | ) | (1,081.5 | ) | (1,162.7 | ) | ||||||
| Net change in prices and production costs related to future production |
1,775.8 | (813.1 | ) | (1,306.1 | ) | |||||||
| Net change due to extensions and discoveries |
789.1 | 1,291.6 | 438.7 | |||||||||
| Net change due to revisions of quantity estimates |
140.4 | (380.4 | ) | 16.3 | ||||||||
| Net change due to purchases and sales of reserves in place |
(25.8 | ) | 6.4 | 499.9 | ||||||||
| Previously estimated development costs incurred during the period |
434.2 | 216.1 | 219.9 | |||||||||
| Changes in future development costs |
(325.4 | ) | (347.4 | ) | (662.6 | ) | ||||||
| Accretion of discount |
170.9 | 256.4 | 410.7 | |||||||||
| Net change in income taxes |
(582.4 | ) | 295.8 | 711.2 | ||||||||
| Other |
11.5 | (2.8 | ) | 2.6 | ||||||||
| Net change |
1,262.6 | (558.9 | ) | (832.1 | ) | |||||||
| Balance at December 31, |
$ | 2,705.6 | $ | 1,443.0 | $ | 2,001.9 | ||||||
86
Table of Contents
Financial Statement Schedule:
Schedule of Valuation and Qualifying Accounts
| Column A Description |
Column B Beginning Balance |
Column C Amounts charged to expense |
Column D Deductions for accounts written off and other |
Column E Ending Balance |
||||||||||||
| (in millions) | ||||||||||||||||
| Year-Ended December 31, 2010 |
||||||||||||||||
| Allowance for bad debts |
$ | 3.0 | $ | (0.3 | ) | $ | (0.4 | ) | $ | 2.3 | ||||||
| Year Ended December 31, 2009 |
||||||||||||||||
| Allowance for bad debts |
2.7 | 0.4 | (0.1 | ) | 3.0 | |||||||||||
| Year Ended December 31, 2008 |
||||||||||||||||
| Allowance for bad debts |
3.3 | 0.4 | (1.0 | ) | 2.7 | |||||||||||
ITEM 9. CHANGES IN AND DISAGREEMENTS WITH ACCOUNTANTS ON ACCOUNTING AND FINANCIAL DISCLOSURE
The Company has not changed its independent auditors or had any disagreement with them concerning accounting matters and financial statement disclosures within the last 24 months.
ITEM 9A. CONTROLS AND PROCEDURES
Evaluation of Disclosure Controls and Procedures
The Company’s Chief Executive Officer and Chief Financial Officer have evaluated the effectiveness of the Company’s disclosure controls and procedures (as such term is defined in Rules 13a-15(e) under the Securities Exchange Act of 1934, as amended, as of December 31, 2010. Based on such evaluation, such officers have concluded that, as of December 31, 2010, the Company’s disclosure controls and procedures are effective in alerting them on a timely basis to material information relating to the Company, including its consolidated subsidiaries, required to be included in the Company’s reports filed or submitted under the Exchange Act. The Company’s Chief Executive Officer and Chief Financial Officer also concluded that the controls and procedures were effective in ensuring that information required to be disclosed by the Company in the reports that it files or submits under the Exchange Act is accumulated and communicated to the Company’s management including its principal executive and financial officers or persons performing similar functions as appropriate to allow timely decisions regarding required disclosure.
Changes in Internal Controls
There were no changes in the Company’s internal controls over financial reporting that occurred during the quarter ended December 31, 2010, that have materially affected, or are reasonably likely to materially affect, the Company’s internal control over financial reporting.
Management’s Assessment of Internal Control Over Financial Reporting
QEP’s management is responsible for establishing and maintaining adequate internal control over financial reporting, as defined in Exchange Act Rule 13a-15(f). QEP’s management assessed the effectiveness of the Company’s internal control over financial reporting as of December 31, 2010. The criteria set forth by the Committee of Sponsoring Organizations of the Treadway Commission in Internal Control—Integrated Framework were used to make this assessment. We believe that the Company’s internal control over financial reporting as of December 31, 2010, is effective based on those criteria.
87
Table of Contents
The effectiveness of QEP’s internal control over financial reporting as of December 31, 2010, has been audited by Ernst & Young LLP, an independent registered public accounting firm, as stated in their report as follows:
Report of Independent Registered Public Accounting Firm
The Board of Directors and Shareholders of
QEP Resources, Inc.
We have audited QEP Resources, Inc.’s internal control over financial reporting as of December 31, 2010, based on criteria established in Internal Control – Integrated Framework issued by the Committee of Sponsoring Organizations of the Treadway Commission (the COSO criteria). QEP Resources, Inc.’s management is responsible for maintaining effective internal control over financial reporting, and for its assessment of the effectiveness of internal control over financial reporting included in the accompanying Management’s Assessment of Internal Control Over Financial Reporting. Our responsibility is to express an opinion on the company’s internal control over financial reporting based on our audit.
We conducted our audit in accordance with the standards of the Public Company Accounting Oversight Board (United States). Those standards require that we plan and perform the audit to obtain reasonable assurance about whether effective internal control over financial reporting was maintained in all material respects. Our audit included obtaining an understanding of internal control over financial reporting, assessing the risk that a material weakness exists, testing and evaluating the design and operating effectiveness of internal control based on the assessed risk, and performing such other procedures as we considered necessary in the circumstances. We believe that our audit provides a reasonable basis for our opinion.
A company’s internal control over financial reporting is a process designed to provide reasonable assurance regarding the reliability of financial reporting and the preparation of financial statements for external purposes in accordance with generally accepted accounting principles. A company’s internal control over financial reporting includes those policies and procedures that (1) pertain to the maintenance of records that, in reasonable detail, accurately and fairly reflect the transactions and dispositions of the assets of the company; (2) provide reasonable assurance that transactions are recorded as necessary to permit preparation of financial statements in accordance with generally accepted accounting principles, and that receipts and expenditures of the company are being made only in accordance with authorizations of management and directors of the company; and (3) provide reasonable assurance regarding prevention or timely detection of unauthorized acquisition, use or disposition of the company’s assets that could have a material effect on the financial statements.
Because of its inherent limitations, internal control over financial reporting may not prevent or detect misstatements. Also, projections of any evaluation of effectiveness to future periods are subject to the risk that controls may become inadequate because of changes in conditions, or that the degree of compliance with the policies or procedures may deteriorate.
In our opinion, QEP Resources, Inc. maintained, in all material respects, effective internal control over financial reporting as of December 31, 2010, based on the COSO criteria.
We also have audited, in accordance with the standards of the Public Company Accounting Oversight Board (United States), the consolidated balance sheets of QEP Resources, Inc. as of December 31, 2010 and 2009, and the related consolidated statements of income, shareholders’ equity, and cash flows for each of the three years in the period ended December 31, 2010, of QEP Resources, Inc. and our report dated February 25, 2011, expressed an unqualified opinion thereon.
/s/Ernst & Young LLP
Ernst & Young LLP
Denver, Colorado
February 25, 2011
88
Table of Contents
There is no information to report in Item 9B.
ITEM 10. DIRECTORS, EXECUTIVE OFFICERS AND CORPORATE GOVERNANCE
The information requested in Item 10 concerning QEP.’s directors is presented in the Company’s definitive Proxy Statement under the section entitled “Election of Directors” and is incorporated herein by reference. A definitive Proxy Statement for QEP’s 2011 annual meeting will be filed with the Securities and Exchange Commission on or about April 7, 2011.
Information about the Company’s executive officers can be found in Item 1 of Part I in this Annual Report.
Information concerning compliance with Section 16(a) of the Exchange Act, is presented in the definitive Proxy Statement for QEP’s 2011 annual meeting under the section entitled “Section 16(a) Compliance” and is incorporated herein by reference.
The Company has a Business Ethics and Compliance Policy (Ethics Policy) that applies to all of its directors, officers (including its Chief Executive Officer and Chief Financial Officer) and employees. QEP has posted the Ethics Policy on its website, www.qepres.com. Any waiver of the Ethics Policy for executive officers must be approved only by the Company’s Board of Directors. QEP will post on its website any amendments to or waivers of the Ethics Policy that apply to executive officers.
ITEM 11. EXECUTIVE COMPENSATION
The information required to be furnished pursuant to Item 11 will be set forth under the caption “Executive Compensation” in the Proxy Statement, and is incorporated herein by reference.
ITEM 12. SECURITY OWNERSHIP OF CERTAIN BENEFICIAL OWNERS AND MANAGEMENT AND RELATED STOCKHOLDER MATTERS
The information requested in Item 12 for certain beneficial owners is presented in QEP’s definitive Proxy Statement for the Company’s 2011 annual meeting under the section entitled “Security Ownership, Principal Holders” and is incorporated herein by reference. Similar information concerning the securities ownership of directors and executive officers is presented in the definitive Proxy Statement for the Company’s 2011 annual meeting under the section entitled “Security Ownership, Directors and Executive Officers” and is incorporated herein by reference.
Finally, information concerning securities authorized for issuance under the Company’s equity compensation plans as of December 31, 2010, is presented in the definitive Proxy Statement for the Company’s 2011 Annual Meeting of Shareholders under the section entitled “Equity Compensation Plan Information” and is incorporated herein by reference.
ITEM 13. CERTAIN RELATIONSHIPS AND RELATED TRANSACTIONS, AND DIRECTOR INDEPENDENCE
The information requested in Item 13 for related transactions involving the Company’s directors and executive officers is presented in the definitive Proxy Statement for QEP’s 2011 Annual Meeting of Shareholders under the sections entitled “Information Concerning the Board of Directors” and “Certain Relationships – Executive Officers.”
ITEM 14. PRINCIPAL ACCOUNTING FEES AND SERVICES
The information requested in Item 14 for principal accountant fees and services is presented in the definitive Proxy Statement for QEP’s 2011 Annual Meeting of Shareholders under the section entitled “Audit Committee Report” and is incorporated herein by reference.
89
Table of Contents
ITEM 15. EXHIBITS AND FINANCIAL STATEMENT SCHEDULES
Financial statements and financial statement schedules filed as part of this report are listed in the index included in Item 8. Financial Statements and Supplementary Data of this report.
(b) Exhibits. The following is a list of exhibits required to be filed as a part of this report in Item 15(b).
| Exhibit No. |
Description | |
| 2.1 | Agreement and Plan of Merger dated as of May 18, 2010, between Questar Market Resources, Inc., a Utah corporation, and QEP Resources, Inc., a Delaware corporation. (Incorporated by reference to Exhibit No. 2.1 to the Company’s Current Report on Form 8-K filed with the Securities and Exchange Commission on May 24, 2010.) | |
| 2.2 | Separation and Distribution Agreement dated as of June 14, 2010, by and between Questar Corporation and QEP Resources, Inc. (Incorporated by reference to Exhibit No. 2.1 to the Company’s Current Report on Form 8-K filed with the Securities and Exchange Commission on June 16, 2010.) | |
| 3.1 | Certificate of Incorporation dated May 18, 2010. (Incorporated by reference to Exhibit No. 3.1 to the Company’s Current Report on Form 8-K filed with the Securities and Exchange Commission on May 24, 2010.) | |
| 3.2 | Amended and Restated Bylaws, deemed effective May 18, 2010. (Incorporated by reference to Exhibit No. 2.1 to the Company’s Current Report on Form 8-K filed with the Securities and Exchange Commission on May 24, 2010.) | |
| 3.5 | Certificate of Designations of Series A Junior Participating Preferred Stock of QEP Resources, Inc. (Incorporated by reference to Exhibit 2. of QEP Resources, Inc.’s Registration Statement on Form 8-A filed with the Securities and Exchange Commission on June 30, 2010.) | |
| 4.1 | Indenture dated as of March 1, 2001, between Questar Market Resources, Inc. (predecessor-in-interest to QEP Resources, Inc.) and Bank One, NA, (predecessor-in- interest to Wells Fargo Bank, National Association), as Trustee, (Incorporated by reference to Exhibit No. 4.01 to the Company’s Current Report on Form 8-K filed with the Securities and Exchange Commission on March 13, 2001.) | |
| 4.2 | Form of the Company’s 7 1/2% Notes due 2011. (Incorporated by reference to Exhibit 4.02 to the Company’s Current Report on Form 8-K filed with the Securities and Exchange Commission on May 13, 2001.) | |
| 4.3 | Form of the Company’s 6.05% Notes due 2016. (Incorporated by reference to Exhibit 99.2 to the Company’s Current Report on Form 8-K filed with the Securities and Exchange Commission on May 15, 2006.) | |
| 4.4 | Form of Officers’ Certificate setting forth the terms of the Company’s 6.05% Notes due 2016. (Incorporated by reference to Exhibit 99.3 to the Company’s Current Report on Form 8-K filed with the Securities and Exchange Commission on May 15, 2006.) | |
| 4.5 | Form of the Company’s 6.80% Notes due 2018. (Incorporated by reference to Exhibit 4.1 to the Company’s Current Report on Form 8-K filed with the Securities and Exchange Commission on April 1, 2008.) | |
| 4.6 | Form of Officers’ Certificate setting forth the terms of the Company’s 6.80% Notes due 2018. (Incorporated by reference to Exhibit 4.2 to the Company’s Current Report on Form 8-K filed with the Securities and Exchange Commission on April 1, 2008.) | |
90
Table of Contents
| Exhibit No. |
Description | |
| 4.7 | Form of the Company’s 6.80% Notes due 2020. (Incorporated by reference to Exhibit 4.1 to the Company’s Current Report on Form 8-K filed with the Securities and Exchange Commission on September 2, 2009.) | |
| 4.8 | Form of Officers’ Certificate setting forth the terms of the Company’s 6.80% Notes due 2020. (Incorporated by reference to Exhibit 4.2 to the Company’s Current Report on Form 8-K filed with the Securities and Exchange Commission on September 2, 2009.) | |
| 4.9 | Officers’ Certificate, dated as of August 16, 2010 (including the form of the Company’s 6.875% Notes due 2021). (Incorporated by reference to Exhibit 4.1 to the Company’s Current Report on Form 8-K filed with the Securities and Exchange Commission on August 16, 2010.) | |
| 4.10 | Rights Agreement, dated as of June 30, 2010, between QEP Resources, Inc. and Wells Fargo Bank, N.A., which includes the Form of Right Certificate as Exhibit B and the Summary of Rights to Purchase Preferred Stock as Exhibit C (Incorporated by reference to Exhibit 1. of QEP Resources, Inc.’s Registration Statement on Form 8-A filed with the Securities and Exchange Commission on June 30, 2010.) | |
| 10.1 | Credit Agreement dated March 11, 2008, by and among Questar Market Resources, Inc., Bank of America, N.A. and other lenders. (Incorporated by reference to Exhibit No. 4.1. to the Company’s Quarterly Report on Form 10-Q for the Quarter Ended March 31, 2008.) | |
| 10.2 | First Amendment to Credit Agreement dated as of June 30, 2010 among QEP Resources, Inc. (successor by merger to Questar Market Resources, Inc.), Bank of America, and N.A., as the administrative agent and letter of credit issuer, and the lenders party thereto. (Incorporated by reference to Exhibit No. 10.1. to the Company’s Current Report on Form 8-K filed with the Securities and Exchange Commission on July 1, 2010.) | |
| 10.3 | Senior Unsecured Bridge Loan Agreement, dated as of June 30, 2010, among QEP Resources, Inc, as borrower, Deutsche Bank AG Cayman Islands Branch, as administrative agent, Bank of America, N.A. and BMO Capital Markets Financing, Inc., as co-syndication agents, JPMorgan Chase Bank, N.A. and Wells Fargo Bank, N.A., as co-documentation agents, and the lenders party thereto. (Incorporated by reference to Exhibit No. 10.2 to the Company’s Current Report on Form 8-K filed with the Securities and Exchange Commission on July 1, 2010.) | |
| 10.4 | Employee Matters Agreement, dated as of June 14, 2010, by and between Questar Corporation and QEP Resources, Inc. (Incorporated by reference to Exhibit No. 10.1 to the Company’s Current Report on Form 8-K filed with the Securities and Exchange Commission on June 16, 2010.) | |
| 10.5 | Tax Matters Agreement, dated as of June 14, 2010, by and between Questar Corporation and QEP Resources, Inc. (Incorporated by reference to Exhibit No. 10.2 to the Company’s Current Report on Form 8-K filed with the Securities and Exchange Commission on June 16, 2010.) | |
| 10.6 | Transition Services Agreement, dated as of June 14, 2010, by and between Questar Corporation and QEP Resources, Inc. (Incorporated by reference to Exhibit No. 10.3 to the Company’s Current Report on Form 8-K filed with the Securities and Exchange Commission on June 16, 2010.) | |
| 10.7+ | QEP Resources, Inc. Deferred Compensation Plan for Directors (Incorporated by reference to Exhibit No. 10.4 to the Company’s Current Report on Form 8-K filed with the Securities and Exchange Commission on June 16, 2010.) | |
| 10.8+ | Amended and Restated Employment Agreement dated June 15, 2010 by and between QEP Resources, Inc., Questar Corporation and Charles B. Stanley (Incorporated by reference to Exhibit No. 10.5 to the Company’s Current Report on Form 8-K filed with the Securities and Exchange Commission on June 16, 2010.) | |
91
Table of Contents
| Exhibit No. |
Description | |
| 10.9+ | Amended and Restated Employment Agreement dated June 15, 2010 by and between QEP Resources, Inc., Questar Corporation and Richard J. Doleshek (Incorporated by reference to Exhibit No. 10.6 to the Company’s Current Report on Form 8-K filed with the Securities and Exchange Commission on June 16, 2010.) | |
| 10.10+ | QEP Resources, Inc. 2010 Annual Management Incentive Plan II (Incorporated by reference to Exhibit No. 10.7 to the Company’s Current Report on Form 8-K filed with the Securities and Exchange Commission on June 16, 2010.) | |
| 10.11+ | QEP Resources, Inc. 2010 Long-term Cash Incentive Plan (Incorporated by reference to Exhibit No. 10.8 to the Company’s Current Report on Form 8-K filed with the Securities and Exchange Commission on June 16, 2010). | |
| 10.12+ | QEP Resources, Inc. 2010 Long-term Stock Incentive Plan (Incorporated by reference to Exhibit No. 10.9 to the Company’s Current Report on Form 8-K filed with the Securities and Exchange Commission on June 16, 2010.) | |
| 10.13+ | QEP Resources, Inc. Executive Severance Compensation Plan (Incorporated by reference to Exhibit No. 10.10 to the Company’s Current Report on Form 8-K filed with the Securities and Exchange Commission on June 16, 2010.) | |
| 10.14+ | QEP Resources, Inc. Deferred Compensation Wrap Plan (Incorporated by reference to Exhibit No. 10.11 to the Company’s Current Report on Form 8-K filed with the Securities and Exchange Commission on June 16, 2010.) | |
| 10.15+ | QEP Resources, Inc. Supplemental Executive Retirement Plan (Incorporated by reference to Exhibit No. 10.12 to the Company’s Current Report on Form 8-K filed with the Securities and Exchange Commission on June 16, 2010.) | |
| 10.16+ | QEP Resources, Inc. Form of Nonqualified Stock Option Agreement for nonqualified stock options granted to certain key executives. (Incorporated by reference to Exhibit No. 10.1. to the Company’s Current Report on Form 8-K filed with the Securities and Exchange Commission on June 29, 2010.) | |
| 10.17+ | QEP Resources, Inc. Form of Nonqualified Stock Option Agreement for nonqualified stock options granted to other officers and key employees. (Incorporated by reference to Exhibit No. 10.2 to the Company’s Current Report on Form 8-K filed with the Securities and Exchange Commission on June 29, 2010.) | |
| 10.18+ | QEP Resources, Inc. Form of Incentive Stock Option Agreement for incentive stock options granted to certain key executives. (Incorporated by reference to Exhibit No. 10.3. to the Company’s Current Report on Form 8-K filed with the Securities and Exchange Commission on June 29, 2010.) | |
| 10.19+ | QEP Resources, Inc. Form of Incentive Stock Option Agreement for incentive stock options granted to other officers and key employees. (Incorporated by reference to Exhibit No. 10.4 to the Company’s Current Report on Form 8-K filed with the Securities and Exchange Commission on June 29, 2010.) | |
| 10.20+ | QEP Resources, Inc. Form of Restricted Stock Agreement for restricted stock granted to certain key executives. (Incorporated by reference to Exhibit No. 10.5 to the Company’s Current Report on Form 8-K filed with the Securities and Exchange Commission on June 29, 2010.) | |
| 10.21+ | QEP Resources, Inc. Form of Restricted Stock Agreement for restricted stock granted to other officers and key employees. (Incorporated by reference to Exhibit No. 10.6 to the Company’s Current Report on Form 8-K filed with the Securities and Exchange Commission on June 29, 2010.) | |
| 10.22+ | QEP Resources, Inc. Form of Restricted Stock Agreement for restricted stock granted to non-employee directors. (Incorporated by reference to Exhibit No. 10.7 to the Company’s Current Report on Form 8-K filed with the Securities and Exchange Commission on June 29, 2010.) | |
92
Table of Contents
| Exhibit No. |
Description | |
| 10.23+ | QEP Resources, Inc. Form of Phantom Stock Agreement for phantom stock granted to non-employee directors. (Incorporated by reference to Exhibit No. 10.8 to the Company’s Current Report on Form 8-K filed with the Securities and Exchange Commission on June 29, 2010.) | |
| 10.24+ | QEP Resources, Inc. Form of Restricted Stock Units Agreement for restricted stock units granted to Mr. Keith O. Rattie. (Incorporated by reference to Exhibit No. 10.9 to the Company’s Current Report on Form 8-K filed with the Securities and Exchange Commission on June 29, 2010.) | |
| 12.1* | Ratio of earnings to fixed charges. | |
| 21.1* | Subsidiaries of the Company. | |
| 23.1* | Consent of Independent Registered Public Accounting Firm. | |
| 23.2* | Consent of Independent Petroleum Engineers and Geologists. | |
| 23.3* | Qualifications and Report of Independent Petroleum Engineers and Geologists. | |
| 24* | Power of Attorney | |
| 31.1* | Certification signed by Charles B. Stanley, QEP Resources, Inc. President and Chief Executive Officer, pursuant to Section 302 of the Sarbanes-Oxley Act of 2002. | |
| 31.2* | Certification signed by Richard J. Doleshek, QEP Resources, Inc. Executive Vice President, Chief Financial Officer and Treasurer, pursuant to Section 302 of the Sarbanes-Oxley Act of 2002. | |
| 32.1* | Certification signed by Charles B. Stanley and Richard J. Doleshek, QEP Resources, Inc. President and Chief Executive Officer and Executive Vice President, Chief Financial Officer and Treasurer, respectively, pursuant to Section 906 of the Sarbanes-Oxley Act of 2002. | |
| * | Filed herewith |
| + | Indicates a management contract or compensatory plan or arrangement |
93
Table of Contents
Pursuant to the requirements of Section 13 or 15(d) of the Securities Exchange Act of 1934, the registrant has duly caused this report to be signed on its behalf by the undersigned, thereunto duly authorized, on the 25th day of February, 2011.
| QEP RESOURCES, INC. | ||
| (Registrant) | ||
| By: | /s/ C. B. Stanley | |
| C. B. Stanley | ||
| President and Chief Executive Officer | ||
Pursuant to the requirements of the Securities Exchange Act of 1934, this report has been signed below by the following persons on behalf of the registrant and in the capacities and on the date indicated.
| /s/ C. B. Stanley |
President and Chief Executive Officer | |||
| C. B. Stanley | Director (Principal Executive Officer) | |||
| /s/ Richard J. Doleshek |
Executive Vice President, | |||
| Richard J. Doleshek | Chief Financial Officer and Treasurer (Principal Financial Officer) | |||
| /s/ B. Kurtis Watts |
Vice President and Controller | |||
| B. Kurtis Watts | (Principal Accounting Officer) | |||
| *Keith O. Rattie |
Chairman of the Board; Director | |
| *Phillips S. Baker, Jr. |
Director | |
| *L. Richard Flury |
Director | |
| *James A. Harmon |
Director | |
| *Robert E. McKee III |
Director | |
| *M. W. Scoggins |
Director | |
| *C. B. Stanley |
Director |
| February 25, 2011 |
*By | /s/ C. B. Stanley | ||||
| Date |
C. B. Stanley, Attorney in Fact |
94