Attached files
| file | filename |
|---|---|
| EX-23.1 - EX-23.1 - EPIQ SYSTEMS INC | a2202203zex-23_1.htm |
| EX-21.1 - EX-21.1 - EPIQ SYSTEMS INC | a2202203zex-21_1.htm |
| EX-12.1 - EX-12.1 - EPIQ SYSTEMS INC | a2202203zex-12_1.htm |
| EX-32.1 - EX-32.1 - EPIQ SYSTEMS INC | a2202203zex-32_1.htm |
| EX-31.2 - EX-31.2 - EPIQ SYSTEMS INC | a2202203zex-31_2.htm |
| EX-31.1 - EX-31.1 - EPIQ SYSTEMS INC | a2202203zex-31_1.htm |
Use these links to rapidly review the document
TABLE OF CONTENTS
UNITED STATES
SECURITIES AND EXCHANGE COMMISSION
WASHINGTON, D. C. 20549
FORM 10-K
| (Mark One) | ||
ý |
ANNUAL REPORT PURSUANT TO SECTION 13 OR 15(d) OF THE SECURITIES EXCHANGE ACT OF 1934 |
|
For the fiscal year ended December 31, 2010 |
||
or |
||
o |
TRANSITION REPORT PURSUANT TO SECTION 13 OR 15(d) OF THE SECURITIES EXCHANGE ACT OF 1934 |
|
For the transition period from to |
||
Commission File Number 0-22081
EPIQ SYSTEMS, INC.
(Exact name of registrant as specified in its charter)
| Missouri | 48-1056429 | |
| (State or other jurisdiction of incorporation or organization) |
(I.R.S. Employer Identification No.) | |
501 Kansas Avenue, Kansas City, Kansas |
66105-1300 |
|
| (Address of principal executive offices) | (Zip Code) |
913-621-9500
(Registrant's telephone number, including area code)
Securities registered pursuant to Section 12(b) of the Act
| Title of each class | Name of exchange on which registered | |
|---|---|---|
| Common Stock, $0.01 par value | The NASDAQ Stock Market, LLC |
Securities
registered pursuant to Section 12(g) of the Act
None
Indicate by check mark whether the registrant is a well-known seasoned issuer, as defined in Rule 405 of the Securities Act. Yes o No ý
Indicate by check mark if the registrant is not required to file reports pursuant to Section 13 or Section 15(d) of the Act. Yes o No ý
Indicate by check mark whether the registrant (1) has filed all reports required to be filed by Section 13 or 15(d) of the Securities Exchange Act of 1934 during the preceding 12 months (or for such shorter period that the registrant was required to file such reports), and (2) has been subject to such filing requirements for the past 90 days. Yes ý No o
Indicate by check mark whether the registrant has submitted electronically and posted on its corporate Web site, if any, every Interactive Data File required to be submitted and posted pursuant to Rule 405 of Regulation S-T (§232.405 of this chapter) during the preceding 12 months (or for such shorter period that the registrant was required to submit and post such files). Yes o No o
Indicate by check mark if disclosure of delinquent filers pursuant to Item 405 of Regulation S-K (§229.405 of this chapter) is not contained herein, and will not be contained, to the best of registrant's knowledge, in definitive proxy or information statements incorporated by reference in Part III of this Form 10-K or any amendment to this form 10-K. ý
Indicate by check mark whether the registrant is a large accelerated filer, an accelerated filer, a non-accelerated filer, or a smaller reporting company. See the definitions of "large accelerated filer," "accelerated filer" and "smaller reporting company" in Rule 12b-2 of the Exchange Act.
| Large accelerated filer o | Accelerated filer ý | Non-accelerated filer o (Do not check if a smaller reporting company) |
Smaller reporting company o |
Indicate by check mark whether the registrant is a shell company (as defined in Rule 12b-2 of the Act). Yes o No ý
The aggregate market value of voting common stock held by non-affiliates of the registrant (based upon the last reported sale price on the NASDAQ Global Market), as of the last business day of the registrant's most recently completed second fiscal quarter (June 30, 2010) was approximately $460,000,000.
There were 35,200,972 shares of common stock of the registrant outstanding as of February 11, 2011.
DOCUMENTS INCORPORATED BY REFERENCE
The information required by Part III of Form 10-K is incorporated herein by reference to the registrant's definitive Proxy Statement relating to its 2011 Annual Meeting of Shareholders, which will be filed with the Commission within 120 days after the end of the registrant's fiscal year.
CAUTIONARY STATEMENT CONCERNING FORWARD-LOOKING STATEMENTS
In this report, in other filings with the Securities and Exchange Commission (the "SEC") and in press releases and other public statements by our officers throughout the year, Epiq Systems, Inc. makes or will make statements that plan for or anticipate the future. These forward-looking statements include but are not limited to any projection or expectation of earnings, revenue or other financial items; the plans, strategies and objectives of management for future operations; factors that may affect our operating results; new products or services; the demand for our products or services; our ability to consummate acquisitions and successfully integrate them into our operations; future capital expenditures; effects of current or future economic conditions or performance; industry trends and other matters that do not relate strictly to historical facts or statements of assumptions underlying any of the foregoing. These forward-looking statements are based on our current expectations which may not prove to be accurate. Many of these statements are found in the "Business" and "Management's Discussion and Analysis of Financial Condition and Results of Operations" sections of this report.
Forward-looking statements may be identified by words or phrases such as "believe," "expect," "anticipate," "should," "planned," "may," "estimated," "goal," "objective," "seeks," and "potential," and variations of these words and similar expressions or negatives of these words. Section 27A of the Securities Act of 1933, as amended and Section 21E of the Securities Exchange Act of 1934, as amended, provide a "safe harbor" for forward-looking statements. In order to comply with the terms of the safe harbor, and because forward-looking statements involve future risks and uncertainties, Item 1A, "Risk Factors" of this report lists a variety of factors that could cause actual results and experience to differ materially from the anticipated results or other expectations expressed in our forward-looking statements. We undertake no obligation to update publicly or revise any forward-looking statements contained in this report or in future communications to reflect future events or developments, except as required by law.
General Development of Business
Epiq Systems, Inc. is a provider of integrated technology solutions for the legal profession. References below to "the company," "we," "us" and "our" may refer to Epiq Systems, Inc. exclusively or to one or more of our subsidiaries. Our solutions streamline the administration of bankruptcy, litigation, financial transactions and regulatory compliance matters. We offer innovative technology solutions for e-discovery, document review, legal notification, claims administration and controlled disbursement of funds. Our clients include leading law firms, corporate legal departments, bankruptcy trustees, government agencies, mortgage processors, financial institutions, and other professional advisors who require innovative technology, responsive service and deep subject-matter expertise.
We were incorporated in the State of Missouri on July 13, 1988, and on July 15, 1988 acquired all of the assets of an unrelated predecessor corporation.
As a part of our business strategy, we have made several acquisitions over the past five years. During 2010, we acquired Jupiter eSources LLC, including their proprietary software product, AACER® (Automated Access to Court Electronic Records), that assists creditors including banks, mortgage processors, and their administrative services professionals to streamline processing of their portfolios of loans in bankruptcy cases. During 2008, we acquired all of the equity of Uberdevelopments Limited and its wholly-owned operating subsidiary Pinpoint Global Limited (collectively, "Pinpoint"), an e-discovery business with operations in the United Kingdom, to expand our market in the United Kingdom. During 2006, we acquired the net assets of Gazes LLC (now Epiq Preference Solutions) to supplement our ability to provide claims preference services for our bankruptcy segment clients.
Our trademarks, service marks, and registered marks include AACER®, Epiq™, EpiqSM, Epiq Systems™, Epiq SystemsSM,Bankruptcy Link®, CasePower®, CasePower 13®, ClaimsMatrix®, ClassMatrix™, ClassMatrixSM, CreditorMatrix™, CreditorMatrixSM, DebtorMatrix®, DocuMatrix®, DMX™, DMXSM, DMX Mobile™, DMX MobileSM, Documatrix Mobile™, Documatrix MobileSM, eDataMatrix®, eDiscovery IQ Review™, eDiscovery IQ ReviewSM, Epiq IQ Review™, Epiq IQ ReviewSM, IQ Review™, IQ ReviewSM, LegalMatrix™, LoanMatrixSM, TCMS®, TCMSWeb®, and XFrame™. The trademarks and service marks (denoted by ™ and SM) have been filed but are not yet registered; the registered marks (denoted by ®) have durations ranging from 2011 through 2020.
Financial Information About Segments
Our business is organized into three reporting segments: eDiscovery, bankruptcy, and settlement administration. Segment information related to revenues, a performance measure of profit or loss, capital expenditures, and total assets is contained in Note 14 of the Notes to Consolidated Financial Statements.
Narrative Description of Business
eDiscovery Segment
Our eDiscovery segment provides collections and forensics, processing, search and review, and document review services to companies and the litigation departments of law firms. Our eDataMatrix® software analyzes, filters, deduplicates and produces documents for review. Produced documents are made available primarily through a hosted environment, and our DocuMatrix™ software allows for efficient attorney review and data requests. Our customers are typically large corporations that use our
1
products and services cooperatively with their legal counsel to manage the e-discovery process for litigation and regulatory matters.
The substantial amount of electronic documents and other data used by businesses has changed the dynamics of how attorneys support discovery in complex litigation matters. Due to the complexity of cases, the volume of data that are maintained electronically, and the volume of documents that are produced in all types of litigation, law firms have become increasingly reliant on electronic evidence management systems to organize and manage the litigation discovery process.
Following is a description of the significant sources of revenue in our eDiscovery business.
- •
- Consulting, forensics and collection service fees based on the number of hours services are provided.
- •
- Fees related to the conversion of data into an organized, searchable electronic database. The amount earned varies
primarily on the number of documents.
- •
- Hosting fees based on the amount of data stored.
- •
- Document review fees based on the number of hours spent reviewing documents, the number of pages reviewed, or the amount of data reviewed.
In 2009, we opened new offices in Brussels and Hong Kong, established global reach for our offices and data centers in the U.S., Europe and Asia, and expanded our offerings to include data forensics and collections services, as well as document review services. In 2009, we also launched IQ Review™, a revolutionary combination of new intelligent technology and expert services which incorporates new prioritization technology into DocuMatrix™, our flagship document management platform. Increased case activity levels and an uptake of new service offerings launched in 2009 contributed to revenue grown in 2010, and is expected to continue into 2011.
Bankruptcy Segment
Bankruptcy is an integral part of the United States' economy. As reported by the Administrative Office of the U.S. Courts for the fiscal years ended December 31, 2010, 2009, and 2008, there were approximately 1.59 million, 1.47 million, and 1.12 million new bankruptcy filings, respectively. Bankruptcy filings for the twelve-month period ended December 31, 2010 increased 8% versus the twelve-month period ended December 31, 2009. During this period, Chapter 7 filings increased 8%, Chapter 11 filings fell 10%, and Chapter 13 filings increased 8%.
Our bankruptcy business provides solutions that address the needs of Chapter 7, Chapter 11, and Chapter 13 bankruptcy trustees to administer bankruptcy proceedings and of debtor corporations that file a plan of reorganization.
- •
- Chapter 7 is a liquidation bankruptcy for individuals or businesses that, as measured by the number of new cases
filed in the twelve-month period ended December 31, 2010, accounted for approximately 71% of all bankruptcy filings. In a Chapter 7 case, the debtor's assets are liquidated and the
resulting cash proceeds are used by the Chapter 7 bankruptcy trustee to pay creditors. Chapter 7 cases typically last several years.
- •
- Chapter 11 is a reorganization model of bankruptcy for corporations that, as measured by the number of new cases filed in the twelve-month period ended December 31, 2010, accounted for approximately 1% of all bankruptcy filings. Chapter 11 generally allows a company, often referred to as the debtor-in-possession, to continue operating under a plan of reorganization to restructure its business and to modify payment terms of both secured and unsecured obligations. Chapter 11 cases generally last several years.
2
- •
- Chapter 13 is a reorganization model of bankruptcy for individuals that, as measured by the number of new cases filed in the twelve-month period ended December 31, 2010, accounted for approximately 28% of all bankruptcy filings. In a Chapter 13 case, debtors make periodic cash payments into a reorganization plan and a Chapter 13 bankruptcy trustee uses these cash payments to make monthly distributions to creditors. Chapter 13 cases typically last between three and five years.
The application of Chapter 7 bankruptcy regulations has the practical effect of discouraging trustee customers from incurring direct administrative costs for computer system expenses. As a result, we provide our Chapter 7 products and services to our trustee customers at no direct charge, and they maintain deposit accounts for bankruptcy cases under their administration at a designated banking institution. We have arrangements with various banks under which we provide the bankruptcy trustee case management software and related services, and the bank provides the bankruptcy trustee with deposit-related banking services. During the years ended December 31, 2010 and 2009, a majority of our Chapter 7 trustee clients' deposits were maintained at Bank of America.
Chapter 11 bankruptcy engagements are generally long-term, multi-year assignments that provide revenue visibility into future periods. For the Chapter 7 trustee services component of the bankruptcy segment, the increase in filings is expected to translate into growth in client deposit balances related to asset liquidations. Our trustee services deposit portfolio exceeded $2.0 billion throughout 2010, while pricing continued at floor pricing levels under our agreements due to the low short-term interest rate environment.
The key participants in a bankruptcy proceeding include the debtor-in-possession, the debtor's legal counsel, the creditors, the creditors' legal counsel, and the bankruptcy judge. Chapter 7 and Chapter 13 cases also include a professional bankruptcy trustee, who is responsible for administering the bankruptcy case. The end-user customers of our Chapter 7, Chapter 11, and Chapter 13 bankruptcy businesses are debtor corporations that file a plan of reorganization and professional bankruptcy trustees. The Executive Office for United States Trustees, a division of the U.S. Department of Justice, appoints all bankruptcy trustees. A United States Trustee is appointed in most federal court districts and generally has responsibility for overseeing the integrity of the bankruptcy system. The bankruptcy trustee's primary responsibilities include liquidating the debtor's assets or collecting funds from the debtor, distributing the collected funds to creditors pursuant to the orders of the bankruptcy court and preparing regular status reports for the Executive Office for United States Trustees and for the bankruptcy court. Trustees manage an entire caseload of bankruptcy cases simultaneously.
On October 1, 2010, we completed the acquisition of Jupiter eSources LLC. The purchase price was comprised of $60.0 million of cash, $8.4 million of which was withheld for any claims for indemnification, and purchase price adjustments. In addition, there is contingent consideration related to an earn-out opportunity based on future revenue growth. The potential undiscounted amount of all future payments that we could be required to make under the earn-out opportunity is between $0 and $20 million over a four year period. The transaction was funded from our credit facility. See Note 13 of the Notes to Consolidated Financial Statements for further detail.
Through this purchase, we acquired a proprietary software product, AACER® (Automated Access to Court Electronic Records), that assists creditors including banks, mortgage processors, and their administrative services professionals to streamline processing of their portfolios of loans in bankruptcy cases. The AACER® product electronically monitors developments in all U.S. bankruptcy courts and applies sophisticated algorithms to classify docket filings automatically in each case to facilitate the management of large bankruptcy claims operations. By implementing the AACER® solution, clients achieve greater accuracy in faster timeframes, with a significant cost savings compared to manual attorney review of each case in the portfolio.
3
Following is a description of the significant sources of revenue in our bankruptcy business.
- •
- Data hosting fees and volume-based fees.
- •
- Case management professional service fees and other support service fees related to the administration of cases, including
data conversion, claims processing, claims reconciliation, professional services, and disbursement services.
- •
- Deposit-based fees, earned primarily on a percentage of Chapter 7 total liquidated assets placed on deposit with a
designated financial institution by our trustee clients, to whom we provide, at no charge, software licenses, limited hardware and hardware maintenance, and postcontract customer support services. The
fees we earn based on total liquidated assets placed on deposit by our trustee clients may vary based on fluctuations in short-term interest rates.
- •
- Legal noticing services to parties of interest in bankruptcy matters, including direct notification and media campaign and
advertising management in which we coordinate notification, primarily through print media outlets, to potential parties of interest for a particular client engagement.
- •
- Reimbursement for costs incurred, primarily related to postage on mailing services.
- •
- Monitoring and noticing fees earned based on monthly or on-demand requests for information provided through our AACER® software product.
Settlement Administration Segment
Our settlement administration segment provides managed services, including legal notification, claims administration, project administration and controlled disbursement.
The customers of our settlement administration segment are companies that require the administration of a settlement, resolution of a class action matter, or administration of a project. We sell our services directly to these customers and other interested parties, including legal counsel, which often provide access to these customers. During the years ended December 31, 2010, 2009 and 2008, less than 1%, 12%, and 22%, respectively, of our consolidated revenue was derived from a large contract with IBM in support of the federal government's analog to digital conversion program. The contract began in the fourth quarter of 2007 and, as expected, wound-down in 2009.
Following is a description of the significant sources of revenue in our settlement administration business.
- •
- Fees contingent upon the month-to-month delivery of case management services such as claims
processing, claims reconciliation, project management, professional services, call center support, website development and administration, and controlled disbursements. The amount we earn varies
primarily on the size and complexity of the engagement.
- •
- Legal noticing services to parties of interest in class action matters; including media campaign and advertising
management, in which we coordinate notification through various media outlets, such as print, radio and television, to potential parties of interest for a particular client engagement.
- •
- Reimbursement for costs incurred related to postage on mailing services.
Key participants in this marketplace include law firms that specialize in representing class action and mass tort plaintiffs and other law firms that specialize in representing defendants. Class action and mass tort refers to litigation in which class representatives bring a lawsuit against a defendant company or other persons on behalf of a large group of similarly affected persons. Mass tort refers to class action cases that are particularly large or prominent. Class action and mass tort litigation is often complex and the cases, including administration of any settlement, may last several years.
4
Competition
eDiscovery
The e-discovery market is highly fragmented, intensely competitive and rapidly evolving. Competitors include Electronic Evidence Discovery, Inc., Fios, Inc., Kroll Ontrack (Altegrity Inc.), Attenex (FTI Consulting, Inc.), Autonomy ZANTAZ, Inc., Stratify, Inc. (Iron Mountain Incorporated), and Clearwell Systems, Inc. Competition is primarily based on the quality of service, technology innovations, and price.
Bankruptcy
Our bankruptcy segment competes in a more mature market. We are one of two primary providers in the Chapter 7 bankruptcy market, along with Bankruptcy Management Solutions, Inc.; and in the Chapter 11 bankruptcy market competitors include Kurtzman Carson Consultants LLC and The Garden City Group, Inc. In both the Chapter 7 and Chapter 11 markets there are also several smaller competitors. Competition is primarily based on quality of service and technology innovations. Competitors for our AACER® product include American InfoSource and LexisNexis® Banko® Solutions.
Settlement Administration
The primary competitors with our settlement administration segment are The Garden City Group, Inc., Rust Consulting, Inc., and Gilardi & Co LLC, as well as several smaller competitors. Competition is primarily based on the quality of service, technology innovations, and price.
In addition to the competitors mentioned above, certain law firms, accounting firms, management consultant firms, turnaround specialists and crisis management firms offer products and services that compete with our products and services in each of our segments.
Key competitive factors and the relative strength of our products and services versus our competitors are directly and indirectly affected by our technology innovations, the quality of our services, price, ease of use of our technology solutions, quality of our technical support, reliability, and our domain expertise. Our ability to continually innovate and differentiate our product offerings has enabled us to achieve and maintain leadership positions in the various markets that we serve.
Sales and Marketing
Our sales executives market our products and services directly to prospective customers and referral law firms through on-site sales calls and longstanding relationships. We focus on attracting and retaining customers by providing superior integrated technology solutions and exceptional customer service. Our client support specialists are responsible for providing ongoing support services for existing customers. Additionally, we maintain a website that clients and potential clients may access to obtain additional information related to solutions we offer, we attend industry trade shows, we publish articles, and we conduct direct mail campaigns and advertise in trade journals.
Government Regulation
Our products and services are not directly regulated by the government. However, our bankruptcy segment customers are subject to significant regulation under the United States Bankruptcy Code, the Federal Rules of Bankruptcy Procedure and local rules and procedures established by bankruptcy courts. Additionally, the Executive Office for United States Trustees, a division of the United States Department of Justice, oversees the federal bankruptcy system and establishes administrative rules governing our clients' activities. Furthermore, class action and mass tort cases, as well as e-discovery
5
requirements related to litigation, are subject to various federal and state laws, as well as rules of evidence and rules of procedure established by the courts.
In April 2006, the United States Supreme Court approved certain amendments to the Federal Rules of Civil Procedure regarding the discovery in litigation of certain electronically stored information. These amendments became effective on December 1, 2006. Among other things, these amendments (i) require early attention by parties in litigation to meet and confer regarding discovery issues and to develop a discovery plan that identifies and addresses the parties' electronically stored information, (ii) expand the reach of federal court subpoenas to include electronically stored information, (iii) allow for parties to object to production of electronically stored information that is not reasonably accessible due to the undue burden or cost associated with such retrieval, and (iv) provide a "safe harbor" to parties unable to provide electronically stored information lost or destroyed as a result of the routine, good-faith operation of an electronic information system. While these federal rules do not apply in state court proceedings, the civil procedure rules of many states have been closely modeled on these provisions. We anticipate the federal and state court discovery rules relating to electronic documents and information will continue to evolve and affect the way we develop and implement technology and service solutions to those changing discovery rules.
Employees
As of December 31, 2010, we employed approximately 550 full-time employees, none of whom is covered by a collective bargaining agreement. We believe the relationship with our employees is good.
Financial Information About Geographic Areas
For the years ended December 31, 2010, 2009 and 2008, approximately 93%, 96%, and 96%, respectively, of our consolidated revenues were generated from services provided within the United States. For both the years ended December 31, 2010 and 2009, approximately 94% of our long-lived assets were located within the United States.
Available Information
Our company internet address is www.epiqsystems.com. We make a variety of information available, free of charge, at our Investor Relations website, www.epiqsystems.com/investors.php, including our annual report on Form 10-K, our quarterly reports on Form 10-Q, our current reports on Form 8-K, and any amendments to those reports as soon as reasonably practicable after we electronically file those reports with or furnish them to the SEC, as well as our code of ethics and other governance documents.
The public may read and copy materials filed by us with the SEC at the SEC's Public Reference Room at 100 F Street, NE, Washington, DC 20549. The public may obtain information on the operation of the Public Reference Room by calling the SEC at 1-800-SEC-0330. The SEC maintains an internet site that contains reports, proxy and information statements and other information regarding issuers that file electronically with the SEC at www.sec.gov. The contents of these websites are not incorporated into this report. Further, our references to the URLs for these websites are intended to be inactive textual references only.
6
This report, other reports to be filed by us with the SEC, press releases made by us and other public statements by our officers, oral and written, contain or will contain forward-looking statements within the meaning of Section 27A of the Securities Act of 1933, as amended and Section 21E of the Securities Exchange Act of 1934, as amended, including those relating to the possible or assumed future results of operations and financial condition. Because those statements are subject to a number of uncertainties and risks, actual results may differ materially from those expressed or implied by the forward-looking statements. Listed below are risks associated with an investment in our securities that could cause actual results to differ from those expressed or implied. If any of the following risks occurs, our business, financial condition, results of operations and prospects could be materially adversely affected.
We compete with other third party providers on the basis of the technological features, capabilities and price of our products and services, and we could lose existing customers and fail to attract new business if we do not keep pace with technological changes and offer competitive pricing for our products and services.
The markets for our products and services are competitive, continually evolving and subject to technological change. We believe that key competitive factors in the markets we serve include the breadth and quality of system and software solution offerings, the stability of the information systems provider, the features and capabilities of the product and service offerings, the pricing of our products and services, and the potential for future product and service enhancements. Our success depends upon our ability to keep pace with technological change and to introduce, on a timely and cost-effective basis, new and enhanced software solutions and services that satisfy changing client requirements. If we do not keep pace with technological changes, we could lose existing customers and fail to attract new business. Likewise, technology products and services can become more price sensitive over time, and if we are not able to maintain price competitive products and services we could lose existing customers and fail to attract new customers. The impact of not keeping pace with technological changes or maintaining competitive pricing could adversely affect our results of operations.
Security problems with our software products, systems or services, including the improper disclosure of personal data, could cause increased service costs, harm our reputation, and result in liability and increased expense for litigation and diversion of management time.
We store and process large amounts of personally identifiable information. Our software products also enable our customers to store and process personal data. We have included security features in our products and processes that are intended to protect the privacy and integrity of data, including confidential client or consumer data. Security for our products and processes is critical given the confidential nature of the information contained in our systems. It is possible that our security controls, our selection and training of employees, and other practices we follow may not prevent the improper disclosure of personally identifiable information. Such disclosure could harm our reputation and subject us to liability in regulatory proceedings and private litigation under laws that protect personal data, resulting in increased costs or loss of revenue. Improper disclosure of personal data could result in lawsuits or regulatory proceedings alleging damages, and perceptions that our products and services do not adequately protect the privacy of personal information could inhibit sales of our products and services. Defending these types of claims could result in increased expenses for litigation and claims settlement and a significant diversion of our management's attention. Additionally, our software products, the systems on which the products are used, and our processes may not be impervious to intentional break-ins ("hacking") or other disruptive disclosures or problems, whether as a result of inadvertent third party action, employee action, malfeasance, or otherwise. Hacking or other disruptive problems could result in the diversion of our development resources, damage to our reputation, increased service costs and impaired market acceptance of our products, any of which could result in higher expenses or lower revenues.
7
Errors or fraud related to our business processes could cause increased expense for litigation and diversion of management attention.
We administer claims, disburse funds, generate and distribute legal notices and provide professional services for third parties. Errors or fraud could occur, for example, in the payment of settlement claims in a case we are administering for a customer. Errors or fraud related to the processing or payment of these claims or errors related to the delivery of professional services could result in the diversion of management resources, damage to our reputation, increased service costs or impaired market acceptance of our services, any of which could result in higher expenses and lower revenues. Additionally, these types of errors or fraud could result in lawsuits alleging damages. Defending these types of claims could result in increased expenses for litigation and claims settlement and a significant diversion of our management's attention.
Interruptions or delays in service at the data centers we utilize could impair the delivery of our service and harm our business.
We provide certain of our services through computer hardware that is located in data centers operated by unrelated third parties. We do not control the operation of these facilities, which increases our vulnerability to problems with the services they provide, and they are subject to damage or interruption from earthquakes, floods, fires, power loss, terrorist attacks, telecommunications failures and similar events. They are also subject to break-ins, sabotage, intentional acts of vandalism and similar misconduct. The occurrence of any of these events, a decision to close a facility without adequate notice, or other unanticipated problems at a facility could result in interruptions in certain of our services. In addition, the failure by our vendor to provide our required data communications capacity could result in interruptions in our service. Any damage to, or failure of, our systems or services could reduce our revenue, cause us to issue credits or pay penalties, cause customers to terminate their agreements with us and adversely affect our ability to secure business in the future. Our business will be harmed if our customers and potential customers believe our services are unreliable.
Releases of new software products or upgrades to our existing software products may have undetected errors, or may not achieve our customer's desired objectives, which could cause litigation claims against us, damage to our reputation, or loss of business.
Certain of our services utilize software solutions developed by us for the needs of our customers. We issue new releases of our software products to our customers periodically. Complex software products, such as those we offer, can contain undetected errors when first introduced or as new versions are released, or may fail to achieve the customer's desired objectives. Any introduction of new software products or upgrade to existing software products has a risk of undetected errors. These undetected errors may be discovered only after a product has been installed and used either in our internal processing or by our customers. Likewise, the software products we acquire in business acquisitions have a risk of undetected errors.
Any undetected errors, difficulties in installing and maintaining our software products or upgrade releases, difficulties training customers and their staffs on the utilization of new software products or upgrade releases, or the failure to achieve the customer's desired objectives, may result in a delay or loss of revenue, diversion of development resources, damage to our reputation, the loss of that customer, loss of future business, increased service costs, potential litigation claims against us, or impaired market acceptance of our products.
8
We rely on third-party hardware and software, which could cause errors or failures of our software or services.
We rely on hardware purchased or leased and software licensed from third parties for our service offerings. The hardware is typically standardized hardware from national vendors. The software licenses are generally standardized, commercial software licenses from national software vendors. We are generally able to select from a number of competing hardware and software applications, and, from time to time, we have changed the hardware and software technologies incorporated into our software products and solutions. Any errors or defects in third party hardware or software incorporated into our products could result in a failure of our service or errors in our software, which in turn could adversely affect our customer relationships and result in the loss of customers, the loss of future business, potential litigation claims against us, and damage to our reputation.
Revenue in our segments can be driven from key business arrangements with third parties including law firms, financial institutions, technology consultancies or other third parties where we serve the same ultimate consumers. The modification of business terms, the projected conclusion, or termination of any of those arrangements could cause uncertainty and adversely affect our future revenue and earnings.
We have various key arrangements in our businesses with law firms, technology consultancies and other third parties where we serve the same ultimate consumers. For example, as reported in this Form 10-K, we had an arrangement with IBM in support of the federal government's analog to digital conversion program which represented less than 1%, 12% and 22% of our consolidated revenue in the years ended December 31, 2010, 2009 and 2008, respectively. This specific arrangement concluded, as expected, in the second half of 2009. The modification of business terms, the intended conclusion, or the unpredicted termination of key business arrangements could cause uncertainty and adversely affect our future revenue or earnings.
We depend upon our key personnel, and we may not be able to retain them or to attract, assimilate and retain highly qualified employees in the future.
Our future success may depend upon the continued service of our senior management and certain of our key technical personnel and our continuing ability to attract, assimilate and retain highly qualified technical, managerial, and sales and marketing personnel. We do not have employment agreements with our Chief Executive Officer, President, or Chief Financial Officer. We maintain key-man life insurance policies on our Chief Executive Officer and our President. The loss of the services of any of these senior executives or other key personnel, including key sales professionals, or the inability to hire or retain qualified personnel in the future could have a material adverse impact on our results of operations.
The integration of acquired businesses is time consuming, may distract our management from our other operations, and can be expensive, all of which could reduce or eliminate our expected earnings.
We have acquired businesses in the past and we may consider opportunities in the future to acquire other companies, assets or product lines that complement or expand our business. If we are unsuccessful in integrating these companies or product lines with our existing operations, or if integration is more difficult than anticipated, we may experience disruptions to our operations. A difficult or unsuccessful integration of an acquired business could have an adverse effect on our results of operations.
Some of the risks that may affect our ability to integrate or realize any anticipated benefits from companies or businesses we acquire include those associated with:
- •
- unexpected losses of key employees or customers of the acquired business;
9
- •
- conforming standards, processes, procedures and controls of the acquired business with our operations;
- •
- increasing the scope, geographic diversity and complexity of our operations;
- •
- difficulties in transferring processes and know-how;
- •
- difficulties in the assimilation of acquired operations, technologies or products;
- •
- diversion of management's attention from other business concerns to the acquired business; and
- •
- adverse effects on existing business relationships with customers.
We continue to expand our business internationally, which subjects us to additional risks associated with these international operations.
We have expanded our business internationally with offices in London, Brussels and Hong Kong, primarily related to our eDiscovery business. We could expand other businesses internationally and we could enter other world markets. It requires significant management attention and financial resources to develop successful global markets. In addition, new operations in geographies we may enter may not be immune from possible government monitoring or intrusion.
Global operations are subject to additional inherent risks, including certain risks that are not present with our domestic operations, and our future results could be adversely affected by a variety of uncontrollable and changing factors. These include:
- •
- difficulties and costs in recruiting effective management for international operations;
- •
- foreign certification, licensing and regulatory requirements, which may be substantially more complex or burdensome than
our domestic requirements;
- •
- unexpected changes in foreign regulatory requirements;
- •
- risk associated with selecting or terminating partners for foreign expansions, including marketing agents, distributors or
other strategic partners for particular markets;
- •
- changes to or reduced protection of intellectual property rights in some countries;
- •
- risk associated with fluctuations in currency exchange rates;
- •
- consequences from changes in applicable international tax laws;
- •
- risk associated with local ownership and/or investment requirements, as well as difficulties in obtaining financing in
foreign countries for local operations;
- •
- political and economic instability, national calamities, war, and terrorism;
- •
- reduced protection of confidential consumer information in some countries; and
- •
- different or additional functionality requirements for our software and services.
Our intellectual property is not protected through patents or formal copyright registration. Therefore, we do not have the full benefit of patent or copyright laws to prevent others from replicating our software.
Our intellectual property rights are not protected through patents or formal copyright registration. We may not be able to protect our trade secrets or prevent others from independently developing substantially equivalent proprietary information and techniques or from otherwise gaining access to our trade secrets. Moreover, litigation may be necessary to enforce our intellectual property rights, to protect our trade secrets, to determine the validity and scope of the proprietary rights of others or to defend against claims of infringements. Litigation of this nature could result in substantial expense for
10
us and diversion of management and other resources, which could result in a loss of revenue and profits.
We may be sued by third parties for alleged infringement of their proprietary rights.
The software and internet industries are characterized by the existence of a large number of patents, trademarks, and copyrights and by frequent litigation based on allegations of infringement or other violations of intellectual property rights. We have received in the past, and may receive in the future, communications from third parties claiming that we have infringed on the intellectual property rights of others. Our technologies may not be able to withstand any third party claims or rights against their use. Any intellectual property claims, with or without merit, could be time-consuming and expensive to resolve, could divert management attention from executing our business plan, and could require us to pay monetary damages or enter into royalty or licensing agreements. In addition, certain customer agreements require us to indemnify our customers for third-party intellectual property infringement claims, which would increase the cost to us of an adverse ruling on such a claim. An adverse determination could also prevent us from offering our service to others, which could result in a loss of revenues and profits.
Future government legislation or changes in court rules could adversely affect one or more of our business segments.
Our products and services are not directly regulated by the government. Each of our three reporting segments and the customers served by those businesses are, however, directly or indirectly affected by federal and state laws and regulations and court rules. For example, bankruptcy reform legislation, class action and tort reform legislation and amendments to the Federal Rules of Civil Procedure regarding discovery of "electronically stored information" have all affected our customers, and indirectly, our business segments. Future federal or state legislation or court rules, or court interpretations of those laws and rules, could adversely affect the businesses we serve and thus could have an adverse impact on our revenues and results of operations.
Goodwill comprises a significant portion of our total assets. We assess goodwill for impairment at least annually, which could result in a material, non-cash write-down and could have a material adverse effect on our results of operations and financial condition.
The carrying value of our goodwill was approximately $294.8 million, or approximately 62% of our total assets, as of December 31, 2010. We assess goodwill for impairment on an annual basis at a reporting unit level. Goodwill is assessed between annual tests if an event occurs or circumstances change that would more likely than not reduce the fair value of a reporting unit below its carrying value. Our impairment reviews require extensive use of accounting judgment and financial estimates. Application of alternative assumptions and definitions, such as reviewing goodwill for impairment at a different organization level, could produce significantly different results. We may be required to recognize impairment of goodwill based on future economic factors such as unfavorable changes in our stock price and market capitalization or unfavorable changes in the estimated future discounted cash flows of our reporting units. Impairment of goodwill could result in material charges that could, in the future, result in a material, non-cash write-down of goodwill, which could have a material adverse effect on our results of operations and financial condition.
Due to the current economic environment and the uncertainties regarding the impact that future economic consequences will have on our reporting units, there can be no assurances that our estimates and assumptions regarding the duration of the economic recession, or the period or strength of recovery, made for purposes of our annual goodwill impairment test, will prove to be accurate predictions of the future. If our assumptions regarding forecasted revenues or margins of certain of our reporting units are not achieved, we may be required to record goodwill impairment losses in future
11
periods. It is not possible at this time to determine if any such future impairment loss would occur, and if it does occur, whether such charge would be material.
As of July 31, 2010, which is the date of our most recent impairment test, the fair value of the bankruptcy trustee management reporting unit had approximately $74.9 million of goodwill allocated to it, and the fair value of this reporting unit exceeded its carrying value by approximately 14%; the fair value of each of our other reporting units was substantially in excess of the carrying value of the reporting unit. The discount rate used in the income approach for determining the fair value of the trustee management reporting unit, evaluated at July 31, 2010, was 12.3%. An increase to the discount rate of 1% would have lowered the fair value determined under the income approach for this reporting unit by approximately $12.0 million, or 12%, which, with all other variables remaining the same, would result in the fair value of this reporting unit exceeding its carrying value by 1%.
In connection with the acquisition of Jupiter eSources LLC in the fourth quarter of 2010, we recognized $30.7 million of goodwill. See Note 13 of the Notes to Consolidated Financial Statements for further detail.
Our quarterly results have fluctuated in the past and may fluctuate in the future. If they do, our operating results may not meet the expectations of securities analysts or investors. This could cause fluctuations in the market price of our common stock.
Our quarterly results have fluctuated in the past and may fluctuate in the future. Our quarterly revenues and operating results can be difficult to forecast. Our business will continue to be affected by a number of factors, any one of which could substantially affect our results of operations for a particular fiscal quarter. Specifically, our quarterly results from operations can vary due to:
- •
- the initiation or termination of a large engagement;
- •
- the timing, size, cancellation or rescheduling of customer orders;
- •
- fluctuations in short-term interest rates or bankruptcy trustees' deposit balances;
- •
- unanticipated expenses related to software maintenance or customer service; and
- •
- unexpected legal or regulatory expenses.
It is possible that our future quarterly results from operations from time to time will not meet the expectations of securities analysts or investors. This could cause a material decrease in the market price of our common stock.
The market price of our common stock may be volatile even if our quarterly results do not fluctuate significantly.
Even if we report stable or increased earnings, the market price of our common stock may be volatile. There are a number of factors, beyond earnings fluctuations, that can affect the market price of our common stock, including the following:
- •
- a decrease in market demand for our stock;
- •
- downward revisions in securities analysts' estimates;
- •
- announcements of technological innovations or new products developed by us or our competitors;
- •
- legal proceedings;
- •
- the degree of customer acceptance of new products or enhancements offered by us; and
- •
- general market conditions and other economic factors.
12
In addition, the stock market has experienced significant price and volume fluctuations that have often been unrelated to the operating performance of particular companies. The market price of our common stock has been volatile and this is likely to continue.
We may not pay cash dividends on our common stock in the future and our common stock may not appreciate in value or even maintain the price at which it was purchased.
Although we historically did not pay cash dividends on our common stock, we initiated our first cash dividend on our common stock during fiscal year 2010. There is no assurance that we will continue to pay cash dividends on our common stock in the future. Certain provisions in our credit facility may restrict our ability to pay dividends in the future. Subject to any financial covenants in current or future financing agreements that directly or indirectly restrict the payment of dividends, the payment of dividends is within the discretion of our board of directors and will depend upon our future earnings and cash flow from operations, our capital requirements, our financial condition and any other factors that the board of directors may consider. Unless we continue to pay cash dividends on our common stock in the future, the success of an investment in our common stock will depend entirely upon its future appreciation. Our common stock may not appreciate in value or even maintain the price at which it was purchased.
Future sales of equity or debt securities could dilute existing shares.
We are authorized to issue up to 100,000,000 shares of common stock and 2,000,000 shares of preferred stock. The issuance of additional common stock and/or preferred stock in the future will reduce the proportionate ownership and voting power of our common stock held by existing stockholders. As of February 11, 2011, there were 35,200,972 shares of common stock outstanding and no shares of preferred stock outstanding. Any future issuances of our common stock would similarly dilute the relative ownership interest of our current stockholders, and could also cause the trading price of our common stock to decline.
Our articles of incorporation and Missouri law contain provisions that could be used by us to discourage or prevent a takeover of our company.
Some provisions of our articles of incorporation could make it more difficult for a third party to acquire control of our company, even if the change of control would be beneficial to certain shareholders. For example, our articles of incorporation include "blank check" preferred stock provisions, which permit our board of directors to issue one or more series of preferred stock without shareholder approval. In conjunction with the issuance of a series of preferred stock, the board is authorized to fix the rights of that series, including voting rights, liquidation preferences, conversion rights and redemption privileges. The board could issue a series of preferred stock to a friendly investor and use one or more of these features of the preferred stock to discourage or prevent a takeover of the company. Additionally, our articles of incorporation do not permit cumulative voting in the election of directors. Cumulative voting, if available, would enable minority shareholders to elect one or more representatives to the board in certain circumstances, which could be used by third parties to facilitate a takeover of our company that was opposed by our board or management.
In addition, the General and Business Corporation Law of Missouri, under which we are incorporated, provides that any merger involving the company must be approved by the holders of not less than two-thirds of the outstanding shares of capital stock entitled to vote on the merger. Presently, our only outstanding voting securities are our shares of common stock. Accordingly, shareholders with voting power over as little as one-third of our outstanding common stock could block a merger proposal, even if that merger proposal were supported by our board of directors or shareholders holding a majority of our then outstanding shares of common stock.
13
ITEM 1B. UNRESOLVED STAFF COMMENTS
None.
Our corporate headquarters are located in a 49,000-square-foot facility in Kansas City, Kansas. This owned property serves as collateral under our credit facility. We also have significant leased offices in New York City and in metropolitan Portland, Oregon, and maintain smaller leased offices in Chicago, Miami, Washington, D.C., Los Angeles, Hartford, Wilmington, Oklahoma City, London, Brussels, and Hong Kong.
Purported Derivative Shareholder Complaint
On July 29, 2008, the Alaska Electrical Pension Fund filed a putative shareholder derivative action on behalf of Epiq Systems, Inc. in the U.S. District Court for the District of Kansas (the "Court") (Civil Action No. 08-CV-2344 CM/JPO), alleging, among other things, improper conduct by each of our current directors and certain current and former executive officers and directors regarding stock option grants. We have stated consistently that the claims made in the action are meritless.
Also as previously reported, on April 27, 2010, on the determination of our board of directors, we entered into a Stipulation of Settlement (the "Settlement Agreement") with plaintiff and defendants relating to the settlement of this litigation and mutual release of claims, and we and our insurance carrier agreed to pay plaintiff's counsel's fees and expenses, which totaled $3.5 million. On June 22, 2010, the Court entered an order which, among other things, preliminarily approved the Settlement Agreement and scheduled a final hearing. On August 25, 2010, the Court entered a final order, dated August 24, 2010, approving the Settlement Agreement and dismissing with prejudice the lawsuit and all claims contained therein (the "Final Order"). During the third quarter of 2010, the settlement amount, which had been fully accrued for in prior periods, was paid by us and our insurance company. On or about September 24, 2010, the Final Order became final and non-appealable because no appeal was filed prior to such date.
14
ITEM 5. MARKET FOR THE REGISTRANT'S COMMON EQUITY, RELATED STOCKHOLDER MATTERS AND ISSUER PURCHASES OF EQUITY SECURITIES
Market Information
Our common stock is traded under the symbol "EPIQ" on the NASDAQ Global Market. The following table shows the reported high and low sales prices for our common stock for the calendar quarters of 2010 and 2009 as reported by NASDAQ.
| |
2010 | 2009 | |||||||||||
|---|---|---|---|---|---|---|---|---|---|---|---|---|---|
| |
High | Low | High | Low | |||||||||
First Quarter |
$ | 14.03 | $ | 11.62 | $ | 18.30 | $ | 14.41 | |||||
Second Quarter |
13.24 | 11.38 | 18.43 | 13.39 | |||||||||
Third Quarter |
13.44 | 12.06 | 16.31 | 14.50 | |||||||||
Fourth Quarter |
13.96 | 11.43 | 15.23 | 12.37 | |||||||||
Holders
As of February 11, 2011, there were approximately 42 owners of record of our common stock and approximately 4,300 beneficial owners of our common stock.
Dividends
For the first time in our history, we declared and paid cash dividends in fiscal 2010. On June 23, 2010 our board of directors declared our first cash dividend of $0.035 per share, payable on August 12, 2010 to shareholders of record at the close of business on July 15, 2010. On September 21, 2010, our board of directors declared another cash dividend of $0.035 per share, payable on November 18, 2010 to shareholders of record at the close of business on October 28, 2010. Total dividends declared and paid in 2010 totaled $1.6 million, or $0.07 per outstanding common share.
On January 17, 2011, our board of directors declared a cash dividend of $0.035 per outstanding common share, which was paid on February 17, 2011 to shareholders of record on January 27, 2011.
We do not have a formal dividend policy. We will determine if we will pay cash dividends on a quarterly basis and dividends may be declared at the discretion of our board of directors. There is no assurance that we will continue to pay cash dividends on our common stock in the future, or that any such dividends will be comparable to those previously declared. Any future declarations of dividends and the establishment of future record and payment dates are subject to the final determination of our board of directors.
Purchases of Equity Securities by the Issuer and Affiliated Purchasers
During 2010 our board of directors approved programs for us to repurchase up to $70.0 million of our common stock. Through December 31, 2010, we purchased 3.4 million shares of common stock for $43.2 million, at a weighted average cost of approximately $12.80 per share. Repurchases may be made from time to time at prevailing market prices in the open market or in privately negotiated purchases, or both. We may utilize one or more plans with its brokers or banks for pre-authorized purchases within defined limits pursuant to SEC Rule 10b5-1 to effect all or a portion of the repurchases.
Our stock repurchase authorization does not have an expiration date and the pace of our repurchase activity will depend on factors such as our working capital needs, our cash requirements for acquisitions and dividend payments, our debt repayment obligations or repurchases of our debt, our stock price, and economic and market conditions. Our stock repurchase program may be accelerated, suspended, delayed or discontinued at any time and without notice.
15
The following table presents the total number of shares purchased during the three months ended December 31, 2010, the average price paid per share, the number of shares that were purchased as part of a publicly announced repurchase program, and the maximum number (or approximate dollar value) of shares that may yet be purchased under a share repurchase program. In addition to the shares purchased under our share repurchase programs; we also have a policy that requires shares to be repurchased by the company to satisfy tax withholding obligations upon the vesting of restricted stock awards.
Period
|
Total Number of Shares Purchased |
Average Price Paid per Share(1) |
Total Number of Shares Purchased as Part of Publicly Announced Plans or Programs |
Maximum Number (or Approximate Dollar Value) of Shares that May Yet Be Purchased Under the Plans or Programs(1)(2) |
|||||||||
|---|---|---|---|---|---|---|---|---|---|---|---|---|---|
October 1 - October 31 |
— | — | — | $ | 35,000,000 | ||||||||
November 1 - November 30 |
801,077 | $ | 12.4112 | 801,077 | $ | 25,068,178 | |||||||
December 1 - December 31 |
251,923 | $ | 13.3771 | 251,923 | $ | 21,712,373 | |||||||
Total Activity for the Three Months Ended December 31, 2010 |
1,053,000 | $ | 12.7432 | 1,053,000 | $ | 21,712,373 | |||||||
- (1)
- Includes
brokerage commissions paid by the company.
- (2)
- On October 26, 2010, we announced that our board of directors authorized $35.0 million for share repurchases. This program has no stated expiration date.
Recent Sales of Unregistered Securities
None.
Performance Graph
The following Performance Graphs and related information shall not be deemed "soliciting material" or to be "filed" with the Securities and Exchange Commission, nor shall such information be incorporated by reference into any future filing under the Securities Act of 1933 or Securities Exchange Act of 1934, each as amended, except to the extent that we specifically incorporate it by reference into such a filing.
The following graphs show the total shareholder return of an investment of $100 in cash for (i) Epiq's common stock, (ii) the NASDAQ Stock Market Computer & Data Processing Index (the "NASDAQ Computer Index"), and (iii) the Standard & Poor's 500 Total Return Index (the "S&P 500 Index") for our last five fiscal years (December 31, 2005 through December 31, 2010) and for the period beginning on the date of our initial public offering through the end of the last fiscal year (February 4, 1997 through December 31, 2010). All values assume reinvestment of the full amount of any dividends. The NASDAQ Computer Index and the S&P 500 Index are calculated by Standard & Poor's Institutional Market Services.
The five-year graph assumes that $100.00 was invested in our common stock on December 31, 2005, at the price of $12.29 per share, the closing sales price on that date. The second graph assumes that $100.00 was invested in our common stock on February 4, 1997, the date of our initial public offering, at the price of $0.93 per share, the closing sales price on that date (after giving effect to the stock splits and stock dividends paid by Epiq). The closing sales prices were used for each index on December 31, 2005 or February 4, 1997, as applicable, and all dividends were reinvested. Shareholder returns over the indicated period should not be considered indicative of future shareholder returns.
16
Five-Year Performance Graph
COMPARISON OF CUMULATIVE TOTAL RETURN
AMONG EPIQ SYSTEMS, INC., S&P 500 TOTAL RETURN INDEX
AND NASDAQ COMPUTER & DATA PROCESSING INDEX
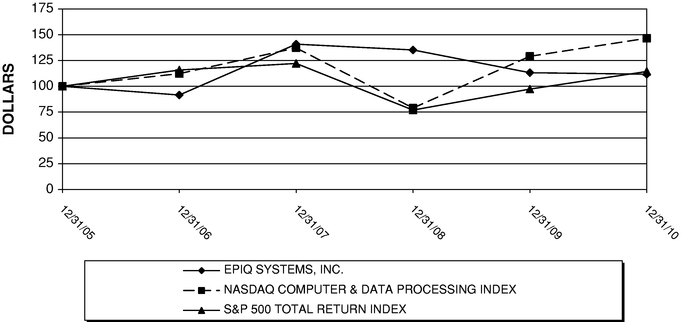
ASSUMES $100 INVESTED ON DEC. 31, 2005
ASSUMES DIVIDEND REINVESTED
FISCAL YEAR ENDING DEC. 31, 2010
Performance Graph Since Initial Public Offering
COMPARISON OF CUMULATIVE TOTAL RETURN
AMONG EPIQ SYSTEMS, INC., S&P 500 TOTAL RETURN INDEX
AND NASDAQ COMPUTER & DATA PROCESSING INDEX
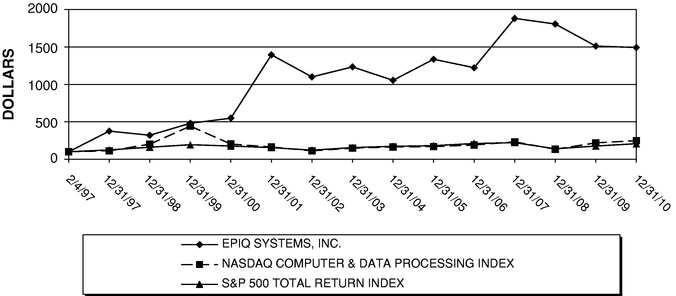
ASSUMES $100 INVESTED ON FEB. 4, 1997
ASSUMES DIVIDEND REINVESTED
FISCAL YEAR ENDING DEC. 31, 2010
17
ITEM 6. SELECTED FINANCIAL DATA
The following table presents selected historical financial data for the years ended December 31, 2010, 2009, 2008, 2007, and 2006.
| |
Year Ended December 31, | |||||||||||||||
|---|---|---|---|---|---|---|---|---|---|---|---|---|---|---|---|---|
| |
2010 | 2009 | 2008 | 2007 | 2006 | |||||||||||
| |
(in thousands, except per share data) |
|||||||||||||||
Income Statement Data: |
||||||||||||||||
Total revenue |
$ | 247,166 | $ | 239,071 | $ | 236,118 | $ | 174,413 | $ | 224,170 | ||||||
Income from operations |
28,469 | 28,211 | 25,821 | 22,876 | 71,225 | |||||||||||
Net income |
13,929 | 14,595 | 13,836 | 6,929 | 35,131 | |||||||||||
Diluted net income per share |
0.36 | 0.38 | 0.36 | 0.21 | 1.05 | |||||||||||
Cash dividends declared per common share |
0.07 | — | — | — | — | |||||||||||
Balance Sheet Data: |
||||||||||||||||
Total assets |
$ | 478,218 | $ | 437,941 | $ | 418,946 | $ | 392,794 | $ | 382,220 | ||||||
Long-term obligations |
86,860 | 4,654 | 55,310 | 58,266 | 83,873 | |||||||||||
In October 2003 we entered into a three-year arrangement related to our Chapter 7 bankruptcy trustee business that included various elements which had previously been provided on a standalone basis. As a result, for the final quarter of 2003 and for the years ended December 31, 2004 and 2005 we deferred substantially all of our Chapter 7 bankruptcy trustee revenue. The $59.7 million of revenue deferred during these periods related to this arrangement was recognized during the year ended December 31, 2006.
In November 2007, we completed a registered offering of 5,000,000 shares of common stock and received net proceeds of approximately $78.6 million.
All per share amounts have been adjusted to reflect the 3-for-2 stock split, effected as 50% stock dividend, paid on June 7, 2007 to holders of record as of May 24, 2007.
18
ITEM 7. MANAGEMENT'S DISCUSSION AND ANALYSIS OF FINANCIAL CONDITION AND RESULTS OF OPERATIONS
The following discussion and analysis of our consolidated results of operations and financial condition should be read in conjunction with the "Cautionary Statement Concerning Forward-Looking Statements," our "Risk Factors," "Selected Financial Data," and "Financial Statements and Supplementary Data" included in this Form 10-K.
Management's Overview
eDiscovery
Our eDiscovery segment provides collections and forensics, processing, search and review, and document review services to companies and the litigation departments of law firms. Our eDataMatrix® software analyzes, filters, deduplicates and produces documents for review. Produced documents are made available primarily through a hosted environment, and our DocuMatrix™ software allows for efficient attorney review and data requests. Our customers are typically large corporations that use our products and services cooperatively with their legal counsel to manage the e-discovery process for litigation and regulatory matters.
The substantial amount of electronic documents and other data used by businesses has changed the dynamics of how attorneys support discovery in complex litigation matters. Due to the complexity of cases, the volume of data that are maintained electronically, and the volume of documents that are produced in all types of litigation, law firms have become increasingly reliant on electronic evidence management systems to organize and manage the litigation discovery process.
Following is a description of the significant sources of revenue in our eDiscovery business.
- •
- Consulting, forensics and collection service fees based on the number of hours services are provided.
- •
- Fees related to the conversion of data into an organized, searchable electronic database. The amount earned varies
primarily on the number of documents.
- •
- Hosting fees based on the amount of data stored.
- •
- Document review fees based on the number of hours spent reviewing documents, the number of pages reviewed, or the amount of data reviewed.
In 2009 we opened new offices in Brussels and Hong Kong, established global reach for our offices and data centers in the U.S., Europe and Asia, and expanded our offerings to include data forensics and collections services, as well as document review services. In 2009 we also launched IQ Review™, a revolutionary combination of new intelligent technology and expert services which incorporates new prioritization technology into DocuMatrix™, our flagship document management platform. Increased case activity levels and an uptake of new service offerings launched in 2009 contributed to revenue grown in 2010, and is expected to continue into 2011.
Operating revenue exclusive of revenue originating from reimbursed direct costs in our eDiscovery segment was $81.1 million in 2010, which represented 37% of our consolidated total.
Bankruptcy Segment
Bankruptcy is an integral part of the United States' economy. As reported by the Administrative Office of the U.S. Courts for the fiscal years ended December 31, 2010, 2009, and 2008, there were approximately 1.59 million, 1.47 million, and 1.12 million new bankruptcy filings, respectively. Bankruptcy filings for the twelve-month period ended December 31, 2010 increased 8% versus the
19
twelve-month period ended December 31, 2009. During this period, Chapter 7 filings increased 8%, Chapter 11 filings fell 10%, and Chapter 13 filings increased 8%.
Our bankruptcy business provides solutions that address the needs of Chapter 7, Chapter 11, and Chapter 13 bankruptcy trustees to administer bankruptcy proceedings and of debtor corporations that file a plan of reorganization.
- •
- Chapter 7 is a liquidation bankruptcy for individuals or businesses that, as measured by the number of new cases
filed in the twelve-month period ended December 31, 2010, accounted for approximately 71% of all bankruptcy filings. In a Chapter 7 case, the debtor's assets are liquidated and the
resulting cash proceeds are used by the Chapter 7 bankruptcy trustee to pay creditors. Chapter 7 cases typically last several years.
- •
- Chapter 11 is a reorganization model of bankruptcy for corporations that, as measured by the number of new cases
filed in the twelve-month period ended December 31, 2010, accounted for approximately 1% of all bankruptcy filings. Chapter 11 generally allows a company, often referred to as the
debtor-in-possession, to continue operating under a plan of reorganization to restructure its business and to modify payment terms of both secured and unsecured obligations.
Chapter 11 cases generally last several years.
- •
- Chapter 13 is a reorganization model of bankruptcy for individuals that, as measured by the number of new cases filed in the twelve-month period ended December 31, 2010, accounted for approximately 28% of all bankruptcy filings. In a Chapter 13 case, debtors make periodic cash payments into a reorganization plan and a Chapter 13 bankruptcy trustee uses these cash payments to make monthly distributions to creditors. Chapter 13 cases typically last between three and five years.
The application of Chapter 7 bankruptcy regulations has the practical effect of discouraging trustee customers from incurring direct administrative costs for computer system expenses. As a result, we provide our Chapter 7 products and services to our trustee customers at no direct charge, and they maintain deposit accounts for bankruptcy cases under their administration at a designated banking institution. We have arrangements with various banks under which we provide the bankruptcy trustee case management software and related services, and the bank provides the bankruptcy trustee with deposit-related banking services. During the years ended December 31, 2010 and 2009, a majority of our Chapter 7 trustee clients' deposits were maintained at Bank of America.
Chapter 11 bankruptcy engagements are generally long-term, multi-year assignments that provide revenue visibility into future periods. For the Chapter 7 trustee services component of the bankruptcy segment, the increase in filings is expected to translate into growth in client deposit balances related to asset liquidations. Our trustee services deposit portfolio exceeded $2.0 billion throughout 2010, while pricing continued at floor pricing levels under our agreements due to the low short-term interest rate environment.
The key participants in a bankruptcy proceeding include the debtor-in-possession, the debtor's legal counsel, the creditors, the creditors' legal counsel, and the bankruptcy judge. Chapter 7 and Chapter 13 cases also include a professional bankruptcy trustee, who is responsible for administering the bankruptcy case. The end-user customers of our Chapter 7, Chapter 11, and Chapter 13 bankruptcy businesses are debtor corporations that file a plan of reorganization and professional bankruptcy trustees. The Executive Office for United States Trustees, a division of the U.S. Department of Justice, appoints all bankruptcy trustees. A United States Trustee is appointed in most federal court districts and generally has responsibility for overseeing the integrity of the bankruptcy system. The bankruptcy trustee's primary responsibilities include liquidating the debtor's assets or collecting funds from the debtor, distributing the collected funds to creditors pursuant to the orders of the bankruptcy court and
20
preparing regular status reports for the Executive Office for United States Trustees and for the bankruptcy court. Trustees manage an entire caseload of bankruptcy cases simultaneously.
On October 1, 2010, we completed the acquisition of Jupiter eSources LLC. The purchase price was comprised of $60.0 million of cash, $8.4 million of which was withheld for any claims for indemnification, and purchase price adjustments. In addition, there is contingent consideration related to an earn-out opportunity based on future revenue growth. The potential undiscounted amount of all future payments that we could be required to make under the earn-out opportunity is between $0 and $20 million over a four year period. The transaction was funded from our credit facility. See Note 13 of the Notes to Consolidated Financial Statements for further detail.
Through this purchase, we acquired a proprietary software product, AACER® (Automated Access to Court Electronic Records), that assists creditors including banks, mortgage processors, and their administrative services professionals to streamline processing of their portfolios of loans in bankruptcy cases. The AACER® product electronically monitors developments in all U.S. bankruptcy courts and applies sophisticated algorithms to classify docket filings automatically in each case to facilitate the management of large bankruptcy claims operations. By implementing the AACER® solution, clients achieve greater accuracy in faster timeframes, with a significant cost savings compared to manual attorney review of each case in the portfolio.
Following is a description of the significant sources of revenue in our bankruptcy business.
- •
- Data hosting fees and volume-based fees.
- •
- Case management professional service fees and other support service fees related to the administration of cases, including
data conversion, claims processing, claims reconciliation, professional services, and disbursement services.
- •
- Deposit-based fees, earned primarily on a percentage of Chapter 7 total liquidated assets placed on deposit with a
designated financial institution by our trustee clients, to whom we provide, at no charge, software licenses, limited hardware and hardware maintenance, and postcontract customer support services. The
fees we earn based on total liquidated assets placed on deposit by our trustee clients may vary based on fluctuations in short-term interest rates.
- •
- Legal noticing services to parties of interest in bankruptcy matters, including direct notification and media campaign and
advertising management in which we coordinate notification, primarily through print media outlets, to potential parties of interest for a particular client engagement.
- •
- Reimbursement for costs incurred, primarily related to postage on mailing services.
- •
- Monitoring and noticing fees earned based on monthly or on-demand requests for information provided through our AACER® software product.
Operating revenue exclusive of revenue originating from reimbursed direct costs in our bankruptcy segment was $97.2 million in 2010, which represented 45% of our consolidated total.
Settlement Administration Segment
Our settlement administration segment provides managed services, including legal notification, claims administration, project administration and controlled disbursement.
The customers of our settlement administration segment are companies that require the administration of a settlement, resolution of a class action matter, or administration of a project. We sell our services directly to these customers and other interested parties, including legal counsel, which often provide access to these customers. During the years ended December 31, 2010, 2009 and 2008, less than 1%, 12%, and 22%, respectively, of our consolidated revenue was derived from a large
21
contract with IBM in support of the federal government's analog to digital conversion program. The contract began in the fourth quarter of 2007 and, as expected, wound-down in 2009.
Following is a description of the significant sources of revenue in our settlement administration business.
- •
- Fees contingent upon the month-to-month delivery of case management services such as claims
processing, claims reconciliation, project management, professional services, call center support, website development and administration, and controlled disbursements. The amount we earn varies
primarily on the size and complexity of the engagement.
- •
- Legal noticing services to parties of interest in class action matters; including media campaign and advertising
management, in which we coordinate notification through various media outlets, such as print, radio and television, to potential parties of interest for a particular client engagement.
- •
- Reimbursement for costs incurred related to postage on mailing services.
Key participants in this marketplace include law firms that specialize in representing class action and mass tort plaintiffs and other law firms that specialize in representing defendants. Class action and mass tort refers to litigation in which class representatives bring a lawsuit against a defendant company or other persons on behalf of a large group of similarly affected persons. Mass tort refers to class action cases that are particularly large or prominent. Class action and mass tort litigation is often complex and the cases, including administration of any settlement, may last several years.
Operating revenue exclusive of revenue originating from reimbursed direct costs in our settlement administration segment was $39.2 million in 2010, which represented 18% of our consolidated total.
Results of Operations for the Year Ended December 31, 2010 Compared with the Year Ended December 31, 2009
Consolidated Results of Operations
Revenue
Total revenue was $247.2 million in 2010, an increase of $8.1 million, or 3%, as compared to $239.1 million in the prior year. A portion of our total revenue consists of reimbursement for direct costs we incur, such as postage related to document management services. We reflect the operating revenue from these reimbursed direct costs as a separate line item on our accompanying Consolidated Statements of Income. Revenue originating from reimbursed direct costs was $29.6 million, a decrease of $0.9 million, or 3%, from $30.5 million in the prior year. Although operating revenue from reimbursed direct costs may fluctuate significantly from period to period, these fluctuations have a minimal effect on our income from operations as we realize little or no margin from this revenue.
Operating revenue exclusive of revenue originating from reimbursed direct costs was $217.6 million in 2010, an increase of $9.1 million as compared to $208.5 million in the prior year. The increase consisted of a $25.3 million increase in the eDiscovery segment and a $6.2 million increase in the bankruptcy segment; offset by a $22.5 million decrease in the settlement administration segment. Changes by segment are discussed below.
Operating Expenses
The direct cost of services, exclusive of depreciation and amortization, was $68.5 million in 2010, a decrease of $3.4 million, or 5%, as compared to $71.9 million in the prior year. Contributing to this decrease was a $2.3 million decrease in the expense related to outside services, primarily related to temporary help and mailing; and a $2.8 million decrease in production supplies. These decreases were
22
partially offset by costs of services of the AACER® product of $1.6 million for which there is no comparable prior year cost. Changes by segment are discussed below.
The direct cost of bundled products and services, exclusive of depreciation and amortization, was $3.5 million in 2010 and in 2009. Changes by segment are discussed below.
Reimbursed direct costs decreased $1.5 million, or 5%, to $28.7 million in 2010, as compared to $30.2 million in the prior year. This decrease corresponded to the decrease in revenue originating from reimbursed direct costs. Changes by segment are discussed below.
General and administrative costs increased $7.2 million, or 9%, to $85.6 million in 2010 compared to $78.4 million in the prior year. Compensation related expense increased $4.6 million; a litigation provision for a shareholder derivative action of $1.6 million was recorded in 2010, compared to $0.5 million in 2009; travel expense increased $1.3 million; lease expense increased $1.2 million; and maintenance expense increased $0.6 million. These increases were partially offset by a $1.6 million decrease in share-based compensation expense. Changes by segment are discussed below.
Depreciation and software and leasehold amortization costs in 2010 were $20.4 million, an increase of $1.6 million, or 9%, compared to $18.8 million in the prior year. This increase was primarily the result of increased depreciation on equipment related to investments in our business segments.
Amortization of identifiable intangible assets in 2010 was $9.2 million, an increase of $1.8 million, or 24%, compared to $7.4 million in the prior year. The increase is due to intangibles associated with the 2010 acquisition of Jupiter eSources LLC.
Other operating expense in 2010 of $2.8 million increased $2.2 million, compared to $0.6 million in the prior year, due to acquisition-related expenses.
Interest Expense, Net
Interest expense was $1.9 million, compared to $1.5 million in the prior year, an increase of $0.4 million, or 31%. In 2010 interest expense was primarily comprised of interest on borrowings on our senior revolving loan; and interest expense related to our convertible notes, through their maturity in June 2010. In the prior year we had a full year of interest expense on the convertible notes; which was partially offset by the benefit of the amortization of the embedded option related to the convertible notes.
Income Taxes
Our effective tax rate for 2010 was 47.6% compared with an effective rate of 45.7% for the prior year. The increase compared to the prior year was primarily related to an increase in state income taxes, including the impact of the completion of the New York State audit. State taxes, non-deductible equity compensation and foreign losses on which we have recorded valuation allowances were the primary reasons our tax rate was higher than the statutory federal rate of 35%. The research credit was renewed in December 2010 and a resulting benefit was recognized during the fourth quarter. We have significant operations located in New York City that are subject to state and local tax rates that are higher than the tax rates assessed by other jurisdictions where we operate.
Net Income
We had net income of $13.9 million for 2010 compared to $14.6 million for the prior year, a decrease of $0.7 million, or 5%. The change from the prior year was the result of growth in our eDiscovery and bankruptcy segments, offset by net acquisition-related costs for the fourth quarter acquisition of Jupiter eSources LLC, an increase in net costs related to the litigation settlement for a shareholder derivative action of approximately $1.1 million pretax, and a decline in our settlement
23
administration segment, due primarily to the conclusion of the analog to digital conversion contract in the latter part of 2009.
Results of Operations by Segment
The following segment discussion is presented on a basis consistent with our segment disclosure contained in Note 14 of our Notes to Consolidated Financial Statements.
eDiscovery Segment
eDiscovery operating revenue before reimbursed direct costs in 2010 was $81.1 million, an increase of $25.3 million, or 45%, compared to $55.8 million in the prior year. The change from the prior year is primarily related to higher case activity levels both domestically and internationally, and a growing contribution from newer service offerings.
eDiscovery direct and administrative costs, including reimbursed direct costs, were $46.0 million in 2010, an increase of $8.3 million, or 22%, compared to $37.7 million in the prior year. This change was a result of a net increase in direct and administrative costs, which were primarily in support of expanded business services, compared to the prior year.
Bankruptcy Segment
Bankruptcy operating revenue before reimbursed direct costs was $97.2 million in 2010, an increase of $6.2 million, or 7%, compared to $91.0 million in the prior year. This increase was primarily attributable to the high number of active corporate restructuring cases, as well as an increase in bankruptcy trustee fees, associated with higher average deposit balances; and the contribution of revenue from the AACER® product.
Bankruptcy direct and administrative costs, including reimbursed direct costs, were $53.1 million in 2010, a decrease of $1.1 million, or 2%, compared to $54.2 million in the prior year. The decreases in these costs were primarily related to a decrease of $2.9 million in outside services; partially offset by an increase of $1.9 million in compensation related expense.
Settlement Administration
Settlement administration operating revenue before reimbursed direct costs was $39.2 million in 2010, a decrease of $22.5 million, or 36%, compared to $61.7 million in the prior year, primarily due to the expected conclusion of the major analog to digital conversion contract in the latter part of 2009.
Settlement administration direct and administrative costs, including reimbursed direct costs, were $55.1 million in 2010, a decrease of $10.1 million, or 16%, compared to $65.2 million in the prior year, primarily due to the direct and administrative costs associated with the conclusion of the major analog to digital conversion contract in the latter part of 2009.
Results of Operations for the Year Ended December 31, 2009 Compared with the Year Ended December 31, 2008
Consolidated Results of Operations
Revenue
Total revenue was $239.1 million in 2009, an increase of $3.0 million, or 1%, as compared to $236.1 million in the prior year. A portion of our total revenue consists of reimbursement for direct costs we incur, such as postage related to document management services. We reflect the operating revenue from these reimbursed direct costs as a separate line item on our accompanying Consolidated Statements of Income. Revenue originating from reimbursed direct costs was $30.5 million, an increase
24
of $2.2 million, or 8%, from $28.3 million in the prior year. Although reimbursed operating revenue may fluctuate significantly from period to period, these fluctuations have a minimal effect on our income from operations as we realize little or no margin from this revenue.
Operating revenue exclusive of revenue originating from reimbursed direct costs was $208.5 million in 2009, an increase of $0.6 million as compared to $207.9 million in the prior year. The increase consisted of a $31.2 million increase in the bankruptcy segment, offset by a $28.2 million decrease in the settlement administration segment, and a $2.3 million decrease in the eDiscovery segment. Changes by segment are discussed below.
Operating Expenses
The direct cost of services, exclusive of depreciation and amortization, was $71.9 million in 2009, a decrease of $10.0 million, or 12%, as compared to $81.9 million in the prior year. Contributing to this decrease was a $9.8 million decrease in the cost of outside services, primarily related to telephone, mailing and temporary help services, and a $5.6 million decrease in legal noticing. These declines were partially offset by $4.8 million increase in compensation related expense, and a $0.9 million increase in software maintenance costs. Changes by segment are discussed below.
The direct cost of bundled products and services, exclusive of depreciation and amortization, was $3.5 million in 2009, a decrease of $0.1 million, or 3%, compared to $3.6 million in the prior year. Changes by segment are discussed below.
Reimbursed direct costs increased in 2009 to $30.2 million compared to $28.1 million in the prior year. This increase corresponded to the increase in revenue originating from reimbursed direct costs. Changes by segment are discussed below.
General and administrative costs increased $7.3 million, or 10%, to $78.4 million in 2009 compared to $71.1 million in the prior year. Contributing to this increase was a $6.1 million increase in share-based compensation expense, which was the result of the timing of when certain awards were granted. There were no share-based awards granted to executive management in fiscal year 2008, and awards pertaining to both 2008 and 2009 were granted in fiscal year 2009. Expense related to cash based incentive awards to executive management in 2009 was $0.2 million compared to $2.4 million in the prior year. Compensation, commission and benefits expense increased $0.8 million, primarily resulting from expanded staffing to meet client demands; data line and telephone expense increased $0.8 million, due primarily to data center expansion; expense related to outside services increased $0.6 million; and $0.5 million of expense in 2009 related to a litigation settlement reserve. Partially offsetting these increases were a $1.2 million decrease in professional fees, due primarily to a decline in legal fees; and a $0.7 million decrease in travel expense, related to expense management measures in 2009. Changes by segment are discussed below.
Depreciation and software and leasehold amortization costs in 2009 were $18.8 million, an increase of $2.5 million, or 15%, compared to $16.3 in the prior year. This increase was primarily the result of increased software amortization expense and increased hardware depreciation largely related to investment in our eDiscovery segment.
Amortization of identifiable intangible assets in 2009 was $7.4 million, a decrease of $1.7 million, or 18%, compared to $9.1 million in the prior year. This decrease was primarily the result of certain non-compete and customer contract intangible assets that were fully amortized during the year.
Other operating expense in 2009 of $0.6 million increased $0.4 million, compared to $0.2 million in the prior year. Expense in 2009 was primarily comprised of acquisition-related expense, and in 2008, other operating expense was comprised of $2.1 million of expense related to potential acquisitions and non-capitalized acquisition related expenses, and a $2.4 million gain related to interest rate floor options purchased during 2007 and recognized in 2008.
25
Interest Expense, Net
Interest expense was $1.5 million, compared to $1.8 million in the prior year, a decrease of $0.3 million, or 16%. Contributing to the decline was a $0.1 million decrease in loan fee amortization and a $0.1 million decrease in other interest expense.
During April 2007, the holders of the contingent convertible subordinated notes exercised their right to extend the maturity of the convertible notes from June 2007 to June 2010. As a result, we continued to pay interest, at a rate of 4% per annum, during the extension period on any convertible notes that remained outstanding through June 15, 2010. The holders of the convertible notes could chose at any time on or prior to June 15, 2010 to convert some or all of the notes into our common shares. See Note 5 of the Notes to Consolidated Financial Statements for additional information regarding this conversion right.
We estimated the fair value of the option to extend immediately prior to the note holders' vote to extend and recorded a final adjustment to the fair value of the option to extend the subordinated convertible notes' maturity. We amortized the exercise date fair value of the option as a reduction to interest expense over the term of the extension. During both 2009 and 2008 we recognized a reduction to interest expense of approximately $1.6 million related to the amortization of the carrying value of the option to extend the maturity term subsequent to the extension date.
Income Taxes
Our effective tax rate for 2009 was 45.7% compared with an effective rate of 43.2% for the prior year. The increase compared to the prior year was primarily related to non-deductible equity compensation in 2009 for which a comparable expense did not exist in the prior year and approximately $0.9 million of additional state income taxes, offset by $0.9 million of both research credits and benefits related to the domestic production activities deduction. State taxes, non-deductible equity compensation and foreign losses on which we have recorded valuation allowances were the primary reasons our tax rate was higher than the statutory federal rate of 35%. We have significant operations located in New York City that are subject to state and local tax rates that are higher than the tax rates assessed by other jurisdictions where we operate.
Net Income
We had net income of $14.6 million for 2009 compared to $13.8 million for the prior year, an increase of $0.8 million, or 5%. Strong growth in our bankruptcy segment, driven primarily by an increase in corporate restructuring engagements, was offset in part by declines in our eDiscovery segment, driven by lower revenues related to the then current economic climate and lower pricing, as well as an increase in expense related to the expansion of service and geographic expansion of the business; a decline in our settlement administration segment, driven primarily by the wind down of the analog to digital conversion contract in 2009; an increase in share-based compensation expense, the result of there being no share-based awards granted to executive management in fiscal year 2008, while awards pertaining to both 2008 and 2009 were granted in fiscal year 2009; a decline in cash based incentive awards granted to executive management in 2009 compared to the prior year; a decline in other operating income due to the gain on the interest rate floor options recognized in the prior year; and an increase in our 2009 effective tax rate, resulting in higher tax expense, due to the items mentioned above.
Results of Operations by Segment
The following segment discussion is presented on a basis consistent with our segment disclosure contained in Note 14 of our Notes to Consolidated Financial Statements.
26
eDiscovery Segment
eDiscovery operating revenue before reimbursed direct costs in 2009 was $55.8 million, a decrease of $2.3 million, or 4%, compared to $58.1 million in the prior year. The change from the prior year primarily related to a slower pace in the start-up of litigation matters in 2009, as well as industry pricing pressures, the impact of which was an approximate 16% decline in the average price of services, both of which can be attributed to the then current economic climate. We believe the national financial, banking and economic crisis that began in the fourth quarter of 2008 and that continued in 2009 had a direct effect on the volume of eDiscovery in litigation and regulatory proceedings in 2009.
eDiscovery direct and administrative costs, including reimbursed direct costs, were $37.7 million in 2009, an increase of $5.7 million, or 18%, compared to $32.0 million in the prior year. This increase was due to a $2.8 million increase in compensation related expense, a $1.1 million increase in building and equipment lease expense and utility expense, a $1.0 million increase in outside services, and a $0.9 million increase in software maintenance costs. The increases in expense were primarily related to the expansion of service offerings and geographic expansion, including certain costs related to data center expansion.
Bankruptcy Segment
Bankruptcy operating revenue before reimbursed direct costs was $91.0 million in 2009, an increase of $31.2 million, or 52%, compared to $59.8 million in the prior year. This increase was primarily attributable to an increase in corporate restructuring engagements, which is the direct result of an increase in Chapter 11 bankruptcy filings. Corporate restructuring engagements are generally long-term, multi-year assignments.
The increase in revenue related to corporate restructuring engagements was slightly offset by a decline in Chapter 7 bankruptcy trustee fees. The Chapter 7 fees reflect year-end deposit portfolio increasing 27% in 2009 compared to 2008, and the impact of lower pricing, resulting from short-term interest rates lowering our pricing formulas to floor levels. Short-term interest rates began declining in the fourth quarter of 2008 and continued to decline in 2009.
Bankruptcy direct and administrative costs, including reimbursed direct costs, were $54.2 million in 2009, an increase of $20.1 million, or 59%, compared to $34.1 million in the prior year. The increases in these costs were directly related to the increase in corporate restructuring engagements, as we expanded our capacity to support increased volumes. Compensation related expense increased $6.7 million, expense related to outside services increased $4.4 million, call center expense increased $1.9 million, legal notification costs increased $0.7 million, and building and equipment lease expense increased $0.3 million. Also contributing to the increase in costs was an increase in reimbursed direct costs of $5.7 million, which directly corresponded to the increase in revenue originating from reimbursed direct costs.
Settlement Administration
Settlement administration operating revenue before reimbursed direct costs was $61.7 million in 2009, a decrease of $28.2 million, or 31%, compared to $89.9 million in the prior year, primarily due to the planned wind down of the major analog to digital conversion contract during 2009, which declined $21.0 million from the prior year, as well as a decrease in legal notification and settlement revenue of $7.7 million.
Settlement administration direct and administrative costs, including reimbursed direct costs, were $65.2 million in 2009, a decrease of $28.0 million, or 30%, compared to $93.2 million in the prior year, primarily due to the planned wind down of the major analog to digital conversion contract during 2009, which resulted in a $17.8 million decrease in costs from the prior year; as well as a decrease of $9.3 million in legal noticing, outside services and production supplies expenses from the prior year.
27
Liquidity and Capital Resources
Cash Flows
Fiscal year 2010
Cash Flows from Operating Activities
During the year ended December 31, 2010, our operating activities provided net cash of $34.4 million. Contributing to net cash provided by operating activities was net income of $13.9 million; and non-cash expenses, such as depreciation and amortization and share-based compensation expense, of $38.1 million. These items were partially offset by a $17.6 million net use of cash resulting from changes in operating assets and liabilities. The most significant changes in operating assets and liabilities were a $17.0 million increase in trade accounts receivable, which was primarily due to an increase in fourth quarter sales as compared to the prior year, and a $1.1 million increase in accounts payable. Trade accounts receivable will fluctuate from period to period depending on the timing of sales and collections. Accounts payable will fluctuate from period to period depending on the timing of purchases and payments.
Cash Flows from Investing Activities
During the year ended December 31, 2010, we used cash of $51.5 million (net of cash acquired) for the acquisition of Jupiter eSources LLC. We used $11.1 million for purchases of property and equipment, including computer hardware. Enhancements to our existing software and the development of new software is essential to our continued growth, and, during 2010, we used cash of $8.1 million to fund internal costs related to the development of software for which technological feasibility had been established. We believe that cash generated from operations will be adequate to fund our anticipated property, equipment and software spending over the next year.
Cash Flows from Financing Activities
During the year ended December 31, 2010, we borrowed $78.0 million under our senior revolving loan, and had net proceeds from stock issued in connection with the exercise of employee stock options of $1.5 million. This cash provided by financing activities was offset by the use of cash of $44.2 million for the purchase of our common stock, including $43.2 million for the purchase of shares under our Share Repurchase Program, and $1.0 million for the purchase of shares required to satisfy tax withholding obligations upon the vesting of restricted stock awards. We also used cash of $22.8 million upon maturity of our contingent convertible subordinated notes ("convertible notes"), paid $11.0 million on our senior revolving loan, used cash of $4.7 million for the payment of long-term obligations, including capital lease payments, $1.5 million for debt issuance costs related to the amendment of our revolving credit facility, and $2.6 million for dividends paid on our common shares.
Recent financing activities
Contingent Convertible Subordinated Notes: On or about June 11, 2010, prior to the maturity date, $27.2 million of convertible notes were converted into 2.3 million shares of common stock at a conversion price of $11.67. On June 15, 2010, the remaining convertible notes matured, resulting in a cash payment of $22.8 million, plus accrued interest. The original $50.0 million of convertible notes were issued in June 2004 with a fixed 4% per annum interest rate and an original maturity of June 15, 2007. The holders of the convertible notes had the right to extend the maturity date by up to three years. In April 2007, the holders exercised this right and the maturity date of the convertible notes was extended to June 15, 2010.
Revolving Credit Agreement: We amended our credit facility during the second quarter of 2010 to increase the aggregate amount of funds available from $100.0 million to $140.0 million and to extend
28
the maturity date to June 2014. During the term of the credit facility, we have the right, subject to compliance with our covenants, to increase the borrowings to $200.0 million. The credit facility is secured by liens on our land and buildings and a significant portion of our furniture and equipment. At December 31, 2010, we had borrowings of $67.0 million under this facility. At December 31, 2009, we did not have any borrowings outstanding under our senior revolving loan. At December 31, 2010, the amount available for borrowings under the credit facility is reduced by the $67.0 million outstanding and $1.1 million in outstanding letters of credit.
Borrowings under the senior revolving loan bear interest at various rates based on our leverage ratio with two rate options at the discretion of management as follows: (1) for base rate advances, borrowings bear interest at prime rate plus 100 to 200 basis points; (2) for LIBOR rate advances, borrowings bear interest at LIBOR rate plus 225 to 325 basis points. At December 31, 2010, borrowings of $67.0 million under this facility had a weighted average interest rate of 2.50%. The average amount of borrowings under this facility in 2010 was $53.8 million, at a weighted average interest rate of 2.74%. The maximum month-end amount outstanding during 2010 was $67.0 million.
The credit facility contains financial covenants related to earnings before interest, provision for income taxes, depreciation, amortization, and other adjustments as defined in the agreement, and total debt. In addition, the credit facility also contains financial covenants related to senior debt, fixed charges, and working capital. As of December 31, 2010, significant financial covenants, all as defined in our credit facility agreement, include a leverage ratio not to exceed 3.00 to 1.00, a fixed charge coverage ratio of not less than 1.25 to 1.00, and a current ratio of not less than 1.50 to 1.00. As of December 31, 2010 and 2009, we were in compliance with all financial covenants.
Other restrictive covenants contained in our credit facility include limitations on incurring additional indebtedness and completing acquisitions. We generally cannot incur indebtedness outside the credit facility, with the exceptions of up to $15.0 million of capital leases, and subordinated debt up to $100.0 million. Generally, for acquisitions we must be able to demonstrate that, on a pro forma basis, we would be in compliance with our covenants during the four quarters prior to the acquisition, and bank permission must be obtained for acquisitions in which cash consideration exceeds $80.0 million or total consideration exceeds $125.0 million.
Share Repurchase Program: During 2010 our board of directors authorized $70.0 million for share repurchases. Through December 31, 2010, we purchased 3.4 million shares of common stock for $43.2 million, at a weighted average cost of approximately $12.80 per share.
Dividends: During 2010, we paid cash dividends of $2.6 million, or $0.07 per share. On January 17, 2011, our board of directors declared a cash dividend of $0.035 per outstanding common share, which was paid on February 17, 2011 to shareholders of record on January 27, 2011.
We believe that funds generated from operations, plus our existing cash resources and amounts available under our credit facility, will be sufficient to meet our currently anticipated working capital requirements, internal software development expenditures, property, equipment and third party software expenditures, deferred acquisition price agreements, capital leases, interest payments due on our outstanding borrowings, and other contractual obligations.
In addition, we believe we could fund any future acquisitions, dividend payments, or common stock repurchases with our internally available cash, cash generated from operations, our existing available debt capacity, or from the issuance of additional securities.
Unrecognized Tax Benefits: As illustrated in the contractual obligations table below, we have approximately $2.8 million of unrecognized tax benefits that have been recorded as liabilities, and we are uncertain as to whether, or when, such amounts may be settled. Settlement of such amounts could require the use of working capital.
29
Fiscal year 2009
Cash Flows from Operating Activities
During the year ended December 31, 2009, our operating activities provided net cash of $51.8 million. Contributing to net cash provided by operating activities was net income of $14.6 million; and non-cash expenses, such as depreciation and amortization, bad debt expense and share-based compensation expense, of $36.7 million. The changes in operating assets and liabilities primarily consisted of a $3.5 million decrease in trade accounts receivable and other assets, offset by a decrease of $1.3 million in accounts payable and other liabilities, and a $1.6 million decrease in deferred revenue. Trade accounts receivable will fluctuate from period to period depending on the timing of sales and collections. Accounts payable will fluctuate from period to period depending on the timing of purchases and payments.
Cash Flows from Investing Activities
During the year ended December 31, 2009, we used cash of approximately $10.3 million for purchases of property and equipment, including computer hardware, purchased software licenses primarily for our eDiscovery business, and purchased computer hardware primarily for our bankruptcy trustee business. Enhancements to our existing software and the development of new software is essential to our continued growth, and, during 2009, we used cash of $7.6 million to fund internal costs related to the development of software for which technological feasibility had been established. Our property, equipment and third-party software purchases consisted primarily of computer-related hardware, purchased software, and leasehold improvements. We believe that cash generated from operations will be adequate to fund our anticipated property, equipment and software spending over the next year.
Cash Flows from Financing Activities
During the year ended December 31, 2009, we used cash to pay approximately $6.1 million as a principal reduction on our deferred acquisition notes and capital lease payments, and $1.8 million to acquire treasury stock related to shares used to satisfy tax withholding upon the vesting of restricted stock awards. This financing use of cash was partially offset by $2.9 million of net proceeds from stock issued in connection with the exercise of employee stock options. We also recognized a portion of the tax benefit related to the exercise of stock options as a financing source of cash.
As of December 31, 2009 and 2008, our borrowings consisted of $50.7 million and $52.3 million, respectively, including the fair value of the embedded option, of contingent convertible subordinated notes, which bore interest at 4% based on the $49.9 million and $50.0 million, respectively, of principal amount outstanding; and approximately $8.1 million and $8.9 million, respectively, of obligations related to capital leases and deferred acquisition price payments. During 2007, the term of our contingent convertible subordinated notes was extended to June 15, 2010. The holders of the contingent convertible subordinated notes had the right to convert at a price of approximately $11.67 per share. The notes required the use of $49.9 million of cash at the extended maturity date of June 15, 2010 if the remaining note holders did not convert their notes into shares of our common stock. One holder of the notes converted a nominal principal amount of the notes into shares of common stock in 2009. On or about June 15, 2010, prior to the maturity date, $27.2 million of convertible notes were converted into 2.3 million shares of common stock at a conversion price of $11.67. On June 15, 2010, the remaining convertible notes matured, resulting in a cash payment of $22.8 million, plus accrued interest.
As of December 31, 2009 and December 31, 2008, we did not have any borrowings outstanding under our $100.0 million senior revolving loan. As of December 31, 2009, significant financial covenants, all as defined in our credit facility agreement, include a leverage ratio not to exceed 3.00 to
30
1.00, a fixed charge coverage ratio of not less than 1.25 to 1.00, and a current ratio of not less than 1.50 to 1.00. As of December 31, 2009 and December 31, 2008, we were in compliance with all financial covenants.
Off-balance Sheet Arrangements
Although we generally do not utilize off-balance sheet arrangements in our operations, we enter into operating leases in the normal course of business. Our operating lease obligations are disclosed below under "Contractual Obligations" and also in Note 6 of the Notes to Consolidated Financial Statements.
Contractual Obligations
As of December 31, 2010, we had $67.0 million outstanding under our senior revolving loan. To determine the amount that we may borrow, the $140.0 million available under the revolving loan is reduced by the $67.0 million outstanding and $1.1 million in outstanding letters of credit.
The following table sets forth a summary of our contractual obligations and commitments, excluding periodic interest payments for capital lease obligations, as of December 31, 2010.
| |
Payments Due By Period (in thousands) |
|||||||||||||||||||||
|---|---|---|---|---|---|---|---|---|---|---|---|---|---|---|---|---|---|---|---|---|---|---|
Contractual Obligation(1)
|
2011 | 2012 | 2013 | 2014 | 2015 | 2016 & After |
Total | |||||||||||||||
Long-term obligations and future accretion(2) |
$ | 494 | $ | 10,156 | $ | 1,988 | $ | 68,685 | $ | 1,427 | $ | — | $ | 82,750 | ||||||||
Employment agreements(3) |
126 | — | — | — | — | — | 126 | |||||||||||||||
Capital lease obligations |
2,450 | 2,404 | 1,178 | 1,023 | — | — | 7,055 | |||||||||||||||
Operating leases |
7,300 | 6,143 | 5,680 | 5,117 | 2,447 | 86 | 26,773 | |||||||||||||||
Total |
$ | 10,370 | $ | 18,703 | $ | 8,846 | $ | 74,825 | $ | 3,874 | $ | 86 | $ | 116,704 | ||||||||
- (1)
- Approximately
$2.8 million of unrecognized tax benefits are not included in this contractual obligations table due to the uncertainty related to the
timing of any payments. Settlement of such amounts would require the utilization of working capital.
- (2)
- Includes
principal payments on our credit facility which matures in June 2014, deferred acquisition payments, the fair value of the earn-out
opportunity, and the present value of the holdback related to the Jupiter eSources LLC acquisition. The amount in the above table includes both the principal amount, as reflected on our
December 31, 2010 Consolidated Balance Sheet, and all future accretion.
- (3)
- In conjunction with acquisitions, we have entered into employment agreements with certain key employees of the acquired companies.
Critical Accounting Policies
We consider our accounting policies related to revenue recognition, share-based compensation, business combinations, goodwill, identifiable intangible assets, and income taxes to be critical policies in understanding our historical and future performance.
Revenue Recognition
We have agreements with clients pursuant to which we deliver various services each month.
31
Following is a description of significant sources of revenue:
- •
- Fees contingent upon the month-to-month delivery of case management services defined by client
contracts, such as claims processing, claims reconciliation, professional services, call center support, disbursement services, project management, collection and forensic services, document review
services, and conversion of data into an organized, searchable electronic database. The amount we earn varies based on the size and complexity of the engagement, the number of hours services are
provided, and the number of documents or amount of data reviewed.
- •
- Hosting fees based on the amount of data stored.
- •
- Deposit-based fees, earned primarily based on a percentage of Chapter 7 total liquidated assets placed on deposit
with a designated financial institution by our trustee clients, to whom we provide, at no charge, software licenses, limited hardware and hardware maintenance, and postcontract customer support
services. The fees we earn are based on total liquidated assets placed on deposit by our trustee clients and may vary based on fluctuations in short-term interest rates.
- •
- Legal noticing services to parties of interest in bankruptcy and class action matters, including direct notification,
media campaign, and advertising management in which we coordinate notification through various media outlets, such as print, radio and television, to potential parties of interest for a particular
client engagement.
- •
- Reimbursement for costs incurred, primarily related to postage on mailing services.
- •
- Monitoring and noticing fees earned based on monthly or on-demand requests for information provided through our AACER® software product.
Non-Software Arrangements
Services related to eDiscovery and settlement administration are billed based on volume. For these contractual arrangements, we have identified each deliverable service element. Based on our evaluation of each element, we have determined that each element delivered has standalone value to our customers because we or other vendors sell such services separately from any other services/deliverables. We have also obtained objective and reliable evidence of the fair value of each element based either on the price we charge when we sell an element on a standalone basis or based on third-party evidence of fair value of such similar services. Lastly, our arrangements do not include general rights of return. Accordingly, each of the service elements in our multiple element case and document management arrangements qualifies as a separate unit of accounting. We allocate revenue to the various units of accounting in our arrangements based on the fair value of each unit of accounting, which is generally consistent with the stated prices in our arrangements. As we have evidence of an arrangement, revenue for each separate unit of accounting is recognized each period. Revenue is recognized as the services are rendered, our fee becomes fixed and determinable, and collectability is reasonably assured. Payments received in advance of satisfaction of the related revenue recognition criteria are recognized as a customer deposit until all revenue recognition criteria have been satisfied.
Software Arrangements
For our Chapter 7 bankruptcy trustee arrangements, we provide our trustee clients with a software license, hardware lease, hardware maintenance, and postcontract customer support services, all at no charge to the trustee. The trustees place their liquidated estate deposits with a financial institution with which we have an arrangement. We earn contingent monthly fees from the financial institutions based on the dollar level of average monthly deposits held by the trustees with that financial institution related to the software license, hardware lease, hardware maintenance, and postcontract customer support services. Since we have not established vendor specific objective evidence of the fair value of
32
the software license, we do not recognize any revenue on delivery of the software. The software element is deferred and included with the remaining undelivered elements, which are postcontract customer support services. This revenue, when recognized, is included as a component of "Case management services revenue". Revenue related to postcontract customer support is entirely contingent on the placement of liquidated estate deposits by the trustee with the financial institution. Accordingly, we recognize this contingent usage based revenue as the fee becomes fixed or determinable at the time actual usage occurs and collectability is probable. This occurs monthly as a result of the computation, billing and collection of monthly deposit fees contractually agreed to. At that time, we have also satisfied the other revenue recognition criteria since we have persuasive evidence that an arrangement exists, services have been rendered, the price is fixed and determinable, and collectability is reasonably assured.
We also provide our trustee clients with certain hardware, such as desktop computers, monitors, and printers; and hardware maintenance. We retain ownership of all hardware provided and we account for this hardware as a lease. As the hardware maintenance arrangement is an executory contract similar to an operating lease, we use guidance related to contingent rentals in operating lease arrangements for hardware maintenance as well as for the hardware lease. Since the payments under all of our arrangements are contingent upon the level of trustee deposits and the delivery of upgrades and other services, and there remain important uncertainties regarding the amount of unreimbursable costs yet to be incurred by us, we account for the hardware lease as an operating lease. Therefore, all lease payments, based on the estimated fair value of hardware provided, were accounted for as contingent rentals; which requires that we recognize rental income when the changes in the factor on which the contingent lease payment is based actually occur. This occurs at the end of each period as we achieve our target when deposits are held at the depository financial institution as, at that time, evidence of an arrangement exists, delivery has occurred, the amount has become fixed and determinable, and collection is reasonably assured. This revenue, which is less than ten percent of our total revenue for the years ended December 31, 2010, 2009 and 2008, is included in the Consolidated Statements of Income as a component of "Case management services" revenue.
Reimbursements
We have revenue related to the reimbursement of certain costs, primarily postage. Reimbursed postage and other reimbursable direct costs are recorded gross in the Consolidated Statements of Income as "Operating revenue from reimbursed direct costs" and as "Reimbursed direct costs".
Share-based compensation
We measure compensation cost for share-based awards at fair value and recognize the expense as compensation expense over the service period for awards expected to vest. To date, the share-based compensation awards we have issued are stock option and nonvested share awards (also referred to as restricted stock awards). We are required to estimate the share-based awards that we ultimately expect to vest and to reduce share-based compensation expense for the effects of estimated forfeitures of awards over the expense recognition period. Although we estimate forfeitures based on historical experience, actual forfeitures in the future may differ. In addition, to the extent our actual forfeitures are different than our estimates, we record a true-up for the difference in the period that the awards vest, and such true-ups could affect our operating results.
We estimate the fair value of employee stock options using a Black-Scholes valuation model. The fair value of an award is affected by our stock price on the date of grant, as well as other assumptions including the expected volatility of our stock price over the term of the awards, the estimated period of time that we expect the stock options will be held, the expected risk-free interest rate, and the expected dividend rate.
33
We estimate our expected volatility based on implied volatilities from traded options on our stock and on our stock's historical volatility based on daily stock prices. We have estimated the expected term of our stock options based on the historical exercise pattern of groups of employees that have similar historical exercise behavior. The expected risk-free interest rate is based on the U.S. Treasury yield curve in effect at the time of the grant.
The fair value of nonvested share awards is determined based on the number of shares granted and the quoted price of our common stock.
We record deferred tax assets for share-based awards that potentially result in deductions on our income tax returns. We estimate the deferred tax asset based on the amount of share-based compensation recognized and the statutory tax rate in the jurisdictions in which we will receive a tax deduction. Because the deferred tax asset we record is based upon the share-based compensation expense in a particular jurisdiction, the aforementioned inputs that affect the fair value of our stock awards also indirectly affect our income tax expense. In addition, differences between the deferred tax assets recognized for financial reporting purposes and the actual tax deduction reported on our income tax returns are recorded in additional paid-in capital. If the tax deduction is less than the deferred tax asset, such shortfalls reduce our pool of excess tax benefits. If the pool of excess tax benefits is reduced to zero, then subsequent shortfalls would increase our income tax expense.
Recognition of share-based compensation expense has had, and will likely continue to have, a material effect on our "Direct cost of services" and "General and administrative" line items within our Consolidated Statements of Income, and also may have a material effect on our"Deferred income taxes" and "Additional paid-in capital" line items within our Consolidated Balance Sheets. For additional information see Note 12 of the Notes to Consolidated Financial Statements.
Business combination accounting
We have acquired a number of businesses in the past, and we may acquire additional businesses in the future. Business combination accounting requires us to determine the fair value of all assets acquired, including identifiable intangible assets, liabilities assumed, and contingent consideration issued in a business combination. The cost of the acquisition is allocated to these assets and liabilities in amounts equal to the estimated fair value of each asset and liability, and any remaining acquisition cost is classified as goodwill. This allocation process requires extensive use of estimates and assumptions, including quoted market prices and estimates of future cash flows to be generated by the acquired assets. Acquisition-related costs for potential and completed acquisitions are expensed, as incurred, and are included in "Other operating expense" in our Consolidated Statements of Income.
Determining the fair value of contingent consideration issued requires an assessment of the projected revenue over the earn-out period, and applying an appropriate discount rate based upon the weighted average cost of capital. This fair value assessment is also required in periods subsequent to a business combination. Such estimates are inherently difficult and subjective and could have a material impact on our Consolidated Financial Statements.
Certain identifiable intangible assets, such as customer lists and covenants not to compete, are amortized based on the pattern in which the economic benefits of the intangible assets are consumed over the intangible asset's estimated economic benefit period, generally from five to ten years. Goodwill is not amortized. Accordingly, the acquisition cost allocation has had, and will continue to have, a significant impact on our current operating results.
Goodwill
Goodwill consists of the excess of cost of acquired enterprises over the sum of the amounts assigned to identifiable assets acquired less liabilities assumed. We assess goodwill for impairment on
34
an annual basis at a reporting unit level. A reporting unit is a component of a segment that constitutes a business, for which discrete financial information is available, and for which the operating results are regularly reviewed by management. We have determined that our reporting units are bankruptcy trustee management, corporate restructuring, eDiscovery, and settlement administration. Goodwill is assessed between annual tests if an event occurs or circumstances change that would more likely than not reduce the fair value of a reporting unit below its carrying value. These events or circumstances could include a significant change in the business climate, a change in strategic direction, legal factors, operating performance indicators, a change in the competitive environment, the sale or disposition of a significant portion of a reporting unit, or future economic factors such as unfavorable changes in our stock price and market capitalization or unfavorable changes in the estimated future discounted cash flows of our reporting units. Our annual test is performed as of July 31 each year, and there have been no events since the annual test to indicate that it is more likely than not that the recorded goodwill balance had become impaired.
Application of the goodwill impairment test requires judgment, including the identification of reporting units, assignment of assets and liabilities to reporting units, assignment of goodwill to reporting units, and determination of the fair value of each reporting unit. We considered both a market approach and an income approach in order to develop an estimate of the fair value of each reporting unit for purposes of our annual impairment test. When evaluating the market approach, we determined that directly comparable publicly-traded companies did not exist, primarily due to the unique business model characteristics and projected growth of each reporting unit. Instead, we utilized a discounted projected future cash flow analysis (income approach) to determine the fair value of each reporting unit. Potential impairment is indicated when the carrying value of a reporting unit, including goodwill, exceeds its estimated fair value. This analysis requires significant judgments, including estimation of future cash flows, which is dependent on internal forecasts, estimation of the long-term rate of growth for our business, estimation of the useful life over which cash flows will occur, and determination of our weighted average cost of capital. Changes in these estimates and assumptions could materially affect the determination of fair value and goodwill impairment for each reporting unit. In addition, financial and credit market volatility directly impacts our fair value measurement through our weighted average cost of capital, used to determine our discount rate, and through our stock price, used to determine our market capitalization. We may be required to recognize impairment of goodwill based on future economic factors such as unfavorable changes in our stock price and market capitalization or unfavorable changes in the estimated future discounted cash flows of our reporting units.
If we determine that the estimated fair value of any reporting unit is less than the reporting unit's carrying value, then we proceed to the second step of the goodwill impairment analysis to measure the potential impairment charge. An impairment loss is recognized for any excess of the carrying value of the reporting unit's goodwill over the implied fair value. If goodwill on our Consolidated Balance Sheet becomes impaired during a future period, the resulting impairment charge could have a material impact on our results of operations and financial condition.
Due to the current economic environment and the uncertainties regarding the impact that future economic impacts will have on our reporting units, there can be no assurances that our estimates and assumptions regarding the duration of the economic recession, or the period or strength of recovery, made for purposes of our annual goodwill impairment test, will prove to be accurate predictions of the future. If our assumptions regarding forecasted revenues or margins of certain of our reporting units are not achieved, we may be required to record goodwill impairment losses in future periods. It is not possible at this time to determine if any such future impairment loss would occur, and if it does occur, whether such charge would be material.
Our recognized goodwill totaled $294.8 million as of December 31, 2010. As of July 31, 2010, which is the date of our most recent impairment test, the fair value of each of our reporting units was
35
substantially in excess of the carrying value of the reporting unit, except for the bankruptcy trustee management reporting unit, which had $74.9 million of goodwill allocated to it. The fair value of this reporting unit exceeded its carrying value by approximately 14%. The discount rate used in the income approach for the trustee management reporting unit, evaluated at July 31, 2010, was 12.3%. An increase to the discount rate of 1% would have lowered the fair value determined under the income approach for this reporting unit by approximately $12.0 million, or 12%, which, with all other variables remaining the same, would result in the fair value of this reporting unit exceeding its carrying value by 1%. In connection with the acquisition of Jupiter eSources LLC on October 1, 2010, as described in Note 13 of the Notes to Consolidated Financial Statements, we recognized $30.7 million of goodwill, which is allocated to the bankruptcy segment.
Identifiable intangible assets
Identifiable intangible assets, resulting from various business acquisitions, consist of customer relationships, agreements not to compete, and trade names. Our customer relationships, agreements not to compete, and one of our trade name intangible assets have finite lives, and are amortized over their estimated economic benefit period, generally from five to ten years. These definite lived intangible assets are tested annually for impairment and also reviewed for impairment whenever events or changes in circumstances have indicated that the carrying amount of these assets might not be recoverable. If we were to determine that events and circumstances warrant a change to the estimate of an identifiable intangible asset's remaining useful life, then the remaining carrying amount of the identifiable intangible asset would be amortized prospectively over that revised remaining useful life. Additionally, information resulting from our annual assessment, or other events and circumstances, may indicate that the carrying value of one or more identifiable intangible assets is not recoverable which would result in recognition of an impairment charge.
Our trade name identifiable intangible asset recognized in connection with the 2010 acquisition of Jupiter eSources LLC was determined to have an indefinite life. Intangible assets with indefinite lives are not amortized and are tested annually for impairment and also reviewed for impairment whenever events or changes in circumstances indicate the carrying amount of the asset might not be recoverable. Impairment of identifiable intangible assets with indefinite lives occurs when the fair value of the asset is less than its carrying amount. If impaired, the asset's carrying amount is reduced to its fair value.
A change in the estimate of the remaining life of one or more identifiable intangible assets or the impairment of one or more identifiable intangible assets could have a material impact on our results of operations and financial condition. Our identifiable intangible assets' carrying value, net of amortization, was $43.6 million as of December 31, 2010.
Income Taxes
A deferred tax asset or liability is recognized for the anticipated future tax consequences of temporary differences between the tax basis of assets or liabilities and their reported amounts in the financial statements and for operating loss and tax credit carryforwards. A valuation allowance is provided when, in the opinion of management, it is more likely than not that some portion or all of a deferred tax asset will not be realized. Realization of the deferred tax assets is dependent on our ability to generate sufficient future taxable income and, if necessary, execution of our tax planning strategies. In the event we determine that sufficient future taxable income, taking into consideration tax planning strategies, may not generate sufficient taxable income to fully realize net deferred tax assets, we may be required to establish or increase valuation allowances by a charge to income tax expense in the period such a determination is made. This charge may have a material impact on recognized income tax expense on our Consolidated Statements of Income. Deferred tax assets and liabilities are measured using enacted tax rates expected to apply to taxable income in the years in which those temporary differences are expected to be recovered or settled. The effect on deferred tax assets and liabilities of a
36
change in tax rates is recognized in income in the period that includes the enactment date. The recognition of a change in enacted tax rates may have a material impact on recognized income tax expense and on our Consolidated Statements of Income.
We follow accounting guidance which prescribes a comprehensive model for how companies should recognize, measure, present, and disclose in their financial statements uncertain tax positions taken or expected to be taken on a tax return. Under this guidance, tax positions are initially recognized in the financial statements when it is more likely than not the position will be sustained upon examination by the tax authorities. Such tax positions are initially and subsequently measured as the largest amount of tax benefit that is greater than 50% likely of being realized upon ultimate settlement with the tax authority assuming full knowledge of the position and all relevant facts. Application of this guidance requires numerous estimates based on available information. We consider many factors when evaluating and estimating our tax positions and tax benefits, and our recognized tax positions and tax benefits may not accurately anticipate actual outcomes. As we obtain additional information, we may need to periodically adjust our recognized tax positions and tax benefits. These periodic adjustments may have a material impact on our Consolidated Statements of Income. For additional information related to uncertain tax positions see Note 10 of the Notes to Consolidated Financial Statements.
Recently Adopted Accounting Pronouncements
In January 2010, the FASB issued updated guidance that requires entities to disclose separately the amounts of significant transfers in and out of Level 1 and Level 2 fair value measurements and describe the reasons for the transfers. In addition, the update requires entities to present separately information about purchases, sales, issuances, and settlements in the reconciliation for fair value measurements using significant unobservable inputs (Level 3). The disclosures related to Level 1 and Level 2 fair value measurements are effective for us in 2010. The update required new disclosures only, and had no impact on our consolidated financial position, results of operations, or cash flows as we have not had any transfers out of Level 1. The disclosures related to Level 3 fair value measurements are effective for us in 2011. This update also only requires new disclosures, and will have no impact on our consolidated financial position, results of operations, or cash flows.
Recently Issued Accounting Pronouncements Not Yet Adopted
In October 2009, the FASB issued new standards for revenue recognition with multiple deliverables. These new standards require entities to allocate revenue in an arrangement using estimated selling prices of the delivered goods and services based on a selling price hierarchy. The amendments eliminate the residual method of revenue allocation and require revenue to be allocated using the relative selling price method. These new standards are effective for us beginning in the first quarter of fiscal year 2011, however early adoption is permitted. We do not anticipate that the adoption of this standard will have a material impact on our consolidated financial statements.
In October 2009, the FASB issued new standards for the accounting for certain revenue arrangements that include software elements. These new standards amend the scope of pre-existing software revenue guidance by removing from the guidance non-software components of tangible products and certain software components of tangible products. These new standards are effective for us beginning in the first quarter of fiscal year 2011, however early adoption is permitted. We do not anticipate that the adoption of this standard will have a material impact on our consolidated financial statements as our software arrangements are not tangible products with software components.
In December 2010, the FASB issued new standards that amend the criteria for performing Step 2 of the goodwill impairment test for reporting units with zero or negative carrying amounts and requires performing Step 2 if qualitative factors indicate that it is more likely than not that a goodwill impairment exists. We will adopt this guidance in fiscal year 2011. We do not anticipate the adoption of
37
this standard will have a material impact on our consolidated financial statements as we do not have any reporting units with zero or negative carrying amounts as of our last impairment test.
ITEM 7A. QUANTITATIVE AND QUALITATIVE DISCLOSURES ABOUT MARKET RISK
The principal market risks to which we are exposed include interest rates under our senior revolving credit facility, foreign exchange rates giving rise to translation, and fluctuations in short-term interest rates on a portion of our bankruptcy trustee revenue.
Interest Rate Risk
Interest on our senior revolving credit facility is generally based on a spread, not to exceed 325 basis points over the LIBOR rate. As of December 31, 2010, we had borrowed $67.0 million under the senior revolving loan.
We performed a sensitivity analysis assuming a hypothetical 100 basis point movement in interest rates applied to the average daily borrowings of the senior revolving loan. As of December 31, 2010, the analysis indicated that such a movement would not have a material effect on our consolidated financial position, results of operations, or cash flows.
In our Chapter 7 bankruptcy business we earn deposit-based fees. These fees are earned primarily on a percentage of Chapter 7 total liquidated assets placed on deposit with a designated financial institution by our trustee clients. The fees we earn based on total liquidated assets placed on deposit by our trustee clients may vary based on fluctuations in short-term interest rates.
We currently do not hold any interest rate floor options or other derivatives.
Foreign Currency Risk
We have operations outside of the United States, therefore, a portion of our revenues and expenses are incurred in a currency other than U.S. dollars. We do not utilize hedge instruments to manage the exposures associated with fluctuating currency exchange rates. Our operating results are exposed to changes in exchange rates between the U.S. dollar and the functional currency of the countries where we have operations. When the U.S. dollar weakens against foreign currencies, the dollar value of revenues and expenses denominated in foreign currencies increases. When the U.S. dollar strengthens, the opposite situation occurs.
38
ITEM 8. FINANCIAL STATEMENTS AND SUPPLEMENTARY DATA
Our Consolidated Financial Statements appear following Item 15 of this Report.
Supplementary Data—Quarterly Financial Information (Unaudited)
The following table sets forth the quarterly financial data for the quarters of the years ended December 31, 2010 and 2009.
| |
1st | 2nd | 3rd | 4th | |||||||||
|---|---|---|---|---|---|---|---|---|---|---|---|---|---|
| |
(in thousands, except per share data) |
||||||||||||
Year ended December 31, 2010 |
|||||||||||||
Total revenue |
$ | 55,371 | $ | 65,933 | $ | 58,287 | $ | 67,575 | |||||
Gross profit(1) |
$ | 30,042 | $ | 36,034 | $ | 32,430 | $ | 37,163 | |||||
Net income |
$ | 2,335 | $ | 3,915 | $ | 4,538 | $ | 3,141 | |||||
Net income per share—Basic(2) |
$ | 0.06 | $ | 0.11 | $ | 0.12 | $ | 0.09 | |||||
Net income per share—Diluted(2) |
$ | 0.06 | $ | 0.10 | $ | 0.12 | $ | 0.08 | |||||
Year ended December 31, 2009 |
|||||||||||||
Total revenue |
$ | 60,828 | $ | 66,190 | $ | 57,809 | $ | 54,244 | |||||
Gross profit(1) |
$ | 29,660 | $ | 33,934 | $ | 29,611 | $ | 29,642 | |||||
Net income |
$ | 3,278 | $ | 2,886 | $ | 4,869 | $ | 3,562 | |||||
Net income per share—Basic(2) |
$ | 0.09 | $ | 0.08 | $ | 0.13 | $ | 0.10 | |||||
Net income per share—Diluted(2) |
$ | 0.09 | $ | 0.08 | $ | 0.12 | $ | 0.09 | |||||
- (1)
- Gross
profit is calculated as total revenue less direct cost of services, direct cost of bundled products and services, reimbursed direct costs, and the
portion of depreciation and software amortization attributable to direct costs of services.
- (2)
- The sum of the quarters' net income per share may not equal the total of the respective year's net income per share as each quarter is calculated independently.
ITEM 9. CHANGES IN AND DISAGREEMENTS WITH ACCOUNTANTS ON ACCOUNTING AND FINANCIAL DISCLOSURE
None.
ITEM 9A. CONTROLS AND PROCEDURES
Conclusion Regarding the Effectiveness of Disclosure Controls and Procedures
Under the supervision and with the participation of our management, including our principal executive officer and principal financial officer, we conducted an evaluation of the effectiveness of the design and operation of our disclosure controls and procedures, as defined in Rules 13a-15(e) and 15d-15(e) of the Securities Exchange Act of 1934. Based on their evaluation as of December 31, 2010, the end of the period covered by this Annual Report on Form 10-K, our principal executive officer and principal financial officer concluded that our disclosure controls and procedures were effective at a reasonable assurance level to ensure that the information required to be disclosed in reports filed or submitted under the Securities Exchange Act of 1934, including this Annual Report on Form 10-K, were recorded, processed, summarized and reported within the time periods specified in the SEC's rules and forms, and was accumulated and communicated to management, including our principal executive officer and principal financial officer, as appropriate to allow timely decisions regarding required disclosure.
39
Management's Report on Internal Control Over Financial Reporting
Our management is responsible for establishing and maintaining adequate internal control over financial reporting. Our internal control over financial reporting is designed to provide reasonable assurance regarding the reliability of financial reporting and the preparation of financial statements for external purposes in accordance with generally accepted accounting principles and includes those policies and procedures that:
- •
- Pertain to the maintenance of records that in reasonable detail accurately and fairly reflect the transactions and
dispositions of the assets of the company;
- •
- Provide reasonable assurance that the transactions are recorded as necessary to permit preparation of financial statements
in accordance with generally accepted accounting principles, and that receipts and expenditures of the company are being made only in accordance with authorizations of management and directors of the
company; and
- •
- Provide reasonable assurance regarding prevention or timely detection of unauthorized acquisition, use or disposition of the company's assets that could have a material effect on the financial statements.
All internal control systems, no matter how well designed, have inherent limitations. Therefore, even those systems determined to be effective can provide only reasonable assurance with respect to financial statement preparation and presentation. Because of its inherent limitations, internal control over financial reporting may not prevent or detect misstatements. Projections of any evaluation of effectiveness to future periods are subject to the risk that controls may become inadequate because of changes in conditions or that the degree of compliance with the policies or procedures may deteriorate.
In connection with the filing of our Annual Report on Form 10-K, our management assessed the effectiveness of our internal control over financial reporting as of December 31, 2010. In making this assessment, our management used the criteria set forth by Committee of Sponsoring Organizations of the Treadway Commission in Internal Control—Integrated Framework. Management has excluded from the scope of its assessment of internal control over financial reporting the operations and related assets of Jupiter eSources LLC, which Epiq acquired on October 1, 2010. At December 31, 2010, and for the year ended December 31, 2010, the amounts subject to the internal control over financial reporting arising from this acquisition represented 1% of our consolidated total assets, 1% of our consolidated net assets, 2% of our consolidated total revenue, and (7%) of our consolidated net income. As a result of that evaluation, management believes that, as of December 31, 2010, our internal control over financial reporting is effective based on those criteria.
The effectiveness of our internal control over financial reporting as of December 31, 2010 has been audited by Deloitte & Touche LLP, an independent registered public accounting firm, as stated in their report which appears beginning on page 41.
Changes in Internal Control Over Financial Reporting
There have been no changes in our internal controls over financial reporting during the quarter ended December 31, 2010, that have materially affected, or are reasonably likely to materially affect, our internal controls over financial reporting.
40
REPORT OF INDEPENDENT REGISTERED PUBLIC ACCOUNTING FIRM
To
the Board of Directors and Stockholders of
Epiq Systems, Inc.
Kansas City, Kansas
We have audited the internal control over financial reporting of Epiq Systems, Inc. and subsidiaries (the "Company") as of December 31, 2010, based on criteria established in Internal Control—Integrated Framework issued by the Committee of Sponsoring Organizations of the Treadway Commission. As described in Management's Report on Internal Control Over Financial Reporting, management excluded from its assessment the internal control over financial reporting at Jupiter eSources LLC, which was acquired on October 1, 2010 and whose financial statements constitute 1% of total assets, 1% of net assets, 2% of total revenue, and (7%) of net income of the consolidated financial statement amounts as of and for the year ended December 31, 2010. Accordingly, our audit did not include the internal control over financial reporting at Jupiter eSources LLC. The Company's management is responsible for maintaining effective internal control over financial reporting and for its assessment of the effectiveness of internal control over financial reporting, included in the accompanying Management's Annual Report on Internal Control over Financial Reporting. Our responsibility is to express an opinion on the Company's internal control over financial reporting based on our audit.
We conducted our audit in accordance with the standards of the Public Company Accounting Oversight Board (United States). Those standards require that we plan and perform the audit to obtain reasonable assurance about whether effective internal control over financial reporting was maintained in all material respects. Our audit included obtaining an understanding of internal control over financial reporting, assessing the risk that a material weakness exists, testing and evaluating the design and operating effectiveness of internal control based on the assessed risk, and performing such other procedures as we considered necessary in the circumstances. We believe that our audit provides a reasonable basis for our opinion.
A company's internal control over financial reporting is a process designed by, or under the supervision of, the company's principal executive and principal financial officers, or persons performing similar functions, and effected by the company's board of directors, management, and other personnel to provide reasonable assurance regarding the reliability of financial reporting and the preparation of financial statements for external purposes in accordance with generally accepted accounting principles. A company's internal control over financial reporting includes those policies and procedures that (1) pertain to the maintenance of records that, in reasonable detail, accurately and fairly reflect the transactions and dispositions of the assets of the company; (2) provide reasonable assurance that transactions are recorded as necessary to permit preparation of financial statements in accordance with generally accepted accounting principles, and that receipts and expenditures of the company are being made only in accordance with authorizations of management and directors of the company; and (3) provide reasonable assurance regarding prevention or timely detection of unauthorized acquisition, use, or disposition of the company's assets that could have a material effect on the financial statements.
Because of the inherent limitations of internal control over financial reporting, including the possibility of collusion or improper management override of controls, material misstatements due to error or fraud may not be prevented or detected on a timely basis. Also, projections of any evaluation of the effectiveness of the internal control over financial reporting to future periods are subject to the risk that the controls may become inadequate because of changes in conditions, or that the degree of compliance with the policies or procedures may deteriorate.
In our opinion, the Company maintained, in all material respects, effective internal control over financial reporting as of December 31, 2010, based on the criteria established in Internal Control—Integrated Framework issued by the Committee of Sponsoring Organizations of the Treadway Commission.
We have also audited, in accordance with the standards of the Public Company Accounting Oversight Board (United States), the consolidated financial statements and financial statement schedule as of and for the year ended December 31, 2010 of the Company and our report dated February 25, 2011 expressed an unqualified opinion on those consolidated financial statements and financial statement schedule.
/s/ DELOITTE & TOUCHE LLP
Kansas
City, Missouri
February 25, 2011
41
None.
ITEM 10. DIRECTORS, EXECUTIVE OFFICERS AND CORPORATE GOVERNANCE
Incorporated by reference to our Proxy Statement for our 2010 Annual Meeting of Shareholders to be filed with the Securities and Exchange Commission within 120 days after the close of the year ended December 31, 2010.
ITEM 11. EXECUTIVE COMPENSATION
Incorporated by reference to our Proxy Statement for our 2010 Annual Meeting of Shareholders to be filed with the Securities and Exchange Commission within 120 days after the close of the year ended December 31, 2010.
ITEM 12. SECURITY OWNERSHIP OF CERTAIN BENEFICIAL OWNERS AND MANAGEMENT AND RELATED STOCKHOLDER MATTERS
Incorporated by reference to our Proxy Statement for our 2010 Annual Meeting of Shareholders to be filed with the Securities and Exchange Commission within 120 days after the close of the year ended December 31, 2010.
Equity Compensation Plan Information
The following table sets forth as of December 31, 2010 (a) the number of securities to be issued upon exercise of outstanding options, warrants and rights, (b) the weighted average exercise price of outstanding options, warrants and rights and (c) the number of securities remaining available for future issuance under equity compensation plans (excluding securities reflected in column (a)).
| |
(a) | (b) | (c) | |||||||
|---|---|---|---|---|---|---|---|---|---|---|
Plan Category
|
Number of securities to be issued upon exercise of outstanding options, warrants and rights |
Weighted-average exercise price of outstanding options, warrants and rights |
Number of securities remaining available for future issuance under equity compensation plans (excluding securities reflected in column (a)) |
|||||||
Equity compensation plans approved by security holders |
6,711,000 | $ | 11.79 | 900,000 | ||||||
Equity compensation plans not approved by security holders |
410,000 | $ | 14.13 | - | ||||||
Total |
7,121,000 | $ | 11.92 | 900,000 | ||||||
As of December 31, 2010, equity compensation plans approved by security holders consist of our 1995 Stock Option Plan and our 2004 Equity Incentive Plan, both as amended. Securities remaining available for future issuance under equity compensation plans approved by security holders consist solely of shares available under the 2004 Equity Incentive Plan. Securities remaining available for future issuance under our 2004 Equity Incentive Plan may be issued, in any combination, as incentive stock options, non-qualified stock options, stock appreciation rights or restricted stock.
As of December 31, 2010, equity compensation plans not approved by security shareholders consist of inducement stock options issued in conjunction with acquisitions. These stock options were issued in conjunction with the execution of employment agreements with certain key employees of acquired
42
companies to become employees of our newly acquired subsidiaries. In accordance with the NASDAQ corporate governance rules, shareholder approval was not required for these inducement stock option grants.
The stock options granted under equity compensation plans not approved by security holders were granted at option exercise prices equal to the fair market value of the common stock on the date of grant, are non-qualified options, are exercisable for up to 10 years from the date of grant, and otherwise have terms substantially identical to the material terms of the 1995 Stock Option Plan and the 2004 Equity Incentive Plan. Additional information related to the equity compensation plans not approved by security holders is contained in Note 12 of the Notes to Consolidated Financial Statements.
ITEM 13. CERTAIN RELATIONSHIPS AND RELATED TRANSACTIONS, AND DIRECTOR INDEPENDENCE
Incorporated by reference to our Proxy Statement for our 2010 Annual Meeting of Shareholders to be filed with the Securities and Exchange Commission within 120 days after the close of the year ended December 31, 2010.
ITEM 14. PRINCIPAL ACCOUNTING FEES AND SERVICES
Incorporated by reference to our Proxy Statement for our 2010 Annual Meeting of Shareholders to be filed with the Securities and Exchange Commission within 120 days after the close of the year ended December 31, 2010.
43
ITEM 15. EXHIBITS, FINANCIAL STATEMENT SCHEDULES
- (a)
- The following documents are filed as a part of this report:
- (1)
- Financial Statements.
- (2)
- Financial Statement Schedules.
- (3)
- Exhibits. Exhibits are listed on the Exhibit Index at the end of this report.
The following Consolidated Financial Statements, contained on pages F-1 through F-40 of this report, are filed as part of this report under Item 8 "Financial Statements and Supplementary Data."
Report of Independent Registered Public Accounting Firm
Consolidated Balance Sheets—December 31, 2010 and 2009
Consolidated Statements of Income—Years Ended December 31, 2010, 2009 and 2008
Consolidated Statements of Changes in Stockholders' Equity and Comprehensive Income—Years Ended December 31, 2010, 2009 and 2008
Consolidated Statements of Cash Flows—Years Ended December 31, 2010, 2009 and 2008
Notes to Consolidated Financial Statements
Epiq Systems, Inc. and subsidiaries for each of the years in the three-year period ended December 31, 2010.
Schedule II—Valuation and Qualifying Accounts
44
Pursuant to the requirements of Section 13 or 15(d) of the Securities Exchange Act of 1934, the registrant has duly caused this report to be signed on its behalf by the undersigned, thereunto duly authorized.
Dated: February 25, 2011 |
EPIQ SYSTEMS, INC. | |||
|
||||
|
||||
|
By: | /s/ TOM W. OLOFSON Tom W. Olofson Chairman of the Board, Chief Executive Officer and Director |
||
Pursuant to the requirements of the Securities Exchange Act of 1934, this report has been signed below by the following persons on behalf of the registrant and in the capacities and on the dates indicated.
Signature
|
Name and Title
|
Date
|
|||
|---|---|---|---|---|---|
| /s/ TOM W. OLOFSON Tom W. Olofson |
Chairman of the Board, Chief Executive Officer and Director (Principal Executive Officer) |
February 25, 2011 | |||
/s/ CHRISTOPHER E. OLOFSON Christopher E. Olofson |
President, Chief Operating Officer and Director |
February 25, 2011 |
|||
/s/ ELIZABETH M. BRAHAM Elizabeth M. Braham |
Executive Vice President, Chief Financial Officer (Principal Financial Officer and Principal Accounting Officer) |
February 25, 2011 |
|||
/s/ W. BRYAN SATTERLEE W. Bryan Satterlee |
Director |
February 25, 2011 |
|||
/s/ EDWARD M. CONNOLLY, JR. Edward M. Connolly, Jr. |
Director |
February 25, 2011 |
|||
/s/ JAMES A. BYRNES James A. Byrnes |
Director |
February 25, 2011 |
|||
/s/ JOEL PELOFSKY Joel Pelofsky |
Director |
February 25, 2011 |
|||
/s/ TERRY C. MATLACK Terry C. Matlack |
Director |
February 25, 2011 |
45
REPORT OF INDEPENDENT REGISTERED PUBLIC ACCOUNTING FIRM
To
the Board of Directors and Stockholders of
Epiq Systems, Inc.
Kansas City, Kansas
We have audited the accompanying consolidated balance sheets of Epiq Systems, Inc. and subsidiaries (the "Company") as of December 31, 2010 and 2009, and the related consolidated statements of income, changes in stockholders' equity and comprehensive income, and cash flows for each of the three years in the period ended December 31, 2010. Our audits also included the financial statement schedule listed in the Index at Item 15(a)(2). These financial statements and financial statement schedule are the responsibility of the Company's management. Our responsibility is to express an opinion on the financial statements and financial statement schedule based on our audits.
We conducted our audits in accordance with the standards of the Public Company Accounting Oversight Board (United States). Those standards require that we plan and perform the audit to obtain reasonable assurance about whether the financial statements are free of material misstatement. An audit includes examining, on a test basis, evidence supporting the amounts and disclosures in the financial statements. An audit also includes assessing the accounting principles used and significant estimates made by management, as well as evaluating the overall financial statement presentation. We believe that our audits provide a reasonable basis for our opinion.
In our opinion, such consolidated financial statements present fairly, in all material respects, the financial position of Epiq Systems, Inc. and subsidiaries as of December 31, 2010 and 2009, and the results of their operations and their cash flows for each of the three years in the period ended December 31, 2010, in conformity with accounting principles generally accepted in the United States of America. Also, in our opinion, such financial statement schedule, when considered in relation to the basic consolidated financial statements taken as a whole, present fairly, in all material respects, the information set forth therein.
We have also audited, in accordance with the standards of the Public Company Accounting Oversight Board (United States), the Company's internal control over financial reporting as of December 31, 2010, based on the criteria established in Internal Control—Integrated Framework issued by the Committee of Sponsoring Organizations of the Treadway Commission and our report dated February 25, 2011 expressed an unqualified opinion on the Company's internal control over financial reporting.
/s/ DELOITTE & TOUCHE LLP
Kansas
City, Missouri
February 25, 2011
F-1
EPIQ SYSTEMS, INC.
CONSOLIDATED BALANCE SHEETS
(In Thousands, Except Share Data)
| |
As of December 31, | |||||||||
|---|---|---|---|---|---|---|---|---|---|---|
| |
2010 | 2009 | ||||||||
ASSETS |
||||||||||
CURRENT ASSETS: |
||||||||||
Cash and cash equivalents |
$ | 5,439 | $ | 48,986 | ||||||
Trade accounts receivable, less allowance for doubtful accounts of $3,778 and $2,928 |
59,940 | 43,471 | ||||||||
Prepaid expenses |
5,581 | 4,867 | ||||||||
Other current assets |
5,637 | 2,341 | ||||||||
Total Current Assets |
76,597 | 99,665 | ||||||||
LONG-TERM ASSETS: |
||||||||||
Property and equipment, net |
41,258 | 40,005 | ||||||||
Internally developed software costs, net |
19,659 | 13,732 | ||||||||
Goodwill |
294,789 | 264,239 | ||||||||
Other intangibles, net of accumulated amortization of $58,339 and $49,188 |
43,580 | 19,524 | ||||||||
Other |
2,335 | 776 | ||||||||
Total Long-term Assets, net |
401,621 | 338,276 | ||||||||
Total Assets |
$ | 478,218 | $ | 437,941 | ||||||
LIABILITIES AND STOCKHOLDERS' EQUITY |
||||||||||
CURRENT LIABILITIES: |
||||||||||
Accounts payable |
$ | 13,227 | $ | 8,260 | ||||||
Accrued compensation |
8,891 | 4,429 | ||||||||
Deposits |
2,553 | 2,996 | ||||||||
Deferred revenue |
1,422 | 760 | ||||||||
Other accrued expenses |
4,611 | 4,138 | ||||||||
Current maturities of long-term obligations |
2,945 | 54,144 | ||||||||
Total Current Liabilities |
33,649 | 74,727 | ||||||||
LONG-TERM LIABILITIES: |
||||||||||
Deferred income taxes |
24,159 | 22,261 | ||||||||
Other long-term liabilities |
5,027 | 9,901 | ||||||||
Long-term obligations (excluding current maturities) |
86,860 | 4,654 | ||||||||
Total Long-term Liabilities |
116,046 | 36,816 | ||||||||
COMMITMENTS AND CONTINGENCIES |
||||||||||
STOCKHOLDERS' EQUITY: |
||||||||||
Preferred stock—$1 par value; 2,000,000 shares authorized; none issued and outstanding |
— | — | ||||||||
Common stock—$0.01 par value; 100,000,000 shares authorized; issued and outstanding—39,063,327 and 36,237,562 shares |
391 | 362 | ||||||||
Additional paid-in capital |
281,119 | 248,937 | ||||||||
Accumulated other comprehensive loss |
(1,971 | ) | (1,815 | ) | ||||||
Retained earnings |
91,069 | 79,772 | ||||||||
Treasury stock, at cost—3,295,492 shares and 56,473 shares |
(42,085 | ) | (858 | ) | ||||||
Total Stockholders' Equity |
328,523 | 326,398 | ||||||||
Total Liabilities and Stockholders' Equity |
$ | 478,218 | $ | 437,941 | ||||||
See accompanying Notes to Consolidated Financial Statements.
F-2
EPIQ SYSTEMS, INC.
CONSOLIDATED STATEMENTS OF INCOME
(In Thousands, Except Per Share Data)
| |
Year Ended December 31, | |||||||||||
|---|---|---|---|---|---|---|---|---|---|---|---|---|
| |
2010 | 2009 | 2008 | |||||||||
REVENUE: |
||||||||||||
Case management services |
$ | 157,561 | $ | 137,170 | $ | 128,331 | ||||||
Case management bundled products and services |
18,993 | 15,206 | 17,774 | |||||||||
Document management services |
41,041 | 56,153 | 61,751 | |||||||||
Operating revenue before reimbursed direct costs |
217,595 | 208,529 | 207,856 | |||||||||
Operating revenue from reimbursed direct costs |
29,571 | 30,542 | 28,262 | |||||||||
Total Revenue |
247,166 | 239,071 | 236,118 | |||||||||
OPERATING EXPENSE: |
||||||||||||
Direct cost of services (exclusive of depreciation and amortization shown separately below) |
68,490 | 71,864 | 81,884 | |||||||||
Direct cost of bundled products and services (exclusive of depreciation and amortization shown separately below) |
3,514 | 3,520 | 3,642 | |||||||||
Reimbursed direct costs |
28,686 | 30,217 | 28,134 | |||||||||
General and administrative |
85,645 | 78,441 | 71,113 | |||||||||
Depreciation and software and leasehold amortization |
20,391 | 18,775 | 16,302 | |||||||||
Amortization of identifiable intangible assets |
9,190 | 7,409 | 9,051 | |||||||||
Other operating expense |
2,781 | 634 | 171 | |||||||||
Total Operating Expense |
218,697 | 210,860 | 210,297 | |||||||||
INCOME FROM OPERATIONS |
28,469 |
28,211 |
25,821 |
|||||||||
INTEREST EXPENSE (INCOME): |
||||||||||||
Interest expense |
1,931 | 1,474 | 1,757 | |||||||||
Interest income |
(32 | ) | (124 | ) | (279 | ) | ||||||
Net Interest Expense |
1,899 | 1,350 | 1,478 | |||||||||
INCOME BEFORE INCOME TAXES |
26,570 |
26,861 |
24,343 |
|||||||||
PROVISION FOR INCOME TAXES |
12,641 |
12,266 |
10,507 |
|||||||||
NET INCOME |
$ | 13,929 | $ | 14,595 | $ | 13,836 | ||||||
NET INCOME PER SHARE INFORMATION: |
||||||||||||
Basic |
$ | 0.38 | $ | 0.41 | $ | 0.39 | ||||||
Diluted |
$ | 0.36 | $ | 0.38 | $ | 0.36 | ||||||
WEIGHTED AVERAGE COMMON SHARES OUTSTANDING: |
||||||||||||
Basic |
36,498 | 35,895 | 35,459 | |||||||||
Diluted |
39,512 | 41,908 | 41,425 | |||||||||
Cash dividends declared per common share |
$ |
0.07 |
$ |
— |
$ |
— |
||||||
See accompanying Notes to Consolidated Financial Statements.
F-3
EPIQ SYSTEMS, INC.
CONSOLIDATED STATEMENTS OF CHANGES IN STOCKHOLDERS' EQUITY
AND COMPREHENSIVE INCOME
(In Thousands)
| |
|
Common Stock |
Treasury Stock |
|
Common Stock |
Additional Paid-In Capital |
Retained Earnings |
Treasury Stock |
AOCI(1) |
Total |
||||||||||||||||||||
|---|---|---|---|---|---|---|---|---|---|---|---|---|---|---|---|---|---|---|---|---|---|---|---|---|---|---|---|---|---|---|
Balance at January 1, 2008 |
35,277 | — | $ | 353 | $ | 231,984 | $ | 51,341 | $ | — | $ | 4 | $ | 283,682 | ||||||||||||||||
Comprehensive income: |
||||||||||||||||||||||||||||||
Net income |
— | — | — | — | 13,836 | — | — | 13,836 | ||||||||||||||||||||||
Foreign currency translation adjustment |
— | — | — | — | — | — | (2,687 | ) | (2,687 | ) | ||||||||||||||||||||
|
||||||||||||||||||||||||||||||
Total comprehensive income |
— | — | — | — | 13,836 | — | (2,687 | ) | 11,149 | |||||||||||||||||||||
|
||||||||||||||||||||||||||||||
Excess tax benefits from share-based compensation |
— | — | — | 308 | — | — | — | 308 | ||||||||||||||||||||||
Common stock issued under share-based compensation plans |
381 | — | 4 | 2,521 | — | — | — | 2,525 | ||||||||||||||||||||||
Share-based compensation |
— | — | — | 2,831 | — | — | — | 2,831 | ||||||||||||||||||||||
Balance at December 31, 2008 |
35,658 | — | 357 | 237,644 | 65,177 | — | (2,683 | ) | 300,495 | |||||||||||||||||||||
Comprehensive income: |
||||||||||||||||||||||||||||||
Net income |
— | — | — | — | 14,595 | — | — | 14,595 | ||||||||||||||||||||||
Foreign currency translation adjustment |
— | — | — | — | — | — | 868 | 868 | ||||||||||||||||||||||
|
||||||||||||||||||||||||||||||
Total comprehensive income |
— | — | — | — | 14,595 | — | 868 | 15,463 | ||||||||||||||||||||||
|
||||||||||||||||||||||||||||||
Excess tax benefits from share-based compensation |
— | — | — | 784 | — | — | — | 784 | ||||||||||||||||||||||
Common stock issued under share-based compensation plans |
292 | 61 | 5 | 1,934 | — | 924 | — | 2,863 | ||||||||||||||||||||||
Common stock repurchased under share-based compensation plans |
— | (117 | ) | — | — | — | (1,782 | ) | — | (1,782 | ) | |||||||||||||||||||
Conversion of convertible notes (Note 5) |
3 | — | — | 32 | — | — | — | 32 | ||||||||||||||||||||||
Share-based compensation |
285 | — | — | 8,543 | — | — | — | 8,543 | ||||||||||||||||||||||
Balance, December 31, 2009 |
36,238 | (56 | ) | 362 | 248,937 | 79,772 | (858 | ) | (1,815 | ) | 326,398 | |||||||||||||||||||
Comprehensive income: |
||||||||||||||||||||||||||||||
Net income |
— | — | — | — | 13,929 | — | — | 13,929 | ||||||||||||||||||||||
Foreign currency translation adjustment |
— | — | — | — | — | — | (156 | ) | (156 | ) | ||||||||||||||||||||
|
||||||||||||||||||||||||||||||
Total comprehensive income |
— | — | — | — | 13,929 | — | (156 | ) | 13,773 | |||||||||||||||||||||
|
||||||||||||||||||||||||||||||
Tax deficiency from share-based compensation |
— | — | — | (211 | ) | — | — | — | (211 | ) | ||||||||||||||||||||
Common stock issued under share-based compensation plans |
497 | 219 | 5 | (1,478 | ) | — | 2,933 | — | 1,460 | |||||||||||||||||||||
Common stock repurchased under share-based compensation plans |
— | (76 | ) | — | — | — | (948 | ) | — | (948 | ) | |||||||||||||||||||
Share repurchases (Note 7) |
— | (3,382 | ) | — | — | — | (43,212 | ) | — | (43,212 | ) | |||||||||||||||||||
Conversion of convertible notes (Note 5) |
2,328 | — | 24 | 27,144 | — | — | — | 27,168 | ||||||||||||||||||||||
Dividends declared (Note 7) |
— | — | — | — | (2,632 | ) | — | — | (2,632 | ) | ||||||||||||||||||||
Share-based compensation |
— | — | — | 6,727 | — | — | — | 6,727 | ||||||||||||||||||||||
Balance at December 31, 2010 |
39,063 | (3,295 | ) | $ | 391 | $ | 281,119 | $ | 91,069 | $ | (42,085 | ) | $ | (1,971 | ) | $ | 328,523 | |||||||||||||
- (1)
- AOCI—Accumulated Other Comprehensive Income (Loss)
See accompanying Notes to Consolidated Financial Statements.
F-4
EPIQ SYSTEMS, INC.
CONSOLIDATED STATEMENTS OF CASH FLOWS
(In Thousands)
| |
Year Ended December 31, | |||||||||||
|---|---|---|---|---|---|---|---|---|---|---|---|---|
| |
2010 | 2009 | 2008 | |||||||||
CASH FLOWS FROM OPERATING ACTIVITIES: |
||||||||||||
Net income |
$ | 13,929 | $ | 14,595 | $ | 13,836 | ||||||
Adjustments to reconcile net income to net cash provided by operating activities: |
||||||||||||
(Benefit) expense for deferred income taxes |
(87 | ) | 1,276 | 938 | ||||||||
Depreciation and software amortization |
20,391 | 18,775 | 16,302 | |||||||||
Benefit related to embedded option |
(738 | ) | (1,610 | ) | (1,610 | ) | ||||||
Amortization of intangible assets |
9,190 | 7,409 | 9,051 | |||||||||
Share-based compensation expense |
6,727 | 8,543 | 2,831 | |||||||||
Provision for bad debts |
2,146 | 1,732 | 1,678 | |||||||||
Other, net |
463 | 597 | 1,277 | |||||||||
Changes in operating assets and liabilities, net of effects from business acquisitions: |
||||||||||||
Trade accounts receivable |
(17,011 | ) | 3,520 | (16,919 | ) | |||||||
Prepaid expenses and other assets |
18 | (11 | ) | 885 | ||||||||
Accounts payable and other liabilities |
(1,117 | ) | (1,255 | ) | 4,566 | |||||||
Deferred revenue |
662 | (1,603 | ) | 1,130 | ||||||||
Excess tax benefit related to share-based compensation |
— | (579 | ) | (95 | ) | |||||||
Other |
(136 | ) | 433 | 348 | ||||||||
Net cash provided by operating activities |
34,437 | 51,822 | 34,218 | |||||||||
CASH FLOWS FROM INVESTING ACTIVITIES: |
||||||||||||
Purchase of property and equipment |
(11,092 | ) | (10,301 | ) | (14,539 | ) | ||||||
Internally developed software costs |
(8,131 | ) | (7,562 | ) | (6,562 | ) | ||||||
Cash paid for business acquisition, net of cash acquired |
(51,548 | ) | — | (4,762 | ) | |||||||
Other investing activities, net |
11 | 302 | 38 | |||||||||
Net cash used in investing activities |
(70,760 | ) | (17,561 | ) | (25,825 | ) | ||||||
CASH FLOWS FROM FINANCING ACTIVITIES: |
||||||||||||
Proceeds from revolver |
78,000 | — | 3,000 | |||||||||
Payments on revolver |
(11,000 | ) | — | (3,000 | ) | |||||||
Debt issuance costs |
(1,460 | ) | — | (795 | ) | |||||||
Payments under long-term obligations |
(27,508 | ) | (6,065 | ) | (4,037 | ) | ||||||
Excess tax benefit related to share-based compensation |
— | 579 | 95 | |||||||||
Common stock repurchases (Note 7) |
(44,160 | ) | (1,782 | ) | — | |||||||
Cash dividends paid (Note 7) |
(2,632 | ) | — | — | ||||||||
Proceeds from issuance of common stock under share-based compensation plans |
1,460 | 2,863 | 2,525 | |||||||||
Net cash used in financing activities |
(7,300 | ) | (4,405 | ) | (2,212 | ) | ||||||
Effect of exchange rate changes on cash |
76 | 124 | (590 | ) | ||||||||
NET (DECREASE) INCREASE IN CASH AND CASH EQUIVALENTS |
(43,547 | ) | 29,980 | 5,591 | ||||||||
CASH AND CASH EQUIVALENTS, BEGINNING OF YEAR |
48,986 | 19,006 | 13,415 | |||||||||
CASH AND CASH EQUIVALENTS, END OF YEAR |
$ | 5,439 | $ | 48,986 | $ | 19,006 | ||||||
See accompanying Notes to Consolidated Financial Statements.
F-5
EPIQ SYSTEMS, INC.
NOTES TO CONSOLIDATED FINANCIAL STATEMENTS
DECEMBER 31, 2010, 2009 AND 2008
NOTE 1: NATURE OF OPERATIONS AND SUMMARY OF SIGNIFICANT ACCOUNTING POLICIES
Principles of Consolidation
The Consolidated Financial Statements include the accounts of Epiq Systems, Inc. ("Epiq") and its wholly-owned subsidiaries. Intercompany transactions and balances have been eliminated in consolidation.
In preparing these financial statements, we have evaluated events and transactions for potential recognition or disclosure through the date the financial statements were issued.
Nature of Operations
We are a provider of integrated technology solutions for the legal profession. Our solutions streamline the administration of bankruptcy, litigation, financial transactions and regulatory compliance matters. We offer innovative technology solutions for e-discovery, document review, legal notification, claims administration and controlled disbursement of funds. Our clients include leading law firms, corporate legal departments, bankruptcy trustees, government agencies, mortgage processors, financial institutions, and other professional advisors who require innovative technology, responsive service and deep subject-matter expertise.
Cash and Cash Equivalents
Cash and cash equivalents include cash on hand and in banks and all liquid investments with original maturities of three months or less at the time of purchase.
Accounts Receivable
Accounts receivable are recorded at the invoiced amount and are non-interest bearing. We maintain an allowance for doubtful accounts to reserve for potentially uncollectible receivables. We review accounts receivable by amounts due from customers which are past due to identify specific customers with known disputes or collectability issues. In determining the amount of the reserve, we make judgments about the creditworthiness of significant customers based on ongoing credit evaluations.
Internally Developed Software Costs
Certain internal software development costs incurred in the creation of computer software products for sale, lease or otherwise to be marketed are capitalized once technological feasibility has been established. Capitalized costs are amortized; beginning in the period the product is available for general release, based on the ratio of current revenue to current and estimated future revenue for each product with minimum annual amortization equal to the straight-line amortization over the remaining estimated economic life of the product. Certain internal software development costs incurred in the creation of computer software products for internal use are capitalized when the preliminary project phase is complete and when management, with the relevant authority, authorizes and commits funding to the project and it is probable the project will be completed and the software will be used to perform the function intended. Capitalized costs are amortized, beginning in the period each module or
F-6
EPIQ SYSTEMS, INC.
NOTES TO CONSOLIDATED FINANCIAL STATEMENTS (Continued)
DECEMBER 31, 2010, 2009 AND 2008
NOTE 1: NATURE OF OPERATIONS AND SUMMARY OF SIGNIFICANT ACCOUNTING POLICIES (Continued)
component of the product is ready for its intended use, on a straight-line basis over the estimated economic life of the product.
Goodwill and Identifiable Intangible Assets
Goodwill consists of the excess of cost of acquired enterprises over the sum of the amounts assigned to identifiable assets acquired less liabilities assumed. We assess goodwill for impairment on an annual basis at a reporting unit level. A reporting unit is a component of a segment that constitutes a business, for which discrete financial information is available, and for which the operating results are regularly reviewed by management. We have determined that our reporting units are bankruptcy trustee management, corporate restructuring, eDiscovery, and settlement administration. Goodwill is assessed between annual tests if an event occurs or circumstances change that would more likely than not reduce the fair value of a reporting unit below its carrying value. These events or circumstances could include a significant change in the business climate, a change in strategic direction, legal factors, operating performance indicators, a change in the competitive environment, the sale or disposition of a significant portion of a reporting unit, or future economic factors such as unfavorable changes in our stock price and market capitalization or unfavorable changes in the estimated future discounted cash flows of our reporting units. Our annual test is performed as of July 31 each year, and there have been no events since the annual test to indicate that it is more likely than not that the recorded goodwill balance had become impaired.
Application of the goodwill impairment test requires judgment, including the identification of reporting units, assignment of assets and liabilities to reporting units, assignment of goodwill to reporting units, and determination of the fair value of each reporting unit. We considered both a market approach and an income approach in order to develop an estimate of the fair value of each reporting unit for purposes of our annual impairment test. When evaluating the market approach, we determined that directly comparable publicly-traded companies did not exist, primarily due to the unique business model characteristics and projected growth of each reporting unit. Instead, we utilized a discounted projected future cash flow analysis (income approach) to determine the fair value of each reporting unit. Potential impairment is indicated when the carrying value of a reporting unit, including goodwill, exceeds its estimated fair value. This analysis requires significant judgments, including estimation of future cash flows, which is dependent on internal forecasts, estimation of the long-term rate of growth for our business, estimation of the useful life over which cash flows will occur, and determination of our weighted average cost of capital. Changes in these estimates and assumptions could materially affect the determination of fair value and goodwill impairment for each reporting unit. In addition, financial and credit market volatility directly impacts our fair value measurement through our weighted average cost of capital, used to determine our discount rate, and through our stock price, used to determine our market capitalization. We may be required to recognize impairment of goodwill based on future economic factors such as unfavorable changes in our stock price and market capitalization or unfavorable changes in the estimated future discounted cash flows of our reporting units.
If we determine that the estimated fair value of any reporting unit is less than the reporting unit's carrying value, then we proceed to the second step of the goodwill impairment analysis to measure the
F-7
EPIQ SYSTEMS, INC.
NOTES TO CONSOLIDATED FINANCIAL STATEMENTS (Continued)
DECEMBER 31, 2010, 2009 AND 2008
NOTE 1: NATURE OF OPERATIONS AND SUMMARY OF SIGNIFICANT ACCOUNTING POLICIES (Continued)
potential impairment charge. An impairment loss is recognized for any excess of the carrying value of the reporting unit's goodwill over the implied fair value. If goodwill on our Consolidated Balance Sheet becomes impaired during a future period, the resulting impairment charge could have a material impact on our results of operations and financial condition.
Due to the current economic environment and the uncertainties regarding the impact that future economic impacts will have on our reporting units, there can be no assurances that our estimates and assumptions regarding the duration of the economic recession, or the period or strength of recovery, made for purposes of our annual goodwill impairment test, will prove to be accurate predictions of the future. If our assumptions regarding forecasted revenues or margins of certain of our reporting units are not achieved, we may be required to record goodwill impairment losses in future periods. It is not possible at this time to determine if any such future impairment loss would occur, and if it does occur, whether such charge would be material.
Our recognized goodwill totaled $294.8 million as of December 31, 2010. As of July 31, 2010, which is the date of our most recent impairment test, the fair value of each of our reporting units was substantially in excess of the carrying value of the reporting unit, except for the bankruptcy trustee management reporting unit, which had $74.9 million of goodwill allocated to it. The fair value of this reporting unit exceeded its carrying value by approximately 14%. The discount rate used in the income approach for the trustee management reporting unit, evaluated at July 31, 2010, was 12.3%. An increase to the discount rate of 1% would have lowered the fair value determined under the income approach for this reporting unit by approximately $12.0 million, or 12%, which, with all other variables remaining the same, would result in the fair value of this reporting unit exceeding its carrying value by 1%. In connection with the acquisition of Jupiter eSources LLC on October 1, 2010, as described in Note 13, we recognized $30.7 million of goodwill, which is allocated to the bankruptcy segment.
Impairment of Long-lived Assets
Identifiable intangible assets, resulting from various business acquisitions, consist of customer relationships, agreements not to compete, and trade names. Our customer relationships, agreements not to compete, and one of our trade name intangible assets have finite lives, and are amortized over their estimated economic benefit period, generally from five to ten years. These definite lived intangible assets are tested annually for impairment and also reviewed for impairment whenever events or changes in circumstances have indicated that the carrying amount of these assets might not be recoverable. If we were to determine that events and circumstances warrant a change to the estimate of an identifiable intangible asset's remaining useful life, then the remaining carrying amount of the identifiable intangible asset would be amortized prospectively over that revised remaining useful life. Additionally, information resulting from our annual assessment, or other events and circumstances, may indicate that the carrying value of one or more identifiable intangible assets is not recoverable which would result in recognition of an impairment charge.
Our trade name identifiable intangible asset recognized in connection with the 2010 acquisition of Jupiter eSources LLC was determined to have an indefinite life. Intangible assets with indefinite lives are not amortized and are tested annually for impairment and also reviewed for impairment whenever events or changes in circumstances indicate the carrying amount of the asset might not be recoverable. Impairment of identifiable intangible assets with indefinite lives occurs when the fair value of the asset is less than its carrying amount. If impaired, the asset's carrying amount is reduced to its fair value.
F-8
EPIQ SYSTEMS, INC.
NOTES TO CONSOLIDATED FINANCIAL STATEMENTS (Continued)
DECEMBER 31, 2010, 2009 AND 2008
NOTE 1: NATURE OF OPERATIONS AND SUMMARY OF SIGNIFICANT ACCOUNTING POLICIES (Continued)
Deferred Loan Fees
Incremental, third party costs related to establishing credit facilities are capitalized and amortized based on the terms of the related debt. The unamortized costs are included as a component of other long-term assets on our Consolidated Balance Sheets. Amortization costs are included as a component of interest expense on our Consolidated Statements of Income.
Share-Based Compensation
We measure the cost of employee services received in exchange for an award of equity instruments based on the grant-date fair value of the award and recognize that cost over the period during which an employee is required to provide service in exchange for the award. We recognize this expense on a straight-line basis over the requisite service period of the award.
Income Taxes
A deferred tax asset or liability is recognized for the anticipated future tax consequences of temporary differences between the tax basis of assets or liabilities and their reported amounts in the financial statements and for operating loss and tax credit carryforwards. A valuation allowance is provided when, in the opinion of management, it is more likely than not that some portion or all of a deferred tax asset will not be realized. Realization of the deferred tax assets is dependent on our ability to generate sufficient future taxable income and, if necessary, execution of our tax planning strategies. In the event we determine that sufficient future taxable income, taking into consideration tax planning strategies, may not generate sufficient taxable income to fully realize net deferred tax assets, we may be required to establish or increase valuation allowances by a charge to income tax expense in the period such a determination is made. This charge may have a material impact on recognized income tax expense on our Consolidated Statements of Income. Deferred tax assets and liabilities are measured using enacted tax rates expected to apply to taxable income in the years in which those temporary differences are expected to be recovered or settled. The effect on deferred tax assets and liabilities of a change in tax rates is recognized in income in the period that includes the enactment date. The recognition of a change in enacted tax rates may have a material impact on recognized income tax expense and on our Consolidated Statements of Income.
We follow accounting guidance which prescribes a comprehensive model for how companies should recognize, measure, present, and disclose in their financial statements uncertain tax positions taken or expected to be taken on a tax return. Under this guidance, tax positions are initially recognized in the financial statements when it is more likely than not the position will be sustained upon examination by the tax authorities. Such tax positions are initially and subsequently measured as the largest amount of tax benefit that is greater than 50% likely of being realized upon ultimate settlement with the tax authority assuming full knowledge of the position and all relevant facts. Application of this guidance requires numerous estimates based on available information. We consider many factors when evaluating and estimating our tax positions and tax benefits, and our recognized tax positions and tax benefits may not accurately anticipate actual outcomes. As we obtain additional information, we may need to periodically adjust our recognized tax positions and tax benefits. These periodic adjustments may have a
F-9
EPIQ SYSTEMS, INC.
NOTES TO CONSOLIDATED FINANCIAL STATEMENTS (Continued)
DECEMBER 31, 2010, 2009 AND 2008
NOTE 1: NATURE OF OPERATIONS AND SUMMARY OF SIGNIFICANT ACCOUNTING POLICIES (Continued)
material impact on our Consolidated Statements of Income. For additional information related to uncertain tax positions see Note 10.
Revenue Recognition
We have agreements with clients pursuant to which we deliver various services each month.
Following is a description of significant sources of our revenue:
- •
- Fees contingent upon the month-to-month delivery of case management services defined by client
contracts, such as claims processing, claims reconciliation, professional services, call center support, disbursement services, project management, collection and forensic services, document review
services, and conversion of data into an organized, searchable electronic database. The amount we earn varies based primarily on the size and complexity of the engagement.
- •
- Hosting fees based on the amount of data stored.
- •
- Deposit-based fees, earned primarily based on a percentage of Chapter 7 total liquidated assets placed on deposit
with a designated financial institution by our trustee clients, to whom we provide, at no charge, software licenses, limited hardware and hardware maintenance, and postcontract customer support
services. The fees we earn are based on total liquidated assets placed on deposit by our trustee clients and may vary based on fluctuations in short-term interest rates.
- •
- Legal noticing services to parties of interest in bankruptcy and class action matters, including direct notification,
media campaign, and advertising management in which we coordinate notification through various media outlets, such as print, radio and television, to potential parties of interest for a particular
client engagement.
- •
- Reimbursement for costs incurred, primarily related to postage on mailing services.
- •
- Monitoring and noticing fees earned based on monthly or on-demand requests for information provided through our AACER® software product.
Non-Software Arrangements
Services related to eDiscovery and settlement administration are billed based on volume. For these contractual arrangements, we have identified each deliverable service element. Based on our evaluation of each element, we have determined that each element delivered has standalone value to our customers because we or other vendors sell such services separately from any other services/deliverables. We have also obtained objective and reliable evidence of the fair value of each element based either on the price we charge when we sell an element on a standalone basis or based on third-party evidence of fair value of such similar services. Lastly, our arrangements do not include general rights of return. Accordingly, each of the service elements in our multiple element case and document management arrangements qualifies as a separate unit of accounting. We allocate revenue to the various units of accounting in our arrangements based on the fair value of each unit of accounting, which is generally consistent with the stated prices in our arrangements. As we have evidence of an
F-10
EPIQ SYSTEMS, INC.
NOTES TO CONSOLIDATED FINANCIAL STATEMENTS (Continued)
DECEMBER 31, 2010, 2009 AND 2008
NOTE 1: NATURE OF OPERATIONS AND SUMMARY OF SIGNIFICANT ACCOUNTING POLICIES (Continued)
arrangement, revenue for each separate unit of accounting is recognized each period. Revenue is recognized as the services are rendered, our fee becomes fixed and determinable, and collectability is reasonably assured. Payments received in advance of satisfaction of the related revenue recognition criteria are recognized as a customer deposit or deferred revenue on our Consolidated Balance Sheets until all revenue recognition criteria have been satisfied.
Software Arrangements
For our Chapter 7 bankruptcy trustee arrangements, we provide our trustee clients with a software license, hardware lease, hardware maintenance, and postcontract customer support services, all at no charge to the trustee. The trustees place their liquidated estate deposits with a financial institution with which we have an arrangement. We earn contingent monthly fees from the financial institutions based on the dollar level of average monthly deposits held by the trustees with that financial institution related to the software license, hardware lease, hardware maintenance, and postcontract customer support services. Since we have not established vendor specific objective evidence of the fair value of the software license, we do not recognize any revenue on delivery of the software. The software element is deferred and included with the remaining undelivered elements, which are postcontract customer support services. This revenue, when recognized, is included as a component of "Case management services revenue" in the Consolidated Statements of Income. Revenue related to postcontract customer support is entirely contingent on the placement of liquidated estate deposits by the trustee with the financial institution. Accordingly, we recognize this contingent usage based revenue as the fee becomes fixed or determinable at the time actual usage occurs and collectability is probable. This occurs monthly as a result of the computation, billing and collection of monthly deposit fees contractually agreed to. At that time, we have also satisfied the other revenue recognition criteria since we have persuasive evidence that an arrangement exists, services have been rendered, the price is fixed and determinable, and collectability is reasonably assured.
We also provide our trustee clients with certain hardware, such as desktop computers, monitors, and printers; and hardware maintenance. We retain ownership of all hardware provided and we account for this hardware as a lease. As the hardware maintenance arrangement is an executory contract similar to an operating lease, we use guidance related to contingent rentals in operating lease arrangements for hardware maintenance as well as for the hardware lease. Since the payments under all of our arrangements are contingent upon the level of trustee deposits and the delivery of upgrades and other services, and there remain important uncertainties regarding the amount of unreimbursable costs yet to be incurred by us, we account for the hardware lease as an operating lease. Therefore, all lease payments, based on the estimated fair value of hardware provided, were accounted for as contingent rentals; which requires that we recognize rental income when the changes in the factor on which the contingent lease payment is based actually occur. This occurs at the end of each period as we achieve our target when deposits are held at the depository financial institution as, at that time, evidence of an arrangement exists, delivery has occurred, the amount has become fixed and determinable, and collection is reasonably assured. This revenue, which is less than ten percent of our total revenue for the years ended December 31, 2010, 2009 and 2008, is included in the Consolidated Statements of Income as a component of "Case management services" revenue.
F-11
EPIQ SYSTEMS, INC.
NOTES TO CONSOLIDATED FINANCIAL STATEMENTS (Continued)
DECEMBER 31, 2010, 2009 AND 2008
NOTE 1: NATURE OF OPERATIONS AND SUMMARY OF SIGNIFICANT ACCOUNTING POLICIES (Continued)
Reimbursements
We have revenue related to the reimbursement of certain costs, primarily postage. Reimbursed postage and other reimbursable direct costs are recorded gross in the Consolidated Statements of Income as "Operating revenue from reimbursed direct costs" and as "Reimbursed direct costs".
Costs Related to Contract Acquisition, Origination, and Set-up
We expense contract acquisition, origination, and set-up costs as incurred.
Depreciation and Software and Leasehold Amortization
The caption "Depreciation and software and leasehold amortization" in the accompanying Consolidated Statements of Income includes costs that are directly related to services of approximately $10.8 million, $10.6 million, and $9.4 million for the years ended December 31, 2010, 2009 and 2008, respectively.
Income Per Share
Basic net income per share is computed on the basis of weighted average outstanding common shares. Diluted net income per share is computed on the basis of basic weighted average outstanding common shares adjusted for the dilutive effect of stock options and convertible debt, if dilutive. The numerator of the diluted net income per share calculation is increased by the amount of interest expense, net of tax, related to outstanding convertible debt, and the allocation of net income to nonvested shares, if the net impact is dilutive.
When calculating incremental shares related to outstanding stock options, we had previously applied the treasury stock method. The treasury stock method assumes that proceeds, consisting of the amount the employee must pay on exercise, compensation cost attributed to future services and not yet recognized, and excess tax benefits, net of tax deficiencies, that would be credited to additional paid-in capital on exercise of the awards, are used to repurchase outstanding shares at the average market price for the period.
Based upon new guidance which was effective January 1, 2009, we determined that the nonvested share awards (also referred to as restricted stock awards) which we began to issue in 2009 are participating securities because they have non-forfeitable rights to dividends. Accordingly, basic net income per share is calculated under the two-class method calculation. In determining the number of diluted shares outstanding, we are required to disclose the more dilutive earnings per share result between the treasury stock method calculation and the two-class method calculation. For the years ended December 31, 2010 and 2009, the two-class method calculation was more dilutive; therefore, the diluted net income per share calculation for those years is presented following the two-class method. There was no impact to our calculation for the year ended December 31, 2008, as we did not have any participating securities outstanding during that period.
F-12
EPIQ SYSTEMS, INC.
NOTES TO CONSOLIDATED FINANCIAL STATEMENTS (Continued)
DECEMBER 31, 2010, 2009 AND 2008
NOTE 1: NATURE OF OPERATIONS AND SUMMARY OF SIGNIFICANT ACCOUNTING POLICIES (Continued)
Segment Information
Our chief operating decision maker, which consists of our executive committee, considers how we organize our business internally for making operating decisions and assessing business performance to determine our reportable segments.
Foreign Currency Translation
Local currencies are the functional currencies for our operating subsidiaries. Accordingly, assets and liabilities of these subsidiaries are translated at the rate of exchange at the balance sheet date. Adjustments from the translation process are part of accumulated other comprehensive loss and are included as a separate component of stockholders' equity. The changes in foreign currency translation adjustments were not adjusted for income taxes since they relate to indefinite term investments in non-United States subsidiaries. Income and expense items of significant value are translated as of the date of the transactions for these subsidiaries; however, day to day operational transactions are translated at average rates of exchange. As of December 31, 2010, 2009 and 2008, cumulative translation adjustments included in accumulated other comprehensive loss were $2.0 million, $1.8 million, and $2.7 million, respectively.
Accounting for Contingencies
We are involved in various legal proceedings that arise from time to time in the ordinary course of business. Except for income tax contingencies, we record accruals for contingencies to the extent that we conclude their occurrence is probable and that the related liabilities are estimable. We record anticipated recoveries under existing insurance contracts when we are assured of recovery. Many factors are considered when making these assessments, including the progress of the case, opinions or views of legal counsel, prior case law, our experience or the experience of other companies with similar cases, and our intent on how to respond. Litigation and other contingencies are inherently unpredictable and excessive damage awards do occur. As such, these assessments can involve a series of complex judgments about future events and can rely heavily on estimates and assumptions.
Use of Estimates
The preparation of financial statements in conformity with accounting principles generally accepted in the United States of America requires management to make estimates and assumptions that affect the reported amounts of assets and liabilities and disclosure of contingent assets and liabilities at the date of the financial statements. Estimates also affect the reported amounts of revenues and expenses during the periods reported. Actual results may differ from those estimates.
Recently Adopted Accounting Pronouncements
In January 2010, the FASB issued updated guidance that requires entities to disclose separately the amounts of significant transfers in and out of Level 1 and Level 2 fair value measurements and describe the reasons for the transfers. In addition, the update requires entities to present separately information about purchases, sales, issuances, and settlements in the reconciliation for fair value
F-13
EPIQ SYSTEMS, INC.
NOTES TO CONSOLIDATED FINANCIAL STATEMENTS (Continued)
DECEMBER 31, 2010, 2009 AND 2008
NOTE 1: NATURE OF OPERATIONS AND SUMMARY OF SIGNIFICANT ACCOUNTING POLICIES (Continued)
measurements using significant unobservable inputs (Level 3). The disclosures related to Level 1 and Level 2 fair value measurements are effective for us in 2010. The update required new disclosures only, and had no impact on our consolidated financial position, results of operations, or cash flows as we have not had any transfers out of Level 1. The disclosures related to Level 3 fair value measurements are effective for us in 2011. This update also only requires new disclosures, and will have no impact on our consolidated financial position, results of operations, or cash flows.
Recently Issued Accounting Pronouncements Not Yet Adopted
In October 2009, the FASB issued new standards for revenue recognition with multiple deliverables. These new standards require entities to allocate revenue in an arrangement using estimated selling prices of the delivered goods and services based on a selling price hierarchy. The amendments eliminate the residual method of revenue allocation and require revenue to be allocated using the relative selling price method. These new standards are effective for us beginning in the first quarter of fiscal year 2011, however early adoption is permitted. We do not anticipate that the adoption of this standard will have a material impact on our consolidated financial statements.
In October 2009, the FASB issued new standards for the accounting for certain revenue arrangements that include software elements. These new standards amend the scope of pre-existing software revenue guidance by removing from the guidance non-software components of tangible products and certain software components of tangible products. These new standards are effective for us beginning in the first quarter of fiscal year 2011, however early adoption is permitted. We do not anticipate that the adoption of this standard will have a material impact on our consolidated financial statements as our software arrangements are not tangible products with software components.
In December 2010, the FASB issued new standards that amend the criteria for performing Step 2 of the goodwill impairment test for reporting units with zero or negative carrying amounts and requires performing Step 2 if qualitative factors indicate that it is more likely than not that a goodwill impairment exists. We will adopt this guidance in fiscal year 2011. We do not anticipate the adoption of this standard will have a material impact on our consolidated financial statements as we do not have any reporting units with zero or negative carrying amounts as of our last impairment test.
F-14
EPIQ SYSTEMS, INC.
NOTES TO CONSOLIDATED FINANCIAL STATEMENTS (Continued)
DECEMBER 31, 2010, 2009 AND 2008
NOTE 2: PROPERTY AND EQUIPMENT
Property and equipment, including leasehold improvements and purchased software, are stated at cost and depreciated or amortized on a straight-line basis over the estimated useful life of each asset or, for leasehold improvements, the lesser of the lease term or useful life. The classification of property and equipment and the related estimated useful lives is as follows:
| |
December 31, | |
||||||
|---|---|---|---|---|---|---|---|---|
| |
Estimated Useful Life |
|||||||
| |
2010 | 2009 | ||||||
| |
(in thousands) |
|
||||||
Land |
$ | 192 | $ | 192 | ||||
Building and building and leasehold improvements |
13,384 | 12,736 | 3 - 30 years | |||||
Furniture and fixtures |
3,489 | 2,976 | 5 - 7 years | |||||
Computer and purchased software |
64,367 | 54,671 | 2 - 5 years | |||||
Transportation equipment |
7,522 | 7,523 | 3 - 5 years | |||||
Operations equipment |
6,118 | 5,784 | 3 - 5 years | |||||
Construction in progress |
3,420 | 684 | ||||||
|
98,492 | 84,566 | ||||||
Accumulated depreciation and amortization |
(57,234 | ) | (44,561 | ) | ||||
Property and equipment |
$ | 41,258 | $ | 40,005 | ||||
Computer and purchased software includes property acquired under capital leases. As of December 31, 2010 and 2009, assets acquired under capital leases had a historical cost basis of $14.7 million and $10.8 million, respectively, and accumulated amortization of $6.6 million and $4.7 million, respectively.
NOTE 3: INTERNALLY DEVELOPED SOFTWARE
The following is a summary of internally developed software capitalized:
| |
Year Ended December 31, | ||||||
|---|---|---|---|---|---|---|---|
| |
2010 | 2009 | |||||
| |
(in thousands) |
||||||
Amounts capitalized, beginning of year |
$ | 39,249 | $ | 32,055 | |||
Development costs capitalized |
8,131 | 7,562 | |||||
Foreign currency translation |
(17 | ) | 22 | ||||
Acquired software |
2,880 | — | |||||
Dispositions |
(1,194 | ) | (390 | ) | |||
Amounts capitalized, end of year |
49,049 | 39,249 | |||||
Accumulated amortization, end of year |
(29,390 | ) | (25,517 | ) | |||
Software development costs, net |
$ | 19,659 | $ | 13,732 | |||
Included in the above are capitalized software development costs for unreleased products of $6.7 million and $5.8 million at December 31, 2010 and 2009, respectively. During the years ended December 31, 2010, 2009 and 2008, we recognized amortization expense related to capitalized software development costs of $5.1 million, $4.8 million, and $5.5 million, respectively.
F-15
EPIQ SYSTEMS, INC.
NOTES TO CONSOLIDATED FINANCIAL STATEMENTS (Continued)
DECEMBER 31, 2010, 2009 AND 2008
NOTE 4: GOODWILL AND INTANGIBLE ASSETS
The change in the carrying amount of goodwill for 2010 and 2009 was as follows:
| |
eDiscovery | Bankruptcy | Settlement Administration |
Total | |||||||||
|---|---|---|---|---|---|---|---|---|---|---|---|---|---|
| |
(in thousands) |
||||||||||||
Balance as of December 31, 2008 |
$ | 79,586 | $ | 151,438 | $ | 32,847 | $ | 263,871 | |||||
Foreign currency translation |
368 | — | — | 368 | |||||||||
Balance as of December 31, 2009 |
79,954 | 151,438 | 32,847 | 264,239 | |||||||||
Acquisitions |
— | 30,678 | — | 30,678 | |||||||||
Foreign currency translation and other |
(128 | ) | — | — | (128 | ) | |||||||
Balance as of December 31, 2010 |
$ | 79,826 | $ | 182,116 | $ | 32,847 | $ | 294,789 | |||||
The increase in goodwill in 2010 resulted from the October 2010 acquisition of Jupiter eSources LLC, discussed further in Note 13.
Identifiable intangible assets as of December 31, 2010 and December 31, 2009 consisted of the following:
| |
December 31, 2010 | December 31, 2009 | ||||||||||||
|---|---|---|---|---|---|---|---|---|---|---|---|---|---|---|
| |
Gross Carrying Amount |
Accumulated Amortization |
Gross Carrying Amount |
Accumulated Amortization |
||||||||||
| |
(in thousands) |
|||||||||||||
Amortizing intangible assets: |
||||||||||||||
Customer relationships |
$ | 63,902 | $ | 32,007 | $ | 40,057 | $ | 25,880 | ||||||
Trade names |
745 | 745 | 745 | 745 | ||||||||||
Non-compete agreements |
30,838 | 25,587 | 27,910 | 22,563 | ||||||||||
Non-amortizing intangible assets: |
||||||||||||||
Trade names |
6,434 | — | — | — | ||||||||||
|
$ | 101,919 | $ | 58,339 | $ | 68,712 | $ | 49,188 | ||||||
Customer relationships and non-compete agreements carry a weighted average life of six years and seven years, respectively. The AACER® trade name acquired in 2010 was determined to have an indefinite life and is not amortized. Aggregate amortization expense related to amortizing intangible assets was $9.2 million, $7.4 million, and $9.1 million for the years ended December 31, 2010, 2009 and 2008, respectively. The following table outlines the estimated future amortization expense related to amortizing intangible assets held at December 31, 2010:
Year Ending December 31,
|
(in thousands) | |||
|---|---|---|---|---|
2011 |
$ | 14,016 | ||
2012 |
10,398 | |||
2013 |
6,883 | |||
2014 |
3,361 | |||
2015 |
2,568 | |||
F-16
EPIQ SYSTEMS, INC.
NOTES TO CONSOLIDATED FINANCIAL STATEMENTS (Continued)
DECEMBER 31, 2010, 2009 AND 2008
NOTE 4: GOODWILL AND INTANGIBLE ASSETS (Continued)
The increase in identifiable intangible assets in 2010 resulted from the acquisition of Jupiter eSources LLC, discussed further in Note 13. See Note 1 for further discussion of goodwill and identifiable intangible assets.
NOTE 5: LONG-TERM OBLIGATIONS
The following is a summary of long-term obligations outstanding:
| |
Year Ended December 31, | |||||||
|---|---|---|---|---|---|---|---|---|
| |
2010 | 2009 | ||||||
| |
(in thousands) |
|||||||
Contingent convertible subordinated notes, including embedded option |
$ | — | $ | 50,706 | ||||
Senior revolving loan |
67,000 | — | ||||||
Capital leases |
7,055 | 5,190 | ||||||
Acquisition-related liabilities |
15,750 | 2,902 | ||||||
Total long-term obligations, including current portion |
89,805 | 58,798 | ||||||
Current maturities of long-term obligations |
(2,945 | ) | (54,144 | ) | ||||
Long-term obligations |
$ | 86,860 | $ | 4,654 | ||||
Credit Facilities
In the second quarter of 2010, we entered into an amended senior credit facility, with KeyBank National Association as administrative agent, and a syndicate of banks as lenders. The credit facility, which continues to provide for a senior revolving loan, increased the aggregate amount of funds available from $100.0 million to $140.0 million, and extended the maturity date from July 2011 to June 2014. During the term of the credit facility, we have the right, subject to compliance with the covenants, to increase the borrowings to a maximum of $200.0 million, an increase from the $175.0 million maximum in our previous facility. The credit facility is secured by liens on our land and buildings and a significant portion of our furniture and equipment.
Borrowings under the senior revolving loan bear interest at various rates based on our leverage ratio with two rate options at the discretion of management as follows: (1) for base rate advances, borrowings bear interest at prime rate plus 100 to 200 basis points; (2) for LIBOR rate advances, borrowings bear interest at LIBOR rate plus 225 to 325 basis points. At December 31, 2010, borrowings of $67.0 million under this facility had a weighted average interest rate of 2.50%. The average amount of borrowings under this facility in 2010 was $53.8 million, at a weighted average interest rate of 2.74%. The maximum month-end amount outstanding during 2010 was $67.0 million. At December 31, 2010, the amount available for borrowings under the credit facility is reduced by the $67.0 million outstanding and $1.1 million in outstanding letters of credit. No amounts were borrowed under the senior revolving loan as of December 31, 2009.
The credit facility contains financial covenants related to earnings before interest, provision for income taxes, depreciation, amortization, and other adjustments as defined in the agreement, and total debt. In addition, the credit facility also contains financial covenants related to senior debt, fixed
F-17
EPIQ SYSTEMS, INC.
NOTES TO CONSOLIDATED FINANCIAL STATEMENTS (Continued)
DECEMBER 31, 2010, 2009 AND 2008
NOTE 5: LONG-TERM OBLIGATIONS (Continued)
charges, and working capital. As of December 31, 2010, significant financial covenants, all as defined in our credit facility agreement, include a leverage ratio not to exceed 3.00 to 1.00, a fixed charge coverage ratio of not less than 1.25 to 1.00, and a current ratio of not less than 1.50 to 1.00. As of December 31, 2010 and 2009, we were in compliance with all financial covenants.
Contingent Convertible Subordinated Notes
On or about June 11, 2010, prior to the maturity date, $27.2 million of contingent convertible subordinated notes ("convertible notes") were converted into 2.3 million shares of common stock at a conversion price of $11.67. On June 15, 2010, the convertible notes matured, resulting in a cash payment of $22.8 million, plus accrued interest. The original $50.0 million of convertible notes were issued in June 2004 with a fixed 4% per annum interest rate and an original maturity of June 15, 2007. The holders of the convertible notes had the right to extend the maturity date by up to three years. In April 2007, the holders exercised this right and the maturity date of the convertible notes was extended to June 15, 2010.
The right to extend the maturity of the convertible notes was accounted for as an embedded option subject to bifurcation. The embedded option was initially valued at $1.2 million and the convertible notes balance was reduced by the same amount. In April 2007, the holders of the convertible notes exercised their right to extend and we performed a final valuation to estimate the fair value of the embedded option as of the approximate date of the extension. The estimated fair value of the embedded option at that date, included as a component of the convertible notes, was approximately $4.8 million. The $4.8 million estimated fair value of the embedded option was amortized as a credit to "Interest expense" on the Consolidated Statements of Income over the period to the extended maturity, which was June 15, 2010. The balance of this embedded option was included as a component of "Current maturities of long-term obligations" on the Consolidated Balance Sheet at December 31, 2009, and was fully amortized at the maturity date.
Upon conversion of $27.2 million of the notes, we recognized a nominal gain related to the remaining unamortized embedded option value associated with the converted notes in the year ended December 31, 2010. During the third quarter of 2009, a nominal principal amount of the notes were converted into shares of common stock. As a result of this conversion, we recognized a nominal gain in the third quarter of 2009 related to the unamortized embedded option value associated with the converted notes. The above changes related to the carrying value of the convertible notes, the estimated fair value of the embedded option, the amortization of the fair value of the embedded option, and recognition of nominal gain upon conversion did not affect our cash flow.
Capital Leases
We lease certain property and software under capital leases that expire during various years through 2014.
Acquisition-related Liabilities
In 2008 we had an acquisition for which a portion of the purchase price was deferred. These deferred payments, which are either non-interest bearing or have a below market interest rate, have
F-18
EPIQ SYSTEMS, INC.
NOTES TO CONSOLIDATED FINANCIAL STATEMENTS (Continued)
DECEMBER 31, 2010, 2009 AND 2008
NOTE 5: LONG-TERM OBLIGATIONS (Continued)
been discounted using an appropriate imputed interest rate. As of December 31, 2010 and 2009, the discounted value of the remaining note payments, for which the final payment is due in 2011, was approximately $0.5 million and $2.9 million, respectively, of which approximately $0.5 million and $2.4 million, respectively, was classified as "Current maturities of long-term obligations" in the Consolidated Balance Sheets as of December 31, 2010 and 2009, respectively.
In the fourth quarter of 2010, in connection with the acquisition of Jupiter eSources LLC, we incurred a liability related to contingent consideration for an earn-out opportunity based on future revenue growth. The potential undiscounted amount of all future payments that we could be required to make under the earn-out opportunity is between $0 and $20 million over a four year period. We estimated the fair value of the contingent consideration using probability assessments of projected revenue over the earn-out period, and applied an appropriate discount rate based upon the weighted average cost of capital. This fair value is based on significant inputs not observable in the market. We have recognized the fair value of approximately $7.2 million of the contingent consideration in "Long-term obligations" on the Consolidated Balance Sheet at December 31, 2010, and subsequent fair value changes, measured quarterly, up to the ultimate amount paid, will be recognized in earnings.
In connection with the acquisition of Jupiter eSources LLC, we withheld a portion of the purchase price for any claims for indemnification and purchase price adjustments. This holdback has been discounted using an appropriate imputed interest rate and $8.1 million is recorded in "Long-term obligations" on the Consolidated Balance Sheet at December 31, 2010.
Scheduled Principal Payments
Our long-term obligations, consisting of our senior revolving loan, acquisition-related liabilities, and capitalized leases, mature as follows for years ending December 31:
| |
(in thousands) | |||
|---|---|---|---|---|
2011 |
$ | 2,945 | ||
2012 |
12,559 | |||
2013 |
3,166 | |||
2014 |
69,708 | |||
2015 |
1,427 | |||
Total |
$ | 89,805 | ||
NOTE 6: OPERATING LEASES
We have non-cancelable operating leases for office space at various locations expiring at various times through 2016. Each of the leases requires us to pay all executory costs (property taxes, maintenance and insurance). Certain of our lease agreements provide for scheduled rent increases during the lease term. Rent expense is recognized on a straight-line basis over the lease term. Landlord provided tenant improvement allowances are recorded as a liability and amortized as a reduction to rent expense. Additionally, we have non-cancelable operating leases for office equipment and automobiles expiring through 2013.
F-19
EPIQ SYSTEMS, INC.
NOTES TO CONSOLIDATED FINANCIAL STATEMENTS (Continued)
DECEMBER 31, 2010, 2009 AND 2008
NOTE 6: OPERATING LEASES (Continued)
Future minimum lease payments during the years ending December 31 are as follows:
| |
Total Future Minimum Lease Payments | |||
|---|---|---|---|---|
| |
(in thousands) |
|||
2011 |
$ | 7,300 | ||
2012 |
6,143 | |||
2013 |
5,680 | |||
2014 |
5,117 | |||
2015 |
2,447 | |||
Thereafter |
86 | |||
Total minimum lease payments |
$ | 26,773 | ||
Expense related to operating leases for the years ended December 31, 2010, 2009 and 2008 was approximately $10.2 million, $8.7 million, and $5.2 million, respectively; net of sublease income of $-0-, $1.0 million, and $1.2 million, respectively.
NOTE 7: STOCKHOLDERS' EQUITY
On February 8, 2008, at a Special Meeting of the Shareholders of Epiq Systems, Inc., shareholders approved an amendment to our articles of incorporation to increase the authorized number of shares of common stock from 50,000,000 to 100,000,000.
Share Repurchase
During 2010, our board of directors authorized $70.0 million for share repurchases. Through December 31, 2010, we purchased 3.4 million shares of common stock for $43.2 million, at a weighted average cost of approximately $12.80 per share.
We also have a policy that requires shares to be repurchased by the company to satisfy tax withholding obligations upon the vesting of restricted stock awards.
Dividend
For the first time in our history, we declared and paid cash dividends in fiscal 2010. On June 23, 2010 our board of directors declared our first cash dividend of $0.035 per share, payable on August 12, 2010 to shareholders of record at the close of business on July 15, 2010. On September 21, 2010, our board of directors declared another cash dividend of $0.035 per share, payable on November 18, 2010 to shareholders of record at the close of business on October 28, 2010.Total dividends declared and paid in 2010 totaled $0.07 per outstanding common share.
On January 17, 2011, our board of directors declared a cash dividend of $0.035 per outstanding common share, which was paid on February 17, 2011 to shareholders of record on January 27, 2011.
F-20
EPIQ SYSTEMS, INC.
NOTES TO CONSOLIDATED FINANCIAL STATEMENTS (Continued)
DECEMBER 31, 2010, 2009 AND 2008
NOTE 8: EMPLOYEE BENEFIT PLANS
Stock Purchase Plan
We have an employee stock purchase plan that allows employees to purchase shares of our common stock through payroll deduction. The purchase price for all employee participants is based on the closing bid price on the last business day of the month.
Defined Contribution Plan
We have a defined contribution 401(k) plan that covers substantially all employees. We match 60% of the first 10% of employee contributions and also have the option of making discretionary contributions. Our plan expense was approximately $1.4 million, $1.2 million, and $1.5 million for the years ended December 31, 2010, 2009, and 2008, respectively.
NOTE 9: FINANCIAL INSTRUMENTS AND CONCENTRATIONS
Fair Values of Assets and Liabilities
Accounting standards establish a three-level fair value hierarchy based upon the assumptions (inputs) used to price assets or liabilities. The hierarchy requires us to maximize the use of observable inputs and minimize the use of unobservable inputs. The three levels of inputs used to measure fair value are listed below.
Level 1—Unadjusted quoted prices in active markets for identical assets or liabilities.
Level 2—Observable inputs other than those included in Level 1, such as quoted market prices for similar assets and liabilities in active markets or quoted prices for identical assets in inactive markets.
Level 3—Unobservable inputs reflecting our own assumptions and best estimate of what inputs market participants would use in pricing an asset or liability.
Assets and Liabilities Measured at Fair Value on a Recurring Basis
The carrying value and estimated fair value of our cash equivalents, which consist of short-term money market funds, are classified as Level 1. Our Level 3 liability is valued using unobservable inputs to the valuation methodology that are significant to the measurement of the fair value of the contingent consideration.
F-21
EPIQ SYSTEMS, INC.
NOTES TO CONSOLIDATED FINANCIAL STATEMENTS (Continued)
DECEMBER 31, 2010, 2009 AND 2008
NOTE 9: FINANCIAL INSTRUMENTS AND CONCENTRATIONS (Continued)
As of December 31, 2010 and 2009, our assets and liabilities that are measured and recorded at fair value on a recurring basis were as follows:
| |
|
Estimated Fair Value Measurements | |||||||||||||
|---|---|---|---|---|---|---|---|---|---|---|---|---|---|---|---|
Items Measured at Fair Value on a Recurring Basis
|
Carrying Value |
Quoted Prices in Active Markets (Level 1) |
Significant Other Observable Inputs (Level 2) |
Significant Unobservable Inputs (Level 3) |
|||||||||||
| |
(in thousands) |
||||||||||||||
December 31, 2010: |
|||||||||||||||
Assets: |
|||||||||||||||
Money market funds |
$ | 54 | $ | 54 | $ | — | $ | — | |||||||
Liabilities: |
|||||||||||||||
Contingent consideration(1) |
$ | 7,166 | $ | — | $ | — | $ | 7,166 | |||||||
December 31, 2009: |
|||||||||||||||
Financial Assets: |
|||||||||||||||
Money market funds |
$ | 44,428 | $ | 44,428 | $ | — | $ | — | |||||||
- (1)
- The contingent consideration represents the estimated fair value of the additional potential earn-out opportunity payable in connection with our acquisition of Jupiter eSources LLC that is contingent based upon future revenue growth. We estimated the fair value using projected revenue over the earn-out period, and applied a discount rate to the projected earn-out payments that approximated the weighted average cost of capital.
As of December 31, 2010 and 2009, the carrying value of our trade accounts receivable, accounts payable, certain other liabilities, deferred acquisition price payments, contingent consideration, and capital leases approximated fair value. The carrying value of the embedded option related to our convertible notes approximated fair value at December 31, 2009, and was fully amortized as of December 31, 2010. At December 31, 2010, the amount outstanding under our credit facility was $67.0 million, which approximated fair value due to the borrowing rates currently available to the company for debt with similar terms.
At December 31, 2010 there was no convertible debt outstanding. As of December 31, 2009, the carrying value of convertible debt was approximately $50.0 million. The fair value of the convertible debt was estimated at $59.9 million as of December 31, 2009. This amount was estimated by taking the outstanding convertible debt, divided by the conversion price of $11.67 per share, to arrive at an estimated number of shares that would be issued assuming conversion of all of the notes. The estimated number of shares was then multiplied by the closing price of our common stock on December 31, 2009 to arrive at an estimate of the fair value of our convertible debt at that time.
Significant Customer and Concentration of Credit Risk
During the years ended December 31, 2010, 2009 and 2008, less than 1%, 12% and 22%, respectively, of our consolidated revenue was derived from a contract with IBM in support of the
F-22
EPIQ SYSTEMS, INC.
NOTES TO CONSOLIDATED FINANCIAL STATEMENTS (Continued)
DECEMBER 31, 2010, 2009 AND 2008
NOTE 9: FINANCIAL INSTRUMENTS AND CONCENTRATIONS (Continued)
national analog to digital television conversion program, which was launched in the fourth quarter of 2007. This revenue was recognized in our settlement administration segment. Accounts receivable related to this contract represented approximately 1% of our accounts receivable balance at December 31, 2009, and there were no receivables related to this contract in our accounts receivable balance at December 31, 2010. The contract was substantially completed in 2009.
NOTE 10: INCOME TAXES
Income before income taxes consisted of the following:
| |
Year Ended December 31, | |||||||||||
|---|---|---|---|---|---|---|---|---|---|---|---|---|
| |
2010 | 2009 | 2008 | |||||||||
| |
(in thousands) |
|||||||||||
Income before income taxes |
||||||||||||
United States |
$ | 23,880 | $ | 27,561 | $ | 23,153 | ||||||
Foreign |
2,690 | (700 | ) | 1,190 | ||||||||
Total |
$ | 26,570 | $ | 26,861 | $ | 24,343 | ||||||
The provision for income taxes included the following:
| |
Year Ended December 31, | ||||||||||||
|---|---|---|---|---|---|---|---|---|---|---|---|---|---|
| |
2010 | 2009 | 2008 | ||||||||||
| |
(in thousands) |
||||||||||||
Provision for income taxes |
|||||||||||||
Currently payable income taxes |
|||||||||||||
Federal |
$ | 6,247 | $ | 6,536 | $ | 7,677 | |||||||
State |
5,366 | 4,205 | 1,368 | ||||||||||
Foreign |
1,115 | 249 | 524 | ||||||||||
Total |
12,728 | 10,990 | 9,569 | ||||||||||
Deferred income taxes |
|||||||||||||
Federal |
1,325 | 1,909 | (157 | ) | |||||||||
State |
(1,368 | ) | (421 | ) | 1,283 | ||||||||
Foreign |
(44 | ) | (212 | ) | (188 | ) | |||||||
Total |
(87 | ) | 1,276 | 938 | |||||||||
Provision for income taxes |
$ | 12,641 | $ | 12,266 | $ | 10,507 | |||||||
F-23
EPIQ SYSTEMS, INC.
NOTES TO CONSOLIDATED FINANCIAL STATEMENTS (Continued)
DECEMBER 31, 2010, 2009 AND 2008
NOTE 10: INCOME TAXES (Continued)
A reconciliation of the provision for income taxes at the statutory rate of 35% to the provision for income taxes at our effective rate is shown below:
| |
Year Ended December 31, | ||||||||||
|---|---|---|---|---|---|---|---|---|---|---|---|
| |
2010 | 2009 | 2008 | ||||||||
| |
(in thousands) |
||||||||||
Computed at the statutory rate |
$ | 9,300 | $ | 9,402 | $ | 8,520 | |||||
Change in taxes resulting from: |
|||||||||||
State income taxes, net of federal tax effect |
2,599 | 2,460 | 1,723 | ||||||||
Non-deductible compensation |
587 | 935 | — | ||||||||
Permanent differences |
178 | 238 | 668 | ||||||||
Foreign tax and change in foreign valuation allowance |
129 | 281 | (75 | ) | |||||||
Research and development credits |
(437 | ) | (846 | ) | (255 | ) | |||||
Other |
285 | (204 | ) | (74 | ) | ||||||
Provision for income taxes |
$ | 12,641 | $ | 12,266 | $ | 10,507 | |||||
The tax effects of temporary differences that give rise to significant portions of deferred tax assets and deferred tax liabilities on the accompanying Consolidated Balance Sheets are as follows:
| |
December 31, | ||||||||
|---|---|---|---|---|---|---|---|---|---|
| |
2010 | 2009 | |||||||
| |
(in thousands) |
||||||||
Deferred tax assets: |
|||||||||
Allowance for doubtful accounts |
$ | 1,305 | $ | 1,382 | |||||
Share-based compensation |
7,919 | 6,362 | |||||||
Contingent convertible subordinated notes |
— | 279 | |||||||
Intangible assets |
848 | 46 | |||||||
Deferred rent |
1,223 | 1,306 | |||||||
Accrued liabilities |
1,872 | 1,363 | |||||||
Foreign loss carryforwards |
176 | 113 | |||||||
State net operating loss carryforwards |
204 | 130 | |||||||
Valuation allowances |
(176 | ) | (113 | ) | |||||
Total deferred tax assets |
13,371 | 10,868 | |||||||
Deferred tax liabilities: |
|||||||||
Prepaid expenses |
(1,484 | ) | (1,385 | ) | |||||
Intangible assets |
(20,414 | ) | (20,285 | ) | |||||
Property and equipment and software development costs |
(12,518 | ) | (10,230 | ) | |||||
Other |
(162 | ) | (267 | ) | |||||
Total deferred tax liabilities |
(34,578 | ) | (32,167 | ) | |||||
Net deferred tax liability |
$ | (21,207 | ) | $ | (21,299 | ) | |||
F-24
EPIQ SYSTEMS, INC.
NOTES TO CONSOLIDATED FINANCIAL STATEMENTS (Continued)
DECEMBER 31, 2010, 2009 AND 2008
NOTE 10: INCOME TAXES (Continued)
In 2010, we applied for the Kansas High Performance Incentive Program ("HPIP") tax credit in conjunction with investments made in our Kansas facilities. During 2010, we accrued $0.2 million of HPIP credits that will be available to offset our 2011 and future Kansas income tax. The credit may be carried forward for a period of ten years provided we continue to meet the HPIP certification requirements.
As of December 31, 2010, we had as filed state and local operating loss carryforwards of $0.2 million. These carryforwards expire in varying amounts in years 2022 through 2030. Management believes that it is more likely than not that we will be able to utilize these carryforwards and, therefore, no valuation allowance is necessary.
During 2010 we recorded a $0.1 million valuation allowance relating to net operating losses generated by our Hong Kong operations. The cumulative $0.2 million valuation allowance offset a $0.2 million deferred tax asset associated with a $1.1 million net operating loss carryforward. The valuation allowance will be released when management believes it is more likely than not that based on the available positive and negative evidence the deferred tax asset will be realizable. Hong Kong net operating losses have an unlimited carryover period.
The net deferred tax liability is presented on the Consolidated Balance Sheets as follows:
| |
December 31, | ||||||
|---|---|---|---|---|---|---|---|
| |
2010 | 2009 | |||||
| |
(in thousands) |
||||||
Other current assets |
$ | 2,952 | $ | 962 | |||
Long-term deferred income tax liability |
(24,159 | ) | (22,261 | ) | |||
Net deferred tax liability |
$ | (21,207 | ) | $ | (21,299 | ) | |
U.S. income and foreign withholding taxes have not been recognized on the excess of earnings for financial reporting over the tax basis of investments in foreign subsidiaries that are essentially permanent in duration. Generally, such earnings become subject to U.S. taxation upon the remittance of dividends or a sale or liquidation of the foreign subsidiary. The amount of such excess totaled approximately $4.3 million at December 31, 2010. It is not practicable to estimate the amount of any deferred tax liability related to this amount.
As of December 31, 2010, 2009, and 2008, the gross amount of unrecognized tax benefits, including penalty and interest, was approximately $2.9 million, $7.8 million, and $6.3 million, respectively. If recognized, approximately $2.3 million, $6.6 million, and $5.7 million would have affected our effective tax rate in 2010, 2009, and 2008, respectively.
F-25
EPIQ SYSTEMS, INC.
NOTES TO CONSOLIDATED FINANCIAL STATEMENTS (Continued)
DECEMBER 31, 2010, 2009 AND 2008
NOTE 10: INCOME TAXES (Continued)
The following table summarizes the activity related to our gross unrecognized tax benefits excluding interest and penalties (in thousands):
| |
2010 | 2009 | 2008 | |||||||
|---|---|---|---|---|---|---|---|---|---|---|
Unrecognized Tax Benefits as of January 1 |
$ | 6,574 | $ | 5,197 | $ | 4,505 | ||||
Gross increases for prior year tax positions |
952 | 406 | 174 | |||||||
Gross decreases for prior year tax positions |
(836 | ) | (401 | ) | (381 | ) | ||||
Gross increase for current year tax positions |
368 | 2,384 | 1,639 | |||||||
Settlements |
(4,005 | ) | — | — | ||||||
Lapse of statute of limitations |
(798 | ) | (1,012 | ) | (740 | ) | ||||
Unrecognized Tax Benefits at December 31 |
$ | 2,255 | $ | 6,574 | $ | 5,197 | ||||
We file income tax returns in the U.S. federal jurisdiction, the United Kingdom, Hong Kong, Belgium, and various state jurisdictions. We have also made an evaluation of the potential impact of assessments by state jurisdictions in which we have not filed tax returns.
During 2010, we reached a final settlement with New York State relating to our 2003 - 2008 income tax returns. We also filed the 2009 New York State and 2003 - 2009 New York City tax returns reflecting the outcome of the state examination. We had previously accrued for these uncertain tax positions and, as a result, the resolution of these matters did not have a material effect on the provision for income taxes. The result of the settlement was comprised of approximately $4.0 million of gross unrecognized tax benefits and $0.9 million of accrued interest.
In November 2010, we also entered into a separate tentative settlement with New York State for investment tax credits and employer incentive credits relating to our New York operations for 2005 - 2008. As of December 31, 2010, the agreement was not finalized. We believe the agreement will be finalized in 2011 and it is reasonably possible that we will recognize $0.5 million of unrecognized tax benefits relating to this agreement within the next twelve months. If recognized, $0.3 million would affect our effective tax rate.
As of December 31, 2010, the 2007 - 2009 federal, state and foreign tax returns are subject to examination. In addition, the 2006 statute of limitations remains open in certain state and foreign jurisdictions, and the New York State statute is open only with respect to our 2005 outstanding investment tax credit refund claim. As of December 31, 2010, it is reasonably possible that approximately $0.8 million of unrecognized tax benefits will be recognized in the following twelve months due to the closing of 2006 and 2007 years for federal and state jurisdictions, and recognizing the previously discussed New York investment tax credit of which $0.6 million would affect our effective tax rate.
We have classified interest and penalties as a component of income tax expense. Estimated interest and penalties classified as a component of income tax expense during 2010, 2009 and 2008 totaled $0.4 million, $0.1 million and $0.1 million, respectively. Accrued interest and penalties, included as a component of "Other long-term liabilities" on the accompanying Consolidated Balance Sheets, totaled $0.4 million and $0.2 million, respectively, as of December 31, 2010. As of December 31, 2009, the accrued interest and penalties were $1.0 million and $0.2 million respectively.
F-26
EPIQ SYSTEMS, INC.
NOTES TO CONSOLIDATED FINANCIAL STATEMENTS (Continued)
DECEMBER 31, 2010, 2009 AND 2008
NOTE 11: NET INCOME PER SHARE
Basic net income per share is computed on the basis of weighted average outstanding common shares. Diluted net income per share is computed on the basis of basic weighted average outstanding common shares adjusted for the dilutive effect of stock options and convertible debt, if dilutive. The numerator of the diluted net income per share calculation is increased by the amount of interest expense, net of tax, related to outstanding convertible debt, and the allocation of net income to nonvested shares, if the net impact is dilutive.
Based upon new guidance effective January 1, 2009, we determined that the nonvested share awards (also referred to as restricted stock awards), which we began to issue in 2009 are participating securities because they have non-forfeitable rights to dividends. Accordingly, basic net income per share is calculated under the two-class method calculation. In determining the number of diluted shares outstanding, we are required to disclose the more dilutive earnings per share result between the treasury stock method calculation and the two-class method calculation. For the years ended December 31, 2010 and 2009, the two-class method calculation was more dilutive; therefore, the diluted net income per share information below is presented following the two-class method. There was no impact to our calculation for the year ended December 31, 2008, which was completed using the treasury stock method, as we did not have any participating securities outstanding during that period.
The computation of basic and diluted net income per share for the years ended December 31, 2010 and 2009 was as follows:
| |
Year ended December 31, 2010 | Year ended December 31, 2009 | ||||||||||||||||||
|---|---|---|---|---|---|---|---|---|---|---|---|---|---|---|---|---|---|---|---|---|
| |
Net Income (Numerator) |
Weighted Average Common Shares Outstanding (Denominator) |
Per Share Amount |
Net Income (Numerator) |
Weighted Average Common Shares Outstanding (Denominator) |
Per Share Amount |
||||||||||||||
| |
(in thousands, except per share data) |
|||||||||||||||||||
Net income |
$ | 13,929 | $ | 14,595 | ||||||||||||||||
Less: amounts allocated to nonvested shares(1) |
(87 | ) | (57 | ) | ||||||||||||||||
Basic net income available to common stockholders |
13,842 | 36,498 | $ | 0.38 | 14,538 | 35,895 | $ | 0.41 | ||||||||||||
Effect of dilutive securities: |
||||||||||||||||||||
Stock options |
— | 1,092 | — | 1,729 | ||||||||||||||||
Convertible debt |
537 | 1,922 | 1,209 | 4,284 | ||||||||||||||||
Add-back: amounts allocated to nonvested shares(1) |
87 | — | 57 | — | ||||||||||||||||
Less: amounts re-allocated to nonvested shares |
(86 | ) | — | (56 | ) | — | ||||||||||||||
Diluted net income available to common stockholders |
$ | 14,380 | 39,512 | $ | 0.36 | $ | 15,748 | 41,908 | $ | 0.38 | ||||||||||
- (1)
- Amounts allocated to holders of nonvested shares are calculated based upon a weighted average percentage of nonvested shares that are participating securities in relation to total shares outstanding.
F-27
EPIQ SYSTEMS, INC.
NOTES TO CONSOLIDATED FINANCIAL STATEMENTS (Continued)
DECEMBER 31, 2010, 2009 AND 2008
NOTE 11: NET INCOME PER SHARE (Continued)
The computation of basic and diluted net income per share for the year ended December 31, 2008 is as follows:
| |
Year ended December 31, 2008 | ||||||||||
|---|---|---|---|---|---|---|---|---|---|---|---|
| |
Net Income | Weighted Average Common Shares Outstanding |
Per Share Amount |
||||||||
| |
(in thousands, except per share data) |
||||||||||
Basic net income available to common stockholders |
$ | 13,836 | 35,459 | $ | 0.39 | ||||||
Effect of dilutive securities: |
|||||||||||
Stock options |
— | 1,680 | |||||||||
Convertible debt |
1,212 | 4,286 | |||||||||
Diluted net income available to common stockholders |
$ | 15,048 | 41,425 | $ | 0.36 | ||||||
For the years ended December 31, 2010, 2009 and 2008 weighted-average outstanding stock options totaling approximately 3.1 million, 2.4 million and 1.9 million shares of common stock, respectively, were antidilutive and, therefore not included in the computation of diluted net income per share.
NOTE 12: SHARE-BASED COMPENSATION
Share-based compensation is measured at grant date, based on the fair value of the award, and is recognized on a straight-line basis over the requisite service period. See Note 1 for additional information.
The following table presents total share-based compensation expense, which is a non-cash charge, included in the Consolidated Statements of Income:
| |
Year Ended December 31, | |||||||||
|---|---|---|---|---|---|---|---|---|---|---|
| |
2010 | 2009 | 2008 | |||||||
| |
(in thousands) |
|||||||||
Direct cost of services |
$ | 222 | $ | 427 | $ | 814 | ||||
General and administrative |
6,505 | 8,116 | 2,017 | |||||||
Pre-tax share-based compensation expense |
6,727 | 8,543 | 2,831 | |||||||
Income tax benefit |
(2,112 | ) | (2,375 | ) | (1,050 | ) | ||||
Total share-based compensation expense, net of tax |
$ | 4,615 | $ | 6,168 | $ | 1,781 | ||||
Share-based compensation expense was adjusted for stock options and awards that we estimate will be forfeited prior to vesting. We use historical information to estimate employee termination and the resulting forfeiture rate. As of December 31, 2010, there was $5.1 million of total unrecognized compensation cost related to nonvested share-based compensation arrangements, which will be recognized over a weighted-average period of 2.5 years. The increase in share-based compensation
F-28
EPIQ SYSTEMS, INC.
NOTES TO CONSOLIDATED FINANCIAL STATEMENTS (Continued)
DECEMBER 31, 2010, 2009 AND 2008
NOTE 12: SHARE-BASED COMPENSATION (Continued)
expense in 2009 was the result of the timing of grants. There were no share-based awards granted to executive management in fiscal year 2008.
The 2004 Equity Incentive Plan, as amended (the "2004 Plan") limits the combined grant of options to acquire shares of common stock, stock appreciation rights, and nonvested share (commonly referred to as restricted stock) awards stock to 7,500,000 shares. Any grant under the 2004 Plan that expires or terminates unexercised, becomes unexercisable or is forfeited will generally be available for further grants. At December 31, 2010, there were approximately 900,000 shares of common stock available for future equity-related grants under the 2004 Plan.
As part of certain acquisitions and as an inducement to key employees, stock options are issued outside of the 2004 Plan from time to time. These options are granted at an option exercise price equal to fair market value of the common stock on the date of grant, are non-qualified options, are exercisable for up to 10 years from the date of grant, and generally vest 25% on the second anniversary of the grant date and continue to vest 25% per year on each anniversary of the grant date until fully vested.
Although various forms of equity instruments may be issued, through December 31, 2010 we have only issued incentive stock options, nonqualified stock options, and nonvested share awards under the 2004 Plan.
Stock Options
Stock options are awards which allow the employee or director to purchase shares of our common stock at prices equal to the fair value at the date of grant. Stock options are issued with an exercise price equal to the grant date closing market price of our common stock. Stock options become exercisable under various vesting schedules, ranging from immediate vesting to a 7 year vesting period, and expire 10 years from the date of grant.
The estimated fair value of stock options is determined using the Black-Scholes valuation model. Key inputs and assumptions to estimate the fair value of stock options include the grant price of the award, the expected option term, the volatility of the company's stock, the risk-free interest rate, and the company's dividend yield. We estimate our expected volatility based on implied volatilities from traded options on our stock and on our stock's historical volatility. Estimates of fair value are not intended to predict actual future events or the value ultimately realized by individuals who receive equity awards, and subsequent events are not indicative of the reasonableness of the original estimates of fair value made by the company.
F-29
EPIQ SYSTEMS, INC.
NOTES TO CONSOLIDATED FINANCIAL STATEMENTS (Continued)
DECEMBER 31, 2010, 2009 AND 2008
NOTE 12: SHARE-BASED COMPENSATION (Continued)
The fair value of each stock option grant was estimated at the date of grant using a Black-Scholes option pricing model. The following table presents the weighted-average assumptions used and the weighted-average fair value per option granted.
| |
Year Ended December 31, | |||||||||
|---|---|---|---|---|---|---|---|---|---|---|
| |
2010 | 2009 | 2008 | |||||||
Expected life of stock option (years) |
6.5 | 6.4 | 5.0 | |||||||
Expected volatility |
37 | % | 41 | % | 41 | % | ||||
Risk-free interest rate |
2.7 | % | 3.0 | % | 2.7 | % | ||||
Dividend yield |
0.63 | % | 0 | % | 0 | % | ||||
Weighted average grant-date fair value |
$ | 4.68 | $ | 6.84 | $ | 5.82 | ||||
We have estimated the expected term of our stock options based on the historical exercise pattern of groups of employees that have similar historical exercise behavior. The expected volatility is estimated based upon implied volatilities from traded stock options on our stock and on our stock's historical volatility, based on daily stock prices. The expected risk-free interest rate is based on the U.S. Treasury yield curve in effect at the time of the grant.
A summary of option activity during the year ended December 31, 2010 is presented below (shares and aggregate intrinsic value in thousands):
| |
Shares | Weighted Average Exercise Price |
Weighted Average Contractual Term |
Aggregate Intrinsic Value |
|||||||||
|---|---|---|---|---|---|---|---|---|---|---|---|---|---|
Outstanding, beginning of period |
7,756 | $ | 11.79 | ||||||||||
Granted |
102 | 11.81 | |||||||||||
Exercised |
(351 | ) | 6.42 | ||||||||||
Forfeited |
(232 | ) | 14.61 | ||||||||||
Expired |
(154 | ) | 13.86 | ||||||||||
Outstanding, end of period |
7,121 | $ | 11.92 | 4.84 | $ | 16,762 | |||||||
Options vested and expected to vest, end of period |
7,017 | $ | 11.88 | 4.80 | $ | 16,714 | |||||||
Options exercisable, end of period |
6,063 | $ | 11.43 | 4.42 | $ | 16,293 | |||||||
The aggregate intrinsic value was calculated using the difference between the December 31, 2010 market price and the grant price for only those awards that have a grant price that is less than the December 31, 2010 market price.
F-30
EPIQ SYSTEMS, INC.
NOTES TO CONSOLIDATED FINANCIAL STATEMENTS (Continued)
DECEMBER 31, 2010, 2009 AND 2008
NOTE 12: SHARE-BASED COMPENSATION (Continued)
The following table summarizes information about stock options outstanding as of December 31, 2010 (in thousands, except contractual life and price data):
| |
Options Outstanding | |
|
|||||||||||||
|---|---|---|---|---|---|---|---|---|---|---|---|---|---|---|---|---|
| |
Options Exercisable | |||||||||||||||
| |
|
Weighted- Average Remaining Contractual Life (in years) |
|
|||||||||||||
Range of Exercise Prices |
Number Outstanding |
Weighted- Average Exercise Price |
Number Exercisable |
Weighted- Average Exercise Price |
||||||||||||
$7.66 to $10.05 |
1,808 | 3.44 | $ | 8.84 | 1,808 | $ | 8.84 | |||||||||
$10.06 to $11.00 |
1,959 | 3.85 | 10.65 | 1,927 | 10.65 | |||||||||||
$11.01 to $14.27 |
1,970 | 5.64 | 12.92 | 1,560 | 12.87 | |||||||||||
$14.28 to $18.15 |
1,384 | 6.94 | 16.33 | 768 | 16.58 | |||||||||||
|
7,121 | 4.84 | 11.92 | 6,063 | 11.43 | |||||||||||
Exercises of Stock Options
The total intrinsic value of stock options exercised during the years ended December 31, 2010, 2009 and 2008 was $2.2 million, $2.7 million and $3.2 million, respectively. During the years ended December 31, 2010, 2009 and 2008 we received cash for payment of the grant price of exercised stock options of approximately $1.5 million, $2.9 million and $2.5 million, respectively, and we anticipate we will realize a tax benefit related to these exercised stock options of approximately $3.8 million, $2.7 million and $0.4 million, respectively. The cash received for payment of the grant price is included as a component of cash flows from financing activities. The tax benefit related to the option exercise price in excess of the option fair value at grant date is separately disclosed as a component of cash flows from financing activities on the consolidated statement of cash flows, and the remainder of the tax benefit is included as a component of cash flows from operating activities.
We settle stock option exercises and nonvested share awards with newly issued common shares or treasury stock.
Nonvested Share Awards
Nonvested share awards entitle the holder to shares of common stock as the award vests. In 2010 we granted 430,000 nonvested share awards at a weighted-average grant date price of $11.67 per share; 230,000 of these awards vested six months after the date of grant, and 200,000 of these awards vest 12 months after the date of grant upon achievement of a performance condition for the calendar year ending December 31, 2010. As of December 31, 2010 the performance condition had been met.
In 2009 we issued 285,000 nonvested share awards at a weighted-average grant date fair value of $14.49 per share, and with a six-month vesting period. The 285,000 awards vested in full in the third quarter of 2009 and the total fair value was $4.1 million. We measure the fair value of nonvested share awards based upon the market price of the underlying common stock as of the date of grant, and amortize the expense over the vesting period using a straight-line method. As of December 31, 2009 there were no nonvested share awards outstanding.
F-31
EPIQ SYSTEMS, INC.
NOTES TO CONSOLIDATED FINANCIAL STATEMENTS (Continued)
DECEMBER 31, 2010, 2009 AND 2008
NOTE 13: ACQUISITIONS
Jupiter eSources LLC
On October 1, 2010, we completed the acquisition of Jupiter eSources LLC, which includes the proprietary software product, AACER® (Automated Access to Court Electronic Records), that assists creditors including banks, mortgage processors, and their administrative services professionals to streamline processing of their portfolios of loans in bankruptcy cases. The AACER® product electronically monitors developments in all U.S. bankruptcy courts and applies sophisticated algorithms to classify docket filings automatically in each case to facilitate the management of large bankruptcy claims operations. By implementing the AACER® solution, clients achieve greater accuracy in faster timeframes, with a significant cost savings compared to manual attorney review of each case in the portfolio.
The purchase price of Jupiter was comprised of the following:
| |
(in thousands) | ||||
|---|---|---|---|---|---|
Cash paid at closing |
$ | 51,600 | |||
Fair value of holdback |
8,090 | ||||
Working capital adjustment |
539 | ||||
Fair value of contingent consideration |
7,166 | ||||
Total preliminary purchase price |
$ | 67,395 | |||
In connection with this acquisition, we withheld a portion of the purchase price for any claims for indemnification and purchase price adjustments. This holdback has been discounted using an appropriate imputed interest rate and $8.1 million is recorded in "Long-term obligations" on the Consolidated Balance Sheet at December 31, 2010.
As a result of an earn-out opportunity based on future revenue growth that is part of this acquisition, we also have contingent consideration. The potential undiscounted amount of all future payments that we could be required to make under the earn-out opportunity is between $0 and $20 million over a four year period. We have recognized the $7.2 million fair value of the contingent consideration in "Long-term obligations" on the Consolidated Balance Sheet at December 31, 2010. The fair value of the contingent consideration was determined by a present value calculation of the potential payouts based on projected revenue. Subsequent changes in fair value, which are measured quarterly, up to the ultimate amount paid, will be recognized in earnings.
The transaction was funded from our credit facility. Transaction related costs, which were expensed during the period in which they were incurred, are reflected in "Other operating expense" in the Consolidated Statements of Income, and totaled $2.6 million for the year ended December 31, 2010 for this acquisition.
Total purchase consideration has been allocated to the tangible and identifiable intangible assets and to liabilities assumed based on their respective fair values on the acquisition date. The measurement period for purchase price allocations ends as soon as information on the facts and circumstances becomes available, but does not exceed 12 months. If new information is obtained about facts and circumstances that existed as of the acquisitions date that, if known, would have affected the measurement of the amounts recognized for assets acquired and liabilities assumed, we will
F-32
EPIQ SYSTEMS, INC.
NOTES TO CONSOLIDATED FINANCIAL STATEMENTS (Continued)
DECEMBER 31, 2010, 2009 AND 2008
NOTE 13: ACQUISITIONS (Continued)
retrospectively adjust the amounts recognized as of the acquisition date. The preliminary purchase price allocations are summarized in the following table:
| |
(in thousands) | ||||
|---|---|---|---|---|---|
Tangible assets and liabilities |
|||||
Current assets, including cash acquired |
$ | 1,733 | |||
Non-current assets |
37 | ||||
Current liabilities |
(1,191 | ) | |||
Intangible assets |
33,258 | ||||
Software |
2,880 | ||||
Goodwill |
30,678 | ||||
Net assets acquired |
$ | 67,395 | |||
Based on the preliminary results of an independent valuation, we have allocated approximately $33.3 million of the purchase price to acquired intangible assets, and $2.9 million of the purchase price to software. The following table summarizes the major classes of acquired intangible assets and software, as well as the respective weighted-average amortization periods:
Identifiable Intangible Assets
|
Amount (in thousands) |
Weighted Average Amortization Period (Years) |
||||||
|---|---|---|---|---|---|---|---|---|
Trade name |
$ | 6,434 | Indefinite | |||||
Non-compete agreements |
2,955 | 5.0 | ||||||
Customer relationships |
23,869 | 5.0 | ||||||
Total identifiable intangible assets |
$ | 33,258 | ||||||
Software
|
Amount (in thousands) |
Weighted Average Amortization Period (Years) |
|||||
|---|---|---|---|---|---|---|---|
AACER® software application |
$ | 2,880 | 5.0 | ||||
The excess of purchase consideration over net assets assumed was recorded as goodwill, which represents the strategic value we placed on the AACER® product. We have allocated goodwill of $30.7 million related to this acquisition to our bankruptcy segment, which is deductible for tax purposes. The consolidated financial statements include the operating results of Jupiter from the date of acquisition.
Pro forma information related to this acquisition is not presented because the impact of the acquisition on our consolidated results of operations was not considered to be significant.
F-33
EPIQ SYSTEMS, INC.
NOTES TO CONSOLIDATED FINANCIAL STATEMENTS (Continued)
DECEMBER 31, 2010, 2009 AND 2008
NOTE 13: ACQUISITIONS (Continued)
Pinpoint Global Limited
On April 4, 2008, our wholly-owned subsidiary, Epiq Systems Holding B.V., acquired all of the equity of Uberdevelopments Limited and its wholly-owned operating subsidiary, Pinpoint Global Limited (collectively, "Pinpoint"), an eDiscovery business with operations in the United Kingdom. The value of the transaction was $7.1 million, consisting of $4.9 million of cash, $1.7 million of deferred payments and $0.5 million of capitalized transaction costs. Certain revenue targets were satisfied as of September 30, 2008, and as of the second anniversary of the date of the agreement, which required additional payments of $0.6 million in the fourth quarter of 2008, and $1.2 million in the second quarter of 2010. These additional payments were recorded as purchase price adjustments. If certain other revenue targets are satisfied prior to the third anniversary date of the agreement, we are required to make an additional payment. We have determined that it is probable that these targets will be satisfied and have began accruing a liability for a total payment of approximately £200,000 (as of December 31, 2010 approximately $0.3 million, including interest). This amount is recorded as compensation expense over the contingency period.
The allocation of the purchase price was as follows: $0.3 million to net assets, $1.1 million to customer contracts, $1.1 million to non-compete agreements, $0.7 million to establish a deferred tax liability related to the acquired intangible assets, and $5.3 million to goodwill. The purchase price in excess of the value of the acquired identifiable net assets reflects the strategic value we placed on Pinpoint as this acquisition facilitated the expansion of our eDiscovery business in the United Kingdom.
The acquisition was accounted for using the purchase method of accounting with the operating results included in the accompanying Consolidated Financial Statements from the date of acquisition. The operating results of the acquired entities are included within our eDiscovery segment. The pro forma results of the acquired entity for the period from January 1, 2008 through the date of acquisition were not material to our consolidated results of operations.
NOTE 14: SEGMENT REPORTING
We have three reporting segments: eDiscovery, bankruptcy, and settlement administration. Our eDiscovery business provides collections and forensics, processing, search and review, and document review services to companies and the litigation departments of law firms. Produced documents are made available primarily through a hosted environment, and our DocuMatrix™ software allows for efficient attorney review and data requests. Our bankruptcy business provides solutions and software that address the needs of trustees to administer bankruptcy proceedings, of debtor corporations that file a plan of reorganization, and assists creditors including banks, mortgage processors, and their administrative services professionals to streamline the processing of their portfolios of loans in bankruptcy cases. Our settlement administration segment provides managed services including legal notification, claims administration, project administration and controlled disbursement.
The segment performance measure is based on earnings before interest, taxes, depreciation and amortization, other operating expense, and share-based compensation expense. In management's evaluation of performance, certain costs, such as compensation for administrative staff and executive management, are not allocated by segment and, accordingly, the following reporting segment results do not include such unallocated costs.
F-34
EPIQ SYSTEMS, INC.
NOTES TO CONSOLIDATED FINANCIAL STATEMENTS (Continued)
DECEMBER 31, 2010, 2009 AND 2008
NOTE 14: SEGMENT REPORTING (Continued)
Assets reported within a segment are those assets that can be identified to a segment and primarily consist of trade receivables, property, equipment and leasehold improvements, software, identifiable intangible assets and goodwill. Cash, tax-related assets, and certain prepaid assets and other assets are not allocated to our segments. Although we can and do identify long-lived assets such as property, equipment and leasehold improvements, software, and identifiable intangible assets to reporting segments, we do not allocate the related depreciation and amortization to the segment as management evaluates segment performance exclusive of these non-cash charges.
Following is a summary of segment information for the year ended December 31, 2010. The intersegment revenues during 2010 related primarily to call center and printing services performed by the settlement administration segment for the bankruptcy segment.
| |
Year Ended December 31, 2010 | ||||||||||||||||
|---|---|---|---|---|---|---|---|---|---|---|---|---|---|---|---|---|---|
| |
eDiscovery | Bankruptcy | Settlement Administration |
Eliminations | Total | ||||||||||||
| |
(in thousands) |
||||||||||||||||
Revenue: |
|||||||||||||||||
Operating revenue before reimbursed direct costs |
$ | 81,130 | $ | 97,219 | $ | 39,246 | $ | — | $ | 217,595 | |||||||
Intersegment revenue |
49 | 1 | 3,092 | (3,142 | ) | — | |||||||||||
Operating revenue before reimbursed direct costs |
81,179 | 97,220 | 42,338 | (3,142 | ) | 217,595 | |||||||||||
Operating revenue from reimbursed direct costs |
363 | 8,450 | 20,758 | — | 29,571 | ||||||||||||
Total revenue |
81,542 | 105,670 | 63,096 | (3,142 | ) | 247,166 | |||||||||||
Direct costs, general and administrative costs |
45,973 | 53,147 | 55,105 | (3,142 | ) | 151,083 | |||||||||||
Segment performance measure |
$ | 35,569 | $ | 52,523 | $ | 7,991 | $ | — | $ | 96,083 | |||||||
F-35
EPIQ SYSTEMS, INC.
NOTES TO CONSOLIDATED FINANCIAL STATEMENTS (Continued)
DECEMBER 31, 2010, 2009 AND 2008
NOTE 14: SEGMENT REPORTING (Continued)
Following is a summary of segment information for the year ended December 31, 2009. The intersegment revenues during 2009 related primarily to call center services performed by the settlement administration segment for the bankruptcy segment.
| |
Year Ended December 31, 2009 | ||||||||||||||||
|---|---|---|---|---|---|---|---|---|---|---|---|---|---|---|---|---|---|
| |
eDiscovery | Bankruptcy | Settlement Administration |
Eliminations | Total | ||||||||||||
| |
(in thousands) |
||||||||||||||||
Revenue: |
|||||||||||||||||
Operating revenue before reimbursed direct costs |
$ | 55,806 | $ | 91,002 | $ | 61,721 | $ | — | $ | 208,529 | |||||||
Intersegment revenue |
1 | 1 | 1,889 | (1,891 | ) | — | |||||||||||
Operating revenue before reimbursed direct costs |
55,807 | 91,003 | 63,610 | (1,891 | ) | 208,529 | |||||||||||
Operating revenue from reimbursed direct costs |
382 | 10,635 | 19,525 | — | 30,542 | ||||||||||||
Total revenue |
56,189 | 101,638 | 83,135 | (1,891 | ) | 239,071 | |||||||||||
Direct costs, general and administrative costs |
37,674 | 54,191 | 65,248 | (1,891 | ) | 155,222 | |||||||||||
Segment performance measure |
$ | 18,515 | $ | 47,447 | $ | 17,887 | $ | — | $ | 83,849 | |||||||
Following is a summary of segment information for the year ended December 31, 2008. Intersegment revenues for this period were not considered material to the segment reporting information.
| |
Year Ended December 31, 2008 | |||||||||||||
|---|---|---|---|---|---|---|---|---|---|---|---|---|---|---|
| |
eDiscovery | Bankruptcy | Settlement Administration |
Total | ||||||||||
| |
(in thousands) |
|||||||||||||
Revenue: |
||||||||||||||
Operating revenue before reimbursed direct costs |
$ | 58,128 | $ | 59,828 | $ | 89,900 | $ | 207,856 | ||||||
Operating revenue from reimbursed direct costs |
182 | 4,936 | 23,144 | 28,262 | ||||||||||
Total revenue |
58,310 | 64,764 | 113,044 | 236,118 | ||||||||||
Direct costs, general and administrative costs |
31,987 | 34,144 | 93,192 | 159,323 | ||||||||||
Segment performance measure |
$ | 26,323 | $ | 30,620 | $ | 19,852 | $ | 76,795 | ||||||
F-36
EPIQ SYSTEMS, INC.
NOTES TO CONSOLIDATED FINANCIAL STATEMENTS (Continued)
DECEMBER 31, 2010, 2009 AND 2008
NOTE 14: SEGMENT REPORTING (Continued)
Following is a reconciliation of our segment performance measure to income before income taxes:
| |
Year Ended December 31, | |||||||||
|---|---|---|---|---|---|---|---|---|---|---|
| |
2010 | 2009 | 2008 | |||||||
| |
(in thousands) |
|||||||||
Segment performance measure |
$ | 96,083 | $ | 83,849 | $ | 76,795 | ||||
Corporate and unallocated expenses |
(28,525 | ) | (20,277 | ) | (22,619 | ) | ||||
Share-based compensation expense |
(6,727 | ) | (8,543 | ) | (2,831 | ) | ||||
Depreciation and software and leasehold amortization |
(20,391 | ) | (18,775 | ) | (16,302 | ) | ||||
Amortization of identifiable intangible assets |
(9,190 | ) | (7,409 | ) | (9,051 | ) | ||||
Other operating expense |
(2,781 | ) | (634 | ) | (171 | ) | ||||
Interest expense, net |
(1,899 | ) | (1,350 | ) | (1,478 | ) | ||||
Income before income taxes |
$ | 26,570 | $ | 26,861 | $ | 24,343 | ||||
Following are total assets by segment:
| |
December 31, 2010 |
December 31, 2009 |
|||||||
|---|---|---|---|---|---|---|---|---|---|
| |
(in thousands) |
||||||||
Assets |
|||||||||
eDiscovery |
$ | 145,246 | $ | 133,515 | |||||
Bankruptcy |
260,458 | 187,484 | |||||||
Settlement Administration |
53,830 | 54,213 | |||||||
Corporate and unallocated |
18,684 | 62,729 | |||||||
Total consolidated assets |
$ | 478,218 | $ | 437,941 | |||||
Following are capital expenditures (including software development costs) by segment:
| |
Year Ended December 31, | |||||||||||
|---|---|---|---|---|---|---|---|---|---|---|---|---|
| |
2010 | 2009 | 2008 | |||||||||
| |
(in thousands) |
|||||||||||
Capital Expenditures |
||||||||||||
eDiscovery |
$ | 7,418 | $ | 8,688 | $ | 14,687 | ||||||
Bankruptcy |
8,047 | 7,009 | 4,820 | |||||||||
Settlement Administration |
1,023 | 5,759 | 2,067 | |||||||||
Corporate and unallocated |
6,600 | 1,753 | 2,567 | |||||||||
Total consolidated capital expenditures |
$ | 23,088 | $ | 23,209 | $ | 24,141 | ||||||
F-37
EPIQ SYSTEMS, INC.
NOTES TO CONSOLIDATED FINANCIAL STATEMENTS (Continued)
DECEMBER 31, 2010, 2009 AND 2008
NOTE 14: SEGMENT REPORTING (Continued)
Following is revenue, determined by the location providing the services, by geographical area:
| |
Year Ended December 31, | |||||||||||
|---|---|---|---|---|---|---|---|---|---|---|---|---|
| |
2010 | 2009 | 2008 | |||||||||
| |
(in thousands) |
|||||||||||
Revenue |
||||||||||||
United States |
$ | 229,072 | $ | 228,961 | $ | 225,950 | ||||||
Other countries |
18,094 | 10,110 | 10,168 | |||||||||
Total |
$ | 247,166 | $ | 239,071 | $ | 236,118 | ||||||
Following are long-lived assets by geographical area:
| |
December 31, 2010 |
December 31, 2009 |
|||||||
|---|---|---|---|---|---|---|---|---|---|
| |
(in thousands) |
||||||||
Long-lived assets |
|||||||||
United States |
$ | 57,331 | $ | 50,324 | |||||
Other countries |
3,586 | 3,413 | |||||||
Total |
$ | 60,917 | $ | 53,737 | |||||
NOTE 15: DERIVATIVE FINANCIAL INSTRUMENTS
Interest Rate Floors
A portion of our bankruptcy trustee revenue is subject to variability based on fluctuations in short-term interest rates. During 2007, in order to limit our economic exposure to market fluctuations in interest rates, we purchased one-month LIBOR based interest rate floor options with a total notional amount of $800 million and initial contractual maturity of three years. We accounted for this transaction by recording this derivative instrument on our balance sheet at fair value. As the interest rate floor options were not designated as an accounting hedge, changes in the fair values of the derivatives were recorded each period in current earnings. During February 2008, we sold the interest rate floor options and realized a $3.5 million gain. The $2.4 million difference between the realized gain of $3.5 million and a previously unrealized gain of $1.1 million was included as a component of "Other operating expense" for the year ended December 31, 2008 on the accompanying Consolidated Statements of Income. As of December 31, 2010 and 2009 we did not hold any interest rate floor options, other derivatives, or auction rate securities.
Contingently Convertible Subordinated Notes
The holders of our convertible notes had the right to extend the maturity of these notes for a period not to exceed three years. The right to extend the maturity of the notes represented an embedded option. The embedded option, which is a derivative financial instrument, was adjusted to estimated fair value at the end of each period, with a final adjustment to an estimated fair value of approximately $4.8 million immediately prior to the April 2007 exercise of the embedded option to extend. This final fair value estimate was amortized as a credit to interest expense over the period to
F-38
EPIQ SYSTEMS, INC.
NOTES TO CONSOLIDATED FINANCIAL STATEMENTS (Continued)
DECEMBER 31, 2010, 2009 AND 2008
NOTE 15: DERIVATIVE FINANCIAL INSTRUMENTS (Continued)
the extended maturity, which was June 15, 2010. For any convertible notes that were converted into shares of our common stock prior to the scheduled extended maturity, the unamortized embedded option value related to those shares was recognized as a gain in the period the conversion occurred. The estimated fair value and the amortized carrying value of our obligation related to the embedded option was included as a component of "Current maturities of long-term obligations" on the Consolidated Balance Sheet at December 31, 2009. At December 31, 2010 this obligation was zero and the embedded option was fully amortized. Changes in the fair value of the embedded option through the final fair value measurement date in April 2007 and the subsequent amortization of the embedded option fair value, through maturity, were recorded each period as a component of interest expense on the accompanying Consolidated Statements of Income.
NOTE 16: SUPPLEMENTAL CASH FLOW INFORMATION
Supplemental cash flow information is as follows:
| |
Year Ended December 31, | ||||||||||
|---|---|---|---|---|---|---|---|---|---|---|---|
| |
2010 | 2009 | 2008 | ||||||||
| |
(in thousands) |
||||||||||
Cash paid for: |
|||||||||||
Interest |
$ | 2,594 | $ | 2,717 | $ | 2,876 | |||||
Income taxes paid, net |
19,898 | 7,958 | 9,335 | ||||||||
Non-cash investing and financing transactions: |
|||||||||||
Capitalized lease obligations incurred |
3,827 | 5,072 | 3,709 | ||||||||
Property, equipment, and leasehold improvements accrued in accounts payable and other long-term liabilities |
2,309 | 490 | 2,018 | ||||||||
Obligation incurred in purchase transaction |
15,256 | — | 810 | ||||||||
Conversion of convertible notes to common stock |
27,168 | 32 | — | ||||||||
NOTE 17: LEGAL PROCEEDINGS
Purported Derivative Shareholder Complaint
On July 29, 2008, the Alaska Electrical Pension Fund filed a putative shareholder derivative action on behalf of Epiq Systems, Inc. in the U.S. District Court for the District of Kansas (the "Court") (Civil Action No. 08-CV-2344 CM/JPO), alleging, among other things, improper conduct by each of our current directors and certain current and former executive officers and directors regarding stock option grants. The company has stated consistently that the claims made in the action are meritless.
Also as previously reported, on April 27, 2010, on the determination of the company's Board of Directors, the company entered into a Stipulation of Settlement (the "Settlement Agreement") with plaintiff and defendants relating to the settlement of this litigation and mutual release of claims, and the company and its insurance carrier agreed to pay plaintiff's counsel's fees and expenses, which totaled $3.5 million. On June 22, 2010, the Court entered an order which, among other things, preliminarily approved the Settlement Agreement and scheduled a final hearing. On August 25, 2010, the Court entered a final order, dated August 24, 2010, approving the Settlement Agreement and
F-39
EPIQ SYSTEMS, INC.
NOTES TO CONSOLIDATED FINANCIAL STATEMENTS (Continued)
DECEMBER 31, 2010, 2009 AND 2008
NOTE 17: LEGAL PROCEEDINGS (Continued)
dismissing with prejudice the lawsuit and all claims contained therein (the "Final Order"). During the third quarter of 2010 the settlement amount, which had been fully accrued for in prior periods, was paid by the company and the insurance company. On or about September 24, 2010, the Final Order became final and non-appealable because no appeal was filed prior to such date.
NOTE 18: SUBSEQUENT EVENTS
From January 1, 2011 through February 24, 2011 we have purchased 0.7 million shares of common stock for $10.0 million, at a weighted average cost of approximately $13.37 per share, under our share repurchase program.
On February 23, 2011, our board of directors declared a cash dividend of $0.035 per share, payable on May 19, 2011 to shareholders of record at the close of business on April 28, 2011.
F-40
EPIQ SYSTEMS, INC.
SCHEDULE II
VALUATION AND QUALIFYING ACCOUNTS
(in thousands)
| |
|
Additions | |
|
||||||||||||
|---|---|---|---|---|---|---|---|---|---|---|---|---|---|---|---|---|
Description
|
Balance at beginning of year |
Charged to costs and expenses |
Charged to other accounts |
Deductions from reserves |
Balance at end of year |
|||||||||||
Allowance for doubtful receivables |
||||||||||||||||
For the year ended December 31, 2010 |
$ |
2,928 |
$ |
2,146 |
$ |
— |
$ |
(1,296 |
) |
$ |
3,778 |
|||||
For the year ended December 31, 2009 |
$ |
2,600 |
$ |
1,732 |
$ |
8 |
$ |
(1,412 |
) |
$ |
2,928 |
|||||
For the year ended December 31, 2008 |
$ |
1,437 |
$ |
1,678 |
$ |
103 |
$ |
(618 |
) |
$ |
2,600 |
|||||
| |
|
Additions | |
|
||||||||||||
|---|---|---|---|---|---|---|---|---|---|---|---|---|---|---|---|---|
Description
|
Balance at beginning of year |
Charged to costs and expenses |
Charged to other accounts |
Deductions from reserves |
Balance at end of year |
|||||||||||
Deferred tax valuation allowance |
||||||||||||||||
For the year ended December 31, 2010 |
$ |
113 |
$ |
63 |
$ |
— |
$ |
— |
$ |
176 |
||||||
For the year ended December 31, 2009 |
$ |
63 |
$ |
113 |
$ |
— |
$ |
(63 |
) |
$ |
113 |
|||||
For the year ended December 31, 2008 |
$ |
— |
$ |
63 |
$ |
— |
$ |
— |
$ |
63 |
||||||
The following exhibits are filed with this Form 10-K or are incorporated herein by reference:
| Exhibit Number |
Description | ||
|---|---|---|---|
| 3.1 | Articles of Incorporation, as amended through February 28, 2008. Incorporated by reference and previously filed as an exhibit to the registrant's (File No. 000-22081) (the "Registrant") annual report on Form 10-K for the year ended December 31, 2007, filed with the Securities and Exchange Commission on March 4, 2008. | ||
3.2 |
Bylaws, as amended and restated through June 2, 2010. Incorporated by reference and previously filed as an exhibit to the Registrant's current report on Form 8-K filed with the Securities and Exchange Commission on June 4, 2010. |
||
4.1 |
Reference is made to exhibits 3.1 and 3.2. |
||
4.2 |
Securities Purchase Agreement dated as of June 10, 2004, among Epiq Systems, Inc. and the Buyers listed on Exhibit A thereto. Incorporated by reference and previously filed as an exhibit to the Registrant's current report on Form 8-K filed with the Securities and Exchange Commission on June 14, 2004. |
||
4.3 |
Amendment No. 1 to Securities Purchase Agreement among Epiq Systems, Inc. and the Holders, dated as of December 15, 2005. Incorporated by reference and previously filed as an exhibit to the Registrant's current report on Form 8-K filed with the Securities and Exchange Commission on December 21, 2005. |
||
10.1 |
1995 Stock Option Plan, as amended. Incorporated by reference and previously filed as an exhibit to the Registrant's current report on Form 8-K filed with the Securities and Exchange Commission on June 4, 2010. |
||
10.2 |
2004 Equity Incentive Plan, as amended. Incorporated by reference and previously filed as an exhibit to the Registrant's current report on Form 8-K filed with the Securities and Exchange Commission on June 4, 2010. |
||
10.3 |
Third Amended and Restated Credit and Security Agreement dated as of June 9, 2010, among Epiq Systems, Inc. and the domestic subsidiary borrowers named therein, KeyBank National Association, as Lead Arranger, Sole Book Runner and Administrative Agent, Silicon Valley Bank as Syndication Agent, Compass Bank and PNC Bank National Association as Co-Documentation Agents, and the lenders named therein. Incorporated by reference and previously filed as an exhibit to the Registrant's current report on Form 8-K, filed with the Securities and Exchange Commission on June 15, 2010. |
||
10.4 |
Form of Nonqualified Stock Option Agreement under 2004 Equity Incentive Plan. Incorporated by reference and previously filed as an exhibit to the Registrant's annual report on Form 10-K for the year ended December 31, 2005, filed with the Securities and Exchange Commission on March 8, 2006. |
||
10.5 |
Employment arrangement between Epiq Systems, Inc. and Lorenzo Mendizabal dated as of May 20, 2005, as amended October 19, 2005. Incorporated by reference and previously filed as an exhibit to the Registrant's annual report on Form 10-K for the year ended December 31, 2006, filed with the Securities and Exchange Commission on March 9, 2007. |
||
10.6 |
Letter Agreement dated February 7, 2006, between Epiq Systems, Inc. and Bank of America, N.A. (portions of this exhibit have been omitted pursuant to grant of confidential treatment pursuant to Rule 24b-2 under the Securities Exchange Act of 1934). Incorporated by reference and previously filed as an exhibit to the Registrant's annual report on Form 10-K for the year ended December 31, 2006, filed with the Securities and Exchange Commission on March 9, 2007. |
||
| Exhibit Number |
Description | ||
|---|---|---|---|
| 10.7 | The Qualified Executive Performance Plan, dated as of March 29, 2007. Incorporated by reference and previously filed as an exhibit to the Registrant's current report on Form 8-K filed with the Securities and Exchange Commission on April 4, 2007. | ||
10.8 |
The Strategic Executive Incentive Plan, dated as of March 29, 2007. Incorporated by reference and previously filed as an exhibit to the Registrant's current report on Form 8-K filed with the Securities and Exchange Commission on April 4, 2007. |
||
10.9 |
Form of Subscription Agreement dated as of November 15, 2007, between Epiq Systems, Inc. and the purchasers named therein. Incorporated by reference and previously filed as an exhibit to the Registrant's current report on Form 8-K filed with the Securities and Exchange Commission on November 16, 2007. |
||
10.10 |
Form of Restricted Stock Award Agreement. Incorporated by reference and previously filed as an exhibit to the Registrant's current report on Form 8-K filed with the Securities and Exchange Commission on February 27, 2009. |
||
10.11 |
Final Judgment and Order of Dismissal with Prejudice dated August 24, 2010, for approval of Stipulation of Settlement (Alaska Electrical Pension Fund v. Tom W. Olofson, et al., Case No.: 08-CV-2344 CM/JPO). Incorporated by reference and previously filed as an exhibit to the Registrant's quarterly report on Form 10-Q filed with the Securities and Exchange Commission on October 28, 2010. |
||
12.1 |
Computation of ratio of earnings to fixed charges.* |
||
21.1 |
List of Subsidiaries.* |
||
23.1 |
Consent of Deloitte & Touche LLP, Independent Registered Public Accounting Firm.* |
||
31.1 |
Certifications of Chief Executive Officer of the Company under Rule 13a-14(a), as adopted pursuant to Section 302 of the Sarbanes-Oxley Act of 2002.* |
||
31.2 |
Certifications of Chief Financial Officer of the Company under Rule 13a-14(a), as adopted pursuant to Section 302 of the Sarbanes-Oxley Act of 2002.* |
||
32.1 |
Certifications of CEO and CFO pursuant to 18 U.S.C. Section 1350.* |
||
- *
- Filed herewith.