Attached files
Table of Contents
UNITED STATES
SECURITIES AND EXCHANGE COMMISSION
Washington, D.C. 20549
Form 10-K
| x | ANNUAL REPORT PURSUANT TO SECTION 13 OR 15(d) OF THE SECURITIES EXCHANGE ACT OF 1934 |
For the fiscal year ended December 31, 2010
| ¨ | TRANSITION REPORT PURSUANT TO SECTION 13 OR 15(d) OF THE SECURITIES EXCHANGE ACT OF 1934 |
For the transition period from to
Commission file number 001-12111
MEDNAX, INC.
(Exact name of registrant as specified in its charter)
| FLORIDA | 26-3667538 | |
| (State or other jurisdiction of incorporation or organization) |
(I.R.S. Employer Identification No.) | |
| 1301 Concord Terrace, Sunrise, Florida | 33323 | |
| (Address of principal executive offices) | (Zip Code) | |
Registrant’s telephone number, including area code (954) 384-0175
Securities registered pursuant to Section 12(b) of the Act:
| Title of Each Class |
Name of Each Exchange on Which Registered | |
| Common Stock, par value $.01 per share | New York Stock Exchange |
Securities registered pursuant to Section 12(g) of the Act: None
Indicate by check mark if the registrant is a well-known seasoned issuer, as defined in Rule 405 of the Securities Act. Yes x No ¨
Indicate by check mark if the registrant is not required to file reports pursuant to Section 13 or Section 15 (d) of the Exchange Act. Yes ¨ No x
Indicate by check mark whether the registrant (1) has filed all reports required to be filed by Section 13 or 15(d) of the Securities Exchange Act of 1934 during the preceding 12 months (or for such shorter period that the registrant was required to file such reports), and (2) has been subject to such filing requirements for the past 90 days. Yes x No ¨
Indicate by check mark whether the registrant has submitted electronically and posted on its Corporate Website, if any, every Interactive Data File required to be submitted and posted pursuant to Rule 405 of Regulation S-T (§232.405 of this chapter) during the preceding 12 months (or for such shorter period that the registrant was required to submit and post such files). Yes x No ¨
Indicate by check mark if disclosure of delinquent filers pursuant to Item 405 of Regulation S-K (§229.405 of this chapter) is not contained herein, and will not be contained, to the best of registrant’s knowledge, in definitive proxy or information statements incorporated by reference in Part III of this Form 10-K or any amendment to this Form 10-K. x
Indicate by check mark whether the registrant is a large accelerated filer, an accelerated filer, a non-accelerated filer or a smaller reporting company. See the definitions of “large accelerated filer,” “accelerated filer” and “smaller reporting company” in Rule 12b-2 of the Exchange Act.
| Large accelerated filer x | Accelerated filer ¨ | Non accelerated filer ¨ | Smaller reporting company ¨ |
Indicate by check mark whether the registrant is a shell company (as defined by Rule 12b-2 of the Exchange Act). Yes ¨ No x
The aggregate market value of shares of Common Stock of the registrant held by non-affiliates of the registrant on June 30, 2010, the last business day of the registrant’s most recently completed second fiscal quarter, was approximately $2,608,769,146 based on a $55.61 closing price per share as reported on the New York Stock Exchange composite transactions list on such date.
The number of shares of Common Stock of the registrant outstanding on February 18, 2011 was 47,983,543.
DOCUMENTS INCORPORATED BY REFERENCE:
The registrant’s definitive proxy statement to be filed with the Securities and Exchange Commission pursuant to Regulation 14A, with respect to the 2011 Annual Meeting of Shareholders is incorporated by reference in Part III of this Form 10-K to the extent stated herein. Except with respect to information specifically incorporated by reference in the Form 10-K, each document incorporated by reference herein is deemed not to be filed as part hereof.
Table of Contents
MEDNAX, INC.
ANNUAL REPORT ON FORM 10-K
For the Year Ended December 31, 2010
FORWARD-LOOKING STATEMENTS
Certain information included or incorporated by reference in this Form 10-K may be deemed to be “forward-looking statements” which may include, but are not limited to, statements relating to our objectives, plans and strategies, and all statements (other than statements of historical facts) that address activities, events or developments that we intend, expect, project, believe or anticipate will or may occur in the future. These statements are often characterized by terminology such as “believe,” “hope,” “may,” “anticipate,” “should,” “intend,” “plan,” “will,” “expect,” “estimate,” “project,” “positioned,” “strategy” and similar expressions, and are based on assumptions and assessments made by our management in light of their experience and their perception of historical trends, current conditions, expected future developments and other factors they believe to be appropriate. Any forward-looking statements in this Form 10-K are made as of the date hereof, and we undertake no duty to update or revise any such statements, whether as a result of new information, future events or otherwise. Forward-looking statements are not guarantees of future performance and are subject to risks and uncertainties. Important factors that could cause actual results, developments and business decisions to differ materially from forward-looking statements are described in this Form 10-K, including the risks set forth under “Risk Factors” in Item 1A.
2
Table of Contents
As used in this Form 10-K, unless the context otherwise requires, the terms “MEDNAX,” the “Company,” “we,” “us” and “our” refer to the parent company, MEDNAX, Inc., a Florida corporation, and the consolidated subsidiaries through which its businesses are actually conducted (collectively, “MDX”), together with MDX’s affiliated professional associations, corporations and partnerships (“affiliated professional contractors”). Certain subsidiaries of MDX have contracts with our affiliated professional contractors, which are separate legal entities that provide physician services in certain states and Puerto Rico.
PART I
| ITEM 1. | BUSINESS |
OVERVIEW
MEDNAX is a leading provider of physician services including newborn, maternal-fetal, pediatric subspecialty, and anesthesia care. At December 31, 2010, our national network comprised 1,675 affiliated physicians, including 968 physicians who provide neonatal clinical care, in 33 states and Puerto Rico, primarily within hospital-based neonatal intensive care units (“NICUs”), to babies born prematurely or with medical complications. We have 172 affiliated physicians who provide maternal-fetal care to expectant mothers experiencing complicated pregnancies and obstetrical hospitalist services in many areas where our affiliated neonatal physicians practice. Our network includes other pediatric subspecialists, including 104 physicians providing pediatric cardiology care, 84 physicians providing pediatric intensive care and 39 physicians providing hospital-based pediatric care. In addition, we have 308 physicians who provide anesthesia care to patients in connection with surgical and other procedures as well as pain management.
MEDNAX, Inc. was incorporated in Florida in 2007 and is the successor to Pediatrix Medical Group, Inc., which was incorporated in Florida in 1979. Our principal executive offices are located at 1301 Concord Terrace, Sunrise, Florida 33323, and our telephone number is (954) 384-0175.
Our Physician Specialties
The following discussion describes our physician specialties and the care that we provide:
| • | Neonatal Care. We provide clinical care to babies born prematurely or with complications within specific units at hospitals, primarily NICUs, through a team of experienced neonatal physician subspecialists (“neonatologists”), neonatal nurse practitioners and other pediatric clinicians. Neonatologists are board-certified or eligible-to-apply-for-certification physicians who have extensive education and training for the care of babies born prematurely or with complications that require complex medical treatment. Neonatal nurse practitioners are registered nurses who have advanced training and education in managing the healthcare needs of newborns, infants and their families. |
| • | Maternal-Fetal Care. We provide outpatient and inpatient clinical care to expectant mothers and their unborn babies through our affiliated maternal-fetal medicine subspecialists, obstetricians and other clinicians, such as maternal-fetal nurse practitioners, certified nurse mid-wives, ultrasonographers and genetic counselors. Maternal-fetal medicine subspecialists are board-certified or eligible-to-apply-for-certification obstetricians who have extensive education and training for the treatment of high-risk expectant mothers and their fetuses. Our affiliated maternal-fetal medicine subspecialists practice primarily in metropolitan areas where we have affiliated neonatologists to provide coordinated care for women with complicated pregnancies whose babies are often admitted to a NICU upon delivery. |
| • | Pediatric Cardiology Care. We provide inpatient and outpatient pediatric cardiology care of the fetus, infant, child, and adolescent patient with congenital heart defects and acquired heart disease as well as adults with congenital heart defects through our affiliated pediatric cardiologist subspecialists and other |
3
Table of Contents
| clinicians such as pediatric nurse practitioners, echocardiographers and other diagnostic technicians, and exercise physiologists. Pediatric cardiologists are board-certified pediatricians who have additional education and training in congenital heart defects and pediatric acquired heart disorders. |
| • | Other Pediatric Subspecialty Care. Our network includes pediatric intensivists, who are hospital-based pediatricians with additional education and training in caring for critically ill or injured children and adolescents, and pediatric hospitalists, who are hospital-based pediatricians specializing in inpatient care and management of acutely ill children. Our affiliated physicians also provide clinical services in other areas of hospitals, particularly in the labor and delivery area and nursery and pediatric department, where immediate accessibility to specialized care may be critical. |
| • | Anesthesia Care. We provide anesthesia care through a team of experienced physician anesthesiologists, certified registered nurse anesthetists (“CRNAs”) and anesthesia assistants (“AAs”). Using the care team approach, anesthesiologists supervise CRNAs and AAs allowing us to provide high quality, cost efficient and service oriented anesthesia care to our patients. Our anesthesiologists are board-certified, or eligible-to-apply-for-certification, physicians who are responsible for administering anesthesia to relieve pain and for managing vital life functions, including breathing, heart rhythm and blood pressure, during surgery. After surgery, they maintain the patient in a comfortable state during recovery and are involved in the provision of critical care medicine in the intensive care unit in urban and community hospitals and surgical centers. |
| • | Anesthesia Subspecialty Care. In addition to their board certification in anesthesiology, many of our anesthesiologists are board-certified in subspecialties such as obstetrical, critical care, cardiac, pediatric and anesthesia. |
| • | Pain Management. We also provide acute and chronic pain management services. Postoperative acute pain management is often initiated in the hospital recovery room and may continue for the remainder of the hospital stay. Chronic pain services are offered through outpatient medical offices or hospital clinics. These clinics are staffed with board-certified anesthesiologists, who are also board-certified or eligible-to-apply-for-certification in pain management, who provide patients with a comprehensive evaluation and treatment plan for their pain. These centers provide a full spectrum of care ranging from medical management of pain through minimally invasive interventional procedures. |
As part of our ongoing commitment to improving patient care through evidence-based medicine, we also conduct clinical research, monitor clinical outcomes and implement clinical quality initiatives with a view to improving patient outcomes, shortening the length of hospital stays and reducing long-term health system costs. We believe that referring and collaborating physicians, hospitals, third-party payors and patients all benefit from our clinical research, education and quality initiatives.
Demand for Our Services
Neonatal Medicine. Of the approximately four million births in the United States annually, we estimate that 12 to 13 percent require NICU admissions. Numerous institutions conduct research to identify potential causes of premature birth and medical complications that often require NICU admissions. Some common contributing factors include the presence of hypertension or diabetes in the mother, lack of prenatal care, complications during pregnancy, drug and alcohol abuse and smoking or poor nutritional habits during pregnancy. Babies admitted to NICUs typically have an illness or condition that requires the care of a neonatologist. Babies who are born prematurely or have a low birth weight often require neonatal intensive care services because of increased risk for medical complications. We believe obstetricians generally prefer to perform deliveries at hospitals that provide a full complement of labor and delivery services, including a NICU staffed by board-certified or eligible-to-apply-for-certification neonatologists. Because obstetrics is a significant source of hospital admissions, hospital administrators have responded to these demands by establishing NICUs and contracting with independent neonatology group practices, such as our affiliated professional contractors, to staff and manage these units. As a result, NICUs within the United States tend to be concentrated in hospitals with a higher volume of births. There are approximately 4,600 board-certified neonatologists in the United States.
4
Table of Contents
Maternal-Fetal Medicine. Expectant mothers with pregnancy complications often seek or are referred by their obstetricians to maternal-fetal medicine subspecialists. These subspecialists provide inpatient and outpatient care to women with conditions such as diabetes, heart disease, hypertension, multiple gestation, recurrent miscarriage, family history of genetic diseases, suspected fetal birth defects, and other complications during their pregnancies. We believe that improved maternal-fetal care has a positive impact on neonatal outcomes. Data on neonatal outcomes demonstrates that, in general, the likelihood of mortality or an adverse condition or outcome (referred to as “morbidity”) is reduced the longer a baby remains in the womb. There are approximately 1,700 board-certified maternal-fetal medicine subspecialists in the United States.
Pediatric Cardiology Medicine. Pediatric cardiologists provide inpatient and outpatient cardiology care of the fetus, infant, child, and adolescent with congenital heart defects and acquired heart disease, as well as of adults with congenital heart defects. We estimate that approximately one in every 120 babies is born with some form of heart defect. With advancements in care, there are approximately one million adults in the United States today living with congenital heart disease. There are approximately 1,900 board-certified pediatric cardiologists in the United States.
Other Pediatric Subspecialty Medicine. Other areas of pediatric subspecialty medicine are closely associated with maternal-fetal-newborn medical care. For example, pediatric intensivists are subspecialists who care for critically ill or injured children and adolescents in pediatric intensive care units (“PICUs”). There are approximately 1,400 board-certified pediatric intensivists in the United States. In addition, pediatric hospitalists are pediatricians who provide care in many hospital areas, including labor and delivery and the newborn nursery.
Anesthesia Medicine. An estimated 46 million inpatient procedures and 35 million ambulatory procedures are performed annually in the United States. Anesthesiologists generally provide or participate in the administration of anesthetics in these procedures. According to the U.S. Census Bureau, the U.S. population continues to expand and the fastest-growing segment of the population consists of individuals over the age of 65. The growth in population and, in particular the age 65 or greater segment, has resulted in an increase in demand for surgical services and a correlating increase in demand for anesthesia services. The growth of ambulatory surgical centers and expansion of office-based procedures has also contributed to the demand for anesthesia services. There are approximately 47,000 anesthesiologists in the United States.
Pain Management. According to the American Academy of Pain Medicine, more than 76 million people suffer from pain and 15% of those who suffer from pain will consult with a pain specialist. As the population ages, we believe the number of people suffering from acute or chronic pain will continue to increase. Lifestyle also plays an important part in the demand for pain management services. We believe that the combination of the growing population of people who suffer from pain, the lifestyle expectations of this population and the ability for patients to seek out a pain specialist without having to be referred by a physician will increase the demand for pain management services.
Hospital-Based Care. Hospitals generally must provide cost-effective, quality care in order to enhance their reputations within their communities and desirability to patients, referring and collaborating physicians and third-party payors. In an effort to improve outcomes and manage costs, hospitals typically employ or contract with physician specialists to provide specialized care in many hospital-based units or settings. Hospitals traditionally staff these units or settings through affiliations with local physician groups or independent practitioners. However, management of these units and settings presents significant operational challenges, including variable admissions rates, increased operating costs, complex reimbursement systems and other administrative burdens. As a result, some hospitals choose to contract with physician organizations that have the clinical quality initiatives, information and reimbursement systems and management expertise required to effectively and efficiently operate these units and settings in the current healthcare environment. Demand for hospital-based physician services, including neonatology and anesthesiology, is determined by a national market in which qualified physicians with advanced training compete for hospital contracts.
Practice Administration. Administrative demands and cost containment pressures from a number of sources, principally commercial and government payors, make it increasingly difficult for physicians to
5
Table of Contents
effectively manage patient care, remain current on the latest procedures and efficiently administer non-clinical activities. As a result, we believe that physicians remain receptive to being affiliated with larger organizations that reduce administrative burdens, achieve economies of scale and provide value-added clinical research, education and quality initiatives. By relieving many of the burdens associated with the management of a subspecialty group practice, we believe that our practice administration services permit our affiliated physicians to focus on providing quality patient care and thereby contribute to improving patient outcomes, ensuring appropriate length of hospital stays and reducing long-term health system costs. In addition, our national network of affiliated physician practices, modeled around a traditional group practice structure, is managed by a non-clinical professional management team with proven abilities to achieve significant operating efficiencies in providing administrative support systems, interacting with physicians, hospitals and third-party payors, managing information systems and technologies, and complying with laws and regulations.
Our Business Strategy
Our business objective is to enhance our position as a leading provider of physician services. The key elements of our strategy to achieve this objective are:
| • | Build upon core competencies. We have developed significant administrative expertise relating to neonatal, maternal-fetal and other pediatric subspecialty services. We have also facilitated the development of a clinical approach to the practice of medicine among our affiliated physicians that includes research, education and quality initiatives intended to advance the practice of neonatology, maternal-fetal, pediatric cardiology medicine and pediatric intensive care, improve the quality of care provided to acutely ill newborns and expectant mothers with pregnancy complications and reduce long-term health system costs. We have begun the development of a clinical data warehouse for our anesthesiology practices by collecting information from our billing and anesthesia record systems. The growth of this program will allow us to establish quality benchmarks for clinical outcomes, patient satisfaction and perioperative efficiencies across our anesthesiology practices. |
| • | Promote same-unit and organic growth. We seek opportunities for increasing revenue from our hospital- and office-based operations. For example, our affiliated hospital-based neonatal, maternal-fetal and other pediatric physicians are well situated to, and, in some cases, provide physician services in other departments, such as newborn nurseries, or in situations where immediate accessibility to specialized obstetric and pediatric care may be critical. In addition, we market our capabilities to obstetricians, pediatricians and family physicians to attract referrals to our hospital-based units and our office-based practices. We also market the services of our affiliated physicians to other hospitals to attract neonatology transport admissions. In addition, we pursue new contractual arrangements with hospitals where we do not currently provide physician services. We are developing similar opportunities with our affiliated anesthesiologists. |
| • | Acquire physician practice groups. We continue to seek to expand our operations by acquiring established physician practices in our specialties which include neonatology, maternal-fetal medicine, pediatric cardiology and anesthesiology. We also pursue complementary pediatric subspecialty physician groups, such as pediatric intensivists and pediatric hospitalists. During 2010, we added 15 physician groups to our national network through acquisitions consisting of eight neonatal practices, two maternal-fetal medicine practices, one pediatric cardiology practice, two other pediatric practices, and two anesthesiology practices. |
| • | Strengthen relationships with our partners. By managing many of the operational challenges associated with physician practices, encouraging clinical research, education and quality initiatives, and promoting timely intervention by our physicians, we believe that our business model is focused on improving the quality of care delivered to patients, promoting the appropriate length of their hospital stays and optimizing efficient use of health system resources. We believe that referring and collaborating physicians, hospitals, third-party payors and patients all benefit to the extent that we are successful in implementing our business model. |
6
Table of Contents
OUR PHYSICIAN SERVICES
Neonatal Care
We provide neonatal care to babies born prematurely or with complications within specific hospital units, primarily NICUs, through our network of 968 affiliated neonatal physicians and other related clinical professionals who staff and manage clinical activities at more than 320 NICUs in 33 states and Puerto Rico. We partner with our hospital clients in an effort to enhance the quality of care delivered to premature and sick babies. Some of the nation’s largest and most prestigious hospitals, both not-for-profit and for-profit institutions, retain us to staff and manage their NICUs. Our affiliated neonatologists generally provide 24-hours-a-day, seven-days-a-week coverage in NICUs, support the local referring physician community and are available for consultation in other hospital departments. Our hospital partners benefit from our experience in managing complex intensive care units. Our neonatal physicians interact with colleagues across the country through an internal communications system to draw upon their collective expertise in managing challenging patient-care issues. Our neonatal physicians also work collaboratively with maternal-fetal medicine subspecialists to coordinate care of mothers experiencing complicated pregnancies and their fetuses. We also employ or contract with neonatal nurse practitioners, who work with our affiliated physicians in providing medical care.
Maternal-Fetal Care
We provide outpatient and inpatient maternal-fetal care to expectant mothers with complicated pregnancies and their fetuses through our network of 172 affiliated physicians and other related clinical professionals who provide maternal-fetal medical care. Our affiliated neonatologists practice with maternal-fetal medicine subspecialists to provide coordinated care for expectant mothers with complicated pregnancies whose babies are often admitted to the NICU upon delivery. We believe continuity of treatment from mother and developing fetus during the pregnancy to the newborn upon delivery has improved the clinical outcomes of our patients.
Pediatric Cardiology Care
Our pediatric cardiology practice consists of 104 affiliated physicians and other related clinical professionals who provide specialized cardiac care to the fetus, neonatal and pediatric patients with congenital and acquired heart disorders, as well as adults with congenital heart defects, through scheduled office visits, hospital rounds and immediate consultation in emergency situations. Our affiliated cardiologists work collaboratively with neonatologists and maternal-fetal medicine subspecialists to provide coordinated care.
Other Pediatric Subspecialty Care
Our network includes other pediatric subspecialists such as pediatric intensivists and pediatric hospitalists. In addition, our affiliated physicians seek to provide support services in other areas of hospitals, particularly in the labor and delivery area, nursery and pediatric department, where immediate accessibility to specialized care may be critical. Our experience and expertise in maternal-fetal-neonatal medicine has led to our involvement in these other areas.
| • | Pediatric Intensive Care. We have 84 affiliated physicians who provide clinical care for critically ill or injured children and adolescents. They staff and manage PICUs at 34 hospitals. |
| • | Pediatric Hospitalists. We have 39 affiliated hospital-based physicians who provide clinical care to acutely ill children at 15 hospitals. |
| • | Other Newborn and Pediatric Care. Because our affiliated physicians and advanced nurse practitioners generally provide hospital-based coverage, they are situated to provide highly specialized care to address medical needs that may arise during a baby’s hospitalization. For example, as part of our ongoing efforts to support and partner with hospitals and the local referring physician community, our affiliated neonatologists, pediatric hospitalists and advanced nurse practitioners provide in-hospital nursery care to newborns through our newborn nursery program. This program is made available for |
7
Table of Contents
| babies during their hospital stay, which in the case of healthy babies typically consists of evaluation and observation, following which they are referred, and their hospital records are provided, to their pediatricians or family practitioners for follow-up care. |
| • | Newborn Hearing Screening Program. Our affiliated physicians also oversee our newborn hearing screening program. Since we launched this program in 1994, we believe that we have become the largest provider of newborn hearing screening services in the United States. In 2010, we screened over 520,000 babies for potential hearing loss at more than 270 hospitals across the nation. Over 40 states either require newborns to be screened for potential hearing loss before being discharged from the hospital or require that parents be offered the opportunity to submit their newborns to hearing screens. We contract or coordinate with hospitals to provide hearing screening services. |
Anesthesia Care
We provide anesthesia care at hospitals, ambulatory surgery centers, and office-based practices with our 308 affiliated anesthesiologists. Following the “care team” model, our physicians work with both practice and hospital employed anesthetists. As an integral part of the surgical team, our anesthesiologists support the surgeons by providing medical care before, during and after surgery so that surgeons may concentrate on the applicable surgery. Our anesthesiologists provide this care by evaluating the patient and consulting with the surgical team before surgery, providing pain control and support of life functions during surgery, supervising care after surgery and discharging the patient from the recovery unit. They also support other departments within the hospital such as labor and delivery, sedation for imaging, and the hospital’s emergency room by providing services as appropriate to patients requiring immediate care. In addition, our physicians provide anesthesia care at ambulatory surgical centers and office-based practices for procedures that require some level of anesthesia.
Pain Management
We provide pain management services in 14 outpatient centers with more than 18 anesthesiologists and eight physician assistants. Our anesthesiologists are board-certified in anesthesiology and board-certified, or eligible-to-apply-for-certification, in pain management. This advanced training and education expands treatment options available for both acute and chronic pain sufferers. The physicians develop treatment plans specific to the patients’ individual needs that include interventional techniques such as trigger point and facet injections, pain pumps, nerve stimulators, radiofrequency ablation and catheters as well as medication management.
CLINICAL RESEARCH, EDUCATION AND QUALITY
As part of our patient focus and ongoing commitment to improving patient care through evidenced-based medicine, we engage in clinical research, continuous quality improvement, and education initiatives. We discover, understand, and teach healthcare practices that enhance the abilities of clinicians to deliver quality care, thereby contributing to better patient outcomes and reduced long-term health system costs. Our investment in these initiatives benefits our patients, clinicians, referring and collaborating physicians, hospital partners and third-party payors. We believe that these initiatives help us, among other things, to enhance the value of our services, attract new and retain existing clinicians, improve clinical operations and enhance practice communication.
| • | Clinical Research. We conduct clinical research to discover ways to improve clinical care for our patients. We share our discoveries throughout the medical community through submissions to peer-reviewed literature. |
| • | We have completed several multi-center clinical trials. In 2010, we completed a multi-center trial entitled 17-Alpha-Hydroxyprogesterone Caproate (17-OHP) for Reduction of Neonatal Morbidity due to Preterm Birth in Twins & Triplets Pregnancies. A paper on the Triplets portion of the trial was published in the March 2010 issue of the medical journal American Journal of Obstetrics and |
8
Table of Contents
| Gynecology, and an abstract about the Twins portion of the trial was presented in the first session of the annual Society for Maternal-Fetal Medicine (“SMFM”) meeting. Also in 2010, a poster about our multi-center trial entitled, Amniotic Fluid Tandem Mass Spectrometry for Pregnancies Complicated by Nonimmune Hydrops and Severe Symmetrical Intrauterine Growth Restriction-A Multicenter Prospective Pilot Cohort Study was presented at the SMFM. |
| • | Several additional multi-center clinical trials are in progress. Two of our trials are focused on improving care for infants: Utility of Genetic Testing in Detection of Late-Onset Hearing Loss has completed enrollment of more than 3,700 infants and is pending publication; and How Illness and Nutritional Support Influence Amino Acid and Acylcarnitine Profiles in Premature Neonates, one of the largest prospective trials related to premature infant nutrition ever conducted has reached an enrollment of 920 out of a prospective 1,000 infants. This trial continues our research on important uses of proteomic evaluation of premature infants, which involves the identification of proteins and the determination of their role in the body. In addition, we continue several collaborative trials, including a sponsored multi-center trial that examines novel diagnostic approaches to the diagnosis of fetal aneuploidy (a condition involving the occurrence of one or more extra or missing chromosomes). |
| • | We also continue to publish research based on data from our clinical information systems. In 2009 and 2010, 18 papers were published as a result of this research, including: New intrauterine growth curves based on United States data, which was published in the medical journal Pediatrics; The changing pattern of inhaled nitric oxide use in the neonatal intensive care unit, which was published in Journal of Perinatology; and Increasing Supplemental Thyroid Hormone Use among Premature Infants Born at 23 to 32 Weeks’ Gestation, also published in Journal of Perinatology. |
| • | Continuous Quality Improvement. As part of our dedication to improving quality across our affiliated practices, we provide our clinicians with powerful information resources. Our physicians have access to accumulated data and robust software tools that enable them to compare their practices to our national practice network across a variety of activity and outcome metrics. From these comparisons, our physicians can identify areas for improvement, and then systematically monitor, study, learn, and implement change. We believe that our initiatives in continuous quality improvement have contributed to better patient care. One of our efforts in neonatal care resulted in a significant reduction in the duration and frequency of antibiotic utilization in the NICU. Other projects include: optimization of weight gain among very low birth weight infants; focus on increasing the use of breast milk; and reduction in the frequency of red blood cell transfusions in premature infants. Our “100,000 Babies Campaign” is focused on the delivery of care in NICUs generally with improved clinical outcomes as a result. One of the current efforts in this project has been directed at reducing catheter-related blood stream infections in neonates, and has resulted in a reduction in infection rates. Continuous quality improvement initiatives are underway for our other physician specialties. For example, in anesthesia care, several internal programs are being evaluated to provide standardized clinical outcome reporting, trend analysis and threshold performance. In addition, our anesthesiologists are leading several hospital sponsored patient safety initiatives. Our anesthesiologists are also evaluating our role in creating high performance surgical teams through innovative programs such as simulation centers and reenactment capabilities. Some of our prior continuous quality initiatives have resulted in published research papers. |
| • | Continuing Medical Education. We also make extensive physician continuing medical education and continuing nursing education resources available to our affiliated clinicians in an effort to ensure that they have access to current treatment methodologies. As an accredited provider for clinicians, we offer live continuing medical education through what we believe is one of the premier conferences in neonatal medicine—NEO: The Conference for Neonatology, which we launched in 2007. In 2010, we launched our Specialty Review in Neonatology/Perinatology 2.0 course, which provides a broad review of the entire subspecialty of neonatal medicine and will be held annually. We have also held meetings in maternal-fetal medicine in 2010 and will be supporting the World Symposium of Perinatal Medicine |
9
Table of Contents
| in 2011. In addition to live educational opportunities, we also offer online education through “Pediatrix University—A University Without Walls®,” an interactive educational website, which we continue to enhance with live presentations that are recorded at our various in person conferences. |
| • | Patient Safety Organization. We have established a federally qualified Patient Safety Organization (“PSO”), the mission of which is to improve quality and safety of care through the collection and analysis of data related to patient events. Our PSO encourages the development and dissemination of information regarding best practices and supports our dedication to clinical research and continuous quality improvement. |
We believe that these initiatives have been enhanced by our integrated national presence together with our clinical and management information systems, which are an integral component of our clinical research and education activities. See “Our Information Systems.”
OUR PRACTICE ADMINISTRATION
We provide multiple administrative services to support the practice of medicine by our affiliated physicians and improve operating efficiencies of our affiliated practice groups.
| • | Unit Management. We appoint a senior physician practicing medicine in each NICU, PICU, maternal-fetal, pediatric cardiology, anesthesia practice and other subspecialty practice that we manage to act as our medical director for that unit or practice. Each medical director is responsible for the overall management of his or her unit or practice, including staffing and scheduling, quality of care, professional discipline, utilization review, coordinating physician recruitment, and monitoring the financial success within the unit or practice. Medical directors also serve as a liaison with hospital administration, other physicians and the community. |
| • | Staffing and Scheduling. We assist with staffing and scheduling physicians and advanced practice nurses within the units and practices that we manage. For example, each NICU is staffed by at least one specialist on site or available on call. For our affiliated anesthesia physicians, CRNAs and AAs, we employ an operational system that assists with their staffing and scheduling. We are responsible for the salaries and benefits paid and provided to our affiliated physicians and practitioners. In addition, we employ, compensate and manage all non-medical personnel for our affiliated physician groups. |
| • | Recruiting and Credentialing. We have significant experience in locating, qualifying, recruiting and retaining experienced physicians. We maintain an extensive nationwide database of maternal-fetal, neonatal and other pediatric subspecialty physicians and are continuing to develop such a database for anesthesiologists. Our medical directors and physician management play a central role in the recruiting and interviewing process before candidates are introduced to other practice group physicians and hospital administrators. We verify the credentials, licenses and references of all prospective affiliated physician candidates. In addition to our database of physicians, we recruit nationally through trade advertising, referrals from our affiliated physicians and attendance at conferences. |
| • | Billing, Collection and Reimbursement. We assume responsibility for contracting with third-party payors for all of our affiliated physicians. We are responsible for billing, collection and reimbursement for services rendered by our affiliated neonatal, maternal-fetal, pediatric subspecialty and anesthesia physicians. In all instances, however, we do not assume responsibility for charges relating to services provided by hospitals or other physicians with whom we collaborate. Such charges are separately billed and collected by the hospitals or other physicians. We provide our affiliated physicians with a training curriculum that emphasizes detailed documentation of and proper coding protocol for all procedures performed and services provided, and we provide comprehensive internal auditing processes, all of which are designed to achieve appropriate coding, billing and collection of revenue for physician services. Generally, our billing and collection operations are conducted from our business offices located across the United States and in Puerto Rico as well as our corporate offices. |
10
Table of Contents
| • | Risk Management and Other Services. We maintain a risk management program focused on reducing risk and improving outcomes through evidence-based medicine, including diligent patient evaluation, documentation and access to research, education and best demonstrated processes. We maintain professional liability coverage for our national group of affiliated healthcare professionals. Through our risk management and medical affairs staff, we conduct risk management programs for loss prevention and early intervention in order to prevent or minimize professional liability claims. In addition, we provide a multi-faceted compliance program that is designed to assist our affiliated practice groups in complying with increasingly complex laws and regulations. We also provide management information systems, facilities management, marketing support and other services to our affiliated physicians and affiliated practice groups. |
OUR INFORMATION SYSTEMS
We maintain several information systems to support our day-to-day operations and ongoing clinical research and business analysis. Since inception, our clinical information systems have accumulated clinical information from more than 13 million daily progress records relating to over 700,000 discharged patients.
| • |
BabySteps®. BabySteps is an electronic health record system used by our affiliated neonatal physicians to record clinical progress notes electronically and provides a decision tree to assist them in certain situations with the selection of appropriate billing codes. We are currently in the process of certifying BabySteps as a module through the Certification Commission for Health Information Technology (“CCHIT®”), an Office of the National Coordinator—Authorized Testing and Certification Body (“ONC-ATCB”), in accordance with the applicable hospital certification criteria adopted by the Secretary of Health and Human Services that support the Stage 1 meaningful use measures required to qualify eligible providers and hospitals under the American Recovery and Reinvestment Act (“ARRA”). |
| • | Clinical Data Warehouse. BabySteps enables our affiliated practices to capture a consistent set of information about the patients we treat. We transfer information from our electronic health records in BabySteps to what we call our “clinical data warehouse.” With comprehensive reporting tools, our physicians are able to use this information to benchmark outcomes, enhance clinical decision-making and advance best practices at the bedside. Using a variety of clinical performance markers, a de-identified version of the data warehouse also helps us track drug interactions, link treatments to outcomes and identify opportunities to enhance patient outcomes. Our clinical data warehouse also helps us to identify prospective clinical trials and continuous quality improvement initiatives. |
| • |
Nextgen®. We have licensed the Nextgen Electronic Medical Record (“EMR”) and Electronic Patient Management (“EPM”) system for our office-based maternal-fetal and pediatric cardiology physicians to record clinical documentation related to their patients and manage the revenue cycle for our office-based practices. This system has the ability to provide benefits to our office-based practices that are similar to what BabySteps provides to our neonatology practices, including decision trees to assist physicians with the selection of appropriate billing codes, promotion of consistent documentation, and data for research and education. We are currently in the process of implementing EMR and EPM in all of our office-based maternal-fetal and pediatric cardiology practices. The 5.6 version of our Nextgen system was certified as a Complete Electronic Health Record (“EHR”) system on December 1, 2010 by CCHIT, in accordance with the applicable certification criteria adopted by the Secretary of Health and Human Services that support the Stage 1 meaningful use measures required to qualify eligible providers and hospitals for funding under the ARRA. |
| • | Pediatrix University®. In addition to providing continuing education, our Pediatrix University also functions as a “virtual doctors’ lounge,” enabling physicians around the country to discuss difficult or unusual cases with one another. It also provides a rich source of ongoing medical education in neonatology and maternal-fetal medicine. |
11
Table of Contents
Our management information systems are also an integral element of the billing and reimbursement process. We maintain systems that provide for electronic data interchange with payors that accept electronic submission, including electronic claims submission, insurance benefits verification and claims processing and remittance advice, which enable us to track numerous and diverse third-party payor relationships and payment methods. Our information systems provide scalability and flexibility as payor groups upgrade their payment and reimbursement systems. We continually seek improvements to our systems to expedite the overall process, streamlining information gathering from our clinical systems through to improving efficiencies in the reimbursement process.
We maintain additional information systems designed to improve operating efficiencies of our affiliated practice groups, reduce physicians’ paperwork requirements and facilitate interaction among our affiliated physicians and their colleagues regarding patient care issues. Following the acquisition of a physician practice group, we implement systematic procedures to improve the acquired group’s operating and financial performance. One of our first steps is to convert a newly acquired group to our broad-based management information system. We also maintain a database management system to assist our business development and recruiting departments to identify potential practice group acquisitions and physician candidates.
RELATIONSHIPS WITH OUR PARTNERS
Our business model, which has been influenced by the direct contact and daily interaction that our affiliated physicians have with their patients, emphasizes a patient-focused clinical approach that addresses the needs of our various “partners,” including hospitals, third-party payors, referring and collaborating physicians, affiliated physicians and, most importantly, our patients. Our relationships with all our partners are important to our continued success.
Hospitals
Our relationships with our hospital partners are critical to our operations. We have been retained by over 320 hospitals to staff and manage clinical activities within specific hospital-based units. Our affiliated physicians are important components of obstetric, pediatric and surgical services provided at hospitals. Our hospital-based focus enhances our relationships with hospitals and creates opportunities for our affiliated physicians to provide patient care in other areas of the hospital. For example, our physicians may provide care in emergency rooms, nurseries and other departments where access to specialized obstetric, pediatric and anesthesia care may be critical. Because hospitals control access to their units and operating rooms through the awarding of contracts and hospital privileges, we must maintain good relationships with our hospital partners. Our hospital partners benefit from our expertise in managing critical care units and other settings staffed with physician specialists, including managing variable admission rates, operating costs, complex reimbursement systems and other administrative burdens. We also work with our hospital partners to enhance their reputation and market our services to referring physicians, an important source of hospital admissions, within the communities served by those hospitals.
Under our contracts with hospitals, we have the responsibility to manage, in many cases exclusively, the provision of physician services for hospital-based units, such as NICUs, and other hospital settings. We typically are responsible for billing patients and third-party payors for services rendered by our affiliated physicians separately from other related charges billed by the hospital or other physicians to the same payors. Some of our hospital contracts require hospitals to pay us administrative fees. Some contracts provide for fees if the hospital does not generate sufficient patient volume in order to guarantee that we receive a specified minimum revenue level. We also receive fees from hospitals for administrative services performed by our affiliated physicians providing medical director services at the hospital. Administrative fees accounted for approximately 6% of our net patient service revenue during 2010. Our contracts with hospitals also generally require us to indemnify them and their affiliates for losses resulting from the negligence of our affiliated physicians. Our hospital contracts typically have terms of one to three years which can be terminated without cause by either party upon prior written notice, and renew automatically for additional terms of one to three years unless terminated early by any party. While we have in most cases been able to renew these arrangements, hospitals may cancel or not renew our arrangements, or reduce or eliminate our administrative fees in the future.
12
Table of Contents
Third-Party Payors
Our relationships with government-sponsored plans, including Medicaid and Medicare, managed care organizations and commercial health insurance payors are vital to our business. We seek to maintain professional working relationships with our third-party payors and streamline the administrative process of billing and collection, and assist our patients and their families in understanding their health insurance coverage and any balance due for co-payment, co-insurance deductible or out-of-network benefit limitations. In addition, through our quality initiatives and continuing research and education efforts, we have sought to enhance clinical care provided to patients, which we believe benefits third-party payors by contributing to improved patient outcomes and reduced long-term health system costs.
We receive compensation for professional services provided by our affiliated physicians to patients based upon rates for specific services provided, principally from third-party payors. Our billed charges are substantially the same for all parties in a particular geographic area, regardless of the party responsible for paying the bill for our services. A significant portion of our net patient service revenue is received from government-sponsored plans, principally state Medicaid programs. Medicaid programs pay for medical and health-related services for certain individuals and families with low incomes and resources and are jointly funded by the federal government and state governments. Medicaid programs can be either standard fee-for-service payment programs or managed care programs in which states have contracted with health insurance companies to run local or state-wide health plans with features similar to health maintenance organizations. Our compensation rates under standard Medicaid programs are established by state governments and are not negotiated. Rates under Medicaid managed care programs are negotiated but are similar to rates established under standard Medicaid programs. Although Medicaid rates vary across the states, these rates are generally much lower in comparison to private sector health plan rates. See Item 1A. Risk Factors—“State budgetary constraints could have an adverse effect on our reimbursement from Medicaid programs.”
Medicare is a health insurance program primarily for individuals 65 years of age and older, certain younger people with disabilities and people with end-stage renal disease. The program is provided without regard to income or assets and offers beneficiaries different ways to obtain their medical benefits. The most common option selected today by Medicare beneficiaries is the traditional fee-for-service payment system and the other options include managed care, preferred provider organizations, private fee-for-service and specialty plans. Medicare compensation rates are generally much lower in comparison to private-sector health plans. Because we provide anesthesia services to a wide array of patients, including Medicare beneficiaries, a portion of our patients’ services are reimbursed by Medicare.
In order to participate in government programs, we and our affiliated practices must comply with stringent and often complex enrollment and reimbursement requirements. Different states also impose differing standards for their Medicaid programs. See “Government Regulation—Government Reimbursement Requirements.”
We also receive compensation pursuant to contracts with commercial payors that offer a wide variety of health insurance products, such as health maintenance organizations, preferred provider organizations and exclusive provider organizations that are subject to various state laws and regulations, as well as self-insured organizations subject to federal Employee Retirement Income Security Act (“ERISA”) requirements. We seek to secure mutually agreeable contracts with payors that enable our affiliated physicians to be listed as in-network participants within the payors’ provider networks. We generally contract with commercial payors through our affiliated professional contractors. Subject to applicable laws and regulations, the terms, conditions and compensation rates of our contracts with commercial third-party payors are negotiated and often vary widely across markets and among payors. In some cases, we contract with organizations that establish and maintain provider networks and then rent or lease such networks to the actual payor. Our contracts with commercial payors typically provide for discounted fee-for-service arrangements and grant each party the right to terminate the contracts without cause upon prior written notice. In addition, these contracts generally give commercial payors the right to audit our billings and related reimbursements for professional services provided by our affiliated physicians.
13
Table of Contents
If we do not have a contractual relationship with a health insurance payor, we generally bill the payor our full billed charges. If payment is less than billed charges, we bill the balance to the patient, subject to state and federal laws regulating such billing. Although we maintain standard billing and collections procedures with appropriate discounts for prompt payment, we also provide discounts in certain hardship situations where patients and their families do not have financial resources necessary to pay the amount due for services rendered. Any amounts written-off related to private-pay patients are based on the specific facts and circumstances related to each individual patient account.
Referring and Collaborating Physicians
Our relationships with our referring and collaborating physicians are critical to our success. Our affiliated physicians seek to establish and maintain professional relationships with referring physicians in the communities where they practice. Because patient volumes at our NICUs are based in part on referrals from other physicians, particularly obstetricians, it is important that we are responsive to the needs of referring physicians in the communities in which we operate. We believe that our community presence, through our hospital coverage and outpatient clinics, assists referring obstetricians, office-based pediatricians and family physicians with their practices. Our affiliated physicians are able to provide comprehensive maternal-fetal, newborn and pediatric subspecialty care to patients using the latest advances in methodologies, supporting the local referring physician community with 24-hours-a-day, seven-days-a-week on-site or on-call coverage.
Our affiliated anesthesiologists seek to establish and maintain professional relationships with collaborating physicians, such as surgeons, and other healthcare providers. Our affiliated anesthesiologists play an important role for surgeons because they provide medical care to the patient throughout the surgical experience. This care includes evaluation of the patient prior to surgery, consultations with the surgical team, providing pain control and support of life functions during surgery and supervising care following surgery through the discharge of the patient from the recovery unit. Accordingly, our affiliated anesthesiologists are focused on delivering quality services to enhance the reputation and satisfaction of collaborating surgeons.
Affiliated Physicians and Practice Groups
Our relationships with our affiliated physicians are important. Our affiliated physicians are organized in traditional practice group structures. In accordance with applicable state laws, our affiliated practice groups are responsible for the provision of medical care to patients. Our affiliated practice groups are separate legal entities organized under state law as professional associations, corporations and partnerships, which we sometimes refer to as “our affiliated professional contractors.” Each of our affiliated professional contractors is owned by a licensed physician affiliated with MEDNAX, Inc. through employment or another contractual relationship. Our national infrastructure enables more effective and efficient sharing of new discoveries and clinical outcomes data, including implementation of best demonstrated processes, and affords access to our sophisticated information systems, and clinical research and education.
Our affiliated professional contractors employ or contract with physicians to provide clinical services in certain states and Puerto Rico. In most of our affiliated practice groups, each physician has entered into an employment agreement with us or one of our affiliated professional contractors providing for a base salary and incentive bonus eligibility and typically having a term of three to five years. We are typically responsible for billing patients and third-party payors for services rendered by our affiliated physicians and, with respect to services provided in a hospital, separately from other charges billed by hospitals to the same payors. Each physician must hold a valid license to practice medicine in the state in which he or she provides patient care and must become a member of the medical staff, with appropriate privileges, at each hospital at which he or she practices. Substantially all the physicians employed by us or our affiliated professional contractors have agreed not to compete within a specified geographic area for a certain period after termination of employment. Although we believe that the non-competition covenants of our affiliated physicians are reasonable in scope and duration and therefore enforceable under applicable state laws, we cannot predict whether a court or arbitration panel
14
Table of Contents
would enforce these covenants. Our hospital contracts also typically require that we and the physicians performing services maintain minimum levels of professional and general liability insurance. We negotiate those policies and contract and pay the premiums for such insurance on behalf of the physicians.
Each of our affiliated professional contractors has entered into a comprehensive management agreement with a subsidiary of MEDNAX, Inc. as manager. These agreements are long-term in nature, and in most cases permanent, subject only to a right of termination by the manager (except in the case of gross negligence, fraud or illegal acts of the manager). Under the terms of these management agreements, the manager is paid for its services based on the performance of the applicable practice group. See “Government Regulation—Fee Splitting; Corporate Practice of Medicine.”
COMPETITION
Competition in our business is generally based upon a number of factors, including reputation, experience and level of care and our affiliated physicians’ ability to provide cost-effective, quality clinical care. The nature of competition for our hospital-based practices, such as neonatology and anesthesia care, differs significantly from competition for our office-based practices. Our hospital-based practices compete nationally with other health services companies and physician groups for hospital contracts and qualified physicians. In some instances, our hospital-based physicians also compete on a more local basis. For example, our neonatologists compete for referrals from local physicians and transports from surrounding hospitals. Our office-based practices, such as maternal-fetal medicine and pediatric cardiology, compete locally for patients with office-based practices in those subspecialties.
Because our operations consist primarily of physician services provided within hospital-based units, we compete with others for contracts with hospitals to provide services. We also compete with hospitals themselves to provide such services. Hospitals may employ neonatologists or anesthesiologists directly or contract with other physician groups to provide services either on an exclusive or non-exclusive basis. A hospital not otherwise competing with us may begin to do so by opening a new NICU or operating facility, expanding the capacity of an existing NICU, adding operating room suites or, in the case of neonatal services, upgrading the level of its existing NICU. If the hospital chooses to do so, it may award the contract to operate the relevant facility to a competing group or company. Because hospitals control access to their NICUs and operating rooms by awarding contracts and hospital privileges, we must maintain good relationships with our hospital partners. Our contracts with hospitals generally provide that they may be terminated without cause upon prior written notice.
The healthcare industry is highly competitive. Companies in other segments of the industry, some of which have financial and other resources greater than ours, may become competitors in providing neonatal, maternal-fetal, other pediatric subspecialty care or anesthesia services.
GOVERNMENT REGULATION
The healthcare industry is governed by a framework of federal and state laws, rules and regulations that are extensive and complex and for which, in many cases, the industry has the benefit of only limited judicial and regulatory interpretation. If we or one of our affiliated practice groups is found to have violated these laws, rules or regulations, our business, financial condition and results of operations could be materially adversely affected. Moreover, the federal healthcare reform legislation signed into law in 2010 contains numerous provisions that may reshape the United States healthcare delivery system, and healthcare reform efforts continue to attract significant legislative interest, legal challenges and public attention that create uncertainty and the potential for additional changes. Healthcare reform implementation, additional legislation or other changes in government regulation may affect our reimbursement, restrict our existing operations, limit the expansion of our business or impose additional compliance requirements and costs, any of which could have a material adverse effect on our business, financial condition, results of operations, cash flows and the trading price of our common stock. See Item 1A. Risk Factors—“New laws, regulations or government policies concerning healthcare reform may have a significant effect on our business.”
15
Table of Contents
Licensing and Certification
Each state imposes licensing requirements on individual physicians and clinical professionals, and on facilities operated or utilized by healthcare companies like us. Many states require regulatory approval, including certificates of need, before establishing certain types of healthcare facilities, offering certain services or expending amounts in excess of statutory thresholds for healthcare equipment, facilities or programs. We and our affiliated physicians are also required to meet applicable Medicaid provider requirements under state laws and regulations and Medicare provider requirements under federal law and regulations.
Fee Splitting; Corporate Practice of Medicine
Many states have laws that prohibit business corporations, such as MDX, from practicing medicine, employing physicians to practice medicine, exercising control over medical decisions by physicians, or engaging in certain arrangements, such as fee splitting, with physicians. In light of these restrictions, we operate by maintaining long-term management contracts through our subsidiaries with affiliated professional contractors, which employ or contract with physicians to provide physician professional services. Under these arrangements, our manager subsidiaries perform only non-medical administrative services, do not represent that they offer medical services and do not exercise influence or control over the practice of medicine by the physicians employed by the affiliated professional contractors. In states where fee splitting with a business corporation or manager is prohibited, the fees that are received from the affiliated professional contractors have been established on a basis that we believe complies with applicable laws. Although the relevant laws in these states have been subject to limited judicial and regulatory interpretation, we believe that we are in compliance with applicable state laws in relation to the corporate practice of medicine and fee splitting. However, regulatory authorities or other parties, including our affiliated physicians, may assert that, despite these arrangements, we or our manager subsidiaries are engaged in the corporate practice of medicine or that the contractual arrangements with the affiliated professional contractors constitute unlawful fee splitting, in which case we could be subject to civil or criminal penalties, the contracts could be found legally invalid and unenforceable, in whole or in part, or we could be required to restructure our contractual arrangements with our affiliated professional contractors.
Fraud and Abuse Provisions
Existing federal laws governing Medicaid, Medicare and other federal healthcare programs (the “FHC Programs”), as well as similar state laws, impose a variety of fraud and abuse prohibitions on healthcare companies like us. These laws are interpreted broadly and enforced aggressively by multiple government agencies, including the Office of Inspector General of the Department of Health and Human Services (the “OIG”), the Department of Justice (the “DOJ”) and various state authorities. In addition, in the Deficit Reduction Act of 2005, Congress established a Medicaid Integrity Program to enhance federal and state efforts to detect Medicaid fraud, waste and abuse and provide financial incentives for states to enact their own false claims legislation as an additional enforcement tool against Medicaid fraud and abuse. Since then, a growing number of states have enacted healthcare fraud and abuse legislation.
The fraud and abuse laws include extensive federal and state regulations applicable to our financial relationships with hospitals, referring physicians and other healthcare entities. In particular, the federal anti-kickback statute prohibits the offer, payment, solicitation or receipt of any remuneration in return for either referring Medicaid, Medicare or other FHC Program business, or purchasing, leasing, ordering, or arranging for or recommending any service or item for which payment may be made by an FHC Program. In addition, federal physician self-referral legislation, commonly known as the “Stark Law,” prohibits a physician from ordering certain designated health services reimbursable by Medicare from an entity with which the physician has a prohibited financial relationship. These laws are broadly worded and, in the case of the anti-kickback statute, have been broadly interpreted by federal courts, and potentially subject many healthcare business arrangements to government investigation and prosecution, which can be costly and time consuming.
16
Table of Contents
Violations of these laws are punishable by substantial penalties, including monetary fines, civil penalties, criminal sanctions (in the case of the anti-kickback statute), exclusion from participation in FHC Programs and forfeiture of amounts collected in violation of such laws, any of which could have an adverse effect on our business and results of operations. Many of the states in which we operate also have similar anti-kickback and self-referral laws which are applicable to our government and non-government business and which also authorize substantial penalties for violations.
There are a variety of other types of federal and state fraud and abuse laws, including laws authorizing the imposition of criminal, civil and administrative penalties for filing false or fraudulent claims for reimbursement with government healthcare programs. These laws include the civil False Claims Act (“FCA”), which prohibits the filing of false claims with the federal government or federal government programs, including Medicaid, Medicare, the TRICARE program for military dependents and retirees, and the Federal Employees Health Benefits Program. Substantial civil fines can be imposed for violating the FCA. Furthermore, proving a violation of the FCA requires only that the government show that the individual or company that filed the false claim acted in “reckless disregard” of the truth or falsity of the claim, notwithstanding that there may have been no intent to defraud the government program and no actual knowledge that the claim was false (which typically are required to be shown to sustain a criminal conviction). The FCA also applies to the improper retention of known overpayments and includes “whistleblower” provisions that permit private citizens to sue a claimant on behalf of the government and thereby share in the amounts recovered under the law. In recent years, many cases have been brought against healthcare companies by such “whistleblowers,” which have resulted in judgments or, more often, settlements involving substantial payments to the government by the companies involved. It is anticipated that the number of such actions against healthcare companies will continue to increase with the enactment of a growing number of state false claims acts and certain amendments to the FCA recently enacted by Congress.
In addition, federal and state agencies that administer healthcare programs have at their disposal statutes, commonly known as “civil money penalty laws,” that authorize substantial administrative fines and exclusion from government programs in cases where an individual or company that filed a false claim, or caused a false claim to be filed, knew or should have known that the claim was false or fraudulent. As under the FCA, it often is not necessary for the agency to show that the claimant had actual knowledge that the claim was false or fraudulent in order to impose these penalties.
The civil and administrative false claims statutes are being applied in an increasingly broader range of circumstances. For example, government authorities often argue that claiming reimbursement for services that fail to meet applicable quality standards may, under certain circumstances, violate these statutes. Government authorities also often take the position, now with support from recent amendments to the FCA, that claims for services that were induced by kickbacks, Stark Law violations or other illicit marketing schemes are fraudulent and, therefore, violate the false claims statutes. In addition, we are in the final year of a corporate integrity agreement with the OIG (the “Corporate Integrity Agreement”) in connection with the settlement of a previously disclosed investigation, which creates an additional basis for administrative liability. See “Government Investigations.”
If we or our affiliated professional contractors were excluded from any government-sponsored healthcare programs, not only would we be prohibited from submitting claims for reimbursement under such programs, but we also would be unable to contract with other healthcare providers, such as hospitals, to provide services to them.
Although we intend to conduct our business in compliance with all applicable federal and state fraud and abuse laws, many of the laws and regulations applicable to us, including those relating to billing and those relating to financial relationships with physicians and hospitals, are broadly worded and may be interpreted or applied by prosecutorial, regulatory or judicial authorities in ways that we cannot predict. Accordingly, we cannot assure you that our arrangements or business practices will not be subject to government scrutiny or be alleged or found to violate applicable fraud and abuse laws. Moreover, the standards of business conduct
17
Table of Contents
expected of healthcare companies under these laws and regulations have become more stringent in recent years, even in instances where there has been no change in statutory or regulatory language. If there is a determination by government authorities that we have not complied with any of these laws and regulations, or that we have materially breached the terms of our Corporate Integrity Agreement with the OIG, our business, financial condition and results of operations could be materially adversely affected. See “Government Investigations.”
Government Reimbursement Requirements
In order to participate in the various state Medicaid programs and in the Medicare program, we and our affiliated practices must comply with stringent and often complex enrollment and reimbursement requirements. Moreover, different states impose differing standards for their Medicaid programs. While our compliance program requires that we and our affiliated practices adhere to the laws and regulations applicable to the government programs in which we participate, our failure to comply with these laws and regulations could negatively affect our business, financial condition and results of operations. See “Government Regulation—Fraud and Abuse Provisions,” “Government Regulation—Compliance Plan,” “Government Investigations” and “Other Legal Proceedings,” and Item 1A. Risk Factors—“Government programs or private insurers may limit, reduce or make retroactive adjustments to reimbursement amounts or rates,” “We may become subject to billing investigations by federal and state government authorities” and “The healthcare industry is highly regulated, and government authorities may determine that we have failed to comply with applicable laws or regulations.”
In addition, Medicaid, Medicare and other government healthcare programs (such as the TRICARE program) are subject to statutory and regulatory changes, administrative rulings, interpretations and determinations, requirements for utilization review and new governmental funding restrictions, all of which may materially increase or decrease program payments as well as affect the cost of providing services and the timing of payments to providers. Moreover, because these programs generally provide for reimbursement on a fee-schedule basis rather than on a charge-related basis, we generally cannot increase our revenue by increasing the amount we charge for our services. To the extent our costs increase, we may not be able to recover our increased costs from these programs, and cost containment measures and market changes in non-governmental insurance plans have generally restricted our ability to recover, or shift to non-governmental payors, these increased costs. In attempts to limit federal and state spending, there have been, and we expect that there will continue to be, a number of proposals to limit or reduce Medicaid and Medicare reimbursement for various services. Our business may be significantly and adversely affected by any such changes in reimbursement policies and other legislative initiatives aimed at reducing healthcare costs associated with Medicaid, Medicare and other government healthcare programs.
Our business also could be adversely affected by reductions in or limitations of reimbursement amounts or rates under these government programs, reductions in funding of these programs or elimination of coverage for certain individuals or treatments under these programs.
Antitrust
The healthcare industry is subject to close antitrust scrutiny. In recent years, the Federal Trade Commission (the “FTC”), the DOJ, and state Attorneys General have increasingly taken steps to review and, in some cases, take enforcement action against, business conduct and acquisitions in the healthcare industry. Violations of antitrust laws may be punishable by substantial penalties, including significant monetary fines, civil penalties, criminal sanctions, consent decrees and injunctions prohibiting certain activities or requiring divestiture or discontinuance of business operations. Any of these penalties could have a material adverse effect on our business, financial condition and results of operations.
18
Table of Contents
HIPAA and Other Privacy Laws
Numerous federal and state laws and regulations govern the collection, dissemination, use and confidentiality of patient health information, including the federal Health Insurance Portability and Accountability Act of 1996 (“HIPAA”) and its implementing regulations, violations of which are punishable by monetary fines, civil penalties and, in some cases, criminal sanctions. As part of our medical record keeping, third-party billing, research and other services, we and our affiliated practices collect and maintain patient health information.
Pursuant to HIPAA, the U.S. Department of Health and Human Services (“HHS”) has adopted standards to protect the privacy and security of individually identifiable health information, known as the Privacy Standards and Security Standards. HHS’s Privacy Standards became effective in 2003 and apply to medical records and other individually identifiable health information in any form, whether electronic, paper or oral, that is used or disclosed by healthcare providers, hospitals, health plans and healthcare clearinghouses, which are known as covered entities. We have implemented privacy policies and procedures, including training programs, designed to be compliant with the HIPAA Privacy Standards.
HHS’s Security Standards became effective in 2005 and require healthcare providers to implement administrative, physical and technical safeguards to protect the integrity, confidentiality and availability of individually identifiable health information that is electronically received, maintained or transmitted (including between us and our affiliated practices). We have implemented security policies, procedures and systems designed to facilitate compliance with the HIPAA Security Standards.
In February 2009, Congress enacted the Health Information Technology for Economic and Clinical Health (“HITECH”) Act as part of the ARRA. Among other changes to the law governing patient health information, HITECH strengthens and expands HIPAA, increases penalties for violations, gives patients new rights to restrict uses and disclosures of their health information, and imposes a number of privacy and security requirements directly on our business associates, which are third-parties that perform functions or services for us or on our behalf. Specifically, HITECH requires that covered entities report any unauthorized use or disclosure of individually identifiable health information that meets the definition of a breach, to the affected individuals, HHS, and depending on the number of affected individuals, the media for the affected market. HITECH also authorizes state Attorneys General to bring civil actions in response to violations of HIPAA that threaten the privacy of state residents. As a result, we have made revisions to our privacy policies and procedures designed to be compliant with the HITECH Act requirements.
In addition to the federal HIPAA and HITECH requirements, numerous other state and some federal laws protect the confidentiality of patient information, including state medical privacy laws, state social security number protection laws, human subjects research laws and federal and state consumer protection laws. In some cases, state laws are more protective than HIPAA and therefore, are not preempted by HIPAA.
Environmental Regulations
Our healthcare operations generate medical waste that must be disposed of in compliance with federal, state and local environmental laws, rules and regulations. Our office-based operations are subject to compliance with various other environmental laws, rules and regulations. Such compliance does not, and we anticipate that such compliance will not, materially affect our capital expenditures, financial position or results of operations.
Compliance Plan
We have adopted a compliance plan that reflects our commitment to complying with laws and regulations applicable to our business and meeting our ethical obligations in conducting our business (the “Compliance Plan”). We believe our Compliance Plan provides a solid framework to meet this commitment and our obligations under the Corporate Integrity Agreement, including:
| • | a Chief Compliance Officer who reports to the Board of Directors on a regular basis; |
| • | a Compliance Committee consisting of our senior executives; |
19
Table of Contents
| • | a formal internal audit function, including a Director of Internal Audit who reports to the Audit Committee on a regular basis; |
| • | our Code of Conduct, which is applicable to our employees, independent contractors, officers and directors; |
| • | our Code of Professional Conduct—Finance, which is applicable to our finance personnel, including our Chief Executive Officer, Chief Financial Officer and Treasurer (who is also our Chief Accounting Officer), Vice President of Accounting and Finance and Controller; |
| • | a disclosure program that includes a mechanism to enable individuals to disclose to the Chief Compliance Officer or any person who is not in the disclosing individual’s chain of command, issues or questions believed by the individual to be a potential violation of criminal, civil, or administrative laws; |
| • | an organizational structure designed to integrate our compliance objectives into our corporate, regional and practice levels; and |
| • | education, monitoring and corrective action programs designed to establish methods to promote the understanding of our Compliance Plan and adherence to its requirements. |
The foundation of our Compliance Plan is our Code of Conduct, which is intended to be a comprehensive statement of the ethical and legal standards governing the daily activities of our employees, affiliated professionals, independent contractors, officers and directors. All our personnel are required to abide by, and are given thorough education regarding, our Code of Conduct. In addition, all employees and affiliated professionals are expected to report incidents that they believe in good faith may be in violation of our Code of Conduct. We maintain a toll-free helpline to permit individuals to report compliance concerns on an anonymous basis and obtain answers to questions about our Code of Conduct. Our Compliance Plan, including our Code of Conduct, is administered by our Chief Compliance Officer with oversight by our Chief Executive Officer, Compliance Committee and Board of Directors. Copies of our Code of Conduct and our Code of Professional Conduct—Finance are available on our website, www.mednax.com. Our Internet website and the information contained therein or connected thereto are not incorporated into or deemed a part of this Form 10-K. Any amendments or waivers to our Code of Professional Conduct—Finance will be promptly disclosed on our website following the date of any such amendment or waiver.
GOVERNMENT INVESTIGATIONS
In September 2006, we entered into a settlement agreement with the Department of Justice and a relator who initiated a “qui tam” complaint against us relating to our billing practices for services provided from January 1996 through December 1999 that were reimbursed by Medicaid, the Federal Employees Health Benefit program, and the United States Department of Defense’s TRICARE program for military dependents and retirees (the “Settlement Agreement”). As part of the Settlement Agreement, we are in the final year of a five-year Corporate Integrity Agreement with the OIG. The Corporate Integrity Agreement acknowledges the existence of our comprehensive Compliance Plan, which provides for policies and procedures aimed at promoting our adherence with FHC Program requirements and requires us to maintain the Compliance Plan in full operation for the term of the Corporate Integrity Agreement. In addition, the Corporate Integrity Agreement requires, among other things, that we must comply with the following integrity obligations during the term of the Corporate Integrity Agreement:
| • | maintaining a Chief Compliance Officer and Compliance Committee to administer our compliance with FHC Program requirements, our Compliance Plan and the Corporate Integrity Agreement; |
| • | maintaining a Code of Conduct for our officers, directors, employees, contractors, subcontractors, agents, or other persons who provide patient care items or services (the “Covered Persons”); |
| • | maintaining written policies and procedures regarding the operation of the Compliance Plan and our compliance with FHC Program requirements; |
20
Table of Contents
| • | providing general compliance training to the Covered Persons as well as specific training to the Covered Persons who perform coding functions relating to claims for reimbursement from any FHC Program; |
| • | engaging an independent review organization to perform annual reviews of samples of claims from multiple hospital units to assist us in assessing and evaluating our coding, billing, and claims-submission practices; |
| • | maintaining a Disclosure Program that includes a mechanism to enable individuals to confidentially disclose issues or questions believed by the individual to be a potential violation of criminal, civil, or administrative laws; |
| • | not hiring or, if employed, removing from our business operations which are related to or compensated, in whole or part, by FHC Programs, persons (i) convicted of a criminal offense related to the provision of healthcare items or services or (ii) ineligible to participate in FHC Programs or Federal procurement or non-procurement programs; |
| • | notifying the OIG of (i) new investigations or legal proceedings by a governmental entity or its agents involving an allegation that the Company has committed a crime or has engaged in fraudulent activities, (ii) matters that a reasonable person would consider a probable violation of criminal, civil or administrative laws applicable to any FHC Program for which penalties or exclusion may be imposed, and (iii) the purchase, sale, closure, establishment, or relocation of any facility furnishing items or services that are reimbursed under FHC Programs; |
| • | reporting and returning overpayments received from FHC Programs; |
| • | submitting reports to the OIG regarding our compliance with the Corporate Integrity Agreement; and |
| • | maintaining for inspection, for a period of six years from the effective date, all documents and records relating to reimbursement from the FHC Programs and compliance with the Corporate Integrity Agreement. |
Failure to comply with our duties under the Corporate Integrity Agreement could result in substantial monetary penalties and in the case of a material breach, could even result in our being excluded from participating in FHC Programs. We believe that we were in compliance with the Corporate Integrity Agreement as of December 31, 2010.
In July 2007, the Audit Committee of our Board of Directors concluded a comprehensive review of our historical practices related to the granting of stock options. In connection with the review, we had discussions with the U.S. Attorney’s office for the Southern District of Florida concerning the matters covered by the review and, in response to a subpoena received in December 2007, provided the office with various documents and information related to our stock option granting practices. We intend to fully cooperate with the U.S. Attorney’s office if there is any additional activity with respect to this matter. In March 2009, we settled an investigation by the Securities and Exchange Commission relating to this matter by entering into a consent decree.
We expect that additional audits, inquiries and investigations from government authorities and agencies will continue to occur in the ordinary course of business. Such audits, inquiries and investigations and their ultimate resolutions, individually or in the aggregate, could have a material adverse effect on our business, financial condition, results of operations, cash flows and the trading price of our common stock.
OTHER LEGAL PROCEEDINGS
In the ordinary course of our business, we become involved in pending and threatened legal actions and proceedings, most of which involve claims of medical malpractice related to medical services provided by our affiliated physicians. Our contracts with hospitals generally require us to indemnify them and their affiliates for losses resulting from the negligence of our affiliated physicians. We may also become subject to other lawsuits
21
Table of Contents
that could involve large claims and significant defense costs. We believe, based upon a review of pending actions and proceedings, that the outcome of such legal actions and proceedings will not have a material adverse effect on our business, financial condition or results of operations. The outcome of such actions and proceedings, however, cannot be predicted with certainty and an unfavorable resolution of one or more of them could have a material adverse effect on our business, financial condition, results of operations, cash flows and the trading price of our common stock.
Although we currently maintain liability insurance coverage intended to cover professional liability and certain other claims, we cannot assure that our insurance coverage will be adequate to cover liabilities arising out of claims asserted against us in the future where the outcomes of such claims are unfavorable to us. With respect to professional liability risk, we self-insure a significant portion of this risk through our wholly owned captive insurance subsidiary. Liabilities in excess of our insurance coverage, including coverage for professional liability and certain other claims, could have a material adverse effect on our business, financial condition and results of operations. See “Professional and General Liability Coverage.”
PROFESSIONAL AND GENERAL LIABILITY COVERAGE
We maintain professional and general liability insurance policies with third-party insurers on a claims-made basis, subject to deductibles, self-insured retention limits, policy aggregates, exclusions, and other restrictions, in accordance with standard industry practice. We believe that our insurance coverage is appropriate based upon our claims experience and the nature and risks of our business. However, we cannot assure that any pending or future claim will not be successful or if successful will not exceed the limits of available insurance coverage.
Our business entails an inherent risk of claims of medical malpractice against our affiliated physicians and us. We contract and pay premiums for professional liability insurance that indemnifies us and our affiliated healthcare professionals on a claims-made basis for losses incurred related to medical malpractice litigation. Professional liability coverage is required in order for our affiliated physicians to maintain hospital privileges. Our self-insured retention under our professional liability insurance program is maintained primarily through a wholly owned captive insurance subsidiary. We record estimates in our Consolidated Financial Statements for our liabilities for self-insured retention amounts and claims incurred but not reported based on an actuarial valuation using historical loss information, claim emergence patterns and various actuarial assumptions. Liabilities for claims incurred but not reported are not discounted. Because many factors can affect historical and future loss patterns, the determination of an appropriate reserve involves complex, subjective judgment, and actual results may vary significantly from estimates. If the self-insured retention amounts and other amounts that we are actually required to pay materially exceed the estimates that have been reserved, our financial condition, results of operations and cash flows could be materially adversely affected.
EMPLOYEES AND PROFESSIONALS UNDER CONTRACT
In addition to the 1,675 practicing physicians affiliated with us as of December 31, 2010, we employed or contracted with 1,613 other clinical professionals, including advanced practice nurses, and 2,982 other full-time and part-time employees.
GEOGRAPHIC COVERAGE
We provide services in 33 states, including Alaska, Arizona, Arkansas, California, Colorado, Florida, Georgia, Idaho, Indiana, Illinois, Iowa, Kansas, Kentucky, Louisiana, Maryland, Michigan, Missouri, Montana, Nevada, New Jersey, New Mexico, New York, North Carolina, Ohio, Oklahoma, Pennsylvania, South Carolina, Tennessee, Texas, Utah, Virginia, Washington and West Virginia, and Puerto Rico. During 2010, approximately 55% of our net patient service revenue was generated by operations in our five largest states. Our operations in Texas accounted for approximately 22% of our net patient service revenue for the same period. Although we continue to seek to diversify the geographic scope of our operations, primarily through acquisitions of physician
22
Table of Contents
group practices, we may not be able to implement successfully or realize the expected benefits of any of these initiatives. Adverse changes or conditions affecting states in which our operations are concentrated, such as healthcare reforms, changes in laws and regulations, reduced Medicaid or Medicare reimbursements, an increase in the income level required to qualify for government healthcare programs or government investigations, may have a material adverse effect on our business, financial condition and results of operations.
SERVICE MARKS
We have registered the service marks “Pediatrix Medical Group and Design,” “Obstetrix Medical Group and Design,” “Pediatrix University,” “Pediatrix University-A University Without Walls,” “SoundGene and Design,” “Soundata,” “Ear Hugs,” and the “Baby design logo,” among others, with the United States Patent and Trademark Office. In addition, we have pending applications to register the service marks “MEDNAX National Medical Group,” the MEDNAX design logo, “American Anesthesiology,” the “American Anesthesiology design logo,” “INewborn,” and “QualitySteps.”
AVAILABLE INFORMATION
Our annual proxy statements, annual reports on Form 10-K, quarterly reports on Form 10-Q, current reports on Form 8-K and amendments to those statements and reports filed or furnished pursuant to Section 13(a) or 15(d) of the Securities Exchange Act of 1934 are available free of charge and may be printed out through our Internet website, www.mednax.com, as soon as reasonably practicable after we electronically file such material with, or furnish it to, the SEC. Our proxy statements and reports may also be obtained directly from the SEC’s Internet website at www.sec.gov or from the SEC’s Public Reference Room at 100 F Street, N.E., Washington, D.C. 20549. Information on the operation of the Public Reference Room can be obtained by calling 1-800-SEC-0330. Our Internet website and the information contained therein or connected thereto are not incorporated into or deemed a part of this Form 10-K.
23
Table of Contents
| ITEM 1A. | RISK FACTORS |
Our business is subject to a number of factors that could materially affect future developments and performance. In addition to factors affecting our business that have been described elsewhere in this Form 10-K, any of the following risks could have a material adverse effect on our business, financial condition, results of operations, cash flows and the trading price of our common stock.
Continuing unfavorable economic conditions could have an adverse effect on our business.
The United States is continuing to be affected by unfavorable economic conditions. The number of unemployed workers is significant. During 2010, our business continued to be affected by a shift toward government-sponsored healthcare programs. If economic conditions do not improve or deteriorate further, there could be additional shifts toward government-sponsored programs and possibly lower patient volumes. These conditions could also lead to additional increases in the number of unemployed workers and a decline in the number of private employers that offer healthcare insurance coverage to their employees. Employers that do offer healthcare coverage may increase the required contributions from employees to pay for their coverage and increase patient responsibility amounts. As a consequence, the number of patients who participate in government-sponsored programs or are uninsured could increase. Payments received from government-sponsored programs are substantially less than payments received from managed care and other third-party payors. A payor mix shift from managed care and other third-party payors to government payors may result in an increase in our estimated provision for contractual adjustments and uncollectibles and a corresponding decrease in our net patient service revenue. Further increases in the government component of our payor mix at the expense of other third-party payors could result in a significant reduction in our average reimbursement rates.
State budgetary constraints could have an adverse effect on our reimbursement from Medicaid programs.
As a result of unfavorable economic conditions, many states are continuing to collect less revenue than they did in prior years and as a consequence are facing significant budget shortfalls and underfunded pension and other obligations. In the recent past, the federal government provided temporary funds to assist states with Medicaid programs but this assistance is due to expire in June 2011, and there can be no assurance that there will be similar funding in the future. Financial conditions in the states where the Company does business could lead to reduced or delayed funding for Medicaid programs and, in turn, reduced or delayed reimbursement for physician services, which could adversely affect our results of operations, cash flows and financial condition.
The birth rate in the United States has declined and may continue to fall.
Provisional data for 2009 indicates that the births in the United States declined by 2.7 percent from 2008 which fell by 1.6 percent from 2007. Although the provisional data is not yet available for 2010, we believe that births may have also declined in 2010. Further declines in births could have an adverse effect on our patient volumes and revenue.
The Healthcare Reform Act may have a significant effect on our business.
In March 2010, the “Patient Protection and Affordable Care Act,” (the “Healthcare Reform Act”), was enacted. The Healthcare Reform Act contains a number of provisions that could affect us over the next several years. These provisions include establishing health insurance exchanges to facilitate the purchase of qualified health plans, expanding Medicaid eligibility, subsidizing insurance premiums and creating incentives for businesses to provide healthcare benefits. Other provisions contain changes to healthcare fraud and abuse laws and expand the scope of the Federal False Claims Act.
The Healthcare Reform Act contains numerous other measures that could also affect us. For example, payment modifiers are to be developed that will differentiate payments to physicians under federal healthcare
24
Table of Contents
programs based on quality of care. In addition, other provisions authorize voluntary demonstration projects relating to the bundling of payments for episodes of hospital care and the sharing of cost savings achieved by providers organized as accountable care organizations under the Medicare program.
Many of the Healthcare Reform Act’s most significant reforms do not take effect until 2014 and thereafter, and their details will be shaped significantly by implementing regulations that have yet to be proposed. Moreover, enactment of the Healthcare Reform Act has been controversial and has prompted numerous legal challenges to its constitutionality as well as efforts to modify or repeal the law now under consideration in Congress. As a result, we cannot predict with any assurance the ultimate effect of the Healthcare Reform Act on our Company, nor can we provide any assurance that its provisions will not have a material adverse effect on our business, financial condition, results of operations or cash flows.
Expanding eligibility of government-sponsored programs could adversely effect our reimbursement.
In February 2009, Congress reauthorized the State Children’s Health Insurance Program (“SCHIP”) through September 2013 and expanded its eligibility coverage. Further expansion of SCHIP eligibility and the Healthcare Reform Act’s expansion of Medicaid coverage could cause patients who otherwise would have participated in private healthcare insurance programs to participate in government-sponsored programs. Additional reform efforts could change the eligibility requirements for Medicaid and for other government-sponsored programs and could increase the number of patients who participate in such programs or the number of uninsured patients. Payments received from government-sponsored programs are substantially less than payments received from managed care and other third-party payors. A payor mix shift from managed care and other third-party payors to government payors may result in an increase in our estimated provision for contractual adjustments and uncollectibles and a corresponding decrease in our net patient service revenue. Further increases in the government component of our payor mix at the expense of other third-party payors could also result in a significant reduction in our average reimbursement rates.
Government programs or private insurers may limit, reduce or make retroactive adjustments to reimbursement amounts or rates.
A significant portion of our net patient revenue is derived from payments made by government-sponsored healthcare programs, principally Medicaid. These government programs, as well as private insurers, have taken and may continue to take steps, including a movement toward increased use of managed care organizations, value-based purchasing, and new patient care models, to control the cost, eligibility for, use and delivery of healthcare services as a result of budgetary constraints and cost containment pressures due to unfavorable economic conditions, rising healthcare costs and for other reasons, including those described above under Item 1. Business—“Government Regulation—Government Reimbursement Requirements.” These government programs and private insurers may attempt other measures to control costs including bundling of services and denial of or reduction in reimbursement for certain services and treatments. As a result, payments from government programs or private payors may decrease significantly. Also, any adjustment in Medicare reimbursement rates may have a detrimental impact on our reimbursement rates not only for Medicare patients but also because Medicaid and other third-party payors often base their reimbursement rates on a percentage of Medicare reimbursement rates. Our business also may be materially affected by limitations on or reductions in reimbursement amounts or rates or elimination of coverage for certain individuals or treatments. Moreover, because government programs generally provide for reimbursements on a fee-schedule basis rather than on a charge-related basis, we generally cannot increase our revenues from these programs by increasing the amount we charge for our services. To the extent our costs increase, we may not be able to recover our increased costs from these programs, and cost containment measures and market changes in non-governmental insurance plans have generally restricted our ability to recover, or shift to non-governmental payors, these increased costs. In addition, funds we receive from third-party payors are subject to audit with respect to the proper billing for physician and ancillary services and, accordingly, our revenue from these programs may be adjusted retroactively. Any retroactive adjustments to our reimbursement amounts could have a material effect on our financial condition, results of operations, cash flows and the trading price of our common stock.
25
Table of Contents
In addition, Medicare reimbursement rates could be reduced due to formulaic rules. Presently, Medicare pays for all physician services based upon a national fee schedule which contains a list of uniform rates. The payment rates under the fee schedule are determined based on national uniform relative value units for the services provided, a geographic adjustment factor and a conversion factor. The fee schedule is adjusted annually based on a complex formula that is linked in part to the use of services by Medicare beneficiaries and the growth in gross domestic product. Since 2002, this formula has resulted in negative payment updates under the fee schedule that have grown increasingly larger, and Congress has had to take repeated legislative action to reverse scheduled payment reductions, most recently in December 2010, when legislation was enacted to avert a 25% rate reduction and extend existing Medicare physician payment rates through the end of 2011. If Congress does not take further action, the Medicare fee schedule will be reduced by approximately 25% effective January 1, 2012. Fee reductions will continue to be scheduled annually and will grow to approximately 40% in cumulative reductions by 2016 unless Congress takes action in the future to modify or reform the mechanism by which payment rates are updated. If no action is taken, reductions in the fee schedule could have a material adverse effect on our financial condition, results of operations, cash flows and the trading price of our common stock.
We may become subject to billing investigations by federal and state government authorities.
State and federal statutes impose substantial penalties, including civil and criminal fines, exclusion from participation in government healthcare programs and imprisonment, on entities or individuals (including any individual corporate officers or physicians deemed responsible) that fraudulently or wrongfully bill governmental or other third-party payors for healthcare services. In addition, federal laws, along with a growing number of state laws, allow a private person to bring a civil action in the name of the government for false billing violations. See Item 1. Business—“Government Regulation—Fraud and Abuse Provisions.” In September 2006, we entered into a settlement agreement with the DOJ that sets forth the terms of a financial settlement related to an investigation by federal and state authorities into our coding and billing practices for the period of time from 1996 through 1999 for neonatal critical care and intensive care services reimbursed by the Medicaid program nationwide, the Federal Employees Health Benefits Program and the TRICARE program. As part of the financial settlement with the DOJ, we entered into the Corporate Integrity Agreement with the OIG for a term of five years. The Corporate Integrity Agreement imposes yearly compliance and audit obligations upon us. We believe that additional audits, inquiries and investigations from government agencies will continue to occur from time to time in the ordinary course of our business, which could result in substantial defense costs to us and a diversion of management’s time and attention. We cannot predict whether any future audits, inquiries or investigations, or the public disclosure of such matters, would have a material adverse effect on our business, financial condition, results of operations, cash flows and the trading price of our common stock. See Item 1. Business—“Government Investigations.”
The healthcare industry is highly regulated, and government authorities may determine that we have failed to comply with applicable laws or regulations.
The healthcare industry and physicians’ medical practices, including the healthcare and other services that we and our affiliated physicians provide, are subject to extensive and complex federal, state and local laws and regulations, compliance with which imposes substantial costs on us. Of particular importance are:
| • | federal laws (including the federal False Claims Act) that prohibit entities and individuals from knowingly or recklessly making claims to Medicaid, Medicare and other government programs that contain false or fraudulent information or from improperly retaining known overpayments; |
| • | a provision of the Social Security Act, commonly referred to as the “anti-kickback” law, that prohibits the knowing and willful offer, payment, solicitation or receipt of any bribe, kickback, rebate or other remuneration, in cash or in kind, in return for the referral or recommendation of patients for items and services covered, in whole or in part, by federal healthcare programs, such as Medicaid and Medicare; |
| • | a provision of the Social Security Act, commonly referred to as the Stark Law, that, subject to limited exceptions, prohibits physicians from referring Medicare patients to an entity for the provision of |
26
Table of Contents
| certain “designated health services” if the physician or a member of such physician’s immediate family has a direct or indirect financial relationship (including a compensation arrangement) with the entity; |
| • | similar state law provisions pertaining to anti-kickback, fee splitting, self-referral and false claims issues, which typically are not limited to relationships involving federal payors; |
| • | provisions of HIPAA that prohibit knowingly and willfully executing a scheme or artifice to defraud a healthcare benefit program or falsifying, concealing or covering up a material fact or making any material false, fictitious or fraudulent statement in connection with the delivery of or payment for healthcare benefits, items or services; |
| • | state laws that prohibit general business corporations from practicing medicine, controlling physicians’ medical decisions or engaging in certain practices, such as splitting fees with physicians; |
| • | federal and state laws that prohibit providers from billing and receiving payment from Medicaid or Medicare for services unless the services are medically necessary, adequately and accurately documented and billed using codes that accurately reflect the type and level of services rendered; |
| • | federal and state laws pertaining to the provision of services by non-physician practitioners, such as advanced nurse practitioners, physician assistants and other clinical professionals, physician supervision of such services and reimbursement requirements that may be dependent on the manner in which the services are provided and documented; and |
| • | federal laws that impose civil administrative sanctions for, among other violations, inappropriate billing of services to federally funded healthcare programs, inappropriately reducing hospital care lengths of stay for such patients, or employing individuals who are excluded from participation in federally funded healthcare programs. |
In addition, we believe that our business will continue to be subject to increasing regulation, the scope and effect of which we cannot predict. See Item 1. Business—“Government Regulation.”
We may in the future become the subject of regulatory or other investigations or proceedings, and our interpretations of applicable laws, rules and regulations may be challenged. For example, regulatory authorities or other parties may assert that our arrangements with our affiliated professional contractors constitute fee splitting or the corporate practice of medicine and seek to invalidate these arrangements, which could have a material adverse effect on our business, financial condition, results of operations, cash flows and the trading price of our common stock. See Item 1. Business—“Government Regulation—Fee Splitting; Corporate Practice of Medicine.” Regulatory authorities or other parties also could assert that our relationships, including fee arrangements, among our affiliated professional contractors, hospital clients or referring physicians violate the anti-kickback, fee splitting or self-referral laws and regulations. See Item 1. Business—“Government Regulation—Fraud and Abuse Provisions” and “—Government Reimbursement Requirements.” Such investigations, proceedings and challenges could result in substantial defense costs to us and a diversion of management’s time and attention. In addition, violations of these laws are punishable by monetary fines, civil and criminal penalties, exclusion from participation in government-sponsored healthcare programs, and forfeiture of amounts collected in violation of such laws and regulations, any of which could have a material adverse effect on our business, financial condition, results of operations, cash flows and the trading price of our common stock.
Federal and state laws that protect the privacy and security of patient health information may increase our costs and limit our ability to collect and use that information and subject us to penalties if we are unable to fully comply with such laws.
Numerous federal and state laws and regulations govern the collection, dissemination, use, security and confidentiality of individually identifiable health information. These laws include:
| • | Provisions of HIPAA that limit how healthcare providers may use and disclose individually identifiable health information, provide certain rights to individuals with respect to that information and impose certain security requirements; |
27
Table of Contents
| • | The federal HITECH Act, which strengthens and expands the HIPAA Privacy Standards and Security Standards; |
| • | Other federal and state laws restricting the use and protecting the privacy and security of patient information, many of which are not preempted by HIPAA; |
| • | Federal and state consumer protection laws; and |
| • | Federal and state laws regulating the conduct of research with human subjects. |
As part of our medical record keeping, third-party billing, research and other services, we collect and maintain patient health information in paper and electronic format. New patient health information standards, whether implemented pursuant to HIPAA, the HITECH Act, congressional action or otherwise, could have a significant effect on the manner in which we handle healthcare-related data and communicate with payors, and compliance with these standards could impose significant costs on us or limit our ability to offer services, thereby negatively impacting the business opportunities available to us.
If we do not comply with existing or new laws and regulations related to patient health information we could be subject to monetary fines, civil penalties or criminal sanctions.
Government authorities or other parties may assert that our business practices violate antitrust laws.
The healthcare industry is subject to close antitrust scrutiny. In recent years, the FTC, the DOJ and state Attorneys General have taken increasing steps to review and, in some cases, take enforcement action against business conduct and acquisitions in the healthcare industry. Violations of antitrust laws may be punishable by substantial penalties, including significant monetary fines, civil penalties, criminal sanctions, and consent decrees and injunctions prohibiting certain activities or requiring divestiture or discontinuance of business operations. Any of these penalties could have a material adverse effect on our business, financial condition and results of operations.
Our affiliated physicians may not appropriately record or document services they provide.
Our affiliated physicians are responsible for maintaining sufficient supporting documentation for the services they provide. We use this information to seek reimbursement for their services from third-party payors. If our physicians do not appropriately document, or where applicable, code for their services, we could be subjected to regulatory or criminal investigations or sanctions and our business, financial condition, results of operations and cash flows could be adversely affected.
We may not find suitable acquisition candidates or successfully integrate our acquisitions. Our acquisitions may expose us to greater business risks and could affect our payor mix.
We have expanded and intend to continue to seek to expand our presence in new and existing metropolitan areas for us by acquiring established neonatal, maternal-fetal and pediatric cardiology physician practice groups, other complementary pediatric subspecialty physician groups and anesthesia care practices. We made our first acquisition of an anesthesia care practice in 2007 and have acquired five additional practices since then. Accordingly, this type of physician service is a relatively new specialty for our company.
Our acquisition strategy involves numerous risks and uncertainties, including:
| • | We may not be able to identify suitable acquisition candidates or strategic opportunities or implement successfully or realize the expected benefits of any suitable opportunities. In addition, we compete for acquisitions with other potential acquirers, some of which may have greater financial or operational resources than we do. This competition may intensify due to the ongoing consolidation in the healthcare industry, which may increase our acquisition costs. |
28
Table of Contents
| • | We may not be able to successfully integrate completed acquisitions, including our recent acquisitions. Integrating completed acquisitions into our existing operations involves numerous short-term and long-term risks, including diversion of our management’s attention, failure to retain key personnel, long-term value of acquired intangible assets and acquisition expenses. In addition, we may be required to comply with laws and regulations that may differ from those of the states in which our operations are currently conducted. |
| • | We cannot be certain that any acquired business will continue to maintain its pre-acquisition revenues and growth rates or be financially successful. In addition, we cannot be certain of the extent of any unknown or contingent liabilities of any acquired business, including liabilities for failure to comply with applicable laws, including laws relating to medical malpractice. Generally we obtain indemnification agreements from the sellers of businesses acquired with respect to pre-closing acts, omissions and other similar risks. It is possible that we may seek to enforce indemnification provisions in the future against sellers who may no longer have the financial wherewithal to satisfy their obligations to us. Accordingly, we may incur material liabilities for past activities of acquired businesses. |
| • | We could incur or assume indebtedness and issue equity in connection with acquisitions. The issuance of shares of our common stock for an acquisition may result in dilution to our existing shareholders and, depending on the number of shares that we issue, the resale of such shares could affect the trading price of our common stock. |
| • | We may acquire businesses that derive a greater portion of their revenue from government-sponsored programs than what we recognize on a consolidated basis. These acquisitions could affect our overall payor mix in future periods. |
| • | Acquisitions of practices in anesthesia care could entail financial and operating risks not fully anticipated. Such acquisitions could divert management’s attention and our resources. |
| • | An acquisition could be subject to a challenge under the antitrust laws either before or after it is consummated. Such a challenge could involve substantial legal costs and divert management’s attention and resources and could result in us having to abandon the transaction or make a divestiture. |
Our employees and business partners may not appropriately secure and protect confidential information in their possession.
Each of our employees and business partners is responsible for the security of the information in our systems and to ensure that private and financial information is kept confidential. Should an employee or business partner not follow appropriate security measures it may result in the release of private or confidential financial information. The release of such information could have a material adverse effect on our business, financial condition, results of operations and cash flows.
We may not be able to successfully recruit and retain qualified physicians to serve as affiliated physicians or independent contractors.
We are dependent upon our ability to recruit and retain a sufficient number of qualified physicians to service existing units at hospitals and our affiliated practices and expand our business. We compete with many types of healthcare providers, including teaching, research and government institutions and other practice groups, for the services of qualified physicians. We may not be able to continue to recruit new physicians or renew contracts with existing physicians on acceptable terms. If we do not do so, our ability to service existing or new hospital units and staff existing or new office-based practices could be adversely affected.
A significant number of our affiliated physicians could leave our affiliated practices or our affiliated professional contractors may be unable to enforce the non-competition covenants of departed physicians.
Our affiliated professional contractors usually enter into employment agreements with our affiliated physicians which typically can be terminated without cause by any party upon prior written notice. In addition,
29
Table of Contents
substantially all of our affiliated physicians have agreed not to compete within a specified geographic area for a certain period after termination of employment. The law governing non-compete agreements and other forms of restrictive covenants varies from state to state. Although we believe that the non-competition and other restrictive covenants applicable to our affiliated physicians are reasonable in scope and duration and therefore enforceable under applicable state law, courts and arbitrators in some states are reluctant to strictly enforce non-compete agreements and restrictive covenants against physicians. If a substantial number of our affiliated physicians leave our affiliated practices or our affiliated professional contractors are unable to enforce the non-competition covenants in the employment agreements, our business, financial condition, results of operations and cash flows could be materially adversely affected. We cannot predict whether a court or arbitration panel would enforce these covenants.
We may be subject to medical malpractice and other lawsuits not covered by insurance.
Our business entails an inherent risk of claims of medical malpractice against our affiliated physicians and us. We may also be subject to other lawsuits which may involve large claims and significant defense costs. Although we currently maintain liability insurance coverage intended to cover professional liability and other claims, there can be no assurance that our insurance coverage will be adequate to cover liabilities arising out of claims asserted against us where the outcomes of such claims are unfavorable to us. Generally, we self-insure our liabilities to pay retention amounts for professional liability matters through a wholly owned captive insurance subsidiary. Liabilities in excess of our insurance coverage, including coverage for professional liability and other claims, could have a material adverse effect on our business, financial condition, results of operations, cash flows and the trading price of our common stock. See Item 1. Business—“Other Legal Proceedings” and “Professional and General Liability Coverage.”
The reserves that we have established in respect of our professional liability losses are subject to inherent uncertainties and if a deficiency is determined this may lead to a reduction in our net earnings.
We have established reserves for losses and related expenses that represent estimates involving actuarial projections, at a given point in time, of our expectations of the ultimate resolution and administration of costs of losses incurred with respect to professional liability risks for the amount of risk retained by us. Insurance reserves are inherently subject to uncertainty. Our reserve estimates are based on actuarial valuations using historical claims, demographic factors, industry trends, severity and exposure factors and other actuarial assumptions. The estimates of projected ultimate losses are developed at least annually. Our reserves could be significantly affected should current and future occurrences differ from historical claim trends and expectations. While claims are monitored closely when estimating reserves, the complexity of the claims and wide range of potential outcomes often hampers timely adjustments to the assumptions used in these estimates. Actual losses and related expenses may deviate, perhaps substantially, from the reserve estimates reflected in our financial statements. If our estimated reserves are determined to be inadequate, we will be required to increase reserves at the time the deficiency is determined. See Item 7. Management’s Discussion and Analysis of Financial Condition and Results of Operations—“Application of Critical Accounting Policies and Estimates—Professional Liability Coverage.”
We may write-off intangible assets, such as goodwill.
Our intangible assets, which consist primarily of goodwill related to our acquisitions, are subject to annual impairment testing. Under current accounting standards, goodwill is tested for impairment on an annual basis and we may be subject to impairment losses as circumstances change after an acquisition. If we record an impairment loss related to our goodwill, it could have a material adverse effect on our results of operations for the year in which the impairment is recorded.
We may not effectively manage our growth.
We have experienced rapid growth in our business and number of our employees and affiliated physicians in recent years which places significant demands on our financial, operational and management resources.
30
Table of Contents
Continued rapid growth may impair our ability to provide our services efficiently and to manage our employees adequately. While we are taking steps to manage our growth, our future results of operations could be materially adversely affected if we are unable to do so effectively.
We may not be able to maintain effective and efficient information systems.
Our operations are dependent on uninterrupted performance of our information systems. Failure to maintain reliable information systems, disruptions in our existing information systems or the implementation of new systems could cause disruptions in our business operations, including errors and delays in billings and collections, difficulty satisfying requirements under hospital contracts, disputes with patients and payors, violations of patient privacy and confidentiality requirements and other regulatory requirements, increased administrative expenses and other adverse consequences, any or all of which could have a material adverse effect on our business, financial condition and results of operations.
Our quarterly results will likely fluctuate from period to period.
We have historically experienced and expect to continue to experience quarterly fluctuations in net patient service revenue and net income. For example, we typically experience negative cash flow from operations in the first quarter of each year, principally as a result of bonus payments to affiliated physicians. In addition, a significant number of our employees and associated professional contractors (primarily affiliated physicians) exceed the level of taxable wages for social security during the first and second quarters. As a result, we incur a significantly higher payroll tax burden and our net income is lower during those quarters. Moreover, a lower number of calendar days are present in the first and second quarters of the year as compared to the remainder of the year. Because we provide services in the NICU on a 24- hours-a-day basis, 365 days a year, any reduction in service days will have a corresponding reduction in net patient service revenue. We also have significant fixed operating costs, including costs for our affiliated physicians, and as a result, are highly dependent on patient volume and capacity utilization of our affiliated physicians to sustain profitability. Quarterly results may also be impacted by the timing of acquisitions and any fluctuation in patient volume. As a result, our results of operations for any quarter are not indicative of results of operations for any future period or full fiscal year.
The value of our common stock may fluctuate.
There has been significant volatility in the market price of securities of healthcare companies generally that we believe in many cases has been unrelated to operating performance. In addition, we believe that certain factors, such as legislative and regulatory developments, including announced regulatory investigations, quarterly fluctuations in our actual or anticipated results of operations, lower revenues or earnings than those anticipated by securities analysts, and general economic and financial market conditions, could cause the price of our common stock to fluctuate substantially.
We may not be able to collect reimbursements for our services from third-party payors in a timely manner.
A significant portion of our net patient service revenue is derived from reimbursements from various third-party payors, including government-sponsored healthcare plans, private insurance plans and managed care plans, for services provided by our affiliated professional contractors. We are responsible for submitting reimbursement requests to these payors and collecting the reimbursements, and we assume the financial risks relating to uncollectible and delayed reimbursements. In the current healthcare environment, payors continue their efforts to control expenditures for healthcare, including revisions to coverage and reimbursement policies. Due to the nature of our business and our participation in government and private reimbursement programs, we are involved from time to time in inquiries, reviews, audits and investigations by governmental agencies and private payors of our business practices, including assessments of our compliance with coding, billing and documentation requirements. We may be required to repay these agencies or private payors if a finding is made that we were
31
Table of Contents
incorrectly reimbursed, or we may be subjected to pre-payment reviews, which can be time-consuming and result in non-payment or delayed payment for the services we provide. We may also experience difficulties in collecting reimbursements because third-party payors may seek to reduce or delay reimbursements to which we are entitled for services that our affiliated physicians have provided. If we are not reimbursed fully and in a timely manner for such services or there is a finding that we were incorrectly reimbursed, our revenue, cash flows and financial condition could be materially adversely affected.
In addition, declining economic conditions could affect the timeliness and amounts received from our third-party and government payors which would impact our short-term liquidity needs.
Hospitals may terminate their agreements with us, our physicians may lose the ability to provide services in hospitals or administrative fees paid to us by hospitals may be reduced.
Our net patient service revenue is derived primarily from fee-for-service billings for patient care provided within hospital units by our affiliated physicians and from administrative fees paid to us by hospitals. See Item 1. Business—“Relationships with Our Partners—Hospitals.” Our hospital partners may cancel or not renew their contracts with us, reduce or eliminate our administrative fees in the future, or refuse to pay us our administrative fees if we fail to honor the terms of our agreement. Declining economic conditions could influence future actions of our hospital partners. To the extent that our arrangements with our hospital partners are canceled, or are not renewed or replaced with other arrangements having at least as favorable terms, our business, financial condition and results of operations could be adversely affected. In addition, to the extent our affiliated physicians lose their privileges in hospitals or hospitals enter into arrangements with other physicians, our business, financial condition, results of operations and cash flows could be materially adversely affected.
Hospitals could limit our ability to use our management information systems in our units by requiring us to use their own management information systems.
Our management information systems, including BabySteps® are used to support our day-to-day operations and ongoing clinical research and business analysis. If a hospital prohibits us from using our own management information systems, it may interrupt the efficient operation of our information systems which, in turn, may limit our ability to operate important aspects of our business, including billing and reimbursement as well as research and education initiatives. This inability to use our management information systems at hospital locations may have a material adverse effect on our business, financial condition, results of operations and cash flows.
Our industry is already competitive and could become more competitive.
The healthcare industry is highly competitive and subject to continual changes in the methods by which services are provided and the manner in which healthcare providers are selected and compensated. Because our operations consist primarily of physician services provided within hospital-based units, we compete with other healthcare services companies and physician groups for contracts with hospitals to provide our services to patients. We also face competition from hospitals themselves to provide our services. Companies in other healthcare industry segments, some of which have greater financial and other resources than ours, may become competitors in providing neonatal, maternal-fetal, pediatric subspecialty care or anesthesia care. We may not be able to continue to compete effectively in this industry, additional competitors may enter metropolitan areas where we operate, and this increased competition may have a material adverse effect on our business, financial condition, results of operations and cash flows.
Unfavorable changes or conditions could occur in the states where our operations are concentrated.
A majority of our net patient service revenue in 2010 was generated by our operations in five states. In particular, Texas accounted for approximately 22% of our net patient service revenue in 2010. See Item 1. Business—“Geographic Coverage.” Adverse changes or conditions affecting these particular states, such as
32
Table of Contents
healthcare reforms, changes in laws and regulations, reduced Medicaid reimbursements and government investigations, economic conditions and natural disasters may have a material adverse effect on our business, financial condition, results of operations and cash flows.
We are dependent upon our key management personnel for our future success.
Our success depends to a significant extent on the continued contributions of our key management personnel, including our Chief Executive Officer, Roger J. Medel, M.D., for the management of our business and implementation of our business strategy. The loss of Dr. Medel or other key management personnel could have a material adverse effect on our business, financial condition, results of operations, cash flows and the trading price of our common stock.
Provisions of our articles and bylaws could deter takeover attempts.
Our Amended and Restated Articles of Incorporation authorize our board of directors to issue up to 1,000,000 shares of undesignated preferred stock and to determine the powers, preferences and rights of these shares without shareholder approval. This preferred stock could be issued with voting, liquidation, dividend and other rights superior to those of the holders of common stock. The issuance of preferred stock under some circumstances could have the effect of delaying, deferring or preventing a change in control. In addition, provisions in our amended and restated articles of incorporation and bylaws, including those relating to calling shareholder meetings, taking action by written consent and other matters, could render it more difficult or discourage an attempt to obtain control of MEDNAX through a proxy contest or consent solicitation. These provisions could limit the price that some investors might be willing to pay in the future for our shares of common stock.
| ITEM 1B. | UNRESOLVED STAFF COMMENTS |
None.
| ITEM 2. | PROPERTIES |
Our corporate office building, which we own, is located in Sunrise, Florida and contains 80,000 square feet of office space. We also lease space covering an additional 33,000 square feet for other corporate administrative functions in Sunrise, Florida. This space and the space in hospitals and other facilities which we lease for our business and medical offices, and other needs, had an aggregate annual rent of approximately $19.8 million in 2010. See Note 15 to the Consolidated Financial Statements in this Form 10-K, which is incorporated herein by reference. We believe that our facilities and the equipment used in our business are in good condition, in all material respects, and sufficient for our present needs. We continue to evaluate opportunities for additional facilities to accommodate future growth and expansion.
| ITEM 3. | LEGAL PROCEEDINGS |
The information required by this Item is included in and incorporated herein by reference to Item 1. Business of this Form 10-K under “Government Investigations” and “Other Legal Proceedings.”
| ITEM 4. | (REMOVED AND RESERVED) |
33
Table of Contents
PART II
| ITEM 5. | MARKET FOR REGISTRANT’S COMMON EQUITY, RELATED STOCKHOLDER MATTERS AND ISSUER PURCHASES OF EQUITY SECURITIES |
Price Range of Common Stock
Our common stock is traded on the New York Stock Exchange (the “NYSE”) under the symbol “MD.” The high and low sales prices for a share of our common stock for each quarter during our last two fiscal years are set forth below:
| High | Low | |||||||
| 2010 |
||||||||
| First Quarter |
$ | 61.60 | $ | 50.15 | ||||
| Second Quarter |
61.27 | 53.67 | ||||||
| Third Quarter |
55.67 | 44.83 | ||||||
| Fourth Quarter |
69.38 | 52.23 | ||||||
| 2009 |
||||||||
| First Quarter |
$ | 40.99 | $ | 24.51 | ||||
| Second Quarter |
45.99 | 28.34 | ||||||
| Third Quarter |
55.17 | 41.46 | ||||||
| Fourth Quarter |
61.48 | 51.22 | ||||||
As of February 18, 2011, we had 249 holders of record of our common stock, and the closing sales price on that date for our common stock was $65.54 per share. We believe that the number of beneficial owners of our common stock is greater than the number of record holders because a significant number of shares of our common stock is held through brokerage firms in “street name.”
Dividend Policy
We did not declare or pay any cash dividends on our common stock in 2010 or 2009, nor do we currently intend to declare or pay any cash dividends in the future. The payment of any future dividends will be at the discretion of our Board of Directors and will depend upon, among other things, future earnings, results of operations, capital requirements, our general financial condition, general business conditions and contractual restrictions on payment of dividends, if any, as well as such other factors as our Board of Directors may deem relevant. Our revolving line of credit restricts our ability to declare and pay cash dividends. See Item 7. Management’s Discussion and Analysis of Financial Condition and Results of Operations—“Liquidity and Capital Resources.”
34
Table of Contents
Performance Graph
The following graph compares the cumulative total shareholder return on $100 invested on December 31, 2005 in our common stock against the cumulative total return of the S&P 500 Index, S&P 600 Health Care Index, and the NYSE Composite Index. The returns are calculated assuming reinvestment of dividends. The graph covers the period from December 31, 2005 through December 31, 2010 and gives effect to a two-for-one stock split effective April 27, 2006. The stock price performance included in the graph is not necessarily indicative of future stock price performance.
The performance graph shall not be deemed incorporated by reference by any general statement incorporating by reference this annual report into any filing under the Securities Act of 1933 or the Securities Exchange Act of 1934, except to the extent that we specifically incorporate this information by reference, and shall not otherwise be deemed filed under such acts.
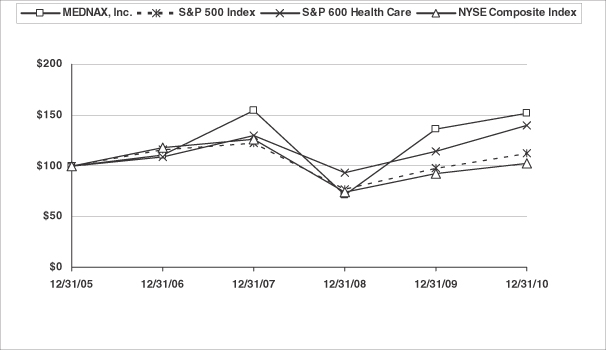
| Company/Index |
Base
Period 2005 |
Years Ending | ||||||||||||||||||||||
| 2006 | 2007 | 2008 | 2009 | 2010 | ||||||||||||||||||||
| MEDNAX, Inc. |
$ | 100.00 | $ | 110.42 | $ | 153.89 | $ | 71.58 | $ | 135.73 | $ | 151.95 | ||||||||||||
| S&P 500 Index |
$ | 100.00 | $ | 115.79 | $ | 122.16 | $ | 76.96 | $ | 97.33 | $ | 111.99 | ||||||||||||
| S&P 600 Health Care |
$ | 100.00 | $ | 108.73 | $ | 129.34 | $ | 92.77 | $ | 113.71 | $ | 139.32 | ||||||||||||
| NYSE Composite Index |
$ | 100.00 | $ | 117.86 | $ | 125.62 | $ | 74.25 | $ | 92.66 | $ | 102.71 | ||||||||||||
Issuer Purchases of Equity Securities
During the three months ended December 31, 2010, we did not repurchase any shares of our securities.
Recent Sales of Unregistered Securities
During the three months ended December 31, 2010, we did not sell any unregistered shares of our securities.
Equity Compensation Plans
Information regarding equity compensation plans is set forth in Item 12 of this Form 10-K and is incorporated herein by reference.
35
Table of Contents
| ITEM 6. | SELECTED FINANCIAL DATA |
The following table includes selected consolidated financial data set forth as of and for each of the five years in the period ended December 31, 2010. The balance sheet data at December 31, 2010 and 2009, and the income statement data for the years ended December 31, 2010, 2009 and 2008, have been derived from the Consolidated Financial Statements included in this Form 10-K. This selected financial data should be read in conjunction with “Management’s Discussion and Analysis of Financial Condition and Results of Operations,” and our Consolidated Financial Statements and the related notes included in Items 7 and 8, respectively, of this Form 10-K (in thousands, except per share and other operating data).
| Years Ended December 31, | ||||||||||||||||||||
| 2010 | 2009 | 2008 | 2007 | 2006 | ||||||||||||||||
| Consolidated Income Statement Data: |
||||||||||||||||||||
| Net patient service revenue (1) |
$ | 1,401,559 | $ | 1,288,264 | $ | 1,068,277 | $ | 917,644 | $ | 804,696 | ||||||||||
| Operating expenses: |
||||||||||||||||||||
| Practice salaries and benefits |
854,920 | 783,493 | 643,445 | 533,306 | 466,168 | |||||||||||||||
| Practice supplies and other operating expenses |
57,511 | 52,232 | 44,767 | 34,078 | 29,247 | |||||||||||||||
| General and administrative expenses |
154,267 | 147,162 | 124,965 | 119,766 | 106,786 | |||||||||||||||
| Depreciation and amortization |
21,950 | 16,448 | 13,071 | 9,594 | 8,084 | |||||||||||||||
| Total operating expenses |
1,088,648 | 999,335 | 826,248 | 696,744 | 610,285 | |||||||||||||||
| Income from operations |
312,911 | 288,929 | 242,029 | 220,900 | 194,411 | |||||||||||||||
| Investment income |
1,434 | 1,682 | 2,982 | 6,855 | 3,836 | |||||||||||||||
| Interest expense |
(3,193 | ) | (2,911 | ) | (3,593 | ) | (749 | ) | (1,032 | ) | ||||||||||
| Income from continuing operations before income taxes |
311,152 | 287,700 | 241,418 | 227,006 | 197,215 | |||||||||||||||
| Income tax provision |
108,461 | 111,896 | 94,736 | 86,987 | 75,107 | |||||||||||||||
| Income from continuing operations |
202,691 | 175,804 | 146,682 | 140,019 | 122,108 | |||||||||||||||
| Income from discontinued operations, net of income taxes (2) |
— | — | 22,519 | 2,703 | 2,357 | |||||||||||||||
| Net income |
$ | 202,691 | $ | 175,804 | $ | 169,201 | $ | 142,722 | $ | 124,465 | ||||||||||
| Per Common and Common Equivalent Share Data: |
||||||||||||||||||||
| Income from continuing operations: |
||||||||||||||||||||
| Basic |
$ | 4.35 | $ | 3.86 | $ | 3.18 | $ | 2.89 | $ | 2.55 | ||||||||||
| Diluted |
$ | 4.26 | $ | 3.78 | $ | 3.11 | $ | 2.81 | $ | 2.47 | ||||||||||
| Income from discontinued operations: |
||||||||||||||||||||
| Basic |
$ | — | $ | — | $ | 0.49 | $ | 0.06 | $ | 0.05 | ||||||||||
| Diluted |
$ | — | $ | — | $ | 0.48 | $ | 0.05 | $ | 0.05 | ||||||||||
| Net income per common share: |
||||||||||||||||||||
| Basic |
$ | 4.35 | $ | 3.86 | $ | 3.67 | $ | 2.95 | $ | 2.60 | ||||||||||
| Diluted |
$ | 4.26 | $ | 3.78 | $ | 3.59 | $ | 2.86 | $ | 2.52 | ||||||||||
| Weighted average shares: |
||||||||||||||||||||
| Basic |
46,630 | 45,573 | 46,121 | 48,458 | 47,924 | |||||||||||||||
| Diluted |
47,570 | 46,471 | 47,161 | 49,904 | 49,387 | |||||||||||||||
36
Table of Contents
| Years Ended December 31, | ||||||||||||||||||||
| 2010 | 2009 | 2008 | 2007 | 2006 | ||||||||||||||||
| Other Operating Data: |
||||||||||||||||||||
| Number of physicians at end of year |
1,675 | 1,484 | 1,274 | 1,072 | 914 | |||||||||||||||
| Number of births |
736,191 | 744,202 | 730,049 | 707,274 | 674,336 | |||||||||||||||
| NICU admissions |
93,310 | 90,567 | 86,865 | 85,059 | 80,151 | |||||||||||||||
| NICU patient days |
1,710,904 | 1,658,845 | 1,566,485 | 1,556,093 | 1,472,428 | |||||||||||||||
| Consolidated Balance Sheet Data: |
||||||||||||||||||||
| Cash and cash equivalents |
$ | 26,251 | $ | 26,503 | $ | 14,346 | $ | 102,843 | $ | 69,595 | ||||||||||
| Working capital (deficit) |
(24,838 | ) | (54,039 | ) | (32,224 | ) | 99,239 | 80,284 | ||||||||||||
| Total assets |
2,037,646 | 1,689,350 | 1,496,874 | 1,302,802 | 1,135,170 | |||||||||||||||
| Total liabilities |
590,192 | 499,252 | 531,736 | 343,750 | 269,369 | |||||||||||||||
| Borrowings under line of credit |
146,500 | 50,000 | 139,500 | — | — | |||||||||||||||
| Capital lease obligations, including current maturities |
181 | 443 | 614 | 924 | 860 | |||||||||||||||
| Shareholders’ equity |
1,447,454 | 1,190,098 | 965,138 | 959,052 | 865,801 | |||||||||||||||
| (1) | We add new physician practices each year as a result of acquisitions. The increase in net patient service revenue related to acquisitions was approximately $96.6 million, $169.5 million, $122.8 million, $42.2 million, and $45.8 million for the years ended December 31, 2010, 2009, 2008, 2007, and 2006, respectively. |
| (2) | In 2008, we completed the sale of our newborn metabolic screening laboratory business in a cash transaction for $68.3 million and recorded a gain on the sale, net of income taxes, of $22.0 million. The results of operations related to the laboratory business have been reported separately as income from discontinued operations, net of income taxes, for the years ended December 31, 2008 and earlier. |
37
Table of Contents
| ITEM 7. | MANAGEMENT’S DISCUSSION AND ANALYSIS OF FINANCIAL CONDITION AND RESULTS OF OPERATIONS |
The following discussion highlights the principal factors that have affected our financial condition and results of operations as well as our liquidity and capital resources for the periods described. This discussion should be read in conjunction with our Consolidated Financial Statements and the related notes included in Item 8 of this Form 10-K. This discussion contains forward-looking statements. Please see the explanatory note concerning “Forward-Looking Statements” preceding Part I of this Form 10-K and Item 1A. Risk Factors for a discussion of the uncertainties, risks and assumptions associated with these forward-looking statements. The operating results for the periods presented were not significantly affected by inflation.
OVERVIEW
MEDNAX is a leading provider of physician services including newborn, maternal-fetal, pediatric subspecialty, and anesthesia care. At December 31, 2010, our national network was composed of 1,675 affiliated physicians, including 968 physicians who provide neonatal clinical care in 33 states and Puerto Rico, primarily within hospital-based neonatal intensive care units, to babies born prematurely or with medical complications. We have 172 affiliated physicians who provide maternal-fetal and obstetrical medical care to expectant mothers experiencing complicated pregnancies primarily in areas where our affiliated neonatal physicians practice. Our network includes other pediatric subspecialists, including 104 physicians providing pediatric cardiology care, 84 physicians providing pediatric intensive care and 39 physicians providing hospital-based pediatric care. In addition, we have 308 physicians who provide anesthesia care to patients in connection with surgical and other procedures as well as pain management.
During the year ended December 31, 2010, we continued our expansion into anesthesia care with the acquisition of two established practices, bringing the number of anesthesia groups acquired since 2007 to six. We also focused on the integration of previously acquired practices and the continuing development of the infrastructure to support those practices. Our national network of physicians and clinical professionals now includes 308 anesthesiologists and 417 advanced practice anesthetists who provide services in six metropolitan areas. We continue to believe that there are additional opportunities to apply our administrative expertise in this practice area, and we intend to pursue the acquisition of additional anesthesia practices in 2011.
In total, we completed the acquisition of 15 physician group practices during the year ended December 31, 2010. These acquisitions consisted of eight neonatal practices, two maternal-fetal medicine practices, one pediatric cardiology practice, two other pediatric practices, and two anesthesiology practices. Based on our experience, we expect that we can improve the results of these practices through improved managed care contracting, improved collections, identification of growth initiatives, as well as, operating and cost savings based upon the significant infrastructure that we have developed.
We have an unsecured $350 million revolving credit facility (“Line of Credit”) that matures in 2013. The Line of Credit provides a funding source for future acquisitions, as well as other corporate purposes. The Line of Credit is guaranteed by substantially all of our subsidiaries and includes a $50 million sub-facility for the issuance of letters of credit and a $25 million sub-facility for swingline loans. In addition, the Line of Credit may be increased to $400 million subject to the satisfaction of specified conditions.
The United States is continuing to be affected by unfavorable economic conditions, and the number of unemployed workers remains significant. During 2010, our business continued to be affected by a shift toward a higher percentage of patient services being reimbursed under government-sponsored healthcare programs. If economic conditions do not improve or deteriorate further, there could be additional shifts toward government-sponsored programs and patient volumes could decline. In addition, many states are continuing to experience lower than anticipated revenue and are facing significant budget shortfalls. These shortfalls could lead to reduced or delayed funding for state Medicaid programs and, in turn, reduced or delayed reimbursement for physician services. See Item 1A, Risk Factors, in this Form 10-K for additional discussion on the general economic
38
Table of Contents
conditions in the United States and recent developments in the healthcare industry that could affect our business. Payments received from government-sponsored programs are substantially less for equivalent services than payments received from commercial insurance payors.
In March 2010, the “Patient Protection and Affordable Care Act,” (the “Healthcare Reform Act”), was enacted. The Healthcare Reform Act contains a number of provisions that could affect us over the next several years. These provisions include establishing health insurance exchanges to facilitate the purchase of qualified health plans, expanding Medicaid eligibility, subsidizing insurance premiums and creating incentives for businesses to provide healthcare benefits. Other provisions contain changes to healthcare fraud and abuse laws and expand the scope of the Federal False Claims Act.
Many of the Healthcare Reform Act’s most significant reforms do not take effect until 2014 and thereafter, and their details will be shaped significantly by implementing regulations that have yet to be proposed. Moreover, enactment of the Healthcare Reform Act has been controversial and has prompted numerous legal challenges to its constitutionality as well as efforts to modify or repeal the law now under consideration in Congress. As a result, we cannot predict with any assurance the ultimate effect of the Healthcare Reform Act on our Company, nor can we provide any assurance that its provisions will not have a material adverse effect on our business, financial condition, results of operations or cash flows.
Geographic Coverage
During 2010, 2009 and 2008, approximately 55%, 56% and 56%, respectively, of our net patient service revenue was generated by operations in our five largest states. During 2010, our five largest states consisted of Texas, North Carolina, Georgia, Florida, and Washington. During 2009, our five largest states consisted of Texas, Georgia, Florida, North Carolina and Virginia. During 2008, our five largest states consisted of Texas, Florida, Georgia, Virginia and Arizona. During 2010, our concentration of net patient service revenue increased in North Carolina and Washington primarily as a result of physician practice acquisitions. During 2010, 2009 and 2008, our operations in Texas accounted for approximately 22%, 24% and 26%, respectively, of our net patient service revenue.
Payor Mix
We bill payors for professional services provided by our affiliated physicians to our patients based upon rates for specific services provided. Our billed charges are substantially the same for all parties in a particular geographic area regardless of the party responsible for paying the bill for our services. We determine our net patient service revenue based upon the difference between our gross fees for services and our estimated ultimate collections from payors. Net patient service revenue differs from gross fees due to (i) managed care payments at contracted rates, (ii) government-sponsored healthcare program reimbursements at government-established rates, (iii) various reimbursement plans and negotiated reimbursements from other third-parties, and (iv) discounted and uncollectible accounts of private-pay patients.
Our payor mix is composed of contracted managed care, government, principally Medicaid and Medicare, other third-parties and private-pay patients. We benefit from the fact that most of the medical services provided in the NICU are classified as emergency services, a category typically classified as a covered service by managed care payors.
39
Table of Contents
The following is a summary of our payor mix, expressed as a percentage of net patient service revenue, exclusive of administrative fees, for the periods indicated:
| Years Ended December 31, | ||||||||||||
| 2010 | 2009 | 2008 | ||||||||||
| Contracted managed care |
67 | % | 66 | % | 65 | % | ||||||
| Government |
25 | % | 26 | % | 26 | % | ||||||
| Other third-parties |
7 | % | 7 | % | 8 | % | ||||||
| Private-pay patients |
1 | % | 1 | % | 1 | % | ||||||
| 100 | % | 100 | % | 100 | % | |||||||
The payor mix shown in the table above is not necessarily representative of the amount of services provided to patients covered under these plans. For example, the gross amount billed to patients covered under government programs for the years ended December 31, 2010, 2009 and 2008 represented approximately 54%, 53% and 52%, respectively, of our total gross patient service revenue. These percentages of gross revenue and the percentages of net revenue provided in the table above include the payor mix impact of acquisitions completed through December 31, 2010. On a same-unit basis, however, the gross amount billed to patients covered under government programs for the years ended December 31, 2010, 2009 and 2008 represented approximately 56%, 54% and 53%, respectively, of our total gross patient service revenue. Same units are those units at which we provided services for the entire current period and the entire comparable period. The difference between the gross percentage billed to patients covered by government programs for the year ended December 31, 2010 from approximately 54%, on a total company basis, and approximately 56%, on a same-unit basis, is due to the payor mix impact of acquisitions completed since December 31, 2007. These most recent acquisitions have a lower government payor mix percentage than the practices, taken as a whole, that comprised our business as of December 31, 2007.
Quarterly Results
We have historically experienced and expect to continue to experience quarterly fluctuations in net patient service revenue and net income. These fluctuations are primarily due to the following factors:
| • | There are fewer calendar days in the first and second quarters of the year, as compared to the third and fourth quarters of the year. Because we provide services in NICUs on a 24-hours-a-day basis, 365 days a year, any reduction in service days will have a corresponding reduction in net patient service revenue. |
| • | The majority of physician services provided by our office-based and anesthesia practices consist of office visits and scheduled procedures that occur during business hours. As a result, volumes at those practices fluctuate based on the number of business days in each calendar quarter. |
| • | A significant number of our employees and our associated professional contractors, primarily physicians, exceed the level of taxable wages for social security during the first and second quarters of the year. As a result, we incur a significantly higher payroll tax burden and our net income is lower during those quarters. |
We have significant fixed operating costs, including physician compensation, and, as a result, are highly dependent on patient volume and capacity utilization of our affiliated professional contractors to sustain profitability. Additionally, quarterly results may be affected by the timing of acquisitions and fluctuations in patient volume. As a result, the operating results for any quarter are not necessarily indicative of results for any future period or for the full year. Our quarterly results are presented in further detail in Note 16 to the Consolidated Financial Statements in this Form 10-K.
40
Table of Contents
Application of Critical Accounting Policies and Estimates
The preparation of financial statements in conformity with accounting principles generally accepted in the United States (“GAAP”) requires estimates and assumptions that affect the reporting of assets, liabilities, revenue and expenses, and the disclosure of contingent assets and liabilities. Note 2 to our Consolidated Financial Statements provides a summary of our significant accounting policies, which are all in accordance with GAAP. Certain of our accounting policies are critical to understanding our Consolidated Financial Statements because their application requires management to make assumptions about future results and depends to a large extent on management’s judgment, because past results have fluctuated and are expected to continue to do so in the future.
We believe that the application of the accounting policies described in the following paragraphs is highly dependent on critical estimates and assumptions that are inherently uncertain and highly susceptible to change. For all of these policies, we caution that future events rarely develop exactly as estimated, and the best estimates routinely require adjustment. On an ongoing basis, we evaluate our estimates and assumptions, including those discussed below.
Revenue Recognition
We recognize patient service revenue at the time services are provided by our affiliated physicians. Almost all of our patient service revenue is reimbursed by government-sponsored healthcare programs (principally Medicaid) and third-party insurance payors. Payments for services rendered to our patients are generally less than billed charges. We monitor our revenue and receivables from these sources and record an estimated contractual allowance to properly account for the anticipated differences between billed and reimbursed amounts. Accordingly, patient service revenue is presented net of an estimated provision for contractual adjustments and uncollectibles. Management estimates allowances for contractual adjustments and uncollectibles on accounts receivable based upon historical experience and other factors, including days sales outstanding (“DSO”) for accounts receivable, evaluation of expected adjustments and delinquency rates, past adjustments and collection experience in relation to amounts billed, an aging of accounts receivable, current contract and reimbursement terms, changes in payor mix and other relevant information. Contractual adjustments result from the difference between the physician rates for services performed and the reimbursements by government-sponsored healthcare programs and insurance companies for such services. The evaluation of these historical and other factors involves complex, subjective judgments. On a routine basis, we compare our cash collections to recorded net patient service revenue and evaluate our historical allowance for contractual adjustments and uncollectibles based upon the ultimate resolution of the accounts receivable balance. These procedures are completed regularly in order to monitor our process of establishing appropriate reserves for contractual adjustments.
DSO is one of the key factors that we use to evaluate the condition of our accounts receivable and the related allowances for contractual adjustments and uncollectibles. DSO reflects the timeliness of cash collections on billed revenue and the level of reserves on outstanding accounts receivable. Any significant change in our DSO results in additional analyses of outstanding accounts receivable and the associated reserves. We calculate our DSO using a three-month rolling average of net patient service revenue. As of December 31, 2010, our DSO was 45.3 days. We had approximately $603.4 million in gross accounts receivable outstanding at December 31, 2010, and considering this outstanding balance, a one percentage point change in our estimated collection rate would result in an impact to net patient service revenue of approximately $6.0 million.
Our net patient service revenue, net income and operating cash flows may be materially and adversely affected if actual adjustments and uncollectibles exceed management’s estimated provisions as a result of changes in these factors. In addition, we are subject to audits of our billing by government-sponsored healthcare programs and other third-party payors. See Note 15 to our Consolidated Financial Statements in this Form 10-K.
Professional Liability Coverage
We maintain professional liability insurance policies with third-party insurers on a claims-made basis, subject to self-insured retention, exclusions and other restrictions. Our self-insured retention under our professional liability insurance program is maintained primarily through a wholly owned captive insurance
41
Table of Contents
subsidiary. We record liabilities for self-insured amounts and claims incurred but not reported based on an actuarial valuation using historical loss information, claim emergence patterns and various actuarial assumptions. Liabilities for claims incurred but not reported are not discounted. Our actuarial assumptions incorporate multiple complex methodologies to determine the best liability estimate for claims incurred but not reported and the future development of known claims, including methodologies that focus on industry trends, paid loss development, reported loss development and industry-based expected pure premiums. The most significant assumptions used in the estimation process include the use of loss development factors to determine the future emergence of claim liabilities, the use of frequency and trend factors to estimate the impact of economic, judicial and social changes affecting claim costs, and assumptions regarding legal and other costs associated with the ultimate settlement of claims. The key assumptions used in our actuarial valuations are subject to constant adjustments as a result of changes in our actual loss history and the movement of projected emergence patterns as claims develop. The average lag period from the date a claim is reported to the date it reaches final settlement is approximately four years, although the facts and circumstances of individual claims could result in lag periods that vary from this average. Although we evaluate the need for professional liability insurance reserves in excess of amounts estimated in our actuarial valuations on a routine basis, our recorded reserves do not deviate significantly from the provided estimates. Because many factors can affect historical and future loss patterns, the determination of an appropriate professional liability reserve involves complex, subjective judgment, and actual results may vary significantly from estimates.
Goodwill
We record acquired assets, including identifiable intangible assets and liabilities at their respective fair values, recording to goodwill the excess of cost over the fair value of the net assets acquired. We test goodwill for impairment at a reporting unit level on an annual basis. The testing for impairment is completed using a two-step test. The first step compares the fair value of a reporting unit with its carrying amount, including goodwill. If the carrying amount of a reporting unit exceeds its fair value, a second step is performed to determine the amount of any impairment loss. We use income and market-based valuation approaches to determine the fair value of our reporting units. These approaches focus on discounted cash flows and market multiples based on our market capitalization to derive the fair value of a reporting unit. We also consider the economic outlook for the healthcare services industry and various other factors during the testing process, including hospital and physician contract changes, local market developments, changes in third-party payor payments, and other publicly available information.
Uncertain Tax Positions
We account for uncertainty in income taxes in accordance with the accounting guidance for uncertain tax positions. This guidance prescribes a recognition threshold and measurement attribute for financial statement recognition and measurement of a tax position taken or expected to be taken in a tax return. It also requires policy disclosures regarding penalties and interest and disclosures regarding increases and decreases in uncertain tax positions as a result of tax positions taken in a current or prior period, settlements with taxing authorities and any lapse of an applicable statute of limitations. Additional qualitative discussion is required for any tax position that may result in a significant increase or decrease in uncertain tax positions within a 12-month period from our reporting date. Accounting for uncertain tax positions under this guidance requires significant judgment and analyses as well as assumptions about future events. Future changes to our analyses and assumptions related to uncertain tax positions may have a material impact on our Consolidated Financial Statements.
Other Matters
Other significant accounting policies, not involving the same level of measurement uncertainties as those discussed above, are nevertheless important to an understanding of our Consolidated Financial Statements. For example, our Consolidated Financial Statements are presented on a consolidated basis with our affiliated professional contractors because we or one of our subsidiaries have entered into management agreements with
42
Table of Contents
our affiliated professional contractors meeting the “controlling financial interest” criteria set forth in accounting guidance for consolidations. Our management agreements are further described in Note 2 to our Consolidated Financial Statements in this Form 10-K. The policies described in Note 2 often require difficult judgments on complex matters that are often subject to multiple sources of authoritative guidance and are frequently reexamined by accounting standards setters and regulators. See “New Accounting Pronouncements” below for matters that may affect our accounting policies in the future.
RESULTS OF OPERATIONS
The following table sets forth, for the periods indicated, certain information related to our operations expressed as a percentage of our net patient service revenue (patient billings net of contractual adjustments and uncollectibles, and including administrative fees):
| Years Ended December 31, | ||||||||||||
| 2010 | 2009 | 2008 | ||||||||||
| Net patient service revenue |
100.0 | % | 100.0 | % | 100.0 | % | ||||||
| Operating expenses: |
||||||||||||
| Practice salaries and benefits |
61.0 | 60.8 | 60.2 | |||||||||
| Practice supplies and other operating expenses |
4.1 | 4.1 | 4.2 | |||||||||
| General and administrative expenses |
11.0 | 11.4 | 11.7 | |||||||||
| Depreciation and amortization |
1.6 | 1.3 | 1.2 | |||||||||
| Total operating expenses |
77.7 | 77.6 | 77.3 | |||||||||
| Income from operations |
22.3 | 22.4 | 22.7 | |||||||||
| Other (expense) income, net |
(.1 | ) | (.1 | ) | (.1 | ) | ||||||
| Income from continuing operations before income taxes |
22.2 | 22.3 | 22.6 | |||||||||
| Income tax provision |
7.7 | 8.7 | 8.9 | |||||||||
| Income from continuing operations |
14.5 | 13.6 | 13.7 | |||||||||
| Income from discontinued operations, net of income taxes |
— | — | 2.1 | |||||||||
| Net income |
14.5 | % | 13.6 | % | 15.8 | % | ||||||
Year Ended December 31, 2010 as Compared to Year Ended December 31, 2009
Our net patient service revenue increased $113.3 million, or 8.8%, to $1.40 billion for the year ended December 31, 2010, as compared to $1.29 billion for the same period in 2009. Of this $113.3 million increase, $96.6 million, or 85.3%, was attributable to revenue generated from acquisitions completed after December 31, 2008. Same-unit net patient service revenue increased $16.7 million, or 1.3%, for the year ended December 31, 2010. The change in same-unit net patient service revenue was the net result of increased revenue of approximately $14.1 million, or 1.1%, related to pricing and reimbursement factors and a net increase of $2.6 million, or 0.2%, from higher overall patient service volumes across our specialties. The net increase in revenue of $14.1 million related to pricing and reimbursement factors was primarily due to improved managed care contracting and the flow through of revenue from modest price increases, partially offset by a decrease in revenue caused by an increase in the percentage of our patients insured under government-sponsored programs. Payments received from government-sponsored programs are substantially less than payments received from commercial insurance payors for equivalent services. The net increase in revenue of $2.6 million from higher patient service volumes includes an increase of $5.8 million from volume growth in our pediatric cardiology and anesthesiology services, partially offset by a decrease of $3.2 million from volume declines in maternal-fetal, neonatal and other services, including hearing screens and newborn nursery services. Same units are those units at which we provided services for the entire current period and the entire comparable period.
Practice salaries and benefits increased by $71.4 million, or 9.1%, to $854.9 million for the year ended December 31, 2010, as compared to $783.5 million for 2009. This $71.4 million increase was primarily
43
Table of Contents
attributable to increased costs of $79.7 million associated with new physicians and other staff to support acquisition-related growth and growth at existing units, partially offset by decreases of $8.3 million in professional liability costs related to favorable claims experience and incentive compensation based on physician-practice operational results.
Practice supplies and other operating expenses increased $5.3 million, or 10.1%, to $57.5 million for the year ended December 31, 2010, as compared to $52.2 million for 2009. The increase was attributable to practice supply and other costs of $2.7 million related to hospital-based, hearing screen program and anesthesiology acquisitions. In addition, rent, medical supply and other costs increased by $1.5 million related to our office-based acquisitions, and practice supply and other costs increased by $1.1 million at our existing units.
General and administrative expenses include all billing and collection functions and all other salaries, benefits, supplies and operating expenses not specifically related to the day-to-day operations of our physician group practices. General and administrative expenses increased $7.1 million, or 4.8%, to $154.3 million for the year ended December 31, 2010, as compared to $147.2 million for 2009. This increase of $7.1 million is attributable to salaries, benefits and other general and administrative costs related to the overall growth of the Company, partially offset by decreases in incentive compensation costs. General and administrative expenses as a percentage of net patient service revenue decreased to 11.0% for the year ended December 31, 2010 from 11.4% for the year ended December 31, 2009.
Depreciation and amortization expense increased by $5.6 million, or 33.5%, to $22.0 million for the year ended December 31, 2010, as compared to $16.4 million for 2009. This increase was attributable to the amortization of intangible assets related to acquisitions, accelerated amortization of approximately $1.2 million related to the termination of a hospital contract associated with a prior acquisition and the depreciation of fixed asset additions.
Income from operations increased $24.0 million, or 8.3%, to $312.9 million for the year ended December 31, 2010, as compared to $288.9 million for 2009. Our operating margin was 22.3% for the year ended December 31, 2010 and remained relatively the same when compared to 22.4% for 2009.
We recorded net interest expense of $1.8 million for the year ended December 31, 2010, as compared to $1.2 million for 2009. The increase in net interest expense was primarily due to accretion related to our contingent consideration liabilities combined with a lower rate of return on our investments, partially offset by a decrease in interest expense due to lower average borrowings under our Line of Credit. Interest expense for the year ended December 31, 2010 and 2009, consisted primarily of interest charges, commitment fees and amortized debt costs associated with our Line of Credit and accretion expense.
Our effective income tax rate was 34.9% for the year ended December 31, 2010, as compared to 38.9% for 2009. The net decrease in our effective income tax rate is primarily related to a $10.9 million reduction in our income tax provision during the third quarter of 2010 resulting from the resolution of certain matters that were under review with taxing authorities. Excluding the favorable impact of the tax matters resolution, our effective income tax rate was 38.4% for the year ended December 31, 2010. We believe that excluding the favorable impact from the tax matters resolution provides a more comparable effective income tax rate.
Net income increased by 15.3% to $202.7 million for the year ended December 31, 2010, as compared to $175.8 million for 2009.
Diluted net income per common and common equivalent share was $4.26 on weighted average shares outstanding of 47.6 million for the year ended December 31, 2010, as compared to $3.78 on weighted average shares outstanding of 46.5 million for 2009. The 1.1 million increase in our weighted average shares is primarily due to the exercise of employee stock options, the vesting of restricted stock and the issuance of shares under our employee stock purchase plan (“Stock Purchase Plan”) during 2010.
44
Table of Contents
Year Ended December 31, 2009 as Compared to Year Ended December 31, 2008
Our net patient service revenue increased $220.0 million, or 20.6%, to $1.3 billion for the year ended December 31, 2009, as compared to $1.1 billion for 2008. Of this $220.0 million increase, $169.5 million, or 77.0%, was attributable to revenue generated from acquisitions completed after December 31, 2007. Same-unit net patient service revenue increased $50.5 million, or 5.1%, for the year ended December 31, 2009. The change in same-unit net patient service revenue was the result of increased revenue of $31.9 million, or 3.2%, from higher patient service volumes across our specialties and $18.6 million, or 1.9%, related to pricing and reimbursement factors. Increased revenue of $31.9 million from higher patient service volumes includes $11.1 million from a 1.7% increase in neonatal intensive care unit patient days and $20.8 million from volume growth in maternal-fetal, pediatric cardiology, anesthesiology and other services, including hearing screens and newborn nursery services. Excluding the additional calendar day for the 2008 leap year, the increase in neonatal intensive care unit patient days was 2.0%. The net increase in revenue of $18.6 million related to pricing and reimbursement factors is primarily due to improved managed care contracting and the flow through of revenue from price increases, partially offset by a decrease in revenue caused by an increase in the percentage of our patients insured under government-sponsored programs. Payments received from government-sponsored programs are substantially less than payments received from commercial insurance payors for equivalent services. Same units are those units at which we provided services for the entire current period and the entire comparable period.
Practice salaries and benefits increased $140.0 million, or 21.8%, to $783.5 million for the year ended December 31, 2009, as compared to $643.4 million for 2008. This $140.0 million increase was primarily attributable to costs of $129.2 million associated with new physicians and other staff to support acquisition-related growth and volume related growth at existing units and an increase in incentive compensation of $10.8 million resulting from physician-practice operational improvements and an increase in the number of practices participating in our incentive compensation program.
Practice supplies and other operating expenses increased $7.5 million, or 16.7%, to $52.2 million for the year ended December 31, 2009, as compared to $44.8 million for 2008. This $7.5 million increase was attributable to increased supply and operating costs of $5.7 million related to office-based and anesthesiology acquisitions and increased supply and operating costs of $1.8 million related to hospital-based acquisitions and same-unit growth.
General and administrative expenses include all billing and collection functions and all other salaries, benefits, supplies and operating expenses not specifically related to the day-to-day operations of our physician group practices. General and administrative expenses increased $22.2 million, or 17.8%, to $147.2 million for the year ended December 31, 2009, as compared to $125.0 million for 2008. This $22.2 million increase is primarily attributable to salaries, benefits and other general and administrative costs related to the overall growth of the company. General and administrative expenses as a percentage of net patient service revenue were 11.4% for the year ended December 31, 2009, as compared to 11.7% for 2008.
Depreciation and amortization expense increased by $3.4 million, or 25.8%, to $16.4 million for the year ended December 31, 2009, as compared to $13.1 million for 2008. This increase was attributable to the amortization of intangible assets related to acquisitions and the depreciation of fixed asset additions.
Income from operations increased $46.9 million, or 19.4%, to $288.9 million for the year ended December 31, 2009, as compared to $242.0 million for 2008. Our operating margin decreased slightly to 22.4% for the year ended December 31, 2009, as compared to 22.7% for 2008. The decrease of approximately 30 basis points is primarily due to the addition of anesthesiology services and growth in our office-based practices which have lower operating margins than neonatal services.
We recorded net interest expense of $1.2 million for the year ended December 31, 2009, as compared to $0.6 million for 2008. The increase in net interest expense was primarily due to increased borrowing levels under our $350 million Line of Credit during 2009 as a result of stock repurchase programs completed in 2008 and
45
Table of Contents
physician practice acquisitions made in late 2008 and during 2009, as well as a decrease in investment income due to a lower rate of return on our investments. Interest expense for the years ended December 31, 2009 and 2008, consisted primarily of interest charges, commitment fees and amortized debt costs associated with our Line of Credit.
Our effective income tax rate was 38.9% for the year ended December 31, 2009, as compared to 39.2% for 2008. The net decrease in our effective income tax rate is primarily related to newly implemented state tax-planning strategies.
Income from continuing operations increased $29.1 million, or 19.9%, to $175.8 million for the year ended December 31, 2009, as compared to $146.7 million for 2008.
Diluted income from continuing operations per common and common equivalent share was $3.78 on weighted average shares outstanding of 46.5 million for the year ended December 31, 2009, as compared to $3.11 on weighted average shares outstanding of 47.2 million for 2008. The net decrease in weighted average shares outstanding was primarily due to the impact of shares repurchased in 2008 under repurchase programs approved by our Board of Directors, partially offset by an increase in weighted average shares from the exercise of employee stock options, the vesting of restricted stock and the issuance of shares under our Stock Purchase Plan.
Diluted income from discontinued operations per common and common equivalent share was $0.48 on weighted average shares outstanding of 47.2 million for 2008. Diluted income from discontinued operations per common and common equivalent share for the year ended December 31, 2008 includes the gain on the sale of our newborn metabolic screening laboratory business of $22.0 million, net of income taxes.
Net income increased $6.6 million, or 3.9%, to $175.8 million for year ended December 31, 2009, as compared to $169.2 million for 2008. Net income for the year ended December 31, 2008 includes the after-tax gain of $22.0 million on the sale of our newborn metabolic screening business.
Diluted net income per common and common equivalent share was $3.78 on weighted average shares outstanding of 46.5 million for the year ended December 31, 2009, as compared to $3.59 on weighted average shares outstanding of 47.2 million for 2008.
LIQUIDITY AND CAPITAL RESOURCES
As of December 31, 2010, we had $26.3 million of cash and cash equivalents on hand as compared to $26.5 million at December 31, 2009. Additionally, we had a working capital deficit of $24.8 million at December 31, 2010, a decrease of $29.2 million from our working capital deficit of $54.0 million at December 31, 2009. This net decrease in our working capital deficit is primarily due to improvements in working capital related to net income, net borrowings on our Line of Credit, proceeds from the issuance of common stock under our stock incentive plans and Stock Purchase Plan and an increase in our long-term deferred tax liabilities, largely offset by the use of funds for physician practice acquisition payments.
We generated cash flow from operating activities of $240.6 million, $241.4 million and $181.4 million for the years ended December 31, 2010, 2009 and 2008, respectively. The net decrease in cash flow provided from operating activities for the year ended December 31, 2010, as compared to the year ended December 31, 2009, was primarily due to: (i) a net decrease in cash flow from operations related to changes in the components of our accounts payable and accrued expenses; and (ii) a reduction in cash flow from operations related to higher accounts receivable balances; partially offset by (iii) a net improvement in cash flow related to changes in our income tax liabilities; and (iv) improved operating results. The net cash flow improvement related to our income tax liabilities is primarily due to the timing of our estimated quarterly tax payments. Our cash tax payments decreased by $24.2 million, from $113.2 million for the year ended December 31, 2009 to $88.6 million in 2010.
46
Table of Contents
Cash flow provided from operating activities for the year ended December 31, 2009 was affected by: (i) improved year-over-year operating results; and (ii) an improvement in cash flow from operations related to accounts receivable; partially offset by (iii) working capital component changes related to accounts payable and accrued expenses; and (iv) an increase in income tax payments of $9.0 million, from $104.2 million for the year ended December 31, 2008 to $113.2 million for the year ended December 31, 2009. Cash flow provided from operating activities for the year ended December 31, 2008 was affected by: (i) an increase in income tax payments of $25.1 million, from $79.1 million for the year ended December 31, 2007 to $104.2 million for the year ended December 31, 2008; (ii) working capital component changes related to accounts receivable and accounts payable and accrued expenses; and (iii) improved year-over-year operating results.
During the year ended December 31, 2010, accounts receivable increased by $17.0 million, as compared to an increase of $2.0 million for 2009. The net increase in accounts receivable for the year ended December 31, 2010 is primarily due to an increase in net patient service revenue related to acquisitions completed during 2010, primarily those completed during the fourth quarter.
Our accounts receivable are principally due from managed care payors, government payors, and other third-party insurance payors. We track our collections from these sources, monitor the age of our accounts receivable, and make all reasonable efforts to collect outstanding accounts receivable through our systems, processes and personnel at our corporate and regional billing and collection offices. We use customary collection practices, including the use of outside collection agencies, for accounts receivable due from private pay patients when appropriate. Almost all of our accounts receivable adjustments consist of contractual adjustments due to the difference between gross amounts billed and the amounts allowed by our payors. Any amounts written off related to private pay patients are based on the specific facts and circumstances related to each individual patient account.
Days sales outstanding (“DSO”) is one of the key factors that we use to evaluate the condition of our accounts receivable and the related allowances for contractual adjustments and uncollectibles. DSO reflects the timeliness of cash collections on billed revenue and the level of reserves on outstanding accounts receivable. Our DSO was 45.3 days at December 31, 2010 as compared to 45.4 days at December 31, 2009. See Application of Critical Accounting Policies and Estimates—Revenue Recognition for more information on our DSO.
Our cash flow from operating activities is significantly affected by the payment of physician incentive compensation. A large majority of our affiliated physicians participate in our performance-based incentive compensation program and almost all of the payments due under the program are made annually in the first quarter of each year. As a result, we typically experience negative cash flow from operations in the first quarter of each year and fund our operations during this period with cash on hand or funds borrowed under our Line of Credit.
During the year ended December 31, 2010, activities related to the components of our accounts payable and accrued expenses reduced operating cash by $37.0 million, compared to cash provided from accounts payable and accrued expenses activities of $39.5 million in 2009. The net decrease in cash provided from these components of $76.5 million was primarily impacted by changes in our accrued salaries and bonuses, our accrual for uncertain tax positions and our accrued professional liability risks. The primary changes impacting these three components of our accounts payable and accrued expenses include (i) an increase in our annual bonus payments made during the first quarter of 2010 for performance-based incentive compensation earned in 2009 combined with a decrease in our accruals for performance-based incentive compensation earned in 2010; (ii) a decrease in reserves for uncertain tax positions resulting from reclassifications to deferred taxes for year end temporary differences and the resolution of certain matters that were under review with taxing authorities; and (iii) an increase in claim payments made under our professional liability insurance policies.
During the year ended December 31, 2010, our net cash used in investing activities of $361.6 million included physician practice acquisition payments and contingent purchase price payments of $338.6 million, capital expenditures of $12.1 million, and net purchases of $10.9 million related to the purchase and maturity of
47
Table of Contents
investments. Our acquisition payments were primarily related to the purchase of eight neonatal physician practices, two maternal-fetal medicine practices, one pediatric cardiology practice, two other pediatric practices and two anesthesiology practices. Our capital expenditures were for medical equipment, software, leasehold improvements, computer and office equipment, furniture and fixtures and other improvements at our office-based practices and our corporate and regional offices.
During the year ended December 31, 2010, our net cash provided from financing activities of $120.8 million consisted primarily of net borrowings on our Line of Credit of $96.5 million, proceeds from the exercise of employee stock options and the issuance of common stock under our Stock Purchase Plan of $22.5 million, excess tax benefits related to the resolution of income tax matters of $3.4 million and excess tax benefits related to the exercise of employee stock options and the vesting of restricted stock of $3.0 million, partially offset by $4.4 million in payments for contingent consideration liabilities. Under the current accounting guidance for business combinations, payments of contingent consideration liabilities related to acquisitions completed after January 1, 2009 are presented as cash flows used in financing activities. Payments of contingent consideration liabilities related to acquisitions completed prior to January 1, 2009 are presented as cash flows used in investing activities.
Our $350 million Line of Credit is guaranteed by substantially all of our subsidiaries and includes a $50 million sub-facility for the issuance of letters of credit and a $25 million sub-facility for swingline loans. In addition, our Line of Credit may be increased to $400 million subject to the satisfaction of specified conditions. At our option, our Line of Credit (other than swingline loans) bears interest at (1) the alternate base rate, which is defined as the higher of (i) the Federal Funds Rate plus one half of 1.0% and (ii) the Wells Fargo Bank, N.A prime rate or (2) the LIBOR rate, plus, in either case, an applicable margin rate of up to 1.5% based on our consolidated leverage ratio. The Line of Credit is also subject to facility fees based on applicable rates defined in the agreement and the aggregate commitments, regardless of usage. Swingline loans bear interest at the alternate base rate plus the applicable margin. Our Line of Credit matures in September 2013. We are subject to certain covenants and restrictions specified in our Line of Credit, including covenants that require us to maintain a minimum fixed charge coverage ratio, to not exceed a specified consolidated leverage ratio, to comply with laws, and restrict us from paying dividends and making certain other distributions, as specified therein. Failure to comply with these covenants would constitute an event of default under our Line of Credit, notwithstanding our ability to meet our debt service obligations. Our Line of Credit includes various customary remedies for the lenders following an event of default. See Item 1A, Risk Factors, in this Form 10-K for more information on the risks associated with our Line of Credit.
At December 31, 2010, we had an outstanding principal balance of $146.5 million on our Line of Credit. We also had outstanding letters of credit associated with our professional liability insurance program of $6.0 million which reduced the amount available on our Line of Credit to $197.5 million at December 31, 2010. At December 31, 2010, we believe we were in compliance, in all material respects, with the financial covenants and other restrictions applicable to us under our Line of Credit. Based on our current expectations, we believe we will be in compliance with these covenants throughout 2011.
The exercise of employee stock options and the purchase of common stock by employees participating in our Stock Purchase Plans generated cash proceeds of $22.5 million, $18.0 million and $11.7 million for the years ended December 31, 2010, 2009 and 2008, respectively. Because stock option exercises and purchases under these plans are dependent on several factors, including the market price of our common stock, we cannot predict the timing and amount of any future proceeds.
We maintain professional liability insurance policies with third-party insurers, subject to self-insured retention, exclusions and other restrictions. Our self-insured retention under our professional liability insurance program is maintained primarily through a wholly owned captive insurance subsidiary. We record liabilities for self-insured amounts and claims incurred but not reported based on an actuarial valuation using historical loss information, claim emergence patterns and various actuarial assumptions. Our total liability related to professional liability risks at December 31, 2010 was $111.7 million.
48
Table of Contents
We anticipate that funds generated from operations, together with our current cash on hand and funds available under our Line of Credit, will be sufficient to finance our working capital requirements, fund anticipated acquisitions and capital expenditures, and meet our contractual obligations as described below for at least the next 12 months. During 2011, we plan to invest approximately $100 million in acquisitions within our neonatal, maternal-fetal, pediatric cardiology and other pediatric subspecialties. Additionally, we plan to pursue acquisitions within the anesthesiology specialty, although the amount we plan to invest during 2011 has not been determined.
CONTRACTUAL OBLIGATIONS
At December 31, 2010, we had certain obligations and commitments under our Line of Credit, capital leases and operating leases totaling approximately $213.2 million as follows (in thousands):
| Payments Due | ||||||||||||||||||||
| Obligation |
Total | 2011 | 2012 and 2013 |
2014 and 2015 |
2016 and Later |
|||||||||||||||
| Line of Credit (1) |
$ | 155,038 | $ | 3,110 | $ | 151,928 | $ | — | $ | — | ||||||||||
| Capital leases |
181 | 125 | 56 | — | — | |||||||||||||||
| Operating leases |
57,991 | 18,198 | 24,300 | 12,995 | 2,498 | |||||||||||||||
| $ | 213,210 | $ | 21,433 | $ | 176,284 | $ | 12,995 | $ | 2,498 | |||||||||||
| (1) | Amounts include interest payments at the applicable rate as of December 31, 2010. |
Certain of our acquisition agreements contain contingent purchase price provisions based on volume and other performance measures. Potential payments under these provisions are not contingent upon the future employment of the sellers. The amount of the payments due under these provisions cannot be determined until the specific targets or measures are attained. In some cases, the sellers are eligible for annual payments over a three- to five-year period based on the growth in profitability of the physician practice. As of December 31, 2010, payments of up to $43.3 million may be due through 2015 under all other contingent purchase price provisions as follows (in thousands):
| 2011 |
$ | 16.5 | ||
| 2012 |
12.6 | |||
| 2013 |
8.0 | |||
| 2014 |
4.1 | |||
| 2015 |
2.1 | |||
| $ | 43.3 | |||
At December 31, 2010, our total liability for uncertain tax positions was $30.6 million. The current portion of our total liability for uncertain tax positions was $10.9 million at December 31, 2010. The timing and amount of future cash flows for each year beyond 2010 cannot be reasonably estimated. See Note 11 to our Consolidated Financial Statements in this Form 10-K for more information regarding our uncertain tax positions.
OFF-BALANCE SHEET ARRANGEMENTS
At December 31, 2010, we did not have any off-balance sheet arrangements that have or are reasonably likely to have a current or future effect on our financial condition, changes in financial condition, revenue or expenses, results of operations, liquidity, capital expenditures or capital resources.
49
Table of Contents
NEW ACCOUNTING PRONOUNCEMENTS
Effective January 1, 2010, we adopted the provisions of new accounting guidance related to variable interest entities. The new guidance amended the consolidation accounting model and included new disclosure requirements for certain types of variable interest entities. The adoption of the new provisions did not have an impact on our Consolidated Financial Statements.
In January 2010, the accounting guidance related to fair value measurements was amended. The amendment requires disclosure of transfers of assets and liabilities into and out of Level 1 and Level 2 of the fair value hierarchy, including the reasons and the timing of the transfers and disclosure of valuation techniques and inputs for assets and liabilities within Level 2 and Level 3 of the fair value hierarchy. Additionally, the guidance requires expanded disclosure about assets and liabilities within Level 3. The new guidance became effective for us on January 1, 2010, except for the new guidance related to the expanded Level 3 disclosure, which is effective for periods beginning after December 15, 2010. We did not have any transfers in or out of Level 1 and Level 2 fair value measurements during the year ended December 31, 2010; therefore, the adoption of the new guidance did not have any impact on our Consolidated Financial Statements.
50
Table of Contents
| ITEM 7A. | QUANTITATIVE AND QUALITATIVE DISCLOSURES ABOUT MARKET RISK |
Our Line of Credit is subject to market risk and interest rate changes. Our Line of Credit bears interest at (1) the alternate base rate, which is defined as the higher of (i) the Federal Funds Rate plus one half of 1% and (ii) the Wells Fargo Bank, N.A. prime rate or (2) the LIBOR rate, plus, in either case, an applicable margin rate of up to 1.5% based on our consolidated leverage ratio. The outstanding principal balance on our Line of Credit was $146.5 million at December 31, 2010. Considering the total outstanding balance of $146.5 million, a 1% change in interest rates would result in an impact to income before taxes of approximately $1.5 million per year.
51
Table of Contents
| ITEM 8. | FINANCIAL STATEMENTS AND SUPPLEMENTARY DATA |
The following Consolidated Financial Statements and Financial Statement Schedule of MEDNAX, Inc. and its subsidiaries are included in this Form 10-K on the pages set forth below:
INDEX TO FINANCIAL STATEMENTS
AND FINANCIAL STATEMENT SCHEDULE
52
Table of Contents
Report of Independent Registered Certified Public Accounting Firm
To the Board of Directors and Shareholders of
MEDNAX, Inc.:
In our opinion, the consolidated financial statements listed in the accompanying index present fairly, in all material respects, the financial position of MEDNAX, Inc. and its subsidiaries (the “Company”) at December 31, 2010 and 2009, and the results of their operations and their cash flows for each of the three years in the period ended December 31, 2010 in conformity with accounting principles generally accepted in the United States of America. In addition, in our opinion, the financial statement schedule listed in the accompanying index presents fairly, in all material respects, the information set forth therein when read in conjunction with the related consolidated financial statements. Also in our opinion, the Company maintained, in all material respects, effective internal control over financial reporting as of December 31, 2010, based on criteria established in Internal Control—Integrated Framework issued by the Committee of Sponsoring Organizations of the Treadway Commission (COSO). The Company’s management is responsible for these consolidated financial statements and financial statement schedule, for maintaining effective internal control over financial reporting and for its assessment of the effectiveness of internal control over financial reporting, included in Management’s Annual Report on Internal Control over Financial Reporting under Item 9A. Our responsibility is to express opinions on these consolidated financial statements, on the financial statement schedule, and on the Company’s internal control over financial reporting based on our integrated audits. We conducted our audits in accordance with the standards of the Public Company Accounting Oversight Board (United States). Those standards require that we plan and perform the audits to obtain reasonable assurance about whether the consolidated financial statements are free of material misstatement and whether effective internal control over financial reporting was maintained in all material respects. Our audits of the consolidated financial statements included examining, on a test basis, evidence supporting the amounts and disclosures in the consolidated financial statements, assessing the accounting principles used and significant estimates made by management, and evaluating the overall consolidated financial statement presentation. Our audit of internal control over financial reporting included obtaining an understanding of internal control over financial reporting, assessing the risk that a material weakness exists, and testing and evaluating the design and operating effectiveness of internal control based on the assessed risk. Our audits also included performing such other procedures as we considered necessary in the circumstances. We believe that our audits provide a reasonable basis for our opinions.
As discussed in Note 2 to the consolidated financial statements, the Company changed the manner in which it accounts for business combinations in 2009.
A company’s internal control over financial reporting is a process designed to provide reasonable assurance regarding the reliability of financial reporting and the preparation of financial statements for external purposes in accordance with generally accepted accounting principles. A company’s internal control over financial reporting includes those policies and procedures that (i) pertain to the maintenance of records that, in reasonable detail, accurately and fairly reflect the transactions and dispositions of the assets of the company; (ii) provide reasonable assurance that transactions are recorded as necessary to permit preparation of financial statements in accordance with generally accepted accounting principles, and that receipts and expenditures of the company are being made only in accordance with authorizations of management and directors of the company; and (iii) provide reasonable assurance regarding prevention or timely detection of unauthorized acquisition, use, or disposition of the company’s assets that could have a material effect on the financial statements.
Because of its inherent limitations, internal control over financial reporting may not prevent or detect misstatements. Also, projections of any evaluation of effectiveness to future periods are subject to the risk that controls may become inadequate because of changes in conditions, or that the degree of compliance with the policies or procedures may deteriorate.
/s/ PricewaterhouseCoopers LLP
Tampa, Florida
February 24, 2011
53
Table of Contents
CONSOLIDATED BALANCE SHEETS
(in thousands)
| December 31, | ||||||||
| 2010 | 2009 | |||||||
| ASSETS | ||||||||
| Current assets: |
||||||||
| Cash and cash equivalents |
$ | 26,251 | $ | 26,503 | ||||
| Short-term investments |
17,381 | 5,380 | ||||||
| Accounts receivable, net |
181,395 | 164,444 | ||||||
| Prepaid expenses |
5,162 | 5,102 | ||||||
| Income taxes receivable |
— | 5,704 | ||||||
| Deferred income taxes |
60,579 | 72,434 | ||||||
| Other assets |
5,241 | 13,098 | ||||||
| Total current assets |
296,009 | 292,665 | ||||||
| Investments |
27,393 | 28,491 | ||||||
| Property and equipment, net |
42,774 | 43,272 | ||||||
| Goodwill |
1,601,319 | 1,270,137 | ||||||
| Other assets, net |
70,151 | 54,785 | ||||||
| Total assets |
$ | 2,037,646 | $ | 1,689,350 | ||||
| LIABILITIES & SHAREHOLDERS’ EQUITY | ||||||||
| Current liabilities: |
||||||||
| Accounts payable and accrued expenses |
$ | 307,723 | $ | 346,470 | ||||
| Current portion of capital lease obligations |
125 | 234 | ||||||
| Income taxes payable |
12,999 | — | ||||||
| Total current liabilities |
320,847 | 346,704 | ||||||
| Line of credit |
146,500 | 50,000 | ||||||
| Capital lease obligations |
56 | 209 | ||||||
| Deferred income taxes |
74,066 | 59,454 | ||||||
| Other liabilities |
48,723 | 42,885 | ||||||
| Total liabilities |
590,192 | 499,252 | ||||||
| Commitments and contingencies |
||||||||
| Shareholders’ equity: |
||||||||
| Preferred stock; $.01 par value; 1,000 shares authorized; none issued |
— | — | ||||||
| Common stock; $.01 par value; 100,000 shares authorized; 47,937 and 46,963 shares issued and outstanding, respectively |
479 | 470 | ||||||
| Additional paid-in capital |
659,091 | 604,435 | ||||||
| Retained earnings |
787,884 | 585,193 | ||||||
| Total shareholders’ equity |
1,447,454 | 1,190,098 | ||||||
| Total liabilities and shareholders’ equity |
$ | 2,037,646 | $ | 1,689,350 | ||||
The accompanying notes are an integral part of these Consolidated Financial Statements.
54
Table of Contents
CONSOLIDATED STATEMENTS OF INCOME
(in thousands, except for per share data)
| Years Ended December 31, | ||||||||||||
| 2010 | 2009 | 2008 | ||||||||||
| Net patient service revenue |
$ | 1,401,559 | $ | 1,288,264 | $ | 1,068,277 | ||||||
| Operating expenses: |
||||||||||||
| Practice salaries and benefits |
854,920 | 783,493 | 643,445 | |||||||||
| Practice supplies and other operating expenses |
57,511 | 52,232 | 44,767 | |||||||||
| General and administrative expenses |
154,267 | 147,162 | 124,965 | |||||||||
| Depreciation and amortization |
21,950 | 16,448 | 13,071 | |||||||||
| Total operating expenses |
1,088,648 | 999,335 | 826,248 | |||||||||
| Income from operations |
312,911 | 288,929 | 242,029 | |||||||||
| Investment income |
1,434 | 1,682 | 2,982 | |||||||||
| Interest expense |
(3,193 | ) | (2,911 | ) | (3,593 | ) | ||||||
| Income from continuing operations before income taxes |
311,152 | 287,700 | 241,418 | |||||||||
| Income tax provision |
108,461 | 111,896 | 94,736 | |||||||||
| Income from continuing operations |
202,691 | 175,804 | 146,682 | |||||||||
| Income from discontinued operations, net of income taxes |
— | — | 22,519 | |||||||||
| Net income |
$ | 202,691 | $ | 175,804 | $ | 169,201 | ||||||
| Per common and common equivalent share data: |
||||||||||||
| Income from continuing operations: |
||||||||||||
| Basic |
$ | 4.35 | $ | 3.86 | $ | 3.18 | ||||||
| Diluted |
$ | 4.26 | $ | 3.78 | $ | 3.11 | ||||||
| Income from discontinued operations: |
||||||||||||
| Basic |
$ | — | $ | — | $ | 0.49 | ||||||
| Diluted |
$ | — | $ | — | $ | 0.48 | ||||||
| Net income: |
||||||||||||
| Basic |
$ | 4.35 | $ | 3.86 | $ | 3.67 | ||||||
| Diluted |
$ | 4.26 | $ | 3.78 | $ | 3.59 | ||||||
| Weighted average shares: |
||||||||||||
| Basic |
46,630 | 45,573 | 46,121 | |||||||||
| Diluted |
47,570 | 46,471 | 47,161 | |||||||||
The accompanying notes are an integral part of these Consolidated Financial Statements.
55
Table of Contents
CONSOLIDATED STATEMENTS OF SHAREHOLDERS’ EQUITY
(in thousands)
| Common Stock | ||||||||||||||||||||
| Number of Shares |
Amount | Additional Paid-in Capital |
Retained Earnings |
Total Shareholders’ Equity |
||||||||||||||||
| Balance at December 31, 2007 |
48,421 | $ | 484 | $ | 556,836 | $ | 401,732 | $ | 959,052 | |||||||||||
| Net income |
— | — | — | 169,201 | 169,201 | |||||||||||||||
| Common stock issued under employee stock option and stock purchase plans |
359 | 4 | 11,678 | — | 11,682 | |||||||||||||||
| Issuance of restricted stock |
226 | 2 | (2 | ) | — | — | ||||||||||||||
| Stock-based compensation expense |
— | — | 20,863 | — | 20,863 | |||||||||||||||
| Forfeitures of restricted stock |
(7 | ) | — | — | — | — | ||||||||||||||
| Repurchases of common stock |
(3,357 | ) | (34 | ) | (38,419 | ) | (161,544 | ) | (199,997 | ) | ||||||||||
| Excess tax benefit related to employee stock incentive plans |
— | — | 4,337 | — | 4,337 | |||||||||||||||
| Balance at December 31, 2008 |
45,642 | 456 | 555,293 | 409,389 | 965,138 | |||||||||||||||
| Net income |
— | — | — | 175,804 | 175,804 | |||||||||||||||
| Common stock issued under employee stock option and stock purchase plans |
794 | 8 | 17,951 | — | 17,959 | |||||||||||||||
| Issuance of restricted stock |
553 | 6 | (6 | ) | — | — | ||||||||||||||
| Stock-based compensation expense |
— | — | 24,320 | — | 24,320 | |||||||||||||||
| Forfeitures of restricted stock |
(26 | ) | — | — | — | — | ||||||||||||||
| Excess tax benefit related to employee stock incentive plans |
— | — | 6,877 | — | 6,877 | |||||||||||||||
| Balance at December 31, 2009 |
46,963 | 470 | 604,435 | 585,193 | 1,190,098 | |||||||||||||||
| Net income |
— | — | — | 202,691 | 202,691 | |||||||||||||||
| Common stock issued under employee stock option and stock purchase plan |
545 | 5 | 22,527 | — | 22,532 | |||||||||||||||
| Issuance of restricted stock |
437 | 4 | (4 | ) | — | — | ||||||||||||||
| Stock-based compensation expense |
— | — | 25,693 | — | 25,693 | |||||||||||||||
| Forfeitures of restricted stock |
(8 | ) | — | — | — | — | ||||||||||||||
| Excess tax benefit related to employee stock incentive plans |
— | — | 3,046 | — | 3,046 | |||||||||||||||
| Excess tax benefit related to resolution of income tax matters |
— | — | 3,394 | — | 3,394 | |||||||||||||||
| Balance at December 31, 2010 |
47,937 | $ | 479 | $ | 659,091 | $ | 787,884 | $ | 1,447,454 | |||||||||||
The accompanying notes are an integral part of these Consolidated Financial Statements.
56
Table of Contents
CONSOLIDATED STATEMENTS OF CASH FLOWS
(in thousands)
| Years Ended December 31, | ||||||||||||
| 2010 | 2009 | 2008 | ||||||||||
| Cash flows from operating activities: |
||||||||||||
| Net income |
$ | 202,691 | $ | 175,804 | $ | 169,201 | ||||||
| Adjustments to reconcile net income to net cash provided from operating activities: |
||||||||||||
| Depreciation and amortization |
21,950 | 16,448 | 13,210 | |||||||||
| Accretion of contingent consideration liabilities |
967 | 268 | — | |||||||||
| Stock-based compensation expense |
25,693 | 24,320 | 20,776 | |||||||||
| Deferred income taxes |
24,375 | 7,447 | (13,649 | ) | ||||||||
| Gain on sale of discontinued operating unit |
— | — | (38,537 | ) | ||||||||
| Changes in assets and liabilities: |
||||||||||||
| Accounts receivable |
(16,951 | ) | (2,049 | ) | (16,929 | ) | ||||||
| Prepaid expenses and other assets |
3,882 | (1,188 | ) | (3,052 | ) | |||||||
| Other assets |
(3,601 | ) | (1,669 | ) | 1,358 | |||||||
| Accounts payable and accrued expenses |
(37,003 | ) | 39,481 | 58,940 | ||||||||
| Income taxes payable |
18,706 | (18,884 | ) | (4,702 | ) | |||||||
| Other liabilities |
(151 | ) | 1,396 | (5,225 | ) | |||||||
| Net cash provided from operating activities |
240,558 | 241,374 | 181,391 | |||||||||
| Cash flows from investing activities: |
||||||||||||
| Acquisition payments, net of cash acquired |
(338,596 | ) | (151,321 | ) | (274,024 | ) | ||||||
| Purchases of investments |
(26,478 | ) | (19,601 | ) | (26,227 | ) | ||||||
| Proceeds from sales or maturities of investments |
15,575 | 22,735 | 24,733 | |||||||||
| Purchases of property and equipment |
(12,113 | ) | (14,947 | ) | (15,680 | ) | ||||||
| Proceeds from sale of discontinued operating unit |
— | — | 68,300 | |||||||||
| Net cash used in investing activities |
(361,612 | ) | (163,134 | ) | (222,898 | ) | ||||||
| Cash flows from financing activities: |
||||||||||||
| Borrowings on line of credit |
684,000 | 473,500 | 449,800 | |||||||||
| Payments on line of credit |
(587,500 | ) | (563,000 | ) | (310,300 | ) | ||||||
| Payments of contingent consideration liabilities |
(4,405 | ) | — | — | ||||||||
| Payments for syndication of line of credit |
— | — | (1,763 | ) | ||||||||
| Payments on long-term debt and capital lease obligations |
(262 | ) | (316 | ) | (521 | ) | ||||||
| Excess tax benefit from exercises of stock options and vesting of restricted stock |
3,043 | 5,774 | 4,131 | |||||||||
| Excess tax benefit related to resolution of income tax matters |
3,394 | — | — | |||||||||
| Proceeds from issuance of common stock |
22,532 | 17,959 | 11,682 | |||||||||
| Repurchases of common stock |
— | — | (199,997 | ) | ||||||||
| Net cash provided from (used in) financing activities |
120,802 | (66,083 | ) | (46,968 | ) | |||||||
| Net (decrease) increase in cash and cash equivalents |
(252 | ) | 12,157 | (88,475 | ) | |||||||
| Cash and cash equivalents at beginning of year |
26,503 | 14,346 | 102,843 | |||||||||
| Cash held by discontinued operating unit |
— | — | (22 | ) | ||||||||
| Cash and cash equivalents at end of year |
$ | 26,251 | $ | 26,503 | $ | 14,346 | ||||||
| Supplemental disclosure of cash flow information: |
||||||||||||
| Cash paid for: |
||||||||||||
| Interest |
$ | 2,559 | $ | 3,666 | $ | 3,474 | ||||||
| Income taxes |
$ | 88,601 | $ | 113,202 | $ | 104,172 | ||||||
| Non-cash investing and financing activities: |
||||||||||||
| Equipment financed through capital leases |
$ | — | $ | 145 | $ | 220 | ||||||
The accompanying notes are an integral part of these Consolidated Financial Statements.
57
Table of Contents
NOTES TO CONSOLIDATED FINANCIAL STATEMENTS
| 1. | General: |
The principal business activity of MEDNAX, Inc. (“MEDNAX” or the “Company”) and its subsidiaries is to provide neonatal, maternal-fetal, other pediatric subspecialty and anesthesia physician services. The Company has contracts with affiliated professional associations, corporations and partnerships (“affiliated professional contractors”), which are separate legal entities that provide physician services in certain states and Puerto Rico. The Company and its affiliated professional contractors also have contracts with hospitals to provide physician services (generally for neonatal or anesthesia care), which include (i) fee-for-service contracts, whereby hospitals agree, in exchange for the Company’s services, to authorize the Company and its healthcare professionals to bill and collect the charges for medical services rendered by the Company’s affiliated healthcare professionals, and (ii) administrative fee contracts, whereby the Company is assured a minimum revenue level.
| 2. | Summary of Significant Accounting Policies: |
Principles of Presentation
The financial statements include all the accounts of the Company and its subsidiaries combined with the accounts of the affiliated professional contractors with which the Company currently has specific management arrangements. The Company’s agreements with affiliated professional contractors provide that the term of the arrangements are permanent, subject only to termination by the Company, except in the case of gross negligence, fraud or bankruptcy of the Company. The Company has the right to receive income, both as ongoing fees and as proceeds from the sale of its interest in the Company’s affiliated professional contractors, in an amount that fluctuates based on the performance of the affiliated professional contractors and the change in the fair value of the Company’s interest in the affiliated professional contractors. The Company has exclusive responsibility for the provision of all non-medical services required for the day-to-day operation and management of the Company’s affiliated professional contractors and establishes the guidelines for the employment and compensation of the physicians. In addition, the agreements provide that the Company has the right, but not the obligation, to purchase, or to designate a person(s) to purchase, the stock of the Company’s affiliated professional contractors for a nominal amount. Separately, in its sole discretion, the Company has the right to assign its interest in the agreements. Based upon the provisions of these agreements, the Company has determined that the affiliated professional contractors are variable interest entities and that the Company is the primary beneficiary as defined in the accounting guidance for consolidation. All significant intercompany and interaffiliate accounts and transactions have been eliminated.
Reclassifications have been made to certain prior period financial statements to conform with the current year presentation.
New Accounting Pronouncements
Effective January 1, 2010, the Company adopted the provisions of new accounting guidance related to variable interest entities. The new guidance amended the consolidation accounting model and included new disclosure requirements for certain types of variable interest entities. The adoption of the new provisions did not have an impact on the Company’s Consolidated Financial Statements.
In January 2010, the accounting guidance related to fair value measurements was amended. The amendment requires disclosure of transfers of assets and liabilities into and out of Level 1 and Level 2 of the fair value hierarchy, including the reasons and the timing of the transfers and disclosure of valuation techniques and inputs for assets and liabilities within Level 2 and Level 3 of the fair value hierarchy. Additionally, the guidance requires expanded disclosure about assets and liabilities within Level 3. The new guidance became effective for
58
Table of Contents
the Company on January 1, 2010, except for the new guidance related to the expanded Level 3 disclosure, which is effective for periods beginning after December 15, 2010. The Company did not have any transfers in or out of Level 1 and Level 2 fair value measurements during the year ended December 31, 2010; therefore, the adoption of the new guidance did not have any impact on the Company’s Consolidated Financial Statements.
Accounting Estimates and Assumptions
The preparation of financial statements in conformity with accounting principles generally accepted in the United States of America (“GAAP”) requires management to make estimates and assumptions that affect the reported amounts of assets and liabilities and disclosure of contingent assets and liabilities at the date of the financial statements and the reported amounts of revenue and expenses during the reporting periods. Significant estimates and assumptions are involved in the calculation of the Company’s allowance for contractual adjustments and uncollectibles on accounts receivable, liabilities for self-insured amounts and claims incurred but not reported related to the Company’s professional liability risks, the fair value of goodwill, and liabilities for uncertain tax positions. Actual results could differ from those estimates.
Segment Reporting
The results of the Company’s operations are aggregated into a single reportable segment for purposes of presenting financial information in accordance with the accounting guidance for segment reporting.
Revenue Recognition
Patient service revenue is recognized at the time services are provided by the Company’s affiliated physicians. Almost all of the Company’s patient service revenue is reimbursed by government-sponsored healthcare programs and third-party insurance payors. Payments for services rendered to the Company’s patients are generally less than billed charges. The Company monitors its revenue and receivables from these sources and records an estimated contractual allowance to properly account for the anticipated differences between billed and reimbursed amounts.
Accordingly, patient service revenue is presented net of an estimated provision for contractual adjustments and uncollectibles. The Company estimates allowances for contractual adjustments and uncollectibles on accounts receivable based upon historical experience and other factors, including days sales outstanding (“DSO”) for accounts receivable, evaluation of expected adjustments and delinquency rates, past adjustments and collection experience in relation to amounts billed, an aging of accounts receivable, current contract and reimbursement terms, changes in payor mix and other relevant information. Contractual adjustments result from the difference between the physician rates for services performed and the reimbursements by government-sponsored healthcare programs and insurance companies for such services.
Accounts receivable are primarily amounts due under fee-for-service contracts from third-party payors, such as insurance companies, self-insured employers and patients and government-sponsored healthcare programs geographically dispersed throughout the United States and its territories. Concentration of credit risk relating to accounts receivable is limited by the number, diversity and geographic dispersion of the business units managed by the Company, as well as by the large number of patients and payors, including the various governmental agencies in the states in which the Company provides services. Receivables from government agencies made up approximately 24% and 26% of net accounts receivable at December 31, 2010 and 2009, respectively.
Cash Equivalents
Cash equivalents are defined as all highly liquid financial instruments with maturities of 90 days or less from the date of purchase. The Company’s cash equivalents typically consist of demand deposits, amounts on deposit in money market accounts, and funds invested in overnight repurchase agreements. Cash equivalent balances may, at certain times, exceed federally insured limits.
59
Table of Contents
Certain cash equivalents carried by the Company are subject to the fair value provisions of the accounting guidance for fair value measurements. See “Fair Value of Financial Instruments” below.
Investments
Investments consist of municipal debt securities, federal home loan securities and certificates of deposit. Investments with remaining maturities of less than one year are classified as short-term investments. Investments classified as long-term have maturities of two to five years.
The Company has the ability and intent to hold its held-to-maturity securities to maturity, and therefore carries such investments at amortized cost in accordance with the provisions of the accounting guidance for investments in debt and equity securities. Held-to-maturity investments are not subject to the fair value requirements of the accounting guidance for fair value measurements.
Property and Equipment
Property and equipment are recorded at original purchase cost. Depreciation of property and equipment is computed using the straight-line method over the estimated useful lives of the underlying assets. Estimated useful lives are generally 20 years for buildings; three to 10 years for medical equipment, computer equipment, software and furniture; and the lesser of the useful life or the remaining lease term for leasehold improvements and capital leases. Upon sale or retirement of property and equipment, the related cost and accumulated depreciation are eliminated from the respective accounts and any resulting gain or loss is included in earnings.
Business Acquisitions
The Company accounts for business acquisitions as required by the provisions of the accounting guidance for business combinations, which includes provisions that the Company adopted effective January 1, 2009. The guidance retains the underlying concepts of the previous standard such that all business combinations are required to be accounted for at fair value, but changes certain aspects of applying the acquisition method of accounting. The changes require the Company to measure contingent consideration at fair value at the acquisition date and also require the Company to expense certain acquisition costs as they are incurred for acquisitions completed after January 1, 2009. See Note 6 for more information on the Company’s business acquisitions.
Goodwill and Other Intangible Assets
The Company records acquired assets and liabilities at their respective fair values under the acquisition method of accounting. Goodwill represents the excess of cost over the fair value of the net assets acquired. Intangible assets with finite lives, principally physician and hospital agreements, are recognized apart from goodwill at the time of acquisition based on the contractual-legal and separability criteria established in the accounting guidance for business combinations. Intangible assets with finite lives are amortized on either an accelerated basis based on the annual undiscounted economic cash flows associated with the particular intangible asset or on a straight-line basis over their estimated useful lives. Intangible assets with finite lives are amortized over periods of one to 20 years.
Goodwill is tested for impairment at a reporting unit level on at least an annual basis in accordance with the subsequent measurement provisions of the accounting guidance for goodwill. The Company defines a reporting unit based upon its management structure for services provided in specific regions of the United States. The testing for impairment is completed using a two-step test. The first step compares the fair value of a reporting unit with its carrying amount, including goodwill. If the carrying amount of a reporting unit exceeds its fair value, a second step is performed to determine the amount of any impairment loss. The Company uses income and market-based valuation approaches to determine the fair value of its reporting units. These approaches focus on discounted cash flows and market multiples based on the Company’s market capitalization to derive the fair
60
Table of Contents
value of a reporting unit. The Company also considers the economic outlook for the healthcare services industry and various other factors during the testing process, including hospital and physician contract changes, local market developments, changes in third-party payor payments, and other publicly available information. The Company completed annual impairment tests in the third quarter of each of 2010, 2009 and 2008 and determined that goodwill was not impaired in any of the three years.
Long-Lived Assets
The Company is required to evaluate long-lived assets, including intangible assets subject to amortization, whenever events or changes in circumstances indicate that the carrying value of the assets may not be fully recoverable. The recoverability of such assets is measured by a comparison of the carrying value of the assets to the future undiscounted cash flows before interest charges to be generated by the assets. If long-lived assets are impaired, the impairment to be recognized is measured as the excess of the carrying value over the fair value. Long-lived assets held for disposal are reported at the lower of the carrying value or fair value less disposal costs. The Company does not believe there are any indicators that would require an adjustment to such assets or their estimated periods of recovery at December 31, 2010 pursuant to current accounting standards.
Professional Liability Coverage
The Company maintains professional liability insurance policies with third-party insurers on a claims-made basis, subject to self-insured retention, exclusions and other restrictions. The Company’s self-insured retention under its professional liability insurance program is maintained primarily through a wholly owned captive insurance subsidiary. The Company records an estimate of liabilities for self-insured amounts and claims incurred but not reported based on an actuarial valuation using historical loss information, claim emergence patterns and various actuarial assumptions. Liabilities for claims incurred but not reported are not discounted.
Income Taxes
The Company records deferred income taxes using the liability method, whereby deferred tax assets and liabilities are determined based on the difference between the financial statement and tax bases of assets and liabilities using enacted tax rates in effect for the year in which the differences are expected to reverse.
The accounting guidance for uncertain tax positions prescribes a recognition threshold and measurement attribute for financial statement recognition and measurement of a tax position taken or expected to be taken in a tax return. The guidance also requires policy disclosures regarding penalties and interest and extensive disclosures regarding increases and decreases in uncertain tax positions as a result of tax positions taken in a current or prior period, settlements with taxing authorities and any lapse of an applicable statute of limitations. Additional qualitative discussion is required for any tax position that may result in a significant increase or decrease in uncertain tax positions within a 12-month period from the Company’s reporting date.
Stock Incentive Plans
The Company grants stock-based awards consisting of restricted and deferred stock and stock options to key employees under its 2008 Incentive Compensation Plan and certain prior incentive compensation plans (collectively, “Stock Incentive Plans”).
In accordance with the accounting guidance for stock-based compensation, the Company measures the cost of employee services received in exchange for stock-based awards based on grant-date fair value. As prescribed under the accounting guidance, the Company estimates the grant-date fair value of stock option grants using a valuation model known as the Black-Scholes-Merton formula or the “Black-Scholes Model” and allocates the resulting compensation expense over the corresponding requisite service period using the graded vesting attribution method. The Black-Scholes Model requires the use of several variables to estimate the grant-date fair
61
Table of Contents
value of stock options including expected volatility, expected life, expected risk-free interest rate and expected dividends. The Company performs significant analyses to calculate and select the appropriate variable assumptions used in the Black-Scholes Model. The Company also performs significant analyses to estimate forfeitures of stock-based awards as required by the accounting guidance for stock-based compensation. The Company is required to adjust its forfeiture estimates on at least an annual basis based on the number of awards that ultimately vest.
Net Income Per Share
Basic net income per share is calculated by dividing net income by the weighted average number of common shares outstanding during the period. Diluted net income per share is calculated by dividing net income by the weighted average number of common and potential common shares outstanding during the period. Potential common shares consist of outstanding options and restricted and deferred stock calculated using the treasury stock method. Under the treasury stock method, the Company includes the assumed excess tax benefits related to the potential exercise or vesting of its stock-based awards using the difference between the average market price for the applicable period less the option price, if any, and the fair value of the stock-based award on the date of grant multiplied by the applicable tax rate.
Fair Value of Financial Instruments
In accordance with the accounting guidance for fair value measurements and disclosures, the Company carries its money market funds and the cash surrender value of life insurance related to its deferred compensation arrangements at fair value. Under this guidance, the fair value of these instruments is determined using a three-tier fair value hierarchy. Based on this hierarchy, the Company determined the fair value of its money market funds and the cash surrender value of life insurance using quoted market prices, a Level 1 or an observable input as defined under the accounting guidance for fair value measurements. The investments underlying the cash surrender value of life insurance consist primarily of exchange-traded equity securities and mutual funds with quoted prices in active markets. At December 31, 2010, the Company’s money market funds and the cash surrender value of life insurance had carrying amounts of $11.7 million and $12.5 million, respectively. At December 31, 2009, the Company’s money market funds and the cash surrender value of life insurance had carrying amounts of $20.2 million and $10.7 million, respectively.
The carrying amounts of cash equivalents, short-term investments, accounts receivable and accounts payable and accrued expenses approximate fair value due to the short maturities of the respective instruments. The carrying value of long-term investments and capital lease obligations approximates fair value.
| 3. | Investments: |
Investments held are summarized as follows (in thousands):
| December 31, 2010 | December 31, 2009 | |||||||||||||||
| Short-Term | Long-Term | Short-Term | Long-Term | |||||||||||||
| Municipal debt securities |
$ | 16,901 | $ | 11,327 | $ | 4,880 | $ | 24,271 | ||||||||
| Federal home loan securities |
— | 16,066 | 500 | 3,500 | ||||||||||||
| Certificates of deposit |
480 | — | — | 720 | ||||||||||||
| $ | 17,381 | $ | 27,393 | $ | 5,380 | $ | 28,491 | |||||||||
62
Table of Contents
| 4. | Accounts Receivable and Net Patient Service Revenue: |
Accounts receivable, net consists of the following (in thousands):
| December 31, | ||||||||
| 2010 | 2009 | |||||||
| Gross accounts receivable |
$ | 603,372 | $ | 541,950 | ||||
| Allowance for contractual adjustments |
(421,977 | ) | (377,506) | |||||
| $ | 181,395 | $ | 164,444 | |||||
Net patient service revenue consists of the following (in thousands):
| Years Ended December 31, | ||||||||||||
| 2010 | 2009 | 2008 | ||||||||||
| Gross patient service revenue |
$ | 4,140,312 | $ | 3,658,459 | $ | 3,014,035 | ||||||
| Contractual adjustments and uncollectibles |
(2,825,827 | ) | (2,444,222 | ) | (2,006,415 | ) | ||||||
| Hospital contract administrative fees |
87,074 | 74,027 | 60,657 | |||||||||
| $ | 1,401,559 | $ | 1,288,264 | $ | 1,068,277 | |||||||
Accounts receivable of $181.4 million and $164.4 million at December 31, 2010 and 2009, respectively, consist primarily of amounts due from government-sponsored healthcare programs and third-party insurance payors for services provided by the Company’s affiliated physicians.
Net patient service revenue of $1.4 billion, $1.3 billion and $1.1 billion for the years ended December 31, 2010, 2009 and 2008, respectively, consists primarily of gross billed charges for services provided by the Company’s affiliated physicians less an estimated allowance for contractual adjustments and uncollectibles to properly account for the anticipated differences between gross billed charge amounts and expected reimbursement amounts.
The Company’s contractual adjustments and uncollectibles as a percentage of gross patient service revenue vary slightly each year depending on several factors, including improved managed care contracting, changes in reimbursement from state Medicaid programs and other government-sponsored programs and annual price increases.
The Company’s annual price increases typically increase contractual adjustments as a percentage of gross patient service revenue. This increase is primarily due to Medicaid and other government-sponsored health care programs that generally provide for reimbursements on a fee-schedule basis rather than on a gross charge basis. When the Company bills these programs, like other payors, on a gross-charge basis, it also increases its provision for contractual adjustments and uncollectibles by the amount of any price increase, resulting in a higher contractual adjustment percentage.
63
Table of Contents
| 5. | Property and Equipment: |
Property and equipment consists of the following (in thousands):
| December 31, | ||||||||
| 2010 | 2009 | |||||||
| Building |
$ | 8,056 | $ | 8,056 | ||||
| Land |
2,032 | 2,032 | ||||||
| Equipment and furniture |
88,868 | 93,794 | ||||||
| 98,956 | 103,882 | |||||||
| Accumulated depreciation |
(56,182 | ) | (60,610) | |||||
| $ | 42,774 | $ | 43,272 | |||||
At December 31, 2010 and 2009, property and equipment includes medical and other equipment held under capital leases of approximately $1.0 million and $1.3 million, and related accumulated depreciation of approximately $0.8 million and $0.9 million, respectively. The Company recorded depreciation expense of approximately $13.5 million, $11.2 million and $9.4 million for the years ended December 31, 2010, 2009 and 2008, respectively.
| 6. | Business Acquisitions: |
During 2010, the Company completed the acquisition of 15 physician group practices for total consideration of $339.3 million, consisting of $328.7 million in cash and $10.6 million of contingent consideration. In connection with these acquisitions, the Company recorded goodwill of approximately $317.5 million, other intangible assets consisting primarily of physician and hospital agreements of approximately $21.4 million, fixed assets of approximately $0.9 million, and other liabilities of approximately $0.5 million. These acquisitions expand the Company’s national network of physician practices. The Company expects to improve the results of these physician practices through improved managed care contracting, improved collections, identification of growth initiatives, as well as, operating and cost savings based upon the significant infrastructure it has developed.
The contingent consideration of $10.6 million recorded during 2010 is related to agreements to pay additional amounts based on the achievement of certain performance measures for up to five years ending after the acquisition dates. The accrued contingent consideration for each acquisition was recorded at acquisition-date fair value using the income approach with assumed discount rates ranging from 3.0% to 6.0% over the applicable terms and an assumed payment probability of 100% for each of the applicable years. The range of the undiscounted amount the Company could pay under the contingent consideration agreements is between $0 and $12.1 million.
During 2010, the Company paid approximately $14.3 million for contingent consideration related to certain prior-period acquisitions, of which $4.4 million was accrued as of December 31, 2009.
During 2009, the Company completed the acquisition of 11 physician group practices for total consideration of $145.5 million, consisting of $128.1 million in cash and $17.4 million of contingent consideration. In connection with these acquisitions, the Company recorded goodwill of approximately $124.8 million, other intangible assets consisting primarily of physician and hospital agreements of approximately $20.2 million, and fixed assets of approximately $0.5 million.
Certain purchase agreements contain contingent purchase price provisions based on volume and other performance measures. Potential payments under these provisions are not contingent upon the future employment of the sellers. The amount of the payments due under these provisions cannot be determined until the specific targets or measures are attained. In some cases, the sellers are eligible for annual contingent purchase price
64
Table of Contents
payments over a three- to five-year period based on the growth in profitability of the physician practice with no stated limit on the annual payment amount. Under all contingent purchase price provisions, payments of up to $43.3 million may be due through 2015, of which $26.1 million is accrued as of December 31, 2010.
The results of operations of the practices acquired in 2010 and 2009 have been included in the Company’s Consolidated Financial Statements from the dates of acquisition. The following pro forma information combines the consolidated results of operations of the Company on a GAAP basis and the acquisitions completed during 2010 and 2009 as if the transactions had occurred on January 1, 2009 (in thousands, except per share data):
| Years Ended December 31, | ||||||||
| 2010 | 2009 | |||||||
| Net patient service revenue |
$ | 1,504,048 | $ | 1,493,588 | ||||
| Net income |
221,091 | 212,293 | ||||||
| Net income per share: |
||||||||
| Basic |
$ | 4.74 | $ | 4.66 | ||||
| Diluted |
$ | 4.65 | $ | 4.57 | ||||
The pro forma results do not necessarily represent results which would have occurred if the acquisitions had taken place at the beginning of the period, nor are they indicative of the results of future combined operations.
| 7. | Goodwill and Other Assets: |
Goodwill was $1.6 billion and $1.3 billion at December 31, 2010 and 2009, respectively. The change in the carrying amount of goodwill of approximately $331.2 million during the year ended December 31, 2010 is primarily related to the Company’s 2010 acquisitions and the 2010 contingent consideration payments related to acquisitions completed prior to January 1, 2009 as discussed in Note 6. The Company expects that approximately $284.2 million of the $331.2 million of goodwill recorded during the year ended December 31, 2010 will be deductible for tax purposes. Goodwill of approximately $142.2 million related to the 2009 acquisitions and the 2009 contingent consideration payments related to acquisitions completed prior to January 1, 2009 as discussed in Note 6 represent the only changes in the carrying amount of goodwill for the year ended December 31, 2009.
Other assets consist of the following (in thousands):
| December 31, | ||||||||
| 2010 | 2009 | |||||||
| Other intangible assets, net |
$ | 51,776 | $ | 38,844 | ||||
| Other assets |
18,375 | 15,941 | ||||||
| $ | 70,151 | $ | 54,785 | |||||
At December 31, 2010, other intangible assets consisted of amortizable hospital, state and other contracts; physician and hospital agreements; and other agreements with gross carrying amounts of approximately $73.0 million, less accumulated amortization of approximately $21.2 million. At December 31, 2009, other intangible assets consisted of amortizable hospital, state and other contracts; physician and hospital agreements; and other agreements with gross carrying amounts of approximately $53.1 million, less accumulated amortization of approximately $14.3 million. Other intangible assets with finite lives are amortized on either an accelerated basis based on the annual undiscounted economic cash flows associated with the particular intangible asset or on a straight-line basis over their estimated useful lives.
Amortization expense related to other intangible assets for the years ended December 31, 2010, 2009 and 2008 was approximately $8.5 million, $5.2 million and $3.6 million, respectively. Amortization expense on other intangible assets for the years 2011 through 2015 is expected to be approximately $8.9 million, $8.0 million, $7.4
65
Table of Contents
million, $6.3 million and $5.4 million, respectively. The remaining weighted average amortization period of other intangible assets is 4.1 years. The calculation of the weighted average amortization period includes amortization expense related to years beyond 2015 of approximately $15.8 million.
Other assets of $18.4 million and $15.9 million at December 31, 2010 and 2009, respectively, consist primarily of the cash surrender value of life insurance related to the Company’s deferred compensation arrangements and other long-term assets.
| 8. | Accounts Payable and Accrued Expenses: |
Accounts payable and accrued expenses consist of the following (in thousands):
| December 31, | ||||||||
| 2010 | 2009 | |||||||
| Accounts payable |
$ | 9,581 | $ | 11,199 | ||||
| Accrued salaries and bonuses |
132,221 | 144,827 | ||||||
| Accrued professional liability risks |
111,662 | 109,628 | ||||||
| Accrued payroll taxes and benefits |
26,122 | 22,600 | ||||||
| Accrual for uncertain tax positions |
10,948 | 40,859 | ||||||
| Other accrued expenses |
17,189 | 17,357 | ||||||
| $ | 307,723 | $ | 346,470 | |||||
At December 31, 2010 and 2009, accrued salaries and bonuses of $132.2 million and $144.8 million, respectively, consist primarily of amounts due under the Company’s performance-based incentive compensation program.
At December 31, 2010 and 2009, accrued professional liability risks of $111.7 million and $109.6 million, respectively, consist of the Company’s liabilities for self-insured retention under its professional liability insurance program and an estimate of liabilities for claims incurred but not reported based on an actuarial valuation. See Note 9 for more information regarding the Company’s accrued professional liability.
The accrual for uncertain tax positions, which represents the current portion of reserves for uncertain tax positions including interest and penalties, decreased by $30.0 million, from $40.9 million at December 31, 2009 to $10.9 million at December 31, 2010, of which $19.0 million related to reclassifications of certain temporary differences to deferred taxes payable and $10.5 million related to the resolution of certain income tax matters that were under review with taxing authorities. See Note 11 for more information regarding the Company’s uncertain tax positions.
| 9. | Accrued Professional Liability: |
At December 31, 2010 and 2009, the Company’s total accrued professional liability of $111.7 million and $109.6 million, respectively, includes incurred but not reported loss reserves of $71.0 million and $68.2 million, respectively, and loss reserves for reported claims associated with self-insured retention amounts through the Company’s wholly owned captive insurance subsidiary of $40.7 million and $41.4 million, respectively.
66
Table of Contents
The activity related to the Company’s loss reserves for reported claims for the years ended December 31, 2010, 2009 and 2008 is as follows (in thousands):
| Years Ended December 31, | ||||||||||||
| 2010 | 2009 | 2008 | ||||||||||
| Balance at beginning of year |
$ | 41,355 | $ | 36,366 | $ | 31,786 | ||||||
| Provision (adjustment) for losses related to: |
||||||||||||
| Current year |
17,256 | 16,497 | 15,174 | |||||||||
| Prior years |
(4,029 | ) | (3,519 | ) | (5,010 | ) | ||||||
| Total provision for losses |
13,227 | 12,978 | 10,164 | |||||||||
| Claim payments related to: |
||||||||||||
| Current year |
(553 | ) | (568 | ) | (15 | ) | ||||||
| Prior years |
(13,357 | ) | (7,421 | ) | (5,569 | ) | ||||||
| Total payments |
(13,910 | ) | (7,989 | ) | (5,584 | ) | ||||||
| Balance at end of year |
$ | 40,672 | $ | 41,355 | $ | 36,366 | ||||||
The net changes in reserves for reported claims for the years ended December 31, 2010 and 2009, are primarily attributable to the increase in the number of physicians insured through the Company’s wholly owned captive insurance subsidiary due to acquisitions and same-unit growth, offset by higher claim payments and adjustments to the provision for losses related to prior years resulting from favorable trends in the Company’s claims experience.
| 10. | Line of Credit and Capital Lease Obligations: |
The Company has an unsecured $350 million revolving line of credit (“Line of Credit”) that is guaranteed by substantially all of the Company’s subsidiaries and includes a $50 million sub-facility for the issuance of letters of credit and a $25 million sub-facility for swingline loans. In addition, the Line of Credit may be increased to $400 million subject to the satisfaction of specified conditions. At the Company’s option, the Line of Credit (other than swingline loans) bears interest at (1) the alternate base rate, which is defined as the higher of (i) the Federal Funds Rate plus one half of 1% and (ii) the Wells Fargo Bank, N.A prime rate or (2) the LIBOR rate, plus, in either case, an applicable margin rate of up to 1.5% based on the Company’s consolidated leverage ratio. The Line of Credit is also subject to facility fees based on applicable rates defined in the agreement and the aggregate commitments, regardless of usage. Swingline loans bear interest at the alternate base rate plus the applicable margin. The Line of Credit matures in September 2013. The Company is subject to certain covenants and restrictions specified in the Line of Credit, including covenants that require it to maintain a minimum fixed charge coverage ratio and to not exceed a specified consolidated leverage ratio, to comply with laws, and restrict it from paying dividends and making certain other distributions, as specified therein. Failure to comply with these covenants would constitute an event of default under the Line of Credit, notwithstanding the Company’s ability to meet its debt service obligations. The Line of Credit includes various customary remedies for the lenders following an event of default. At December 31, 2010, the Company believes it was in compliance, in all material respects, with the financial covenants and other restrictions applicable under the Line of Credit.
The Company had $146.5 million in outstanding principal balance under the Line of Credit at December 31, 2010. The Company has outstanding letters of credit associated with its professional liability insurance program which reduced the amount available under the Line of Credit by $6.0 million at December 31, 2010. The weighted average interest rate on the letters of credit was 1.0% at December 31, 2010. At December 31, 2010, the Company had an available balance on the Line of Credit of $197.5 million.
67
Table of Contents
The Company’s capital lease obligations consist of the following (in thousands):
| December 31, | ||||||||
| 2010 | 2009 | |||||||
| Capital lease obligations |
$ | 181 | $ | 443 | ||||
| Less: Current portion |
(125 | ) | (234 | ) | ||||
| Long-term portion |
$ | 56 | $ | 209 | ||||
The amounts due under the terms of the Company’s capital lease obligations at December 31, 2010 are as follows (in thousands):
| 2011 |
$ | 125 | ||
| 2012 |
56 | |||
| $ | 181 | |||
| 11. | Income Taxes: |
The components of the income tax provision (benefit) are as follows (in thousands):
| December 31, | ||||||||||||
| 2010 | 2009 | 2008 | ||||||||||
| Federal: |
||||||||||||
| Current |
$ | 73,756 | $ | 93,590 | $ | 92,960 | ||||||
| Deferred |
22,814 | 6,391 | (10,066 | ) | ||||||||
| 96,570 | 99,981 | 82,894 | ||||||||||
| State: |
||||||||||||
| Current |
10,330 | 11,315 | 12,822 | |||||||||
| Deferred |
1,561 | 600 | (980 | ) | ||||||||
| 11,891 | 11,915 | 11,842 | ||||||||||
| Total |
$ | 108,461 | $ | 111,896 | $ | 94,736 | ||||||
The Company files its tax return on a consolidated basis with its subsidiaries. The remaining affiliated professional contractors file tax returns on an individual basis.
The effective tax rate was 34.86%, 38.89% and 39.24% for the years ended December 31, 2010, 2009 and 2008, respectively. The net decrease in the Company’s effective income tax rate for the year ended December 31, 2010 was primarily related to the $10.9 million reduction in its income tax provision resulting from a resolution of certain matters that were under review with taxing authorities.
68
Table of Contents
The differences between the effective rate and the United States federal income tax statutory rate are as follows:
| December 31, | ||||||||||||
| 2010 | 2009 | 2008 | ||||||||||
| Tax at statutory rate |
35.00 | % | 35.00 | % | 35.00 | % | ||||||
| State income tax, net of federal benefit |
2.42 | 2.69 | 3.19 | |||||||||
| Non-deductible expenses |
0.35 | 0.40 | 0.56 | |||||||||
| Change in accrual estimates relating to uncertain tax positions |
(2.81 | ) | 0.82 | 0.63 | ||||||||
| Other, net |
(0.10 | ) | (0.02 | ) | (0.14 | ) | ||||||
| Income tax provision |
34.86 | % | 38.89 | % | 39.24 | % | ||||||
The significant components of deferred income tax assets and liabilities are as follows (in thousands):
| December 31, 2010 | December 31, 2009 | |||||||||||||||||||||||
| Total | Current | Non- Current |
Total | Current | Non- Current |
|||||||||||||||||||
| Allowance for uncollectible accounts |
$ | 34,254 | $ | 34,254 | $ | — | $ | 43,068 | $ | 43,068 | $ | — | ||||||||||||
| Net operating loss carryforward |
7,799 | 7,799 | — | 2,789 | 2,789 | — | ||||||||||||||||||
| Reserves and accruals |
37,045 | 33,378 | 3,667 | 35,466 | 31,810 | 3,656 | ||||||||||||||||||
| Other |
488 | 488 | — | 271 | 271 | — | ||||||||||||||||||
| Stock-based compensation |
18,316 | 8,700 | 9,616 | 15,906 | 6,238 | 9,668 | ||||||||||||||||||
| Total deferred tax assets |
97,902 | 84,619 | 13,283 | 97,500 | 84,176 | 13,324 | ||||||||||||||||||
| Accrual to cash adjustment |
(24,040 | ) | (24,040 | ) | — | (11,742 | ) | (11,742 | ) | — | ||||||||||||||
| Property and equipment |
(965 | ) | — | (965 | ) | (1,481 | ) | — | (1,481 | ) | ||||||||||||||
| Amortization |
(86,384 | ) | — | (86,384 | ) | (71,297 | ) | — | (71,297 | ) | ||||||||||||||
| Total deferred tax liabilities |
(111,389 | ) | (24,040 | ) | (87,349 | ) | (84,520 | ) | (11,742 | ) | (72,778 | ) | ||||||||||||
| Net deferred tax (liability) asset |
$ | (13,487 | ) | $ | 60,579 | $ | (74,066 | ) | $ | 12,980 | $ | 72,434 | $ | (59,454 | ) | |||||||||
The income tax benefit related to the exercise of stock options, the purchase of shares under the Company’s non-qualified employee stock purchase plan and the vesting of restricted stock in excess of amounts recorded as equity compensation expense reduces taxes currently payable and is credited to additional paid-in capital. Such amounts totaled approximately $3.0 million, $6.9 million, and $4.3 million for the years ended December 31, 2010, 2009 and 2008, respectively.
The Company has net operating loss carryforwards for federal and state tax purposes totaling approximately $20.7 million, $8.0 million, and $14.9 million at December 31, 2010, 2009 and 2008, respectively, expiring at various times commencing in 2014. The increase in net operating loss carryforwards of $12.7 million in 2010 and the decrease of $6.9 million in 2009 are primarily due to timing differences related to the recognition of income for tax purposes associated with physician practice acquisitions.
As of December 31, 2010, 2009 and 2008, the Company’s liability for uncertain tax positions, excluding accrued interest and penalties, was $22.3 million, $49.4 million and $47.6 million, respectively. The Company had approximately $12.3 million of uncertain tax positions that, if recognized, would favorably impact its effective tax rate at December 31, 2010.
During the third quarter of 2010, the Company reached a resolution with taxing authorities on certain income tax matters that were under review. In connection with this resolution, the Company recorded a reduction in reserves for uncertain tax positions of $9.6 million, excluding interest of $4.7 million, and also recorded a
69
Table of Contents
reduction in its income tax provision of $10.9 million. In addition, the resolution resulted in an increase in additional paid-in capital of $3.4 million for excess tax benefits related to stock-based awards, which increased the Company’s cash flow from financing activities.
The following table summarizes the activity related to the Company’s liability for uncertain tax positions for the years ended December 31, 2010, 2009 and 2008 (in thousands):
| Years Ended December 31, | ||||||||||||
| 2010 | 2009 | 2008 | ||||||||||
| Balance at beginning of year |
$ | 49,416 | $ | 47,562 | $ | 29,769 | ||||||
| Increases related to prior year tax positions |
948 | — | 16,574 | |||||||||
| Decreases related to prior year tax positions |
(9,569 | ) | (1,051 | ) | (4,227 | ) | ||||||
| Increases related to current year tax positions |
2,334 | 5,867 | 9,815 | |||||||||
| Decreases related to current year tax positions |
(19,035 | ) | — | — | ||||||||
| Settlements |
(500 | ) | (2,191 | ) | (3,556 | ) | ||||||
| Decreases related to lapse of statutes of limitations |
(1,304 | ) | (771 | ) | (813 | ) | ||||||
| Balance at end of year |
$ | 22,290 | $ | 49,416 | $ | 47,562 | ||||||
During the 12 months ended December 31, 2010, the Company decreased its liability for uncertain tax positions by a total of $27.1 million, of which $19.0 million related to reclassifications of certain temporary differences to deferred taxes payable and $9.6 million related to the resolution reached with taxing authorities discussed above. During the 12 months ended December 31, 2009, the Company increased its liability for uncertain tax positions by a total of $1.9 million, which is primarily related to changes in temporary differences, partially offset by settlements.
The Company includes interest and penalties related to income tax liabilities in income tax expense. The Company recognized $1.7 million, $2.5 million and $3.2 million, respectively, of interest and penalties related to income tax liabilities during the years ended December 31, 2010, 2009 and 2008. The Company also recorded a reduction in interest expense of $4.7 million during the year ended December 31, 2010 in connection with the resolution of income tax matters discussed above. At December 31, 2010 and 2009, the Company’s accrued liability for interest and penalties related to income tax liabilities totaled $8.3 million and $11.3 million, respectively.
At December 31, 2010, accounts payable and accrued expenses and other liabilities as presented in the Company’s Consolidated Balance Sheet include $10.9 million and $19.7 million, respectively, related to the Company’s total liability for uncertain tax positions of $30.6 million. At December 31, 2009, accounts payable and accrued expenses and other liabilities as presented in the Company’s Consolidated Balance Sheet include $40.9 million and $19.8 million, respectively, related to the Company’s total liability for uncertain tax positions of $60.7 million.
The Company’s liability for uncertain tax positions could be reduced over the next 12 months by approximately $1.5 million, excluding accrued interest, due to the expiration of statutes of limitation. Additionally, the Company anticipates that its liability for uncertain tax positions will be increased over the next 12 months by additional taxes of approximately $2.3 million. Although the Company anticipates additional changes in its liability for uncertain tax positions related to certain temporary differences, an estimate of the range of such changes cannot be made at this time.
The Company is currently subject to U.S. Federal and various state income tax examinations for the tax years 2004 through 2009.
70
Table of Contents
| 12. | Common and Common Equivalent Shares: |
The calculation of shares used in the basic and diluted net income per share calculation for the years ended December 31, 2010, 2009 and 2008 is as follows (in thousands):
| Years Ended December 31, | ||||||||||||
| 2010 | 2009 | 2008 | ||||||||||
| Weighted average number of common shares outstanding |
46,630 | 45,573 | 46,121 | |||||||||
| Weighted average number of dilutive common share equivalents |
940 | 898 | 1,040 | |||||||||
| Weighted average number of common and common equivalent shares outstanding |
47,570 | 46,471 | 47,161 | |||||||||
| Antidilutive securities not included in the diluted earnings per share calculation |
464 | 2,348 | 1,625 | |||||||||
| 13. | Stock Incentive Plans and Stock Purchase Plan: |
The Company’s 2008 Incentive Compensation Plan (the “2008 Incentive Plan”) provides for grants of stock options, stock appreciation rights, restricted stock, deferred stock, and other stock-related awards and performance awards that may be settled in cash, stock or other property. As provided in the 2008 Incentive Plan, no additional grants can be made from the Company’s prior incentive plans, except that new awards will be permitted under the 2004 Incentive Compensation Plan (the “2004 Incentive Plan”) to the extent that shares previously granted under the 2004 Incentive Plan are forfeited, expire or terminate. Under the 2008 Incentive Plan, a total of six million shares were available for the granting of awards, inclusive of the number of shares remaining available for grant under the 2004 Incentive Plan as of May 23, 2008. To date, the only equity awards made by the Company under the 2008 Incentive Plan are for stock options, restricted stock and deferred stock. Collectively, the Company’s prior incentive plans and the 2008 Incentive Plan are referred to as the Stock Incentive Plans.
Under the 2008 Incentive Plan, options to purchase shares of common stock may be granted at a price not less than the fair market value of the shares on the date of grant. The options must be exercised within 10 years from the date of grant and generally become exercisable on a pro rata basis over a three-year period from the date of grant. The Company issues new shares of its common stock upon exercise of its stock options. Restricted stock awards generally vest over periods of three years upon the fulfillment of specified service-based conditions and in certain instances performance-based conditions. Deferred stock awards vest on a cliff basis over a term of five years upon the fulfillment of specified service-based and performance-based conditions. The Company recognizes compensation expense related to its restricted stock and deferred stock awards ratably over the corresponding vesting periods. At December 31, 2010, the Company had approximately 2.2 million shares available for future grants and awards under its Stock Incentive Plans.
In September 2008, the Company’s shareholders approved an amendment to the Company’s 1996 Non-Qualified Employee Stock Purchase Plan (the “Non-Qualified Plan”) to increase the number of shares issuable under the Non-Qualified Plan from 1.5 million to 2.5 million shares. The approved amendment also expanded participation in the Non-Qualified Plan to all employees who formerly participated in the 1996 Qualified Employee Stock Purchase Plan, which was terminated in August 2008. Under the Non-Qualified Plan, employees are permitted to purchase the Company’s common stock at 85% of market value on January 1st, April 1st, July 1st and October 1st of each year. In accordance with the provisions of accounting guidance for stock-based compensation, the Company recognizes stock-based compensation expense for the 15% discount received by participating employees. During the year ended December 31, 2010, 128,158 shares were issued under the Non-Qualified Plan. At December 31, 2010, the Company had approximately 674,000 shares reserved for issuance under the Non-Qualified Plan.
71
Table of Contents
The Company recognized approximately $25.7 million, $24.3 million and $20.8 million of stock-based compensation expense related to its Stock Incentive Plans and Stock Purchase Plan during the years ended December 31, 2010, 2009 and 2008, respectively. The after-tax impact of stock-based compensation expense on net income was approximately $16.7 million, $14.9 million and $12.6 million for the years ended December 31, 2010, 2009 and 2008, respectively.
The activity related to the Company’s restricted and deferred stock awards and the corresponding weighted average grant-date fair values are as follows:
| Number of Shares |
Weighted Average Fair Value |
|||||||
| Non-vested shares at December 31, 2007 |
470,700 | $ | 46.23 | |||||
| Awarded |
325,748 | $ | 54.40 | |||||
| Forfeited |
(6,950 | ) | $ | 49.65 | ||||
| Vested |
(296,811 | ) | $ | 42.84 | ||||
| Non-vested shares at December 31, 2008 |
492,687 | $ | 53.63 | |||||
| Awarded |
552,632 | $ | 41.74 | |||||
| Forfeited |
(25,764 | ) | $ | 45.44 | ||||
| Vested |
(188,222 | ) | $ | 51.65 | ||||
| Non-vested shares at December 31, 2009 |
831,333 | $ | 46.43 | |||||
| Awarded |
436,756 | $ | 54.90 | |||||
| Forfeited |
(8,086 | ) | $ | 46.12 | ||||
| Vested |
(304,554 | ) | $ | 47.13 | ||||
| Non-vested shares at December 31, 2010 |
955,449 | $ | 50.08 | |||||
The aggregate fair value of the restricted shares that vested during the years ended December 31, 2010, 2009 and 2008 was approximately $14.4 million, $9.7 million and $12.7 million, respectively.
At December 31, 2010, the total stock-based compensation cost related to non-vested restricted and deferred stock remaining to be recognized as compensation expense over a weighted-average period of approximately 1.6 years was $22.7 million.
The Company uses the Black-Scholes Model to estimate the fair value of each stock option on the date of grant. The weighted average grant-date fair values for stock options granted during the years ended December 31, 2010, 2009 and 2008 were $18.89, $12.19 and $12.97, respectively, which were calculated using the following weighted average assumptions for expected volatility, expected life, risk-free interest rate and dividend yield:
| Years Ended December 31, | ||||||
| 2010 | 2009 | 2008 | ||||
| Expected volatility |
35% | 32% to 37 |
23% to 29 | |||
| Expected life—officers (in years) |
4.5 | 4.5 | 4.5 | |||
| Expected life—other employees (in years) |
3.5 | 3.5 | 3.5 | |||
| Risk-free interest rate |
2.1% to 2.3 |
1.4% to 2.1 |
2.1% to 3.3 | |||
| Dividend yield |
0% | 0% | 0% | |||
Expected volatility is estimated using sequential periods of historical price data related to the Company’s common stock. The Company assigns expected lives and corresponding risk-free interest rates to two separate homogenous employee groups consisting of officers and all other employees. The Company evaluates the estimated expected lives assigned to its two employee groups, officers and other employees, using historical
72
Table of Contents
exercise data, taking into consideration the impact of partial life cycle data, contractual term and post-vesting cancellations. The risk-free interest rates used are based on the published U.S. Treasury yield curve in effect at the time of the grant for instruments with a similar life. The dividend yield reflects the Company’s dividend yield at the date of grant.
The activity and certain other information related to the Company’s stock option awards are as follows:
| Number of Shares |
Weighted Average Exercise Price |
Weighted Average Remaining Contractual Term (in years) |
Aggregate Intrinsic Value (in millions) |
|||||||||||||
| Outstanding at December 31, 2007 |
2,906,614 | $ | 34.31 | |||||||||||||
| Granted |
773,972 | $ | 54.91 | |||||||||||||
| Canceled |
(22,160 | ) | $ | 48.74 | ||||||||||||
| Exercised |
(231,337 | ) | $ | 23.61 | $ | 9.3 | ||||||||||
| Outstanding at December 31, 2008 |
3,427,089 | $ | 39.59 | |||||||||||||
| Granted |
162,269 | $ | 40.76 | |||||||||||||
| Canceled |
(38,992 | ) | $ | 56.61 | ||||||||||||
| Exercised |
(617,612 | ) | $ | 20.17 | $ | 21.8 | ||||||||||
| Outstanding at December 31, 2009 |
2,932,754 | $ | 43.52 | |||||||||||||
| Granted |
60,747 | $ | 58.26 | |||||||||||||
| Canceled |
(8,667 | ) | $ | 61.27 | ||||||||||||
| Exercised |
(416,901 | ) | $ | 39.25 | $ | 9.1 | ||||||||||
| Outstanding at December 31, 2010 |
2,567,933 | $ | 44.50 | 5.6 | $ | 58.5 | ||||||||||
| Exercisable at December 31, 2010 |
2,133,802 | $ | 43.04 | 5.2 | $ | 51.7 | ||||||||||
At December 31, 2010, the total stock-based compensation cost related to non-vested stock options remaining to be recognized as compensation expense over a weighted-average period of approximately 1.1 years was $1.6 million.
The excess tax benefit related primarily to stock options and restricted stock for the years ended December 31, 2010, 2009 and 2008 was approximately $3.0 million, $6.9 million and $4.3 million, respectively. The cash proceeds received from the exercise of stock options for the years ended December 31, 2010, 2009 and 2008 were approximately $16.4 million, $12.5 million and $5.5 million, respectively.
| 14. | Retirement Plans: |
The Company maintains four qualified contributory savings plans as allowed under Section 401(k) of the Internal Revenue Code and Section 1165(e) of the Puerto Rico Income Tax Act of 1954 (the “401(k) Plans”). The 401(k) Plans permit participant contributions and allow elective and, in certain situations, non-elective Company contributions based on each participant’s contribution or a specified percentage of eligible wages. Participants may defer a percentage of their annual compensation subject to the limits defined in the 401(k) Plans. The Company recorded an expense of $18.2 million, $16.1 million and $13.2 million for the years ended December 31, 2010, 2009 and 2008, respectively, related to the 401(k) Plans.
73
Table of Contents
| 15. | Commitments and Contingencies: |
In September 2006, the Company entered into a settlement agreement with the Department of Justice and a relator who initiated a “qui tam” complaint against the Company relating to its billing practices for services provided from January 1996 through December 1999 that were reimbursed by Medicaid, the Federal Employees Health Benefit program, and the United States Department of Defense’s TRICARE program for military dependents and retirees (“Settlement Agreement”). As part of the Settlement Agreement, the Company is in the final year of a five-year Corporate Integrity Agreement with the Office of Inspector General of the Department of Health and Human Services (the “OIG”). The Corporate Integrity Agreement acknowledges the existence of the Company’s comprehensive Compliance Plan, which provides for policies and procedures aimed at promoting the Company’s adherence with FHC Program requirements and requires the Company to maintain the Compliance Plan in full operation for the term of the Corporate Integrity Agreement. In addition, the Corporate Integrity Agreement requires, among other things, that the Company must comply with the following integrity obligations during the term of the Corporate Integrity Agreement:
| • | maintaining a Chief Compliance Officer and Compliance Committee to administer compliance with FHC Program requirements, the Compliance Plan and the Corporate Integrity Agreement; |
| • | maintaining the Code of Conduct for the Company’s officers, directors, employees, contractors, subcontractors, agents, or other persons who provide patient care items or services (the “Covered Persons”); |
| • | maintaining the written policies and procedures regarding the operation of the Compliance Plan and the Company’s compliance with FHC Program requirements; |
| • | providing general compliance training to the Covered Persons as well as specific training to the Covered Persons who perform coding functions relating to claims for reimbursement from any FHC Program; |
| • | engaging an independent review organization to perform annual reviews of samples of claims from multiple hospital units to assist the Company in assessing and evaluating its coding, billing, and claims-submission practices; |
| • | maintaining the Disclosure Program that includes a mechanism to enable individuals to confidentially disclose issues or questions believed by the individual to be a potential violation of criminal, civil, or administrative laws; |
| • | not hiring or, if employed, removing from the Company’s business operations which are related to or compensated, in whole or part, by FHC Programs, persons (i) convicted of a criminal offense related to the provision of healthcare items or services or (ii) ineligible to participate in FHC Programs or Federal procurement or non-procurement programs; |
| • | notifying the OIG of (i) new investigations or legal proceedings by a governmental entity or its agents involving an allegation that the Company has committed a crime or has engaged in fraudulent activities, (ii) matters that a reasonable person would consider a probable violation of criminal, civil or administrative laws applicable to any FHC Program for which penalties or exclusion may be imposed, and (iii) the purchase, sale, closure, establishment, or relocation of any facility furnishing items or services that are reimbursed under FHC Programs; |
| • | reporting and returning overpayments received from FHC Programs; |
| • | submitting reports to the OIG regarding the Company’s compliance with the Corporate Integrity Agreement; and |
| • | maintaining for inspection, for a period of six years from the effective date, all documents and records relating to reimbursement from the FHC Programs and compliance with the Corporate Integrity Agreement. |
74
Table of Contents
Failure to comply with the Company’s duties under the Corporate Integrity Agreement could result in substantial monetary penalties and in the case of a material breach, could even result in the Company being excluded from participating in FHC Programs. Management believes that the Company was in compliance with the Corporate Integrity Agreement as of December 31, 2010.
In July 2007, the Audit Committee of the Company’s Board of Directors concluded a comprehensive review of the Company’s historical practices related to the granting of stock options. In connection with the review, the Company had discussions with the U.S. Attorney’s office for the Southern District of Florida concerning the matters covered by the review and, in response to a subpoena received in December 2007, provided the office with various documents and information related to the Company’s stock option granting practices. The Company intends to fully cooperate with the U.S. Attorney’s office if there is any additional activity with respect to this matter. In March 2009, the Company settled an investigation by the Securities and Exchange Commission relating to this matter by entering into a consent decree.
The Company expects that additional audits, inquiries and investigations from government authorities and agencies will continue to occur in the ordinary course of business. Such audits, inquiries and investigations and their ultimate resolutions, individually or in the aggregate, could have a material adverse effect on the Company’s business, financial condition, results of operations, cash flows and the trading price of its common stock.
In the ordinary course of business, the Company becomes involved in pending and threatened legal actions and proceedings, most of which involve claims of medical malpractice related to medical services provided by the Company’s affiliated physicians. The Company’s contracts with hospitals generally require the Company to indemnify them and their affiliates for losses resulting from the negligence of the Company’s affiliated physicians. The Company may also become subject to other lawsuits which could involve large claims and significant defense costs. The Company believes, based upon a review of pending actions and proceedings, that the outcome of such legal actions and proceedings will not have a material adverse effect on its business, financial condition or results of operations. The outcome of such actions and proceedings, however, cannot be predicted with certainty and an unfavorable resolution of one or more of them could have a material adverse effect on the Company’s business, financial condition, results of operations, cash flows and the trading price of its common stock.
Although the Company currently maintains liability insurance coverage intended to cover professional liability and certain other claims, the Company cannot assure that its insurance coverage will be adequate to cover liabilities arising out of claims asserted against it in the future where the outcomes of such claims are unfavorable. With respect to professional liability risk, the Company generally self-insures a portion of this risk through its wholly owned captive insurance subsidiary. Liabilities in excess of the Company’s insurance coverage, including coverage for professional liability and certain other claims, could have a material adverse effect on the Company’s business, financial condition and results of operations. See “Professional and General Liability Coverage” in Item 1 of this Form 10-K.
The Company leases space for certain corporate offices and its regional offices and medical offices, storage space and temporary housing of medical staff. Rent expense for the years ended December 31, 2010, 2009 and 2008 was approximately $19.8 million, $18.1 million, and $14.3 million, respectively.
75
Table of Contents
Future minimum lease payments under non-cancelable operating leases as of December 31, 2010 are as follows (in thousands):
| 2011 |
$ | 18,198 | ||
| 2012 |
13,748 | |||
| 2013 |
10,552 | |||
| 2014 |
8,267 | |||
| 2015 |
4,728 | |||
| Thereafter |
2,498 | |||
| $ | 57,991 | |||
| 16. | Selected Quarterly Financial Information (Unaudited): |
The following tables set forth a summary of the Company’s selected quarterly financial information for each of the four quarters ended December 31, 2010 and 2009 (in thousands, except for per share data):
| 2010 Quarters | ||||||||||||||||
| First | Second | Third | Fourth | |||||||||||||
| Net patient service revenue |
$ | 332,927 | $ | 349,094 | $ | 351,058 | $ | 368,480 | ||||||||
| Operating expenses: |
||||||||||||||||
| Practice salaries and benefits |
213,402 | 208,762 | 211,884 | 220,872 | ||||||||||||
| Practice supplies and other operating expenses |
13,095 | 14,062 | 13,980 | 16,374 | ||||||||||||
| General and administrative expenses |
38,099 | 39,164 | 37,499 | 39,505 | ||||||||||||
| Depreciation and amortization |
4,780 | 5,006 | 6,321 | 5,843 | ||||||||||||
| Total operating expenses |
269,376 | 266,994 | 269,684 | 282,594 | ||||||||||||
| Income from operations |
63,551 | 82,100 | 81,374 | 85,886 | ||||||||||||
| Investment income |
404 | 265 | 438 | 327 | ||||||||||||
| Interest expense |
(710 | ) | (1,118 | ) | (481 | ) | (884 | ) | ||||||||
| Income before income taxes |
63,245 | 81,247 | 81,331 | 85,329 | ||||||||||||
| Income tax provision |
24,982 | 31,889 | 20,061 | 31,529 | ||||||||||||
| Net income |
$ | 38,263 | $ | 49,358 | $ | 61,270 | $ | 53,800 | ||||||||
| Per common and common equivalent share data (1): |
||||||||||||||||
| Net income: |
||||||||||||||||
| Basic |
$ | 0.83 | $ | 1.06 | $ | 1.31 | $ | 1.15 | ||||||||
| Diluted |
$ | 0.81 | $ | 1.04 | $ | 1.29 | $ | 1.12 | ||||||||
| Weighted average shares: |
||||||||||||||||
| Basic |
46,300 | 46,516 | 46,788 | 46,914 | ||||||||||||
| Diluted |
47,267 | 47,528 | 47,482 | 47,998 | ||||||||||||
| (1) | Basic and diluted per share amounts are computed for each of the periods presented. Accordingly, the sum of the quarterly per share amounts may not agree with the full year amount. |
76
Table of Contents
| 2009 Quarters | ||||||||||||||||
| First | Second | Third | Fourth | |||||||||||||
| Net patient service revenue |
$ | 303,885 | $ | 319,815 | $ | 331,276 | $ | 333,288 | ||||||||
| Operating expenses: |
||||||||||||||||
| Practice salaries and benefits |
194,008 | 191,756 | 198,229 | 199,500 | ||||||||||||
| Practice supplies and other operating expenses |
12,641 | 12,798 | 13,100 | 13,693 | ||||||||||||
| General and administrative expenses |
36,650 | 36,295 | 37,648 | 36,569 | ||||||||||||
| Depreciation and amortization |
3,963 | 4,187 | 3,956 | 4,342 | ||||||||||||
| Total operating expenses |
247,262 | 245,036 | 252,933 | 254,104 | ||||||||||||
| Income from operations |
56,623 | 74,779 | 78,343 | 79,184 | ||||||||||||
| Investment income |
441 | 429 | 430 | 382 | ||||||||||||
| Interest expense |
(1,011 | ) | (824 | ) | (570 | ) | (506 | ) | ||||||||
| Income before income taxes |
56,053 | 74,384 | 78,203 | 79,060 | ||||||||||||
| Income tax provision |
22,001 | 31,167 | 30,069 | 28,659 | ||||||||||||
| Net income |
$ | 34,052 | $ | 43,217 | $ | 48,134 | $ | 50,401 | ||||||||
| Per common and common equivalent share data (1): |
||||||||||||||||
| Net income: |
||||||||||||||||
| Basic |
$ | 0.75 | $ | 0.95 | $ | 1.05 | $ | 1.10 | ||||||||
| Diluted |
$ | 0.74 | $ | 0.93 | $ | 1.03 | $ | 1.07 | ||||||||
| Weighted average shares: |
||||||||||||||||
| Basic |
45,282 | 45,446 | 45,663 | 45,918 | ||||||||||||
| Diluted |
45,931 | 46,253 | 46,664 | 47,054 | ||||||||||||
| (1) | Basic and diluted per share amounts are computed for each of the periods presented. Accordingly, the sum of the quarterly per share amounts may not agree with the full year amount. |
77
Table of Contents
| ITEM 9. | CHANGES IN AND DISAGREEMENTS WITH ACCOUNTANTS ON ACCOUNTING AND FINANCIAL DISCLOSURE |
None.
| ITEM 9A. | CONTROLS AND PROCEDURES |
Evaluation of Disclosure Controls and Procedures
We carried out an evaluation, under the supervision and with the participation of our management, including our Chief Executive Officer and Chief Financial Officer, of the effectiveness of our disclosure controls and procedures (as defined in Rules 13a-15(e) and 15d-15(e) under the Securities Exchange Act of 1934, as amended). Based upon that evaluation, the Chief Executive Officer and Chief Financial Officer have concluded that our disclosure controls and procedures were effective as of the end of the period covered by this report.
Management’s Annual Report on Internal Control Over Financial Reporting
Management of the Company is responsible for establishing and maintaining adequate internal control over financial reporting as defined in Rule 13a-15(f) or 15d-15(f) promulgated under the Securities Exchange Act of 1934, as amended. The Company’s internal control over financial reporting includes those policies and procedures that (i) pertain to the maintenance of records that, in reasonable detail, accurately and fairly reflect the transactions and dispositions of the assets of the Company; (ii) provide reasonable assurance that transactions are recorded as necessary to permit preparation of financial statements in accordance with generally accepted accounting principles, and that receipts and expenditures of the Company are being made only in accordance with authorizations of management and directors of the Company; and (iii) provide reasonable assurance regarding the prevention or timely detection of unauthorized acquisition, use, or disposition of the Company’s assets that could have a material effect on the Company’s financial statements.
Internal control over financial reporting is designed to provide reasonable assurance regarding the reliability of financial reporting and the preparation of financial statements prepared for external purposes in accordance with generally accepted accounting principles. Because of its inherent limitations, internal control over financial reporting may not prevent or detect misstatements. Also, projections of any evaluation of effectiveness to future periods are subject to the risk that controls may become inadequate because of changes in conditions, or that the degree of compliance with the policies or procedures may deteriorate.
Management assessed the effectiveness of the Company’s internal control over financial reporting as of the end of the period covered by this report. In making this assessment, management used the criteria set forth by the Committee of Sponsoring Organizations of the Treadway Commission (“COSO”) in “Internal Control—Integrated Framework.” Based on our assessment we concluded that, as of the end of the period covered by this report, the Company’s internal control over financial reporting was effective based on those criteria.
The Company’s independent registered certified public accounting firm, PricewaterhouseCoopers LLP, has audited our internal control over financial reporting as of December 31, 2010 as stated in their report which appears on page 53 of this Annual Report on Form 10-K.
Changes in Internal Control Over Financial Reporting
No change in our internal control over financial reporting occurred during our last fiscal quarter that has materially affected, or is reasonably likely to materially affect, our internal control over financial reporting.
78
Table of Contents
PART III
| ITEM 10. | DIRECTORS, EXECUTIVE OFFICERS AND CORPORATE GOVERNANCE |
The information required by this Item is incorporated by reference to the applicable information in the definitive proxy statement for our 2011 Annual Meeting of Shareholders, which is to be filed with the SEC within 120 days after our fiscal year end.
| ITEM 11. | EXECUTIVE COMPENSATION |
The information required by this Item is incorporated by reference to the applicable information in the definitive proxy statement for our 2011 Annual Meeting of Shareholders, which is to be filed with the SEC within 120 days after our fiscal year end.
| ITEM 12. | SECURITY OWNERSHIP OF CERTAIN BENEFICIAL OWNERS AND MANAGEMENT AND RELATED STOCKHOLDER MATTERS |
SECURITIES AUTHORIZED FOR ISSUANCE UNDER EQUITY COMPENSATION PLANS
The following table provides information as of December 31, 2010, with respect to shares of our common stock that may be issued under existing equity compensation plans, including our 2008 Incentive Compensation Plan, as amended (“2008 Incentive Plan”), our 2004 Incentive Compensation Plan, as amended (“2004 Incentive Plan”), our Amended and Restated Stock Option Plan, as amended (the “Option Plan”), and our 1996 Non-Qualified Employee Stock Purchase Plan, as amended and restated (the “Stock Purchase Plan”).
| Plan Category |
Number of securities to be issued upon exercise of outstanding options, warrants and rights |
Weighted-average exercise price of outstanding options, warrants and rights |
Number of securities remaining available for future issuance under equity compensation plans (excluding securities reflected in column (a)) |
|||||||||
| (a) | (b) | (c) | ||||||||||
| Equity compensation plans approved by security holders |
2,567,933 | (1) | $ | 44.50 | 2,922,592 | (2) | ||||||
| Equity compensation plans not approved by security holders |
N/A | N/A | N/A | |||||||||
| Total |
2,567,933 | $ | 44.50 | 2,922,592 | ||||||||
| (1) | Represents 931,328 shares issuable under the 2008 Incentive Plan, 1,052,974 shares issuable under the 2004 Incentive Plan and 583,631 shares issuable under the Option Plan. |
| (2) | Under the 2008 Incentive Plan, the 2004 Incentive Plan and the Stock Purchase Plan, 2,211,949, 36,753 and 673,890 shares, respectively, remain available for future issuance. |
The remaining information required by this Item is incorporated by reference to the applicable information in the definitive proxy statement for our 2011 Annual Meeting of Shareholders, which is to be filed with the SEC within 120 days after our fiscal year end.
| ITEM 13. | CERTAIN RELATIONSHIPS AND RELATED TRANSACTIONS, AND DIRECTOR INDEPENDENCE |
The information required by this Item is incorporated by reference to the applicable information in the definitive proxy statement for our 2011 Annual Meeting of Shareholders, which is to be filed with the SEC within 120 days after our fiscal year end.
| ITEM 14. | PRINCIPAL ACCOUNTING FEES AND SERVICES |
The information required by this Item is incorporated by reference to the applicable information in the definitive proxy statement for our 2011 Annual Meeting of Shareholders, which is to be filed with the SEC within 120 days after our fiscal year end.
79
Table of Contents
PART IV
| ITEM 15. | EXHIBITS AND FINANCIAL STATEMENT SCHEDULE |
| (a)(1) Financial | Statements |
The information required by this Item is included in Item 8 of Part II of this Form 10-K.
| (a)(2) Financial | Statement Schedules |
The following financial statement schedule for the years ended December 31, 2010, 2009 and 2008, is included in this Form 10-K as set forth below (in thousands).
Schedule II: Valuation and Qualifying Accounts
| Years Ended December 31, | ||||||||||||
| 2010 | 2009 | 2008 | ||||||||||
| Allowance for contractual adjustments and uncollectibles: |
||||||||||||
| Balance at beginning of year |
$ | 377,506 | $ | 369,446 | $ | 313,131 | ||||||
| Amount charged against operating revenue |
2,825,827 | 2,444,222 | 2,006,415 | |||||||||
| Accounts receivable contractual adjustments and write-offs (net of recoveries) |
(2,781,356 | ) | (2,436,162 | ) | (1,950,100 | ) | ||||||
| Balance at end of year |
$ | 421,977 | $ | 377,506 | $ | 369,446 | ||||||
All other schedules have been omitted because they are not applicable, not required or the information is included elsewhere herein.
| (a)(3) Exhibits |
See Item 15(b) of this Form 10-K.
| (b) Exhibits |
| 2.1 | Agreement and Plan of Merger, dated as of December 29, 2008, between MEDNAX, Inc., Pediatrix Medical Group, Inc. and PMG Merger Sub, Inc. (incorporated by reference to Exhibit 2.1 to MEDNAX’s Current Report on Form 8-K dated January 2, 2009). | |
| 3.1 | Amended and Restated Articles of Incorporation of MEDNAX, Inc. (incorporated by reference to Exhibit 3.1 to MEDNAX’s Current Report on Form 8-K dated January 2, 2009). | |
| 3.2 | Articles of Amendment Designating Series A Junior Participating Preferred Stock of MEDNAX, Inc. (incorporated by reference to Exhibit 3.2 to MEDNAX’s Current Report on Form 8-K dated January 2, 2009). | |
| 3.3 | Amended and Restated By-laws of MEDNAX, Inc. (incorporated by reference to Exhibit 3.3 to MEDNAX’s Current Report on Form 8-K dated January 2, 2009). | |
| 10.1 | Credit Agreement, dated as of September 3, 2008, among Wachovia Bank, National Association, as Administrative Agent, Bank of America, N.A., as Syndication Agent, the Lenders party thereto and Pediatrix Medical Group, Inc. and certain of its domestic subsidiaries named as Guarantors therein (incorporated by reference to Exhibit 99.2 to Pediatrix’s Current Report on Form 8-K dated September 4, 2008). | |
80
Table of Contents
| 10.2 | Assignment and Joinder Agreement, dated as of January 1, 2009, among MEDNAX, Inc., MEDNAX Services, Inc., the Guarantors identified on the signature pages thereto and Wachovia Bank, National Association, in its capacity as Administrative Agent (incorporated by reference to Exhibit 10.1 to MEDNAX’s Current Report on Form 8-K dated January 2, 2009). | |
| 10.3 | Amended and Restated Stock Option Plan of Pediatrix dated as of June 4, 2003 (incorporated by reference to Exhibit 10.5 to Pediatrix’s Quarterly Report on Form 10-Q for the period ended June 30, 2003).* | |
| 10.4 | First Amendment, dated December 29, 2008, to Pediatrix Medical Group, Inc. Amended and Restated Stock Option Plan (incorporated by reference to Exhibit 10.7 to MEDNAX’s Current Report on Form 8-K dated January 2, 2009).* | |
| 10.5 | 1996 Non-Qualified Employee Stock Purchase Plan of MEDNAX, Inc., as amended and restated, dated January 1, 2009 (incorporated by reference to Exhibit 10.6 to MEDNAX’s Current Report on Form 8-K dated January 2, 2009).* | |
| 10.6 | Executive Non-Qualified Deferred Compensation Plan of Pediatrix, dated October 13, 1997 (incorporated by reference to Exhibit 10.35 to Pediatrix’s Quarterly Report on Form 10-Q for the period ended June 30, 1998).* | |
| 10.7 | Amended and Restated Thrift and Profit Sharing Plan of Pediatrix (incorporated by reference to Exhibit 4.5 to Pediatrix’s Registration Statement on Form S-8 (Registration No. 333-101222)).* | |
| 10.8 | Pediatrix Medical Group of Puerto Rico Thrift and Profit Sharing Plan (incorporated by reference to Exhibit 4.3 to Pediatrix’s Registration Statement on Form S-8 dated December 9, 2004).* | |
| 10.9 | Pediatrix Medical Group, Inc. 2004 Incentive Compensation Plan (incorporated by reference to Exhibit A of Pediatrix’s Proxy Statement on Schedule 14A dated as of April 9, 2004).* | |
| 10.10 | Second Amendment, dated December 29, 2008, to Pediatrix Medical Group, Inc. 2004 Incentive Compensation Plan (incorporated by reference to Exhibit 10.8 to MEDNAX’s Current Report on Form 8-K dated January 2, 2009).* | |
| 10.11 | Pediatrix Medical Group, Inc. 2008 Incentive Compensation Plan (incorporated by reference to Exhibit A of Pediatrix’s Proxy Statement on Schedule 14A dated as of April 8, 2008).* | |
| 10.12 | First Amendment, dated December 29, 2008, to Pediatrix Medical Group, Inc. 2008 Incentive Compensation Plan (incorporated by reference to Exhibit 10.9 to MEDNAX’s Current Report on Form 8-K dated January 2, 2009).* | |
| 10.13 | Pediatrix Medical Group, Inc. Form of Stock Option Agreement for Stock Options Awarded Under the Amended and Restated Stock Option Plan (incorporated by reference to Exhibit 10.3 to Pediatrix’s Current Report on Form 8-K dated February 23, 2005).* | |
| 10.14 | Pediatrix Medical Group, Inc. Form of Incentive Stock Option Agreement for Incentive Stock Options Awarded Under the 2004 Incentive Compensation Plan (incorporated by reference to Exhibit 10.4 to Pediatrix’s Current Report on Form 8-K dated February 23, 2005).* | |
| 10.15 | Pediatrix Medical Group, Inc. Form of Non-Qualified Stock Option Agreement for Non-Qualified Stock Options Awarded Under the 2004 Incentive Compensation Plan (incorporated by reference to Exhibit 10.5 to Pediatrix’s Current Report on Form 8-K dated February 23, 2005).* | |
| 10.16 | Pediatrix Medical Group, Inc. Form of Restricted Stock Agreement for Restricted Stock Awarded Under the 2004 Incentive Compensation Plan (incorporated by reference to Exhibit 10.5 to Pediatrix’s Current Report on Form 8-K dated February 23, 2005).* | |
| 10.17 | MEDNAX, Inc. Form of Non-Qualified Stock Option Agreement for Non-Qualified Stock Options Awarded Under the 2008 Incentive Compensation Plan (incorporated by reference to Exhibit 10.17 to MEDNAX’s Annual Report on Form 10-K for the year ended December 31, 2008).* | |
81
Table of Contents
| 10.18 | MEDNAX, Inc. Form of Restricted Stock Agreement for Restricted Stock Awarded Under the 2008 Incentive Compensation Plan (incorporated by reference to Exhibit 10.18 to MEDNAX’s Annual Report on Form 10-K for the year ended December 31, 2008).* | |
| 10.19 | Employment Agreement, dated August 20, 2008, by and between Pediatrix Medical Group, Inc. and Roger J. Medel, M.D. (incorporated by reference to Exhibit 10.1 to Pediatrix’s Current Report on Form 8-K dated August 22, 2008).* | |
| 10.20 | Amendment Agreement, dated December 29, 2008, between MEDNAX, Inc., Pediatrix Medical Group, Inc. and Roger J. Medel, M.D. (incorporated by reference to Exhibit 10.2 to MEDNAX’s Current Report on Form 8-K dated January 2, 2009).* | |
| 10.21 | Employment Agreement, dated August 20, 2008, by and between Pediatrix Medical Group, Inc. and Joseph M. Calabro (incorporated by reference to Exhibit 10.2 to Pediatrix’s Current Report on Form 8-K dated August 22, 2008).* | |
| 10.22 | Amendment Agreement, dated December 29, 2008, between MEDNAX, Inc., Pediatrix Medical Group, Inc. and Joseph M. Calabro (incorporated by reference to Exhibit 10.3 to MEDNAX’s Current Report on Form 8-K dated January 2, 2009).* | |
| 10.23 | Employment Agreement, dated August 20, 2008, by and between Pediatrix Medical Group, Inc. and Karl B. Wagner (incorporated by reference to Exhibit 10.3 to Pediatrix’s Current Report on Form 8-K dated August 22, 2008).* | |
| 10.24 | Amendment Agreement, dated December 29, 2008, between MEDNAX, Inc., Pediatrix Medical Group, Inc. and Karl B. Wagner (incorporated by reference to Exhibit 10.4 to MEDNAX’s Current Report on Form 8-K dated January 2, 2009).* | |
| 10.25 | Second Amendment Agreement, dated February 24, 2010, by and among Mednax, Inc., Mednax Services, Inc., American Anesthesiology, Inc. and Karl B. Wagner (incorporated by reference to Exhibit 10.25 to MEDNAX’s Annual Report on Form 10-K for the year ended December 31, 2009).* | |
| 10.26 | Employment Agreement, dated August 20, 2008, by and between Pediatrix Medical Group, Inc. and Thomas W. Hawkins (incorporated by reference to Exhibit 10.4 to Pediatrix’s Current Report on Form 8-K dated August 22, 2008).* | |
| 10.27 | Amendment Agreement, dated December 29, 2008, between MEDNAX, Inc., Pediatrix Medical Group, Inc. and Thomas W. Hawkins (incorporated by reference to Exhibit 10.5 to MEDNAX’s Current Report on Form 8-K dated January 2, 2009).* | |
| 10.28 | Employment Agreement, dated February 24, 2010, by and between MEDNAX Services, Inc. and Vivian Lopez-Blanco (incorporated by reference to Exhibit 10.28 to MEDNAX’s Annual Report on Form 10-K for the year ended December 31, 2009).* | |
| 10.29 | Employment Agreement, dated August 11, 2008, by and between Pediatrix Medical Group, Inc. and Frederick V. Miller, M.D (incorporated by reference to Exhibit 10.29 to MEDNAX’s Annual Report on Form 10-K for the year ended December 31, 2009).* | |
| 10.30 | Amendment Agreement, dated December 31, 2008, between MEDNAX, Inc., Pediatrix Medical Group, Inc. and Frederick V. Miller, M.D. (incorporated by reference to Exhibit 10.30 to MEDNAX’s Annual Report on Form 10-K for the year ended December 31, 2009).* | |
| 10.31 | Restricted Shares Units Agreement for Roger J. Medel, M.D. dated August 20, 2008 (incorporated by reference to Exhibit 10.5 to Pediatrix’s Current Report on Form 8-K dated August 22, 2008).* | |
| 10.32 | Restricted Shares Units Agreement for Roger J. Medel, M.D. dated August 20, 2008 (incorporated by reference to Exhibit 10.6 to Pediatrix’s Current Report on Form 8-K dated August 22, 2008).* | |
82
Table of Contents
| 10.33 | Form of Indemnification Agreement between Pediatrix and each of its directors and executive officers. (incorporated by reference to Exhibit 10.6 to Pediatrix’s Annual Report on Form 10-K for the year ended December 31, 2003).* | |
| 10.34 | Form of Amended and Restated Exclusive Management and Administrative Services Agreement with affiliated professional contractors (incorporated by reference to Exhibit 10.7 to Pediatrix’s Annual Report on Form 10-K for the year ended December 31, 2003). | |
| 10.35 | Settlement Agreement, effective September 21, 2006, among the United States Department of Justice and on behalf of the Office of the Inspector General of the Department of Health and Human Services the TRICARE Management Activity, through its General Counsel, and the Office of Personnel Management (“OPM”), which administers the Federal Employees Health Benefits Program (collectively the “United States”); Pediatrix Medical Group, Inc. and Daniel M. Hall, MD (incorporated by reference to Exhibit 10.1 to Pediatrix’s Current Report on Form 8-K dated September 22, 2006). | |
| 10.36 | Model State Settlement Agreement (incorporated by reference to Exhibit 10.2 to Pediatrix’s Current Report on Form 8-K dated September 22, 2006). | |
| 10.37 | Corporate Integrity Agreement, effective September 20, 2006, among Pediatrix and the Office of Inspector General (OIG) of the United States Department of Health and Human Services (HHS) to promote compliance with the statutes, regulations, and written directives of Medicare, Medicaid, TRICARE, and all other Federal healthcare programs (as defined in 42 U.S.C. § 1320a-7b(f)) (Federal healthcare program requirements) (incorporated by reference to Exhibit 10.3 to Pediatrix’s Current Report on Form 8-K dated September 22, 2006). | |
| 10.38 | Stipulation of Settlement dated January 16, 2008, by and among Pediatrix, certain of the Pediatrix’s current and former officers and directors and Jacob Schwartz (incorporated by reference to Exhibit 10.1 to Pediatrix’s current report of Form 8-K dated January 16, 2008). | |
| 21.1+ | Subsidiaries of the Registrant. | |
| 23.1+ | Consent of PricewaterhouseCoopers LLP. | |
| 31.1+ | Certification of Chief Executive Officer pursuant to Securities Exchange Act Rule 13a-14(a), as adopted pursuant to Section 302 of the Sarbanes-Oxley Act of 2002. | |
| 31.2+ | Certification of Chief Financial Officer pursuant to Securities Exchange Act Rule 13a-14(a), as adopted pursuant to Section 302 of the Sarbanes-Oxley Act of 2002. | |
| 32+ | Certification pursuant to 18 U.S.C. Section 1350, as adopted pursuant to Section 906 of the Sarbanes-Oxley Act of 2002. | |
| 101.INS++ | XBRL Instance Document. | |
| 101.SCH++ | XBRL Taxonomy Extension Schema Document. | |
| 101.CAL++ | XBRL Taxonomy Extension Calculation Linkbase Document. | |
| 101.DEF++ | XBRL Taxonomy Extension Definition Linkbase Document. | |
| 101.LAB++ | XBRL Taxonomy Extension Label Linkbase Document. | |
| 101.PRE++ | XBRL Taxonomy Extension Presentation Linkbase Document. | |
| * | Management contracts or compensation plans, contracts or arrangements. |
| + | Filed herewith |
| ++ | Pursuant to Rule 406T of Regulation S-T, these interactive data files are deemed not filed or part of a registration statement or prospectus for purposes of Sections 11 or 12 of the Securities Act of 1933, as amended, are deemed not filed for purposes of Section 18 of the Securities Exchange Act of 1934, as amended, and otherwise are not subject to liability under those sections. |
83
Table of Contents
SIGNATURES
Pursuant to the requirements of Section 13 or 15(d) of the Securities Exchange Act of 1934, the registrant has duly caused this report to be signed on its behalf by the undersigned, thereunto duly authorized.
| MEDNAX, INC. | ||||||
| Date: February 24, 2011 | By: | /s/ Roger J. Medel, M.D. | ||||
| Roger J. Medel, M.D. | ||||||
| Chief Executive Officer | ||||||
Pursuant to the requirements of the Securities Exchange Act of 1934, this report has been signed below by the following persons on behalf of the registrant in the capacities and on the dates indicated.
| Signature |
Title |
Date | ||
| /s/ Roger J. Medel, M.D. Roger J. Medel, M.D. |
Chief Executive Officer (Principal Executive Officer) |
February 24, 2011 | ||
| /s/ Vivian Lopez-Blanco Vivian Lopez-Blanco |
Chief Financial Officer and Treasurer (Principal Financial Officer and Principal Accounting Officer) | February 24, 2011 | ||
| /s/ Cesar L. Alvarez Cesar L. Alvarez |
Director and Chairman of the Board | February 24, 2011 | ||
| /s/ Waldemar A. Carlo, M.D. Waldemar A. Carlo, M.D. |
Director | February 24, 2011 | ||
| /s/ Michael B. Fernandez Michael B. Fernandez |
Director | February 24, 2011 | ||
| /s/ Roger K. Freeman, M.D. Roger K. Freeman, M.D. |
Director | February 24, 2011 | ||
| /s/ Paul G. Gabos Paul G. Gabos |
Director | February 24, 2011 | ||
| /s/ Dany Garcia Dany Garcia |
Director | February 24, 2011 | ||
| /s/ Pascal J. Goldschmidt, M.D. Pascal J. Goldschmidt, M.D. |
Director | February 24, 2011 | ||
| /s/ Manuel Kadre Manuel Kadre |
Director | February 24, 2011 | ||
| /s/ Donna E. Shalala, Ph.D. Donna E. Shalala, Ph.D. |
Director | February 24, 2011 | ||
| /s/ Enrique J. Sosa, Ph.D. Enrique J. Sosa, Ph.D. |
Director | February 24, 2011 | ||
84