Attached files
| file | filename |
|---|---|
| EX-21.1 - Duff & Phelps Corp | v212153_ex21-1.htm |
| EX-32.2 - Duff & Phelps Corp | v212153_ex32-2.htm |
| EX-31.1 - Duff & Phelps Corp | v212153_ex31-1.htm |
| EX-31.2 - Duff & Phelps Corp | v212153_ex31-2.htm |
| EX-32.1 - Duff & Phelps Corp | v212153_ex32-1.htm |
| EX-23.1 - Duff & Phelps Corp | v212153_ex23-1.htm |
UNITED STATES
SECURITIES AND EXCHANGE COMMISSION
Washington, D.C. 20549
FORM 10-K
|
x
|
ANNUAL REPORT PURSUANT TO SECTION 13 OR 15(d) OF THE SECURITIES EXCHANGE ACT OF 1934
|
|
|
For the year ended December 31, 2010
|
|
|
or
|
|
¨
|
TRANSITION REPORT PURSUANT TO SECTION 13 OR 15(d) OF THE SECURITIES EXCHANGE ACT OF 1934
|
|
|
For the transition period from _______ to ________.
|
Commission File No. 001-33693
DUFF & PHELPS CORPORATION
(Exact name of registrant as specified in its charter)
|
Delaware
|
20-8893559
|
|
|
(State or Other Jurisdiction of
Incorporation or Organization)
|
(I.R.S. Employer
Identification No.)
|
55 East 52nd Street, 31st Floor
New York, New York 10055
(Address of Principal Executive Offices) (Zip Code)
Registrant’s telephone number, including area code: (212) 871-2000
Securities registered pursuant to Section 12(b) of the Act:
|
Title of each class
|
Name of each exchange on which registered
|
|
|
Class A Common Stock, $0.01 par value
|
New York Stock Exchange
|
Securities registered pursuant to Section 12(g) of the Act: None
Indicate by check mark if the registrant is a well-known seasoned issuer, as defined in Rule 405 of the Securities Act. Yes ¨ No x
Indicate by check mark if the registrant is not required to file reports pursuant to Section 13 or Section 15(d) of the Act. Yes ¨ No x
Indicate by check mark whether the registrant (1) has filed all reports required to be filed by Section 13 or 15(d) of the Securities Exchange Act of 1934 during the preceding 12 months (or for such shorter period that the registrant was required to file such reports), and (2) has been subject to such filing requirements for the past 90 days. Yes x No ¨
Indicate by check mark whether the registrant has submitted electronically and posted on its corporate Website, if any, every Interactive Data File required to be submitted and posted pursuant to Rule 405 of Regulation S-T (of this chapter) during the preceding 12 months (or for such shorter period that the registrant was required to submit and post such files). Yes ¨ No ¨
Indicate by check mark if disclosure of delinquent filers pursuant to Item 405 of Regulation S-K is not contained herein and will not be contained, to the best of the registrant’s knowledge, in the definitive proxy or information statements incorporated by reference in Part III of this Form 10-K or any amendment to this Form 10-K. x
Indicate by check mark whether the registrant is a large accelerated filer, an accelerated filer, a non-accelerated filer, or a smaller reporting company. See the definitions of “large accelerated filer,” “accelerated filer” and “smaller reporting company” in Rule 12b-2 of the Exchange Act.
Large Accelerated Filer ¨ Accelerated Filer x Non-Accelerated Filer ¨ Smaller Reporting Company ¨
Indicate by check whether the registrant is a shell company (as defined in Rule 12b-2 of the Exchange Act). Yes ¨ No x
The aggregate market value of the registrant’s Class A common stock held by non-affiliates was $381.9 million as of June 30, 2010, based on the closing price of the registrant’s Class A common stock reported on the New York Stock Exchange on such date of $12.63 per share, assuming the conversion of all shares of Class B common stock into shares of Class A common stock and exclusion of common equity held by affiliates.
The number of shares outstanding of the registrant’s Class A common stock, par value $0.01 per share, was 30,168,386 as of January 31, 2011. The number of shares outstanding of the registrant’s Class B common stock, par value $0.0001 per share, was 11,150,997 as of January 31, 2011.
Documents Incorporated by Reference
Portions of the registrant’s consolidated financial statements are incorporated by reference into Part I and Part II of this Form 10-K. Portions of the registrant’s Proxy Statement for its 2011 Annual Meeting of Stockholders are incorporated by reference into Part III of this Form 10-K.
DUFF & PHELPS CORPORATION
FORM 10-K
TABLE OF CONTENTS
|
Page
|
||
|
PART I
|
||
|
Item 1.
|
Business
|
1
|
|
Item 1A.
|
Risk Factors
|
11
|
|
Item 1B.
|
Unresolved Staff Comments
|
21
|
|
Item 2.
|
Properties
|
21
|
|
Item 3.
|
Legal Proceedings
|
21
|
|
Item 4.
|
(Removed and Reserved)
|
21
|
|
PART II
|
||
|
Item 5.
|
Market for Registrant’s Common Equity, Related Stockholder Matters and Issuer Purchases of Equity Securities
|
22
|
|
Item 6.
|
Selected Financial Data
|
25
|
|
Item 7.
|
Management’s Discussion and Analysis of Financial Condition and Results of Operations
|
29
|
|
Item 7A.
|
Quantitative and Qualitative Disclosures About Market Risk
|
63
|
|
Item 8.
|
Financial Statements and Supplementary Data
|
63
|
|
Item 9.
|
Changes in and Disagreements with Accountants on Accounting and Financial Disclosure
|
63
|
|
Item 9A.
|
Controls and Procedures
|
64
|
|
Item 9B.
|
Other Information
|
65
|
|
PART III
|
||
|
Item 10.
|
Directors, Executive Officers and Corporate Governance.
|
65
|
|
Item 11.
|
Executive Compensation
|
65
|
|
Item 12.
|
Security Ownership of Certain Beneficial Owners and Management and Related Stockholder Matters
|
65 |
|
Item 13.
|
Certain Relationships and Related Transactions, and Director Independence
|
65
|
|
Item 14.
|
Principal Accountant Fees and Services
|
65
|
|
PART IV
|
||
|
Item 15.
|
Exhibits, Financial Statement Schedules
|
66
|
|
Signatures
|
67
|
Forward-Looking Statements
This report contains forward-looking statements within the meaning of Section 27A of the Securities Act of 1933 and Section 21E of the Securities Exchange Act of 1934 (the “Exchange Act”), which reflect the Company’s current views with respect to, among other things, future events and financial performance. The Company generally identifies forward looking statements by terminology such as “outlook,” “believes,” “expects,” “potential,” “continues,” “may,” “will,” “could,” “should,” “seeks,” “approximately,” “predicts,” “intends,”
“plans,” “estimates,” “anticipates” or the negative version of those words or other comparable words. Any forward-looking statements contained in this discussion are based upon our historical performance and on our current plans, estimates and expectations. The inclusion of this forward-looking information should not be regarded as a representation by us, or any other person that the future plans, estimates or expectations contemplated by us will be achieved. Such forward-looking statements are subject to various risks and uncertainties and assumptions relating to our operations, financial results, financial condition, business prospects, growth strategy and liquidity. If one or more of these or other risks or uncertainties materialize, or if our underlying assumptions prove to be incorrect, our actual
results may vary materially from those indicated in these statements. These factors should not be construed as exhaustive and should be read in conjunction with the other cautionary statements and the risk factors section that are included in this Annual Report on Form 10-K and any subsequent filings of our Quarterly Reports on Form 10-Q. The forward-looking statements included in this Annual Report on Form 10-K are made only as of the date of this filing with the Securities and Exchange Commission. The Company does not undertake any obligation to publicly update or review any forward-looking statement, whether as a result of new information, future developments or otherwise.
In this report, references to the “Company,” “we,” “us,” “our” and “Successor” refer to Duff & Phelps Corporation and its consolidated subsidiaries during the period subsequent to October 3, 2007, the date we consummated our initial public offering (“IPO”) and related transactions. Prior to the IPO, Duff & Phelps Acquisitions, LLC and its subsidiaries (“D&P Acquisitions” or “Predecessor”) was comprised of certain consolidated entities under the common ownership of D&P Acquisitions. References to “revenue” or “revenues” refer to revenue
excluding client reimbursable expenses. Amounts are reported in thousands, except for per share amounts, rate-per-hour, headcount or where the context requires otherwise.
Part I
Item 1. Business.
Overview
We are a leading provider of independent financial advisory and investment banking services. Our mission is to help our clients protect, maximize and recover value by providing independent advice on issues involving highly technical and complex assessments in the areas of valuation, transactions, financial restructuring, disputes and taxation. We believe that the Duff & Phelps brand is associated with experienced professionals who give trusted guidance in a responsive manner. We serve a global client base through offices in 24 cities, comprised of offices in 17 U.S. cities, including New York, Chicago, Dallas and Los Angeles, and seven international offices located in Amsterdam,
London, Munich, Paris, Shanghai, Tokyo and Toronto.
We provide our services globally to a wide variety of companies that are in need of industry-leading, customized financial advice. Our clients include publicly-traded and privately-held companies, government entities, and investment firms such as private equity firms and hedge funds. Additionally, we maintain extensive relationships with law, accounting and investment banking firms from which we receive referral business.
Our collaborative, team-based culture promotes the cross-selling of new business opportunities across practice groups and enables us to deliver the most appropriate Duff & Phelps professionals to meet a client's needs. In addition, our integrated, multi-disciplinary approach enables us to cross-staff our professionals across multiple service lines to better manage the utilization of our professionals. We believe that our Company’s culture, global scale, broad service offering and strong brand name, provides an appealing career platform that allows us to attract and retain highly qualified professionals.
Our History
The original Duff & Phelps business was founded in 1932 to provide high quality investment research services focused on the utility industry. Over several decades, it evolved into a diversified financial services firm providing investment banking, credit rating and investment management services. In 1994, the credit rating business of Duff & Phelps was spun off into a separate public company that was eventually purchased by Fitch Ratings, Ltd. In 2000, Duff & Phelps, LLC, the company that operated the investment banking practice of the Duff & Phelps business, was acquired by Webster Financial Corporation (“Webster”). In 2004, Duff & Phelps,
LLC was acquired from Webster by its management and an investor group led by Lovell Minnick Partners LLC (“Lovell Minnick”).
In 2005, Duff & Phelps, LLC teamed with Lovell Minnick and Vestar Capital Partners (“Vestar”), another leading private equity firm, to acquire the Corporate Value Consulting business (“CVC”) from the Standard & Poor's division of The McGraw-Hill Companies, Inc. (“McGraw-Hill”). CVC was formed in the 1970s, initially as part of the financial advisory service groups of Price Waterhouse and Coopers & Lybrand. These practices were combined in 1998 when Price Waterhouse merged with Coopers & Lybrand to form PricewaterhouseCoopers (“PwC”) and were subsequently acquired by McGraw-Hill in 2001, thereby establishing independence from the
audit practice of PwC. In connection with the acquisition of CVC, D&P Acquisitions, LLC (“D&P Acquisitions”) was formed and Duff & Phelps, LLC became a wholly-owned subsidiary of D&P Acquisitions. In October 2006, D&P Acquisitions acquired Chanin Capital Partners, LLC (“Chanin”), an independent specialty investment bank providing restructuring advisory services.
The Company was incorporated on April 23, 2007 and consummated its initial public offering (“IPO”) on October 3, 2007. Since our IPO, we have acquired eight additional businesses to continue the build out of our business and the services we offer.
1
2010 Developments
General developments during 2010 included the following:
|
|
§
|
Over the past several years, our business has been impacted by the economic downturn in general and slowdown of merger and acquisition (“M&A”) activity in particular. During 2010, we began to see modest improvements in certain areas of our business, particularly in the latter part of the year in certain areas relating to M&A activity. Many areas of our business, including M&A Advisory, Transaction Opinions and Due Diligence, demonstrated growth as a result of the improvement in overall M&A transaction volume. We believe these businesses, as well as Valuation Advisory, should generally react favorably to the extent that the overall increase in transaction volume continues. Our Global Restructuring Advisory business grew modestly as a
result of continued economic volatility, although such growth may be tempered if we enter a more robust period of economic recovery. Certain other areas of our business which we believe have historically been less correlated to M&A volumes, such as Portfolio Valuation and Financial Engineering, have experienced lower growth in recent quarters as a result of the current economic environment. Overall, we believe that revenue and earnings for the year demonstrate the resiliency of our balanced portfolio of services and diversified client base, whose demand for complex financial advisory and valuation services continues.
|
|
|
§
|
Our client service headcount decreased to 785 client service professionals at December 31, 2010, compared to 878 client service professionals at December 31, 2009. We had 157 client service managing directors at December 31, 2010, compared to 163 at December 31, 2009.
|
|
|
§
|
We had $113,328 of cash and cash equivalents and no debt at December 31, 2010.
|
|
|
§
|
We made targeted acquisitions to strengthen the depth of our offerings in key markets and service areas:
|
|
Effective
|
||||
|
Date
|
Acquisition
|
Description
|
||
|
6/15/10
|
Cole Valuation Partners
|
Toronto-based independent financial advisory firm. Specializing in financial litigation support, business valuation, corporate finance advisory and forensic and investigative accounting. Cole added 20 client service professionals and became part of our Dispute & Legal Management Consulting business unit.
|
||
|
12/15/10
|
Dynamic Credit Partners (U.S. Advisory Business)
|
New York-based provider of valuation services for complex financial instruments. Dynamic added 8 client service professionals and became part of our Financial Engineering business unit.
|
||
|
12/15/10
|
June Consulting Group
|
Houston-based advisor to corporate legal departments on technical and operational issues. June added 12 client service professionals and became part of our Dispute & Legal Management Consulting business unit.
|
|
|
§
|
We paid quarterly cash dividends of $0.05 per share of our Class A common stock to holders of record on March 16, 2010 and $0.06 per share on May 18, 2010, August 17, 2010 and November 23, 2010. Concurrent with the payment of per share dividends on our Class A common stock, the Company distributed an equal amount per unit to holders of vested ownership units of D&P Acquisitions (“New Class A Units”).
|
|
|
§
|
In 2010 the Company announced that its Board of Directors had approved a stock repurchase program, authorizing the Company to repurchase in the aggregate up to $50,000 of its outstanding common stock. As part of this program, the Company repurchased 451 shares of Class A common stock to date at an average price of $13.54 per share through the filing date of this Annual Report on Form 10-K.
|
2
Overview of Our Services
We generate revenues from Financial Advisory, Corporate Finance Consulting and Investment Banking services. We typically enter into these engagements on a time-and-materials basis, a fixed-fee basis or a contingent-fee basis. Revenue trends in our Financial Advisory and Investment Banking segments, and to a lesser extent the Corporate Finance Consulting segment, generally are correlated to the volume of M&A activity and restructurings. However, deviations from this trend can occur in any given year for a number of reasons. For example, changes in our market share or the ability of our clients to close certain large transactions can cause our revenue results to diverge
from the level of overall M&A or restructuring activity. In addition, because many businesses do not routinely engage in M&A and restructuring activity, our fee paying engagements with many clients are not likely to be predictable and high levels of revenue in one quarter are not necessarily predictive of continued high levels of revenue in future periods. Further, we have lines of business that are not correlated to the volume of M&A activity and restructurings, but rather to bankruptcy filings, litigation or regulatory trends.
Revenues and operating income by segment are reported in the Notes to the Consolidated Financial Statements. Segment revenues as a percentage of total revenues excluding reimbursable expenses are summarized as follows:
|
Year Ended December 31,
|
||||||||||||
|
2010
|
2009
|
2008
|
||||||||||
|
Financial Advisory
|
60 | % | 63 | % | 66 | % | ||||||
|
Corporate Finance Consulting
|
15 | % | 17 | % | 15 | % | ||||||
|
Investment Banking
|
25 | % | 20 | % | 19 | % | ||||||
| 100 | % | 100 | % | 100 | % | |||||||
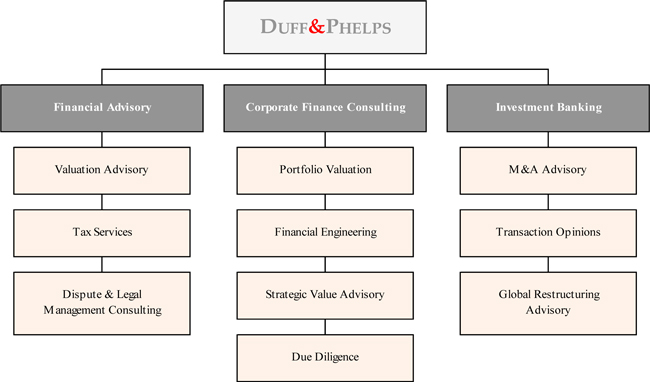
Our Financial Advisory segment provides clients with services through our Valuation Advisory, Tax Services and Dispute & Legal Management Consulting business units. Our Corporate Finance Consulting segment provides services related to Portfolio Valuation, Financial Engineering, Strategic Value Advisory and Due Diligence. We believe our services provided through these two segments help our clients effectively navigate through increasingly complex financial valuations as well as accounting, tax, regulatory and legal issues. Our Investment Banking segment includes our Global Restructuring Advisory, Transaction Opinions and M&A Advisory business units. Through this
segment we provide independent advice to our clients in order to assist them in making critical decisions in a variety of strategic situations.
3
Our segments serve a broad base of clients and work collaboratively to identify and capture new business opportunities. The services we offer within these segments are often complementary, which present opportunities for us to cross-sell related services and, we believe, increase our relevance to our clients. In addition, our client service professionals possess core financial and valuation skill sets that are portable within operating segments, facilitating the sharing of resources across the organization.
Financial Advisory
The foundation of our Financial Advisory segment is our core competency in making highly technical and complex assessments of value. We believe we are one of the leading independent valuation services firms in the world. Services are delivered by client service professionals who possess highly specialized skills in finance, valuation, accounting and tax. We typically price these services based on our assessment of the hours required to deliver the work and the billing rates of the client service professionals assigned to the project. In addition, certain of our property tax engagements are contingency-based.
Valuation Advisory
Financial Reporting. We believe we are a leading independent provider of valuation services for financial reporting. We provide objective and independent valuation advice that allows our clients to meet important regulatory, market and fiduciary requirements. Our corporate finance expertise and extensive working knowledge of the relevant accounting requirements, combined with our use and development of industry-specific sophisticated valuation methodologies, fulfill even the most complex financial reporting requirements. Examples of the financial reporting services we offer in the context of both U.S. Generally Accepted
Accounting Principles (“GAAP”) and International Financial Reporting Standards (“IFRS”) include valuations for business combinations (purchase price allocations) pursuant to Financial Accounting Standards Board (“FASB”) Accounting Standards Codification (“ASC”) 805, Business Combinations and IFRS 3, Business Combinations; periodic impairment testing of goodwill and other intangibles pursuant to FASB ASC 350, Intangibles–Goodwill and Other; periodic impairment testing of long-lived fixed assets pursuant to FASB ASC 360, Property, Plant, and Equipment; periodic impairment testing of assets, including
goodwill, pursuant to International Accounting Standards (“IAS”) IAS 36, Impairment of Assets; valuations related to stock compensation pursuant to FASB ASC 718, Compensation–Stock Compensation and IFRS 2, Share-Based Payment; “cheap stock” valuation; and fresh start accounting for companies emerging from Chapter 11 bankruptcy. The acute sensitivity of our clients at the highest levels of the organization to the quality and transparency of the financial information they present to their investors results in strong customer loyalty, which often leads to repeat client engagements and creates an established entry point for the delivery of additional services.
Fixed Asset/Real Estate Valuation. We provide integrated fixed asset and real estate valuations, with specialized expertise in machinery and equipment valuation, fixed asset reconciliation, cost segregation, real estate valuation and real estate consulting. Our services are used for a variety of purposes, including valuation of machinery and equipment for financial and tax reporting and loan/lease structuring; satisfying Sarbanes-Oxley Act Section 404 requirements for fixed asset internal controls; optimizing tax depreciation benefits; assisting corporate clients in reviewing their real estate occupancy strategy in an effort to reduce costs,
increase operating efficiencies and raise capital; and various real estate appraisal purposes. Our geographic scale enables us to compete effectively and win large client assignments involving multiple asset sites on a national and global basis.
Tax Valuation. We specialize in tax valuations and related advisory services when tax laws and regulations stipulate that a valuation is required or when assistance is needed to implement a client's tax strategies. We offer tax valuation and advisory services for a variety of transaction-related, compliance and planning purposes, including taxable reorganizations; purchase price allocations; inventory, fixed asset, intangible asset and goodwill valuations; net operating loss and built-in gains analyses; and estate and gift taxes. We have the technical expertise and testimony experience to defend our work and our clients' valuation
positions in regulatory inquiries.
Tax Services
State & Local Tax Services. We provide tax valuation and consulting services for a variety of transaction-related, compliance, planning and dispute purposes.
|
|
§
|
Property tax services – Property taxes are a significant recurring expense paid by companies, but one of the least understood due to the complexity of the applicable tax regulations. We assist companies in identifying opportunities for property tax savings by reviewing their property tax assessments and liabilities. Our services include negotiating assessment appeals, providing property tax due diligence for acquisitions, preparing studies to remove non-taxable embedded costs, obtaining property tax exemptions and providing general property tax consulting and compliance services.
|
4
|
|
§
|
Business incentives advisory – State and local governments often offer valuable tax incentives in return for investments in their jurisdictions. Whether the planned investment will create new facilities, expand or relocate operations, penetrate new markets, result in hiring additional or replacement employees, or initiate research and development activities, business incentives in the form of tax exemptions, tax credits, project grants and other tax benefits may be available at the state and local levels to offset some of these costs. Our strategic geographic network of business incentives experts provides us with specialized, local knowledge of the potential business incentives available to our clients.
|
|
|
§
|
Unclaimed property and tax risk advisory – Our professionals combine their extensive experience and technical resources to help our clients manage their unclaimed property responsibilities. We offer services to help clients effectively manage the reporting of unclaimed property, such as audit representation and negotiation, transaction planning and M&A assistance, and outsourcing of the unclaimed property compliance process.
|
Transfer Pricing. Transfer pricing is a significant international tax issue facing multi-national companies. Most tax authorities require comprehensive transfer pricing documentation, have other compliance requirements and impose severe penalties for failure to comply. Furthermore, transfer pricing presents significant tax optimization opportunities for multi-national companies. We provide a full scope of transfer pricing services to ensure that inter-company transactions comply with required arm's-length standards as well as create the contemporaneous documentation to support global compliance requirements.
Dispute & Legal Management Consulting
Dispute Consulting. We offer a broad array of dispute consulting services to corporate clients in a variety of industries. Our professionals provide comprehensive support throughout all stages of a dispute including early case assessment, electronic discovery services, complex data management, forensic accounting and damages testimony. Our experts have provided testimony in a variety of subject matters including bankruptcy and retrospective solvency, business insurance consulting, intellectual property disputes, commercial and shareholder litigation, forensic accounting and investigative services and purchase price
disputes. Our clients include corporations and attorneys from many of the largest and most prominent corporations and law firms in the country. Our professionals have provided testimony in arbitrations, mediations, federal and state courts and on behalf of clients involved in governmental inquiries. In addition to the industry and forensic accounting experts which are a part of our practice, we also maintain an external network of affiliates with specialized skills whom we work with on an as-needed basis in order to provide our clients with comprehensive support.
Legal Management Consulting. We provide various services designed to enable chief legal officers, chief compliance officers and law firm leaders to develop organizational strategy, streamline operations, improve compliance programs, optimize technology systems and make informed risk management decisions. Legal management consulting services are matched to the specific needs of the client, and have encompassed organizational planning and design, operations improvement, and technology and infrastructure planning. In addition, we assist clients in the development and implementation of a wide variety of records and information management
programs, including the creation of records retention and privacy programs.
Global Electronic Discovery and Investigations. Our electronic discovery and investigations practice supports the efforts of both the dispute consulting and legal management consulting practices. Our services include computer forensic investigations and expert testimony, litigation readiness and electronic discovery cost containment consulting, complex data management and electronic discovery collection, preservation, processing, analysis, review and production of a wide variety of digital evidence types.
Corporate Finance Consulting
Our Corporate Finance Consulting segment provides consulting services in connection with the valuation of difficult-to-value investments, advice regarding transactions and business growth strategies and consulting regarding business performance measurement and improvement. This segment primarily serves clients who invest in alternative assets. Its foundation is our expertise in the valuation of these assets, especially for securities and positions for which there are no “active market” quotations available. Given the significant rise in the number and value of illiquid securities held by hedge funds, private equity funds, pension funds, endowments and corporations, we
believe the scrutiny and attention by investors and regulators to fair value reporting standards has increased substantially.
5
Portfolio Valuation
Our portfolio valuation client service professionals specialize in assisting the alternative asset management community with investment and reporting issues, including portfolio valuations, “best practices” consulting, general partnership valuations, secondary market transaction valuations and operational risk due diligence. Our portfolio valuation clients include investors in illiquid and restricted securities, including private equity firms and hedge funds. The majority of our clients’ illiquid portfolios are comprised of secured and unsecured loans and other debt instruments, privately held preferred equity and common equity, convertible securities, warrants and options,
structured products, OTC and other derivative securities. Similar to our corporate clients, our alternative asset community clients are under intense scrutiny regarding their fiduciary duties to their investors/constituents, which has prompted many of these firms to obtain outside assurances on the valuations of the investment portfolios for which they are responsible. Conflict of interest considerations typically prevent any accounting firm that has an audit relationship with a portfolio company from rendering valuation advisory services on the entire portfolio. As a result, we typically do not compete with large accounting firms, such as the four largest international accounting firms (i.e., the “Big Four”), in providing these services. We typically deliver these services on a recurring
basis. We believe we are a market leader in portfolio valuations, which provides us with an attractive opportunity to increase our revenues in this practice group and increase our brand equity and recognition within the alternative asset community.
Financial Engineering
New financial processes and sophisticated quantitative models are transforming the way investors analyze and manage risk, price financial instruments and evaluate business strategies. Our financial engineering practice provides the valuation advice investors use, including valuation of alternative and derivative instruments (including structured products, mortgage-backed securities and other complex instruments), to enhance their ability to identify, control, diversify, mitigate and exploit risk. Financial engineering analyses and valuations can be used to support financial reporting, tax planning, risk management, securities design and investment decision making. We draw upon the
latest developments in finance theory, mathematics and computer science to design and evaluate financial instruments that help achieve investors' goals. Financial engineering services include auction rate securities valuation; derivatives valuations pursuant to FASB ASC 815, Derivatives and Hedging; alternative assets valuations pursuant to FASB ASC 820, Fair Value Measurements and Disclosures; and valuations for employee stock options and incentives pursuant to FASB ASC 718, Compensation–Stock Compensation.
Due Diligence
We provide buy-side and sell-side transaction advisory services to private equity and strategic buyers. Our professionals assist with the accounting, financial, commercial, operational, tax and information technology aspects of the due diligence process by developing and executing a due diligence plan that focuses on the key value drivers and risks that are critical to our clients' investment or divestiture decisions. Our independence allows us to provide a broader and deeper array of services to our clients than their audit firms. Our ability to collaborate across D&P practices also creates a more efficient and cost effective process. We have expanded our
services to include interim financial management (CFO, controller, etc.), working capital and cash flow analysis/forecasts, performance analysis and benchmarking, lender analyses, covenant reviews, IPO related assistance (helping prepare management’s discussion and analysis, pro-forma financial statements and footnote disclosures) and operations analysis. These services enable our clients to obtain further transparency into their investment portfolios and enhance their ability to proactively make investment lifecycle decisions.
Strategic Value Advisory
Our strategic value advisory practice helps clients improve ongoing performance, optimize their transaction and investment strategies, and enhance fundamental company value. Whether a company is contemplating a transaction, allocating capital, addressing profitability or liquidity issues, or weighing alternative growth strategies, we provide advice and management tools based on a rigorous valuation-oriented perspective. We advise management and boards of directors of companies that are evaluating strategic alternatives, looking to raise capital or considering mergers, acquisitions, joint ventures or divestitures. We also help companies address profitability and operational issues,
value contingencies and allocate limited capital.
Investment Banking
Our Investment Banking segment focuses on providing services to corporate and investor clients through our M&A Advisory, Transaction Opinions and Global Restructuring Advisory business units. A significant portion of revenues in this segment are generated from success-based fees that are paid when a transaction closes and are generally tied to the value of the transaction. As a result, revenues in this segment can be less predictable and more event-driven than revenues in our Financial Advisory and Corporate Finance Consulting segments. However, projects in this segment have the potential to generate higher revenue per client service professional, thereby resulting in higher
margins.
M&A Advisory
We provide objective valuation, structuring and negotiation services tailored to help our clients achieve their strategic goals on the best possible terms. We have developed our expertise through hundreds of sell-side, buy-side, divestiture and capital raising assignments across a wide range of industries. We provide our services primarily to middle-market clients, including the portfolio companies of our private equity clients, focusing primarily on transaction values ranging from $20 million to $1 billion (actual dollars).
6
Transaction Opinions
Our independent fairness opinions, solvency opinions and commercially reasonable debt opinions help provide boards of directors, lenders, trustees and other corporate fiduciaries with a legally defensible basis to support important corporate decisions. Our ability to offer financial opinions that satisfy all constituencies, including regulators and shareholders, has been developed through extensive research, detailed financial analyses and a commitment to stay current on key governance and regulatory issues. In recent years, we believe our fairness opinion practice has benefited from an increase in the perceived standard of diligence required by boards of directors to adequately satisfy their
fiduciary duties, particularly when faced with financial advisors who may have conflicts arising from the receipt of success-based transaction advisory or financing fees in conjunction with sell-side advisory assignments. Finally, we believe we are one of the leading financial advisors in transactions involving retirement benefit plans, including employee stock ownership plans (“ESOPs”) and other ERISA plans. We have a strong background in resolving the unique financial, valuation, tax and structural issues involving employee benefit plans under the Employee Retirement Income Security Act of 1974 (“ERISA”), and also provide recurring ERISA/ESOP valuation services for our clients on a periodic basis.
Global Restructuring Advisory
Our global restructuring practice provides financial restructuring advice to all constituencies in the business reorganization process, including debtors, senior and junior lenders, existing and potential equity investors and other interested parties for clients domestically and internationally. Our services include strategy, plan development and implementation, working capital forecasting and management, exchange offers and consent solicitations, out-of-court workouts, Chapter 11 restructurings and debtor-in-possession and exit financing advisory services.
Our Global Reach
Increasing our global presence remains a key strategy. Revenues excluding reimbursable expenses attributable to geographic area are summarized as follows:
|
Year Ended December 31,
|
||||||||||||
|
2010
|
2009
|
2008
|
||||||||||
|
North America
|
89 | % | 90 | % | 90 | % | ||||||
|
Europe
|
10 | % | 9 | % | 9 | % | ||||||
|
Asia
|
1 | % | 1 | % | 1 | % | ||||||
|
Total revenues
|
100 | % | 100 | % | 100 | % | ||||||
Our Clients
We have a client base that includes Fortune 1000 and smaller companies, prominent law firms and leading private equity and hedge funds. Our clients operate in a broad array of industries. The following table summarizes our global client base and the number of engagements we performed for each client:
|
Approximate
|
Approximate
|
|||||||
|
Number of
|
Number of
|
|||||||
|
Clients
|
Engagements
|
|||||||
|
2010
|
2,100 | 4,500 | ||||||
|
2009
|
2,200 | 4,500 | ||||||
|
2008
|
2,300 | 4,900 | ||||||
In addition, our client base includes over one third of S&P 500 companies. Our top ten clients represented approximately 11.8%, 15.9% and 8.5% of revenues excluding reimbursable expenses in 2010, 2009 and 2008, respectively. No single client accounted for more than 1.7% of total revenues in 2010, 2009 or 2008, except for one client that accounted for 2.4% and 8.1% of revenues in 2010 and 2009, respectively. This client resulted from an engagement to serve as a financial advisor to the court appointed examiner of a large financial services company under bankruptcy protection. This engagement wound down during the first half of 2010.
7
Our Professionals
We believe our core asset is our professional staff, their intellectual capital, their professional relationships and their dedication to providing the highest quality services to our clients. We seek talented, motivated and detail-oriented individuals with a desire to grow in a challenging, professional and diversified work environment. We believe individuals are attracted to us as an employer because we combine the stability, professionalism and client relationships of a large firm with the collaborative culture and conflict-free environment of a smaller, high growth firm, which enables our personnel to maximize their commercial potential and career development opportunities.
At December 31, 2010, we had 1,039 globally-based personnel, consisting of 785 experienced and credentialed client service professionals, 158 internal support personnel and 96 administrative staff. Of our 785 client service professionals, 157 were managing directors and 628 were directors, vice-presidents, senior associates and analysts. Of the 785 client service professionals, 83% were based domestically and 17% internationally. Most of our client service professionals have backgrounds in accounting, finance or economics. The common elements of these skill sets enables us to transfer staff between service lines to better manage the utilization and career development of
our client service professionals. We source these client service professionals from top undergraduate and graduate schools, and from a variety of our competitors, including the Big Four, independent specialty consulting firms, middle market investment banks and larger, diversified investment banks.
We consistently monitor the performance of our personnel through an annual performance management process that is designed to align performance with our business strategy, assess competency against appropriately set benchmarks and identify development needs in the context of short and long-term career aspirations. To reward performance we have implemented a reward program that aims to aggressively differentiate compensation based on performance. Our reward program includes base pay, an incentive bonus and a variety of benefits. We also aim to align our interests with those of our personnel through equity ownership programs. Many of our senior client service professionals
are subject to restrictive covenants that, in most cases, prohibit the individual from soliciting our clients for a period of up to two years following termination of the person's employment with us and from soliciting our personnel for a period of two years after termination of the person's employment.
We have comprehensive training programs in place to further enhance the development of our personnel. We provide ongoing professional development through the D&P University (our annual multi-week national training event) for new client service professionals and internal courses on both technical and non-technical subjects, and we support personnel in their career progression through training and development programs designed to help new and recently promoted personnel to quickly become effective in their new roles.
Business Development and Marketing
Our goal is to build a well-recognized brand globally that is synonymous with a top-tier financial advisory and investment banking services firm. We generate new business opportunities primarily based on the professional relationships of our managing directors, our reputation in the marketplace and referrals from third party advisors, including law, accounting and investment banking firms and our corporate investor clients. Our managing directors are respected within their chosen fields and are instrumental to our business development activities. Many of our managing directors are recognized as leaders in their fields and are members of national trade boards and committees of trade
associations.
Our client service professionals are encouraged to generate new business from both existing and new clients, and are rewarded with increased compensation and promotions for obtaining new business. Many of our client service professionals have published articles in industry, business opportunities, economic and legal journals and have made speeches and presentations at industry conferences and seminars, which serve as a means of attracting new business and enhancing their reputations. In pursuing new business, our client service professionals emphasize Duff & Phelps' institutional reputation and experience while also promoting the expertise of the particular individuals who will work on the matter.
We augment the business development activities of our managing directors and other client service professionals with centralized brand support through advertising in business and industry media, select sports marketing avenues, the production of marketing materials and the organization and sponsorship of seminars, trade conferences and other events.
Competition
Our competition varies by segment. Within our Financial Advisory and Corporate Finance Consulting segments, we compete primarily with the consulting practices of major accounting firms, such as the Big Four, and regional and global consulting companies. Within our Investment Banking segment, we compete with both boutique M&A and restructuring advisory firms as well as large, diversified investment banks. We believe the principal competitive factors in all segments include the reputation of the firm and its professionals, technical expertise and experience, the ability to rapidly deploy large teams for client engagements, geographic presence, and to a lesser extent,
price.
8
Regulation
As a participant in the financial services industry, we are subject to extensive regulation in the U.S., the United Kingdom and elsewhere. As a matter of public policy, regulatory bodies in the U.S. and foreign jurisdictions are charged with safeguarding the integrity of the securities and other financial markets and with protecting the interests of customers participating in those markets. In the United States, the Securities and Exchange Commission (“SEC”) is the federal agency responsible for the administration of the federal securities laws. Duff & Phelps Securities, LLC, our subsidiary through which we provide our M&A advisory services in the United States,
is registered as a broker-dealer with the SEC and is a member firm of the Financial Industry Regulatory Authority, Inc. (“FINRA”). Accordingly, the conduct and activities of Duff & Phelps Securities, LLC are subject to the rules and regulations of the SEC and FINRA. As Duff & Phelps Securities, LLC is also registered to conduct business in all U.S. states, the District of Columbia and Puerto Rico, state securities regulators also have regulatory authority over Duff & Phelps Securities, LLC.
Our business is also subject to regulation by non-U.S. governmental and regulatory bodies and self-regulatory authorities in other jurisdictions in which we operate. Duff & Phelps Securities, Ltd. is authorized and regulated by the Financial Services Authority. The Financial Services Authority is an independent non-governmental body located in the United Kingdom. In addition to conducting business in the United Kingdom, Duff & Phelps Securities, Ltd. has also received passports into 29 European Economic Area (“EEA”) territories. Under the Markets in Financial Instruments Directive (“MiFID”), Duff & Phelps Securities, Ltd. may engage in
certain regulated activities on a cross border basis. Duff & Phelps Securities, Ltd. is allowed to conduct certain regulated services in those countries without receiving direct authorization from the host EEA state (i.e., the EEA country where the Company is doing business). The Financial Services Authority is wholly responsible for the Company’s business conducted in the United Kingdom and all prudential regulation. The host state is responsible for regulating the conduct of that business. Therefore, although Duff & Phelps Securities, Ltd. is not required to obtain direct authorization from the host state, it must comply with local regulatory requirements. Duff & Phelps Securities, Ltd. also received permission from the Financial Services Authority and the
Bundesanstalt für Finanzdienstleistungsaufsicht (“BaFin”) to establish a branch office in Munich, Germany. Duff & Phelps SAS is regulated by the Autorité des marchés financiers (“AMF”). The AMF is an independent public body located in France. Duff & Phelps SAS is permitted to conduct certain regulated activities in France as a result of this authorization.
Broker-dealers are subject to regulations that cover all aspects of the securities business, including sales methods, trade practices among broker-dealers, use and safekeeping of customers' funds and securities, capital structure, record-keeping, the financing of customers' purchases and the conduct and qualifications of directors, officers and employees. In particular, as a registered broker-dealer and member of various self-regulatory organizations, Duff & Phelps Securities, LLC is subject to the SEC's uniform net capital rule, Rule 15c3-1. Rule 15c3-1 specifies the minimum level of net capital a broker-dealer must maintain and also requires that a significant part of a broker-dealer's
assets be kept in relatively liquid form. The SEC and various self-regulatory organizations impose rules that require notification when net capital falls below certain predefined criteria, limit the ratio of subordinated debt to equity in the regulatory capital composition of a broker-dealer and constrain the ability of a broker-dealer to expand its business under certain circumstances. Additionally, the SEC's uniform net capital rule imposes certain requirements that may have the effect of prohibiting a broker-dealer from distributing or withdrawing capital and requiring prior notice to the SEC for certain withdrawals of capital. Certain of our businesses are subject to compliance with laws and regulations of U.S. federal and state governments, non-U.S. governments, their respective agencies and/or various self-regulatory organizations or exchanges
relating to the privacy of client information, and any failure to comply with these regulations could expose us to liability and/or reputational damage.
Additional legislation, changes in rules promulgated by the SEC and self-regulatory organizations or changes in the interpretation or enforcement of existing laws and rules, either in the United States or elsewhere, may directly affect the mode of our operation and profitability.
The U.S. and non-U.S. government agencies and self-regulatory organizations, as well as state securities commissions in the United States, are empowered to conduct administrative proceedings that can result in censure, fine, the issuance of cease-and-desist orders or the suspension or expulsion of a broker-dealer or its directors, officers or employees.
Intellectual Property
Our success has resulted in part from our methodologies and other proprietary intellectual property rights. We rely upon a combination of nondisclosure and other contractual arrangements, trade secret, copyright and trademark laws to protect our proprietary rights and rights of third parties from whom we license intellectual property. We also enter into confidentiality and intellectual property agreements with our personnel that limit the distribution of proprietary information. We have only a limited ability to protect our important intellectual property rights. Pursuant to a name use agreement between the Company and Phoenix Duff & Phelps Corporation, a subsidiary of
Virtus Investment Partners, Inc., we have the perpetual exclusive right to use the Duff & Phelps name in connection with capital raising, M&A advisory services, corporate valuation, fairness opinions, strategic financial consulting, capital adequacy opinions and certain other investment banking businesses.
9
Available Information
Our website address is www.duffandphelps.com. We make available free of charge on the Investor Relations section of our website (http://ir.duffandphelps.com) our Annual Report on Form 10-K, Quarterly Reports on Form 10-Q, Current Reports on Form 8-K and all amendments to those reports as soon as reasonably practicable after such material is electronically filed or furnished with the SEC pursuant to Section 13(a) or 15(d) of the Securities Exchange Act of 1934. We also make available through our website other reports filed with or furnished to the SEC under the
Exchange Act, including our Proxy Statements and reports filed by our officers and directors under Section 16(a) of that Act. Our Corporate Governance Guidelines, Code of Business Conduct and Ethics, Whistleblower Policy and Committee Charters are also available on our website. We do not intend for information contained in our website to be part of this Annual Report on Form 10-K.
Any materials we file with the SEC may be read and copied at the SEC’s Public Reference Room at 100 F Street, N.E., Washington, DC 20549. Information on the operation of the Public Reference Room may be obtained by calling the SEC at 1-800-SEC-0330. The SEC maintains an Internet site (http://www.sec.gov) that contains reports, proxy and information statements and other information regarding issuers that file electronically with the SEC.
10
Item 1A. Risk Factors.
Risks Related to Our Business
A continued or renewed economic downturn, decline in global financial markets and/or other conditions beyond our control may materially and adversely affect our business, results of operations, financial condition, access to funding and the market price of our Class A common stock
A continued or renewed economic downturn, decline in global financial markets and/or other conditions beyond our control may continue to adversely affect employment rates, commercial and consumer spending, commercial and consumer indebtedness, availability of credit, asset values, investments and liquidity, which in turn may continue to negatively impact certain of our customers and have resulted and may continue to result in decreased demand or pricing levels for our services.
As a financial advisory, corporate finance consulting and investment banking firm, our business segments are materially affected by conditions in the global financial markets and economic conditions throughout the world. For example, revenue generated by our M&A advisory, transaction opinions and purchase price allocation engagements is directly related to the volume and size of the M&A transactions for which we provide services. During periods of unfavorable market or economic conditions, the volume and size of M&A transactions may decrease, thereby reducing the demand for our services and increasing price competition among financial advisory firms seeking such
engagements. Our results of operations would be adversely affected by any such reduction in the volume or value of M&A transactions. We have seen a reduction in demand for these services in recent periods and may continue to see a reduction in demand for these or other services in future periods. Our profitability could also be adversely affected by our fixed costs and the possibility that we would be unable to scale back other costs within a time frame sufficient to match any decreases in revenue relating to changes in market and economic conditions.
The future market and economic climate may deteriorate because of many factors beyond our control, and any one of these factors may cause a substantial decline in the global financial services markets, which could result in reduced demand for our services. These factors include, among other things, economic and political conditions in the United States and elsewhere in the world, wavering corporate/consumer confidence levels, the availability of cash for investment by mutual funds and other institutional as well as retail investors, and legislative and regulatory changes. Beginning in July 2007, there was a significant disruption in world financial markets, particularly in the credit markets,
which negatively impacted M&A activity, particularly among private equity buyers. If the ongoing effects of this downturn continue or renew, our results of operations, demand for our services or pricing levels could be adversely affected in future periods.
Our liquidity, financial position and profitability could be adversely affected by deterioration in U.S. and international credit markets and economic conditions
Recent deterioration in the global capital markets has caused financial institutions to seek additional capital, merge with larger financial institutions and in some cases fail. These conditions have led to concerns by market participants about the stability of financial markets generally and the strength of counterparties, resulting in a contraction of available credit, even for the most credit-worthy borrowers. Due to recent market events, our liquidity and our ability to obtain financing may be negatively impacted if the lender under our revolving credit facility, or another financial institution, suffers liquidity issues. In such an event, we may not be able to draw on all, or a
substantial portion, of our revolving credit facility. Also, if we attempt to obtain future financing in addition to, or replacement of, our existing credit facility to finance our continued growth through acquisitions or otherwise, the credit market turmoil could negatively impact our ability to obtain such financing.
Our clients may be unable to pay us for our services
Our clients include some companies that may from time to time encounter financial difficulties, especially in light of the current economic environment and the recent turmoil in the credit markets. If a client's financial difficulties become severe, the client may be unwilling or unable to pay our invoices in the ordinary course of business, which could adversely affect collections of our accounts receivable and unbilled services. On occasion, some of our clients have entered bankruptcy, which has prevented us from collecting amounts owed to us. The bankruptcy of a client with a substantial account receivable could have a material adverse effect on our financial condition and results
of operations. In addition, if a client declares bankruptcy after paying us certain invoices, a court may determine that we are not properly entitled to that payment and may require repayment of some or all of the amount we received, which could adversely affect our financial condition and results of operations.
11
Our business operates in a highly competitive environment where typically there are no long-term contracted sources of revenue and clients can terminate engagements with us at any time
Our business operates in a highly competitive environment where typically there are no long-term contracted sources of revenue. Typically, each revenue-generating engagement is separately solicited, awarded and negotiated. In addition, many businesses do not routinely engage in transactions requiring our services. As a consequence, our fee-paying engagements with many clients are not likely to be predictable, and high levels of revenue in one period are not necessarily predictive of continued high levels of revenue in future periods. We also lose clients each year as a result of the sale or merger of a client, a change in a client's senior management, competition from
other firms and other causes. As a result, our revenue could decline materially due to such changes in the volume, nature and scope of our engagements.
Further, many of our engagements depend upon transactions, disputes or proceedings that involve our clients. Our clients may decide at any time to abandon the transaction, resolve the dispute or proceeding or file for bankruptcy. Our engagements can therefore terminate suddenly and without advance notice to us. If an engagement is terminated unexpectedly, our client service professionals working on the engagement could be underutilized until we assign them to other projects. In addition, because much of our work is project-based rather than recurring in nature, our client service professionals' utilization depends on our ability to secure engagements on a continual
basis. Accordingly, the termination or significant reduction in the scope of a single large engagement could have an immediate adverse impact on our revenues and results of operations.
A high percentage of our revenue is derived from a small number of clients and the reduction of services provided to clients or termination of any one of our engagements could reduce our revenues and harm our operating results
Our clients operate in a broad array of industries and include Fortune 1000 companies, smaller companies, prominent law firms and leading private equity and hedge funds. Our top ten clients represented approximately 11.8%, 15.9% and 8.5% of revenues excluding reimbursable expenses in 2010, 2009 and 2008, respectively. The composition of the group of clients comprising these percentages can vary significantly each year, and a relatively small number of clients may account for a significant portion of our revenues. The loss or decrease of revenue from even one client or the failure of us to consummate a success-fee based engagement could adversely affect our revenues and results of
operations.
No single client accounted for more than 1.7% of total revenues in 2010, 2009 or 2008, except for one client that accounted for 2.4% and 8.1% of revenues in 2010 and 2009, respectively. This client resulted from an engagement to serve as a financial advisor to the court appointed examiner of a large financial services company under bankruptcy protection. This engagement wound down during the first half of 2010. The inability to replace revenue from this or certain other of our clients that represent a significant percentage of our revenues could adversely affect our revenues and results of operations in the future.
The financial advisory, corporate finance consulting and investment banking industries are highly competitive, and we may not be able to compete effectively
The financial advisory and corporate finance consulting industries are extremely competitive, highly fragmented and subject to rapid change and we expect it to remain so in the future. The industries include a large number of participants with a variety of skills and industry expertise, including the consulting practices of major accounting, financial consulting, technical and economic advisory, general management consulting firms and regional and specialty consulting firms as well as the internal professional resources of organizations. Our competitors vary depending on the particular practice group. In addition, we also expect to continue to face competition from new entrants
because the barriers to entry into financial advisory services and corporate finance consulting are relatively low. The principal competitive factors in the financial advisory and corporate finance consulting markets include firm and professional reputations, client and referral source relationships, the ability to attract and retain top professionals, the ability to manage engagements effectively and the ability to be responsive and provide high quality services. There is also competition on price. Many of our competitors have greater national and international presences, as well as significantly greater personnel, financial, technical and marketing resources. In addition, these competitors may generate greater revenues and have greater name recognition than we do. If we are unable to compete successfully with our existing
competitors or with any new competitors, our financial results will be adversely affected.
The investment banking industry is extremely competitive and we expect it to remain so in the future. Most of our competitors in the investment banking industry have a wider range of products and services, greater financial and marketing resources, larger customer bases, greater name recognition, more managing directors to serve their clients' needs, greater global reach and more established relationships with their customers than we have. These larger and better capitalized competitors may be better able to respond to changes in the investment banking market, to compete for skilled professionals, to finance acquisitions, to fund internal growth and to compete for market share
generally. In particular, the ability to provide financing as well as advisory services has become an important advantage for some of our larger competitors, and because we are unable to provide such financing we may be unable to compete for advisory clients in a significant part of the investment banking market.
12
Our inability to hire and retain talented people in an industry where there is great competition for talent could have a serious negative effect on our prospects and results of operations
Our business involves the delivery of professional services and is highly labor-intensive. Our performance is largely dependent on the talents and efforts of highly skilled individuals. Competition for qualified professionals in the financial advisory and investment banking industries is intense. Our continued ability to compete effectively in our business depends on our ability to attract new professionals and to retain and motivate our existing professionals. The unexpected or unplanned loss of a significant number of our professionals or the inability to attract, hire, develop, train and retain additional skilled personnel could have a serious negative effect on us,
including our ability to manage, staff and successfully complete our existing engagements and obtain new engagements. Increasing competition for these individuals may also significantly increase our labor costs, which could negatively affect our margins and results of operations.
Our inability to retain our senior management team and other key personnel would be detrimental to our business
We rely heavily on our senior management team and other key personnel, and our ability to retain them is particularly important to our business. Given the highly specialized nature of our services, these people must have a thorough understanding of our service offerings as well as the skills and experience necessary to manage an organization consisting of a diverse group of professionals. In addition, we rely on our senior management team and other key personnel to generate and market our business. Many of our key personnel do not have employment contracts with us. Any of our key personnel, including those with written employment contracts, may voluntarily terminate his or
her employment with us. If one or more members of our senior management team or our other managing directors leave and we cannot replace them with a suitable candidate quickly, we could experience difficulty in securing and successfully completing engagements and managing our business properly, which could harm our business prospects and results of operations. In addition, the loss of these personnel could jeopardize our relationships with clients and result in the loss of client engagements.
Revenues from our success-based engagements are difficult to predict, and the timing and extent of recovery of our costs is uncertain
From time to time, primarily in our Investment Banking segment and in certain of our Tax Services businesses, we enter into engagement agreements under which our fees include a significant success-based component. Success-based fees are contingent on the achievement of certain goals, such as the successful completion of a transaction or restructuring. In many cases we are not paid for advisory engagements that do not result in the successful consummation of a transaction or restructuring, other than the reimbursement of certain out-of-pocket expenses and, in some cases, a modest retainer. The achievement of these contractually-defined goals is often impacted by factors outside of our control,
such as market conditions and the decisions and actions of our clients and interested third parties. For example, a client could delay or terminate an acquisition transaction because of a failure to agree upon final terms with the counterparty, failure to obtain necessary regulatory consents or board or shareholder approvals, failure to secure necessary financing, adverse market conditions or because the target's business is experiencing unexpected financial problems. Anticipated bidders for assets of a client during a restructuring transaction may not materialize or our client may not be able to restructure its operations or indebtedness due to a failure to reach agreement with its principal creditors. Because success-based fees are contingent, revenues on such engagements, which are recognized when all revenue recognition criteria are met, are not certain and the
timing of receipt is difficult to predict and may not occur evenly throughout the year. In the current economic environment, completing transactions is a challenge, and many have failed or been delayed, making our ability to predict revenues increasingly difficult, even late into any fiscal period. We intend to continue to enter into success-based fee arrangements and these engagements could impact our revenues to a greater extent in the future. Should success-based fee arrangements represent a greater percentage of our business in the future, we may experience increased volatility in our working capital requirements and greater variations in our quarter-to-quarter results, which could affect the price of our Class A common stock.
Our financial results could suffer if we are unable to achieve or maintain adequate utilization and suitable billing rates for our client service professionals
Our profitability depends to a large extent on the utilization and billing rates of our client service professionals in our Financial Advisory and Corporate Finance Consulting segments. Utilization of our client service professionals is affected by a number of factors, including, among other things, the number and size of client engagements, the timing of the commencement, completion and termination of engagements, which in many cases is unpredictable, our ability to transition our client service professionals efficiently from completed engagements to new engagements, the hiring of additional client service professionals (because there is generally a transition period for new client service professionals
that may result in a temporary drop in our utilization rate, which may be the result of restrictions imposed by non-compete or other similar agreements with the professional's former employer), unanticipated changes in the scope of client engagements, our ability to forecast demand for our services and thereby maintain an appropriate level of client service professionals, and conditions affecting the industries in which we practice as well as general economic conditions.
13
The billing rates of our client service professionals in our Financial Advisory and Corporate Finance Consulting segments are also affected by a number of factors, including, among other things, our clients' perception of our ability to add value through our services, the market demand for the services we provide, introduction of new services by us or our competitors, the pricing policies of our competitors and general economic conditions. If we are unable to achieve and maintain adequate overall utilization as well as maintain or increase the billing rates for our professionals, our financial results could materially suffer.
The profitability of our fixed-fee engagements with clients may not meet our expectations if we underestimate the cost of these engagements
When making proposals for fixed-fee engagements, we estimate the costs and timing for completing the engagements. These estimates reflect our best judgment regarding the efficiencies of our methodologies and client service professionals as we plan to deploy them on engagements. Any increased or unexpected costs or unanticipated delays in connection with the performance of fixed-fee engagements, including delays caused by factors outside our control, could make these contracts less profitable or unprofitable, which would have an adverse effect on our profit margin.
Fees earned in connection with assignments in the bankruptcy context may be subject to challenge and reduction
From time to time we advise debtors, creditors, examiners or other stakeholders of companies which are involved in bankruptcy proceedings in the United States Bankruptcy Courts. Under the applicable rules of those courts, our fees are subject to approval by the court and other interested parties have the ability to challenge the payment of those fees. Fees earned and reflected in our revenues may be subject to successful challenges, which could result in a reduction of revenues and affect our stock price adversely.
Fluctuations in our quarterly revenues and results of operations could depress the market price of our common stock
We may experience significant fluctuations in our revenues and results of operations from one quarter to the next. If our revenues or net income in a quarter fall below the expectations of securities analysts or investors, the market price of our Class A common stock could fall significantly. Our results of operations in any quarter can fluctuate for many reasons, including the number, scope, and timing of ongoing client engagements; when we receive success-based fees; the extent to which we can reassign our client service professionals efficiently from one engagement to the next; the extent to which our client service professionals take holiday, vacation, and sick time; hiring; the extent of
fee discounting or cost overruns and other factors affecting productivity and collectability of receivables and unbilled work in process.
Because we generate a substantial portion of our revenues from advisory services that we provide on a time-and-materials basis, our revenues in any period are directly related to the number of our client service professionals, their billing rates, and the number of billable hours they work in that period. We have a limited ability to increase any of these factors in the short term. Accordingly, if we underutilize our client service professionals during one part of a fiscal period, we may be unable to compensate by augmenting revenues during another part of that period. In addition, we are occasionally unable to fully utilize any additional client service professionals that we hire,
particularly in the quarter in which we hire them. Moreover, a significant majority of our operating expenses, primarily office rent and salaries, are fixed in the short term. As a result, if our revenues fail to meet our expectations in any quarter, the shortfall could have a disproportionate adverse effect on our net income. For these reasons, we believe our historical results of operations are not necessarily indicative of our future performance.
Potential conflicts of interest may preclude us from accepting some engagements
We provide our services primarily in connection with significant or complex transactions, disputes, or other matters that usually involve sensitive client information or are adversarial. Our engagement by a client may preclude us from accepting engagements with the client's competitors or adversaries because of conflicts, or perceived conflicts, between their business interests or positions on disputed issues or other reasons. Accordingly, the nature of our business limits the number of both potential clients and potential engagements. Moreover, in many industries in which we provide services, there has been a continuing trend toward business consolidations and strategic
alliances. These consolidations and alliances reduce the number of potential clients for our services and increase the chances that we will be unable to continue some of our ongoing engagements or accept new engagements as a result of actual or perceived conflicts of interest.
14
Our ability to maintain and attract new business depends upon our reputation, the professional reputation of our client service professionals and the quality of our services
As a professional services firm, our ability to secure new engagements depends heavily upon our reputation and the individual reputations of our client service professionals. Any factor that diminishes our reputation or that of our client service professionals, including not meeting client expectations or misconduct by our client service professionals, could make it substantially more difficult for us to attract new engagements and clients. Similarly, because we obtain many of our new engagements from former or current clients or from referrals by those clients or by law, accounting or investment banking firms with whom we have worked in the past, any client that questions the quality of our
work or that of our client service professionals could impair our ability to secure additional new engagements and clients.
Our intellectual property rights in our Duff & Phelps name are important, and any inability to use that name could negatively impact our ability to build brand identity
We believe that establishing, maintaining and enhancing the Duff & Phelps name are important to our business. Pursuant to a name use agreement between us and Phoenix Duff & Phelps Corporation, a subsidiary of Virtus Investment Partners, Inc., we have the perpetual exclusive right to use the Duff & Phelps name in connection with capital raising, M&A services, corporate valuations, fairness opinions, strategic financial consulting, capital adequacy opinions and certain other investment banking businesses. It is possible that we and Phoenix Duff & Phelps Corporation could disagree on whether certain types of our businesses are covered by the name use agreement. If
Phoenix Duff & Phelps Corporation were to successfully challenge our right to use our name, or if we were unable to prevent a competitor from using a name that is similar to our name, our ability to build brand identity could be negatively impacted. In addition, if Phoenix Duff & Phelps Corporation is involved in any misconduct or illegal activity, our reputation could be negatively impacted.
Our engagements could result in professional liability, which could be very costly and hurt our reputation
Our engagements typically involve complex analysis and the exercise of professional judgment. As a result, we are subject to the risk of professional liability. If a client questions the quality of our work, the client could threaten or bring a lawsuit to recover damages or contest its obligation to pay our fees. Litigation alleging that we performed negligently or breached any other obligations to a client could expose us to significant legal liabilities and, regardless of outcome, is often very costly, could distract our management and could damage our reputation. In addition, third parties may allege reliance on our work which could expose us to additional lawsuits and
potential liability. We are not always able to include provisions in our engagement agreements that are designed to limit our exposure to legal claims relating to our services. Even if these limiting provisions are included in an engagement agreement, they may not protect us or may not be enforceable under some circumstances, including, without limitation, in the context of a bankruptcy proceeding. In addition, we carry professional liability insurance to cover many of these types of claims, but the policy limits and the breadth of coverage may be inadequate to cover any particular claim or all claims plus the cost of legal defense. For example, we provide services on engagements in which the impact on a client may substantially exceed the limits of our professional liability coverage. If we are found to have professional liability
with respect to work performed on such an engagement, we may not have sufficient insurance to cover the entire liability.
If the number of debt defaults, bankruptcies or other factors affecting demand for our restructuring advisory services declines, or we lose business to new entrants into the restructuring advisory business that are no longer precluded from offering such services due to changes to the U.S. Bankruptcy Code, our restructuring advisory business' revenue could suffer
We provide various financial restructuring and related advice to companies in financial distress or to their creditors, examiners or other stakeholders. A number of factors affect demand for these advisory services, including general economic conditions, the availability and cost of debt and equity financing and changes to laws, rules and regulations, including deregulation or privatization of particular industries and those that protect creditors.
Section 327 of the U.S. Bankruptcy Code, which requires that a “disinterested person” be employed in a restructuring, has been modified pursuant to the Bankruptcy Abuse Prevention and Consumer Protection Act of 2005. The “disinterested person” definition of the U.S. Bankruptcy Code had historically disqualified certain of our competitors, but had not often disqualified us from obtaining a role in restructurings because we are not an underwriter of securities or lender. However, the 2005 amendment to the “disinterested person” definition allows underwriters of securities to compete for restructuring engagements, as well as for the recruitment and retention of
restructuring professionals. If our competitors are retained in new restructuring engagements, our restructuring advisory business, and thereby our results of operations, could be adversely affected.
15
Legal and regulatory restrictions on our clients may reduce the demand for our services
New laws or regulations or changes in enforcement of existing laws or regulations applicable to our clients may adversely affect our businesses. For example, changes in antitrust enforcement could affect the level of M&A activity and changes in regulation could restrict the activities of our clients and their need for the types of advisory services that we provide to them.
Changes in laws, regulations or accounting standards may adversely affect our business
As an independent financial advisory firm, we have benefited from the enactment of the Sarbanes-Oxley Act, which substantially limits the scope of non-audit services that public accounting firms, such as the Big Four, can provide to their audit clients. Additionally, we have benefited from increased sensitivity among investors, managers and boards to auditor conflicts, which we believe has limited the engagement of public accounting firms to perform even permissible non-audit services. However, changes in the federal securities laws, changes in judicial interpretations of these laws or less vigorous enforcement of these laws, as a result of changes in political appointments or priorities or for other
reasons, or reduced sensitivity among investors, managers and boards to auditor conflicts, could substantially reduce the limitations on public accounting firms to provide non-audit services, including the services that we provide or may provide in the future. Increased competition from accounting firms could materially adversely affect our financial condition and results of operations. Conversely, it is possible that increased sensitivity among investors or changes in regulations could lead to limits that would adversely impact us by creating real or perceived conflicts among the various services we provide to our clients.
Further, the demand for a substantial portion of our business is generated by financial reporting requirements under U.S. GAAP or IFRS. For example, the demand for our purchase price allocation services is primarily driven by the requirement under FASB ASC 805, Business Combinations, that in a business combination the acquiring company allocates the purchase price to individual tangible assets as well as intangible assets and liabilities, based on fair value. Therefore, the demand for our services could decrease as a result of any future changes in accounting standards (e.g., FASB
ASC 820, Fair Value Measurements and Disclosures, or any suspension of so-called “mark-to-market” accounting) or our inability to develop expertise resulting from new standards or a change of existing standards. As a result, our financial condition and results of operation could be materially adversely affected by any future changes in accounting standards.
We are subject to extensive regulation in the financial services industry
We participate in the financial services industry, and are subject to extensive regulation in the United States, the United Kingdom and elsewhere. Duff & Phelps Securities, LLC, our subsidiary through which we provide our M&A advisory services in the United States, is registered as a broker-dealer with the SEC and is a member firm of FINRA. Accordingly, the conduct and activities of Duff & Phelps Securities, LLC are subject to the rules and regulations of the SEC and FINRA. Certain state securities regulators also have regulatory or oversight authority over Duff & Phelps Securities, LLC. Duff & Phelps Securities, Ltd., our subsidiary, is authorized and
regulated by the Financial Services Authority in the United Kingdom. In addition to conducting business in the United Kingdom, Duff & Phelps Securities, Ltd. has also received passports into 29 European Economic Area (“EEA”) territories. Under the Markets in Financial Instruments Directive (“MiFID”), Duff & Phelps Securities, Ltd. may engage in certain regulated activities on a cross border basis. Duff & Phelps Securities, Ltd. is allowed to conduct certain regulated services in those countries without receiving direct authorization from the host EEA state (i.e., the EEA country where the Company is doing business). The Financial Services Authority is wholly responsible for the Company’s business conducted in the United Kingdom and all prudential
regulation. The host state is responsible for regulating the conduct of that business. Therefore, although Duff & Phelps Securities, Ltd. is not required to obtain direct authorization from the host state, it must comply with local regulatory requirements. Duff & Phelps Securities, Ltd. also received permission from the Financial Services Authority and the Bundesanstalt für Finanzdienstleistungsaufsicht (“BaFin”) to establish a branch office in Munich, Germany. Duff & Phelps SAS is regulated by the Autorité des marchés financiers (“AMF”). The AMF is an independent public body located in France. Duff & Phelps SAS is permitted to conduct certain regulated activities in France as a result of this authorization.
Our business is therefore subject to regulation by non-U.S. governmental and regulatory bodies and self-regulatory authorities in other countries where we operate. We face the risk of significant intervention by regulatory authorities in all jurisdictions in which we conduct our business. Among other things, we could be fined, prohibited from engaging in some of our business activities or subject to limitations or conditions on our business activities. In addition, as a result of highly publicized financial scandals, the environment in which we operate may be subject to further regulation. New laws or regulations or changes in the enforcement of existing laws or
regulations applicable to our clients may also adversely affect our business.
16
Our operations and infrastructure could malfunction or fail
Our ability to conduct business may be adversely impacted by a disruption in the infrastructure that supports our businesses and the communities in which we are located. This may include a disruption involving electrical, communications, transportation or other services used by us or third parties with or through whom we conduct business, whether due to human error, natural disasters, power loss, telecommunication failures, break-ins, sabotage, computer viruses, intentional acts of vandalism, acts of terrorism or war or otherwise. We do not have fully redundant systems, and our disaster recovery plan does not include restoration of all services. Nearly all of our personnel in our
primary locations work in close proximity to each other. If a disruption occurs in one location and our personnel in that location are unable to communicate with or travel to other locations, our ability to service and interact with our clients and customers may suffer and we may not be able to implement successfully contingency plans that depend on communication or travel.
Our operations also rely on the secure processing, storage and transmission of confidential and other information in our computer systems and networks. Although we take protective measures and endeavor to modify them as circumstances warrant, our computer systems, software and networks may be vulnerable to unauthorized access, computer viruses or other malicious events that could have a security impact. If one or more of such events occur, this could jeopardize our or our clients’ or counterparties' confidential and other information processed and stored in, and transmitted through, our computer systems and networks, or otherwise cause interruptions or malfunctions in our, our clients',
our counterparties' or third parties' operations. We may be required to expend significant additional resources to modify our protective measures or to investigate and remediate vulnerabilities or other exposures, and we may be subject to litigation and financial losses that are either not insured against or not fully covered through any insurance maintained by us.
Acquisitions may disrupt our operations or adversely affect our results
We regularly evaluate opportunities to acquire other businesses. The expenses we incur evaluating and pursuing acquisitions could have a material adverse effect on our results of operations. If we acquire a business, we may be unable to manage it profitably or successfully integrate its operations with our own. Moreover, we may be unable to realize the financial, operational, and other benefits we anticipate from acquisitions. Competition for future acquisition opportunities in our markets could increase the price we pay for businesses we acquire and could reduce the number of potential acquisition targets. Further, acquisitions may involve a number of special
financial and business risks, including expenses related to any potential acquisition from which we may withdraw, diversion of our management's time, attention, and resources, decreased utilization during the integration process, loss of key acquired personnel, difficulties in integrating diverse corporate cultures, increased costs to improve or coordinate managerial, operational, financial, and administrative systems including compliance with the Sarbanes-Oxley Act, dilutive issuances of equity securities, including convertible debt securities, the assumption of legal liabilities, amortization of acquired intangible assets, potential write-offs related to the impairment of goodwill, and additional conflicts of interest.
Expanding our service offerings or number of offices may not be profitable and our failure to manage expansion successfully could adversely affect our revenues and results of operations
We may choose to develop new service offerings or open new offices because of market opportunities or client demands. Developing new service offerings involves inherent risks, including our inability to estimate demand for the new service offerings, competition from more established market participants, a lack of market understanding, and unanticipated expenses to recruit and hire qualified client service professionals and to market and provide our new service offerings.
In addition, expanding into new geographic areas and/or expanding current service offerings is challenging and may require integrating new client service professionals into our culture as well as assessing the demand in the applicable market. Expansion creates new and increased management and training responsibilities for our professionals. Expansion also increases the demands on our internal systems, procedures, and controls, and on our managerial, administrative, financial, marketing, and other resources. New responsibilities and demands may adversely affect the overall quality of our work. If we cannot manage the risks associated with new service offerings or new locations
effectively, we are unlikely to be successful in these efforts, which could harm our ability to sustain profitability and our business prospects.
Our international operations create special risks
We intend to continue our international expansion, and our international revenues could account for an increasing portion of our revenues in the future. Our international operations carry special financial and business risks, including greater difficulties in managing and staffing foreign operations, cultural differences that result in lower utilization, currency fluctuations that adversely affect our financial position and operating results, unexpected changes in trading policies, regulatory requirements, tariffs and other barriers, greater difficulties in collecting accounts receivable, longer sales cycles, restrictions on the repatriation of earnings, potentially adverse tax consequences, such as
trapped foreign losses, less stable political and economic environments, and civil disturbances or other catastrophic events that reduce business activity. If our international revenues increase relative to our total revenues, these factors could have a more pronounced effect on our operating results.
17
Employee misconduct could harm us and is difficult to detect and deter
There have been a number of highly publicized cases involving fraud or other misconduct by employees in the financial services industry in recent years and we run the risk that employee misconduct could occur at our company. For example, misconduct by employees could involve the improper use or disclosure of confidential information, which could result in regulatory sanctions and serious reputational or financial harm. Our business often requires that we deal with confidences of the greatest significance to our clients, the improper use of which may have a material adverse impact on our clients. It is not always possible to deter employee misconduct and the precautions we take to
detect and prevent this activity may not be effective in all cases. Any breach of our clients' confidences as a result of employee misconduct could impair our ability to attract and retain clients.
Risks Related to Our Organization and Structure
Our only material asset is our ownership of D&P Acquisitions, and we are accordingly dependent upon distributions from D&P Acquisitions to pay dividends, if any, taxes and other expenses
The Company is a holding company and has no material assets other than its ownership of New Class A Units. The Company has no independent means of generating revenue. We intend to cause D&P Acquisitions to make distributions to its unitholders in an amount sufficient to cover all applicable taxes payable, payments pursuant to the tax receivable agreement and dividends, if any, declared by us. To the extent that we need funds, and D&P Acquisitions is restricted from making such distributions under applicable law or regulation, or is otherwise unable to provide such funds, it could materially adversely affect our liquidity and financial condition.
The existing unitholders of D&P Acquisitions, whose interests may differ from those of our public stockholders, own a substantial stake in the Company
The existing unitholders of D&P Acquisitions, including Vestar and Lovell Minnick, owned 27.0% of the New Class A Units at December 31, 2010. Because they hold their ownership interest in our business through D&P Acquisitions, rather than through the public company, these existing unitholders may have conflicting interests with holders of our Class A common stock. For example, the existing unitholders of D&P Acquisitions may have different tax positions from us which could influence their decisions regarding whether and when to dispose of assets, and whether and when to incur new or refinance existing indebtedness, especially in light of the existence of the TRA (as defined in Item
7). In addition, the structuring of future transactions may take into consideration these existing unitholders' tax considerations even where no similar benefit would accrue to us.
In addition, the existing unitholders of D&P Acquisitions, including Vestar and Lovell Minnick, controlled 27.0% of the combined voting power of our Class A and Class B common stock at December 31, 2010. Accordingly, the existing unitholders of D&P Acquisitions, if voting in the same manner, could significantly influence the election of all of the members of our board of directors, and thereby have the ability to significantly influence control over our management and affairs. In addition, they could significantly influence the outcome of all matters requiring shareholder approval and could significantly influence a change of control of our company or a change in the composition of our
board of directors, which could preclude any unsolicited acquisition of our company.
We are required to pay the existing unitholders of D&P Acquisitions for certain tax benefits
We are treated for U.S. federal income tax purposes as having directly purchased membership interests in D&P Acquisitions from the unitholders of New Class A Units when New Class A Units are exchanged for Class A common stock or redeemed. As a result of our initial redemption of New Class A Units with a portion of the proceeds of the IPO and additional exchanges or redemptions of New Class A Units, we are and will be entitled to a proportionate share of D&P Acquisitions' existing tax basis for its assets, and are and we will also become entitled to certain tax basis adjustments reflecting the difference between the price we pay to acquire those units and that proportionate share. As a
result, the amount of tax that we would otherwise be required to pay in the future may be reduced, although the Internal Revenue Service (“IRS”) may challenge all or part of that tax basis adjustment, and a court could sustain such a challenge.
18
We have entered into a tax receivable agreement with the existing unitholders of D&P Acquisitions that provides for the payment by us to them of 85% of the amount of cash savings, if any, in U.S. federal, state and local income tax or franchise tax that we realize as a result of (i) D&P Acquisitions' tax basis in its goodwill and similar intangible assets on the date of the redemption, including any portion of that tax basis arising from its liabilities on the date of the redemption and (ii) the tax basis adjustments referred to above. While the actual amount of the adjusted tax basis, as well as the amount and timing of any payments under this agreement will vary depending upon a number of
factors, including the basis of our proportionate share of D&P Acquisitions' assets on the dates of exchanges, the timing of exchanges, the price of shares of our Class A common stock at the time of each exchange, the extent to which such exchanges are taxable, the deductions and other adjustments to taxable income to which D&P Acquisitions is entitled, the amount of liabilities of D&P Acquisitions in existence on the date of the redemption and future exchanges, and the amount and timing of our income, we expect that during the anticipated term of the tax receivable agreement, the payments that we may make to the existing unitholders of D&P Acquisitions could be substantial. Payments under the tax receivable agreement will give rise to additional tax benefits and therefore to additional potential payments under the tax receivable agreement. In addition, the
tax receivable agreement will provide for interest accrued from the due date (without extensions) of the corresponding tax return to the date of payment under the agreement.
Were the IRS to challenge a tax basis adjustment, or other deductions or adjustments to taxable income of D&P Acquisitions, the existing unitholders of D&P Acquisitions will not reimburse us for any payments that may previously have been made under the tax receivable agreement, except that excess payments made to an existing unitholder are netted against payments otherwise to be made, if any, after our determination of such excess. As a result, in certain circumstances we could make payments to the existing unitholders of D&P Acquisitions under the tax receivable agreement in excess of our cash tax savings. Our ability to achieve benefits from any tax basis adjustment, or other
deductions or adjustments to taxable income of D&P Acquisitions, and the payments to be made under this agreement, will depend upon a number of factors, as discussed above, including the timing and amount of our future income.
Our amended and restated certificate of incorporation contains a provision renouncing our interest and expectancy in certain corporate opportunities identified by Lovell Minnick and Vestar
Lovell Minnick and Vestar and their affiliates are in the business of providing buyout capital and growth capital to developing companies, and may acquire interests in businesses that directly or indirectly compete with certain portions of our business. Our amended and restated certificate of incorporation provides for the allocation of certain corporate opportunities between us, on the one hand, and Lovell Minnick and Vestar, on the other hand. As set forth in our amended and restated certificate of incorporation, neither Lovell Minnick nor Vestar, nor any director, officer, stockholder, member, manager or employee of Lovell Minnick or Vestar has any duty to refrain from engaging, directly or
indirectly, in the same business activities or similar business activities or lines of business in which we operate. Therefore, a director or officer of our company who also serves as a director, officer, member, manager or employee of Lovell Minnick or Vestar may pursue certain acquisition opportunities that may be complementary to our business and, as a result, such acquisition opportunities may not be available to us. These potential conflicts of interest could have a material adverse effect on our business, financial condition, results of operations or prospects if attractive corporate opportunities are allocated by Lovell Minnick or Vestar to themselves or their other affiliates instead of to us. To date, no acquisition or attractive corporate opportunity of which we are aware was foregone because of our relationship with Lovell Minnick and
Vestar. The above provision shall automatically, without any need for any action by us, be terminated and void at such time as Lovell Minnick, Vestar and their affiliates, whose ownership interests shall be counted together as a group, own less than 20% of our outstanding Class A common stock on a fully exchanged basis. As of December 31, 2010, Lovell Minnick, Vestar and their affiliates collectively owned 20.9% of our Class A common stock on a fully exchanged basis.
Risks Related to Our Class A Common Stock
The market price and trading volume of our Class A common stock may be volatile, which could result in rapid and substantial losses for our stockholders
The market price of our Class A common stock has been highly volatile and could be subject to wide fluctuations in the future. In addition, the trading volume in our Class A common stock may fluctuate and cause significant price variations to occur. If the market price of our Class A common stock declines significantly, stockholders may be unable to sell their Class A common stock at or above their purchase price, if at all. We cannot make any assertions that the market price of our Class A common stock will not fluctuate or decline significantly in the future. Some of the factors that could negatively affect the price of our Class A common stock or result in fluctuations
in the price or trading volume of our Class A common stock include variations in our quarterly operating results; failure to meet our earnings estimates; publication of research reports about us or the investment management industry or the failure of securities analysts to cover our Class A common stock; additions or departures of our executive officers and other key management personnel; adverse market reaction to any indebtedness we may incur or securities we may issue in the future; actions by stockholders; changes in market valuations of similar companies; speculation in the press or investment community; changes or proposed changes in laws or regulations or differing interpretations thereof affecting our business or enforcement of these laws and regulations, or announcements relating to these matters; adverse publicity about the financial advisory industry generally or individual
scandals, specifically; and general market and economic conditions.
19
Our Class A common stock price may decline due to the large number of shares eligible for future sale and for exchange into Class A common stock
The market price of our Class A common stock could decline as a result of sales of a large number of shares of our Class A common stock or the perception that such sales could occur. These sales, or the possibility that these sales may occur, also might make it more difficult for us to sell equity securities in the future at a time and price that we deem appropriate.
The existing unitholders of D&P Acquisitions have entered into an exchange agreement with D&P Acquisitions under which, from time to time, typically once a quarter, they will have the right to exchange with D&P Acquisitions their vested New Class A Units for shares of our Class A common stock on a one-for-one basis, subject to notice requirements and minimum retained ownership requirements, and subject to customary conversion rate adjustments for stock splits, stock dividends and reclassifications. The exchange agreement generally provides that (i) certain of our existing unitholders, including Vestar and Lovell Minnick, may currently elect to exchange with D&P Acquisitions 100% of their
New Class A Units into shares of our Class A common stock; (ii) our executive unitholders may currently elect to exchange with D&P Acquisitions up to 60% of such New Class A Units after September 28, 2010, and 100% of such New Class A Units after September 28, 2011, subject to vesting and notice requirements; and (iii) our non-executive unitholders may currently elect to exchange with D&P Acquisitions up to 100% of such New Class A Units after September 28, 2010, subject to vesting and notice requirements.
At December 31, 2010, the existing unitholders of D&P Acquisitions held 11,151 or 27.0% of New Class A Units, all of which will be potentially exchangeable with D&P Acquisitions for shares of our Class A common stock. We filed a registration statement in order to permit the resale of these shares and the 3,375 shares of Class A common stock purchased by Shinsei pursuant to a stock purchase agreement prior to our IPO, subject to certain blackouts and other restrictions. In addition, there were 3,432 restricted stock awards and 303 restricted stock units outstanding at December 31, 2010. Subject to forfeiture provisions, these awards vest and could potentially be sold at
various times through 2014.
We could change our existing dividend policy in the future
We began paying quarterly cash dividends to holders of record of our Class A common stock on June 12, 2009. In 2010, we paid quarterly cash dividends of $0.05 per share of our Class A common stock to holders of record on March 16, 2010 and $0.06 per share on May 18, 2010, August 17, 2010 and November 23, 2010. We intend to continue to pay quarterly dividends subject to capital availability and periodic determinations that cash dividends are in the best interest of our stockholders. Future declaration and payment of dividends on our common stock is at the discretion of our board of directors and depend upon, among other things, our
future operations and earnings, capital requirements and surplus, general financial condition, contractual restrictions and other factors as the board of directors may deem relevant. For example, in the event that deteriorating economic conditions or disruptions in the credit markets have a significant impact on our liquidity or ability to obtain financing, our board of directors could decide to reduce or even suspend dividend payments in the future. We cannot provide assurance that we will continue to declare dividends at all or in any particular amounts. A reduction in our dividend payments could have a negative effect on our stock price.
Anti-takeover provisions in our charter documents and Delaware law could delay or prevent a change in control
Our certificate of incorporation and by-laws may delay or prevent a merger or acquisition that a stockholder may consider favorable by permitting our board of directors to issue one or more series of preferred stock, requiring advance notice for stockholder proposals and nominations, and placing limitations on convening stockholder meetings. In addition, we are subject to provisions of the Delaware General Corporation Law that restrict certain business combinations with interested stockholders. These provisions may also discourage acquisition proposals or delay or prevent a change in control, which could harm our stock price.
20
Item 1B. Unresolved Staff Comments.
None.
Item 2. Properties.
We currently have leased offices located in 24 cities across the United States, Europe and Asia. Our current principal executive office is located in one leased facility in New York, consisting of approximately 60,000 square feet of office space under a 16-year sublease that expires in 2023. Our principal executive office in New York accommodates our executive team and corporate functions, as well as client service professionals in many of our practice groups and each reporting segment.
We also occupy leased facilities for our other offices under non-cancelable operating leases that expire at various dates through 2021 and that include fixed or minimum payments, plus, in some cases, scheduled base rent increases over the terms of the lease. We believe our current facilities are adequate to meet our needs and that additional facilities are available for lease to meet future needs.
Item 3. Legal Proceedings.
From time to time, we are involved in legal proceedings and litigation arising in the ordinary course of business. As of the date of this annual report on Form 10-K, we are not a party to or threatened with any litigation or other legal proceeding that, in our opinion, could have a material adverse effect on our business, operating results or financial condition.
Item 4. (Removed and Reserved).
21
PART II
Item 5. Market for Registrant’s Common Equity, Related Stockholder Matters and Issuer Purchases of Equity Securities.
Price Range of the Company’s Class A Common Stock
Our Class A common stock is listed on the New York Stock Exchange (“NYSE”) and is traded under the symbol “DUF.” At the close of business on January 31, 2011, there were 480 Class A common stockholders of record. A number of the Company’s stockholders have their shares in street name; therefore, the Company believes that there are substantially more beneficial owners of Class A common stock.
The following table sets forth for the periods indicated the high and low reported sale prices per share for the Class A common stock and dividends paid per share of Class A common stock:
|
Dividends
|
||||||||||||
|
Sales Price
|
Per
|
|||||||||||
|
High
|
Low
|
Share
|
||||||||||
|
Year Ended December 31, 2010
|
||||||||||||
|
Fourth Quarter
|
$ | 17.35 | $ | 12.75 | $ | 0.06 | ||||||
|
Third Quarter
|
13.82 | 9.92 | 0.06 | |||||||||
|
Second Quarter
|
17.45 | 11.28 | 0.06 | |||||||||
|
First Quarter
|
19.00 | 15.64 | 0.05 | |||||||||
|
Year Ended December 31, 2009
|
||||||||||||
|
Fourth Quarter
|
$ | 19.16 | $ | 15.39 | $ | 0.05 | ||||||
|
Third Quarter
|
19.68 | 15.63 | 0.05 | |||||||||
|
Second Quarter
|
19.96 | 14.23 | 0.05 | |||||||||
|
First Quarter
|
19.86 | 12.35 | - | |||||||||
Dividend Policy
We began paying quarterly cash dividends to holders of record of our Class A common stock on June 12, 2009. In 2010, we paid quarterly cash dividends of $0.05 per share of our Class A common stock to holders of record on March 16, 2010 and $0.06 per share on May 18, 2010, August 17, 2010 and November 23, 2010. Concurrent with the payment of per share dividends on our Class A common stock, the Company distributed an equal amount per unit to holders of New Class A Units. Future cash dividends and distributions, if any, will be at the discretion of our board of directors and can be changed or discontinued at any time. Dividend determinations (including the size of our
quarterly dividend) will depend upon, among other things, our future operations and earnings, capital requirements and surplus, general financial condition, contractual restrictions and other factors as the board of directors may deem relevant.
Exchange of New Class A Units to Class A Common Stock
In connection with the closing of the IPO, we entered into an exchange agreement, dated as of October 3, 2007 (as amended, the “Exchange Agreement”), by and among us, D&P Acquisitions, and certain unitholders of D&P Acquisitions, through which we may issue shares of Class A common stock upon the exchange of the New Class A Units. Pursuant to the Exchange Agreement, in connection with any such exchange, a corresponding number of shares of our Class B common stock will be cancelled. Subject to the terms and notice requirements as set forth in an amendment to the Exchange Agreement, exchanges are scheduled to occur on March 5th, May 15th, August 15th and November 15th of each
year.
In 2010, 1,788 New Class A Units were exchanged for 1,788 shares of Class A common stock and 1,788 shares of Class B common stock were cancelled. We filed a registration statement in order to permit the resale of these shares from time to time, subject to certain blackouts and other restrictions. We received no other consideration in connection with these exchanges. There were no exchanges during 2010 by any of our current executive officers or entities affiliated with Lovell Minnick Partners or Vestar Capital Partners.
22
Issuer Purchases of Equity Securities
The following table summarizes repurchases of shares of the Company’s Class A common stock during the quarter ended December 31, 2010:
|
Approximate
|
||||||||||||||||
|
Total
|
Dollar
|
|||||||||||||||
|
Number of
|
Value of
|
|||||||||||||||
|
Shares
|
Shares that
|
|||||||||||||||
|
Total
|
Purchased as
|
May Yet Be
|
||||||||||||||
|
Number of
|
Average
|
Part of Publicly
|
Purchased
|
|||||||||||||
|
Shares
|
Price Paid
|
Announced
|
Under the
|
|||||||||||||
|
Class A Common Stock
|
Purchased
|
Per Share
|
Program(1)
|
Program
|
||||||||||||
|
October 1 through October 31, 2010
|
- | $ | - | - | $ | 43,983 | ||||||||||
|
November 1 through November 30, 2010
|
2 | 13.94 | - | 43,983 | ||||||||||||
|
December 1 through December 31, 2010
|
18 | 14.71 | 7 | 43,892 | ||||||||||||
|
Total
|
20 | $ | 14.64 | 7 | ||||||||||||
|
|
(1)
|
On April 29, 2010, the Company announced that its Board of Directors had approved a stock repurchase program, authorizing the Company to repurchase in the aggregate up to $50,000 of its outstanding common stock. There is no set expiration date.
|
As part of this program, the Company repurchased 451 shares of Class A common stock to date at an average price of $13.54 per share through the filing date of this Annual Report on Form 10-K. Purchases by the Company under this program were made from time to time at prevailing market prices in open market purchases. The purchases were funded from existing cash balances. Repurchased shares were retired and recorded as a reduction to additional paid-in capital. This program does not obligate the Company to acquire any particular amount of common stock. The timing, frequency and amount of repurchase activity will depend on a variety of factors such as levels of
cash generation from operations, cash requirements for investment in the Company’s business, current stock price, market conditions, compliance with financial covenants pursuant to our Credit Agreement, and other factors. The share repurchase program may be suspended, modified or discontinued at any time.
In addition, the Company withheld shares of our Class A common stock from holders of restricted stock awards to satisfy the holders’ tax liabilities in connection with the lapse of restrictions on such shares. These shares were not part of a publicly announced repurchase program and were retired upon purchase.
Equity Compensation Plan Information
See Item 12. Security Ownership of Certain Beneficial Owners and Management and Related Stockholder Matters – Equity Compensation Plan Information.
23
Stock Performance Graph
The following graph compares the cumulative total return to stockholders of the Company's Class A common stock relative to the cumulative total returns of the Russell 2000 Index, and a customized peer group of seven companies that includes: CRA International, Inc.; Evercore Partners, Inc.; FTI Consulting, Inc.; Greenhill & Company, Inc.; Huron Consulting Group, Inc.; LECG Corporation; and Navigant Consulting, Inc. An investment of $100 (actual dollars) with reinvestment of all dividends is assumed to have been made in our common stock, the peer group, and the index on September 28, 2007 and its relative performance is tracked
through December 31, 2010. The stock price performance included in this graph is not necessarily indicative of future stock price performance.
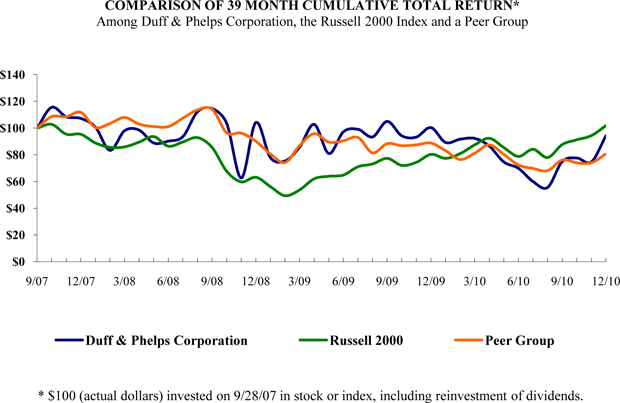
| 9/07 | 10/07 | 11/07 | 12/07 | 1/08 | 2/08 | 3/08 | 4/08 | 5/08 | 6/08 | |||||||||||||||||||||||||||||||
|
Duff & Phelps Corporation
|
$ | 100.00 | $ | 115.53 | $ | 108.39 | $ | 107.25 | $ | 100.76 | $ | 83.38 | $ | 98.04 | $ | 98.47 | $ | 88.83 | $ | 90.25 | ||||||||||||||||||||
|
Russell 2000 Index
|
100.00 | 102.87 | 95.48 | 95.42 | 88.92 | 85.62 | 85.98 | 89.58 | 93.69 | 86.48 | ||||||||||||||||||||||||||||||
|
Peer Group
|
100.00 | 108.60 | 108.50 | 111.82 | 100.56 | 103.44 | 107.99 | 102.97 | 101.20 | 101.13 | ||||||||||||||||||||||||||||||
| 7/08 | 8/08 | 9/08 | 10/08 | 11/08 | 12/08 | 1/09 | 2/09 | 3/09 | 4/09 | |||||||||||||||||||||||||||||||
|
Duff & Phelps Corporation
|
$ | 93.68 | $ | 112.21 | $ | 114.60 | $ | 103.54 | $ | 62.67 | $ | 104.20 | $ | 77.87 | $ | 75.42 | $ | 85.83 | $ | 102.78 | ||||||||||||||||||||
|
Russell 2000 Index
|
89.68 | 92.92 | 85.52 | 67.73 | 59.72 | 63.18 | 56.15 | 49.33 | 53.73 | 62.04 | ||||||||||||||||||||||||||||||
|
Peer Group
|
107.44 | 113.64 | 114.10 | 96.53 | 96.24 | 90.16 | 80.65 | 74.23 | 86.94 | 95.84 | ||||||||||||||||||||||||||||||
| 5/09 | 6/09 | 7/09 | 8/09 | 9/09 | 10/09 | 11/09 | 12/09 | 1/10 | 2/10 | |||||||||||||||||||||||||||||||
|
Duff & Phelps Corporation
|
$ | 80.98 | $ | 97.20 | $ | 99.11 | $ | 93.41 | $ | 105.03 | $ | 94.23 | $ | 93.29 | $ | 100.39 | $ | 89.28 | $ | 91.70 | ||||||||||||||||||||
|
Russell 2000 Index
|
63.91 | 64.85 | 71.10 | 73.13 | 77.35 | 72.10 | 74.36 | 80.35 | 77.39 | 80.88 | ||||||||||||||||||||||||||||||
|
Peer Group
|
89.52 | 90.52 | 92.99 | 81.47 | 88.37 | 86.89 | 87.48 | 88.80 | 83.15 | 76.50 | ||||||||||||||||||||||||||||||
| 3/10 | 4/10 | 5/10 | 6/10 | 7/10 | 8/10 | 9/10 | 10/10 | 11/10 | 12/10 | |||||||||||||||||||||||||||||||
|
Duff & Phelps Corporation
|
$ | 92.30 | $ | 86.56 | $ | 74.67 | $ | 69.91 | $ | 60.00 | $ | 55.63 | $ | 75.01 | $ | 77.63 | $ | 74.78 | $ | 94.30 | ||||||||||||||||||||
|
Russell 2000 Index
|
87.46 | 92.41 | 85.40 | 78.78 | 84.20 | 77.96 | 87.68 | 91.26 | 94.43 | 101.93 | ||||||||||||||||||||||||||||||
|
Peer Group
|
81.19 | 87.48 | 80.29 | 72.39 | 69.82 | 68.15 | 76.11 | 74.04 | 74.07 | 80.74 |
24
Item 6. Selected Financial Data
The following table sets forth the historical selected financial data for the Company for all periods presented. For more information on our historical financial information and Adjusted EBITDA, see Item 7. Management’s Discussion and Analysis of Financial Condition and Results of Operations and Item 8. Financial Statements and Supplemental Data.
Consolidated Statements of Operations
|
Successor
|
Predecessor
|
|||||||||||||||||||||||
|
Period from
|
Period from
|
|||||||||||||||||||||||
|
Year Ended
|
Year Ended
|
Year Ended
|
October 4 to
|
January 1 to
|
Year Ended
|
|||||||||||||||||||
|
December 31,
|
December 31,
|
December 31,
|
December 31,
|
October 3,
|
December 31,
|
|||||||||||||||||||
|
2010(1)
|
2009
|
2008(2)
|
2007(3)
|
2007
|
2006(4)
|
|||||||||||||||||||
|
Revenues
|
$ | 365,546 | $ | 370,903 | $ | 381,476 | $ | 87,883 | $ | 253,275 | $ | 246,742 | ||||||||||||
|
Reimbursable expenses
|
9,485 | 11,083 | 10,546 | 2,824 | 9,946 | 12,526 | ||||||||||||||||||
|
Total revenues
|
375,031 | 381,986 | 392,022 | 90,707 | 263,221 | 259,268 | ||||||||||||||||||
|
Direct client service costs
|
||||||||||||||||||||||||
|
Compensation and benefits(5)
|
205,958 | 210,302 | 216,137 | 71,141 | 158,748 | 146,926 | ||||||||||||||||||
|
Other direct client service costs
|
7,548 | 7,232 | 8,224 | 1,440 | 2,307 | 1,034 | ||||||||||||||||||
|
Acquisition retention expenses(6)
|
11 | - | 793 | 217 | 2,035 | 6,003 | ||||||||||||||||||
|
Reimbursable expenses
|
9,547 | 11,158 | 10,623 | 2,586 | 10,079 | 12,685 | ||||||||||||||||||
| 223,064 | 228,692 | 235,777 | 75,384 | 173,169 | 166,648 | |||||||||||||||||||
|
Operating expenses
|
||||||||||||||||||||||||
|
Selling, general and adminitrative(7)
|
97,451 | 99,162 | 108,312 | 25,308 | 70,946 | 68,606 | ||||||||||||||||||
|
Depreciation and amortization
|
9,916 | 10,244 | 9,816 | 2,384 | 6,754 | 7,702 | ||||||||||||||||||
|
Charge from impairment of certain intangible assets
|
674 | - | - | - | - | - | ||||||||||||||||||
|
Merger and acquisition costs
|
704 | - | - | - | - | - | ||||||||||||||||||
| 108,745 | 109,406 | 118,128 | 27,692 | 77,700 | 76,308 | |||||||||||||||||||
|
Operating income/(loss)
|
43,222 | 43,888 | 38,117 | (12,369 | ) | 12,352 | 16,312 | |||||||||||||||||
|
Other expense/(income)
|
||||||||||||||||||||||||
|
Interest income
|
(112 | ) | (53 | ) | (668 | ) | (763 | ) | (1,306 | ) | (556 | ) | ||||||||||||
|
Interest expense
|
312 | 1,131 | 3,475 | 1,426 | 5,494 | 5,911 | ||||||||||||||||||
|
Loss on early extinguishment of debt
|
- | 1,737 | - | - | - | - | ||||||||||||||||||
|
Other expense/(income)
|
173 | 141 | 398 | 369 | 215 | (243 | ) | |||||||||||||||||
| 373 | 2,956 | 3,205 | 1,032 | 4,403 | 5,112 | |||||||||||||||||||
|
Income/(loss) before income taxes
|
42,849 | 40,932 | 34,912 | (13,401 | ) | 7,949 | 11,200 | |||||||||||||||||
|
Provision for income taxes
|
13,503 | 12,264 | 10,619 | 1,176 | 1,051 | 701 | ||||||||||||||||||
|
Net income/(loss)
|
29,346 | 28,668 | 24,293 | (14,577 | ) | 6,898 | 10,499 | |||||||||||||||||
|
Less: Net income/(loss) attributable to noncontrolling interest
|
12,581 | 17,100 | 19,068 | (8,225 | ) | - | - | |||||||||||||||||
|
Net income/(loss) attributable to Duff & Phelps Corporation
|
$ | 16,765 | $ | 11,568 | $ | 5,225 | $ | (6,352 | ) | $ | 6,898 | $ | 10,499 | |||||||||||
|
Net income/(loss) per share attributable to stockholders of
|
||||||||||||||||||||||||
|
Class A common stock of Duff & Phelps Corporation:
|
||||||||||||||||||||||||
|
Basic
|
$ | 0.62 | $ | 0.57 | $ | 0.37 | $ | (0.49 | ) | |||||||||||||||
|
Diluted
|
$ | 0.60 | $ | 0.54 | $ | 0.36 | $ | (0.49 | ) | |||||||||||||||
|
Adjusted EBITDA(8)(9)
|
$ | 61,026 | $ | 66,569 | $ | 73,632 | $ | 16,374 | $ | 52,569 | $ | 44,051 | ||||||||||||
|
Adjusted EBITDA(8)(9), as a percentage of revenues
|
16.7 | % | 17.9 | % | 19.3 | % | 18.6 | % | 20.8 | % | 17.9 | % | ||||||||||||
|
Adjusted Pro Forma Net Income(8)(9)
|
$ | 29,737 | $ | 32,711 | $ | 36,003 | N/A | N/A | N/A | |||||||||||||||
|
Adjusted Pro Forma Net Income per fully exchanged, fully diluted share outstanding(8)(9)
|
$ | 0.77 | $ | 0.88 | $ | 1.05 | N/A | N/A | N/A | |||||||||||||||
|
End of period managing directors
|
157 | 163 | 168 | 130 | 127 | 106 | ||||||||||||||||||
|
End of period client service professionals
|
785 | 878 | 975 | 844 | 773 | 671 | ||||||||||||||||||
|
(1)
|
Includes the results of Cole Valuation Partners from June 15, 2010; the U.S. advisory business of Dynamic Credit Partners from December 15, 2010; and June Consulting Group from December 15, 2010.
|
25
|
(2)
|
Includes the results of Dubinsky & Company from April 11, 2008; World Tax Service US from July 15, 2008; Kane Reece Associates from July 31, 2008; and Financial and IP Analysis, Inc. (d/b/a The Lumin Expert Group) from August 8, 2008.
|
|
(3)
|
Includes the results of Rash & Associates from October 31, 2007.
|
|
(4)
|
Includes the results of Chanin Capital Partners from October 31, 2006.
|
|
(5)
|
Includes $14,891, $16,432 and $20,537 of equity-based compensation for the years ended December 31, 2010, 2009 and 2008, respectively; $23,806 of equity-based compensation for the period from October 4, 2007 to December 31, 2007; $23,187 for the period from January 1 to October 3, 2007; and $10,244 for the year ended December 31, 2006.
|
|
(6)
|
Acquisition retention expenses include $11 of equity-based compensation expense for the year ended December 31, 2010. In 2010, acquisition retention expenses resulted from expense incurred from certain restricted stock awards that were granted in conjunction with the closing of our acquisition of the U.S. advisory business of Dynamic Capital Partners. The grants were made as a retention incentive to certain former principals of Dynamic who became managing directors of the Company. The grants are subject to certain annual and cliff vesting provisions over three years. These grants may be in addition to future grants awarded as a component of incentive compensation. In 2008 and prior years, we also incurred compensation expense in connection with deferred retention payments that we agreed to
make to certain former employees of CVC in connection with the CVC acquisition in September 2005.
|
|
(7)
|
Includes $5,542, $7,223 and $10,803 of equity-based compensation for the years ended December 31, 2010, 2009 and 2008, respectively; $2,856 of equity-based compensation for the period from October 4, 2007 to December 31, 2007; $8,241 for the period from January 1 to October 3, 2007; and $3,790 for the year ended December 31, 2006.
|
|
(8)
|
Adjusted EBITDA, Adjusted Pro Forma Net Income, and Adjusted Pro Forma Net Income per share are non-GAAP financial measures. We believe that Adjusted EBITDA provides a relevant and useful alternative measure of our ongoing profitability and performance, when viewed in conjunction with GAAP measures, as it adjusts net income or loss attributable to Duff & Phelps Corporation for (a) net income or loss attributable to noncontrolling interest, (b) provision for income taxes, (c) interest expense and depreciation and amortization (a significant portion of which relates to debt and capital investments that have been incurred as the result of acquisitions and investments in stand-alone infrastructure which we do not expect to incur at the same levels in the future), (d) equity-based compensation
associated with the Legacy Units of D&P Acquisitions, a significant portion of which is due to certain onetime grants associated with acquisitions prior to our IPO, and options to purchase shares of the Company’s Class A common stock granted in connection with the IPO, (e) impairment charges, acquisition retention expenses and other merger and acquisition costs, which are generally non-recurring in nature or are related to deferred payments associated with prior acquisitions, and (f) costs incurred from the realignment of our senior management which are generally non-recurring in nature and primarily include cash severance and charges from the accounting impact of the acceleration of vesting of restricted stock awards.
|
Given the level of acquisition activity during the period prior to our IPO, and related capital investments and one time equity grants associated with acquisitions during the this period (which we do not expect to incur at the same levels post IPO) and the IPO, and our belief that, as a professional services organization, our operations are not capital intensive on an ongoing basis, we believe the Adjusted EBITDA measure, in addition to GAAP financial measures, provides a relevant and useful benchmark for investors, in order to assess our financial performance and comparability to other companies in our industry. The Adjusted EBITDA measure is utilized by our senior management to evaluate our overall performance and
operating expense characteristics and to compare our performance to that of certain of our competitors. A measure similar to Adjusted EBITDA is the principal measure that has determined the compensation of our senior management team. In addition, a measure similar to Adjusted EBITDA is a key measure that determines compliance with certain financial covenants under our credit facility. Management compensates for the inherent limitations associated with using the Adjusted EBITDA measure through disclosure of such limitations, presentation of our financial statements in accordance with GAAP and reconciliation of Adjusted EBITDA to the most directly comparable GAAP measure, net income or loss. Furthermore, management also reviews GAAP measures, and evaluates individual measures that are not included in Adjusted EBITDA such as our level of capital expenditures, equity issuance and interest
expense, among other measures.
Adjusted EBITDA, as defined by the Company and reconciled below, consists of net income or loss attributable to Duff & Phelps Corporation before (a) net income or loss attributable to the noncontrolling interest, (b) provision for income taxes, (c) other expense/(income), net, (d) depreciation and amortization, (e) charges from impairment of intangible assets, (f) equity-based compensation associated with Legacy Units and IPO Options included in both compensation and benefits and in selling, general and administrative expenses, (g) cash severance and equity-compensation expense from the acceleration of vesting of restricted stock awards due to the realignment of our senior management, (h) acquisition retention
expenses and (i) merger and acquisition costs:
26
Adjusted EBITDA Reconciliation
|
Successor
|
Predecessor
|
|||||||||||||||||||||||
|
Period from
|
Period from
|
|||||||||||||||||||||||
|
Year Ended
|
Year Ended
|
Year Ended
|
October 4 to
|
January 1 to
|
Year Ended
|
|||||||||||||||||||
|
December 31,
|
December 31,
|
December 31,
|
December 31,
|
October 3,
|
December 31,
|
|||||||||||||||||||
|
2010
|
2009
|
2008
|
2007
|
2007
|
2006
|
|||||||||||||||||||
|
Net income/(loss) attributable to Duff & Phelps Corporation
|
$ | 16,765 | $ | 11,568 | $ | 5,225 | $ | (6,352 | ) | $ | 6,898 | $ | 10,499 | |||||||||||
|
Net income/(loss) attributable to noncontrolling interest
|
12,581 | 17,100 | 19,068 | (8,225 | ) | - | - | |||||||||||||||||
|
Provision for income taxes
|
13,503 | 12,264 | 10,619 | 1,176 | 1,051 | 701 | ||||||||||||||||||
|
Other expense(income), net
|
373 | 2,956 | 3,205 | 1,032 | 4,403 | 5,112 | ||||||||||||||||||
|
Depreciation and amortization
|
9,916 | 10,244 | 9,816 | 2,384 | 6,754 | 7,702 | ||||||||||||||||||
|
Charge from impairment of certain intangible assets
|
674 | - | - | - | - | - | ||||||||||||||||||
|
Equity-based compensation associated with Legacy Units and IPO Options
|
3,399 | 12,437 | 24,906 | 26,142 | 31,428 | 14,034 | ||||||||||||||||||
|
Charge from realignment of senior management (not included in equity-based compensation from Legacy Units and IPO Options above)(9)
|
3,100 | - | - | - | - | - | ||||||||||||||||||
|
Acquisition retention expenses
|
11 | - | 793 | 217 | 2,035 | 6,003 | ||||||||||||||||||
|
Merger and acquisition costs
|
704 | - | - | - | - | - | ||||||||||||||||||
|
Adjusted EBITDA
|
$ | 61,026 | $ | 66,569 | $ | 73,632 | $ | 16,374 | $ | 52,569 | $ | 44,051 | ||||||||||||
Adjusted Pro Forma Net Income, as defined by Duff & Phelps and reconciled below, consists of net income or loss attributable to Duff & Phelps Corporation before (a) net income or loss attributable to the noncontrolling interest, (b) a non-recurring charge from the repayment and subsequent termination of our former credit agreement, (c) equity-based compensation associated with Legacy Units and IPO Options included in both compensation and benefits and in selling, general and administrative expenses, (d) acquisition retention expenses, (e) cash severance and equity-compensation expense from the acceleration of vesting of restricted stock awards due to the realignment of our senior management, (f) merger and
acquisition costs, and less (g) pro forma corporate income tax applied at an assumed rate as specified in the applicable footnote (such assumed pro forma corporate income tax rate may fluctuate between periods and may include true-ups relating to prior periods, based on management estimates and judgments). Adjusted Pro Forma Net Income per share, as defined by Duff & Phelps, consists of Adjusted Pro Forma Net Income divided by the weighted average number of the Company's Class A and Class B shares for the applicable period, giving effect to the dilutive impact, if any, of stock options and restricted stock awards and units issued in connection with the Company’s ongoing long-term compensation program (“Ongoing RSAs”).
Reconciliation of Adjusted Pro Forma Net Income
|
Year Ended December 31,
|
||||||||||||
|
2010
|
2009
|
2008
|
||||||||||
|
Net income attributable to Duff & Phelps Corporation
|
$ | 16,765 | $ | 11,568 | $ | 5,225 | ||||||
|
Net income attributable to noncontrolling interest(a)
|
12,581 | 17,100 | 19,068 | |||||||||
|
Loss on early extinguishment of debt(b)
|
- | 1,737 | - | |||||||||
|
Equity-based compensation associated with Legacy Units and IPO Options(c)
|
3,399 | 12,437 | 24,906 | |||||||||
|
Charge from realignment of senior management (not included in equity-based compensation from Legacy Units and IPO Options above)(9)
|
3,100 | - | - | |||||||||
|
Acquisition retention expenses(d)
|
11 | - | 793 | |||||||||
|
Merger and acquisition costs(e)
|
704 | - | - | |||||||||
|
Adjustment to provision for income taxes(f)
|
(6,823 | ) | (10,131 | ) | (13,989 | ) | ||||||
|
|
||||||||||||
|
Adjusted Pro Forma Net Income, as defined
|
$ | 29,737 | $ | 32,711 | $ | 36,003 | ||||||
|
Pro forma fully exchanged, fully diluted shares outstanding(g)
|
38,792 | 37,338 | 34,346 | |||||||||
|
Adjusted Pro Forma Net Income per fully exchanged, fully diluted share outstanding
|
$ | 0.77 | $ | 0.88 | $ | 1.05 | ||||||
27
|
(a)
|
Represents elimination of the noncontrolling interest associated with the ownership by existing unitholders of D&P Acquisitions (excluding D&P Corporation), as if such unitholders had fully exchanged their partnership units and Class B common stock of the Company for shares of Class A common stock of the Company.
|
|
(b)
|
Represents a non-recurring charge from the repayment and subsequent termination of our credit agreement.
|
|
(c)
|
Represents elimination of equity-based compensation associated with Legacy Units and IPO Options.
|
|
(d)
|
Represents elimination of acquisition retention expenses. In 2010, these expenses resulted from expense incurred from certain restricted stock awards that were granted in conjunction with the closing of our acquisition of the U.S. advisory business of Dynamic Capital Partners. The grants were made as a retention incentive to certain former principals of Dynamic who became managing directors of the Company. The grants are subject to certain annual and cliff vesting provisions over three years. These grants may be in addition to future grants awarded as a component of incentive compensation. In 2008 and prior years, we also incurred compensation expense in connection with deferred retention payments that we agreed to make to certain former employees of CVC in connection with the CVC acquisition
in September 2005.
|
|
(e)
|
Represents elimination of merger and acquisitions costs.
|
|
(f)
|
Represents an adjustment to reflect an assumed effective corporate tax rate of approximately 40.6% for the years ended December 31, 2010, 2009 and 2008 which includes a provision for U.S. federal income taxes and assumes the highest statutory rates apportioned to each state, local and/or foreign jurisdiction. Assumes (i) full exchange of existing unitholders' partnership units and Class B common stock of the Company into Class A common stock of the Company, (ii) the Company has adopted a conventional corporate tax structure and is taxed as a C Corporation in the U.S. at prevailing corporate rates, and (iii) all deferred tax assets related to foreign operations are fully realizable.
|
|
(g)
|
Based on the weighted-average number of aggregated Class A and Class B shares of common stock outstanding, excluding Ongoing RSAs, and dilutive effect of Ongoing RSAs. The Company believes that IPO Options would not be considered dilutive when applying the treasury method.
|
Both Adjusted EBITDA and Adjusted Pro Forma Net Income are non-GAAP financial measures which are not prepared in accordance with, and should not be considered alternatives to, measurements required by GAAP, such as operating income, net income or loss, net income or loss per share, cash flow from continuing operating activities or any other measure of performance or liquidity derived in accordance with GAAP. The presentation of this additional information is not meant to be considered in isolation or as a substitute for the most directly comparable GAAP measures. In addition, it should be noted that companies calculate Adjusted EBITDA and Adjusted Pro Forma Net Income differently and, therefore, Adjusted EBITDA and
Adjusted Pro Forma Net Income as presented for us may not be comparable to Adjusted EBITDA and Adjusted Pro Forma Net Income reported by other companies.
|
(9)
|
On April 22, 2010, we announced certain management changes related to the departure of our former president and one of our segment leaders. We incurred a onetime charge associated with these changes of approximately $3,610 primarily in our second quarter of 2010 related to cash severance and the accounting impact of accelerated vesting of equity-based awards. Of this amount, approximately $3,100 primarily resulted from cash severance and a charge from the accelerated vesting of restricted stock awards which is added back to Adjusted EBITDA and Adjusted Pro Forma Net Income. The remaining $510 related to a charge from the accelerated vesting of Legacy Units and IPO Options which is also added back to Adjusted EBITDA and Adjusted Pro Forma Net Income consistent with prior
presentation.
|
Consolidated Balance Sheet Data
|
As of December 31,
|
||||||||||||||||||||
|
2010
|
2009
|
2008
|
2007
|
2006
|
||||||||||||||||
|
Cash and cash equivalents
|
$ | 113,328 | $ | 107,311 | $ | 81,381 | $ | 90,243 | $ | 59,132 | ||||||||||
|
Total assets
|
548,226 | 507,033 | 416,197 | 404,513 | 268,031 | |||||||||||||||
|
Current and long-term debt
|
- | - | 42,972 | 43,181 | 77,997 | |||||||||||||||
|
Total liabilities
|
205,662 | 193,276 | 178,438 | 223,030 | 174,013 | |||||||||||||||
|
Total stockholders' equity of Duff & Phelps Corporation
|
251,270 | 214,886 | 100,129 | 69,504 | - | |||||||||||||||
|
Noncontrolling interest
|
91,294 | 98,871 | 137,630 | 111,979 | - | |||||||||||||||
|
Total stockholders' equity
|
342,564 | 313,757 | 237,759 | 181,483 | - | |||||||||||||||
|
Total redeemable units
|
- | - | - | - | 91,973 | |||||||||||||||
|
Total unitholders' equity/(deficit)
|
- | - | - | - | 2,045 | |||||||||||||||
28
Item 7. Management’s Discussion and Analysis of Financial Condition and Results of Operations.
Overview
We are a leading provider of independent financial advisory and investment banking services. Our mission is to help our clients protect, maximize and recover value by providing independent advice on issues involving highly technical and complex assessments in the areas of valuation, transactions, financial restructuring, disputes and taxation. We believe that the Duff & Phelps brand is associated with experienced professionals who give trusted guidance in a responsive manner.
We provide our services globally to a wide variety of companies that are in need of industry-leading, customized financial advice. Our clients include publicly-traded and privately-held companies, government entities, and investment firms such as private equity firms and hedge funds. Additionally, we maintain extensive relationships with law, accounting and investment banking firms from which we receive referral business.
Our collaborative, team-based culture promotes the cross-selling of new business opportunities across practice groups and enables us to deliver the most appropriate Duff & Phelps professionals to meet a client's needs. In addition, our integrated, multi-disciplinary approach enables us to cross-staff our professionals across multiple service lines to better manage the utilization of our professionals. We believe that our Company’s culture, global scale, broad service offering and strong brand name, provides an appealing career platform that allows us to attract and retain highly qualified professionals.
We generate revenues from Financial Advisory, Corporate Finance Consulting and Investment Banking services. We typically enter into these engagements on a time-and-materials basis, a fixed-fee basis or a contingent-fee basis. Revenue trends in our Financial Advisory and Investment Banking segments, and to a lesser extent the Corporate Finance Consulting segment, generally are correlated to the volume of M&A activity and restructurings. However, deviations from this trend can occur in any given year for a number of reasons. For example, changes in our market share or the ability of our clients to close certain large transactions can cause our revenue results to diverge from the level of overall M&A or
restructuring activity. In addition, because many businesses do not routinely engage in M&A and restructuring activity, our fee paying engagements with many clients are not likely to be predictable and high levels of revenue in one quarter are not necessarily predictive of continued high levels of revenue in future periods. Further, we have lines of business that are not correlated to the volume of M&A activity and restructurings, but rather to bankruptcy filings, litigation or regulatory trends.
29
Our Financial Advisory segment provides clients with services through our Valuation Advisory, Tax Services and Dispute & Legal Management Consulting business units. Our Corporate Finance Consulting segment provides services related to Portfolio Valuation, Financial Engineering, Strategic Value Advisory and Due Diligence. We believe our services provided through these two segments help our clients effectively navigate through increasingly complex financial valuations as well as accounting, tax, regulatory and legal issues. Our Investment Banking segment includes our Global Restructuring Advisory, Transaction Opinions and M&A Advisory business units. Through this segment we provide independent advice to our
clients in order to assist them in making critical decisions in a variety of strategic situations.
Our most significant expenses are costs classified as direct client service costs and operating expenses. Direct client service costs include salaries, performance bonuses, payroll taxes, benefits and equity-based compensation for client service professionals. We accrue performance bonuses based on actual performance and client service gross margin targets in each period for our segments. We also incur other direct client service costs which may include fees paid to independent contractors that we retain to supplement full-time personnel, typically on an as-needed basis for specific client engagements. From time to time, we also incur expenses, including those relating to travel, other out-of-pocket expenses and
third-party costs to perform specific client engagement that are not billable to clients.
We also incur operating expenses which include selling, general and administrative expenses (“SG&A”). SG&A consist of salaries, performance bonuses, payroll taxes, benefits and equity-based compensation for our corporate and administrative personnel, costs for occupancy, technology and communications, marketing and business development, recruiting, training, professional fees, depreciation and amortization and other operating expenses. Merger and acquisition costs resulted from professional fees, incremental marketing expenses and incremental travel and entertainment incurred in conjunction with prospective or consummated acquisitions.
Critical Accounting Policies and Estimates
Management’s discussion and analysis of the Company’s financial condition and results of operations is based upon the Company’s consolidated financial statements, which have been prepared in accordance with accounting principles generally accepted in the United States (“GAAP”). The preparation of financial statements in conformity with GAAP requires management to make estimates and assumptions that affect amounts of assets and liabilities and disclosures of contingent assets and liabilities as of the date of the financial statements and reported amounts of revenues and expenses during the periods presented. Actual results could differ from these estimates. Estimates and assumptions are
reviewed periodically and the effects of revisions are reflected in the consolidated financial statements in the period they are deemed to be necessary. Significant estimates made in the accompanying consolidated financial statements include, but are not limited to the following:
|
|
·
|
proportional performance under client engagements for the purpose of determining revenue recognition,
|
|
|
·
|
accounts receivable and unbilled services valuation,
|
|
|
·
|
incentive compensation and other accrued benefits,
|
|
|
·
|
useful lives of intangible assets,
|
|
|
·
|
the carrying value of goodwill and intangible assets,
|
|
|
·
|
amounts due to noncontrolling unitholders,
|
|
|
·
|
reserves for estimated tax liabilities,
|
|
|
·
|
contingent liabilities,
|
|
|
·
|
certain estimates and assumptions used in the allocation of revenues and expenses for our segment reporting, and
|
|
|
·
|
certain estimates and assumptions used in the calculation of the fair value of equity compensation issued to employees.
|
Critical accounting policies are those policies that we believe present the most complex or subjective measurements and have the most potential to impact our financial position and operating results. While all decisions regarding accounting policies are important, we believe that the following policies could be considered critical. These critical policies relate to revenue recognition, accounts receivable and allowance for doubtful accounts, goodwill and other intangible assets, acquisition accounting, accounting for equity-based compensation and income taxes.
Revenue Recognition
We recognize revenues in accordance with FASB ASC 605, Revenue Recognition. Revenue is recognized when persuasive evidence of an arrangement exists, the related services are provided, the price is fixed or determinable and collectability is reasonably assured. We generate revenues from services provided by our Financial Advisory, Corporate Finance Consulting and Investment Banking segments. We typically enter into these engagements on a time-and-materials basis, a fixed-fee basis or a contingent fee basis. Revenues from time-and-materials engagements are recognized as the hours are incurred by our client service professionals.
30
Revenues from fixed-fee engagements are recognized as the services are provided under a proportional performance method. Revenues for engagements under a proportional performance method are recognized based on estimates of work completed versus the total services to be provided under the engagement. Revenue recognition is affected by a number of factors that change the estimated amount of work required to complete the project such as changes in scope, the staffing on the engagement and the level of client participation. Losses, if any, on fixed-fee engagements are recognized in the period in which the loss first becomes probable and reasonably estimable. To date, such losses have not been significant. Historically,
if an engagement terminates prior to completion, we have typically recovered the costs incurred related to the services provided. Periodic engagement reviews require us to make judgments and estimates regarding the overall profitability and stage of project completion, which, in turn, impact the revenue recognition in the current period.
In the absence of clear and reliable output measures, we believe that our method of recognizing service revenues, for contracts with fixed fees, based on hours of service provided represents an appropriate surrogate for output measures. We determined that an input-based approach was most appropriate because the input measures are deemed to be a reasonable substitute for output measures based on the performance of our obligations to the customer, and due to the fact that an input-based approach would not vary significantly from an output measure approach. We believe this methodology provides a reliable measure of the revenue from the advisory services we provide to our customers under fixed-fee engagements given the
nature of the consulting services we provide and the following additional considerations:
|
|
·
|
We are a specialty consulting firm.
|
|
|
·
|
Our engagements do not typically have specific interim deliverables or milestones.
|
|
|
·
|
The customer receives the benefit of our services throughout the contract term.
|
|
|
·
|
The customer is obligated to pay for services rendered even if a final deliverable is not produced, typically based on the proportional hours performed to date.
|
|
|
·
|
We do not incur setup costs.
|
|
|
·
|
We expense contract fulfillment costs, which are primarily compensation costs, as incurred.
|
We recognize revenue over the period that the services are provided in proportion to the delivery of services as measured by billable hours as this reflects the pattern in which obligations to the customer are filled and by which the customer receives the benefit of the service. Revenue is not recognized on a straight-line basis or upon completion as this is not reflective of the manner in which services are provided.
We have engagements for which the revenues are contingent on successful completion of the project. Any contingent revenue on these contracts is not recognized until the contingency is resolved and payment is reasonably assured. Retainer fees under these arrangements are deferred and recognized ratably over the period in which the related service is rendered. Revenues from restructuring advisory engagements that are performed with respect to cases in bankruptcy court are typically recognized in the month in which the services are performed unless there are objections and/or holdbacks mandated by court instructions. Costs related to these engagements are expensed as incurred.
We also have contracts with clients to deliver multiple services that are covered under specific engagement letters. These contracts specifically identify the services to be provided with the corresponding deliverable. All engagement letters are reviewed by management and signed by both the client and the Company prior to revenue being recorded. During the review process, management ascertains which services are being provided for within the contract and sets up the appropriate coding and accrual rates within the financial system for each element. For engagements that have multiple elements, a separate task will be set up for each element to enable more accurate tracking and variance analysis.
The fair value for each service is determined based on the prices charged when each element is sold separately. Revenues are recognized in accordance with our accounting policies for the elements as described further above. The elements qualify for separation when the services have value on a stand-alone basis and fair value of the separate element exists. While determining fair value and identifying separate elements requires judgment, generally fair value and the separate elements are readily identifiable as we also sell those elements individually outside of a multiple services engagement.
Differences between the timing of billings and the recognition of revenue are recognized as either unbilled services or deferred revenue in the accompanying consolidated balance sheets. Revenues recognized for services performed but not yet billed to clients have been recorded as unbilled services. Client prepayments and retainers are classified as deferred revenue and recognized as earned or ratably over the service period.
31
Equity-Based Compensation
We account for equity-based compensation in accordance with FASB ASC 718, Compensation–Stock Compensation. Equity-based compensation expense is based on fair value at the date of grant and the pre-vesting forfeiture rate. It is recognized over the requisite service period using the accelerated method of amortization as described in FASB ASC 718 for grants with graded vesting or using the straight-line method for grants with cliff vesting. The fair value of the awards is determined from periodic valuations using key assumptions for implied asset volatility, expected dividends, risk free rate and the expected term of the awards. If factors change and we
employ different assumptions in the application of FASB ASC 718 in future periods or if there is a material change in the fair value of the Company, the compensation expense that we record may differ significantly from what we have recorded in the current period.
Forfeitures are estimated at the time an award is granted and revised, if necessary, in subsequent periods if actual forfeitures differ from those estimates. A one-percentage point decrease in the estimated forfeiture rates would have resulted in a approximately $1,300 increase in compensation expense related to equity-based compensation expense for the year ended December 31, 2010.
Direct client service costs and selling, general and administrative expenses include equity-based compensation with respect to (a) grants of legacy units of D&P Acquisitions prior to the consummation of the Recapitalization Transactions (“Legacy Units”), (b) options to purchase shares of the Company’s Class A common stock granted in connection with the IPO (“IPO Options”) and (c) restricted stock awards issued in connection with our ongoing long-term compensation program, consisting of restricted shares of Class A common stock and restricted stock units (“Ongoing RSAs”).
Legacy Units
Immediately prior to the closing of the IPO on October 3, 2007, D&P Acquisitions effectuated certain transactions intended to simplify the capital structure of D&P Acquisitions (the “Recapitalization Transactions”). Prior to the Recapitalization Transactions, D&P Acquisitions' capital structure consisted of seven different classes of membership interests (collectively, “Legacy Units”), each of which had different capital accounts and amounts of aggregate distributions above which its holders share in future distributions. Certain units were issued in conjunction with acquisitions and as long-term incentive compensation to management and independent members of the board of
directors.
The net effect of the Recapitalization Transactions was to convert the Legacy Units into a single new class of units called “New Class A Units.” The holders of New Class A Units also own one share of the Company’s Class B common stock for each New Class A Unit. Pursuant to an exchange agreement, the New Class A Units are exchangeable on a one-for-one basis for shares of the Company’s Class A common stock. In connection with an exchange, a corresponding number of shares of the Company’s Class B common stock are cancelled.
The Company accounts for equity-based compensation in accordance with the fair value provisions of FASB ASC 718. As of October 3, 2007, the value used for the purpose of FASB ASC 718 for the above referenced units was based on the price of $16.00 per share of Class A common stock sold in the IPO, which determined the conversion of Legacy Units of D&P Acquisitions into New Class A Units pursuant to the Recapitalization Transactions. In all cases of graded vesting, equity-based compensation expense is being accrued through charges to operations over the respective vesting periods of the equity grants using the accelerated method of amortization.
Generally, Legacy Units were vested upon grant or have certain vesting provisions on each anniversary date over a four to five year requisite service period assuming that the holder remains employed by the Company, as more precisely defined in the individual grant agreements. Accelerated vesting occurs in the case of a sale of the Company or a qualified liquidity event.
Upon a termination of such holder's employment other than for cause, unvested units will be forfeited for no consideration and vested units may be exchanged at the option of the holder or repurchased for a repurchase price equal to the fair market value of such units at the option of the Company. Upon a termination of such holder's employment for cause or if the holder resigns without good reason and then competes with the Company, all vested and unvested units will be forfeited without any consideration.
IPO Options and Ongoing Restricted Stock Awards
The Duff & Phelps Corporation Amended and Restated 2007 Omnibus Stock Incentive Plan permits the grant of stock options, stock appreciation rights, deferred stock awards, restricted stock awards, dividend equivalent rights, and any other share-based awards that are valued in whole or in part by reference to our Class A common stock, or any combination of these. This plan is administered by the Compensation Committee of our board of directors.
Options were granted in conjunction with our IPO to employees with exercise prices equal to the market value of our common stock on the grant date and expire ten years subsequent to grant date. Vesting provisions for individual awards are established at the grant date at the discretion of the Compensation Committee of our board of directors. Options granted under our share-based incentive compensation plans vest annually over four years. We plan to issue new shares of our common stock whenever stock options are exercised or share awards are granted. The Company did not grant options prior to 2007.
32
Ongoing RSAs are typically granted as a form of incentive compensation, generally contingent on continued employment and converted to unrestricted Class A common stock when restrictions on transfer lapse. The restrictions on transfer and forfeiture provisions are generally eliminated after three years for all awards granted to non-executives with certain exceptions related to retiree eligible employees and termination of employees without cause. The restrictions on transfer and forfeiture provisions are eliminated annually over three years based on ratable vesting for grants made to executives and four years for non-employee members of our board of directors. Corresponding expense is recognized based on the fair
market value on the date of grant.
Accounts Receivable and Allowance for Doubtful Accounts
Accounts receivable are recorded at face amounts less an allowance for doubtful accounts. On a periodic basis, we evaluate our accounts receivable and establish the allowance for doubtful accounts by calculating and recording a specified percentage of the individual open receivable balances. Specific allowances are also recorded based on historical experience, analysis of past due accounts, client creditworthiness and other current available information. However, our actual experience may vary from our estimates. If the financial condition of our clients were to deteriorate, resulting in their inability or unwillingness to pay our fees, we may need to record additional allowances or write-offs in future periods. This
risk is mitigated to the extent that we may receive retainers from some of our clients prior to performing significant services.
The provision for doubtful accounts is recorded as a reduction in revenue to the extent the provision relates to fee adjustments and other discretionary pricing adjustments. To the extent the provision relates to a client's inability to make required payments on accounts receivables, the provision is recorded in operating expenses.
Historically, our actual losses and credits have been consistent with these allowances. As a percentage of gross accounts receivable, our accounts receivable allowances totaled 2.2% and 3.0% at December 31, 2010 and December 31, 2009, respectively. As of December 31, 2010, a one-percentage point deviation in uncollectible accounts receivable would have resulted in an increase or decrease in the allowance and bad debt expense or revenue adjustment of $617.
Goodwill and Other Intangible Assets
Goodwill represents the excess of purchase price and related acquisition costs over the value assigned to the net tangible and identifiable intangible assets of businesses acquired. Under the provisions of FASB ASC 350, Intangibles–Goodwill and Other, goodwill is required to be tested for impairment on an annual basis and between annual tests whenever indications of impairment exist such as loss of key personnel, unanticipated competition or other unforeseen developments. Impairment exists when the carrying amount of goodwill exceeds its implied fair value, resulting in an impairment charge for this excess. An impairment test involves considerable
management judgment and estimates regarding future operating results and cash flows. Pursuant to our policy, we performed the annual goodwill assessment as of October 1, 2010 and determined that no impairment of goodwill existed as of that date. We have considered the overall economic environment and other factors related to potential impairment subsequent to October 1, 2010 through the date hereof and concluded that no indications of impairment have arisen.
Other intangible assets include trade names, customer relationships, contract backlog, and non-competition agreements. We use valuation techniques in estimating the initial fair value of acquired intangible assets. These valuations are primarily based on the present value of the estimated net cash flows expected to be derived from the client contracts and relationships, discounted for assumptions about future customer attrition. We evaluate our intangible assets for impairment whenever events or changes in circumstances indicate that the carrying amount of the assets may not be recoverable. In the event that higher or earlier-than-expected customer attrition occurs, it may result in higher future amortization charges
or an impairment charge for customer-related intangible assets.
Acquisition Accounting
For business combinations for which the acquisition date is on or before January 1, 2009, we utilized the purchase method of accounting in accordance with FASB Statement No. 141, Business Combinations. For business combinations for which the acquisition date is on or after January 1, 2009, we utilize the purchase method of accounting in accordance with FASB ASC 805, Business Combinations. These standards require that the total cost of an acquisition be allocated to the tangible and intangible
assets acquired and liabilities assumed based upon their respective fair values at the date of acquisition. The allocation of the purchase price is dependent upon certain valuations and other studies. FASB ASC 805 introduced significant changes in the accounting for and reporting of business acquisitions, including changes in the accounting for contingent consideration.
Income Taxes
We have recorded net deferred tax assets as we expect to realize future tax benefits related to the utilization of certain of these assets. If we determine in the future that we will not be able to fully utilize all or part of these deferred tax assets, we would record a valuation allowance and record it as a charge to income in the period the determination was made. While utilization of these deferred tax assets will provide future cash flow benefits, they will not have an effect on future income tax expense.
33
As a result of the Company’s acquisition of New Class A Units of D&P Acquisitions as described above, the Company expects to benefit from depreciation and other tax deductions reflecting D&P Acquisitions' tax basis for its assets. Those deductions will be allocated to the Company and will be taken into account in reporting the Company’s taxable income. Further, as a result of a federal income tax election made by D&P Acquisitions applicable to a portion of the Company’s acquisition of D&P Acquisitions’ New Class A Units, the income tax basis of the assets of D&P Acquisitions underlying a portion of the units the Company has acquired have been adjusted based upon the amount
that the Company has paid for that portion of its D&P Acquisitions’ New Class A Units. The Company has entered into an agreement with the selling unitholders of D&P Acquisitions that will provide for the additional payment by the Company to the selling unitholders of D&P Acquisitions of 85% of the amount of cash savings, if any, in U.S. federal, state and local income tax that the Company realizes (i) from the tax basis in its proportionate share of D&P Acquisitions' goodwill and similar intangible assets that the Company receives as a result of the exchanges and (ii) from the federal income tax election referred to above. As result of these transactions, the Company's tax basis in its share of D&P Acquisitions' assets will be higher than the book basis of these same assets.
The Company accounts for uncertainties in income tax positions in accordance with FASB ASC 740, Income Taxes. FASB ASC 740 prescribes a recognition threshold and measurement attribute for financial statement recognition and measurement of a tax position taken or expected to be taken in a tax return.
Other Policies and Account Descriptions
Reimbursable Expenses
Reimbursable expenses, including those relating to travel, other out-of-pocket expenses and third-party costs are included as a component of total revenues. Expense reimbursements that are billable to clients are included in total revenues, and typically an equivalent amount of reimbursable expenses are included in total direct client service costs. Reimbursable expenses related to time-and-materials and fixed-fee engagements are recognized as revenue in the period in which the expense is incurred and collectability is reasonably assured. We typically manage and analyze our business on the basis of revenue before reimbursable expenses. We believe this is the most accurate reflection of our services because it
eliminates the effect of these reimbursable expenses that we bill to our clients.
Acquisition Retention Expenses
In 2010, we incurred expense from certain restricted stock awards that were granted in conjunction with the closing of our acquisition of the U.S. advisory business of Dynamic Capital Partners. The grants were made as a retention incentive to certain former principals of Dynamic who became managing directors of the Company. The grants are subject to certain annual and cliff vesting provisions over three years. These grants may be in addition to future grants awarded as a component of incentive compensation. In 2008 and prior years, we also incurred compensation expense in connection with deferred retention payments that we agreed to make to certain former employees of CVC in connection with the CVC acquisition in
September 2005.
Distributions and Other Payments to Noncontrolling Unitholders
The following table summarizes distributions and other payments to noncontrolling unitholders, as described more fully below:
|
Year Ended
|
||||||||||||
|
December 31,
|
December 31,
|
December 31,
|
||||||||||
|
2010
|
2009
|
2008
|
||||||||||
|
Distributions for taxes
|
$ | 7,081 | $ | 20,097 | $ | 9,753 | ||||||
|
Other distributions
|
2,752 | 1,879 | - | |||||||||
|
Payments pursuant to the Tax Receivable Agreement
|
4,267 | 3,090 | 791 | |||||||||
| $ | 14,100 | $ | 25,066 | $ | 10,544 | |||||||
Distributions for taxes
As a limited liability company, D&P Acquisitions does not incur significant federal or state and local taxes, as these taxes are primarily the obligations of the members of D&P Acquisitions. As authorized by the Third Amended and Restated LLC Agreement of D&P Acquisitions, D&P Acquisitions is required to distribute cash, generally, on a pro rata basis, to its members to the extent necessary to provide funds to pay the members' tax liabilities, if any, with respect to the earnings of D&P Acquisitions. The tax distribution rate has been set at 45% of each member’s allocable share of taxable income of D&P Acquisitions. D&P Acquisitions is only required to make such distributions if cash
is available for such purposes as determined by the Company. The Company expects cash will be available to make these distributions. Upon completion of its tax returns with respect to the prior year, D&P Acquisitions may make true-up distributions to its members, if cash is available for such purposes, with respect to actual taxable income for the prior year. The change in level of distributions for each member’s estimated tax liability between periods primarily resulted from the timing of quarterly payments.
34
Other distributions
During the year ended December 31, 2010, the Company distributed $2,752 to holders of New Class A Units, other than Duff & Phelps Corporation. Concurrent with the payment of the dividend to shareholders of record, holders of New Class A Units received a $0.05 distribution per vested unit on March 16, 2010 and a $0.06 distribution per vested unit on May 28, 2010, August 27, 2010 and December 3, 2010. These amounts totaled $2,590 and will be treated as a reduction in basis of each member’s ownership interests. Pursuant to the terms of the Third Amended and Restated LLC Agreement of D&P Acquisitions, a corresponding amount per unvested unit was deposited into a segregated account and will be distributed
once a year with respect to units that vested during that year. During the year ended December 31, 2010, the Company distributed $162 to members whose units vested during 2009 and accrued $276 to members whose units vested during 2010. This accrual was paid in January 2011. Any amounts related to unvested units that forfeit are returned to the Company.
Payments pursuant to the Tax Receivable Agreement
As a result of the Company’s acquisition of New Class A Units of D&P Acquisitions, the Company expects to benefit from depreciation and other tax deductions reflecting D&P Acquisitions' tax basis for its assets. Those deductions will be allocated to the Company and will be taken into account in reporting the Company’s taxable income. Further, as a result of a federal income tax election made by D&P Acquisitions applicable to a portion of the Company’s acquisition of New Class A Units of D&P Acquisitions, the income tax basis of the assets of D&P Acquisitions underlying a portion of the units the Company has and will acquire (pursuant to the exchange agreement) will be adjusted
based upon the amount that the Company has paid for that portion of its New Class A Units of D&P Acquisitions.
The Company has entered into a tax receivable agreement (“TRA”) with the existing unitholders of D&P Acquisitions (for the benefit of the existing unitholders of D&P Acquisitions) that provides for the payment by the Company to the unitholders of D&P Acquisitions of 85% of the amount of cash savings, if any, in U.S. federal, state and local income tax that the Company realizes (i) from the tax basis in its proportionate share of D&P Acquisitions' goodwill and similar intangible assets that the Company receives as a result of the exchanges and (ii) from the federal income tax election referred to above. D&P Acquisitions expects to make future payments under the TRA to the extent cash is
available for such purposes.
As of December 31, 2010, the Company recorded a liability of $109,525, representing the payments due to D&P Acquisitions’ unitholders under the TRA (see current and non-current portion of “Due to noncontrolling unitholders” on the Company’s Condensed Consolidated Balance Sheets).
Within the next 12 month period, the Company expects to pay $5,640 of the total amount. The basis for determining the current portion of the payments due to D&P Acquisitions’ unitholders under the TRA is the expected amount of payments to be made within the next 12 months. The long-term portion of the payments due to D&P Acquisitions’ unitholders under the tax receivable agreement is the remainder. Payments are anticipated to be made annually over 15 years, commencing from the date of each event that gives rise to the TRA benefits, beginning with the date of the closing of the IPO on October 3, 2007. The payments are made in accordance with the terms of the TRA. The timing of the
payments is subject to certain contingencies including Duff & Phelps Corporation having sufficient taxable income to utilize all of the tax benefits defined in the TRA.
To determine the current amount of the payments due to D&P Acquisitions’ unitholders under the TRA, the Company estimated the amount of taxable income that Duff & Phelps Corporation has generated over the previous fiscal year. Next, the Company estimated the amount of the specified TRA deductions at year end. This was used as a basis for determining the amount of tax reduction that generates a TRA obligation. In turn, this was used to calculate the estimated payments due under the TRA that the Company expects to pay in the next 12 months. These calculations are performed pursuant to the terms of the TRA.
Obligations pursuant to the TRA are obligations of Duff & Phelps Corporation. They do not impact the noncontrolling interest. These obligations are not income tax obligations and have no impact on the tax provision or the allocation of taxes. Furthermore, the TRA has no impact on the allocation of the provision for income taxes to the Company’s net income. In general, items of income and expense are allocated on the basis of member’s ownership interests pursuant to the Third Amended and Restated Limited Liability Company Agreement of Duff & Phelps Acquisitions, LLC.
35
Results of Operations
Year Ended December 31, 2010 versus Year Ended December 31, 2009
The results of operations are summarized as follows:
|
Year Ended
|
Year Ended
|
|||||||||||||||
|
December 31,
|
December 31,
|
Unit
|
Percent
|
|||||||||||||
|
2010
|
2009
|
Change
|
Change
|
|||||||||||||
|
Revenues
|
$ | 365,546 | $ | 370,903 | $ | (5,357 | ) | (1.4 | )% | |||||||
|
Reimbursable expenses
|
9,485 | 11,083 | (1,598 | ) | (14.4 | )% | ||||||||||
|
Total revenues
|
375,031 | 381,986 | (6,955 | ) | (1.8 | )% | ||||||||||
|
Direct client service costs
|
||||||||||||||||
|
Compensation and benefits(1)
|
205,958 | 210,302 | (4,344 | ) | (2.1 | )% | ||||||||||
|
Other direct client service costs
|
7,548 | 7,232 | 316 | 4.4 | % | |||||||||||
|
Acquisition retention expenses(2)
|
11 | - | 11 | N/A | ||||||||||||
|
Reimbursable expenses
|
9,547 | 11,158 | (1,611 | ) | (14.4 | )% | ||||||||||
| 223,064 | 228,692 | (5,628 | ) | (2.5 | )% | |||||||||||
|
Operating expenses
|
||||||||||||||||
|
Selling, general and administrative(3)
|
97,451 | 99,162 | (1,711 | ) | (1.7 | )% | ||||||||||
|
Depreciation and amortization
|
9,916 | 10,244 | (328 | ) | (3.2 | )% | ||||||||||
|
Charge from impairment of certain intangible assets
|
674 | - | 674 | N/A | ||||||||||||
|
Merger and acquisition costs
|
704 | - | 704 | N/A | ||||||||||||
| 108,745 | 109,406 | (661 | ) | (0.6 | )% | |||||||||||
|
Operating income
|
43,222 | 43,888 | (666 | ) | (1.5 | )% | ||||||||||
|
Other expense/(income), net
|
||||||||||||||||
|
Interest income
|
(112 | ) | (53 | ) | (59 | ) | 111.3 | % | ||||||||
|
Interest expense
|
312 | 1,131 | (819 | ) | (72.4 | )% | ||||||||||
|
Loss on early extinguishment of debt
|
- | 1,737 | (1,737 | ) | (100.0 | )% | ||||||||||
|
Other expense
|
173 | 141 | 32 | 22.7 | % | |||||||||||
| 373 | 2,956 | (2,583 | ) | (87.4 | )% | |||||||||||
|
Income before income taxes
|
42,849 | 40,932 | 1,917 | 4.7 | % | |||||||||||
|
Provision for income taxes
|
13,503 | 12,264 | 1,239 | 10.1 | % | |||||||||||
|
Net income
|
29,346 | 28,668 | 678 | 2.4 | % | |||||||||||
|
Less: Net income attributable to noncontrolling interest
|
12,581 | 17,100 | (4,519 | ) | (26.4 | )% | ||||||||||
|
Net income attributable to Duff & Phelps Corporation
|
$ | 16,765 | $ | 11,568 | $ | 5,197 | 44.9 | % | ||||||||
|
Other financial and operating data
|
||||||||||||||||
|
Adjusted EBITDA(4)(5)
|
$ | 61,026 | $ | 66,569 | $ | (5,543 | ) | (8.3 | )% | |||||||
|
Adjusted EBITDA(4)(5) as a percentage of revenues
|
16.7 | % | 17.9 | % | (1.2 | )% | (6.7 | )% | ||||||||
|
Adusted Pro Forma Net Income(4)(5)
|
$ | 29,737 | $ | 32,711 | $ | (2,974 | ) | (9.1 | )% | |||||||
|
Adusted Pro Forma Net Income per fully exchanged, fully diluted share outstanding(4)(5)
|
$ | 0.77 | $ | 0.88 | $ | (0.11 | ) | (12.5 | )% | |||||||
|
End of period managing directors
|
157 | 163 | (6 | ) | (3.7 | )% | ||||||||||
|
End of period client service professionals
|
785 | 878 | (93 | ) | (10.6 | )% | ||||||||||
|
(1)
|
Compensation and benefits include $14,891 and $16,432 of equity-based compensation expense for the years ended December 31, 2010 and 2009, respectively.
|
36
|
(2)
|
Acquisition retention expenses include $11 of equity-based compensation expense for the year ended December 31, 2010. Acquisition retention expenses resulted from expense incurred from certain restricted stock awards that were granted in conjunction with the closing of our acquisition of the U.S. advisory business of Dynamic Capital Partners. The grants were made as a retention incentive to certain former principals of Dynamic who became managing directors of the Company. The grants are subject to certain annual and cliff vesting provisions over three years. These grants may be in addition to future grants awarded as a component of incentive compensation.
|
|
(3)
|
Selling, general and administrative expenses include $5,542 and $7,223 of equity-based compensation expense for the years ended December 31, 2010 and 2009, respectively.
|
|
(4)
|
Adjusted EBITDA, Adjusted Pro Forma Net Income, and Adjusted Pro Forma Net Income per share are non-GAAP financial measures. We believe that Adjusted EBITDA provides a relevant and useful alternative measure of our ongoing profitability and performance, when viewed in conjunction with GAAP measures, as it adjusts net income or loss attributable to Duff & Phelps Corporation for (a) net income or loss attributable to noncontrolling interest, (b) provision for income taxes, (c) interest expense and depreciation and amortization (a significant portion of which relates to debt and capital investments that have been incurred as the result of acquisitions and investments in stand-alone infrastructure which we do not expect to incur at the same levels in the future), (d) equity-based compensation
associated with the Legacy Units of D&P Acquisitions, a significant portion of which is due to certain onetime grants associated with acquisitions prior to our IPO, and options to purchase shares of the Company’s Class A common stock granted in connection with the IPO, (e) impairment charges, acquisition retention expenses and other merger and acquisition costs, which are generally non-recurring in nature or are related to deferred payments associated with prior acquisitions, and (f) costs incurred from the realignment of our senior management which are generally non-recurring in nature and primarily include cash severance and charges from the accounting impact of the acceleration of vesting of restricted stock awards.
|
Given the level of acquisition activity during the period prior to our IPO, and related capital investments and one time equity grants associated with acquisitions during the this period (which we do not expect to incur at the same levels post IPO) and the IPO, and our belief that, as a professional services organization, our operations are not capital intensive on an ongoing basis, we believe the Adjusted EBITDA measure, in addition to GAAP financial measures, provides a relevant and useful benchmark for investors, in order to assess our financial performance and comparability to other companies in our industry. The Adjusted EBITDA measure is utilized by our senior management to evaluate our overall performance and
operating expense characteristics and to compare our performance to that of certain of our competitors. A measure similar to Adjusted EBITDA is the principal measure that has determined the compensation of our senior management team. In addition, a measure similar to Adjusted EBITDA is a key measure that determines compliance with certain financial covenants under our credit facility. Management compensates for the inherent limitations associated with using the Adjusted EBITDA measure through disclosure of such limitations, presentation of our financial statements in accordance with GAAP and reconciliation of Adjusted EBITDA to the most directly comparable GAAP measure, net income or loss. Furthermore, management also reviews GAAP measures, and evaluates individual measures that are not included in Adjusted EBITDA such as our level of capital expenditures, equity issuance and interest
expense, among other measures.
Adjusted EBITDA, as defined by the Company and reconciled below, consists of net income or loss attributable to Duff & Phelps Corporation before (a) net income or loss attributable to the noncontrolling interest, (b) provision for income taxes, (c) other expense/(income), net, (d) depreciation and amortization, (e) charges from impairment of intangible assets, (f) equity-based compensation associated with Legacy Units and IPO Options included in both compensation and benefits and in selling, general and administrative expenses, (g) cash severance and equity-compensation expense from the acceleration of vesting of restricted stock awards due to the realignment of our senior management, (h) acquisition retention
expenses and (i) merger and acquisition costs:
37
Reconciliation of Adjusted EBITDA
|
Year Ended
|
Year Ended
|
|||||||
|
December 31,
|
December 31,
|
|||||||
|
2010
|
2009
|
|||||||
|
Net income attributable to Duff & Phelps Corporation
|
$ | 16,765 | $ | 11,568 | ||||
|
Net income attributable to noncontrolling interest
|
12,581 | 17,100 | ||||||
|
Provision for income taxes
|
13,503 | 12,264 | ||||||
|
Other expense/(income), net
|
373 | 2,956 | ||||||
|
Depreciation and amortization
|
9,916 | 10,244 | ||||||
|
Charge from impairment of certain intangible assets
|
674 | - | ||||||
|
Equity-based compensation associated with Legacy Units and IPO Options
|
3,399 | 12,437 | ||||||
|
Charge from realignment of senior management (not included in equity-based compensation from Legacy Units and IPO Options above)(5)
|
3,100 | - | ||||||
|
Acquisition retention expenses
|
11 | - | ||||||
|
Merger and acquisition costs
|
704 | - | ||||||
|
Adjusted EBITDA
|
$ | 61,026 | $ | 66,569 | ||||
Adjusted Pro Forma Net Income, as defined by Duff & Phelps and reconciled below, consists of net income or loss attributable to Duff & Phelps Corporation before (a) net income or loss attributable to the noncontrolling interest, (b) a non-recurring charge from the repayment and subsequent termination of our former credit agreement, (c) equity-based compensation associated with Legacy Units and IPO Options included in both compensation and benefits and in selling, general and administrative expenses, (d) acquisition retention expenses, (e) cash severance and equity-compensation expense from the acceleration of vesting of restricted stock awards due to the realignment of our senior management, (f) merger and
acquisition costs, and less (g) pro forma corporate income tax applied at an assumed rate as specified in the applicable footnote (such assumed pro forma corporate income tax rate may fluctuate between periods and may include true-ups relating to prior periods, based on management estimates and judgments). Adjusted Pro Forma Net Income per share, as defined by Duff & Phelps, consists of Adjusted Pro Forma Net Income divided by the weighted average number of the Company's Class A and Class B shares for the applicable period, giving effect to the dilutive impact, if any, of stock options and restricted stock awards and units issued in connection with the Company’s ongoing long-term compensation program (“Ongoing RSAs”).
Reconciliation of Adjusted Pro Forma Net Income
|
Year Ended
|
Year Ended
|
|||||||
|
December 31,
|
December 31,
|
|||||||
|
2010
|
2009
|
|||||||
|
Net income attributable to Duff & Phelps Corporation
|
$ | 16,765 | $ | 11,568 | ||||
|
Net income attributable to noncontrolling interest(a)
|
12,581 | 17,100 | ||||||
|
Loss on early extinguishment of debt(b)
|
- | 1,737 | ||||||
|
Equity-based compensation associated with Legacy Units and IPO Options(c)
|
3,399 | 12,437 | ||||||
|
Charge from realignment of senior management (not included in equity-based compensation from Legacy Units and IPO Options above)(5)
|
3,100 | - | ||||||
|
Acquisition retention expenses(d)
|
11 | |||||||
|
Merger and acquisition costs(e)
|
704 | - | ||||||
|
Adjustment to provision for income taxes(f)
|
(6,823 | ) | (10,131 | ) | ||||
|
Adjusted Pro Forma Net Income, as defined
|
$ | 29,737 | $ | 32,711 | ||||
|
Pro forma fully exchanged, fully diluted shares outstanding(g)
|
38,792 | 37,338 | ||||||
|
Adjusted Pro Forma Net Income per fully exchanged, fully diluted share outstanding
|
$ | 0.77 | $ | 0.88 | ||||
|
(a)
|
Represents elimination of the noncontrolling interest associated with the ownership by existing unitholders of D&P Acquisitions (excluding D&P Corporation), as if such unitholders had fully exchanged their partnership units and Class B common stock of the Company for shares of Class A common stock of the Company.
|
|
(b)
|
Represents a non-recurring charge from the repayment and subsequent termination of our credit agreement.
|
|
(c)
|
Represents elimination of equity-based compensation associated with Legacy Units and IPO Options.
|
38
|
(d)
|
Represents elimination of acquisition retention expenses which resulted from expense incurred from certain restricted stock awards that were granted in conjunction with the closing of our acquisition of the U.S. advisory business of Dynamic Capital Partners. The grants were made as a retention incentive to certain former principals of Dynamic who became managing directors of the Company. The grants are subject to certain annual and cliff vesting provisions over three years. These grants may be in addition to future grants awarded as a component of incentive compensation.
|
|
(e)
|
Represents elimination of merger and acquisitions costs.
|
|
(f)
|
Represents an adjustment to reflect an assumed effective corporate tax rate of approximately 40.6% for the years ended December 31, 2010 and 2009 which includes a provision for U.S. federal income taxes and assumes the highest statutory rates apportioned to each state, local and/or foreign jurisdiction. Assumes (i) full exchange of existing unitholders' partnership units and Class B common stock of the Company into Class A common stock of the Company, (ii) the Company has adopted a conventional corporate tax structure and is taxed as a C Corporation in the U.S. at prevailing corporate rates, and (iii) all deferred tax assets related to foreign operations are fully realizable.
|
|
(g)
|
Based on the weighted-average number of aggregated Class A and Class B shares of common stock outstanding, excluding Ongoing RSAs, and dilutive effect of Ongoing RSAs. The Company believes that IPO Options would not be considered dilutive when applying the treasury method.
|
Both Adjusted EBITDA and Adjusted Pro Forma Net Income are non-GAAP financial measures which are not prepared in accordance with, and should not be considered alternatives to, measurements required by GAAP, such as operating income, net income or loss, net income or loss per share, cash flow from continuing operating activities or any other measure of performance or liquidity derived in accordance with GAAP. The presentation of this additional information is not meant to be considered in isolation or as a substitute for the most directly comparable GAAP measures. In addition, it should be noted that companies calculate Adjusted EBITDA and Adjusted Pro Forma Net Income differently and, therefore, Adjusted EBITDA and
Adjusted Pro Forma Net Income as presented for us may not be comparable to Adjusted EBITDA and Adjusted Pro Forma Net Income reported by other companies.
|
(5)
|
On April 22, 2010, we announced certain management changes related to the departure of our former president and one of our segment leaders. We incurred a onetime charge associated with these changes of approximately $3,610 primarily in our second quarter of 2010 related to cash severance and the accounting impact of accelerated vesting of equity-based awards. Of this amount, approximately $3,100 primarily resulted from cash severance and a charge from the accelerated vesting of restricted stock awards which is added back to Adjusted EBITDA and Adjusted Pro Forma Net Income. The remaining $510 related to a charge from the accelerated vesting of Legacy Units and IPO Options which is also added back to Adjusted EBITDA and Adjusted Pro Forma Net Income consistent with prior
presentation.
|
39
Revenues
Revenues excluding reimbursable expenses decreased $5,357 or 1.4% to $365,546 for the year ended December 31, 2010, compared to $370,903 for the year ended December 31, 2009. The decrease in revenues primarily resulted from a decrease in revenues from our Financial Advisory and Corporate Finance Consulting segments, partially offset by an increase in revenues from our Investment Banking segment, as summarized in the following table:
|
Year Ended
|
Year Ended
|
|||||||||||||||
|
December 31,
|
December 31,
|
Dollar
|
Percent
|
|||||||||||||
|
2010
|
2009
|
Change
|
Change
|
|||||||||||||
|
Financial Advisory
|
||||||||||||||||
|
Valuation Advisory
|
$ | 135,076 | $ | 138,510 | $ | (3,434 | ) | (2.5 | )% | |||||||
|
Tax Services
|
43,324 | 47,902 | (4,578 | ) | (9.6 | )% | ||||||||||
|
Dispute & Legal Management Consulting(1)
|
41,062 | 47,220 | (6,158 | ) | (13.0 | )% | ||||||||||
| 219,462 | 233,632 | (14,170 | ) | (6.1 | )% | |||||||||||
|
Corporate Finance Consulting
|
||||||||||||||||
|
Portfolio Valuation
|
19,795 | 22,153 | (2,358 | ) | (10.6 | )% | ||||||||||
|
Financial Engineering(2)
|
13,474 | 19,171 | (5,697 | ) | (29.7 | )% | ||||||||||
|
Strategic Value Advisory
|
11,819 | 13,450 | (1,631 | ) | (12.1 | )% | ||||||||||
|
Due Diligence
|
10,766 | 8,182 | 2,584 | 31.6 | % | |||||||||||
| 55,854 | 62,956 | (7,102 | ) | (11.3 | )% | |||||||||||
|
Investment Banking
|
||||||||||||||||
|
M&A Advisory
|
22,719 | 15,845 | 6,874 | 43.4 | % | |||||||||||
|
Transaction Opinions
|
28,903 | 21,076 | 7,827 | 37.1 | % | |||||||||||
|
Global Restructuring Advisory
|
38,608 | 37,394 | 1,214 | 3.2 | % | |||||||||||
| 90,230 | 74,315 | 15,915 | 21.4 | % | ||||||||||||
|
Total Revenues (excluding reimbursables)
|
$ | 365,546 | $ | 370,903 | $ | (5,357 | ) | (1.4 | )% | |||||||
|
(1)
|
Includes $6,871 of revenue from our acquisition of Cole Valuation Partners effective June 15, 2010. Also includes a de minimis amount of revenue from our acquisition of June Consulting Group effective December 15, 2010.
|
|
(2)
|
Includes a de minimis amount of revenue from our acquisition of the U.S. advisory business of Dynamic Capital Partners effective December 15, 2010.
|
Our Financial Advisory segment was impacted by lower revenues from each business unit. Valuation Advisory was primarily impacted by a reduction of goodwill impairment testing due to the improvement in the overall economic environment, as the corresponding prior year benefited from a significant volume of goodwill impairment testing as a result of the fallout from the financial crisis. In addition, there was lower revenue generated from Valuation Advisory client service professionals with respect to Portfolio Valuation engagements (see cross utilization explanation in segment discussion). These decreases were partially offset by an increase in revenues from purchase price allocations and a higher volume of real estate
valuation work. In addition, Valuation Advisory revenues were $36,054 in the quarter ended December 31, 2010. This represents a sequential increase of $4,881 or 15.7% over the quarter ended September 30, 2010 and a $1,378 or 4.0% increase over the quarter ended December 31, 2009.
The decrease in revenues from Tax Services primarily resulted from the departure of staff during the first half of 2010 associated with World Tax Service US (which we acquired in July 2008) and related income tax advisory services.
Dispute & Legal Management Consulting (and to a lesser extent certain business units in our Corporate Finance Consulting segment) was impacted by lower revenues from an engagement to serve as a financial advisor to the court appointed examiner of a large financial services company under bankruptcy protection. This engagement wound down during the first half of 2010. Revenues from this engagement were primarily recognized in our Dispute & Legal Management Consulting business unit as well as our Corporate Finance Consulting segment. Our 2010 results include approximately $8,200 of revenue from this engagement, compared to approximately $30,100 of revenue recognized in the prior year (of which approximately 70%
was recognized in Dispute & Legal and approximately 30% in Corporate Finance Consulting). The decrease from this engagement was partially offset by revenue from our acquisitions during the year.
Our Corporate Finance Consulting segment was impacted by lower revenues from Portfolio Valuation, Financial Engineering and Strategic Value Advisory, primarily due to lower revenues from an engagement to serve as a financial advisor to the court appointed examiner of a large financial services company under bankruptcy protection (as described above) and reduced demand. Our Due Diligence business grew due to an increase in M&A related activity.
40
Each of our business units in the Investment Banking segment demonstrated growth versus the prior year from an improvement in overall M&A transaction volume with respect to our M&A Advisory and Transaction Opinions business units and from continued economic volatility with respect to Global Restructuring Advisory.
Our client service headcount decreased to 785 client service professionals at December 31, 2010, compared to 878 client service professionals at December 31, 2009. This decrease resulted from targeted reductions and attrition, partially offset by the addition of 40 client service professionals from acquisitions, and targeted hiring of professionals with specific expertise. In addition, we had 157 client service managing directors at December 31, 2010, compared to 163 at December 31, 2009. We added 24 managing directors from acquisitions, internal promotions and limited hiring. These additions were principally offset by targeted reductions.
Direct Client Service Costs
Direct client service costs decreased $5,628 or 2.5% to $223,064 for the year ended December 31, 2010, compared to $228,692 for the year ended December 31, 2009. Direct client service costs include compensation and benefits for client service employees, fees payable to contractors and other expenses related to the execution of engagements.
In addition, direct client service costs include a charge of approximately $540 from certain management changes announced on April 22, 2010, including the departure of our former president and one of our segment leaders. The Company incurred a onetime charge associated with these changes of approximately $3,610 primarily in its second quarter of 2010 related to cash severance and the accounting impact of the accelerated vesting of equity-based awards. Of this amount, approximately $540 was included as a charge to direct client service costs, primarily for cash severance related to the departure of one of our segment leaders.
The following table adjusts direct client service costs for equity-based compensation associated with Legacy Units and IPO Options, acquisition retention expenses, reimbursable expenses and the charge from the departure of our former president and one of our segment leaders:
Direct Client Service Costs
|
Year Ended
|
Year Ended
|
|||||||
|
December 31,
|
December 31,
|
|||||||
|
2010
|
2009
|
|||||||
|
Revenues (excluding reimbursables)
|
$ | 365,546 | $ | 370,903 | ||||
|
Total direct client service costs
|
$ | 223,064 | $ | 228,692 | ||||
|
Less: equity-based compensation associated with Legacy Units and IPO Options
|
(1,308 | ) | (8,736 | ) | ||||
|
Less: acquisition retention expenses
|
(11 | ) | - | |||||
|
Less: reimbursable expenses
|
(9,547 | ) | (11,158 | ) | ||||
|
Less: charge from realignment of senior management
|
(540 | ) | - | |||||
|
Direct client service costs, as adjusted
|
$ | 211,658 | $ | 208,798 | ||||
|
Direct client service costs, as adjusted, as a percentage of revenues
|
57.9 | % | 56.3 | % | ||||
Direct client service costs, as adjusted, increased between periods. Higher equity-compensation expense from incremental grants of Ongoing RSAs and higher accrued incentive compensation were partially offset by lower base compensation and related benefits as the result of the reduction in headcount between periods.
Equity-based compensation from Legacy Units and IPO Options decreased between periods primarily as a result of the accelerated attribution of expense on awards with graded-tranche vesting in prior periods for Legacy Units and IPO Options.
41
Operating Expenses
Operating expenses decreased $661 or 0.6% to $108,745 for the year ended December 31, 2010, compared to $109,406 for the year ended December 31, 2009.
Selling, general and administrative expenses include a charge of approximately $3,070 from the departure of our former president, including approximately $510 related to Legacy Units and IPO Options. In addition, operating expenses include a $674 onetime charge from the impairment of certain intangible assets that originated from our acquisition of World Tax Service US in July 2008. The impairment resulted from the departure of the two managing directors who ran this group and associated staff in March 2010. World Tax Service US operated as part of our Financial Advisory segment. Also, merger and acquisition costs resulted from closed and pending acquisitions and related
activity. These costs include professional fees, incremental marketing expenses and incremental travel and entertainment.
The following table adjusts operating expenses for equity-based compensation associated with Legacy Units and IPO Options, depreciation and amortization, a charge to impair certain intangible assets, the charge from the departure of our former president and merger and acquisition costs:
|
Operating Expenses
|
||||||||
|
|
||||||||
|
|
Year Ended
|
Year Ended
|
||||||
|
December 31,
|
December 31,
|
|||||||
|
2010
|
2009
|
|||||||
|
Revenues (excluding reimbursables)
|
$ | 365,546 | $ | 370,903 | ||||
|
Total operating expenses
|
$ | 108,745 | $ | 109,406 | ||||
|
Less: equity-based compensation associated with Legacy Units and IPO Options
|
(2,091 | ) | (3,701 | ) | ||||
|
Less: depreciation and amortization
|
(9,916 | ) | (10,244 | ) | ||||
|
Less: charge to impair certain intangible assets
|
(674 | ) | - | |||||
|
Less: charge from realignment of senior management (not included in equity-based compensation from
|
||||||||
|
Legacy Units and IPO Options above)
|
(2,560 | ) | - | |||||
|
Less: merger and acquisition costs
|
(704 | ) | - | |||||
|
Operating expenses, as adjusted
|
$ | 92,800 | $ | 95,461 | ||||
|
Operating expenses, as adjusted, as a percentage of revenues
|
25.4 | % | 25.7 | % | ||||
Operating expenses, as adjusted, decreased between periods primarily from lower accrued compensation in part from the departure of our former president, professional fees and bad debts, partially offset primarily by higher occupancy and marketing costs.
Equity-based compensation from Legacy Units and IPO Options decreased between periods primarily as a result of the accelerated attribution of expense on awards with graded-tranche vesting in prior periods, partially offset by the charge incurred from our realignment of senior management (as described above).
Other Income and Expense
Other income and expense include interest income, interest expense and other expense. Interest expense decreased primarily as a result of repayment and termination of our former credit facility with General Electric Capital Corporation in May 2009.
42
Provision for Income Taxes
The provision for income taxes was $13,503 or 31.5% of income before income taxes for the year ended December 31, 2010, compared to $12,264 or 30.0% of income before income taxes for the year ended December 31, 2009. The U.S. statutory income tax rate of 35% plus state and local statutory rates were decreased to the effective tax rate due to the fact that D&P Acquisitions, LLC and many of its subsidiaries operate as limited liability companies or other flow-through entities which are not subject to federal income tax. This operating structure results in a rate benefit because a portion of the Company’s earnings are not subject to corporate level taxes. This favorable impact is
partially offset by an increase due to state and local taxes, the effect of permanent differences and foreign taxes. The increase in the provision for income taxes as a percentage of income before income taxes resulted primarily from a decrease in the rate benefit from operating as an LLC, due to an increase in Duff & Phelps Corporation’s ownership of D&P Acquisitions, LLC. During the year ended December 31, 2010, the Company recorded discrete items that resulted in a benefit to income tax expense, including (i) an immaterial adjustment to correct the purchase accounting of a prior acquisition and (ii) provision to actual adjustments.
Net Income Attributable to the Noncontrolling Interest
Net income attributable to the noncontrolling interest represents the portion of net income or loss before income taxes attributable to the ownership interest in D&P Acquisitions held by the existing unitholders to the extent the book value of their interest in D&P Acquisitions is greater than zero. This interest totaled 30.8% and 43.8% for the years ended December 31, 2010 and 2009, respectively.
43
Segment Results – Year Ended December 31, 2010 versus Year Ended December 31, 2009
The following table sets forth selected segment operating results:
|
Results of Operations by Segment
|
||||||||||||||||
|
Year Ended
|
Year Ended
|
|||||||||||||||
|
December 31,
|
December 31,
|
Unit
|
Percent
|
|||||||||||||
|
2010
|
2009
|
Change
|
Change
|
|||||||||||||
|
Financial Advisory
|
||||||||||||||||
|
Revenues (excluding reimbursables)
|
$ | 219,462 | $ | 233,632 | $ | (14,170 | ) | (6.1 | )% | |||||||
|
Segment operating income
|
$ | 28,692 | $ | 37,557 | $ | (8,865 | ) | (23.6 | )% | |||||||
|
Segment operating income margin
|
13.1 | % | 16.1 | % | (3.0 | )% | (18.6 | )% | ||||||||
|
Corporate Finance Consulting
|
||||||||||||||||
|
Revenues (excluding reimbursables)
|
$ | 55,854 | $ | 62,956 | $ | (7,102 | ) | (11.3 | )% | |||||||
|
Segment operating income
|
$ | 10,335 | $ | 13,854 | $ | (3,519 | ) | (25.4 | )% | |||||||
|
Segment operating income margin
|
18.5 | % | 22.0 | % | (3.5 | )% | (15.9 | )% | ||||||||
|
Investment Banking
|
||||||||||||||||
|
Revenues (excluding reimbursables)
|
$ | 90,230 | $ | 74,315 | $ | 15,915 | 21.4 | % | ||||||||
|
Segment operating income
|
$ | 22,061 | $ | 15,233 | $ | 6,828 | 44.8 | % | ||||||||
|
Segment operating income margin
|
24.4 | % | 20.5 | % | 3.9 | % | 19.0 | % | ||||||||
|
Total
|
||||||||||||||||
|
Revenues (excluding reimbursables)
|
$ | 365,546 | $ | 370,903 | ||||||||||||
|
Segment operating income
|
$ | 61,088 | $ | 66,644 | ||||||||||||
|
Net client reimbursable expenses
|
(62 | ) | (75 | ) | ||||||||||||
|
Equity-based compensation from
|
||||||||||||||||
|
Legacy Units and IPO Options
|
(3,399 | ) | (12,437 | ) | ||||||||||||
|
Depreciation and amortization
|
(9,916 | ) | (10,244 | ) | ||||||||||||
|
Charge from impairment of certain intangible assets
|
(674 | ) | - | |||||||||||||
|
Charge from realignment of senior management (not included in equity-based compensation from Legacy Units or IPO Options above)
|
(3,100 | ) | - | |||||||||||||
|
Acquisition retention expenses
|
(11 | ) | ||||||||||||||
|
Merger and acquisition costs
|
(704 | ) | - | |||||||||||||
|
Operating income
|
$ | 43,222 | $ | 43,888 | ||||||||||||
|
|
||||||||||||||||
|
Average Client Service Professionals
|
||||||||||||||||
|
Financial Advisory
|
567 | 657 | (90 | ) | (13.7 | )% | ||||||||||
|
Corporate Finance Consulting
|
112 | 132 | (20 | ) | (15.2 | )% | ||||||||||
|
Investment Banking
|
128 | 133 | (5 | ) | (3.8 | )% | ||||||||||
|
Total
|
807 | 922 | (115 | ) | (12.5 | )% | ||||||||||
|
End of Period Client Service Professionals
|
||||||||||||||||
|
Financial Advisory
|
548 | 618 | (70 | ) | (11.3 | )% | ||||||||||
|
Corporate Finance Consulting
|
109 | 129 | (20 | ) | (15.5 | )% | ||||||||||
|
Investment Banking
|
128 | 131 | (3 | ) | (2.3 | )% | ||||||||||
|
Total
|
785 | 878 | (93 | ) | (10.6 | )% | ||||||||||
|
Revenue per Client Service Professional
|
||||||||||||||||
|
Financial Advisory
|
$ | 387 | $ | 356 | $ | 31 | 8.7 | % | ||||||||
|
Corporate Finance Consulting
|
$ | 499 | $ | 477 | $ | 22 | 4.6 | % | ||||||||
|
Investment Banking
|
$ | 705 | $ | 559 | $ | 146 | 26.1 | % | ||||||||
|
Total
|
$ | 453 | $ | 402 | $ | 51 | 12.7 | % | ||||||||
44
|
Results of Operations by Segment – Continued
|
||||||||||||||||
|
Year Ended
|
Year Ended
|
|||||||||||||||
|
December 31,
|
December 31,
|
Unit
|
Percent
|
|||||||||||||
|
2010
|
2009
|
Change
|
Change
|
|||||||||||||
|
Utilization(1)
|
||||||||||||||||
|
Financial Advisory
|
67.8 | % | 65.7 | % | 2.1 | % | 3.2 | % | ||||||||
|
Corporate Finance Consulting
|
60.9 | % | 64.0 | % | (3.1 | )% | (4.8 | )% | ||||||||
|
Rate-Per-Hour(2)
|
||||||||||||||||
|
Financial Advisory
|
$ | 342 | $ | 321 | $ | 21 | 6.5 | % | ||||||||
|
Corporate Finance Consulting
|
$ | 453 | $ | 401 | $ | 52 | 13.0 | % | ||||||||
|
|
||||||||||||||||
|
Revenues (excluding reimbursables)
|
||||||||||||||||
|
Financial Advisory
|
$ | 219,462 | $ | 233,632 | $ | (14,170 | ) | (6.1 | )% | |||||||
|
Corporate Finance Consulting
|
55,854 | 62,956 | (7,102 | ) | (11.3 | )% | ||||||||||
|
Investment Banking
|
90,230 | 74,315 | 15,915 | 21.4 | % | |||||||||||
|
Total
|
$ | 365,546 | $ | 370,903 | $ | (5,357 | ) | (1.4 | )% | |||||||
|
Average Number of Managing Directors
|
||||||||||||||||
|
Financial Advisory
|
91 | 97 | (6 | ) | (6.2 | )% | ||||||||||
|
Corporate Finance Consulting
|
30 | 30 | - | 0.0 | % | |||||||||||
|
Investment Banking
|
40 | 39 | 1 | 2.6 | % | |||||||||||
|
Total
|
161 | 166 | (5 | ) | (3.0 | )% | ||||||||||
|
End of Period Managing Directors
|
||||||||||||||||
|
Financial Advisory
|
88 | 93 | (5 | ) | (5.4 | )% | ||||||||||
|
Corporate Finance Consulting
|
31 | 30 | 1 | 3.3 | % | |||||||||||
|
Investment Banking
|
38 | 40 | (2 | ) | (5.0 | )% | ||||||||||
|
Total
|
157 | 163 | (6 | ) | (3.7 | )% | ||||||||||
|
Revenue per Managing Director
|
||||||||||||||||
|
Financial Advisory
|
$ | 2,412 | $ | 2,409 | $ | 3 | 0.1 | % | ||||||||
|
Corporate Finance Consulting
|
$ | 1,862 | $ | 2,099 | $ | (237 | ) | (11.3 | )% | |||||||
|
Investment Banking
|
$ | 2,256 | $ | 1,906 | $ | 350 | 18.4 | % | ||||||||
|
Total
|
$ | 2,270 | $ | 2,234 | $ | 36 | 1.6 | % | ||||||||
|
|
(1)
|
The utilization rate for any given period is calculated by dividing the number of hours incurred by client service professionals who worked on client assignments (including internal projects for the Company) during the period by the total available working hours for all of such client service professionals during the same period, assuming a 40 hour work week, less paid holidays and vacation days. Utilization excludes client service professionals associated with certain property tax services due to the nature of the work performed and client service professionals from certain acquisitions prior to their transition to the Company’s financial system.
|
|
|
(2)
|
Average billing rate-per-hour is calculated by dividing revenues for the period by the number of hours worked on client assignments (including internal projects for the Company) during the same period. Financial Advisory revenues used to calculate rate-per-hour exclude revenues associated with certain property tax engagements. The average billing rate excludes certain hours from our acquisitions prior to their transition to the Company’s financial system.
|
For segment reporting purposes, management uses certain estimates and assumptions to allocate revenues and expenses. Revenues and expenses attributable to reportable segments are generally based on which segment and product line a client service professional is a dedicated member. As a result, revenues recognized that relate to the cross utilization of client service professionals across reportable segments occur each period depending on the expertise required for each engagement. In particular, the Financial Advisory segment (primarily Valuation Advisory services) recognized revenues of $9,544 and $11,533 from the cross utilization of its client service professionals on engagements
from the Corporate Finance Consulting segment (primarily Portfolio Valuation services) in the years ended December 31, 2010 and 2009, respectively.
45
Financial Advisory
Revenues
Revenues from the Financial Advisory segment decreased $14,170 or 6.1% to $219,462 for the year ended December 31, 2010, compared to $233,632 for the year ended December 31, 2009. The overall decline resulted from a decrease in revenues from each business unit, as summarized in the following table:
|
Year Ended
|
Year Ended
|
|||||||||||||||
|
December 31,
|
December 31,
|
Dollar
|
Percent
|
|||||||||||||
|
2010
|
2009
|
Change
|
Change
|
|||||||||||||
|
Financial Advisory
|
||||||||||||||||
|
Valuation Advisory
|
$ | 135,076 | $ | 138,510 | $ | (3,434 | ) | (2.5 | )% | |||||||
|
Tax Services
|
43,324 | 47,902 | (4,578 | ) | (9.6 | )% | ||||||||||
|
Dispute & Legal Management Consulting(1)
|
41,062 | 47,220 | (6,158 | ) | (13.0 | )% | ||||||||||
| $ | 219,462 | $ | 233,632 | $ | (14,170 | ) | (6.1 | )% | ||||||||
|
(1)
|
Includes $6,871 of revenue from our acquisition of Cole Valuation Partners effective June 15, 2010. Also includes a de minimis amount of revenue from our acquisition of June Consulting Group effective December 15, 2010.
|
Our Financial Advisory segment was impacted by lower revenues from each business unit. Valuation Advisory was primarily impacted by a reduction of goodwill impairment testing due to the improvement in the overall economic environment, as the corresponding prior year benefited from a significant volume of goodwill impairment testing as a result of the fallout from the financial crisis. In addition, there was lower revenue generated from Valuation Advisory client service professionals with respect to Portfolio Valuation engagements (see cross utilization explanation in segment discussion). These decreases were partially offset by an increase in revenues from purchase price allocations
and a higher volume of real estate valuation work. In addition, Valuation Advisory revenues were $36,054 in the quarter ended December 31, 2010. This represents a sequential increase of $4,881 or 15.7% over the quarter ended September 30, 2010 and a $1,378 or 4.0% increase over the quarter ended December 31, 2009.
The decrease in revenues from Tax Services primarily resulted from the departure of staff during the first half of 2010 associated with World Tax Service US (which we acquired in July 2008) and related income tax advisory services.
Dispute & Legal Management Consulting (and to a lesser extent certain business units in our Corporate Finance Consulting segment) was impacted by lower revenues from an engagement to serve as a financial advisor to the court appointed examiner of a large financial services company under bankruptcy protection. This engagement wound down during the first half of 2010. Revenues from this engagement were primarily recognized in our Dispute & Legal Management Consulting business unit as well as our Corporate Finance Consulting segment. Our 2010 results include approximately $8,200 of revenue from this engagement, compared to approximately $30,100 of revenue recognized in the prior
year (of which approximately 70% was recognized in Dispute & Legal and approximately 30% in Corporate Finance Consulting). The decrease from this engagement was partially offset by revenue from our acquisitions during the year.
Segment Operating Income
Financial Advisory segment operating income decreased $8,865 or 23.6% to $28,692 for the year ended December 31, 2010, compared to $37,557 for the year ended December 31, 2009. Segment operating income margin, defined as segment operating income expressed as a percentage of segment revenues, was 13.1% for the year ended December 31, 2010, compared to 16.1% for the year ended December 31, 2009. Segment operating income decreased primarily as a result of lower revenues, partially offset by a reduction of direct costs and allocated overhead expenses.
46
Corporate Finance Consulting
Revenues
Revenues from the Corporate Finance Consulting segment decreased $7,102 or 11.3% to $55,854 for the year ended December 31, 2010, compared to $62,956 for the year ended December 31, 2009. Lower revenues from Portfolio Valuation, Financial Engineering and Strategic Value Advisory were partially offset by higher revenues from Due Diligence, as summarized in the following table:
|
Year Ended
|
Year Ended
|
|||||||||||||||
|
December 31,
|
December 31,
|
Dollar
|
Percent
|
|||||||||||||
|
2010
|
2009
|
Change
|
Change
|
|||||||||||||
|
Corporate Finance Consulting
|
||||||||||||||||
|
Portfolio Valuation
|
$ | 19,795 | $ | 22,153 | $ | (2,358 | ) | (10.6 | )% | |||||||
|
Financial Engineering(1)
|
13,474 | 19,171 | (5,697 | ) | (29.7 | )% | ||||||||||
|
Strategic Value Advisory
|
11,819 | 13,450 | (1,631 | ) | (12.1 | )% | ||||||||||
|
Due Diligence
|
10,766 | 8,182 | 2,584 | 31.6 | % | |||||||||||
| $ | 55,854 | $ | 62,956 | $ | (7,102 | ) | (11.3 | )% | ||||||||
|
(1)
|
Includes a de minimis amount of revenue from our acquisition of the advisory business of Dynamic Capital Partners effective December 15, 2010.
|
Our Corporate Finance Consulting segment was impacted by lower revenues from Portfolio Valuation, Financial Engineering and Strategic Value Advisory, primarily due to lower revenues from an engagement to serve as a financial advisor to the court appointed examiner of a large financial services company under bankruptcy protection (as described above) and reduced demand. Our Due Diligence business grew due to an increase in M&A related activity.
Segment Operating Income
Operating income from the Corporate Finance Consulting segment decreased $3,519 or 25.4% to $10,335 for the year ended December 31, 2010, compared to $13,854 for the year ended December 31, 2009. Segment operating income margin was 18.5% for the year ended December 31, 2010, compared to 22.0% for the year ended December 31, 2009. Segment operating income decreased primarily as a result of lower revenues, partially offset by a reduction of direct costs and allocated overhead expenses.
47
Investment Banking
Revenues
Revenues from the Investment Banking segment increased $15,915 or 21.4% to $90,230 for the year ended December 31, 2010, compared to $74,315 for the year ended December 31, 2009, as summarized in the following table:
|
Year Ended
|
Year Ended
|
|||||||||||||||
|
December 31,
|
December 31,
|
Dollar
|
Percent
|
|||||||||||||
|
2010
|
2009
|
Change
|
Change
|
|||||||||||||
|
Investment Banking
|
||||||||||||||||
|
M&A Advisory
|
$ | 22,719 | $ | 15,845 | $ | 6,874 | 43.4 | % | ||||||||
|
Transaction Opinions
|
28,903 | 21,076 | 7,827 | 37.1 | % | |||||||||||
|
Global Restructuring Advisory
|
38,608 | 37,394 | 1,214 | 3.2 | % | |||||||||||
| $ | 90,230 | $ | 74,315 | $ | 15,915 | 21.4 | % | |||||||||
Each of our business units in the Investment Banking segment demonstrated growth versus the prior year from an improvement in overall M&A transaction volume with respect to our M&A Advisory and Transaction Opinions business units and from continued economic volatility with respect to Global Restructuring Advisory.
Segment Operating Income
Operating income from the Investment Banking segment increased $6,828 or 44.8% to $22,061 for the year ended December 31, 2010, compared to $15,233 for the year ended December 31, 2009. Operating income margin was 24.4% for the year ended December 31, 2010, compared to 20.5% for the year ended December 31, 2009. The increase in segment operating income resulted from higher revenues from an increase in transaction activity, partially offset by an increase in direct costs.
48
Year Ended December 31, 2009 versus Year Ended December 31, 2008
The results of operations are summarized as follows:
Results of Operations
|
Year Ended
|
Year Ended
|
|||||||||||||||
|
December 31,
|
December 31,
|
Unit
|
Percent
|
|||||||||||||
|
2009
|
2008
|
Change
|
Change
|
|||||||||||||
|
Revenues
|
$ | 370,903 | $ | 381,476 | $ | (10,573 | ) | (2.8 | )% | |||||||
|
Reimbursable expenses
|
11,083 | 10,546 | 537 | 5.1 | % | |||||||||||
|
Total revenues
|
381,986 | 392,022 | (10,036 | ) | (2.6 | )% | ||||||||||
|
Direct client service costs
|
||||||||||||||||
|
Compensation and benefits(1)
|
210,302 | 216,137 | (5,835 | ) | (2.7 | )% | ||||||||||
|
Other direct client service costs
|
7,232 | 8,224 | (992 | ) | (12.1 | )% | ||||||||||
|
Acquisition retention expenses(2)
|
- | 793 | (793 | ) | (100.0 | )% | ||||||||||
|
Reimbursable expenses
|
11,158 | 10,623 | 535 | 5.0 | % | |||||||||||
| 228,692 | 235,777 | (7,085 | ) | (3.0 | )% | |||||||||||
|
Operating expenses
|
||||||||||||||||
|
Selling, general and administrative(3)
|
99,162 | 108,312 | (9,150 | ) | (8.4 | )% | ||||||||||
|
Depreciation and amortization
|
10,244 | 9,816 | 428 | 4.4 | % | |||||||||||
| 109,406 | 118,128 | (8,722 | ) | (7.4 | )% | |||||||||||
|
Operating income
|
43,888 | 38,117 | 5,771 | 15.1 | % | |||||||||||
|
Other expense/(income)
|
||||||||||||||||
|
Interest income
|
(53 | ) | (668 | ) | 615 | (92.1 | )% | |||||||||
|
Interest expense
|
1,131 | 3,475 | (2,344 | ) | (67.5 | )% | ||||||||||
|
Loss on early extinguishment of debt
|
1,737 | - | 1,737 | N/A | ||||||||||||
|
Other expense
|
141 | 398 | (257 | ) | (64.6 | )% | ||||||||||
| 2,956 | 3,205 | (249 | ) | (7.8 | )% | |||||||||||
|
Income before income taxes
|
40,932 | 34,912 | 6,020 | 17.2 | % | |||||||||||
|
Provision for income taxes
|
12,264 | 10,619 | 1,645 | 15.5 | % | |||||||||||
|
Net income
|
28,668 | 24,293 | 4,375 | 18.0 | % | |||||||||||
|
Less: Net income attributable to noncontrolling interest
|
17,100 | 19,068 | (1,968 | ) | (10.3 | )% | ||||||||||
|
Net income attributable to Duff & Phelps Corporation
|
$ | 11,568 | $ | 5,225 | $ | 6,343 | 121.4 | % | ||||||||
|
Other financial and operating data
|
||||||||||||||||
|
Adjusted EBITDA(4)
|
$ | 66,569 | $ | 73,632 | $ | (7,063 | ) | (9.6 | )% | |||||||
|
Adjusted EBITDA(4) as a percentage of revenues
|
17.9 | % | 19.3 | % | (1.4 | )% | (7.0 | )% | ||||||||
|
Adjusted Pro Forma Net Income(4)
|
$ | 32,711 | $ | 36,003 | $ | (3,292 | ) | (9.1 | )% | |||||||
|
Adjusted Pro Forma Net Income, per fully exchanged, fully diluted share outstanding(4)
|
$ | 0.88 | $ | 1.05 | $ | (0.17 | ) | (16.2 | )% | |||||||
|
End of period managing directors
|
163 | 168 | (5 | ) | (3.0 | )% | ||||||||||
|
End of period client service professionals
|
878 | 975 | (97 | ) | (9.9 | )% | ||||||||||
|
(1)
|
Compensation and benefits include $16,432 and $20,537 of equity-based compensation expense for the year ended December 31, 2009 and 2008, respectively.
|
49
|
(2)
|
In 2008 and prior years, we incurred compensation expense in connection with deferred retention payments that we agreed to make to certain former employees of CVC in connection with the CVC acquisition in September 2005.
|
|
(3)
|
Selling, general and administrative expenses include $7,223 and $10,803 of equity-based compensation expense for the year ended December 31, 2009 and 2008, respectively.
|
|
(4)
|
Adjusted EBITDA, Adjusted Pro Forma Net Income, and Adjusted Pro Forma Net Income per share are non-GAAP financial measures. We believe that Adjusted EBITDA provides a relevant and useful alternative measure of our ongoing profitability and performance, when viewed in conjunction with GAAP measures, as it adjusts net income or loss attributable to Duff & Phelps Corporation for (a) net income or loss attributable to noncontrolling interest, (b) provision for income taxes, (c) interest expense and depreciation and amortization (a significant portion of which relates to debt and capital investments that have been incurred as the result of acquisitions and investments in stand-alone infrastructure which we do not expect to incur at the same levels in the future), (d) equity-based
compensation associated with the Legacy Units of D&P Acquisitions, a significant portion of which is due to certain onetime grants associated with acquisitions prior to our IPO, and options to purchase shares of the Company’s Class A common stock granted in connection with the IPO, (e) impairment charges, acquisition retention expenses and other merger and acquisition costs, which are generally non-recurring in nature or are related to deferred payments associated with prior acquisitions, and (f) costs incurred from the realignment of our senior management which are generally non-recurring in nature and primarily include cash severance and charges from the accounting impact of the acceleration of vesting of restricted stock awards.
|
Given the level of acquisition activity during the period prior to our IPO, and related capital investments and one time equity grants associated with acquisitions during the this period (which we do not expect to incur at the same levels post IPO) and the IPO, and our belief that, as a professional services organization, our operations are not capital intensive on an ongoing basis, we believe the Adjusted EBITDA measure, in addition to GAAP financial measures, provides a relevant and useful benchmark for investors, in order to assess our financial performance and comparability to other companies in our industry. The Adjusted EBITDA measure is utilized by our senior management to evaluate our overall
performance and operating expense characteristics and to compare our performance to that of certain of our competitors. A measure similar to Adjusted EBITDA is the principal measure that has determined the compensation of our senior management team. In addition, a measure similar to Adjusted EBITDA is a key measure that determines compliance with certain financial covenants under our credit facility. Management compensates for the inherent limitations associated with using the Adjusted EBITDA measure through disclosure of such limitations, presentation of our financial statements in accordance with GAAP and reconciliation of Adjusted EBITDA to the most directly comparable GAAP measure, net income or loss. Furthermore, management also reviews GAAP measures, and evaluates individual measures that are not included in Adjusted EBITDA such as our
level of capital expenditures, equity issuance and interest expense, among other measures.
Adjusted EBITDA, as defined by the Company and reconciled below, consists of net income or loss attributable to Duff & Phelps Corporation before (a) net income or loss attributable to the noncontrolling interest, (b) provision for income taxes, (c) other expense/(income), net, (d) depreciation and amortization, (e) charges from impairment of intangible assets, (f) equity-based compensation associated with Legacy Units and IPO Options included in both compensation and benefits and in selling, general and administrative expenses, (g) cash severance and equity-compensation expense from the acceleration of vesting of restricted stock awards due to the realignment of our senior management, (h) acquisition retention
expenses and (i) merger and acquisition costs:
|
Reconciliation of Adjusted EBITDA
|
||||||||
|
Year Ended
|
Year Ended
|
|||||||
|
December 31,
|
December 31,
|
|||||||
|
2009
|
2008
|
|||||||
|
Net income attributable to Duff & Phelps Corporation
|
$ | 11,568 | $ | 5,225 | ||||
|
Net income attributable to noncontrolling interest
|
17,100 | 19,068 | ||||||
|
Provision for income taxes
|
12,264 | 10,619 | ||||||
|
Other expense/(income), net
|
2,956 | 3,205 | ||||||
|
Depreciation and amortization
|
10,244 | 9,816 | ||||||
|
Acquisition retention expenses
|
- | 793 | ||||||
|
Equity-based compensation associated with Legacy Units and IPO Options
|
12,437 | 24,906 | ||||||
|
Adjusted EBITDA
|
$ | 66,569 | $ | 73,632 | ||||
50
Adjusted Pro Forma Net Income, as defined by Duff & Phelps and reconciled below, consists of net income or loss attributable to Duff & Phelps Corporation before (a) net income or loss attributable to the noncontrolling interest, (b) a non-recurring charge from the repayment and subsequent termination of our former credit agreement, (c) equity-based compensation associated with Legacy Units and IPO Options included in both compensation and benefits and in selling, general and administrative expenses, (d) acquisition retention expenses, (e) cash severance and equity-compensation expense from the acceleration of vesting of restricted stock awards due to the realignment of our senior management, (f) merger and
acquisition costs, and less (g) pro forma corporate income tax applied at an assumed rate as specified in the applicable footnote (such assumed pro forma corporate income tax rate may fluctuate between periods and may include true-ups relating to prior periods, based on management estimates and judgments). Adjusted Pro Forma Net Income per share, as defined by Duff & Phelps, consists of Adjusted Pro Forma Net Income divided by the weighted average number of the Company's Class A and Class B shares for the applicable period, giving effect to the dilutive impact, if any, of stock options and restricted stock awards and units issued in connection with the Company’s ongoing long-term compensation program (“Ongoing RSAs”).
|
Reconciliation of Adjusted Pro Forma Net Income
|
||||||||
|
Year Ended
|
Year Ended
|
|||||||
|
December 31,
|
December 31,
|
|||||||
|
2009
|
2008
|
|||||||
|
Net income attributable to Duff & Phelps Corporation
|
$ | 11,568 | $ | 5,225 | ||||
|
Net income attributable to noncontrolling interest(a)
|
17,100 | 19,068 | ||||||
|
Loss on early extinguishment of debt(b)
|
1,737 | - | ||||||
|
Equity-based compensation associated with Legacy Units and IPO Options(c)
|
12,437 | 24,906 | ||||||
|
Acquisition retention expenses(d)
|
- | 793 | ||||||
|
Adjustment to provision for income taxes(e)
|
(10,131 | ) | (13,989 | ) | ||||
|
Adjusted Pro Forma Net Income, as defined
|
$ | 32,711 | $ | 36,003 | ||||
|
Pro forma fully exchanged, fully diluted shares outstanding(f)
|
37,338 | 34,346 | ||||||
|
Adjusted Pro Forma Net Income per fully exchanged, fully diluted share outstanding
|
$ | 0.88 | $ | 1.05 | ||||
|
|
(a)
|
Represents elimination of the noncontrolling interest associated with the ownership by existing unitholders of D&P Acquisitions (excluding D&P Corporation), as if such unitholders had fully exchanged their partnership units and Class B common stock of the Company for shares of Class A common stock of the Company.
|
|
|
(b)
|
Represents a non-recurring charge from the repayment and subsequent termination of our credit agreement.
|
|
|
(c)
|
Represents elimination of equity-based compensation associated with Legacy Units and IPO Options.
|
|
|
(d)
|
Represents elimination of acquisition retention expenses. In 2008 and prior years, we incurred compensation expense in connection with deferred retention payments that we agreed to make to certain former employees of CVC in connection with the CVC acquisition in September 2005.
|
|
|
(e)
|
Represents an adjustment to reflect an assumed effective corporate tax rate of approximately 40.6% for the years ended December 31, 2009 and 2008 which includes a provision for U.S. federal income taxes and assumes the highest statutory rates apportioned to each state, local and/or foreign jurisdiction. Assumes (i) full exchange of existing unitholders' partnership units and Class B common stock of the Company into Class A common stock of the Company and (ii) the Company has adopted a conventional corporate tax structure and is taxed as a C Corporation in the U.S. at prevailing corporate rates.
|
|
|
(f)
|
Based on the weighted-average number of aggregated Class A and Class B shares of common stock outstanding, excluding Ongoing RSAs, and dilutive effect of Ongoing RSAs. The Company believes that IPO Options would not be considered dilutive when applying the treasury method.
|
Both Adjusted EBITDA and Adjusted Pro Forma Net Income are non-GAAP financial measures which are not prepared in accordance with, and should not be considered alternatives to, measurements required by GAAP, such as operating income, net income or loss, net income or loss per share, cash flow from continuing operating activities or any other measure of performance or liquidity derived in accordance with GAAP. The presentation of this additional information is not meant to be considered in isolation or as a substitute for the most directly comparable GAAP measures. In addition, it should be noted that companies calculate Adjusted EBITDA and Adjusted Pro Forma Net Income differently and, therefore,
Adjusted EBITDA and Adjusted Pro Forma Net Income as presented for us may not be comparable to Adjusted EBITDA and Adjusted Pro Forma Net Income reported by other companies.
51
Revenues
Revenues excluding reimbursable expenses decreased $10,573 or 2.8% to $370,903, compared to $381,476 for the year ended December 31, 2008. The decrease in revenues primarily resulted from a 7.7% decrease in revenues from our Financial Advisory segment. These decreases were partially offset by an 11.4% increase in revenues from our Corporate Finance Consulting segment and a 3.5% increase in revenues from our Investment Banking segment, as summarized in the following table:
|
Year Ended
|
Year Ended
|
|||||||||||||||
|
December 31,
|
December 31,
|
Dollar
|
Percent
|
|||||||||||||
|
2009
|
2008
|
Change
|
Change
|
|||||||||||||
|
Financial Advisory
|
||||||||||||||||
|
Valuation Advisory(1)
|
$ | 138,510 | $ | 178,799 | $ | (40,289 | ) | (22.5 | )% | |||||||
|
Tax Services(2)
|
47,902 | 44,965 | 2,937 | 6.5 | % | |||||||||||
|
Dispute & Legal Management Consulting(3)
|
47,220 | 29,405 | 17,815 | 60.6 | % | |||||||||||
| 233,632 | 253,169 | (19,537 | ) | (7.7 | )% | |||||||||||
|
Corporate Finance Consulting
|
||||||||||||||||
|
Portfolio Valuation
|
22,153 | 15,224 | 6,929 | 45.5 | % | |||||||||||
|
Financial Engineering
|
19,171 | 14,495 | 4,676 | 32.3 | % | |||||||||||
|
Strategic Value Advisory
|
13,450 | 12,009 | 1,441 | 12.0 | % | |||||||||||
|
Due Diligence
|
8,182 | 14,766 | (6,584 | ) | (44.6 | )% | ||||||||||
| 62,956 | 56,494 | 6,462 | 11.4 | % | ||||||||||||
|
Investment Banking
|
||||||||||||||||
|
M&A Advisory
|
15,845 | 17,975 | (2,130 | ) | (11.8 | )% | ||||||||||
|
Transaction Opinions
|
21,076 | 36,185 | (15,109 | ) | (41.8 | )% | ||||||||||
|
Global Restructuring Advisory
|
37,394 | 17,653 | 19,741 | 111.8 | % | |||||||||||
| 74,315 | 71,813 | 2,502 | 3.5 | % | ||||||||||||
|
Total Revenues (excluding reimbursables)
|
$ | 370,903 | $ | 381,476 | $ | (10,573 | ) | (2.8 | )% | |||||||
|
|
(1)
|
Valuation Advisory includes the results of the Kane Reece acquisition effective July 31, 2008.
|
|
|
(2)
|
Tax Services include the results of Rash effective October 31, 2007 and World Tax Service US effective July 15, 2008.
|
|
|
(3)
|
Dispute & Legal Management Consulting includes the acquisitions of Dubinsky effective April 11, 2008 and Lumin effective August 8, 2008.
|
Services within each of our segments were impacted by the general economic environment which led to a substantially lower volume of M&A and real estate transactions and a corresponding decline in revenues from services associated with our Valuation Advisory, Transaction Opinions, Due Diligence and to a lesser extent our M&A Advisory business units. These decreases were partially offset primarily by increases in revenues from counter-cyclical and non-cyclical services provided by Global Restructuring Advisory, Dispute & Legal Management Consulting, Portfolio Valuation and Financial Engineering.
Our client service headcount decreased to 878 client service professionals at December 31, 2009, compared to 975 client service professionals at December 31, 2008. This decrease resulted from targeted reductions and attrition across all segments, partially offset by limited hiring of professionals in areas which we have targeted for investment, such as strengthening our global investment banking segment by hiring a new M&A leader and additional Investment Banking managing directors.
52
Direct Client Service Costs
Direct client service costs decreased $7,085 or 3.0% to $228,692 for the year ended December 31, 2009, compared to $235,777 for the year ended December 31, 2008. Direct client service costs include compensation and benefits and other direct client service costs. Other direct client service costs include fees payable to contractors and other expenses related to engagements. The following table adjusts direct client service costs for equity-based compensation associated with Legacy Units and IPO Options, acquisition retention expenses and reimbursable expenses.
|
Direct Client Service Costs
|
||||||||
|
Year Ended
|
Year Ended
|
|||||||
|
December 31,
|
December 31,
|
|||||||
|
2009
|
2008
|
|||||||
|
Revenues (excluding reimbursables)
|
$ | 370,903 | $ | 381,476 | ||||
|
Total direct client service costs
|
$ | 228,692 | $ | 235,777 | ||||
|
Less: equity-based compensation associated
|
||||||||
|
with Legacy Units and IPO Options
|
(8,736 | ) | (17,442 | ) | ||||
|
Less: acquisition retention expenses
|
- | (793 | ) | |||||
|
Less: reimbursable expenses
|
(11,158 | ) | (10,623 | ) | ||||
|
Direct client service costs, as adjusted
|
$ | 208,798 | $ | 206,919 | ||||
|
Direct client service costs, as adjusted, as a percentage of revenues
|
56.3 | % | 54.2 | % | ||||
Direct client service costs, as adjusted, increased between periods primarily as a result of an increase in expense from incremental grants of Ongoing RSAs and higher salary costs. These increases were partially offset by lower accrued and other compensation primarily as a result of the decline in revenues between periods and a reduction of recruiting activity in the year ended December 31, 2009. Salary costs were higher as a result of an increase in average client service managing directors between periods and annual salary increases to existing client service employees.
Equity-based compensation decreased between periods primarily as a result of the accelerated attribution of expense on awards with graded-tranche vesting in prior periods for Legacy Units and IPO Options, partially offset by changes in estimates of forfeiture rates and an increase in expense from grants of Ongoing RSAs. Expenses related to retention payments associated with the acquisition of the CVC business in 2005 decreased as a result of the completion of the payments in 2008.
53
Operating Expenses
Operating expenses decreased $8,722 or 7.4% to $109,406 for the year ended December 31, 2009, compared to $118,128 for the year ended December 31, 2008. The following table adjusts operating expenses for depreciation and amortization and equity-based compensation associated with Legacy Units and IPO Options. Operating expenses, as adjusted, as a percentage of revenues decreased between periods as the result of a concerted effort to reduce expenses due to the decline in revenues between periods.
|
Operating Expenses
|
||||||||
|
Year Ended
|
Year Ended
|
|||||||
|
December 31,
|
December 31,
|
|||||||
|
2009
|
2008
|
|||||||
|
Revenues (excluding reimbursables)
|
$ | 370,903 | $ | 381,476 | ||||
|
Total operating expenses
|
$ | 109,406 | $ | 118,128 | ||||
|
Less: equity-based compensation associated with Legacy Units and IPO Options
|
(3,701 | ) | (7,464 | ) | ||||
|
Less: depreciation and amortization
|
(10,244 | ) | (9,816 | ) | ||||
|
Operating expenses, as adjusted
|
$ | 95,461 | $ | 100,848 | ||||
|
Operating expenses, as adjusted, as a percentage of revenues
|
25.7 | % | 26.4 | % | ||||
The decrease in operating expenses, as adjusted, resulted from lower professional and practice development expenses, lower recruiting costs from a decline in hiring activity and lower accrued compensation primarily as a result of the decline in revenues between periods, partially offset by higher professional fees, administrative salaries and other general expenses.
Equity-based compensation decreased between periods primarily as a result of the accelerated attribution of expense on awards with graded-tranche vesting in prior periods for Legacy Units and IPO Options, partially offset by changes in estimates of forfeiture rates and an increase in expense from incremental grants of Ongoing RSAs.
Other Income and Expense
Other income and expense include interest income, interest expense and other expense. Interest expense decreased primarily as a result of repayment and termination of our former credit facility with General Electric Capital Corporation (“GE Capital”). The termination of our former credit facility resulted in a $1,737 early extinguishment charge of which $1,674 was non-cash in the year ended December 31, 2009.
Provision for Income Taxes
The provision for income taxes was $12,264 or 30.0% of income before income taxes for the year ended December 31, 2009, compared to $10,619 or 30.4% of income before income taxes for the year ended December 31, 2008. The U.S. statutory income tax rate of 35% was decreased to the effective tax rate due to the fact that D&P Acquisitions, LLC and many of its subsidiaries operate as limited liability companies or other flow-through entities which are not subject to federal income tax. This operating structure results in a rate benefit because a portion of the Company’s earnings are not subject to corporate level taxes. This favorable impact is partially offset by an increase due to state
and local taxes, the effect of permanent differences and foreign taxes.
Net Income Attributable to the Noncontrolling Interest
Net income attributable to the noncontrolling interest represents the portion of net income or loss before income taxes attributable to the ownership interest in D&P Acquisitions held by the existing unitholders to the extent the book value of their interest in D&P Acquisitions is greater than zero. This interest totaled 43.8% and 58.4% for the years ended December 31, 2009 and 2008, respectively.
54
Segment Results – Year Ended December 31, 2009 versus Year Ended December 31, 2008
The following table sets forth selected segment operating results:
|
Results of Operations by Segment
|
||||||||||||||||
|
Year Ended
|
Year Ended
|
|||||||||||||||
|
December 31,
|
December 31,
|
Unit
|
Percent
|
|||||||||||||
|
2009
|
2008
|
Change
|
Change
|
|||||||||||||
|
Financial Advisory
|
||||||||||||||||
|
Revenues (excluding reimbursables)
|
$ | 233,632 | $ | 253,169 | $ | (19,537 | ) | (7.7 | )% | |||||||
|
Segment operating income
|
$ | 37,557 | $ | 42,816 | $ | (5,259 | ) | (12.3 | )% | |||||||
|
Segment operating income margin
|
16.1 | % | 16.9 | % | (0.8 | )% | (4.9 | )% | ||||||||
|
Corporate Finance Consulting
|
||||||||||||||||
|
Revenues (excluding reimbursables)
|
$ | 62,956 | $ | 56,494 | $ | 6,462 | 11.4 | % | ||||||||
|
Segment operating income
|
$ | 13,854 | $ | 13,220 | $ | 634 | 4.8 | % | ||||||||
|
Segment operating income margin
|
22.0 | % | 23.4 | % | (1.4 | )% | (6.0 | )% | ||||||||
|
Investment Banking
|
||||||||||||||||
|
Revenues (excluding reimbursables)
|
$ | 74,315 | $ | 71,813 | $ | 2,502 | 3.5 | % | ||||||||
|
Segment operating income
|
$ | 15,233 | $ | 17,673 | $ | (2,440 | ) | (13.8 | )% | |||||||
|
Segment operating income margin
|
20.5 | % | 24.6 | % | (4.1 | )% | (16.7 | )% | ||||||||
|
Total
|
||||||||||||||||
|
Revenues (excluding reimbursables)
|
$ | 370,903 | $ | 381,476 | ||||||||||||
|
Segment operating income
|
$ | 66,644 | $ | 73,709 | ||||||||||||
|
Net client reimbursable expenses
|
(75 | ) | (77 | ) | ||||||||||||
|
Equity-based compensation from
|
||||||||||||||||
|
Legacy Units and IPO Options
|
(12,437 | ) | (24,906 | ) | ||||||||||||
|
Depreciation and amortization
|
(10,244 | ) | (9,816 | ) | ||||||||||||
|
Acquisition retention expenses
|
- | (793 | ) | |||||||||||||
|
Operating income
|
$ | 43,888 | $ | 38,117 | ||||||||||||
|
|
||||||||||||||||
|
Average Client Service Professionals
|
||||||||||||||||
|
Financial Advisory
|
657 | 688 | (31 | ) | (4.5 | )% | ||||||||||
|
Corporate Finance Consulting
|
132 | 127 | 5 | 3.9 | % | |||||||||||
|
Investment Banking
|
133 | 119 | 14 | 11.8 | % | |||||||||||
|
Total
|
922 | 934 | (12 | ) | (1.3 | )% | ||||||||||
|
End of Period Client Service Professionals
|
||||||||||||||||
|
Financial Advisory
|
618 | 710 | (92 | ) | (13.0 | )% | ||||||||||
|
Corporate Finance Consulting
|
129 | 131 | (2 | ) | (1.5 | )% | ||||||||||
|
Investment Banking
|
131 | 134 | (3 | ) | (2.2 | )% | ||||||||||
|
Total
|
878 | 975 | (97 | ) | (9.9 | )% | ||||||||||
|
Revenue per Client Service Professional
|
||||||||||||||||
|
Financial Advisory
|
$ | 356 | $ | 368 | $ | (12 | ) | (3.3 | )% | |||||||
|
Corporate Finance Consulting
|
$ | 477 | $ | 445 | $ | 32 | 7.2 | % | ||||||||
|
Investment Banking
|
$ | 559 | $ | 603 | $ | (44 | ) | (7.3 | )% | |||||||
|
Total
|
$ | 402 | $ | 408 | $ | (6 | ) | (1.5 | )% | |||||||
55
|
Results of Operations by Segment – Continued
|
||||||||||||||||
|
Year Ended
|
Year Ended
|
|||||||||||||||
|
December 31,
|
December 31,
|
Unit
|
Percent
|
|||||||||||||
|
2009
|
2008
|
Change
|
Change
|
|||||||||||||
|
Utilization(1)
|
||||||||||||||||
|
Financial Advisory
|
65.7 | % | 64.2 | % | 1.5 | % | 2.3 | % | ||||||||
|
Corporate Finance Consulting
|
64.0 | % | 57.8 | % | 6.2 | % | 10.7 | % | ||||||||
|
Rate-Per-Hour(2)
|
||||||||||||||||
|
Financial Advisory
|
$ | 321 | $ | 333 | $ | (12 | ) | (3.6 | )% | |||||||
|
Corporate Finance Consulting
|
$ | 401 | $ | 397 | $ | 4 | 1.0 | % | ||||||||
|
|
||||||||||||||||
|
Revenues (excluding reimbursables)
|
||||||||||||||||
|
Financial Advisory
|
$ | 233,632 | $ | 253,169 | $ | (19,537 | ) | (7.7 | )% | |||||||
|
Corporate Finance Consulting
|
62,956 | 56,494 | 6,462 | 11.4 | % | |||||||||||
|
Investment Banking
|
74,315 | 71,813 | 2,502 | 3.5 | % | |||||||||||
|
Total
|
$ | 370,903 | $ | 381,476 | $ | (10,573 | ) | (2.8 | )% | |||||||
|
Average Number of Managing Directors
|
||||||||||||||||
|
Financial Advisory
|
97 | 96 | 1 | 1.0 | % | |||||||||||
|
Corporate Finance Consulting
|
30 | 25 | 5 | 20.0 | % | |||||||||||
|
Investment Banking
|
39 | 32 | 7 | 21.9 | % | |||||||||||
|
Total
|
166 | 153 | 13 | 8.5 | % | |||||||||||
|
End of Period Managing Directors
|
||||||||||||||||
|
Financial Advisory
|
93 | 105 | (12 | ) | (11.4 | )% | ||||||||||
|
Corporate Finance Consulting
|
30 | 28 | 2 | 7.1 | % | |||||||||||
|
Investment Banking
|
40 | 35 | 5 | 14.3 | % | |||||||||||
|
Total
|
163 | 168 | (5 | ) | (3.0 | )% | ||||||||||
|
Revenue per Managing Director
|
||||||||||||||||
|
Financial Advisory
|
$ | 2,409 | $ | 2,637 | $ | (228 | ) | (8.6 | )% | |||||||
|
Corporate Finance Consulting
|
$ | 2,099 | $ | 2,260 | $ | (161 | ) | (7.1 | )% | |||||||
|
Investment Banking
|
$ | 1,906 | $ | 2,244 | $ | (338 | ) | (15.1 | )% | |||||||
|
Total
|
$ | 2,234 | $ | 2,493 | $ | (259 | ) | (10.4 | )% | |||||||
|
|
(1)
|
The utilization rate for any given period is calculated by dividing the number of hours incurred by client service professionals who worked on client assignments (including internal projects for the Company) during the period by the total available working hours for all of such client service professionals during the same period, assuming a 40 hour work week, less paid holidays and vacation days. Utilization excludes client service professionals associated with certain property tax services due to the nature of the work performed and client service professionals from certain acquisitions prior to their transition to the Company’s financial system.
|
|
|
(2)
|
Average billing rate-per-hour is calculated by dividing revenues for the period by the number of hours worked on client assignments (including internal projects for the Company) during the same period. Financial Advisory revenues used to calculate rate-per-hour exclude revenues associated with certain property tax engagements. The average billing rate excludes certain hours from our acquisitions prior to their transition to the Company’s financial system.
|
56
Revenues and expenses attributable to reportable segments are generally based on which segment and product line a client service professional is a dedicated member. As a result, revenues recognized that relate to the cross utilization of client service professionals across reportable segments occur each period. In the years ended December 31, 2009 and 2008, the Financial Advisory segment (primarily Valuation Advisory services) recognized revenues of $11,533 and $16,553 from the cross utilization of its client service professionals on engagements from the Corporate Finance Consulting segment (primarily Portfolio Valuation services), respectively.
Financial Advisory
Revenues
Revenues from the Financial Advisory segment decreased $19,537 or 7.7% to $233,632 for the year ended December 31, 2009, compared to $253,169 for the year ended December 31, 2008. The decline in revenues resulted from a decrease in services provided by our Valuation Advisory business, partially offset by continued growth in revenues from our Dispute & Legal Management Consulting and Tax Services businesses, as summarized in the following table:
|
|
Year Ended
|
Year Ended
|
||||||||||||||
|
|
December 31,
|
December 31,
|
Dollar
|
Percent
|
||||||||||||
|
|
2009
|
2008
|
Change
|
Change
|
||||||||||||
|
Financial Advisory
|
||||||||||||||||
|
Valuation Advisory(1)
|
$ | 138,510 | $ | 178,799 | $ | (40,289 | ) | (22.5 | )% | |||||||
|
Tax Services(2)
|
47,902 | 44,965 | 2,937 | 6.5 | % | |||||||||||
|
Dispute & Legal Management Consulting(3)
|
47,220 | 29,405 | 17,815 | 60.6 | % | |||||||||||
|
|
$ | 233,632 | $ | 253,169 | $ | (19,537 | ) | (7.7 | )% | |||||||
|
|
(1)
|
Valuation Advisory includes the results of the Kane Reece acquisition effective July 31, 2008.
|
|
|
(2)
|
Tax Services include the results of Rash effective October 31, 2007 and World Tax Service US effective July 15, 2008.
|
|
|
(3)
|
Dispute & Legal Management Consulting includes the acquisitions of Dubinsky effective April 11, 2008 and Lumin effective August 8, 2008.
|
The decrease in revenues from our Valuation Advisory business primarily resulted from reduced demand for services correlated to the volume of M&A transactions, including real estate valuations and purchase price allocations. These decreases were partially offset by increases in revenues from goodwill impairment testing. The increase in revenues from our Dispute & Legal Management Consulting business primarily resulted from an engagement to serve as a financial advisor to the court appointed examiner of a large financial services company under bankruptcy protection and incremental revenues from our acquisitions of Lumin and Dubinsky. The engagement for the court appointed
examiner to wound down during the first half of 2010. The increase in revenues from tax services primarily resulted from continued growth in property tax services.
Segment Operating Income
Financial Advisory segment operating income decreased $5,259 or 12.3% to $37,557 for the year ended December 31, 2009, compared to $42,816 for the year ended December 31, 2008. Segment operating income margin, defined as segment operating income expressed as a percentage of segment revenues, was 16.1% for the year ended December 31, 2009, compared to 16.9% for the year ended December 31, 2008.
57
Corporate Finance Consulting
Revenues
Revenues from the Corporate Finance Consulting segment increased $6,462 or 11.4% to $62,956 for the year ended December 31, 2009, compared to $56,494 for the year ended December 31, 2008. Growth was primarily driven by demand for services related to Portfolio Valuation, Financial Engineering and Strategic Value Advisory, partially offset by a decrease in revenues from Due Diligence, as summarized in the following table:
|
Year Ended
|
Year Ended
|
|||||||||||||||
|
December 31,
|
December 31,
|
Dollar
|
Percent
|
|||||||||||||
|
2009
|
2008
|
Change
|
Change
|
|||||||||||||
|
Corporate Finance Consulting
|
||||||||||||||||
|
Portfolio Valuation
|
$ | 22,153 | $ | 15,224 | $ | 6,929 | 45.5 | % | ||||||||
|
Financial Engineering
|
19,171 | 14,495 | 4,676 | 32.3 | % | |||||||||||
|
Strategic Value Advisory
|
13,450 | 12,009 | 1,441 | 12.0 | % | |||||||||||
|
Due Diligence
|
8,182 | 14,766 | (6,584 | ) | (44.6 | )% | ||||||||||
| $ | 62,956 | $ | 56,494 | $ | 6,462 | 11.4 | % | |||||||||
Portfolio Valuation, Financial Engineering and Strategic Value Advisory benefited from increased demand from existing clients as well as the addition of new clients. Financial Engineering also benefited from engagements sourced from Portfolio Valuation as well as the Financial Advisory segment, including the engagement to serve as a financial advisor to the court appointed examiner of a large financial services company under bankruptcy protection. The decrease in revenues from Due Diligence resulted from a lower volume of M&A transactions.
Segment Operating Income
Operating income from the Corporate Finance Consulting segment increased $634 or 4.8% to $13,854 for the year ended December 31, 2009, compared to $13,220 for the year ended December 31, 2008. Segment operating income margin was 22.0% for the year ended December 31, 2009, compared to 23.4% for the year ended December 31, 2008. Improvements in segment operating income primarily resulted from the increase in revenues.
Investment Banking
Revenues
Revenues from the Investment Banking segment increased $2,502 or 3.5% to $74,315 for the year ended December 31, 2009, compared to $71,813 for the year ended December 31, 2008, as summarized in the following table:
|
Year Ended
|
Year Ended
|
|||||||||||||||
|
December 31,
|
December 31,
|
Dollar
|
Percent
|
|||||||||||||
|
2009
|
2008
|
Change
|
Change
|
|||||||||||||
|
Investment Banking
|
||||||||||||||||
|
M&A Advisory
|
$ | 15,845 | $ | 17,975 | $ | (2,130 | ) | (11.8 | )% | |||||||
|
Transaction Opinions
|
21,076 | 36,185 | (15,109 | ) | (41.8 | )% | ||||||||||
|
Global Restructuring Advisory
|
37,394 | 17,653 | 19,741 | 111.8 | % | |||||||||||
| $ | 74,315 | $ | 71,813 | $ | 2,502 | 3.5 | % | |||||||||
Global Restructuring Advisory benefited from an increase in demand for our domestic and international restructuring services. Revenues from transaction opinions and to a lesser extent M&A Advisory decreased as a result of the current economic landscape and a lower volume of M&A transactions. In particular, our Transaction Opinions business experienced a lower volume and value of engagements in the year ended December 31, 2009.
Segment Operating Income
Operating income from the Investment Banking segment decreased $2,440 or 13.8% to $15,233 for the year ended December 31, 2009, compared to $17,673 for the year ended December 31, 2008. Operating income margin was 20.5% for the year ended December 31, 2009, compared to 24.6% for the year ended December 31, 2008.
58
Liquidity and Capital Resources
Our primary sources of liquidity are our existing cash balances and availability under our revolving credit facility. Our historical cash flows are primarily related to the timing of (i) cash receipt of revenues, (ii) payment of base compensation, benefits and operating expenses, (iii) payment of bonuses to employees, (iv) distributions and other payments to noncontrolling unitholders, (v) corporate tax payments by the Company, (vi) dividends to the extent declared by the board of directors, (vii) funding of our deferred compensation program, (viii) repurchases of Class A common stock, and (ix) cash consideration for acquisitions and acquisition-related expenses.
Cash and cash equivalents increased by $6,017 to $113,328 at December 31, 2010, compared to $107,311 at December 31, 2009. The increase in cash primarily resulted from $59,774 provided by operating activities, partially offset by $28,472 used in investing activities and $25,207 used in financing activities.
Operating Activities
During the year ended December 31, 2010, cash of $59,774 was provided by operating activities, compared to $66,986 provided in the corresponding prior year. The decrease of amounts provided by operating activities primarily resulted from changes in assets and liabilities either providing or using cash, partially from (i) lower cash bonus payments made in 2010 with respect to the 2009 bonus year, as compared to cash bonus payments made in 2009 with respect to the 2008 bonus year, and (ii) higher bonus accruals in the current year, as compared to the prior year.
Investing Activities
During the year ended December 31, 2010, cash of $28,472 was used in investing activities, compared to $17,466 used in the corresponding prior year. Investing activities during the current period included (i) purchases of property and equipment to support our business, (ii) cash consideration for acquisitions in the current year, and (iii) purchases of investments related to the Company’s deferred compensation plan.
Financing Activities
During the year ended December 31, 2010, cash of $25,207 was used in financing activities, compared to $24,452 used in the prior year period. Significant financing activities are summarized as follows:
|
|
·
|
Distributions and other payments to noncontrolling unitholders – Distributions and other payments to noncontrolling unitholders are summarized as follows:
|
|
Year Ended
|
||||||||||||
|
December 31,
|
December 31,
|
December 31,
|
||||||||||
|
2010
|
2009
|
2008
|
||||||||||
|
Financing activities
|
||||||||||||
|
Distributions for taxes
|
$ | 7,081 | $ | 20,097 | $ | 9,753 | ||||||
|
Other distributions
|
2,752 | 1,879 | - | |||||||||
| $ | 9,833 | $ | 21,976 | $ | 9,753 | |||||||
|
Operating activities
|
||||||||||||
|
Payments pursuant to the Tax Receivable Agreement
|
$ | 4,267 | $ | 3,090 | $ | 791 | ||||||
Distributions for taxes
As a limited liability company, D&P Acquisitions does not incur significant federal or state and local taxes, as these taxes are primarily the obligations of the members of D&P Acquisitions. As authorized by the Third Amended and Restated LLC Agreement of D&P Acquisitions, D&P Acquisitions is required to distribute cash, generally, on a pro rata basis, to its members to the extent necessary to provide funds to pay the members' tax liabilities, if any, with respect to the earnings of D&P Acquisitions. The tax distribution rate has been set at 45% of each member’s allocable share of taxable income of D&P Acquisitions. D&P Acquisitions is only required
to make such distributions if cash is available for such purposes as determined by the Company. The Company expects cash will be available to make these distributions. Upon completion of its tax returns with respect to the prior year, D&P Acquisitions may make true-up distributions to its members, if cash is available for such purposes, with respect to actual taxable income for the prior year. The change in level of distributions for each member’s estimated tax liability between periods primarily resulted from the timing of quarterly payments.
59
Other distributions
During the year ended December 31, 2010, the Company distributed $2,752 to holders of New Class A Units, other than Duff & Phelps Corporation. Concurrent with the payment of the dividend to shareholders of record, holders of New Class A Units received a $0.05 distribution per vested unit on March 16, 2010 and a $0.06 distribution per vested unit on May 28, 2010, August 27, 2010 and December 3, 2010. These amounts totaled $2,590 and will be treated as a reduction in basis of each member’s ownership interests. Pursuant to the terms of the Third Amended and Restated LLC Agreement of D&P Acquisitions, a corresponding amount per unvested unit was deposited into a segregated
account and will be distributed once a year with respect to units that vested during that year. During the year ended December 31, 2010, the Company distributed $162 to members whose units vested during 2009 and accrued $276 to members whose units vested during 2010. This accrual was paid in January 2011. Any amounts related to unvested units that forfeit are returned to the Company.
Payments pursuant to the Tax Receivable Agreement
As a result of the Company’s acquisition of New Class A Units of D&P Acquisitions, the Company expects to benefit from depreciation and other tax deductions reflecting D&P Acquisitions' tax basis for its assets. Those deductions will be allocated to the Company and will be taken into account in reporting the Company’s taxable income. Further, as a result of a federal income tax election made by D&P Acquisitions applicable to a portion of the Company’s acquisition of New Class A Units of D&P Acquisitions, the income tax basis of the assets of D&P Acquisitions underlying a portion of the units the Company has and will acquire (pursuant to the exchange
agreement) will be adjusted based upon the amount that the Company has paid for that portion of its New Class A Units of D&P Acquisitions.
The Company has entered into a tax receivable agreement (“TRA”) with the existing unitholders of D&P Acquisitions (for the benefit of the existing unitholders of D&P Acquisitions) that provides for the payment by the Company to the unitholders of D&P Acquisitions of 85% of the amount of cash savings, if any, in U.S. federal, state and local income tax that the Company realizes (i) from the tax basis in its proportionate share of D&P Acquisitions' goodwill and similar intangible assets that the Company receives as a result of the exchanges and (ii) from the federal income tax election referred to above. D&P Acquisitions expects to make future payments under the TRA to the
extent cash is available for such purposes.
As of December 31, 2010, the Company recorded a liability of $109,525, representing the payments due to D&P Acquisitions’ unitholders under the TRA (see current and non-current portion of “Due to noncontrolling unitholders” on the Company’s Condensed Consolidated Balance Sheets).
Within the next 12 month period, the Company expects to pay $5,640 of the total amount. The basis for determining the current portion of the payments due to D&P Acquisitions’ unitholders under the TRA is the expected amount of payments to be made within the next 12 months. The long-term portion of the payments due to D&P Acquisitions’ unitholders under the tax receivable agreement is the remainder. Payments are anticipated to be made annually over 15 years, commencing from the date of each event that gives rise to the TRA benefits, beginning with the date of the closing of the IPO on October 3, 2007. The payments are made in accordance with the terms of the
TRA. The timing of the payments is subject to certain contingencies including Duff & Phelps Corporation having sufficient taxable income to utilize all of the tax benefits defined in the TRA.
To determine the current amount of the payments due to D&P Acquisitions’ unitholders under the TRA, the Company estimated the amount of taxable income that Duff & Phelps Corporation has generated over the previous fiscal year. Next, the Company estimated the amount of the specified TRA deductions at year end. This was used as a basis for determining the amount of tax reduction that generates a TRA obligation. In turn, this was used to calculate the estimated payments due under the TRA that the Company expects to pay in the next 12 months. These calculations are performed pursuant to the terms of the TRA.
Obligations pursuant to the TRA are obligations of Duff & Phelps Corporation. They do not impact the noncontrolling interest. These obligations are not income tax obligations and have no impact on the tax provision or the allocation of taxes. Furthermore, the TRA has no impact on the allocation of the provision for income taxes to the Company’s net income. In general, items of income and expense are allocated on the basis of member’s ownership interests pursuant to the Third Amended and Restated Limited Liability Company Agreement of Duff & Phelps Acquisitions, LLC.
|
|
·
|
Repurchases of Class A common stock – Repurchases of Class A common stock includes shares repurchased pursuant to a publicly announced repurchase program as well as shares of Class A common stock withheld to cover payroll tax withholdings related to the lapse of restrictions on Ongoing RSAs.
|
60
|
|
·
|
Dividends – Cash dividends of $6,618 reflects the payment of quarterly cash dividends of $0.05 per share of our Class A common stock to holders of record as of March 16, 2010 and $0.06 per share of our Class A common stock to holders of record as of May 18, August 17 and December 3, 2010.
|
Credit Facility
On July 15, 2009, Duff & Phelps, LLC entered into a credit agreement with Bank of America, N.A., as administrative agent and the lenders from time to time party thereto ("Credit Agreement"), providing for a $30,000 senior secured revolving credit facility (“Credit Facility”), including a $10,000 sub-limit for the issuance of letters of credit. The proceeds of the facility are permitted to be used for working capital, permitted acquisitions and general corporate purposes. The maturity date is July 15, 2012 and amounts borrowed may be voluntarily prepaid at any time without penalty or premium, subject to customary breakage costs.
There were no amounts outstanding under the Credit Facility at December 31, 2010 or through the filing date of this Annual Report on Form 10-K. As of December 31, 2010, the Company had $4,109 of outstanding letters of credit of which $3,685 were issued against the Credit Facility. There was $424 of cash deposited into a restricted account to serve as deposits to secure the remaining letters of credit. These letters of credit were issued in connection with real estate leases.
Loans under the Credit Facility will, at the Company's option, bear interest on the principal amount outstanding at either (a) a rate equal to LIBOR, plus an applicable margin or (b) a base rate, plus an applicable margin. The applicable margin rate will be based on the Company's most recent consolidated leverage ratio and ranges from 1.75% to 2.50% per annum depending on the Company's consolidated leverage ratio. In addition, the Company is required to pay an unused commitment fee on the actual daily amount of the unutilized portion of the commitments of the lenders at a rate ranging from 0.25% to 0.50% per annum, based on the Company's most recent consolidated leverage ratio. Based
on the Company’s consolidated leverage ratio at December 31, 2010, the Company qualifies for the 1.75% applicable margin and 0.25% unused commitment fee.
The Credit Agreement contains customary representations and warranties and customary affirmative and negative covenants, including, among others, limitations on (a) the incurrence of liens, (b) the incurrence of indebtedness, (c) the ability to make dividends and distributions, as well as redeem and repurchase equity interests, and (d) acquisitions, mergers, consolidations and sales of assets. In addition, the Credit Agreement contains financial covenants that do not permit (a) a total leverage ratio of greater than 2.75 to 1.00 until the quarter ending September 30, 2010, and 2.50 to 1.00 thereafter and (b) a consolidated fixed charge coverage ratio of less than 2.00 to 1.00 until September 30, 2010, and
1.25 to 1.00 thereafter. The financial covenants are tested on the last day of each fiscal quarter based on the last four fiscal quarter periods. Management believes that the Company was in compliance with all of its covenants as of December 31, 2010. The Credit Agreement permits dividend payments or other distributions in the Company’s common stock or other equity interests subject to certain limitations.
The obligation of the Company to pay amounts outstanding under the Credit Facility may be accelerated upon the occurrence of an "Event of Default" as defined in the Credit Agreement. The Company's obligations under the Credit Agreement are guaranteed by D&P Acquisitions, and certain domestic subsidiaries of the Company (collectively, the "Guarantors"). The Credit Agreement is secured by a lien on substantially all of the personal property of the Company and each of the Guarantors.
Future Needs
Our primary financing need has been to fund our growth. Our growth strategy includes hiring additional revenue-generating client service professionals and expanding our service offerings through existing client service professionals, new hires or acquisitions of new businesses. We intend to fund such growth over the next twelve months with cash on-hand, funds generated from operations and borrowings under our revolving credit agreement. We believe these funds will be adequate to fund future growth.
61
Contractual Obligations
The contractual obligations presented in the table below represent our estimates of future payments under fixed contractual obligations and commitments at December 31, 2010. Changes in our business needs or interest rates, as well as actions by third parties and other factors, may cause these estimates to change. Because these estimates are complex and necessarily subjective, our actual payments in future periods are likely to vary from those presented in the table.
|
Payments Due by Period
|
||||||||||||||||||||
|
Less Than
|
2 to 3
|
4 to 5
|
More Than
|
|||||||||||||||||
|
Total
|
1 Year
|
Years
|
Years
|
5 Years
|
||||||||||||||||
|
Principal and interest payments under credit facility(1)
|
$ | - | $ | - | $ | - | $ | - | $ | - | ||||||||||
|
Operating lease obligations
|
136,209 | 17,365 | 31,469 | 24,741 | 62,634 | |||||||||||||||
|
Payments pursuant to the Tax Receivable Agreement
|
109,525 | 5,640 | 12,475 | 13,450 | 77,960 | |||||||||||||||
|
Total
|
$ | 245,734 | $ | 23,005 | $ | 43,944 | $ | 38,191 | $ | 140,594 | ||||||||||
(1) Excludes amounts for unused commitment fee.
Off-Balance Sheet Arrangements
Pursuant to the terms of our credit facility, we currently provide standby letters of credit totaling $4,109 at December 31, 2010 to guarantee obligations that may arise under certain real estate leases. These potential obligations are not reflected in the Company’s consolidated financial statements. Other than the aforementioned letters of credit, we do not invest in any off-balance sheet vehicles that provide liquidity, capital resources, market or credit risk support, or engage in any leasing activities that expose us to any liability that is not reflected in our consolidated financial statements.
Exchange Rate Risk
We are exposed to risk from changes in foreign exchange rates related to our subsidiaries that use a foreign currency as their functional currency. We currently manage our foreign exchange exposure without the use of derivative instruments. We do not believe this risk is material in relation to our consolidated financial statements.
Inflation
We believe that inflation has not had a material impact on the Company’s results of operations for each of the three years ended December 31, 2010, 2009 and 2008. However, there can be no assurance that future inflation will not have an adverse impact on the Company’s operating results and financial condition.
Recent Accounting Pronouncements
In October 2009, the FASB issued ASU No. 2009-13, Multiple-Deliverable Revenue Arrangements. ASU 2009-13 supersedes certain guidance in FASB ASC 605-25, Revenue Recognition – Multiple-Element Arrangements, and requires an entity to allocate arrangement consideration at the inception of an arrangement to all of its deliverables based on their relative selling prices (the relative-selling-price method). ASU 2009-13 eliminates the use of the residual method of allocation in which the undelivered element is measured at its estimated selling price and the
delivered element is measured as the residual of the arrangement consideration, and requires the relative-selling-price method in all circumstances in which an entity recognizes revenue for an arrangement with multiple deliverable subject to ASU 2009-13. ASU 2009-13 must be adopted no later than the beginning of the first fiscal year beginning on or after June 15, 2010, with early adoption permitted through either prospective application for revenue arrangement entered into, or materially modified, after the effective date or through retrospective application to all revenue arrangement for all periods presented. We do not anticipate that the adoption of ASU 2009-13 will have a material effect on our consolidated financial statements.
62
Item 7A. Quantitative and Qualitative Disclosures About Market Risk
We are exposed to market risks related to interest rates and changes in the market value of our investments. Our exposure to changes in interest rates is limited to borrowings under our Credit Facility, which has variable interest rates tied to the LIBOR or prime rate. At December 31, 2010, there were no borrowings outstanding.
Item 8. Financial Statements and Supplemental Data.
The Company’s consolidated financial statements are included under Item 15 of this report.
Item 9. Changes in and Disagreements with Accountants on Accounting and Financial Disclosure.
63
Item 9A. Controls and Procedures.
|
(a)
|
Evaluation of Disclosure Controls and Procedures
|
|
|
Our management, including our Chief Executive Officer and Chief Financial Officer, evaluated the effectiveness of our disclosure controls and procedures pursuant to Rule 13a-15 under the Exchange Act as of the end of the period covered by this report. Based on that evaluation, our Chief Executive Officer and Chief Financial Officer have concluded that, as of the end of the period covered by this report, our disclosure controls and procedures (as defined in Rule 13a-15(e) and Rule 15d-15(e) under the Exchange Act) are effective, in all material respects, to ensure that information we are required to disclose in reports that we file or submit under the Exchange Act is recorded, processed, summarized and reported within the time periods specified in SEC rules and forms, and that such
information is accumulated and communicated to our management, including our Chief Executive Officer and Chief Financial Officer, as appropriate, to allow timely decisions regarding required disclosure.
|
|
|
The effectiveness of our disclosure controls and procedures and our internal control over financial reporting is subject to various inherent limitations, including cost limitations, judgments used in decision making, assumptions about the likelihood of future events, the soundness of our systems, the possibility of human error, and the risk of fraud. Moreover, projections of any evaluation of effectiveness of future periods are subject to the risk that controls may become inadequate because of changes in conditions and the risk that the degree of compliance with policies or procedures may deteriorate over time. Because of these limitations, there can be no assurance that any system of disclosure controls and procedures or internal control over financial reporting will be
successful in preventing all errors or fraud or in making all material information known in a timely manner to the appropriate levels of management.
|
|
(b)
|
Management’s Annual Report on Internal Control Over Financial Reporting and Report of Independent Registered Public Accounting Firm
|
|
|
Our management is responsible for establishing and maintaining adequate internal control over financial reporting as defined in Rules 13a-15(f) and 15d-15(f) under the Exchange Act. The Company’s internal control over financial reporting is designed to provide reasonable assurance regarding the reliability of financial reporting and the preparation of financial statements for external purposes in accordance with GAAP. The Company’s internal control over financial reporting includes those policies and procedures that: (i) pertain to the maintenance of records that, in reasonable detail, accurately and fairly reflect the transactions and dispositions of the assets of the Company; (ii) provide reasonable assurance that transactions are recorded as necessary to
permit preparation of financial statements in accordance with GAAP, and that receipts and expenditures of the Company are being made only in accordance with authorizations of management and directors of the Company; and (iii) provide reasonable assurance regarding prevention or timely detection of unauthorized acquisition, use or disposition of the Company’s assets that could have a material effect on the financial statements.
|
|
|
Because of its inherent limitations, internal control over financial reporting may not prevent or detect misstatements. Also, projections of any evaluation of effectiveness to future periods are subject to the risk that controls may become inadequate because of changes in conditions, or that the degree of compliance with the policies or procedures may deteriorate. Management assessed the effectiveness of the Company’s internal control over financial reporting as of December 31, 2010. In making this assessment, management used the criteria set forth by the Committee of Sponsoring Organizations of the Treadway Commission in Internal Control – Integrated Framework. Based on our
assessment and those criteria, management believes that the Company maintained effective internal control over financial reporting as of December 31, 2010.
|
|
|
Our independent auditors have issued an audit report on the effectiveness of the Company’s internal control over financial reporting. That report appears on page F-2.
|
|
(c)
|
Change in Internal Control Over Financial Reporting
|
|
|
No change in our internal control over financial reporting (as defined in Rule 13a-15(f) under the Exchange Act) occurred during our fourth quarter of 2010 that has materially affected, or is likely to materially affect, our internal control over financial reporting.
|
64
Item 9B. Other Information.
None.
Item 10. Directors, Executive Officers and Corporate Governance.
The information required by this Item is incorporated herein by reference to the Proxy Statement for the Company’s 2011 Annual Meeting of Stockholders.
Item 11. Executive Compensation.
The information required by this Item is incorporated herein by reference to the Proxy Statement for the Company’s 2011 Annual Meeting of Stockholders.
Item 12. Security Ownership of Certain Beneficial Owners and Management and Related Stockholder Matters.
The information contained in this section is incorporated herein by reference to the Proxy Statement for the Company’s 2011 Annual Meeting of Stockholders and this Annual Report on Form 10-K under the caption Part II – Item 5. Market for Registrant’s Common Equity, Related Stockholder Matters and Issuer Purchases of Equity Securities.
Equity Compensation Plan Information
The following table lists information regarding outstanding options and shares reserved for future issuance under our equity compensation plans at December 31, 2010. All equity compensation plans have been approved by the stockholders.
|
(a)
|
(b)
|
(c)
|
||||||||||
|
Number of Securities
|
||||||||||||
|
Number of Securities
|
Remaining Available for
|
|||||||||||
|
to be Issued Upon
|
Weighted-Average
|
Future Issuance Under
|
||||||||||
|
Exercise of Outstanding
|
Exercise Price of
|
Equity Compensation
|
||||||||||
|
Options, Warrants
|
Outstanding Options,
|
Plans (Excluding Securities
|
||||||||||
|
Plan Category
|
and Rights(1)
|
Warrants and Rights(2)
|
Reflected in Column (a))
|
|||||||||
|
2007 Omnibus Stock Plan
|
5,396 | $ | 16.00 | 5,085 | ||||||||
|
|
(1)
|
Includes common stock issuable upon the vesting of 3,735 restricted stock awards or units and the exercise of 1,661 outstanding options granted under the Duff & Phelps Corporation Amended and Restated 2007 Omnibus Stock Incentive Plan (“2007 Omnibus Stock Plan”).
|
|
|
(2)
|
The weighted average exercise price shown relates solely to the options granted. The restricted stock awards and units have no exercise price due to their nature.
|
Item 13. Certain Relationships and Related Transactions, and Director Independence.
The information required by this Item is incorporated herein by reference to the Proxy Statement for the Company’s 2011 Annual Meeting of Stockholders.
Item 14. Principal Accountant Fees and Services.
The information required by this Item is incorporated herein by reference to the Proxy Statement for the Company’s 2011 Annual Meeting of Stockholders.
65
Item 15. Exhibits, Financial Statement Schedules.
|
(a)
|
The following documents are filed as part of this report:
|
|
|
(1)
|
Consolidated Financial Statements – The consolidated financial statements listed in the “Index to Consolidated Financial Statements” described at F-1 are incorporated by reference herein.
|
|
|
(2)
|
Financial Statement Schedules – The financial statement schedule “Schedule II – Valuation and Qualifying Accounts” is incorporated by reference herein. All other schedules have been omitted because they are not applicable, not required or the information required is included in the financial statements or notes thereto.
|
|
|
(3)
|
Exhibits – Certain of the exhibits to this Annual Report are hereby incorporated by references, as summarized in (b) below.
|
|
(b)
|
Exhibits
|
A list of exhibits required to be filed as part of this report is set forth in the Exhibit Index immediately following the Consolidated Financial Statements filed as part of this report on Form 10-K and is incorporated herein by reference.
|
(c)
|
All other financial statement schedules have been omitted since they are either not required, not applicable or the required information is shown in the financial statements or related notes.
|
66
SIGNATURES
Pursuant to the requirements of Section 13 or 15(d) of the Securities Exchange Act of 1934, the registrant has duly caused this report to be signed on its behalf by the undersigned, thereunto duly authorized, on February 23, 2011.
|
DUFF & PHELPS CORPORATION
|
||
|
By:
|
/s/ Noah Gottdiener
|
|
|
Noah Gottdiener
|
||
|
Chairman of the Board and Chief Executive Officer
|
||
|
(Principal Executive Officer)
|
Pursuant to the requirements of the Securities Act of 1934, as amended, this Report has been signed below by the following persons on behalf of the Registrant in the capacities and as of the date indicated.
|
Signature
|
Capacity
|
Date
|
||
|
/s/ Noah Gottdiener
|
Chairman of the Board, Chief Executive
|
February 23, 2011
|
||
|
Noah Gottdiener
|
Officer, President and Director
|
|||
|
(Principal Executive Officer)
|
||||
|
/s/ Jacob L. Silverman
|
Chief Financial Officer
|
February 23, 2011
|
||
|
Jacob L. Silverman
|
(Principal Financial and Accounting Officer)
|
|||
|
/s/ Robert M. Belke
|
Director
|
February 23, 2011
|
||
|
Robert M. Belke
|
||||
|
/s/ Peter W. Calamari
|
Director
|
February 23, 2011
|
||
|
Peter W. Calamari
|
||||
|
/s/ William R. Carapezzi
|
Director
|
February 23, 2011
|
||
|
William R. Carapezzi
|
||||
|
/s/ William J. Hannigan
|
Director
|
February 23, 2011
|
||
|
William J. Hannigan
|
||||
|
/s/ Harvey M. Krueger
|
Director
|
February 23, 2011
|
||
|
Harvey M. Krueger
|
||||
|
/s/ Sander M. Levy
|
Director
|
February 23, 2011
|
||
|
Sander M. Levy
|
||||
|
/s/ Jeffrey D. Lovell
|
Director
|
February 23, 2011
|
||
|
Jeffrey D. Lovell
|
|
|
67
INDEX TO CONSOLIDATED FINANCIAL STATEMENTS
|
Audited Consolidated Financial Statements:
|
|
|
Reports of Independent Registered Public Accounting Firm
|
F-2
|
|
Consolidated Statements of Operations
|
F-4
|
|
Consolidated Balance Sheets
|
F-5
|
|
Consolidated Statements of Cash Flows
|
F-6
|
|
Consolidated Statements of Stockholders’ Equity and Comprehensive Income
|
F-8
|
|
Notes to Consolidated Financial Statements
|
F-11
|
|
Financial Statement Schedules:
|
|
|
Schedule II – Valuation and Qualifying Accounts
|
F-46
|
F-1
REPORT OF INDEPENDENT REGISTERED PUBLIC ACCOUNTING FIRM
To the Board of Directors and Stockholders of
Duff & Phelps Corporation and Subsidiaries:
We have audited the accompanying consolidated balance sheets of Duff & Phelps Corporation and subsidiaries (the “Company”) as of December 31, 2010 and 2009, and the related consolidated statements of operations, stockholders’ equity and comprehensive income, and cash flows for each of the years in the three-year period ended December 31, 2010. In connection with our audits of the consolidated financial statements, we also have audited the consolidated financial statement schedule II, Valuation and Qualifying Accounts. These consolidated financial statements and the accompanying consolidated
financial statement schedule are the responsibility of the Company’s management. Our responsibility is to express an opinion on these consolidated financial statements and consolidated financial statement schedule based on our audits.
We conducted our audits in accordance with the standards of the Public Company Accounting Oversight Board (United States). Those standards require that we plan and perform the audit to obtain reasonable assurance about whether the financial statements are free of material misstatement. An audit includes examining, on a test basis, evidence supporting the amounts and disclosures in the financial statements. An audit also includes assessing the accounting principles used and significant estimates made by management, as well as evaluating the overall financial statement presentation. We believe that our audits provide a reasonable basis for our opinion.
In our opinion, the consolidated financial statements referred to above present fairly, in all material respects, the financial position of Duff & Phelps Corporation and subsidiaries as of December 31, 2010 and 2009, and the results of its operations and its cash flows for each of the years in the three-year period ended December 31, 2010, in conformity with U.S. generally accepted accounting principles. Also in our opinion, the related consolidated financial statement schedule, when considered in relation to the basic consolidated financial statements taken as a
whole, presents fairly, in all material respects, the information set forth therein.
We also have audited, in accordance with the standards of the Public Company Accounting Oversight Board (United States), the Company’s internal control over financial reporting as of December 31, 2010, based on the criteria established in Internal Control – Integrated Framework issued by the Committee of Sponsoring Organizations of the Treadway Commission (COSO), and our report dated February 23, 2011 expressed an unqualified opinion on the effectiveness of the Company’s internal control over financial reporting.
/s/ KPMG LLP
New York, New York
February 23, 2011
F-2
REPORT OF INDEPENDENT REGISTERED PUBLIC ACCOUNTING FIRM
To the Board of Directors and Stockholders of
Duff & Phelps Corporation and Subsidiaries:
We have audited Duff & Phelps Corporation and subsidiaries’ (the “Company”) internal control over financial reporting as of December 31, 2010, based on criteria established in Internal Control – Integrated Framework issued by the Committee of Sponsoring Organizations of the Treadway Commission (COSO). The Company’s management is responsible for maintaining effective internal control over financial reporting and for its assessment of the effectiveness of internal control over financial reporting, included in the accompanying Management’s Annual Report on Internal Control over Financial
Reporting. Our responsibility is to express an opinion on the Company’s internal control over financial reporting based on our audit.
We conducted our audit in accordance with the standards of the Public Company Accounting Oversight Board (United States). Those standards require that we plan and perform the audit to obtain reasonable assurance about whether effective internal control over financial reporting was maintained in all material respects. Our audit included obtaining an understanding of internal control over financial reporting, assessing the risk that a material weakness exists, and testing and evaluating the design and operating effectiveness of internal control based on the assessed risk. Our audit also included performing such other procedures as we considered necessary in the circumstances. We believe that our
audit provides a reasonable basis for our opinion.
A company’s internal control over financial reporting is a process designed to provide reasonable assurance regarding the reliability of financial reporting and the preparation of financial statements for external purposes in accordance with generally accepted accounting principles. A company’s internal control over financial reporting includes those policies and procedures that (1) pertain to the maintenance of records that, in reasonable detail, accurately and fairly reflect the transactions and dispositions of the assets of the company; (2) provide reasonable assurance that transactions are recorded as necessary to permit preparation of financial statements in accordance with
generally accepted accounting principles, and that receipts and expenditures of the company are being made only in accordance with authorizations of management and directors of the company; and (3) provide reasonable assurance regarding prevention or timely detection of unauthorized acquisition, use, or disposition of the company’s assets that could have a material effect on the financial statements.
Because of its inherent limitations, internal control over financial reporting may not prevent or detect misstatements. Also, projections of any evaluation of effectiveness to future periods are subject to the risk that controls may become inadequate because of changes in conditions, or that the degree of compliance with the policies or procedures may deteriorate.
In our opinion, Duff & Phelps Corporation and subsidiaries maintained, in all material respects, effective internal control over financial reporting as of December 31, 2010, based on criteria established in Internal Control – Integrated Framework issued by the Committee of Sponsoring Organizations of the Treadway Commission.
We also have audited, in accordance with the standards of the Public Company Accounting Oversight Board (United States), the consolidated balance sheets of Duff & Phelps Corporation and subsidiaries as of December 31, 2010 and 2009, and the related consolidated statements of operations, stockholders’ equity and comprehensive income, and cash flows for each of the years in the three-year period ended December 31, 2010, and our report dated February 23, 2011 expressed an unqualified opinion on those consolidated financial statements and the related consolidated financial statement schedule.
/s/ KPMG LLP
New York, New York
February 23, 2011
F-3
Duff & Phelps Corporation and Subsidiaries
Consolidated Statements of Operations
(In thousands, except per share data)
|
Year Ended
|
||||||||||||
|
December 31,
|
December 31,
|
December 31,
|
||||||||||
|
2010
|
2009
|
2008
|
||||||||||
|
Revenues
|
$ | 365,546 | $ | 370,903 | $ | 381,476 | ||||||
|
Reimbursable expenses
|
9,485 | 11,083 | 10,546 | |||||||||
|
Total revenues
|
375,031 | 381,986 | 392,022 | |||||||||
|
Direct client service costs
|
||||||||||||
|
Compensation and benefits (includes $14,891, $16,432 and $20,537 of equity-based compensation for the years ended December 31, 2010, 2009 and 2008, respectively)
|
205,958 | 210,302 | 216,137 | |||||||||
|
Other direct client service costs
|
7,548 | 7,232 | 8,224 | |||||||||
|
Acquisition retention expenses (includes $11 of equity-based compensation for the year ended December 31, 2010)
|
11 | - | 793 | |||||||||
|
Reimbursable expenses
|
9,547 | 11,158 | 10,623 | |||||||||
| 223,064 | 228,692 | 235,777 | ||||||||||
|
Operating expenses
|
||||||||||||
|
Selling, general and administrative (includes $5,542, $7,223 and $10,803 of equity-based compensation for the years ended December 31, 2010, 2009 and 2008, respectively)
|
97,451 | 99,162 | 108,312 | |||||||||
|
Depreciation and amortization
|
9,916 | 10,244 | 9,816 | |||||||||
|
Charge from impairment of certain intangible assets (Note 7)
|
674 | - | - | |||||||||
|
Merger and acquisition costs
|
704 | - | - | |||||||||
| 108,745 | 109,406 | 118,128 | ||||||||||
|
Operating income
|
43,222 | 43,888 | 38,117 | |||||||||
|
Other expense/(income), net
|
||||||||||||
|
Interest income
|
(112 | ) | (53 | ) | (668 | ) | ||||||
|
Interest expense
|
312 | 1,131 | 3,475 | |||||||||
|
Loss on early extinguishment of debt
|
- | 1,737 | - | |||||||||
|
Other expense
|
173 | 141 | 398 | |||||||||
| 373 | 2,956 | 3,205 | ||||||||||
|
Income before income taxes
|
42,849 | 40,932 | 34,912 | |||||||||
|
Provision for income taxes
|
13,503 | 12,264 | 10,619 | |||||||||
|
Net income
|
29,346 | 28,668 | 24,293 | |||||||||
|
Less: Net income attributable to noncontrolling interest
|
12,581 | 17,100 | 19,068 | |||||||||
|
Net income attributable to Duff & Phelps Corporation
|
$ | 16,765 | $ | 11,568 | $ | 5,225 | ||||||
|
Weighted average shares of Class A common stock outstanding
|
||||||||||||
|
Basic
|
25,170 | 19,013 | 13,225 | |||||||||
|
Diluted
|
26,089 | 19,795 | 13,501 | |||||||||
|
Net income per share attributable to stockholders of Class A common stock of Duff & Phelps Corporation (Note 4)
|
||||||||||||
|
Basic
|
$ | 0.62 | $ | 0.57 | $ | 0.37 | ||||||
|
Diluted
|
$ | 0.60 | $ | 0.54 | $ | 0.36 | ||||||
|
Cash dividends declared per common share
|
$ | 0.23 | $ | 0.15 | $ | - | ||||||
See accompanying notes to the consolidated financial statements.
F-4
Duff & Phelps Corporation and Subsidiaries
Consolidated Balance Sheets
(In thousands, except per share data)
|
December 31,
|
December 31,
|
|||||||
|
2010
|
2009
|
|||||||
|
ASSETS
|
||||||||
|
Current assets
|
||||||||
|
Cash and cash equivalents
|
$ | 113,328 | $ | 107,311 | ||||
|
Accounts receivable (net of allowance for doubtful accounts of $1,347 and $1,690 at December 31, 2010 and 2009, respectively)
|
60,358 | 55,079 | ||||||
|
Unbilled services
|
23,101 | 22,456 | ||||||
|
Prepaid expenses and other current assets
|
7,479 | 6,100 | ||||||
|
Net deferred income taxes, current
|
2,555 | 4,601 | ||||||
|
Total current assets
|
206,821 | 195,547 | ||||||
|
Property and equipment (net of accumulated depreciation of $26,375 and $20,621 at December 31, 2010 and 2009, respectively) (Note 6)
|
29,250 | 27,413 | ||||||
|
Goodwill (Note 7)
|
139,170 | 122,876 | ||||||
|
Intangible assets (net of accumulated amortization of $20,656 and $16,881 at December 31, 2010 and 2009, respectively) (Note 7)
|
30,407 | 27,907 | ||||||
|
Other assets
|
2,638 | 3,218 | ||||||
|
Investments related to deferred compensation plan (Note 15)
|
23,151 | 17,807 | ||||||
|
Net deferred income taxes, non-current
|
116,789 | 112,265 | ||||||
|
Total non-current assets
|
341,405 | 311,486 | ||||||
|
Total assets
|
$ | 548,226 | $ | 507,033 | ||||
|
LIABILITIES AND STOCKHOLDERS' EQUITY
|
||||||||
|
Current liabilities
|
||||||||
|
Accounts payable
|
$ | 2,397 | $ | 2,459 | ||||
|
Accrued expenses
|
11,254 | 11,609 | ||||||
|
Accrued compensation and benefits
|
39,875 | 35,730 | ||||||
|
Liability related to deferred compensation plan, current portion (Note 15)
|
1,314 | - | ||||||
|
Deferred revenues
|
2,427 | 3,633 | ||||||
|
Other current liabilities
|
430 | 993 | ||||||
|
Due to noncontrolling unitholders, current portion
|
5,640 | 4,303 | ||||||
|
Total current liabilities
|
63,337 | 58,727 | ||||||
|
Liability related to deferred compensation plan, less current portion (Note 15)
|
21,764 | 18,051 | ||||||
|
Other long-term liabilities (Note 9)
|
16,676 | 15,400 | ||||||
|
Due to noncontrolling unitholders, less current portion
|
103,885 | 101,098 | ||||||
|
Total non-current liabilities
|
142,325 | 134,549 | ||||||
|
Total liabilities
|
205,662 | 193,276 | ||||||
|
Commitments and contingencies (Note 13)
|
||||||||
|
Stockholders' equity
|
||||||||
|
Preferred stock (50,000 shares authorized; zero issued and outstanding)
|
- | - | ||||||
|
Class A common stock, par value $0.01 per share (100,000 shares authorized; 30,166 and 27,290 shares issued and outstanding at December 31, 2010 and 2009, respectively)
|
302 | 273 | ||||||
|
Class B common stock, par value $0.0001 per share (50,000 shares authorized; 11,151 and 12,974 shares issued and outstanding at December 31, 2010 and 2009, respectively)
|
1 | 1 | ||||||
|
Additional paid-in capital
|
232,644 | 207,210 | ||||||
|
Accumulated other comprehensive income
|
1,400 | 693 | ||||||
|
Retained earnings
|
16,923 | 6,709 | ||||||
|
Total stockholders' equity of Duff & Phelps Corporation
|
251,270 | 214,886 | ||||||
|
Noncontrolling interest
|
91,294 | 98,871 | ||||||
|
Total stockholders' equity
|
342,564 | 313,757 | ||||||
|
Total liabilities and stockholders' equity
|
$ | 548,226 | $ | 507,033 | ||||
See accompanying notes to the consolidated financial statements.
F-5
Duff & Phelps Corporation and Subsidiaries
Consolidated Statements of Cash Flows
(In thousands)
|
Year Ended
|
||||||||||||
|
December 31,
|
December 31,
|
December 31,
|
||||||||||
|
2010
|
2009
|
2008
|
||||||||||
|
Cash flows from operating activities:
|
||||||||||||
|
Net income
|
$ | 29,346 | $ | 28,668 | $ | 24,293 | ||||||
|
Adjustments to reconcile net income to net cash provided by operating activities:
|
||||||||||||
|
Depreciation and amortization
|
9,916 | 10,244 | 9,816 | |||||||||
|
Equity-based compensation
|
20,444 | 23,655 | 31,340 | |||||||||
|
Bad debt expense
|
2,074 | 2,386 | 1,604 | |||||||||
|
Net deferred income taxes
|
3,050 | (941 | ) | (384 | ) | |||||||
|
Charge from impairment of certain intangible assets
|
674 | - | - | |||||||||
|
Loss on early extinguishment of debt
|
- | 1,674 | - | |||||||||
|
Other
|
932 | 368 | 2,353 | |||||||||
|
Changes in assets and liabilities providing/(using) cash:
|
||||||||||||
|
Accounts receivable
|
(3,231 | ) | (1,492 | ) | (9,030 | ) | ||||||
|
Unbilled services
|
(12 | ) | (4,518 | ) | 5,427 | |||||||
|
Prepaid expenses and other current assets
|
(930 | ) | 452 | (237 | ) | |||||||
|
Other assets
|
(1,802 | ) | (3,639 | ) | 2,916 | |||||||
|
Accounts payable and accrued expenses
|
(1,933 | ) | 4,515 | (4,108 | ) | |||||||
|
Accrued compensation and benefits
|
6,157 | 9,839 | (20,088 | ) | ||||||||
|
Deferred revenues
|
(1,378 | ) | 352 | (5,051 | ) | |||||||
|
Other liabilities
|
734 | (1,487 | ) | 1,536 | ||||||||
|
Due to noncontrolling unitholders from payments pursuant to the Tax Receivable Agreement
|
(4,267 | ) | (3,090 | ) | (791 | ) | ||||||
|
Net cash provided by operating activities
|
59,774 | 66,986 | 39,596 | |||||||||
|
Cash flows from investing activities:
|
||||||||||||
|
Purchase of property and equipment
|
(7,080 | ) | (5,517 | ) | (11,836 | ) | ||||||
|
Business acquisitions, net of cash acquired
|
(18,217 | ) | (5,291 | ) | (16,520 | ) | ||||||
|
Purchase of investments for deferred compensation plan
|
(3,175 | ) | (6,658 | ) | (10,466 | ) | ||||||
|
Proceeds from sale of investments in deferred compensation plan
|
- | - | 1,692 | |||||||||
|
Net cash used in investing activities
|
(28,472 | ) | (17,466 | ) | (37,130 | ) | ||||||
|
Cash flows from financing activities:
|
||||||||||||
|
Distributions to noncontrolling unitholders
|
(9,833 | ) | (21,976 | ) | (9,753 | ) | ||||||
|
Repurchases of Class A common stock
|
(8,897 | ) | (915 | ) | - | |||||||
|
Dividends
|
(6,618 | ) | (3,757 | ) | - | |||||||
|
Net proceeds from sale of Class A common stock
|
(3 | ) | 148,840 | - | ||||||||
|
Proceeds from exercise of IPO Options
|
144 | 1,202 | 69 | |||||||||
|
Redemption of noncontrolling unitholders
|
- | (104,612 | ) | - | ||||||||
|
Repayments of debt
|
- | (42,763 | ) | (794 | ) | |||||||
|
Payment of costs for debt issuance and extinguishment
|
- | (471 | ) | (589 | ) | |||||||
|
Net cash used in financing activities
|
(25,207 | ) | (24,452 | ) | (11,067 | ) | ||||||
|
Effect of exchange rate on cash and cash equivalents
|
(78 | ) | 862 | (261 | ) | |||||||
|
Net increase/(decrease) in cash and cash equivalents
|
6,017 | 25,930 | (8,862 | ) | ||||||||
|
Cash and cash equivalents at beginning of period
|
107,311 | 81,381 | 90,243 | |||||||||
|
Cash and cash equivalents at end of period
|
$ | 113,328 | $ | 107,311 | $ | 81,381 | ||||||
See accompanying notes to the consolidated financial statements.
F-6
Duff & Phelps Corporation and Subsidiaries
Consolidated Statement of Cash Flows – Continued
(In thousands)
|
Year Ended
|
||||||||||||
|
December 31,
|
December 31,
|
December 31,
|
||||||||||
|
2010
|
2009
|
2008
|
||||||||||
|
Supplemental disclosures of cash flow activities:
|
||||||||||||
|
Interest paid
|
$ | - | $ | 746 | $ | 3,043 | ||||||
|
Income taxes paid
|
$ | 10,410 | $ | 5,073 | $ | 7,690 | ||||||
|
Supplemental disclosures of non-cash investing and financing activities:
|
||||||||||||
|
Value of Class A common stock issued for business acquisitions
|
$ | 2,535 | $ | 180 | $ | 5,443 | ||||||
See accompanying notes to the consolidated financial statements.
F-7
Duff & Phelps Corporation and Subsidiaries
Consolidated Statement of Stockholders’ Equity
and Comprehensive Income
(In thousands)
|
Stockholders of Duff & Phelps Corporation
|
||||||||||||||||||||||||||||||||||||||||
|
Accumulated
|
||||||||||||||||||||||||||||||||||||||||
|
Total
|
Other
|
|||||||||||||||||||||||||||||||||||||||
|
Stockholders'
|
Comprehensive
|
Common Stock - Class A
|
Common Stock - Class B
|
Additional
|
Comprehensive
|
Retained
|
Noncontrolling
|
|||||||||||||||||||||||||||||||||
|
Equity
|
Income
|
Shares
|
Dollars
|
Shares
|
Dollars
|
Paid-in-Capital
|
Income/(Loss)
|
Earnings
|
Interest
|
|||||||||||||||||||||||||||||||
|
Balance as of December 31, 2009
|
$ | 313,757 | 27,290 | $ | 273 | 12,974 | $ | 1 | $ | 207,210 | $ | 693 | $ | 6,709 | $ | 98,871 | ||||||||||||||||||||||||
|
Comprehensive income
|
||||||||||||||||||||||||||||||||||||||||
|
Net income for the year ended December 31, 2010
|
29,346 | $ | 29,346 | - | - | - | - | - | - | 16,765 | 12,581 | |||||||||||||||||||||||||||||
|
Currency translation adjustment
|
381 | 381 | - | - | - | - | - | 340 | - | 41 | ||||||||||||||||||||||||||||||
|
Amortization of post-retirement benefits
|
514 | 514 | - | - | - | - | - | 367 | - | 147 | ||||||||||||||||||||||||||||||
|
Total comprehensive income
|
30,241 | $ | 30,241 | - | - | - | - | - | 707 | 16,765 | 12,769 | |||||||||||||||||||||||||||||
|
Sale of Class A common stock
|
(3 | ) | - | - | - | - | (3 | ) | - | - | - | |||||||||||||||||||||||||||||
|
Issuance of Class A common stock for acquisitions
|
2,535 | 176 | 2 | - | - | 1,798 | - | - | 735 | |||||||||||||||||||||||||||||||
|
Exchange of New Class A Units
|
1 | 1,788 | 18 | (1,788 | ) | - | (17 | ) | - | - | - | |||||||||||||||||||||||||||||
|
Net issuance of restricted stock awards
|
(2,771 | ) | 1,596 | 16 | - | - | (1,920 | ) | - | - | (867 | ) | ||||||||||||||||||||||||||||
|
Adjustment to Tax Receivable Agreement as a result of the exchange of New Class A Units
|
1,529 | - | - | - | - | 1,529 | - | - | - | |||||||||||||||||||||||||||||||
|
Issuance for exercises of IPO Options
|
282 | 18 | - | - | - | 203 | - | - | 79 | |||||||||||||||||||||||||||||||
|
Forfeitures
|
(2 | ) | (251 | ) | (2 | ) | (35 | ) | - | - | - | - | - | |||||||||||||||||||||||||||
|
Equity-based compensation
|
20,615 | - | - | - | - | 14,216 | - | - | 6,399 | |||||||||||||||||||||||||||||||
|
Income tax windfall/(shortfall) on equity-based compensation
|
(64 | ) | - | - | - | - | (64 | ) | - | - | - | |||||||||||||||||||||||||||||
|
Distributions to noncontrolling unitholders
|
(10,109 | ) | - | - | - | - | (7,131 | ) | - | - | (2,978 | ) | ||||||||||||||||||||||||||||
|
Change in ownership interests between periods
|
- | - | - | - | - | 21,403 | - | - | (21,403 | ) | ||||||||||||||||||||||||||||||
|
Deferred tax asset effective tax rate conversion
|
(786 | ) | - | - | - | - | (382 | ) | - | - | (404 | ) | ||||||||||||||||||||||||||||
|
Repurchases of Class A common stock pursuant to publicly announced program
|
(6,110 | ) | (451 | ) | (5 | ) | - | - | (4,198 | ) | - | - | (1,907 | ) | ||||||||||||||||||||||||||
|
Dividends on Class A common stock
|
(6,551 | ) | - | - | - | - | - | - | (6,551 | ) | - | |||||||||||||||||||||||||||||
|
Balance as of December 31, 2010
|
$ | 342,564 | 30,166 | $ | 302 | 11,151 | $ | 1 | $ | 232,644 | $ | 1,400 | $ | 16,923 | $ | 91,294 | ||||||||||||||||||||||||
See accompanying notes to the consolidated financial statements.
F-8
Duff & Phelps Corporation and Subsidiaries
Consolidated Statement of Stockholders’ Equity
and Comprehensive Income – Continued
(In thousands)
|
Stockholders of Duff & Phelps Corporation
|
||||||||||||||||||||||||||||||||||||||||
|
Accumulated
|
Retained
|
|||||||||||||||||||||||||||||||||||||||
|
Total
|
Other
|
Earnings/
|
||||||||||||||||||||||||||||||||||||||
|
Stockholders'
|
Comprehensive
|
Common Stock - Class A
|
Common Stock - Class B
|
Additional
|
Comprehensive
|
(Accumulated
|
Noncontrolling
|
|||||||||||||||||||||||||||||||||
|
Equity
|
Income
|
Shares
|
Dollars
|
Shares
|
Dollars
|
Paid-in Capital
|
Income
|
Deficit)
|
Interest
|
|||||||||||||||||||||||||||||||
|
Balance as of December 31, 2008
|
$ | 237,759 | 14,719 | $ | 147 | 20,889 | $ | 2 | $ | 100,985 | $ | 122 | $ | (1,127 | ) | $ | 137,630 | |||||||||||||||||||||||
|
Comprehensive income
|
||||||||||||||||||||||||||||||||||||||||
|
Net income for the year ended December 31, 2009
|
28,668 | $ | 28,668 | - | - | - | - | - | - | 11,568 | 17,100 | |||||||||||||||||||||||||||||
|
Currency translation adjustment
|
862 | 862 | - | - | - | - | - | 668 | - | 194 | ||||||||||||||||||||||||||||||
|
Amortization of post-retirement benefits
|
(134 | ) | (134 | ) | - | - | - | - | - | (88 | ) | - | (46 | ) | ||||||||||||||||||||||||||
|
Total comprehensive income
|
29,396 | $ | 29,396 | - | - | - | - | - | 580 | 11,568 | 17,248 | |||||||||||||||||||||||||||||
|
Sale of Class A common stock
|
148,840 | 10,550 | 106 | - | - | 71,437 | - | - | 77,297 | |||||||||||||||||||||||||||||||
|
Issuance of Class A common stock for acquisitions
|
180 | 10 | - | - | - | 78 | - | - | 102 | |||||||||||||||||||||||||||||||
|
Exchange of New Class A Units
|
8 | 770 | 8 | (770 | ) | - | (3 | ) | - | - | 3 | |||||||||||||||||||||||||||||
|
Net issuance of restricted stock awards
|
(901 | ) | 1,318 | 13 | - | - | (435 | ) | - | - | (479 | ) | ||||||||||||||||||||||||||||
|
Redemption of New Class A Units
|
(104,612 | ) | - | - | (7,050 | ) | (1 | ) | (51,415 | ) | - | - | (53,196 | ) | ||||||||||||||||||||||||||
|
Adjustments to due to noncontrolling unitholders pursuant to the Tax Receivable Agreement
|
(50,012 | ) | - | - | - | - | (50,012 | ) | - | - | - | |||||||||||||||||||||||||||||
|
Issuance for exercise of IPO Options
|
1,146 | 72 | - | - | - | 681 | - | - | 465 | |||||||||||||||||||||||||||||||
|
Forfeitures
|
2 | (149 | ) | (1 | ) | (95 | ) | - | 3 | - | - | - | ||||||||||||||||||||||||||||
|
Equity-based compensation
|
23,999 | - | - | - | - | 13,126 | - | - | 10,873 | |||||||||||||||||||||||||||||||
|
Income tax windfall/(shortfall) on equity-based compensation
|
(74 | ) | - | - | - | - | (74 | ) | - | - | - | |||||||||||||||||||||||||||||
|
Distributions to noncontrolling unitholders
|
(21,976 | ) | - | - | - | - | (10,570 | ) | - | - | (11,406 | ) | ||||||||||||||||||||||||||||
|
Change in ownership interests between periods
|
- | - | - | - | - | 79,605 | (9 | ) | - | (79,596 | ) | |||||||||||||||||||||||||||||
|
Change in deferred tax asset associated with stockholders' equity
|
53,734 | - | - | - | - | 53,804 | - | - | (70 | ) | ||||||||||||||||||||||||||||||
|
Dividends on Class A common stock
|
(3,732 | ) | - | - | - | - | - | - | (3,732 | ) | - | |||||||||||||||||||||||||||||
|
Balance as of December 31, 2009
|
$ | 313,757 | 27,290 | $ | 273 | 12,974 | $ | 1 | $ | 207,210 | $ | 693 | $ | 6,709 | $ | 98,871 | ||||||||||||||||||||||||
See accompanying notes to the consolidated financial statements.
F-9
Duff & Phelps Corporation and Subsidiaries
Consolidated Statement of Stockholders’ Equity
and Comprehensive Income – Continued
(In thousands)
|
Stockholders of Duff & Phelps Corporation
|
||||||||||||||||||||||||||||||||||||||||
|
Accumulated
|
Retained
|
|||||||||||||||||||||||||||||||||||||||
|
Total
|
Other
|
Earnings/
|
||||||||||||||||||||||||||||||||||||||
|
Stockholders'
|
Comprehensive
|
Common Stock - Class A
|
Common Stock - Class B
|
Additional
|
Comprehensive
|
(Accumulated
|
Noncontrolling
|
|||||||||||||||||||||||||||||||||
|
Equity
|
Income
|
Shares
|
Dollars
|
Shares
|
Dollars
|
Paid-in Capital
|
Income
|
Deficit)
|
Interest
|
|||||||||||||||||||||||||||||||
|
Balance as of December 31, 2007
|
$ | 181,483 | 13,125 | $ | 131 | 21,090 | $ | 2 | $ | 75,589 | $ | 134 | $ | (6,352 | ) | $ | 111,979 | |||||||||||||||||||||||
|
Net income for the year ended December 31, 2008
|
24,293 | $ | 24,293 | - | - | - | - | - | - | 5,225 | 19,068 | |||||||||||||||||||||||||||||
|
Currency translation adjustment
|
(262 | ) | (262 | ) | - | - | - | - | - | (111 | ) | - | (151 | ) | ||||||||||||||||||||||||||
|
Amortization of post-retirement benefits
|
209 | 209 | - | - | - | - | - | 86 | - | 123 | ||||||||||||||||||||||||||||||
|
Total comprehensive income/(loss)
|
24,240 | $ | 24,240 | - | - | - | - | - | (25 | ) | 5,225 | 19,040 | ||||||||||||||||||||||||||||
|
Issuance of common stock
|
5,443 | 322 | 3 | - | - | 2,221 | - | - | 3,219 | |||||||||||||||||||||||||||||||
|
Conversion of New Class A Units
|
- | 69 | - | (69 | ) | - | - | - | - | - | ||||||||||||||||||||||||||||||
|
Issuance of restricted stock awards
|
13 | 1,226 | 13 | - | - | - | - | - | - | |||||||||||||||||||||||||||||||
|
Exercise of stock options
|
255 | 16 | - | - | - | 255 | - | - | - | |||||||||||||||||||||||||||||||
|
Forfeitures
|
- | (39 | ) | - | (132 | ) | - | - | - | - | - | |||||||||||||||||||||||||||||
|
Equity-based compensation
|
30,725 | - | - | - | - | 12,671 | - | - | 18,054 | |||||||||||||||||||||||||||||||
|
Income tax windfall on equity-based compensation
|
131 | - | - | - | - | 131 | - | - | - | |||||||||||||||||||||||||||||||
|
Distributions to noncontrolling unitholders
|
(9,752 | ) | - | - | - | - | (597 | ) | - | - | (9,155 | ) | ||||||||||||||||||||||||||||
|
Change in ownership interests between periods
|
- | - | - | - | - | 5,843 | 13 | - | (5,856 | ) | ||||||||||||||||||||||||||||||
|
Adjustment to due to noncontrolling unitholders
|
5,982 | - | - | - | - | 5,982 | - | - | - | |||||||||||||||||||||||||||||||
|
Deferred tax asset effective tax rate conversion
|
(889 | ) | - | - | - | - | (889 | ) | - | - | - | |||||||||||||||||||||||||||||
|
Other
|
128 | - | - | - | - | (221 | ) | - | - | 349 | ||||||||||||||||||||||||||||||
|
Balance as of December 31, 2008
|
$ | 237,759 | 14,719 | $ | 147 | 20,889 | $ | 2 | $ | 100,985 | $ | 122 | $ | (1,127 | ) | $ | 137,630 | |||||||||||||||||||||||
See accompanying notes to the consolidated financial statements.
F-10
DUFF & PHELPS CORPORATION AND SUBSIDIARIES
NOTES TO THE CONSOLIDATED FINANCIAL STATEMENTS
(In thousands, except per share amounts)
|
Note 1.
|
Organization and Nature of the Company
|
Duff & Phelps Corporation (the “Company”), a Delaware corporation, is a leading provider of independent financial advisory and investment banking services. Its mission is to help its clients protect, maximize and recover value by providing independent advice on issues involving highly technical and complex assessments in the areas of valuation, transactions, financial restructuring, disputes and taxation. The Company believes that the Duff & Phelps brand is associated with experienced professionals who give trusted guidance in a responsive manner. The Company serves a global client base through offices in 24 cities, comprised of offices in 17 U.S. cities,
including New York, Chicago, Dallas and Los Angeles, and seven international offices located in Amsterdam, London, Munich, Paris, Shanghai, Tokyo and Toronto.
The Company was incorporated on April 23, 2007 as a holding company for the purpose of facilitating an initial public offering (“IPO”) of the Company’s common equity and to become the sole managing member of Duff & Phelps Acquisitions, LLC and its subsidiaries (“D&P Acquisitions”). D&P Acquisitions represented the predecessor entity prior to the Company’s IPO and currently represents the operating subsidiaries of the Company.
The Company has sole voting power in and controls the management of D&P Acquisitions. As a result, the Company consolidates the financial results of D&P Acquisitions and records noncontrolling interest for the economic interest in D&P Acquisitions held by the existing unitholders to the extent the book value of their interest in D&P Acquisitions is greater than zero. The Company’s economic interest in D&P Acquisitions totaled 73.0% at December 31, 2010. Net income attributable to the noncontrolling interest on the statement of operations represents the portion of earnings or loss attributable to the economic interest in D&P Acquisitions held by the
noncontrolling unitholders. Noncontrolling interest on the balance sheet represents the portion of net assets of D&P Acquisitions attributable to the noncontrolling unitholders based on the portion of total units of D&P Acquisitions owned by such unitholders (“New Class A Units”).
|
Summary of Significant Accounting Policies
|
Principles of Consolidation
The consolidated financial statements have been prepared in accordance with accounting principles generally accepted in the United States (“GAAP”) and include the accounts of the Company, its controlled subsidiaries and other entities consolidated as required by GAAP.
Use of Estimates
The preparation of financial statements in conformity with GAAP requires management to make estimates and assumptions that affect amounts of assets and liabilities and disclosures of contingent assets and liabilities as of the date of the financial statements and reported amounts of revenues and expenses during the periods presented. Actual results could differ from these estimates. Estimates and assumptions are reviewed periodically and the effects of revisions are reflected in the consolidated financial statements in the period they are deemed to be necessary. Significant estimates made in the accompanying consolidated financial statements include, but are not limited to the
following:
|
|
·
|
proportional performance under client engagements for the purpose of determining revenue recognition,
|
|
|
·
|
accounts receivable and unbilled services valuation,
|
|
|
·
|
incentive compensation and other accrued benefits,
|
|
|
·
|
useful lives of intangible assets,
|
|
|
·
|
the carrying value of goodwill and intangible assets,
|
|
|
·
|
amounts due to noncontrolling unitholders,
|
|
|
·
|
reserves for estimated tax liabilities,
|
|
|
·
|
contingent liabilities,
|
|
|
·
|
certain estimates and assumptions used in the allocation of revenues and expenses for our segment reporting, and
|
|
|
·
|
certain estimates and assumptions used in the calculation of the fair value of equity compensation issued to employees.
|
F-11
DUFF & PHELPS CORPORATION AND SUBSIDIARIES
NOTES TO THE CONSOLIDATED FINANCIAL STATEMENTS
(In thousands, except per share amounts)
The Company is subject to uncertainties, such as the impact of future events, economic, environmental and political factors, and changes in the business climate; therefore, actual results may differ from those estimates. When no estimate in a given range is deemed to be better than any other when estimating contingent liabilities, the low end of the range is accrued. Accordingly, the accounting estimates used in the preparation of the Company's consolidated financial statements will change as new events occur, as more experience is acquired, as additional information is obtained and as the Company's operating environment changes. Changes in estimates are made when circumstances
warrant. Such changes and refinements in estimation methodologies are reflected in reported results of operations; if material, the effects of changes in estimates are disclosed in the notes to the consolidated financial statements.
Revenue Recognition
The Company recognizes revenues in accordance with Financial Accounting Standards Board (“FASB”) Accounting Standards Codification (“ASC”) 605, Revenue Recognition. Revenue is recognized when persuasive evidence of an arrangement exists, the related services are provided, the price is fixed or determinable and collectability is reasonably assured.
Revenues are primarily generated from financial advisory, corporate finance consulting and investment banking services. The Company typically enters into these engagements on a time-and-materials basis, a fixed-fee basis or a contingent-fee basis. Revenues from time-and-materials engagements are recognized as the hours are incurred by the Company's professionals.
Revenues from fixed-fee engagements are recognized as the services are provided under a proportional performance method. The nature of services typically provided under fixed-fee engagements include (but are not limited to) purchase price allocations, goodwill and intangible asset impairment, international business combinations, option valuations, transfer pricing and litigation support services. Revenues for engagements under a proportional performance method are recognized based on estimates of work completed versus the total services to be provided under the engagement. Estimates of work completed are based on the level of services or billable hours provided by each member of the
engagement team during the period relative to the estimated total level of effort or total billable hours required to perform the engagement. These estimates are continually monitored during the term of the contract and if appropriate are amended as the contract progresses.
Revenue recognition is affected by a number of factors that change the estimated amount of work required to complete the project such as changes in scope, the staffing on the engagement and the level of client participation. Periodic engagement reviews require the Company to make judgments and estimates regarding the overall profitability and stage of project completion, which, in turn, affect how the Company recognizes revenue.
Losses, if any, on fixed-fee engagements are recognized in the period in which the loss becomes probable and reasonably estimated.
In the absence of clear and reliable output measures, the Company believes that our method of recognizing service revenues, for contracts with fixed fees, based on hours of service provided represents an appropriate surrogate for output measures. The Company determined that an input-based approach was most appropriate because the input measures are deemed to be a reasonable substitute for output measures based on the performance of our obligations to the customer, and due to the fact that an input-based approach would not vary significantly from an output measure approach. The Company believes this methodology provides a reliable measure of the revenue from the advisory services the Company
provides to our customers under fixed-fee engagements given the nature of the consulting services the Company provide and the following additional considerations:
|
|
§
|
the Company is a specialty consulting firm;
|
|
|
§
|
the Company’s engagements do not typically have specific interim deliverables or milestones;
|
|
|
§
|
the customer receives the benefit of the Company’s services throughout the contract term;
|
|
|
§
|
the customer is obligated to pay for services rendered even if a final deliverable is not produced, typically based on the proportional hours performed to date;
|
|
|
§
|
the Company does not incur setup costs; and
|
|
|
§
|
the Company expenses contract fulfillment costs, which are primarily compensation costs, as incurred.
|
F-12
DUFF & PHELPS CORPORATION AND SUBSIDIARIES
NOTES TO THE CONSOLIDATED FINANCIAL STATEMENTS
(In thousands, except per share amounts)
The Company recognizes revenue over the period that the services are provided in proportion to the delivery of services as measured by billable hours as this reflects the pattern in which obligations to the customer are filled and by which the customer receives the benefit of the service. Revenue is not recognized on a straight-line basis or upon completion as this is not reflective of the manner in which services are provided.
The Company has engagements for which the revenues are contingent on successful completion of the project. Any contingent revenue on these contracts is not recognized until the contingency is resolved and payment is reasonably assured. Retainer fees under these arrangements are deferred and recognized ratably over the period in which the related service is rendered. Revenues from restructuring engagements that are performed with respect to cases in bankruptcy court are typically recognized in the month in which the services are performed unless there are objections and/or holdbacks mandated by court instructions. Costs related to these engagements are expensed as
incurred.
Revenues for contracts with multiple elements are allocated based on the element's fair value. Fair value is determined based on the prices charged when each element is sold separately. Revenues are recognized in accordance with our accounting policies for the elements. Elements qualify for separation when the services have value on a stand-alone basis and fair value of the separate element exists. While determining fair value and identifying separate elements requires judgment, generally fair value and the separate elements are readily identifiable as the Company sells those elements individually outside of a multiple services engagement. Contracts with
multiple elements are generally fixed-fee or time-and-materials engagements. Contracts are typically terminable by either party upon sufficient notification and do not include provisions for refunds relating to services provided.
Differences between the timing of billings and the recognition of revenue are recognized as either unbilled services or deferred revenue in the accompanying Consolidated Balance Sheets. Revenues recognized for services performed but not yet billed to clients have been recorded as unbilled services. Client prepayments and retainers are classified as deferred revenue and recognized as earned or ratably over the service period.
Reimbursable expenses, including those relating to travel, other out-of-pocket expenses and any third-party costs, are included as a component of revenues. Expense reimbursements that are billable to clients are included in total revenues, and typically an equivalent amount of reimbursable expenses are included in total direct client service costs. Reimbursable expenses related to time and materials and fixed-fee engagements are recognized as revenue in the period in which the expense is incurred and collectability is reasonably assured. Taxes collected from customers and remitted to governmental authorities are presented in the income statement on a net basis.
Accounts Receivable and Allowance for Doubtful Accounts
Accounts receivable are recorded at face amounts less an allowance for doubtful accounts. On a periodic basis, the Company evaluates its accounts receivable and establishes the allowance for doubtful accounts by calculating and recording a specified percentage of the individual open receivable balances. Specific allowances are also recorded based on historical experience, analysis of past due accounts, client creditworthiness and other current available information.
The provision for doubtful accounts is recorded as a reduction in revenue to the extent the provision relates to fee adjustments and other discretionary pricing adjustments. To the extent the provision relates to a client's inability to make required payments on accounts receivables, the provision is recorded in operating expenses.
Concentration of Credit Risk
Financial instruments that potentially subject the Company to concentration of credit risk consist primarily of receivables from clients. The Company performs ongoing credit evaluations of its major customers and maintains allowances for potential credit losses. No single client balance is considered large enough to pose a significant credit risk. No single client accounted for more than 1.7% of total revenues in 2010, 2009 or 2008, except for one client that accounted for 2.4% and 8.1% of revenues in 2010 and 2009, respectively. This client resulted from an engagement to serve as a financial advisor to the court appointed examiner of a large financial services company
under bankruptcy protection.
F-13
DUFF & PHELPS CORPORATION AND SUBSIDIARIES
NOTES TO THE CONSOLIDATED FINANCIAL STATEMENTS
(In thousands, except per share amounts)
Bad debt expense is summarized as follows:
|
Year Ended
|
||||||||||||
|
December 31,
|
December 31,
|
December 31,
|
||||||||||
|
2010
|
2009
|
2008
|
||||||||||
|
Bad debt expense
|
$ | 2,074 | $ | 2,386 | $ | 1,604 | ||||||
The Company has international operations in North America, Europe and Asia. The Company has not entered into any transactions to hedge its exposure to these foreign exchange fluctuations through the use of derivative instruments or otherwise. An appreciation or depreciation of any of these currencies relative to the U.S. dollar would result in an adverse or beneficial impact to the Company’s financial results. Historically, the value of these foreign currencies has fluctuated relative to the U.S. dollar. The net impact of the fluctuation of foreign currencies recorded in Accumulated Other Comprehensive Income is summarized on the Consolidated Statements of
Stockholders’ Equity.
Cash and Cash Equivalents
The Company considers all highly liquid investments with original maturities of three months or less to be cash equivalents. Cash and cash equivalents are primarily held in operating accounts at major financial institutions and also in money market mutual funds, in which the Company is exposed to market and credit risk.
Property and Equipment
Property and equipment are recorded at cost, less accumulated depreciation. Property and equipment are depreciated using the straight-line method based upon the following estimated useful lives: leasehold improvements – over the lesser of the estimated useful life of the asset or the remaining life of the lease; equipment and furniture – two to ten years; and software, computers and related equipment – two to five years.
Goodwill and Other Intangible Assets
Goodwill represents the excess of purchase price and related acquisition costs over the value assigned to the net tangible and identifiable intangible assets of businesses acquired. Under the provisions of FASB ASC 350-20, Intangibles–Goodwill and Other, goodwill is required to be tested for impairment on an annual basis and between annual tests whenever indications of impairment exist. Impairment exists when the carrying amount of goodwill exceeds its implied fair value, resulting in an impairment charge for this excess. Goodwill is tested for impairment annually, or more often when certain events or circumstances
indicate impairment may exist.
The Company evaluates goodwill for impairment using a two-step impairment test approach at the reporting unit level. In the first step, the fair value for each of the Company's three reporting units is compared to its book value, including goodwill. If the fair value of the reporting unit is less than the book value, a second step is performed that compares the implied fair value of the reporting unit's goodwill to the book value of the goodwill. The fair value for the goodwill is determined based on the difference between the fair values of each of the three reporting units and the net fair values of the identifiable assets and liabilities of such reporting units. If the fair value
of the goodwill is less than the book value, the difference is recognized as impairment. The Company has concluded that there has been no impairment of goodwill for each period presented.
The Company evaluates the remaining useful lives of intangible assets not being amortized each year to determine whether events or circumstances continue to support an indefinite useful life. There have been no changes in useful lives of indefinite-lived intangible assets for each period presented.
Acquisition Accounting
For business combinations for which the acquisition date is on or before January 1, 2009, the Company utilized the purchase method of accounting in accordance with FASB Statement No. 141, Business Combinations. For business combinations for which the acquisition date is on or after January 1, 2009, the Company will utilize the purchase method of accounting in accordance with FASB ASC 805, Business Combinations. These standards require that the total cost of an
acquisition be allocated to the tangible and intangible assets acquired and liabilities assumed based upon their respective fair values at the date of acquisition. The allocation of the purchase price is dependent upon certain valuations.
F-14
DUFF & PHELPS CORPORATION AND SUBSIDIARIES
NOTES TO THE CONSOLIDATED FINANCIAL STATEMENTS
(In thousands, except per share amounts)
Impairment of Long-Lived Assets
The Company evaluates long-lived assets, including amortizable identifiable intangible assets, for impairment whenever events or changes in circumstances indicate that the carrying amount of an asset may not be recoverable. Upon such an occurrence, recoverability of assets to be held and used is measured by comparing the carrying amount of an asset to forecasted undiscounted net cash flows expected to be generated by the asset. If the carrying amount of the asset exceeds its estimated future cash flows, an impairment charge is recognized by the amount by which the carrying amount of the asset exceeds the fair value of the asset. For long-lived assets held for sale, assets are written down to
fair value, less cost to sell. Fair value is determined based on discounted cash flows, appraised values or management's estimates, depending upon the nature of the assets.
Fair Value of Financial Instruments
The Company's financial instruments consist of cash and cash equivalents, investments and liabilities related to the deferred compensation plan, accounts receivable, accounts payable, accrued expenses, debt and other liabilities. The fair value of these instruments approximated their carrying value at December 31, 2010 and 2009.
Foreign Currency Translation
The Company's foreign operations use their local currency as their functional currency. Financial statements of foreign subsidiaries are translated into U.S. dollars using period-end exchange rates for assets and liabilities and weighted average exchange rates for revenues and expenses. Adjustments resulting from translating net assets are reported as a separate component of accumulated other comprehensive income or loss within unitholders' and stockholders’ equity under the caption currency translation adjustment. Gains or losses resulting from foreign currency transactions are included in selling, general and administrative expense in the consolidated statements of
operations. Transaction gains and losses are not material.
Other Comprehensive Income
Comprehensive income is a measure of income which includes both net income and other comprehensive income or loss. Other comprehensive income or loss results from items deferred from recognition into the statement of operations. Accumulated other comprehensive income is separately presented on the Company's consolidated balance sheet as part of stockholders’ equity.
Accounting for Equity-Based Compensation
The Company accounts for equity-based compensation in accordance with the provisions of FASB ASC 718, Compensation–Stock Compensation (“FASB ASC 718”). Equity-based compensation expense is based on fair value at the date of grant and is recognized over the requisite service period using the accelerated method of amortization for grants with graded vesting or using the straight-line method for grants with cliff vesting.
Income Taxes
The Company accounts for income taxes under the asset and liability method prescribed by FASB ASC 740, Income Taxes (“FASB ASC 740”). Deferred tax assets and liabilities are recognized for the future tax consequences attributable to differences between the financial statement carrying amounts of existing assets and liabilities and their respective tax bases. Management periodically assesses the recoverability of its deferred tax assets based upon expected future earnings, future deductibility of the asset, and changes in applicable tax laws and other factors. If management determines that it is not probable that the
deferred tax asset will be fully recoverable in the future, a valuation allowance may be established for the difference between the asset balance and the amount expected to be recoverable in the future. The allowance will result in a charge to the Company’s consolidated statements of operations. Further, the Company records its income taxes receivable and payable based upon its estimated income tax liability.
F-15
DUFF & PHELPS CORPORATION AND SUBSIDIARIES
NOTES TO THE CONSOLIDATED FINANCIAL STATEMENTS
(In thousands, except per share amounts)
D&P Acquisitions complies with the requirements of the Internal Revenue Code that are applicable to limited liability companies (“LLCs”) that have elected to be treated as partnerships, which allow for the complete pass-through of taxable income or losses to D&P Acquisitions’ unitholders, who are individually responsible for any federal tax consequences. Therefore, no federal tax provision is required in the D&P Acquisitions’ consolidated financial statements in the periods prior to October 3, 2007. D&P Acquisitions is subject to certain state and local taxes, and its international subsidiaries are subject to tax in their jurisdictions.
To account for uncertainties in income tax positions, the Company prescribes a recognition threshold and measurement attribute for financial statement recognition and measurement of a tax position taken or expected to be taken in a tax return. The Company recognizes interest income and expense related to income taxes as a component of interest expense and penalties as a component of selling, general and administrative expenses.
Leases
The Company leases office facilities under non-cancelable operating leases that include fixed or minimum payments plus, in some cases, scheduled base rent increases over the terms of the lease. Certain leases provide for monthly payment of real estate taxes, insurance and other operating expenses applicable to the property. The Company has various leases that grant a free rent period and entitle the Company to a lease incentive. Rent expense is reflected in the consolidated financial statements on a straight-line basis over the term of the leases. In addition to office leases, the Company leases a nominal amount of equipment under operating leases.
Derivative Instruments
The Company accounts for its derivative instruments in accordance with FASB ASC 815, Derivative and Hedging, which establishes accounting and reporting standards for derivative instruments as either assets or liabilities in the statement of financial position based on their fair values. Changes in the fair values are reported in earnings or other comprehensive income depending on the use of the derivative and whether it qualifies for hedge accounting. Derivative instruments are designated and accounted for as either a hedge of a recognized asset or liability (fair value hedge) or a hedge of a forecasted transaction (cash flow hedge). For derivatives designated
as effective cash flow hedges, changes in fair values are recognized in other comprehensive income. Changes in fair values related to fair value hedges as well as the ineffective portion of cash flow hedges are recognized in earnings. Changes in the fair value of the underlying hedged item of a fair value hedge are also recognized in earnings. The Company neither holds nor issues derivative financial instruments for trading purposes.
Dividends
The Company began paying quarterly cash dividends to holders of record of our Class A common stock on June 12, 2009. In 2010, the Company paid quarterly cash dividends of $0.05 per share of our Class A common stock to holders of record on March 16, 2010 and $0.06 per share on May 18, 2010, August 17, 2010 and November 23, 2010. Concurrently with the payment of per share dividends on its Class A common stock, the Company distributed an equal amount per unit to holders of New Class A Units (as defined in Note 3). Future cash dividends and distributions, if any, are at the discretion of the board of directors and can be changed or discontinued at any time. Dividend
determinations (including the size of our quarterly dividend) are dependent upon, among other things, the Company’s future operations and earnings, capital requirements and surplus, general financial condition, contractual restrictions and other factors as the board of directors may deem relevant.
Repurchases of Class A Common Stock
In conjunction with repurchases of Class A common stock, repurchased shares are retired and recorded as a reduction to additional paid-in capital.
F-16
DUFF & PHELPS CORPORATION AND SUBSIDIARIES
NOTES TO THE CONSOLIDATED FINANCIAL STATEMENTS
(In thousands, except per share amounts)
Segment Reporting
The Company provides services through three segments: Financial Advisory, Corporate Finance Consulting and Investment Banking. The Company generally defines its segments by the nature of their services and how the business is managed and resources are allocated. The Financial Advisory segment provides services related to its Valuation Advisory, Tax Services, and Dispute & Legal Management Consulting business units; the revenue model associated with this segment is generally based on time and materials. The Corporate Finance Consulting segment provides services related to the Portfolio Valuation, Financial Engineering, Strategic Value Advisory and Due Diligence business
units; the revenue model associated with this segment is generally based on time and materials. The Investment Banking segment provides services related to its Global Restructuring Advisory, Transaction Opinions, and Merger & Acquisition Advisory business units; the revenue model associated with this segment is generally based on fixed retainers, fixed fees and contingent fees upon the successful completion of a transaction.
Recent Accounting Pronouncements
In October 2009, the FASB issued Accounting Standards Update (“ASU”) No. 2009-13, Multiple-Deliverable Revenue Arrangements. ASU 2009-13 supersedes certain guidance in FASB ASC 605-25, Revenue Recognition–Multiple-Element Arrangements and requires an entity to allocate arrangement consideration at the inception of an arrangement to all of its deliverables based on their relative selling prices (the relative-selling-price method). ASU 2009-13 eliminates the use of the residual method of allocation in which the undelivered element is measured at its estimated selling price and the
delivered element is measured as the residual of the arrangement consideration, and requires the relative-selling-price method in all circumstances in which an entity recognizes revenue for an arrangement with multiple deliverable subject to ASU 2009-13. ASU 2009-13 must be adopted no later than the beginning of the first fiscal year beginning on or after June 15, 2010, with early adoption permitted through either prospective application for revenue arrangements entered into, or materially modified, after the effective date or through retrospective application to all revenue arrangements for all periods presented. The Company does not anticipate that the adoption of ASU 2009-13 will have a material effect on its consolidated financial statements.
F-17
DUFF & PHELPS CORPORATION AND SUBSIDIARIES
NOTES TO THE CONSOLIDATED FINANCIAL STATEMENTS
(In thousands, except per share amounts)
|
Note 3.
|
NONCONTROLLING INTEREST
|
D&P Acquisitions represented the predecessor entity prior to the Company’s IPO and currently represents the operating subsidiaries of the Company. Immediately prior to the closing of the IPO on October 3, 2007, D&P Acquisitions effectuated certain transactions intended to simplify the capital structure of D&P Acquisitions (the “Recapitalization Transactions”).
Prior to the Recapitalization Transactions, D&P Acquisitions' capital structure consisted of seven different classes of membership interests (collectively, “Legacy Units”), each of which had different capital accounts and amounts of aggregate distributions above which its holders share in future distributions. Certain units were issued in conjunction with acquisitions and as long-term incentive compensation to management and independent members of the board of directors. The net effect of the Recapitalization Transactions was to convert the Legacy Units into a single new class of units called “New Class A Units.” The holders of New Class A Units also own
one share of the Company’s Class B common stock for each New Class A Unit.
The Company has sole voting power in and controls the management of D&P Acquisitions. As a result, the Company consolidates the financial results of D&P Acquisitions and records noncontrolling interest for the economic interest in D&P Acquisitions held by the existing unitholders to the extent the book value of their interest in D&P Acquisitions is greater than zero. The Company’s economic interest in D&P Acquisitions totaled 73.0% at December 31, 2010. The noncontrolling unitholders’ interest in D&P Acquisitions totaled 27.0% at December 31, 2010.
Net income attributable to the noncontrolling interest on the statement of operations represents the portion of earnings or loss attributable to the economic interest in D&P Acquisitions held by the noncontrolling unitholders. Noncontrolling interest on the balance sheet represents the portion of net assets of D&P Acquisitions attributable to the noncontrolling unitholders based on the portion of total units of D&P Acquisitions owned by such unitholders (“New Class A Units”). The ownership of the New Class A Units is summarized as follows:
|
Duff &
|
Non-
|
|||||||||||
|
Phelps
|
controlling
|
|||||||||||
|
Corporation
|
Unitholders
|
Total
|
||||||||||
|
December 31, 2007
|
13,125 | 21,090 | 34,215 | |||||||||
|
Issuance of Class A common stock for acquisitions
|
322 | - | 322 | |||||||||
|
Exchange to Class A common stock
|
69 | (69 | ) | - | ||||||||
|
Issuance for exercises of IPO Options
|
16 | - | 16 | |||||||||
|
Net issuance of restricted stock awards
|
1,226 | - | 1,226 | |||||||||
|
Forfeitures
|
(39 | ) | (132 | ) | (171 | ) | ||||||
|
December 31, 2008
|
14,719 | 20,889 | 35,608 | |||||||||
|
Sale of Class A common stock
|
10,550 | - | 10,550 | |||||||||
|
Issuance of Class A common stock for acquisitions
|
10 | - | 10 | |||||||||
|
Redemption of New Class A Units
|
- | (7,050 | ) | (7,050 | ) | |||||||
|
Exchange to Class A common stock
|
770 | (770 | ) | - | ||||||||
|
Issuance for exercises of IPO Options
|
72 | - | 72 | |||||||||
|
Net issuance of restricted stock awards
|
1,318 | - | 1,318 | |||||||||
|
Forfeitures
|
(149 | ) | (95 | ) | (244 | ) | ||||||
|
December 31, 2009
|
27,290 | 12,974 | 40,264 | |||||||||
|
Issuance of Class A common stock for acquisitions
|
176 | - | 176 | |||||||||
|
Exchange to Class A common stock
|
1,788 | (1,788 | ) | - | ||||||||
|
Net issuance of restricted stock awards
|
1,596 | - | 1,596 | |||||||||
|
Issuance for exercises of IPO Options
|
18 | - | 18 | |||||||||
|
Repurchases of Class A common stock pursuant to publicly announced program
|
(451 | ) | - | (451 | ) | |||||||
|
Forfeitures
|
(251 | ) | (35 | ) | (286 | ) | ||||||
|
December 31, 2010
|
30,166 | 11,151 | 41,317 | |||||||||
|
Percent of total
|
||||||||||||
|
December 31, 2008
|
41.3 | % | 58.7 | % | 100 | % | ||||||
|
December 31, 2009
|
67.8 | % | 32.2 | % | 100 | % | ||||||
|
December 31, 2010
|
73.0 | % | 27.0 | % | 100 | % | ||||||
F-18
DUFF & PHELPS CORPORATION AND SUBSIDIARIES
NOTES TO THE CONSOLIDATED FINANCIAL STATEMENTS
(In thousands, except per share amounts)
A reconciliation from “Income before income taxes” to “Net income attributable to the noncontrolling interest” and “Net income attributable to Duff & Phelps Corporation” is detailed as follows:
|
Year Ended
|
||||||||||||
|
December 31,
|
December 31,
|
December 31,
|
||||||||||
|
2010
|
2009
|
2008
|
||||||||||
|
Income before income taxes
|
$ | 42,849 | $ | 40,932 | $ | 34,912 | ||||||
|
Less: provision for income taxes for entities other than Duff & Phelps Corporation(a)(b)
|
(2,066 | ) | (1,904 | ) | (2,247 | ) | ||||||
|
Income before income taxes, as adjusted
|
40,783 | 39,028 | 32,665 | |||||||||
|
Ownership percentage of noncontrolling interest(d)
|
30.8 | % | 43.8 | % | 58.4 | % | ||||||
|
Net income attributable to noncontrolling interest
|
12,581 | 17,100 | 19,068 | |||||||||
|
Income before income taxes, as adjusted, attributable to Duff & Phelps Corporation
|
28,202 | 21,928 | 13,597 | |||||||||
|
Less: provision for income taxes of Duff & Phelps Corporation(a)(c)
|
(11,437 | ) | (10,360 | ) | (8,372 | ) | ||||||
|
Net income attributable to Duff & Phelps Corporation
|
$ | 16,765 | $ | 11,568 | $ | 5,225 | ||||||
|
(a)
|
The consolidated provision for income taxes is equal to the sum of (i) the provision for income taxes for entities other than Duff & Phelps Corporation and (ii) the provision for income taxes of Duff & Phelps Corporation. The consolidated provision for income taxes totaled $13,503, $12,264 and $10,619 for the years ended December 31, 2010, 2009 and 2008, respectively.
|
|
(b)
|
The provision for income taxes for entities other than Duff & Phelps Corporation represents taxes imposed directly on Duff & Phelps, LLC, a wholly-owned subsidiary of D&P Acquisitions, and its subsidiaries, such as taxes imposed on certain domestic subsidiaries (e.g., Rash & Associates), taxes imposed by certain foreign jurisdictions, and taxes imposed by certain local and other jurisdictions (e.g., New York City). Since Duff & Phelps, LLC is taxed as a partnership and a flow-through entity for U.S. federal and state income tax purposes, there is no provision for these taxes
on income allocable to the noncontrolling interest.
|
|
(c)
|
The provision of income taxes of Duff & Phelps Corporation includes all U.S. federal and state income taxes.
|
|
(d)
|
Income before income taxes, as adjusted, is allocated to the noncontrolling interest based on the total New Class A Units vested for income tax purposes (“Tax-Vested Units”) owned by the noncontrolling interest as a percentage of the aggregate amount of all Tax-Vested Units. This percentage may not necessarily correspond to the total number of New Class A Units at the end of each respective period.
|
Distributions and Other Payments to Noncontrolling Unitholders
The following table summarizes distributions and other payments to noncontrolling unitholders, as described more fully below:
|
Year Ended
|
||||||||||||
|
December 31,
|
December 31,
|
December 31,
|
||||||||||
|
2010
|
2009
|
2008
|
||||||||||
|
Distributions for taxes
|
$ | 7,081 | $ | 20,097 | $ | 9,753 | ||||||
|
Other distributions
|
2,752 | 1,879 | - | |||||||||
|
Payments pursuant to the Tax Receivable Agreement
|
4,267 | 3,090 | 791 | |||||||||
| $ | 14,100 | $ | 25,066 | $ | 10,544 | |||||||
F-19
DUFF & PHELPS CORPORATION AND SUBSIDIARIES
NOTES TO THE CONSOLIDATED FINANCIAL STATEMENTS
(In thousands, except per share amounts)
Distributions for taxes
As a limited liability company, D&P Acquisitions does not incur significant federal or state and local taxes, as these taxes are primarily the obligations of the members of D&P Acquisitions. As authorized by the Third Amended and Restated LLC Agreement of D&P Acquisitions, D&P Acquisitions is required to distribute cash, generally, on a pro rata basis, to its members to the extent necessary to provide funds to pay the members' tax liabilities, if any, with respect to the earnings of D&P Acquisitions. The tax distribution rate has been set at 45% of each member’s allocable share of taxable income of D&P Acquisitions. D&P Acquisitions is only required
to make such distributions if cash is available for such purposes as determined by the Company. The Company expects cash will be available to make these distributions. Upon completion of its tax returns with respect to the prior year, D&P Acquisitions may make true-up distributions to its members, if cash is available for such purposes, with respect to actual taxable income for the prior year. The change in level of distributions for each member’s estimated tax liability between periods primarily resulted from the timing of quarterly payments.
Other distributions
During the year ended December 31, 2010, the Company distributed $2,752 to holders of New Class A Units, other than Duff & Phelps Corporation. Concurrent with the payment of the dividend to shareholders of record, holders of New Class A Units received a $0.05 distribution per vested unit on March 16, 2010 and a $0.06 distribution per vested unit on May 28, 2010, August 27, 2010 and December 3, 2010. These amounts totaled $2,590 and will be treated as a reduction in basis of each member’s ownership interests. Pursuant to the terms of the Third Amended and Restated LLC Agreement of D&P Acquisitions, a corresponding amount per unvested unit was deposited into a segregated
account and will be distributed once a year with respect to units that vested during that year. During the year ended December 31, 2010, the Company distributed $162 to members whose units vested during 2009 and accrued $276 to members whose units vested during 2010. This accrual was paid in January 2011. Any amounts related to unvested units that forfeit are returned to the Company.
Payments pursuant to the Tax Receivable Agreement
As a result of the Company’s acquisition of New Class A Units of D&P Acquisitions, the Company expects to benefit from depreciation and other tax deductions reflecting D&P Acquisitions' tax basis for its assets. Those deductions will be allocated to the Company and will be taken into account in reporting the Company’s taxable income. Further, as a result of a federal income tax election made by D&P Acquisitions applicable to a portion of the Company’s acquisition of New Class A Units of D&P Acquisitions, the income tax basis of the assets of D&P Acquisitions underlying a portion of the units the Company has and will acquire (pursuant to the exchange
agreement) will be adjusted based upon the amount that the Company has paid for that portion of its New Class A Units of D&P Acquisitions.
The Company has entered into a tax receivable agreement (“TRA”) with the existing unitholders of D&P Acquisitions (for the benefit of the existing unitholders of D&P Acquisitions) that provides for the payment by the Company to the unitholders of D&P Acquisitions of 85% of the amount of cash savings, if any, in U.S. federal, state and local income tax that the Company realizes (i) from the tax basis in its proportionate share of D&P Acquisitions' goodwill and similar intangible assets that the Company receives as a result of the exchanges and (ii) from the federal income tax election referred to above. D&P Acquisitions expects to make future payments under the TRA to the
extent cash is available for such purposes.
As of December 31, 2010, the Company recorded a liability of $109,525, representing the payments due to D&P Acquisitions’ unitholders under the TRA (see current and non-current portion of “Due to noncontrolling unitholders” on the Company’s Condensed Consolidated Balance Sheets).
Within the next 12 month period, the Company expects to pay $5,640 of the total amount. The basis for determining the current portion of the payments due to D&P Acquisitions’ unitholders under the TRA is the expected amount of payments to be made within the next 12 months. The long-term portion of the payments due to D&P Acquisitions’ unitholders under the tax receivable agreement is the remainder. Payments are anticipated to be made annually over 15 years, commencing from the date of each event that gives rise to the TRA benefits, beginning with the date of the closing of the IPO on October 3, 2007. The payments are made in accordance with the terms of the
TRA. The timing of the payments is subject to certain contingencies including Duff & Phelps Corporation having sufficient taxable income to utilize all of the tax benefits defined in the TRA.
F-20
DUFF & PHELPS CORPORATION AND SUBSIDIARIES
NOTES TO THE CONSOLIDATED FINANCIAL STATEMENTS
(In thousands, except per share amounts)
To determine the current amount of the payments due to D&P Acquisitions’ unitholders under the TRA, the Company estimated the amount of taxable income that Duff & Phelps Corporation has generated over the previous fiscal year. Next, the Company estimated the amount of the specified TRA deductions at year end. This was used as a basis for determining the amount of tax reduction that generates a TRA obligation. In turn, this was used to calculate the estimated payments due under the TRA that the Company expects to pay in the next 12 months. These calculations are performed pursuant to the terms of the TRA.
Obligations pursuant to the TRA are obligations of Duff & Phelps Corporation. They do not impact the noncontrolling interest. These obligations are not income tax obligations and have no impact on the tax provision or the allocation of taxes. Furthermore, the TRA has no impact on the allocation of the provision for income taxes to the Company’s net income. In general, items of income and expense are allocated on the basis of member’s ownership interests pursuant to the Third Amended and Restated Limited Liability Company Agreement of Duff & Phelps Acquisitions, LLC.
F-21
DUFF & PHELPS CORPORATION AND SUBSIDIARIES
NOTES TO THE CONSOLIDATED FINANCIAL STATEMENTS
(In thousands, except per share amounts)
|
Note 4.
|
Earnings per Share
|
Basic earnings per share (“EPS”) measures the performance of an entity over the reporting period. Diluted earnings per share measures the performance of an entity over the reporting period while giving effect to all potentially dilutive common shares that were outstanding during the period. The treasury stock method is used to determine the dilutive potential of stock options, restricted stock awards, restricted stock units, and D&P Acquisitions’ units and Class B common stock that are exchangeable into the Company’s Class A common stock.
In accordance with FASB ASC 260, Earnings Per Share, all outstanding unvested share-based payments that contain rights to non-forfeitable dividends participate in the undistributed earnings with the common stockholders and are therefore participating securities. Companies with participating securities are required to apply the two-class method in calculating basic and diluted net income per share.
Our restricted stock awards are considered participating securities as they receive non-forfeitable dividends at the same rate as our common stock. The computation of basic and diluted net income per share is reduced for a presumed hypothetical distribution of earnings to the holders of our unvested restricted stock. Accordingly, the effect of the allocation reduces earnings available for common stockholders.
The following is a reconciliation of the numerator and denominator used in the basic and diluted EPS calculations:
|
Year Ended
|
||||||||||||
|
December 31,
|
December 31,
|
December 31,
|
||||||||||
|
2010
|
2009
|
2008
|
||||||||||
|
Basic and diluted net income per share:
|
||||||||||||
|
Numerator
|
||||||||||||
|
Net income available to holders of Class A common stock
|
$ | 16,765 | $ | 11,568 | $ | 5,225 | ||||||
|
Earnings allocated to participating securities
|
(1,132 | ) | (803 | ) | (357 | ) | ||||||
|
Earnings available for common stockholders
|
$ | 15,633 | $ | 10,765 | $ | 4,868 | ||||||
|
Denominator for basic net income per share of Class A common stock
|
||||||||||||
|
Weighted average shares of Class A common stock
|
25,170 | 19,013 | 13,225 | |||||||||
|
Denominator for diluted net income per share of Class A common stock
|
||||||||||||
|
Weighted average shares of Class A common stock
|
25,170 | 19,013 | 13,225 | |||||||||
|
Add dilutive effect of the following:
|
||||||||||||
|
Restricted stock awards and units
|
919 | 782 | 276 | |||||||||
|
Assumed conversion of New Class A Units for Class A common stock(a)
|
- | - | - | |||||||||
|
Dilutive weighted average shares of Class A common stock
|
26,089 | 19,795 | 13,501 | |||||||||
|
Basic income per share of Class A common stock
|
$ | 0.62 | $ | 0.57 | $ | 0.37 | ||||||
|
Diluted income per share of Class A common stock
|
$ | 0.60 | $ | 0.54 | $ | 0.36 | ||||||
|
_________________________
|
||||||||||||
|
(a) The following shares were anti-dilutive and excluded from this calculation:
|
||||||||||||
|
Weighted average New Class A Units outstanding
|
12,703 | 17,543 | 20,845 | |||||||||
|
Weighted average IPO Options outstanding
|
1,742 | 1,909 | 2,039 | |||||||||
F-22
DUFF & PHELPS CORPORATION AND SUBSIDIARIES
NOTES TO THE CONSOLIDATED FINANCIAL STATEMENTS
(In thousands, except per share amounts)
Anti-dilution is the result of (i) the allocation of income or loss associated with the exchange of New Class A Units for Class A common stock and (ii) options listed above exceeding those outstanding under the treasury stock method.
Shares of Class B common stock do not share in the earnings of the Company and are therefore not participating securities. Accordingly, basic and diluted earnings per share of Class B common stock have not been presented.
F-23
DUFF & PHELPS CORPORATION AND SUBSIDIARIES
NOTES TO THE CONSOLIDATED FINANCIAL STATEMENTS
(In thousands, except per share amounts)
|
Note 5.
|
Fair Value Measurements
|
The following table presents assets and liabilities measured at fair value on a recurring basis as of December 31, 2010:
|
Quoted Prices
|
||||||||||||||||
|
in Active
|
Significant
|
|||||||||||||||
|
Markets for
|
Other
|
Significant
|
||||||||||||||
|
Identical
|
Observable
|
Unobservable
|
||||||||||||||
|
Assets
|
Inputs
|
Inputs
|
||||||||||||||
|
Description
|
(Level 1)
|
(Level 2)
|
(Level 3)
|
Total
|
||||||||||||
|
Investments held in conjunction with deferred compensation plan(1)
|
$ | - | $ | 23,151 | $ | - | $ | 23,151 | ||||||||
|
Total assets
|
$ | - | $ | 23,151 | $ | - | $ | 23,151 | ||||||||
|
Benefits payable in conjunction with deferred compensation plan(1)
|
$ | - | $ | 23,078 | $ | - | $ | 23,078 | ||||||||
|
Total liabilities
|
$ | - | $ | 23,078 | $ | - | $ | 23,078 | ||||||||
|
(1)
|
The investments held and benefits payable to participants in conjunction with the deferred compensation plan were primarily based on quoted prices for similar assets in active markets. Changes in the fair value of the investments are recognized as an increase or decrease in compensation expense. Changes in the fair value of the benefits payables to participants are recognized as a corresponding offset to compensation expense. The net impact of changes in fair value is not material. The deferred compensation plan is further discussed in Note 15.
|
The investments and benefits payable in conjunction with the deferred compensation plan were valued using the market approach. The Company does not have any material financial assets in a market that is not active.
|
Note 6.
|
Property and Equipment
|
Property and equipment consisted of the following:
|
December 31,
|
December 31,
|
|||||||
|
2010
|
2009
|
|||||||
|
Office furniture, computers and equipment
|
$ | 36,014 | $ | 31,401 | ||||
|
Leasehold improvements
|
19,611 | 16,633 | ||||||
|
Sub-total
|
55,625 | 48,034 | ||||||
|
Less: accumulated depreciation
|
(26,375 | ) | (20,621 | ) | ||||
|
Property and equipment, net
|
$ | 29,250 | $ | 27,413 | ||||
Depreciation of property and equipment is summarized as follows:
|
Year Ended
|
||||||||||||
|
December 31,
|
December 31,
|
December 31,
|
||||||||||
|
2010
|
2009
|
2008
|
||||||||||
|
Depreciation expense
|
$ | 6,156 | $ | 6,454 | $ | 5,771 | ||||||
F-24
DUFF & PHELPS CORPORATION AND SUBSIDIARIES
NOTES TO THE CONSOLIDATED FINANCIAL STATEMENTS
(In thousands, except per share amounts)
|
Note 7.
|
Goodwill and Intangible Assets
|
The following table summarizes the activity in goodwill by segment:
|
Corporate
|
||||||||||||||||
|
Financial
|
Finance
|
Investment
|
||||||||||||||
|
Advisory
|
Consulting
|
Banking
|
Total
|
|||||||||||||
|
Ending balance as of December 31, 2007
|
$ | 65,346 | $ | 15,723 | $ | 26,493 | $ | 107,562 | ||||||||
|
Additions due to acquisitions
|
||||||||||||||||
|
Chanin
|
- | - | - | - | ||||||||||||
|
Other
|
8,894 | - | - | 8,894 | ||||||||||||
|
Ending balance as of December 31, 2008
|
74,240 | 15,723 | 26,493 | 116,456 | ||||||||||||
|
Additions due to acquisitions
|
||||||||||||||||
|
Chanin
|
- | - | 5,063 | 5,063 | ||||||||||||
|
Other
|
1,357 | - | - | 1,357 | ||||||||||||
|
Ending balance as of December 31, 2009
|
75,597 | 15,723 | 31,556 | 122,876 | ||||||||||||
|
Additions due to acquisitions
|
||||||||||||||||
|
Chanin
|
- | - | - | - | ||||||||||||
|
Other
|
13,811 | 2,212 | - | 16,023 | ||||||||||||
|
Impact of foreign currency translation
|
271 | - | - | 271 | ||||||||||||
|
Ending balance as of December 31, 2010
|
$ | 89,679 | $ | 17,935 | $ | 31,556 | $ | 139,170 | ||||||||
The increase in goodwill during the year ended December 31, 2010 resulted from three acquisitions during the year and payment of contingent consideration that resulted from acquisitions in prior years.
The following tables summarize intangible assets:
|
December 31, 2010
|
||||||||||||
|
Gross
|
Accumulated
|
Net
|
||||||||||
|
Intangibles
|
Amortization
|
Intangibles
|
||||||||||
|
Customer lists
|
$ | 35,229 | $ | (11,435 | ) | $ | 23,794 | |||||
|
Trade names
|
2,657 | (2,657 | ) | - | ||||||||
|
Indefinite-lived trade names
|
3,120 | - | 3,120 | |||||||||
|
Non-compete
|
7,182 | (4,208 | ) | 2,974 | ||||||||
|
Software
|
2,875 | (2,356 | ) | 519 | ||||||||
|
Total intangible assets
|
$ | 51,063 | $ | (20,656 | ) | $ | 30,407 | |||||
|
December 31, 2009
|
||||||||||||
|
Gross
|
Accumulated
|
Net
|
||||||||||
|
Intangibles
|
Amortization
|
Intangibles
|
||||||||||
|
Customer lists
|
$ | 31,070 | $ | (8,798 | ) | $ | 22,272 | |||||
|
Trade names
|
2,882 | (2,642 | ) | 240 | ||||||||
|
Indefinite-lived trade names
|
3,120 | - | 3,120 | |||||||||
|
Non-compete
|
4,841 | (3,557 | ) | 1,284 | ||||||||
|
Software
|
2,875 | (1,884 | ) | 991 | ||||||||
|
Total intangible assets
|
$ | 44,788 | $ | (16,881 | ) | $ | 27,907 | |||||
Non-compete agreements are being amortized over an expected life of 18 months to five years. The remaining finite-lived trade names are being amortized over an expected life of two to 10 years. Customer lists are being amortized over an expected life of nine to 15 years. Software is being amortized over an expected life of five years.
F-25
DUFF & PHELPS CORPORATION AND SUBSIDIARIES
NOTES TO THE CONSOLIDATED FINANCIAL STATEMENTS
(In thousands, except per share amounts)
Amortization expense of intangible assets is summarized as follows:
|
Year Ended
|
||||||||||||
|
December 31,
|
December 31,
|
December 31,
|
||||||||||
|
2010
|
2009
|
2008
|
||||||||||
|
Amortization expense
|
$ | 3,760 | $ | 3,790 | $ | 4,045 | ||||||
|
|
Annual amortization expense for intangible assets over the next five years is summarized as follows:
|
|
Year Ending December 31,
|
||||
|
2011
|
$ | 4,067 | ||
|
2012
|
3,929 | |||
|
2013
|
3,516 | |||
|
2014
|
3,175 | |||
|
2015
|
2,683 | |||
|
Thereafter
|
9,917 | |||
During the year ended December 31, 2010, the Company incurred a onetime charge of $674 from the impairment of certain intangible assets that originated from its acquisition of World Tax Services US in July 2008. World Tax Service US operated as part of the Financial Advisory segment. The impairment resulted from the departure of the two managing directors who ran the practice and associated staff in March 2010.
F-26
DUFF & PHELPS CORPORATION AND SUBSIDIARIES
NOTES TO THE CONSOLIDATED FINANCIAL STATEMENTS
(In thousands, except per share amounts)
|
Note 8.
|
Long-Term Debt
|
On July 15, 2009, Duff & Phelps, LLC entered into a credit agreement with Bank of America, N.A., as administrative agent and the lenders from time to time party thereto ("Credit Agreement"), providing for a $30,000 senior secured revolving credit facility (“Credit Facility”), including a $10,000 sub-limit for the issuance of letters of credit. The proceeds of the facility are permitted to be used for working capital, permitted acquisitions and general corporate purposes. The maturity date is July 15, 2012 and amounts borrowed may be voluntarily prepaid at any time without penalty or premium, subject to customary breakage costs.
There were no amounts outstanding under the Credit Facility at December 31, 2010 or through the filing date of this Annual Report on Form 10-K. As of December 31, 2010, the Company had $4,109 of outstanding letters of credit of which $3,685 were issued against the Credit Facility. There was $424 of cash deposited into a restricted account to serve as deposits to secure the remaining letters of credit. These letters of credit were issued in connection with real estate leases.
Loans under the Credit Facility will, at the Company's option, bear interest on the principal amount outstanding at either (a) a rate equal to LIBOR, plus an applicable margin or (b) a base rate, plus an applicable margin. The applicable margin rate will be based on the Company's most recent consolidated leverage ratio and ranges from 1.75% to 2.50% per annum depending on the Company's consolidated leverage ratio. In addition, the Company is required to pay an unused commitment fee on the actual daily amount of the unutilized portion of the commitments of the lenders at a rate ranging from 0.25% to 0.50% per annum, based on the Company's most recent consolidated leverage ratio. Based
on the Company’s consolidated leverage ratio at December 31, 2010, the Company qualifies for the 1.75% applicable margin and 0.25% unused commitment fee.
The Credit Agreement contains customary representations and warranties and customary affirmative and negative covenants, including, among others, limitations on (a) the incurrence of liens, (b) the incurrence of indebtedness, (c) the ability to make dividends and distributions, as well as redeem and repurchase equity interests, and (d) acquisitions, mergers, consolidations and sales of assets. In addition, the Credit Agreement contains financial covenants that do not permit (a) a total leverage ratio of greater than 2.75 to 1.00 until the quarter ending September 30, 2010, and 2.50 to 1.00 thereafter and (b) a consolidated fixed charge coverage ratio of less than 2.00 to 1.00 until September 30, 2010, and
1.25 to 1.00 thereafter. The financial covenants are tested on the last day of each fiscal quarter based on the last four fiscal quarter periods. Management believes that the Company was in compliance with all of its covenants as of December 31, 2010. The Credit Agreement permits dividend payments or other distributions in the Company’s common stock or other equity interests subject to certain limitations.
The obligation of the Company to pay amounts outstanding under the Credit Facility may be accelerated upon the occurrence of an "Event of Default" as defined in the Credit Agreement. The Company's obligations under the Credit Agreement are guaranteed by D&P Acquisitions, and certain domestic subsidiaries of the Company (collectively, the "Guarantors"). The Credit Agreement is secured by a lien on substantially all of the personal property of the Company and each of the Guarantors.
|
Note 9.
|
Other Long-Term Liabilities
|
Other long-term liabilities consist of the following:
|
December 31,
|
December 31,
|
|||||||
|
2010
|
2009
|
|||||||
|
Deferred rent
|
$ | 14,393 | $ | 13,871 | ||||
|
Other
|
2,283 | 1,529 | ||||||
| $ | 16,676 | $ | 15,400 | |||||
F-27
DUFF & PHELPS CORPORATION AND SUBSIDIARIES
NOTES TO THE CONSOLIDATED FINANCIAL STATEMENTS
(In thousands, except per share amounts)
|
Note 10.
|
Equity-Based Compensation
|
|
|
Equity-based compensation with respect to (a) grants of units of D&P Acquisitions prior to the recapitalization transaction that were effectuated in conjunction with the IPO (“Legacy Units”), (b) options to purchase shares of the Company’s Class A common stock granted in connection with the IPO (“IPO Options”) and (c) restricted stock awards and units issued in connection with the Company’s ongoing long-term compensation program (“Ongoing RSAs”) is detailed in the table below:
|
|
Year Ended
|
||||||||||||
|
December 31, 2010
|
||||||||||||
|
Client
|
||||||||||||
|
Service
|
SG&A
|
Total
|
||||||||||
|
Legacy Units
|
$ | 534 | $ | 1,402 | $ | 1,936 | ||||||
|
IPO Options
|
774 | 689 | 1,463 | |||||||||
|
Ongoing RSAs
|
13,594 | 3,451 | 17,045 | |||||||||
|
Total
|
$ | 14,902 | $ | 5,542 | $ | 20,444 | ||||||
|
Year Ended
|
||||||||||||
|
December 31, 2009
|
||||||||||||
|
Client
|
||||||||||||
|
Service
|
SG&A
|
Total
|
||||||||||
|
Legacy Units
|
$ | 6,536 | $ | 2,624 | $ | 9,160 | ||||||
|
IPO Options
|
2,200 | 1,077 | 3,277 | |||||||||
|
Ongoing RSAs
|
7,696 | 3,522 | 11,218 | |||||||||
|
Total
|
$ | 16,432 | $ | 7,223 | $ | 23,655 | ||||||
|
Year Ended
|
||||||||||||
|
December 31, 2008
|
||||||||||||
|
Client
|
||||||||||||
|
Service
|
SG&A
|
Total
|
||||||||||
|
Legacy Units
|
$ | 13,056 | $ | 5,519 | $ | 18,575 | ||||||
|
IPO Options
|
4,386 | 1,945 | 6,331 | |||||||||
|
Ongoing RSAs
|
3,095 | 3,339 | 6,434 | |||||||||
|
Total
|
$ | 20,537 | $ | 10,803 | $ | 31,340 | ||||||
Legacy Units
Immediately prior to the closing of the IPO on October 3, 2007, D&P Acquisitions effectuated certain transactions intended to simplify the capital structure of D&P Acquisitions (the “Recapitalization Transactions”). Prior to the Recapitalization Transactions, D&P Acquisitions' capital structure consisted of seven different classes of membership interests (collectively, “Legacy Units”), each of which had different capital accounts and amounts of aggregate distributions above which its holders share in future distributions. Certain units were issued in conjunction with acquisitions and as long-term incentive compensation to management and independent members of
the board of directors.
The net effect of the Recapitalization Transactions was to convert the Legacy Units into a single new class of units called “New Class A Units.” The holders of New Class A Units also own one share of the Company’s Class B common stock for each New Class A Unit. Pursuant to an exchange agreement, the New Class A Units are exchangeable on a one-for-one basis for shares of the Company’s Class A common stock. In connection with an exchange, a corresponding number of shares of the Company’s Class B common stock are cancelled. See further description in “Note 11. Capital Structure.”
F-28
DUFF & PHELPS CORPORATION AND SUBSIDIARIES
NOTES TO THE CONSOLIDATED FINANCIAL STATEMENTS
(In thousands, except per share amounts)
The Company accounts for equity-based compensation in accordance with the fair value provisions of FASB ASC 718. As of October 3, 2007, the value used for the purpose of FASB ASC 718 for the above referenced units was based on the price of $16.00 per share of Class A common stock sold in the IPO, which determined the conversion of Legacy Units of D&P Acquisitions into New Class A Units pursuant to the Recapitalization Transactions. In all cases of graded vesting, equity-based compensation expense is being accrued through charges to operations over the respective vesting periods of the equity grants using the accelerated method of amortization.
Generally, Legacy Units were vested upon grant or have certain vesting provisions on each anniversary date over a four to five year requisite service period assuming that the holder remains employed by the Company, as more precisely defined in the individual grant agreements. Accelerated vesting occurs in the case of a sale of the Company or a qualified liquidity event.
The following table summarizes activity for New Class A Units attributable to equity-based compensation:
|
New
|
||||
|
Class A Units
|
||||
|
Attributable to
|
||||
|
Equity-Based
|
||||
|
Compensation
|
||||
|
Balance as of December 31, 2007
|
6,747 | |||
|
Forfeited
|
(131 | ) | ||
|
Balance as of December 31, 2008
|
6,616 | |||
|
Redeemed or exchanged
|
(3,290 | ) | ||
|
Forfeited
|
(95 | ) | ||
|
Balance as of December 31, 2009
|
3,231 | |||
|
Redeemed or exchanged
|
(1,666 | ) | ||
|
Forfeited
|
(35 | ) | ||
|
Balance as of December 31, 2010
|
1,530 | |||
|
Vested
|
1,119 | |||
|
Unvested
|
411 | |||
Upon a termination of such holder's employment other than for cause, unvested units will be forfeited for no consideration and vested units may be exchanged at the option of the holder or repurchased for a repurchase price equal to the fair market value of such units at the option of the Company. Upon a termination of such holder's employment for cause or if the holder resigns without good reason and then competes with the Company, all vested and unvested units will be forfeited without any consideration.
A select group of senior executives hold units whereby 50% of the units time vest and 50% of the units contain certain performance conditions for fiscal years ending 2006, 2007 and 2008. These performance conditions were met. In addition, all of the time-vesting units will vest immediately upon the occurrence of a sale of the Company or a qualified liquidity event prior to the fifth anniversary of the date of issuance, so long as the holder remains employed with the Company.
IPO Options and Restricted Stock Awards
The Duff & Phelps Corporation Amended and Restated 2007 Omnibus Incentive Stock Plan (“Omnibus Plan”) permits the grant of 11,150 stock options, stock appreciation rights, deferred stock awards, restricted stock awards, dividend equivalent rights, and any other share-based awards that are valued in whole or in part by reference to the Company’s Class A common stock, or any combination of these. This plan is administered and interpreted by the Compensation Committee of the Company’s board of directors.
F-29
DUFF & PHELPS CORPORATION AND SUBSIDIARIES
NOTES TO THE CONSOLIDATED FINANCIAL STATEMENTS
(In thousands, except per share amounts)
Options were granted in conjunction with the Company’s IPO to employees with exercise prices equal to the market value of the Company’s Class A common stock on the grant date and expire ten years subsequent to grant date. Vesting provisions for individual awards are established at the grant date at the discretion of the Compensation Committee of the Company’s board of directors. Options granted under the Company’s share-based incentive compensation plans vest annually over four years. The Company plans to issue new shares of the Company’s Class A common stock whenever stock options are exercised or share awards are granted. The Company did not
grant options prior to 2007.
The Company valued the IPO Options using the Black-Scholes method. Asset volatility was based on the historical mean of the Company’s closest peer group. The following table details the weighted average assumptions used to determine fair value at the time of grant:
|
Asset volatility
|
39 | % | ||
|
Expected dividends
|
None
|
|||
|
Risk-free rate
|
4.28 | % | ||
|
Expected term of options
|
6.25 years
|
|||
The following table summarizes option activity:
|
Weighted
|
||||||||
|
Average
|
||||||||
|
IPO
|
Grant Date
|
|||||||
|
Options
|
Fair Value
|
|||||||
|
Balance as of December 31, 2007
|
2,066 | $ | 7.33 | |||||
|
Exercised
|
(16 | ) | 7.33 | |||||
|
Forfeited
|
(53 | ) | 7.33 | |||||
|
Balance as of December 31, 2008
|
1,997 | 7.33 | ||||||
|
Exercised
|
(72 | ) | 7.33 | |||||
|
Forfeited
|
(110 | ) | 7.33 | |||||
|
Balance as of December 31, 2009
|
1,815 | 7.33 | ||||||
|
Exercised
|
(18 | ) | 7.33 | |||||
|
Forfeited
|
(136 | ) | 7.33 | |||||
|
Balance as of December 31, 2010
|
1,661 | $ | 7.33 | |||||
|
Vested
|
1,272 | |||||||
|
Unvested
|
389 | |||||||
|
Weighted average exercise price
|
$ | 16.00 | ||||||
|
Weighted average remaining contractual term
|
6.75 | |||||||
|
Total intrinsic value of exercised options
|
$ | 15 | ||||||
|
Total fair value of vested options
|
$ | 9,326 | ||||||
|
Aggregate intrinsic value of outstanding options
|
$ | 1,429 | ||||||
|
Options expected to vest
|
1,646 | |||||||
|
Aggregate intrinsic value of options expected to vest
|
$ | 1,416 | ||||||
Restricted stock awards and restricted stock units are granted as a form of incentive compensation and are accounted for similarly. Corresponding expense is recognized based on the fair market value of the Company’s Class A common stock on the date of grant over the service period. Restricted stock units are generally contingent on continued employment and are converted to common stock when restrictions on transfer lapse after three years.
During the year ended December 31, 2010, the Company issued 1,926 Ongoing RSAs related to annual bonus incentive compensation, performance incentive initiatives, promotions and recruiting efforts. The restrictions on transfer and forfeiture provisions are generally eliminated after three years for all awards granted to non-executives with certain exceptions related to retiree eligible employees and termination of employees without cause.
F-30
DUFF & PHELPS CORPORATION AND SUBSIDIARIES
NOTES TO THE CONSOLIDATED FINANCIAL STATEMENTS
(In thousands, except per share amounts)
Of the 1,926 Ongoing RSAs granted, 120 awards were granted to executives on March 10, 2010. The restrictions on transfer and forfeiture provisions are eliminated annually over three years based on ratable vesting for grants made to executives. In addition, 23 awards were granted to members of the board of directors on May 6, 2010. The restrictions on transfer and forfeiture provisions are eliminated annually over four years based on ratable vesting for grants made to members of the board of directors.
Pursuant to the employment agreements entered into on July 17, 2007 with all of the Executive Officers of the Company, the Executive Officers’ annual bonus may be paid in the form of cash and restricted shares, valued at the per share closing price on the date the bonus is paid. The Company has recorded equity-based compensation expense of $441, $863 and $1,541 for the years ended December 31, 2010, 2009 and 2008, respectively, in relation to the bonus earned in each year.
The following table summarizes restricted award activity:
|
Weighted
|
Weighted
|
|||||||||||||||
|
Restricted
|
Average
|
Restricted
|
Average
|
|||||||||||||
|
Stock
|
Grant Date
|
Stock
|
Grant Date
|
|||||||||||||
|
Awards
|
Fair Value
|
Units
|
Fair Value
|
|||||||||||||
|
Balance as of December 31, 2007
|
61 | $ | 19.34 | - | $ | - | ||||||||||
|
Granted
|
1,226 | 13.84 | 93 | 13.05 | ||||||||||||
|
Forfeited
|
(39 | ) | 12.87 | (1 | ) | 11.98 | ||||||||||
|
Balance as of December 31, 2008
|
1,248 | 14.14 | 92 | 13.06 | ||||||||||||
|
Granted
|
1,376 | 14.32 | 82 | 13.84 | ||||||||||||
|
Converted to Class A common stock upon lapse of restrictions
|
(135 | ) | 15.52 | - | - | |||||||||||
|
Forfeited
|
(149 | ) | 13.74 | (1 | ) | 13.25 | ||||||||||
|
Balance as of December 31, 2009
|
2,340 | 14.11 | 173 | 13.43 | ||||||||||||
|
Granted
|
1,772 | 16.66 | 154 | 16.92 | ||||||||||||
|
Converted to Class A common stock upon lapse of restrictions
|
(429 | ) | 16.37 | - | 13.84 | |||||||||||
|
Forfeited
|
(251 | ) | 14.35 | (24 | ) | 15.54 | ||||||||||
|
Balance as of December 31, 2010
|
3,432 | $ | 15.13 | 303 | $ | 15.03 | ||||||||||
|
Vested
|
- | - | ||||||||||||||
|
Unvested
|
3,432 | 303 | ||||||||||||||
Forfeitures are estimated at the time an award is granted and revised, if necessary, in subsequent periods if actual forfeitures differ from those estimates. Pre-vesting forfeitures were estimated to be between 2% and 21% as of December 31, 2010 based on historical experience and future expectations.
The total unamortized compensation cost related to all non-vested awards was $24,199 at December 31, 2010. A tax benefit of $2,612, $2,775 and $2,390 was recognized for the stock options issued in conjunction with the IPO and Ongoing RSAs for the years ended December 31, 2010, 2009 and 2008, respectively.
F-31
DUFF & PHELPS CORPORATION AND SUBSIDIARIES
NOTES TO THE CONSOLIDATED FINANCIAL STATEMENTS
(In thousands, except per share amounts)
|
Note 11.
|
Capital Structure
|
The Company has two classes of common stock, Class A and Class B, which are described as follows:
|
(a)
|
Class A common stock
|
Holders of the Company’s Class A common stock are entitled to one vote for each share held of record on all matters submitted to a vote of stockholders.
Holders of the Company’s Class A common stock are entitled to receive dividends when and if declared by the Company’s board of directors out of funds legally available, subject to any statutory or contractual restrictions on the payment of dividends and to any restrictions on the payment of dividends imposed by the terms of any outstanding preferred stock.
In the event of the Company’s merger or consolidation with or into another entity in connection with which shares of the Company’s Class A common stock are converted into or exchangeable for shares of stock, other securities or property (including cash), all holders of shares of the Company’s Class A common stock will thereafter be entitled to receive the same kind and amount of shares of stock and other securities and property (including cash). Upon the Company’s dissolution or liquidation or the sale of all or substantially all of the Company’s assets, after payment in full of all amounts required to be paid to creditors and to the holders of preferred stock having
liquidation preferences, if any, the holders of the Company’s Class A common stock will be entitled to receive pro rata the Company’s remaining assets available for distribution.
Holders of the Company’s Class A common stock do not have preemptive, subscription, redemption or conversion rights.
Subject to the transfer restrictions set forth in the 3rd LLC Agreement of D&P Acquisitions, holders of fully vested New Class A Units (other than Duff & Phelps Corporation) may exchange these New Class A Units with D&P Acquisitions for shares of Class A common stock on a one-for-one basis, subject to customary conversion rate adjustments for stock splits, stock dividends and reclassifications.
In connection with the closing of the IPO, D&P Acquisitions and certain of its existing unitholders entered into an Exchange Agreement under which, subject to the applicable minimum retained ownership requirements and certain other restrictions, including notice requirements, from time to time, typically once a quarter, such unitholders (or certain transferees thereof) will have the right to exchange with D&P Acquisitions their New Class A Units for shares of the Company’s Class A common stock on a one-for-one basis. In connection with an exchange, a corresponding number of shares of the Company’s Class B common stock will be required to be cancelled. However, the exchange
of New Class A Units for shares of the Company’s Class A common stock will not affect the Company’s Class B common stockholders' voting power since the votes represented by the cancelled shares of the Company’s Class B common stock will be replaced with the votes represented by the shares of Class A common stock for which such New Class A Units are exchanged.
|
(b)
|
Class B common stock
|
Holders of the Company’s Class B common stock are entitled to one vote for each share held of record on all matters submitted to a vote of stockholders.
Generally, all matters to be voted on by stockholders must be approved by a majority (or, in the case of election of directors, by a plurality) of the votes entitled to be cast by all shares of Class B common stock and Class A common stock present in person or represented by proxy, voting together as a single class. Except as otherwise provided by law, amendments to the amended and restated certificate of incorporation must be approved by a majority of the combined voting power of all shares of Class B common stock and Class A common stock, voting together as a single class. However, amendments to the certificate of incorporation that would alter or change the powers, preferences or special
rights of the Class B common stock so as to affect them adversely also must be approved by a majority of the votes entitled to be cast by the holders of the shares affected by the amendment, voting as a separate class. Notwithstanding the foregoing, any amendment to the Company’s amended and restated certificate of incorporation to increase or decrease the authorized shares of any class of common stock shall be approved upon the affirmative vote of the holders of a majority of the shares of Class B common stock and Class A common stock, voting together as a single class.
F-32
DUFF & PHELPS CORPORATION AND SUBSIDIARIES
NOTES TO THE CONSOLIDATED FINANCIAL STATEMENTS
(In thousands, except per share amounts)
Holders of the Company’s Class B common stock will not have any right to receive dividends (other than dividends consisting of shares of the Company’s Class B common stock paid proportionally with respect to each outstanding share of the Company’s Class B common stock) or to receive a distribution upon a liquidation or winding up of the Company. Holders of the Company’s Class B common stock do not have preemptive, subscription, redemption or conversion rights.
Exchanges of New Class A Units to Class A Common Stock
In connection with the closing of the IPO, D&P Acquisitions and certain of its existing unitholders entered into an exchange agreement under which, subject to the applicable minimum retained ownership requirements and certain other restrictions, including notice requirements, from time to time, typically once a quarter, such unitholders (or certain transferees thereof) will have the right to exchange with D&P Acquisitions their New Class A Units for shares of the Company’s Class A common stock on a one-for-one basis. The Company exchanged 1,788, 770 and 69 New Class A Units for a corresponding number of shares of Class A common stock in the years ended December 31, 2010, 2009 and 2008,
respectively. In connection with the exchange, a corresponding number of shares of Class B common stock were cancelled. The Company received no other consideration in connection with the exchanges. During the year ended December 31, 2010, there were no exchanges by any of the Company’s current executive officers or entities affiliated with Lovell Minnick Partners or Vestar Capital Partners.
F-33
DUFF & PHELPS CORPORATION AND SUBSIDIARIES
NOTES TO THE CONSOLIDATED FINANCIAL STATEMENTS
(In thousands, except per share amounts)
|
Note 12.
|
Income Taxes
|
Components of the provision for income taxes consist of the following:
|
Year Ended
|
||||||||||||
|
December 31,
|
December 31,
|
December 31,
|
||||||||||
|
2010
|
2009
|
2008
|
||||||||||
|
Current
|
||||||||||||
|
Federal
|
$ | 6,502 | $ | 7,530 | $ | 3,076 | ||||||
|
Foreign
|
1,701 | 670 | 752 | |||||||||
|
State and local
|
1,704 | 1,765 | 1,110 | |||||||||
|
Total current expense
|
9,907 | 9,965 | 4,938 | |||||||||
|
Deferred expense/(benefit)
|
||||||||||||
|
Federal
|
3,864 | 2,354 | 4,879 | |||||||||
|
Foreign
|
(952 | ) | (372 | ) | (318 | ) | ||||||
|
State and local
|
684 | 317 | 1,120 | |||||||||
|
Total deferred expense/(benefit)
|
3,596 | 2,299 | 5,681 | |||||||||
|
Provision for income tax expense
|
$ | 13,503 | $ | 12,264 | $ | 10,619 | ||||||
Prior to its IPO, the Company had not been subject to U.S. federal income taxes as the predecessor entity was an LLC, but had been subject to the New York City Unincorporated Business Tax and certain other state and local taxes, including certain non-income tax fees in other jurisdictions where the Company had registered offices and conducted business. As a result of the IPO, the operating business entities of the Company were restructured and a portion of the Company’s income is subject to U.S. federal, state, local and foreign income taxes and taxed at the prevailing corporate tax rates. During the year ended December 31, 2010, the Company recorded discrete items that resulted in a
benefit to income tax expense, including (i) an immaterial adjustment to correct the purchase accounting of a prior acquisition and (ii) provision to actual adjustments.
D&P Acquisitions complies with the requirements of the Internal Revenue Code that are applicable to limited liability companies (“LLCs”) that have elected to be treated as partnerships, which allow for the complete pass-through of taxable income or losses to D&P Acquisitions’ unitholders, who are individually responsible for any federal tax consequences. Therefore, no federal tax provision is required in the D&P Acquisitions’ consolidated financial statements in the periods prior to October 3, 2007. D&P Acquisitions is subject to certain state and local taxes, and its international subsidiaries are subject to tax in their jurisdictions.
A reconciliation of the U.S. statutory income tax rate to the Company’s effective tax rate is as follows:
|
Year Ended
|
||||||||||||
|
December 31,
|
December 31,
|
December 31,
|
||||||||||
|
2010
|
2009
|
2008
|
||||||||||
|
U.S. statutory tax rate
|
35.0 | % | 35.0 | % | 35.0 | % | ||||||
|
Increase due to state and local taxes
|
5.7 | % | 5.6 | % | 6.4 | % | ||||||
|
Effect of permanent differences
|
1.6 | % | 4.2 | % | 7.3 | % | ||||||
|
Rate benefit as an LLC
|
(11.0 | )% | (15.0 | )% | (19.6 | )% | ||||||
|
Foreign taxes
|
1.9 | % | 0.7 | % | 1.3 | % | ||||||
|
Prior year provision to actual adjustment
|
(1.7 | )% | (0.5 | )% | 0.0 | % | ||||||
|
Effective tax rate
|
31.5 | % | 30.0 | % | 30.4 | % | ||||||
The Company's effective tax rate includes a rate benefit attributable to the fact that the Company’s subsidiaries operate as a series of limited liability companies and other flow-through entities which are not subject to federal income tax. Accordingly, a portion of the Company's earnings are not subject to corporate level taxes. This favorable impact is partially offset by the impact of certain permanent items, primarily attributable to certain compensation related expenses that are not deductible for tax purposes.
F-34
DUFF & PHELPS CORPORATION AND SUBSIDIARIES
NOTES TO THE CONSOLIDATED FINANCIAL STATEMENTS
(In thousands, except per share amounts)
Income taxes payable were $3,464 and $3,661 at December 31, 2010 and 2009, respectively, and prepaid income taxes were $727 at 2008.
Deferred income taxes are provided for the effects of temporary differences between the tax basis of an asset or liability and its reported amount in the consolidated balance sheets. These temporary differences result in taxable or deductible amounts in future years. Details of the Company’s deferred tax assets and liabilities are summarized as follows:
|
December 31,
|
December 31,
|
|||||||
|
2010
|
2009
|
|||||||
|
Current deferred tax assets
|
||||||||
|
Compensation and benefits
|
$ | 3,289 | $ | 5,098 | ||||
|
Other
|
674 | 718 | ||||||
|
Net operating losses
|
1 | 33 | ||||||
|
Total current deferred tax assets
|
3,964 | 5,849 | ||||||
|
Current deferred tax liabilities
|
||||||||
|
Compensation and benefits
|
(195 | ) | (302 | ) | ||||
|
Prepaid expenses
|
(1,214 | ) | (946 | ) | ||||
|
Total current deferred tax liabilities
|
(1,409 | ) | (1,248 | ) | ||||
|
Net current deferred tax assets
|
2,555 | 4,601 | ||||||
|
Long-term deferred tax assets
|
||||||||
|
Compensation and benefits
|
19,577 | 13,458 | ||||||
|
Goodwill and other intangibles
|
109,138 | 105,416 | ||||||
|
Fixed assets
|
(410 | ) | 232 | |||||
|
Other
|
3,385 | 2,138 | ||||||
|
Credits
|
1,545 | 710 | ||||||
|
Net operating losses
|
1,200 | 2,191 | ||||||
|
Valuation allowance
|
(2,913 | ) | (2,387 | ) | ||||
|
Total long-term deferred tax assets
|
131,522 | 121,758 | ||||||
|
Long-term deferred tax liabilities
|
||||||||
|
Goodwill and other intangibles
|
(14,675 | ) | (9,474 | ) | ||||
|
Other
|
(58 | ) | (19 | ) | ||||
|
Total long-term deferred tax liabilities
|
(14,733 | ) | (9,493 | ) | ||||
|
Net long-term deferred tax assets
|
116,789 | 112,265 | ||||||
|
Total deferred tax assets and liabilities
|
$ | 119,344 | $ | 116,866 | ||||
The Company recognized net deferred tax assets related to differences between the financial reporting basis and the tax basis of the net assets of the Company. The valuation allowance primarily represents the tax benefits of certain foreign net operating loss carry forwards and other foreign deferred tax assets which may not be realized in future years. These losses are available on the carry forward basis in varying time frames in each jurisdiction ranging from five years to indefinitely. In addition, certain credit carry forwards will commence to expire in six to 10 years unless utilized.
Based on the Company's historical taxable income and its expected future earnings, management has evaluated the uncertainty associated with booking tax benefits and has determined that the deferred tax assets, other than those offset by valuation allowances, will be realized as offsets to deferred tax liabilities and future taxable income.
F-35
DUFF & PHELPS CORPORATION AND SUBSIDIARIES
NOTES TO THE CONSOLIDATED FINANCIAL STATEMENTS
(In thousands, except per share amounts)
The Company accounts for uncertainties in income tax positions in accordance with FASB ASC 740. A reconciliation of the beginning and ending amount of unrecognized tax benefit is summarized as follows:
|
Balance as of December 31, 2007
|
$ | 288 | ||
|
Additional based on tax positions related to the current year
|
187 | |||
|
Additional for tax positions of prior years
|
27 | |||
|
Balance as of December 31, 2008
|
502 | |||
|
Additional based on tax positions related to the current year
|
78 | |||
|
Lapse of statue of limitations
|
(32 | ) | ||
|
Balance as of December 31, 2009
|
548 | |||
|
Additional based on tax positions related to the current year
|
115 | |||
|
Lapse of statue of limitations
|
(128 | ) | ||
|
Balance as of December 31, 2010
|
$ | 535 |
The $535 of unrecognized tax benefit would impact the effective tax rate if realized. The Company recognizes accrued interest related to unrecognized tax benefits in interest expense. The Company recognized $10, $26 and $22 of interest expense during the years ended December 31, 2010, 2009 and 2008, respectively. There was no accrual or expense for penalties for the years ended December 31, 2010, 2009 and 2008.
The Company and its subsidiaries file income tax returns in the U.S. federal jurisdiction and various states and foreign jurisdictions. Duff & Phelps, LLC and D&P Acquisitions are open for federal income tax purposes from 2007 forward. These entities are not subject to federal income taxes as they are flow-through entities. The Company is open for federal income tax purposes beginning in 2007.
With respect to state and local jurisdictions and countries outside of the United States, the Company and its subsidiaries are typically subject to examination for four to five years after the income tax returns have been filed. Although the outcome of tax audits is always uncertain, the Company believes that adequate amounts of tax, interest and penalties have been provided for in the accompanying consolidated financial statements for any adjustments that might be incurred due to state, local or foreign audits.
F-36
DUFF & PHELPS CORPORATION AND SUBSIDIARIES
NOTES TO THE CONSOLIDATED FINANCIAL STATEMENTS
(In thousands, except per share amounts)
Commitments
The Company leases office facilities under non-cancelable operating leases that expire at various dates through 2023 and include fixed or minimum payments plus, in some cases, scheduled base rent increases over the terms of the lease. Certain leases provide for monthly payment of real estate taxes, insurance and other operating expenses applicable to the property. The Company has various leases that grant a free rent period and entitle the Company to a lease incentive. The accompanying consolidated financial statements reflect all rent expense on a straight-line basis over the term of the leases. In addition to office leases, the Company leases a nominal amount of
equipment under operating leases that expire at various dates through 2014.
As detailed in Note 3, the Company is committed to obligations pursuant to the TRA. The timing of payments is subject to certain contingencies including Duff & Phelps Corporation having sufficient taxable income to utilize all of the tax benefits defined in the TRA.
Future minimum annual lease payments and obligations pursuant to the TRA are summarized as follows:
|
Annual
|
Payments
|
|||||||||||
|
Lease
|
Pursuant
|
|||||||||||
|
Payments
|
to the TRA
|
Total
|
||||||||||
|
Year Ending December 31,
|
||||||||||||
|
2011
|
$ | 17,365 | $ | 5,640 | $ | 23,005 | ||||||
|
2012
|
16,474 | 6,122 | 22,596 | |||||||||
|
2013
|
14,995 | 6,353 | 21,348 | |||||||||
|
2014
|
12,804 | 6,596 | 19,400 | |||||||||
|
2015
|
11,937 | 6,854 | 18,791 | |||||||||
|
Thereafter
|
62,634 | 77,960 | 140,594 | |||||||||
Total rental expense for operating leases is summarized as follows:
|
Year Ended
|
||||||||||||
|
December 31,
|
December 31,
|
December 31,
|
||||||||||
|
2010
|
2009
|
2008
|
||||||||||
|
Rental expense
|
$ | 15,690 | $ | 14,851 | $ | 14,555 | ||||||
Contingencies
The Company is involved in various claims or disputes arising in the normal course of business. Management does not believe that these matters would have a material adverse effect on the Company's financial position, results of operations or liquidity.
|
Note 14.
|
Charge from Realignment of Senior Management
|
On April 22, 2010, the Company announced the departure of its former president and one of its segment leaders. The Company incurred a onetime charge associated with these changes of approximately $3,610 primarily in the three months ended June 30, 2010 related to cash severance and the accounting impact of accelerated vesting of equity-based awards. Approximately $540 of this amount is included in direct client service costs as a component of compensation and benefits and approximately $3,070 in operating expenses as a component of selling, general and administrative expenses. These charges were not allocated to any of the Company’s segments or associated with a restructuring,
exit or disposal activity.
F-37
DUFF & PHELPS CORPORATION AND SUBSIDIARIES
NOTES TO THE CONSOLIDATED FINANCIAL STATEMENTS
(In thousands, except per share amounts)
|
Note 15.
|
Employee Benefit Plans
|
Defined Contribution 401(k) Plan
Duff & Phelps, LLC, a subsidiary of the Company, sponsors the Duff & Phelps Savings Plan, a qualified defined contribution 401(k) plan covering substantially all employees (“401(k) Plan”). Employees are entitled to make contributions up to 100% of their compensation subject to Internal Revenue Code (“Code”) limitations. The Company matches an amount equal to an employee’s contribution up to 3% of the employee’s compensation and matches 50% of the employee’s contribution up to the next 3% of compensation. All Company contributions are discretionary. Participants are immediately vested in both their voluntary and matching
contributions plus actual earnings thereon.
Company contributions to the 401(k) Plan is included as components of (i) compensation and benefits of direct client service costs and (ii) selling, general and administrative expenses in the Company’s consolidated statements of operations and are summarized as follows:
|
Year Ended
|
||||||||||||
|
December 31,
|
December 31,
|
December 31,
|
||||||||||
|
2010
|
2009
|
2008
|
||||||||||
|
Contributions to 401(k) Plan
|
$ | 4,610 | $ | 5,030 | $ | 5,127 | ||||||
Deferred Compensation Plan
Duff & Phelps, LLC maintains the Duff & Phelps Deferred Compensation Plan (“Deferred Compensation Plan”) for key employees. The purpose of the Deferred Compensation Plan is to attract and retain key employees by providing each participant with an opportunity to defer receipt of a portion of their salary, bonus and other specified compensation. The plan is not intended to meet the qualification requirements of Code Section 401(a), but is intended to meet the requirements of Code Section 409A, and is operated and interpreted consistent with that intent.
The Deferred Compensation Plan constitutes an unsecured promise by the Company to pay benefits in the future. Participants in the Deferred Compensation Plan have the status of general unsecured creditors of the Company. The plan is unfunded for U.S. federal tax purposes and is intended to be an unfunded arrangement for eligible employees who are part of a select group of management or highly compensated employees of the Company within the meaning of Sections 201(2), 301(a)(3) and 401(a)(1) of ERISA. Any amounts set aside to defray the liabilities assumed by the Company will remain general assets of the Company and remain subject to the claims of the Company’s creditors until such amounts
are distributed to the participants.
For participants who reside in the United States, the Company may credit participants with discretionary contributions provided the participant is employed on the last day of the plan year and has deferred the maximum permissible amount to the Company’s qualified 401(k) plan for such year. Discretionary contributions are derived from a pool that is equal to an aggregate of 4½% of the compensation of each participant for the plan year that exceeds the limitation on compensation under Code Section 401(a)(17) for such year. For participants outside of the United States, the Company’s matching contributions will be an amount determined by the Company. Company matching
contributions to the Deferred Compensation Plan are 100% vested.
Under the terms of the plan, the Company established a “rabbi trust” as a vehicle for accumulating assets to pay benefits under the plan. Payments under the plan may be paid from the general assets of the Company or from the assets of any such rabbi trust. Payment from any such source reduces the obligation owed to the participant or beneficiary. The rabbi trust invests in an investment vehicle structured as a corporate-owned life insurance (“COLI”) policy with a cash surrender value that mirrors the payable to the participants of the plan and tracks the value of the plan assets. Participants can earn a return on their deferred compensation that is
based on hypothetical investment funds. The policy is redeemable on demand in an amount equal to the cash surrender value. The cash surrender value approximated fair value at December 31, 2010.
F-38
DUFF & PHELPS CORPORATION AND SUBSIDIARIES
NOTES TO THE CONSOLIDATED FINANCIAL STATEMENTS
(In thousands, except per share amounts)
The following table summarizes the fair market value of the rabbi trust and the corresponding liability owed to participants:
|
December 31,
|
December 31,
|
|||||||
|
2010
|
2009
|
|||||||
|
Fair market value of investments in rabbi trust(1)
|
$ | 23,151 | $ | 17,807 | ||||
|
Payable to participants of the plan
|
23,078 | 18,051 | ||||||
(1) At December 31, 2010 and 2009, the fair market value of investments in rabbi trust held in conjunction with the Deferred Compensation Plan excludes approximately $0 and $251 which is included in cash and cash equivalents, respectively.
The fair market value of the investments in the rabbi trust is included in “Investments related to the deferred compensation plan” with the corresponding deferred compensation obligation included in current and non-current portion of liability related to the deferred compensation plan on the Consolidated Balance Sheets. Changes in the fair value of the investments are recognized as compensation expense (or credit). Changes in the fair value of the benefits payables to participants are recognized as a corresponding offset to compensation expense (or credit). The net impact of changes in fair value is not material.
F-39
DUFF & PHELPS CORPORATION AND SUBSIDIARIES
NOTES TO THE CONSOLIDATED FINANCIAL STATEMENTS
(In thousands, except per share amounts)
|
Note 16.
|
Segment Information
|
The Company provides services through three segments: Financial Advisory, Corporate Finance Consulting and Investment Banking. The Company generally defines its segments by the nature of their services and how the business is managed and resources are allocated. The Financial Advisory segment provides services related to its Valuation Advisory, Tax Services, and Dispute & Legal Management Consulting business units. The Corporate Finance Consulting segment provides services related to the Portfolio Valuation, Financial Engineering, Strategic Value Advisory and Due Diligence business units. The Investment Banking segment provides services related to its
M&A Advisory, Transaction Opinions and Global Restructuring Advisory business units.
|
Year Ended
|
||||||||||||
|
December 31,
|
December 31,
|
December 31,
|
||||||||||
|
2010
|
2009
|
2008
|
||||||||||
|
Financial Advisory
|
||||||||||||
|
Revenues (excluding reimbursables)
|
$ | 219,462 | $ | 233,632 | $ | 253,169 | ||||||
|
Segment operating income
|
28,692 | 37,557 | 42,816 | |||||||||
|
Segment operating income margin
|
13.1 | % | 16.1 | % | 16.9 | % | ||||||
|
Corporate Finance Consulting
|
||||||||||||
|
Revenues (excluding reimbursables)
|
$ | 55,854 | $ | 62,956 | $ | 56,494 | ||||||
|
Segment operating income
|
10,335 | 13,854 | 13,220 | |||||||||
|
Segment operating income margin
|
18.5 | % | 22.0 | % | 23.4 | % | ||||||
|
Investment Banking
|
||||||||||||
|
Revenues (excluding reimbursables)
|
$ | 90,230 | $ | 74,315 | $ | 71,813 | ||||||
|
Segment operating income
|
22,061 | 15,233 | 17,673 | |||||||||
|
Segment operating income margin
|
24.4 | % | 20.5 | % | 24.6 | % | ||||||
|
Total
|
||||||||||||
|
Revenues (excluding reimbursables)
|
$ | 365,546 | $ | 370,903 | $ | 381,476 | ||||||
|
Segment operating income
|
$ | 61,088 | $ | 66,644 | $ | 73,709 | ||||||
|
Net client reimbursable expenses
|
(62 | ) | (75 | ) | (77 | ) | ||||||
|
Equity-based compensation associated with Legacy Units and IPO options
|
(3,399 | ) | (12,437 | ) | (24,906 | ) | ||||||
|
Depreciation and amortization
|
(9,916 | ) | (10,244 | ) | (9,816 | ) | ||||||
|
Charge from impairment of certain intangible assets
|
(674 | ) | - | - | ||||||||
|
Charge from realignment of senior management (not included in equity-based compensation from Legacy Units and IPO Options above)(Note 14)
|
(3,100 | ) | - | - | ||||||||
|
Acquisition retention expense
|
(11 | ) | - | (793 | ) | |||||||
|
Merger and acquisition costs
|
(704 | ) | - | - | ||||||||
|
Operating income
|
$ | 43,222 | $ | 43,888 | $ | 38,117 | ||||||
Revenues and expenses attributable to reportable segments are generally based on which segment and product line a client service professional is a dedicated member. As a result, revenues recognized that relate to the cross utilization of client service professionals across reportable segments occur each period. In the years ended December 31, 2010, 2009 and 2008, the Financial Advisory segment (primarily valuation advisory services) recognized revenues of $9,544, $11,533 and $16,553 from the cross utilization of its client service professionals on engagements from the Corporate Finance Consulting segment (primarily portfolio valuation services), respectively.
F-40
DUFF & PHELPS CORPORATION AND SUBSIDIARIES
NOTES TO THE CONSOLIDATED FINANCIAL STATEMENTS
(In thousands, except per share amounts)
Revenues excluding reimbursable expenses attributable to geographic area are summarized as follows:
|
Year Ended
|
||||||||||||
|
December 31,
|
December 31,
|
December 31,
|
||||||||||
|
2010
|
2009
|
2008
|
||||||||||
|
North America
|
$ | 326,039 | $ | 331,974 | $ | 342,003 | ||||||
|
Europe
|
36,132 | 33,400 | 34,596 | |||||||||
|
Asia
|
3,375 | 5,529 | 4,877 | |||||||||
|
Total
|
$ | 365,546 | $ | 370,903 | $ | 381,476 | ||||||
F-41
DUFF & PHELPS CORPORATION AND SUBSIDIARIES
NOTES TO THE CONSOLIDATED FINANCIAL STATEMENTS
(In thousands, except per share amounts)
|
Note 17.
|
Related Party Transactions
|
Lovell Minnick Partners
Entities affiliated with Lovell Minnick Partners are holders of Class B common stock and an equivalent number of New Class A Units. Two managing directors of Lovell Minnick Partners serve as independent directors on the Company’s Board of Directors.
In conjunction with the May 2009 follow-on offering, the Company redeemed 1,900 New Class A Units of D&P Acquisitions held by entities affiliated with Lovell Minnick Partners, a shareholder of the Company, at a price per unit equal to the public offering price or an aggregate amount of $28,025.
D&P Acquisitions made distributions to entities affiliated with Lovell Minnick Partners as summarized in the following table and described in Note 3:
|
Year Ended
|
||||||||||||
|
December 31,
|
December 31,
|
December 31,
|
||||||||||
|
2010
|
2009
|
2008
|
||||||||||
|
Distributions for taxes
|
$ | 1,890 | $ | 5,101 | $ | 2,347 | ||||||
|
Other distributions
|
831 | 542 | - | |||||||||
|
Payments pursuant to the TRA
|
1,145 | 743 | 190 | |||||||||
| $ | 3,866 | $ | 6,386 | $ | 2,537 | |||||||
An affiliate of Lovell Minnick Partners engaged the Company to provide certain consulting services. As a result of services provided, the Company recorded $36, $0 and $512 of revenues resulting from engagements during the years ended December 31, 2010, 2009 and 2008, respectively.
Vestar Capital Partners
Entities affiliated with Vestar Capital Partners are holders of Class B common stock and an equivalent number of New Class A Units. A managing director of Vestar Capital Partners serves as independent directors on the Company’s Board of Directors.
In conjunction with the May 2009 follow-on offering, the Company redeemed 1,600 New Class A Units of D&P Acquisitions held by entities affiliated with Vestar Capital Partners, a shareholder of the Company, at a price per unit equal to the public offering price or an aggregate amount of $23,600. Included in this amount were payments to Noah Gottdiener, Chairman and Chief Executive Officer, Gerard Creagh, former President, and Harvey Krueger, an independent director, who are also members in a limited liability company managed by Vestar Capital Partners. As a result, Messrs. Gottdiener, Creagh and Krueger each received $53, $53 and $42, respectively, as a result of such
redemptions.
D&P Acquisitions made distributions to entities affiliated with Vestar Capital Partners as summarized in the following table and described in Note 3:
|
Year Ended
|
||||||||||||
|
December 31,
|
December 31,
|
December 31,
|
||||||||||
|
2010
|
2009
|
2008
|
||||||||||
|
Distributions for taxes
|
$ | 2,618 | $ | 6,388 | $ | 3,145 | ||||||
|
Other distributions
|
1,156 | 754 | - | |||||||||
|
Payments pursuant to the TRA
|
1,629 | 1,250 | 320 | |||||||||
| $ | 5,403 | $ | 8,392 | $ | 3,465 | |||||||
F-42
DUFF & PHELPS CORPORATION AND SUBSIDIARIES
NOTES TO THE CONSOLIDATED FINANCIAL STATEMENTS
(In thousands, except per share amounts)
Shinsei Bank
Shinsei Bank, Ltd., a shareholder of the Company, engaged the Company to provide certain consulting services. As a result of services provided, the Company recorded $1,590 of revenues resulting from the engagement during the year ended December 31, 2008. A representative from Shinsei Bank serves as an observer on the Company’s board of directors.
|
Note 18.
|
Regulated Subsidiaries
|
Duff & Phelps Securities, LLC (“Securities”), a wholly-owned subsidiary of the Company, is a registered U.S. broker-dealer, subject to the SEC’s “Uniform Net Capital Rule,” Rule 15c3-1. At December 31, 2010, Securities reported net capital of $9,803 which was $9,455 in excess of its net capital requirement of $348. At December 31, 2009, Securities reported net capital of $6,544 which was $6,478 in excess of its net capital requirement of $66. Aggregate indebtedness of Securities totaled $5,221 and $991 at December 31, 2010 and 2009, respectively.
Duff & Phelps Securities, Limited (“Securities Ltd.”), a wholly-owned subsidiary of the Company, is a registered United Kingdom broker-dealer, authorized and regulated by the Financial Services Authority. Securities Ltd. is currently registered in England and Wales. At December 31, 2010, the entity reported net capital of UK£143 which was UK£100 in excess of its net capital requirement of UK£43. At December 31, 2009, the entity reported net capital of UK£188 which was UK£144 in excess of its net capital requirement of UK£44.
Duff & Phelps SAS is regulated by the Autorité des marchés financiers (“AMF”). The AMF is an independent public body located in France. Duff & Phelps SAS is permitted to conduct certain regulated activities in France as a result of this authorization. There is no net capital requirement for Duff & Phelps SAS.
F-43
DUFF & PHELPS CORPORATION AND SUBSIDIARIES
NOTES TO THE CONSOLIDATED FINANCIAL STATEMENTS
(In thousands, except per share amounts)
|
Note 19.
|
Selected Quarterly Data (Unaudited)
|
The following table contains information derived from unaudited financial statements of the Company. In the opinion of the Company’s management, the information includes all adjustments necessary for fair presentation of the results. The results of a particular quarter are not necessarily indicative of the results that might be achieved for a full fiscal year.
|
Year Ended December 31, 2010
|
||||||||||||||||||||
|
Fourth
|
Third
|
Second
|
First
|
|||||||||||||||||
|
Total
|
Quarter
|
Quarter
|
Quarter
|
Quarter
|
||||||||||||||||
|
Revenues
|
$ | 365,546 | $ | 103,213 | $ | 84,427 | $ | 88,742 | $ | 89,164 | ||||||||||
|
Reimbursable expenses
|
9,485 | 2,322 | 2,403 | 1,962 | 2,798 | |||||||||||||||
|
Total revenues
|
375,031 | 105,535 | 86,830 | 90,704 | 91,962 | |||||||||||||||
|
Operating income
|
$ | 43,222 | $ | 15,356 | $ | 9,201 | $ | 7,394 | $ | 11,271 | ||||||||||
|
Net income
|
29,346 | 9,963 | 7,197 | 4,618 | 7,568 | |||||||||||||||
|
Net income attributable to Duff & Phelps Corporation
|
16,765 | 5,876 | 4,109 | 2,507 | 4,273 | |||||||||||||||
|
Weighted average shares of Class A common stock outstanding:
|
||||||||||||||||||||
|
Basic
|
25,170 | 25,758 | 24,873 | 25,058 | 24,986 | |||||||||||||||
|
Diluted
|
26,089 | 26,807 | 24,954 | 25,754 | 25,780 | |||||||||||||||
|
Net income per share attributable to stockholders of Class A common stock of Duff & Phelps Corporation:
|
||||||||||||||||||||
|
Basic
|
$ | 0.62 | $ | 0.21 | $ | 0.15 | $ | 0.10 | $ | 0.16 | ||||||||||
|
Diluted
|
0.60 | 0.20 | 0.15 | 0.09 | 0.16 | |||||||||||||||
|
Year Ended December 31, 2009
|
||||||||||||||||||||
|
Fourth
|
Third
|
Second
|
First
|
|||||||||||||||||
|
Total
|
Quarter
|
Quarter
|
Quarter
|
Quarter
|
||||||||||||||||
|
Revenues
|
$ | 370,903 | $ | 98,345 | $ | 93,240 | $ | 90,053 | $ | 89,265 | ||||||||||
|
Reimbursable expenses
|
11,083 | 3,026 | 3,394 | 2,626 | 2,037 | |||||||||||||||
|
Total revenues
|
381,986 | 101,371 | 96,634 | 92,679 | 91,302 | |||||||||||||||
|
Operating income
|
$ | 43,888 | $ | 14,069 | $ | 10,711 | $ | 9,757 | $ | 9,351 | ||||||||||
|
Net income
|
28,668 | 9,300 | 7,588 | 5,199 | 6,581 | |||||||||||||||
|
Net income attributable to Duff & Phelps Corporation
|
11,568 | 4,617 | 3,452 | 1,734 | 1,765 | |||||||||||||||
|
Weighted average shares of Class A common stock outstanding:
|
||||||||||||||||||||
|
Basic
|
19,013 | 23,451 | 21,625 | 17,356 | 13,479 | |||||||||||||||
|
Diluted
|
19,795 | 24,375 | 22,448 | 18,111 | 13,973 | |||||||||||||||
|
Net income per share attributable to stockholders of Class A common stock of Duff & Phelps Corporation:
|
||||||||||||||||||||
|
Basic
|
$ | 0.57 | $ | 0.18 | $ | 0.15 | $ | 0.10 | $ | 0.12 | ||||||||||
|
Diluted
|
0.54 | 0.18 | 0.14 | 0.09 | 0.11 | |||||||||||||||
F-44
DUFF & PHELPS CORPORATION AND SUBSIDIARIES
NOTES TO THE CONSOLIDATED FINANCIAL STATEMENTS
(In thousands, except per share amounts)
|
Note 20.
|
Subsequent Events
|
In accordance with FASB ASC 855, Subsequent Events, management of the Company evaluated subsequent events.
Declaration of Quarterly Dividend
On February 23, 2011, the Company announced that its board of directors had declared a quarterly dividend of $0.08 per share on its outstanding Class A common stock. The dividend is payable on March 25, 2011 to shareholders of record on March 15, 2011. Concurrent with the payment of the dividend, the Company will also be distributing $0.08 per unit to holders of New Class A Units.
F-45
SCHEDULE II
DUFF & PHELPS CORPORATION AND SUBSIDIARIES
VALUATION AND QUALIFYING ACCOUNTS
(In thousands, except per share amounts)
|
Additions
|
||||||||||||||||||||
|
Charged to
|
Charged to
|
|||||||||||||||||||
|
Beginning
|
Cost and
|
Other
|
Ending
|
|||||||||||||||||
|
Balance
|
Expenses
|
Accounts(1)
|
Deductions(2)
|
Balance
|
||||||||||||||||
|
Allowance for doubtful accounts
|
||||||||||||||||||||
|
Year ended December 31, 2010
|
$ | 1,690 | $ | 2,074 | $ | (617 | ) | $ | (1,800 | ) | $ | 1,347 | ||||||||
|
Year ended December 31, 2009
|
1,701 | 2,386 | 722 | (3,119 | ) | 1,690 | ||||||||||||||
|
Year ended December 31, 2008
|
1,881 | 1,604 | 1,995 | (3,779 | ) | 1,701 | ||||||||||||||
|
(1)
|
Fee adjustments recorded as a reduction to revenue.
|
|
(2)
|
Uncollectible accounts written off, recoveries of billed accounts receivable and fee adjustments recorded against the allowance.
|
F-46
DUFF & PHELPS CORPORATION AND SUBSIDIARIES
EXHIBIT INDEX
In reviewing the agreements included as exhibits to this Annual Report on Form 10-K (whether incorporated by reference or otherwise), please remember they are included to provide you with information regarding their terms and are not intended to provide any other factual or disclosure information about the Company or the other parties to the agreements. The agreements contain representations and warranties by each of the parties to the applicable agreement. These representations and warranties have been made solely for the benefit of the other parties to the applicable agreement and (i) should not in all instances be treated as categorical statements of fact, but rather as a way of allocating
the risk to one of the parties if those statements prove to be inaccurate; (ii) have been qualified by disclosures that were made to the other party in connection with the negotiation of the applicable agreement, which disclosures are not necessarily reflected in the agreement; (iii) may apply standards of materiality in a way that is different from what may be viewed as material to you or other investors; and (iv) were made only as of the date of the applicable agreement or such other date or dates as may be specified in the agreement and are subject to more recent developments. Accordingly, these representations and warranties may not describe the actual state of affairs as of the date they were made or at any other time.
|
Exhibit
|
||
|
Number
|
Description
|
|
|
3.1
|
Amended and Restated Certificate of Incorporation of Duff & Phelps Corporation (incorporated by reference to Exhibit 3.1 to the Registrant’s Registration Statement on Form S-1 filed with the SEC on September 5, 2007).
|
|
|
3.2
|
Amended and Restated By-Laws of Duff & Phelps Corporation (incorporated by reference to Exhibit 3.2 to the Registrant’s Registration Statement on Form S-1 filed with the SEC on September 5, 2007).
|
|
|
3.3
|
Third Amended and Restated Limited Liability Company Agreement of Duff & Phelps Acquisitions, LLC, dated as of October 3, 2007 (incorporated by reference to Exhibit 10.1 to the Registrant’s Quarterly Report on Form 10-Q filed with the SEC on November 14, 2007).
|
|
|
10.1
|
Credit Agreement, dated as of July 15, 2009, among Duff & Phelps, LLC, each lender from time to time party thereto and Bank of America, N.A., as administrative agent (incorporated by reference to Exhibit 99.1 to the Registrant’s Current Report on Form 8-K filed with the SEC on July 17, 2009).
|
|
|
10.2
|
First Amendment to Credit Agreement, dated as of November 8, 2010, among Duff & Phelps, LLC, Duff & Phelps Acquisitions, LLC, Chanin Capital Partners LLC, and Rash & Associates, L.P., as guarantors, Bank of America, N.A., as administrative agent and letter of credit issuer, and each other lender party thereto, related to the Credit Agreement, dated as of July 15, 2009, among Duff & Phelps, LLC, each agent and lender from time to time party thereto and Bank of America, N.A., as administrative agent (incorporated by reference to Exhibit 10.1 to the Registrant’s Current Report on Form 8-K filed with the SEC on November 9, 2010).
|
|
|
10.3
|
Registration Rights Agreement, dated as of October 3, 2007, by and between Duff & Phelps Corporation, Duff & Phelps Acquisitions LLC, Lovell Minnick Equity Partners LP, LM Duff Holdings, LLC, Vestar Capital Partners IV L.P., Vestar/D&P Holdings, LLC and the Holders as set forth in the Agreement (incorporated by reference to Exhibit 10.2 to the Registrant’s Quarterly Report on Form 10-Q filed with the SEC on November 14, 2007).
|
|
|
10.4
|
Tax Receivable Agreement, by and between Duff & Phelps Corporation, Duff & Phelps Acquisitions, LLC and the Members as set forth in the Agreement (incorporated by reference to Exhibit 10.3 to the Registrant’s Quarterly Report on Form 10-Q filed with the SEC on November 14, 2007).
|
|
|
10.5
|
Exchange Agreement, by and between Duff & Phelps Acquisitions, LLC, Lovell Minnick Equity Partners LP, LM Duff Holdings, LLC, Vestar Capital Partners IV, L.P., Vestar/D&P Holdings, LLC and the Members as set forth in the Agreement (incorporated by reference to Exhibit 10.4 to the Registrant’s Quarterly Report on Form 10-Q filed with the SEC on November 14, 2007).
|
|
|
10.6
|
First Amendment to the Exchange Agreement, dated as of October 5, 2009, by and among Duff & Phelps Acquisitions, LLC, Lovell Minnick Equity Partners LP, LM Duff Holdings, LLC, Vestar Capital Partners IV, L.P., Vestar/D&P Holdings, LLC and the other Amending Members as set forth in the Amendment (incorporated by reference to Exhibit 10.1 to the Registrant’s Current Report on Form 8-K filed with the SEC on October 6, 2009).
|
|
|
10.7 *
|
Employment Agreement, dated July 17, 2007, by and between Duff & Phelps, LLC and Noah Gottdiener (incorporated by reference to Exhibit 10.7 to the Registrant’s Registration Statement on Form S-1 filed with the SEC on July 26, 2007).
|
|
|
10.8 *
|
Employment Agreement, dated July 17, 2007, by and between Duff & Phelps, LLC and Gerard Creagh (incorporated by reference to Exhibit 10.8 to the Registrant’s Registration Statement on Form S-1 filed with the SEC on July 26, 2007).
|
DUFF & PHELPS CORPORATION AND SUBSIDIARIES
EXHIBIT INDEX
|
Exhibit
|
||
|
Number
|
Description
|
|
|
10.9 *
|
Employment Agreement, dated July 17, 2007, by and between Duff & Phelps, LLC and Jacob Silverman (incorporated by reference to Exhibit 10.9 to the Registrant’s Registration Statement on Form S-1 filed with the SEC on July 26, 2007).
|
|
|
10.10 *
|
Employment Agreement, dated July 17, 2007, by and between Duff & Phelps, LLC and Brett Marschke (incorporated by reference to Exhibit 10.10 to the Registrant’s Registration Statement on Form S-1 filed with the SEC on July 26, 2007).
|
|
|
10.11 *
|
Employment Agreement, dated July 17, 2007, by and between Duff & Phelps, LLC and Edward Forman (incorporated by reference to Exhibit 10.11 to the Registrant’s Registration Statement on Form S-1 filed with the SEC on July 26, 2007).
|
|
|
10.12 *
|
Duff & Phelps Corporation Amended and Restated 2007 Omnibus Stock Incentive Plan (filed as Appendix I to the Registrant’s Definitive Proxy Statement filed with the SEC on March 22, 2010).
|
|
|
10.13
|
Name Use Agreement, dated as of July 1, 1996, by and between Phoenix Duff & Phelps Corporation and Duff & Phelps, LLC (incorporated by reference to Exhibit 10.11 to the Registrant’s Registration Statement on Form S-1 filed with the SEC on May 23, 2007).
|
|
|
10.14 *
|
DPH Unit Vesting Agreement, dated September 11, 2007, by and among Duff & Phelps Acquisitions, LLC, Duff & Phelps, LLC and Noah Gottdiener (incorporated by reference to Exhibit 10.15 to the Registrant’s Registration Statement on Form S-1 filed with the SEC on September 13, 2007).
|
|
|
10.15 *
|
DPH Unit Vesting Agreement, dated September 11, 2007, by and among Duff & Phelps Acquisitions, LLC, Duff & Phelps, LLC and Jacob Silverman (incorporated by reference to Exhibit 10.16 to the Registrant’s Registration Statement on Form S-1 filed with the SEC on September 13, 2007).
|
|
|
10.16
|
Stockholders Agreement, dated September 5, 2007, by and among Duff & Phelps Corporation, Duff & Phelps Acquisitions, LLC and Shinsei Bank, Limited (incorporated by reference to Exhibit 10.17 to the Registrant’s Registration Statement on Form S-1 filed with the SEC on September 13, 2007).
|
|
|
10.17 *
|
Form of Stock Option Award Agreement under the Duff & Phelps Corporation 2007 Omnibus Stock Incentive Plan (incorporated by reference to Exhibit 10.18 to the Registrant’s Registration Statement on Form S-1 filed with the SEC on September 21, 2007).
|
|
|
10.18 *
|
Form of Restricted Stock Award Agreement under the Duff & Phelps Corporation 2007 Omnibus Stock Incentive Plan (incorporated by reference to Exhibit 10.19 to the Registrant’s Registration Statement on Form S-1 filed with the SEC on September 21, 2007).
|
|
|
10.19 *
|
Form of Restricted Stock Award Agreement for Non-Employee Directors under the Duff & Phelps Corporation 2007 Omnibus Stock Incentive Plan (incorporated by reference to Exhibit 10.1 to the Registrant’s Current Report on Form 8-K filed with the SEC on May 16, 2008).
|
|
|
21.1**
|
List of Subsidiaries.
|
|
|
23.1**
|
Consent of KPMG LLP.
|
|
|
31.1**
|
Certification of the Chief Executive Officer, pursuant to Rule 13a-14(a)/15d-14(a), as adopted pursuant to Section 302 of the Sarbanes-Oxley Act of 2002.
|
|
|
31.2**
|
Certification of the Chief Financial Officer, pursuant to Rule 13a-14(a)/15d-14(a), as adopted pursuant to Section 302 of the Sarbanes-Oxley Act of 2002.
|
|
|
32.1**
|
Certification of the Chief Executive Officer, pursuant to 18 U.S.C. Section 1350, as adopted pursuant to Section 906 of the Sarbanes-Oxley Act of 2002.
|
|
|
32.2**
|
Certification of the Chief Financial Officer, pursuant to 18 U.S.C. Section 1350, as adopted pursuant to Section 906 of the Sarbanes-Oxley Act of 2002.
|
|
|
*
|
Indicates a management contract or compensatory plan.
|
|
|
**
|
Each document marked with an asterisk is filed herewith.
|