Attached files
UNITED STATES
SECURITIES AND EXCHANGE COMMISSION
Washington, D.C. 20549
FORM 10-K/A
(Amendment No. 2)
SAnnual Report Pursuant to Section 13 or 15(d) of the Securities Exchange Act of 1934
For the fiscal year ended June 30, 2010
or
oTransition Report Pursuant to Section 13 or 15(d) of the Securities Exchange Act of 1934
For the Transition Period From ____ to ____
Commission file number: 33-60032
Buckeye Technologies Inc.
(Exact name of registrant as specified in its charter)
|
Delaware
|
62-1518973
|
|
|
(State or other jurisdiction of incorporation or organization)
|
(I.R.S. Employer Identification No.)
|
|
1001 Tillman Street, Memphis, Tennessee
|
38112
|
|
|
(Address of principal executive offices)
|
(Zip Code)
|
Registrant’s telephone number, including area code (901) 320-8100
Securities registered pursuant to Section 12(b) of the Act:
|
Title of Each Class
|
Name of Each Exchange on which Registered
|
|
|
Common Stock, par value $0.01 per share
|
New York Stock Exchange
|
Securities registered pursuant to Section 12(g) of the Act: None
Indicate by check mark if the registrant is a well-known seasoned issuer, as defined in Rule 405 of the Securities Act. Yes o No S
Indicate by check mark if the registrant is not required to file reports pursuant to Section 13 or Section 15(d) of the Act. Yes o No S
Indicate by check mark whether registrant (1) has filed all reports required to be filed by Section 13 or 15(d) of the Securities Exchange Act of 1934 during the preceding 12 months (or for such shorter period that the registrant was required to file such reports), and (2) has been subject to such filing requirements for the past 90 days. Yes S No o
Indicate by check mark whether the registrant has submitted electronically and posted on its corporate Web site, if any, every Interactive Data file required to be submitted and posted pursuant to Rule 405 of Regulation S-T during the preceding 12 months (or for such shorter period that the registrant was required to submit and post such files). Yes o No o
Indicate by check mark if disclosure of delinquent filers pursuant to Item 405 of Regulation S-K is not contained herein, and will be contained, to the best of registrant’s knowledge, in definitive proxy or information statements incorporated by reference in Part III of this Form 10-K or any amendment to this Form 10-K. S
Indicate by check mark whether the registrant is a large accelerated filer, an accelerated filer, a non-accelerated filer or a smaller reporting company. See the definitions of “large accelerated filer,” “accelerated filer” and “smaller reporting company” in Rule 12b-2 of the Exchange Act. (Check one).
|
Large accelerated filer o
|
Accelerated filer S
|
Non-accelerated filer o
|
Smaller Reporting Company o
|
Indicate by a check mark whether the registrant is a shell company (as defined in Rule 12b-2 of the Exchange Act). Yes o No S
As of December 31, 2009, the aggregate market value of the registrant’s voting common equity held by non-affiliates, computed by reference to the price at which the common equity was last sold, was approximately $360 million.
As of September 1, 2010, there were outstanding 39,353,491 Common Shares of the Registrant.
DOCUMENTS INCORPORATED BY REFERENCE
Portions of Buckeye Technologies Inc.’s 2010 Annual Proxy Statement filed with the Commission in connection with the 2010 Annual Meeting of Stockholders (the “2010 Proxy Statement”) were incorporated by reference into Part III of the Annual Report on Form 10-K filed with the Commission on September 2, 2010.
EXPLANATORY NOTE
Buckeye Technologies Inc. (the “Company”) is filing this Amendment No. 2 to its Annual Report on Form 10-K (this “Amendment No. 2”) to amend its Annual Report on Form 10-K for the fiscal year ended June 30, 2010, as filed with the Securities and Exchange Commission (the “Commission”) on September 2, 2010 (the “Original Form 10-K”), as amended by Amendment No. 1 filed with the Commission on January 21, 2011 (“Amendment No. 1”). Amendment No. 1 amended and restated Item 15 and the Exhibit Index of the Original Form 10-K in response to comments from the Commission relative to certain exhibits to the Original Form 10-K. After the Company filed Amendment No. 1, the Commission requested that the Company provide a “full” amendment to the Original Form 10-K and include all parts of Form 10-K, including those that were not being amended. Accordingly, this Amendment No. 2 includes all parts of Form 10-K, including updated certifications of the Company’s Principal Executive Officer and Principal Financial Officer pursuant to Sections 906 and 302 of the Sarbanes-Oxley Act of 2002.
No other item or disclosures appearing in the Original Form 10-K, as amended by Amendment No.1, is affected by this Amendment No. 2 other than those matters specifically described above. This Amendment No. 2 is presented as of the filing date of the Original Form 10-K and does not reflect events occurring after that date, or modify or update disclosures in any way other than as specifically noted above. Accordingly, this Amendment No. 2 should be read in conjunction with the Company’s other filings made with the Commission subsequent to the date of the Original Form 10-K, including any amendments to those filings.
INDEX
BUCKEYE TECHNOLOGIES INC.
|
ITEM
|
PAGE
|
|
|
PART I
|
||
|
1.
|
Business
|
3
|
|
1A.
|
Risk Factors
|
9
|
|
1B.
|
Unresolved Staff Comments
|
14
|
|
2.
|
Properties
|
14
|
|
3.
|
Legal Proceedings
|
14
|
|
4.
|
(Removed and reserved)
|
15
|
|
PART II
|
||
|
5.
|
Market for the Registrant’s Common Equity, Related Stockholder Matters and Issuer Purchases of Equity Securities
|
17
|
|
6.
|
Selected Financial Data
|
19
|
|
7.
|
Management’s Discussion and Analysis of Financial Condition and Results of Operations
|
20
|
|
7A.
|
Qualitative and Quantitative Disclosures About Market Risk
|
33
|
|
8.
|
Financial Statements and Supplementary Data
|
34
|
|
9.
|
Changes in and Disagreements with Accountants on Accounting and Financial Disclosure
|
34
|
|
9A.
|
Controls and Procedures
|
35
|
|
9B.
|
Other information
|
35
|
|
PART III
|
||
|
10.
|
Directors, Executive Officers and Corporate Governance
|
35
|
|
11.
|
Executive Compensation
|
35
|
|
12.
|
Security Ownership of Certain Beneficial Owners and Management and Related Stockholder Matters
|
35
|
|
13.
|
Certain Relationships and Related Transactions, and Director Independence
|
36
|
|
14.
|
Principal Accountant Fees and Services
|
36
|
|
PART IV
|
||
|
15.
|
Exhibits and Financial Statement Schedules
|
36
|
|
Signatures
|
37
|
|
|
OTHER
|
||
|
Index to Consolidated Financial Statements and Schedules
|
F-1
|
|
PART I
Item 1. Business
General
Buckeye Technologies Inc. (sometimes referred to in this report as “we”, “us”, the “Company” or “Buckeye”) is a leading producer of value-added cellulose-based specialty products, headquartered in Memphis, Tennessee. We believe that we have leading positions in many of the high-end niche markets in which we compete. We utilize our expertise in polymer chemistry, leading research and development and advanced manufacturing facilities to develop and produce innovative and proprietary products for our customers. We sell our products to a wide array of technically demanding niche markets in which we believe our proprietary products, manufacturing processes and commitment to customer technical service give us a competitive advantage. We are the only manufacturer in the world offering cellulose-based specialty products made from both wood and cotton and utilizing wetlaid and airlaid technologies. As a result, we believe we produce and market a broader range of cellulose-based specialty products than any of our competitors. We produce precisely tailored products designed to meet individual customer requirements. Our focus on specialty niche markets allows us to establish long-term supply positions with key customers. We operate manufacturing facilities in the United States, Canada, Germany and Brazil.
Cellulose is a natural fiber derived from trees and other plants that is used in the manufacture of a wide array of products. The total cellulose market generally can be divided into two categories: commodity and specialty. Manufacturers use commodity cellulose to produce bulk paper and packaging materials, the markets for which are very large but highly cyclical. Specialty cellulose is used to impart unique chemical or physical characteristics to a diverse range of highly engineered products. Specialty cellulose generally commands higher prices, and demand for specialty cellulose is less cyclical than commodity cellulose. We believe the more demanding performance requirements for products requiring specialty cellulose limit the number of participants in our niche markets. Our focus on niche specialty cellulose markets has enabled us to maintain positive cash flows even during cyclical downturns in the commodity cellulose markets.
Company History
We and our predecessors have participated in the specialty cellulose market for over 85 years and have developed new uses for many cellulose-based products. We began operations as an independent company in March 1993, when we acquired the cellulose manufacturing operations of the Procter & Gamble Company located in Memphis, Tennessee and Perry, Florida (the “Foley Plant”), with Procter & Gamble retaining a 50% limited partnership interest in the Foley Plant. We became a public company in November 1995 and simultaneously acquired and redeemed Procter & Gamble’s remaining interest in the Foley Plant.
In May 1996, we acquired the specialty cellulose business of Peter Temming AG located in Glueckstadt, Germany. That same year, we acquired Alpha Cellulose Holdings, Inc., a specialty cellulose producing facility located in Lumberton, North Carolina. In May 1997, we acquired Merfin International Inc., a leading manufacturer of airlaid nonwovens with facilities located in Canada, Ireland and the United States. In October 1999, we acquired substantially all of the assets of Walkisoft, UPM-Kymmene’s airlaid nonwovens business. The acquisition of Walkisoft added manufacturing facilities in Steinfurt, Germany and Gaston County, North Carolina. In March 2000, we acquired the intellectual property rights to the Stac-Pac® folding technology and the cotton cellulose business of Fibra, S.A. located in Americana, Brazil. In calendar 2001, we commenced operating the world’s largest airlaid nonwovens machine at our Gaston, North Carolina facility and started up a cosmetic cotton fiber line at our Lumberton, North Carolina facility.
Due to a decline in demand for cotton content paper, in August 2003 we closed the specialty cotton papers portion of our Lumberton, North Carolina facility. Due to excess airlaid production capacity around the globe, we closed our single-line airlaid nonwovens facility in Cork, Ireland in July 2004. In December 2005, we ceased production at our cotton linter pulp facility in Glueckstadt, Germany. In conjunction with this closure, we upgraded the capability of our Americana, Brazil manufacturing facility, which was completed during fiscal year 2006.
We are incorporated in Delaware and our executive offices are located at 1001 Tillman Street, Memphis, Tennessee. Our telephone number is (901) 320-8100.
3
Products
Our product lines can be broadly grouped into four categories: chemical cellulose, customized fibers, fluff pulp and nonwoven materials. We manage these products within two reporting segments: specialty fibers and nonwoven materials. The chemical cellulose and customized fibers are derived from wood and cotton cellulose materials using wetlaid technologies. Fluff pulps are derived from wood using wetlaid technology. Wetlaid technologies encompass cellulose manufacturing processes in which fibers are deposited using water. Airlaid nonwoven materials are derived from wood pulps, synthetic fibers and other materials using airlaid technology. Airlaid technology utilizes air as a depositing medium for fibers, one benefit of which is an increased ability as compared to wetlaid processes to mix additional feature-enhancing substances into the material being produced. A breakdown of our major product categories, percentage of sales, product attributes and applications is provided below.
|
Product Groups
|
% of Fiscal 2010
Sales
|
Value Added Attributes
|
Market for End Use Applications
|
|
Specialty Fibers
Chemical Cellulose
Food casings
Rayon industrial
cord
Rayon staple fiber
Cellulose ethers
Wood acetate
Cotton acetate
|
33%
|
Purity and strength
Strength and heat stability
Uniform viscosity and dyeability
High viscosity, low viscosity, purity
and safety
Viscosity uniformity and purity
Transparency/clarity, strength and
purity
|
Hot dog and sausage casings
High performance tires and hose reinforcement
Textiles
Personal care products, low fat dairy products, pharmaceuticals and construction materials
Cigarette filters
Liquid crystal display film for computers and television screens and plastic applications
|
|
Customized Fibers
Filters
Specialty cotton
papers
Cosmetic Cotton
Buckeye UltraFiber 500®
|
15%
|
High porosity and product life
Color permanence and tear resistance
Absorbency, strength and softness
Finishing and crack reduction
|
Automotive, laboratory and industrial filters
Personal stationery, premium letterhead and currency
Cotton balls and cotton swabs
Concrete
|
|
Fluff Pulp
Fluff pulp
|
19%
|
Absorbency and fluid transport
|
Disposable diapers, feminine hygiene products and adult incontinence products
|
|
Nonwoven Materials
Airlaid nonwovens
|
33%
|
Absorbency, fluid management and
wet strength
|
Feminine hygiene products, specialty wipes and mops, tablecloths, napkins, placemats, incontinence products and food pads
|
See Note 18, Segment Information, to the Consolidated Financial Statements for additional information on products.
4
Raw Materials
Slash pine timber and cotton fibers are the principal raw materials used in the manufacture of our specialty fibers products. These materials represent the largest components of our variable costs of production. The region surrounding the Foley Plant has a high concentration of slash pine timber, which enables us to purchase adequate supplies of a species well suited to our products at an attractive cost. In order to be better assured of a secure source of wood at reasonable prices, we have entered into timber purchase agreements which allow us to purchase a portion of our wood at market prices that are fixed annually or current market prices as stated in the agreements. Additional information is included in Note 21, Commitments, to the Consolidated Financial Statements.
We purchase cotton linter fiber either directly from cottonseed oil mills or indirectly through agents or brokers. We purchase the majority of our requirements of cotton fiber for the Memphis and Lumberton plants domestically. The majority of the cotton fiber processed in the Americana plant is purchased in Brazil.
Fluff pulp is the principal raw material used in the manufacture of our nonwoven materials products. Approximately 50% of our fluff pulp usage is internally supplied and the remainder is purchased from several other suppliers. In addition to fluff pulp, our nonwovens products are comprised of synthetic fibers, latex polymers, absorbent powders and carrier tissue depending on grade specifications. These raw materials are also purchased from multiple sources.
The cost and availability of slash pine timber, cotton linter fiber and fluff pulp are subject to market fluctuations caused by supply and demand factors. We do not foresee material constraints from pricing or availability for slash pine timber and fluff pulp. We continue to have raw material availability issues for our cotton linter fibers in both North America and Brazil. We have increased our imported cotton linters purchases for specialty cotton fiber production in Memphis in order to minimize the impact of current constraints on North American cotton fiber availability. This raw material availability constraint will limit our growth and increase production costs.
Our manufacturing processes, especially for specialty fibers, require significant amounts of fuel oil and natural gas. These manufacturing inputs are subject to significant changes in prices, which could adversely affect our operating results.
Sales and Customers
Our products are marketed and sold through a highly trained, technically skilled sales force. We maintain sales offices in the United States, Europe and China. Our worldwide sales are diversified by geographic region as well as end-product application. Our sales are distributed to customers in over 60 countries around the world. Our fiscal 2010 sales reflect this geographic diversity, with 39% of sales in North America, 33% of sales in Europe, 16% of sales in Asia, 4% of sales in South America and 8% in other regions. Approximately 86% of our worldwide sales for fiscal 2010 were denominated in U.S. dollars. Our products are shipped by rail, truck and ocean carrier. Geographic segment data and product sales data are included in Note 18, Segment Information, to the Consolidated Financial Statements.
Sales by geographical destination for the three years ended June 30, 2010 were as follows:
(in millions)
|
Sales by Destination
|
|||||||||||||||||||
|
2010
|
2009
|
2008
|
|||||||||||||||||
|
United States
|
$
|
229
|
30
|
%
|
$
|
245
|
32
|
%
|
$
|
257
|
31
|
%
|
|||||||
|
Germany
|
70
|
9
|
67
|
9
|
72
|
9
|
|||||||||||||
|
Italy
|
53
|
7
|
48
|
6
|
62
|
7
|
|||||||||||||
|
China
|
44
|
6
|
14
|
2
|
16
|
2
|
|||||||||||||
|
Mexico
|
34
|
5
|
46
|
6
|
38
|
5
|
|||||||||||||
|
Canada
|
33
|
4
|
31
|
4
|
31
|
4
|
|||||||||||||
|
Japan
|
32
|
4
|
34
|
5
|
39
|
5
|
|||||||||||||
|
France
|
27
|
4
|
29
|
4
|
31
|
4
|
|||||||||||||
|
Brazil
|
25
|
3
|
25
|
3
|
30
|
3
|
|||||||||||||
|
Spain
|
23
|
3
|
20
|
3
|
26
|
3
|
|||||||||||||
|
All other
|
186
|
25
|
196
|
26
|
224
|
27
|
|||||||||||||
|
Total
|
$
|
756
|
100
|
%
|
$
|
755
|
100
|
%
|
$
|
826
|
100
|
%
|
|||||||
The high-end, technically demanding specialty niche markets that we serve require a higher level of sales and technical service support than do commodity product sales. Our sales, product development and customer service professionals work with customers in their plants to design products tailored precisely to their product needs and manufacturing processes. In addition to a
5
Research and Development
Our research and development activities focus on developing new products, improving existing products and enhancing process technologies to further reduce costs and respond to environmental needs. We have research and development pilot plant facilities in Memphis, and we employ engineers, scientists and technicians who are focused on advanced products and new applications to drive future growth. Our pilot plant facilities allow us to produce, test and deliver breakthrough products to the market place on a more cost-effective basis while minimizing interruptions to the normal production cycles of our operating plants.
Research and development costs of $6.8 million, $7.5 million and $8.2 million were charged to expense as incurred for the years ended June 30, 2010, 2009 and 2008, respectively.
Competition
There are relatively few specialty fibers producers when compared with the much larger commodity paper pulp markets. The technical demands and unique requirements of the high-purity chemical cellulose or customized fiber pulp user tend to differentiate suppliers on the basis of their ability to meet the customer’s particular set of needs, rather than focusing only on pricing. The high-purity chemical cellulose and customized fiber markets are less subject to price variation than commodity paper pulp markets. Major competitors include Rayonier Inc., Borregaard, Sateri International Group (”Sateri”), Neucel Specialty Cellulose Ltd., Sappi Saiccor, Tembec Inc., and Archer Daniels Midland Company.
We believe that the number of producers is unlikely to grow significantly due to the substantial investment required to enter the mature specialty fibers market and due to sufficient existing capacity. However, Sateri reportedly added 250,000 tons of specialty pulp capacity in Brazil (Bahia) during 2008/2009 and is supplying this new volume into the market now. Fortress Paper Ltd. has announced plans to convert a bleached paper mill in Thurso, Quebec to a chemical cellulose mill sometime in 2011. Demand from China for chemical cellulose to support its growing viscose rayon staple fiber market is strong and we expect this demand to continue consistent with the growth of China’s middle class. Thus, this additional chemical cellulose capacity is expected to be readily consumed by China’s growth.
Although global demand for fluff pulp is growing by 3% to 5% annually, we expect fluff pulp prices over the longer term to vary directly with commodity paper pulp prices because fluff pulp is often produced in mills that also produce commodity paper pulp. Over longer periods of time, fluff pulp prices are higher than commodity pulp prices by $40 to $60 per air dry metric tonne on average, but short term variances can be more significant. We use 40,000 to 50,000 metric tons of fluff pulp annually from our Perry, Florida wood cellulose facility as a key raw material in our airlaid nonwovens business. We believe that we currently produce approximately 5% of the world’s supply of fluff pulp. Major competitors include AbitibiBowater Inc., International Paper Company, GP Cellulose, LLC, Rayonier, Weyerhaeuser Corp. and Domtar Corp. We believe the current global output of fluff pulp is approximately 5.1 million tons annually. We understand that future increases in output at Domtar’s Plymouth mill and a conversion project to produce fluff at GP Cellulose’s recently acquired Alabama River Mill could add 300,000 to 500,000 tons of fluff output in the next two years.
Demand for airlaid nonwovens grew significantly in the 1990’s. Since then, significant capacity expansion in 2001, primarily in North America, resulted in the market being oversupplied. Buckeye is a leading supplier of airlaid nonwoven materials worldwide. The markets in which we compete also utilize nonwovens materials produced with technologies other than airlaid such as spunlace. Major nonwovens competitors include Ahlstrom Oyi, Fiberweb Plc, P.H. Glatfelter Company, Duni AB, GP Cellulose, LLC, Kimberly-Clark Corporation and Polymer Group, Inc.
While the North American industry is operating in an environment of excess supply, the European market has been more balanced. Glatfelter announced the new line at their Falkenhagen, Germany facility with an annual capacity in the range of 15,000 to 20,000 metric tons came online in 2009. Additionally, Lycell started up a new airlaid line in Finland in early 2010 reportedly with an annual capacity of approximately 8,000 metric tons. We understand that Fiberweb permanently shut down an airlaid line in Italy in January 2009. In other parts of the world, Fiberweb has started up a second machine in China, which we understand has approximately 10,000 metric tons of annual capacity, and we understand that Sambo started up a 10,000 metric tons per year line in South Korea last year.
6
Intellectual Property
At June 30, 2010 and 2009, we had intellectual property assets recorded totaling $13.2 million and $14.8 million, respectively. These assets include patents, licenses, trademarks and trade names, the majority of which were obtained in the acquisition of airlaid nonwovens businesses and Stac-Pac® technology. We intend to protect our patents and file applications for any future inventions that are deemed to be important to our business operations. The Stac-Pac® packaging technology, a proprietary system for packaging low-density nonwoven materials in compressed cube-shaped bales, is an example of technology we acquired to further differentiate us from our airlaid nonwovens competitors. Stac-Pac® bales facilitate our customers’ high-speed production lines with a continuous flow of material. Stac-Pac® units also reduce freight costs by compressing more material in a bale than can be shipped in a traditional roll form, which enables us to ship the bales more effectively in trucks and containers. Additional information is included in Note 1, Accounting Policies, to the Consolidated Financial Statements.
|
Seasonality
|
Our overall business generally is not seasonal to a substantial extent, although we ship slightly lower specialty fiber volume in the July – September quarter and slightly lower nonwovens volume is shipped in the October – December quarter.
Employees
As of August 15, 2010, we employed approximately 1,400 employees, of whom approximately 73% are employed at our facilities in the United States. Approximately 54% of the U.S. employees are represented by unions at two plants in Perry, Florida and Memphis, Tennessee. Our Foley Plant’s labor agreement is in effect through April 1, 2012. The agreement for the Memphis Plant is in effect through March 18, 2013. At our Canadian facility, the labor agreement expired on June 30, 2009, but was automatically extended until negotiations are completed. A national union provides employee representation for non-management workers at our specialty fibers plant in Americana, Brazil. A works council provides employee representation for non-management workers at our nonwoven materials plant in Steinfurt, Germany. Our plants in Gaston, King and Lumberton, North Carolina are not unionized.
None of our facilities has had labor disputes or work stoppages in recent history. The Foley and Memphis Plants have not experienced any work stoppages due to labor disputes in over 30 years and 50 years, respectively. We consider our relationships with our employees and their representative organizations to be good. An extended interruption of operations at any of our facilities, however, could have a material adverse effect on our business.
Environmental Regulations and Liabilities
Our operations are subject to extensive general and industry-specific federal, state, local and foreign environmental laws and regulations, particularly those relating to air and water quality, waste disposal and the cleanup of contaminated soil and groundwater. We devote significant resources to maintaining compliance with these laws and regulations. Such environmental laws and regulations at the federal level include the Comprehensive Environmental Response, Compensation and Liability Act of 1980, as amended, the Clean Air Act of 1990, as amended, the Clean Water Act of 1972, as amended, the Resource Conservation and Recovery Act of 1976, as amended, the Toxic Substances Control Act of 1976, as amended, and the Safe Drinking Water Act of 1974, as amended. These environmental regulatory programs are primarily administered by the U.S. Environmental Protection Agency (“EPA”). In addition, the individual states and foreign countries in which we operate have adopted and may adopt in the future equivalent or more stringent environmental laws and regulations or have enacted their own parallel environmental programs. We closely monitor our environmental compliance with current environmental requirements and believe that we are in substantial compliance.
We expect that, due to the nature of our operations, we will be subject to increasingly stringent environmental requirements, including standards applicable to wastewater discharges and air emissions, such as emissions of greenhouse gases, and general permitting requirements for our manufacturing facilities. We also expect that we will continue to incur substantial costs to comply with such requirements. Any failure on our part to comply with environmental laws or regulations could subject us to penalties or other sanctions that could materially affect our business, results of operations or financial condition. We cannot currently assess, however, the impact that more stringent environmental requirements may have on our operations or capital expenditure requirements. We do not anticipate that capital expenditures in connection with matters relating to environmental compliance will have a material effect on our results of operations during fiscal year 2011.
7
The Foley Plant, located in Perry, Florida, discharges treated wastewater into the Fenholloway River. Under the terms of an agreement with the Florida Department of Environmental Protection (“FDEP”), approved by the EPA in 1995, we agreed to a comprehensive plan to attain Class III (“fishable/swimmable”) status for our discharge into the Fenholloway River under applicable Florida law (the “Fenholloway Agreement”). The Fenholloway Agreement established a schedule for the filing of necessary permit applications and approvals to implement the following activities, among others: (i) make process changes within the Foley Plant to reduce the coloration of its wastewater discharge, (ii) restore certain wetlands areas, (iii) install a pipeline to relocate the wastewater discharge point into the Fenholloway River to a point closer to the mouth of the river, and (iv) provide oxygen enrichment to the treated wastewater prior to discharge at the new location. Since finalization of the Fenholloway Agreement, we have completed the required process changes within the Foley Plant. In making these in-plant process changes, we incurred significant capital expenditures. Based on the anticipated National Pollutant Discharge Elimination System (“NPDES”) permit conditions, we have incurred and, once a final NPDES permit is issued, expect to incur significant capital expenditures.
We expect to incur additional capital expenditures related to our wastewater treatment and discharge of between $40 million and $60 million over at least five years, possibly beginning as early as fiscal year 2012. The amount and timing of these capital expenditures may vary depending on a number of factors, including when the final NPDES permit is issued and its final terms and conditions. For additional information on environmental matters, see Note 22, Contingencies, to the Consolidated Financial Statements. These possible expenditures could have a material adverse effect on our business, results of operations or financial condition.
The Foley Plant is also subject to FDEP and EPA air emission standards. In 2007, new EPA boiler air emission regulations (boiler Maximum Achievable Control Technology (“MACT”) standards) applicable to the Foley Plant were vacated following a public legal challenge. EPA re-proposed those regulations in April 2010. The public comment period for that proposed rule ended on August 23, 2010, but EPA has not issued its final regulation for the boiler MACT. These regulations may impact both bark boilers at the Foley Plant. However, since EPA has not promulgated a final rule, it is difficult to predict the potential capital expenditures associated with these pending regulations.
Other Information
Our website is www.bkitech.com. We make available, free of charge, through our website under the heading “Investor Relations,” proxy materials, annual reports on Form 10-K, quarterly reports on Form 10-Q and current reports on Form 8-K, and any amendments to those reports filed or furnished pursuant to Section 13(a) or Section 15(d) of the Securities Exchange Act of 1934, as amended. The information on our website is not part of or incorporated by reference in this Annual Report on Form 10-K or any other report that we may file with the Commission.
These reports are also available as soon as reasonably practicable after we electronically file such materials with, or furnish such materials to, the Securities and Exchange Commission, or the SEC. The public may also read and copy any materials we file with the SEC at the SEC’s Public Reference Room at Station Place, 100 F Street NE, Washington, D.C. 20549. The public may obtain information about the operation of the Public Reference Room by calling the SEC at 1-800-SEC-0330. In addition, the SEC maintains an internet site that contains reports, proxy and information statements and other information filed electronically by us, which are available at http://www.sec.gov.
Safe Harbor Provisions
This document contains both historical and forward-looking statements. All statements other than statements of historical fact are, or may be deemed to be, “forward-looking” statements within the meaning of the Private Securities Litigation Reform Act of 1995. These forward-looking statements are not based on historical facts, but rather reflect management’s current expectations concerning future results and events.
These forward-looking statements generally can be identified by the use of statements that include phrases such as "believe," "expect," "anticipate," "intend," "plan," "foresee," "likely," "will" or other similar words or phrases. Similarly, statements that describe management’s objectives, plans or goals are or may be forward-looking statements. These forward-looking statements involve known and unknown risks, uncertainties and other factors that are difficult to predict and which may cause the actual results, performance or achievements to be different from any future results, performance and achievements expressed or implied by these statements.
8
The following important factors, among others, including those set forth below in Item 1A of this Annual Report on Form 10-K, could affect future results, causing these results to differ materially from those expressed in our forward-looking statements: dependence on a single customer; the ability to obtain additional capital, maintain adequate cash flow to service debt as well as meet operating needs; maintaining satisfactory labor relations; an inability to predict the scope of future environmental compliance costs or liabilities; pricing fluctuations and worldwide economic conditions; competition; and fluctuations in the costs and availability of raw materials.
Any forward-looking statements included in this document are only made as of the date of this document and we do not intend nor undertake to publicly update any forward-looking statements to reflect subsequent events or circumstances except as we may be required by law to do so.
Item 1A. Risk Factors
Our operations are subject to a number of risks including those listed below and discussed elsewhere in this Annual Report on Form 10-K (particularly in Item 7. Management’s Discussion and Analysis of Financial Condition and Results of Operations). If any of the events described in the following risk factors actually occur, it could materially affect our results of operations and financial condition.
Risks related to our industry
We are subject to the cyclical changes caused by general global and industry conditions.
The demand and pricing of our products, particularly fluff pulp, are influenced by the much larger market for papermaking pulps which is highly cyclical. The markets for most cellulose and absorbent products are sensitive to both changes in general global economic conditions and to changes in industry capacity. Both of these factors are beyond our control. The price of these products can fluctuate significantly when supply and demand become imbalanced for any reason. Our financial performance can be heavily influenced by these pricing fluctuations and the general cyclicality of the industries in which we compete. Furthermore, a general economic downturn in a particular country or on an international scale could reduce the overall sales within our industry, thereby likely reducing our sales. We cannot assure you that current prices will be maintained, that any price increases will be achieved, or that industry capacity utilization will reach favorable levels. The demand, cost and prices for our products may fluctuate substantially in the future and downturns in market conditions could have a material adverse effect on our business, results of operations and financial condition.
Competition and surplus capacity could adversely affect our operating results and financial condition.
The markets for our products are all competitive. Actions by competitors can affect our ability to sell our products and can affect the volatility of the prices at which our products are sold. Other actions by competitors, such as reducing costs or adding low-cost capacity, may adversely affect our competitive position in the products we manufacture and, consequently, our sales, operating income and cash flows. New competitors and the expansion of existing competitors could create a surplus capacity of the goods that we sell, which might cause us to either lose sales or lower the prices of our goods. Actions by our competitors and any surplus capacity could cause our sales and profits to decline, affecting our operating results and financial condition.
Market fluctuations in the availability and cost of energy and raw materials are beyond our control and may adversely affect our business.
Energy, chemicals, and raw material costs, including fuel oil, natural gas, electricity, cotton linters, wood, and caustic and other chemicals are a significant operating expense. The prices and availability of raw materials and energy can be volatile and are susceptible to rapid and substantial changes due to factors beyond our control such as changing economic conditions, currency fluctuations, weather conditions, political unrest and instability in energy-producing nations, and supply and demand considerations. We have raw material availability issues at our Memphis and Americana specialty fiber plants. We have the option to import cotton linters purchases for our Memphis specialty cotton fiber production in order to minimize the impact of current constraints on North American cotton fiber availability. We have limited production at our Americana, Brazil and Memphis specialty fibers facilities because of raw material constraints. This raw material availability constraint will limit growth and increase our production costs. Energy and chemical costs which had increased substantially in recent years, resulting in increased production costs for our products, have recently moderated. Increases in production costs could have a material adverse effect on our business, financial condition and results of operations. In addition to increased costs, it is possible that a disruption in supply of natural gas or other fossil fuels could limit our ability to operate our facilities.
9
Market fluctuations in the availability and cost of transportation are beyond our control and may adversely impact our business.
Our business depends on the transportation of a large number of products, both domestically and internationally. An increase in transportation rates or fuel surcharges and/or a reduction in transport availability in truck, rail and international shipping could negatively impact our ability to provide products to our customers in a timely manner. An increase in international shipping rates or fuel surcharges or a reduction in the availability of vessels could negatively impact our costs and our ability to provide products to our international customers in a timely manner. While we have had adequate transportation availability, there is no assurance that such availability can continue to be effectively managed in the future.
Risks related to our business
Exposure to commodity products creates volatility in pricing and profits.
If our research and development efforts do not result in the commercialization of new, proprietary products, we will continue to have significant exposure to fluff pulp, which could result in volatility in sales prices and profits.
Our indebtedness levels could adversely affect us.
As of June 30, 2010, our total debt was approximately $237.5 million and our total debt, as a percentage of total capitalization, was 35%. Our level of debt could have a significant adverse future effect on our business. For example:
- we may have limited ability to borrow additional amounts for working capital, capital expenditures, acquisitions, debt service requirements, execution of our growth strategy, research and development costs or other purposes;
- a substantial portion of our cash flow may be used to pay principal and interest on our debt, which will reduce the funds available for working capital, capital expenditures, acquisitions and other purposes;
- our senior secured credit facility covenants require us to meet certain financial objectives and impose other restrictions on business operations. These covenants and those contained in the indenture governing our senior notes limit our ability to borrow additional funds or dispose of assets and limit our flexibility in planning for and reacting to changes in our business;
- we may be more vulnerable to adverse changes in general economic, industry and competitive conditions and adverse changes in government regulation;
- our debt level and the various covenants contained in the indenture related to our senior notes and the documents governing our other existing indebtedness may place us at a relative competitive disadvantage as compared to certain of our competitors; and
- our borrowings under our senior secured credit facility are at floating rates of interest, which could result in higher interest expense in the event of an increase in interest rates.
Our ability to pay principal of and interest on our senior notes, to service our other debt and to refinance indebtedness when necessary depends on our financial and operating performance, each of which is subject to prevailing economic conditions and to financial, business and other factors beyond our control.
We cannot assure you that we will generate sufficient cash flow from operations or that we will be able to obtain sufficient funding to satisfy all of our obligations. If we are unable to pay our debts, we will be required to pursue one or more alternative strategies, such as selling assets, refinancing or restructuring our indebtedness or selling additional equity capital. However, we cannot assure you that any alternative strategies will be feasible at the time or prove adequate. Also, certain alternative strategies will require the consent of our senior secured lenders before we engage in any such strategy.
Changes in credit ratings issued by nationally recognized statistical rating organizations could adversely affect our cost of financing and have an adverse effect on the market price of our securities.
Credit rating agencies rate our debt securities on factors that include our operating results, actions that we take, their view of the general outlook for our industry and their view of the general outlook for the economy. Actions taken by the rating agencies can include maintaining, upgrading or downgrading the current rating or placing the company on a watch list for possible future downgrading. Downgrading the credit rating of our debt securities or placing us on a watch list for possible future downgrading could limit our access to the credit markets, increase our cost of financing, and have an adverse effect on the market price of our securities.
10
A material disruption at one of our manufacturing facilities could prevent us from meeting customer demand, reduce our sales or negatively affect our results of operation and financial condition.
Any of our manufacturing facilities, or any of our machines within an otherwise operational facility, could cease operations unexpectedly due to a number of events, including:
- unscheduled maintenance outages;
- prolonged power failures;
- an equipment failure;
- a chemical spill or release;
- explosion of a boiler;
- labor difficulties;
- disruptions in the transportation infrastructure, including roads, bridges, railroad tracks and tunnels;
- fires, floods, windstorms, earthquakes, hurricanes or other catastrophes;
- terrorism or threats of terrorism;
- governmental regulations; and
- other operational problems.
We may be required to pay significant export taxes or countervailing and anti-dumping duties for exported products.
We may experience reduced revenues and margins on some of our businesses as a result of export taxes or countervailing and anti-dumping duty applications. It is possible that countervailing duty and antidumping tariffs, or similar types of tariffs could be imposed on us in the future. These tariffs could have a material adverse effect on our business, financial results and financial condition.
The impacts of climate-related initiatives, at the international, federal and state levels, remain uncertain at this time.
Currently, there are numerous international, federal and state-level initiatives and proposals addressing domestic and global climate issues. Within the U.S., most of these proposals would regulate and/or tax, in one fashion or another, the production of carbon dioxide and other “greenhouse gases” to facilitate the reduction of carbon compound emissions to the atmosphere, and provide tax and other incentives to produce and use more “clean energy.” For example, in 2009 the U.S. House of Representatives passed the Markey-Waxman bill (HR 2454), which would establish a so-called “cap and trade” regime and new permitting requirements to regulate greenhouse gas generation, as well as provide an incentive for the production and use of clean energy. To date, the U.S. Senate has not passed any comparable legislation. In sum, we believe that the potential for climate change legislation on the federal level is unknown. In addition, in late 2009, the U.S. EPA issued an “endangerment finding” under the Clear Air Act (“CAA”) with respect to carbon dioxide, which could lead to the regulation of carbon dioxide as a criteria pollutant under the CAA and have significant ramifications for us and the industry in general. On the international front, the United Nations Climate Change Conference in Copenhagen, which took place in December 2009, did not result in any significant progress toward a binding agreement to replace the Kyoto Protocol, which expires in 2012.
We are dependent upon attracting and retaining key personnel.
We believe that our success depends, to a significant extent, upon our ability to attract and retain key senior management and operations management personnel. Our failure to recruit and retain these key personnel could adversely affect our financial condition or results of operations.
Our failure to maintain satisfactory labor relations could have a material adverse effect on our business.
If our negotiations with the representatives of the unions, to which many of our employees belong, are not successful, our
11
Employee representation is provided by a national union for non-management workers at our specialty fibers plant in Americana, Brazil, and a works council at our nonwoven materials plant in Steinfurt, Germany. Our plants in Gaston, Lumberton and King, North Carolina are not unionized.
The failure to renegotiate labor agreements in a timely manner could lead to a curtailment or stoppage of work at our factories. If we negotiated a labor agreement on unfavorable terms, our production costs will increase. A reduction in production or increasing the costs of production would lower our profits and harm our business.
Compliance with extensive general and industry specific environmental laws and regulations requires significant resources, and the significant associated costs may adversely affect our business.
Our operations are subject to extensive general and industry-specific federal, state, local and foreign environmental laws and regulations, particularly those relating to air and water quality, waste disposal and the cleanup of contaminated soil and groundwater. We devote significant resources to maintaining compliance with these laws and regulations. Such environmental laws and regulations at the federal level include the Comprehensive Environmental Response, Compensation and Liability Act of 1980, as amended, the Clean Air Act of 1990, as amended, the Clean Water Act of 1972, as amended, the Resource Conservation and Recovery Act of 1976, as amended, the Toxic Substances Control Act of 1976, as amended, and the Safe Drinking Water Act of 1974, as amended. These environmental regulatory programs are primarily administered by the U.S. Environmental Protection Agency (“EPA”). In addition, the individual states and foreign countries in which we operate have adopted and may adopt in the future equivalent or more stringent environmental laws and regulations or have enacted their own parallel environmental programs. We closely monitor our environmental compliance with current environmental requirements and believe that we are in substantial compliance.
We expect that, due to the nature of our operations, we will be subject to increasingly stringent environmental requirements, including standards applicable to wastewater discharges and air emissions, such as emissions of greenhouse gases, and general permitting requirements for our manufacturing facilities. We also expect that we will continue to incur substantial costs to comply with such requirements. Any failure on our part to comply with environmental laws or regulations could subject us to penalties or other sanctions that could materially affect our business, results of operations or financial condition. We cannot currently assess, however, the impact that more stringent environmental requirements may have on our operations or capital expenditure requirements. We do not anticipate that capital expenditures in connection with matters relating to environmental compliance will have a material effect on our earnings during fiscal year 2011.
Compliance with recently passed legislation may adversely affect our business.
In March 2010, Congress passed the Patient Protection and Affordable Care Act and the Health Care and Education Affordability Reconciliation Act (collectively, the “Acts”). Among other things, the Acts contain provisions that will affect employer-sponsored health care plans, impose excise taxes on certain plans, and reduce the tax benefits available to employers that receive the Medicare Part D subsidy. We are currently reviewing provisions of the Acts and their impact on our company-sponsored plans. We are currently unable to estimate costs associated with compliance with the Acts.
Because approximately 70% of our sales are to customers outside the United States, we are subject to the economic and political conditions of foreign nations.
We have manufacturing facilities in four countries and sell products in approximately 60 countries. For the fiscal year ended June 30, 2010, sales of our products outside the United States represented approximately 70% of our sales. The global economy and relative strength or weakness of the U.S. dollar can have a significant impact on our sales. In addition, although approximately 83% of our sales are denominated in U.S. dollars, it is possible that as we expand globally, we will face increased risks associated with operating in foreign countries, including:
- the risk that foreign currencies will be devalued or that currency exchange rates will fluctuate;
|
|
-
|
the risk that limitations will be imposed on our ability to convert foreign currencies into U.S. dollars or on our foreign subsidiaries' ability to remit dividends and other payments to the United States;
|
12
|
|
-
|
the risk that our foreign subsidiaries will be required to pay withholding or other taxes on remittances and other payments to the United States or that the amount of any such taxes will be increased;
|
- the risk that certain foreign countries may experience hyperinflation; and
- the risk that foreign governments may impose or increase investment or other restrictions affecting our business.
Any of these risks could have a material adverse effect on our business, results of operations or financial condition.
Risks related to ownership of our common stock
The price of our common stock may be volatile.
The market price of our common stock may be influenced by many factors, some of which are beyond our control, including those described above under “Risks Related to our Industries and Business” and the following:
- actual or anticipated fluctuations in our operating results or our competitors’ operating results;
|
|
-
|
announcements by us or our competitors of new products, capacity changes, significant contracts, acquisitions or strategic investments;
|
- our growth rate and our competitors’ growth rates;
- the financial market and general economic conditions;
|
|
-
|
changes in stock market analyst recommendations regarding us, our competitors or our industry generally, or lack of analyst coverage of our common stock;
|
|
|
-
|
sales of our common stock by our executive officers, directors and significant stockholders or sales of substantial amounts of common stock; and
|
- changes in accounting principles.
In addition, there has been significant volatility in the market price and trading volume of securities of companies operating in our industry that often has been unrelated to the operating performance of particular companies.
Some companies that have had volatile market prices for their securities have had securities litigation brought against them. If litigation of this type is brought against us, it could result in substantial costs and would divert management’s attention and resources.
13
Item 1B. Unresolved Staff Comments
None.
Item 2. Properties
Corporate Headquarters. Our corporate headquarters, research and development laboratories, and pilot plants are located in Memphis, Tennessee.
Specialty Fiber Plants
Memphis Plant. The Memphis Plant is located on approximately 75 acres adjacent to the headquarters complex and has a capacity of approximately 100,000 annual metric tons of cotton cellulose. As of June 30, 2010, the Memphis Plant operated at about 50% of its capacity.
Foley Plant. The Foley Plant is located at Perry, Florida, on a 2,900 acre site and has a capacity of approximately 465,000 annual metric tons of wood cellulose. In connection with the acquisition of the Foley Plant, we also own 13,000 acres of real property near the plant site. As of June 30, 2010, the Foley Plant operated at approximately 100% of its capacity.
Lumberton Plant. The Lumberton Plant is located in Lumberton, North Carolina on a 65-acre site and has a capacity of approximately 8,000 annual metric tons of cosmetic cotton fiber. As of June 30, 2010, the Lumberton Plant operated at approximately 100% of its capacity.
Americana Plant. The Americana Plant is located in the city of Americana in the state of Sao Paulo, Brazil on 27 acres and is part of a multi-business industrial site with a capacity of approximately 40,000 annual metric tons of cotton cellulose. As of June 30, 2010, the Americana Plant operated at about 30% of its capacity.
Nonwovens Plants
The stated capacity of airlaid nonwovens machines is based upon an assumed mix of products. The flexible nature of airlaid technology allows for a wide range of materials to be produced. Machine production capability has typically been lower than the stated capacity, often by factors of 10-20%, when adjusted to reflect the actual product mix. Based on current product mix, utilization of our airlaid machines worldwide, as of June 30, 2010, was approximately 75% of their capacity.
Delta Plant. The Delta Plant is located in Delta, British Columbia on a 12-acre industrial park site and has a total capacity of approximately 30,000 annual metric tons of airlaid nonwovens (26,000 based on current production mix) from two production lines.
Steinfurt Plant. The Steinfurt Plant is located in Steinfurt, Germany on an 18-acre site and has a total capacity of approximately 30,000 annual metric tons of airlaid nonwovens from two production lines.
Gaston Plant. The Gaston Plant is located in Gaston County near Mt. Holly, North Carolina on an 80-acre site and has a total capacity of approximately 60,000 annual metric tons of airlaid nonwovens (43,000 annual metric tons based on current production mix) from two production lines.
King Plant. The King Plant is located in King, North Carolina and converts airlaid materials and wetlaid papers into wipes, towels and tissues for industrial and commercial uses.
We own our corporate headquarters, the Memphis Plant, the Foley Plant, the Lumberton Plant, the Americana Plant, the Delta Plant, the Steinfurt Plant and the Gaston Plant. We lease buildings that house the King Plant, the sales offices in Europe and China and distribution facilities in Savannah, Georgia. All of the facilities located in the United States are pledged as collateral for certain debt agreements.
We believe that our specialty fibers and nonwoven materials manufacturing facilities and administrative buildings are adequate to meet current operating demands.
Item 3. Legal Proceedings
We are involved from time to time in routine legal matters and other claims incidental to our business. We review outstanding claims and proceedings internally and with external counsel as necessary to assess the probability and amount of potential loss. These assessments are re-evaluated at each reporting period and as new information becomes available to determine whether a
14
Item 4. (Removed and Reserved)
Executive Officers of the Registrant
The names, ages and positions held by our executive officers on September 1, 2010 are:
|
Name
|
Age
|
Position
|
Elected to Present Position
|
|
John B. Crowe
|
63
|
Chairman of the Board, Chief Executive Officer and Director
|
July 2006
|
|
Kristopher J. Matula
|
48
|
President, Chief Operating Officer and Director
|
July 2006
|
|
Charles S. Aiken
|
60
|
Sr. Vice President, Energy and Sustainability
|
October 2003
|
|
Sheila Jordan Cunningham
|
58
|
Sr. Vice President, General Counsel and Secretary
|
April 2000
|
|
Steven G. Dean
|
54
|
Sr. Vice President and Chief Financial Officer
|
July 2007
|
|
Douglas L. Dowdell
|
52
|
Sr. Vice President, Specialty Fibers
|
February 2006
|
|
Paul N. Horne
|
55
|
Sr. Vice President, Product and Market Development
|
February 2006
|
|
Marko M. Rajamaa
|
49
|
Sr. Vice President, Nonwovens
|
October 2006
|
John B. Crowe
Chairman of the Board, Chief Executive Officer and Director
Mr. Crowe has served as Chairman of the Board and Chief Executive Officer since July 1, 2006. He served as President and Chief Operating Officer from April 2003 to July 2006. He was elected as a director of Buckeye in August 2004. He served as Senior Vice President, Wood Cellulose from January 2001 to April 2003. He served as Vice President, Wood Cellulose Manufacturing from January 1998 to January 2001. Prior to joining us, he was Executive Vice President/General Manager of Alabama River Pulp and Alabama Pine Pulp Operations, a division of Parsons and Whittemore, Inc. and was Vice President and Site Manager of Flint River Operations, a subsidiary of Weyerhauser Company. From 1979 to 1992, he was an employee of Procter & Gamble.
Kristopher J. Matula
President, Chief Operating Officer and Director
Mr. Matula has served as President and Chief Operating Officer since July 1, 2006. He was elected as a director of Buckeye in April 2007. He served as Executive Vice President and Chief Financial Officer from October 2003 to July 2006. He served as Senior Vice President, Nonwovens and Corporate Strategy from April 2003 to October 2003. He served as Senior Vice President, Nonwovens from January 2001 to April 2003. He served as Senior Vice President, Commercial - Absorbent Products from July 1997 to January 2001 and as Vice President, Corporate Strategy from April 1996 to July 1997. Prior to joining Buckeye in 1994, he held various positions with Procter & Gamble and General Electric.
Charles S. Aiken
Senior Vice President, Energy and Sustainability
Mr. Aiken has served as Senior Vice President, Energy and Sustainability since January 1, 2010. He served as Senior Vice President, Manufacturing from October 2003 to January 2010. He served as Senior Vice President, Nonwovens Manufacturing from April 2000 to October 2003. He served as Vice President, Business Systems from April 1998 to April 2000 and as Vice President, Foley Plant from June 1995 to April 1998. He was an employee of Procter & Gamble from 1977 to March 1993.
Sheila Jordan Cunningham
Senior Vice President, General Counsel and Secretary
Ms. Cunningham has served as Senior Vice President, General Counsel and Secretary since April 2000. She served as Vice President, General Counsel and Secretary from April 1998 to April 2000. She served as Assistant General Counsel from March 1997 to April 1998 and as Secretary from July 1997 to April 1998. Prior to joining us, she was a partner in the law firm of Baker, Donelson, Bearman, Caldwell, & Berkowitz, P.C.
Steven G. Dean
Senior Vice President and Chief Financial Officer
Mr. Dean has served as Senior Vice President and Chief Financial Officer since July 1, 2007. He served as Vice President and Chief Financial Officer from July 2006 to July 2007. He served as Vice President and Controller from February 2006 to July 2006. Mr. Dean served as Company Controller from December 2005 to February 2006. Previously, he served as Controller for
15
Douglas L. Dowdell
Senior Vice President, Specialty Fibers
Mr. Dowdell has served as Senior Vice President, Specialty Fibers since February 1, 2006. He served as Senior Vice President, Nonwovens from February 2005 to February 2006. He served as Vice President, Nonwovens from October 2003 to February 2005. He served as Vice President, Absorbent Wood Fiber Sales from February 2002 to October 2003. He served as Vice President, Nonwovens Business Development from February 2001 to February 2002. He served as Vice President, Absorbent Products Business Development from August 2000 to February 2001. Prior to August 2000 he held several positions in the Company including: Manager, Absorbent Fiber Sales; Manager, Business Development; and Manager, Wood Procurement. He was an employee of Procter & Gamble from 1988 to March 1993.
Paul N. Horne
Senior Vice President, Product and Market Development
Mr. Horne has served as Senior Vice President, Product and Market Development since February 1, 2006. He served as Senior Vice President, Cotton Cellulose from January 2001 to February 2006. He served as Senior Vice President, Commercial - Specialty Cellulose from July 1997 to January 2001 and as Vice President, North and South American Sales from October 1995 to July 1997. He was an employee of Procter & Gamble from 1982 to March 1993.
Marko M. Rajamaa
Senior Vice President, Nonwovens
Mr. Rajamaa has served as Senior Vice President, Nonwovens since October 26, 2006. He served as Vice President, Nonwovens from February 2006 to October 2006 and as Vice President, Nonwovens Sales – Europe and Middle East from January 2002 to February 2006. Previously, he served as Manager, Nonwoven Sales, Europe, Middle East and Africa from 1999 to 2002. Prior to joining Buckeye in 1999, he held various sales management positions with Walkisoft / UPM-Kymmene.
16
PART II
Item 5. Market for the Registrant’s Common Equity, Related Stockholder Matters and Issuer Purchases of Equity Securities
Our common stock is traded on the New York Stock Exchange under the symbol BKI. There were approximately 7,125 shareholders on August 20, 2010, based on the number of record holders of our common stock and an estimate of the number of individual participants represented by security position listings. The table below sets forth the high and low sales prices for our common stock.
|
Year Ended June 30
|
|||||||||||||
|
2010
|
2009
|
||||||||||||
|
High
|
Low
|
High
|
Low
|
||||||||||
|
First quarter (ended September 30)
|
$
|
11.32
|
$
|
4.56
|
$
|
10.51
|
$
|
7.29
|
|||||
|
Second quarter (ended December 31)
|
12.09
|
8.12
|
8.71
|
3.14
|
|||||||||
|
Third quarter (ended March 31)
|
13.08
|
10.18
|
4.74
|
1.65
|
|||||||||
|
Fourth quarter (ended June 30)
|
15.17
|
9.95
|
5.66
|
2.15
|
|||||||||
We did not make any dividend payments during the years ended June 30, 2010 or 2009. On August 3, 2010, our Board of Directors declared a quarterly dividend of $0.04 per share of common stock. The dividend is payable on September 15, 2010 to stockholders of record as of the close of business on August 16, 2010. Each quarterly dividend payment is subject to review and approval by our Board of Directors, and we evaluate our dividend payment amount on an annual basis at the end of each fiscal year. Our 2013 notes limit the funds available to make dividend payments. We did not repurchase any shares of our common stock during the year ended June 30, 2010 and we repurchased 0.1 million shares during the year ended June 30, 2009. At June 30, 2010, we have remaining approximately 5.6 million shares that we are authorized by our Board of Directors to repurchase. The amount we distribute as dividends and the number of shares that we ultimately repurchase will depend on our financial results and ability to comply with certain conditions under our most restrictive debt agreements at the time of distribution or repurchase.
See the table labeled ‘Equity Compensation Plan Information” to be contained in the 2010 Proxy Statement, incorporated by reference in Part III, Item 12 of this Annual Report on Form 10-K.
Part II, Item 12 of this Annual Report on Form 10-K is incorporated herein by this reference.
17
Performance Graph
The line graph below compares the cumulative total stockholder return on our common stock with the cumulative total return of the Standard & Poor’s 500 Index, the Russell 2000 Index, the New York Stock Exchange (“NYSE”) Paper & Allied Products peer group, and the New York Stock Exchange (“NYSE”) Paper & Allied Products peer group excluding KMB for the five fiscal years ended June 30, 2010. The graph and table assume that $100 was invested on June 30, 2005 in each of our common stock, the Standard & Poor’s index, the Russell 2000 Index, the NYSE Paper & Allied Products peer group and the NYSE Paper & Allied Products peer group excluding KMB and that all dividends were reinvested.
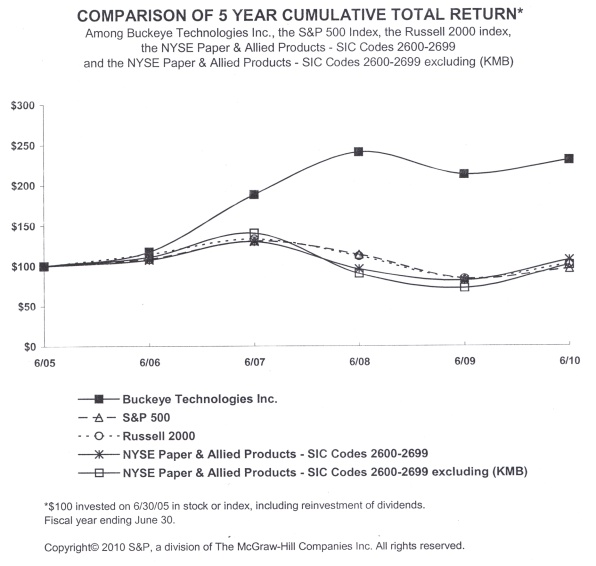 |
|
2005
|
2006
|
2007
|
2008
|
2009
|
2010
|
||
|
Buckeye Technologies Inc.
|
100.00
|
117.48
|
188.45
|
241.08
|
213.41
|
231.03
|
|
|
S&P 500
|
100.00
|
108.63
|
131.00
|
113.81
|
83.98
|
96.09
|
|
|
Russell 2000
|
100.00
|
114.58
|
133.41
|
111.80
|
83.84
|
101.85
|
|
|
NYSE Paper & Allied Products – SIC Codes 2600-2699 (U.S. & Foreign Cos.) excluding KMB
|
100.00
|
107.22
|
130.01
|
96.03
|
81.56
|
106.82
|
|
|
NYSE Paper & Allied Products - SIC Codes 2600-2699 (U.S. & Foreign Cos.)
|
100.00
|
110.80
|
140.46
|
90.14
|
72.26
|
100.68
|
|
18
We are transitioning from the S&P 500 as our broad-based index to the Russell 2000. We believe that the Russell 2000 index provides a more relevant benchmark for a company of our size. Buckeye Technologies Inc. is included in the Russell 2000 index. We are also transitioning our peer group from NYSE Paper and Allied Products SIC codes 2600 – 2699 to NYSE Paper and Allied Products SIC Codes 2600 – 2699 excluding Kimberly-Clark Corporation (“KMB”). We believe that due to KMB’s large market capitalization relative to the other companies in the peer group, the peer group results are skewed towards KMB’s results and as such are not as relevant a benchmark for our performance.
Item 6. Selected Financial Data
Selected Financial Data
|
In thousands, except per share data
|
Year Ended June 30
|
|||||||||||||||
|
2010(a)
|
2009(b)
|
2008(c)
|
2007 (d)
|
2006 (e)
|
||||||||||||
|
Operating Data:
|
||||||||||||||||
|
Net sales
|
$
|
756,426
|
$
|
754,529
|
$
|
825,517
|
$
|
769,321
|
$
|
728,485
|
||||||
|
Operating income (loss)
|
146,466
|
(22,639
|
)
|
100,333
|
81,211
|
44,420
|
||||||||||
|
Net income (loss)
|
114,574
|
(65,388
|
)
|
47,102
|
30,118
|
1,980
|
||||||||||
|
Basic earnings (loss) per share
|
$
|
2.95
|
$
|
(1.69
|
)
|
$
|
1.21
|
$
|
0.80
|
$
|
0.05
|
|||||
|
Diluted earnings (loss) per share
|
$
|
2.90
|
$
|
(1.69
|
)
|
$
|
1.20
|
$
|
0.79
|
$
|
0.05
|
|||||
|
Balance sheet data:
|
||||||||||||||||
|
Total assets
|
$
|
852,454
|
$
|
792,384
|
$
|
1,009,225
|
$
|
951,822
|
$
|
948,213
|
||||||
|
Total long-term debt and capital leases (including current portion)
|
$
|
237,332
|
$
|
327,465
|
$
|
394,268
|
$
|
445,893
|
$
|
522,090
|
||||||
|
Ratio of earnings to fixed charges (f)
|
7.3x
|
(52,264
|
)
|
$
|
2.9x
|
2.1x
|
$
|
(497
|
)
|
|||||||
|
(a)
|
Includes a pretax charge of $3,353 ($2,095 after tax) for restructuring costs. Includes a pretax benefit of $77,677 ($76,791 after tax) for alternative fuel mixture credits. Includes a pretax charge of $2,606 ($1,629 after tax) for early extinguishment of debt. Includes an after tax benefit of $5,415 for investment tax credits on prior period energy project expenditures.
|
|
(b)
|
Includes a pretax charge of $138,008 ($127,598 after tax) for goodwill impairment. Includes a pretax benefit of $54,232 ($39,644 after tax) for alternative fuel mixture credits. Includes a pretax benefit of $401 ($261 after tax) for early extinguishment of debt.
|
|
(c)
|
Includes a pretax charge of $623 ($392 after tax) for early extinguishment of debt.
|
|
(d)
|
Includes a pretax benefit of $2,000 ($1,274 after tax) from a water conservation partnership payment. Includes $1,867 ($1,171 after tax) from reversal of accrued interest related to cancellation of a contingent note. Includes a pretax charge of $1,249 ($812 after tax) for restructuring costs and $832 ($521 after tax) for early extinguishment of debt.
|
|
(e)
|
Includes a pretax charge of $5,616 ($3,497 after tax) for restructuring and impairment costs.
|
|
(f)
|
Earnings were inadequate to cover fixed charges during fiscal years 2009 and 2006. Amount reflects the deficit of earnings to fixed charges. See Exhibit 12.1 for computation.
|
19
Item 7. Management’s Discussion and Analysis of Financial Condition and Results of Operations
The following Management's Discussion and Analysis of Results of Operations and Financial Condition ("MD&A") summarizes the significant factors affecting our results of operations, liquidity, capital resources and contractual obligations, as well as discussing our critical accounting policies. This discussion should be read in conjunction with the Consolidated Financial Statements, Notes to the Consolidated Financial Statements, and other sections of this Annual Report on Form 10-K. Our MD&A is composed of four major sections; Executive Summary, Results of Operations, Financial Condition and Critical Accounting Policies and Estimates. Unless otherwise indicated, references to a year (e.g., “2010”) refers to our fiscal year ended June 30 of that year.
Executive Summary
We manufacture and distribute value-added cellulose-based specialty products used in numerous applications, including disposable diapers, personal hygiene products, engine, air and oil filters, concrete reinforcing fibers, food casings, cigarette filters, rayon filaments, acetate plastics, thickeners and papers. Our products are produced in the United States, Canada, Germany and Brazil, and we sell these products in approximately 60 countries worldwide. We generate revenues, operating income and cash flows from two reporting segments: specialty fibers and nonwoven materials. Specialty fibers are derived from wood and cotton cellulose materials using wetlaid technologies. Our nonwoven materials are derived from wood pulps, synthetic fibers and other materials using an airlaid process.
Our strategy is to continue to strengthen our position as a leading supplier of cellulose-based specialty products. Our key focus areas over the next twelve months include maximizing cash flow, optimizing capacity utilization, investing in the Foley Energy Project, identifying new bio-energy initiatives that support profitable, sustainable growth, and accelerating the rate of change to a Lean Enterprise culture. We plan to take a balanced approach in allocating capital between debt reduction, investment in high rate of return projects, and returning cash to shareholders.
Our 2010 financial results were much improved. Toward the end of 2009, we began to recover from the deepest economic recession since the Great Depression, which had had a noticeable impact on our markets beginning in October 2008. This improving trend continued and accelerated throughout 2010. While not satisfied with our overall results, we are pleased with the consistent improvement each quarter over the course of the year. The versatility of our wood specialty facility allowed us to focus on other specialty markets to remain sold out at the beginning of the year after taking some market downtime in the third quarter of 2009. As our key markets returned to full strength, we continued to improve our product mix throughout the year. Our new office in Beijing, China (opened in January 2009) is adding value by increasing sales of our products in China.
Net sales for 2010 were $756 million compared to $755 million in 2009, with the Specialty Fibers segment market sales (excluding intercompany sales) down 1% and sales in the Nonwoven Materials segment up 3%. Higher shipment volume had a positive $37 million impact on sales compared to 2009, while lower selling prices and unfavorable mix reduced sales by $37 million. Market shipment volume was up 5% for our specialty fibers segment and 5% for our nonwovens segment. While selling prices have been trending up over the past several quarters, total year average prices are down year over year by about 4% overall. This was partly due to lower fluff pulp prices (-6%) and partly due to reduced prices for higher purity specialty grades and nonwovens products reflecting lower input costs.
Operating income for 2010 was $146 million compared to a loss of $23 million in 2009. A large part of the $169 million improvement is explained by two items – last year’s $138 million non-cash goodwill impairment charge and an increase of $23 million in income from the alternative fuel mixture credit in 2010. Total gross margin increased by $12 million in spite of only a slight ($2 million) increase in sales revenue, largely due to the return to profitability of our Memphis cotton specialty fibers plant and higher sales and improved margins in our nonwovens segment. Total gross margin for our wood specialty products was down about $7 million year over year due to sales mix and the $4 million impact of a power outage and voltage surge at our Florida specialty fibers facility in June. Gross margin as a percentage of sales improved from 14.5% to 16.0%. Partially offsetting the improvement in gross margin were restructuring costs of $3 million related to headcount reductions required to (i) reduce selling, research and administrative expenses, (ii) to reduce costs at our Memphis plant based on reduced capacity utilization, and (iii) to restructure our UltraFiber sales force. Total headcount enrollment as of June 30, 2010 was 1,410 compared to 1,444 one year earlier and 1,518 two years earlier. Selling, research and administrative (“SRA”) expenses of $48 million were up $2 million over the prior year due to higher employee bonus accruals, but SRA expenses are expected to drop to the $44 million range in 2011 as a result of these restructuring actions.
20
Net earnings for 2010 of $115 million, or $2.90 per diluted share, were up $180 million or $4.59 per diluted share compared to 2009. Last year’s goodwill impairment charge accounted for $3.30 of this improvement and the increase in income from the alternative fuel mixture credit accounted for an additional $0.91. Excluding these two items along with restructuring costs, early debt extinguishment costs and investment tax credits related to prior period expenditures, adjusted EPS (reconciled below) improved from $0.59 per diluted share in 2009 to $0.91 per share in 2010. The impact of the improved gross margin net of higher SRA expenses mentioned above added $0.19 to earnings. Net interest expense for the year was down $12 million or 40%, adding an additional $0.19 to EPS for the year, but a higher effective tax rate reduced earnings by $0.08 compared to the prior year. The effective tax rates on income excluding the goodwill impairment charge and income from alternative fuel mixture credit were 35.5% in 2010 compared to 29.6% in 2009.
Net cash provided by operating activities in 2010 totaled $125 million, including $25 million from the alternative fuel mixture credit, enabling us to reduce total debt to $238 million on June 30, 2010. We have made significant progress reducing our debt and improving our balance sheet. Reducing total debt by $90 million this year, retiring $110 million of 2010 bonds and $60 million of our 2013 bonds were significant milestones for Buckeye. Net interest expense for the year was $18 million, compared to $29 million in 2009. Most of the reduction in interest expense came from lower total debt, but also from exchanging 8.0% and 8.5% bond debt for our banking facility debt of LIBOR plus 1.25%. A top priority continues to be generating free cash flow. Our debt target is to be in a range of 2.0-2.5 EBITDA. On July 28, 2010 we received our 2010 U.S. federal income tax refund of $67 million. We used this refund to reduce the outstanding balance on our credit facility. After this reduction, our debt to EBITDA ratio was below the target range. There will be times when we will be well below that range; however, this provides us with the flexibility to take advantage of potential opportunities to improve shareholder value.
Our capital spending for the year just completed was $47.5 million. This included $12.3 million in spending on the Florida Energy Project, which is on schedule to be complete with full startup in the first quarter of 2012. Incentives received in 2010 related to spending to-date on this project included a $7.4 million State of Florida grant received in the first quarter and $6.6 million in section 48 federal investment tax credits received as part of the 2009 tax refund in June 2010. We expect to see some benefits of the project beginning as early as the second quarter of 2011.
Over the past two fiscal years, the alternative fuel mixtures credits (“AFMC”), which expired on December 31, 2009, have generated significant net income and cash flow for Buckeye, and have allowed us to reach our debt reduction goals much more quickly than would have otherwise been the case. During this period, the AFMC generated $131.9 million in operating income and added $116.4 million in net income or $2.97 per share. Net cash provided by operating activities increased by $63.4 million during this period. On a cumulative basis through July 2010 including the receipt of the 2010 tax refund, the AFMC has generated total cash flow of $120.1 million for Buckeye since we began earning these credits in February 2009. Now, based on a new IRS Chief Counsel Advice Memorandum issued in July 2010 addressing the applicability of the $1.01 cellulosic biofuel producer tax credit (“CBPC”) to black liquor in calendar year 2009, we anticipate filing claims for additional tax benefits under that program. We received a cellulosic biofuel producer registration number which allowed us to amend our tax return for the year ended June 30, 2009 and claim approximately $21 million of CBPC on black liquor produced and used in our business from January 1, 2009 until February 11, 2009 before we began mixing diesel with black liquor to qualify for the AFMC. We expect to be able to realize this $21 million through a combination of tax refunds and reductions in quarterly estimated tax payments by the end of December 2010. We could also convert alternative fuel mixture credits for gallons of black liquor produced and used by us from February 12, 2009 through December 31, 2009, the time period that we mixed diesel with black liquor to claim alternative fuel mixture cash refunds and alternative fuel mixture income tax credits. For any gallon of fuel, the $0.50 alternative fuel mixture credit may be exchanged for the $1.01 CBPC by repaying the $0.50 credit, with interest, for any gallon of fuel for which the $0.50 credit was claimed and received by us. Tax returns would have to be amended to claim the CBPC. Converting the $0.50 alternative fuel mixture credits/refunds to $1.01 CBPC for all gallons of the black liquor mixed with diesel would produce an additional benefit of approximately $56 million, less interest paid to the IRS, and is dependent on our future taxable income for the tax years ending June 30, 2011 through June 30, 2016.We are currently analyzing this opportunity based on the recent IRS guidance and will recognize any benefits in the financial statements for the first quarter of 2011.
On August 3 2010, the Board of Directors announced our first ever quarterly dividend of $.04 per share, a milestone for Buckeye. With approximately 40 million shares outstanding, this will initially represent a $6.5 million annual distribution of cash to shareholders. This in essence is cash flow that was formerly used to reduce our debt and pay our interest expense and now will be used to return cash to shareholders. Our objectives for returning cash to shareholders in the form of dividends are to increase shareholder returns and to broaden our shareholder base. We expect that Buckeye will continue to generate cash flow from operations sufficient to pay this dividend and grow it over time while also continuing to invest in high-return projects and growth opportunities.
21
Results of Operations
Consolidated results
The following table compares the components of consolidated operating income for the three fiscal years ended June 30, 2010.
|
(millions)
|
Year Ended June 30
|
$ Change
|
Percent Change
|
|||||||||||||||||||
|
2010
|
2009
|
2008
|
2010/
2009
|
2009/
2008
|
2010/
2009
|
2009/
2008
|
||||||||||||||||
|
Net sales
|
$
|
756.4
|
$
|
754.5
|
$
|
825.5
|
$
|
1.9
|
$
|
(71.0
|
)
|
0.3
|
%
|
(8.6
|
)%
|
|||||||
|
Cost of goods sold
|
635.0
|
645.2
|
676.0
|
(10.2
|
)
|
(30.8
|
)
|
(1.6
|
)
|
(4.6
|
)
|
|||||||||||
|
Gross margin
|
121.4
|
109.3
|
149.5
|
12.1
|
(40.2
|
)
|
11.1
|
(26.9
|
)
|
|||||||||||||
|
Selling, research and administrative expenses
|
48.1
|
46.3
|
47.3
|
1.8
|
(1.0
|
)
|
3.9
|
(2.1
|
)
|
|||||||||||||
|
Amortization of intangibles and other
|
1.9
|
1.9
|
1.8
|
-
|
0.1
|
-
|
5.6
|
|||||||||||||||
|
Impairment and restructuring costs
|
3.4
|
138.0
|
0.1
|
(134.6
|
)
|
137.9
|
(97.5
|
)
|
n/a
|
|||||||||||||
|
Alternative fuel mixture credits
|
(77.7
|
)
|
(54.2
|
)
|
-
|
(23.5
|
)
|
(54.2
|
)
|
43.4
|
100.0
|
|||||||||||
|
Other operating income
|
(0.8
|
)
|
-
|
-
|
(0.8
|
)
|
-
|
(100.0
|
)
|
-
|
||||||||||||
|
Operating income (loss)
|
$
|
146.5
|
$
|
(22.6
|
)
|
$
|
100.3
|
$
|
169.1
|
$
|
(122.9
|
)
|
748.2
|
%
|
(122.5
|
)%
|
||||||
Net sales increased slightly for 2010 versus 2009. Higher volume in both wood specialty products and nonwoven materials was mostly offset by lower pricing and unfavorable product mix in both segments. We also experienced lower volume in cotton specialty products, as we reduced our production to match raw material availability.
Gross margin in 2010 versus 2009 improved by $12.1 million on the increased sales volume and increased as a percent of net sales from 14.5% to 16.0%. Our costs were down significantly year over year, but reductions in cost were mostly offset by lower selling prices and unfavorable sales mix. We experienced lower raw material prices ($20 million), primarily for cotton linter fibers and fluff pulp, although prices for both started increasing in the second half of 2010 and have continued to rise in the first quarter of 2011. In addition, chemical prices were lower by $17 million and energy prices were lower by $10 million. Direct cost spending was up about $11 million year over year in spite of significant reductions at our Memphis specialty cotton fibers plant mainly due to higher shipment volumes, increased maintenance spending and higher bonus accruals. Only $2.5 million of this increase in direct cost spending was due to the June power outage.
The global economic downturn had an unfavorable impact on the demand for many of our products in 2009. Net sales decreased 8.6% for 2009 versus 2008, primarily due to lower shipment volume in both the specialty fibers and nonwoven materials segments. Lower shipment volume accounted for approximately $101.1 million of the decline. Higher selling prices for our products partially offset the lower volume, with selling prices being up approximately 6% on average compared to 2008 ($44.3 million).
Gross margin was lower for 2009 versus 2008 by $40.2 million. Lower shipment volume and associated market-related production downtime resulted in lost margin on reduced shipments and higher costs due to lower capacity utilization rates. Overall selling price increases more than offset increases in raw material, chemical and energy prices over that same period.
Selling, research and administrative expenses increased $1.8 million in 2010 due mainly to higher bonus and stock compensation expense which offset the impact of lower employment. Selling, research and administrative expenses decreased $1.0 million in 2009. As a percentage of net sales these costs increased to 6.4% in 2010 versus 6.1% in 2009 and 5.7% in 2008.
Based on the economic environment and the steep decline in the price of our stock at that time, which created a significant gap between the book and market value of our equity, we concluded that there were sufficient indicators to require us to perform an interim goodwill impairment analysis as of December 31, 2008. During the three months ended March 31, 2009, we completed this analysis. We concluded that there was no change to the impairment loss of $138 million we recognized at December 31, 2008. Since this goodwill impairment charge is non-cash, it did not affect our liquidity or financial covenants.
22
We recorded $77.7 million and $54.2 million in alternative fuel mixture credits, which were net of expenses, in our consolidated statements of operations for the years 2010 and 2009, respectively. During 2010 and 2009 we received $8.4 million and $38.4 million, respectively, in cash refunds through the filing of periodic excise tax refund claims. We claimed $13.8 million as income tax credits on our 2009 tax return and $75.2 million as income tax credits on our 2010 tax return which reduced our cash taxes in 2010 by an additional $17.0 million. We have treated the credits received in cash as taxable income and the income tax credits as non-taxable income. The alternative fuel mixture credits are subject to audit by the IRS. The credit expired on December 31, 2009.
Further discussion of revenue and operating trends can be found later in this MD&A. Additional information on the goodwill impairment may also be found in Note 3, Goodwill, to the Consolidated Financial Statements.
Segment results
Although nonwoven materials processes, customers, distribution methods and regulatory environment are very similar to specialty fibers, we believe it is appropriate for nonwoven materials to be disclosed as a separate reporting segment from specialty fibers. The specialty fibers segment consists of our chemical cellulose, customized fibers and fluff pulp product lines which are cellulosic fibers based on both wood and cotton. The nonwovens materials segment consists of our airlaid plants and our converting plant. We make separate financial decisions and allocate resources based on the sales and operating income of each segment. We allocate selling, research, and administrative expenses to each segment, and we use the resulting operating income to measure the performance of the two segments. We exclude items that are not included in measuring business performance, such as restructuring costs, the impact of goodwill impairment loss, alternative fuel mixture credits, amortization of intangibles, and unallocated at-risk and stock-based compensation.
The following table compares net sales and operating income by segment for the three years ended June 30, 2010. Each segment is discussed in further detail in the paragraphs below.
|
(millions)
|
Year Ended June 30
|
$ Change
|
Percent Change
|
|||||||||||||||||||
|
2010
|
2009
|
2008
|
2010/
2009
|
2009/
2008
|
2010/
2009
|
2009/
2008
|
||||||||||||||||
|
Net sales
|
||||||||||||||||||||||
|
Specialty Fibers
|
$
|
537.5
|
$
|
551.6
|
$
|
595.8
|
$
|
(14.1
|
)
|
$
|
(44.2
|
)
|
(2.6
|
)%
|
(7.4
|
)%
|
||||||
|
Nonwoven Material
|
246.8
|
239.7
|
263.6
|
7.1
|
(23.9
|
)
|
3.0
|
(9.1
|
)
|
|||||||||||||
|
Corporate
|
(27.9
|
)
|
(36.8
|
)
|
(33.8
|
)
|
8.9
|
(3.0
|
)
|
24.2
|
(8.9
|
)
|
||||||||||
|
Total net sales
|
756.4
|
754.5
|
825.5
|
1.9
|
(71.0
|
)
|
0.3
|
(8.6
|
)
|
|||||||||||||
|
Operating income
|
||||||||||||||||||||||
|
Specialty Fibers
|
65.2
|
53.7
|
90.6
|
11.5
|
(36.9
|
)
|
21.4
|
(40.7
|
)
|
|||||||||||||
|
Nonwoven Material
|
16.8
|
12.3
|
15.3
|
4.5
|
(3.0
|
)
|
36.6
|
(19.6
|
)
|
|||||||||||||
|
Corporate
|
64.5
|
(88.6
|
)
|
(5.6
|
)
|
153.1
|
(83.0
|
)
|
172.8
|
N/A
|
||||||||||||
|
Total operating income
|
$
|
146.5
|
$
|
(22.6
|
)
|
$
|
100.3
|
$
|
169.1
|
$
|
(122.9
|
)
|
748.2
|
%
|
(122.5
|
)%
|
||||||
Specialty fibers
The following table compares specialty fibers net sales and operating income for the three years ended June 30, 2010.
|
(millions)
|
Year Ended June 30
|
$ Change
|
Percent Change
|
|||||||||||||||||||
|
2010
|
2009
|
2008
|
2010/
2009
|
2009/
2008
|
2010/
2009
|
2009/
2008
|
||||||||||||||||
|
Net sales
|
$
|
537.5
|
$
|
551.6
|
$
|
595.8
|
$
|
(14.1
|
)
|
$
|
(44.2
|
)
|
(2.6
|
)%
|
(7.4
|
)%
|
||||||
|
Operating income
|
65.2
|
53.7
|
90.6
|
11.5
|
(36.9
|
)
|
21.4
|
(40.7
|
)
|
|||||||||||||
|
Operating margin percentage
|
12.1
|
%
|
9.7
|
%
|
15.2
|
%
|
||||||||||||||||
Net sales decreased 2.6% in 2010 versus 2009. Higher shipment volume had a positive $19 million impact on sales compared to 2009, while lower selling prices and unfavorable mix reduced sales by $34 million. Fluff pulp pricing decreased by $47 per ton. Prices for high-end specialty wood grades were down 6%, primarily due to cost pass-through provisions included in our annual sales agreements. Prices for specialty cotton grades were down 3% reflecting lower costs for cotton linters. Unfavorable product sales mix also contributed to the lower sales. Shipment volume for the segment was up 5%, as shipment volume for specialty wood fibers increased by 7%, but shipment volume was lower by 7% for specialty cotton fibers.
23
Operating income for 2010 improved by $11.5 million compared to 2009 in spite of a $14.1 million drop in sales revenue, largely due to the return to profitability of our Memphis cotton specialty fibers plant. Our gross margin for this plant improved by $17 million due to a combination of lower raw material costs, chemical costs, energy costs and headcount and other direct cost reductions, although as a percentage of sales, it is still below the average for the total specialty fibers segment. Total gross margin for our wood specialty products was down about $7 million year over year due to sales mix and the $4 million impact of a power outage and voltage surge at our Florida specialty fibers facility in June. Operating margin as a percentage of sales for the specialty fibers segment improved from 9.7% to 12.1%.
We also saw a reduction in finished goods inventory in the specialty fibers segment, partly due to 5,000 tons of lost production in June at the Foley Plant due to the power outage. Inventories are currently below sustainable levels both at the Foley Plant and at the Memphis Plant, and will have to be rebuilt during the first six months of 2011.
Specialty fibers net sales were down, primarily due to lower shipment volume for 2009 versus 2008 as the global economic downturn impacted demand for many of our products. Shipment volume for the specialty fibers segment was down 11% compared to 2008, with specialty wood fibers shipments off 7% and specialty cotton fibers off 29%. Specialty wood fibers sales were most negatively impacted by reduced demand for fluff pulp and specialty wood grades used in automotive and construction applications. Partially offsetting the lower volume were higher prices of approximately 13% on our wood specialty products (excluding fluff) and 15% on our cotton specialty products. Fluff pulp prices decreased approximately $23 per ton compared to 2008.
Operating income for 2009 versus 2008 was unfavorably affected by the lower sales volume and lower production volume. Higher raw material costs ($14.9 million), primarily due to the increase in cotton fibers, higher chemical costs ($16.0 million), higher energy costs ($5.4 million) and higher transportation costs ($3.0 million) contributed to the lower operating income. The higher specialty fibers prices, lower direct cost spending and favorable exchange rates in Brazil partially offset the unfavorable items.
Nonwoven materials
The following table compares nonwoven materials net sales and operating income for the three years ended June 30, 2010.
|
(millions)
|
Year Ended June 30
|
$ Change
|
Percent Change
|
|||||||||||||||||||
|
2010
|
2009
|
2008
|
2010/
2009
|
2009/
2008
|
2010/
2009
|
2009/
2008
|
||||||||||||||||
|
Net sales
|
$
|
246.8
|
$
|
239.7
|
$
|
263.6
|
$
|
7.1
|
$
|
(23.9
|
)
|
3.0
|
%
|
(9.1
|
)%
|
|||||||
|
Operating income
|
16.8
|
12.3
|
15.3
|
4.5
|
(3.0
|
)
|
36.6
|
(19.6
|
)
|
|||||||||||||
|
Operating margin percentage
|
6.8
|
%
|
5.1
|
%
|
5.8
|
%
|
||||||||||||||||
Nonwoven materials sales increased 3.0% in 2010 versus 2009. Airlaid shipment volume improved by 6%, offsetting lower prices and unfavorable product mix.
Operating income increased 37% in 2010 versus 2009. In addition to benefiting from the increased shipment volume and improved capacity utilization, operating margin improved from 5.1% to 6.8% as price decreases lagged reductions in raw material costs (primarily fluff pulp). This trend of expanding margins during times of falling raw material costs reversed course in mid-year as fluff pulp prices started to rapidly escalate, with operating margin for the fourth quarter down to 5.9%.
Nonwoven materials sales decreased in 2009 versus 2008, primarily due to lower shipment volume ($18.5 million) and a weakening of the euro versus the U.S. dollar ($8.2 million). Higher pricing of $5.4 million partially offset the impact of lower volumes. Shipment volumes for the nonwoven materials segment were down 7%. Part of this reduction was because we did not completely replace the business lost in January 2008 and part was due to the global recession. Shipment volume for our airlaid nonwovens products used in wipes, however, our largest product category, was up year over year by about 1%. Selling prices were up about 2% on the average compared to the prior year.
Operating income decreased $3.0 million for 2009 versus 2008. The impact of lower sales volumes, unfavorable product mix and higher raw material prices were partially offset by higher selling prices, lower transportation costs, a weaker Canadian dollar and reduced selling, research, and administrative spending.
24
Corporate
Our intercompany net sales elimination represents intercompany sales from our Florida and Memphis specialty fiber facilities to our airlaid nonwovens plants. Intercompany sales were down $8.9 million from 2009 to 2010 primarily due to reduced shipments and selling prices for fluff pulp shipped from our Florida mill to our airlaid nonwovens plants. The unallocated at-risk compensation and unallocated stock-based compensation represent compensation for executive officers and certain other employees.
The following tables compare corporate net sales and operating income (loss) for the three years ended June 30, 2010.
|
(millions)
|
Year Ended June 30
|
$ Change
|
Percent Change
|
|||||||||||||||||||
|
2010
|
2009
|
2008
|
2010/
2009
|
2009/
2008
|
2010/
2009
|
2009/
2008
|
||||||||||||||||
|
Net sales
|
$
|
(27.9
|
)
|
$
|
(36.8
|
)
|
$
|
(33.8
|
)
|
$
|
8.9
|
$
|
(3.0
|
)
|
24.2
|
%
|
(8.9
|
)%
|
||||
|
Operating income (loss)
|
64.5
|
(88.6
|
)
|
(5.6
|
)
|
153.1
|
(83.0
|
)
|
172.8
|
N/A
|
||||||||||||
The operating income (loss) for the three years ended June 30 consists of:
|
(millions)
|
2010
|
2009
|
2008
|
|||||||
|
Unallocated at-risk compensation
|
$
|
(4.9
|
)
|
$
|
(1.7
|
)
|
$
|
(2.6
|
)
|
|
|
Unallocated stock-based compensation
|
(2.7
|
)
|
(1.9
|
)
|
(0.9
|
)
|
||||
|
Intellectual property amortization
|
(1.9
|
)
|
(1.9
|
)
|
(1.9
|
)
|
||||
|
Restructuring expenses
|
(3.4
|
)
|
-
|
(0.1
|
)
|
|||||
|
Goodwill impairment loss
|
-
|
(138.0
|
)
|
-
|
||||||
|
Gross margin on intercompany sales
|
(0.1
|
)
|
0.7
|
(0.1
|
)
|
|||||
|
Alternative fuel mixture credits
|
77.7
|
54.2
|
-
|
|||||||
|
$
|
64.5
|
$
|
(88.6
|
)
|
$
|
(5.6
|
)
|
|||
Restructuring activities
2010 Restructuring program
During 2010, we implemented a restructuring program to sharpen our focus on key priorities which included restructuring our Ultra Fiber sales force, aligning capacity utilization with current market conditions at our Memphis Plant, and reducing selling, research and administrative expenses. The total cost of this program was $3.4 million and was completed during the fourth quarter of 2010. As a result of this restructuring, 31 positions were eliminated and 8 employees were transferred from selling, research and administrative positions to management positions at our Florida facility.
Interest expense and amortization of debt costs
Interest expense and amortization of debt costs decreased $11.7 million for 2010 versus 2009. Interest expense decreased due to debt reduction of $90.0 million and a reduction of approximately 134 basis points in our average interest rate.
Interest expense and amortization of debt costs decreased $4.3 million for 2009 versus 2008. This improvement was the result of lower average debt levels and lower average interest rates during 2009. In addition, approximately $0.8 million more interest was capitalized on long-term projects in 2009 versus 2008.
Gain (loss) on early extinguishment of debt costs
2010 – During 2010, we used borrowings under our credit facility to redeem the remaining $110 million of our 2010 notes. As a result of this extinguishment, we recorded a $0.2 million non-cash gain which was the net of the deferred financing costs, offset by the remaining unamortized interest rate swap early termination fee. We also used cash and borrowings to redeem $60 million of our 2013 notes. As a result of this extinguishment, we recorded $2.8 million in losses which included redemption price premiums of $1.7 million and non-cash write-off of deferred financing costs of $1.1 million.
25
2009 – During 2009, we used borrowings on our revolving credit facility to purchase $5 million of our 2010 notes at a discount of 8.5%. As a result of this extinguishment, we wrote off a portion of deferred financing costs. The net of the discount and the deferred financing costs resulted in a gain of $0.4 million.
2008 – During 2008, we used cash from operations and borrowings on our revolving credit facility to redeem the remaining $60 million of our 2008 notes and to redeem $35 million of the 2010 notes. As a result of these extinguishments, we wrote off a portion of deferred financing costs, resulting in non-cash expenses of $0.6 million during 2008.
See Note 10, Long-Term Debt, in the Consolidated Financial Statements for further discussion of the debt issuance and related extinguishment.
Foreign exchange and other
Foreign exchange and other in 2010, 2009 and 2008 were $(0.5) million, $(0.4) million and $0.6 million, respectively. The loss in 2010 was primarily due to foreign currency losses as a result of the strengthening of the Canadian dollar versus the U.S. dollar. The loss in 2009 was primarily due to a settlement fee in certain litigation and a charge related to the termination of hedge accounting treatment on an interest rate swap. The income in 2008 was primarily due to foreign currency gains as a result of the strengthening of the Brazilian real.
Income tax expense
Our effective tax rate for 2010 was approximately 8.9% versus (26.5)% in 2009 and 30.0% in 2008.
During 2010 and 2009, we claimed the alternative fuel mixture credits as cash refunds through the filing of periodic excise tax refund claims and as income tax credits on the federal income tax returns filed for the 2010 and 2009 tax years. For purposes of calculating federal and state income taxes, we treat the credits claimed as cash refunds of excise tax as taxable income and the credits claimed on the federal income tax return as nontaxable income. In 2010 and 2009, we recorded tax benefits of $26.3 million and $4.8 million, respectively, due to the nontaxable nature of the alternative fuel mixture credits claimed on the federal income tax return. This tax benefit was much larger in 2010 than in 2009 because only 4% of the 2010 credits were claimed as cash refunds of excise tax (treated as taxable income) compared to 76% in 2009.
The American Recovery and Reinvestment Act of 2009 expanded the IRC Section 48 energy investment tax credit to include qualified property for facilities producing electricity using open-loop biomass. During 2010, we recorded a tax benefit of $8.4 million relating to this tax credit, of which $5.4 million relates to expenditures prior to June 30, 2009 and $3.0 million relates to 2010 expenditures. We expect to realize continuing benefits from the energy investment tax credit which will reduce our effective tax rate over the next several years based on planned spending on energy projects at our Foley mill.
On December 31, 2008 we recorded a $138.0 million goodwill impairment charge and we recognized a tax benefit of $10.4 million in connection with the goodwill impairment charge.
Effective July 2007, Germany reduced its tax rates resulting in a $2.2 million net tax benefit for 2008 related to remeasurement of German deferred tax liabilities based on reversal of temporary differences.
On July 1, 2007, we adopted the provisions of ASC 740, “Accounting for Uncertainty in Income Taxes.” ASC 740 clarifies the accounting for income taxes by prescribing the minimum recognition threshold a tax position is required to meet before being recognized in the financial statements. As a result of the adoption, we recorded an adjustment of $0.9 million to reduce retained earnings at July 1, 2007. At adoption and June 30, 2008, our unrecognized tax benefits totaled $1.8 million and cumulative potential interest and penalties accrued related to unrecognized tax benefits totaled $0.2 million. We include interest and penalties related to income tax matters as a component of income before income taxes. All unrecognized tax benefits at adoption would affect the effective tax rate, if recognized. During 2009, as a result of a state audit, we reduced our unrecognized tax benefits by $0.2 million and our related interest and penalties by $0.1 million. During 2010, we increased unrecognized tax benefits by $0.4 million related to federal income taxes. The balance in unrecognized tax benefits and our related interest and penalties is $2 million and $0.1 million, respectively.
26
Financial Condition
Our financial condition continued to improve during 2010 with the $90.0 million debt reduction. We plan to take a balanced approach in allocating capital between debt reduction, investment in high rate of return projects, and returning cash to shareholders.
Liquidity and capitalization
We have the following major sources of financing: a senior secured credit facility and senior notes. Our senior secured credit facility and senior notes contain various covenants. We were in compliance with these covenants as of June 30, 2010, and believe we will continue to remain in compliance for the foreseeable future. These sources of financing are described in detail in Note 10, Long-Term Debt, to the Consolidated Financial Statements.
Our total debt decreased $90.0 million to $237.5 million at June 30, 2010 from $327.5 million at June 30, 2009. From June 30, 2008 to June 30, 2009, total debt decreased by $67.0 million. Our total debt as a percentage of our total capitalization was 35.2% at June 30, 2010, as compared to 50.7% at June 30, 2009 and 47.9% at June 30, 2008.
On July 25, 2007, we established a $200 million senior secured revolving credit facility with a maturity date of July 25, 2012. We used the proceeds from this credit facility to pay the outstanding balance on the former credit facility plus fees and expenses. The interest rate applicable to borrowings under the credit facility is grid based pricing, related to our total leverage ratio, at the agent’s prime rate plus 0.25% to 1.00% or a LIBOR-based rate ranging from LIBOR plus 1.25% to LIBOR plus 2.00%. We also used proceeds from this facility to redeem the remaining $60 million of our 2008 notes, to redeem $20 million of the 2010 notes in mid-September 2007, and for general corporate purposes. The credit facility is secured by substantially all of our assets located in the United States.
Our credit facility contains covenants customary for financing of this type. The financial covenants include: maximum total leverage ratio of consolidated total debt to consolidated earnings before interest, taxes, depreciation and amortization (“EBITDA”), and minimum ratio of consolidated EBITDA to consolidated interest expense. During 2010 and at June 30, 2010, we were in compliance with the financial covenants under our credit facility.
On June 30, 2010, we had $22.1 million of cash and cash equivalents and we had $97.8 million borrowing capacity on our credit facility. The commitment fee on the unused portion of the revolving credit facility ranges from 0.25% to 0.40% per annum based on a grid related to our leverage ratio. Total costs for the issuance of the facility were approximately $1.3 million and are being amortized to interest expense using the effective interest method over the life of the facility.
On June 30, 2009 we amended the 2013 notes to permit the redemption, repurchase or retirement of subordinated indebtedness, including our then existing 2010 notes, up to sixteen months prior to maturity, four months earlier than was allowed by the indenture prior to amendment. On July 31, 2009 we redeemed the remaining $110 million of our 2010 notes using borrowings on our revolving credit facility.
On July 28, 2010 we received our 2010 U.S. federal income tax refund of $67 million. We used this refund to reduce the outstanding balance on our revolving credit facility. On September 1, 2010, we called the remaining $140,000 of the 2013 notes for redemption on October 1, 2010. These notes will be redeemed using borrowings on our revolving credit facility.
While we can offer no assurances, we believe that our cash flow from operations, together with current cash and cash equivalents, will be sufficient to fund necessary capital expenditures, meet operating expenses and service our debt obligations for the next twenty-four months.
Treasury stock
At June 30, 2010, a total of 5.4 million shares have been repurchased under authorizations by our Board of Directors to repurchase up to 11.0 million shares of our common stock. Repurchased shares, if any, are held as treasury stock and are available for general corporate purposes, including the funding of employee benefit and stock-related plans. We did not repurchase any shares during 2010 but during 2009 and 2008, we repurchased 0.1 and 0.3 million shares, respectively. Our 2013 notes limit the funds available to repurchase stock.
27
Cash Flow
Cash and cash equivalents totaled $22.1 million at June 30, 2010, compared to $22.1 million at June 30, 2009 and $10.4 million at June 30, 2008. The following table provides a summary of cash flows for the three years ended June 30, 2009.
|
(millions)
|
2010
|
2009
|
2008
|
|||||||
|
Operating activities:
|
||||||||||
|
Net income (loss)
|
$
|
114.6
|
$
|
(65.4
|
)
|
$
|
47.1
|
|||
|
Noncash charges and credits, net
|
64.4
|
189.8
|
67.5
|
|||||||
|
Changes in operating assets and liabilities, net
|
(53.5
|
)
|
(3.1
|
)
|
(22.3
|
)
|
||||
|
Net cash provided by operating activities
|
125.5
|
121.3
|
92.3
|
|||||||
|
Investing activities:
|
||||||||||
|
Purchases of property, plant and equipment
|
(47.5
|
)
|
(42.4
|
)
|
(49.2
|
)
|
||||
|
Other investing activities
|
6.9
|
(0.3
|
)
|
(0.4
|
)
|
|||||
|
Net cash used in investing activities
|
(40.6
|
)
|
(42.7
|
)
|
(49.6
|
)
|
||||
|
Financing activities:
|
||||||||||
|
Net borrowings (payments) under lines of credit
|
80.5
|
(61.1
|
)
|
78.2
|
||||||
|
Payments on long-term debt and other
|
(170.0
|
)
|
(5.4
|
)
|
(129.0
|
)
|
||||
|
Other financing activities, net
|
2.3
|
(0.5
|
)
|
1.8
|
||||||
|
Net cash used in financing activities
|
(87.2
|
)
|
(67.0
|
)
|
(49.0
|
)
|
||||
|
Effect of foreign currency rate fluctuations on cash
|
2.3
|
0.1
|
1.9
|
|||||||
|
Net increase (decrease) in cash and cash equivalents
|
$
|
0.0
|
$
|
11.7
|
$
|
(4.4
|
)
|
|||
Cash provided by operating activities
Cash flows from operating activities in 2010 increased $4.2 million over 2009. While the $25.4 million positive impact of the AFMC on 2010 cash flow was $12.7 million less than in 2009, the income tax refund from 2009 received in 2010 included $6.6 million in section 48 investment tax credits related to the Foley Energy Project. In addition, working capital was reduced by $5.4 million during 2010 as reductions in finished goods inventory and increased payables more than offset an increase in accounts receivable.
The $29.0 million increase in cash flows from operating activities in 2009 was primarily due to the $38.0 million in cash received from alternative fuel mixture credits during the year, which offset the negative impact of reduced sales revenue and gross margin. Cash flow in 2009 also benefitted from lower inventory levels, partially offset by lower accounts payable and current liabilities. The inventory decrease was primarily due to lower levels of raw cotton linters and lower prices on raw materials at all sites. The decrease in accounts payable was also due to the lower inventory levels and lower prices for raw materials, chemicals and energy. Finally, the lower level of net sales resulted in cash generated from reduced accounts receivable ($9.9 million) in 2009 compared to an increase in accounts receivable of $6.0 million in 2008 due to increased net sales in that year.
Net cash used in investing activities
Purchases of property, plant and equipment were at relatively consistent levels during the last three years. We expect efficiency improvement and energy saving projects, maintenance capital and environmental spending will result in total capital expenditures of approximately $57 million for 2011, of which $11 million will be for the Foley Energy Project. During 2010, we spent $12.3 million on this project, which is on schedule to be complete with full startup in the first quarter of 2012. A portion of the spending for this project was partly funded by the $7.4 million State of Florida grant received in September 2009. Through 2010, we have spent $29.7 million of this three-year, $45 million project, which involves the installation of a steam turbine generator and upgrade of two recovery boilers, and is expected to save the equivalent of 200,000 barrels of oil per year and improve the energy self-sufficiency of our Foley Plant from about 85% to about 95%.
28
We expect to incur significant capital expenditures in the future to comply with environmental obligations at our Foley Plant specialty fibers facility. The amount and timing of these capital expenditures may vary depending on a number of factors, including when the final NPDES permit is issued and its final terms and conditions. For additional information on environmental matters, see Note 22, Contingencies, to the Consolidated Financial Statements.
Net cash used in financing activities
During 2010, we used cash from operations and proceeds from stock options exercises to reduce our debt by $90.0 million.
During 2009, we used cash from operations to reduce our debt and capital leases by $67.0 million.
During 2008, we used cash from operations and proceeds from stock option exercises to reduce our debt and capital leases by $51.4 million.
Contractual Obligations
The following table summarizes our significant contractual cash obligations at June 30, 2010. Certain of these contractual obligations are reflected in our balance sheet, while others are disclosed as future obligations under accounting principles generally accepted in the United States.
|
(millions)
|
Payments Due by Period (5)
|
|||||||||||||||
|
Contractual Obligations
|
Total
|
Less than
1 year
|
1-3 years
|
3-5 years
|
Greater than
5 years
|
|||||||||||
|
Long-term obligations (1)
|
$
|
283.0
|
$
|
81.0
|
$
|
56.1
|
$
|
145.9
|
$
|
-
|
||||||
|
Operating lease obligations (2)
|
3.1
|
1.9
|
1.2
|
-
|
-
|
|||||||||||
|
Timber commitments (3)
|
6.2
|
6.2
|
-
|
-
|
-
|
|||||||||||
|
Other purchase commitments(4)
|
32.0
|
22.7
|
7.9
|
1.4
|
-
|
|||||||||||
|
Total contractual cash obligations
|
$
|
324.3
|
$
|
111.8
|
$
|
65.2
|
$
|
147.3
|
$
|
-
|
||||||
(1) Amounts include related interest payments. Interest payments for variable debt of $97.5 million are based on the effective rate as of June 30, 2010 of 1.9%. See Note 10, Long-Term Debt, to the Consolidated Financial Statements for further information on interest rates.
(2) See Note 11, Leases, to the Consolidated Financial Statements for further information.
(3) See Note 21, Commitments, to the Consolidated Financial Statements for further information.
(4) The majority of other purchase commitments are take-or-pay contracts made in the ordinary course of business related to utilities and raw material purchases.
(5) Less than one year references 2011; 1-3 years references 2012 and 2013; 3-5 years references 2014 and 2015.
|
Note:
|
Additionally, the cash flow to fund postretirement benefit obligations for our U.S. plan has an expected net present value of $25.4 million. The actuarially estimated annual benefit payments are as follows: 2011 - $1.7 million; 2012-2013 - $3.5 million; 2014 - 2015 - $3.5 million; and 2016 through 2020 - $9.4 million. These obligations are not included in the table above as the total obligation is based on the present value of the payments and would not be consistent with the contractual cash obligations disclosures included in the table above. See Note 16, Employee Benefit Plans, to the Consolidated Financial Statements for further information.
|
|
Recent Accounting Pronouncements
|
See Note 2, Recent Accounting Pronouncements, to the Consolidated Financial Statements for a discussion of recent accounting pronouncements and their impact.
29
Critical Accounting Policies and Estimates
This discussion and analysis is based upon our consolidated financial statements. Our critical and significant accounting policies are more fully described in Note 1, Accounting Policies, to the Consolidated Financial Statements. Some of our accounting policies require us to make significant estimates and assumptions about future events that affect the amounts reported in our financial statements and the accompanying notes. Future events and their effects cannot be determined with certainty. Therefore, the determination of estimates underlying our financial statements requires the exercise of management’s judgment. Actual results could differ from those estimates, and any such differences may be material to our financial statements. Our management exercises critical judgment in the application of our accounting policies in the following areas, which significantly affect our financial condition and results of operations. Management has discussed the development and selection of these critical accounting policies and estimates with the Audit Committee of our Board of Directors and with our independent auditors.
Allowance for doubtful accounts
We provide an allowance for receivables we believe we may not collect in full. Management evaluates the collectability of accounts based on a combination of factors. In circumstances in which we are aware of a specific customer’s inability to meet its financial obligations (i.e., bankruptcy filings or substantial downgrading of credit ratings), we record a specific reserve. For all other customers, we recognize reserves for bad debts based on our historical collection experience. If circumstances change (i.e., higher than expected defaults or an unexpected material adverse change in a major customer’s ability to meet its financial obligations), our estimates of the recoverability of amounts due could be reduced by a material amount.
Bad debt expense for 2010, 2009 and 2008 was $0.1 million, $0.5 million and $0.1 million, respectively.
Deferred income taxes and other liabilities
Deferred income tax assets and liabilities are recognized based on the difference between the financial statement and the tax law treatment of certain items. Realization of certain components of deferred tax assets is dependent upon the occurrence of future events. We record a valuation allowance to reduce our net deferred tax assets to the amount we believe is more likely than not to be realized. These valuation allowances can be impacted by changes in tax laws, changes to statutory tax rates, and future taxable income levels and are based on our judgment, estimates and assumptions regarding those future events.
We increased (decreased) tax expense by $1.7 million in 2010, by $2.0 million in 2009 and by $(0.5) million in 2008 by changes to our valuation allowance.
In the event we were to determine that we would not be able to realize all or a portion of the net deferred tax assets in the future, we would increase the valuation allowance through a charge to income in the period that such determination is made. Conversely, if we were to determine that we would be able to realize our deferred tax assets in the future, in excess of the net carrying amounts, we would decrease the recorded valuation allowance through an increase to income in the period that such determination is made.
We record our world-wide tax provision based on the tax rules and regulations in the various jurisdictions in which we operate. Significant managerial judgment is required in determining our effective tax rate and evaluating our tax positions. Where we believe that the deduction of an item is supportable for income tax purposes, the item is deducted in our income tax returns.
On July 1, 2007 we adopted the provisions of FIN 48, which clarifies the accounting for income taxes by prescribing the minimum recognition threshold a tax position is required to meet before being recognized in the financial statements. We record our unrecognized tax benefits on the consolidated balance sheets in other liabilities. Cumulative potential interest and penalties accrued related to unrecognized tax benefits are included as a component of income before income taxes.
Depreciation
We provide for depreciation on our production machinery and equipment at our cotton cellulose and airlaid nonwovens plants using the units-of-production depreciation method which is based on the expected productive hours of the assets, subject to a minimum level of depreciation. Under this method, we calculate depreciation based on the expected total productive hours of the assets subject to a minimum level of depreciation. We review our estimate of total productive hours at least annually. If the estimated productive hours of these assets change based on changes in utilization and useful life assumptions, we adjust depreciation expense per unit of production accordingly. We use the straight-line method for determining depreciation on our other capital assets.
30
Long-lived assets
Long-lived assets are reviewed for impairment when circumstances indicate the carrying value of an asset may not be recoverable. For assets that are held and used, recoverability is evaluated based on the undiscounted cash flows expected to be generated by the asset. If the carrying value of the assets is determined to not be recoverable, we measure the potential impairment by comparing the carrying value of the assets to their fair value. If impairment exists, an adjustment is made to write the asset down to its fair value. Estimated fair values are determined based on quoted market values, discounted cash flows or internal and external appraisals, as applicable. Assets to be disposed of are carried at the lower of carrying value or estimated net realizable value.
No circumstances existed in 2010 and 2008 to indicate the carrying value of any of our assets may not be recoverable. We have made acquisitions in the past that included a significant amount of goodwill and other intangible assets. We have previously adopted ASC 350 “Intangibles – Goodwill and Other “, and, as a consequence, discontinued the amortization of goodwill. We will continue to amortize other intangible assets that meet certain criteria over their useful lives.
In accordance with ASC 350, we perform a goodwill impairment analysis on an annual basis, in the fourth fiscal quarter, and, if certain events or circumstances indicate that an impairment loss may have been incurred, on an interim basis. Goodwill is recognized for the excess of the purchase price over the fair value of tangible and identifiable intangible net assets of businesses acquired. Goodwill of businesses acquired is specifically identified to the reporting units to which the businesses belong. We estimate fair value based on a combination of the income approach and the market approach. The income approach requires management to estimate future net cash flows, the timing of these cash flows and an appropriate discount rate (or weighted average cost of capital) representing the time value of money and the inherent risk and uncertainty of future cash flows. The discount rate is based on independently calculated beta risks for a composite group of companies, our target capital mix and an estimated market risk premium. The assumptions used in estimating future cash flows were consistent with the reporting unit’s internal planning. The market approach estimates the fair value of our reporting units on comparable market prices. Goodwill is measured at the reporting unit level by comparing the reporting unit’s carrying amount, including goodwill, to the fair market value of the reporting unit. The analysis of potential impairment of goodwill requires a two-step process. The first step is the estimation of fair value. If step one indicates that impairment potentially exists, the second step is performed to measure the amount of impairment, if any. Goodwill impairment exists when the implied fair value of goodwill is less than its carrying value.
During our quarter ended December 31, 2008, based on the economic environment and the steep decline in the price of our stock at that time, which created a significant gap between the book and market value of our equity, we concluded that there were sufficient indicators to require us to perform an interim goodwill impairment test as of December 31, 2008. As a result, we recorded an impairment charge of $138 million which represented our best estimate of the resulting goodwill impairment. We engaged an independent valuation firm to assist with this impairment testing by expressing opinions as of December 31, 2008 of the fair values of the business enterprises of our four reporting units. The results of step one indicated goodwill was impaired at three of our reporting units as the estimated fair value was less than the carrying value of the reporting units. As such, step two of the goodwill impairment test was performed to determine the actual amount of goodwill impairment. In this step, we were required to allocate the fair value of the reporting unit, as determined in step one, to all of the reporting unit’s assets and liabilities in a hypothetical purchase price allocation as if these reporting units had been acquired on the date of the test. We reviewed our long-lived tangible and intangible assets within the impaired reporting units and we determined that the forecasted undiscounted cash flows related to these assets or asset groups were in excess of their carrying values and therefore these assets were not impaired. See Note 1, Accounting Policies and Note 3, Goodwill, to the Consolidated Financial Statements for further information on long-lived assets and impairment charges.
31
|
Non-GAAP Financial Measures
|
In our press releases and other communication with investors, we include certain financial information not derived in accordance with generally accepted accounting principles (“GAAP”). The non-GAAP measures used are “adjusted operating income”, “adjusted net income” and “adjusted diluted earnings per share” and are equal to operating income, net income and earnings per share excluding income from alternative fuel mixture credits, investment tax credits on prior period expenditures, restructuring, goodwill impairment and early debt retirement costs. We believe that the presentation of these non-GAAP measures provides information that is useful to investors as it allows for a more meaningful comparison of these financial measures to prior periods, but this information should not be considered a substitute for any measures derived in accordance with GAAP. We manage our business units by financial measures which exclude these items. Operating income and earnings per share targets for our all-employee bonus and at-risk compensation also exclude the benefit of alternative fuel mixture credits and the goodwill impairment charge.
|
Year Ended June 30,
|
|||||||||||||
|
2010
|
2009
|
2008
|
|||||||||||
|
Adjusted operating income
|
|||||||||||||
|
Operating income (loss) in accordance with GAAP
|
$
|
146.5
|
$
|
(22.6
|
)
|
$
|
100.3
|
||||||
|
Goodwill impairment
|
-
|
138.0
|
-
|
||||||||||
|
Restructuring costs
|
3.4
|
-
|
0.1
|
||||||||||
|
Alternative fuel mixture credits
|
(77.7
|
)
|
(54.2
|
)
|
-
|
||||||||
|
Adjusted operating income
|
$
|
72.2
|
$
|
61.2
|
$
|
100.4
|
|||||||
|
Adjusted net income
|
|||||||||||||
|
Net income (loss) in accordance with GAAP
|
$
|
114.6
|
$
|
(65.4
|
)
|
$
|
47.1
|
||||||
|
Goodwill impairment
|
-
|
127.6
|
-
|
||||||||||
|
Restructuring costs
|
2.1
|
-
|
0.1
|
||||||||||
|
Alternative fuel mixture credits
|
(76.8
|
)
|
(39.6
|
)
|
-
|
||||||||
|
Early extinguishment of debt
|
1.6
|
0.3
|
(0.4
|
)
|
|||||||||
|
Investment tax credit on prior period expenditures
|
(5.4
|
)
|
-
|
-
|
|||||||||
|
Adjusted net income
|
$
|
36.1
|
$
|
22.9
|
$
|
46.8
|
|||||||
|
Adjusted diluted earnings per share (EPS)
|
|||||||||||||
|
EPS in accordance with GAAP
|
$
|
2.90
|
$
|
(1.69
|
)
|
$
|
1.20
|
||||||
|
Goodwill impairment
|
-
|
3.30
|
-
|
||||||||||
|
Restructuring costs
|
0.05
|
-
|
-
|
||||||||||
|
Alternative fuel mixture credits
|
(1.94
|
)
|
(1.03
|
)
|
-
|
||||||||
|
Early extinguishment of debt
|
0.04
|
0.01
|
(0.01
|
)
|
|||||||||
|
Investment tax credit on prior period expenditures
|
(0.14
|
)
|
-
|
-
|
|||||||||
|
Adjusted diluted EPS
|
$
|
0.91
|
$
|
0.59
|
$
|
1.19
|
|||||||
32
We calculate EBITDA as earnings before cumulative effect of change in accounting plus interest expense, income taxes and depreciation and amortization. Adjusted EBITDA further adjusts EBITDA by adding back the following items: asset impairment charges, non-cash charges and other (gains) losses. You should not consider adjusted EBITDA to be an alternative measure of our net income, as an indicator of operating performance; or our cash flow, as an indicator of liquidity. Adjusted EBITDA corresponds with the definition contained in our US revolving credit facility, established on July 25, 2007, and it provides useful information concerning our ability to comply with debt covenants. Although we believe adjusted EBITDA enhances your understanding of our financial condition, this measure, when viewed individually, is not a better indicator of any trend as compared to other measures (e.g., net sales, net earnings, net cash flows, etc.).
|
Year Ended June 30,
|
|||||||||||||
|
2010
|
2009
|
2008
|
|||||||||||
|
Adjusted EBITDA
|
|||||||||||||
|
Net income (loss)
|
$
|
114.6
|
$
|
(65.4
|
)
|
$
|
47.1
|
||||||
|
Income tax expense
|
11.2
|
13.7
|
20.2
|
||||||||||
|
Interest expense
|
16.7
|
28.2
|
32.5
|
||||||||||
|
Amortization of debt costs
|
0.9
|
1.1
|
1.1
|
||||||||||
|
Early extinguishment of debt
|
2.6
|
(0.4
|
)
|
0.6
|
|||||||||
|
Depreciation, depletion and amortization
|
48.2
|
49.9
|
52.7
|
||||||||||
|
EBITDA
|
194.2
|
27.1
|
154.2
|
||||||||||
|
Asset impairments
|
-
|
138.0
|
-
|
||||||||||
|
Non-cash charges
|
1.3
|
1.6
|
1.0
|
||||||||||
|
Adjusted EBITDA
|
$
|
195.5
|
$
|
166.7
|
$
|
155.2
|
|||||||
Free cash flow is provided supplementally because it is widely used by investors as a valuation and liquidity measure in our industry. We define free cash flow as net cash provided by operating activities less cash used in investing activities. This measure is not a substitute for, and should not be used in conjunction with, GAAP liquidity or financial measures. We use free cash flow as one of our measures to evaluate and monitor the ongoing financial performance of our operations. Other companies may calculate free cash flow differently.
|
Year Ended June 30,
|
|||||||||||||
|
2010
|
2009
|
2008
|
|||||||||||
|
Free Cash Flow
|
|||||||||||||
|
Net cash provided by operating activities
|
$
|
125.5
|
$
|
121.3
|
$
|
92.3
|
|||||||
|
Net cash used in investing activities
|
(40.6
|
)
|
(42.8
|
)
|
(49.6
|
)
|
|||||||
|
Free cash flow
|
$
|
84.9
|
$
|
78.5
|
$
|
42.7
|
|||||||
Item 7A. Qualitative and Quantitative Disclosures About Market Risk
We are exposed to market risk from changes in foreign exchange rates, interest rates, raw material costs and the price of certain commodities used in our production processes. To reduce such risks, we selectively use financial instruments. All hedging transactions are authorized and executed pursuant to clearly defined policies and procedures. Further, we do not enter into financial instruments for trading purposes.
The following risk management discussion and the estimated amounts generated from the sensitivity analyses are forward-looking statements of market risk, assuming that certain adverse market conditions occur. Actual results in the future may differ materially from those projected results due to actual developments in the global financial markets. The analysis methods used to assess and mitigate risks discussed below should not be considered projections of future events or losses.
A discussion of our accounting policies for risk management is included in Note 1, Accounting Policies, to the Consolidated Financial Statements.
33
Interest Rates
The fair value of our long-term public debt is based on an average of the bid and offer prices at year-end. The fair value of the credit facility approximates its carrying value due to its variable interest rate. The carrying value and fair value of long-term debt at June 30, 2010 were $237.3 million and $241.1 million and at June 30, 2009 were $327.5 million and $311.4 million, respectively. Market risk is estimated as the potential change in fair value resulting from a hypothetical 100 basis point decrease in interest rates and would amount to a $1.0 million increase in the fair value of long-term debt as of June 30, 2010.
We had $97.3 million of variable rate long-term debt outstanding on June 30, 2010. At this borrowing level, a hypothetical 100 basis point increase in interest rates would have a $1.0 million unfavorable impact on our pre-tax earnings and cash flows. The primary interest rate exposures on floating rate debt are with respect to LIBOR rates and U.S. prime rates.
Foreign Currency Exchange Rates
Foreign currency exposures arise from transactions including firm commitments and anticipated transactions denominated in a currency other than an entity’s functional currency. We and our subsidiaries generally enter into transactions denominated in their respective functional currencies. Our primary foreign currency exposure arises from foreign-denominated revenues and costs and their translation into U.S. dollars. The primary currencies to which we are exposed include the euro, Canadian dollar and the Brazilian real. We do not have any hedges in place to protect against fluctuations in any of these currencies, but we do sometimes hedge this exposure. Our euro exposure is internally hedged for the most part because a high percentage of both the sales and costs at our Steinfurt, Germany plant are denominated in euros. We estimate that the negative pre-tax impact of a $0.05 strengthening of the USD versus the Euro (USD/Euro rate) on our operating income is about $0.9 million annually. We estimate the positive pre-tax impact of a 5% strengthening of the USD versus the Canadian dollar (USD/CAD exchange rate) at about $1.1 million annually. We estimate the negative pre-tax impact of a 5% strengthening of the USD versus the Brazilian real (USD/BRL exchange rate) at about $0.7 million annually. We are continuously evaluating our foreign currency exposure and our hedging policy is subject to change.
We generally view as long-term our investments in foreign subsidiaries with a functional currency other than the U.S. dollar. As a result, we do not generally hedge these net investments. However, we use capital structuring techniques to manage our net investment in foreign currencies as considered necessary. The net investment in foreign subsidiaries translated into dollars using the year-end exchange rates is $181.8 million and $181.8 million at June 30, 2010 and 2009, respectively. The potential foreign currency translation loss from investment in foreign subsidiaries resulting from a hypothetical 10% adverse change in quoted foreign currency exchange rates amounts to approximately $16.5 million at June 30, 2010. This change would be reflected in the equity section of our consolidated balance sheet in accumulated other comprehensive loss. The primary foreign currency exposures on our long-term investments are with the euro, Canadian dollar and the Brazilian real.
Commodities
We are dependent on commodities in our production process. Natural gas, electricity, fuel oil, caustic and other chemicals are just some of the commodities that our processes rely upon. Exposure to these commodities can have a significant impact on our operating performance.
In order to minimize market exposure, we may use forward contracts to reduce price fluctuations in a desired percentage of forecasted purchases of fossil fuels over a period of generally less than one year. As of June 30, 2010 and June 30, 2009 we had contracts in place to purchase 125,000 MMBTUs through December 2010 and 359,220 MMBTUs through May 2010, respectively, of natural gas at various fixed prices through December 2010. Additionally, as of June 30, 2010 we had options in place to purchase 580,000 MMBTUs of natural gas at prices ranging from $6 to $7 per MMBTU through November 2010.
Item 8. Financial Statements and Supplementary Data
Information required by this Item is set forth in the Company’s Consolidated Financial Statements and supplementary data contained in this report beginning on page F-1.
Item 9. Changes in and Disagreements with Accountants on Accounting and Financial Disclosure
None.
34
Item 9A. Controls and Procedures
|
|
Management’s Evaluation of Disclosure Controls and Procedures
|
Under the supervision and with the participation of our management, including our principal executive officer and principal financial officer, we evaluated the effectiveness of our disclosure controls and procedures, as defined in Rule 13a-15(e) of the Securities Exchange Act of 1934 (“Exchange Act”) as of June 30, 2010. Based on that evaluation, our principal executive and financial officers have concluded that, as of June 30, 2010, our disclosure controls and procedures were effective to ensure that the information required to be disclosed in our filings under the Exchange Act is recorded, processed, summarized and reported within the time periods specified in the SEC’s rules and forms, including ensuring that such information is accumulated and communicated to our management as appropriate to allow timely decisions regarding required disclosure.
|
|
Assessment of Internal Control Over Financial Reporting
|
Management’s report on our internal control over financial reporting is presented on page F-3 of this Annual Report on Form 10-K. The report of Ernst & Young LLP with respect to internal control over financial reporting is presented on page F-4 of this Annual Report on Form 10-K.
|
|
Changes in Internal Control Over Financial Reporting
|
During our fiscal quarter ended June 30, 2010, no change occurred in our internal control over financial reporting that has materially affected, or is reasonably likely to materially affect, our internal control over financial reporting.
Item 9B. Other Information
None.
PART III
Item 10. Directors, Executive Officers and Corporate Governance
Directors and Executive Officers
The information required by this Item regarding our Board of Directors is incorporated by reference to the section entitled “Proposal 1 – Election of Directors” to be included in the 2010 Proxy Statement. The information required by this Item regarding our executive officers is set forth in Part 1, Item 4 of this Annual Report on Form 10-K under “Executive Officers of the Registrant” and incorporated herein by this reference.
Corporate Governance and Code of Business Conduct & Ethics
The information required by this Item regarding our Code of Business Conduct & Ethics and Audit Committee (including the Audit Committee’s “audit committee financial expert”) is incorporated by reference to the section of the 2010 Proxy Statement entitled “Governance of the Company.”
Compliance with Section 16(a) of the Exchange Act
The information required by this Item relating to compliance with Section 16(a) of the Exchange Act is incorporated by reference to the section of our 2010 Proxy Statement entitled “Section 16(a) Beneficial Ownership Reporting Compliance.”
Item 11. Executive Compensation
The information required by this Item with respect to director and executive officer compensation is incorporated by reference to the section of the 2010 Proxy Statement entitled “Executive Compensation.”
Item 12. Security Ownership of Certain Beneficial Owners and Management and Related Stockholder Matters
The information required by this Item is incorporated by reference to the section of the 2010 Proxy Statement entitled “Security Ownership of Certain Beneficial Owners and Management” and “Equity Compensation Plan Information.”
35
Item 13. Certain Relationships and Related Transactions, and Director Independence
The information required by this Item relating to certain relationships and related transactions, and director independence is incorporated by reference to the sections of the 2010 Proxy Statement entitled “Certain Relationships and Related Transactions” and “Governance of the Company.”
Item 14. Principal Accountant Fees and Services
The information required by this Item regarding principal accountant fees and services is incorporated by reference to the section of the 2010 Proxy Statement entitled “Fees Paid to Auditors.”
PART IV
Item 15. Exhibits and Financial Statement Schedules
|
(a)
|
(1)
|
Financial Statements
|
|
- See Index to Consolidated Financial Statements and Schedule on page F-1.
|
||
|
(2)
|
Financial Statement Schedules
|
|
|
- See Index to Consolidated Financial Statements and Schedule on page F-1. All other financial statement schedules are omitted as the information is not required or because the required information is presented in the financial statements or the notes thereto.
|
||
|
(3)
|
Listing of Exhibits. See Exhibit Index immediately following signature page to this Form 10-K/A.
|
36
SIGNATURES
Pursuant to the requirements of Section 13 or 15(d) of the Securities Exchange Act of 1934, the registrant has duly caused this report to be signed on its behalf by the undersigned, thereunto duly authorized.
Buckeye Technologies Inc.
|
By:
|
/s/ John B. Crowe
|
|
John B. Crowe, Director, Chairman of the Board and Chief Executive Officer
|
|
|
Date:
|
February 24, 2011
|
37
EXHIBIT INDEX
|
Exhibit
|
Incorporation by Reference or
|
|
|
Numbers
|
Description
|
Filed Herewith
|
|
3.1
|
Second Amended and Restated Certificate of Incorporation
|
Exhibit 3.1 to the Company's Quarterly Report on Form 10-Q for quarter ended December 31, 1997, filed on February 13, 1998
|
|
3.1(a)
|
Articles of Amendment to the Second Amended and Restated Certificate of Incorporation
|
Exhibit 3.1(a) to Form S-4 file no. 333-59267, filed on July 16, 1998
|
|
3.2
|
Amended and Restated By-laws
|
Exhibit 3.1 to the Company's Current Report on Form 8-K, filed on September 16, 2009
|
|
4.1
|
First Amendment to the Rights Agreement
|
Form 8-A to Form 10-K for year ended June 30, 1997 file no. 001-41030, filed on September 26, 1997
|
|
4.3
|
Indenture for 8.5% Senior Notes due 2013, dated September 22, 2003
|
Exhibit 4.4 to Form S-4, file no. 333-110091, filed on October 30, 2003
|
|
4.4
|
First Supplemental Indenture for 8.5% Senior Notes due 2013, dated as of July 1, 2009
|
Exhibit 4.4 to the Company's Annual Report on Form 10-K for the fiscal year ended June 30, 2009, filed on August 27, 2010
|
|
10.1
|
Amended and Restated 1995 Management Stock Option Plan
|
Exhibit 10.1 to the Company's Annual Report on Form 10-K for year ended June 30, 1998, filed on September 23, 1998
|
|
10.2
|
Second Amended and Restated 1995 Incentive and Nonqualified Stock Option Plan for Management Employees
|
Exhibit 10.2 to the Company's Annual Report on Form 10-K for the fiscal year ended June 30, 2000, filed on September 25, 2000
|
|
10.3
|
Form of Management Stock Option Subscription Agreement
|
Exhibit 10.3 to the Company's Annual Report on Form 10-K for year ended June 30, 1998, filed on September 23, 1998
|
|
10.4
|
Form of Stock Option Subscription Agreement
|
Exhibit 10.4 to the Company's Annual Report on Form 10-K for year ended June 30, 1998, filed on September 23, 1998
|
|
10.5
|
Amended and Restated Formula Plan for Non-Employee Directors
|
Exhibit 10.1 to the Company's Quarterly Report on Form 10-Q for quarter ended December 31, 2000, filed on February 6, 2001
|
|
10.6
|
Amendment No. 1 to Timberlands Agreement dated January 1, 1999 by and Between Buckeye Florida, Limited Partnership and Foley Timber and Land Company. Certain portions of the Agreement have been omitted pursuant to an Application for Confidential Treatment dated October 30, 1995
|
Exhibit 10.1 to the Company's Quarterly Report on Form 10-Q/A for quarter ended March 31, 1999, filed on May 12, 1999
|
|
10.7
|
Form of Change in Control Agreement, dated August 8, 2006
|
Exhibit 10.1 to the Company's Current Report on Form 8-K, filed on August 11, 2006
|
|
10.8
|
Retirement Replacement Plan
|
Exhibit 10.1 to the Company's Quarterly Report on Form 10-Q for the quarter ended September 30, 2006, filed on October 27, 2006
|
|
10.9*
|
Amended and Restated Credit Agreement dated July 25, 2007 among the Registrant; Bank of America NA; Banc of America Securities LLC; Citizens Bank of Pennsylvania; Cobank, ACB; Regions Bank; and the other lenders party thereto
|
Exhibit 10.9 to the Company’s Amendment No. 1 to its Annual Report on Form 10-K for the fiscal year ended June 30, 2010, filed on January 21, 2011.
|
38
|
10.10
|
2007 Omnibus Incentive Compensation
Plan
|
Exhibit A to the Company's 2007 Proxy Statement, filed on September 20, 2007
|
|
10.11
|
Form of Indemnification Agreement
|
Exhibit 10.1 to the Company's Current Report on Form 8-K, filed on October 27, 2009
|
|
10.12
|
Form of Performance Shares Award Agreement
|
Exhibit 10.1 to the Company's Current Report on Form 8-K, filed on July 21, 2010
|
|
12.1
|
Computation of Ratio of Earnings to Fixed Charges
|
Filed with the Original Form 10-K
|
|
21.1
|
Subsidiaries
|
Filed with the Original Form 10-K
|
|
23.1
|
Consent of Ernst & Young LLP
|
Filed with the Original Form 10-K
|
|
31.1
|
Section 302 Certification of Chief Executive Officer
|
Filed herewith
|
|
31.2
|
Section 302 Certification of Chief Financial Officer
|
Filed herewith
|
|
32.1
|
Section 1350 Certification of Chief Executive Officer
|
Filed herewith
|
|
32.2
|
Section 1350 Certification of Chief Financial Officer
|
Filed herewith
|
*Confidential treatment has been requested for portions of this exhibit. The copy filed with Amendment No. 1 omits the information subject to the confidentiality request. Omissions have been designated as [***]. A complete version of this exhibit has been filed separately with the Securities and Exchange Commission.
39
BUCKEYE TECHNOLOGIES INC.
INDEX TO CONSOLIDATED FINANCIAL STATEMENTS AND SCHEDULE
|
PAGE
|
|
|
Report of Management
|
F-2
|
|
Management’s Report on Internal Control Over Financial Reporting
|
F-3
|
|
Reports of Independent Registered Public Accounting Firm
|
F-4
|
|
Financial Statements as of June 30, 2010, June 30, 2009 and for the Three Years Ended June 30, 2010:
|
|
|
Consolidated Statements of Operations
|
F-6
|
|
Consolidated Balance Sheets
|
F-7
|
|
Consolidated Statements of Stockholders’ Equity
|
F-8
|
|
Consolidated Statements of Cash Flows
|
F-9
|
|
Notes to Consolidated Financial Statements
|
F-10
|
|
Schedule:
|
|
|
Schedule II - Valuation and Qualifying Accounts
|
F-41
|
F-1
Report of Management
The management of Buckeye Technologies Inc. is committed to providing financial reports that are complete, accurate and easily understood.
The consolidated financial statements and financial information included in this report have been prepared in accordance with accounting principles generally accepted in the United States and in the opinion of management fairly and completely present the Company’s financial results. Our independent auditor, Ernst & Young LLP, has examined our financial statements and expressed an unqualified opinion.
Ensuring the accuracy of financial statements starts at the top of the Company. Our Board of Directors provides oversight as the representative of the stockholders. Our Audit Committee, consisting entirely of independent Directors, meets regularly with management, internal audit and the independent auditors to review our financial reports.
The Company’s senior management, our corporate leadership team, is actively involved in all aspects of the business. This group understands key strategies and monitors financial results. We maintain a system of internal control which provides reasonable assurance that transactions are accurately recorded and assets are safeguarded. All of the Company’s officers and financial executives adhere to the Company’s Code of Business Conduct and Ethics and provide written confirmation of their compliance annually.
Our Company was built on a foundation of integrity and honesty. We take responsibility for the quality and accuracy of our financial reporting.
|
/s/ John B. Crowe
|
/s/ Kristopher J. Matula
|
/s/ Steven G. Dean
|
|
John B. Crowe
|
Kristopher J. Matula
|
Steven G. Dean
|
|
Chairman of the Board and
|
President and
|
Senior Vice President and
|
|
Chief Executive Officer
|
Chief Operating Officer
|
Chief Financial Officer
|
F-2
Management’s Report on Internal Control Over Financial Reporting
Our management is responsible for establishing and maintaining adequate internal control over financial reporting (as such term is defined in Rules 13a-15(f) and 15d-15(f) under the Securities Exchange Act of 1934, as amended). Our internal control over financial reporting includes, among other things: defined policies and procedures for conducting and governing our business, a written Code of Business Conduct and Ethics adopted by our Board of Directors and applicable to all directors and all officers and employees of Buckeye and our subsidiaries, sophisticated information systems for processing transactions and a properly staffed and professional internal audit department. Mechanisms are in place to monitor the effectiveness of our internal control over financial reporting and actions are taken to correct identified deficiencies. Our procedures for financial reporting include the active involvement of senior management, our Audit Committee and a staff of highly qualified financial and legal professionals.
Management, with the participation of our principal executive and financial officers, evaluated our internal control over financial reporting as of June 30, 2010, the end of our fiscal year. Management based its evaluation on criteria established in Internal Control—Integrated Framework issued by the Committee of Sponsoring Organizations of the Treadway Commission (the “COSO criteria”).
Based on this evaluation, management has concluded that our internal control over financial reporting was effective as of June 30, 2010.
Our independent registered public accounting firm, Ernst & Young LLP, audited the effectiveness of our internal controls over financial reporting. Ernst & Young LLP has issued their report on the effectiveness of internal control over financial reporting which is included in this Annual Report on Form 10-K.
|
/s/ John B. Crowe
|
/s/ Steven G. Dean
|
|
John B. Crowe
|
Steven G. Dean
|
|
Chairman of the Board and
|
Senior Vice President and
|
|
Chief Executive Officer
|
Chief Financial Officer
|
F-3
Report of Independent Registered Public Accounting Firm
The Board of Directors and Stockholders of Buckeye Technologies Inc.
We have audited Buckeye Technologies Inc.’s internal control over financial reporting as of June 30, 2010, based on criteria established in Internal Control—Integrated Framework issued by the Committee of Sponsoring Organizations of the Treadway Commission (the “COSO criteria”). Buckeye Technologies Inc.’s management is responsible for maintaining effective internal control over financial reporting, and for its assessment of the effectiveness of internal control over financial reporting included in the accompanying Management’s Report on Internal Control Over Financial Reporting. Our responsibility is to express an opinion on the company’s internal control over financial reporting based on our audit.
We conducted our audit in accordance with the standards of the Public Company Accounting Oversight Board (United States). Those standards require that we plan and perform the audit to obtain reasonable assurance about whether effective internal control over financial reporting was maintained in all material respects. Our audit included obtaining an understanding of internal control over financial reporting, assessing the risk that a material weakness exists, testing and evaluating the design and operating effectiveness of internal control based on the assessed risk, and performing such other procedures as we considered necessary in the circumstances. We believe that our audit provides a reasonable basis for our opinion.
A company’s internal control over financial reporting is a process designed to provide reasonable assurance regarding the reliability of financial reporting and the preparation of financial statements for external purposes in accordance with generally accepted accounting principles. A company’s internal control over financial reporting includes those policies and procedures that (1) pertain to the maintenance of records that, in reasonable detail, accurately and fairly reflect the transactions and dispositions of the assets of the company; (2) provide reasonable assurance that transactions are recorded as necessary to permit preparation of financial statements in accordance with generally accepted accounting principles, and that receipts and expenditures of the company are being made only in accordance with authorizations of management and directors of the company; and (3) provide reasonable assurance regarding prevention or timely detection of unauthorized acquisition, use, or disposition of the company’s assets that could have a material effect on the financial statements.
Because of its inherent limitations, internal control over financial reporting may not prevent or detect misstatements. Also, projections of any evaluation of effectiveness to future periods are subject to the risk that controls may become inadequate because of changes in conditions, or that the degree of compliance with the policies or procedures may deteriorate.
In our opinion, Buckeye Technologies Inc. maintained, in all material respects, effective internal control over financial reporting as of June 30, 2010, based on the COSO criteria.
We also have audited, in accordance with the standards of the Public Company Accounting Oversight Board (United States), the consolidated balance sheets of Buckeye Technologies Inc. as of June 30, 2010 and 2009 and the related consolidated statements of operations, stockholders’ equity, and cash flows for each of the three years in the period ended June 30, 2010 of Buckeye Technologies Inc. and our report dated September 1, 2010 expressed an unqualified opinion thereon.
Memphis, Tennessee /s/ Ernst & Young LLP
September 1, 2010
F-4
Report of Independent Registered Public Accounting Firm
The Board of Directors and Stockholders of Buckeye Technologies Inc.
We have audited the accompanying consolidated balance sheets of Buckeye Technologies Inc. as of June 30, 2010 and 2009 and the related consolidated statements of operations, stockholders' equity, and cash flows for each of the three years in the period ended June 30, 2010. Our audits also included the financial statement schedule listed in the Index at Item 15 (a). These financial statements and schedule are the responsibility of the Company’s management. Our responsibility is to express an opinion on these financial statements and schedule based on our audits.
We conducted our audits in accordance with the standards of the Public Company Accounting Oversight Board (United States). Those standards require that we plan and perform the audit to obtain reasonable assurance about whether the financial statements are free of material misstatement. An audit includes examining, on a test basis, evidence supporting the amounts and disclosures in the financial statements. An audit also includes assessing the accounting principles used and significant estimates made by management, as well as evaluating the overall financial statement presentation. We believe that our audits provide a reasonable basis for our opinion.
In our opinion, the financial statements referred to above present fairly, in all material respects, the consolidated financial position of Buckeye Technologies Inc. as of June 30, 2010 and 2009, and the consolidated results of its operations and its cash flows for each of the three years in the period ended June 30, 2010, in conformity with U.S. generally accepted accounting principles. Also, in our opinion, the related financial statement schedule, when considered in relation to the basic financial statements taken as a whole, presents fairly in all material respects the information set forth therein.
We also have audited, in accordance with the standards of the Public Company Accounting Oversight Board (United States), Buckeye Technologies Inc.’s internal control over financial reporting as of June 30, 2010, based on criteria established in Internal Control-Integrated Framework issued by the Committee of Sponsoring Organizations of the Treadway Commission and our report dated September 1, 2010 expressed an unqualified opinion thereon.
Memphis, Tennessee /s/ Ernst & Young LLP
September 1, 2010
F-5
Consolidated Statements of Operations
(In thousands, except per share data)
|
Year Ended June 30
|
|||||||||||||||||
|
2010
|
2009
|
2008
|
|||||||||||||||
|
Net sales
|
$
|
756,426
|
$
|
754,529
|
$
|
825,517
|
|||||||||||
|
Cost of goods sold
|
635,023
|
645,194
|
675,955
|
||||||||||||||
|
Gross margin
|
121,403
|
109,335
|
149,562
|
||||||||||||||
|
Selling, research and administrative expenses
|
48,107
|
46,318
|
47,277
|
||||||||||||||
|
Amortization of intangibles and other
|
1,905
|
1,880
|
1,856
|
||||||||||||||
|
Goodwill impairment loss
|
-
|
138,008
|
-
|
||||||||||||||
|
Restructuring costs
|
3,353
|
-
|
96
|
||||||||||||||
|
Alternative fuel mixture credits
|
(77,677
|
)
|
(54,232
|
)
|
-
|
||||||||||||
|
Other operating income
|
(751
|
)
|
-
|
-
|
|||||||||||||
|
Operating income (loss)
|
146,466
|
(22,639
|
)
|
100,333
|
|||||||||||||
|
Other income (expense):
|
|||||||||||||||||
|
Interest income
|
123
|
240
|
571
|
||||||||||||||
|
Interest expense and amortization of debt costs
|
(17,624
|
)
|
(29,294
|
)
|
(33,557
|
)
|
|||||||||||
|
Gain (loss) on early extinguishment of debt
|
(2,606
|
)
|
401
|
(623
|
)
|
||||||||||||
|
Foreign exchange and other
|
(548
|
)
|
(418
|
)
|
581
|
||||||||||||
|
Income (loss) before income taxes
|
125,811
|
(51,710
|
)
|
67,305
|
|||||||||||||
|
Income tax expense
|
11,237
|
13,678
|
20,203
|
||||||||||||||
|
Net income (loss)
|
$
|
114,574
|
$
|
(65,388
|
)
|
$
|
47,102
|
||||||||||
|
Earnings (loss) per share
|
|||||||||||||||||
|
Basic
|
$
|
2.95
|
$
|
(1.69
|
)
|
$
|
1.21
|
||||||||||
|
Diluted
|
$
|
2.90
|
$
|
(1.69
|
)
|
$
|
1.20
|
||||||||||
|
Weighted average shares for earnings per share
|
|||||||||||||||||
|
Basic
|
38,874
|
38,689
|
38,888
|
|
|||||||||||||
|
Effect of diluted shares
|
631
|
-
|
513
|
||||||||||||||
|
Diluted
|
39,505
|
38,689
|
39,401
|
||||||||||||||
See accompanying notes.
F-6
Consolidated Balance Sheets
(In thousands, except share data)
|
June 30
|
|||||||
|
2010
|
2009
|
||||||
|
Assets
|
|||||||
|
Current assets:
|
|||||||
|
Cash and cash equivalents
|
$
|
22,121
|
$
|
22,061
|
|||
|
Accounts receivable – trade, net of allowance for doubtful accounts of $850 in 2010 and $991 in 2009
|
119,566
|
105,087
|
|||||
|
Income tax and alternative fuel mixture credits receivable
|
68,356
|
9,374
|
|||||
|
Accounts receivable – other
|
3,394
|
6,205
|
|||||
|
Inventories
|
74,850
|
87,637
|
|||||
|
Deferred income taxes
|
2,478
|
261
|
|||||
|
Prepaid expenses and other
|
7,063
|
6,246
|
|||||
|
Total current assets
|
297,828
|
236,871
|
|||||
|
Property, plant and equipment, net
|
524,475
|
526,589
|
|||||
|
Goodwill
|
2,425
|
2,425
|
|||||
|
Intellectual property and other, net
|
27,726
|
26,499
|
|||||
|
Total assets
|
$
|
852,454
|
$
|
792,384
|
|||
|
Liabilities and stockholders’ equity
|
|||||||
|
Current liabilities:
|
|||||||
|
Trade accounts payable
|
$
|
39,376
|
$
|
30,882
|
|||
|
Accrued expenses
|
44,007
|
40,804
|
|||||
|
Short-term debt
|
198
|
-
|
|||||
|
Current portion of long-term debt
|
67,000
|
-
|
|||||
|
Total current liabilities
|
150,581
|
71,686
|
|||||
|
Long-term debt
|
170,332
|
327,465
|
|||||
|
Accrued postretirement benefits
|
25,283
|
23,235
|
|||||
|
Deferred income taxes
|
56,344
|
48,399
|
|||||
|
Other liabilities
|
12,593
|
3,568
|
|||||
|
Commitments and contingencies (Notes 21 and 22)
|
|||||||
|
Stockholders’ equity:
|
|||||||
|
Preferred stock, $.01 par value; 10,000,000 shares authorized; none issued or outstanding
|
-
|
-
|
|||||
|
Common stock, $.01 par value; 100,000,000 shares authorized; 43,142,770 shares issued; 39,909,310 and 39,491,951 shares outstanding at June 30, 2010 and 2009, respectively
|
431
|
431
|
|||||
|
Additional paid-in capital
|
45,480
|
43,736
|
|||||
|
Accumulated other comprehensive income
|
31,131
|
33,701
|
|||||
|
Retained earnings
|
403,121
|
288,547
|
|||||
|
Treasury shares, 3,233,460 and 3,650,944 shares at June 30, 2010 and 2009, respectively
|
(42,842
|
)
|
(48,384
|
)
|
|||
|
Total stockholders’ equity
|
437,321
|
318,031
|
|||||
|
Total liabilities and stockholders’ equity
|
$
|
852,454
|
$
|
792,384
|
|||
See accompanying notes.
F-7
Consolidated Statements of Stockholders' Equity
(In thousands, except share data)
|
Common
stock
|
Additional
paid-in
capital
|
Accumulated
other
comprehensive
income (loss)
|
Retained
Earnings
|
Treasury
shares
|
Total
|
||||||||||||||
|
Balance at June 30, 2007
|
$
|
431
|
$
|
48,032
|
$
|
49,491
|
$
|
307,851
|
$
|
(58,651
|
)
|
$
|
347,154
|
||||||
|
Comprehensive income:
|
|||||||||||||||||||
|
Net income
|
-
|
-
|
-
|
47,102
|
-
|
47,102
|
|||||||||||||
|
Other comprehensive income (loss):
|
|||||||||||||||||||
|
Foreign currency translation adjustment
|
-
|
-
|
31,184
|
-
|
-
|
31,184
|
|||||||||||||
|
Net prior service credit and actuarial gain on post
retirement obligations, net of tax of $450
|
-
|
-
|
767
|
-
|
-
|
767
|
|||||||||||||
|
Net unrealized loss from cash flow hedging
instrument, net of tax of ($227)
|
-
|
-
|
(386
|
)
|
-
|
-
|
(386
|
)
|
|||||||||||
|
Comprehensive income
|
78,667
|
||||||||||||||||||
|
Adjustment to apply FIN 48, net of tax
|
-
|
-
|
-
|
(878
|
)
|
-
|
(878
|
)
|
|||||||||||
|
Issuance of 614,695 shares of common stock
|
-
|
(2,572
|
)
|
-
|
-
|
8,391
|
5,819
|
||||||||||||
|
Repurchase of 300,000 shares of common stock
|
-
|
-
|
-
|
-
|
(2,720
|
)
|
(2,720
|
)
|
|||||||||||
|
Stock-based compensation expense
|
-
|
914
|
-
|
-
|
-
|
914
|
|||||||||||||
|
Tax benefit from stock-based awards
|
-
|
601
|
-
|
-
|
-
|
601
|
|||||||||||||
|
Balance at June 30, 2008
|
$
|
431
|
$
|
46,975
|
$
|
81,056
|
$
|
354,075
|
$
|
(52,980
|
)
|
$
|
429,557
|
||||||
|
Comprehensive income:
|
|||||||||||||||||||
|
Net loss
|
-
|
-
|
-
|
(65,388
|
)
|
-
|
(65,388
|
)
|
|||||||||||
|
Other comprehensive income (loss):
|
|||||||||||||||||||
|
Foreign currency translation adjustment
|
-
|
-
|
(48,072
|
)
|
-
|
-
|
(48,072
|
)
|
|||||||||||
|
Net prior service credit and actuarial losses on post
retirement obligations, net of tax of $282
|
-
|
-
|
479
|
-
|
-
|
479
|
|||||||||||||
|
Net unrealized gain from cash flow hedging
instrument, net of tax of $140
|
|
|
-
|
|
|
-
|
|
|
238
|
|
|
-
|
|
|
-
|
|
|
238
|
|
|
Comprehensive income (loss)
|
(112,743
|
)
|
|||||||||||||||||
|
Adjustment to apply ASC 715 “Compensation – Retirement Benefits”, net of tax
|
-
|
-
|
-
|
(140
|
)
|
-
|
(140
|
)
|
|||||||||||
|
Issuance of 396,948 shares of common stock
|
-
|
(5,263
|
)
|
-
|
-
|
5,263
|
-
|
||||||||||||
|
Forfeiture of 12,699 shares of common stock
|
-
|
173
|
-
|
-
|
(173
|
)
|
-
|
||||||||||||
|
Repurchase of 54,800 shares of common stock
|
-
|
-
|
-
|
-
|
(494
|
)
|
(494
|
)
|
|||||||||||
|
Stock-based compensation expense
|
-
|
1,845
|
-
|
-
|
-
|
1,845
|
|||||||||||||
|
Tax benefit from stock-based awards
|
-
|
6
|
-
|
-
|
-
|
6
|
|||||||||||||
|
Balance at June 30, 2009
|
$
|
431
|
$
|
43,736
|
$
|
33,701
|
$
|
288,547
|
$
|
(48,384
|
)
|
$
|
318,031
|
||||||
|
Comprehensive income:
|
|||||||||||||||||||
|
Net income
|
-
|
-
|
-
|
114,574
|
-
|
114,574
|
|||||||||||||
|
Other comprehensive income (loss):
|
|||||||||||||||||||
|
Foreign currency translation adjustment
|
-
|
-
|
(689
|
)
|
-
|
-
|
(689
|
)
|
|||||||||||
|
Net prior service credit and actuarial losses on post
retirement obligations, net of tax of ($1,194)
|
-
|
-
|
(2,033
|
)
|
-
|
-
|
(2,033
|
)
|
|||||||||||
|
Net unrealized gain from cash flow hedging
instrument, net of tax of ($89)
|
-
|
-
|
152
|
-
|
-
|
152
|
|||||||||||||
|
Comprehensive income
|
112,004
|
||||||||||||||||||
|
Issuance of 504,461 shares of common stock
|
(2,766
|
)
|
6,682
|
3,916
|
|||||||||||||||
|
Withholding of 47,877 shares of restricted stock for tax payments
|
-
|
641
|
-
|
-
|
(641
|
)
|
-
|
||||||||||||
|
Forfeiture of 37,100 shares of common stock
|
-
|
499
|
-
|
-
|
(499
|
)
|
-
|
||||||||||||
|
Stock-based compensation expense
|
-
|
2,335
|
-
|
-
|
-
|
2,335
|
|||||||||||||
|
Tax benefit from stock-based awards
|
-
|
1,035
|
-
|
-
|
-
|
1,035
|
|||||||||||||
|
Balance at June 30, 2010
|
$
|
431
|
$
|
45,480
|
$
|
31,131
|
$
|
403,121
|
$
|
(42,842
|
)
|
$
|
437,321
|
||||||
|
See accompanying notes.
|
|||||||||||||||||||
F-8
Consolidated Statements of Cash Flows
(In thousands)
|
Year Ended June 30
|
||||||||||
|
2010
|
2009
|
2008
|
||||||||
|
Operating activities
|
||||||||||
|
Net income (loss)
|
$
|
114,574
|
$
|
(65,388
|
)
|
$
|
47,102
|
|||
|
Adjustments to reconcile net income (loss) to net cash provided by operating activities:
|
||||||||||
|
Depreciation
|
46,275
|
48,047
|
50,873
|
|||||||
|
Amortization
|
2,857
|
2,541
|
2,155
|
|||||||
|
(Gain) loss on early extinguishment of debt
|
2,606
|
(401
|
)
|
623
|
||||||
|
Goodwill impairment loss
|
-
|
138,008
|
-
|
|||||||
|
Deferred income taxes
|
7,658
|
(1,006
|
)
|
12,850
|
||||||
|
Provision for bad debts
|
(84
|
)
|
477
|
116
|
||||||
|
Excess tax benefit from stock based compensation
|
(726
|
)
|
-
|
(44
|
)
|
|||||
|
Stock-based compensation expense
|
2,335
|
1,845
|
914
|
|||||||
|
Other
|
3,599
|
436
|
27
|
|||||||
|
Changes in operating assets and liabilities:
|
||||||||||
|
Accounts receivable
|
(16,200
|
)
|
9,872
|
(5,975
|
)
|
|||||
|
Income tax and alternative fuel mixture credits receivable
|
(58,982
|
)
|
(9,374
|
)
|
-
|
|||||
|
Inventories
|
12,452
|
19,453
|
(20,185
|
)
|
||||||
|
Other assets
|
(94
|
)
|
(1,318
|
)
|
(1,205
|
)
|
||||
|
Accounts payable and other current liabilities
|
9,220
|
(21,925
|
)
|
5,055
|
||||||
|
Net cash provided by operating activities
|
125,490
|
121,267
|
92,306
|
|||||||
|
Investing activities
|
||||||||||
|
Purchases of property, plant and equipment
|
(47,540
|
)
|
(42,423
|
)
|
(49,197
|
)
|
||||
|
Proceeds from sales of assets
|
8
|
-
|
17
|
|||||||
|
Proceeds from State of Florida grant
|
7,381
|
-
|
-
|
|||||||
|
Other
|
(421
|
)
|
(340
|
)
|
(451
|
)
|
||||
|
Net cash used in investing activities
|
(40,572
|
)
|
(42,763
|
)
|
(49,631
|
)
|
||||
|
Financing activities
|
||||||||||
|
Net borrowings (payments) under revolving line of credit
|
80,502
|
(61,130
|
)
|
78,235
|
||||||
|
Payments on long-term debt and other
|
(170,000
|
)
|
(5,315
|
)
|
(129,019
|
)
|
||||
|
Payments for debt issuance costs
|
(650
|
)
|
-
|
(1,321
|
)
|
|||||
|
Payments related to early extinguishment of debt
|
(1,700
|
)
|
-
|
-
|
||||||
|
Purchase of treasury shares
|
-
|
(494
|
)
|
(2,720
|
)
|
|||||
|
Cash used to settle net share equity awards
|
(684
|
)
|
(43
|
)
|
-
|
|||||
|
Net proceeds from sale of equity interests
|
4,600
|
-
|
5,819
|
|||||||
|
Excess tax benefit from stock based compensation
|
726
|
-
|
44
|
|||||||
|
Net cash used in financing activities
|
(87,206
|
)
|
(66,982
|
)
|
(48,962
|
)
|
||||
|
Effect of foreign currency rate fluctuations on cash
|
2,348
|
146
|
1,890
|
|||||||
|
Increase (decrease) in cash and cash equivalents
|
60
|
11,668
|
(4,397
|
)
|
||||||
|
Cash and cash equivalents at beginning of year
|
22,061
|
10,393
|
14,790
|
|||||||
|
Cash and cash equivalents at end of year
|
$
|
22,121
|
$
|
22,061
|
$
|
10,393
|
||||
See accompanying notes.
F-9
Notes to Consolidated Financial Statements
(In thousands, except share data)
NOTE 1: ACCOUNTING POLICIES
Business Description and Basis of Presentation
Our financial statements are consolidated financial statements of Buckeye Technologies Inc. We manufacture and distribute value-added cellulose-based specialty products used in numerous applications including disposable diapers, personal hygiene products, engine air and oil filters, food casings, rayon filament, acetate plastics, thickeners and papers.
Fiscal Year
Except as otherwise specified, references to a year (e.g., “2010”) refers to our fiscal year ended June 30 of that year.
Reclassifications
Certain prior year amounts have been reclassified to conform to current year classifications.
Principles of Consolidation
The consolidated financial statements include the accounts of Buckeye Technologies Inc. and our subsidiaries, all of which are wholly owned. All significant intercompany accounts and transactions have been eliminated.
Summary of Significant Accounting Policies
Cash and Cash Equivalents
We consider cash equivalents to be temporary cash investments with a maturity of three months or less when purchased.
Inventories
Inventories are valued at the lower of cost or market. The costs of manufactured cotton-based specialty fibers and costs for nonwoven raw materials are generally determined on the first-in, first-out (“FIFO”) basis. Other manufactured products and raw materials are generally valued on an average cost basis. Manufactured inventory costs include material, labor and manufacturing overhead. Slash pine timber, cotton fibers and chemicals are the principal raw materials used in the manufacture of our specialty fiber products. Fluff pulp is the principal raw material used in our nonwoven materials products. We take physical counts of inventories at least annually, and we review periodically the provision for potential losses from obsolete, excess or slow-moving inventories. The reserve for the lower of cost or market valuation was $311 on June 30, 2010 and $1,278 on June 30, 2009.
Allowance for Doubtful Accounts
We provide an allowance for receivables we believe we may not collect in full. Management evaluates the collectability of accounts based on a combination of factors. In circumstances where we are aware of a specific customer’s inability to meet its financial obligations (i.e., bankruptcy filings or substantial downgrading of credit ratings), we record a specific reserve. For all other customers, we recognize reserves for bad debts based on our historical collection experience. If circumstances change (i.e., higher than expected defaults or an unexpected material adverse change in a major customer’s ability to meet its financial obligations), our estimates of the recoverability of amounts due could differ by a material amount. We have established credit limits for each customer. We generally require the customer to provide a letter of credit for export sales in high-risk countries. Credit limits are monitored routinely.
F-10
Property, Plant and Equipment
Property, plant and equipment are recorded at cost. Cost includes the interest cost associated with significant capital additions. Interest capitalized for the years ended June 30, 2010, 2009 and 2008 was $1,376, $1,423 and $631, respectively. Depreciation on production machinery and equipment at the cotton cellulose and airlaid nonwovens plants is determined by the units-of-production method which is based on the expected productive hours of the assets, subject to a minimum level of depreciation. The straight-line method is used for determining depreciation on other capital assets. Depreciation under the straight-line method is computed over the following estimated useful lives: buildings—30 to 40 years; machinery and equipment—3 to 20 years. Depreciation and amortization expense includes the amortization of assets under capital lease.
Long-Lived Assets
Long-lived assets are reviewed for impairment when circumstances indicate the carrying value of an asset may not be recoverable. For assets that are to be held and used, recoverability is evaluated based on the undiscounted cash flows expected to be generated by the asset. If the carrying values of the assets are determined to not be recoverable, we measure the potential impairment by comparing the carrying value of the assets to their fair value. If impairment exists, an adjustment is made to write the asset down to its fair value. Estimated fair values are determined based on quoted market values, discounted cash flows or internal and external appraisals, as applicable. Assets to be disposed of are carried at the lower of carrying value or estimated net realizable value.
In accordance with ASC 350 “Intangibles – Goodwill and Other”, we perform a goodwill impairment analysis on an annual basis, in the fourth fiscal quarter, and, if certain events or circumstances indicate that an impairment loss may have been incurred, on an interim basis. Goodwill is recognized for the excess of the purchase price over the fair value of tangible and identifiable intangible net assets of businesses acquired. Goodwill of businesses acquired is specifically identified to the reporting units to which the businesses belong. We estimate fair value based on a combination of the income approach and the market approach. The income approach requires management to estimate future net cash flows, the timing of these cash flows and an appropriate discount rate (or weighted average cost of capital) representing the time value of money and the inherent risk and uncertainty of future cash flows. The discount rate is based on independently calculated beta risks for a composite group of companies, our target capital mix and an estimated market risk premium. The assumptions used in estimating future cash flows are consistent with the reporting unit’s internal planning. The market approach estimates the fair value of our reporting units on comparable market prices. Goodwill is measured at the reporting unit level by comparing the reporting unit’s carrying amount, including goodwill, to the fair market value of the reporting unit. The analysis of potential impairment of goodwill requires a two-step process. The first step is the estimation of fair value. If step one indicates that impairment potentially exists, the second step is performed to measure the amount of impairment, if any. Goodwill impairment exists when the implied fair value of goodwill is less than its carrying value. During 2009, we recorded an impairment charge of $138,008. See Note 3, Goodwill, for further discussion of goodwill and the goodwill impairment charge. No impairment of goodwill was recorded during 2010 or 2008. The change in goodwill during 2008 resulted from changes in foreign currency exchange rates. Prior to adoption of ASC 350, we amortized goodwill. Accumulated amortization totaled $1,577 at June 30, 2010 and 2009.
Intellectual Property and Other
At June 30, 2010 and 2009, we had intellectual property totaling $13,154 and $14,845, respectively, which includes patents, licenses, trademarks and trade names, the majority of which were obtained in the acquisition of airlaid nonwovens businesses and Stac-Pac® technology. Intellectual property is amortized by the straight-line method over 5 to 20 years and is net of accumulated amortization of $20,620 and $18,778 at June 30, 2010 and 2009, respectively. Intellectual property amortization expense of $1,905, $1,880 and $1,856 was recorded during the years June 30, 2010, 2009 and 2008, respectively. Estimated amortization expense for the five succeeding fiscal years follows: $1,910 in 2011, $1,915 in 2012, $1,915 in 2013, $1,915 in 2014 and $1,915 in 2015.
Deferred debt costs of $2,440 and $4,706 at June 30, 2010 and 2009, respectively, are amortized by the effective interest method over the life of the related debt and are net of accumulated amortization of $3,128 and $5,454 at June 30, 2010 and 2009, respectively. We recorded amortization of deferred debt costs of $946, $1,047 and $1,088 during the years ending June 30, 2010, 2009 and 2008, respectively.
Income Taxes
We provide for income taxes under the liability method. Accordingly, deferred income taxes reflect the net tax effects of temporary differences between the carrying amounts of assets and liabilities for financial reporting purposes and the amounts used for income tax purposes. No provision is made for U.S. income taxes applicable to undistributed earnings of foreign subsidiaries that are indefinitely reinvested in foreign operations. It is not practicable to compute the potential deferred tax liability associated with these undistributed foreign earnings.
F-11
Risk Management
We are exposed to certain market risks as a part of our ongoing business operations and use derivative financial instruments, where appropriate, to manage these risks. Derivatives are financial instruments whose value is derived from one or more underlying financial instruments. Examples of underlying instruments are currencies, commodities and interest rates. We record the fair value of all outstanding derivatives in other assets or other liabilities. Gains and losses related to non-designated instruments or the ineffective portion of any hedge are recorded in various costs and expenses. Derivatives are recorded in the consolidated balance sheet at fair value.
Labor Agreements
As of June 30, 2010, we employed approximately 1,400 employees. Approximately 46% of the global workforce is covered under collective bargaining agreements. These employees are represented by unions at three plants, two in the U.S. at Perry, Florida (the “Foley Plant”) and Memphis, Tennessee and one in Canada at Delta, British Columbia. Our Foley Plant’s labor agreement is in effect through April 1, 2012. The agreement for the Memphis Plant is in effect through March 18, 2013. At our Canadian facility, the labor agreement expired on June 30, 2009, but was automatically extended until negotiations are completed.
Environmental Costs
Based on ASC 410 “Asset Retirement and Environmental Obligations”, we capitalize environmental contamination treatment costs if (1) the costs extend the life, increase the capacity, or improve the safety or efficiency of property and the condition of that property after the costs are incurred is improved as compared to its condition when originally constructed or acquired, if later, (2) the costs mitigate or prevent environmental contamination that has yet to occur and that otherwise may result from future operations or activities and the costs improve the property compared to its condition when originally constructed or acquired, if later, or (3) the costs are incurred in preparing a property for sale. A liability is recorded for such capital expenditures when incurred.
Liabilities for environmental expenses are recorded when probable and the cost can be reasonably estimated. Generally, the timing of these accruals coincides with the earlier of completion of a feasibility study or our commitment to a plan of action based on the then known facts.
Revenue Recognition
We recognize revenue when the following criteria are met: persuasive evidence of an agreement exists: (i) delivery has occurred; (ii)our price to the buyer is fixed and determinable; and (iii) collectability is reasonably assured. Delivery is not considered to have occurred until the customer takes title and assumes the risks and rewards of ownership. The timing of revenue recognition is largely dependent on shipping terms. Discounts and allowances reduce net sales and are comprised of trade allowances, cash discounts and sales returns.
Shipping and Handling Costs
Amounts related to shipping and handling which are billed to a customer in a sales transaction have been classified as revenue. Costs incurred for shipping and handling have been classified as costs of goods sold.
Repairs and Maintenance Costs
Repairs and maintenance costs are expensed as incurred.
Foreign Currency Translation
Management has determined that the local currency of our German, Canadian, and Brazilian subsidiaries is the functional currency, and accordingly European euro, Canadian dollar, and Brazilian real denominated balance sheet accounts are translated into United States dollars at the rate of exchange in effect at fiscal year end. Income and expense activity for the period is translated at the average exchange rate during the period. Translation adjustments are included as a separate component of stockholders' equity.
Transaction gains and losses that arise from exchange rate fluctuations on transactions denominated in a currency other than the local functional currency are included in “Foreign exchange and other” in the results of operations. Transaction gains of $498, $192 and $396 were recorded during the years ended June 30, 2010, 2009 and 2008, respectively.
F-12
Use of Estimates
The preparation of the consolidated financial statements in conformity with accounting principles generally accepted in the United States (“GAAP”) requires management to make estimates and assumptions that affect the amounts reported in the consolidated financial statements and accompanying notes. Actual results could differ from the estimates and assumptions used.
Changes in estimates are recognized in accordance with the accounting rules for the estimate, which is typically in the period when new information becomes available to management. Areas where the nature of the estimate makes it reasonably possible that actual results could materially differ from amounts estimated include: impairment assessments on long-lived assets (including goodwill), allowance for doubtful accounts, inventory reserves, income tax liabilities, and contingent liabilities.
Earnings Per Share
Basic earnings per share has been computed based on the average number of common shares outstanding excluding restricted stock. Diluted earnings per share reflects the increase in average common shares outstanding that would result from the assumed exercise of outstanding stock options and restricted stock awards calculated using the treasury stock method.
Stock-Based Compensation
We use a modified prospective application, as permitted under ASC 718 “Compensation – Stock Compensation”, for share-based awards. Under this application, we are required to record compensation expense for all share-based awards granted after July 1, 2005 (the date of adoption) and for the unvested portion of previously granted share-based awards that remained outstanding at the date of adoption.
Dividends declared per common share
On August 3, 2010, our Board of Directors declared a quarterly dividend of $0.04 per share of common stock. The dividend is payable on September 15, 2010 to stockholders of record as of the close of business on August 16, 2010. Each quarterly dividend payment is subject to review and approval by our Board of Directors, and we evaluate our dividend payment amount on an annual basis at the end of each fiscal year. Our 2013 notes limit the funds available to make dividend payments.
NOTE 2: RECENT ACCOUNTING PRONOUNCEMENTS
Effective July 1, 2008, we adopted the rules for fair value measurements, which define fair values, establish a framework for measuring fair value in accordance with GAAP, and expand disclosure about fair value measurements. We have applied the fair value measurements to our financial assets and liabilities which consist of derivative contracts, including interest rate swaps, foreign currency forward contracts, and other financial instruments that are used to hedge exposures to interest rate, currency and commodity risks. Effective July 1, 2009, we applied the rules for fair value measurements to our non-financial assets and liabilities recorded at fair value on a non-recurring basis. See Note 12, Fair Value Measurements, for our disclosures about fair value measurements.
In December 2007, new guidance was issued to better represent the economic value of a business combination transaction. The changes to the guidance include, but are not limited to: (1) acquisition costs will be recognized separately from the acquisition; (2) known contractual contingencies at the time of the acquisition will be considered part of the liabilities acquired measured at their fair value; all other contingencies will be part of the liabilities acquired measured at their fair value only if it is more likely than not that they meet the definition of a liability; (3) contingent consideration based on the outcome of future events will be recognized and measured at the time of the acquisition; (4) business combinations achieved in stages (step acquisitions) will need to recognize the identifiable assets and liabilities, as well as noncontrolling interests, in the acquiree, at the full amounts of their fair values; and (5) a bargain purchase (defined as a business combination in which the total acquisition-date fair value of the identifiable net assets acquired exceeds the fair value of the consideration transferred plus any noncontrolling interest in the acquiree) will require that excess to be recognized as a gain attributable to the acquirer. We adopted the new guidance effective July 1, 2009. This guidance had no effect on our current financial statements.
On July 1, 2009, we adopted the provisions that are included in the Accounting Standards Codification and the Hierarchy of Generally Accepted Accounting Principles which identify the sources of accounting principles and the framework for selecting the principles to be used in the preparation of financial statements of nongovernmental entities that are presented in conformity with GAAP. The Accounting Standards Codification’s primary purpose is to improve clarity and use of existing standards by grouping authoritative literature under common topics.
F-13
In December 2009, the FASB issued Accounting Standards Update No. 2009-17, “Improvements to Financial Reporting by Enterprises Involved with Variable Interest Entities” (“ASU 2009-17”) amending the FASB Accounting Standards Codification (“Codification”). The amendments in ASU 2009-17 replace the quantitative-based risks and rewards calculation for determining which enterprise, if any, has a controlling financial interest in a variable interest entity with an approach focused on identifying which enterprise has the power to direct the activities of a variable interest entity that most significantly impact the entity’s economic performance and (1) the obligation to absorb losses of the entity or (2) the right to receive benefits from the entity. An approach that is expected to be primarily qualitative will be more effective for identifying which enterprise has a controlling financial interest in a variable interest entity. The amendments in ASU 2009-17 also require additional disclosures about an enterprise’s involvement in variable interest entities, which will enhance the information provided to users of financial statements. We adopted ASU 2009-17 effective December 31, 2009 and it did not have a material effect on our current financial statements; however, it may have a material effect on future financial statements depending on our future activities.
In January 2010, the FASB issued Accounting Standards Update 2010-01, “Equity: Accounting for Distributions to Shareholders with Components of Stock and Cash,” (“ASU 2010-01”). ASU 2010-01 amends the Codification to clarify that the stock portion of a distribution to shareholders that allows them to elect to receive cash or stock with a potential limitation on the total amount of cash that all shareholders can elect to receive in the aggregate is considered a share issuance that is reflected in earnings per share prospectively and is not a stock dividend. ASU 2010-01 codifies the consensus reached by the Emerging Issues Task Force in Issue No. 09-E, “Accounting for Stock Dividends, including Distributions to Shareholders with Components of Stock and Cash.” We adopted ASU 2010-01 effective December 31, 2009 and it did not have a material effect on our current financial statements; however, it may have an effect on future financial statements depending on our future activities.
In January 2010, the FASB issued Accounting Standards Update 2010-02, “Consolidation: Accounting and Reporting for Decreases in Ownership of a Subsidiary – A Scope Clarification,” (“ASU 2010-02”). ASU 2010-02 amends the Codification to clarify that the scope of the decrease in ownership provisions of ASC 810-10 and related guidance applies to: (i) a subsidiary or group of assets that is a business or nonprofit activity; (ii) a subsidiary that is a business or nonprofit activity that is transferred to an equity method or joint venture; (iii) an exchange of a group of assets that constitutes a business or nonprofit activity for a non-controlling interest in an entity (including an equity-method investee or joint venture); and (iv) a decrease in ownership in a subsidiary that is not a business or nonprofit activity when the substance of the transaction causing the decrease in ownership is not addressed in other authoritative guidance. If no other guidance exists, an entity should apply the guidance in ASC 810-10. The amendments in the update also clarify that the decrease in ownership guidance in ASC 810-10 does not apply to sales of in-substance real estate or conveyances of oil and gas mineral rights, even if these transfers involve businesses. We adopted ASU 2010-02 effective December 31, 2009 and it did not have a material effect on our current financial statements, however, it may have an effect on future financial statements depending on our future activities.
In January 2010, the FASB issued Accounting Standards Update 2010-06, “Fair Value Measures and Disclosures,” (“ASU 2010-06”). ASU 2010-06 amends the Codification to require new disclosures as follows: (1) transfers in and out of Levels 1 and 2; and (2) activity in Level 3 fair value measurements. ASU 2010-06 further provides amendments to the Codification that clarify existing disclosures as follows: (1) level of disaggregation; and (2) disclosures about inputs and valuation techniques. We adopted ASU 2010-06 and it did not have a material effect on our current financial statements.
In January 2010, the FASB issued Accounting Standards Update 2010-09, “Subsequent Events (Topic 855),” (“ASU 2010-09”). As a result of ASU 2010-09, SEC registrants will no longer disclose the date through which management evaluated subsequent events in the financial statements, either in originally issued financial statements or reissued financial statements. The guidance in ASU 2010-09 is effective immediately. We adopted ASU 2010-09 and it did not have a material effect on our current financial statements.
F-14
NOTE 3: GOODWILL
We perform a goodwill impairment analysis on an annual basis and, if certain events or circumstances indicate that an impairment loss may have been incurred, on an interim basis. Goodwill is recognized for the excess of the purchase price over the fair value of tangible and identifiable intangible net assets of businesses acquired. Goodwill of businesses acquired is specifically identified to the reporting units to which the businesses belong. Goodwill is reviewed annually for impairment in the fourth fiscal quarter. We estimate fair value based on a combination of the income approach and the market approach. The income approach requires management to estimate future net cash flows, the timing of these cash flows and an appropriate discount rate (or weighted average cost of capital) representing the time value of money and the inherent risk and uncertainty of future cash flows. The discount rate is based on independently calculated beta risks for a composite group of companies, our target capital mix and an estimated market risk premium. The assumptions used in estimating future cash flows are consistent with the reporting unit’s internal planning. The market approach estimates the fair value of our reporting units on comparable market prices. Goodwill is measured at the reporting unit level by comparing the reporting unit’s carrying amount, including goodwill, to the fair market value of the reporting unit. The analysis of potential impairment of goodwill requires a two-step process. The first step is the estimation of fair value. If step one indicates that impairment potentially exists, the second step is performed to measure the amount of impairment, if any. Goodwill impairment exists when the implied fair value of goodwill is less than its carrying value.
During our quarter ended December 31, 2008, based on the economic environment at that time and the steep decline in the price of our stock, which created a significant gap between the book and market value of our equity, we concluded that there were sufficient indicators to require us to perform an interim goodwill impairment test as of December 31, 2008. As a result, during the three months ended December 31, 2008, we recorded an impairment charge of $138,008 which represented our best estimate of the resulting goodwill impairment. We engaged an independent valuation firm to assist with this impairment testing by expressing opinions as of December 31, 2008 of the fair values of the business enterprises of our four reporting units. The results of step one indicated goodwill was impaired at three of our reporting units as the estimated fair value was less than the carrying value of the reporting units. As such, step two of the goodwill impairment test was performed to determine the actual amount of goodwill impairment. In this step, we were required to allocate the fair value of the reporting unit, as determined in step one, to all of the reporting unit’s assets and liabilities in a hypothetical purchase price allocation as if these reporting units had been acquired on the date of the test. Upon completion of this step, our original estimate did not change and therefore no change was required to the $138,008 non-cash goodwill impairment charge estimated and recorded in the second quarter of 2009. We reviewed our long-lived tangible and intangible assets within the impaired reporting units and determined that the forecasted undiscounted cash flows related to these assets or asset groups were in excess of their carrying values, and therefore these assets were not impaired.
There were no changes in the carrying amount of goodwill for the year ended June 30, 2010. The changes in the carrying amount of goodwill for the year ended June 30, 2009 were as follows:
|
Balance as of
June 30, 2008
|
Change due to fluctuation in
foreign currency exchange rate
|
Impairment
|
Balance as of
June 30, 2009
|
|||||||||
|
Specialty Wood Fibers Reporting Unit
|
$
|
3,932
|
$
|
-
|
$
|
(3,932
|
)
|
$
|
-
|
|||
|
Specialty Cotton Fibers Reporting Unit
|
45,827
|
(7,007
|
)
|
(38,820
|
)
|
-
|
||||||
|
Specialty Fibers Segment
|
49,759
|
(7,007
|
)
|
(42,752
|
)
|
-
|
||||||
|
Airlaid Nonwovens Reporting Unit
|
111,438
|
(16,182
|
)
|
(95,256
|
)
|
-
|
||||||
|
Converting Reporting Unit
|
2,425
|
-
|
-
|
2,425
|
||||||||
|
Nonwoven Materials Segment
|
113,863
|
(16,182
|
)
|
(95,256
|
)
|
2,425
|
||||||
|
Total
|
$
|
163,622
|
$
|
(23,189
|
)
|
$
|
(138,008
|
)
|
$
|
2,425
|
||
F-15
NOTE 4: RESTRUCTURING COSTS
During 2010, we entered into a restructuring program to sharpen our focus on key priorities which included restructuring our Ultra Fiber sales force, aligning capacity utilization with current market conditions at our Memphis Plant, and reducing selling, research and administrative expenses. The total cost of this program was $3,353 and was completed during the fourth quarter of 2010. The remaining accrual of $313 will be paid over the next six months. As a result of this restructuring, 31 positions were eliminated and 8 employees were transferred from selling, research and administrative positions to management positions at our Foley Plant.
Restructuring expenses are included in “Restructuring costs” in our consolidated statements of operations. The charges below reflect severance and employee benefits accrued over the retention period, relocation expenses and other miscellaneous expenses. Accrual balances are included in “Accrued expenses” in the balance sheet. The following table summarizes the expenses and accrual balances by reporting segment for the year ended June 30, 2010.
|
Year Ended June 30, 2010
|
|||||||||||||||||||
|
2010 Restructuring Program
|
Accrual
Balance as of
June 30, 2009
|
Additional Charges
|
Payments
|
Accrual
Balance as of
June 30, 2010
|
Program
Charges to
Date
|
Total
Estimated
Charges
|
|||||||||||||
|
Severance and employee benefits
|
|||||||||||||||||||
|
Specialty fibers
|
$
|
-
|
$
|
1,035
|
$
|
(1,029
|
)
|
$
|
6
|
$
|
1,035
|
$
|
1,035
|
||||||
|
Corporate
|
-
|
1,370
|
(1,313
|
)
|
57
|
1,370
|
1,370
|
||||||||||||
|
Other miscellaneous expenses
|
|||||||||||||||||||
|
Specialty fibers
|
-
|
948
|
(698
|
)
|
250
|
948
|
948
|
||||||||||||
|
Total 2010 Program
|
$
|
-
|
$
|
3,353
|
$
|
(3,040
|
)
|
$
|
313
|
$
|
3,353
|
$
|
3,353
|
||||||
NOTE 5: ALTERNATIVE FUEL MIXTURE CREDITS
The U.S. Internal Revenue Code of 1986, as amended (the “Code”) permits a refundable excise tax credit under certain circumstances for the production and use of alternative fuels and alternative fuel mixtures in lieu of fossil-based fuels. The credit was equal to $.50 per gallon of alternative fuel contained in the mixture. We qualified for the alternative fuel mixture credit because we produce liquid fuels derived from biomass, byproducts of our wood pulping process, and utilize those fuels to power our Foley Plant.
On March 19, 2009 the U.S. Internal Revenue Service (“IRS”) accepted our application to be registered as an alternative fuel mixer. We began producing and consuming alternative fuel mixtures on February 12, 2009. We recorded $77,677 and $54,232 in alternative fuel mixture credits, which was net of expenses, in our consolidated statements of operations for 2010 and 2009, respectively. During 2010 and 2009 we received $8,449 and $38,422 in cash related to these claims, respectively. We claimed $13,848 as income tax credits on our 2009 tax return and $75,225 as income tax credits on our 2010 tax return. We have treated the credits received in cash as taxable income and the income tax credits as non-taxable income. The alternative fuel mixture credits are subject to audit by the IRS. The credit expired on December 31, 2009.
NOTE 6: MITIGATION BANK
In February 2002, we were issued a mitigation bank/environmental resource permit by the State of Florida to restore approximately 6,748 acres of property to wetlands. As the three phases of the project are completed under this permit, credits are released that can be sold through the mitigation bank and an obligation is created to maintain the property as wetlands in perpetuity.
In 2005, we began construction on the first phase of the mitigation bank. Since that time, we have completed two of the three phases covered under the permit. Phase III will not commence before 2013. During 2006 through 2009, we sold approximately 17 credits for $417. As of June 30, 2010 we have recorded a long-term asset of $586 for mitigation bank credits and a long-term perpetual maintenance liability of $157. The asset includes all costs associated with the construction required to return the property to wetlands, hydrologic monitoring, vegetation monitoring and the present value of the perpetual maintenance. During 2010 we recorded $751, which was net of expenses, in mitigation bank sales which are shown as other operating income on our consolidated statements of operations.
F-16
NOTE 7: INVENTORIES
|
Components of inventories
|
|||||||
|
June 30
|
|||||||
|
2010
|
2009
|
||||||
|
Raw materials
|
$
|
21,007
|
$
|
20,004
|
|||
|
Finished goods
|
29,901
|
42,599
|
|||||
|
Storeroom and other supplies
|
23,942
|
25,034
|
|||||
|
$
|
74,850
|
$
|
87,637
|
||||
NOTE 8: PROPERTY, PLANT AND EQUIPMENT
|
Components of property, plant and equipment
|
|||||||
|
June 30
|
|||||||
|
2010
|
2009
|
||||||
|
Land and land improvements
|
$
|
16,710
|
$
|
16,832
|
|||
|
Buildings
|
141,923
|
141,085
|
|||||
|
Machinery and equipment
|
913,180
|
892,518
|
|||||
|
Construction in progress
|
59,788
|
40,878
|
|||||
|
1,131,601
|
1,091,313
|
||||||
|
Accumulated depreciation
|
(607,126
|
)
|
(564,724
|
)
|
|||
|
$
|
524,475
|
$
|
526,589
|
||||
NOTE 9: ACCRUED EXPENSES
|
Components of accrued expenses
|
|||||||
|
June 30
|
|||||||
|
2010
|
2009
|
||||||
|
Income taxes
|
$
|
87
|
$
|
2,973
|
|||
|
Interest
|
3,147
|
6,159
|
|||||
|
Retirement plans
|
6,507
|
6,807
|
|||||
|
Salaries and incentive pay
|
14,237
|
6,501
|
|||||
|
Customer incentive programs
|
4,192
|
2,619
|
|||||
|
Vacation pay
|
4,878
|
4,734
|
|||||
|
Other
|
10,959
|
11,011
|
|||||
|
$
|
44,007
|
$
|
40,804
|
||||
F-17
NOTE 10: LONG-TERM DEBT
|
Components of long-term debt
|
|||||||
|
June 30
|
|||||||
|
2010
|
2009
|
||||||
|
Senior notes due 2013
|
$
|
140,000
|
$
|
200,000
|
|||
|
Senior subordinated notes due 2010
|
-
|
110,444
|
|||||
|
Credit Facility
|
97,332
|
17,021
|
|||||
|
Total debt
|
237,332
|
327,465
|
|||||
|
Less current portion of long-term debt
|
67,000
|
-
|
|||||
|
Total long-term debt
|
$
|
170,332
|
$
|
327,465
|
|||
Senior Notes
Our 8.5% senior notes due October 1, 2013 (the “2013 notes”) are unsecured obligations and are senior to any of our subordinated debt. The 2013 notes are guaranteed by our direct and indirect domestic subsidiaries that are also guarantors on our credit facility. The 2013 notes became redeemable at our option, in whole or part, at any time on or after October 1, 2008, at redemption prices varying from 104.25% to 100% of principal amount on or after October 1, 2011 (102.833% at June 30, 2010), together with accrued and unpaid interest to the date of redemption.
On June 30, 2009 we amended the 2013 notes to permit the redemption, repurchase or retirement of subordinated indebtedness, including our 8% senior subordinated notes due 2010 (the “2010 notes” and, with the 2013 notes, the “notes”), up to sixteen months prior to maturity, which represented an increase of four months compared to the prior terms of the indentures pursuant to which the notes were issued. We paid a consent fee of $650 in the aggregate to all consenting holders. We recorded this consent fee as a deferred financing cost and we are amortizing it over the remaining term of the 2013 notes using the effective interest rate method.
On January 4, 2010, we redeemed $35,000 of the 2013 notes using a combination of $19,000 cash on hand and $16,000 in borrowings on our revolving credit facility. On April 19, 2010, we redeemed $25,000 of the 2013 notes using borrowings on our revolving credit facility. During 2010, we recorded $2,771 in losses related to the extinguishment of this debt which included the redemption price premiums of $1,700 and the write-offs of the related deferred financing costs of $1,071.
Senior Subordinated Notes
On July 31, 2009 we redeemed the remaining $110,000 then outstanding of 2010 notes using borrowings on our revolving credit facility. During 2010 we recorded a $165 gain related to the early extinguishment of this debt, which was the net of the write-off of the related deferred financing costs and the remaining unamortized interest rate swap early termination fee.
Revolving Credit Facility
Our $200,000 senior secured revolving credit facility (the “Credit Facility”) currently has a maturity date of July 25, 2012. The interest rate applicable to borrowings under the Credit Facility is the agent’s prime rate plus 0.25% to 1.00% or a LIBOR-based rate ranging from LIBOR plus 1.25% to LIBOR plus 2.00%. The Credit Facility is secured by substantially all of our assets located in the United States.
The Credit Facility contains covenants customary for financing of this type. The financial covenants include: maximum total leverage ratio of consolidated total debt to consolidated earnings before interest, taxes, depreciation and amortization (“EBITDA”), and minimum ratio of consolidated EBITDA to consolidated interest expense. During 2010 and 2009 and at June 30, 2010, we were in compliance with the financial covenants under our credit facility.
We reclassified $67,000 of the outstanding balance on the credit facility to current portion of long-term debt due to our intention to pay this amount using proceeds from our 2010 U.S. federal income tax refund during the first quarter of 2011.
F-18
At June 30, 2010, we had $22,121 of cash and cash equivalents and we had $97,750 borrowing capacity under the Credit Facility. The Credit Facility allows for a sublimit on letters of credit of $50,000. As of June 30, 2010, $45,082 of the sublimit was unused. The commitment fee on the unused portion of the revolving credit facility ranges from 0.25% to 0.40% per annum based on a grid related to our leverage ratio. Total costs for the issuance of the facility were approximately $1,300 and are being amortized to interest expense using the effective interest method over the life of the facility. During 2008, $178 was expensed as early extinguishment of debt related to the write-off of deferred financing costs for the term loan portion of the former credit facility.
Aggregate maturities of long-term debt for the next five fiscal years and beyond are as follows: 2011-$67,000, 2013-$30,332, 2014-$140,000 and thereafter $0. Terms of long-term debt agreements require compliance with certain covenants including interest coverage ratios and limitations on restricted payments and levels of indebtedness.
Other
Total cash interest payments for 2010, 2009 and 2008 was $21,391, $29,462 and $35,615, respectively.
NOTE 11: LEASES
We lease office and warehouse facilities and equipment under various operating leases. Operating lease expense was $2,773, $2,771 and $2,401 during 2010, 2009 and 2008, respectively. The aggregate commitments under the operating leases at June 30, 2010 were as follows: 2011—$1,927; 2012—$1,114; 2013—$46; 2014—$2; 2015—$0 and thereafter—$0.
NOTE 12: FAIR VALUE MEASUREMENTS
For certain of our financial instruments, including cash and cash equivalents, accounts receivable, accounts payable, and short-term debt, the carrying amounts approximate fair value due to their short maturities. The fair value of our long-term public debt is based on an average of the bid and offer prices. The fair value of the credit facility approximates its carrying value due to its variable interest rate. The carrying value and fair value of long-term debt at June 30, 2010, were $237,332 and $241,007, respectively, and at June 30, 2009 were $327,465 and $311,362, respectively.
For the financial instruments disclosed below, fair value is determined at each balance sheet date using an income approach, which consists of a discounted cash flow model that takes into account the present value of future cash flows under the terms of the contracts using current market information as of the reporting date, such as prevailing interest rates and foreign currency spot and forward rates. The following table provides a summary of the inputs used to develop these estimates under the fair value hierarchy:
|
Fair Value Measurements at June 30, 2010
|
||||||||||||||||
|
Total
|
Quoted prices
in active
markets for
identical assets (Level 1)
|
Significant
other
observable
inputs
(Level 2)
|
Significant unobservable
inputs
(Level 3)
|
|||||||||||||
|
Assets:
|
||||||||||||||||
|
Natural gas hedges
|
$
|
39
|
$
|
-
|
$
|
39
|
$
|
-
|
||||||||
F-19
NOTE 13: FINANCIAL DERIVATIVE INSTRUMENTS
As part of our risk management program, we use a variety of financial instruments such as foreign currency forwards and options, interest rate swaps, and natural gas contracts as cash flow hedges to mitigate risk. We do not hold or issue derivative financial instruments for trading purposes.
Foreign Currency Hedging
Fluctuations in exchange rates can change our foreign currency equivalent revenue and hence our foreign currency earnings. When conditions warrant, our foreign subsidiaries hedge a portion of forecasted U.S. dollar denominated sales/receivables utilizing foreign exchange forward and option contracts. These contracts are designated as cash flow hedges and accounting for these hedge instruments requires that they be recorded on the balance sheet as either an asset or a liability measured at fair value as of the reporting date. The effective portion of the hedge gain or loss is reported as a component of accumulated other comprehensive income (loss) and subsequently reclassified into gain (loss) on exchange rates when the hedged exposure affects earnings. Any ineffective portions of related gains or losses are recorded in the statements of operations immediately. In the event the underlying forecasted transaction does not occur, or it becomes probable that it will not occur, we will reclassify the gain or loss on the related cash flow hedge from accumulated other comprehensive income (loss) to gain (loss) on exchange rates in our consolidated statement of operations. As of June 30, 2010, we did not have any foreign currency hedges in place. As of June 30, 2009 we had a foreign currency contract that did not qualify for hedge accounting treatment with a value of $320 recorded in prepaid expenses and other on the balance sheet.
Interest Rate Swaps
In May 2001, we entered into an interest rate swap relative to $100,000 of our 2010 notes. The swap converted interest payments from a fixed rate to a floating rate of LIBOR plus 1.97%. This arrangement qualified as a fair value hedge. As such, the net effect from the interest rate swap was recorded as part of interest expense. On October 15, 2003, the swap counter party exercised its right to terminate the swap and paid us $4,000 as an early termination fee, which was being amortized as a reduction to interest expense through October 15, 2010. At June 30, 2009, the unamortized portion of the termination fee was recorded as an increase in debt of $541. On July 31, 2009, the remaining $506 was recorded as a gain on early extinguishment of debt when we redeemed the remaining 2010 notes. During 2010, 2009 and 2008, the swap reduced our interest expense by $35, $463 and $877, respectively.
On September 17, 2007 we entered into an interest rate swap agreement that matured on September 17, 2009 relative to $30,000 of debt under our Credit Facility. The swap involved the exchange of interest payments from a floating-rate three month LIBOR plus the applicable margin on the revolving credit facility to a fixed rate of 4.79% plus the same applicable margin. This arrangement qualified as a cash flow hedge; therefore, the net effect from the interest rate swap was recorded as interest expense. On June 17, 2009 we retired the $30,000 of variable rate debt that had been hedged. As a result of the extinguishment of the underlying debt, hedge accounting on the interest rate swap was no longer appropriate. During 2009 and 2008, the swap increased our interest expense by $818 and $91, respectively.
Commodity Hedging
We have entered into contracts for the purchase of natural gas at a fixed rate to manage the price risk associated with a portion of our forecasted purchases. The objective of these hedges is to provide supply assurance for contracted volumes at a pre-determined price; provide a systemic method of purchasing commodities which enables us the opportunity to take advantage of forward price trends based on historical data; provide a methodology to bring price stability that will contribute to improved price forecasting and budgeting assumptions; and reduce the variability of cash flows associated with the purchase of natural gas at certain plants. These contracts are designated as cash flow hedges. As of June 30, 2010 and June 30, 2009 we had contracts in place to purchase 125,000 MMBTUs through December 2010 and 359,220 MMBTUs through May 2010 of natural gas at various fixed prices, respectively. Additionally, as of June 30, 2010 we had options in place to purchase 580,000 MMBTUs of natural gas at prices ranging from $6 to $7 per MMBTU through November 2010.
F-20
Fair Value of Derivative Instruments
In the next twelve months, we intend to reclassify into earnings $39 in net gains incurred in respect of cash flow hedges.
All cash flows associated with purchasing and selling derivatives are classified as operating cash flows in the consolidated statement of cash flows. The following table presents the location of all assets and liabilities associated with our hedging instruments within the consolidated balance sheet:
|
Asset Derivatives
|
Liability Derivatives
|
||||||||||||
|
Derivatives designated as hedging instruments
|
Balance Sheet Location
|
Fair Value at
6/30/10
|
Fair Value at
6/30/09
|
Fair Value at
6/30/10
|
Fair Value at 6/30/09
|
||||||||
|
Natural gas hedges
|
Prepaid expenses
|
$
|
39
|
$
|
-
|
$
|
-
|
$
|
-
|
||||
|
Natural gas hedges
|
Accrued expenses
|
-
|
-
|
234
|
|||||||||
|
Interest rate swap
|
Accrued expenses
|
-
|
-
|
-
|
320
|
||||||||
|
Total derivatives designated as hedging instruments
|
$
|
39
|
|
$
|
-
|
$
|
-
|
$
|
554
|
||||
The following tables present the impact of derivative instruments, net of tax, and their location within the consolidated statement of operations:
|
Derivatives in Cash Flow Hedging Relationships:
|
||||||||||||||||||
|
Amount of (Gain) Loss
Recognized in AOCI on
Derivative (Effective Portion)
|
Amount of (Gain) Loss
Reclassified from AOCI into
Income (Effective Portion)(a)
|
Amount of (Gain) Loss
Recognized in Income on
Derivatives (Ineffective Portion)
|
||||||||||||||||
|
Year ended June 30,
|
Year ended June30,
|
Year ended June 30,
|
||||||||||||||||
|
2010
|
2009
|
2010
|
2009
|
2010
|
2009
|
|||||||||||||
|
Natural gas hedges
|
$
|
146
|
$
|
1,163
|
$
|
387
|
$
|
(1,015
|
)
|
$
|
-
|
$
|
-
|
|||||
|
Interest rate swap
|
-
|
(1,093
|
)
|
-
|
707
|
-
|
-
|
|||||||||||
|
Total
|
$
|
146
|
$
|
70
|
$
|
387
|
$
|
(308
|
)
|
$
|
-
|
$
|
-
|
|||||
|
(a) Amounts related to natural gas contracts are included in cost of goods sold and amounts related to interest rate swaps are included in net interest expense and amortization of debt costs.
|
||||||||||||||||||
|
Derivatives not Designated as Cash Flow Hedges:
|
||||||||
|
Year ended June 30,
|
||||||||
|
Classification of (gains) or losses
|
2010
|
2009
|
||||||
|
Foreign currency swap
|
Foreign exchange and other
|
$
|
337
|
$
|
-
|
|||
NOTE 14: STOCKHOLDERS’ EQUITY
Stock Compensation Plans
In November 2007, the 2007 Omnibus Incentive Compensation Plan (the “2007 Plan”) was approved by the stockholders. The following is a general description of certain features of the 2007 Plan.
The 2007 Plan authorizes the grant of restricted stock or options to purchase shares of common stock as awards. Options granted may be either “incentive stock options” as defined in Section 422 of the Code, or nonqualified stock options, as determined by the Compensation Committee of the Board of Directors (the “Compensation Committee”).
The aggregate number of shares of common stock initially available for awards under the 2007 Plan was 3,500,000. The 2007 Plan provides that the number of shares available for issuance is reduced by a factor of one and three-fourths (1.75) to one for each share issued pursuant to an award of restricted stock. Accordingly, if the Compensation Committee granted all awards under the 2007 Plan in the form of restricted stock, the number of shares available for issuance would be 2,000,000.
F-21
Grants under the 2007 Plan are subject to terms and conditions determined by the Compensation Committee, are generally exercisable in increments of one-third per year beginning one year from the date of grant and expire ten years from the date of grant. During 2010 there were no options and 36,848 shares of restricted stock granted under the 2007 Plan. During 2009 and 2008, 360,236 and 320,951 options and 378,861 and 200,637 shares of restricted stock were granted under the 2007 Plan, respectively. At June 30, 2010, 1,836,820 shares were available to grant under this plan.
In August 1997, the Board of Directors authorized a restricted stock plan (the “Restricted Stock Plan”) and set aside 800,000 treasury shares to fund this plan. At June 30, 2010, 362,482 restricted shares had been awarded since inception of this plan. Under this plan, the vesting period is from the date of grant to the date of the recipient’s death or the recipient’s retirement from Buckeye. Based on historic experience, the forfeiture rate used for employees whose vesting period is greater than 10 years is 15% and no forfeiture rate is applied for employees whose vesting period is less than 10 years. Restricted stock under the Restricted Stock Plan is recognized as compensation expense on a straight line basis from the date of grant to the date each recipient reaches age 62.
Restricted stock may be voted by the recipient; however, the restricted stock may not be sold, pledged, or otherwise transferred before it is vested.
We use the Black-Scholes option-pricing model to calculate the fair value of options for determining our option related compensation expense which is recognized on a straight-line basis over the required service period of the award in the “selling, research and administrative expenses” caption of the consolidated statements of operations. The key assumptions for this valuation method include the expected life of the option, stock price volatility, risk-free interest rate and dividend yield. Many of these assumptions are judgmental and highly sensitive in the determination of compensation expense. No options were granted in 2010. The table below indicates the key assumptions used in the option valuation calculations for options granted during fiscal years 2009 and 2008 and a discussion of our methodology for developing each of the assumptions used in the valuation model:
|
2009
|
2008
|
|
|
Expected lives
|
6.0 years
|
6.0 years
|
|
Expected volatility
|
70%
|
60%
|
|
Risk-free interest rate
|
2.3%
|
3.3%
|
Expected Lives - This is the period of time over which the options granted are expected to remain outstanding. Options granted have a maximum term of ten years. An increase in the expected life will increase compensation expense.
Expected Volatility - This is a measure of the amount by which a price has fluctuated or is expected to fluctuate. We use actual changes in the market value of our stock to calculate the volatility assumption. We calculate daily market value changes from the date of grant over a past period representative of the expected life of the options to determine volatility. An increase in the expected volatility will increase compensation expense.
Risk-Free Interest Rate - This is the U.S. Treasury rate for the day of the grant having a term approximating the expected life of the option. An increase in the risk-free interest rate will increase compensation expense.
Dividend Yield - We did not make any dividend payments during the last five years. On August 3, 2010 our Board of Directors approved the commencement of a regular quarterly cash dividend in the amount of $0.04 per common share. An increase in the dividend yield will decrease compensation expense.
Restricted stock and options under the 2007 Plan are recognized as compensation expense on a straight-line basis over the three year vesting period. Under the 2007 Plan, and based on historical experience, a forfeiture rate of 10% is applied to employees who are not officers of Buckeye. No forfeiture rate is applied to grants to our officers. The forfeiture rate decreases the compensation expense. The weighted-average fair value of restricted stock awards is the closing price of the common stock on the New York Stock Exchange on the date of the grant.
Stock-based compensation expense was $2,672 ($1,683 after tax and $0.04 per share), $1,845 ($1,162 after tax and $0.03 per share) and $914 ($575 after tax and $0.01 per share) for 2010, 2009 and 2008, respectively. Stock-based compensation is recorded in selling, research and administrative expenses in the consolidated statements of operations.
F-22
The following table summarizes information about our stock option plans for the years ended June 30:
|
2010
|
2009
|
2008
|
|||||||||||||||||
|
Shares
|
Weighted-
Average
Exercise
Price
|
Shares
|
Weighted-
Average
Exercise
Price
|
Shares
|
Weighted-
Average
Exercise
Price
|
||||||||||||||
|
Outstanding at beginning of year
|
2,171,550
|
$
|
10.14
|
1,954,151
|
$
|
11.51
|
3,005,850
|
$
|
14.06
|
||||||||||
|
Granted at market
|
-
|
-
|
360,236
|
4.04
|
320,951
|
9.03
|
|||||||||||||
|
Exercised
|
(467,613
|
)
|
9.84
|
-
|
-
|
(415,650
|
)
|
13.76
|
|||||||||||
|
Forfeited
|
(28,134
|
)
|
5.71
|
(4,637
|
)
|
8.06
|
(3,200
|
)
|
7.62
|
||||||||||
|
Expired
|
(353,000
|
)
|
15.93
|
(138,200
|
)
|
13.70
|
(953,800
|
)
|
17.75
|
||||||||||
|
Outstanding at end of year
|
1,322,803
|
$
|
8.79
|
2,171,550
|
$
|
10.14
|
1,954,151
|
$
|
11.51
|
||||||||||
|
Exercisable at end of year
|
961,887
|
$
|
9.91
|
1,513,523
|
$
|
11.88
|
1,491,600
|
$
|
12.41
|
||||||||||
The total intrinsic value of options exercised during 2010 was $2,082. No options were exercised during 2009. The total intrinsic value of options exercised during 2008 was $1,423. The fair value of options vested during 2010, 2009 and 2008 was $1,054, $817 and $258, respectively. The fair value of options nonvested at June 30, 2010, 2009 and 2008 was $1,264, $2,416 and $2,333, respectively. Using the Black-Scholes valuation method calculated under the assumptions indicated above, the weighted-average fair value of the grants at market was $2.56 per option in 2009 and $5.26 per option in 2008. No options were granted in 2010. As of June 30, 2010 the total future compensation cost related to non-vested stock option grants was $953 and will be recognized over a weighted average period of 1.33 years. The aggregate intrinsic value of options outstanding and of vested options outstanding, defined as the excess fair value over the exercise price of the options, at June 30, 2010 was $2,676 and $1,179, respectively.
The following summary provides information about stock options outstanding and exercisable at June 30, 2010:
|
Outstanding
|
Exercisable
|
||||||||||||||
|
Exercise Price
|
Options
|
Average
Exercise Price
|
Average
Remaining Life
(Years)
|
Options
|
Average
Exercise Price
|
||||||||||
|
$4.00 - $8.00
|
552,261
|
$
|
5.60
|
6.93
|
289,585
|
$
|
6.50
|
||||||||
|
$8.01 - $12.00
|
700,542
|
10.14
|
4.74
|
602,302
|
10.32
|
||||||||||
|
$12.01 - $24.00
|
70,000
|
20.48
|
0.30
|
70,000
|
20.48
|
||||||||||
|
1,322,803
|
$
|
8.79
|
5.42
|
961,887
|
$
|
9.91
|
|||||||||
Stock options that could potentially dilute basic earnings per share in the future, which were not included in the fully diluted computation because the grant prices were greater than the average market price of common shares for the period, were 70,942, 2,171,550 and 1,827,571 for the years ended June 30, 2010, 2009 and 2008, respectively.
Restricted Stock
The following table summarizes information about our restricted stock for the years ended June 30:
|
2010
|
2009
|
2008
|
|||||||||||||||||
|
Shares
|
Weighted-
Average
Price
|
Shares
|
Weighted-
Average
Price
|
Shares
|
Weighted-
Average
Price
|
||||||||||||||
|
Nonvested at beginning of year
|
791,417
|
$
|
6.18
|
461,837
|
$
|
8.40
|
262,792
|
$
|
7.73
|
||||||||||
|
Granted at market
|
36,848
|
9.07
|
398,887
|
4.18
|
205,045
|
9.23
|
|||||||||||||
|
Vested
|
(209,307
|
)
|
(6.15
|
)
|
(67,307
|
)
|
(9.51
|
)
|
-
|
-
|
|||||||||
|
Forfeited
|
(37,100
|
)
|
(5.97
|
)
|
(2,000
|
)
|
(9.03
|
)
|
(6,000
|
)
|
(7.27
|
)
|
|||||||
|
Nonvested at end of year
|
581,858
|
$
|
6.55
|
791,417
|
$
|
6.18
|
461,837
|
$
|
8.40
|
||||||||||
As of June 30, 2010, the total future compensation cost related to non-vested restricted stock awards was $2,073 and will be recognized over a weighted average period of 4.09 years. The fair value of restricted stock vested during fiscal years 2010, 2009 and 2008 was $1,147, $640 and $0, respectively.
F-23
Treasury Shares
At June 30, 2010, a total of 5,364,100 shares have been repurchased under authorizations by our Board of Directors to repurchase up to 11,000,000 shares of our common stock. Repurchased shares, if any, are held as treasury stock and are available for general corporate purposes, including the funding of employee benefit and stock-related plans. We did not repurchase any shares during 2010 but during 2009 and 2008, we repurchased 54,800 and 300,000 shares at a total cost of $494 and $2,720, respectively. Our 2013 notes limit the funds available to repurchase stock.
Accumulated Other Comprehensive Income
The components of accumulated other comprehensive income (loss) were as follows:
|
Balance as of
June 30, 2010
|
Balance as of
June 30, 2009
|
|||||
|
Foreign currency translation
|
$
|
34,947
|
$
|
35,636
|
||
|
Net prior service credit and actuarial losses on post retirement obligations
|
(3,821
|
)
|
(1,788
|
)
|
||
|
Net unrealized gain (loss) from cash flow hedging instruments
|
5
|
(147
|
)
|
|||
|
$
|
31,131
|
$
|
33,701
|
|||
NOTE 15: INCOME TAXES
The components of income (loss) before income taxes were taxed under the following jurisdictions:
|
Year Ended June 30
|
||||||||||
|
2010
|
2009
|
2008
|
||||||||
|
Domestic
|
$
|
126,618
|
$
|
41,357
|
$
|
60,059
|
||||
|
Foreign
|
(807
|
)
|
(93,067
|
)
|
7,246
|
|||||
|
Income (loss) before income taxes
|
$
|
125,811
|
$
|
(51,710
|
)
|
$
|
67,305
|
|||
Income tax expense (benefit):
|
Year Ended June 30
|
||||||||||
|
2010
|
2009
|
2008
|
||||||||
|
Current tax expense:
|
||||||||||
|
Federal
|
$
|
657
|
$
|
11,843
|
$
|
2,206
|
||||
|
Foreign
|
2,567
|
2,247
|
5,082
|
|||||||
|
State and other
|
348
|
1,039
|
926
|
|||||||
|
Current tax expense
|
3,572
|
15,129
|
8,214
|
|||||||
|
Deferred tax expense (benefit):
|
||||||||||
|
Federal
|
7,370
|
4,546
|
16,672
|
|||||||
|
Foreign
|
(1,022
|
)
|
(5,290
|
)
|
(5,674
|
)
|
||||
|
State and other
|
1,317
|
(707
|
)
|
991
|
||||||
|
Deferred tax expense
|
7,665
|
(1,451
|
)
|
11,989
|
||||||
|
Income tax expense
|
$
|
11,237
|
$
|
13,678
|
$
|
20,203
|
||||
F-24
The difference between reported income tax expense (benefit) and a tax determined by applying the applicable U.S. federal statutory income tax rate to income before income taxes is reconciled as follows:
|
Year Ended June 30
|
|||||||||||||||||||
|
2010
|
2009
|
2008
|
|||||||||||||||||
|
Expected tax expense (benefit)
|
$
|
44,034
|
35.0
|
%
|
$
|
(18,096
|
)
|
35.0
|
%
|
$
|
23,557
|
35.0
|
%
|
||||||
|
Investment tax credit
|
(8,447
|
)
|
(6.7
|
)
|
-
|
-
|
-
|
-
|
|||||||||||
|
Domestic manufacturing deduction
|
(718
|
)
|
(0.6
|
)
|
(1,063
|
)
|
2.1
|
(255
|
)
|
(0.4
|
)
|
||||||||
|
Effect of foreign operations
|
173
|
0.1
|
(435
|
)
|
0.8
|
(2,745
|
)
|
(4.1
|
)
|
||||||||||
|
Nondeductible goodwill impairment charge
|
-
|
-
|
37,892
|
(73.3
|
)
|
-
|
-
|
||||||||||||
|
Alternative fuel mixture credits
|
(26,300
|
)
|
(20.9
|
)
|
(4,847
|
)
|
9.3
|
-
|
-
|
||||||||||
|
Change in tax reserves
|
-
|
-
|
(234
|
)
|
0.5
|
-
|
-
|
||||||||||||
|
Research and development tax credit
|
-
|
-
|
-
|
-
|
(1,407
|
)
|
(2.1
|
)
|
|||||||||||
|
Change in valuation allowances
|
1,662
|
1.3
|
1,981
|
(3.8
|
)
|
(501
|
)
|
(0.7
|
)
|
||||||||||
|
Adjustment of prior year provision estimates
|
-
|
-
|
203
|
(0.4
|
)
|
(234
|
)
|
(0.4
|
)
|
||||||||||
|
State taxes and other, net
|
833
|
0.7
|
(1,723
|
)
|
3.3
|
1,788
|
2.7
|
||||||||||||
|
Income tax expense
|
$
|
11,237
|
8.9
|
%
|
$
|
13,678
|
(26.5
|
)%
|
$
|
20,203
|
30.0
|
%
|
|||||||
During 2010 and 2009, we claimed the alternative fuel mixture credits as cash refunds through the filing of periodic excise tax refund claims and as income tax credits on the federal income tax returns filed for the 2010 and 2009 tax years. For purposes of calculating federal and state income taxes, we treat the credits claimed as cash refunds of excise tax as taxable income and the credits claimed on the federal income tax return as nontaxable income. In 2010 and 2009, we recorded tax benefits of $26,300 and $4,847, respectively, due to the nontaxable nature of the alternative fuel mixture credits claimed on the federal income tax return.
The American Recovery and Reinvestment Act of 2009 expanded the IRC Section 48 energy investment tax credit to include qualified property for facilities producing electricity using open-loop biomass. During 2010, we recorded a tax benefit of $8,447 relating to this tax credit, of which $5,415 relates to expenditures prior to June 30, 2009 and $3,032 relates to 2010 expenditures. We expect to realize continuing benefits from the energy investment tax credit which will reduce our effective tax rate over the next several years based on planned spending on energy projects at our Foley mill. We account for the investment tax credit as a reduction of federal income taxes in the year in which the credit arises by utilizing the flow-through method of accounting.
We increased our valuation allowance from $14,446 to $16,136 during fiscal year 2010 and from $13,401 to $14,446 during fiscal year 2009. During 2010, we increased the valuation allowance related to state tax net operating losses by $7. During 2009, we reduced the valuation allowance related to state tax net operating losses by $54 to reflect changes to the estimate of expected utilization.
During 2010 and 2009, we increased the valuation allowance in Brazil by $968 and $1,110, respectively, to eliminate the tax benefit of current losses. In addition to accounting for the current year losses, we increased the valuation allowance in Brazil during 2010 by $943 and decreased the valuation allowance in 2009 by $935 to reflect currency translation adjustments. The net increase to the valuation allowance recorded in Brazil for 2010 and 2009 was $1,911 and $175, respectively. During 2008, we decreased our valuation allowance related to deferred tax assets for net operating losses of the Americana, Brazil operations by $501 due to tax planning associated with intercompany interest charges offsetting the operating losses.
During 2010, we recorded a net decrease to the valuation allowance in Canada by $228. The net decrease resulted from the write-off of a valuation allowance of $915 established for an unutilized net-operating loss that expired in 2010 and from an increase to the valuation allowance of $687 resulting from current year losses that we believe are more likely than not to expire unutilized. At June 30, 2009, due to the impairment of goodwill in 2009 and cumulative book losses net of intercompany charges in our Canadian operations over the past three years, we recorded a valuation allowance of $871 related to net operating losses which we believe will expire unutilized. We also increased the valuation allowance in Canada by $53 to reflect unfavorable currency translation adjustments. The total increase to the valuation allowance recorded during 2009 in Canada was $924. Effective December 2007, Canada enacted Canada Bill C-28 which reduced its Canadian corporate tax rates to 19.5% for 2008, 19% for 2009, 18% for 2010, 16.5% for 2011 and 15% for 2012 and later years. This reduction in corporate rates resulted in a remeasurement of Canadian deferred tax balances with a net tax benefit of $165 in fiscal 2008. Furthermore, changes in estimates and tax planning resulted in a net tax benefit of $438 in fiscal 2008 related to utilization of Canadian net operating loss carryforwards.
F-25
On December 31, 2008 we recorded a $138,008 goodwill impairment charge and we recognized a tax benefit of $10,410 in connection with the goodwill impairment charge.
Effective July 2007, Germany reduced its tax rates resulting in a $2,245 net tax benefit for fiscal 2008 related to remeasurement of German deferred tax liabilities based on reversal of temporary differences.
On July 1, 2007, we adopted the provisions of ASC 740, “Accounting for Uncertainty in Income Taxes.” ASC 740 clarifies the accounting for income taxes by prescribing the minimum recognition threshold a tax position is required to meet before being recognized in the financial statements. As a result of the adoption, we recorded an adjustment of $878 to reduce retained earnings at July 1, 2007. At adoption and June 30, 2008, our unrecognized tax benefits totaled $1,806 and cumulative potential interest and penalties accrued related to unrecognized tax benefits totaled $164. We include interest and penalties related to income tax matters as a component of income before income taxes. All unrecognized tax benefits at adoption would affect the effective tax rate, if recognized. During the year ended June 30, 2009, as a result of a North Carolina audit, we were able to reduce our unrecognized tax benefits by $228 and our related interest and penalties by $108. In the year ended June 30, 2010, we recorded unrecognized tax benefits of $468 related to federal income taxes. The balance in unrecognized tax benefits and our related interest and penalties is $2,046 and $56, respectively. It is reasonably possible that the amount of the benefit with respect to certain of our tax positions will increase or decrease within the next twelve months, but an estimate of the range of the reasonably possible changes cannot be made. However, we do not expect that the resolution of any of our uncertain tax positions will be material. The following table summarizes the activity related to our unrecognized tax benefits:
|
Year Ended June 30
|
||||||
|
2010
|
2009
|
|||||
|
Uncertain tax position balance at beginning of year
|
$
|
1,634
|
$
|
1,970
|
||
|
Increases related to prior year positions
|
-
|
-
|
||||
|
Increases related to current year tax positions
|
468
|
-
|
||||
|
Decreases related to settlements with taxing authorities
|
-
|
(336
|
)
|
|||
|
Decreases due to lapses in statutes of limitations
|
-
|
-
|
||||
|
Uncertain tax position balance at end of year
|
$
|
2,102
|
$
|
1,634
|
||
We file income tax returns with federal, state, local and foreign jurisdictions. As of June 30, 2010, we remained subject to examinations of our U.S. federal and state income tax returns for the years ended June 30, 2002 through June 30, 2010, Canadian income tax returns for the years ended June 30, 2004 through June 30, 2010 and German tax filings for the years ended June 30, 2004 through June 30, 2010.
The tax effects of temporary differences that give rise to significant portions of the deferred tax assets (liabilities) are as follows:
|
June 30
|
|||||||
|
2010
|
2009
|
||||||
|
Deferred tax liabilities:
|
|||||||
|
Property, plant and equipment
|
$
|
(79,826
|
)
|
$
|
(68,985
|
)
|
|
|
Inventory
|
(462
|
)
|
(59
|
)
|
|||
|
Other
|
(6,159
|
)
|
(8,089
|
)
|
|||
|
Total deferred tax liabilities
|
(86,447
|
)
|
(77,133
|
)
|
|||
|
Deferred tax assets:
|
|||||||
|
Postretirement benefits
|
9,609
|
8,540
|
|||||
|
Net operating losses
|
28,308
|
25,922
|
|||||
|
Nondeductible reserves
|
1,620
|
1,520
|
|||||
|
Credit carryforwards
|
569
|
569
|
|||||
|
Other
|
8,611
|
6,890
|
|||||
|
Total deferred tax assets
|
48,717
|
43,441
|
|||||
|
Valuation allowances
|
(16,136
|
)
|
(14,446
|
)
|
|||
|
Deferred tax assets, net of valuation allowances
|
32,581
|
28,995
|
|||||
|
Net deferred tax liability
|
$
|
(53,866
|
)
|
$
|
(48,138
|
)
|
|
F-26
The valuation allowances at June 30, 2010 and 2009 relate specifically to net operating losses in certain state and foreign jurisdictions. Management believes it is more likely than not that the net deferred tax assets recorded at June 30, 2010 will be fully utilized after consideration of the valuation allowance recorded.
Taxes paid (received) in fiscal 2010, 2009 and 2008 were ($6,383), $7,333 and $10,077, respectively.
At June 30, 2010, foreign net operating loss carryforwards total approximately $78,718. Of this total, $54,183 have no expiration date and $24,535 have expiration dates from 2014 to 2030. All federal net operating loss carryforwards and federal tax credit carryforwards were utilized during 2008 and 2009. State net operating loss carryforwards total $78,425 and expire between 2018 and 2030. State tax credits of $876 are recorded and are expected to be utilized over the next few years.
We have not recorded deferred income taxes on the unremitted earnings of our foreign subsidiaries, primarily the unremitted earnings of our German operations. It is not practicable to estimate the deferred income tax liability on the unremitted earnings.
NOTE 16: EMPLOYEE BENEFIT PLANS
Defined Contribution Plans
We have defined contribution retirement plans covering certain U.S. employees. We contribute 1% of the employee's gross compensation plus 1/2% for each year of service up to a maximum of 11% of the employee's gross compensation. We match employees’ voluntary contributions to their retirement accounts up to the lesser of $2,000 per year or 2% of their eligible gross earnings. Contribution expense for the retirement plans for the years ended June 30, 2010, 2009 and 2008 was $7,623, $7,960 and $7,870, respectively.
Post Retirement Healthcare Plans
We also provide medical, dental, and life insurance post retirement plans covering certain U.S. employees who meet specified age and service requirements. Certain employees who met specified age and service requirements on March 15, 1993 are covered by their previous employer and are not covered by these plans. Our current policy is to fund the cost of these benefits as payments to participants are required. We have established cost maximums to more effectively control future medical costs. Effective January 1, 2006, Medicare eligible retirees age 65 or older are no longer covered under the self-funded plan. Instead, they are provided a subsidy towards the purchase of supplemental insurance.
On July 1, 2008, we adopted the measurement date provisions of ASC 715 “ Compensation – Retirement Benefits”, which requires the measurement date of the plan’s funded status to be the same as our fiscal year end.
The adoption of the measurement date provisions of ASC 715 resulted in a decrease in accrued postretirement benefits of $1,177, an increase in deferred tax liabilities of $435, an increase in accumulated other comprehensive income of $882 and a decrease in the opening balance of retained earnings of $140. The adoption of the measurement date provisions of SFAS No. 158 had no material effect on our consolidated statement of operations for the fiscal year ended June 30, 2010 or for any prior period presented, and it will not materially affect our operating results in future periods.
The components of net periodic benefit costs are as follows:
|
Year Ended June 30
|
||||||||||
|
2010
|
2009
|
2008
|
||||||||
|
Service cost for benefits earned
|
$
|
405
|
$
|
483
|
$
|
604
|
||||
|
Interest cost on benefit obligation
|
1,399
|
1,493
|
1,401
|
|||||||
|
Amortization of prior service credit
|
(990
|
)
|
(1,002
|
)
|
(1,002
|
)
|
||||
|
Amortization of actuarial loss
|
126
|
277
|
583
|
|||||||
|
Total cost
|
$
|
940
|
$
|
1,251
|
$
|
1,586
|
||||
F-27
The following table provides a reconciliation of the changes in the plans’ benefit obligations over the two-year period ending June 30, 2010, and a statement of the plans’ funded status as of June 30, 2010 and 2009. The amount included below entitled “other plans” represents benefit obligations for certain current and former employees of one of our German subsidiaries.
|
June 30
|
|||||||
|
2010
|
2009
|
||||||
|
Change in benefit obligation:
|
|||||||
|
Obligation at beginning of year
|
$
|
23,223
|
$
|
23,698
|
|||
|
Service cost and interest cost between May 1, 2008 and June 30, 2008
|
-
|
328
|
|||||
|
Service cost
|
405
|
483
|
|||||
|
Interest cost
|
1,399
|
1,493
|
|||||
|
Participant contributions
|
761
|
776
|
|||||
|
Amendments
|
110
|
-
|
|||||
|
Actuarial loss (gain)
|
2,252
|
(1,589
|
)
|
||||
|
Benefits paid
|
(2,739
|
)
|
(1,966
|
)
|
|||
|
Obligation at end of year
|
25,411
|
23,223
|
|||||
|
Change in plan assets:
|
|||||||
|
Fair value of plan assets at beginning of year
|
-
|
-
|
|||||
|
Employer contributions
|
1,978
|
1,190
|
|||||
|
Plan participant contributions
|
761
|
776
|
|||||
|
Benefits paid
|
(2,739
|
)
|
(1,966
|
)
|
|||
|
Fair value of plan assets at end of year
|
-
|
-
|
|||||
|
Funded status at end of year
|
(25,411
|
)
|
(23,223
|
)
|
|||
|
Other plans
|
(1,587
|
)
|
(1,853
|
)
|
|||
|
Accrued post retirement benefit obligation
|
(26,998
|
)
|
(25,076
|
)
|
|||
|
Less current portion included in accrued expenses
|
1,715
|
1,841
|
|||||
|
Noncurrent obligation recognized in the consolidated balance sheet
|
$
|
(25,283
|
)
|
$
|
(23,235
|
)
|
|
The accrued benefit obligation recorded on the consolidated balance sheet at June 30, 2010 and 2009 reflects the accumulated benefit obligation less any portion that is currently funded. The accumulated actuarial loss and prior service cost that had not yet been reflected in the net periodic benefit costs were included in accumulated other comprehensive income (loss) at June 30 as follows:
|
June 30
|
|||||||
|
2010
|
2009
|
||||||
|
Prior service credit
|
$
|
1,276
|
$
|
2,377
|
|||
|
Accumulated actuarial loss
|
(7,341
|
)
|
(5,215
|
)
|
|||
|
Accumulated other comprehensive income (loss)
|
(6,065
|
)
|
(2,838
|
)
|
|||
|
Tax effect
|
2,244
|
1,050
|
|||||
|
Accumulated other comprehensive income (loss), net of tax
|
$
|
(3,821
|
)
|
$
|
(1,788
|
)
|
|
The prior service credit and accumulated actuarial loss included in other comprehensive income (loss) and expected to be recognized in net periodic benefit cost during the fiscal year ended June 30, 2011 is $526 ($331 net of tax) and $385 ($243 net of tax), respectively.
Expected annual benefit payments are as follows: 2011 - $1,715; 2012 - $1,755; 2013 - $1,711; 2014 - $1,739; 2015 - $1,778; and 2016 to 2020 - $9,447. Expected employer contributions for fiscal year 2011 are approximately $2,529.
The discount rate used to determine benefit obligations was 5.20% and 6.65% at June 30, 2010 and 2009, respectively.
F-28
The weighted average assumptions used to determine net periodic benefit cost were as follows:
|
2010
|
2009
|
2008
|
||||||||
|
Discount rate
|
6.65%
|
6.90%
|
5.90%
|
|||||||
|
Measurement date
|
June 30, 2009
|
June 30, 2008
|
April 30, 2007
|
|||||||
During 2008, our net employer cost reached the net employer cost cap. Therefore no assumption has been made for a rate increase in the per capita cost of covered benefits.
We use currently available high quality long-term corporate bond indices to determine the appropriate discount rate. Due to the long-term nature of these indices, they have a similar maturity to expected benefit payments.
NOTE 17: SIGNIFICANT CUSTOMER
Net sales to The Procter & Gamble Company and its affiliates for the years ended June 30, 2010, 2009 and 2008 were 7%, 8% and 10%, respectively, of total net sales. Specialty fibers accounted for 68%, 68% and 66% of these sales in fiscal years 2010, 2009 and 2008, respectively. The remainder of these sales were derived from the nonwoven materials segment.
NOTE 18: SEGMENT INFORMATION
We report results for two segments, specialty fibers and nonwoven materials. The specialty fibers segment consists of our chemical cellulose, customized fibers and fluff pulp product lines which are cellulosic fibers based on both wood and cotton. The nonwovens materials segment consists of our airlaid plants and our converting plant. Management makes financial decisions and allocates resources based on the sales and operating income of each segment. We allocate selling, research, and administrative expenses to each segment and management uses the resulting operating income to measure the performance of the segments. The financial information attributed to these segments is included in the following table:
|
Specialty
Fibers
|
Nonwoven
Materials
|
Corporate
|
Total
|
|||||||||||||
|
Net sales
|
2010
|
$
|
537,483
|
$
|
246,803
|
$
|
(27,860
|
)
|
$
|
756,426
|
||||||
|
2009
|
551,630
|
239,678
|
(36,779
|
)
|
754,529
|
|||||||||||
|
2008
|
595,782
|
263,551
|
(33,816
|
)
|
825,517
|
|||||||||||
|
Operating income (loss)
|
2010
|
65,219
|
16,797
|
64,450
|
146,466
|
|||||||||||
|
2009
|
53,691
|
12,273
|
(88,603
|
)
|
(22,639
|
)
|
||||||||||
|
2008
|
90,640
|
15,300
|
(5,607
|
)
|
100,333
|
|||||||||||
|
Depreciation and amortization of intangibles
|
2010
|
29,604
|
14,770
|
3,809
|
48,183
|
|||||||||||
|
2009
|
31,372
|
14,904
|
3,651
|
49,927
|
||||||||||||
|
2008
|
33,168
|
16,134
|
3,425
|
52,727
|
||||||||||||
|
Total assets
|
2010
|
504,224
|
230,981
|
117,249
|
852,454
|
|||||||||||
|
2009
|
497,681
|
243,736
|
50,967
|
792,384
|
||||||||||||
|
2008
|
525,147
|
279,688
|
204,390
|
1,009,225
|
||||||||||||
|
Capital expenditures
|
2010
|
42,591
|
3,971
|
978
|
47,540
|
|||||||||||
|
2009
|
37,392
|
3,714
|
1,317
|
42,423
|
||||||||||||
|
2008
|
42,347
|
4,855
|
1,995
|
49,197
|
||||||||||||
The accounting policies of the segments are the same as those described in the summary of significant accounting policies. Management evaluates operating performance of the specialty fibers and nonwoven materials segments, excluding amortization of intangibles, the impact of goodwill impairment loss, alternative fuel mixture credits, charges related to restructuring, unallocated at-risk compensation and unallocated stock-based compensation for executive officers and certain other employees. Therefore, the corporate segment includes operating elements such as segment eliminations, amortization of intangibles, goodwill impairment loss, alternative fuel mixture credits, charges related to restructuring, unallocated at-risk compensation and unallocated stock-based compensation for executive officers and certain other employees. Corporate net sales represents the elimination of intersegment sales included in the specialty fibers reporting segment. We account for intersegment sales as if the sales were to third parties. Corporate assets primarily include cash, income tax and alternative fuel mixture credit receivable, goodwill and intellectual property.
F-29
Our identifiable product lines are chemical cellulose, customized fibers, fluff pulp and nonwoven materials. Chemical cellulose is used to impart purity, strength and viscosity in the manufacture of diverse products such as food casings, cigarette filters, rayon filament, acetate fibers, thickeners for consumer products, cosmetics and pharmaceuticals. Customized fibers are used to provide porosity, color permanence, strength and tear resistance in filters, premium letterhead, currency paper and personal stationery as well as absorbency and softness in cotton balls and cotton swabs. Fluff pulp and nonwoven materials are used to increase absorbency and fluid transport in products such as disposable diapers, feminine hygiene products and adult incontinence products. Additionally, nonwoven materials are used to enhance fluid management and strength in wipes, tabletop items, food pads, household wipes and mops. The following provides relative net sales to unaffiliated customers by product line:
|
Year Ended June 30
|
||||||||||
|
2010
|
2009
|
2008
|
||||||||
|
Chemical cellulose
|
33
|
%
|
35
|
%
|
32
|
%
|
||||
|
Customized fibers
|
15
|
%
|
13
|
%
|
17
|
%
|
||||
|
Fluff pulp
|
19
|
%
|
20
|
%
|
19
|
%
|
||||
|
Nonwoven materials
|
33
|
%
|
32
|
%
|
32
|
%
|
||||
|
100
|
%
|
100
|
%
|
100
|
%
|
|||||
We are domiciled in the United States and have manufacturing operations in the United States, Canada, Germany and Brazil. The following provides a summary of net sales to unaffiliated customers based on point of origin, net sales by point of destination and long-lived assets by geographical area:
|
Year Ended June 30
|
|||||||||||||||||||
|
Net sales by point of origin:
|
2010
|
2009
|
2008
|
||||||||||||||||
|
United States
|
$
|
593,515
|
78
|
%
|
$
|
592,139
|
78
|
%
|
$
|
624,741
|
76
|
%
|
|||||||
|
Germany
|
91,142
|
12
|
87,372
|
12
|
110,077
|
13
|
|||||||||||||
|
Other
|
71,769
|
10
|
75,018
|
10
|
90,699
|
11
|
|||||||||||||
|
Total
|
$
|
756,426
|
100
|
%
|
$
|
754,529
|
100
|
%
|
$
|
825,517
|
100
|
%
|
|||||||
|
Year Ended June 30
|
|||||||||||||||||||
|
Net sales by point of destination:
|
2010
|
2009
|
2008
|
||||||||||||||||
|
North America
|
$
|
298,382
|
40
|
%
|
$
|
326,111
|
43
|
%
|
$
|
329963
|
40
|
%
|
|||||||
|
Europe
|
248,018
|
33
|
259,026
|
34
|
305,441
|
37
|
|||||||||||||
|
Asia
|
138,806
|
18
|
105,463
|
14
|
90,807
|
11
|
|||||||||||||
|
South America
|
26,032
|
3
|
27,894
|
4
|
33,021
|
4
|
|||||||||||||
|
Other
|
45,188
|
6
|
36,035
|
5
|
66,285
|
8
|
|||||||||||||
|
Total
|
$
|
756,426
|
100
|
%
|
$
|
754,529
|
100
|
%
|
$
|
825,517
|
100
|
%
|
|||||||
|
As of June 30
|
|||||||||
|
2010
|
2009
|
2008
|
|||||||
|
Long-lived assets by geographical area:
|
|||||||||
|
United States
|
$
|
400,856
|
$
|
395,662
|
$
|
394,463
|
|||
|
Brazil
|
46,972
|
44,973
|
56,955
|
||||||
|
Germany
|
38,381
|
48,141
|
57,878
|
||||||
|
Canada
|
38,264
|
37,807
|
46,402
|
||||||
|
Other
|
2
|
6
|
10
|
||||||
|
Total long-lived assets
|
$
|
524,475
|
$
|
526,589
|
$
|
555,708
|
|||
F-30
|
As of June 30
|
||||||||||
|
2010
|
2009
|
2008
|
||||||||
|
Net assets by geographical area:
|
||||||||||
|
United States
|
$
|
255,488
|
$
|
136,223
|
$
|
110,391
|
||||
|
Germany
|
67,028
|
71,460
|
73,966
|
|||||||
|
Brazil
|
63,809
|
60,624
|
91,052
|
|||||||
|
Canada
|
50,626
|
49,376
|
153,641
|
|||||||
|
Other
|
370
|
348
|
507
|
|||||||
|
Total net assets
|
$
|
437,321
|
$
|
318,031
|
$
|
429,557
|
||||
NOTE 19: RESEARCH AND DEVELOPMENT EXPENSES
Research and development costs of $6,752, $7,469 and $8,194 were charged to expense as incurred for the years ended June 30, 2010, 2009 and 2008, respectively.
NOTE 20: STATE OF FLORIDA GRANT
On August 11, 2009 we announced that we had qualified to receive up to $7,381 from the State of Florida Quick Action Closing Fund. This performance-based incentive provides up-front cash for approved economic development projects. On September 30, 2009, we received the $7,381 as an incentive to complete our $45,000 Foley Energy Project which had been suspended in March 2009. We have committed to invest $32,300 on this and other related energy projects after the date of the grant, and to maintain at least 555 jobs, at a specified average wage, at our Foley Plant. We are required to make the investment by December 31, 2012 and to maintain the jobs and specified wage level through December 31, 2015. If we fail to make at least 80% of the investment or if we fall below the 555 jobs or specified wage level in any of the next six years, we would be required to repay a prorated portion of the award. In March 2010, Taylor County Development Authority (“TCDA”) awarded us a matching grant for $207, payable in four equal installments. We recorded the first $52 installment on March 15, 2010. We have recorded these cash incentives in the long-term liability section of our condensed consolidated balance sheets. As we invest in the Foley Energy Project, we are reclassifying this liability as a reduction in the cost of equipment. For 2010 we have reclassified $3,524. When the project is complete, we will amortize the $7,588 over the life of the equipment.
NOTE 21: COMMITMENTS
We have significant purchase contracts for timber and energy under separate agreements expiring at various dates through fiscal year 2014. Under two separate timber contracts we are required to purchase certain timber from specified tracts of land that is available for harvest. The energy contract is for our Americana Plant and requires us to purchase a minimum amount of contracted energy each year. The contract prices under the terms of the timber agreements are fixed annually based on market prices and the contract prices under the energy contract are adjusted annually based on inflation indices. At June 30, 2010, total annual purchase obligations, as estimated based on current contract prices for those agreements noted above, were as follows: 2011—$28,896; 2012—$5,097; 2013—$2,813; 2014—$1,407; 2015—$0; thereafter—$0. Purchases under these agreements for 2010, 2009 and 2008 were $11,741, $10,880 and $16,743, respectively.
NOTE 22: CONTINGENCIES
Our operations are subject to extensive general and industry-specific federal, state, local and foreign environmental laws and regulations, particularly those relating to air and water quality, waste disposal and the cleanup of contaminated soil and groundwater. We devote significant resources to maintaining compliance with these laws and regulations. Such environmental laws and regulations at the federal level include the Comprehensive Environmental Response, Compensation and Liability Act of 1980, as amended, the Clean Air Act of 1990, as amended, the Clean Water Act of 1972, as amended, the Resource Conservation and Recovery Act of 1976, as amended, the Toxic Substances Control Act of 1976, as amended, and the Safe Drinking Water Act of 1974, as amended. These environmental regulatory programs are primarily administered by the U.S. Environmental Protection Agency (“EPA”). In addition, the individual states and foreign countries in which we operate have adopted and may adopt in the future equivalent or more stringent environmental laws and regulations or have enacted their own parallel environmental programs. We closely monitor our compliance with current environmental requirements and believe that we are in substantial compliance.
F-31
We expect that, due to the nature of our operations, we will be subject to increasingly stringent environmental requirements, including standards applicable to wastewater discharges and air emissions, such as emissions of greenhouse gases, and general permitting requirements for our manufacturing facilities. We also expect that we will continue to incur substantial costs to comply with such requirements. Any failure on our part to comply with environmental laws or regulations could subject us to penalties or other sanctions that could materially affect our business, results of operations or financial condition. We cannot currently assess, however, the impact that more stringent environmental requirements may have on our operations or capital expenditure requirements. We do not anticipate that capital expenditures in connection with matters relating to environmental compliance will have a material effect on our earnings during fiscal year 2011.
Our Foley Plant discharges treated wastewater into the Fenholloway River. Under the terms of an agreement with the Florida Department of Environmental Protection (“FDEP”), approved by the EPA in 1995, we agreed to a comprehensive plan to attain Class III (“fishable/swimmable”) status for the Fenholloway River under applicable Florida law (the “Fenholloway Agreement”). The Fenholloway Agreement established a schedule for the filing of necessary permit applications and approvals to implement the following activities, among others: (i) make process changes within the Foley Plant to reduce the coloration of its wastewater discharge, (ii) restore certain wetlands areas, (iii) install a pipeline to relocate the wastewater discharge point into the Fenholloway River to a point closer to the mouth of the river, and (iv) provide oxygen enrichment to the treated wastewater prior to discharge at the new location. We have completed the process changes within the Foley Plant as required by the Fenholloway Agreement. In making these in-plant process changes, we incurred significant capital expenditures. Based on the anticipated permit conditions, we expect to incur significant additional capital expenditures once final permits are issued.
In August 2005 FDEP drafted a proposed renewal of the Buckeye National Pollutant Discharge Elimination System (“NPDES”) permit. The FDEP completed the required public notice, review and comment process and issued the formal Notice of Intent to Issue Permit in November 2005. The proposed permit was challenged by some members of the public. In January 2008, the pending administrative hearing was dismissed due to anticipated revisions to the permit based on additional studies and development of a total maximum daily load (“TMDL”) for the Fenholloway River. The development of the TMDL is necessary because the EPA and FDEP have listed the Fenholloway River as an impaired water (not meeting all water quality standards) under the Clean Water Act for certain pollutants. In addition, we also have filed a petition with the FDEP for the establishment of Site-Specific Alternative Water Quality Criteria (“SSAC”), which petition must be approved by the EPA. The additional studies necessary to support revisions to the permit have been completed. The Florida Environmental Regulation Commission adopted a rule establishing a SSAC for the Fenholloway River. SSACs require the approval of the EPA. It is expected to be forwarded to EPA in September 2010. The revised draft NPDES permit to be issued by FDEP will be based upon modeling performed in conjunction with the EPA and the FDEP, will address the TMDL established for the Fenholloway River by the EPA and will also contain Water Quality Based Effluent Limits. When the FDEP issues the revised draft permit it will be subject to public comment and opportunity for requesting a hearing.
We expect to incur additional capital expenditures related to our wastewater treatment and discharge of between $40 million and $60 million over at least five years, possibly beginning as early as fiscal year 2012. The amount and timing of these capital expenditures may vary depending on a number of factors including when the final NPDES permit is issued and its final terms and conditions.
The Foley Plant is also subject to FDEP and EPA air emission standards. In 2007, new EPA boiler air emission regulations (boiler Maximum Achievable Control Technology (“MACT”) standards) applicable to the Foley Plant were vacated following a public legal challenge. EPA re-proposed those regulations in April 2010. The public comment period for that proposed rule ended on August 23, 2010, but EPA has not issued its final regulation for the boiler MACT. These regulations may impact both bark boilers at the Foley Plant. However, since EPA has not promulgated a final rule, it is difficult to predict the potential capital expenditures associated with these pending regulations.
On November 4, 2009, we received an Infraction Document from the São Paulo State Tax Authority with respect to our Americana Plant related to Brazilian state value-added taxes (“ICMS Taxes”) for the period of January 1, 2005 through December 31, 2008. On December 4, 2009, we filed our objection to 2,624 real ($1,457 at June 30, 2010 exchange rates) of the taxes and penalties that were assessed. On August 9, 2010 Americana received an Infraction Document from the São Paulo State Tax Authority related to ICMS taxes for the period of January 1, 2009 through December 31, 2009. We intend to file our objection to 796 real ($442 at June 30, 2010 exchange rates) of the taxes and penalties that were assessed. The process for defending our objection will involve a lengthy appeals process and it could be several years before we reach resolution. We believe we have meritorious defenses to this assessment and intend to defend our position vigorously.
F-32
On June 17, 2010, our Foley Plant experienced a failure on our utility provider’s incoming line that sent a voltage surge to most of our electrical components, resulting in losses of variable frequency drives and other electrical control components. This power failure caused an unplanned complete shutdown of the facility. Both production lines were returned to full production by June 23, 2010. In July, we experienced 27 hours of downtime on one of our production lines and 12 hours of downtime on our other production line when additional electrical control components damaged by the voltage surge failed. The total value of the loss, including business interruption, cannot be determined at this time, but we believe that losses in excess of our $2,000 deductible will be covered by property and business interruption insurance. In June 2010, we wrote-off certain fixed assets that were damaged. In August 2010, we received a $1,000 advance from the insurance company. We have recorded this advance in other current liabilities. We have not recognized potential gains arising from property damage or business interruption insurance in our Consolidated Statements of Operations and will not do so until final settlement of the insurance claim.
We are involved in certain legal actions and claims arising in the ordinary course of business. In the opinion of management, however, based upon information currently available, the ultimate liability with respect to these actions will not materially affect our consolidated results of operations or financial position. We review outstanding claims and proceedings internally and with external counsel as necessary to assess probability of loss and for the ability to estimate loss. These assessments are re-evaluated each quarter or as new information becomes available to determine whether a reserve should be established or if any existing reserve should be adjusted. The actual cost of resolving a claim or proceeding ultimately may be substantially different than the amount of the recorded reserve. In addition, because it is not permissible under GAAP to establish a litigation reserve until the loss is both probable and estimable, in some cases there may be insufficient time to establish a reserve prior to the actual incurrence of the loss (upon verdict and judgment at trial, for example, or in the case of a quickly negotiated settlement).
NOTE 23: QUARTERLY RESULTS OF OPERATIONS (UNAUDITED)
|
First Quarter
|
Second Quarter
|
Third Quarter
|
Fourth Quarter
|
||||||||||
|
Year ended June 30, 2010
|
|||||||||||||
|
Net sales
|
$
|
177,274
|
$
|
183,308
|
$
|
190,714
|
$
|
205,130
|
|||||
|
Gross margin
|
24,907
|
30,214
|
33,147
|
33,135
|
|||||||||
|
Operating income (loss)
|
47,962
|
55,720
|
23,690
|
19,094
|
|||||||||
|
Net income (loss)
|
39,231
|
46,284
|
19,343
|
9,716
|
|||||||||
|
Earnings (loss) per share
|
|||||||||||||
|
Basic
|
$
|
1.00
|
$
|
1.19
|
$
|
0.50
|
$
|
0.25
|
|||||
|
Diluted
|
$
|
1.01
|
$
|
1.18
|
$
|
0.49
|
$
|
0.24
|
|||||
|
Year ended June 30, 2009
|
|||||||||||||
|
Net sales
|
$
|
221,293
|
$
|
184,665
|
$
|
171,635
|
$
|
176,936
|
|||||
|
Gross margin
|
35,338
|
23,132
|
23,870
|
26,995
|
|||||||||
|
Operating income
|
22,659
|
(126,613
|
)
|
12,804
|
68,511
|
||||||||
|
Net income
|
8,850
|
(124,984
|
)
|
4,286
|
46,460
|
||||||||
|
Earnings per share
|
|||||||||||||
|
Basic
|
$
|
0.23
|
$
|
(3.23
|
)
|
$
|
0.11
|
$
|
1.20
|
||||
|
Diluted
|
$
|
0.23
|
$
|
(3.23
|
)
|
$
|
0.11
|
$
|
1.20
|
||||
During the first quarter of 2010, we recorded a pretax benefit of $35,842 ($35,105 after tax) for alternative fuel mixture credits, a pre-tax charge of $765 ($478 after tax) for restructuring expense, and a pre-tax benefit of $165 ($103 after tax) on early extinguishment of debt. During the second quarter of 2010, we recorded a pretax benefit of $37,073 ($37,496 after tax) for alternative fuel mixture credits and a pre-tax charge of $50 ($31 after tax) for restructuring expense. During the third quarter of 2010, we recorded a pretax benefit of $4,762 ($4,190 after tax) for alternative fuel mixture credits, an after-tax benefit of $7,440 for investment tax credits, a pre-tax charge of $2,394 ($1,497 after tax) for restructuring expense, and a pre-tax charge of $1,538 ($961 after tax) for early extinguishment of debt. During the fourth quarter of 2010, we recorded an after-tax benefit of $1,007 for investment tax credits, a pre-tax charge of $144 ($90 after tax) for restructuring expense and a pre-tax charge of $1,233 ($771 after tax) for early extinguishment of debt.
During the second quarter of 2009, we recorded a pretax charge of $138,008 ($127,598 after tax) for goodwill impairment. During the fourth quarter of 2009, we recorded a pretax benefit of $54,232 ($39,644 after tax) for alternative fuel mixture credits and a tax benefit of $1,394 for corrections to deferred taxes.
F-33
NOTE 24: SUBSEQUENT EVENTS
On August 3, 2010, our Board of Directors declared a quarterly dividend of $0.04 per share of common stock. The dividend is payable on September 15, 2010 to stockholders of record as of the close of business on August 16, 2010.
On July 9, 2010, the IRS Office of Chief Counsel released legal advice concluding that black liquor sold or used before January 1, 2010, qualifies for the cellulosic biofuel producer tax credit (“CBPC”). Each gallon of black liquor produced by and used as a fuel by us in our business operations during calendar 2009 will qualify for the $1.01 non-refundable CBPC. We received a cellulosic biofuel producer registration number which allowed us to amend the tax return for the year ended June 30, 2009 and claim approximately $21 million of CBPC on black liquor produced and used in the business from January 1, 2009 until February 11, 2009 before we began mixing diesel with black liquor to qualify for the AFMC. Approximately $8 million will be received as tax refunds for tax years ended June 30, 2009 and June 30, 2010, with the remaining $13 million used to offset estimated tax payments for the year ending June 30, 2011.
The Addendum included with the Form 637 CB Registration approval includes guidance on converting alternative fuel mixture credits for gallons of black liquor produced and used by us from February 12, 2009 through December 31, 2009, the time period that we mixed diesel with black liquor to claim alternative fuel mixture cash refunds and alternative fuel mixture income tax credits. For any gallon of fuel, the $0.50 alternative fuel mixture credit may be exchanged for the $1.01 CBPC by repaying the $0.50 credit, with interest, for any gallon of fuel for which the $0.50 credit was claimed and received by us. The tax returns would have to be amended to claim the CBPC.
Converting the $0.50 alternative fuel mixture credits/refunds to $1.01 CBPC for all gallons of the black liquor mixed with diesel would produce an additional benefit of approximately $56 million, less interest paid to the IRS, and is dependent on our future taxable income for tax years ending June 30, 2011 through June 30, 2016. We are currently analyzing this opportunity based on the recent IRS guidance and will recognize any benefits in the financial statements for the first quarter of 2011.
On September 1, 2010, we called the remaining $140,000 of the 2013 notes for redemption on October 1, 2010. These notes will be redeemed using borrowings on our revolving credit facility.
F-34
NOTE 25: CONDENSED CONSOLIDATING FINANCIAL STATEMENTS
The guarantor subsidiaries presented below represent our subsidiaries that are subject to the terms and conditions outlined in the indenture governing the senior notes and that guarantee the notes, jointly and severally, on a senior unsecured basis. The non-guarantor subsidiaries presented below represent the foreign subsidiaries which do not guarantee the senior notes. Each subsidiary guarantor is 100% owned directly or indirectly by Buckeye Technologies Inc. and all guarantees are full and unconditional.
Supplemental financial information for Buckeye Technologies Inc. and our guarantor subsidiaries and non-guarantor subsidiaries for the senior notes is presented in the following tables.
STATEMENTS OF OPERATIONS
Year ending June 30, 2010
|
Buckeye Technologies
Inc.
|
Guarantors
U.S.
Subsidiaries
|
Non-
Guarantor
Subsidiaries
|
Consolidating
Adjustments
|
Consolidated
|
|||||||||||
|
Net sales
|
$
|
92,018
|
$
|
532,659
|
$
|
163,596
|
$
|
(31,847
|
)
|
$
|
756,426
|
||||
|
Cost of goods sold
|
77,631
|
435,986
|
152,310
|
(30,904
|
)
|
635,023
|
|||||||||
|
Gross margin
|
14,387
|
96,673
|
11,286
|
(943
|
)
|
121,403
|
|||||||||
|
Selling, research and administrative expenses, and other
|
(11,762
|
)
|
51,510
|
9,513
|
-
|
49,261
|
|||||||||
|
Restructuring and impairment costs
|
3,353
|
-
|
-
|
-
|
3,353
|
||||||||||
|
Alternative fuel mixture credits
|
-
|
(77,677
|
)
|
-
|
-
|
(77,677
|
)
|
||||||||
|
Operating income (loss)
|
22,796
|
122,840
|
1,773
|
(943
|
)
|
146,466
|
|||||||||
|
Other income/(expense):
|
|||||||||||||||
|
Net interest income/(expense) and amortization of debt
|
(18,778
|
)
|
1,281
|
(4
|
)
|
-
|
(17,501
|
)
|
|||||||
|
Other income/(expense), including equity in income of
affiliates
|
|
73,768
|
|
37
|
|
(739
|
)
|
|
(76,220
|
)
|
|
(3,154
|
)
|
||
|
Intercompany interest income/(expense)
|
27,374
|
(25,956
|
)
|
(1,418
|
)
|
-
|
-
|
||||||||
|
Income/(loss) before income taxes
|
105,160
|
98,202
|
(388
|
)
|
(77,163
|
)
|
125,811
|
||||||||
|
Income tax expense/(benefit)
|
(9,414
|
)
|
29,137
|
1,546
|
(10,032
|
)
|
11,237
|
||||||||
|
Net income (loss)
|
$
|
114,574
|
$
|
69,065
|
$
|
(1,934
|
)
|
$
|
(67,131
|
)
|
$
|
114,574
|
|||
F-35
STATEMENTS OF OPERATIONS
Year ending June 30, 2009
|
Buckeye Technologies
Inc.
|
Guarantors
U.S.
Subsidiaries
|
Non-
Guarantor
Subsidiaries
|
Consolidating
Adjustments
|
Consolidated
|
|||||||||||
|
Net sales
|
$
|
96,684
|
$
|
534,915
|
$
|
163,069
|
$
|
(40,139
|
)
|
$
|
754,529
|
||||
|
Cost of goods sold
|
98,653
|
437,193
|
150,251
|
(40,903
|
)
|
645,194
|
|||||||||
|
Gross margin
|
(1,969
|
)
|
97,722
|
12,818
|
764
|
109,335
|
|||||||||
|
Selling, research and administrative expenses, and other
|
(14,076
|
)
|
52,656
|
9,618
|
-
|
48,198
|
|||||||||
|
Goodwill impairment loss
|
20,230
|
24,922
|
92,856
|
-
|
138,008
|
||||||||||
|
Alternative fuel mixture credits
|
-
|
(54,232
|
)
|
-
|
-
|
(54,232
|
)
|
||||||||
|
Operating income (loss)
|
(8,123
|
)
|
74,376
|
(89,656
|
)
|
764
|
(22,639
|
)
|
|||||||
|
Other income/(expense):
|
|||||||||||||||
|
Net interest income/(expense) and amortization of debt
|
(30,467
|
)
|
1,265
|
148
|
-
|
(29,054
|
)
|
||||||||
|
Other income/(expense), including equity in income of
affiliates
|
.
|
(81,335
|
)
|
.
|
(208
|
)
|
.
|
(8
|
)
|
.
|
81,534
|
.
|
.
|
(17
|
)
|
|
Intercompany interest income/(expense)
|
30,830
|
(27,276
|
)
|
(3,554
|
)
|
-
|
-
|
||||||||
|
Income/(loss) before income taxes
|
(89,095
|
)
|
48,157
|
(93,070
|
)
|
82,298
|
(51,710
|
)
|
|||||||
|
Income tax expense/(benefit)
|
(23,707
|
)
|
19,032
|
(3,044
|
)
|
21,397
|
13,678
|
||||||||
|
Net income (loss)
|
$
|
(65,388
|
)
|
$
|
29,125
|
$
|
(90,026
|
)
|
$
|
60,901
|
$
|
(65,388
|
)
|
||
STATEMENTS OF OPERATIONS
Year ending June 30, 2008
|
Buckeye Technologies
Inc.
|
Guarantors
U.S.
Subsidiaries
|
Non-
Guarantor
Subsidiaries
|
Consolidating
Adjustments
|
Consolidated
|
||||||||||||
|
Net sales
|
$
|
123,263
|
$
|
538,444
|
$
|
201,515
|
$
|
(37,705
|
)
|
$
|
825,517
|
|||||
|
Cost of goods sold
|
108,297
|
422,226
|
182,964
|
(37,532
|
)
|
675,955
|
||||||||||
|
Gross margin
|
14,966
|
116,218
|
18,551
|
(173
|
)
|
149,562
|
||||||||||
|
Selling, research and administrative expenses, and
other
|
(17,729
|
)
|
55,872
|
10,990
|
-
|
49,133
|
||||||||||
|
Restructuring costs
|
69
|
-
|
27
|
-
|
96
|
|||||||||||
|
Operating income (loss)
|
32,626
|
60,346
|
7,534
|
(173
|
)
|
100,333
|
||||||||||
|
Other income/(expense):
|
||||||||||||||||
|
Net interest income/(expense) and amortization of debt
|
(33,712
|
)
|
272
|
454
|
-
|
(32,986
|
)
|
|||||||||
|
Other income/(expense), including equity in income of
affiliates
|
50,966
|
156
|
208
|
(51,372
|
)
|
(42
|
)
|
|||||||||
|
Intercompany interest income/(expense)
|
26,961
|
(26,014
|
)
|
(947
|
)
|
-
|
-
|
|||||||||
|
Income/(loss) before income taxes
|
76,841
|
34,760
|
7,249
|
(51,545
|
)
|
67,305
|
||||||||||
|
Income tax expense/(benefit)
|
29,739
|
7,612
|
(654
|
)
|
(16,494
|
)
|
20,203
|
|||||||||
|
Net income (loss)
|
$
|
47,102
|
$
|
27,148
|
$
|
7,903
|
$
|
(35,051
|
)
|
$
|
47,102
|
|||||
F-36
BALANCE SHEETS
As of June 30, 2010
|
Buckeye
Technologies
Inc.
|
Guarantors
U.S.
Subsidiaries
|
Non-
Guarantor
Subsidiaries
|
Consolidating
Adjustments
|
Consolidated
|
||||||||||||
|
Assets
|
||||||||||||||||
|
Current assets
|
||||||||||||||||
|
Cash and cash equivalents
|
$
|
771
|
$
|
3
|
$
|
21,347
|
$
|
-
|
$
|
22,121
|
||||||
|
Accounts receivable, net
|
43,142
|
54,060
|
25,758
|
-
|
122,960
|
|||||||||||
|
Income tax and alternative fuel mixture credits
receivable
|
-
|
68,356
|
-
|
-
|
68,356
|
|||||||||||
|
Inventories
|
10,234
|
47,339
|
17,954
|
(677
|
)
|
74,850
|
||||||||||
|
Other current assets
|
727
|
6,471
|
2,343
|
-
|
9,541
|
|||||||||||
|
Intercompany accounts receivable
|
-
|
242,219
|
-
|
(242,219
|
)
|
-
|
||||||||||
|
Total current assets
|
54,874
|
418,448
|
67,402
|
(242,896
|
)
|
297,828
|
||||||||||
|
Property, plant and equipment, net
|
56,085
|
344,771
|
123,619
|
-
|
524,475
|
|||||||||||
|
Goodwill and intangibles, net
|
13,154
|
2,425
|
-
|
-
|
15,579
|
|||||||||||
|
Intercompany notes receivable
|
359,717
|
-
|
-
|
(359,717
|
)
|
-
|
||||||||||
|
Other assets, including investment in subsidiaries
|
462,937
|
232,066
|
94,351
|
(774,782
|
)
|
14,572
|
||||||||||
|
Total assets
|
$
|
946,767
|
$
|
997,710
|
$
|
285,372
|
$
|
(1,377,395
|
)
|
$
|
852,454
|
|||||
|
Liabilities and stockholders’ equity
|
||||||||||||||||
|
Current liabilities
|
||||||||||||||||
|
Trade accounts payable
|
$
|
5,218
|
$
|
26,399
|
$
|
7,759
|
$
|
-
|
$
|
39,376
|
||||||
|
Other current liabilities
|
19,091
|
21,072
|
4,043
|
(1
|
)
|
44,205
|
||||||||||
|
Current portion of long-term debt
|
67,000
|
-
|
-
|
-
|
67,000
|
|||||||||||
|
Intercompany accounts payable
|
239,509
|
-
|
2,710
|
(242,219
|
)
|
-
|
||||||||||
|
Total current liabilities
|
330,818
|
47,471
|
14,512
|
(242,220
|
)
|
150,581
|
||||||||||
|
Long-term debt
|
170,332
|
-
|
-
|
-
|
170,332
|
|||||||||||
|
Deferred income taxes
|
(2,070
|
)
|
52,319
|
6,095
|
-
|
56,344
|
||||||||||
|
Other long-term liabilities
|
10,366
|
25,922
|
1,588
|
-
|
37,876
|
|||||||||||
|
Intercompany notes payable
|
-
|
261,865
|
97,852
|
(359,717
|
)
|
-
|
||||||||||
|
Stockholders’/invested equity
|
437,321
|
610,133
|
165,325
|
(775,458
|
)
|
437,321
|
||||||||||
|
Total liabilities and stockholders’ equity
|
$
|
946,767
|
$
|
997,710
|
$
|
285,372
|
$
|
(1,377,395
|
)
|
$
|
852,454
|
|||||
F-37
BALANCE SHEETS
As of June 30, 2009
|
Buckeye
Technologies
Inc.
|
Guarantors
U.S.
Subsidiaries
|
Non-
Guarantor
Subsidiaries
|
Consolidating
Adjustments
|
Consolidated
|
||||||||||||
|
Assets
|
||||||||||||||||
|
Current assets
|
||||||||||||||||
|
Cash and cash equivalents
|
$
|
1,138
|
$
|
4
|
$
|
20,919
|
$
|
-
|
$
|
22,061
|
||||||
|
Accounts receivable, net
|
18,644
|
63,522
|
29,126
|
-
|
111,292
|
|||||||||||
|
Income tax and alternative fuel mixture credits
receivable
|
-
|
9,374
|
-
|
-
|
9,374
|
|||||||||||
|
Inventories
|
17,325
|
53,722
|
16,931
|
(341
|
)
|
87,637
|
||||||||||
|
Other current assets
|
332
|
5,156
|
1,019
|
-
|
6,507
|
|||||||||||
|
Intercompany accounts receivable
|
-
|
131,302
|
-
|
(131,302
|
)
|
-
|
||||||||||
|
Total current assets
|
37,439
|
263,080
|
67,995
|
(131,643
|
)
|
236,871
|
||||||||||
|
Property, plant and equipment, net
|
58,821
|
336,836
|
130,932
|
-
|
526,589
|
|||||||||||
|
Goodwill and intangibles, net
|
14,845
|
2,425
|
-
|
-
|
17,270
|
|||||||||||
|
Intercompany notes receivable
|
363,717
|
-
|
-
|
(363,717
|
)
|
-
|
||||||||||
|
Other assets, including investment in subsidiaries
|
328,471
|
267,118
|
103,781
|
(687,716
|
)
|
11,654
|
||||||||||
|
Total assets
|
$
|
803,293
|
$
|
869,459
|
$
|
302,708
|
$
|
(1,183,076
|
)
|
$
|
792,384
|
|||||
|
Liabilities and stockholders’ equity
|
||||||||||||||||
|
Current liabilities
|
||||||||||||||||
|
Trade accounts payable
|
$
|
4,856
|
$
|
18,295
|
$
|
7,731
|
$
|
-
|
$
|
30,882
|
||||||
|
Other current liabilities
|
19,731
|
14,564
|
6,510
|
(1
|
)
|
40,804
|
||||||||||
|
Intercompany accounts payable
|
127,923
|
-
|
3,379
|
(131,302
|
)
|
-
|
||||||||||
|
Total current liabilities
|
152,510
|
32,859
|
17,620
|
(131,303
|
)
|
71,686
|
||||||||||
|
Long-term debt
|
327,465
|
-
|
-
|
-
|
327,465
|
|||||||||||
|
Deferred income taxes
|
(3,862
|
)
|
44,251
|
8,010
|
-
|
48,399
|
||||||||||
|
Other long-term liabilities
|
9,149
|
15,802
|
1,852
|
-
|
26,803
|
|||||||||||
|
Intercompany notes payable
|
-
|
268,991
|
94,726
|
(363,717
|
)
|
-
|
||||||||||
|
Stockholders’/invested equity
|
318,031
|
507,556
|
180,500
|
(688,056
|
)
|
318,031
|
||||||||||
|
Total liabilities and stockholders’ equity
|
$
|
803,293
|
$
|
869,459
|
$
|
302,708
|
$
|
(1,183,076
|
)
|
$
|
792,384
|
|||||
F-38
STATEMENTS OF CASH FLOWS
Year ending June 30, 2010
|
Buckeye
Technologies
Inc.
|
Guarantors
U.S.
Subsidiaries
|
Non-
Guarantor
Subsidiaries
|
Consolidated
|
||||||||||
|
Net cash provided by operations
|
$
|
89,075
|
$
|
36,406
|
$
|
9
|
$
|
125,490
|
|||||
|
Investing activities:
|
|||||||||||||
|
Purchases of property, plant and equipment
|
(2,045
|
)
|
(43,367
|
)
|
(2,128
|
)
|
(47,540
|
)
|
|||||
|
Proceeds from Florida grant
|
-
|
7,381
|
-
|
7,381
|
|||||||||
|
Other
|
-
|
(421
|
)
|
8
|
(413
|
)
|
|||||||
|
Net cash used in investing activities
|
(2,045
|
)
|
(36,407
|
)
|
(2,120
|
)
|
(40,572
|
)
|
|||||
|
Financing activities
|
|||||||||||||
|
Net borrowings under revolving line of credit
|
80,311
|
-
|
191
|
80,502
|
|||||||||
|
Net payments on long-term debt and other
|
(167,708
|
)
|
-
|
-
|
(167,708
|
)
|
|||||||
|
Net cash used in financing activities
|
(87,397
|
)
|
-
|
191
|
(87,206
|
)
|
|||||||
|
Effect of foreign currency rate fluctuations on cash
|
-
|
-
|
2,348
|
2,348
|
|||||||||
|
Increase (decrease) in cash and cash equivalents
|
(367
|
)
|
(1
|
)
|
428
|
60
|
|||||||
|
Cash and cash equivalents at beginning of period
|
1,138
|
4
|
20,919
|
22,061
|
|||||||||
|
Cash and cash equivalents at end of period
|
$
|
771
|
$
|
3
|
$
|
21,347
|
$
|
22,121
|
|||||
STATEMENTS OF CASH FLOWS
Year ending June 30, 2009
|
Buckeye
Technologies
Inc.
|
Guarantors
U.S.
Subsidiaries
|
Non-
Guarantor
Subsidiaries
|
Consolidated
|
||||||||||
|
Net cash provided by operations
|
$
|
70,592
|
$
|
36,787
|
$
|
13,888
|
$
|
121,267
|
|||||
|
Investing activities:
|
|||||||||||||
|
Purchases of property, plant and equipment
|
(3,392
|
)
|
(36,222
|
)
|
(2,809
|
)
|
(42,423
|
)
|
|||||
|
Other
|
-
|
(340
|
)
|
-
|
(340
|
)
|
|||||||
|
Net cash used in investingactivities
|
(3,392
|
)
|
(36,562
|
)
|
(2,809
|
)
|
(42,763
|
)
|
|||||
|
Financing activities
|
|||||||||||||
|
Purchase of treasury shares
|
(494
|
)
|
-
|
-
|
(494
|
)
|
|||||||
|
Net payments under revolving line of credit
|
(61,059
|
)
|
-
|
(71
|
)
|
(61,130
|
)
|
||||||
|
Net payments on long-term debt and other
|
(5,000
|
)
|
(358
|
)
|
-
|
(5,358
|
)
|
||||||
|
Net cash used in financing activities
|
(66,553
|
)
|
(358
|
)
|
(71
|
)
|
(66,982
|
)
|
|||||
|
Effect of foreign currency rate fluctuations on cash
|
-
|
-
|
146
|
146
|
|||||||||
|
Increase (decrease) in cash and cash equivalents
|
647
|
(133
|
)
|
11,154
|
11,668
|
||||||||
|
Cash and cash equivalents at beginning of period
|
491
|
137
|
9,765
|
10,393
|
|||||||||
|
Cash and cash equivalents at end of period
|
$
|
1,138
|
$
|
4
|
$
|
20,919
|
$
|
22,061
|
|||||
F-39
STATEMENTS OF CASH FLOWS
Year ending June 30, 2008
|
Buckeye
Technologies
Inc.
|
Guarantors
U.S.
Subsidiaries
|
Non-
Guarantor
Subsidiaries
|
Consolidated
|
||||||||||
|
Net cash provided by operations
|
$
|
49,605
|
$
|
39,561
|
$
|
3,140
|
$
|
92,306
|
|||||
|
Investing activities:
|
|||||||||||||
|
Purchases of property, plant and equipment
|
(6,722
|
)
|
(39,023
|
)
|
(3,452
|
)
|
(49,197
|
)
|
|||||
|
Other
|
-
|
(451
|
)
|
17
|
(434
|
)
|
|||||||
|
Net cash used in investingactivities
|
(6,722
|
)
|
(39,474
|
)
|
(3,435
|
)
|
(49,631
|
)
|
|||||
|
Financing activities
|
|||||||||||||
|
Purchase of treasury shares
|
(2,720
|
)
|
-
|
-
|
(2,720
|
)
|
|||||||
|
Net borrowings under revolving line of credit
|
78,079
|
-
|
156
|
78,235
|
|||||||||
|
Net payments on long-term debt and other
|
(124,080
|
)
|
(397
|
)
|
-
|
(124,477
|
)
|
||||||
|
Net cash provided by (used in) financing activities
|
(48,721
|
)
|
(397
|
)
|
156
|
(48,962
|
)
|
||||||
|
Effect of foreign currency rate fluctuations on cash
|
-
|
-
|
1,890
|
1,890
|
|||||||||
|
Increase (decrease) in cash and cash equivalents
|
(5,838
|
)
|
(310
|
)
|
1,751
|
(4,397
|
)
|
||||||
|
Cash and cash equivalents at beginning of period
|
6,329
|
447
|
8,014
|
14,790
|
|||||||||
|
Cash and cash equivalents at end of period
|
$
|
491
|
$
|
137
|
$
|
9,765
|
$
|
10,393
|
|||||
F-40
SCHEDULE II
VALUATION AND QUALIFYING ACCOUNTS
|
Column B
|
Column C
|
Column D
|
Column E
|
||||||||||
|
Description
|
Balance
at
Beginning
of
Period
|
Additions
Charged
to
Expenses
|
Deductions
|
Balance
at
End
of
Period
|
|||||||||
|
Allowance for doubtful accounts
|
|||||||||||||
|
Year ended June 30, 2010
|
$
|
991
|
$
|
(84
|
)
|
$
|
(57)(a
|
)
|
$
|
850
|
|||
|
Year ended June 30, 2009
|
$
|
1,457
|
$
|
477
|
$
|
(943)(a
|
)
|
$
|
991
|
||||
|
Year ended June 30, 2008
|
$
|
1,399
|
$
|
116
|
$
|
(58)(a
|
)
|
$
|
1,457
|
||||
|
Accrual for restructuring
|
|||||||||||||
|
Year ended June 30, 2010
|
$
|
-
|
$
|
3,353
|
$
|
(3,040)(b
|
)
|
$
|
313
|
||||
|
Year ended June 30, 2009
|
$
|
116
|
$
|
16
|
$
|
(132)(b
|
)
|
$
|
-
|
||||
|
Year ended June 30, 2008
|
$
|
327
|
$
|
96
|
$
|
(307)(b
|
)
|
$
|
116
|
||||
|
Deferred tax assets valuation allowance
|
|||||||||||||
|
Year ended June 30, 2010
|
$
|
14,446
|
$
|
1,662
|
$
|
28(c
|
)
|
$
|
16,136
|
||||
|
Year ended June 30, 2009
|
$
|
13,401
|
$
|
1,981
|
$
|
(936)(c
|
)
|
$
|
14,446
|
||||
|
Year ended June 30, 2008
|
$
|
11,720
|
$
|
(501
|
)
|
$
|
2,182(c
|
)
|
$
|
13,401
|
|||
(a) Uncollectible accounts written off, net of recoveries, translation adjustments and changes in quality claims. Quality claims are recorded as reduction in sales.
|
|
(b) Severance payments, lease cancellations, relocation expenses, impact of foreign currency exchange and miscellaneous expenses.
|
|
|
(c) Impact of change in exchange rate between Brazilian reals and U.S. dollars.
|
F-41