Attached files
| file | filename |
|---|---|
| 8-K - FORM 8-K - AVON PRODUCTS INC | d8k.htm |
 Exhibit 99.1 |
 Andrea Jung
Chairman and
Chief Executive Officer |
 This presentation
contains forward-looking statements within the meaning of the Private Securities Litigation
Reform Act of 1995. Words such as “estimate,” “project,” “forecast,”
“plan,” “believe,” “may,” “expect,” “anticipate,”
“intend,” “planned,” “potential,” “can,”
“expectation,” and similar expressions, or the negative of those expressions, may identify
forward-looking statements. Such forward-looking statements are based on
management’s reasonable current assumptions and expectations. Such forward-looking
statements involve risks, uncertainties and other factors, which may cause the actual results,
levels of activity, performance or achievement of Avon to be materially different from any
future results expressed or implied by such forward-looking statements, and there can be no
assurance that actual results will not differ materially from management’s expectations.
Please see our “Risk Factors” in Part I, Item 1A, and “Management’s
Discussion and Analysis of Financial Conditions and Results of Operations” in Part II,
Item 7, of Avon’s Annual Report on Form 10-K for the fiscal year ended December 31,
2010. We undertake no obligation to update any forward-looking statements, whether as
a result of new information, future events or otherwise.
Please see the Appendix to this slide presentation which is posted on
www.avoninvestor.com
for an explanation and/or reconciliation of certain Non-GAAP financial measures included
in this presentation.
|
 Investor materials, including today’s slides,
can be found at:
http://www.avoninvestor.com |
 Key
Messages •
We are committed to delivering sustainable
growth,
with
mid-teen
operating margins by 2013
•
We have restructured
the management team
to
strengthen execution rigor
•
In 2011, we are squarely focused on top and
bottom-line recovery
in the second half
•
We remain committed to sustained strategic
investment
in
2011
and
beyond
•
We have redesigned short and long-term
executive
compensation
to tightly align with
operating margin expansion |
 Underlying these messages is our intent
to reinforce management accountability
and provide better
visibility
into
our financial objectives |
 1
2
3
4
5
Management Reorganization
A Look at 2013
More Detail on 2011
Executive Compensation
2011 Priorities
Agenda |
 1
Management
Reorganization |
 Implementing a Comprehensive Management
Realignment to Sharpen our Operational Focus
•
Represents most significant
reorganization since 2005
•
Entirely new CBU leadership team
–
Five new regional heads
–
New leadership in U.S. and Russia
•
New Developed and Developing Market Group leaders
increases operational oversight
•
Strengthens management depth
and bench |
 Developed
Markets
Charles Cramb
Developing
Markets
Charles Herington
Chairman & CEO
Andrea Jung
•
Latin America
•
CEE
•
Asia Pacific & China
•
North America
•
WEMEA
•
Silpada
& Liz Earle
•
Corporate Strategy |
 Leveraging Seasoned Internal Talent with
Strategic Hires to Strengthen Execution Rigor
•
Highly experienced
CBU leadership team
–
Seasoned direct selling operators
–
General management experience spanning all regions
–
Cross-functional experience in Marketing and global
Direct Selling
•
External searches
underway for CFO and
Latin America CBU leader |
 2
2011 Priorities |
 Our
2011 Priorities are Clear •
Restore growth in Brazil and Russia
•
Stabilize North America
•
Reignite Skincare
•
Deliver meaningful operating margin expansion |
 •
Organic sales growth of mid-single digit (C$)
–
Low-single-digit growth continues in 1H
–
Reaccelerate to mid-single digit growth in 2H
•
FY
adjusted
operating
margin
expansion
of
50-70
bps
–
Lower in 1H
–
Significant improvement in 2H
–
Costing to lower end of mid-single digit sales growth
More Visibility on Goals for 2011 |
 In
Brazil, We are Expecting Revenue to Improve Throughout the Year
•
Return Service levels to
historical norms
•
Sustain healthy Avon Field
fundamentals and consumer
demand
•
Hold or grow Beauty
market share in 2H
How We Would Define Success in 2011 |
 Aggressive Recovery Programs are Underway
in Brazil
•
Short-term, end-to-end
micro-management
of
service recovery
•
Mid to long-term investments in
service
infrastructure
•
Stepped
up
RVP
investment
to address Representative
annoyance factor and retention |
 In
Russia, We are Focusing on Strengthening Sales Growth in the Second Half
•
Regain mid-single digit
Active Representative
growth by year-end
•
Return Skincare and Color to
at-market growth by year-end
•
Strengthen Field fundamentals
for share gains in 2012 and
beyond
How We Would Define Success in 2011 |
 In
Russia, Growth Initiatives are Targeted Against Field and Category
Activation •
New Sales Leadership
compensation plan that
increases earning potential
for first year leaders by 25%
•
Strengthened Skincare
pipeline, expected to pay
dividends in 2H
•
Higher focus on promotional
activity in Color |
 In
North America, our Near-Term Goal is to Stabilize the Top-Line
•
Stem Active Representative
declines during the
second half
•
Stabilize average order by
year-end
•
Maintain steady annual
progress toward double-digit
operating margin
How We Would Define Success in 2011 |
 Initiatives are Underway in the U.S. to Stabilize
Field and Average Order Growth in the Near-Term
•
$20 million investment to
improve Sales Leadership
earnings
–
“Believe in Your Success”
program steps up recruiting
and development bonuses
•
Re-energized Holiday
offers and giftables
•
New Mom
&
Baby
business in 2H |
 We
are Also Evaluating Significant Changes to our Sales Leadership Model
•
More leadership titles and levels
•
Increased compensation at all levels of Leadership
•
Higher % of variable vs. fixed sales expense
•
Even greater focus on Sales Leadership as a
growth driver
Opportunities Under Evaluation |
 Turning to our Global Beauty Business,
Reigniting Skincare Growth is Critical in 2011
Avon Net Sales Growth, 2010 vs. 2009 (C$)
12%
6%
5%
-3%
Fragrance
Color
Personal Care
Skincare |
 We are Strengthening
our Skincare
Portfolio with a Compelling
Product Offer
Across Price Tiers
|
 In
the Value Tier, We are Launching a New Global Brand, Avon
Care Value-priced skin
and body
line for Developing
markets |
 Avon Care Video |
 In
Mass, We are Revitalizing Avon Solutions
Revamped
formula, brand and packaging launching Q2 |
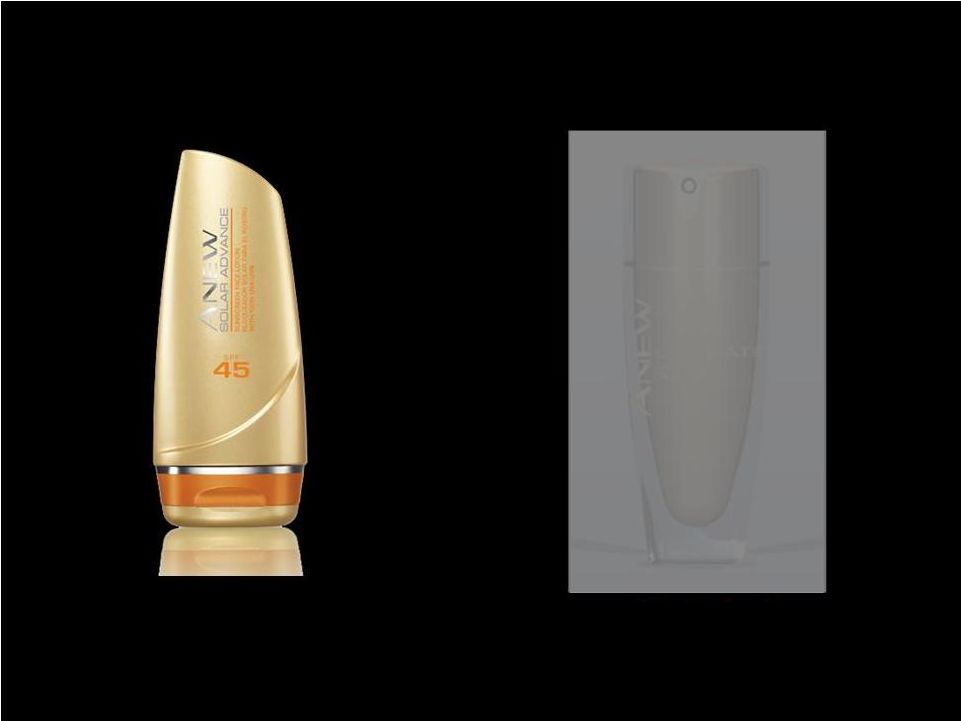 In
Masstige, We are Defending Anew with
Technology
First-to-Market
Sun Care
Innovation
Q4
Anti-Aging
Breakthrough |
 First-to-Market Sun Innovation Reverses 50% of
Sun Damage in 24 Hours |
 In
Q4, We Will Continue to Build our Flagship Anew Brand with an Anti-Aging
Breakthrough •
Based on 10 years of
groundbreaking
cell
biology research
•
Uncovers
a
genetic
link
between longevity and
youthful skin |
 Fountain of Youth Teaser Video |
 In
sum, our execution focus against the
top-line is clear –
restore growth in Brazil
and Russia,
stabilize the U.S.
and reignite Skincare
|
 On the bottom-line, we are focused on
delivering
50-70
bps of margin
expansion… |
 …without compromising strategic investments
against Avon’s
long-term health |
 Our
Investment Philosophy is Fully Aligned With Growth Objectives as We Drive the
Bottom-Line •
On average, grow
advertising
and
RVP
in line
with sales
•
Continuously
optimize
mix
based on paybacks
•
Defend
share
in
priority
markets and categories |
 In
2011, We are Rebalancing Investment From Advertising to RVP to Support Field
Recovery A strong Field is a pre-requisite for
effective advertising investment
>10% increase
>10% decline
2011 vs. 2010 Investment Growth
RVP
Advertising |
 Despite Reduced Overall Advertising Spend,
We Will Maintain Strong Support in Key Markets
2%
5%
Largest, Most
Competitive
Markets
1
All Other
Avon Markets
2011E Advertising Spend as % Beauty Sales
1
Includes: Brazil, Russia, US, Mexico, Turkey, Colombia
|
 50
100
And We Will Focus on Core Beauty Categories
With the Highest Near-Term Paybacks
Core Skincare,
Fragrance, Color
Hair Care
"White Space"
2010 Advertising Payback Index –
Large Market Example
Reducing spend in "white space" categories while
sustaining focus on core Beauty
Source: Brazil 2010 Marketing Mix Model |
 We
Also Remain Committed to our Long-Term Strategic Growth Agenda
Innovate our
Channel
to drive Representative
productivity
+
Innovate our
Market Basket
to enhance
average order |
 We
are Launching New Advertising to Reinforce Direct Selling Channel Equity
•
Designed to promote the benefits of Direct Selling
•
TV commercial tested significantly above industry
norms
•
Airing in the U.S. and U.K. |
 Channel Ad |
 We
are Continuing to e-Enable Representatives... •
Doubling geographic coverage
of e-tools
in 2011
•
Aggressively focusing on activation,
leveraging
pilot market learnings
•
Actively
monitoring
and
measuring
performance
Avon Leadership Manager
e-Brochure
Intelligent Ordering |
 ...And Early Pilot Market Results are Positive
Intelligent Ordering Example
•
90%
of Representatives in
Russia, Poland and Ukraine
say
they
are
using
the tool
•
In Brazil, Representatives
who used Intelligent Ordering
increased
their
units
per
order
•
In
8
markets today, rolling out
to
22
by year end |
 Service Model Transformation Remains a
Key Focus
•
Redefine core processes
that make up Service
•
Define required business
requirements
and
capabilities
•
Redesign and standardize
OMS
Supported by a 60 person
global, cross-functional team
Objectives
Scope
•
Order Submission
•
Product Availability
•
Segmented Service
•
Fulfillment and Delivery
•
Settlement/Collections
•
Returns
•
Customer Service |
 To
Enhance our Market Basket, We are Launching Mom and Baby...
Expanding
Avon Baby
in Developing markets
Launching
Tiny Tillia,
starting in the U.S. |
 ...And We are Extending our Focus on
Higher-Tier Direct Selling
Liz Earle
to begin global
expansion in 2012
Silpada
primarily focused in
North America, now in U.K. |
 In
sum,
we
will
continue
to
invest
in our
brand and channel for the long-term as
we deliver
operating margin
expansion |
 3
Executive
Compensation |
 From
50%
Operating Profit
50% Revenue Growth
To
60%
Operating Margin
40% Revenue Growth
Business
Objectives
2011 Annual Incentive Plan is Tied to:
•
Mid-single digit sales growth
•
12% adjusted operating margin
Annual Incentive Plan Shifts Focus From
Operating Profit to Operating Margin |
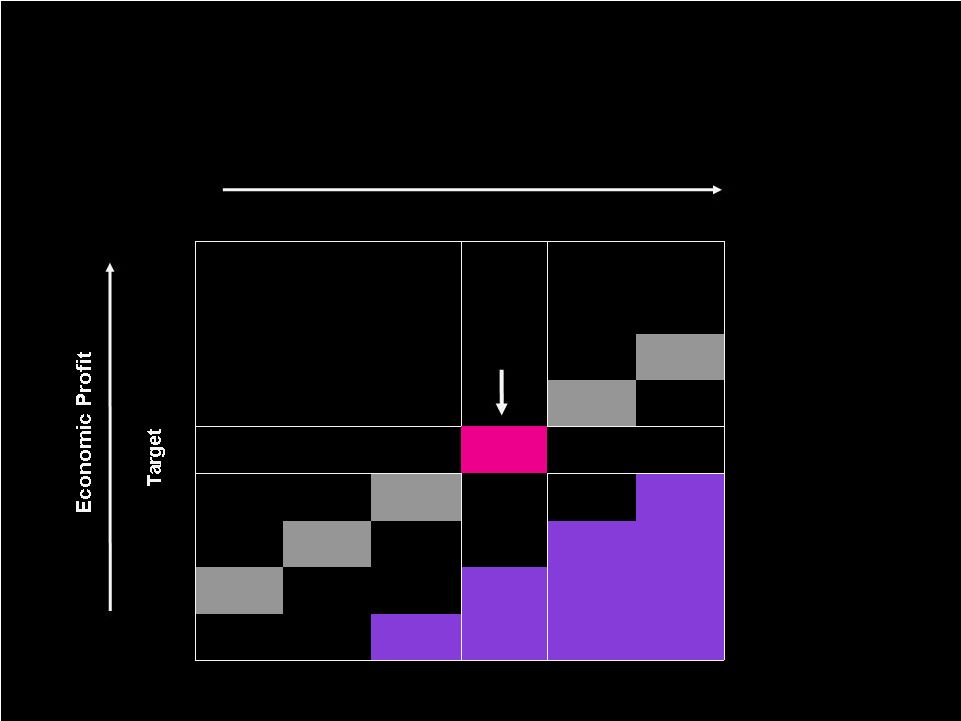
 New
Long-Term Incentive Plan Drives Alignment with Operating Margin Goals
•
Significant margin expansion
is
required
over the
three year period to trigger payout
•
Achievement of both
Cumulative Economic Profit and
Revenue Growth determine payout percentage
–
Use of a payout “matrix”
ensures tradeoffs
between
revenue growth
and
profitability/margin
are
considered |
 Economic Profit is a Key Component of the Plan
•
Rewards management for both profitability
and
efficient asset management
Economic
Profit
Capital Charge
X
Assets
Employed
Revenue
X
Operating
Margin |
 Long-Term Incentive Plan Payout is Based on
a Matrix
Revenue Growth
Low
High
14% Margin |
 Payout is Tied to 14% Operating Margin
by 2013
Revenue Growth
Target
(MSD)
Low
High
14%
14%
14%
14%
14%
100%
payout
14%
14% Margin |
 Payout Can Exceed 100% Only If We Deliver
Operating Margin Above 14% in 2013
Revenue Growth
Target
(MSD)
Low
High
14%
14%
14%
14%
14%
100%
payout
14%
14% Margin |
 There
is No Payout if Operating Margin is Less Than 13.5% and Economic Profit is
Below Target Revenue Growth
Target
(MSD)
Low
14%
14%
14%
14%
14%
Margins too
Low –
0%
Payout
100%
payout
14%
High |
 New
Incentive Programs – Summary
•
Tightly aligned to 2013 14% operating
margin •
Annual
and
Long
Term
Plan
work
in
tandem
to:
–
Realize both revenue growth
and margin expansion
–
Effectively manage cash
and capital
•
100%
of senior management long-term incentive
compensation is at risk
–
70% Performance RSUs
–
30% Performance cash |
 4
More Detail
on 2011 |
 Chuck Cramb
Vice Chairman,
Chief Finance and Strategy Officer
56 |
 4
More Detail
on 2011 |
 A
Look at 2011 Revenue Growth •
We are costing to the lower end of mid-single digit
sales growth |
 A
Look at 2011 Revenue Growth •
We are costing to the lower end of mid-single digit
sales growth
•
First-half organic sales likely to be in low-single digit
range
–
Need to regain momentum
–
1Q expected to be similar to 4Q 2010
–
Some improvement in 2Q |
 A
Look at 2011 Revenue Growth •
We are costing to the lower end of mid-single digit
sales growth
•
First-half organic sales likely to be in low-single digit
range
–
Need to regain momentum
–
1Q expected to be similar to 4Q 2010
–
Some improvement in 2Q
•
Acquisitions expected to add approximately 2pts to
1H growth |
 A
Look at 2011 Revenue Growth •
We are costing to the lower end of mid-single digit
sales growth
•
First-half organic sales likely to be in low-single digit
range
–
Need to regain momentum
–
1Q expected to be similar to 4Q 2010
–
Some improvement in 2Q
•
Acquisitions expected to add approximately 2pts to
1H growth
•
Expect return to mid-single digit range in second half
–
Minimal impact from acquisitions |
 A
Look at 2011 Revenue Growth •
Gradual recovery in Brazil
–
Shorts should return to historical norms
–
Representative annoyance dissipates |
 A
Look at 2011 Revenue Growth •
Gradual recovery in Brazil
–
Shorts should return to historical norms
–
Representative annoyance dissipates
•
Gradual recovery in Russia
–
New compensation scheme takes hold
–
Macro and competitive pressures remain |
 A
Look at 2011 Revenue Growth •
Gradual recovery in Brazil
–
Shorts should return to historical norms
–
Representative annoyance dissipates
•
Gradual recovery in Russia
–
New compensation scheme takes hold
–
Macro and competitive pressures remain
•
North America remains in transition
–
Rolling out changes to redesigned Sales Leadership
model
–
Expect signs of stabilization by year-end |
 A
Look at 2011 Revenue Growth •
Gradual recovery in Brazil
–
Shorts should return to historical norms
–
Representative annoyance dissipates
•
Gradual recovery in Russia
–
New compensation scheme takes hold
–
Macro and competitive pressures remain
•
North America remains in transition
–
Rolling out changes to redesigned Sales Leadership
model
–
Expect signs of stabilization by year-end
Mid-single
digit
revenue
growth |
 A
Look at 2011 Operating Margin •
Key elements of our plan
–
Overall mid-single digit sales growth
–
Significant gross margin improvement
–
RVP and advertising grow roughly in line with sales, with a shift
more towards RVP
–
Recalibrate the pace of incremental strategic investments
–
Duplicate distribution costs to taper off in second half
–
Overhead to grow slower than sales |
 A
Look at 2011 Operating Margin •
Key elements of our plan
–
Overall mid-single digit sales growth
–
Significant gross margin improvement
–
RVP and advertising grow roughly in line with sales, with a shift
more towards RVP
–
Recalibrate the pace of incremental strategic investments
–
Duplicate distribution costs to taper off in second half
–
Overhead to grow slower than sales
•
Recognize potential headwinds
–
Significant commodity cost increases
–
Timing of major market recoveries and stabilizations
–
Venezuela uncertainties |
 A
Look at 2011 Operating Margin •
Key elements of our plan
–
Overall mid-single digit sales growth
–
Significant gross margin improvement
–
RVP and advertising grow roughly in line with sales, with a shift
more towards RVP
–
Recalibrate the pace of incremental strategic investments
–
Duplicate distribution costs to taper off in second half
–
Overhead to grow slower than sales
•
Recognize potential headwinds
–
Significant commodity cost increases
–
Timing of major market recoveries and stabilizations
–
Venezuela uncertainties
Lower margins in 1H and improvement in 2H |
 A
Look at 2011 Operating Margin •
Key elements of our plan
–
Overall mid-single digit sales growth
–
Significant gross margin improvement
–
RVP and advertising grow roughly in line with sales, with a shift
more towards RVP
–
Recalibrate the pace of incremental strategic investments
–
Duplicate distribution costs to taper off in second half
–
Overhead to grow slower than sales
•
Recognize potential headwinds
–
Significant commodity cost increases
–
Timing of major market recoveries and stabilizations
–
Venezuela uncertainties
Leads to a 50-70bps margin improvement |
 2011
Cash Flow Expected to be Similar to Prior Year |
 2011
Cash Flow Expected to be Similar to Prior Year
•
Key Assumptions
–
Mid-single digit revenue growth
–
Achieve margin target for compensation
–
Restructuring of $0.09 (~$65MM)
–
No major Venezuela disruption |
 Key
Swing Factors to 2011 Cash Flow •
Higher net income
–
Mid-single digit revenue growth and target margins
–
Lower restructuring |
 Key
Swing Factors to 2011 Cash Flow •
Higher net income
–
Mid-single digit revenue growth and target margins
–
Lower restructuring
•
Offset by lower non-cash items
–
2010 impacted by Venezuela $60MM
–
Lower obsolescence and bad debt provisions |
 Key
Swing Factors to 2011 Cash Flow •
Higher net income
–
Mid-single digit revenue growth and target margins
–
Lower restructuring
•
Offset by lower non-cash items
–
2010 impacted by Venezuela $60MM
–
Lower obsolescence and bad debt provisions
•
Results in higher cash-related earnings |
 Key
Swing Factors to 2011 Cash Flow •
Cash flow will further benefit from
–
Inventory improvements of 3 to 5 days
–
Lower income and other taxes
•
Primarily $60MM unfavorable 2010 timing |
 Key
Swing Factors to 2011 Cash Flow •
Cash flow will further benefit from
–
Inventory improvements of 3 to 5 days
–
Lower income and other taxes
•
Primarily $60MM unfavorable 2010 timing
•
These gains offset by
–
Higher accounts receivable (follows revenue increases)
–
Lower A/P and Accruals
•
Unfavorable CTI mismatch of $40MM in 2011 vs. $30MM
favorable mismatch in 2010
•
Payout of 3 year Long-term Incentive cash plan
•
Incremental pension contribution of $75MM |
 Key
Swing Factors to 2011 Cash Flow •
Cash flow will further benefit from
–
Inventory improvements of 3 to 5 days
–
Lower income and other taxes
•
Primarily $60MM unfavorable 2010 timing
•
These gains offset by
–
Higher accounts receivable (follows revenue increases)
–
Lower A/P and Accruals
•
Unfavorable CTI mismatch of $40MM in 2011 vs. $30MM
favorable mismatch in 2010
•
Payout of 3 year Long-term Incentive cash plan
•
Incremental pension contribution of $75MM
•
Net result operating cash flow roughly equal to 2010 |
 2011
Capital Expenditures Expected to Be in $300-315MM Range
•
Shifting from Supply Chain to higher IT investments
(US$ Millions)
2008A
2009A
2010A
2011E
$377
$296
$331
$300-315
IT
Supply Chain
Other |
 2011
Free Cash Flow Expected to Cover Dividends
Free Cash Flow
>
$395
MM
Current Dividend
~ $395
MM |
 5
A Look at
2013 |
 $135
$200
$300
$40
$120
$230
$270
$300
$350
$390
$430
$430
$15
$80
$120
$150
$200
$300+
$300+
$300+
$15
$200+
$200+
$200+
$200+
2007
2008
2009
2010
2011
2012
2013+
SSI
PLS
2005 Program
2009 Program
We Have and Expect to Continue to Deliver on
our Restructuring and Strategic Initiatives
Projected Savings and Benefits ($MM)
$1,130MM+
+$80
+$70
+$50
$930MM+ |
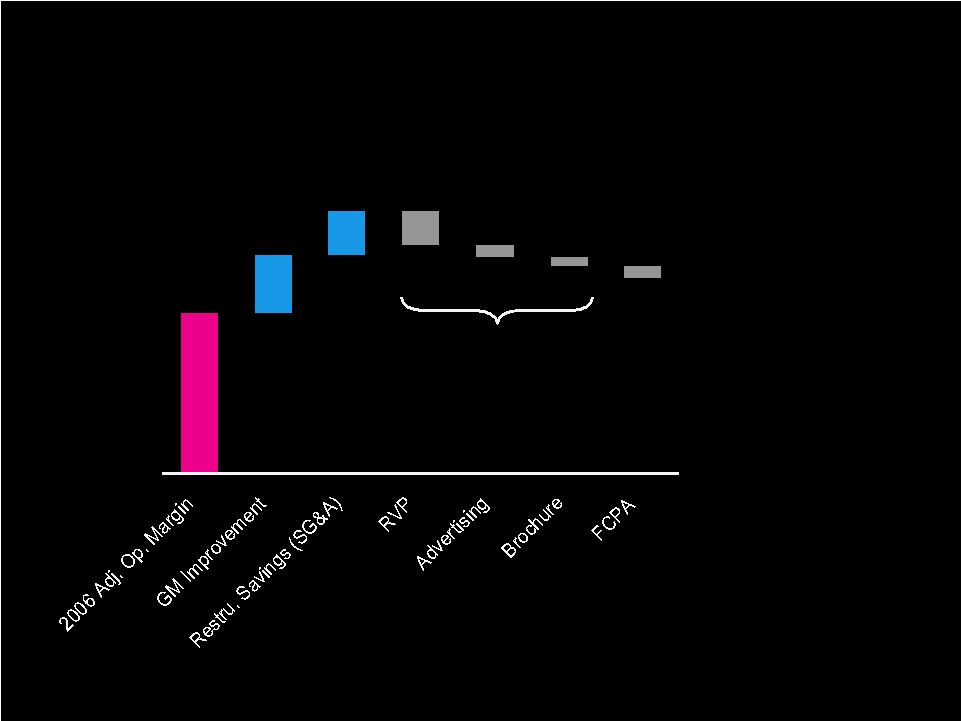
 However, Savings and Benefits Have Been More than
Offset by Planned Investments and Unanticipated Costs |
 11.4%
However, Savings and Benefits Have Been More than
Offset by Planned Investments and Unanticipated Costs |
 11.4%
4.2%
However, Savings and Benefits Have Been More than
Offset by Planned Investments and Unanticipated Costs |
 11.4%
4.2%
3.1%
However, Savings and Benefits Have Been More than
Offset by Planned Investments and Unanticipated Costs |
 11.4%
-0.6%
-0.9%
-2.4%
3.1%
4.2%
However, Savings and Benefits Have Been More than
Offset by Planned Investments and Unanticipated Costs
-3.9% |
 11.4%
-0.9%
-0.6%
-0.9%
-2.4%
3.1%
4.2%
However, Savings and Benefits Have Been More than
Offset by Planned Investments and Unanticipated Costs
-3.9% |
 11.4%
-1.6%
-0.9%
-0.6%
-0.9%
-2.4%
3.1%
4.2%
However, Savings and Benefits Have Been More than
Offset by Planned Investments and Unanticipated Costs
-3.9% |
 11.4%
-0.9%
-1.6%
-0.9%
-0.6%
-0.9%
-2.4%
3.1%
4.2%
However, Savings and Benefits Have Been More than
Offset by Planned Investments and Unanticipated Costs
-3.9%
•
Freight
•
Bad Debt |
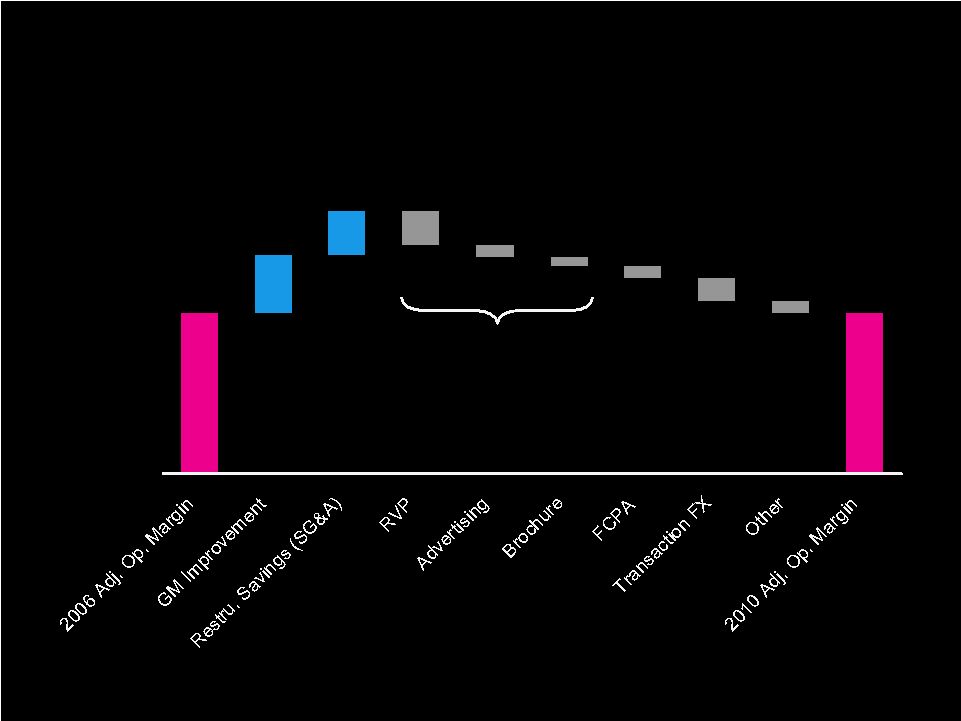 11.4%
11.4%
-0.9%
-1.6%
-0.9%
-0.6%
-0.9%
-2.4%
3.1%
4.2%
However, Savings and Benefits Have Been More than
Offset by Planned Investments and Unanticipated Costs
-3.9% |
 As
Promised, We Reinvested for Future Growth… $430MM
Restructuring
Savings
Advertising
$265MM
Strategic
Investments
$23MM
RVP
$400MM
Incremental Investments 2005 vs. 2010 |
 A
Look at 2013 Margin •
Revenue growth
•
Gross margin improvement
•
SG&A savings |
 A
Look at 2013 Margin Revenue Growth |
 Our
Business Fundamentals Should Drive Mid-Single Digit Growth
•
Beauty market is growing
•
Direct-selling channel remains strong
•
68% of business in emerging and developing markets |
 64%
56%
17%
15%
14%
13%
11%
10%
10%
South
Africa
India
Central
America
Turkey
Ukraine
Italy
Argentina
Colombia
Philippines
Don’t Underestimate Growth Potential of Some of
the Smaller Markets
2010 Revenue Growth (C$)
2010 Revenue
~20%
of
Sales from
DD Growers |
 Geographic Mix Will be Beneficial
•
Key market recovery
–
Brazil and Russia
•
Stabilization and then return to growth
–
U.S. and China
•
Growth from emerging and developing markets
–
Higher margin businesses |
 A
Look at 2013 Margin Gross Margin Improvement |
 Continue Improvement in Gross Margin
2010 Gross Margin
63.5%
•
Pricing
+
•
Product Mix
+
•
Supply Chain Productivity
+
•
Continued Restructuring Savings
+
•
Commodity Increases
-
2013
Gross Margin
++ |
 As
Skincare Returns to Growth, We Expect to Benefit From its Strong Margins
Skincare
Color
Fragrance
Jewelry
Personal Care
Hair Care
Home
1.3x |
 3-4% Annual Supply Chain Productivity Savings
by Focusing on…
•
Strategic sourcing
–
Directs: raw materials and components
–
Indirects: maintenance & repair, and logistics
•
Distribution
–
New facilities come online (Brazil and Colombia)
–
Automation and efficiency improvements of old facilities
•
Greater leverage of our global manufacturing footprint
–
Closure of Springdale and Germany factories (2012)
•
Consolidating production into remaining facilities
–
Increasing Beauty outsourcing from 10-15% to 30-35%
|
 …with the Goal of Offsetting Some Inflationary
and Commodity Pressures
•
Inflationary labor costs, mainly in LATAM & CEE
•
Pricing pressure on our oil based derivatives
–
Resins
–
Chemicals
–
Transportation
•
As well as impact of cotton prices on our Non-Beauty
business |
 And
our Highest Margin Markets Should Lead the Growth
2010 Adjusted Operating Margin
~60%
of our
portfolio
19%
15%
12%
12%
9%
-5%
CEE
LATAM
WEMEA
AP
NA
China |
 A
Look at 2013 Margin SG&A Savings |
 SG&A Savings
Overhead to grow slower than sales
-
Restructuring savings
-
ZOG philosophy
Advertising and RVP together, to
grow in line with sales
New facilities
Higher Average Order size
Advertising
RVP
Distribution
Overhead |
 Impact of Actions on 2013 Operating Margin
2010 Operating Margin
11.4%
•
GM Improvement
++
•
Advertising & RVP
=
•
Distribution Costs
+
•
Overhead Leverage
+
•
Geographic Mix
+
2013 Operating Margin
Mid-Teens |
 There Will Still be Some Mismatch Between
Net Income and Cash Flow
2011
•
LTI
•
Pension
•
Restructuring
$40M
mismatch
2012
•
Closing 2
Factories
•
Restructuring
$50M
mismatch
2013
•
No mismatch |
 Other Cash Flow Drivers
•
Capital Expenditures to remain in $300-350MM range
•
Target 3-5 day annual reduction in Inventory
•
Continue to improve Accounts Payable terms
•
Remain committed to competitive dividend |
 We
Expect Continued Improvement in Cash Flow…
•
Driven by net income growth
•
Benefit from working capital improvements
•
End of restructuring programs
Will Improve to $1B+ Annual
Cash Flow from Operations |
 Closing Remarks… |
 In
Summary… •
We
have
reorganized
to
strengthen
operational
oversight
and
execution
rigor
•
We
have
redesigned
short
and
long-term
executive
compensation
to tightly align with operating margin
expansion
•
We
remain
squarely
focused
against
:
–
Restore sustainable top-line growth
–
Deliver mid-teen operating margins by 2013
two priorities |
 |
 Appendix |
 Non-GAAP Financial
Measures •
To supplement our financial results presented in accordance with US GAAP, we disclose operating
results that have been adjusted to exclude the impact of changes due to the translation of foreign
currencies into U.S. dollars. We refer to these adjusted growth rates as Constant $ growth,
which is a non-GAAP financial measure. We believe this measure provides investors an
additional perspective on trends. To exclude the impact of changes due to the translation
of foreign currencies into U.S. dollars, we calculate current year results and prior year
results at a constant exchange rate. Currency impact is determined as the difference between
actual growth rates and constant currency growth rates.
•
We present gross margin and operating margin on a non-GAAP basis. The discussion of our
segments presents operating margin on a non-GAAP basis. We have provided a
quantitative reconciliation of the difference between the non-GAAP financial measure and
the financial measure calculated and reported in accordance with GAAP. These non-GAAP
measures should not be considered in isolation, or as a substitute for, or superior to,
financial measures calculated in accordance with GAAP. The Company uses non-GAAP
financial measures to evaluate its operating performance and believes that it is meaningful for
investors to be made aware of, on a period to period basis, the impacts of 1) costs to
implement (“CTI”) restructuring initiatives and 2) costs and charges related to
Venezuela being designated as a highly inflationary economy and the subsequent devaluation of
its currency in January 2010 (“Venezuelan special items”). The Venezuelan special
items include the impact on the Statement of Income caused by the devaluation of the Venezuelan
currency on monetary assets and liabilities, such as cash, receivables and payables; deferred tax
assets and liabilities; and nonmonetary assets, such as inventory and prepaid expenses.
For nonmonetary assets, the Venezuelan special items include the earnings impact caused by the
difference between the historical cost of the assets at the previous official exchange rate of
2.15 and the revised exchange rate of 4.30. |
 AVON PRODUCTS,
INC. SUPPLEMENTAL SCHEDULE
NON-GAAP FINANCIAL MEASURES
(Unaudited)
Reported
(GAAP)
CTI
restructuring
initiatives
Venezuelan
special items
Rounding
Adjusted
(Non-GAAP)
62.8%
0.1
0.6
63.5%
13.2%
0.4
1.8
15.4%
6.9%
1.8
0.0
0.1
8.8%
18.8%
0.3
0.0
19.1%
12.1%
0.1
0.0
12.2%
12.4%
0.0
0.0
12.4%
(4.7)%
0.0
0.0
(0.1)
(4.8)%
0.0%
0.0
0.0
0.0%
Total
9.9%
0.7
0.7
0.1
11.4%
Asia Pacific
China
Global and other
Latin America
North America
Central & Eastern Europe
Western Europe, Middle East & Africa
SEGMENT OPERATING MARGIN
Gross margin
$ in Millions (except per share data)
TWELVE MONTHS ENDED 12/31/10 |
 GAAP
and C$ Growth Rates 10%
15%
Philippines
10%
25%
Colombia
11%
6%
Argentina
Fragrance
11%
12%
Color
7%
6%
Personal Care
5%
5%
Skincare
-3%
-3%
South Africa
82%
64%
India
65%
56%
Central America
16%
17%
Turkey
17%
15%
Ukraine
12%
14%
Italy
7%
13%
GAAP
Constant $ |