Attached files
Table of Contents
UNITED STATES
SECURITIES AND EXCHANGE COMMISSION
Washington, D.C. 20549
FORM 10-K
(Mark One)
| x | ANNUAL REPORT PURSUANT TO SECTION 13 OR 15(d) OF THE SECURITIES EXCHANGE ACT OF 1934. |
For the fiscal year ended December 26, 2010
OR
| ¨ | TRANSITION REPORT PURSUANT TO SECTION 13 OR 15(d) OF THE SECURITIES EXCHANGE ACT OF 1934. |
For the transition period from to
Commission File Number 001-34747
SPANSION INC.
(Exact name of registrant as specified in its charter)
| Delaware | 20-3898239 | |
| (State or other jurisdiction of incorporation or organization) |
(I.R.S. Employer Identification No.) |
915 DeGuigne Drive
P.O. Box 3453
Sunnyvale, CA 94088
(408) 962-2500
(Address, including zip code, and telephone number, including area code, of registrant’s principal executive offices)
Securities registered pursuant to Section 12(b) of the Act:
| Title of each class |
(Name of each exchange on which registered) | |
| Class A Common Stock, $0.001 par value per share | New York Stock Exchange |
Securities registered pursuant to Section 12(g) of the Act:
None
Indicate by check mark if the registrant is a well-known seasoned issuer, as defined in Rule 405 of the Securities Act. Yes ¨ No x
Indicate by check mark if the registrant is not required to file reports pursuant to Section 13 or Section 15(d) of the Act. Yes ¨ No x
Indicate by check mark whether the registrant (1) has filed all reports required to be filed by Section 13 or 15(d) of the Securities Exchange Act of 1934 during the preceding 12 months (or for such shorter period that the registrant was required to file such reports), and (2) has been subject to such filing requirements for the past 90 days. Yes x No ¨
Indicate by check mark whether the registrant has submitted electronically and posted on its corporate Website, if any, every Interactive Data File required to be submitted and posted pursuant to Rule 405 of Regulation S-T (section 232.405 of this chapter) during the preceding 12 months (or for such shorter period that the registrant was required to submit and post such files). Yes ¨ No ¨
Indicate by check mark if disclosure of delinquent filers pursuant to Item 405 of Regulation S-K (§ 229.405 of this chapter) is not contained herein, and will not be contained, to the best of registrant’s knowledge, in definitive proxy or information statements incorporated by reference in Part III of this Form 10-K or any amendment to this Form 10-K. ¨
Indicate by check mark whether the registrant is a large accelerated filer, an accelerated filer, a non-accelerated filer, or a smaller reporting company. See definition of “accelerated filer,” “large accelerated filer” and “smaller reporting company” in Rule 12b-2 of the Exchange Act. (Check one):
| Large accelerated filer x | Accelerated filer ¨ | Non-accelerated filer ¨ (Do not check if a smaller reporting company) |
Smaller reporting company ¨ |
Indicate by check mark whether the registrant is a shell company (as defined by Rule 12b-2 of the Exchange Act). Yes ¨ No x
The aggregate market value of Class A Common Stock (Common Stock) held by non-affiliates of the registrant based upon the closing sale price on the New York Stock Exchange on June 27, 2010 was approximately $51.4 million. Shares held by each executive officer, director and by each person who owns 10 percent or more of the outstanding Common Stock have been excluded in that such persons may be deemed to be affiliates. This determination of affiliate status is not necessarily a conclusive determination for other purposes.
Indicate by check mark whether the registrant has filed all documents and reports required to be filed by Section 12, 13, or 15(d) of the Securities Exchange Act of 1934 subsequent to the distribution of securities under a plan confirmed by a court. Yes x No ¨
The number of shares outstanding of each of the registrant’s classes of common stock as of the close of business on February 17, 2011:
| Class |
Number of Shares | |
| Class A Common Stock, $0.001 par value per share | 62,390,784 | |
| Class B Common Stock, $0.001 par value per share | 1 |
DOCUMENTS INCORPORATED BY REFERENCE
Portions of the Definitive Proxy Statement for the Annual Meeting of Stockholders, which we expect will be held on or about May 6, 2011 (2011 Proxy Statement) are incorporated by reference into Part III hereof.
Table of Contents
FORM 10-K
For The Fiscal Year Ended December 26, 2010
INDEX
2
Table of Contents
PART I
Cautionary Statement Regarding Forward-Looking Statements
This Annual Report on Form 10-K contains forward-looking statements. These statements relate to future events or our future financial performance. Forward-looking statements may include words such as “may,” “will,” “should,” “expect,” “plan,” “intend,” “anticipate,” “believe,” “estimate,” “predict,” “potential,” “continue” or other wording indicating future results or expectations. Forward-looking statements are subject to risks and uncertainties, and actual events or results may differ materially. Factors that could cause our actual results to differ materially include, but are not limited to, those discussed under “Risk Factors” in this report. We also face risks and uncertainties associated with emergence from bankruptcy ; claims not discharged in the bankruptcy proceedings and their effect on our results of operations and profitability; our substantial indebtedness and its impact on our financial health and operations; and the sufficiency of workforce and cost reduction initiatives. Other risks and uncertainties relating to our business include our ability to: succeed with our new business strategy focused primarily on the embedded Flash memory market; maintain or increase our average selling price and lower our average costs; accurately forecast customer demand for our products; attract new customers; obtain additional financing in the future; maintain our distribution relationships and channels in the future; successfully enter new markets and manage our international expansion; successfully compete with existing and new competitors, or with new memory or other technologies; successfully develop new applications and markets for our products; maintain manufacturing efficiency; obtain adequate supplies of satisfactory materials essential to manufacture our products; successfully develop and transition to the latest technologies; negotiate patent and other intellectual property licenses and patent cross-licenses and acquire additional patents; protect our intellectual property and defend against infringement or other intellectual property claims; effectively manage fluctuations in foreign currency exchange rates; maintain our business operations and demand for our products in the event of natural or man-made catastrophic events; and effectively manage, operate and compete in the extraordinarily volatile market conditions effected in part by cautious capital spending by our customers as they face their own business challenges. We undertake no obligation to revise or update any forward-looking statements to reflect any event or circumstance that arises after the date of this report, or to conform such statements to actual results or changes in our expectations.
| ITEM 1. | BUSINESS |
Overview
We are a leading designer, manufacturer and developer of Flash memory semiconductors. We primarily focus on serving the embedded Flash memory market to customers worldwide. Our Flash memory products primarily store data and software code for microprocessors, controllers and other programmable semiconductors which run applications in a broad range of electronics systems. These electronic systems include computing and communications, automotive and industrial, consumer and gaming, wireless and machine-to-machine, or M2M, devices. In addition to Flash memory products, we assist our customers in developing and prototyping their designs by providing software and hardware development tools, drivers and simulation models for system-level integration.
Our Flash memory solutions are incorporated in products from leading original equipment manufacturers, or OEMs. Our products are designed to accommodate various voltage, interface and memory density requirements for a wide range of specific applications and customer platforms. The majority of our new product designs are based on our proprietary two-bit-per-cell MirrorBit technology which has a simpler cell architecture requiring fewer manufacturing steps, supporting higher yields and lower costs as compared to competing floating gate NOR Flash memory technology.
For fiscal 2010, our net sales of the Successor (see Part II, Item 7 “Management’s Discussion and Analysis of Financial Condition and Results of Operations—The Chapter 11 Cases and Emergence—General
3
Table of Contents
Information” for details of Successor and Predecessor) was $764.7 million and our net loss was $96.7 million. For fiscal 2010, the Predecessor had net sales of $403.6 million and net income of $363.6 million.
For fiscal 2009, the Predecessor had net sales of $1.4 billion and a net loss of $514.1 million.
We are headquartered in Sunnyvale, California, with research and development, manufacturing, assembly and sales operations in the United States, Asia, Europe and the Middle East. We own and operate one wafer fabrication facility located in Austin, Texas; three final manufacturing facilities in Bangkok, Thailand and in Kuala Lumpur and Penang, Malaysia. Final manufacturing consists of assembly, test, mark and pack operations. For financial information about geographic areas and for information with respect to our sales, refer to the information set forth in Part II. Item 7. “Management’s Discussion and Analysis of Financial Condition and Results of Operations.”
Our mailing address and executive offices are located at 915 DeGuigne Drive, Sunnyvale, California 94088, and our telephone number is (408) 962-2500. References in this report to “Spansion,” “we,” “us,” “our,” or the “Company” shall mean Spansion Inc. and our consolidated subsidiaries, unless the context indicates otherwise. We are subject to the information and periodic reporting requirements of the Securities Exchange Act of 1934, or Exchange Act, and, in accordance therewith, file periodic reports, proxy statements and other information with the Securities and Exchange Commission, or SEC. Such periodic reports, proxy statements and other information is available for inspection and copying at the SEC’s Public Reference Room at 100 F Street, NE., Washington, DC 20549 or may be obtained by calling the SEC at 1-800-SEC-0330. In addition, the SEC maintains a Web site at http://www.sec.gov that contains reports, proxy statements and other information regarding issuers that file electronically with the SEC. We also post on the Investor Relations page of our Web site, www.spansion.com, a link to our filings with the SEC, our Code of Ethics for our Chief Executive Officer, Chief Financial Officer, Corporate Controller and other Senior Finance Executives, our Code of Business Conduct, which applies to all directors and all our employees, and the charters of our Audit, Compensation, Finance and Nominating and Corporate Governance committees. Our filings with the SEC are posted as soon as reasonably practical after they are filed electronically with the SEC. Please note that information contained on our Web site is not incorporated by reference in, or considered to be a part of, this document. You can also obtain copies of these documents free of charge by writing to us at: Corporate Secretary, Spansion Inc., 915 DeGuigne Drive, Sunnyvale, California 94085, or emailing us at: Corporate.Secretary@spansion.com.
Industry Overview
The proliferation of electronic systems, such as broadband access devices, automotive powertrain control, digital TVs, set-top boxes, printers, digital cameras, gaming machines, mobile phones, wireless and wired infrastructure, industrial control and M2M modules, drives increasing use of Flash memory to support the reliable operation of embedded software code. Electronic systems need to store both operating instructions in the form of software code as well as content or data that needs to be processed. As electronic systems add features to process rich multimedia content and require greater performance, they require increasingly complex software code and therefore more code storage. As a result, software code storage and content storage have become critical components of electronic systems across a variety of industries and applications.
The overall memory market can be divided into “volatile” and “non-volatile” categories. Volatile memory, such as dynamic random access memory, or DRAM, loses its content when the system is powered down while non-volatile memory retains its content even after power is turned off, allowing memory content to be retrieved at a later time. The primary semiconductor component used to store and access software code and digital content today is non-volatile Flash memory.
4
Table of Contents
Overview of Flash Memory
Flash memory is well suited for a variety of applications across a broad range of electronic products, including consumer electronics, networking and telecommunications equipment, mobile phones, PCs, automotive electronics, gaming and industrial equipment.
The Flash memory market consists of two major segments: NOR and NAND Flash memory. Different performance characteristics make NOR and NAND Flash memory suitable for different uses. NOR Flash memory is most often used for reliable code execution and data storage in consumer electronics, automobile and industrial applications and mobile phones. NAND Flash memory is used for data storage in solid-state removable memory applications, such as USB storage devices and data cards. NAND Flash memory is also used in high-end mobile phones, MP3 players, and other embedded applications.
NAND Flash memory is not well-suited for code storage and execution because it has slower read speeds along with lower reliability than NOR. On the other hand, NAND has faster write and erase speeds, and is available at higher densities than NOR with a lower cost per bit at these high densities. These attributes make NAND the preferred technology for data storage in removable storage applications and NOR the preferred technology for program code storage and execution. Further, customers seeking fast read performance and superior reliability have traditionally chosen NOR Flash memory over NAND.
Our Addressable Markets
The Flash memory market can be divided into two major categories based on application: the integrated category, which includes wireless and embedded applications, and the removable storage category, which includes Flash memory cards and USB drives. Within the integrated category, we refer to portable, battery-powered communications applications as “wireless” and all other applications, such as consumer, telecommunications, automotive and industrial electronics, as “embedded.” We have focused historically on the integrated category of the Flash memory market. In early 2009, we narrowed our strategic focus to the embedded portion of the Flash memory market and intend to continue to selectively engage in portions of the wireless market where we believe we can do so advantageously. The embedded Flash memory market is characterized by long design and life cycles, lower capital and technology investments, stable average selling prices, or ASPs, and fragmented competition with multiple suppliers.
In addition to our focus on our traditional embedded NOR Flash memory applications, we plan to expand our presence in growing portions of the embedded Flash memory market, including additional embedded NOR Flash memory applications and embedded NAND Flash memory applications. We believe our proprietary MirrorBit technology, licensing partners, customer relationships and broad product portfolio will enable us to extend our leadership in the attractive embedded Flash memory markets.
Technology
Our current product portfolio offers densities ranging from 1-megabit to 16-gigabits and a broad array of interfaces and features. We own and use fundamental intellectual property in two Flash memory technologies, single-bit-per-cell floating gate and two-bit-per-cell MirrorBit technology. Compared to competing floating gate multilevel cell NOR technology, two-bit-per-cell MirrorBit technology has a simpler cell architecture requiring fewer manufacturing steps and supporting higher yields, resulting in lower manufacturing costs. Our current and new products are based primarily on MirrorBit two-bit-per-cell technology and allow us to offer a broad range of product configurations and capabilities, including high density and high performance. We own fundamental intellectual property in both floating gate and MirrorBit technology.
Floating Gate Technology. Floating gate is the conventional Flash memory cell technology that is utilized by most Flash memory companies today for both NOR and NAND products. We have created innovations in
5
Table of Contents
floating gate technology that have become industry standards, such as negative gate erase, single power supply and embedded programming algorithms, and we continue to hold a strong position in the NOR Flash memory market with our products based on floating gate technology.
MirrorBit Technology. MirrorBit NOR technology is the foundation of our current product roadmap. Also referred to as charge trapping technology, MirrorBit NOR technology stores two distinct charges in a single memory cell, with each charge equivalent to one bit of data thereby doubling the density of each memory cell and enabling higher density, lower cost products.
Markets, Applications & Products
We design, develop and sell Flash memory solutions that are primarily used in the computing and communications, automotive and industrial, consumer and gaming and wireless and M2M end markets. Our products and solutions deliver a combination of high performance and competitive cost for a wide range of customer platforms and applications. The product offerings support various voltages, interfaces and memory densities. We offer 3-volt products to serve embedded applications, 1.8-volt products to serve Wireless applications and 5-volt products primarily for automotive and industrial applications.
GL and AL Families. The GL and AL product families address applications where high reliability coupled with low cost are important, including consumer, gaming, networking and telecommunications. The AL product family offers densities as low as 8-megabits, supports a simpler feature set and provides a standard parallel interface for value-focused applications, such as digital video disk, or DVD, players. The GL product family currently offers densities up to 2-gigabits in production and includes a page-mode interface and Advanced Sector Protection to support high performance consumer applications, such as high-end set top boxes, or STBs, and digital video recorders, or DVRs. MirrorBit technology is utilized for the GL family, while both MirrorBit and floating gate technology are utilized for the AL family.
CD and CL Families. The CD (2.5-volt) and CL (3.0-volt) product families address automotive engine and transmission control applications, which require high reliability, feature rich, high performance and capability to operate across wide temperature ranges. The CD and CL product families combine a high performance burst-mode interface, with Simultaneous Read/Write and Advanced Sector Protection at 16- and 32-megabit densities. Because engine and transmission control units must withstand extreme temperatures, this family operates at up to 150°C and is available in a fully tested die-only solution for incorporation into special customer modules.
FL Family. The FL family utilizes floating gate and MirrorBit technologies with a Serial Peripheral Interface, or SPI, and a low pin count package to provide low cost solutions that currently support densities from 4- to 256-megabits in production. This product line supports the option for single, dual or quad serial input/output, or I/O, thereby providing a lower system-cost, high performance solution for Industrial, Automotive, and Consumer markets.
WS/ NS/ VS Families. The WS/NS/VS product families, which operate with a 1.8-volt supply, are used for a broad range of mobile phones with features such as complex ring tones, enhanced color displays, higher resolution cameras and internal storage for multimedia content including music, videos and pictures. The WS and VS families, which include products based on floating gate and MirrorBit technology, combine a high performance burst-mode 1.8-volt interface, with Simultaneous Read/Write and Advanced Sector Protection features at 64-megabits to 512-megabits densities. These products are usually combined with third-party PSRAM or DRAM die in a single multi-chip packages, or MCP, to meet mobile phone memory needs.
JL and PL Families. The JL and PL product families, with a 3-volt interface, support mobile phone and automotive applications. Based on floating gate and MirrorBit technology, these products offer a page-mode interface, simultaneous Read/Write capability and Advanced Sector Protection at 32-megabit to 128-megabit densities.
6
Table of Contents
AS Family. The AS product family delivers small form-factor and reliable performance for module-based applications such as Bluetooth for consumer and automotive markets. This 1.8 volt product line supports densities from 8- to 16-megabits with a standard parallel interface to optimize value-driven performance.
F Family. The F product family is a 5-volt, legacy offering which primarily supports automotive markets.
Our goal is to streamline and simplify our customers’ design and development cycle by providing consistent and comprehensive tools to support customers’ development process, from initial system bring-up to final product deployment. In addition to Flash memory products, we assist customers in prototyping their designs by providing the necessary software and hardware development tools, drivers and simulation models for seamless system-level integration.
Sales and Marketing
We market and sell our products worldwide under the Spansion trademark. Since the beginning of the second quarter of fiscal 2006, we have sold our products to our customers directly or through distributors. We rely on Fujitsu to act as our largest distributor in Japan and our nonexclusive distributor throughout the rest of the world, other than Europe and the Americas, with limited exceptions.
We market our products through a variety of direct and indirect channels. We have direct relationships with many of our top customers worldwide. We supplement this effort with programs designed to support design-in of our products on reference designs from third parties, which are typically used by our Flash memory customers when choosing Flash memory solutions. In addition, we focus a portion of our marketing efforts on providers of complementary semiconductor products such as chipsets to ensure our products interoperate effectively with the most widely used components in various embedded applications.
Our marketing activities target customers, reference design houses and our potential partners include a combination of direct marketing activities such as trade shows, events and marketing collateral and indirect activities such as public relations and other marketing communications activities.
Customers
We serve our customers worldwide directly or through our distributors which buy products from us and resell them to OEMs and original design manufacturer, or ODMs, either directly or through their own distributors. Customers for our products consist of OEMs, ODMs and contract manufacturers.
After the deconsolidation of Spansion Japan as discussed in Part II, Item 7 “Management’s Discussion and Analysis of Financial Condition and Results of Operations—The Chapter 11 Cases—Business Relationship with Spansion Japan and Foundry Agreement,” in fiscal 2009, sales to Spansion Japan accounted for approximately 21 percent of our total net sales. Net sales to Spansion Japan were $84.0 million or 7 percent of our total net sales, in fiscal 2010. Spansion Japan resold substantially all its purchases to Fujitsu who in turn acted as a distributor of our products in Japan. No OEM, ODM or contract manufacturer accounted for more than ten percent of our net sales for fiscal 2010. During the second quarter of fiscal 2010, we purchased Spansion Japan’s distribution business and began distributing our products in Japan through our wholly owned subsidiary, Nihon Spansion Limited to Fujitsu. Net sales to Fujitsu (in its capacity as a distributor), including sales made through Spansion Japan after its deconsolidation and Nihon Spansion Limited, accounted for approximately 23 percent of our total net sales in the Successor for fiscal 2010 and 18 percent of our total net sales in the Predecessor for fiscal 2010.
Original Equipment Manufacturers
OEMs consist primarily of foreign and domestic manufacturers of mobile phones, consumer electronics, automotive electronics and networking equipment companies, selected regional accounts and customers in other target applications.
7
Table of Contents
Third-Party Distributors
Our third-party distributors typically resell to OEMs, ODMs and contract manufacturers. Sales through our direct distributors are typically made pursuant to agreements that provide return rights for discontinued products or for products that are not more than twelve months older than their manufacturing date code. In addition, some of our agreements with distributors may contain standard stock rotation provisions permitting limited levels of product returns.
We generally warrant that products sold to our customers and our distributors will, at the time of shipment, be free from defects in workmanship and materials and conform to our approved specifications. Subject to specific exceptions, we offer a one-year limited warranty.
Research and Development
Research and development is critical to our success and is focused on process, product and system level development. We conduct our product and system engineering activities primarily in Sunnyvale, California and Netanya, Israel, with additional design and development engineering teams located in Europe and Asia. Our primary development focus is on MirrorBit products for embedded applications. We conduct our process and product development primarily in Sunnyvale, California, at our fabrication facility located in Austin, Texas (Fab 25) and at third party foundries that provide foundry services to us. We are developing non-volatile memory process technologies. Specifically, we continue to refine our 65-nanometer NOR process technology, intending to deploy 45-nanometer NOR process technology, and, through our joint development agreement with Elpida, continue to develop 43-nanometer charge trapping NAND process technology. We also intend to develop more advanced technologies independently or with partners. In April 2009, we stopped further production of development wafers at our research and development manufacturing facility known as the Submicron Development Center, or SDC, in Sunnyvale, California, as part of our strategy to reduce research and development costs by utilizing Fab 25 and third party facilities for technology development.
Our research and development expenses for fiscal 2010, fiscal 2009 and fiscal 2008 were $100.5 million, $136.4 million and $431.8 million, respectively. For more information, see Part II, Item 7 “Management’s Discussion and Analysis of Financial Condition and Results of Operations.”
Manufacturing
We own and operate one wafer fabrication facility, Fab 25, which is located in Austin, Texas and has approximately 114,000 square feet of clean room space. This facility produces 200-millimeter wafers, manufactured using 130-nanometer, 110-nanometer, 90-nanometer and 65-nanometer process technology. We also own three final manufacturing facilities in Bangkok, Thailand and in Kuala Lumpur and Penang, Malaysia. Final manufacturing may consist of assembly, test, mark and pack operations. We use a number of third party companies to provide supplemental final manufacturing services for us.
Like most semiconductor companies, we direct significant efforts toward the invention and development of manufacturing process technologies that achieve one or more of the following objectives: reduction of our manufacturing costs, improvement of our device performance and/or addition of product features and capabilities. We achieve these goals primarily through a combination of optimizing the number of process steps required to produce a product, and by reducing the scale or size of key structures in our integrated circuits such as the memory cells used to store charge and the surrounding circuits that manage and interface to these cells. We develop each process technology using particular design rules and refer to this as the process or technology node using nanometers as a measurement of length of certain critical structures in the process. By shrinking the features, we enable more cells in the same area, which allows us to incorporate more bits per wafer at each successive process node, decreasing material cost per bit and either increasing the number of die per wafer for a given density or increasing the density.
8
Table of Contents
During fiscal 2010, we offered products manufactured on technology nodes from 320-nanometer to 65-nanometer, utilizing MirrorBit and floating gate cell technology. We continue to manufacture products based on floating gate technology at process nodes from 320-nanometer to 110-nanometer. However, during fiscal 2010, the majority of our wafer production was comprised of MirrorBit products using 110- and 90-nanometer process technology. We also manufactured MirrorBit ORNAND products and MirrorBit NOR products on 65-nanometer process technology.
We outsource a significant portion of our manufacturing function to external foundry partners. To augment our internal wafer fabrication capacity, we have foundry agreements with Semiconductor Manufacturing International Corporation, or SMIC, Fujitsu Limited, Elpida Memory, Inc., or Elpida, and Texas Instruments Ltd. The arrangement with SMIC provides support for advanced technology products at 65-nanometer. The arrangement with Elpida provides for the development of charge trapping NAND products manufactured using 43-nanometer process technology. Also, the deployment of leading edge technology in support of foundry manufacturing provides a more cost efficient solution for future research and development wafer production as an alternative to an in house dedicated research and development manufacturing facility for wafer production. The arrangement with Fujitsu Limited, using our former JV1 and JV2 wafer fabrication facilities which we sold to them in April 2007, provides us with the ability to efficiently support the declining customer demand for legacy products on legacy production process nodes. We also obtain foundry services, including wafer and sort services, from Texas Instruments. In September 2009, we sold to Powertech Technology Inc. (PTI) our final manufacturing facility located in Suzhou, China, and certain related equipment. Following the sale, PTI began providing final manufacturing services to us at the Suzhou facility, further representing our shift to an outsourced manufacturing model. We may in the future change the location where our products are manufactured to reflect changes in customer demand. We have in the past, and may in the future, obtain foundry, subcontractor and other arrangements with third parties to meet demand.
Our manufacturing processes require many raw materials, such as silicon wafers, mold compound, substrates and various chemicals and gases, and the necessary equipment for manufacturing. We obtain these materials and equipment from a large number of suppliers located throughout the world.
Environmental Matters
Many of our facilities are located on properties or in areas with a long history of industrial activity. Prior to 2003, environmental audits were conducted for each of our manufacturing facilities. The audits described various conditions customary of facilities in our industry and, in particular, noted historical soil and groundwater contamination at our Sunnyvale, California facility arising from the leakage from chlorinated solvent storage tanks that previously had been located on this property. This property is listed on the U.S. Environmental Protection Agency’s Superfund National Priorities List. AMD, the former owner of the property and responsible party, is investigating and remediating this contamination.
In 2003, each of AMD and Fujitsu agreed to indemnify us against losses arising out of the presence or release, prior to June 30, 2003, of hazardous substances at or from these and other sites they each contributed to us. Conversely, our subsidiary agreed to indemnify each of AMD and Fujitsu from and against liabilities arising out of events or circumstances occurring after June 30, 2003, in connection with the operation of our business. AMD and Fujitsu, on the one hand, and we, on the other, agreed to indemnify the other against liability arising from permit violations attributable to our respective activities. To the extent AMD and Fujitsu cannot meet their obligations under any of their indemnity agreements, or material environmental conditions arise, we may be required to incur costs to address these matters, which could have a material adverse effect on us.
We have made and will continue to make capital and other expenditures to comply with environmental laws, but we do not expect compliance with environmental requirements to result in material expenditures in the foreseeable future. Environmental laws and regulations are complex, change frequently and have tended to
9
Table of Contents
become more stringent over time—factors that could alter the current outlook. See “Risk Factors—We are subject to a variety of environmental laws that could result in liabilities.”
Competition
Our principal NOR Flash memory competitors are Micron Technology, Inc., Macronix International Co., Ltd., Winbond Electronics Corp. and Samsung Electronics Co., Ltd. Additional NOR Flash memory competitors include Microchip Technology Inc., EON Silicon Solution Inc., Atmel Corporation and Toshiba Corporation.
We increasingly compete with NAND Flash memory manufacturers where NAND Flash memory has the ability to replace NOR Flash memory in customer applications. Our principal NAND Flash memory competitors include Samsung Electronics Co., Ltd. and Micron Technology, Inc.
We believe Flash memory providers must also possess the following attributes to remain competitive:
| • | strong relationships with OEMs, ODMs and contract manufacturers that are acknowledged leaders within their respective industries; |
| • | discipline to continually reduce costs ahead of historically declining semiconductor market prices; |
| • | strong market focus to identify emerging Flash memory applications; |
| • | advanced research and development; |
| • | flexibility in manufacturing capacity and utilization so as to take advantage of industry conditions through market cycles; |
| • | access to the financial resources needed to maintain a highly competitive technological position; |
| • | focus on sustainable and profitable portions of the Flash memory market; |
| • | the ability to establish and sustain strategic relationships and alliances with key industry participants; |
| • | the ability to manufacture products with a high degree of market acceptance and a low cost structure; and |
| • | rapid time to market for new products, measured by the time elapsed from first conception of a new product to its commercialization. |
Employees
We had approximately 3,400 employees at December 26, 2010.
Backlog
We generally manufacture and market standard lines of products. Sales are made primarily pursuant to purchase orders for current delivery or agreements covering purchases over a period of time. These orders or agreements may be revised or canceled without penalty. Generally, in light of current industry practice and experience, we do not believe that backlog information is necessarily indicative of actual sales for any succeeding period.
Intellectual Property
Our success depends in part on our proprietary technology. While we attempt to protect our proprietary technology through patents, copyrights and trade secrets, we believe that our success will depend upon technological expertise, continued development of new products, and successful cost reductions achievable by improving process technologies. In addition, we have access to intellectual property through certain cross-license
10
Table of Contents
arrangements with AMD and Fujitsu. There can be no assurance that we will be able to protect our technology or that competitors will not be able to develop similar technology independently. We currently have a number of United States and foreign patents and patent applications. There can be no assurance that the claims allowed on any patents we hold will be sufficiently broad to protect our technology, or that any patents will issue from any application pending or filed by us. In addition, there can be no assurance that any patents issued to us will not be challenged, invalidated or circumvented or that the rights granted thereunder will provide competitive advantages to us.
Rights to Intellectual Property
We rely on a combination of protections provided by contracts, including confidentiality and non-disclosure agreements, copyrights, patents, trademarks and common law rights, such as trade secrets, to protect our intellectual property. Our U.S. patents are potentially valid and enforceable for either 17 years from the date they were issued or 20 years from the date they were filed. Accordingly, some of our existing patents will only survive for a few more years while others will survive for approximately another 15 years. We do not believe that the expiration of any specific patent will have a material adverse effect on us. In addition, the duration of our valid and enforceable trademarks is indefinite.
AMD and Fujitsu have each contributed to us various intellectual property rights pursuant to an Amended and Restated Intellectual Property Contribution and Ancillary Matters Agreement. Under this agreement, we became owners, or joint owners with each of Fujitsu and AMD, of certain patents, patent applications, trademarks, and other intellectual property rights and technology. AMD and Fujitsu reserved rights, on a royalty-free basis, to practice the contributed patents and to license these patents to their affiliates and successors-in-interest to their semiconductor groups. AMD and Fujitsu each have the right to use the jointly-owned intellectual property for their own internal purposes and to license such intellectual property to others to the extent consistent with their non-competition obligations to us. In addition, we have granted a non-exclusive, perpetual, irrevocable, fully paid and royalty-free license of our rights in that technology to each of AMD and Fujitsu.
We have entered into separate patent cross-license agreements with each of AMD and Fujitsu in which we granted to AMD or Fujitsu, as applicable, and AMD or Fujitsu, as applicable, each granted to us, non-exclusive licenses under certain patents and patent applications of their semiconductor groups to make, have made, use, sell, offer to sell, lease, import and otherwise dispose of specific semiconductor-related products anywhere in the world. The patents and patent applications that are licensed are those with an effective filing date prior to the termination of our patent cross-license agreements. Each agreement will automatically terminate on the later of June 30, 2013 or the date AMD’s or Fujitsu’s, whichever is the other party to the agreement, ownership interest in us is transferred or disposed of in its entirety. Each agreement may be terminated by a party on a change in control of the other party or its semiconductor group. The licenses to patents under license at the time of the termination will survive until the last such patent expires.
Under each agreement, in cases where there is a change of control of us or the other party (AMD or Fujitsu, or each of their semiconductor groups, as applicable), the other party shall have the right to terminate the agreement (or to invoke the provisions described in this paragraph if the agreement had been previously terminated) by giving 30 days written notice within 90 days after receiving notice of the change of control. If so terminated, the rights, licenses and immunities granted under the agreement will continue solely with respect to those licensed patents that are entitled to an effective filing date that is on or before, and are licensed as of, the date of such change of control, and will continue until the expiration of the last to expire of such licensed patents. Moreover, with respect to circuit patents, which are patents (other than process patents) covering elements relating to electrical signals to achieve a particular function, the rights, licenses and immunities granted to the party undergoing the change of control are limited solely to:
| i. | each existing and pending product of such party as of the date of change of control; |
11
Table of Contents
| ii. | each existing and pending product of the acquiring third party of such party as of the date of change of control that would have been in direct competition with products described in (i) above; and |
| iii. | successor products described in (i) and (ii) above provided such successor product is based substantially on the same technology. |
Beginning in November 2008, we no longer incurred royalties associated with licenses that survive the termination of the cross-license agreement. In fiscal 2008, we incurred royalty expenses of approximately $3 million to each of AMD and Fujitsu under their respective patent cross-license agreements.
We may be subject to claims that we are infringing intellectual property rights of third parties through the manufacture and sale of our products and the operation of our business. Therefore, absent negotiating our own license agreements with the third parties who own such intellectual property, we will be vulnerable to claims by such parties that our products or operations infringe such parties’ patents or other intellectual property rights.
We will continue to attempt to negotiate our own agreements and arrangements with third parties for intellectual property and technology that is important to our business. We will also attempt to acquire new patents as our success in negotiating patent cross-license agreements with other industry participants will depend in large part upon the strength of our patent portfolio relative to that of the third party with which we are negotiating.
Patents and Patent Applications
As of December 26, 2010, we had 1,696 U.S. patents and 873 foreign patents as well as 502 patent applications pending in the United States and 840 patent applications pending outside the United States. We expect to file future patent applications in both the United States and abroad on significant inventions, as we deem appropriate. In addition, under our cross-license agreement with AMD, AMD granted us the right to use a substantial number of patents that AMD owns. Similarly, under our cross-license agreement with Fujitsu, Fujitsu also granted us the right to use a substantial number of patents that Fujitsu owns. There can be no assurance that the claims allowed on any patents we hold will be sufficiently broad to protect our technology, or that any patents will issue from any application pending or filed by us.
| ITEM 1A. | RISK FACTORS |
You should carefully consider the risks described below and the other information in this Annual Report on Form 10-K. If any of the following risks materialize, our business could be materially harmed, and our financial condition and results of operations could be materially and adversely affected.
The risks described below are not the only ones facing us. Additional risks not currently known to us or that we currently believe are immaterial may also impair our business, results of operations, financial condition and liquidity.
We have recently transformed our business through the implementation of a new business strategy. If this strategy is unsuccessful, we will be materially adversely affected.
Shortly after our chapter 11 bankruptcy proceedings (the Chapter 11 Cases) commenced, we began implementing a new business strategy focused primarily on exiting a large portion of the wireless Flash memory market in order to reduce significantly our engineering expenses. We remain dedicated to, and focused on, the embedded portion of the Flash memory market and intend to continue to selectively engage in portions of the wireless market where we believe we can do so advantageously. The embedded market is more mature than the wireless market and is expected to grow more slowly than some other sectors of the semiconductor industry. In addition, the embedded market historically has been, and we anticipate that it will continue to be, subject to
12
Table of Contents
selling price reductions. If we are unable to successfully address these challenges and execute this new business strategy, our business will be materially adversely affected.
In addressing these challenges, our new business strategy has involved, and will continue to involve, cost containment, in particular with respect to our workforce and we will continue to make judgments as to whether we should further reduce, relocate or otherwise change our workforce. Costs incurred in connection with such workforce changes, should they occur, may be higher than estimated. In addition, such workforce changes may impair our ability to achieve our current or future business objectives. In addition, any workforce changes may not be effected on the planned timetable and may result in the recording of additional charges. Similarly, any decision by us to further limit investment in, or exit or dispose of parts of, our business may result in the recording of additional charges. As part of our review of our restructured business, we look at the recoverability of tangible and intangible assets. Future market conditions may indicate these assets are not recoverable based on changes in forecasts of future business performance and the estimated useful life of these assets, and this may trigger further write-downs of these assets which may have a material adverse effect on our business, results of operations and financial condition.
Our new business strategy may also include considering strategic transactions, such as acquisitions, divestitures, joint ventures, alliances or co-production programs, as such opportunities arise. We may not be able to effect any strategic transaction or if we enter into transactions, we may not realize the benefits we anticipate. Moreover, in the case of acquisitions, the integration of separate companies involves a number of integration risks. Consummating any acquisitions, divestitures, joint ventures, alliances or co-production programs could result in the incurrence of additional transaction-related expenses, as well as unforeseen contingent liabilities, which could materially adversely affect us.
Our business has been characterized by selling prices that decline over time, which can negatively affect our results of operations.
Historically, the selling prices of our products have decreased during the products’ lives, and we expect this trend to continue. When our selling prices decline, our net sales and gross margins also decline unless we are able to compensate by selling more units and thereby reducing our manufacturing costs per unit or by introducing and selling new, higher margin products with higher densities and/or advanced features. If the selling prices for our products continue to decline, our operating results could be materially adversely affected.
During downturns, periods of extremely intense competition, or the presence of oversupply in the industry, the selling prices for our products have declined at a rapid rate over relatively short time periods as compared to historical rates of decline. We are unable to predict selling prices for any future periods and may experience unanticipated, sharp declines in selling prices for our products. When such pricing declines occur, we may not be able to mitigate the effects by selling more or higher margin units, or by reducing our manufacturing costs. In such circumstances, our operating results could be materially adversely affected.
The Flash memory market is highly cyclical and has experienced severe downturns that have materially adversely affected, and may in the future materially adversely affect, our business.
The Flash memory market is highly cyclical and in the past has experienced severe downturns, generally as a result of wide fluctuations in supply and demand, constant and rapid technological change, continuous new product introductions and price erosion. Our financial performance has been, and may in the future be, adversely affected by these downturns. We have incurred substantial losses in past downturns, including the most recent downturn, due principally to:
| • | substantial declines in selling prices, particularly due to competitive pressures and an imbalance in product supply and demand; and |
| • | a decline in demand for end-user products that incorporate our products. |
13
Table of Contents
Our historical financial information is not necessarily indicative of what our results of operations, financial condition or cash flows will be in the future. If our net sales decline in the future, or if these or other similar conditions continue or occur again in the future, we would likely be materially adversely affected.
If demand for consumer products, industrial products or mobile phones utilizing Flash memory declines, as we experienced during the worldwide global recession, our business could be materially adversely affected. Also, if the functionality of successive generations of such products does not require increasing Flash memory density or if such products no longer require the type of Flash memory product we produce due to alternative technologies or otherwise, our operating results would be materially adversely affected.
We cannot be certain that the Chapter 11 Cases will not adversely affect our operations going forward.
Although we emerged from the Chapter 11 Cases on May 10, 2010, we cannot provide assurance that our prior bankruptcy will not adversely affect our future operations. Our suppliers and vendors could stop providing supplies or services to us or provide such supplies or services only on unfavorable terms such as “cash on delivery,” “cash on order” or other terms that could have an adverse impact on our short-term cash flows. In addition, the fact that we recently emerged from the Chapter 11 Cases may adversely affect our ability to retain existing customers, attract new customers and maintain contracts that are critical to our operations.
We lost a significant amount of market share while in bankruptcy as certain customers were unwilling to work with a vendor in bankruptcy and others reduced their dependence on us by shifting their business to other vendors. There can be no assurance as to whether we will be able, or how long it may take, to regain or retain all or any portion of that lost market share.
If we are unable to attract and retain qualified personnel at reasonable costs, we may not be able to achieve our business objectives.
We are dependent on the experience and industry knowledge of our senior management and other key employees to execute our current business plans and lead us through the implementation of the Plan of Reorganization. Competition for certain key positions and specialized technical and sales personnel in the high-technology industry remains strong. The Chapter 11 Cases, along with workforce reductions, created uncertainty that led to an increase in unwanted attrition and additional challenges in attracting and retaining new qualified personnel. We have lost many key employees with long tenures and broad knowledge about our technology and historical operations and we are at risk of losing or being unable to hire talent critical to a successful reorganization and ongoing operation of our business. If we are not able to attract, recruit or retain qualified employees (including as a result of headcount or salary reductions), we may not have the personnel necessary to successfully implement the Plan of Reorganization that was approved by the U.S. Bankruptcy Court on April 16, 2010 in connection with our emergence from the Chapter 11 Cases (the Plan). We also may not be able to successfully implement our new business strategy. If this occurs our business, results of operations and financial condition could be materially adversely impacted.
We may not satisfy the covenants, financial tests and ratios in our debt instruments, which if not met, would have a material adverse effect on us.
Our credit agreement, or Senior Secured Term Loan, our loan and security agreement, or Revolving Credit Facility, and the indenture governing our 7.875 percent Unsecured Senior Notes due 2017 require us to comply with covenants, financial tests and ratios. We cannot assure you that we will be able to satisfy or comply with these covenants, financial tests and ratios, as our ability to do so may be affected by events beyond our control. If we fail to satisfy or comply with such covenants, financial tests and ratios, or if we disagree with our lenders about whether or not we are in compliance, we cannot assure you that we will be able to obtain waivers or amendments if required to avoid a default. A breach of any of the provisions, covenants, financial tests or ratios under our debt instruments could prevent us from borrowing under our Revolving Credit Facility and result in an
14
Table of Contents
event of default under the applicable agreement, which in turn could trigger cross-defaults under other debt instruments, any of which would materially adversely affect us.
Transfers or issuances of our equity, or a debt restructuring, may impair or reduce our ability to utilize our net operating loss carry-forwards and certain other tax attributes in the future.
Pursuant to U.S. tax rules, a corporation is generally permitted to deduct from taxable income in any year net operating losses (NOLs) carried forward from prior years. We have NOL carry forwards in the United States of approximately $870.0 million as of December 26, 2010. Our ability to utilize these NOL carry forwards could be subject to a significant limitation if we were to undergo an “ownership change” for purposes of Section 382 of the Internal Revenue Code of 1986, as amended.
Our reliance on third-party manufacturers entails risks that could materially adversely affect us.
We have in the past and plan in the future to enter into foundry, subcontractor and other arrangements with third parties to meet demand for our products. Third-party manufacturers we have used in the past or expect to use in the future for foundry and other manufacturing services include Texas Instruments, or TI, Fujitsu Semiconductors Limited, or FSL, Elpida Memory, Inc., or Elpida, and Semiconductor Manufacturing International Corporation, or SMIC. We also use independent contractors to perform some of the assembly, testing and packaging of our products, including ChipMOS Technologies Limited. We depend on these manufacturers to allocate to us a portion of their manufacturing capacity sufficient to meet our needs. Third-party manufacturers are generally under no obligation to provide us with any specified minimum quantity of product. We also depend on these manufacturers to produce products of acceptable quality and at acceptable manufacturing yields and to deliver those products to us on a timely basis at acceptable prices. In addition, we rely on these manufacturers to invest capital into their facilities and process technologies to meet our needs for new products using advanced process technologies. Given our recent emergence from the Chapter 11 Cases and the volatility and disruption in the capital and credit markets worldwide, we cannot assure you that they will make the investments in their facilities previously contemplated. We cannot assure you that these manufacturers will be able to meet our near-term or long-term manufacturing requirements and may not be able to attain qualification from our customers, which may be required prior to production of products at a third party facility. In addition, any significant change in the payment terms we have with these manufacturers could adversely affect us.
In the past, Spansion Japan Limited, a former wholly-owned subsidiary of Spansion LLC, or Spansion Japan, facilitated distribution of our products in Japan, manufactured and supplied sorted and unsorted silicon wafers for us, and provided sort services to us. In August 2010, we entered into a new foundry agreement with TI as a result of TI’s purchase of two wafer fabrication facilities and equipment from Spansion Japan. Accordingly, we rely on TI to manufacture wafers for and supply sort services to us. A sudden and unanticipated reduction or cessation of the supply of goods and services from TI would likely be disruptive and have a material adverse impact on our results of operations.
Third party manufacturers with whom we contract also make products for other companies, including certain of our competitors, and/or for themselves and could choose to prioritize capacity for themselves or other customers beyond any minimum guaranteed amounts, reduce deliveries to us or, in the absence of price guarantees, increase the prices they charge us on short notice, such that we may not be able to pass cost increases on to our customers. The likelihood of this occurring may be greater as a result of the Chapter 11 Cases. We may be unable to secure an alternative supply for specific products in a short timeframe or at all at an acceptable cost to satisfy our production requirements. In addition, we may be required to incur additional development, manufacturing and other costs to establish alternative sources of supply. Other risks associated with our increased dependence on third-party manufacturers include: their ability to adapt to our proprietary technology, reduced control over delivery schedules, quality assurance, manufacturing yields and cost, misappropriation of our intellectual property, reduced ability to manage inventory and parts and risks associated with operating in foreign
15
Table of Contents
countries. If we are unable to secure sufficient or reliable suppliers of wafers or obtain the necessary assembly, testing and packaging services, our ability to meet customer demand for our products may be adversely affected, which could have a material adverse effect on us.
We rely on Fujitsu Semiconductors Limited to distribute our products in Japan.
We currently rely on FSL through its subsidiary, Fujitsu Electronics Inc., to distribute our products to customers in Japan, which is an important geographic market for us. Under our distribution agreement with FSL, FSL has agreed to use its best efforts to promote the sale of our products in Japan and to other customers served by FSL. In the event that we reasonably determine that FSL’s sales performance in Japan and to those customers served by FSL is not satisfactory based on specified criteria, then we have the right to require FSL to propose and implement an agreed-upon corrective action plan. If we reasonably believe that the corrective action plan is inadequate, we can take steps to remedy deficiencies ourselves through means that include appointing another distributor as a supplementary distributor to sell products in Japan and to customers served by FSL. Pursuing these actions would be costly and disruptive to the sales of our products in Japan. If FSL’s sales performance in Japan is unsatisfactory or if we are unable to successfully maintain our distribution agreement and relationship with FSL and we cannot timely find a suitable supplementary distributor, we could be materially adversely affected.
Under the terms of our distribution agreement with FSL, either party may terminate the distribution agreement, for convenience upon 60 days written notice to the other party. If FSL unexpectedly terminates its distribution agreement with us, or otherwise ceases its support of our customers in Japan, we would be required to develop and rely on a relationship with another distributor or establish our own local sales organization and support functions. We cannot be certain that we would be successful in selling our products to customers currently served by FSL or new customers. If customers currently served by FSL, or potential new customers, refused to purchase our products directly from us or from another distributor, or either it or we are not successful in distributing our products, our sales in Japan might decline, and we could be materially adversely affected.
Inaccurate forecasting of customer demand could materially and adversely affect our business, results of operations and financial results and may lead to excess inventory and poor gross margins.
Although our manufacturing cycle times are relatively long, often in excess of ten weeks, we nevertheless compete in a market where suppliers’ ability to respond quickly to new orders is a competitive differentiator. Thus, we must forecast customer demand and produce sufficient amounts of our products in order to fill current and future orders even though demand is volatile and difficult to predict.
To forecast demand and value inventory, we consider, among other factors, the inventory on hand, historical customer demand data, backlog data, competitiveness of product offerings, market conditions and product life cycles. If we are unable to accurately assess these factors and anticipate future demand or market conditions, inventory write-downs may be required and would be reflected in cost of sales in the period the write-down is made. Similarly, when customers change orders booked with us, our planned manufacturing capacity may be greater or less than actual demand, resulting in less than optimal capacity usage. When this occurs, we adjust our production levels but such adjustments may not prevent our production of excess inventory. An inability to address challenges like the ones described above would have a negative impact on our gross margin in that period. Moreover, inaccurate forecasting could also result in excess or obsolete inventory that would reduce our margins or shortages in inventory that would cause us to fail to meet customer demand. If we are unable to produce the types and quantities of products required by our customers in the timeframes and on the delivery schedules required by our customers, we may lose customers or, in certain circumstances, be liable for losses incurred by our customers, which would materially adversely affect our business and financial results.
Industry overcapacity could require us to take actions which could have a material adverse effect on us.
Semiconductor companies with their own manufacturing facilities and specialist semiconductor foundries, which are subcontractors that manufacture semiconductors designed by others, have added significant capacity in
16
Table of Contents
recent years and during the first half of 2010 a number of companies announced plans to do so again. In 2008, the significant excess capacity led to oversupply and a downturn in the memory industry. The contraction of the worldwide economy, further compounded industry overcapacity. Fluctuations in the growth rate of industry capacity relative to the growth rate in demand for Flash memory products can contribute to cyclicality in the Flash memory market, which has in the past and may in the future negatively impact our selling prices and materially adversely affect us.
It is difficult to predict future growth or decline in the markets we serve, making it very difficult to estimate requirements for production capacity. If our target markets do not grow as we anticipate, we may under-utilize our manufacturing capacity or we may be contractually obligated to purchase minimum quantities of certain products from our subcontractors. This may result in write-downs or write-offs of inventories and losses on products the demand for which is lower than we anticipate. In addition, during periods of industry overcapacity, customers do not generally order products as far in advance of the scheduled shipment date as they do during periods when our industry is operating closer to capacity, which can exacerbate the difficulty in forecasting capacity requirements and may result in increased inventory levels.
Many of our costs are fixed. Additionally, pursuant to some of our subcontractor and foundry arrangements with third parties we may incur and pay penalties as a result of our agreements to pay for a certain amount of product even if we do not accept delivery of all of such amount. Accordingly, during periods in which we under-utilize our manufacturing capacity as a result of reduced demand for some of our products, our costs cannot be reduced in proportion to the reduced net sales for such periods. When this occurs, our operating results may be materially adversely affected.
A further significant shift in the Flash memory market to NAND architecture would materially adversely affect us.
Flash memory products are generally based on either NOR or NAND architecture. To date, our Flash memory products have been based on NOR architecture which are typically produced at a higher cost-per-bit than NAND-based products. We are developing our NAND architecture based on charge trapping technology primarily to address embedded applications currently served by NAND-based products or potentially served by NAND-based products in the future, but we cannot be certain that our NAND products will satisfactorily address those market needs.
Since 2004, industry sales of NAND-based Flash memory products increased as a percentage of total Flash memory sales compared to sales of NOR-based Flash memory products, resulting in NAND vendors in aggregate gaining a greater share of the overall Flash memory market and NOR vendors in aggregate losing overall market share. We expect the Flash memory market trend of decreasing market share for NOR-based Flash memory products relative to NAND-based Flash memory products to continue for the foreseeable future.
Customers manufacturing products for embedded applications may increasingly choose floating gate NAND-based Flash memory products over our NOR or NAND Flash memory products based on our charge trapping technology. If this occurs, our sales may be materially adversely affected. Moreover, some of our competitors are able to manufacture floating gate NAND-based Flash memory products on 300-millimeter wafers produced at a lower cost than we can currently achieve. In addition, some of our competitors may choose to utilize more advanced manufacturing process technologies than we may have available in order to offer competitive products at lower costs or with higher densities.
In addition, even if products based on NAND architecture are unsuccessful in displacing products based on NOR architecture, the average selling price for our products may be adversely affected by a significant decline in the price for NAND-based Flash memory products. Such a decline may result in downward price pressure in the overall Flash memory market affecting the price we can obtain for our NOR-based Flash memory products, which would adversely affect us. We believe such downward pricing pressure was a factor in the significant
17
Table of Contents
declines in the selling prices of our products in 2008. If the prices for NAND Flash memory products similarly decline in the future, we may be materially adversely affected.
If we fail to successfully identify new applications and markets for our products, our future operating results would be materially adversely affected.
We are identifying new applications and opportunities for our products beyond our traditional customer base and in some cases plan to deploy our Flash memory solutions beyond current Flash memory markets. However, some of these opportunities require that we succeed in creating, marketing, gaining customer acceptance of, and deploying these new system architectures into, a customer base where we do not have historic business relationships and where our solution is required to replace established and proven solutions. In some cases our solutions rely on third parties to contribute a significant and necessary component of the solution without which the solution will not be viable. If we are unsuccessful in our attempts to bring new products to market due to our failures or those of third parties, experience significant delays in generating sales, fail to establish their value or face competition from third parties or incumbent suppliers that result in lower margins than expected, our future operating results would be materially adversely affected.
We cannot be certain that we will have sufficient resources to invest in the level of research and development required to remain competitive or that our substantial research and development investments will lead to timely improvements in technology needed to successfully develop, introduce and commercialize new products and technologies.
The Flash memory industry is highly competitive and subject to rapid technological change. In order to compete, we are required to make substantial investments in research and development for product design, process technologies and production techniques in an effort to design and manufacture advanced Flash memory products. For example, in connection with our new business strategy, our research and development expenses for fiscal 2009 and 2010 were $136.4 million and $100.5 million, or approximately 10 percent and 9 percent of our total net sales, respectively. We cannot assure you that we will have sufficient resources independently or through joint development agreements to maintain the level of investment in research and development that is required for us to remain competitive, which could materially adversely affect us.
As part of our reorganization, our strategy has changed to increasingly seek to share research and development costs with third parties. For example, in 2009, we entered into a joint development agreement with Elpida for the development of products based on NAND architecture. However we cannot assure you that we will be able to negotiate such arrangements for more of our research and development needs, or that such arrangements will result in commercially successful technology and products in a timely manner or at all. We will be dependent on the third parties in such agreements to continue to invest financial and skilled human resources, and we cannot assure you that such third parties will make the necessary investments, the absence of which would materially adversely affect our business.
Our success depends to a significant extent on our ability to develop, qualify, produce, introduce and gain market acceptance of new product designs and improvements that provide value to Flash memory customers. Our ability to develop and qualify new products and related technologies to meet evolving industry requirements at prices acceptable to our customers and on a timely basis is critical to our competitiveness in our target markets. If we are delayed in developing or qualifying new products or technologies, we could be materially adversely affected.
Competitors may introduce new memory or other technologies that may make our Flash memory products uncompetitive or obsolete.
Our competitors are working on a number of new competitive technologies, including ferroelectric random access memory, or FRAM, magneto resistive random access memory, or MRAM, polymer, charge trapping and
18
Table of Contents
phase-change based memory, or PCM, technologies. If such products are successfully developed and commercialized as a viable alternative to MirrorBit or floating gate Flash memory, these other products could pose a competitive threat to existing Flash memory companies, including us. In addition, some of the licensees and customers of Saifun Semiconductors Ltd., or Saifun, which we purchased in 2008 and renamed Spansion Israel Ltd., are our competitors or work with our competitors and possess licenses from Spansion Israel Ltd. for intellectual property associated with charge trapping Flash memory technology. Use of this charge trapping intellectual property or use of independently developed charge trapping Flash memory technology by our competitors, if successfully developed and commercialized, may allow these competitors to develop Flash memory products that may compete with our products based on charge trapping technology. If we are unable to compete with these new technologies, we may be materially adversely affected.
Intense competition in the Flash memory market could materially adversely affect us.
Our principal NOR Flash memory competitors are Micron Technology, Inc., or Micron, Macronix International Co., Ltd., or Macronix, Winbond Electronics Corp. and Samsung Electronics Co., Ltd., or Samsung. Additional NOR Flash memory competitors include Microchip Technology Inc., EON Silicon Solution Inc., Atmel Corporation and Toshiba Corporation, or Toshiba.
We increasingly compete with NAND Flash memory manufacturers where NAND Flash memory has the ability to replace NOR Flash memory in customer applications. Our principal NAND Flash memory competitors include Samsung Electronics Co., Ltd. and Micron Technology, Inc. In the future, our principal NAND Flash memory competitors may include Elpida Memory, Inc., Hynix Semiconductor Inc., Toshiba Semiconductor Company, Powerchip Technology Corporation, Macronix International Co., Ltd., Intel Corporation and Sandisk Corporation.
The Flash memory market is characterized by intense competition. The basis of competition is cost, selling price, performance, quality, customer relationships and ability to provide value-added solutions. In particular, in the past our competitors have aggressively priced their products, which resulted in decreased selling prices for our products and adversely impacted our results of operations. Some of our competitors, including Samsung and Toshiba, are more diversified than we are and may be able to sustain lower operating margins in their Flash memory business based on the profitability of their other, non-Flash memory businesses. In addition, capital investments by competitors in the past have resulted in substantial industry manufacturing capacity and announced capital investments planned for the future may further contribute to a competitive pricing environment. Some of our competitors are able to manufacture NAND-based Flash memory products on 300-millimeter wafers at lower costs than us or may choose to utilize more advanced manufacturing process technologies than us. As a result, such competitors may be able to offer products competitive to ours at a lower cost or higher density. Moreover, our NAND-based Flash memory products based on our proprietary MirrorBit technology may not have the price, performance, quality and other features necessary to compete successfully for these applications.
We expect competition in the Flash memory market to intensify as existing manufacturers introduce new products, new manufacturers enter the market, industry-wide production capacity increases and competitors aggressively price their Flash memory products to increase market share. The competition we face intensified during the Chapter 11 Cases as our ability to compete was reduced. If our competitors, many of whom have greater financial resources than us, increase their focus on the Flash memory products or segments of the Flash memory markets that generate a significant portion of our net sales we could be materially adversely affected.
Competitive pressures may also increase if NOR memory vendors merge, if NAND memory vendors acquire NOR businesses or other NAND businesses, or if our competitors otherwise consolidate their operations. For example, on April 8, 2010, Microchip Technology announced that it had completed its acquisition of Silicon Storage Technology, Inc.; and on May 7, 2010, Micron announced that it had completed its acquisition of
19
Table of Contents
Numonyx Holdings B.V. Furthermore, we face increasing competition from NAND Flash memory vendors targeting the embedded portion of the Flash memory market.
To compete successfully, we must decrease our manufacturing costs and develop, introduce and sell products at competitive prices that meet our customers’ demands. If we are unable to compete effectively, we could be materially adversely affected.
Unless we maintain manufacturing efficiency, we may not become profitable and our future profitability could be materially adversely affected.
The Flash memory industry is characterized by rapid technological changes. For example, new manufacturing process technologies using smaller feature sizes and offering better performance characteristics are generally introduced every one to two years. The introduction of new manufacturing process technologies allows us to increase the functionality of our products while at the same time optimizing performance parameters, and increasing storage capacity. In addition, the reduction of feature sizes enables us to produce smaller chips offering the same functionality and thereby considerably reducing the cost per bit. In order to remain competitive, it is essential that we secure the capabilities to develop and qualify new manufacturing process technologies. For example, our leading Flash memory products must be manufactured at 65-nanometer and more advanced process technologies. If we are delayed in transitioning to these technologies and other future technologies, we could be materially adversely affected.
Manufacturing our products involves highly complex processes that require advanced equipment. Our manufacturing efficiency is an important factor in achieving profitability, and we cannot be sure that we will be able to maintain or increase our manufacturing efficiency to the same extent as our competitors. For example, we continuously modify our manufacturing processes in an effort to improve yields and product performance and decrease costs. We are continuing to transition to 65-nanometer process technology for the manufacture of some of our products. During periods when we are implementing new process technologies, manufacturing facilities may not be fully productive. We may fail to achieve acceptable yields or may experience product delivery delays as a result of, among other things, capacity constraints, delays in the development of new process technologies, changes in our process technologies, upgrades or expansion of existing facilities, impurities or other difficulties in the manufacturing process. Any of these occurrences could adversely impact our relationships with customers, cause harm to our reputation in the marketplace, cause customers to move future business to our competitors or cause us to make financial concessions to our customers.
Improving our manufacturing efficiency in future periods is dependent on our ability to:
| • | develop advanced process technologies and advanced products that utilize those technologies; |
| • | successfully transition to advanced process technologies; |
| • | continue to reduce test times; |
| • | ramp product and process technology improvements rapidly and effectively to commercial volumes; |
| • | achieve acceptable levels of manufacturing wafer output and yields, which may decrease as we implement more advanced technologies; and |
| • | maintain our quality controls and rely upon the quality and process controls of our suppliers. |
Our ability to generate sufficient operating cash flows depends in part on maintaining our expense reduction efforts.
Our business is capital intensive and our ability to generate operating cash flows depends in large part on the maintenance of our low cost strategy. In response to decreasing cash balances of the Predecessor prior to the Chapter 11 Cases and as part of our strategy going forward, we intend to continue our low cost strategy. Some
20
Table of Contents
cost cutting activities may require initial cash outlays before the cost reductions are realized. We cannot assure you that we will be able to achieve anticipated expense reductions. If our expense reduction efforts are unsuccessful, our operating results and business may be materially adversely affected. Furthermore, in certain instances our cost reductions may make it more difficult for us to succeed in the extremely competitive Flash memory market.
Our working capital, investments and capital requirements may require us to seek additional financing, which may not be available to us.
Our debt instruments may not be sufficient for our future working capital, investments and capital requirements. We also may not be able to access additional financing resources due to a variety of reasons, including the restrictive covenants in the Senior Secured Term Loan, the Revolving Credit Facility and the Senior Unsecured Notes indenture and the lack of available capital due to the tight nature of global credit markets. If our financing requirements are not met by the Senior Secured Term Loan and the Revolving Credit Facility and we are unable to access additional financing, our business, operations, financial condition and cash flows will be materially adversely affected.
If we cannot adequately protect our technology or other intellectual property in the United States and abroad, through patents, copyrights, trade secrets, trademarks and other measures, we may lose a competitive advantage and incur significant expenses as a result of litigation and other claims.
We rely on a combination of protections provided by contracts, including confidentiality and non-disclosure agreements, copyrights, patents, trademarks and common law rights, such as trade secrets, to protect our intellectual property. However, we cannot assure you that we will be able to adequately protect our technology or other intellectual property from third-party infringement or from misappropriation in the United States and abroad. Any patent owned or licensed by us or issued to us could be challenged, invalidated or circumvented or rights granted under these patents or licenses may not provide a competitive advantage to us. Furthermore, patent applications that we file may not result in issuance of a patent or, if a patent is issued, the patent may not be issued in a form that is advantageous to us. Despite our efforts to protect our intellectual property rights, others may independently develop similar products, duplicate our products or design around our patents and other intellectual property rights. In addition, it is difficult to monitor compliance with, and enforce, our intellectual property rights on a worldwide basis in a cost-effective manner. Foreign laws may provide less intellectual property protection than is afforded in the United States. Our efforts to protect our intellectual property in the United States and abroad, through lawsuits such as those that have been filed between us and Samsung may be time-consuming and costly. If we cannot adequately protect our technology or other intellectual property rights in the United States and abroad, we may be materially adversely affected.
We are currently party to various lawsuits brought by third parties alleging that we infringe their intellectual property rights. In the future, third parties may bring additional actions against us based on similar allegations. To resolve such claims, we may seek to obtain a license under the third party’s intellectual property rights. We cannot assure you that we will be able to obtain all of the necessary licenses on satisfactory terms, if at all. These parties have or may in the future file lawsuits against us seeking damages (potentially including treble damages or willful infringement) or an injunction against the sale of our products that incorporate allegedly infringed intellectual property or against the operation of our business as presently conducted, which could result in our having to stop the sale of some of our products, increase the costs of selling some of our products, or cause damage to our reputation. The award of damages, including material royalty payments, or the entry of an injunction against the manufacture and sale of some or all of our products, would have a material adverse effect on us. We could decide, in the alternative, to redesign our products or to resort to litigation to challenge or defend such claims, either of which could be expensive and time-consuming and may have a material adverse effect on us.
We expect to attempt to negotiate agreements and arrangements with third parties for the license of intellectual property and technology that are important to our business. We also expect to continue to apply for
21
Table of Contents
new patents as our success in negotiating patent cross-license agreements with other industry participants will depend in large part upon the strength of our patent portfolio relative to that of the third party with which we are negotiating. If we are unable to negotiate agreements or arrangements for intellectual property, or to obtain patents, necessary for the success of our business, we may be materially adversely affected.
We provide indemnities relating to non-infringement of patents and other intellectual property indemnities to certain of our customers in connection with the delivery, design, manufacture and sale of our products. If we incur substantial costs in connection with any claim pursuant to such indemnification, our business, results of operations and financial condition could be materially adversely affected.
If essential equipment or adequate supplies of satisfactory materials are not available to manufacture our products, we could be materially adversely affected.
Our manufacturing operations depend upon obtaining deliveries of equipment and adequate supplies of materials on a timely basis. We purchase equipment and materials from a number of suppliers. From time to time, suppliers may extend lead times, limit supply to us or increase prices due to capacity constraints or other factors. Because the equipment that we purchase is complex, it is difficult for us to substitute one supplier for another or one piece of equipment for another. Some raw materials we use in the manufacture of our products are available from a limited number of suppliers or only from a limited number of suppliers in a particular region. In addition, we purchase raw materials such as gold for which prices on the world markets have fluctuated significantly during recent periods. Our manufacturing operations also depend upon the quality and usability of the materials we use in our products, including raw materials and wafers we receive from our suppliers. If the materials we receive from our suppliers do not meet our manufacturing requirements or product specifications, are not obtained in a timely manner or if there are significant increases in costs of materials, we may be materially adversely affected.
We also rely on purchasing commercial memory die such as PSRAM from third-party suppliers to incorporate these die into multi-chip package products. The availability of these third-party purchased commercial die is subject to market availability, and the process technology roadmaps and manufacturing capacities of our vendors. In addition, some of our suppliers may also be our competitors. Interruption of supply from a competitor that is a supplier or otherwise or increased demand in the industry could cause shortages and price increases in various essential materials. If we are unable to procure these materials, or if the materials we receive from our suppliers do not meet our production requirements or product specifications, we may have to reduce our manufacturing operations or our manufacturing yields may be adversely affected. Such a reduction and yield issues have in the past and could in the future have a material adverse effect on us.
Costs related to defective products could have a material adverse effect on us.
One or more of our products may be found to be defective or we may initiate voluntary recalls of products after they have been shipped to customers in volume. We generally provide a limited warranty with respect to our products. Accordingly, if we recall products or are forced to replace defective products, the cost of product replacements or product returns may be substantial, and our reputation with our customers could be damaged. In addition, we could incur substantial costs to implement modifications to fix defects. Any of these problems could materially adversely affect us.
Worldwide economic and political conditions and risks may adversely affect demand for our products and have a material adverse effect on us.
We operate in more than ten countries and we derive a majority of our net sales outside the United States. For example, a significant portion of our planned wafer fabrication capacity for existing and future products is provided by third parties located in Japan and China, and nearly all final tests and assembly of our products is performed at our facilities in Malaysia and Thailand and by third parties in China, Taiwan, Korea and Thailand.
22
Table of Contents
Our business depends on overall worldwide economic conditions and the economic and business conditions within our customers’ industries. Our business may also be affected by economic factors that are beyond our control, such as downturns in economic activity in a specific country or region. A further weakening of the worldwide economy or the economies of individual countries or the demand for our customers’ products may cause a decrease in demand for our products, which could materially adversely affect us.
We could also be significantly and adversely affected by geopolitical concerns and world events, such as wars and terrorist attacks. Our net sales and financial results have been and could be negatively affected to the extent such geopolitical concerns continue or similar events occur or are anticipated to occur. Terrorist attacks or armed conflicts may directly impact our physical facilities or those of our suppliers or customers. Furthermore, these attacks may make travel and the transportation of our products more difficult and more expensive, which could materially adversely affect us.
The political and economic risks associated with our sales to, and operations in, foreign countries include:
| • | expropriation; |
| • | changes in political or economic conditions; |
| • | compliance with U.S. and international laws involving international operations, including the Foreign Corrupt Practices Act and export control laws; |
| • | changes in tax laws, trade protection measures and import or export licensing requirements; |
| • | difficulties in protecting our intellectual property; |
| • | changes in foreign currency exchange rates; |
| • | restrictions on transfers of funds and other assets of our subsidiaries between jurisdictions; |
| • | changes in freight and interest rates; |
| • | disruption in air transportation between the location of our facilities; and |
| • | loss or modification of exemptions for taxes and tariffs. |
In particular, consequences of military action in the Middle East have in the past, and may in the future, adversely affect demand for our products and our relationship with various third parties with which we collaborate. Our subsidiary, Spansion Israel, conducts business in Israel, which is affected and surrounded by unstable political, economic and military conditions. We cannot predict the effect of continued or increased violence, or the effect of military action in that region. Continued armed conflicts or political instability in the region would harm business conditions and could adversely affect our results of operations. Furthermore, several countries continue to restrict or ban business with Israel and Israeli companies. These restrictive laws and policies may limit our ability to make sales in those countries, and, as a global company, may limit our own ability to efficiently administer our worldwide resources.
More generally, any of these events could cause consumer confidence and spending to decrease or result in increased volatility in the U.S. economy and worldwide financial markets.
Unfavorable currency exchange rate fluctuations could adversely affect us.
As a result of our foreign operations, we have sales, expenses, assets and liabilities that are denominated in Japanese yen and other foreign currencies. For example:
| • | some of our costs are denominated in Japanese yen, Thai baht and Malaysian ringgit; |
| • | sales of our products to, and purchases from, TI are denominated in both U.S. dollars and Japanese yen; and |
| • | some fixed asset purchases are denominated in Japanese yen and European Union euros. |
23
Table of Contents
Consequently, movements in exchange rates could cause our net sales and expenses to fluctuate, affecting our results of operations and cash flows. We use foreign currency forward contracts to reduce our exposure to foreign currency exchange rate fluctuations. The objective of these contracts is to reduce the impact of foreign currency exchange rate movements on our operating results and on our foreign currency denominated monetary assets and liabilities. We do not use these contracts for speculative or trading purposes. We cannot assure you that these activities will be successful in reducing our foreign currency exchange rate exposure. If these activities are unsuccessful, our financial condition could be materially adversely affected.
We are subject to a variety of environmental laws that could result in liabilities.
Our properties and many aspects of our business operations are subject to various domestic and international environmental laws and regulations, including those relating to materials used in our products and manufacturing processes; chemical use and handling; waste minimization; discharge of pollutants into the environment; the treatment, transport, storage and disposal of solid and hazardous wastes; and remediation of contamination. Certain of these laws and regulations require us to obtain permits for our operations, including permits related to the discharge of air pollutants and wastewater. From time to time, our facilities are subject to investigation by governmental regulators. Environmental compliance obligations and liability risks are inherent in many of our manufacturing and other activities. Any failure to comply with applicable environmental laws, regulations or permits may subject us to a range of consequences, including fines, suspension of production, alteration of manufacturing processes, sales limitations, and criminal and civil liabilities or other sanctions. We could also be held liable for any and all consequences arising out of exposure to hazardous materials used, stored, released, disposed of by us or located at or under our facilities, or for other environmental or natural resource damage. Certain environmental laws, including the U.S. Comprehensive Environmental Response, Compensation and Liability Act of 1980, or the Superfund Act, impose joint and several liabilities on current and previous owners or operators of real property for the cost of removal or remediation of hazardous substances and costs related to damages to natural resources. Liability can attach even if the owner or operator did not know of, or was not responsible for, the release of such hazardous substances. These environmental laws also can result in liability for persons, like us, who arrange for hazardous substances to be sent to disposal or treatment facilities, in the event such facilities are found to be contaminated. Such persons can be responsible for cleanup costs at a disposal or treatment facility, even if they never owned or operated the contaminated facility. One of our properties is listed on the U.S. Environmental Protection Agency’s Superfund National Priorities List. However, other parties currently are responsible for all investigation, cleanup and remediation activities. Although we have not been named a responsible party at this site, if we were so named, costs associated with the cleanup of the site could have material adverse effect upon us. We have not been named a responsible party at any Superfund or other contaminated site. If we were ever so named, costs associated with the cleanup of the site could be material. Additionally, contamination that has not yet been identified could exist at one or more of our facilities, and identification of such contamination could have a material adverse effect on us.
Our business is subject to complex and dynamic environmental regulatory schemes. While we have budgeted for reasonably foreseeable environmental expenditures, we cannot assure you that environmental laws will not change or become more stringent in the future. Future environmental regulations could require us to procure expensive pollution abatement or remediation equipment; to modify product designs; or to incur other expenses associated with compliance with such regulations. For example, the European Union and China recently began imposing stricter requirements regarding reduced lead content in semiconductor packaging. Therefore, we cannot assure you that our costs of complying with current and future environmental and health and safety laws, or liabilities arising from past or future releases of, or exposure to, hazardous substances, will not have a material adverse effect on our business.
24
Table of Contents
Our business, worldwide operations and the operations of our suppliers could be subject to natural disasters and other business disruptions, which could harm our future net sales and financial condition and increase our costs and expenses.
Our worldwide operations and business could be subject to natural disasters and other business disruptions, such as a world health crisis, fire, earthquake, tsunami, volcano eruption, flood, hurricane, power loss, power shortage, telecommunications failure or similar events, which could harm our future net sales and financial condition and increase our costs and expenses. Our corporate headquarters are located near major earthquake fault lines in California and TI’s wafer fabrication facilities, Fujitsu’s manufacturing facilities and Elpida’s manufacturing facilities are located near major earthquake fault lines in Japan. Also, our assembly and test facility located in Thailand and our subcontractors’ assembly and test facilities in Asia may be affected by tsunamis. In the event of a major earthquake or tsunami, we could experience loss of life of our employees, destruction of facilities or other business interruptions. If such business disruptions result in cancellations of customer orders or contribute to a general decrease in economic activity or demand for our products, or directly impact our marketing, manufacturing, financial, and logistics functions, our results of operations and financial condition could be materially adversely affected.
Furthermore, the operations of our suppliers could be subject to natural disasters and other business disruptions, which could cause shortages and price increases in various essential materials, which are required to manufacture our products or commercial memory die such as PSRAMs for incorporation into our MCP products. If we are unable to procure an adequate supply of materials that are required for us to manufacture our products, or if the operations of our other suppliers of such materials are affected by an event that causes a significant business disruption, we may have to reduce our manufacturing operations. Such a reduction could in the future have a material adverse effect on us.
Changes to financial accounting standards may affect our results of operations and cause us to change our business practices.
We prepare our financial statements in accordance with generally accepted accounting principles, or GAAP, in the United States. These accounting principles are subject to interpretation by the Financial Accounting Standards Board, or FASB, the Securities and Exchange Commission, or SEC, and various bodies formed to interpret and create appropriate accounting policies. A change in those policies or other requirements with respect to the reporting of financial statements can have a significant effect on our reported results and may affect our reporting of transactions completed before a change is announced.
For example, the SEC has released a proposed roadmap regarding the potential use by U.S. issuers of financial statements prepared in accordance with International Financial Reporting Standards, or IFRS. Under the proposed roadmap, we may be required to prepare financial statements in accordance with IFRS. The SEC announced it will make a determination in 2011 regarding the mandatory adoption of these new standards. It is unclear at this time how the Commission will propose GAAP and IFRS be harmonized if the proposed changes are adopted. If adopted, we will need to develop new systems and controls around IFRS principles. Since this would be a new endeavor, the specific costs associated with this conversion are uncertain and could have a material impact on our results of operations.
AMD and Fujitsu may continue to use all of our intellectual property and the intellectual property they have transferred to us.
In connection with our reorganization as Spansion LLC in June 2003, Advanced Micro Devices, Inc., or AMD, and Fujitsu transferred approximately 400 patents and patent applications to us. In addition, AMD and Fujitsu contributed additional patents to us at the time of our initial public offering. However, both AMD and Fujitsu have retained license rights under the patents they contributed to us. In addition, under their respective patent cross-license agreements with us, AMD and Fujitsu have also obtained licenses to our present and future
25
Table of Contents
patents with effective filing dates prior to June 30, 2013, although the scope of patents under license can be impacted by a change in control of the parties or their semiconductor groups. These licenses continue until the last to expire of the patents under license expires and provide AMD and Fujitsu with licenses to all of our present and future patents in existence through such cross-license termination date. In addition, we have granted a non-exclusive, perpetual, irrevocable fully paid and royalty-free license under our rights, other than patent and trademark rights, in our technology to each of AMD and Fujitsu. Under our non-competition agreement, both AMD and Fujitsu have agreed that they will not directly or indirectly engage in a business, and have agreed to divest any acquired business, that manufactures or supplies standalone semiconductor devices (including single chip, multiple chip or system devices) containing certain Flash memory, which is the business in which we primarily compete. With respect to each of AMD and Fujitsu, this non-competition restriction will last until May 10, 2012. After the expiration of the non-competition restriction period, should either AMD or Fujitsu decide to re-enter the Flash memory business, it could use our present and future patents and technologies licensed by us to AMD and Fujitsu to compete against us. If either AMD or Fujitsu were to compete with us, we could be materially adversely affected.
Our stock price may be volatile, and stockholders may lose all or part of their investment.
The market price of our common stock has been volatile and may in the future be subject to wide fluctuations in response to many risk factors listed in this section, and others beyond our control, including:
| • | actual or anticipated changes in our operating results; |
| • | changes in financial estimates by securities analysts; |
| • | fluctuations in the valuation of companies perceived to be comparable to us; |
| • | announcements by us or our competitors of significant acquisitions, strategic partnerships, divestitures, joint ventures or other strategic initiatives; and |
| • | stock price and volume fluctuations attributable to inconsistent trading volume levels or other factors. |
Furthermore, the stock markets have experienced extreme price and volume fluctuations that have affected and continue to affect the market prices of equity securities of many companies. These fluctuations often have been unrelated or disproportionate to the operating performance of those companies. These broad market and industry fluctuations, as well as general economic, political and market conditions such as recessions, interest rate changes or international currency fluctuations, may negatively impact the market price of shares of our common stock. In the past, companies that have experienced volatility in the market price of their stock have been subject to securities class action litigation. We may be the target of this type of litigation in the future. Securities litigation against us could result in substantial costs and divert our management’s attention from other business concerns, which could materially adversely affect us.
| ITEM 1B. | UNRESOLVED STAFF COMMENTS |
None.
| ITEM 2. | PROPERTIES |
Our principal engineering, manufacturing and administrative facilities as of December 26, 2010, comprise approximately 2.8 million square feet and are located in the United States, Europe, Middle East and Asia. Over 2.6 million square feet of this space is in buildings we own in Sunnyvale, California; Austin, Texas; Kuala Lumpur, Malaysia; Penang, Malaysia; and Bangkok, Thailand. The remainder of this space is leased. We lease approximately 156,000 square feet of office and warehouse space in Europe and Asia. Our Fab 25 facility in Austin, Texas and our facility in Sunnyvale, California are encumbered by liens securing our Senior Secured
26
Table of Contents
Term Loan and Revolving Credit Facility. See Part II, Item 7 “Management’s Discussion and Analysis of Financial Condition and Results of Operations—Contractual Obligations.”
Our facility leases have terms of generally one to five years. We currently do not anticipate difficulty in either retaining occupancy of any of our facilities through lease renewals prior to expiration or through month-to-month occupancy or replacing them with equivalent facilities.
| ITEM 3. | LEGAL PROCEEDINGS |
Tessera District Court Action
On October 7, 2005, Tessera, Inc. filed a complaint, Civil Action No. 05-04063, for patent infringement against Spansion LLC in the United States District Court for the Northern District of California under the patent laws of the United States of America, 35 U.S.C. section 1, et seq., including 35 U.S.C. section 271. The complaint alleges that Spansion LLC’s Ball Grid Array (BGA) and multichip packages infringe the following Tessera patents: United States Patent No. 5,679,977, United States Patent No. 5,852,326, United States Patent No. 6,433,419 and United States Patent No. 6,465,893. On December 16, 2005, Tessera filed a First Amended Complaint naming Spansion Inc. and Spansion Technology Inc., our wholly owned subsidiary, as defendants. On January 31, 2006, Tessera filed a Second Amended Complaint adding Advanced Semiconductor Engineering, Inc., Chipmos Technologies, Inc., Chipmos U.S.A., Inc., Silicon Precision Industries Co., Ltd., Siliconware USA, Inc., ST Microelectronics N.V., ST Microelectronics, Inc., Stats Chippac Ltd., Stats Chippac, Inc., and Stats 34 Chippac (BVI) Limited.
The Second Amended Complaint alleges that Spansion LLC’s BGA and multichip packages infringe the four Tessera patents identified above. The Second Amended Complaint further alleges that each of the newly named defendants is in breach of a Tessera license agreement and is infringing on a fifth Tessera patent, United States Patent No. 6,133,627. The Second Amended Complaint seeks unspecified damages and injunctive relief, a trebling of damages for alleged willful conduct and attorney’s fees (the “Tessera District Court Action”). On February 9, 2006, Spansion filed an answer to the Second Amended Complaint and asserted counterclaims against Tessera. On April 18, 2006, the U.S. District Court issued a Case Management Order that set a trial date of January 28, 2008. On March 13, 2007, the U.S. District Court issued an order vacating the trial date. On April 12, 2007, the U.S. District Court issued an order referring case management scheduling issues to a Special Master, and directing that the court will appoint an expert in the case to testify on the ultimate merits of the technical issues relating to infringement and patent validity. On April 26, 2007, we, along with other defendants, filed a motion to stay the Tessera District Court action pending resolution of the proceeding before the International Trade Commission described below (the “ITC Action”). On May 24, 2007, the U.S. District Court issued an order staying the Tessera District Court action until final resolution of the ITC action.
On January 29, 2010, a claim estimation hearing was conducted in the U.S. Bankruptcy Court, and on February 9, 2010, the U.S. Bankruptcy Court issued a ruling estimating the potential damages in this case for post-petition infringement by Spansion to be approximately $4.2 million. The U.S. Bankruptcy Court as a result of a stipulation of the parties also set an estimated reserve of $130M for the pre-petition amount of Tessera’s claim.
Tessera ITC Action
On April 17, 2007, Tessera, Inc. filed a complaint under section 337 of the Tariff Act of 1930, 19 U.S.C. § 1337, in the United States International Trade Commission (“ITC”) against respondents ATI Technologies, Inc., Freescale Semiconductor, Inc., Motorola, Inc., Qualcomm, Inc., Spansion Inc., Spansion LLC and STMicroelectronics N.V. Tessera claims that “face up” and “stacked-chip” small format laminate Ball Grid Array (“BGA”) packages, including the Spansion 5185941F60 chip assembly, infringe certain specified claims of United States Patent Nos. 5,852,326 and 6,433,419 (“Asserted Patents”). The complaint requests that the ITC
27
Table of Contents
institute an investigation into the matter. The complaint seeks a permanent exclusion order pursuant to section 337(d) of the Tariff Act of 1930, as amended, excluding from entry into the United States all semiconductor chips with small format laminate BGA semiconductor packaging that infringe any of the Asserted Patents, and all products containing such infringing small format laminate BGA semiconductor packaged chips. The complaint also seeks a permanent cease and desist order pursuant to section 337(f) of the Tariff Act of 1930, as amended, directing respondents with respect to their domestic inventories to cease and desist from marketing, advertising, demonstrating, sampling, warehousing inventory for distribution, offering for sale, selling, distributing, licensing, or using any semiconductor chips with small format laminate BGA semiconductor packaging that infringe any of the Asserted Patents, and/or products containing such semiconductor chips. On May 15, 2007, the ITC instituted an investigation pursuant to 19 U.S.C. § 1337, entitled In the Matter of Certain Semiconductor Chips with Minimized Chip Package Size and Products Containing Same, Inv. No. 337-TA-605, identifying ATI Technologies, ULC, Freescale Semiconductor, Inc., Motorola, Inc., Spansion Inc., Spansion LLC and STMicroelectronics N.V. (“Respondents”) as respondents. On June 8, 2007, Respondents filed a motion to stay the ITC investigation pending reexamination of the Asserted Patents by the U.S. Patent and Trademark Office. On February 26, 2008, the assigned administrative law judge issued an Initial Determination granting respondents’ motion for a stay of the ITC investigation pending completion of the re-examination of the Asserted Patents by the U.S. Patent and Trademark Office. On March 4, 2008, Tessera filed with the ITC a Petition for Review of the Initial Determination Ordering Stay. On March 27, 2008, the ITC issued an order reversing the Initial Determination, and denying Respondents’ motion for a stay of the ITC investigation pending reexamination of the Asserted Patents. On December 1, 2008, Judge Essex issued an Initial Determination, ruling that the accused small-format BGA packages of Spansion Inc. and Spansion LLC and the other Respondents did not infringe the asserted claims of the Asserted Patents and, therefore, Spansion Inc. and Spansion LLC and the other Respondents were not in violation of section 337 of the Tariff Act of 1930. On December 15, 2008, Tessera filed with the ITC a petition to review the Initial Determination. On January 30, 2009, the ITC issued a notice to review in part Judge Essex’s decision finding no violation of section 337. On May 20, 2009, the ITC issued a Final Determination reversing the Initial Determination by finding that there was a violation of 19 U.S.C. § 1337 by Spansion Inc. and Spansion LLC, Qualcomm, Inc., ATI Technologies, Motorola, Inc. STMicroelectronics N.V. and Freescale Semiconductor, Inc., and determined that the appropriate form of relief is (1) a limited exclusion order under 19 U.S.C. § 1337(d)(1) prohibiting the unlicensed entry of semiconductor chips with minimized chip package size and products incorporating these chips that infringe one or more of claims 1, 2, 6, 12, 16-19, 21, 24-26, and 29 of the ‘326 patent and claims 1-11, 14, 15,19, and 22-24 of the ‘419 patent, and are manufactured abroad by or on behalf of, or imported by or on behalf of, Spansion, Qualcomm, ATI, Motorola, STMicroelectronics N.V. and Freescale; and (2) cease and desist orders directed to Motorola, Qualcomm, Freescale and Spansion. The cease and desist order directed to Spansion prohibits importing, selling, marketing, advertising, distributing, offering for sale, transferring (except for exportation) and soliciting U.S. agents or distributors for certain semiconductor chips that are covered by the patents asserted in the action. On June 2, 2009, Spansion and the other respondents to the investigation jointly filed with the ITC a motion to stay the effect of the ITC decision pending appeal to the U.S. Court of Appeals for the Federal Circuit (the “Federal Circuit”). On July 17, 2009, the ITC denied the motion. On July 20, 2009, Spansion appealed the ITC decision to the Federal Circuit and filed an emergency motion for stay pending appeal and immediate temporary stay. The Federal Circuit denied the stay motions on September 8, 2009. The principal brief in the Federal Circuit appeal was filed on October 30, 2009. On September 24, 2010, the Asserted Patents expired, thereby terminating the exclusion order. Consolidated appeals 2009-1461, -1462 and -1465 were also filed along with Spansion’s appeal number 2009-1460 by appellants Freescale Semiconductor, Inc., ATI Technologies, ULC, STMicroelectronics N.V. and Qualcomm Incorporated. Oral arguments were heard in June 2010. On December 21, 2010, the Federal Circuit affirmed the Commission opinion.
Fast Memory Erase LLC v. Spansion Inc., et al.
On June 9, 2008, Fast Memory Erase LLC filed a complaint in the U.S. District Court for the Northern District of Texas alleging patent infringement against Spansion Inc., Spansion LLC, Intel Corp., Numonyx B.V., Numonyx, Inc., Nokia Corp., Nokia Inc., Sony Ericsson Mobile Communications AB, Sony Ericsson Mobile
28
Table of Contents
Communications (USA), Inc., and Motorola, Inc. The case is styled, Fast Memory Erase, LLC v. Spansion Inc., Spansion LLC, et al., Case No. 3:08-CV-00977-M (N.D. Tex.). Fast Memory Erase’s complaint alleges that Spansion’s NOR Flash products using floating gate technology infringe one or more claims of U.S. Patent No. 6,236,608 (the ‘608 patent). Fast Memory Erase has also asserted U.S. Patent No. 6,303,959 (the ‘959 patent) in its complaint against the products of other defendants, namely Intel and Numonyx, but it has not asserted the ‘959 patent against any Spansion products. On December 22, 2008, Fast Memory Erase filed an amended complaint. In its amended complaint, Fast Memory Erase added Apple, Inc. as a defendant. Spansion has answered Fast Memory Erase’s complaint and amended complaint. Spansion’s answers assert that Spansion does not infringe the ’608 patent and that the ‘608 patent is invalid. In its answers, Spansion also asserts counterclaims against Fast Memory Erase for declaratory judgments of non-infringement and invalidity. The case was stayed against Spansion as a result of the Chapter 11 Cases until May 18, 2009. The U.S. Bankruptcy Court preliminarily lifted the stay and set June 23, 2009 as the date for a final determination on the stay. The parties subsequently agreed to lift the stay so that the U.S. District Court could proceed with a Markman hearing to determine the meaning of certain claims, which was held on September 16, 2009. No ruling has yet been issued as a result of the Markman hearing.
LSI, Agere ITC Investigation
On April 18, 2008, LSI Corporation and Agere Systems, Inc. (collectively “Complainants”) filed a complaint under section 337 of the Tariff Act of 1930, 19 U.S.C. § 1337, in the ITC against respondents United Microelectronics Corporation, Integrated Device Technology, Inc., AMIC Technology Corporation, Elpida Memory, Inc., Freescale Semiconductor, Inc., Grace Semiconductor Manufacturing Corporation, Microchip Technology, Inc., Micronas Semiconductor Holding, AG, National Semiconductor Corporation, Nanya Technology Corporation, NXP B.V., ON Semiconductor Corporation, Powerchip Semiconductor Corporation, ProMOS Technologies, Inc., Spansion, Inc., STMicroelectronics NV and Vanguard International Semiconductor Corporation. The complaint alleges that certain Spansion Flash products, including Spansion’s 4 Mb CMOS 3.0 Volt-only Simultaneous Read/Write Flash Memory and 1 G MirrorBit NOR Flash products, infringe at least claim 1 of U.S. Patent No. 5,227,335 (the “Asserted Patent”). The complaint identifies, under the heading “Related Litigations,” other lawsuits involving the Asserted Patent, including Agere Systems, Inc. v Atmel Corporation, Civil Action No. 2:02-CV-864 (E.D. Pa.) (The “Atmel case”). The complaint requests that the ITC institute an investigation into the matter. The complainant seeks a permanent exclusion order pursuant to section 337(d) of the Tariff Act of 1930, as amended, excluding from entry into the United States all semiconductor IC devices and products containing same, made by a method that infringes one or more claims of the Asserted Patent. The complainant also seeks a permanent cease and desist order pursuant to section 337(1) of the Tariff Act of 1930, as amended, directing respondents to cease and desist from importing, selling, offering for sale, using, demonstrating, promoting, marketing, and/or advertising in the United States, or otherwise transferring outside the United States for sale in the United States, semiconductor IC devices and products containing same made by a method that infringes one or more claims of the Asserted Patent. On May 16, 2008, the ITC instituted an investigation pursuant to 19 U.S.C. § 1337, entitled In the Matter of Certain Semiconductor Integrated Circuits Using Tungsten Metallization and Products Containing Same No. 337-TA-648, identifying United Microelectronics Corporation, Integrated Device Technology, Inc., AMIC Technology Corporation, Elpida Memory, Inc., Freescale Semiconductor, Inc., Grace Semiconductor Manufacturing Corporation, Microchip Technology, Inc., Micronas Semiconductor Holding, AG, National Semiconductor Corporation, Nanya Technology Corporation, NXP B.V., ON Semiconductor Corporation, Powerchip Semiconductor Corporation, ProMOS Technologies, Inc., Spansion, Inc., STMicroelectronics NV and Vanguard International Semiconductor Corporation (“Respondents”) as respondents. On June 5, 2008, respondents Elpida Memory, Inc., Freescale Semiconductor, Inc., Grace Semiconductor Manufacturing Corporation, Integrated Device Technology, Microchip Technology, Inc., Nanya Technology Corp., Powerchip Semiconductor Corp., Spansion Inc. and ST Microelectronics N.V. filed a joint motion for summary determination that Complainant is precluded from re-litigating an invalid patent, based upon the jury finding of invalidity and the court ruling affirming the invalidity finding of the Asserted Patent in the Atmel case. On June 27, 2008, Administrative Law Judge Carl L. Charneski set an Initial Determination date of May 21, 2009, with a hearing to be completed by March 13, 2009,
29
Table of Contents
and a target date for completion of the ITC investigation of August 21, 2009. On September 18, 2008, Judge Charneski granted Complainants’ motion to add five respondents, Dongbu HiTek Semiconductor Business; Jazz Semiconductor, Magnachip Semiconductor; Qimonda AG, and Tower Semiconductor, Ltd. On October 30, 2008, Judge Charneski denied Complainants’ request to add additional claims of infringement against Spansion, and also suspended the current procedural schedule. On November 5, 2008, Judge Charneski issued an order modifying procedural schedule, setting a hearing date of July 20, 2009 and issued a separate order setting an Initial Determination date of September 21, 2009, and a target date for completion of the ITC investigation of January 21, 2010. On December 11, 2008, Judge Charneski issued an Initial Determination denying respondents’ motion for summary determination that Complainant should be precluded from re-litigating an invalid patent. On February 3, 2009, the ITC issued an opinion affirming the ITC determination that Complainant is not precluded from re-litigating the validity of the patent.
A hearing was held July 20, 2009 through July 27, 2009. The initial determination based upon that hearing was issued on September 21, 2009. The judge held that the patent asserted by LSI and Agree is invalid and that Spansion is not a proper party to the action. On April 19, 2010, the Commission issued its Opinion with a finding of no violation of Section 337 of the Tariff Act of 1930.
On May 14, 2010, LSI Corporation and Agere Systems Inc. filed an appeal to the United States Court of Appeals for the Federal Circuit. On November 15, 2010, the United States Court of Appeals for the Federal Circuit entered an order dismissing the appeal as moot and vacating the Commission’s opinion. On November 30, 2010, the Commission dismissed the investigation.
LSI, Agere v. Spansion, Inc., et al.
On April 18, 2008, LSI Corporation and Agere Systems, Inc. filed a complaint, Civil Action No. 2-08 CV-165, in the United States District Court for the Eastern District of Texas, against defendants United Microelectronics Corporation, Integrated Device Technology, Inc., AMIC Technology Corporation, Elpida Memory, Inc., Freescale Semiconductor, Inc., Grace Semiconductor Manufacturing Corporation, Microchip Technology, Inc., Micronas Semiconductor Holding, AG, National Semiconductor Corporation, Nanya Technology Corporation, NXP B.V., ON Semiconductor Corporation, Powerchip Semiconductor Corporation, ProMOS Technologies, Inc., Spansion, Inc., STMicroelectronics NV and Vanguard International Semiconductor Corporation (“Defendants”). The complaint alleges that certain Spansion Flash products, including Spansion’s 4 Mb CMOS 3.0 Volt-only Simultaneous Read/Write Flash Memory and 1 G MirrorBit NOR Flash products, infringe at least claim 1 of U.S. Patent No. 5,227, 335 (the “Asserted Patent”). The complaint seeks a declaration that Spansion infringes the Asserted Patent, permanent injunctive relief and unspecified reasonable royalty and other damages, a trebling of damages for alleged willful conduct and attorney’s fees. On June 13, 2008 Defendants filed an Unopposed Motion to stay the Eastern District of Texas action pending resolution of an International Trade Commission investigation (“ITC”) that is described above. On June 13, 2008, Judge T. John Ward issued an order staying the Eastern District of Texas action until a final determination of the ITC investigation described above. The stay has not yet been lifted in light of the dismissal of the ITC investigation described above.
Spansion v. Samsung Patent Infringement Litigation
Spansion is currently a party to eight, patent infringement proceedings involving Samsung Electronics Co., Ltd.:
Patent Litigation Settlement Agreement with Samsung Electronics Co., Ltd. (Samsung)
On April 7, 2009, Spansion announced that it had settled its patent litigation lawsuits with Samsung. As part of the settlement, Samsung agreed to pay Spansion $70 million and both parties agreed to exchange rights in their patent portfolios in the form of licenses and covenants subject to a settlement agreement. On June 2, 2009, the U.S. Bankruptcy Court entered an order denying Spansion’s motion seeking approval of the settlement
30
Table of Contents
agreement. By its terms, the settlement agreement has been terminated automatically as a result of the failure of the U.S. Bankruptcy Court to approve the settlement agreement by June 2, 2009 (sixty days from when Spansion filed a motion seeking U.S. Bankruptcy Court approval). In addition, as a result of the failure of the U.S. Bankruptcy Court to approve the settlement agreement, the lawsuit by Samsung against Spansion Japan Limited is no longer stayed, and the cases in the U.S. District Court and the ITC have resumed.
Samsung ITC Investigation
On November 17, 2008 Spansion Inc. and Spansion LLC filed a complaint under section 337 of the Tariff Act of 1930, 19 U.S.C. § 1337, in the United States International Trade Commission (“ITC”) against respondents Samsung Electronics Co., Ltd., Samsung Electronics America, Inc., Samsung International, Inc., Samsung Semiconductor, Inc., and Samsung Telecommunications America, LLC and Apple, Inc., Hon Hai Precision Industry Co., Ltd., AsusTek Computer Inc., Asus Computer International, Inc., Kingston Technology Company, Inc., Kingston Technology (Shanghai) Co. Ltd., Kingston Technology Far East Co., Kingston Technology Far East (Malaysia) Sdn. Bhd., Lenovo Group Limited, Lenovo (United States) Inc., Lenovo (Beijing) Limited, Lenovo Information Products (Shenzhen) Co., Ltd., Lenovo (Huiyang) Electronic Industrial Co., Ltd., Shanghai Lenovo Electronic Co., Ltd., PNY Technologies, Inc., Research In Motion, Ltd., Research In Motion Corporation, Sony Corporation, Sony Corporation of America, Sony Ericsson Mobile Communications AB, Sony Ericsson Mobile Communications (USA), Inc., Beijing SE Putian Mobile Communication Co., Ltd., Transcend Information Inc., Transcend Information Inc. (US), Transcend Information Inc. (Shanghai Factory), Verbatim Americas LLC, and Verbatim Corporation (collectively “Downstream Respondents”). In the ITC Complaint, Spansion alleges that Samsung and Downstream Respondents infringe United States Patent Nos. 6,380,029, 6,080,639, 6,376,877, and 5,715,194 (the “Asserted Patents”), which are owned by Spansion, through the unlawful importation into the United States of certain Samsung flash memory chips. The complaint seeks a permanent general exclusion order pursuant to section 337(d) of the Tariff Act of 1930, as amended, excluding from entry into the United States the Samsung chips that infringe any of the Asserted Patents, and all products produced by Downstream Respondents that contain such chips. The complaint also seeks a permanent cease and desist order pursuant to section 337(f) of the Tariff Act of 1930, as amended, prohibiting Samsung and Downstream Respondents from importing, selling for importation, using, offering for sale, selling after importation, building inventory for distribution, distributing, licensing, or otherwise transferring within the United States, Samsung chips that the Asserted Patents, and/or products containing such chips. On December 18, 2008 the ITC instituted an investigation pursuant to 19 U.S.C. § 1337, entitled In the Matter of Certain Flash Memory Chips and Products Containing Same, Inv. No. 337-TA-664, identifying Samsung and Downstream Respondents (“Respondents”) as respondents. On December 19, 2008, Administrative Law Judge Charles E. Bullock set a target date for completion of the ITC Investigation of April 19, 2010, and set the hearing to begin July 27, 2009. Subsequently, on February 9, 2009, Judge Bullock extended the target date for the investigation to June 18, 2010, and re-set the hearing to begin on September 28, 2009. Each of the Respondents has entered an appearance and answered the complaint. On January 30, 2009, the parties submitted their respective discovery statements, which included proposed discovery schedules, to Judge Bullock. On March 12, 2009, this action was stayed pending U.S. Bankruptcy Court approval of a settlement agreement between Spansion and Samsung. On June 2, 2009, the U.S. Bankruptcy Court entered an order denying Spansion’s motion seeking approval of the settlement agreement. As a result of the failure of the U.S. Bankruptcy Court to approve the settlement agreement, Spansion’s case against Samsung in the ITC resumed. A trial was held from May 3, 2010 through May 14, 2010. On October 22, 2010, the judge issued his Initial Determination concluding that there was no violation of 19 U.S.C. § 1337 with respect to either of the two remaining Asserted Patents. The investigation was terminated on December 23, 2010 with a decision by the ITC to not review the Initial Determination.
Spansion v. Samsung District Court Action
On November 17, 2008, Spansion LLC filed a complaint, Civil Action No. 08-855-SLR, in the United States District Court for District of Delaware, against defendants Samsung Electronics Co. LTD., and Samsung Electronics America, Inc., Samsung Semiconductor, Inc., Samsung Telecommunications America, LLC, and
31
Table of Contents
Samsung Austin Semiconductor, LLC (“Samsung U.S.”). The complaint alleges that certain Samsung flash memory chips infringe United States Patent Nos. 6,455,888, 6,509,232, 5,831,901, 5,991,202, 6,433,383, and 6,246,610 (the “Spansion Patents”). The complaint seeks a judgment that Samsung infringes the Spansion Patents, permanent injunctive relief and damages, a trebling of damages for alleged willful conduct, and attorney’s fees, costs, and expenses. On January 8, 2009, Samsung U.S. answered the Complaint, and asserted a number of affirmative defenses. Samsung U.S.’s answer seeks a judgment of non-infringement as well as attorney’s fees, costs, and expenses in connection with defending against Spansion’s claims. On January 16, 2009, Samsung answered the Complaint, asserted affirmative defenses and counterclaimed that Spansion infringes United States Patent Nos. 6,930,050, 5,748,531, 5,740,065, 5,567,987, and 5,173,442 (the “Samsung Patents”), owned by Samsung. Samsung’s counterclaim seeks a judgment that Spansion infringes the Samsung Patents, permanent injunctive relief and damages, a trebling of damages for alleged willful conduct, and attorney’s fees, costs, and expenses. On March 31, 2009, this action was stayed pending U.S. Bankruptcy Court approval of a settlement agreement between Spansion and Samsung. On June 2, 2009, the U.S. Bankruptcy Court entered an order denying Spansion’s motion seeking approval of the settlement agreement. As a result of the failure of the U.S. Bankruptcy Court to approve the settlement agreement, Spansion’s case against Samsung in the U.S. District Court for District of Delaware has resumed. On August 3, 2009, Samsung amended its counterclaims to remove Patent Nos. 6,930,050 and 5,740,065, from the action. On August 13, 2009, Spansion responded to Samsung’s counterclaims as to the remaining patents asserted by Samsung (i.e., United States Patent Nos., 5,748,531, 5,567,987, and 5,173,442). The action is presently scheduled for trial on October 31, 2011 and discovery is underway. The U.S. Bankruptcy Court has set a reserve of approximately $75 million for any pre-petition damages that Samsung may have for its counterclaims.
Samsung v. Spansion Japan Ltd.
On January 28, 2009, Samsung filed two patent infringement actions in the Tokyo District Court in Japan against Spansion Japan Ltd. (“Spansion Japan”) alleging that certain flash memory chips manufactured or sold by Spansion Japan infringe certain Japanese patents allegedly owned by Samsung. The actions allege infringement of Japanese patents JP 3834189 and JP 3505324, respectively. The two actions have been consolidated for trial. The complaints seek both injunctive relief and damages. On March 31, 2009, this action by Samsung against Spansion Japan was stayed pending U.S. Bankruptcy Court approval in the U.S. and Japan of a settlement agreement between Spansion and Samsung.
On April 7, 2009, Spansion announced that it had settled its patent infringement litigation with Samsung including the proceedings referenced above. As part of the settlement, Samsung agreed to pay Spansion $70 million and both parties exchanged rights in their patent portfolios in the form of licenses and covenants subject to a confidential settlement agreement. The settlement was subject to Bankruptcy Court approval in both the U.S. and Japan and, if approved, would end the patent disputes between the two companies. On May 18, 2009, the U.S. Bankruptcy Court held a hearing to review Spansion’s motion for approval of the settlement. On June 2, 2009, the U.S. Bankruptcy Court entered an order denying Spansion’s motion seeking approval of the settlement agreement. By its terms, the settlement agreement has been terminated automatically as a result of the failure of the U.S. Bankruptcy Court to approve the settlement agreement by June 2, 2009 (sixty days from when Spansion filed a motion seeking U.S. Bankruptcy Court approval). In addition, as a result of the failure of the U.S. Bankruptcy Court to approve settlement agreement, the action by Samsung against Spansion Japan is no longer stayed, and the cases in the U.S. District Court and the ITC have resumed. A technical hearing was held on December 18, 2009, and a subsequent hearing was held January 28, 2010. On August 31, 2010, the Tokyo High Court issued a decision in case H21-Wa-1986 that Spansion Japan did not infringe the Samsung patent at issue in that case. The Tokyo High Court subsequently expressed its view that the patent in case H21-Wa-39933 is invalid. On November 29, 2010 a hearing was held. In response to the court’s suggestion for Samsung to withdraw the claims, Samsung told the court that it had no intention to withdraw the claims. The court will now proceed to deliver the decisions on these two cases. A hearing was held on January 18, 2011 to terminate both cases. A decision of the Tokyo High Court is expected by the end of March 2011.
32
Table of Contents
Samsung v. Spansion ITC Investigation
On July 31, 2009, Samsung filed a patent infringement complaint with the ITC against Spansion Inc. and Spansion LLC (collectively, “Spansion”), Spansion Japan Limited, and the following downstream respondents: Alpine Electronics, Inc., Alpine Electronics of America, Inc., D-Link Corporation, D-Link Systems, inc., Slacker, Inc., Synology, Inc., Synology North America Corp., Shenzhen Egreat Co., Ltd., EGreat USA, and Appro International, Inc. The ITC commissioned its investigation of Samsung’s complaint on August 27, 2009. Subsequently, certain of Spansion’s creditors sought an order from the U.S. Bankruptcy Court seeking a stay of Samsung’s ITC action. On October 1, 2009, the U.S. Bankruptcy Court issued an order granting the motion to stay Samsung’s ITC action against Spansion. Both Samsung and the ITC have appealed this order. The investigation has been terminated with respect to Slacker, Synology, Shenzhen Egreat, Egreat, and Appro International based on consent order stipulations entered into by those respondents. On September 22, 2010 the investigation was terminated with respect to U.S. Patent No. 6,930,050 without prejudice on Samsung’s unopposed motion. A hearing was held December 6-14, 2010, and the Initial Determination of the judge is expected in February 2011.
Samsung v. Spansion International, Inc.
On July 31, 2009, Samsung Electronics Co., Ltd. commended an action in the Fourth Civil Division of the Federal Court in Dusseldorf, Germany against Spansion International Inc. and other third parties alleging patent infringement since March 2, 2009 of German patent DE 693 27 499 T2 (EP 0 591 009 B1). The action seeks damages in the amount of € 500,000 (approximately $655,750 as of December 26, 2010). An initial hearing to establish the schedule for the case was set for October 20, 2009. On September 4, 2009, Spansion filed a motion seeking to enforce the automatic stay as to this action, and on November 4, 2009, the U.S. Bankruptcy Court issued an order granting Spansion’s motion to stay this action. On August 27, 2010, Spansion filed a nullity action (Case no. 2 Ni 22/10 (EP)) in the Federal Patent Court in Munich, Germany seeking a decision that the patent asserted by Samsung is invalid. A hearing in the infringement action has been scheduled for October 25, 2011.
Spansion LLC v. Samsung Electronics Co., Ltd., et al. (ITC)
On August 6, 2010, Spansion LLC filed a complaint (Investigation No. 337-TA-735) with the ITC seeking institution of an investigation by the ITC pursuant to Section 337 of the Tariff Act of 1930, as amended, with respect to violations of Section 337 based on the sale for importation into the United States, importation and/or sale within the United States after importation of Samsung Chips and downstream products containing those chips that infringe one or more claims of certain Spansion U.S. Patents. The proposed Respondents in the action are Samsung Electronics Co., Ltd., Samsung Electronics America, Inc., Samsung International, Inc., Samsung Semiconductor, Inc., Samsung Telecommunications America, LLC, Apple, Inc., BenQ Corp., BenQ America Corp., Qisda Corp., Kingston Technology Company, Inc., Kingston Technology (Shanghai) Co. Ltd., Kingston Technology Far East Co., Kingston Technology Far East (Malaysia) Sdn Bhd, MiTAC Digital Corporation (aka Magellan), MiTAC International Corporation, Nokia Corp., Nokia Inc., PNY Technologies, Inc., Research In Motion Ltd., Research In Motion Corporation, Sirius XM Radio Inc., Transcend Information Inc., Transcend Information, Inc. (US), and Transcend Information Inc. (Shanghai Factory).
The complaint alleges infringement of U.S. Patent Nos.: 7,018,922; 6,900,124; 6,459, 625; and 6,369,416, which are owned by Spansion. The Complaint seeks issuance of a permanent general exclusion order excluding from entry into the United States Samsung Chips and downstream products containing Samsung Chips as described and claimed in Spansion’s Patents, a permanent limited exclusion order excluding from entry into the United States Samsung Chips and all Respondents’ downstream products containing Samsung Chips as described and claimed in Spansion’s Patents, and a permanent cease and desist order prohibiting the importation, sale for importation, use, offering for sale, sale after importation, inventory for distribution, distribution, licensing, or otherwise transferring within the United States Samsung Chips and downstream products containing Samsung Chips.
33
Table of Contents
On September 7, 2010, the ITC issued a Notice of Investigation advising us that it has instituted an investigation based upon the Complaint filed by Spansion. On October 7, 2010, the judge issued an order establishing the procedural schedule in this action. The order sets certain procedural due dates including June 20, 2011 as the trial date, September 12, 2011 as the due date for the Initial Determination, and January 12, 2012 as the Target Date for completion of the investigation.
Spansion LLC v. Samsung Electronics Co., Ltd., et al (N.D. Cal.)
On August 6, 2010, Spansion LLC filed a complaint in the U.S. District Court for the Northern District of California—San Jose Division (CV 10-03446 JCS) for patent infringement against Samsung Electronics Co., Ltd., Samsung Electronics America, Inc., Samsung Telecommunications America, LLC, and Samsung Austin Semiconductor, LLC (“Samsung Defendants”). The complaint alleges infringement of U.S. Patent Nos.: 7,018,922; 6,900,124; 6,459, 625; and 6,369,416, which are owned by Spansion (“Spansion Patents”).
The Complaint seeks entry of a judgment that:
| • | the Samsung Defendants have infringed the Spansion Patents; |
| • | the infringement of the Spansion Patents has been willful; |
| • | the Samsung Defendants be preliminarily and permanently enjoined from infringement of the Spansion Patents; |
| • | Spansion be awarded compensatory damages, together with prejudgment interest and costs; |
| • | Spansion be awarded treble damages for willful past infringement; |
| • | This case be adjudged an exceptional case under 35 U.S.C. § 285 in favor of Spansion and that Spansion be awarded its costs, attorneys’ fees, and all other expenses incurred in this action; and |
| • | Spansion be awarded such other relief as the Court deems just and proper. |
This action has been stayed pending the ITC Investigation No. 337-TA-735 referenced above.
Spansion LLC v. Samsung Electronics Co., Ltd, et al (E.D. Va.)
On August 6, 2010, Spansion LLC filed a complaint in the U.S. District Court for the Eastern District of Virginia—Alexandria Division (1-10 CV 881 CMH/JFA) for patent infringement against Samsung Electronics Co., Ltd., Samsung Electronics America, Inc., Samsung Telecommunications America, LLC, and Samsung Austin Semiconductor, LLC (“Samsung Defendants”). The complaint alleges infringement of U.S. Patent Nos.: 7,151,027; 6,359,307; and 6,232,630, which are owned by Spansion (“Spansion Patents”).
The Complaint seeks entry of a judgment that:
| • | the Samsung Defendants have infringed the Spansion Patents; |
| • | the infringement of the Spansion Patents has been willful; |
| • | the Samsung Defendants be preliminarily and permanently enjoined from infringement of the Spansion Patents; |
| • | Spansion be awarded compensatory damages, together with prejudgment interest and costs; |
| • | Spansion be awarded treble damages for willful past infringement; |
| • | This case be adjudged an exceptional case under 35 U.S.C. § 285 in favor of Spansion, and that Spansion be awarded its costs, attorneys’ fees, and all other expenses incurred in this action; and |
| • | Spansion be awarded such other relief as the Court deems just and proper. |
34
Table of Contents
Samsung filed a motion to transfer this case to the Northern District of California. A hearing on this motion was held on October 22, 2010 at which the judge denied the motion. On October 28, 2010, Samsung filed an answer to the Complaint denying the allegations and alleging infringement by Spansion of three Samsung U.S. patent: 6,777,812; 6,602,733; and 5,508,564. On January 4, 2011, the court issued a scheduling order setting a final pretrial conference for April 21, 2011, with trial expected to be then set for a date four to eight weeks later.
Spansion LLC v. Samsung Electronics Co., Ltd, et al (W.D. Wi.)
On August 13, 2010, Spansion LLC filed a complaint in the U.S. District Court for the Western District of Wisconsin (Civil Action No. 3:10-cv-453) for patent infringement against Samsung Electronics Co., Ltd., Samsung Electronics America, Inc., Samsung Telecommunications America, LLC, and Samsung Austin Semiconductor, LLC (“Samsung Defendants”). The complaint alleges infringement of U.S. Patent Nos.: 5,793,677 (“Spansion Patent”).
The Complaint seeks entry of a judgment that:
| • | the Samsung Defendants have infringed the Spansion Patent; |
| • | the infringement of the Spansion Patent has been willful; |
| • | the Samsung Defendants be preliminarily and permanently enjoined from infringement of the Spansion Patent; |
| • | Spansion be awarded compensatory damages, together with prejudgment interest and costs; |
| • | Spansion be awarded treble damages for willful past infringement; |
| • | This case be adjudged an exceptional case under 35 U.S.C. § 285 in favor of Spansion, and that Spansion be awarded its costs, attorneys’ fees, and all other expenses incurred in this action; and |
| • | Spansion be awarded such other relief as the Court deems just and proper. |
On October 28, 2010, Samsung filed an answer to the Complaint denying the allegations and alleging infringement by Spansion of two Samsung U.S. patents: 6,734,065 and 6,828,229. In addition, on October 29, 2010, Samsung filed a motion to transfer this case to the Northern District of California. A hearing date on this motion has not yet been set. Discovery is ongoing. Trial has been set for February 27, 2012.
Spansion v. Samsung Electronics Co., Ltd, et al (W.D. Wi.)
On November 8, 2010, Spansion LLC filed a complaint in the U.S. District Court for the Western District of Wisconsin (Civil Action No. 3:10-cv-685) for patent infringement against Samsung Electronics Co., Ltd., Samsung Electronics America, Inc., Samsung Telecommunications America, LLC, and Samsung Austin Semiconductor, LLC (“Samsung Defendants”). The complaint alleges infringement of U.S. Patent Nos.: 5,715,194 (“Spansion Patent”).
The Complaint seeks entry of a judgment that:
| • | the Samsung Defendants have infringed the Spansion Patent; |
| • | the infringement of the Spansion Patent has been willful; |
| • | the Samsung Defendants be preliminarily and permanently enjoined from infringement of the Spansion Patent; |
| • | Spansion be awarded compensatory damages, together with prejudgment interest and costs; |
| • | Spansion be awarded treble damages for willful past infringement; |
35
Table of Contents
| • | This case be adjudged an exceptional case under 35 U.S.C. § 285 in favor of Spansion, and that Spansion be awarded its costs, attorneys’ fees, and all other expenses incurred in this action; and |
| • | Spansion be awarded such other relief as the Court deems just and proper. |
On December 12, 2010, Samsung filed a motion to stay this action because of the Samsung ITC Investigation referenced above that involves the same patent. Samsung also filed a motion to transfer this case. These motions are pending. Trial has been set for March 19, 2012. On February 7, 2011, Samsung filed an answer to the complaint denying the allegations and alleging infringement by Spansion of three Samsung U.S. patents: 6,383,882; 6,806,574; and 7,005,373. Samsung also alleged tortious interference with Samsung’s business relationships and malicious prosecution.
| ITEM 4. | SUBMISSION OF MATTERS TO A VOTE OF SECURITY HOLDERS |
No matters were submitted to a vote of security holders during the fourth quarter of the fiscal year covered by this Report.
36
Table of Contents
PART II
| ITEM 5. | MARKET FOR REGISTRANT’S COMMON EQUITY, RELATED STOCKHOLDER MATTERS AND ISSUER PURCHASES OF EQUITY SECURITIES |
Market Price of Common Stock
Pursuant to the Plan of Reorganization (see Part II, Item 7 “Management’s Discussion and Analysis of Financial Condition and Results of Operations—The Chapter 11 Cases and Emergence—General Information”), all outstanding shares of our Class A common stock outstanding prior to the Emergence Date were cancelled effective May 10, 2010. Our new Class A common stock issued in accordance with the Plan of Reorganization was initially listed on the New York Stock Exchange Amex LLC, or NYSE Amex, from May 18, 2010 to June 23, 2010. On June 23, 2010, the Class A common stock was transferred from the NYSE Amex to The New York Stock Exchange, or NYSE, under the symbol “CODE.” The following table sets forth the high and low per share sales prices for our new Class A common stock, as reported by the NYSE Amex and the NYSE, as applicable.
| High | Low | |||||||
| Fiscal Year Ended December 26, 2010 |
||||||||
| Fourth Quarter |
$ | 20.95 | $ | 14.09 | ||||
| Third Quarter |
$ | 17.96 | $ | 13.73 | ||||
| Second Quarter (from May 10, 2010) |
$ | 20.00 | $ | 10.51 | ||||
As of February 17, 2011, there were 414 holders of record of our Class A common stock. Because many of our shares are held by brokers and other institutions on behalf of stockholders, we are unable to estimate the total number of stockholders represented by these record holders. The closing sale price of our New Common Stock on February 17, 2011 was $21.12 per share.
We currently do not plan to pay dividends on shares of our Class A common stock in the foreseeable future and are currently prohibited from doing so in specific circumstances under agreements governing our borrowing arrangements.
The information under the caption “Equity Compensation Plan Information” in Part III, Item 12 of this Annual Report on Form 10-K is incorporated herein by reference.
37
Table of Contents
Stock Performance Graph
This performance graph shall not be deemed “filed” for purposes of Section 18 of the Securities Exchange Act of 1934, as amended (the Exchange Act), or incorporated by reference into any filing of Spansion under the Securities Act of 1933, as amended, or the Exchange Act, except as shall be expressly set forth by specific reference in such filing.
The following graph shows a comparison from May 18, 2010, (the date our Class A common stock commenced trading) through December 26, 2010 of the cumulative total return for our Class A common stock, the NYSE Composite Index and the S&P Semiconductors Index. Such returns are based on historical results and are not intended to suggest future performance. Data for the NYSE Composite Index and the S&P Semiconductors Index assume reinvestment of dividends.
COMPARISON OF 8 MONTH CUMULATIVE TOTAL RETURN*
Among Spansion Inc., the NYSE Composite Index
and the S&P Semiconductors Index
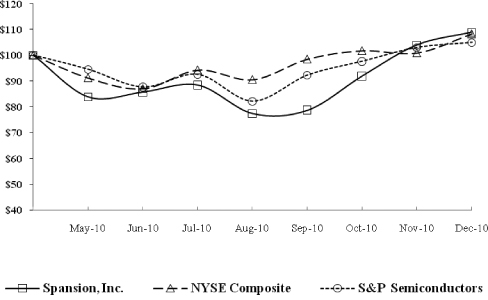
| * | $100 invested on 5/18/2010 in Spansion Inc. Class A common stock (CODE) or 4/30/2010 in NYSE Composite index or S&P Semiconductors index, including reinvestment of dividends. The graph shows the cumulative total returns from 5/10 (May 2010) to 12/10 (December 2010). |
| Fiscal year ending December 26, 2010. |
38
Table of Contents
| ITEM 6. | SELECTED FINANCIAL DATA |
The following summary historical financial data should be read in conjunction with “Management’s Discussion and Analysis of Financial Condition and Results of Operations” and our consolidated financial statements and related notes included elsewhere in this Annual Report on Form 10-K.
Fiscal years in the table below included 52 weeks each, except for fiscal 2006, which included 53 weeks.
| Year Ended December 26, 2010 | ||||||||||||||||||||||||||||
| Successor(1) | Predecessor(1) | Predecessor | ||||||||||||||||||||||||||
| Period from May 11, 2010 to December 26, 2010 |
Period from December 28, 2009 to May 10, 2010 |
Year Ended December 27, 2009 |
Year Ended December 28, 2008 |
Year Ended December 30, 2007 |
Year Ended December 31, 2006 |
|||||||||||||||||||||||
| (in thousands, except per share amounts) | ||||||||||||||||||||||||||||
| Statement of Operations Data: |
||||||||||||||||||||||||||||
| Net sales |
$ | 759,886 | $ | 324,914 | $ | 1,061,487 | $ | 1,630,573 | $ | 1,627,253 | $ | 1,310,479 | ||||||||||||||||
| Net sales to related party |
4,801 | 78,705 | 349,166 | 651,230 | 873,560 | 1,268,795 | ||||||||||||||||||||||
| Total net sales |
764,687 | 403,619 | 1,410,653 | 2,281,803 | 2,500,813 | 2,579,274 | ||||||||||||||||||||||
| Cost of sales |
647,381 | 274,817 | 1,103,757 | 2,193,345 | 2,065,143 | 2,063,639 | ||||||||||||||||||||||
| Gross profit |
117,306 | 128,802 | 306,896 | 88,458 | 435,670 | 515,635 | ||||||||||||||||||||||
| Other expenses: |
||||||||||||||||||||||||||||
| Research and development |
65,414 | 35,068 | 136,449 | 431,808 | 436,785 | 342,033 | ||||||||||||||||||||||
| Sales, general and administrative |
122,478 | 68,105 | 216,298 | 253,878 | 239,317 | 264,358 | ||||||||||||||||||||||
| In-process research and development |
— | — | — | 10,800 | — | — | ||||||||||||||||||||||
| Restructuring charges |
— | (2,772 | ) | 46,852 | 11,161 | — | — | |||||||||||||||||||||
| Asset impairment charges(2) |
— | — | 12,538 | 1,652,622 | — | — | ||||||||||||||||||||||
| Operating income (loss) before reorganization items |
(70,586 | ) | 28,401 | (105,241 | ) | (2,271,811 | ) | (240,432 | ) | (90,756 | ) | |||||||||||||||||
| Interest and other income, net |
175 | (2,904 | ) | 4,038 | 5,200 | 32,595 | 11,681 | |||||||||||||||||||||
| Interest expense(3) |
(24,180 | ) | (30,573 | ) | (50,976 | ) | (105,536 | ) | (87,460 | ) | (74,156 | ) | ||||||||||||||||
| Gain on deconsolidation of subsidiary(4) |
— | — | 30,100 | — | — | — | ||||||||||||||||||||||
| Loss before reorganization items and income taxes |
(94,591 | ) | (5,076 | ) | (122,079 | ) | (2,372,147 | ) | (295,297 | ) | (153,231 | ) | ||||||||||||||||
| Reorganization items |
— | 370,340 | (391,383 | ) | — | — | — | |||||||||||||||||||||
| Income (loss) before income taxes |
(94,591 | ) | 365,264 | (513,462 | ) | (2,372,147 | ) | (295,297 | ) | (153,231 | ) | |||||||||||||||||
| (Provision) benefit for income taxes(5) |
(2,101 | ) | (1,640 | ) | (597 | ) | (62,865 | ) | 25,144 | 2,215 | ||||||||||||||||||
| Net income (loss) |
$ | (96,692 | ) | $ | 363,624 | $ | (514,059 | ) | $ | (2,435,012 | ) | $ | (270,153 | ) | $ | (151,016 | ) | |||||||||||
| Net income (loss) per common share |
||||||||||||||||||||||||||||
| Basic |
$ | (1.60 | ) | $ | 2.24 | $ | (3.18 | ) | $ | (15.69 | ) | $ | (2.00 | ) | $ | (1.17 | ) | |||||||||||
| Diluted(6) |
$ | (1.60 | ) | $ | 2.24 | $ | (3.18 | ) | $ | (15.69 | ) | $ | (2.00 | ) | $ | (1.17 | ) | |||||||||||
| Shares used in per share calculation: |
||||||||||||||||||||||||||||
| Basic |
60,479 | 162,439 | 161,847 | 155,162 | 134,924 | 128,965 | ||||||||||||||||||||||
| Diluted(6) |
60,479 | 162,610 | 161,847 | 155,162 | 134,924 | 128,965 | ||||||||||||||||||||||
| December 26, 2010 |
December 27, 2009 |
December 28, 2008 |
December 30, 2007 |
December 31, 2006 |
||||||||||||||||||||||||
| Balance Sheet Data: |
||||||||||||||||||||||||||||
| Cash, cash equivalents and marketable securities |
$ | 354,273 | $ | 425,238 | $ | 116,387 | $ | 415,742 | $ | 885,769 | ||||||||||||||||||
| Working capital (deficit) |
439,970 | 553,023 | (1,183,337 | ) | 592,518 | 1,085,027 | ||||||||||||||||||||||
| Total assets |
1,399,305 | 1,437,977 | 1,773,872 | 3,813,863 | 3,547,726 | |||||||||||||||||||||||
| Long-term debt and capital lease obligations, including current portion, short term note, and notes payable to banks under revolving loans |
454,509 | 64,150 | 1,442,782 | 1,294,189 | 1,004,036 | |||||||||||||||||||||||
| Liabilities subject to compromise |
— | 987,127 | — | — | — | |||||||||||||||||||||||
| Total stockholders’ equity (deficit) |
624,285 | (857,693 | ) | (450,647 | ) | 1,737,810 | 1,957,780 | |||||||||||||||||||||
| (1) | Please refer to Note 2 of the Notes to Consolidated Financial Statements for explanation of basis of ‘Successor’ and ‘Predecessor’ presentations. |
39
Table of Contents
| (2) | The asset impairment charge for fiscal 2009 includes pre-tax impairment on an equity investment and loan to an investee. The asset impairment charge for fiscal 2008 includes pre-tax impairment related to long-lived assets held for use of $1.6 billion, and impairment related to goodwill and intangible assets of $20.8 million and $53.5 million, respectively. |
| (3) | Contractual interest expense for the year ended December 27, 2009 was approximately $89.4 million. |
| (4) | The gain on deconsolidation of subsidiary represents the difference between the carrying value of our investment in and receivables from Spansion Japan immediately before deconsolidation and the estimated fair value of our retained non-controlling interest in Spansion Japan, which was zero then and as of December 27, 2009. |
| (5) | The provision for income taxes in fiscal 2009 includes a decrease of $457.9 million in valuation allowances against deferred tax assets in our Japanese subsidiary resulting from the deconsolidation of our Japanese subsidiary in March 2009. However, the decrease in the amount of deferred tax assets had no impact on the provision for income taxes since the deferred tax assets had a full valuation allowance. The provision for income taxes in fiscal 2008 includes an increase of $462.6 million in valuation allowances against deferred tax assets in foreign jurisdictions. This increase occurred because we did not believe it was more likely than not that these deferred tax assets would be realized in these jurisdictions. The increase in valuation allowance resulted in a $64.5 million income tax expense associated with deferred tax assets of Spansion Japan. |
| (6) | Diluted net loss per share is computed using the weighted-average number of common shares and excludes potential common shares, as their effect is anti-dilutive. |
40
Table of Contents
| ITEM 7. | MANAGEMENT’S DISCUSSION AND ANALYSIS OF FINANCIAL CONDITION AND RESULTS OF OPERATIONS |
The following discussion of our financial condition and results of operations should be read in conjunction with the consolidated financial statements and related notes as of December 26, 2010 and December 27, 2009 and for the fiscal years ended December 26, 2010, December 27, 2009, and December 28, 2008, which are elsewhere in this Annual Report on Form10-K.
Executive Summary
Historically, one-half or more of our revenues came from cell phone manufacturers, or the “wireless” market. Over the last decade, the dynamics of that market changed as a result of increasing feature sets that drove an increased need for data storage that favored an implementation of NAND over NOR memory architectures, and a consolidation of cell phone manufacturers. At the same time, customers constituting a large portion of demand for NOR Flash memory demanded increasing investment in engineering and leading edge wafer manufacturing capability, as well as ever faster decreases in the prices for products. These changes adversely impacted our operational performance and financial results to unsustainable levels.
Shortly after entering the Chapter 11 bankruptcy proceedings, we began exiting a large portion of the wireless market and focusing on the embedded market. While this significantly reduced our revenue, it allowed us to significantly reduce our engineering expenses without impairing our ability to compete in other areas of the Flash memory market. Our exit from a large portion of the wireless market, related reductions in research and development spending and capital expenditures, combined with other cost reductions including disposal of manufacturing facilities, enabled us to begin generating significant cash flow. Ultimately, we achieved modest profitability in the second half of 2009 despite a significant decline in our net sales.
We continue to be a leader in the NOR portion of the Flash memory market and remain dedicated to, and focused on, the embedded market, which uses code storage in industrial, consumer, communications, gaming and automotive applications. We intend to continue to selectively engage in portions of the wireless market where we can do so advantageously. We believe that although the embedded market is mature and will grow more slowly than some other sectors of the semiconductor industry, we can compete successfully with our continued focus on providing best-in-class customer service, quality and reliability and solutions engineering. We also believe that we can mitigate the historical and anticipated trend of selling price reductions by serving applications with growing unit demand, migrating customers to higher density and more feature-rich devices, capturing market share and expanding our product offerings.
Circumstances Leading to the Commencement of Bankruptcy Proceedings in 2009
A variety of external economic factors contributed to the decline in our operating performance prior to our seeking relief under Chapter 11 of the U.S. Bankruptcy Code, such as persistent oversupply in the Flash memory industry compounded by the global economic recession, which significantly reduced demand for our products beginning in the fourth quarter of 2008 and continues to negatively impact demand. These two factors were further complicated by our inability to obtain the additional external financing necessary to meet capital expenditure needs and operational costs in a market characterized by swift technological advances and constantly changing manufacturing processes.
Our strategy was historically based on aggressive revenue and market share growth, leveraging advanced technology and low cost, high-volume manufacturing. In our 2006 long range planning cycle, forecasted revenue growth supported the construction of a $1.2 billion advanced wafer fabrication facility called SP1. Debt financing was arranged and construction on SP1 commenced in early 2007.
Although we continued to increase our NOR memory market segment share, steep ASP declines during the first half of 2007 negatively affected revenue and operating cash flow. At that time, we anticipated an
41
Table of Contents
improvement in the market environment for the second half of 2007 and aggressively continued the construction of SP1 and incurred associated capital expenditures with the ultimate goal of significant cost reductions that would enhance our competitive position.
During the second half of 2007, the ASP environment stabilized relative to earlier in the year. However, we faced customer qualification issues resulting in a shortfall of anticipated revenue and increased inventory levels which contributed to our failure to meet financial performance targets in the second half of 2007. For fiscal 2007, cash flow from operations was $216.3 million, which was significantly lower than anticipated. Driven by the SP1 and investments in our research and development facilities, our capital spending in 2007 was approximately $1.1 billion.
Our 2008 operating plan included capital expenditures of approximately $535.0 million, of which approximately 80 percent was expected to occur in the first half of the year in order to complete the phase 1 SP1. Upon completion of the first phase, SP1 was anticipated to generate approximately $300 million in revenue in 2008.
In the first quarter of 2008, we lost liquidity in our investment in $121.9 million of AAA/Aaa-rated auction rate securities, or ARS, because the auctions in which these ARS were traded failed. Throughout the second and third quarters of 2008, the credit markets continued to deteriorate and we intensified our cash management efforts. Operationally, the ramp-up of SP1 was delayed due to slower than expected customer qualifications and a sharp decline in the Japanese wireless market. In the third quarter of 2008, we engaged investment bankers and capital restructuring advisors to evaluate the situation and to accelerate plans to improve liquidity. Multiple initiatives were launched and/or accelerated, including efforts to sell production facilities, raise capital and seek liquidity options for the ARS.
In the fourth quarter of 2008, the macroeconomic environment deteriorated significantly, causing a sharp decline in worldwide demand for consumer goods, and consequently a sharp reduction of demand for our products. Furthermore, continued tightening of credit availability and general market liquidity initiatives curtailed our ability to execute the liquidity initiatives launched in the third quarter of 2008. As these events unfolded, we intensified our strategic restructuring efforts to include, among other things, pursuing a potential sale of some or all of our assets. The sharp decline in demand, coupled with our inability to execute liquidity initiatives limited our ability to generate sufficient funding for our operations and meet our debt servicing requirements, ultimately leading to our seeking relief under Chapter 11 of the U.S. Bankruptcy Code.
The Chapter 11 Cases and Emergence
General Information
On March 1, 2009, Spansion Inc., Spansion LLC, Spansion Technology LLC, Spansion International, Inc., and Cerium Laboratories LLC (collectively, the Debtors) each filed a voluntary petition for relief under the Chapter 11 Cases. On May 10, 2010 (the Emergence Date), the Debtors emerged from the Chapter 11 Cases, following the confirmation of the Plan of Reorganization.
Upon emergence from the Chapter 11 Cases, we adopted fresh start accounting in accordance with the Financial Accounting Standards Board (FASB) Accounting Standards Codification (ASC) 852 “Reorganizations.” The adoption of fresh start accounting resulted in us becoming a new entity for financial reporting purposes. Accordingly, the Consolidated Financial Statements on or after May 11, 2010 are not comparable to the Consolidated Financial Statements prior to that date.
We qualified for fresh start accounting, in accordance with ASC 852, due to:
| • | the reorganization value of the Debtors’ assets immediately before the date of confirmation being less than the total of all their post-petition liabilities and allowed claims; and |
42
Table of Contents
| • | holders of our existing voting shares immediately before confirmation receiving less than 50 percent of the voting shares following the Emergence Date. |
Reorganization value is the value attributed to the reorganized entity, in addition to the expected net realizable value of those assets that will be disposed of before reorganization occurs. This reorganization value is viewed as the fair value of the entity before considering liabilities and approximates the amount a willing buyer would pay for the assets of the entity immediately after the reorganization. Reorganization value is generally determined by discounting future cash flows. Immediately prior to the Emergence Date, the Debtors’ reorganization value of $1.2 billion was less than the sum of post-petition liabilities of $617 million and allowed claims of $939 million.
Also, holders of Class A common stock outstanding prior to the Emergence Date (Old Common Stock) did not receive any consideration for their shares or any pre-determined allocation of Class A common stock of the reorganized Company (New Common Stock). Holders of New Common Stock issued by the reorganized Company after the Emergence Date primarily include unsecured creditors who have received or will receive shares of New Common Stock in settlement of their allowed claims, and participants in a rights offering that we conducted in February 2010, as described below under “—Effectiveness of the Plan and Exit Financing.”
Fresh start accounting required resetting the historical net book values of our assets and liabilities as of Emergence Date to the related fair values by allocating our reorganization value to our assets and liabilities pursuant to ASC 805 “Business Combinations” and ASC 852-10 “Reorganizations.” The excess reorganization value over the fair value of tangible and identifiable intangible assets has been recorded as goodwill on our Consolidated Balance Sheet. Deferred taxes have been determined in conformity with ASC 740 “Income Taxes.” For additional information regarding the impact of fresh start accounting on our Consolidated Balance Sheet as of the Emergence Date, see Note 2 to our Consolidated Financial Statements included in Part II, Item 8 of this Annual Report.
References herein in the Management’s Discussion and Analysis of Financial Condition and Results of Operations and the financial statements to the “Successor” refer to Spansion and its consolidated subsidiaries after May 10, 2010, after giving effect to: (i) the cancellation of Old Common Stock issued prior to May 10, 2010; (ii) the issuance of New Common Stock and settlement of existing debt and other adjustments in accordance with the Plan; and (iii) the application of fresh start accounting. References to the “Predecessor” refer to Spansion and its consolidated subsidiaries up to May 10, 2010.
Effectiveness of the Plan and Exit Financing
Under the Plan, most holders of allowed general, unsecured claims against the Predecessor received or will receive New Common Stock in satisfaction of their claims. Holders of allowed general, unsecured claims subject to a low payout threshold received cash in satisfaction of their claims. Holders of Senior Secured Floating Rate Notes (FRNs) received cash of approximately $638 million to fully discharge their claims. The $638 million was primarily provided by the exit financing discussed below.
Pursuant to the Plan, the holders of allowed claims were offered the right to purchase a total of 12,974,496 shares of the New Common Stock upon emergence from the Chapter 11 Cases at a price of $8.43 per share (Rights Offering). The number of shares available to each eligible claimant was based on each claimant’s proportionate allowed claim. In connection with the Rights Offering, we entered into a Backstop Rights Purchase Agreement with Silver Lake Management Company Sumeru, LLC whereby they committed to purchase the remaining balance of Rights Offering shares that are not otherwise subscribed for by the Rights Offering participants. Based on the agreement, Silver Lake Management Company Sumeru, LLC purchased 3,402,704 shares of the New Common Stock that had not been subscribed for by the Rights Offering participants. As of May 10, 2010, we received net proceeds of approximately $104.9 million through the Rights Offering, which was used in full to partially discharge the FRN claims.
43
Table of Contents
On February 9, 2010, we closed a five-year Senior Secured Term Loan agreement of $450 million with a group of lenders. The proceeds of the Senior Secured Term Loan, together with cash proceeds from other sources of cash available to us, were used in full to partially discharge the remaining balance of the FRN claims. See Note 12 of the Notes to Consolidated Financial Statements for more information.
On May 10, 2010, we entered into a senior revolving credit facility agreement (Revolving Credit Facility) with Bank of America and other financial institutions in an aggregate amount of up to $65 million to fund bankruptcy related expenses and ongoing working capital. As of December 26, 2010, we have not drawn under this facility which was entered into as a pre-condition to obtaining the Senior Secured Term Loan facility. See Note 12 of the Notes to Consolidated Financial Statements for more information.
The Plan contemplates the distribution of 65.8 million shares of New Common Stock, consisting of: (i) 46,247,760 shares to holders of allowed general, unsecured claims; (ii) 12,974,496 shares to subscribers of the Rights Offering; and (iii) 6,580,240 shares reserved for issuance to eligible employees in connection with grants of stock options and restricted stock units (RSUs) under our new 2010 Equity Incentive Award Plan (the 2010 Plan). As of December 26, 2010, we had granted options to purchase 3,027,943 shares of New Common Stock and 3,040,566 RSUs under the 2010 Plan to our directors and employees, and 511,731 shares were eligible for future equity awards.
In accordance with the Plan, holders of Old Common Stock , or stock options exercisable for Old Common Stock and RSUs which convert into Old Common Stock, outstanding as of May 10, 2010 did not receive any distributions, and their equity interests were cancelled on May 10, 2010.
Business Relationship with Spansion Japan and Foundry Agreement
Prior to the Debtors’ filing of the Chapter 11 Cases, on February 10, 2009, Spansion Japan Limited, a wholly-owned subsidiary of Spansion LLC (Spansion Japan) filed a proceeding under the Corporate Reorganization Law of Japan to obtain protection from Spansion Japan’s creditors (the Spansion Japan Proceeding). On March 3, 2009 the Tokyo District Court approved the filing of the Spansion Japan Proceeding and appointed the incumbent representative director of Spansion Japan as trustee. As a result, we no longer controlled Spansion Japan despite our 100 percent equity ownership interest and, effective March 3, 2009, we deconsolidated Spansion Japan and have accounted for its interest in Spansion Japan as a cost basis investment. Effective September 28, 2010, our 100 percent equity ownership interest in Spansion Japan was extinguished by the Tokyo District Court and Spansion Japan was no longer our subsidiary.
Spansion Japan manufactured and supplied silicon wafers, and provided sort services to us through August 31, 2010 when Spansion Japan sold its manufacturing facilities (known as JV3 and SP1) located at Aizu Wakamatsu, Japan to a subsidiary of Texas Instruments Incorporated (TI) which began to provide such services to us on September 1, 2010. Spansion Japan also functioned as the sole distributor of our products in Japan whereby it purchased products from us and sold them to customers in Japan, primarily through a subsidiary of Fujitsu Limited. The wafers purchased from Spansion Japan were a material component of our cost of goods sold, and historically the wafer prices were governed by a foundry agreement. Management believed that the prices under that foundry agreement greatly exceeded the amounts that the U.S. Bankruptcy Court would have required us to pay for wafers purchased during the period from February 9, 2009 through October 27, 2009 (the date when Spansion and Spansion Japan mutually agreed to pricing terms through executed purchase orders).
After unsuccessful efforts by us and Spansion Japan to renegotiate the prices under the foundry agreement, we filed a motion with the U.S. Bankruptcy Court in October 2009 to reject the foundry agreement. An order rejecting the foundry agreement was issued by the U.S. Bankruptcy Court on November 19, 2009. As a result, there was no valid contract establishing pricing for the wafers we received from Spansion Japan from February 9, 2009 through October 27, 2009 (Disputed Period).
On January 8, 2010, we reached an agreement in principle (the Settlement) with Spansion Japan, subject to the completion of definitive agreements and our emergence from the Chapter 11 Cases, to: (i) acquire Spansion
44
Table of Contents
Japan’s distribution business; (ii) obtain foundry services, including wafer and sort services, from Spansion Japan; (iii) resolve our dispute with Spansion Japan relating to pricing of wafers purchased during the Disputed Period; and (iv) pay to Spansion Japan of approximately $45 million of which approximately $10 million was outstanding as of December 26, 2010. The outstanding balance of $10 million will be fully settled in the first quarter of fiscal 2010. The U.S. Bankruptcy Court and the Tokyo District Court approved the Settlement on January 29, 2010 and February 1, 2010, respectively.
On February 2, 2010, we entered into a foundry agreement with Spansion Japan whereby we agreed to purchase from Spansion Japan: (i) a minimum of 10 billion yen (equivalent to approximately $120.7 million at December 26, 2010) worth of wafers over six quarters, beginning with the first quarter of 2010 and ending with the second quarter of 2011; and (ii) minimum sort services of $7.7 million for the first quarter of 2010 and $8.9 million for each quarter from the second quarter of 2010 to the second quarter of 2011, with both sort services and wafer production to be subject to normal and customary foundry performance conditions. On March 29, 2010, we executed with Spansion Japan various agreements implementing the Settlement, which included the purchase of Spansion Japan’s distribution business, which was consummated on May 24, 2010 for a total cash purchase price of $13.1 million. With the acquisition of Spansion Japan’s distribution business, all material conditions of the Settlement were fulfilled and we set off the receivable and payable balances due from/to Spansion Japan as of October 27, 2009 (the date when we and Spansion Japan mutually agreed to pricing terms through executed purchase orders). All transactions with Spansion Japan are now being settled on a regular basis on mutually agreed upon terms.
The purchase price relating to the acquisition of Spansion Japan’s distribution business was allocated to the acquired business based on its estimated fair values as of May 24, 2010, as set forth below:
| In millions | ||||
| Tangible assets |
$ | 1.5 | ||
| Customer relationships |
10.1 | |||
| Goodwill |
3.3 | |||
| Liabilities |
(1.8 | ) | ||
| Total purchase price |
$ | 13.1 | ||
See Note 6 of the Notes to the Consolidated Financial Statements for more information relating to the above intangible assets.
Until May 24, 2010, Spansion Japan continued in its historical role as the sole distributor of our products in Japan. After the purchase of the distribution business from Spansion Japan on May 24, 2010, we distribute our products in Japan through our wholly owned subsidiary, Nihon Spansion Limited.
Effective June 27, 2010, Spansion Japan’s Plan of Reorganization (the POR) was confirmed by the Tokyo District Court. The POR provided for Spansion Japan to redeem shares held by its shareholders without consideration, cancel such shares and issue new shares to unsecured creditors. The redemption, cancellation and new issuance were completed effective September 28, 2010. As a result, we no longer had any equity ownership of Spansion Japan. Until this date, we had accounted for our interest in Spansion Japan as a cost basis investment since we had not controlled Spansion Japan since March 3, 2009.
On August 31, 2010, Spansion Japan sold its manufacturing facilities to a subsidiary of TI. At the same time, we terminated our foundry agreement with Spansion Japan and entered into a new foundry agreement with TI whereby we agreed to purchase from TI: (i) a minimum of $235.5 million worth of wafers over eight quarters, beginning with the third quarter of 2010 and ending with the second quarter of 2012; and (ii) minimum sort services of $8.9 million for each quarter from the fourth quarter of 2010 to the second quarter of 2011 and $8.5 million each from the third quarter of 2011 through the second quarter of 2012, with both sort services and wafer
45
Table of Contents
production to be subject to normal and customary foundry performance conditions. The foundry agreement with TI stipulates the minimum purchases for wafers and sort services in Japanese Yen and United States Dollars (USD) respectively. Minimum wafer purchase commitments as disclosed above were translated in to USD as of December 26, 2010 and are subject to currency fluctuations over the term of the foundry agreement.
Pursuant to the Plan, a claims agent has been appointed to analyze and, at the claims agent’s discretion, contest outstanding disputed claims totaling $1.5 billion, which included the $936 million general unsecured proof of claim filed by Spansion Japan as a result of the November 19, 2009 foundry agreement rejection order. The Company accrued its best estimate of the liability which was included in the $938.5 million of liabilities subject to compromise as of the Emergence Date. Since these claims are being handled by the claims agent and are under the jurisdiction of the U.S. Bankruptcy Court, their sole recourse is to receive shares reserved under the plan and, therefore, any outcome of the claims adjudication process will have no direct impact on the Successor.
On October 20, 2010, the claims agent entered into an agreement with Spansion Japan to settle all claims asserted by and between Spansion Japan and the chapter 11 estates of the Debtors. Spansion Japan had asserted a claim for approximately $936 million related to damages allegedly incurred as a result of our rejection of our foundry agreement with Spansion Japan. The claims agent had been engaged in litigation with Spansion Japan over the amount of damages sustained by Spansion Japan. As part of the agreement, Citigroup Global Markets Inc. (Citi), which was not a party to this litigation, purchased the rejection damages claim from Spansion Japan for $100 million in cash. In separate transactions, the claims agent agreed to allow the rejection damages claim held by Citi in the amount of $200 million, and we purchased 85 percent of the allowed claim from Citi for $85 million in cash which was recorded as an adjustment to the Successor’s Stockholders’ Equity. See the Consolidated Statement of Stockholders’ Equity (Deficit) for more information.
Basis of Presentation
The accompanying consolidated financial statements have been prepared in accordance with U.S. generally accepted accounting principles (U.S. GAAP). In preparing the Consolidated Financial Statements for the Predecessor, we applied ASC 852 “Reorganizations,” which requires that the financial statements, for periods subsequent to the Chapter 11 filing, distinguish transactions and events that were directly associated with the reorganization from the ongoing operations of the business. Accordingly, professional fees associated with the Chapter 11 Cases and certain gains and losses resulting from reorganization of our business have been reported separately as reorganization items. In addition, interest expense for the Predecessor has been reported only to the extent that it was paid during the Chapter 11 Cases or that it was probable that it would be an allowed priority, secured, or unsecured claim under the Chapter 11 Cases. Interest income earned during the Chapter 11 Cases is reported as a reorganization item.
Upon emergence from Chapter 11, we adopted fresh start accounting in accordance with ASC 852 “Reorganizations”. The adoption of fresh start accounting results in us becoming a new entity for financial reporting purposes. Accordingly, the Consolidated Financial Statements on or after May 10, 2010 are not comparable to the Consolidated Financial Statements prior to that date. Our Consolidated Statements of Operations for fiscal year ended December 26, 2010 and for subsequent periods through fiscal year 2012 will be split into Predecessor and Successor financial statements for as long as any Predecessor financial statements are disclosed.
Fresh start accounting requires resetting the historical net book value of assets and liabilities to fair value by allocating the entity’s reorganization value to its assets and liabilities pursuant to ASC 805 “Business Combinations” and ASC 820 “Fair Value Measurements and Disclosures”. The excess reorganization value over the fair value of tangible and identifiable intangible assets is recorded as goodwill on the Consolidated Balance Sheet. Deferred taxes are determined in conformity with ASC 740 “Income Taxes”. For additional information regarding the impact of fresh start accounting on our Consolidated Balance Sheet as of December 26, 2010, see Note 2 to our Consolidated Financial Statements included in Part II, Item 8 of this Annual Report.
46
Table of Contents
Furthermore, effective March 3, 2009, we deconsolidated Spansion Japan because, despite its 100 percent equity ownership interest, we no longer controlled Spansion Japan due to the appointment of a trustee in the Spansion Japan Proceeding. Since March 3, 2009, we have accounted for its interest in Spansion Japan as a cost basis investment. Transactions between us and Spansion Japan after March 3, 2009, have been reflected as transactions with a third party. Effective, September 28, 2010, the Company’s 100 percent equity ownership interest in Spansion Japan was extinguished by the Tokyo District Court. See “Business Relationship with Spansion Japan and Foundry Agreement” above for further details.
With the exception of Spansion Japan as described above, the consolidated financial statements include all our accounts and those of its wholly owned subsidiaries, and all intercompany accounts and transactions have been eliminated.
Critical Accounting Policies and Estimates
Our discussion and analysis of our financial condition and results of operations are based upon our consolidated financial statements, which have been prepared in accordance with U.S.GAAP. The preparation of these financial statements requires us to make estimates and judgments that affect the reported amounts in our consolidated financial statements. We evaluate our estimates on an on-going basis, including those related to our net sales, inventories, asset impairments, stock-based compensation expense, legal reserve and income taxes. We base our estimates on experience and on various other assumptions that we believe to be reasonable under the circumstances, the results of which form the basis for making judgments about the carrying values of assets and liabilities. The actual results may differ from these estimates or our estimates may be affected by different assumptions or conditions.
Our critical accounting policies incorporate our more significant judgments and estimates used in the preparation of our consolidated financial statements. We believe the following critical accounting policies are significant to the presentation of our financial statements and require difficult, subjective and complex judgments.
Revenue Recognition
We generally recognize revenue when we sell our products to OEM customers and title and risk of loss for the products have transferred to the OEM. Estimates of product returns and sales allowances, related to reasons other than product quality, are based on actual historical experience and are recorded as a reduction in revenue at the time revenue is recognized. For the year ended December 27, 2009 and December 26, 2010, the Company deferred the recognition of revenues and related product costs on sales to Spansion Japan until the products were resold by Spansion Japan’s distributors.
We sell to distributors and provide such distributors certain rights of return, stock rotation and price protection as discussed below. We defer the recognition of revenue and related product costs on these sales as deferred income on shipments until the merchandise is resold by our distributors. We also sell some of our products to certain distributors under sales arrangements with terms that do not allow for rights of returns or price protection on unsold products held by them. In these instances, we recognize revenue when we ship the product directly to the distributors.
Rights of return are granted whereby we are obligated to repurchase inventory from a distributor upon termination of the distributor’s sales agreement with us. However, we are not required to repurchase the distributor’s inventory under certain circumstances, such as the failure to return the inventory in saleable condition or we may only be required to repurchase a portion of distributor’s inventory, for example when distributor has terminated the agreement for its convenience.
Stock rotation rights are provided to distributors when we have given written notice to the distributor that a product is being removed from our published price list. The distributor has a limited period of time to return the
47
Table of Contents
product. All returns are for credit only; the distributor must order a quantity of products, the dollar value of which equals or exceeds the dollar value of the products being returned. Some distributors are also offered quarterly stock rotation. Such stock rotation is limited to a certain percentage of the previous three months’ net shipments.
A general price protection is granted to a distributor if we publicly announce a generally applicable price reduction relating specifically to certain products, whereby the distributor is entitled to a credit equal to the difference between the price paid by the distributor and the newly announced price.
Price protection adjustments are provided to distributors solely for those products that: 1) are shipped by us to the distributor during the period preceding the price reduction announcement by us, 2) are part of the distributor’s inventory at the time of the announcement, and 3) are located at geographic territories previously authorized by us.
In addition, if in our sole judgment, a distributor demonstrates that it needs a price lower than the current published price list in order to secure an order from the distributor’s customers, we may, but we have no obligation to, grant the distributor a credit to our current published price. The distributor must submit the request for a reduction in price prior to the sale of products to its customer. If the request is approved and the sale occurs, the distributor must make a claim with the proof of resale to end customers for a credit within a specified time period.
Gross deferred revenue and gross deferred cost of sales on shipments to distributors as of December 26, 2010 and December 27, 2009 are as follows:
| December 26, 2010 |
December 27, 2009 |
|||||||
| (in thousands) | ||||||||
| Deferred revenue |
$ | 61,855 | $ | 90,465 | ||||
| Less: deferred costs of sales |
(40,562 | ) | (36,308 | ) | ||||
| Deferred income on shipments(1) |
$ | 21,293 | $ | 54,157 | ||||
| (1) | The deferred income of $22.2 million and $63.0 million on the consolidated balance sheet as of December 26, 2010 and December 27, 2009 included $0.9 million and $8.8 million of defered revenue related to our licensing revenue that was excluded in the table above, respectively. |
Our distributors provide us with periodic data regarding the product, price, quantity, and end customer when products are resold as well as the quantities of our products they still have in stock. We reconcile distributors’ reported inventories to their activities.
Estimates of Sales Returns and Allowances
From time to time we may accept sales returns or provide pricing adjustments to customers who do not have contractual return or pricing adjustment rights. We record a provision for estimated sales returns and allowances on product sales in the same period that the related revenues are recorded, which primarily impacts gross margin. We base these estimates on actual historical sales returns, allowances, historical price reductions, market activity and other known or anticipated trends and factors. These estimates are subject to management’s judgment, and actual provisions could be different from our estimates and current provisions, resulting in future adjustments to our revenues and operating results.
Inventory Valuation
At each balance sheet date, we evaluate our ending inventories for excess quantities and obsolescence. This evaluation includes analysis of sales levels by product and projections of future demand. These projections assist
48
Table of Contents
us in determining the carrying value of our inventory and are also used for near-term factory production planning. We write off inventories that we consider obsolete and adjust remaining specific inventory balances to approximate the lower of our standard manufacturing cost or market value. Among other factors, management considers forecasted demand in relation to the inventory on hand, competitiveness of product offerings, market conditions and product life cycles when determining obsolescence and net realizable value. If we anticipate future demand or market conditions to be less favorable than our previous projections, additional inventory write-downs may be required and would be reflected in cost of sales in the period the write-down is made. This would have a negative impact on our gross margin in that period. A continued weak economy could lead to additional write downs of inventory. If in any period we are able to sell inventories that were not valued or that had been written down in a previous period, related revenues would be recorded without any offsetting charge to cost of sales, resulting in a net benefit to our gross margin in that period.
Stock-Based Compensation Expenses
We estimated the fair value of our stock-based awards to employees using the Black-Scholes-Merton option pricing model, which requires the use of input assumptions, including expected volatility, expected life, expected dividend rate, and expected risk-free rate of return. The assumptions for expected volatility and expected life are the two assumptions that significantly affect the grant date fair value. Stock-based compensation expense recognized during a period is based on the higher of the grant-date fair value of the portion of share-based payment awards that is ultimately expected to vest, or actually vest, during the period. Compensation expense for all share-based payment awards was recognized using the straight-line attribution method reduced for estimated forfeitures.
We estimate volatility based on our recent historical volatility and the volatilities of our competitors who are in the same industry sector with similar characteristics (guideline companies) because of the lack of historical realized volatility data on our business. We have used the simplified calculation of expected life since our emergence from the Chapter 11 Cases and continue to use this method as we do not have sufficient historical exercise data to provide a reasonable basis upon which to estimate the expected term of share options since our initial public offering. If we determined that another method used to estimate expected volatility or expected life was more reasonable than our current methods, or if another method for calculating these input assumptions was prescribed by authoritative guidance, the fair value calculated for share-based awards could change significantly. Higher volatility and longer expected lives result in an increase to share-based compensation determined at the date of grant.
In addition, we are required to develop an estimate of the number of share-based awards that will be forfeited due to employee turnover. ASC 718 requires forfeitures to be estimated at the time of grant and revised, if necessary, in subsequent periods if actual forfeitures differ from those estimates in order to derive the Company’s best estimate of awards ultimately expected to vest. We do not have sufficient historical forfeiture experience related to our own stock-based awards granted subsequent to emergence from Chapter 11 in May 2010, and therefore, estimated our forfeitures based on the average of our own post-emergence fiscal 2010 forfeiture rate and historical forfeiture rates of peer companies over the expected vesting term of our stock based awards. These estimates will be revised, if necessary, in subsequent periods if actual forfeitures differ from those estimates.
Income Taxes
In determining taxable income for financial statement reporting purposes, we must make estimates and judgments. These estimates and judgments are applied in the calculation of specific tax liabilities and in the determination of the recoverability of deferred tax assets, which arise from temporary differences between the recognition of assets and liabilities for tax and financial statement reporting purposes.
We must assess the likelihood that we will be able to recover our deferred tax assets. Unless recovery of these deferred tax assets is considered more likely than not, we must increase our provision for taxes by
49
Table of Contents
recording a charge to income tax expense, in the form of a valuation allowance against those deferred tax assets for which we believe it is more likely than not they will be realized. We consider past performance, future expected taxable income and prudent and feasible tax planning strategies in determining the need for a valuation allowance.
In addition, the calculation of our tax liabilities involves the application of complex tax rules and the potential for future adjustments by the relevant tax jurisdiction. If our estimates of these taxes are greater or less than actual results, an additional tax benefit or charge will result.
In determining the financial statement effects of an unrecognized tax position, we must determine when it is more likely than not, based on the technical merits, that the position will be sustained upon examination. In this determination, we must assume that the position will be examined by a taxing authority that has full knowledge of all relevant information, and will be resolved in the court of last resort. The more likely than not recognition threshold means that no amount of tax benefits may be recognized for a tax position without a greater than 50 percent likelihood that it will be sustained upon examination.
Goodwill and Intangible Assets
Goodwill represents the excess of our enterprise value upon emergence over the fair value of our net tangible and identifiable intangible assets acquired. We recorded goodwill in the second quarter of fiscal 2010 in connection with fresh start accounting (see Note 2 and Note 6 of the Notes to Consolidated Financial Statements included in Part II, Item 8 of this Annual Report for more information relating to fresh start accounting and valuation of Goodwill). In accordance with the provisions of ASC 350, “Intangibles, Goodwill and Other”, goodwill amounts are not amortized, but rather are tested for impairment at the reporting unit level at least annually, or more frequently if there are indicators of impairment present. We have determined that we have a single reporting unit and we will perform the annual goodwill impairment analysis as of the fourth quarter of each fiscal year, with the first annual testing carried out in the fourth quarter of fiscal 2010.
We have determined that the annual goodwill impairment test will be performed on November 30th of each fiscal year commencing from November 30, 2010. ASC 350 requires a two-step method for determining goodwill impairment. Step one is to compare the fair value of the reporting unit with the unit’s carrying amount, including goodwill. If this test indicates that the fair value is less than the carrying value, then step two is required to compare the implied fair value of the reporting unit’s goodwill with the carrying amount of the reporting unit’s goodwill.
We determine the fair value of our single reporting unit to be equal to our market capitalization plus a control premium. Market capitalization is determined by multiplying the shares outstanding on the assessment date by the average market price of our common stock over a 10-day period before and a 10-day period after each assessment date. We use this 20-day duration to consider inherent market fluctuations that may affect any individual closing price. We believe that our market capitalization alone does not fully capture the fair value of our business as a whole, or the substantial value that an acquirer would obtain from its ability to obtain control of our business. As such, in determining fair value, we add a control premium—which seeks to give effect to the increased consideration a potential acquirer would be required to pay in order to gain sufficient ownership to set policies, direct operations and make decisions related to our company—to our market capitalization.
No goodwill impairment was recorded in fiscal 2010. We performed the step one fair value comparison as of November 30, 2010 and our market capitalization, calculated as described above, was $1.3 billion and our carrying value, including goodwill, was $644 million. Because market capitalization significantly exceeded our carrying value, our estimate of the control premium was not a determining factor in the outcome of step one of the impairment assessment and we therefore did not incorporate a control premium into out step one computation.
We recorded In-process research and development of approximately $43 million in the second quarter of fiscal 2010 in connection with fresh start accounting (See Note 3 and Note 6 of the Notes to our Consolidated
50
Table of Contents
Financial Statements included in Part II, Item 8 of this Annual Report for more information relating to fresh start accounting). Intangible assets include projects that have not reached technological feasibility and have no alternative future use at the time of the valuation. These projects related to the development of process technologies to manufacture flash memory products based on 65 nanometer process technology and primarily includes certain new products from the GL and FL product families. As of December 26, 2010, none of these projects had reached technological feasibility but the Company expects these projects to attain technological feasibility and commence commercial production during fiscal 2011 and the first half of fiscal 2012.
We will consider quarterly whether indicators of impairment relating to the intangible assets are present. These indicators may include, but are not limited to, significant decreases in the market value of an intangible asset, significant changes in the extent or manner in which an intangible asset is used or an adverse change in our overall business climate. If these or other indicators are present, we test for recoverability of the intangible asset by determining whether the estimated undiscounted cash flows attributable to the intangible asset in question is less than its carrying value. If less, we recognize an impairment loss based on the excess of the carrying amount of the intangible asset over its respective fair value. (See Note 7 to our Consolidated Financial Statements included in Part II, Item 8 of this Annual Report for more information relating to the above).
Impairment of Long-Lived Assets including Acquisition-Related Intangible Assets
We consider quarterly whether indicators of impairment of long-lived assets and intangible assets are present. These indicators may include, but are not limited to, significant decreases in the market value of an asset, significant changes in the extent or manner in which an asset is used or an adverse change in our overall business climate. If these or other indicators are present, we test for recoverability of the asset (asset group) by determining whether the estimated undiscounted cash flows attributable to the asset (asset group) in question are less than their carrying value. If less, we recognize an impairment loss based on the excess of the carrying amount of the asset (asset group) over its respective fair value. Significant judgment is involved in determining whether impairment is measured at the individual asset or at an asset group level.
Our manufacturing processes are vertical in nature and we have had multiple foundries, assembly and test facilities. As a result, the cash flows of our assets and liabilities below the entity level are not largely independent of one another and we concluded impairment should be evaluated at the single entity-wide asset group (i.e., consolidated Spansion) level. Fair value is determined by discounted future cash flows, appraisals or other methods. Significant judgment is involved in estimating future cash flows and deriving the discount rate to apply to the estimated future cash flows and in evaluating the results of appraisals or other valuation methods. If the asset (asset group) determined to be impaired is to be held and used, we recognize an impairment loss through a charge to our operating results which also reduces the carrying basis of the related asset or assets in an asset group. The adjusted carrying value of the related asset (asset group) establishes a new cost basis and accumulated depreciation is reset to zero. The asset (asset group) is depreciated or amortized over the remaining estimated useful life of the asset. We also must make subjective judgments regarding the remaining useful life of the asset. If the asset (asset group) determined to be impaired is held for sale, we measure the new carrying value of the asset (asset group) at fair value less estimated cost to dispose, with the impairment loss being charged to operations.
Estimates Relating to Litigation Reserve
Upon emergence and as part of fresh start accounting, we adopted our litigation reserve policy whereby we record our estimates of litigation expenses to defend ourselves over the course of a reasonable period of time, currently estimated at twelve months in accordance with the provisions of ASC 450, Contingencies. Considerable judgment is necessary to estimate these costs and an accrual is made when it is probable that a liability has been incurred and the amount of loss can be reasonably estimated. (See Part I, Item 3- Legal Proceedings for more information regarding our outstanding legal proceedings).
51
Table of Contents
Results of Operations
The following is a summary and analysis of our net sales, gross margin, operating expenses, interest and other income, net, interest expense and income tax provision for the two periods in fiscal 2010, fiscal 2009 and fiscal 2008.
In addition, we have presented a combined summary and analysis of the two periods in fiscal 2010. The combined summary of our net sales, gross margin, operating expenses, interest and other income, net, interest expense and income tax provision shown in the table for fiscal 2010 is not a required presentation under U.S. GAAP, but disclosed as we believe that it would assist the reader to understand the historical financial trends of the Company.
| Successor | Predecessor | Predecessor | ||||||||||||||||||||||
| Period from May 11, 2010 to December 26, 2010 |
Period from December 28, 2009 to May 10, 2010 |
Combined for the Fiscal Year Ended December 26, 2010 |
Year Ended December 27, 2009 |
Year Ended December 28, 2008 |
||||||||||||||||||||
| (in thousands) | ||||||||||||||||||||||||
| Net sales |
$ | 764,687 | $ | 403,619 | $ | 1,168,306 | $ | 1,410,653 | $ | 2,281,803 | ||||||||||||||
| Cost of sales |
647,382 | 274,817 | 922,199 | 1,103,757 | 2,193,345 | |||||||||||||||||||
| Gross profit |
117,305 | 128,802 | 246,107 | 306,896 | 88,458 | |||||||||||||||||||
| Gross margin |
15 | % | 32 | % | 21 | % | 22 | % | 4 | % | ||||||||||||||
| Research and development |
65,414 | 35,068 | 100,482 | 136,449 | 431,808 | |||||||||||||||||||
| Sales, general and administrative |
122,478 | 68,106 | 190,584 | 216,298 | 253,878 | |||||||||||||||||||
| In-process research and development |
— | — | — | — | 10,800 | |||||||||||||||||||
| Restructuring charges |
— | (2,772 | ) | (2,772 | ) | 46,852 | 11,161 | |||||||||||||||||
| Asset impairment charges |
— | — | — | 12,538 | 1,652,622 | |||||||||||||||||||
| Operating income (loss) |
(70,587 | ) | 28,400 | (42,186 | ) | (105,241 | ) | (2,271,811 | ) | |||||||||||||||
| Gain on deconsolidation of subsidiary |
— | — | — | 30,100 | — | |||||||||||||||||||
| Interest and other income (expense), net |
175 | (2,904 | ) | (2,728 | ) | 4,038 | 5,200 | |||||||||||||||||
| Interest expense |
(24,180 | ) | (30,573 | ) | (54,754 | ) | (50,976 | ) | (105,536 | ) | ||||||||||||||
| Reorganization items |
— | 370,340 | 370,340 | (391,383 | ) | — | ||||||||||||||||||
| Provision for income taxes |
(2,101 | ) | (1,640 | ) | (3,741 | ) | (597 | ) | (62,865 | ) | ||||||||||||||
Total Net Sales Comparison for Fiscal 2010 and Fiscal 2009
For fiscal 2010, net sales in the Predecessor was $764.7 million while that of the Successor was $403.6 million.
Total net sales in fiscal 2010 decreased 17.2 percent compared to total net sales in fiscal 2009. Approximately 19.4 percent or $273 million, of the decrease was attributable to our decision to exit a large portion of the wireless market and approximately 3.7 percent or $52.0 million was attributable to deferred revenue lost as a result of fresh start accounting required for the Successor. This decrease was offset by an approximately 5.9 percent, or $83.0 million, increase in sales in the embedded market where we recaptured business lost during the Chapter 11 Cases.
Total Net Sales Comparison for Fiscal 2009 and Fiscal 2008
Total net sales in fiscal 2009 decreased 38 percent compared to total net sales in fiscal 2008. The decrease in total net sales was primarily attributable to a 34 percent decrease in unit shipments. The decrease in unit
52
Table of Contents
shipments was largely due to (i) a decrease in customer demand for our products, spurred by a worldwide decrease in demand for Flash memory in addition to loss of business as a result of our filing for bankruptcy, and (ii) our strategic decision to exit a large portion of the wireless market. Partially offsetting the decrease in overall demand was an increase in customer purchases of buffer inventory in the period just prior to and after commencement of the Chapter 11 Cases.
Gross Margin; Operating Expenses; Interest and Other Income, Net; Interest Expense and Income Tax Provision
The following is a summary of gross margin; operating expenses; interest and other income, net; interest expense and income tax provision for each fiscal 2010, fiscal 2009 and fiscal 2008.
Gross margin
For fiscal 2010, gross profit in the Predecessor was $128.8 million while the gross profit for the Successor, which was impacted by the fresh start accounting adjustments as mentioned below, was $117.3 million.
Our gross margin decreased by approximately one percent in fiscal 2010 compared to gross margin in fiscal 2009. Successor’s fresh start accounting related adjustments included amortization of approximately $90.2 million of inventory mark-up, a charge of approximately $64.6 million on higher valuation of fixed assets and a decrease in revenues due to “fresh start” accounting adjustments that eliminated some of our revenue (See Note 2). The overall decrease was partially offset by lower expenses resulting from operating efficiencies in factory utilization, a product mix shift from wireless to embedded products and better pricing from suppliers during the year.
Our gross margin increased by approximately 18 percent in fiscal 2009 compared to gross margin in fiscal 2008. Our gross margin in fiscal 2009 was higher primarily due to (i) the $253.2 million write-down of inventory in 2008, which is described below; (ii) certain fixed overhead costs and underutilization charges relating primarily to an advanced wafer fabrication facility in Aizu-Wakamatsu, Japan (SP1) in fiscal 2008 that did not fully reoccur in fiscal 2009 because we deconsolidated Spansion Japan in the first quarter of fiscal 2009; and (iii) a decrease in depreciation expense resulting from the write-down of certain manufacturing assets at the end of fiscal 2008. The increase in gross margin due to the aforesaid factors was partially offset by lower revenues in fiscal 2009 and an increase in fixed manufacturing costs resulting from the underutilization of our factories, primarily in the first quarter of 2009.
Research and development
R&D expenses for the Successor from May 11, 2010 to December 26, 2010 were $65.4 million which included, among other items, approximately (i) $36.4 million of labor costs, (ii) $5.6 million of expenses relating to outside service providers, (iii) $6.3 million of material costs, and (iv) $17.1 million of building and other allocated operating expenses.
For the Predecessor, from December 28, 2009 to May 10, 2010, R&D expenses of $35.1 million included, among other items, approximately (i) $22.8 million of labor costs, (ii) $3.7 million of expenses relating to outside service providers, (iii) $1.8 million of material costs, and (iv) $4.3 million of building and other allocated operating expenses.
Research and development, or R&D, expenses decreased by approximately 26 percent in fiscal 2010 compared to fiscal 2009. The decrease in R&D expenses were primarily due to lower operational expenses incurred in fiscal 2010 of approximately: (i) $26.8 million as a result of the closure of our Sub-micron Development Center (SDC) located at Sunnyvale, California in fiscal 2009; and (ii) $7.1 million as a result of the closure of R&D operations in certain of our foreign final manufacturing locations.
53
Table of Contents
Research and development expenses decreased by approximately 68 percent in fiscal 2009 compared to fiscal 2008. The decrease in research and development expenses was primarily due to: (i) labor cost savings of approximately $96.4 million from shutdowns, furloughs and workforce reductions, and material cost and technology savings of approximately $32.0 million, resulting from our continued efforts to reduce costs and conserve cash in fiscal 2009; (ii) a decrease of approximately $57.1 million in depreciation expense resulting from the write-down of certain long-lived assets at the end of fiscal 2008, which significantly reduced the cost basis of our depreciable assets; (iii) a decrease of approximately $49.9 million in research and development expenses related to Spansion Japan as a result of the deconsolidation; (iv) a decrease of approximately $31.3 million attributable to the shutdown of our SDC in April 2009; (v) a decrease of approximately $17.8 million in outside services including engineering, software and consulting services and travel expenses due to cost reduction measures; and (vi) a decrease of approximately $5.7 million research and development expenses related to Spansion Israel Ltd. as a result of its workforce reduction.
Sales, general and administrative
For the Successor, during the period from May 11, 2010 to December 26, 2010, SG&A expenses of $122.5 million included among other items, approximately (i) $49.3 million of labor costs, (ii) $51.1 million of expenses relating to outside service providers and (iii) $14.5 million of building and other allocated operating expenses.
For the Predecessor, during the period from December 28, 2009 to May 10, 2010, SG&A expenses of $68.1 million included among other items, approximately (i) $25.9 million of labor costs, (ii) $25.1 million of expenses relating to outside service providers, and (iii) $6.6 million of building and other allocated operating expenses.
Sales, general and administrative, or SG&A, expenses in fiscal 2010 decreased by approximately 12 percent compared to fiscal 2009. This decrease was principally due to (i) a decrease of approximately $12.9 million in expense for doubtful accounts; (ii) savings of approximately $16.6 million in labor costs and approximately $6.2 million relating to a planned reduction of information technology expenses; and (iii) the Successor’s allocation based on utilization, of approximately $5.9 million of information technology charges from SG&A to R&D and Cost of Goods Sold. The information technology charges were not allocated to other functional areas in the Predecessor.
The overall decrease was partially offset by: (i) an increase of approximately $12.9 million in accrued bonuses primarily related to our 2010 performance-based bonus plan; and (ii) an increase of approximately $6.8 million of operating expenses in fiscal 2010 due to the acquisition of Spansion Japan’s sales and distribution organization in May 2010 which is now operated by our subsidiary, Nihon Spansion Limited.
SG&A expenses in fiscal 2009 decreased by approximately 15 percent compared to fiscal 2008. The decrease in SG&A expenses in fiscal 2009 was primarily due to: (i) labor cost savings of approximately $27.4 million from workforce reductions; (ii) a decrease of approximately $20.7 million in professional services fees; and (iii) a decrease of approximately $6.8 million in travel expenses and $8.6 million in other miscellaneous operating expenses including reductions in building cost, supplies, repair, employee training and development, and telecommunication expenses. Further, as a result of the deconsolidation of Spansion Japan, SG&A expenses attributable to Spansion Japan decreased to $4.3 million for fiscal 2009, from $27.3 million for fiscal 2008.
The decrease in SG&A expenses was partially offset by an increase of approximately $19.8 million in provisions for doubtful accounts and approximately $43.2 million in provisions for litigation and other related matters, which occurred in the first quarter of fiscal 2009.
In-process research and development (IPR&D)
In the first quarter of fiscal 2008, we expensed $10.8 million of IPR&D charges in connection with the acquisition of Saifun Semiconductor Ltd. (subsequently renamed as Spansion Israel Ltd). Projects that qualify as
54
Table of Contents
IPR&D are those that have not reached technological feasibility and have no alternative future use at the time of the acquisition. We did not have a similar charge during fiscal 2009 or fiscal 2010.
Restructuring charges
Restructuring charges for the Predecessor from December 28, 2009 to May 10, 2010 decreased by approximately $49.6 million compared to the fiscal 2009. The decrease in restructuring charges was primarily due to: (i) approximately $ 39.4 million of lower cash settled restructuring charges on employee severance pay and benefits, professional fees, and relocation of property, plant and equipment in the second quarter of fiscal 2010; (ii) an approximately $5.5 million gain on the sale of SDC fixed assets; (iii) increase of approximately $0.6 million gain from the sale of our plant in Suzhou, China in fiscal 2010 when compared to fiscal 2009; and (iv) an approximately $1.7 million lower depreciation and fixed assets write-offs . There were no restructuring charges in the Successor period.
In fiscal 2009, we implemented various restructuring measures, including workforce reductions of approximately 3,200. The related restructuring charges, primarily comprised of severance costs and other related costs, were $46.9 million for fiscal 2009.
In fiscal 2008, we incurred $11.2 million of restructuring charges.
Asset impairment charges
In accordance with the guidance in ASC Topic 360, Property, Plant, and Equipment we did not record any impairment charges as there are no impairment triggers for the Predecessor or Successor.
For the year ended December 27, 2009, we recorded an impairment charge of approximately $12.5 million primarily due to impairment on its equity investment and loan to an investee.
We recorded an impairment charge of $1.6 billion in the fourth quarter of fiscal 2008. Reduced unit demand resulted in factory underutilization, lower prices, and negative margins and together these effects resulted in a lower fair value for our plant and equipment than their then current carrying value. Furthermore, we determined that the carrying values of goodwill and intangible assets from our Spansion Israel Ltd. acquisition exceeded fair value. The impairment charges were comprised of impairments of property, plant and equipment (approximately $1,578.4 million), goodwill (approximately $20.8 million) and intangible assets (approximately $53.5 million).
Gain on deconsolidation of subsidiary
Effective March 3, 2009, we deconsolidated Spansion Japan because, despite our 100 percent ownership interest, we were no longer deemed to control Spansion Japan as a result of the appointment of a trustee in the Spansion Japan Proceeding. The gain recognized upon deconsolidation of Spansion Japan was $30.1 million gain, which represents the difference between the carrying value of our investment in and receivables from Spansion Japan immediately before deconsolidation and the estimated fair value of our retained non-controlling interest in Spansion Japan, which was zero then and as of December 27, 2009. We did not have a similar gain during either fiscal 2010 period or fiscal 2008.
Interest and other income, net
Interest and other income, net, in the Successor for fiscal 2010 was $0.2 million and in the Predecessor for fiscal 2010 was an expense of $2.9 million which mainly consisted of approximately $3.0 million in impairment charges on certain investments in privately held companies.
Interest and other income, net, decreased by approximately $6.8 million in fiscal 2010 compared to fiscal 2009. The decrease was mainly due to approximately $3.0 million in impairment charges on certain investments
55
Table of Contents
in privately held companies during fiscal 2010 and approximately $2.0 million relating to penalty on early repayment of the Senior Secured Term Loan. In addition, interest and other income, net, was lower due to a decrease in our average investment portfolio yield as a result of decrease of approximately $85.0 million on our investment in Auction Rate Securities (ARS) which earned higher interest as compared to the yields on our cash and cash equivalents. The decrease is partially offset by preferential claim payments received during the last quarter of fiscal 2010 of $0.7 million.
Interest and other income, net, decreased by approximately $1.2 million in fiscal 2009 compared to fiscal 2008. The decrease in interest and other income, net, was mainly due to the combined effect of decreases in our invested cash, cash equivalents and ARS balances, and a decrease in our average investment portfolio yield of approximately 1.9 percent.
Interest expense
For the Successor, there was an increase in interest expense in fiscal 2010 mainly due to approximately (i) 18.7 million of term loan interest compared to none in fiscal 2009, (ii) $2.1 million of interest relating to our New Senior Unsecured Notes issued in the fourth quarter of fiscal 2010 compared to none in fiscal 2009, and (iii) $1.3 million of interest rate swap loss as the hedge was de-designated due to ineffectiveness of our hedging activities as a result of the term loan amendments during the fourth quarter of fiscal 2010. The increase in interest expense was partially offset by the elimination of interest expense of approximately $15.2 million relating to the Senior Floating Rate Notes (Old), which were fully settled upon our emergence from the Chapter 11 Cases and lower accretion of interest on long term license and other software contract obligations of approximately $4.8 million.
For the Predecessor, the increase was primarily due to interest expense of approximately $9.3 million and amortization of financing costs of approximately $11.2 million on our Senior Secured Term Loan, partially offset by decreases of approximately:
| (i) | $7.1 million in interest expenses for our 11.75% Senior Unsecured Notes due 2016, or Old Senior Unsecured Notes, and our Exchangeable Senior Subordinated Debentures as interest expenses on these obligations were accrued only through the Petition Date as a result of the Chapter 11 Cases; |
| (ii) | $2.8 million in interest expense for FRNs due to a decrease in interest rate from 4.6 percent in the six months ended June 28, 2009 to 3.4 percent in the Predecessor period from December 28, 2009 through May 10, 2010. |
| (iii) | $3.4 million in interest expense related to capital leases as a result of lease buy-outs, terminations upon expiration of lease term and lease rejections as a result of reorganization efforts; and |
| (iv) | $2.2 million in interest expense as a result of the deconsolidation of Spansion Japan effective March 3, 2009. |
Interest expense for fiscal 2010 increased by $3.8 million compared to fiscal 2009.
Interest expense decreased by approximately $54.6 million in fiscal 2009 as compared to fiscal 2008. The decrease in interest expense was primarily due to decreases of approximately:
| (i) | $32.2 million in interest expense for Old Senior Unsecured Notes and Exchangeable Senior Subordinated Debentures as interest expense on these obligations was only accrued through the Petition Date pursuant to the accounting guidance for entities in reorganization, wherein interest expense is recognized during reorganization only to the extent the underlying debt is well secured or the interest will be paid; |
| (ii) | $13.8 million in interest expense for the FRNs, resulting from lower interest rates; |
56
Table of Contents
| (iii) | $11.2 million in interest expense for Spansion Japan, resulting from the deconsolidation; and |
| (iv) | $9.2 million in interest expense due to capital lease rejections as a result of reorganization efforts and the cessation of amortization of debt discount and financing costs since the Petition Date pursuant to the accounting guidance for entities in reorganization. |
The average interest rate on our debt portfolio was 6.00 percent for the Successor period ended September 26, 2010 and 4.85 percent for the Predecessor period ended May 10, 2010. The average interest rate on our debt portfolio for fiscal 2009 was 3.44 percent.
These decreases were partially offset by (i) approximately $6.5 million of capitalized interest related to the financing of SP1 during the first quarter of fiscal 2008, while no such interest was capitalized for the corresponding period in fiscal 2009 and (ii) an increase of approximately $3.6 million in interest expense due to accrued interest for liabilities to Spansion Japan.
The average interest rate on our debt portfolio was 3.44 percent in fiscal 2009 compared to 6.14 percent for fiscal 2008.
Reorganization items
Reorganization items of $370.3 million for the fiscal 2010 primarily consisted of a gain of approximately $434.0 million which resulted from the discharge of pre-petition obligations, and a gain of approximately $22.5 million, which resulted from settlement of rejected capital leases and various license agreements. The overall gain was partially offset by (i) approximately $59.5 million in professional fees, (ii) approximately $12.7 million of debt financing costs written-off, (iii) approximately $10.8 million in adjustments related to accrued claims and cancellation of old equity incentive plans, and (iv) approximately $7.0 million of withholding tax liability related to a foreign subsidiary.
Reorganization items for fiscal 2009 were comprised of a provision for expected allowed claims of approximately $354.9 million related primarily to rejection or repudiation of executory contracts and leases and the effects of approved settlements and approximately $37.1 million for professional fees. No corresponding charges were incurred in fiscal 2008.
Income tax provision
We recorded income tax expense of $2.1 million for the period from May 11, 2010 to December 26, 2010 and $1.6 million for the period from December 28, 2009 to May 10, 2010. We recorded income tax expense of $0.6 million in fiscal 2009 and $62.9 million in fiscal 2008.
Income tax expense recorded for the period from May 11, 2010 to December 26, 2010 differs from the benefit for income taxes that would be derived by applying a U.S. statutory 35 percent rate to the loss before income taxes primarily due to our inability to benefit from U.S. operating losses due to lack of a history of earnings and income that was earned and tax effected in foreign jurisdictions with different tax rates.
Income tax expense recorded for the period from December 28, 2009 to May 10, 2010 differs from the income tax expense that would be derived by applying a U.S. statutory 35 percent rate to the income before income taxes primarily due to the exclusion of cancellation of debt income as taxable income, our inability to benefit from U.S. operating losses after exclusion of cancellation of debt income due to a lack of a history in earnings, and income that was earned and tax effected in foreign jurisdictions with different tax rates.
Income tax expense recorded for fiscal 2009 differs from the benefit for income taxes that would be derived by applying a U.S. statutory 35 percent rate to the loss before income taxes primarily due to our inability to
57
Table of Contents
benefit from U.S. operating losses due to lack of a history of earnings and income that was earned and tax effected in foreign jurisdictions with different tax rates.
The income tax expense recorded for fiscal 2008 differs from the benefit for income taxes that would be derived by applying a U.S. statutory 35 percent rate to the loss before income taxes primarily because we cannot benefit from U.S. operating losses due to lack of a history of earnings, an increase of $64.5 million in the valuation allowance associated with deferred tax assets of Spansion Japan, and income that was earned and tax effected in foreign jurisdictions with different tax rates.
The increase of $64.5 million in the valuation allowance associated with deferred tax assets of Spansion Japan was recorded due to a change in our judgment about the ability to realize our Japanese deferred tax assets and the filing of the Spansion Japan Proceeding. We believe it is not more likely than not that these deferred tax assets will be realized in these jurisdictions.
As of December 26, 2010, we recorded a valuation allowance of approximately $301.3 million against our U.S. deferred tax assets, net of deferred tax liabilities. This valuation allowance offsets all of our net U.S. deferred tax assets. As of December 26, 2010 we have also recorded valuation allowances of approximately $3.5 million against various foreign deferred tax assets for which we believe it is not more likely than not that they will be realized.
Contractual Obligations
The following table summarizes our contractual obligations at December 26, 2010. The table is supplemented by the discussion following the table.
| Total | 2011 | 2012 | 2013 | 2014 | 2015 | 2016 and Beyond |
||||||||||||||||||||||||||
| (in thousands) | ||||||||||||||||||||||||||||||||
| Senior Secured Term Loan |
251,749 | $ | 10,530 | $ | 2,530 | $ | 2,530 | $ | 2,530 | $ | 233,629 | $ | — | |||||||||||||||||||
| Senior Unsecured Notes |
200,000 | — | — | — | — | — | 200,000 | |||||||||||||||||||||||||
| Capital lease obligations |
3,159 | 3,159 | — | — | — | — | — | |||||||||||||||||||||||||
| Interest expense on debt |
179,687 | 33,282 | 32,676 | 31,878 | 31,189 | 19,162 | 31,500 | |||||||||||||||||||||||||
| Interest expense on capital leases |
79 | 79 | — | — | — | — | — | |||||||||||||||||||||||||
| Other long term liabilities(1) |
6,768 | 3,000 | 3,768 | — | — | — | — | |||||||||||||||||||||||||
| Operating leases |
8,201 | 5,423 | 1,394 | 574 | 348 | 348 | 114 | |||||||||||||||||||||||||
| Unconditional purchase commitments(2) |
242,553 | 144,794 | 52,618 | 19,365 | 13,034 | 12,742 | — | |||||||||||||||||||||||||
| Total contractual obligations(3) |
$ | 892,196 | $ | 200,267 | $ | 92,986 | $ | 54,347 | $ | 47,101 | $ | 265,881 | $ | 231,614 | ||||||||||||||||||
| (1) | The other long term liabilities comprise payment commitments under long term software license agreements with vendors and asset retirement obligations. |
| (2) | Unconditional purchase commitments (UPC) include agreements to purchase goods or services that are enforceable and legally binding on us and that specify all significant terms, including fixed or minimum quantities to be purchased; fixed, minimum or variable price provisions; and the approximate timing of the transaction. These agreements are related principally to inventory and other items. UPCs exclude agreements that are cancelable without penalty. The table above excludes the payments we expect to pay to Spansion Japan in connection with the Settlement. Additionally, the foundry agreement with TI stipulates the minimum purchases for wafers and sort services in Japanese Yen and United States Dollars (USD) respectively. Minimum wafer purchase commitments as disclosed above were translated in to USD as of December 26, 2010 and are subject to currency fluctuations over the term of the foundry agreement. See Item 7—Management’s Discussion and Analysis of Financial Condition and Results of Operations as described in Business Relationship with Spansion Japan and Foundry Agreement for more information. |
58
Table of Contents
| (3) | As of December 26, 2010, the liability for uncertain tax positions was $14.5 million including interest and penalties. Due to the high degree of uncertainty regarding the timing of potential future cash flows associated with these liabilities, we are unable to make a reasonably reliable estimate of the amount and period in which these liabilities might be paid. |
Senior Secured Term Loan
On February 9, 2010, Spansion LLC, our wholly owned operating subsidiary, borrowed $450 million under a Senior Secured Term Loan. In connection with the Senior Secured Term Loan, the Predecessor incurred financing points, fees to the arrangers and legal costs of approximately $11.1 million as interest expense. In addition, we paid the lenders approximately $10 million of financing fees upon the release of Senior Secured Term Loan funds from escrow.
On November 9, 2010, Spansion LLC amended its Senior Secured Term Loan Agreement to, among other things, allow the issuance of the $200 million of 7.875% Senior Unsecured Notes due 2017 reduce interest rates on outstanding Senior Secured Term Loan balances, remove the requirement of maintaining interest rate hedging arrangements and amend its financial covenants of: (i) a minimum consolidated interest coverage ratio from 3.75 to 1.0 to 3.50 to 1.0; (ii) a maximum leverage ratio from 2.50 to 1.0 until September 25, 2011 and 2.0 to 1.0 thereafter to 3.00 to 1.0; and (iii) maximum permitted capital expenditures from $100 million in 2011 and $125 million in 2012 and each fiscal year thereafter to $150 million. Furthermore, any capital expenditure amount not expended in the fiscal year for which we are permitted may be carried over for expenditure in the succeeding fiscal year in an amount not to exceed $40 million in any fiscal year. We also obtained a waiver to a mandatory prepayment requirement that we use 50 percent of the net proceeds we received from the sale of shares of our Class A common stock in November 2010 (the Stock Offering) to pay down the Senior Secured Term Loan.
As of December 26, 2010, we are in compliance with all of the covenants under the Senior Secured Term Loan.
Interest on the Senior Secured Term Loan accrues at a rate per annum, reset quarterly, equal to the prime lending rate or the Federal Funds rate plus 0.50 percent, whichever is higher but not less than 2.75 percent, plus 3.75 percent. Alternatively, we have the option to choose 1-month, 3-month, and 6-month LIBOR rate, or choose 9-month and 12-month LIBOR with the consent of all the lenders, in which case the interest on the Senior Secured Term Loan accrues at a rate per annum equal to the LIBOR or 1.75 percent, whichever is higher, plus 4.75 percent. Interest is payable quarterly in arrears. As of December 26, 2010, the Senior Secured Term Loan carried interest at 6.5 percent and the principal amount outstanding was $259.8 million.
The Senior Secured Term Loan is secured by our assets including, among other items, a first priority lien on property, plant and equipment and inventory, and a second priority lien on account receivables and cash. Based on certain agreed upon thresholds, the Senior Secured Term Loan will require net cash proceeds from asset sales or other dispositions of property, extraordinary cash receipts, and other future cash flows to be used to prepay the outstanding balance of the loan. Voluntary prepayments of borrowings will be permitted in whole or in part, in minimum principal amounts to be agreed upon, (i) at any time on or prior to November 9, 2011, provided if we make any prepayment of the Senior Secured Term Loan in connection with any repricing transaction or effects any amendment resulting in a repricing transaction, a prepayment premium of 1 percent of the amount being repaid plus all accrued and unpaid interest plus breakage costs, if any, or a payment equal to 1 percent of the aggregate amount outstanding immediately prior to such amendment; and (ii) thereafter at any time without premium or penalty.
During the third quarter of fiscal 2010, we entered into a hedging arrangement with a financial institution to hedge the variability of interest payments attributable to fluctuations in the LIBOR benchmark interest rate relating to the interest payments under the Senior Secured Term Loan. We entered into a $250 million interest rate swap where we pay the independent swap counterparty a fixed rate of 2.42 percent and, in exchange, the
59
Table of Contents
swap counterparty pays us an interest rate equal to the floor rate of 2 percent or three-month LIBOR, whichever is higher. These swap agreements effectively fixed the interest rate at 7.92 percent through 2013 for the Senior Secured Term Loan. As of November 9, 2010 due to amendment of the term loan (see above), the critical terms of the swap and the Senior Secured Term Loan were no longer matched and the hedge was rendered ineffective. As a result, the hedge has been de-designated as a cash flow hedge in accordance with ASC Topic 815, “Derivatives and Hedging,” and the mark-to-market of the swap has been reported as a component of Interest expense for the fourth quarter of fiscal 2010. See Note 10 Financial Instruments for more information.
Senior Unsecured Notes
On November 9, 2010, Spansion LLC completed an offering of $200 million aggregate principal amount of 7.875 percent Senior Unsecured Notes due 2017, resulting in net proceeds of approximately $195.6 million after related offering expenses. The Senior Unsecured Notes are general unsecured senior obligations of Spansion LLC and are guaranteed by Spansion Inc. and Spansion Technology LLC on a senior unsecured basis. Interest is payable on May 15 and November 15 of each year beginning May 15, 2011 until and including the maturity date of November 15, 2017.
Prior to November 15, 2013, Spansion LLC may redeem some or all of the Notes at a price equal to 100 percent of the principal amount, plus accrued and unpaid interest and a “make-whole” premium. Thereafter, Spansion LLC may redeem all or part of the Notes at any time at the redemption prices set forth in the Indenture plus accrued and unpaid interest, if any, to the date of redemption.
In addition, on or prior to November 15, 2013, Spansion LLC may redeem up to 35 percent of the Notes with the proceeds of certain sales of equity securities at 107.875 percent (100 percent of the principal amount plus a premium equal to the interest rate applicable to the Notes), plus accrued and unpaid interest, if any, to the date of redemption.
Upon a change of control (as defined in the Senior Unsecured Notes indenture), holders of the Notes may require Spansion LLC to repurchase all of their notes at a repurchase price equal to 101 percent of the principal amount of the Notes to be repurchased, plus accrued and unpaid interest, if any, to the date of redemption.
Certain events are considered “Events of Default,” which may result in the accelerated maturity of the Notes, including: (i) a default in any interest, principal or premium amount payment; (ii) a merger, consolidation or sale of all or substantially all of its property; (iii) a breach of covenants in the Notes or the Indenture; (iv) a default in certain debts; (v) if we incur any judgment for the payment of money in an aggregate amount in excess of $25 million; or (vi) if a court enters certain orders or decrees under any bankruptcy law. Upon occurrence of one of these events, the trustee or certain holders may declare the principal of and accrued interest on all of the Notes to be immediately due and payable. If certain events of bankruptcy, insolvency or reorganization with respect to us occur, all amounts on the Notes shall be due and payable immediately without any declaration or other act by the trustee or holders of the Notes.
As of December 26, 2010, we are in compliance with all of the covenants under the Senior Unsecured Notes indenture.
Obligations under Capital Leases
As of December 26, 2010 and December 27, 2009, we had aggregate outstanding capital lease obligations, net of imputed interest, of approximately $3.2 million and $18.9 million, respectively. The aggregate weighted average interest rate for the capital lease obligations was 7.5 percent as of December 26, 2010. Obligations under these lease agreements are collateralized by the assets leased and are payable through 2011. Leased assets consist principally of machinery and equipment.
As of December 26, 2010, the gross amount of assets recorded under capital leases and accumulated amortization thereon was approximately $4.1 million and $3.0 million, respectively. As of December 27, 2009,
60
Table of Contents
the gross amount of assets recorded under capital leases and accumulated amortization thereon was approximately $67.4 million and $63.5 million, respectively.
During the first and second quarter of 2009, we submitted various motions to the U.S. Bankruptcy Court seeking rejection of certain equipment leases with future principal and interest payments of approximately $54.5 million through 2011, all of which have been approved by the Court as of August 10, 2009. Accordingly, such amount was written off and recorded in reorganization items in the Predecessor.
Liquidity and Capital Resources
Cash Requirements
As of December 26, 2010, our cash, cash equivalents and short term investments totaled $354.3 million. We had not borrowed under the Revolving Credit Facility as of December 26, 2010. As of December 26, 2010, the availability under this facility was $27.0 million after deducting the standby letters of credit of $1.5 million issued to certain vendors.
During the fourth quarter of fiscal 2010, we issued $200.0 million of our Senior Unsecured Notes and concurrently repaid $196.0 million of our Senior Secured Term Loan.
In connection with the October 20, 2010 settlement agreement between the claims agent appointed to resolve certain pre-bankruptcy claims and Spansion Japan, Citigroup Global Markets Inc. (Citi), which was not a party to this litigation, purchased the rejection damages claim from Spansion Japan for $100 million in cash. In separate transactions, the claims agent agreed to allow the rejection damages claim held by Citi in the amount of $200 million, and we purchased 85 percent of the allowed claim from Citi for $85 million in cash.
Our future uses of cash are expected to be primarily for working capital, debt service, capital expenditures, purchase of our bankruptcy claims and other contractual obligations. We also expect the remaining Plan disbursements and expenses incurred for outstanding claims resolution will continue using cash from operations for at least for the first half of fiscal 2011, or until all outstanding claims are resolved. We believe our anticipated cash flows from operations, current cash balances, and our existing revolving credit facility will be sufficient to make remaining Plan disbursements and expenses incurred for outstanding claims resolution, fund working capital requirements, debt service, and operations and to meet our cash needs for at least the next twelve months.
Financial Condition (Sources and Uses of Cash)
Our cash and cash equivalents consisted of demand deposits, treasury bills and money market funds with a total amount of $329.3 million as of December 26, 2010.
Our cash flows for fiscal 2010, fiscal 2009 and fiscal 2008 are summarized as follows:
| Year Ended December 26, 2010 | ||||||||||||||||
| Successor | Predecessor | Predecessor | ||||||||||||||
| Period from May 11, 2010 to December 26, 2010 |
Period from December 28, 2009 to May 10, 2010 |
Year Ended December 27, 2009 |
||||||||||||||
| (in thousands) | ||||||||||||||||
| Net cash provided by operating activities |
$ | 66,319 | $ | 1,359 | $ | 236,549 | ||||||||||
| Net cash provided by (used in) investing activities |
(22,169 | ) | 76,686 | (62,833 | ) | |||||||||||
| Net cash provided by (used in) financing activities |
30,238 | (148,219 | ) | 37,895 | ||||||||||||
| Effect of exchange rate changes on cash |
178 | — | (3,095 | ) | ||||||||||||
| Net increase (decrease) in cash and cash equivalents |
$ | 74,566 | $ | (70,174 | ) | $ | 208,516 | |||||||||
61
Table of Contents
Net Cash Provided by Operating Activities
Net cash provided by operations was $66.3 million during the period from May 11, 2010 to December 26, 2010, and was primarily due to net loss adjustments for non-cash items of $231.0 million and a decrease in operating assets and liabilities of $68.0 million.
Net cash provided by operations was $1.4 million during the period from December 28, 2009 to May 10, 2010, and was primarily due to net income adjustments for non-cash items of $382.8 million and a decrease in operating assets and liabilities of $20.5 million.
While our net loss was $514.1 million, we generated $236.5 million in cash from operating activities in fiscal 2009, due to significant non-cash items and changes in operating assets and liabilities. Non-cash items primarily consisted of $168.4 million of depreciation and amortization, $14.0 million of asset impairment charges, $19.8 million of provisions for doubtful accounts, and $12.4 million of stock compensation costs, and the $30.1 million of gain from the deconsolidation of Spansion Japan. The $629.4 million increase in accounts payable and accrued liabilities was primarily due to the various liabilities subject to compromise provided in connection with the Chapter 11 Cases. The $180.6 million decrease in inventories was primarily due to the reduction of production at our factories in our effort to minimize cash outlays in the first quarter of fiscal 2009, the effects of deconsolidation of Spansion Japan and our strategic decision to exit a large portion of the wireless market. The $248.4 million increase in receivables primarily reflects sales to Spansion Japan, which were eliminated on consolidation at the end of fiscal 2008, but not as of December 27, 2009, due to the deconsolidation.
Net Cash Provided by (Used in) Investing Activities
Net cash used by investing activities was $22.2 million during the period from May 11, 2010 to December 26, 2010, primarily due to purchases of treasury bills totaling $55.0 million during the year, and $49.3 million of capital expenditures used to purchase property, plant and equipment, and $13.1 million of cash decrease due to purchase of Spansion Japan’s distribution business, partially offset by proceeds of $44.7 million from redemption of ARS, $30.0 million proceeds from maturity of treasury bills, and $20.5 million from sale of property, plant and equipment. Purchases of treasury bills for $55.0 million mentioned above includes approximately $30 million of purchases that were reported as cash equivalents in our Form 10-Q for the third quarter of fiscal 2010.
Net cash provided by investing activities was $76.7 million during the period from December 28, 2009 to May 10, 2010, primarily due to $62.4 million of proceeds from the sale of ARS, $18.7 million of proceeds from the sale of the Suzhou plant, and $9.6 million from the sale of other property, plant and equipment, offset by $14.0 million of capital expenditures used to purchase property, plant and equipment.
Net cash used in investing activities was $62.8 million in fiscal 2009, primarily consisted of cash reduction of $52.1 million related to the deconsolidation of Spansion Japan, capital expenditures of $29.7 million, decrease in cash of $10.4 million related to the sale of the Suzhou assembly and test facility, and a loan (investment) of $5.3 million made to an investee in January 2009 pursuant to terms of an existing contractual obligation, partially offset by proceeds of $14.8 million from redemptions of ARS and proceeds of $15.5 million from the sale of our Suzhou assembly and test facility.
Net Cash Provided by (Used in) Financing Activities
Net cash provided by financing activities was $30.2 million during the period from May 11, 2010 to December 26, 2010, primarily due to net proceeds of $195.6 million from borrowing under Senior Unsecured Notes, $124.4 net proceeds from issuance of common stock, partially offset by payments of $204.8 million on debt and capital lease obligations, and $85.0 million of cash decrease due to purchase of Spansion Japan claim in shares.
62
Table of Contents
Net cash used by financing activities was $148.2 million during the period from December 28, 2009 to May 10, 2010, primarily due to payments of $691.2 million on debt and capital lease obligations, partially offset by $438.1 million from the Senior Secured Term Loan net of issuance costs and $104.9 million from the Rights Offering.
Net cash provided by financing activities in fiscal 2009 was primarily comprised of $117.8 million from borrowings mainly under the UBS AG Loan and the Spansion Japan 2007 Revolving Credit Facility (borrowed prior to the Spansion Japan Proceeding), offset in part by $79.9 million in repayments of debts, primarily the Senior Secured Revolving Credit Facility, UBS Loan Secured by ARS, and certain capital lease obligations.
Off-Balance-Sheet Arrangements
During the normal course of business, we make certain indemnities and commitments under which we may be required to make payments in relation to certain transactions. These indemnities include non-infringement of patents and intellectual property, indemnities to our customers in connection with the delivery, design, manufacture and sale of our products, indemnities to our directors and officers in connection with legal proceedings, indemnities to various lessors in connection with facility leases for certain claims arising from such facility or lease, and indemnities to other parties to certain acquisition agreements. The duration of these indemnities and commitments varies, and in certain cases, is indefinite. We believe that substantially all of our indemnities and commitments provide for limitations on the maximum potential future payments we could be obligated to make. However, we are unable to estimate the maximum amount of liability related to our indemnities and commitments because such liabilities are contingent upon the occurrence of events which are not reasonably determinable. Management believes that any liability for these indemnities and commitments would not be material to our accompanying consolidated financial statements.
We do not have any other significant off-balance sheet arrangements, as defined in Item 303(a) (4) (ii) of SEC Regulation S-K, as of December 26, 2010 or December 27, 2009.
| ITEM 7A. | QUALITATIVE AND QUANTITATIVE DISCLOSURE ABOUT MARKET RISK |
Interest Rate Risk
Our exposure to market risk for changes in interest rates relates primarily to our cash deposits, invested cash and debt. At December 26, 2010, we had approximately $224.3 million held in demand deposit accounts, approximately $130.0 million invested in Treasury Bills of which $105.0 million are with maturity terms of 30 to 90 days and remaining $25.0 million is with a maturity term of six months. Accordingly, our interest income fluctuates with short-term market conditions. Our cash and short term investment position is highly liquid and our exposure to interest rate risk is minimal.
As of December 26, 2010, approximately 45 percent of the aggregate principal amounts outstanding under our third party debt obligations were fixed rate, and approximately 55 percent of our total debt obligations were variable rate comprised of the Senior Secured Term Loan with an outstanding balance of approximately $251.8 million as of December 26, 2010. The Senior Secured Term Loan has a LIBOR floor of 1.75 percent. While LIBOR is below 1.75 percent, our interest expense will not change along with short-term change in interest rate environment. When LIBOR is above 1.75 percent, changes in interest rates associated with the term loan could then result in a change to our interest expense. For example, a one percent aggregate change in interest rates would increase/decrease our contractual interest expense by approximately $2.5 million annually.
As of December 26, 2010, we have a hedging arrangement with a financial institution to partially hedge the variability of interest payments attributable to fluctuations in the LIBOR benchmark interest rate. See Note 10 to our Consolidated Financial Statements included in Part II, Item 8 of this Annual Report.
63
Table of Contents
Default Risk
We intend to actively monitor market conditions and developments specific to the securities and security classes in which we invest. We believe that we take a conservative approach to investing our funds in that our policy is to invest only in highly-rated securities with relatively short maturities and we do not invest in securities we believe involve a higher degree of risk.
The following table presents the cost basis, fair value and related weighted-average interest rates by year of maturity for our investment portfolio and debt obligations as of December 26, 2010 and comparable fair values as of December 27, 2009:
| 2011 | 2012 | 2013 | 2014 | 2015 | Thereafter | Total | 2010 Fair value |
2009 Fair value |
||||||||||||||||||||||||||||
| (in thousands, except for percentages) | ||||||||||||||||||||||||||||||||||||
| Investment Portfolio |
||||||||||||||||||||||||||||||||||||
| Cash equivalents: |
||||||||||||||||||||||||||||||||||||
| Fixed rate amounts |
$ | 104,977 | $ | — | $ | — | $ | — | $ | — | $ | — | $ | 104,977 | $ | 104,977 | $ | — | ||||||||||||||||||
| Weighted-average rate |
0.13 | % | — | — | — | — | — | 0.13 | % | — | — | |||||||||||||||||||||||||
| Variable rate amounts |
$ | — | $ | — | $ | — | $ | — | $ | — | $ | — | $ | — | $ | — | $ | 20 | ||||||||||||||||||
| Weighted-average rate |
— | — | — | — | — | — | — | — | — | |||||||||||||||||||||||||||
| Short Term Investment: |
||||||||||||||||||||||||||||||||||||
| Fixed rate amounts |
$ | 24,979 | $ | — | $ | — | $ | — | $ | — | $ | — | $ | 24,979 | $ | 24,979 | $ | — | ||||||||||||||||||
| Weighted-average rate |
0.17 | % | — | — | — | — | — | 0.17 | % | — | — | |||||||||||||||||||||||||
| Variable rate amounts |
$ | — | $ | — | $ | — | $ | — | $ | — | $ | — | $ | — | — | $ | 107,125 | |||||||||||||||||||
| Weighted-average rate |
— | — | — | — | — | — | — | — | — | |||||||||||||||||||||||||||
| Total Investment Portfolio |
$ | 129,956 | $ | — | $ | — | $ | — | $ | — | $ | — | $ | 129,956 | 129,956 | $ | 107,145 | |||||||||||||||||||
| Debt Obligations |
||||||||||||||||||||||||||||||||||||
| Debt—fixed rate amounts |
$ | 3,159 | $ | — | $ | — | $ | — | $ | — | $ | 200,000 | $ | 203,159 | $ | 203,159 | $ | 368,146 | ||||||||||||||||||
| Weighted-average rate |
7.50 | % | — | — | — | — | 7.88 | % | 7.87 | % | — | — | ||||||||||||||||||||||||
| Debt—variable rate amounts |
$ | 10,530 | $ | 2,530 | $ | 2,530 | $ | 2,530 | $ | 233,630 | $ | — | $ | 251,750 | $ | 254,582 | $ | 696,963 | ||||||||||||||||||
| Weighted-average rate |
6.50 | % | 6.50 | % | 6.50 | % | 6.50 | % | 6.50 | % | — | 6.50 | % | — | — | |||||||||||||||||||||
| Total Debt Obligations |
$ | 13,689 | $ | 2,530 | $ | 2,530 | $ | 2,530 | $ | 233,630 | $ | 200,000 | $ | 454,909 | 457,741 | 1,065,109 | ||||||||||||||||||||
Foreign Exchange Risk
Our sales, expenses, assets and liabilities denominated in Japanese yen and other foreign currencies were exposed to foreign currency exchange rate fluctuations. For example,
| • | some of our manufacturing costs are denominated in Japanese yen, and other foreign currencies such as the Thai baht and Malaysian ringgit; |
| • | sales of our products to Fujitsu are denominated in both US dollars and Japanese yen; and |
| • | some fixed asset purchases are denominated in Japanese yen and European Union euros. |
Consequently, movements in exchange rates could cause our net sales and our expenses to fluctuate, affecting our profitability and cash flows. We use foreign currency forward contracts to reduce our foreign exchange exposure on our foreign currency denominated monetary assets and liabilities. The objective of these contracts is to reduce the impact of foreign currency exchange rate movements to our operating results. We do not use these contracts for speculative or trading purposes.
We had an aggregate of $39.9 million (notional amount) of short-term foreign currency forward contracts denominated in Japanese yen outstanding as of December 26, 2010. The unrealized gain or loss related to the foreign currency forward contracts for the year ended December 26, 2010 was not material. We do not anticipate any material adverse effect on our consolidated financial position, results of operations or cash flows resulting from the use of these instruments in the future. However, we cannot assure you that these strategies will be
64
Table of Contents
effective, in particular, we generally cover only a portion of our foreign currency exchange exposure. We cannot assure you that these activities will eliminate foreign exchange rate exposure. Failure to eliminate this exposure could have an adverse effect on our business, financial condition and results of operations.
The following table provides information about our foreign currency forward contracts as of December 26, 2010 and December 27, 2009.
| December 26, 2010 | December 27, 2009 | |||||||||||||||||||||||
| Notional Amount |
Average Contract Rate |
Estimated Fair Value |
Notional Amount |
Average Contract Rate |
Estimated Fair Value |
|||||||||||||||||||
| (in thousands, except contract rates) | ||||||||||||||||||||||||
| Foreign currency forward contract: |
||||||||||||||||||||||||
| Japanese yen |
$ | 39,884 | ¥ | 82.74 | $ | 67 | — | ¥ | — | — | ||||||||||||||
65
Table of Contents
| ITEM 8. | FINANCIAL STATEMENTS AND SUPPLEMENTARY DATA |
Spansion Inc.
Consolidated Statements of Operations
(in thousands, except per share amounts)
| Year Ended December 26, 2010 | ||||||||||||||||||||
| Successor(1) | Predecessor(1) | Predecessor(1) | Predecessor(1) | |||||||||||||||||
| Period from May 11, 2010 to December 26, 2010 |
Period from December 28, 2009 to May 10, 2010 |
Year Ended December 27, 2009 |
Year Ended December 28, 2008 |
|||||||||||||||||
| Net sales |
$ | 759,886 | $ | 324,914 | $ | 1,061,487 | $ | 1,630,573 | ||||||||||||
| Net sales to related parties |
4,801 | 78,705 | 349,166 | 651,230 | ||||||||||||||||
| Total net sales |
764,687 | 403,619 | 1,410,653 | 2,281,803 | ||||||||||||||||
| Cost of sales (Note 9) |
647,381 | 274,817 | 1,103,757 | 2,193,345 | ||||||||||||||||
| Research and development (Note 9) |
65,414 | 35,068 | 136,449 | 431,808 | ||||||||||||||||
| Sales, general and administrative (Note 9) |
122,478 | 68,105 | 216,298 | 253,878 | ||||||||||||||||
| In-process research and development |
— | — | — | 10,800 | ||||||||||||||||
| Restructuring charges (credits) |
— | (2,772 | ) | 46,852 | 11,161 | |||||||||||||||
| Asset impairment charges |
— | — | 12,538 | 1,652,622 | ||||||||||||||||
| Operating income (loss) before reorganization items |
(70,586 | ) | 28,401 | (105,241 | ) | (2,271,811 | ) | |||||||||||||
| Other income (expense): |
||||||||||||||||||||
| Interest and other income, net |
175 | (2,904 | ) | 4,038 | 5,200 | |||||||||||||||
| Interest expense(2) |
(24,180 | ) | (30,573 | ) | (50,976 | ) | (105,536 | ) | ||||||||||||
| Gain on deconsolidation of subsidiary |
— | — | 30,100 | — | ||||||||||||||||
| Loss before reorganization items and income taxes |
(94,591 | ) | (5,076 | ) | (122,079 | ) | (2,372,147 | ) | ||||||||||||
| Reorganization items |
— | 370,340 | (391,383 | ) | — | |||||||||||||||
| Income (loss) before income taxes |
(94,591 | ) | 365,264 | (513,462 | ) | (2,372,147 | ) | |||||||||||||
| Provision for income taxes |
(2,101 | ) | (1,640 | ) | (597 | ) | (62,865 | ) | ||||||||||||
| Net income (loss) |
$ | (96,692 | ) | $ | 363,624 | $ | (514,059 | ) | $ | (2,435,012 | ) | |||||||||
| Net income (loss) per share: |
||||||||||||||||||||
| Basic |
$ | (1.60 | ) | $ | 2.24 | $ | (3.18 | ) | $ | (15.69 | ) | |||||||||
| Diluted |
$ | (1.60 | ) | $ | 2.24 | $ | (3.18 | ) | $ | (15.69 | ) | |||||||||
| Shares used in per share calculation: |
||||||||||||||||||||
| Basic |
60,479 | 162,439 | 161,847 | 155,162 | ||||||||||||||||
| Diluted |
60,479 | 162,610 | 161,847 | 155,162 | ||||||||||||||||
| (1) | Please refer to Note 2 for explanation of basis of ‘Successor’ and ‘Predecessor’ presentation. |
| (2) | Contractual interest expense for the year ended December 27, 2009 was approximately $89,380. |
See accompanying notes
66
Table of Contents
Spansion Inc.
Consolidated Balance Sheets
(in thousands, except par value and share amounts)
| Successor | Predecessor | |||||||||||
| December 26, 2010 |
December 27, 2009 |
|||||||||||
| Assets |
||||||||||||
| Current assets: |
||||||||||||
| Cash and cash equivalents |
$ | 329,294 | $ | 324,903 | ||||||||
| Short-term investment |
24,979 | 100,335 | ||||||||||
| Accounts receivable |
166,301 | 129,174 | ||||||||||
| Accounts receivable from related party (Note 9) |
— | 366,602 | ||||||||||
| Allowance for doubtful accounts |
(326 | ) | (56,408 | ) | ||||||||
| Accounts receivable, net |
165,975 | 439,368 | ||||||||||
| Inventories: |
||||||||||||
| Raw materials |
16,537 | 14,202 | ||||||||||
| Work-in-process |
128,753 | 112,469 | ||||||||||
| Finished goods |
23,647 | 15,052 | ||||||||||
| Total inventories |
168,937 | 141,723 | ||||||||||
| Deferred income taxes |
6,321 | 13,332 | ||||||||||
| Prepaid expenses and other current assets |
50,210 | 49,533 | ||||||||||
| Total current assets |
745,716 | 1,069,194 | ||||||||||
| Property, plant and equipment: |
||||||||||||
| Land |
51,778 | 20,107 | ||||||||||
| Buildings and leasehold improvements |
68,437 | 117,553 | ||||||||||
| Equipment |
242,240 | 318,592 | ||||||||||
| Construction in progress |
18,745 | 14,345 | ||||||||||
| Total property, plant and equipment |
381,200 | 470,597 | ||||||||||
| Accumulated depreciation and amortization |
(121,260 | ) | (147,887 | ) | ||||||||
| Property, plant and equipment, net |
259,940 | 322,710 | ||||||||||
| Intangible assets, net |
197,733 | — | ||||||||||
| Goodwill |
153,338 | — | ||||||||||
| Other assets |
42,578 | 46,073 | ||||||||||
| Total assets |
$ | 1,399,305 | $ | 1,437,977 | ||||||||
| Liabilities and Stockholders’ Deficit |
||||||||||||
| Current liabilities: |
||||||||||||
| Short term note |
$ | — | $ | 64,150 | ||||||||
| Accounts payable |
119,288 | 33,463 | ||||||||||
| Accounts payable to related party (Note 9) |
— | 221,211 | ||||||||||
| Accrued compensation and benefits |
39,978 | 21,630 | ||||||||||
| Other accrued liabilities |
109,444 | 112,676 | ||||||||||
| Income taxes payable |
1,107 | 83 | ||||||||||
| Deferred income |
22,198 | 50,929 | ||||||||||
| Deferred income to related party |
40 | 12,029 | ||||||||||
| Current portion of long-term debt and obligations under capital leases |
13,689 | — | ||||||||||
| Total current liabilities |
305,744 | 516,171 | ||||||||||
See accompanying notes
67
Table of Contents
Spansion Inc.
Consolidated Balance Sheets—(Continued)
(in thousands, except par value and share amounts)
| Successor | Predecessor | |||||||
| December 26, 2010 |
December 27, 2009 |
|||||||
| Deferred income taxes |
$ | 3,877 | $ | 13,405 | ||||
| Long-term debt and capital lease obligations, less current portion |
441,220 | — | ||||||
| Other long-term liabilities |
24,179 | 9,825 | ||||||
| Total long-term liabilities |
469,276 | 23,230 | ||||||
| Liabilities subject to compromise |
— | 1,756,269 | ||||||
| Total liabilities |
775,020 | 2,295,670 | ||||||
| Commitments and contingencies (Note 13) |
— | — | ||||||
| Stockholders’ equity (deficit): |
||||||||
| Old Class A common stock, $0.001 par value, 714,999,998 shares authorized, 162,291,633 shares issued and outstanding |
— | 162 | ||||||
| New Class A common stock, $0.001 par value, 150,000,000 shares authorized, 61,741,598 shares issued and outstanding (Note 19) |
62 | — | ||||||
| New Class B common stock, $0.001 par value, 1 share authorized, 1 share issued and outstanding (Note 19) |
— | — | ||||||
| New preferred stock, $0.001 par value, 50,000,000 shares authorized, 0 shares issued and outstanding (Note 19) |
— | — | ||||||
| Additional paid-in capital |
721,712 | 2,484,320 | ||||||
| Accumulated deficit |
(96,692 | ) | (3,342,370 | ) | ||||
| Accumulated other comprehensive income (loss) |
(797 | ) | 195 | |||||
| Total stockholders’ equity (deficit) |
624,285 | (857,693 | ) | |||||
| Total liabilities and stockholders’ equity (deficit) |
$ | 1,399,305 | $ | 1,437,977 | ||||
See accompanying notes
68
Table of Contents
Spansion, Inc.
Consolidated Statements of Cash Flows
(in thousands)
| Year Ended December 26, 2010 | ||||||||||||||||
| Successor | Predecessor | Predecessor | Predecessor | |||||||||||||
| Period from May 11, 2010 to December 26, 2010 |
Period from December 28, 2009 to May 10, 2010 |
Year Ended December 27, 2009 |
Year Ended December 28, 2008 |
|||||||||||||
| Cash Flows from Operating Activities: |
||||||||||||||||
| Net income (loss) |
$ | (96,692 | ) | $ | 363,624 | $ | (514,059 | ) | $ | (2,435,012 | ) | |||||
| Adjustments to reconcile net loss to net cash provided by operating activities: |
||||||||||||||||
| Depreciation and amortization, and in-process research and development write-off |
137,206 | 43,788 | 168,368 | 644,492 | ||||||||||||
| Asset impairment charges |
— | — | 14,045 | 1,652,622 | ||||||||||||
| Provision for doubtful accounts |
331 | 7,229 | 19,832 | 1,799 | ||||||||||||
| Provision for deferred income taxes |
15,492 | 7,000 | 18 | 49,887 | ||||||||||||
| Net (gain) loss on sale and disposal of property, plant, and equipment |
(1,483 | ) | (2,107 | ) | 76 | (28,238 | ) | |||||||||
| Other than temporary impairment on marketable securities |
— | — | — | 3,270 | ||||||||||||
| Impairment on investment |
— | 3,011 | — | 2,648 | ||||||||||||
| Mark to market on hedging derivatives |
1,329 | — | — | — | ||||||||||||
| Gain on sale of marketable securities |
— | — | — | (621 | ) | |||||||||||
| Non-cash compensation under equity incenive plans |
8,323 | 7,052 | 12,419 | 21,578 | ||||||||||||
| Gain on deconsolidation of subsidiary |
— | — | (30,100 | ) | — | |||||||||||
| Gain on sale of Suzhou plant |
(3,701 | ) | (5,224 | ) | (4,669 | ) | — | |||||||||
| (Gain) Loss from approved settlement of rejected capital leases and various licenses |
— | (22,517 | ) | 3,090 | — | |||||||||||
| Non-cash inventory expenses related to fresh start markup |
90,173 | — | — | — | ||||||||||||
| Amortization of debt premium and discount, net |
— | — | 1,540 | 9,950 | ||||||||||||
| Gain on discharge of pre-petition obligations |
— | (434,046 | ) | — | — | |||||||||||
| Write-off of financing costs for old debts |
— | 13,022 | — | — | ||||||||||||
| Changes in operating assets and liabilities, net of effects of deconsolidation of subsidiary and acquisition of Saifun: |
||||||||||||||||
| (Increase) decrease in accounts receivable and other receivables |
(27,857 | ) | 10,156 | (248,352 | ) | 141,202 | ||||||||||
| Decrease (increase) in inventories |
31,552 | (7,242 | ) | 180,569 | 204,713 | |||||||||||
| (Increase) decrease in prepaid expenses and other current assets |
(16,577 | ) | (3,894 | ) | (10,448 | ) | 14,799 | |||||||||
| (Increase) decrease in other assets |
652 | 1,534 | (5,165 | ) | (1,183 | ) | ||||||||||
| Increase (decrease) in accounts payable, accrued liabilities, and accrued compensation |
(79,554 | ) | 23,213 | 629,395 | (4,720 | ) | ||||||||||
| (Decrease) increase in income taxes payable |
— | — | (2,708 | ) | (9,846 | ) | ||||||||||
| Increase (decrease) in deferred income to a related party |
— | — | 11,665 | (218 | ) | |||||||||||
| Increase (decrease) in deferred income |
7,125 | (3,240 | ) | 11,032 | (4,570 | ) | ||||||||||
| Net cash provided by operating activities |
66,319 | 1,359 | 236,549 | 262,552 | ||||||||||||
69
Table of Contents
Spansion, Inc.
Consolidated Statements of Cash Flows—(Continued)
(in thousands)
| Year Ended December 26, 2010 | ||||||||||||||||
| Successor | Predecessor | Predecessor | Predecessor | |||||||||||||
| Period from May 11, 2010 to December 26, 2010 |
Period from December 28, 2009 to May 10, 2010 |
Year Ended December 27, 2009 |
Year Ended December 28, 2008 |
|||||||||||||
| Cash Flows from Investing Activities: |
||||||||||||||||
| Proceeds from sale of property, plant and equipment |
20,534 | 9,620 | 4,352 | 6,743 | ||||||||||||
| Purchases of property, plant and equipment |
(49,299 | ) | (14,046 | ) | (29,713 | ) | (430,831 | ) | ||||||||
| Business acquisition, net of cash acquired |
(13,125 | ) | — | — | 733 | |||||||||||
| Proceeds from maturity and sale of marketable securities |
29,989 | — | — | 133,695 | ||||||||||||
| Purchases of marketable securities |
(54,968 | ) | — | — | (36,950 | ) | ||||||||||
| Loan made to an investee |
— | — | (5,263 | ) | (5,136 | ) | ||||||||||
| Cash proceeds from sale of Suzhou plant |
— | 18,687 | 15,539 | — | ||||||||||||
| Proceeds from redemption of auction rate securities |
44,700 | 62,425 | 14,775 | — | ||||||||||||
| Cash decrease due to deconsolidation of subsidiary |
— | — | (52,092 | ) | — | |||||||||||
| Cash decrease due to the sale of Suzhou plant |
— | — | (10,431 | ) | — | |||||||||||
| Net cash provided by (used by) investing activities |
(22,169 | ) | 76,686 | (62,833 | ) | (331,746 | ) | |||||||||
| Cash Flows from Financing Activities: |
||||||||||||||||
| Proceeds from borrowings, net of issuance costs |
195,588 | 438,082 | 117,758 | 250,558 | ||||||||||||
| Payments on debt and capital lease obligations |
(204,798 | ) | (691,176 | ) | (79,863 | ) | (241,806 | ) | ||||||||
| Proceeds from rights offering |
— | 104,875 | — | — | ||||||||||||
| Purchase of Spansion Japan claim in shares |
(85,000 | ) | — | — | — | |||||||||||
| Proceeds from issuance of common stock, net of offering costs |
124,448 | — | — | — | ||||||||||||
| Net cash provided by (used in) financing activities |
30,238 | (148,219 | ) | 37,895 | 8,752 | |||||||||||
| Effect of exchange rate changes on cash and cash equivalents |
178 | — | (3,095 | ) | (22,263 | ) | ||||||||||
| Net (decrease) increase in cash and cash equivalents |
74,566 | (70,174 | ) | 208,516 | (82,705 | ) | ||||||||||
| Cash and cash equivalents at the beginning of period |
254,729 | 324,903 | 116,387 | 199,092 | ||||||||||||
| Cash and cash equivalents at end of period |
$ | 329,295 | $ | 254,729 | $ | 324,903 | $ | 116,387 | ||||||||
| Supplemental Cash Flows Disclosures: |
||||||||||||||||
| Interest paid (including $0, $0, $11,306 of interest related to obligations to related parties) |
$ | 33,991 | $ | 6,130 | $ | 38,638 | $ | 94,593 | ||||||||
| Income taxes paid (refunded) |
$ | 643 | $ | 408 | $ | 2,845 | $ | (15,155 | ) | |||||||
| Non-cash investing and financing activities: |
||||||||||||||||
| Settlement of liabilities subject to compromise through issuance of reorganized Spansion Inc. common stock |
$ | — | $ | 486,064 | $ | — | $ | — | ||||||||
| Equipment capital leases |
$ | — | $ | — | $ | — | $ | 56,611 | ||||||||
| Issuance of common stock and stock options to acquire Saifun |
$ | — | $ | — | $ | — | $ | 108,898 | ||||||||
See accompanying notes
70
Table of Contents
Spansion, Inc.
Consolidated Statements of Stockholders’ Equity (Deficit)
(in thousands)
| Shares | Amount | Additional Paid-in Capital |
Accumulated Deficit |
Accumulated Other Comprehensive Income (Loss) |
Total Stockholders’ Equity (Deficit) |
|||||||||||||||||||
| Balance at December 30, 2007 |
135,372 | $ | 135 | $ | 2,336,448 | $ | (562,577 | ) $ | (36,195 | ) $ | 1,737,811 | |||||||||||||
| Comprehensive loss: |
||||||||||||||||||||||||
| Net loss |
— | — | — | (2,435,012 | ) | — | (2,435,012 | ) | ||||||||||||||||
| Other comprehensive income: |
||||||||||||||||||||||||
| Net unrealized gain on investment |
— | — | — | — | 662 | 662 | ||||||||||||||||||
| Change in pension plan and post-retirement benefit , net of taxes of $0 |
— | — | — | — | (34,985 | ) | (34,985 | ) | ||||||||||||||||
| Net change in cumulative translation adjustment |
— | — | — | — | 145,397 | 145,397 | ||||||||||||||||||
| Total other comprehensive income |
— | — | — | — | — | 111,074 | ||||||||||||||||||
| Total comprehensive loss |
— | — | — | — | — | (2,323,938 | ) | |||||||||||||||||
| Issuance of shares: |
||||||||||||||||||||||||
| Vesting of RSUs |
1,368 | 1 | (1 | ) | — | — | — | |||||||||||||||||
| Exercise of options |
26 | — | 1 | — | — | 1 | ||||||||||||||||||
| Issuance of common stock to acquire Saifun |
22,729 | 23 | 108,876 | — | — | 108,899 | ||||||||||||||||||
| Issuance of common stock to purchase asset |
1,608 | 2 | 4,998 | — | — | 5,000 | ||||||||||||||||||
| Compensation recognized under employee stock plans |
— | — | 21,580 | — | — | 21,580 | ||||||||||||||||||
| Balance at December 28, 2008 |
161,103 | 161 | 2,471,902 | (2,997,589 | ) | 74,879 | (450,647 | ) | ||||||||||||||||
| Comprehensive loss: |
||||||||||||||||||||||||
| Net loss |
— | — | — | (514,059 | ) | — | (514,059 | ) | ||||||||||||||||
| Other comprehensive income: |
||||||||||||||||||||||||
| Net unrealized gain on investment |
— | — | — | — | (465 | ) | (465 | ) | ||||||||||||||||
| Change in pension plan and post-retirement benefit , net of taxes of $0 |
— | — | — | — | 123 | 123 | ||||||||||||||||||
| Net change in cumulative translation adjustment |
— | — | — | — | (25,073 | ) | (25,073 | ) | ||||||||||||||||
| Total other comprehensive loss |
(25,415 | ) | ||||||||||||||||||||||
| Total comprehensive loss |
(539,474 | ) | ||||||||||||||||||||||
| Effect of Spansion Japan deconsolidation |
— | — | — | 169,278 | (49,269 | ) | 120,009 | |||||||||||||||||
| Issuance of shares: |
||||||||||||||||||||||||
| Vesting of RSUs |
1,027 | 1 | — | — | — | 1 | ||||||||||||||||||
| Exercise of options |
162 | — | — | — | — | — | ||||||||||||||||||
| Compensation recognized under employee stock plans |
— | — | 12,418 | — | — | 12,418 | ||||||||||||||||||
| Balance at December 27, 2009 |
162,292 | 162 | 2,484,320 | (3,342,370 | ) | 195 | (857,693 | ) | ||||||||||||||||
| Comprehensive income: |
||||||||||||||||||||||||
| Net income from December 27, 2009 to May 10, 2010 |
— | — | — | 363,624 | — | 363,624 | ||||||||||||||||||
71
Table of Contents
Spansion, Inc.
Consolidated Statements of Stockholders’ Equity (Deficit)—(Continued)
(in thousands)
| Shares | Amount | Additional Paid-in Capital |
Accumulated Deficit |
Accumulated Other Comprehensive Income (Loss) |
Total Stockholders’ Equity (Deficit) |
|||||||||||||||||||
| Other comprehensive income |
||||||||||||||||||||||||
| Net change in cumulative translation adjustment |
— | — | — | — | — | — | ||||||||||||||||||
| Total other comprehensive income |
— | |||||||||||||||||||||||
| Total comprehensive income |
— | — | — | — | — | 363,624 | ||||||||||||||||||
| Issuance of shares under old employee stock plans: |
— | — | — | — | — | — | ||||||||||||||||||
| Vesting of RSUs |
176 | — | — | — | — | — | ||||||||||||||||||
| Exercise of options |
83 | — | — | — | — | — | ||||||||||||||||||
| Equity settlement for liabilities subject to compromise |
— | 486 | 485,578 | — | — | 486,064 | ||||||||||||||||||
| Compensation recognized under old employee stock plans |
— | — | 1,595 | — | — | 1,595 | ||||||||||||||||||
| Cancellation of old employee stock plans |
— | — | 5,457 | — | — | 5,457 | ||||||||||||||||||
| Balance at May 10, 2010 (Predecessor) |
162,551 | 648 | 2,976,950 | (2,978,746 | ) | 195 | (953 | ) | ||||||||||||||||
| Fresh start adjustments: |
||||||||||||||||||||||||
| Cancellation of Predecessor common stock |
(162,551 | ) | (648 | ) | (2,976,950 | ) | — | — | (2,977,598 | ) | ||||||||||||||
| Elimination of Predecessor accumulated deficit and accumulated other comprehensive loss |
— | — | — | 2,978,746 | (195 | ) | 2,978,551 | |||||||||||||||||
| Balance at May 11, 2010 (Successor) |
— | — | — | — | — | — | ||||||||||||||||||
| Comprehensive income: |
||||||||||||||||||||||||
| Net loss from May 11 to December 26, 2010 |
— | — | — | (96,692 | ) | — | (96,692 | ) | ||||||||||||||||
| Other comprehensive income: |
||||||||||||||||||||||||
| Net change in cumulative translation adjustment |
— | — | — | — | (797 | ) | (797 | ) | ||||||||||||||||
| Total other comprehensive income |
(797 | ) | ||||||||||||||||||||||
| Total comprehensive income |
(97,489 | ) | ||||||||||||||||||||||
| Issuance of Successor common stock ($0.001 per share) |
46,248 | 46 | 569,079 | — | — | 569,125 | ||||||||||||||||||
| Vesting of RSUs |
72 | — | — | — | — | — | ||||||||||||||||||
| Retirement of common stock |
(5,316 | ) | (5 | ) | — | — | — | (5 | ) | |||||||||||||||
| Rights offering settlement |
12,974 | 13 | 104,862 | — | — | 104,875 | ||||||||||||||||||
| Compensation recognized under new employee stock plan |
— | — | 8,323 | — | — | 8,323 | ||||||||||||||||||
| Purchase of Spansion Japan claims in shares |
— | — | (85,000 | ) | — | — | (85,000 | ) | ||||||||||||||||
| Net proceeds from issuance of common stock |
7,763 | 8 | 124,448 | — | — | 124,456 | ||||||||||||||||||
| Balance at December 26, 2010 (Successor) |
61,741 | $ | 62 | $ | 721,712 | $ | (96,692 | ) | $ | (797 | ) | $ | 624,285 | |||||||||||
See accompanying notes
72
Table of Contents
Spansion Inc.
Notes to Consolidated Financial Statements
1. Nature of Operations
The Company
Spansion Inc. (the Company) is a leading designer, manufacturer and developer of Flash memory semiconductors. The Company is focused on the embedded Flash market and its Flash memory products primarily store data and software code for microprocessors, controllers and other programmable semiconductors which run applications in a broad range of electronics systems. These electronic systems include computing and communications, automotive and industrial, consumer and gaming, wireless and machine-to-machine, or M2M. In addition to Flash memory products, the Company assists its customers in developing and prototyping their designs by providing software and hardware development tools, drivers and simulation models for system-level integration.
The Company’s Flash memory solutions are incorporated in products from leading original equipment manufacturers, or OEMs. The Company’s products are designed to address various voltage, interface and memory density requirements for a wide range of specific applications and customer platforms. The majority of the Company’s new product designs are based on its proprietary two-bit-per-cell MirrorBit technology which has a simpler cell architecture requiring fewer manufacturing steps, supporting higher yields and lower costs as compared to competing floating gate NOR Flash technology.
History of the Company
In 1993, Advanced Micro Devices, Inc. (AMD) and Fujitsu Limited (Fujitsu) formed a manufacturing venture, Fujitsu AMD Semiconductor Limited (FASL).
FASL produced wafers containing Flash memory circuits. These wafers were then sold to AMD and Fujitsu, who separated the circuits on each wafer into individual die, processed the die into finished goods and sold the finished Flash memory devices to their customers. AMD and Fujitsu performed all research and development activities for the design and development of Flash memory devices and developed the manufacturing processes that were to be used in the operation of the fabs to manufacture Flash memory devices. Through June 30, 2003, FASL contracted with AMD and Fujitsu for the receipt of certain support and administrative services.
As of June 30, 2003, in order to expand their existing manufacturing venture, AMD and Fujitsu formed a limited liability company called FASL LLC and later renamed Spansion LLC. In addition to its 49.992 percent ownership in FASL, AMD contributed to Spansion LLC its Flash memory inventory, its wafer manufacturing facility located in Austin Texas, its Flash memory research and development facility (the Submicron Development Center (SDC)) located in Sunnyvale, California, and its Flash memory assembly and test facilities located in Thailand, Malaysia and China. Fujitsu contributed to Spansion LLC its 50.008 percent ownership interest in FASL, its Flash memory inventory and its Flash memory assembly and test facilities located in Malaysia. Both AMD and Fujitsu transferred employees to Spansion LLC to perform various research and development, marketing and administration functions. AMD and Fujitsu also provided working capital to Spansion LLC in the form of cash contributions and loans. As a result, Spansion LLC began manufacturing finished Flash memory devices which through the first fiscal quarter of fiscal 2006 were exclusively sold to AMD and Fujitsu. In the second quarter of fiscal 2006, the Company began selling its products directly to customers previously served by AMD.
On December 21, 2005, Spansion LLC was reorganized into Spansion Inc. and completed its underwritten initial public offering (IPO) of its Class A common stock.
73
Table of Contents
Spansion Inc.
Notes to Consolidated Financial Statements—(Continued)
2. Emergence from Chapter 11
General Information
On March 1, 2009, Spansion Inc., Spansion LLC, Spansion Technology LLC, Spansion International, Inc., and Cerium Laboratories LLC (collectively, the Debtors) each filed a voluntary petition for relief under Chapter 11 of the U.S. Bankruptcy Code in the U.S. Bankruptcy Court for the District of Delaware (the Chapter 11 Cases). On May 10, 2010, the Debtors emerged from the Chapter 11 Cases, following the confirmation of the Plan of Reorganization (the Plan) by the U.S. Bankruptcy Court on April 16, 2010.
Upon emergence from bankruptcy on May 10, 2010 (Emergence Date), the Company adopted fresh start accounting in accordance with the Financial Accounting Standards Board (FASB) Accounting Standards Codification (ASC) 852 “Reorganizations.” The adoption of fresh start accounting resulted in the Company becoming a new entity for financial reporting purposes. Accordingly, the Consolidated Financial Statements on or after May 10, 2010 are not comparable to the Consolidated Financial Statements prior to that date.
The Company qualified for fresh start accounting, in accordance with ASC 852 “Reorganizations,” due to:
| • | the reorganization value of the Debtors’ assets immediately before the date of confirmation being less than the total of all their post-petition liabilities and allowed claims; and |
| • | holders of existing voting shares of the Company immediately before confirmation receiving less than 50 percent of the voting shares of the post-emerged Company. |
Reorganization value is the value attributed to the reorganized entity, in addition to the expected net realizable value of those assets that will be disposed of before reorganization occurs. This reorganization value is viewed as the fair value of the entity before considering liabilities and approximates the amount a willing buyer would pay for the assets of the entity immediately after the reorganization. Reorganization value is generally determined by discounting future cash flows. Immediately prior to the Emergence Date, the Debtors’ reorganization value of $1.2 billion was less than the sum of post-petition liabilities of $617 million and allowed claims of $939 million.
Also, holders of Class A common stock outstanding prior to the Emergence Date (Old Common Stock) did not receive any consideration for their shares or any pre-determined allocation of Class A common stock of the reorganized Company (New Common Stock). Holders of New Common Stock issued by the reorganized Company after the Emergence Date primarily include unsecured creditors who have received or will receive shares of New Common Stock in settlement of their allowed claims, and participants in a rights offering that the Company conducted in February 2010, as described below under “Effectiveness of the Plan and Exit Financing.”
Fresh start accounting required resetting the historical net book values of assets and liabilities of the Company as of Emergence Date to the related fair values by allocating reorganization value to its assets and liabilities pursuant to accounting guidance related to ASC 805 “Business Combinations” and ASC 852-10. The excess reorganization value over the fair value of tangible and identifiable intangible assets has been recorded as goodwill on the Company’s Consolidated Balance Sheet. Deferred taxes have been determined in conformity with applicable accounting guidance related to ASC 740 “Income Taxes.” For additional information regarding the impact of fresh start accounting on the Company’s Consolidated Balance Sheet as of the Emergence Date, see “Fresh Start Consolidated Balance Sheet” below.
References in these financial statements to the “Successor” refer to Spansion and its consolidated subsidiaries after May 10, 2010, after giving effect to: (i) the cancellation of Old Common Stock issued prior to May 10, 2010; (ii) the issuance of New Common Stock and settlement of existing debt and other adjustments in
74
Table of Contents
Spansion Inc.
Notes to Consolidated Financial Statements—(Continued)
accordance with the Plan; and (iii) the application of fresh start accounting. References to “Predecessor” refer to Spansion and its consolidated subsidiaries up to May 10, 2010.
Effectiveness of the Plan and Exit Financing
Under the Plan, most holders of allowed general, unsecured claims against the Predecessor received or will receive New Common Stock in satisfaction of their claims. Holders of allowed general, unsecured claims subject to a low payout threshold received cash in satisfaction of their claims. Holders of Senior Secured Floating Rate Notes (FRN) received cash of approximately $638 million to fully discharge their claims. The $638 million was primarily provided by the exit financing discussed below.
Pursuant to the Plan, the holders of allowed claims were offered the right to purchase a total of 12,974,496 shares of the New Common Stock upon emergence from the Chapter 11 Cases at a price of $8.43 per share (Rights Offering). The number of shares available to each eligible claimant was based on each claimant’s proportionate allowed claim. In connection with the Rights Offering, the Company entered into a Backstop Rights Purchase Agreement with Silver Lake Management Company Sumeru, LLC whereby they committed to purchase the remaining balance of Rights Offering shares that are not otherwise subscribed for by the Rights Offering participants. Based on the agreement, Silver Lake Management Company Sumeru, LLC purchased 3,402,704 shares of the New Common Stock that had not been subscribed for by the Rights Offering participants. As of May 10, 2010, the Company received net proceeds of approximately $104.9 million through the Rights Offering that was used in full to partially discharge the FRN claims.
On February 9, 2010, the Company closed a five-year Senior Secured Term Loan agreement of $450 million with a group of lenders. The proceeds of the Senior Secured Term Loan, together with cash proceeds from other sources of cash available to the Company, were used in full to partially discharge the remaining balance of the FRN claims. See Note 12 for details.
On May 10, 2010, the Company entered into a senior revolving credit facility agreement (Revolving Credit Facility) with certain financial institutions in an aggregate amount of up to $65 million to fund bankruptcy related expenses and ongoing working capital. As of December 26, 2010, the Company has not drawn under this facility which was entered into as a pre-condition to obtaining the Senior Secured Term Loan facility. See Note 12 for further details.
The Plan contemplates the distribution of 65.8 million shares of New Common Stock, consisting of: (i) 46,247,760 shares to holders of allowed general, unsecured claims; (ii) 12,974,496 shares to subscribers of the Rights Offering; and (iii) 6,580,240 shares reserved for issuance to eligible employees in connection with grants of stock options and restricted stock units (RSUs) under the Company’s new 2010 Equity Incentive Award Plan. As of December 26, 2010, the Company had granted options to purchase 3,027,943 shares of new Common Stock and 3,040,566 shares of RSUs under the 2010 Plan to its employees, and 511,731 shares were eligible for future equity awards.
In accordance with the Plan, holders of Old Common Stock , or stock options exercisable for Old Common Stock and RSUs which convert into Old Common Stock, outstanding as of May 10, 2010 did not receive any distributions, and their equity interests were cancelled on May 10, 2010.
Business Relationship with Spansion Japan and Foundry Agreement
Prior to the Debtors’ filing of the Chapter 11 Cases, on February 10, 2009, Spansion Japan Limited, a wholly-owned subsidiary of Spansion LLC (Spansion Japan) filed a proceeding under the Corporate
75
Table of Contents
Spansion Inc.
Notes to Consolidated Financial Statements—(Continued)
Reorganization Law of Japan to obtain protection from Spansion Japan’s creditors (the Spansion Japan Proceeding). On March 3, 2009 the Tokyo District Court approved the filing of the Spansion Japan Proceeding and appointed the incumbent representative director of Spansion Japan as trustee. As a result, the Company no longer controlled Spansion Japan despite its 100 percent equity ownership interest and, effective March 3, 2009, the Company deconsolidated Spansion Japan and has accounted for its interest in Spansion Japan as a cost basis investment. Effective, September 28, 2010, the Company’s 100 percent equity ownership interest in Spansion Japan was extinguished by the Tokyo District Court and Spansion Japan is no longer considered a subsidiary of the Company.
Spansion Japan manufactured and supplied processed (or semi-finished) silicon wafers to the Company, and provided sort services to the Company through August 31, 2010 when Spansion Japan sold its manufacturing facilities (known as JV3 and SP1) located at Aizu Wakamatsu, Japan to a subsidiary of Texas Instruments Incorporated (TI) which began to provide such services to us on September 1, 2010. Spansion Japan also functioned as the sole distributor of the Company’s products in Japan whereby it purchased products from the Company and sold them to customers in Japan, primarily through a subsidiary of Fujitsu Limited. The wafers purchased from Spansion Japan were a material component of the Company’s cost of goods sold, and historically the wafer prices were governed by a foundry agreement. Management believes that the prices under that foundry agreement greatly exceeded the amounts that the U.S. Bankruptcy Court would have required the Company to pay for wafers purchased during the period from February 9, 2009 through October 27, 2009 (the date when the Company and Spansion Japan mutually agreed to pricing terms through executed purchase orders).
After unsuccessful efforts by the Company and Spansion Japan to renegotiate the prices under the foundry agreement, the Company filed a motion with the U.S. Bankruptcy Court in October 2009 to reject the foundry agreement. An order rejecting the foundry agreement was issued by the U.S. Bankruptcy Court on November 19, 2009. As a result, there was no valid contract establishing pricing for the wafers the Company received from Spansion Japan from February 9, 2009 through October 27, 2009 (Disputed Period).
On January 8, 2010, the Company reached an agreement in principle (the Settlement) with Spansion Japan, subject to the completion of definitive agreements and the Company’s emergence from the Chapter 11 Cases, to:
(i) acquire Spansion Japan’s distribution business; (ii) obtain foundry services, including wafer and sort services, from Spansion Japan; and (iii) resolve the Company’s dispute with Spansion Japan relating to pricing of wafers purchased during the Disputed Period and (iv) pay to Spansion Japan of approximately $45 million of which approximately $10 million was outstanding as of December 26, 2010. The outstanding balance of $10 million will be fully settled in the first quarter of fiscal 2010. The U.S. Bankruptcy Court and the Tokyo District Court approved the Settlement on January 29, 2010 and February 1, 2010, respectively.
On February 2, 2010, the Company and Spansion Japan entered into a foundry agreement whereby the Company agreed to purchase from Spansion Japan: (i) a minimum of 10 billion yen (equivalent to $120.7 million at December 26, 2010) worth of wafers over six quarters, beginning with the first quarter of 2010 and ending with the second quarter of 2011; and (ii) minimum sort services of $7.7 million for the first quarter of 2010 and $8.9 million for each quarter from the second quarter of 2010 to the second quarter of 2011, with both sort services and wafer production to be subject to normal and customary foundry performance conditions. On March 29, 2010, the Company and Spansion Japan executed various agreements implementing the Settlement including the purchase of Spansion Japan’s distribution business, which was consummated on May 24, 2010 for a total cash purchase price of $13.1 million. With the acquisition of Spansion Japan’s distribution business, all material conditions of the Settlement were fulfilled and the Company set off the receivable and payable balances due from/to Spansion Japan as of October 27, 2009 (the date when the Company and Spansion Japan mutually
76
Table of Contents
Spansion Inc.
Notes to Consolidated Financial Statements—(Continued)
agreed to pricing terms through executed purchase orders). All transactions with Spansion Japan are now being settled on a regular basis on mutually agreed upon terms.
The purchase price relating to the acquisition of Spansion Japan’s distribution business was allocated to the acquired business based on its estimated fair values as of May 24, 2010, as set forth below:
| In millions | ||||
| Tangible assets |
$ | 1.5 | ||
| Customer relationships |
10.1 | |||
| Goodwill |
3.3 | |||
| Liabilities |
(1.8 | ) | ||
| Total purchase price |
$ | 13.1 | ||
See Note 6 for disclosures relating to the above intangible assets.
Until May 24, 2010, Spansion Japan continued in its historical role as the sole distributor of the Company’s products in Japan. After the purchase of the distribution business from Spansion Japan on May 24, 2010, the Company distributes its products in Japan through its newly formed, wholly owned subsidiary, Nihon Spansion Limited.
Effective June 27, 2010, Spansion Japan’s Plan of Reorganization (the POR) was confirmed by the Tokyo District Court. The POR provided for Spansion Japan to redeem shares held by its shareholders without consideration, cancel such shares and issue new shares to unsecured creditors. The redemption, cancellation and new issuance were completed effective September 28, 2010. As a result, the Company no longer had any equity ownership of Spansion Japan. Until this date, the Company had accounted for its interest in Spansion Japan as a cost basis investment since the Company has not controlled Spansion Japan since March 3, 2009.
On August 31, 2010, Spansion Japan sold its manufacturing facilities to a subsidiary of TI. At the same time, the Company terminated its foundry agreement with Spansion Japan and entered into a new foundry agreement with TI whereby the Company agreed to purchase from TI: (i) a minimum of $235.5 million worth of wafers over eight quarters, beginning with the third quarter of 2010 and ending with the second quarter of 2012; and (ii) minimum sort services of $8.9 million for each quarter from the fourth quarter of 2010 to the second quarter of 2011 and $8.5 million each from the third quarter of 2011 through the second quarter of 2012, with both sort services and wafer production to be subject to normal and customary foundry performance conditions. The foundry agreement with TI stipulates the minimum purchases for wafers and sort services in Japanese Yen and United States Dollars (USD) respectively. Minimum wafer purchase commitments as disclosed above were translated in to USD as of December 26, 2010 and are subject to currency fluctuations over the term of the foundry agreement.
Ongoing Chapter 11 Matters
Resolution of Outstanding Claims
Pursuant to the Plan, a claims agent has been appointed to analyze and, at the claims agent’s discretion, contest outstanding disputed claims totaling $1.5 billion, which included the $936 million general unsecured proof of claim filed by Spansion Japan as a result of the November 19, 2009 foundry agreement rejection order. The Company accrued its best estimate of the liability which was included in the $938.5 million of liabilities subject to compromise as of the Emergence Date. Since these claims are being handled by the claims agent and
77
Table of Contents
Spansion Inc.
Notes to Consolidated Financial Statements—(Continued)
are under the jurisdiction of the U.S. Bankruptcy Court, their sole recourse is to receive shares reserved under the plan and, therefore, any outcome of the claims adjudication process will have no direct impact on the Successor.
On October 20, 2010, the claims agent entered into an agreement with Spansion Japan to settle all claims asserted by and between Spansion Japan and the chapter 11 estates of the Debtors. Spansion Japan had asserted a claim for approximately $936 million related to damages allegedly incurred as a result of our rejection of our foundry agreement with Spansion Japan. The claims agent had been engaged in litigation with Spansion Japan over the amount of damages sustained by Spansion Japan. As part of the agreement, Citigroup Global Markets Inc. (Citi), which was not a party to this litigation, purchased the rejection damages claim from Spansion Japan for $100 million in cash. In separate transactions, the claims agent agreed to allow the rejection damages claim held by Citi in the amount of $200 million, and we purchased 85 percent of the allowed claim from Citi for $85 million in cash which was recorded as an adjustment to the Successor’s Stockholders’ Equity. See the Consolidated Statement of Stockholders’ Equity (Deficit) for more information.
Liabilities Subject to Compromise
At December 26, 2010, the Company had a zero balance for liabilities subject to compromise (LSTC) due to its emergence from the Chapter 11 Cases on May 10, 2010. For information regarding the discharge of LSTC, see “Fresh-Start Consolidated Balance Sheet” below.
The following table summarizes the components of LSTC included in the Consolidated Balance Sheet at December 27, 2009:
| Predecessor | ||||
| December 27, 2009 | ||||
| (in thousands) | ||||
| Accounts payable and accrued liabilities |
$ | 639,897 | ||
| Accounts payable to related parties |
109,941 | |||
| Accrued compensation and benefits |
16,138 | |||
| Long-term debt |
968,266 | |||
| Capital lease obligations |
18,861 | |||
| Other long-term liabilities |
3,166 | |||
| Total liabilities subject to compromise |
$ | 1,756,269 | ||
LSTC refers to pre-petition obligations that were impacted by the Chapter 11 Cases. These liabilities represented the then estimated amounts expected to be allowed on known or potential claims to be resolved through the Chapter 11 Cases and included certain items that could be assumed under the Plan.
Reorganization Items
The Company is required to disclose separately items such as professional fees directly related to the process of reorganizing the Predecessor under the Chapter 11 Cases, realized gains and losses, provisions for losses, and interest income resulting from the reorganization and restructuring of the business. These reorganization items are not applicable following the Emergence Date.
78
Table of Contents
Spansion Inc.
Notes to Consolidated Financial Statements—(Continued)
The following table summarizes the components of the Company’s reorganization items for the periods from December 28, 2009 to May 10, 2010 and for the year ended December 27, 2009, respectively:
| Predecessor | ||||||||
| Period from December 28, 2009 to May 10, 2010 |
Year Ended December 27, 2009 |
|||||||
| (in thousands) | ||||||||
| Professional and service fees directly related to reorganization(1) |
$ | 58,336 | $ | 37,086 | ||||
| Provision for expected allowed claims(2) |
5,655 | 354,915 | ||||||
| Gain on discharge of pre-petition obligations |
(434,046 | ) | — | |||||
| Interest income |
(285 | ) | (618 | ) | ||||
| Total reorganization items |
$ | (370,340 | ) | $ | 391,383 | |||
| (1) | Includes fees associated with the advisors and service providers to the Debtors. |
| (2) | Represents the Company’s estimate of expected allowed claims related primarily to rejection or repudiation of executory contracts and leases and the effects of approved settlements. |
No cash was paid for professional fees for the period from May 11, 2010 to December 26, 2010. Cash paid for professional fees from December 28, 2009 to May 10, 2010 and for the year ended December 27, 2009 was approximately $10.6 million and $33.5 million, respectively.
Fresh Start Consolidated Balance Sheet
Upon emergence from the Chapter 11 Cases, the Company adopted fresh start accounting as prescribed under ASC 852 “Reorganizations,” which requires the Company to revalue its assets and liabilities to their related fair values. As such, the Company adjusted its stockholders’ deficit to equal the reorganization value at the Emergence Date. Items such as accumulated depreciation, accumulated deficit, accumulated other comprehensive income (loss) and allowances for doubtful accounts (AFDA) were reset to zero. The Company allocated the reorganization value to its individual assets and liabilities based on their estimated fair values. Items such as, accounts receivable, auction rate securities and cash (whose fair values approximated their book values) reflected values similar to those reported prior to emergence. Items such as prepaid and other current assets, inventory, property, plant and equipment, deferred income tax asset and liability, accounts payable, income tax payable, and deferred income were adjusted from amounts previously reported. Since “fresh start accounting” was adopted at emergence and because of the significance of LSTC that were relieved upon emergence, the historical financial statements of the Predecessor and the financial statements of the Successor are not comparable.
To facilitate the calculation of the enterprise value of the Successor, management developed a set of financial projections for the Successor using a number of estimates and assumptions. With the assistance of financial advisors, management determined the enterprise value and corresponding equity value of the Successor based on the financial projections using various valuation methods, including: (i) a comparison of the Company’s projected performance to the market values of comparable companies; and (ii) a calculation of the present value of future cash flows based on management projections, both of which were submitted to the Bankruptcy Court for confirmation. Utilizing these methodologies, the equity value of the Successor was estimated by the Bankruptcy Court to be in the range of $872 million and $944 million with an additional increase to the enterprise value by approximately $496 million for Bankruptcy Court-approved distributable value as well as the settlement of administrative claims. Based on the Bankruptcy Court-approved enterprise value ranges and
79
Table of Contents
Spansion Inc.
Notes to Consolidated Financial Statements—(Continued)
guidance, the Company estimated the enterprise value of the Successor to be approximately $1.5 billion. The enterprise value and corresponding equity value are dependent upon achieving the future financial results set forth in management’s projections, as well as the realization of certain other assumptions. We cannot provide any assurance that the projections will be achieved or that the assumptions will be realized. The excess equity value (using the midpoint of the range) over the fair value of tangible and identifiable intangible assets has been reflected as goodwill on the Consolidated Fresh Start Balance Sheet. All estimates, assumptions, valuations, appraisals and financial projections, including the fair value adjustments, the financial projections, the enterprise value and equity value projections, are inherently subject to significant uncertainties and the resolution of contingencies beyond the Company’s control. Accordingly, there can be no assurance that the estimates, assumptions, valuations, appraisals and the financial projections will be realized, and actual results could vary materially.
The adjustments set forth in the following Fresh Start Consolidated Balance Sheet in the columns captioned “Plan Adjustments” and “Fresh Start Adjustments” reflect the effect of the consummation of the transactions contemplated by the Plan, including the settlement of various liabilities, issuance of securities, incurrence of new indebtedness and cash payments as well as fair value adjustments as a result of the adoption of fresh start accounting.
80
Table of Contents
Spansion Inc.
Notes to Consolidated Financial Statements—(Continued)
The effects of the Plan and fresh start accounting on our Consolidated Balance Sheet at May 10, 2010 are as follows:
| Predecessor Balance Sheet |
Plan Adjustments |
Fresh Start Adjustments |
Successor Balance Sheet |
|||||||||||||
| (in thousands) | ||||||||||||||||
| Assets |
||||||||||||||||
| Current assets: |
||||||||||||||||
| Cash and cash equivalents |
$ | 358,643 | $ | (103,914 | )(a) | $ | — | $ | 254,729 | |||||||
| Auction rate securities |
41,854 | — | — | 41,854 | ||||||||||||
| Accounts receivable |
112,849 | (7,133 | )(g) | (15,332 | )(q)(r) | 90,384 | ||||||||||
| Accounts receivable from related party |
374,417 | — | (51,289 | )(q) | 323,128 | (t) | ||||||||||
| Allowance for doubtful accounts |
(62,473 | ) | 3,814 | (h) | 58,659 | (q) | — | |||||||||
| Accounts receivables, net |
424,793 | (3,319 | ) | (7,962 | ) | 413,512 | ||||||||||
| Inventories |
148,966 | — | 141,937 | (i) | 290,903 | |||||||||||
| Deferred income taxes |
14,324 | — | (13,183 | )(j) | 1,141 | |||||||||||
| Restricted cash |
531,313 | (525,515 | )(a) | — | 5,798 | |||||||||||
| Prepaid expenses and other current assets |
27,476 | (300 | ) | (14,656 | )(s) | 12,520 | ||||||||||
| Total current assets |
1,547,369 | (633,048 | ) | 106,136 | 1,020,457 | |||||||||||
| Property, plant and equipment, net |
287,100 | — | 85,593 | (k) | 372,693 | |||||||||||
| Intangible assets, net |
1,212 | — | 198,288 | (l) | 199,500 | |||||||||||
| Goodwill |
— | — | 162,253 | (m) | 162,253 | |||||||||||
| Deferred income taxes |
— | — | 20,893 | (j) | 20,893 | |||||||||||
| Other assets |
36,180 | (13,315 | )(c) | 49 | 22,914 | |||||||||||
| Total assets |
$ | 1,871,861 | $ | (646,363 | ) | $ | 573,212 | $ | 1,798,710 | (t) | ||||||
| Liabilities and Stockholders’ Deficit |
||||||||||||||||
| Current liabilities: |
||||||||||||||||
| Short term note |
$ | 1,380 | $ | — | $ | — | $ | 1,380 | ||||||||
| Senior secured term loan |
450,000 | (445,500 | )(d) | — | 4,500 | |||||||||||
| Accounts payable |
117,048 | (24,411 | )(b.2) | 25,483 | (n) | 118,120 | ||||||||||
| Accounts payable to related party |
319,564 | — | — | 319,564 | (t) | |||||||||||
| Accrued compensation and benefits |
33,046 | 1,750 | (f) | 232 | 35,028 | |||||||||||
| Other accrued liabilities |
118,905 | 1,631 | (b.1) | 19,772 | (n) | 140,308 | ||||||||||
| Income taxes payable |
176 | — | — | 176 | ||||||||||||
| Deferred income taxes |
— | — | 13,816 | (g) | 13,816 | |||||||||||
| Rights offering deposits |
75,783 | 29,092 | (b) | (104,875 | )(b) | — | ||||||||||
| Current portion of long-term debt and obligations under capital lease |
638,108 | (628,637 | )(b)(a) | (146 | ) | 9,325 | ||||||||||
| Deferred income |
59,718 | — | (47,458 | )(o)(r) | 12,260 | |||||||||||
| Total current liabilities |
1,813,728 | (1,066,075 | ) | (93,176 | ) | 654,477 | ||||||||||
| Deferred income taxes |
21,397 | — | (9,324 | )(j) | 12,073 | |||||||||||
| Long-term debt and obligations and capital lease obligations, less current portion |
— | 3,044 | (b) | 496 | 3,540 | |||||||||||
| Senior secured term loan |
— | 445,500 | (d) | — | 445,500 | |||||||||||
| Other long-term liabilities |
8,861 | — | 259 | 9,120 | ||||||||||||
| Commitments and contingencies |
||||||||||||||||
| Total long-term liabilities |
30,258 | 448,544 | (8,569 | ) | 470,233 | |||||||||||
| Liabilities subject to compromise |
938,522 | (938,522 | ) | — | — | |||||||||||
| Total liabilities |
2,782,508 | (1,556,053 | ) | (101,745 | ) | 1,124,710 | ||||||||||
| New Common Stock |
— | — | 674,000 | (p) | 674,000 | |||||||||||
| Stockholders’ deficit |
(910,647 | ) | 909,690 | (e) | 957 | (e) | — | |||||||||
| Total liabilities and stockholders’ deficit |
$ | 1,871,861 | $ | (646,363 | ) | $ | 573,212 | $ | 1,798,710 | (t) | ||||||
81
Table of Contents
Spansion Inc.
Notes to Consolidated Financial Statements—(Continued)
Plan Adjustments
The primary Plan adjustment is the elimination of LSTC which is based on all claims received by the Company and accruals made from these claims of estimated final settlements. LSTC amounted to $938.5 million on our Consolidated Balance Sheet immediately prior to May 10, 2010, which were discharged in the Chapter 11 Cases or settled by issuance of the Company’s New Common Stock. In accordance with the Plan, the Company set aside, from total LSTC, those final settlements which were to be settled in cash (approximately $18.4 million) and stock (approximately $486.1 million) and recorded a reorganization gain of approximately $434.0 million in full settlement of the LSTC.
Other Plan adjustments include:
| (a) | Repayment of Predecessor debt. This relates to (b) below; |
| (b) | Repayment of FRNs. This was recorded in LSTC prior to May 10, 2010. Total principal amount owed to FRNs prior to the Emergence Date amounted to approximately $625.6 million (of the $628.6 million net plan adjustment as noted in (b) in the above table, approximately $3 million related to the re-class of capital lease obligations from short term liability to long term liability). |
In addition, accumulated interest owed to FRNs prior to Emergence Date was approximately $13 million ($1.6 million net plan adjustment noted in (b.1) in the table above comprised of $17.6 million of LSTC, offset by the aforementioned $13 million of accumulated interest paid to FRNs and $3 million of accounts payable).
The Company also incurred approximately $19.6 million in professional fees and financing costs relating the settlement of amounts due to FRNs. (the $24.4 million net plan adjustment to accounts payable noted in (b.2) in the table above comprised of the aforementioned $19.6 million of professional fees as well as $4.8 million of accounts payable)
In accordance with the Plan, the Company settled the FRN principal, accumulated interest, professional fees and financing costs (as described above) fully in cash on the Emergence Date. Proceeds from the $450 million term loan, net proceeds of $104.9 million from the Rights Offering and the Company’s cash balances were utilized to effect the above settlements;
| (c) | Extinguishment of debt financing costs. In connection with the extinguishment of old debts (Senior Unsecured Notes, Exchangeable Senior Subordinated Debentures and FRNs) in accordance with the Plan, the Company originally had capitalized and amortized all financing costs relating to such old debt. In accordance with the provisions of ASC 470, “Early Extinguishment of Debt”, the remaining unamortized costs of approximately $13 million was expensed as reorganization expense; |
| (d) | Reclassification of the Senior Secured Term Loan between short-term and long-term obligations. During the first quarter of 2010, prior to emergence and as part of its exit financing strategy, the Company closed a $450 million senior secured five-year term loan facility, the receipt of the proceeds which were contingent upon emergence from the Chapter 11 Cases. The Company had recorded the receipts as restricted cash and short term liability as of March 28, 2010 pending the remaining outcome of the Chapter 11 Cases during the second quarter of 2010. Upon emergence, the Company received the loan proceeds and reclassified the long term portion of the loan to long term liability; |
| (e) | Elimination of old equity. Upon the effective date of the Plan, all existing Spansion equity plans (2005 & 2007 Equity Incentive Plans and Saifun Option Plans) and all equity awards there under were cancelled. In accordance with ASC 718, “Compensation-Stock Compensation,” the Company recorded, as an adjustment to stockholder’s deficit, the remaining unamortized stock compensation expense of approximately $5.5 million as a reorganization expense in the Income Statement of the Predecessor |
82
Table of Contents
Spansion Inc.
Notes to Consolidated Financial Statements—(Continued)
| during the second quarter of 2010. Total adjustments to stockholders’ deficit, net of all adjustments in the “Plan Adjustments” column in the above table, amounted to approximately $909.7 million; |
| (f) | Chapter 11 emergence bonus payable to the Chief Executive Officer of the Company. In accordance with our employment agreement with our Chief Executive Officer, Mr. Kispert was entitled to a $1.7 million bonus upon the consummation of the Plan, which was consummated on May 10, 2010. Because this bonus was payable only upon the effectiveness of the Plan and was not contingent upon any other performance requirement in the post-emergence period, the Company accounted for the bonus as a Plan adjustment and a reorganization expense in accordance with ASC 805 “Compensation payments for post-combination services;” |
| (g) | Set-off of accounts payable and accounts receivable balances and reorganization gains realized from accounts receivable reserve balances. Of the $7.1 million net plan adjustment noted in (g) in the above table, $11.4 million of accounts receivable relating to a customer was set-off against amounts owed to the same customer upon the confirmation of the Plan, and which was offset by a net $4.3 million reorganization gain, of which $3.9 million related to a credit note issued to a customer which was rendered ineffective as no unsecured claim was received from the customer during the Bankruptcy Court claims process period which closed during the first quarter of fiscal year 2010. Similarly, an additional $0.5 million gain was recorded for a accounts receivable reserve for a customer which was rendered ineffective upon plan confirmation; and |
| (h) | Set-off of allowance for doubtful accounts balance against a gross accounts receivable balance. A $3.8 million allowance for doubtful debt balance relating to a customer was set-off against the gross accounts receivable of $11.4 million ((as noted in (g) above)) as these balances were rendered ineffective upon the confirmation of the Plan. |
Fresh Start Adjustments
Significant adjustments reflected in the Fresh Start Consolidated Balance Sheet based on the revaluation of assets and liabilities are summarized as follows:
| (i) | Inventories. An adjustment of $141.9 million was recorded to increase the net book value of inventories to their estimated fair value. The fair value of finished goods was estimated based on the average selling price less the sum of disposal costs and a reasonable profit allowance for the remaining manufacturing and selling effort. The fair value of work-in-process was estimated based on the average selling price less the sum of cost to complete, disposal costs, and a reasonable profit allowance. Raw materials were carried on the Predecessor’s and Successor’s books at replacement costs and there was no fair value adjustment required; |
| (j) | Deferred Income Tax. Due to various adjustments and revaluations arising from fresh start accounting, both on foreign and domestic entities, deferred tax assets and liabilities associated with certain tangible and intangible assets were revalued and/or recomputed. Similarly, certain tax attributes such as tax credits, tax allowances and net operating losses were revaluated and/or recomputed, resulting in a net deferred tax adjustment of $3.2 million; |
| (k) | Property, plant and equipment, net. A net adjustment of $ 85.6 million was recorded to increase the net book value of tangible fixed assets to their estimated fair value. In valuing its long-lived tangible assets, the Company applied the fair value definition as set forth in ASC 820 “Fair Value Measurement” which states that fair value is the amount at which an asset (or liability) could be bought (or incurred) or sold (or settled) in a current transaction between willing parties, that is, other than in a forced or liquidation sale. The Company identified its long-lived assets as either in-use or to-be-disposed-off (either by sale or by scrap). Assets in-use were valued under the continued use |
83
Table of Contents
Spansion Inc.
Notes to Consolidated Financial Statements—(Continued)
| premise. This premise assumes that the assets will remain “as-is, where is,” and continue to be used at their present location for the continuation of business operations. This value includes all direct and indirect costs necessary to acquire, install, and make the asset operational. Assets to be disposed of were valued on an in-exchange value premise. This premise represents the highest and best use of the asset is an in-exchange if the asset would provide maximum value to market participants principally on a standalone basis; |
| (l) | Intangible Assets. An adjustment of $198.3 million was recorded (for developed technology, customer relationships, trade name and in-process research and development (IPR&D) based on fair values determined by the Company. As part of its application of fresh start accounting, the Company allocated the reorganization value to its assets and liabilities, including intangible assets using: i) discounted cash flow methodology applied to its financial forecasts and also taking into consideration the enterprise value of the Successor based on the Bankruptcy Court approved enterprise value ranges and methodologies (see “Fresh Start Consolidated Balance Sheet” section of Note 2 for discussion of the enterprise value), and ii) Guideline Public Company (GPC) methodology, considering data from public companies deemed to be comparable to the Company to develop relevant market multiples which were then applied to the Company’s forecasts provided by Management to calculate its fair value. See Note 9 for details; |
| (m) | Goodwill. An adjustment of $162.3 million was recorded to reflect the allocation of the reorganized enterprise value of the Successor in excess of the fair value of tangible and identified intangible net assets. See Note 9 for details; |
| (n) | Accounts Payable and Other Accrued Liabilities. The increase of $25.4 million in Accounts Payable primarily related to the recording of a $25.2 million legal liability arising from the implementation of a new accounting policy upon the adoption of fresh start accounting, see Note 3 for details. The increase of $19.8 million in other accrued liabilities was primarily due to $16.4 million of liabilities reclassified from deferred income, a $1.3 million increase to an existing liability which was previously discounted to its net present value (when the liability was deemed to be long term in previous accounting periods and which was deemed to be short term as of the Emergence Date) and a $1.4 million accrual for committed purchase orders to vendors; |
| (o) | Deferred Income. An adjustment of $39.5 million was recorded to reduce deferred income to the fair value of the Company’s related future performance obligations. Of the net fresh start adjustment of $47.5 million noted in (o) in the above table, $39.5 million related to deferred income as discussed above and $8.0 million related to other deferred revenue balances set-off against accounts receivable balances (see (r) below for details); |
| (p) | New Common Stock. All Old Common Stock of the Predecessor was cancelled and the Successor issued New Common Stock in accordance with the Plan. See Note 4 for details; |
| (q) | Elimination of allowance for doubtful accounts (AFDA). Upon the adoption of fresh start accounting, all of the Predecessor’s reserves including AFDA are eliminated as the Successor commences operations as a new entity. Therefore, the remaining AFDA balance of $58.7 million prior to the adoption of fresh start accounting was eliminated by setting off the reserves against their original accounts receivable balances; |
| (r) | Deferred revenue set-off against accounts receivable. In prior accounting periods, the Company had previously recorded deferred revenue from two customers amounting to approximately $8.0 million for invoice collection uncertainties (i.e. collectability of sales proceeds was not reasonably assured). As part of fresh start accounting, the fair values of the deferred revenue and accounts receivable balances in the balance sheet amounted to zero as there were no additional performance obligations to be |
84
Table of Contents
Spansion Inc.
Notes to Consolidated Financial Statements—(Continued)
| rendered by the Company. Hence, these two balances were set-off against each other. There was no impact to retained earnings as a result of the above; |
| (s) | New debt financing costs write off. During the first quarter of 2010, prior to emergence and as part of its’ exit financing strategy, the Company closed a $450 million five-year senior secured term loan facility resulting in debt financing costs of approximately $13.5 million which were capitalized in the predecessor’s financial statements just prior to the Emergence Date. These were paid upon emergence. However, the Company concluded the fair value of the deferred financing costs to be zero as the fair value of the debt was deemed to be at par value. Similarly, the Company also recorded a fresh start adjustment of $0.6 million of financing costs relating to its new unutilized revolving credit facility for which there was no future performance obligations. This resulted in a zero fair value; and |
| (t) | Net adjustment to enterprise value. Included in accounts receivable/payable to related parties is approximately $283 million receivable/payable to Spansion Japan, representing balances related to transactions between the two companies prior to October 27, 2009 (the date when the Company and Spansion Japan mutually agreed to pricing terms through executed purchase orders). These balances were deemed expunged, released and satisfied on consummation of definitive agreements laid out in the January 8, 2010 Settlement as described above. With the acquisition of Spansion Japan’s distribution business on May 24, 2010, all material conditions of the Settlement were fulfilled. As a result, the receivable and payable balances due from/to Spansion Japan as of October 27, 2009 were set-off subsequent to May 24, 2010, and prior to the end of the second quarter ended June 27, 2010. Therefore, the enterprise value as of the Emergence Date is the total assets of the Company (approximately $1.8 billion) less $283 million (which was grossed up in accounts receivable and payable in the opening balance sheet as of the Emergence Date). Thus, the enterprise value was approximately $1.5 billion. |
3. Summary of Significant Accounting Policies
Basis of Presentation
The accompanying consolidated financial statements of the Company have been prepared in accordance with U.S. generally accepted accounting principles (U.S. GAAP). In preparing the Consolidated Financial Statements for the Predecessor, the Company applied ASC 852 “Reorganizations,” which requires that the financial statements, for periods subsequent to the Chapter 11 filing, distinguish transactions and events that were directly associated with the reorganization from the ongoing operations of the business. Accordingly, professional fees associated with the Chapter 11 Cases and certain gains and losses resulting from reorganization of the Company’s business have been reported separately as reorganization items. In addition, interest expense for the Predecessor has been reported only to the extent that it was paid during the Chapter 11 Cases or that it was probable that it would be an allowed priority, secured, or unsecured claim under the Chapter 11 Cases. Interest income earned during the Chapter 11 Cases is reported as a reorganization item.
Upon emergence from Chapter 11, the Company adopted fresh start accounting. The adoption of fresh start accounting results in the Company becoming a new entity for financial reporting purposes. Accordingly, the Consolidated Financial Statements on or after May 10, 2010 are not comparable to the Consolidated Financial Statements prior to that date. The Company’s Consolidated Statements of Operations for fiscal year ended December 26, 2010 and for subsequent periods through fiscal year 2013 will be split into Predecessor and Successor financial statements for as long as any Predecessor financial statements are disclosed.
Fresh start accounting requires resetting the historical net book value of assets and liabilities to fair value by allocating the entity’s reorganization value to its assets and liabilities pursuant to ASC 805 “Business
85
Table of Contents
Spansion Inc.
Notes to Consolidated Financial Statements—(Continued)
Combinations” and ASC 820 “Fair Value Measurements and Disclosures”. The excess reorganization value over the fair value of tangible and identifiable intangible assets was recorded as goodwill on the Consolidated Balance Sheet. Deferred taxes were determined in conformity with ASC 740 “Income Taxes”. For additional information regarding the impact of fresh start accounting on our Consolidated Balance Sheet as of December 26, 2010, see Note 2 for further details.
Furthermore, effective March 3, 2009, the Company deconsolidated Spansion Japan because, despite its 100 percent equity ownership interest, the Company no longer controlled Spansion Japan due to the appointment of a trustee in the Spansion Japan Proceeding. Since March 3, 2009, the Company has accounted for its interest in Spansion Japan as a cost basis investment. Transactions between the Company and Spansion Japan after March 3, 2009, have been reflected as transactions with a third party. Effective, September 28, 2010, the Company’s 100 percent equity ownership interest in Spansion Japan was extinguished by the Tokyo District Court. See “Business Relationship with Spansion Japan and Foundry Agreement” in Note 2 above for further details.
With the exception of Spansion Japan as described above, the consolidated financial statements include all the accounts of the Company and those of its wholly owned subsidiaries, and all intercompany accounts and transactions have been eliminated.
Fiscal Year
The Company operates on a 52- to 53-week fiscal year ending on the last Sunday in December. The years ended December 26, 2010, December 27, 2009 and December 28, 2008 consisted of 52 weeks each.
Principles of Consolidation
With the exception of Spansion Japan as described above, the consolidated financial statements include all the accounts of the Company and those of its wholly owned subsidiaries, and all intercompany accounts and transactions have been eliminated.
Use of Estimates
The preparation of the Company’s consolidated financial statements and disclosures in conformity with U.S. GAAP requires management to make estimates and assumptions that affect the reported amounts of assets and liabilities, disclosure of commitments and contingencies and the reported amounts of revenues and expenses during the reporting periods. Estimates are used to account for the fair value of fresh start adjustments, the fair value of certain marketable securities, revenue reserves, the allowance for doubtful accounts, inventory reserves, valuation of acquired intangible assets, impairment of long-lived assets, legal contingencies, income taxes, stock-based compensation expenses, liabilities subject to compromise, the fair value of the debt, and product warranties. Actual results may differ from those estimates, and such differences may be material to the Company’s consolidated financial statements.
Cash Equivalents
Cash equivalents consist of financial instruments that are readily convertible into cash and have remaining maturities of three months or less at the time of purchase.
86
Table of Contents
Spansion Inc.
Notes to Consolidated Financial Statements—(Continued)
Allowance for Doubtful Accounts
The Company maintains an allowance for doubtful accounts based on a variety of factors, including the length of time the receivable is past due, historical experience and the financial condition of customers.
The following describes activity in the accounts receivable allowance for doubtful accounts for the periods ended December 26, 2010, May 10, 2010, and December 27, 2009.
| Period ended |
Predecessor/ Successor |
Balance at Beginning of Period |
Additions Charged to Costs and Expenses |
Deductions | Balance at End of Period |
|||||||||||||||
| (in thousands) | ||||||||||||||||||||
| December 26, 2010 |
Successor | $ | 0 | $ | 465 | $ | (138 | ) | $ | 326 | ||||||||||
| May 10, 2010 |
Predecessor | $ | 56,408 | $ | 2,251 | $ | (58,659 | ) | $ | 0 | ||||||||||
| December 27, 2009 |
Predecessor | $ | 8,106 | $ | 48,524 | $ | (222 | ) | $ | 56,408 | ||||||||||
In the Predecessor period, approximately $58.7 million was written off as a result of fresh start accounting – See Note 2 for further details. During the year ended December 27, 2009, of the $48.5 million charged to costs and expenses, approximately $28.5 million related to reserves recorded as an allowance against the accounts receivable due from Spansion Japan as of March 3, 2009, which was included in the gain on deconsolidation of subsidiary in the consolidated statement of operations for the year ended therein.
Inventories
Inventories are stated at standard cost adjusted to approximate the lower of actual cost (first-in, first-out method) or market. The Company writes down inventories based on forecasted demand and technological obsolescence. These factors are impacted by market and economic conditions, technology changes, new product introductions and changes in strategic direction and require estimates that may include uncertain elements. Actual demand may differ from forecasted demand, and such differences may have a material effect on recorded inventory values.
In connection with fresh start accounting, net inventories were adjusted to increase the carrying value of inventories to estimated fair value on May 11, 2010.
| Successor | Successor | Predecessor | ||||||||||
| December 26, 2010 | May 11, 2010 | December 27, 2009 | ||||||||||
| (in thousands) | ||||||||||||
| Raw materials |
$ | 16,537 | $ | 15,675 | $ | 14,202 | ||||||
| Work-in-process |
128,753 | 236,510 | 112,468 | |||||||||
| Finished goods |
23,647 | 41,625 | 15,052 | |||||||||
| Inventories |
$ | 168,937 | $ | 293,810 | $ | 141,722 | ||||||
The increase in the carrying value of inventory to estimated fair value due to fresh start accounting as of December 26, 2010 and May 11, 2010 was approximately $5.9 million and $141.9 million respectively.
Revenue Recognition
The Company generally recognizes revenue when it has sold its products to its OEM customers and title and risk of loss for the products have transferred to the OEM. Estimates of product returns and sales allowances,
87
Table of Contents
Spansion Inc.
Notes to Consolidated Financial Statements—(Continued)
related to reasons other than product quality, are based on actual historical experience and are recorded as a reduction in revenue at the time revenue is recognized.
The Company sells directly to distributors under terms that provide for rights of return, stock rotation and price protection guarantees. The Company defers the recognition of revenue and related product costs on these sales as deferred income until the product is resold by its distributors. The Company also sells some of its products to certain distributors under sales arrangements that do not allow for rights of return or price protection on unsold products. In these instances, the Company recognizes revenue when it ships the product directly to the distributors.
The Company recognizes revenue net of sales taxes, value-added taxes, and transaction taxes directly imposed by governmental authorities on the Company’s revenue producing transactions with its customers. The Company includes shipping costs related to products shipped to customers in cost of sales.
For the year ended December 27, 2009 and December 26,2010, the Company deferred the recognition of revenues and related product costs on sales to Spansion Japan until the products were resold by Spansion Japan’s distributors.
Property, Plant and Equipment
Property, plant and equipment are stated at cost for the Predecessor and revalued at fair value on May 11, 2010 in accordance with fresh start accounting. Depreciation and amortization are provided on a straight-line basis over the existing useful lives of the assets. Pre-emergence fully depreciated assets were deemed to have useful lives of 12 months post-emergence. Estimated useful lives of property, plant and equipment for financial reporting purposes are as follows: machinery and equipment, two to seven years; buildings and building improvements, from five to twenty-six years; and leasehold improvements, the shorter of the remaining terms of the leases or the estimated economic useful lives of the improvements.
| Successor | Successor | Predecessor | ||||||||||
| December 26, 2010 | May 11, 2010 | December 27, 2009 | ||||||||||
| (in thousands) | ||||||||||||
| Land |
$ | 51,778 | $ | 51,778 | $ | 20,107 | ||||||
| Buildings and leasehold improvements |
68,437 | 70,210 | 117,553 | |||||||||
| Equipment |
242,240 | 235,463 | 318,592 | |||||||||
| Construction in progress |
18,745 | 15,242 | 14,345 | |||||||||
| Accumulated depreciation and amortization |
(121,260 | ) | — | (147,887 | ) | |||||||
| Property, plant and equipment, net |
$ | 259,940 | $ | 372,693 | $ | 322,710 | ||||||
Impairment of Long-Lived Assets including Acquisition-Related Intangible Assets
The Company evaluates whether an impairment loss has occurred for an asset (asset group) to be held and used when events and circumstances indicate that the carrying amount of an asset (asset group) might not be recoverable. For purposes of assessing recoverability and impairment of an asset (asset group) held and used, the Company groups assets at the lowest level for which there are identifiable independent cash flows. The Company assesses recoverability by determining whether the undiscounted cash flows estimated to be generated by an asset (asset group) are less than the carrying amount of the asset (asset group). If fair value of the asset (asset group) is less than the carrying value, the impairment loss is based on the excess of the carrying amount of the asset (asset group) over its fair value. The adjusted carrying value of the related asset (asset group) establishes
88
Table of Contents
Spansion Inc.
Notes to Consolidated Financial Statements—(Continued)
the new cost basis and accumulated depreciation and amortization are reset to zero. For an asset (disposal group) held for sale, impairment losses are measured at the lower of the carrying amount of the asset (disposal group) or the fair value of the asset (disposal group). For an asset (asset group) to be disposed of other than by sale, impairment losses are measured based on the excess of the carrying amount of the asset (asset group) over its respective fair value. Fair value for purposes of measuring impairments is determined by discounted future cash flows, appraisals or other methods. See Note 7 and 8 for further details.
Intangible Assets
Intangible assets other than intellectual property include developed technology, customer relationships and trade name which are amortized on a straight-line basis over periods ranging from seven to ten years. See Note 6 for details. If an IPR&D project is completed, the carrying value of the related intangible asset is amortized over the remaining estimated life of the asset beginning in the period in which the project is completed and sales of related product commenced. If an IPR&D project becomes impaired or is abandoned, the carrying value of the related intangible asset would be written down to its fair value and an impairment charge would be recorded in the period in which the impairment occurs.
Goodwill
Goodwill represents the allocated enterprise value in connection with fresh start accounting under ASC 852 and the excess of the purchase price over the fair value of net tangible and identifiable intangible assets acquired in connection with the acquisition of the Spansion Japan’s distribution business (see Note 6). Goodwill amounts are not amortized, but rather are tested for impairment at least annually or more frequently if there are indicators of impairment present, at a level within the Company referred to as the reporting unit. The Company has historically performed its goodwill impairment analysis as of the last day of the fourth quarter of the fiscal year. With fresh start accounting, the Company will assess goodwill for impairment during the fourth quarter of each fiscal year. See Note 6 for further details of the goodwill impairment analysis.
Foreign Currency Translation/Transactions
The functional currency of the Company and its foreign subsidiaries, except for Spansion Japan (which was deconsolidated on March 3, 2009) and Nihon Spansion Limited (which was incorporated in Japan in May 2010) is the U.S. dollar. Adjustments resulting from re-measuring foreign currency denominated transactions and balances of these subsidiaries, other than Spansion Japan and Nihon Spansion Limited, into U.S. dollars are included in operations. Adjustments resulting from translating the foreign currency financial statements of Spansion Japan (up to March 3, 2009) and Nihon Spansion Limited, for which the functional currency is the Japanese yen, into the U.S. dollar reporting currency were included as a separate component of accumulated other comprehensive income (loss). Gains or losses resulting from transactions denominated in currencies other than the functional currencies of the Company and its subsidiaries were recorded in cost of sales in the Predecessor and in interest and other income (expense), net in the Successor. The aggregate exchange loss included in determining net loss was $0.5 million exchange gain for the Successor for fiscal 2010, $0.8 million loss for the Predecessor for fiscal 2010, $0.5 million in fiscal 2009 and $1.6 million for fiscal 2008.
Research and Development Expenses
The Company expenses research and development costs in the period in which such costs are incurred.
89
Table of Contents
Spansion Inc.
Notes to Consolidated Financial Statements—(Continued)
Advertising Expenses
Advertising costs are expensed as incurred. Advertising expenses were approximately $0.7 million for the Successor, $0.6 million for the Predecessor for the year ended December 26, 2010, $1.0 million for the year ended 2009 and $3.4 million for the year ended 2008.
Net Income (Loss) per Share
Basic and diluted net loss per share is computed based on the weighted-average number of common shares outstanding during the period.
For the Successor period ended December 26, 2010 and for the Predecessor year ended December 27, 2009 and December 28, 2008, the Company excluded from its diluted per share computation approximately 1.2 million, 19.2 million and 24.8 million potential common shares issuable upon exercise of outstanding stock options, upon vesting of outstanding restricted stock units and upon conversion of the Exchangeable Senior Subordinated Debentures (in the Predecessor), as their inclusion would be anti-dilutive. For the Predecessor period ended May 10, 2010, the Company had a net income and hence approximately 0.2 million of such shares were included in its diluted per share computation.
Income Taxes
In determining taxable income for financial statement reporting purposes, the Company must make estimates and judgments. These estimates and judgments are applied in the calculation of specific tax liabilities and in the determination of the recoverability of deferred tax assets, which arise from temporary differences between the recognition of assets and liabilities for tax and financial statement reporting purposes.
The Company must assess the likelihood that it will be able to recover its deferred tax assets. Unless recovery of these deferred tax assets is considered more likely than not, the Company must increase its provision for taxes by recording a charge to income tax expense, in the form of a valuation allowance against those deferred tax assets for which it does not believe it is more likely than not they will be realized. The Company considers past performance, future expected taxable income and prudent and feasible tax planning strategies in determining the need for a valuation allowance.
In addition, the calculation of the Company’s tax liabilities involves the application of complex tax rules and the potential for future adjustments by the relevant tax jurisdiction. If the Company’s estimates of these taxes are greater or less than actual results, an additional tax benefit or charge will result.
In determining the financial statement effects of an unrecognized tax position, the Company must determine when it is more likely than not, based on the technical merits, that the position will be sustained upon examination. In this determination, the Company must assume that the position will be examined by a taxing authority that has full knowledge of all relevant information, and will be resolved in the court of last resort. The more likely than not recognition threshold means that no amount of tax benefits may be recognized for a tax position without a greater than 50 percent likelihood that it will be sustained upon examination.
90
Table of Contents
Spansion Inc.
Notes to Consolidated Financial Statements—(Continued)
Accumulated Other Comprehensive Income (Loss)
The following are the components of accumulated other comprehensive income (loss):
| Successor | Predecessor | |||||||
| December 26, 2010 | December 27, 2009 | |||||||
| (in thousands) | ||||||||
| Cumulative translation adjustment |
$ | 797 | $ | — | ||||
| Unrealized gain on Saifun auction rate securities |
— | 195 | ||||||
| Total accumulated other comprehensive income |
$ | 797 | $ | 195 | ||||
Stock-Based Compensation
The Company estimates the fair value of its stock-based awards to employees using Black-Scholes-Merton option pricing model. Stock-based compensation expense recognized during a period is based on the higher of the grant-date fair value of the portion of share-based payment awards that is ultimately expected to vest, or actually vests, during the period. Compensation expense for all share-based payment awards is recognized using the straight-line attribution method reduced for estimated forfeitures.
Fair Value
The Company re-measured each major category of assets and liabilities at fair value in connection with fresh start accounting in accordance with the guidance in ASC 820. Fair value is defined as the price that would be received to sell an asset or paid to transfer a liability in an orderly transaction between market participants at the measurement date. In measuring fair value, the Company uses a hierarchy that maximizes the use of observable inputs and minimizes the use of unobservable inputs by requiring that the most observable inputs be used when available. Observable inputs are inputs that market participants would use in pricing the asset or liability developed based on market data obtained from sources independent of the Company. Unobservable inputs are inputs that reflect the Company’s best estimate of what market participants would use in pricing the asset or liability developed based on the best information available in the circumstances. The hierarchy is broken down into three levels based on the reliability of inputs as follows:
Level 1—Inputs are unadjusted, quoted prices in active markets for identical assets or liabilities at the measurement date.
Level 2—Inputs (other than quoted prices included in Level 1) are either directly or indirectly observable for the asset or liability through correlation with market data at the measurement date and for the duration of the asset/liability’s anticipated life.
Level 3—Inputs reflect management’s best estimate of what market participants would use in pricing the asset or liability at the measurement date. Consideration is given to the risk inherent in the valuation technique and the risk inherent in the inputs to the model.
The availability of observable inputs can vary and is affected by a wide variety of factors. To the extent that valuation is based on models or inputs that are less observable or unobservable in the market, the determination of fair value requires more judgment. Accordingly, the degree of judgment exercised by the Company in determining fair value is greatest for assets and liabilities categorized in Level 3. When observable prices are not available, the Company either uses implied pricing from comparables or valuation models based on net present value of estimated future cash flows, adjusted as appropriate for liquidity, credit, market and/or other risk factors. Fair value is a market-based measure considered from the perspective of a market participant rather than an
91
Table of Contents
Spansion Inc.
Notes to Consolidated Financial Statements—(Continued)
entity-specific measure. Therefore, even when market assumptions are not readily available, the Company’s own assumptions are set to reflect those it believes market participants would use in pricing the asset or liability at the measurement date. Please see Note 16 for fair value measurement.
Estimates relating to Litigation Reserve
Upon emergence and as part of fresh start accounting, the Company adopted a litigation reserve policy whereby it records its estimates of litigation expenses to defend it over the course of a reasonable period of time, currently estimated at twelve months in accordance with the provisions of ASC 450, “Contingencies”. Judgment is necessary to estimate these costs and an accrual is made when it is probable that a liability has been incurred and the amount of loss can be reasonably estimated. See Note 21 for a description of outstanding legal proceedings.
New Accounting Pronouncements
In April 2010, the FASB issued revised guidance to clarify that an employee share-based payment award with an exercise price denominated in the currency of a market in which a substantial portion of the entity’s equity securities trades should not be considered to contain a condition that is not a market, performance or service condition. Therefore, an entity would not classify such an award as a liability if it otherwise qualifies as equity. The amendments in this guidance are effective for fiscal years, and interim periods within those fiscal years, beginning on or after December 15, 2010. The revised guidance should be implemented by recording a cumulative-effect adjustment to the opening balance of retained earnings. The cumulative-effect adjustment should be calculated for all awards outstanding as of the beginning of the fiscal year in which the amendments are initially applied, as if the amendments had been applied consistently since the inception of the award. The cumulative-effect adjustment should be presented separately. Earlier application is permitted. The Company believes the adoption of this guidance on December 27, 2010 will not have a material impact on its consolidated financial statements.
In January 2010, the FASB issued amended guidance on fair value measurements and disclosures. The new guidance requires additional disclosures regarding fair value measurements, amends disclosures about postretirement benefit plan assets, and provides clarification regarding the level of disaggregation of fair value disclosures by investment class. This guidance is effective for interim and annual reporting periods beginning after December 15, 2009, except for certain Level 3 activity disclosure requirements that will be effective for reporting periods beginning after December 15, 2010. Accordingly, we adopted this amendment on December 28, 2009, except for the additional Level 3 requirements which will be adopted in 2011. The adoption of this guidance has not had, and the Company believes the adoption on December 27, 2010 will not have a material impact on its consolidated financial statements.
In October 2009, the FASB amended the accounting standards for revenue recognition to remove tangible products containing software components and non-software components that function together to deliver the product’s essential functionality from the scope of industry-specific software revenue recognition guidance. In October 2009, the FASB also amended the accounting standards for multiple deliverable revenue arrangements to:
| • | provide updated guidance on whether multiple deliverables exist, how the deliverables in an arrangement should be separated, and how the consideration should be allocated; |
| • | require an entity to allocate revenue in an arrangement using estimated selling prices of deliverables if a vendor does not have vendor-specific objective evidence of selling price or third-party evidence of selling price; and |
| • | eliminate the use of the residual method and require an entity to allocate revenue using the relative selling price method. |
92
Table of Contents
Spansion Inc.
Notes to Consolidated Financial Statements—(Continued)
The accounting changes included in this guidance are effective for fiscal years beginning on or after June 15, 2010, with early adoption permitted. Adoption may either be on a prospective basis or by retrospective application. The Company believes the adoption on December 27, 2010 of this guidance will not have a material impact on its consolidated financial statements.
Financial Statement Reclassifications
Certain prior period amounts in the consolidated statements of operations related to sales to Spansion Japan have been reclassified to conform to the current period presentation. There was no material impact to the Company’s results from operations due to these reclassifications.
4. Equity Incentive Plan and Stock-Based Compensation
Successor
Plan Descriptions
2010 Equity Incentive Award Plan
On May 10, 2010, upon emergence from the Chapter 11 Cases, the Company’s Board of Directors approved the Spansion Inc. 2010 Equity Incentive Award Plan (the 2010 Plan), under which 6,580,240 shares of New Common Stock were initially reserved and made available for issuance in the form of equity awards, including incentive and nonqualified stock options and restricted stock unit (RSU) awards.
The aggregate number of shares of New Common Stock which may be issued or transferred pursuant to equity awards under the 2010 Plan is the sum of (i) 6,580,240 (provided, that the aggregate number of shares of New Common Stock which may be issued or transferred pursuant to Full Value Awards , as defined in the Plan is 3,290,120) and (ii) an annual increase on the first day of each year beginning in 2011 and ending in 2015, equal to the least of (A) seven million (7,000,000) shares; (B) a percentage of the shares of New Common Stock outstanding (on an as converted basis) on the last day of the immediately preceding fiscal year as follows: 7 percent for the increase made January 1, 2011, 6 percent for the increase made January 1, 2012, 4.5 percent for the increase made January 1, 2013 and 3.5 percent for the increases made thereafter; and (C) such smaller number as may be determined by the Board prior to the first day of such year.
The 2010 Plan is administered by the Compensation Committee of the Company’s Board of Directors, and that committee has the authority to, among other things, grant awards, delegate certain of its powers, accelerate or extend the vesting or exercisability of awards and determine the date of grant of an award. The maximum term of any stock option granted under the 2010 Plan is seven years from the date of grant and the exercise price of each option is determined under the applicable terms and conditions as approved by the Compensation Committee.
The 2010 Plan provides that grants of incentive stock options may only be granted to employees of the Company or its subsidiaries. Grants of non-qualified options and RSUs may be awarded to an officer or employee, a consultant or advisor, or a director of the Company or its subsidiaries. The exercise price of each stock option shall not be less than 100 percent of the fair market value of the New Common Stock on the date of grant (not less than 110 percent if such stock option is granted to a person who has more than 10 percent of the total combined voting power of all classes of stock of the Company or any subsidiary. The 2010 Plan also provides for the issuance of performance-based RSU (PBRSU) awards, which the Company issued to certain senior executives in fiscal 2010.
Under the 2010 Plan, one third of the shares subject to stock options excluding stock options granted to non-employee directors vest on the anniversary of the grant date, and 1/36 of the shares vest each month for the
93
Table of Contents
Spansion Inc.
Notes to Consolidated Financial Statements—(Continued)
next two years for all grants. For non-employee directors, one twelfth of the shares subject to stock options vest on a quarterly basis over three years. All stock options expire if not exercised by the seventh anniversary of the grant date. RSU awards for certain senior officers and employees vest in four substantially equal installments on the last trading day in January of each year from 2011 through 2014. Ten percent up to a maximum of 100 shares of the RSU awards granted to the employees in the U.S. on May 10, 2010, excluding the executive officers, vested immediately. For non-employee directors, one twelfth of the RSU awards granted vest on a quarterly basis over three years. Shares that are subject to or underlie awards that expire or for any reason are cancelled, terminated or forfeited, or fail to vest will again be available for grant under the 2010 Plan.
The PBRSU awards have a four-year performance period, with 25% of each target award (Base shares) subject to performance goals in each of the four fiscal years following the date of grant, with a minimum of 50% and a maximum of 150% of base shares vesting over a four-year period, subject to performance. If the performance goals are not met in a particular year, the shares will be carried forward and will be forfeited if not earned by the last performance year. If performance is above target in a particular year, base shares earned will be accelerated after shares carried forward from prior years are used.
Valuation and Expense Information
The following table sets forth the total recorded stock-based compensation expense by financial statement caption for the Successor (2010 Plan) and the Predecessor (2005 Plan, 2007 Plan, Saifun 2003 Plan, Saifun Semiconductor Ltd. 2001 Share Option Plan and Saifun Semiconductor Ltd. 1997 Share Option Plan), resulting from the Company’s stock options and RSU awards for the years ended December 26, 2010, December 27, 2009, and December 28, 2008.
| Year Ended December 26, 2010 | ||||||||||||||||||||
| Successor | Predecessor | Predecessor | Predecessor | |||||||||||||||||
| Period from May 11, 2010 to December 26, 2010 |
Period from December 28, 2009 to May 10, 2010(1) |
Year Ended December 27, 2009 |
Year Ended December 28, 2008 |
|||||||||||||||||
| (in thousands) | ||||||||||||||||||||
| Cost of sales |
$ | 3,164 | $ | 346 | $ | 2,718 | $ | 5,340 | ||||||||||||
| Research and development |
1,520 | 683 | 3,684 | 6,424 | ||||||||||||||||
| Sales, general and administrative |
3,642 | 566 | 6,016 | 9,816 | ||||||||||||||||
| Expense on forfeiture and cancellation of old equity incentive plans |
— | 5,457 | — | — | ||||||||||||||||
| Stock-based compensation expense |
$ | 8,326 | $ | 7,052 | $ | 12,418 | $ | 21,580 | ||||||||||||
| (1) | May 10, 2010 is the date on which all old equity incentive plans were cancelled and the 2010 Plan took effect. |
The weighted average fair value of the Company’s stock options granted in the Successor under the 2010 Plan was $5.21per share. The fair value of each stock option was estimated at the date of grant using a Black-Scholes option pricing model, with the following assumptions for grants:
| Weighted Average for the period from May 10, 2010 to December 26, 2010 |
||||
| Expected volatility |
55.44 | % | ||
| Risk-free interest rate |
1.76 | % | ||
| Expected term (in years) |
4.3 | |||
| Dividend yield |
0.00 | % | ||
94
Table of Contents
Spansion Inc.
Notes to Consolidated Financial Statements—(Continued)
The Company’s dividend yield is zero because the Company has never paid dividends and does not have plans to do so over the expected life of the stock options. As the Company emerged as a new public company for which historical information is not relevant, it considered historical and implied volatilities from peer companies who are in the same industry sector with similar characteristics to estimate the expected volatility over the option term. The risk-free interest rate is based on the yield from U.S. Treasury zero-coupon bond with a remaining term equal to the expected stock option life. The expected term is based on the “simplified method” for developing the estimate of the expected life of a “plain vanilla” stock. Under this approach, the expected term is presumed to be the mid-point between the average vesting date and the end of the contractual term.
ASC 718 requires forfeitures to be estimated at the time of grant and revised, if necessary, in subsequent periods if actual forfeitures differ from those estimates in order to derive the Company’s best estimate of awards ultimately expected to vest. The Company does not have sufficient historical forfeiture experience related to its own stock-based awards granted subsequent to emergence from Chapter 11 in May 2010, and therefore, estimated the forfeitures based on the average of its own post-emergence fiscal 2010 forfeiture rate and historical forfeiture rates of peer companies over the expected vesting term of our stock based awards.
As of December 26, 2010, the total unrecognized compensation cost related to unvested stock options and RSU awards was approximately $32.5 million after reduction for estimated forfeitures, and such stock options and RSU awards will generally vest ratably through 2014.
Shares Available to Grant
The numbers of shares of New Common Stock available for grant at December 26, 2010 under the 2010 Plan are shown in the following table:
| Number of shares available for grant: |
||||
| Shares reserved for grant under the 2010 Plan(1) |
6,580,240 | |||
| Stock options granted through December 26, 2010, net of forfeited stock options |
(3,027,943 | ) | ||
| RSU awards granted through December 26, 2010, net of forfeited RSU awards |
(3,040,566 | ) | ||
| Shares available for grant under the 2010 Plan |
511,731 | |||
| (1) | The 6,580,240 shares reserved for grant are in accordance with the Company’s 2010 Equity Incentive Plan. |
Stock Option and Restricted Stock Unit Activity
The following table summarizes stock option activity and related information under the 2010 Plan for the periods presented:
| Number of Shares |
Weighted- Average Exercise Price |
Average Remaining Contractual Life (in years) |
Aggregate Intrinsic Value (in thousands) |
|||||||||||||
| Options: |
||||||||||||||||
| Outstanding as of May 10, 2010 |
— | $ | — | — | $ | — | ||||||||||
| Granted |
3,193,436 | $ | 10.91 | |||||||||||||
| Forfeited |
(165,493 | ) | $ | 10.51 | ||||||||||||
| Exercised |
— | |||||||||||||||
| Outstanding as of December 26, 2010 |
3,027,943 | $ | 10.93 | 6.40 | $ | 27,875 | ||||||||||
| Exercisable as of December 26, 2010 |
— | $ | — | — | $ | — | ||||||||||
95
Table of Contents
Spansion Inc.
Notes to Consolidated Financial Statements—(Continued)
The aggregate intrinsic value in the preceding table represents the total pretax intrinsic value, based on the New Common Stock’s closing sales price of $20.14 as of December 23, 2010, which would have been received by the stock option holders had all stock option holders exercised their in-the-money stock options as of that date.
The following table summarizes RSU award activities and related information for the periods presented:
| Shares | Fair Value | |||||||
| Restricted Stock Units: |
||||||||
| Unvested as of May 10, 2010 |
— | $ | — | |||||
| Granted |
3,192,186 | $ | 10.86 | |||||
| Forfeited |
(151,620 | ) | $ | 10.51 | ||||
| Vested |
(71,992 | ) | $ | 10.51 | ||||
| Unvested as of December 26, 2010 |
2,968,574 | $ | 10.88 | |||||
Predecessor
Plan Descriptions
Under the Plan and upon the Company’s emergence from Chapter 11 Cases on the Emergence Date, the Predecessor’s equity plans as described below were cancelled.
2005 Equity Incentive Plan
In fiscal 2005, the Company’s stockholders approved the Spansion Inc. 2005 Equity Incentive Plan (the 2005 Plan) under which 9,500,000 shares of Common Stock had been reserved and made available for issuance in the form of equity awards, including incentive and nonqualified stock options and restricted stock unit (RSU) awards.
Grants may be awarded to an officer or employee, a consultant or advisor, or a non-employee director of the Company or its subsidiaries; provided that, the incentive stock options granted under the 2005 Plan could be granted only to employees of the Company or its subsidiaries. The exercise price of each incentive stock option was required to be not less than 100 percent of the fair market value of the Company’s Common Stock on the date of grant (not less than 110 percent if such stock option is granted to a person who has more than 10 percent of the total voting power of all classes of the Company’s stock).
The maximum term of any stock option granted under the 2005 Plan is 10 years from the date of grant and the exercise price of each option is determined under the applicable terms and conditions as approved by the Compensation Committee.
On May 29, 2007, the Company’s stockholders approved the Spansion Inc. 2007 Equity Incentive Plan (the 2007 Plan) (see below); at that time, the Company discontinued granting awards under the 2005 Plan.
2007 Equity Incentive Plan
On May 29, 2007, the Company’s stockholders approved the Spansion Inc. 2007 Equity Incentive Plan (the 2007 Plan). Grants may be awarded to an officer or employee, a consultant or advisor, or a non-employee director of the Company or its subsidiaries. Stock options and RSU awards issued under the 2007 Plan generally vest 25 percent after one year, and the balance vest ratably on a quarterly basis over the following three years and expire if
96
Table of Contents
Spansion Inc.
Notes to Consolidated Financial Statements—(Continued)
not exercised by the seventh anniversary of the grant date. RSU awards have no exercise price or expiration date. Shares that are subject to or underlie awards that expired or for any reason were cancelled, terminated or forfeited, or failed to vest after implementation of the 2007 Plan are again available for grant under the 2007 Plan.
The maximum number of shares of the Company’s Common Stock that may be issued or transferred pursuant to awards under the 2007 Plan equals the sum of: (1) 6,675,000 shares, plus (2) the number of shares that were available for award grant purposes under the 2005 Plan as of May 29, 2007, plus (3) the number of any shares subject to stock options and restricted stock or RSU awards granted under the 2005 Plan and outstanding as of May 29, 2007 which expire, or for any reason are cancelled or terminated, after that date without being exercised or paid. As of May 29, 2007, approximately 920,523 shares were available for award grant purposes under the 2005 Plan, and approximately 7,091,852 shares were subject to options and restricted stock or RSU awards then outstanding under the 2005 Plan.
Saifun Semiconductors Ltd. Employee Share Option Plans (Saifun Option Plans)
The Company assumed all outstanding option shares under the Saifun 1997, 2001 and 2003 plans (Saifun Option Plans), which were converted into options to purchase shares of the Company’s Common Stock. Each option share assumed continues to have, and be subject to, the same terms and conditions of such options immediately prior to the acquisition date.
For options granted under the Saifun Option Plans, the exercise period may not exceed 10 years from the date of grant. Options are granted with an exercise price equal to the market price of the stock at the date of grant or at a lower price as may be determined by the compensation committee of the board of directors at the date of grant. Prior to the Acquisition, option awards vested over a period of up to five years; restricted stock unit and option awards granted after the Acquisition will vest over a period of up to four years. Awards granted under any of the Saifun Option Plans from the inception of the Saifun 2003 Plan through the Acquisition that are forfeited or cancelled revert to the Saifun 2003 Plan reserve. Future awards granted under the Saifun 2003 Plan that are forfeited or cancelled will also revert to that plan’s reserve.
Valuation and Expense Information
Under the Plan and upon the Company’s emergence from Chapter 11 Cases on the Emergence Date, the Predecessor’s outstanding equity securities, including all shares of Old Common Stock and options to purchase shares of Old Common Stock, were cancelled. The Company accelerated approximately $5.5 million of unrecognized compensation cost as of May 10, 2010, related to unvested stock options and RSU awards under the Predecessor equity plans. The charge was recorded as a reorganization item during the second quarter of fiscal 2010. No stock options were granted in the year ended December 27, 2009 under the Predecessor equity plans. The weighted average fair value of the Company’s stock options granted in the year ended December 28, 2008 under Spansion Plans and Saifun Option Plans was $1.89 per share. The fair value of each stock option was estimated at the date of grant using a Black-Scholes-Merton option pricing model, with the following assumptions for grants:
| Weighted Average for the Year Ended Dec. 28, 2008 |
||||
| Expected volatility |
48.66 | % | ||
| Risk-free interest rate |
2.67 | % | ||
| Expected term (in years) |
5.05 | |||
| Dividend yield |
0 | % | ||
97
Table of Contents
Spansion Inc.
Notes to Consolidated Financial Statements—(Continued)
The Company’s dividend yield is zero because the Company has never paid dividends and does not have plans to do so over the expected life of the stock options. The expected volatility is based on the Company’s historical volatility since its initial public offering in December 2005 and the volatilities of the Company’s competitors who are in the same industry sector with similar characteristics (guideline companies) given the limited historical realized volatility data of the Company. The risk-free interest rate is based on the yield from U.S. Treasury zero-coupon bond with a remaining term equal to the expected stock option life. The expected term is based on the “simplified method” for developing the estimate of the expected life of a “plain vanilla” stock option except for options granted to Saifun on the date of acquisition for which expected term was based on historical option exercise activity. Under this approach, the expected term is presumed to be the mid-point between the average vesting date and the end of the contractual term. The Company estimates forfeitures based on its historical forfeiture rates and those estimates are revised, if necessary, in subsequent periods if actual forfeitures differ from those estimates in order to derive the Company’s best estimate of awards ultimately expected to vest.
As of December 27, 2009, the total unrecognized compensation cost related to unvested stock options and RSU awards was approximately $13.0 million after reduction for estimated forfeitures, and such stock options and RSU awards will generally vest ratably through 2012.
Stock Option and Restricted Stock Unit Activity
The following table summarizes stock option activities and related information under Spansion Plans and Saifun Option Plans for the period presented:
| Number of Shares |
Weighted- Average Exercise Price |
Weighted- Average Remaining Contractual Life (in years) |
Aggregate Intrinsic Value (in thousands) |
|||||||||||||
| Options: |
||||||||||||||||
| Outstanding as of December 30, 2007 |
3,536,968 | $ | 11.53 | |||||||||||||
| Granted(1) |
6,806,119 | $ | 1.48 | |||||||||||||
| Cancelled |
(537,156 | ) | $ | 6.32 | ||||||||||||
| Exercised |
(26,534 | ) | $ | 0.08 | ||||||||||||
| Outstanding as of December 28, 2008 |
9,779,397 | $ | 4.85 | 6.42 | $ | 675 | ||||||||||
| Granted |
— | |||||||||||||||
| Cancelled |
(3,084,126 | ) | $ | 3.95 | ||||||||||||
| Exercised |
(197,951 | ) | $ | 0.03 | ||||||||||||
| Outstanding as of December 27, 2009(2) |
6,497,320 | $ | 5.42 | 4.77 | $ | 137 | ||||||||||
| Exercisable as of December 27, 2009(3) |
4,033,620 | $ | 7.03 | 3.86 | $ | 57 | ||||||||||
| (1) | The number of options granted in year ended December 28, 2008 includes 4,364,829 shares of options granted in March 2008 under Saifun Option Plans in accordance with the provisions of the Acquisition Agreement. |
| (2) | The number of options outstanding as of December 27, 2009 includes 349,090 shares of options held by Spansion Japan employees. |
| (3) | The number of options exercisable as of December 27, 2009 includes 284,473 shares of options held by Spansion Japan employees. |
The aggregate intrinsic value in the preceding table represents the total pretax intrinsic value, based on the Company’s closing stock price of $0.10 as of December 24, 2009, which was the last trading day prior to
98
Table of Contents
Spansion Inc.
Notes to Consolidated Financial Statements—(Continued)
December 27, 2009, which would have been received by the stock option holders had all stock option holders exercised their stock options as of that date.
The following table summarizes RSU award activities and related information for the period presented:
| Number of Shares |
Weighted- Average Grant-date Fair Value |
|||||||
| Restricted Stock Units: |
||||||||
| Unvested as of December 30, 2007 |
3,153,426 | $ | 11.33 | |||||
| Granted |
1,916,180 | $ | 2.93 | |||||
| Cancelled |
(400,909 | ) | $ | 8.74 | ||||
| Vested |
(1,368,132 | ) | $ | 11.51 | ||||
| Unvested as of December 28, 2008 |
3,300,565 | $ | 6.69 | |||||
| Granted |
— | $ | — | |||||
| Cancelled |
(1,316,748 | ) | $ | 6.33 | ||||
| Vested |
(1,026,884 | ) | $ | 8.35 | ||||
| Unvested as of December 27, 2009(1) |
956,933 | $ | 5.41 | |||||
| (1) | The number of RSUs unvested as of December 27, 2009 includes 73,358 shares held by Spansion Japan employees. |
5. Concentration of Credit Risk
Financial instruments that potentially subject the Company to concentrations of credit risk consist primarily of trade receivables.
In fiscal 2009, concentration of credit risk with respect to trade receivables existed because the Company sold a significant portion of its products directly to Spansion Japan which in turn resold these products to Fujitsu and trade accounts receivable from Spansion Japan comprised approximately 83 percent of the total consolidated trade accounts receivable balance as of December 27, 2009 and approximately 76 percent as of May 10, 2010 in the Predecessor. As of December 26, 2010, the Company did not have any trade accounts receivables with Spansion Japan due to the acquisition of the Spansion Japan’s distribution business in May 2010 (See Note 2 for details).
For the Successor, concentration of credit risk with respect to trade receivables existed because the Company sold a significant portion of its products to one customer which comprised of approximately 38 percent of the total consolidated trade accounts receivable balance as of December 26, 2010.
6. Intangible Assets and Goodwill
As part of its application of fresh start accounting, the Company allocated the reorganization value to its assets and liabilities, including intangible assets using: i) discounted cash flow methodology applied to its financial forecasts and also taking into consideration the enterprise value of the Successor based on the Bankruptcy Court approved enterprise value ranges and methodologies ( See Note 2 for discussion of the enterprise value), and ii) GPC methodology, considering data from public companies deemed to be comparable to the Company to develop relevant market multiples which were then applied to the Company’s forecasts provided by Management to calculate its fair value. Amortizable intangible assets included developed
99
Table of Contents
Spansion Inc.
Notes to Consolidated Financial Statements—(Continued)
technology, customer relationships, trade name and trademarks and their estimated useful lives are between seven to ten years. Indefinite-lived assets included IPR&D and goodwill.
During the third and fourth quarter of 2010, the Company corrected the allocation of the reorganization value to its assets and liabilities, including Goodwill resulting in a decrease to Goodwill of $12.5 million and a corresponding increase to deferred tax assets, fixed assets and income tax payable of $10.8 million, $2.2 million and $0.5 million, respectively. The Company concluded that the correction was not material to the previous or present periods.
Intangible assets at December 26, 2010 and December 27, 2009 are as follows:
| Successor | Predecessor | |||||||||||
| December 26, 2010 |
December 27, 2009 | |||||||||||
| (in thousands) | ||||||||||||
| Developed technology |
$ | 65,900 | $ | 1,646 | ||||||||
| Customer relationships |
93,348 | — | ||||||||||
| Trade name |
8,200 | — | ||||||||||
| Total amortizable intangible assets |
$ | 167,448 | 1,646 | |||||||||
| Less: Accumulated Amortization |
(12,715 | ) | (316 | ) | ||||||||
| Intangible assets , net |
$ | 154,733 | 1,330 | |||||||||
| IPR&D |
43,000 | — | ||||||||||
| Goodwill |
153,338 | — | ||||||||||
| Intangible assets and goodwill net |
$ | 351,071 | 1,330 | |||||||||
Customer relationships (which is amortized over a useful life of ten years) and goodwill included $10.1 million and $3.3 million, respectively, of intangibles assets arising from the acquisition of the Spansion Japan distribution business (See Note 2) as of May 24, 2010.
In accordance with ASC 350, Intangibles-Goodwill and Other, the Company reviews goodwill for impairment at least annually in the fourth quarter of each fiscal year or more frequently if events or changes in circumstances indicate that the asset might be impaired. The Company has determined that the annual goodwill impairment test will be performed on November 30th of each fiscal year commencing from November 30, 2010. ASC 350 requires a two-step method for determining goodwill impairment. Step one is to compare the fair value of the reporting unit with the unit’s carrying amount, including goodwill. If this test indicates that the fair value is less than the carrying value, then step two is required to compare the implied fair value of the reporting unit’s goodwill with the carrying amount of the reporting unit’s goodwill.
We determine the fair value of our single reporting unit to be equal to our market capitalization plus a control premium. Market capitalization is determined by multiplying the shares outstanding on the assessment date by the average market price of our common stock over a 10-day period before and a 10-day period after each assessment date. We use this 20-day duration to consider inherent market fluctuations that may affect any individual closing price. We believe that our market capitalization alone does not fully capture the fair value of our business as a whole, or the substantial value that an acquirer would obtain from its ability to obtain control of our business. As such, in determining fair value, we add a control premium which seeks to give effect to the increased consideration a potential acquirer would be required to pay in order to gain sufficient ownership to set policies, direct operations and make decisions related to our company to our market capitalization.
100
Table of Contents
Spansion Inc.
Notes to Consolidated Financial Statements—(Continued)
No goodwill impairment was recorded in fiscal 2010. We performed the step one fair value comparison as of November 30, 2010 and our market capitalization without considering a control premium, was $1.3 billion and our carrying value, including goodwill, was $644.0 million. Because market capitalization significantly exceeded our carrying value, our estimate of the control premium was not a determining factor in the outcome of step one of the impairment assessment.
In-Process Research and Development
As part of the application of fresh start accounting, approximately $43 million was allocated to IPR&D which included projects that had not reached technological feasibility and had no alternative future use at the time of the valuation. These projects related to the development of process technologies to manufacture flash memory products based on 65 nanometer process technology and primarily included certain new products from the GL and FL product families. As of December 26, 2010, none of these projects had reached technological feasibility but the Company expects these projects to attain technological feasibility and commence commercial production during fiscal 2011 and the first half of fiscal 2012. The values assigned to IPR&D was determined using a discounted cash flow methodology , specifically an excess earnings approach, which estimates value based upon the discounted value of future cash flow expected to be generated by the in-process projects, net of all contributory asset returns. The approach includes consideration of the importance of each project to the overall development plan, estimating costs to develop the purchased IPR&D into commercially viable products.
The discount rates applied to individual projects were selected after consideration of the overall estimated weighted average cost of capital and the discount rates applied to the valuation of the other assets acquired. Such weighted average cost of capital was adjusted to reflect the difficulties and uncertainties in completing each project and thereby achieving technological feasibility, the percentage of completion of each project, anticipated market acceptance and penetration, market growth rates and risks related to the impact of potential changes in future target markets. In developing the estimated fair values, the Company used a discount rate based on the Company’s weighted-average cost of capital.
If an IPR&D project is completed, the carrying value of the related intangible asset is amortized over the remaining estimated life of the asset beginning in the period in which the project is completed and sales of related product commenced. If an IPR&D project becomes impaired or is abandoned, the carrying value of the related intangible asset would be written down to its fair value and an impairment charge would be recorded in the period in which the impairment occurs.
7. Impairment of Long-Lived Assets including Acquisition-Related Intangible Assets
In accordance with the guidance in ASC Topic 360, Property, Plant, and Equipment we did not record any impairment charges as there are no impairment triggers for the Predecessor or Successor.
For the year ended December 27, 2009, the Company recorded an impairment charge of approximately $12.5 million primarily due to impairment on its equity investment and loan to an investee.
In 2008, a variety of external economic factors contributed to the decline in the Company’s operating performance, such as persistent oversupply in the Flash memory industry compounded by the global economic recession. The 2008 global economic downturn caused a sharp decline in worldwide demand for consumer goods and, consequently, a sharp reduction in demand for the Company’s products, which resulted in significant declines in the Company’s manufacturing capacity utilization as the Company reduced production. In addition to these economic factors, the ramp-up of SP1 was delayed during the second and third quarters of 2008 due to
101
Table of Contents
Spansion Inc.
Notes to Consolidated Financial Statements—(Continued)
slower than expected customer qualifications and the steep decline in the Japanese wireless market. These factors, among others, caused the Company’s stock price to drop significantly throughout 2008, resulting in a sustained market capitalization well below book value.
Given these indicators of impairment, the Company believed its long-lived assets including its acquisition-related intangible assets, may not be recoverable at December 28, 2008. Because of the vertical nature of the Company’s manufacturing operations and its multiple foundry, assembly and test facilities, the cash flows of the Company’s assets and liabilities below the entity level are not largely independent of one another and, therefore, the Company evaluated recoverability using a single, entity-wide asset group that included all of the Company’s long-lived assets and related operating assets and liabilities. The Company prepared an undiscounted cash flow analysis and determined that the carrying value of the asset group exceeded the undiscounted cash flows expected from the use and eventual disposition of the asset group and, therefore, the asset group was not recoverable. Accordingly, the Company estimated the fair value of the asset group based on a probability weighted cash flow forecast, discounted based on the Company’s weighted-average cost of capital. The total carrying value of the asset group exceeded management’s estimated fair value indicating an impairment loss. The excess carrying value of the asset group over its fair value was allocated on a pro rata basis to the individual assets in the asset group to adjust and reduce their carrying values. In this process, the adjusted carrying value of an individual asset was not reduced to below its individual fair value, if determinable. The adjusted carrying values of the assets established a new cost basis for the assets and depreciation and amortization was reset to zero.
As a result of this impairment analysis, the Company recorded a total long-lived asset impairment charge of approximately $1.6 billion in the fourth quarter ended December 28, 2008, reflecting the low demand for semiconductor equipment worldwide, coupled with excess supply.
8. Acquisition of Saifun Semiconductors Ltd.
On March 18, 2008, the Company completed the acquisition of all of the outstanding shares of Saifun Semiconductor Ltd, a publicly held company headquartered in Netanya, Israel and which is a provider of intellectual property (IP) solutions for the non-volatile memory (NVM) market.
The Company paid a consideration of approximately 22.7 million shares of the Predecessor Company’s Class A common stock for all outstanding common shares of Saifun Semiconductor Ltd. In addition, the Company also assumed all of the outstanding stock options of Saifun Semiconductor Ltd. which were converted into options to purchase approximately 4.3 million shares of the Predecessor Company’s Class A common stock. As a result of fresh start accounting, all of the Predecessor Company’s common stock and stock awards were cancelled- See Note 2 for further details of fresh start accounting.
102
Table of Contents
Spansion Inc.
Notes to Consolidated Financial Statements—(Continued)
The total purchase price for Saifun Semiconductor Ltd. was $119.3 million and was allocated to its tangible and identifiable intangible assets and liabilities based on their estimated fair values as of March 18, 2008, as set forth below:
| in millions | ||||
| Net tangible assets acquired |
$ | 24.2 | ||
| Existing technology |
42.8 | |||
| In process research and development |
10.8 | |||
| Non-competition agreement |
1.3 | |||
| Customer relationships |
18.0 | |||
| Trade name |
1.4 | |||
| Goodwill |
20.8 | |||
| Total purchase price |
$ | 119.3 | ||
Management performed an analysis to determine the fair value of each tangible and identifiable intangible asset, including the portion of the purchase price attributable to acquired in-process research and development projects.
In-Process Research and Development
Of the total purchase price, approximately $10.8 million was allocated to in-process research and development (IPR&D) and was expensed in the first quarter of fiscal 2008. Projects that qualify as IPR&D represent those that have not reached technological feasibility, which have no alternative future use at the time of the acquisition. These projects included development of top injection technology and Nitride-Read-Only-Memory (NROM) design projects.
The value assigned to IPR&D was determined using a discounted cash flow methodology, specifically an excess earnings approach, which estimates value based upon the discounted value of future cash flows expected to be generated by the in-process projects, net of all contributory asset returns. The approach includes consideration of the importance of each project to the overall development plan, estimating costs to develop the purchased IPR&D into commercially viable products.
The discount rates applied to individual projects were selected after consideration of the overall estimated weighted average cost of capital and the discount rates applied to the valuation of the other assets acquired. Such weighted average cost of capital was adjusted to reflect the difficulties and uncertainties in completing each project and thereby achieving technological feasibility, the percentage of completion of each project, anticipated market acceptance and penetration, market growth rates and risks related to the impact of potential changes in future target markets. In developing the estimated fair values, the Company used a discount rate of 20.8 percent.
Other Acquisition Related Intangible Assets
The Company determined the fair value of other acquisition related intangible assets using income approaches and based the rates on the most current financial forecast available as of March 18, 2008. The discount rates used to discount net cash flows to their present values was 17.8 percent. The Company determined these discount rates after consideration of the Company’s estimated weighted average cost of capital. The Company recorded the excess of the purchase price over the net tangible and identifiable intangible assets as goodwill.
The estimated useful lives for the acquired intangible assets were based upon Saifun’s historical experience with technology life cycles, product roadmaps and Spansion’s intended future use of the intangible assets. The
103
Table of Contents
Spansion Inc.
Notes to Consolidated Financial Statements—(Continued)
Company amortized acquisition related intangible assets using the straight-line method over their then estimated useful lives.
Existing technology represents Saifun’s core technology, Nitride-Read-Only-Memory (NROM) intellectual property. NROM technology doubles the storage of a Flash memory cell by creating two distinct and independent charges in a single cell. This technology asset was estimated to have a useful life of six years. As a result of the impairment review during the fourth quarter of 2008, the Company recorded an impairment of $35.6 million, reducing the carrying value of NROM intellectual property to $1.6 million. At December 27, 2009, net carrying value of this intellectual property was $1.3 million and which was fully impaired upon the adoption of fresh start accounting (See note 2 for details of fresh start accounting).
Customer relationships represent Saifun’s existing contractual relationships as of March 18, 2008, which were estimated to have an average useful life of seven years. As a result of the impairment review during the fourth quarter of 2008, the Company recorded an impairment of $16.0 million, reducing the carrying value of Saifun customer relationships to zero.
Trade names were estimated to have an average useful life of four years. As a result of the impairment review during the fourth quarter of 2008, the Company recorded an impairment of $1.1 million, reducing the carrying value of trade names to zero.
Non-competition agreements represent agreements with four key employees and were estimated to have a useful life of two years. As a result of the impairment review during the fourth quarter of 2008, the Company recorded an impairment of $0.8 million, reducing the carrying value of the non-competition agreements to zero.
In the fourth quarter of 2008, pursuant to its accounting policy, the Company performed its annual analysis to determine whether its goodwill was impaired. To perform step 1 of the analysis, the Company used a combination of the income approach and the guideline public company market approach, equally weighted. The income approach utilized the same forecast and other assumptions used to assess recoverability and measure impairment of its long-lived assets other than goodwill. The step 1 analysis indicated the fair value of its single reporting unit to be significantly below its carrying value and the step 2 analysis indicated the implied fair value of its goodwill was zero. As a result, the Company recognized an impairment charge on its remaining goodwill of $20.8 million, reducing its goodwill balance to zero.
Income Taxes
Deferred tax liabilities of $8.6 million were recorded when the acquisition occurred. At the end of fiscal 2008, the remaining deferred tax liabilities of $6.6 million were recorded as an income tax benefit because most of the acquisition related intangible assets were impaired.
9. Related Party Transactions
Spansion Japan
As discussed in Note 3, in the section entitled, “Basis of Presentation,” despite its 100 percent equity ownership interest in Spansion Japan, the Company has not included Spansion Japan in its consolidated financial statements since March 3, 2009 as it no longer controlled Spansion Japan due to the appointment of a trustee in the Spansion Japan Proceeding. Since that date, the Company has accounted for its interest in Spansion Japan as a cost basis investment and treated Spansion Japan as a related party for financial reporting purposes. Effective June 27, 2010, Spansion Japan’s POR was confirmed by the Tokyo District Court. The POR provided for
104
Table of Contents
Spansion Inc.
Notes to Consolidated Financial Statements—(Continued)
Spansion Japan to redeem shares held by its shareholders without consideration, cancel such shares and issue new shares to unsecured creditors. The redemption, cancellation and new issuance were completed effective September 28, 2010. Thereafter the Company had no equity ownership of Spansion Japan.
On February 2, 2010, the Company and Spansion Japan entered into a foundry agreement whereby the Company agreed to purchase from Spansion Japan: (i) a minimum of 10 billion yen (equivalent to $120.7 million at December 26, 2010) worth of wafers over six quarters beginning with the first quarter of 2010 and ending with the second quarter of 2011; and (ii) minimum sort services of $7.7 million for the first quarter of 2010 and $8.9 million for each quarter from the second quarter of 2010 to the second quarter of 2011, with both sort services and wafer production subject to normal and customary foundry performance conditions. This agreement replaced an earlier foundry agreement whereby Spansion Japan manufactured wafers for the Company based on a five-quarter rolling production forecast and in exchange, the Company reimbursed Spansion Japan for its manufacturing cost, plus a surcharge of 6 percent. The Company’s motion to reject the earlier foundry agreement was approved by the U.S. Bankruptcy Court on November 19, 2009.
On August 31, 2010, Spansion Japan sold its manufacturing facilities to a subsidiary of TI. At the same time the Company terminated its foundry agreement with Spansion Japan and entered into a new foundry agreement with TI whereby the Company agreed to purchase from TI: (i) a minimum of $235.5 million worth of wafers over eight quarters, beginning with the third quarter of 2010 and ending with the second quarter of 2012; and (ii) minimum sort services of $8.9 million for each quarter from the fourth quarter of 2010 to the second quarter of 2011 and $8.5 million each from the third quarter of 2011 through the second quarter of 2012, with both sort services and wafer production to be subject to normal and customary foundry performance conditions.
Spansion Japan continued in its historical role as the sole distributor of the Company’s products in Japan, whereby it purchased products from the Company and sold them to customers in Japan, primarily through a subsidiary of Fujitsu Limited, until May 24, 2010. On May 24, 2010, the Company acquired the distribution business from Spansion Japan and subsequently has been distributing its products in Japan through a wholly owned subsidiary, Nihon Spansion Limited. With the acquisition of Spansion Japan’s distribution business, all material conditions of the January 8, 2010 Settlement were fulfilled and the Company set off the receivable and payable balances due from/to Spansion Japan as of October 27, 2009 (the date when the Company and Spansion Japan mutually agreed to pricing terms through executed purchase orders). All transactions with Spansion Japan were thereafter settled on a regular basis on mutually agreed upon terms.
The following tables present the significant related party transactions between the Company and Spansion Japan for the years ended December 26, 2010 and December 27, 2009:
| Year ended December 26, 2010 | Year ended December 27, 2009 | |||||||||||||||
| Successor | Predecessor | Predecessor | ||||||||||||||
| Period from May 11, 2010 to December 26, 2010 |
Period from December 28, 2009 to May 10, 2010 |
Period from March 3, 2009 to December 27, 2009 |
||||||||||||||
| (in thousands) | ||||||||||||||||
| Sales to Spansion Japan |
$ | 5,240 | $ | 78,705 | $ | 298,958 | ||||||||||
| Wafer purchases from Spansion Japan |
30,039 | 80,160 | 257,404 | |||||||||||||
| Payment to Spansion Japan for services (R&D) |
143 | 2,686 | 15,933 | |||||||||||||
105
Table of Contents
Spansion Inc.
Notes to Consolidated Financial Statements—(Continued)
| Predecessor | ||||
| December 27, 2009 | ||||
| (in thousands) | ||||
| Trade accounts receivable from Spansion Japan |
$ | 366,602 | ||
| Trade accounts payable to Spansion Japan |
(331,151 | ) | ||
| Deferred income on shipments to Spansion Japan |
(12,029 | ) | ||
Fujitsu
Fujitsu Limited (Fujitsu) was a holder of greater than 10 percent of the Company’s Old Common Stock voting securities prior to its emergence from the Chapter 11 Cases on May 10, 2010. On emergence from the Chapter 11 Cases, the Company’s Old Common Stock issued prior to May 10, 2010 was cancelled and New Common Stock was issued in accordance with the Plan. As a result, Fujitsu no longer holds greater than 10 percent of the Company’s voting securities and has ceased to be a related party since that date.
The Company did not have significant transactions and account balances directly with Fujitsu following the deconsolidation of Spansion Japan, which was effective March 3, 2009 until Fujitsu ceased to be a related party on May 10, 2010. The following table presents the significant related party transactions between the Company and Fujitsu for the years ended December 27, 2009.
The Company entered into a five-year License Settlement Agreement with Fujitsu on September 11, 2008, which resulted in the payment to Fujitsu by the Company of quarterly royalties based on certain percentage thresholds of actual sales of the Company’s Flash memory products (minus sales by Fujitsu to Spansion Japan for wafers which are incorporated into Spansion’s Flash memory products and to be sold by Spansion Japan to Fujitsu under the existing Distribution Agreement), subject to a maximum amount of $10 million over the five-year term. These royalty payments were recognized in cost of sales in the Company’s statements of operations.
| Year Ended December 27, 2009 |
Year Ended December 28, 2008 |
|||||||
| (in thousands) | ||||||||
| Net sales to Fujitsu |
$ | 50,208 | $ | 651,230 | ||||
| Inventory and cost of sales: |
||||||||
| Royalties to Fujitsu |
— | 3,184 | ||||||
| Other purchases of goods and services from Fujitsu and rental expense to |
||||||||
| Fujitsu |
11,617 | 79,138 | ||||||
| Subcontract manufacturing and commercial die purchases from Fujitsu |
569 | 8,771 | ||||||
| Wafer purchases, processing and sort services from Fujitsu |
6,096 | 244,317 | ||||||
| Net gain recognized on sale of assets to Fujitsu on April 2, 2007 |
(3,075 | ) | (34,543 | ) | ||||
| Reimbursement on costs of employees seconded to Fujitsu |
(2,633 | ) | (29,057 | ) | ||||
| Equipment rental income from Fujitsu |
(186 | ) | (3,692 | ) | ||||
| Administrative services income from Fujitsu |
(68 | ) | (1,311 | ) | ||||
| $ | 12,320 | $ | 266,807 | |||||
| Service fees to Fujitsu: |
||||||||
| Cost of sales |
— | 28 | ||||||
| Research and development |
— | 10 | ||||||
| Sales, general and administrative |
110 | 610 | ||||||
| Service fees to Fujitsu |
$ | 110 $ | $ | 648 | ||||
106
Table of Contents
Spansion Inc.
Notes to Consolidated Financial Statements—(Continued)
10. Financial Instruments
Cash equivalent and short term investments held by the Company included investments in U.S. Treasury bills of approximately $130.0 million as of December 26, 2010 and auction rate securities of approximately $100.3 million as of December 27, 2009. Amortized cost of U.S Treasury bills approximated fair value. The fair value of auction rate securities were determined based on discounted cash flow methodology. See Note 16 Fair Value for further details.
Fair Value of Other Financial Instruments not carried at Fair Value
Substantially all of the Company’s long-term debt is traded in the market and the fair value in the table below is based on the quoted market price as of December 26, 2010 and December 27, 2009. The carrying amounts and estimated fair values of the Company’s debt instruments are as follows:
| December 26, 2010 | December 27, 2009 | |||||||||||||||
| Carrying Amount |
Estimated Fair Value |
Carrying Amount |
Estimated Fair Value |
|||||||||||||
| Debt traded in the market |
$ | 451,750 | $ | 454,582 | $ | 968,265 | $ | 982,098 | ||||||||
| Debt not traded in the market |
3,159 | 3,159 | 83,011 | 83,011 | ||||||||||||
| Total Debt Obligations |
$ | 454,909 | $ | 457,741 | $ | 1,051,276 | $ | 1,065,109 | ||||||||
The fair value of the Company’s long-term debt that is not traded in the market was estimated by considering the interest rates and the terms of the debt. The fair value of the Company’s accounts receivable and accounts payable approximates their carrying value.
Interest Rate Risk
The Company is currently exposed to the variability of future quarterly interest payments on its variable rate debt due to changes in the LIBOR interest rate above the floor rate of 1.75 percent. To mitigate this interest rate risk and also to comply with the requirement of hedging in the $450 million term loan facility, the Company has entered into interest rate swaps to manage the interest rate risk associated with its borrowings.
During the third quarter of fiscal 2010, the Company entered into a hedging arrangement with a financial institution to hedge the variability of interest payments attributable to fluctuations in the LIBOR benchmark interest rate relating to the interest payments under the Senior Secured Term Loan. The Company entered into a $250 million interest rate swap which effectively converted $250 million of the variable interest rate obligation to a fixed interest rate obligation and is accounted for as a cash flow hedge in accordance with ASC Topic 815, Derivatives and Hedging. Under terms of the swap agreements, the Company pays the independent swap counterparty a fixed rate of 2.42 percent and, in exchange, the swap counterparty pays the Company an interest rate equal to the floor rate of 2 percent or three-month LIBOR, whichever is higher. These swap agreements effectively fixed the interest rate at 7.92 percent through 2013 for $250 million on term loan facility.
For derivative instruments that are designated and qualify as a cash flow hedge, the effective portion of the gain or loss on the derivative is reported as a component of accumulated other comprehensive income / loss (AOCI), an equity account, and reclassified into earnings in the same period or periods during which the hedged transaction affects earnings. Gains and losses on the derivative representing hedge ineffectiveness are recognized in current earnings.
107
Table of Contents
Spansion Inc.
Notes to Consolidated Financial Statements—(Continued)
As of November 9, 2010, due to amendment of the Senior Secured Term Loan (see Note 12), the critical terms of the swap and the Senior Secured Term Loan was no longer matched; thus the hedge was rendered ineffective. As a result, the hedge has been de-designated as a cash flow hedge and the mark-to-market of the swap has been reported as a component of Interest expense for the fourth quarter of fiscal 2010. The company has recorded a loss of approximately $1.3 million in interest expenses related to the swap for the year ended December 26, 2010.
The location and fair value amounts of the Company’s derivative instruments reported in its Consolidated Balance Sheet as of December 26, 2010 and December 27, 2009 were as follows:
| Balance Sheet Location |
December 26, 2010 | December 27, 2009 | ||||||||
| (in thousands) | ||||||||||
| Interest Rate Swap |
Other Current Liabilities and Other Liabilities |
$ | 1,180 | $ | — | |||||
11. Warranties and Indemnities
The Company generally offers a one-year limited warranty for its Flash memory products. Changes in the Company’s liability for product warranty during the years ended December 26, 2010, December 27, 2009, and December 28, 2008 are as follows:
| Year Ended December 26, 2010 | ||||||||||||||||||||
| Successor | Predecessor | Predecessor | Predecessor | |||||||||||||||||
| Period from May 11, 2010 to December 26, 2010 |
Period from December 28, 2009 to May 10, 2010 |
Year Ended December 27, 2009 |
Year Ended December 28, 2008 (2) |
|||||||||||||||||
| (in thousands) | ||||||||||||||||||||
| Balance, beginning of period |
$ | 3,169 | $ | 3,841 | $ | 1,489 | $ | 1,305 | ||||||||||||
| Provision for warranties issued |
1,498 | 1,694 | 4,243 | 12,552 | ||||||||||||||||
| Settlements |
(1,207 | ) | (852 | ) | (881 | ) | (12,258 | ) | ||||||||||||
| Changes in liability for pre-existing warranties during the period |
(1,694 | ) | (1,514 | ) | (1,010 | ) | (110 | ) | ||||||||||||
| Balance, end of period |
$ | 1,766 | $ | 3,169 | $ | 3,841 | $ | 1,489 | ||||||||||||
In addition to product warranties, the Company, from time to time in its normal course of business, indemnifies other parties with whom it enters into contractual relationships, including customers, directors, lessors and parties to other transactions with the Company, with respect to certain matters. The Company agrees to hold the other party harmless against specified losses, such as those arising from a breach of representations or covenants, third-party infringement claims or other claims made against certain parties. It is not possible to determine the maximum potential amount of liability under these indemnification obligations due to the limited history of indemnification claims and the unique facts and circumstances that are likely to be involved in each particular claim and indemnification provision.
108
Table of Contents
Spansion Inc.
Notes to Consolidated Financial Statements—(Continued)
12. Debt and Capital Lease Obligations
The following table summarizes the Company’s debt and capital lease obligations at December 26, 2010 and December 27, 2009:
| Successor | Predecessor | |||||||||||
| December 26, 2010 |
December 27, 2009 |
|||||||||||
| (in thousands) | ||||||||||||
| Debt obligations: |
||||||||||||
| Senior Notes |
$ | — | $ | 233,440 | ||||||||
| Senior Unsecured Notes |
200,000 | — | ||||||||||
| Exchangeable Senior Subordinated Debentures |
— | 109,233 | ||||||||||
| Senior Secured Floating Rate Notes |
— | 625,593 | ||||||||||
| UBS Loan Secured by Auction Rate Securities |
— | 64,150 | ||||||||||
| Senior Secured Term Loan |
251,750 | — | ||||||||||
| Obligations under capital leases |
3,159 | 18,861 | ||||||||||
| Total debt and capital lease obligations |
454,909 | 1,051,277 | ||||||||||
| Less: amount subject to compromise |
— | 987,127 | ||||||||||
| Total debt and capital lease obligations not subject to compromise |
454,909 | 64,150 | ||||||||||
| Less: current portion |
13,689 | 64,150 | ||||||||||
| Long-term debt and capital lease obligations not subject to compromise |
$ | 441,220 | $ | — | ||||||||
Exit Financing
Pursuant to the Plan, the holders of allowed claims were offered the right to purchase a total of 12,974,496 shares of the New Common Stock upon emergence from the Chapter 11 Cases at a price of $8.43 per share (the Rights Offering). The number of shares available to each eligible claimant was based on each claimant’s proportionate allowed claim. On January 25, 2010, the Company entered into a Backstop Rights Purchase Agreement with Silver Lake Management Company Sumeru, LLC whereby they committed to purchase the balance of Rights Offering shares not otherwise subscribed for by the Rights Offering participants. The Company received net proceeds of approximately $104.9 million through the Rights Offering on February 9, 2010. In addition, the Company closed a $450 million five-year Senior Secured Term Loan Agreement. Upon the Company’s emergence on May 10, 2010, the proceeds from the Rights Offering and the Senior Secured Term Loan, together with other sources of cash available to the Company, were used to fully discharge the balance of the FRN claims of approximately $638 million.
Union Bank of Switzerland (UBS AG) Loan Secured by Auction Rate Securities
In June 2010, the Company repaid the remaining balance outstanding under the UBS AG loan from proceeds from a partial redemption of the Company’s ARS.
Senior Secured Term Loan
On February 9, 2010, Spansion LLC, the wholly owned operating subsidiary of the Company, borrowed $450 million under the Senior Secured Term Loan. In connection with the Senior Secured Term Loan, the Predecessor incurred financing points, fees to the arrangers and legal costs of approximately $11.1 million as interest expense. In addition, the Company paid the lenders approximately $10 million of financing fees upon the release of Senior Secured Term Loan funds from escrow.
109
Table of Contents
Spansion Inc.
Notes to Consolidated Financial Statements—(Continued)
On November 9, 2010, Spansion LLC amended its Senior Secured Term Loan Agreement, among other things, including allowing issuance of the $200 million Senior Unsecured Notes, reduction in interest rates (see below), removing the requirement of maintaining interest rate hedging arrangements and amending its financial covenants of (i) a minimum consolidated interest coverage ratio from 3.75 to 1.0 to 3.50 to 1.0; (ii) a maximum leverage ratio from 2.50 to 1.0 until September 25, 2011 and 2.0 to 1.0 thereafter to 3.00 to 1.0; and (iii) maximum permitted capital expenditures from $75 million in 2010, $100 million in 2011 and $125 million in 2012 and each fiscal year thereafter to $150 million during each fiscal year. Furthermore, any capital expenditure amount not expended in the fiscal year for which the Company is permitted may be carried over for expenditure in the succeeding fiscal year in an amount not to exceed $40 million in any fiscal year. The Company also obtained a waiver to a mandatory prepayment requirement that it use 50 percent of the net proceeds from the Stock Offering (defined below) to pay down the Senior Secured Term Loan.
As of December 26, 2010, the Company is in compliance with all of the financial covenants under the Senior Secured Term Loan.
Pursuant to the Senior Secured Term Loan Amendment on November 9, 2010, interest on the Senior Secured Term Loan accrues at a rate per annum, reset quarterly, equal to the prime lending rate or the Federal Funds rate plus 0.50 percent, whichever is higher but not less than 2.75 percent, plus 3.75 percent. Alternatively, the Company has the option to choose 1-month, 3-month, and 6-month LIBOR rate, or choose 9-month and 12-month LIBOR with the consent of all the lenders and the interest on the Senior Secured Term Loan accrues at a rate per annum equal to the LIBOR or 1.75 percent, whichever is higher, plus 4.75 percent. Interest is payable quarterly in arrears. As of December 26, 2010, the Senior Secured Term Loan carried interest at 6.5 percent.
The Senior Secured Term Loan is secured by the assets of the Company including, among other items, a first priority lien on property, plant and equipment and inventory, and a second priority lien on account receivables and cash. Based on certain agreed upon thresholds, the Senior Secured Term Loan will require net cash proceeds from asset sales or other dispositions of property, extraordinary cash receipts, and other future cash flows to be used to prepay the outstanding balance of the loan. Voluntary prepayments of borrowings will be permitted in whole or in part, in minimum principal amounts to be agreed upon, (i) at any time on or prior to November 9, 2011, provided if the Company makes any prepayment of the Senior Secured Term Loan in connection with any re-pricing transaction or effects any amendment resulting in a re-pricing transaction, a prepayment premium of 1 percent of the amount being repaid plus all accrued and unpaid interest plus breakage costs, if any, or a payment equal to 1 percent of the aggregate amount outstanding immediately prior to such amendment; and (ii) thereafter at any time without premium or penalty.
During the third quarter of fiscal 2010, we entered into a hedging arrangement with a financial institution to hedge the variability of interest payments attributable to fluctuations in the LIBOR benchmark interest rate relating to the interest payments under the Senior Secured Term Loan. We entered into a $250 million interest rate swap where we pay the independent swap counterparty a fixed rate of 2.42 percent and, in exchange, the swap counterparty pays us an interest rate equal to the floor rate of 2 percent or three-month LIBOR, whichever is higher. These swap agreements effectively fixed the interest rate at 7.92 percent through 2013 for $250 million term loan facility. As of November 9, 2010 due to amendment of the term loan (see above), the critical terms of the swap and the Senior Secured Term Loan were no longer matched and the hedge was rendered ineffective. As a result, the hedge has been de-designated as a cash flow hedge in accordance with ASC Topic 815, “Derivatives and Hedging,” and the mark-to-market of the swap has been reported as a component of Interest expense for the fourth quarter of fiscal 2010. See Note 10 Financial Instruments for more information.
110
Table of Contents
Spansion Inc.
Notes to Consolidated Financial Statements—(Continued)
Revolving Credit Facility
On May 10, 2010, the Company entered into the Revolving Credit Facility with Bank of America and other financial institutions. Availability under the Revolving Credit Facility provides up to $65 million to supplement its working capital. Available amounts for borrowing under the Revolving Credit Facility, net of reserves, are limited to 85 percent of eligible accounts receivable and 25 percent of ineligible receivables subject to a cap of $10 million. The Revolving Credit Facility is subject to a number of covenants including fixed charge ratio coverage of 1.00 to 1.00 when qualified cash and availability under the facility is below $60 million.
On November 9, 2010, the Company, Spansion LLC and certain of Spansion LLC’s subsidiaries amended the Loan and Security Agreement with the lenders. The amendment among other things, included allowing issuance of the $200 million Senior Unsecured Notes and increasing reporting trigger threshold from less than $60 million of availability plus qualified cash to $80 million and covenant trigger threshold from less than $40 million of availability and qualified cash to $60 million.
As of December 26, 2010, the Company has not made any draw downs against this facility and is in compliance with all of the financial covenants under the Revolving Credit Facility which was entered into as a pre-condition to obtaining the Senior Secured Term Loan.
Senior Unsecured Notes
On November 9, 2010, Spansion LLC completed an offering of $200 million aggregate principal amount of 7.875 percent Senior Unsecured Notes due 2017. The Senior Unsecured Notes were issued at face value, resulting in net proceeds of approximately $195.6 million after related offering expenses. The Notes are general unsecured senior obligations of Spansion LLC and are guaranteed by the Company and Spansion Technology LLC on a senior unsecured basis. Interest is payable on May 15 and November 15 of each year beginning May 15, 2011 until and including the maturity date of November 15, 2017.
Prior to November 15, 2013, Spansion LLC may redeem some or all of the Notes at a price equal to 100 percent of the principal amount, plus accrued and unpaid interest and a “make-whole” premium. Thereafter, Spansion LLC may redeem all or part of the Notes at any time at the redemption prices set forth in the Indenture plus accrued and unpaid interest, if any, to the date of redemption.
In addition, on or prior to November 15, 2013, Spansion LLC may redeem up to 35 percent of the Notes with the proceeds of certain sales of equity securities at 107.875 percent (100 percent of the principal amount plus a premium equal to the interest rate applicable to the Notes), plus accrued and unpaid interest, if any, to the date of redemption.
Upon a change of control (as defined in the Indenture), holders of the Notes may require Spansion LLC to repurchase all of their notes at a repurchase price equal to 101 percent of the principal amount of the Notes to be repurchased, plus accrued and unpaid interest, if any, to the date of redemption.
Certain events are considered “Events of Default,” which may result in the accelerated maturity of the Notes, including: (i) a default in any interest, principal or premium amount payment; (ii) a merger, consolidation or sale of all or substantially all of its property; (iii) a breach of covenants in the Notes or the Indenture; (iv) a default in certain debts; (v) if the Company incurs any judgment for the payment of money in an aggregate amount in excess of $25 million; or (vi) if a court enters certain orders or decrees under any bankruptcy law. Upon occurrence of one of these events, the trustee or certain holders may declare the principal of and accrued interest on all of the Notes to be immediately due and payable. If certain events of bankruptcy, insolvency or
111
Table of Contents
Spansion Inc.
Notes to Consolidated Financial Statements—(Continued)
reorganization with respect to the Company occur, all amounts on the Notes shall be due and payable immediately without any declaration or other act by the trustee or holders of the Notes.
Impact of Chapter 11 Cases
As discussed in Note 3, the accounting guidance for entities in Chapter 11 reorganization provides that interest expense should be reported only to the extent that it will be paid during the Chapter 11 Cases proceeding or that it is probable that it will be an allowed priority, secured or unsecured claim. On that basis, the Company ceased accruing interest as of the Petition Date (March 1, 2009) on its Senior Unsecured Notes and Exchangeable Senior Subordinated Debentures. In addition, accretion of the discounted carrying value of the Exchangeable Senior Subordinated Debentures ceased on March 1, 2009. The Company continued to accrue interest on the FRN through the Emergence Date and the UBS loan secured by ARS.
Impact of Emergence from Chapter 11 Cases
The Senior Unsecured Notes and Exchangeable Senior Subordinated Debentures are being settled by distribution from the 46,247,760 shares of the Company’s New Common Stock reserved to holders of allowed general, unsecured claims. On May 10, 2010, the unamortized portion of the capitalized financing costs related to these two debts was fully written off as a result of the Company’s Plan adjustments.
Obligations under Capital Leases
As of December 26, 2010 and December 27, 2009, the Company had aggregate outstanding capital lease obligations, net of imputed interest, of approximately $3.2 million and $18.9 million, respectively. The aggregate weighted average interest rate for the capital lease obligations was 7.5 percent as of December 26, 2010. Obligations under these lease agreements are collateralized by the assets leased and are payable through 2011. Leased assets consist principally of machinery and equipment.
As of December 26, 2010, the gross amount of assets recorded under capital leases and accumulated amortization thereon was approximately $4.1 million and $3.0 million, respectively. As of December 27, 2009, the gross amount of assets recorded under capital leases and accumulated amortization thereon was approximately $67.4 million and $63.5 million, respectively.
During the first and second quarter of 2009, the Company submitted various motions to the U.S. Bankruptcy Court seeking rejection of certain equipment leases with future principal and interest payments of approximately $54.5 million through 2011, all of which have been approved by the Court as of August 10, 2009. Accordingly, such amount was written off and recorded in reorganization items in the Predecessor.
112
Table of Contents
Spansion Inc.
Notes to Consolidated Financial Statements—(Continued)
Debt and Future Minimum Capital Lease Payments
For each of the next five years and beyond, the scheduled maturities of the Company’s debt and capital lease obligations outstanding as of December 26, 2010, are as follows:
| Other Debt | Capital Leases | |||||||
| (in thousands) | ||||||||
| Fiscal 2011 |
$ | 43,813 | $ | 3,238 | ||||
| Fiscal 2012 |
35,206 | — | ||||||
| Fiscal 2013 |
34,408 | — | ||||||
| Fiscal 2014 |
33,719 | — | ||||||
| Fiscal 2015 |
252,792 | — | ||||||
| Fiscal 2016 and beyond |
231,500 | — | ||||||
| 631,437 | 3,238 | |||||||
| Less amount representing interest |
(179,687 | ) | (79 | ) | ||||
| Total |
$ | 451,750 | $ | 3,159 | ||||
Predecessor
Accounting for Convertible Debt Instruments
As of May 10, 2010, the convertible debt instruments (issued in June 2006 and further described below) in the Predecessor were included in liabilities subject to compromise and were fully retired as part of Chapter 11 proceedings accounting. See Note 2 for further details of fresh start accounting.
The Company’s Exchangeable Senior Subordinated Debentures, issued in June 2006, are accounted for in accordance with the accounting guidance for convertible debt instruments that may be settled in cash upon conversion. This accounting guidance provides that issuers of such instruments should separately account for the liability and equity components of those instruments by allocating the proceeds at the date of issuance of the instrument between the liability component and the embedded conversion option (the equity component) by first determining the carrying amount of the liability. To calculate this amount, the Company determined the fair value of the liability excluding the embedded conversion option and by giving effect to other substantive features, such as put and call options, and then allocating the excess of the initial proceeds to the embedded conversion option. The excess of the principal amount of the liability component over its carrying amount is reported as a debt discount and is amortized as interest expense over the expected life of the instrument. As a result of applying this guidance, the Company recorded an equity component of $117.4 million, representing the fair value of the embedded conversion options, and a liability component of $89.6 million, representing the fair value of the debentures as of the date issuance. The net carrying amount of the liability component of the Exchangeable Senior Subordinated Debentures was included in liabilities subject to compromise at December 27, 2009.
The table below shows the components of the net carrying amount of the liability portion of the Exchangeable Senior Subordinated Debentures at December 27, 2009:
| (Predecessor) | ||||
| December 27, 2009 | ||||
| (in thousands) | ||||
| Principal amount of liability component |
$ | 207,000 | ||
| Unamortized discount |
(97,767 | ) | ||
| Net carrying amount |
$ | 109,233 | ||
113
Table of Contents
Spansion Inc.
Notes to Consolidated Financial Statements—(Continued)
The application of this guidance requires that recognition of non-cash interest expense for the accretion of the discounted carrying amount of the instrument. However, pursuant to the accounting guidance for entities in reorganization, interest expense recorded subsequent to March 1, 2009 only includes amounts expected to be actually paid during the Creditor Protection Proceedings, and as a result amortization of the discounted carrying value ceased.
The following represents the components of interest expense and effective interest rates relating to the Exchangeable Senior Subordinated Debentures:
| (Predecessor) | ||||||||
| Year Ended December 27, 2009 |
Year Ended December 28, 2008 |
|||||||
| (in thousands) | ||||||||
| Contractual interest expense |
$ | 806 | $ | 4,539 | ||||
| Amortization of discount |
1,475 | 7,903 | ||||||
| Total interest expense |
$ | 2,281 | $ | 12,442 | ||||
| Effective interest rate |
12.23 | % | 12.23 | % | ||||
13. Commitments
Certain facilities are leased under various operating leases expiring at various dates through the year 2013. Certain of these leases contain renewal options. Rental expense was approximately $5.3 million in the Successor for fiscal 2010, $2.4 million in the Predecessor for fiscal 2010, $11.9 million in fiscal 2009 and $23.8 million fiscal 2008.
The table below summarizes our future minimum lease payments under operating leases as of the end of fiscal 2010.
| Operating Leases | ||||
| (in thousands) | ||||
| Fiscal 2011 |
5,423 | |||
| Fiscal 2012 |
1,394 | |||
| Fiscal 2013 |
574 | |||
| Fiscal 2014 |
348 | |||
| Fiscal 2015 |
348 | |||
| 2016 & beyond |
114 | |||
| $ | 8,201 | |||
114
Table of Contents
Spansion Inc.
Notes to Consolidated Financial Statements—(Continued)
14. Interest Income and Other Income, Net
| Year Ended December 26, 2010 | Predecessor | Predecessor | ||||||||||||||||||||||||||
| Successor | Predecessor | |||||||||||||||||||||||||||
| Period from May 11, 2010 to December 26, 2010 |
Period from December 28, 2009 to May 10, 2010 |
Year Ended December 27, 2009 |
Year Ended December 28, 2008 |
|||||||||||||||||||||||||
| (in thousands) | ||||||||||||||||||||||||||||
| Other than temporary impairment on marketable securities, net of gain on put |
$ | — | $ | — | $ | — | $ | (3,270 | ) | |||||||||||||||||||
| Loss on early extinguishment of debt |
1,988 | — | — | — | ||||||||||||||||||||||||
| Exchange loss/ (gain) |
(483 | ) | 791 | — | — | |||||||||||||||||||||||
| Interest income |
(915 | ) | (746 | ) | 4,016 | 8,162 | ||||||||||||||||||||||
| Other income, net |
(765 | ) | 2,859 | 22 | 308 | |||||||||||||||||||||||
| $ | (175 | ) | $ | 2,904 | $ | 4,038 | $ | 5,200 | ||||||||||||||||||||
15. Income Taxes
The provision for income taxes consists of:
| Year Ended December 26, 2010 | Predecessor | Predecessor | ||||||||||||||||||
| Successor | Predecessor | |||||||||||||||||||
| Period from May 11, 2010 to December 26, 2010 |
Period from December 28, 2009 to May 10, 2010 |
Year Ended December 27, 2009 |
Year Ended December 28, 2008 |
|||||||||||||||||
| (in thousands) | ||||||||||||||||||||
| Current: |
||||||||||||||||||||
| U.S. federal |
$ | — | $ | — | $ | (118 | ) | $ | (350 | ) | ||||||||||
| U.S. state and local |
(43 | ) | 17 | 14 | 57 | |||||||||||||||
| Foreign national and local |
2,976 | 1,659 | 701 | 6,992 | ||||||||||||||||
| $ | 2,933 | $ | 1,676 | 597 | 6,699 | |||||||||||||||
| Deferred: |
||||||||||||||||||||
| U.S. federal |
— | — | — | — | ||||||||||||||||
| U.S. state and local |
— | — | — | — | ||||||||||||||||
| Foreign national and local |
(830 | ) | (36 | ) | — | 56,166 | ||||||||||||||
| (830 | ) | (36 | ) | — | 56,166 | |||||||||||||||
| Expense for income taxes |
$ | 2,103 | $ | 1,640 | $ | 597 | $ | 62,865 | ||||||||||||
| Pre-tax profit (loss) consists of: |
| |||||||||||||||||||
| Year Ended December 26, 2010 | Predecessor | Predecessor | ||||||||||||||||||
| Successor | Predecessor | |||||||||||||||||||
| Period from May 11, 2010 to December 26, 2010 |
Period from December 28, 2009 to May 10, 2010 |
Year Ended December 27, 2009 |
Year Ended December 28, 2008 |
|||||||||||||||||
| (in thousands) | ||||||||||||||||||||
| Domestic operations |
$ | (110.2 | ) | $ | 454.5 | $ | (518.0 | ) | $ | (1,244.9 | ) | |||||||||
| Foreign operations |
$ | 15.6 | $ | (89.2 | ) | $ | 4.5 | $ | (1,127.2 | ) | ||||||||||
| Totals |
$ | (94.6 | ) | $ | 365.3 | $ | (513.5 | ) | $ | (2,372.1 | ) | |||||||||
115
Table of Contents
Spansion Inc.
Notes to Consolidated Financial Statements—(Continued)
Deferred income taxes reflect the net tax effects of tax carryovers and temporary differences between the carrying amounts of assets and liabilities for financial reporting and the balances for income tax purposes. Significant components of the Company’s deferred tax assets and liabilities as of December 26, 2010 and December 27, 2009 are as follows:
| Successor | Predecessor | |||||||||||
| December 26, 2010 |
December 27, 2009 |
|||||||||||
| (in thousands) | ||||||||||||
| Deferred tax assets: |
||||||||||||
| Net operating loss carryovers |
$ | 280,401 | $ | 411,811 | ||||||||
| Deferred distributor income |
11,654 | 34,296 | ||||||||||
| Inventory valuation |
26,412 | 43,225 | ||||||||||
| Accrued expenses not currently deductible |
17,120 | 1,936 | ||||||||||
| Accrued expenses not currently deductible—litigation |
15,322 | — | ||||||||||
| Property, plant and equipment |
35,055 | 258,733 | ||||||||||
| Federal and state tax credit carryovers |
10,220 | 19,021 | ||||||||||
| Stock-based compensation |
2,629 | 4,392 | ||||||||||
| Unrealized loss on investment |
4,468 | 105,115 | ||||||||||
| Unrealized loss on balance sheet translation |
5,183 | — | ||||||||||
| Research & Development |
909 | — | ||||||||||
| Goodwill amortization |
927 | — | ||||||||||
| Other |
93 | 2,696 | ||||||||||
| Total deferred tax assets |
410,393 | 881,225 | ||||||||||
| Less: valuation allowance |
(304,749 | ) | (761,786 | ) | ||||||||
| 105,644 | 119,439 | |||||||||||
| Deferred tax liabilities: |
||||||||||||
| Inventory valuation |
(4,048 | ) | (3,623 | ) | ||||||||
| Inventory (fair value accounting) |
(17,567 | ) | — | |||||||||
| Intangibles Basis Diff (Fair Value Accounting) |
(2,652 | ) | — | |||||||||
| Customer Relationships (Fair Value Accounting) |
(27,489 | ) | — | |||||||||
| Developed Technology (Fair Value Accounting |
(21,308 | ) | — | |||||||||
| In Process R&D (Fair Value Accounting) |
(15,322 | ) | — | |||||||||
| Property, plant and equipment |
(1,237 | ) | (95,127 | ) | ||||||||
| Unrealized gain on investments—Japan & Suzhou |
— | (16,755 | ) | |||||||||
| Capitalized interest |
— | (2,122 | ) | |||||||||
| Unrealized gain on investments |
— | (1,801 | ) | |||||||||
| Unrealized gain on balance sheet translation |
(50 | ) | (11 | ) | ||||||||
| Other |
(41 | ) | — | |||||||||
| Total deferred tax liabilities |
(89,714 | ) | (119,439 | ) | ||||||||
| Net deferred tax assets |
$ | 15,930 | $ | — | ||||||||
For the period ending December 26, 2010, the net valuation allowance increased by $3.4 million over that of the period ending May 10, 2010 primarily due to losses and tax credits of $1.1 million generated in the U.S. and an increase of $2.3 million in the valuation allowance associated with deferred tax assets of foreign entities. For the period ending May 10, 2010 the net valuation allowance decreased by $460.5 million over that of the end of 2009 primarily due to a decrease of $423.1 million in the valuation allowance associated with losses and tax
116
Table of Contents
Spansion Inc.
Notes to Consolidated Financial Statements—(Continued)
credits in the U.S. and a decrease of $37.4 million in the valuation allowance associated with various tax assets of foreign entities.
As of December 26, 2010, the Company had U.S. federal and state net operating loss carry forwards of approximately $870.0 million and $214.9 million, respectively. Approximately $533.6 million of the federal net operating loss carry forwards are subject to an annual limitation of $27.2 million. These net operating losses, if not utilized, expire from 2018 to 2030. The Company also had U.S. federal and state tax credit carryovers of $17.2 million which expire from 2020 to 2030. Included in this amount are California state tax credits of $15.1 million which can be carried forward indefinitely.
If the Company were to undergo an “ownership change” for purposes of Section 382 of the Internal Revenue Code of 1986, as amended, such as an offering of its common stock, its ability to utilize its unlimited federal net operating loss carry forwards of approximately $336.4 million as of December 26, 2010 may be limited under certain provisions of the Internal Revenue Code. As a result, the Company may incur greater tax liabilities than it would in the absence of such a limitation and any incurred liabilities could materially adversely affect it.
The table below displays the reconciliation between statutory federal income taxes and the total provision (benefit) for income taxes.
| Tax | Rate | |||||||
| (in thousands, except for percentages) |
||||||||
| Period from May 11, 2010 to December 26, 2010 |
||||||||
| Statutory federal income tax expense |
$ | (33,107 | ) | 35 | % | |||
| State and federal taxes |
(43 | ) | 0.0 | % | ||||
| Foreign income at other than U.S. rates |
(3,307 | ) | 3.5 | % | ||||
| Valuation allowance |
38,560 | (40.8 | %) | |||||
| Provision for income taxes |
$ | 2,103 | (2.2 | %) | ||||
| Period from December 28, 2009 to May 10, 2010 |
||||||||
| Statutory federal income tax expense |
$ | 127,842 | 35.0 | % | ||||
| State and federal taxes |
17 | 0.0 | % | |||||
| Foreign income at other than U.S. rates |
32,841 | 9.0 | % | |||||
| Cancellation of debt income exclusion |
(151,916 | ) | (41.6 | %) | ||||
| Valuation allowance |
(7,144 | ) | (2.0 | %) | ||||
| Provision for income taxes |
$ | 1,640 | 0.4 | % | ||||
| Year ended December 27, 2009 |
||||||||
| Statutory federal income tax expense |
$ | (179,712 | ) | 35.0 | % | |||
| State and federal taxes |
(104 | ) | 0.0 | % | ||||
| Foreign income at other than U.S. rates |
(879 | ) | 0.2 | % | ||||
| Valuation allowance |
181,292 | (35.3 | %) | |||||
| Provision for income taxes |
$ | 597 | (0.1 | %) | ||||
| Year ended December 28, 2008 |
||||||||
| Statutory federal income tax expense |
$ | (827,559 | ) | 35.0 | % | |||
| State taxes |
(292 | ) | 0.1 | % | ||||
| Foreign income at other than U.S. rates |
(8,879 | ) | 0.4 | % | ||||
| Valuation allowance |
899,595 | (38.1 | %) | |||||
| Expense for income taxes |
$ | 62,865 | (2.7 | %) | ||||
117
Table of Contents
Spansion Inc.
Notes to Consolidated Financial Statements—(Continued)
The Company’s operations in China and Malaysia operated under tax holidays for fiscal years 2009 and 2008. The net impact of these tax holidays was to decrease the company’s net loss by approximately $3.3 million in fiscal year 2009 (less than $0.02 per share diluted), and $7.3 million in fiscal year 2008 (less than $0.05 per share diluted).
The Company has made no provision for U.S. income taxes on approximately $74.4 million of cumulative undistributed earnings of certain foreign subsidiaries at December 26, 2010 because it is the Company’s intention to reinvest such earnings permanently. The determination of the amount of unrecognized deferred tax liability related to these earnings is not practicable.
A reconciliation of the beginning and ending amount of unrecognized tax benefits is as follows:
| (in thousands) | ||||
| Balance at December 30, 2007 |
$ | 2,574 | ||
| Additions based on tax positions related to the current year |
1,132 | |||
| Additions for tax positions of prior years |
19 | |||
| Reductions for tax positions of prior years |
(763 | ) | ||
| Settlements |
(149 | ) | ||
| Balance at December 28, 2008 |
$ | 2,813 | ||
| Additions based on tax positions related to the current year |
$ | 895 | ||
| Additions for tax positions of prior years |
344 | |||
| Reductions for tax positions of prior years |
(2 | ) | ||
| Settlements |
— | |||
| Balance at December 27, 2009 |
$ | 4,050 | ||
| Additions based on tax positions related to the current year |
52,071 | |||
| Additions for tax positions of prior years |
31 | |||
| Reductions for tax positions of prior years |
(2,537 | ) | ||
| Settlements |
— | |||
| Lapse of statue of limitations |
(31 | ) | ||
| Balance at December 26, 2010 |
$ | 53,584 | ||
The Company recognizes $53.6 million as the total amount of unrecognized tax benefits that, if recognized, would affect the effective tax rate. However, $42.9 million of the unrecognized tax benefits are currently offset against net operating loss carry forwards and tax credit carry forwards subject to a full valuation allowance.
The Company recognizes interest and penalties related to unrecognized tax benefits in income tax expenses and such amounts were $3.7 million in fiscal 2010.
The Company is subject to taxation in the United States and various states, such as California and Texas, and foreign jurisdictions such as Israel, Japan, Malaysia, and Thailand. The Company’s tax years 2006 through 2010 are subject to examination by the tax authorities. With few exceptions, the Company is not subject to U.S. federal, state, local or foreign examinations by tax authorities for years before 2006.
The Company does not believe that it is reasonably possible that the total amounts of unrecognized tax benefits will significantly increase or decrease within the next twelve months.
118
Table of Contents
Spansion Inc.
Notes to Consolidated Financial Statements—(Continued)
16. Fair Value
ASC 820 defines fair value, establishes a consistent framework for measuring fair value and expands disclosure requirements about fair value measurements. ASC 820 requires, among other things, the Company’s valuation techniques used to measure fair value to maximize the use of observable inputs and minimize the use of unobservable inputs. This guidance was applied to the valuation of assets and liabilities in connection with the Company’s fresh start accounting and as recorded by the Predecessor at May 10, 2010.
There are three general valuation techniques that may be used to measure fair value, as described below:
| (A) | Market approach—Uses prices and other relevant information generated by market transactions involving identical or comparable assets or liabilities; |
| (B) | Cost approach—Based on the amount that currently would be required to reproduce or replace the service capacity of an asset (reproduction cost or replacement cost); and |
| (C) | Income approach—Uses valuation techniques to convert future amounts to a single present amount based on current market expectations about the future amounts (includes present value techniques, option-pricing models, the excess earnings method, and the royalty savings method). |
| I. | Net present value method is an income approach where a stream of expected cash flows is discounted at an appropriate discount rate. |
| II. | The excess earnings method is a variation of the income approach where the value of a specific asset is isolated from its contributory assets. |
Fair value information for each major category of assets and liabilities measured on a nonrecurring basis as part of fresh start accounting during the period is included in Note 2. The Company remeasured its assets and liabilities at fair value on May 10, 2010 as required by ASC 852 using the guidance for measurement found in ASC 805. The gains and losses related to these fair value adjustments were recorded by the Successor as adjustments to accumulated deficit.
As of December 26, 2010, the fair value measurements of the Company’s financial assets consisted of the following and which are categorized in the table below based upon the fair value hierarchy:
| Successor | Predecessor | |||||||||||||||||||||||||||||||||||
| Level 1 | Level 2 | Level 3 | Total | Level 1 | Level 2 | Level 3 | Total | |||||||||||||||||||||||||||||
| December 26, 2010 | December 27, 2009 | |||||||||||||||||||||||||||||||||||
| (in thousands) | ||||||||||||||||||||||||||||||||||||
| Money market funds |
$ | — | $ | — | $ | — | $ | — | $ | 20 | $ | — | $ | — | $ | 20 | ||||||||||||||||||||
| Treasury Bills |
$ | 129,955 | — | — | $ | 129,955 | — | — | — | — | ||||||||||||||||||||||||||
| Auction rate securities |
— | — | — | — | — | — | 100,335 | 100,335 | ||||||||||||||||||||||||||||
| Put option |
— | — | — | — | — | — | 6,790 | 6,790 | ||||||||||||||||||||||||||||
| Total financial assets |
$ | 129,955 | $ | — | $ | — | $ | 129,955 | $ | 20 | $ | — | $ | 107,125 | $ | 107,145 | ||||||||||||||||||||
| Interest rate swaps |
$ | — | $ | 1,180 | $ | — | 1,180 | $ | — | $ | — | $ | — | $ | — | |||||||||||||||||||||
| Total financial liabilities |
$ | — | $ | 1,180 | $ | — | $ | 1,180 | $ | — | $ | — | $ | — | $ | — | ||||||||||||||||||||
The fair value of the treasury bills are based on quoted prices in active markets for identical terms. In determining the fair value of our interest rate swap, the Company uses the present value of expected cash flows based on market observable interest rate yield curves and interest rate volatility commensurate with the term of each instrument. Since the Company only uses observable inputs in the swap, it is considered a Level 2 valuation.
119
Table of Contents
Spansion Inc.
Notes to Consolidated Financial Statements—(Continued)
The tables below present reconciliations for the Company’s Level 3 financial assets measured at fair value on a recurring basis using significant unobservable inputs (Level 3) for the year ended December 26, 2010 and December 27, 2009, respectively.
| Year Ended December 26, 2010 | ||||||||||||||||||||||||||||
| Successor | Predecessor | Predecessor | ||||||||||||||||||||||||||
| Period from May 11, 2010 to December 26, 2010 |
Period from December 28, 2009 to May 10, 2010 |
Year Ended December 27, 2009 |
||||||||||||||||||||||||||
| Auction rate securities |
put option | Auction rate securities |
put option | Auction rate securities |
put option | |||||||||||||||||||||||
| (in thousands) | ||||||||||||||||||||||||||||
| Balance at beginning of period |
$ | 41,855 | $ | 2,845 | $ | 100,335 | $ | 6,790 | $ | 94,014 | $ | 27,465 | ||||||||||||||||
| Redemptions at par |
(44,700 | ) | — | (62,425 | ) | — | (14,775 | ) | — | |||||||||||||||||||
| Change in fair value |
2,845 | (2,845 | ) | 3,945 | (3,945 | ) | 21,096 | (20,675 | ) | |||||||||||||||||||
| Balance at end of period |
$ | — | $ | — | $ | 41,855 | $ | 2,845 | $ | 100,335 | $ | 6,790 | ||||||||||||||||
Auction Rate Securities and Put Option
At December 27, 2009, the Company held $100.3 million of ARS valued at fair value ($107.1 million at par). The ARS, for which the underlying assets are student loans, have credit ratings of AAA and Aaa. These ARS were classified within Level 3, given the failures in the auction markets subsequent to February 2008 and the lack of any correlation of these instruments to other observable market data. As a result, the Company’s valuation of these ARS required substantial judgment and estimation of factors that were not observable in the market due to the lack of trading in the securities.
In November 2008, the Company accepted an offer to participate in an auction rate securities settlement from UBS, its broker, providing the Company the right, but not the obligation, to sell to UBS up to 100 percent of its ARS at par. The Company’s right to sell the ARS to UBS commencing June 30, 2010 through July 2, 2012 represented a put option for a payment equal to the par value of the ARS. At December 27, 2009, there was insufficient observable ARS market information available to determine the fair value of the Company’s ARS investments. As a result, the Company determined the fair value of its ARS investments at December 27, 2009 using a discounted cash flow (DCF) methodology. Significant inputs used in the DCF models included the credit quality of the instruments, the percentage and the types of guarantees, the probability of the auction succeeding or the security being called prior to final maturity, and an illiquidity discount factor. The key assumptions used in the DCF analysis to determine the fair values as of December 27, 2009 were the discount factor to be applied and the period over which the cash flows would be expected to occur. The discount factor used was based on the three-month LIBOR (0.25 percent as of December 27, 2009) adjusted by 85 basis points (bps) to reflect the current market conditions for instruments with similar credit quality at the date of the valuation. In addition, the discount factor was incrementally adjusted for an illiquidity discount of 125 bps to reflect the lack of an active market. The Company applied this discount factor over the expected life of the estimated cash flows of its ARS with projected interest income of 1.36 percent per annum. The projected interest income is based on a trailing 12-month average 91-day U.S. Treasury Bill Rate at 0.16 percent as of December 27, 2009 plus 120 bps, which is the average annual yield of the Company’s ARS assuming auctions continue to fail.
The Company used a DCF model to estimate the fair value of its put option as of December 27, 2009. The valuation model is based on the following key assumptions:
| • | A discount rate based on the 6-month U.S. Treasury Bill Rate (0.17 percent as of December 27, 2009), adjusted by 50 bps to reflect the credit risk associated with the put option; and |
| • | An expected life of 6 months |
120
Table of Contents
Spansion Inc.
Notes to Consolidated Financial Statements—(Continued)
The fair value of the put option of $6.8 million at December 27, 2009 was reflected as a component of prepaid and other current assets and other assets as of that date. Changes in the fair values of the ARS and the put option were reflected as components of interest and other income (expense), net.
17. Restructuring Charges
During the period from December 28, 2009 to May 10, 2010 and during fiscal 2009, as part of its ongoing strategic effort to reduce cost and conserve cash, the Company eliminated regular and contract positions globally, through planned consolidations, attrition, and a reduction in regular, contract and temporary workers in manufacturing, engineering, management and administrative support functions. There were no restructuring charges incurred by the Company from May 11, 2010 to December 26, 2010.
Restructuring charges for the period from December 28, 2009 to May 10, 2010 and for the year ended December 27, 2009, were as follows:
| Predecessor | ||||||||
| Period from December 28, 2009 to May 10, 2010 |
Year Ended December 27, 2009 |
|||||||
| Employee severance pay and benefits |
$ | 1,397 | $ | 28,880 | ||||
| Professional fees |
300 | 4,999 | ||||||
| Relocation of property, plant and equipment |
156 | 3,705 | ||||||
| Utilities, deinstallation and tax expenses for Sub-micron Development Center (SDC) building |
1,404 | — | ||||||
| Others |
(142 | ) | 4,946 | |||||
| Cash settled restructuring charges |
3,115 | 42,530 | ||||||
| Depreciation and write-off fixed assets |
4,963 | 6,681 | ||||||
| Gain recognized on sale of Suzhou plant |
(5,224 | ) | (4,669 | ) | ||||
| Gain from sale of fixed assets |
(5,542 | ) | — | |||||
| Other |
(84 | ) | 2,310 | |||||
| Total restructuring charges (credits) |
$ | (2,772 | ) | $ | 46,852 | |||
The following table summarizes the restructuring activity for the period from December 28, 2009 to May 10, 2010 and for the year ended December 27, 2009, respectively:
| Predecessor | ||||||||
| Period from December 28, 2009 to May 10, 2010 |
Year Ended December 27, 2009 |
|||||||
| (in thousands) | ||||||||
| Accrued restructuring balance, beginning of period (Predecessor) |
$ | 11,954 | $ | 333 | ||||
| Additional accruals for cash settled restructuring charges |
3,115 | 42,530 | ||||||
| Adjustments |
(9,283 | ) | 292 | |||||
| Cash payments |
(2,996 | ) | (31,201 | ) | ||||
| Accrued restructuring balance, end of period (Predecessor) |
$ | 2,790 | $ | 11,954 | ||||
121
Table of Contents
Spansion Inc.
Notes to Consolidated Financial Statements—(Continued)
The accrued restructuring balance was included in accrued compensation and benefits in the Company’s consolidated balance sheet as of December 27, 2009. Substantially, all of the remaining accrued restructuring balance related to the Company’s restructuring activities is expected to be disbursed within the next twelve months.
18. Segment Reporting
The Company operates and measures its results in one reportable segment which primarily relates to the design, manufacture and development of Flash memory semiconductor products. See Note 1 for details of the Company’s business. The Company’s Chief Operating Decision Maker, the Chief Executive Officer, evaluates performance of the Company and makes decisions regarding allocation of resources based on total Company results.
The following table presents a summary of net sales by geographic areas for the periods presented:
| Year Ended December 26, 2010 | Predecessor | Predecessor | ||||||||||||||||||
| Successor | Predecessor | |||||||||||||||||||
| Period from May 11, 2010 to December 26, 2010 |
Period from December 28, 2009 to May 10, 2010 |
Year Ended December 27, 2009 |
Year Ended December 28, 2008 |
|||||||||||||||||
| (in thousands) | ||||||||||||||||||||
| Geographical sales(1): |
||||||||||||||||||||
| Net sales to end customers: |
||||||||||||||||||||
| United States of America |
77,243 | 37,715 | $ | 218,291 | $ | 307,039 | ||||||||||||||
| China |
264,125 | 140,014 | 374,827 | 669,231 | ||||||||||||||||
| Korea |
27,341 | 19,436 | 109,008 | 238,370 | ||||||||||||||||
| EMEA |
114,445 | 67,477 | 214,981 | 351,052 | ||||||||||||||||
| Others |
91,402 | 58,860 | 144,380 | 63,972 | ||||||||||||||||
| Net sales to related parties: |
||||||||||||||||||||
|
Japan(2) |
190,131 | 80,117 | 349,166 | 652,139 | ||||||||||||||||
| Total |
764,687 | 403,619 | $ | 1,410,653 | $ | 2,281,803 | ||||||||||||||
| (1) | Geographical sales are based on the customer’s bill-to location. |
| (2) | Net sales to Japan is comprised of net sales to Fujitsu of $50,208 during January and February 2009 and net sales to Spansion Japan of $304,204 from March through December 2009. During the second quarter of fiscal 2010, the Company a) purchased Spansion Japan’s distribution business and began distributing its products in Japan through its wholly owned subsidiary, Nihon Spansion Limited, and b) began selling its products directly to Fujitsu through Nihon Spansion Limited. |
None of the end customers accounted for more than 10 percent of the Company’s net sales in fiscal 2010 and in fiscal 2009, whereas one customer accounted for approximately 18 percent of the Company’s net sales in fiscal 2008.
122
Table of Contents
Spansion Inc.
Notes to Consolidated Financial Statements—(Continued)
Long-lived assets information is based on the physical location of the assets at the end of each fiscal year. The following table presents a summary of long-lived assets by geography:
| Successor | Predecessor | |||||||||||
| December 26, 2010 | December 27, 2009 | |||||||||||
| (in thousands) | ||||||||||||
| Geographical long-lived assets: |
||||||||||||
| Net property, plant and equipment |
||||||||||||
| United States |
$ | 198,114 | $ | 254,566 | ||||||||
| Japan |
1,800 | — | ||||||||||
| Other countries |
60,026 | 68,144 | ||||||||||
| Total |
$ | 259,940 | $ | 322,710 | ||||||||
19. Capital Structure
Successor
Upon emergence, the total number of shares of capital stock that the Company is authorized to issue under its Amended and Restated Certificate of Incorporation is 200,000,001 shares, consisting of: (i) 150,000,000 shares of Class A Common Stock, par value $0.001 per share; (ii) one share of Class B Common Stock, par value $0.001 per share; and (iii) 50,000,000 shares of Preferred Stock, par value $0.001 per share, issuable in one or more series. As of December 26, 2010, there are 61,741,598 shares of Class A Common Stock and one share of Class B Common Stock issued and outstanding.
Common Stock
Except as described below or as required by law, the holders of the Company’s common stock are entitled to one vote per share on all matters to be voted on by stockholders and shall vote together as a single class. The holder of Class B Common Stock, which is Silver Lake Management Company Sumeru, LLC, shall be entitled to vote for up to two directors to the Board. The holders of Class A Common Stock shall be entitled to vote for all other directors to the Board. The outstanding share of Class B Common Stock shall convert into shares of Class A Common Stock on a share-for-share basis: (i) upon the written consent of the holder of the outstanding Class B Common Stock; (ii) in the event that any person other than SLS Spansion Holdings, Silver Lake Management Company Sumeru, LLC or their respective Affiliates and managed accounts becomes the holder of the share of Class B Common Stock; or (iii) after August 2010, Sumeru’s aggregate ownership interest in the Company ceases to be at least five percent.
Preferred Stock
The Company’s board of directors has the authority, without action by the stockholders, to designate and issue preferred stock in one or more series and to designate the rights, preferences and privileges of each series, such as dividend rates, dividend rights, liquidation preferences, voting rights and the number of shares constituting any series and designation of such series which may be greater than the rights of the common stock. It is not possible to state the actual effect of the issuance of any shares of preferred stock upon the rights of holders of the common stock until the board of directors determines the specific rights of the holders of such preferred stock. However, the effects might include, among other things:
| • | restricting dividends on the common stock; |
| • | diluting the voting power of the common stock; |
123
Table of Contents
Spansion Inc.
Notes to Consolidated Financial Statements—(Continued)
| • | impairing the liquidation rights of the common stock; or |
| • | delaying or preventing a change of control of Spansion without further action by the stockholders. |
20. Sale of Assembly, Mark and Pack Facility in Suzhou, China
On August 21, 2009, Spansion LLC, a wholly owned subsidiary of the Company entered into an Asset and Share Purchase Agreement (the Purchase Agreement) with Powertech Technology Inc., a company organized under the laws of the Republic of China (Taiwan) (PTI), pursuant to which Spansion LLC sold its assembly, mark, test and pack facility located in Suzhou, China (the Suzhou Facility) and other related assets owned by Spansion LLC. Pursuant to the Purchase Agreement, Spansion LLC sold (i) all of the issued and outstanding ordinary shares (the Shares) of its wholly owned subsidiary, Spansion Holdings (Singapore) Pte. Ltd., a company organized under the laws of the Republic of Singapore (Singapore Subsidiary), which in turn owns all the registered capital of Spansion (China) Limited, a wholly foreign-owned enterprise organized under the laws of the People’s Republic of China and the entity that owns the Suzhou Facility ( Suzhou Subsidiary), and (ii) certain assembly, mark and pack equipment and tooling equipment and other assets related to the Suzhou Facility that is owned directly by Spansion LLC (together, the Purchased Assets). On September 4, 2009, the U.S. Bankruptcy Court approved the sale of the purchased assets and the sale was closed on September 8, 2009 (the Closing Date).
In consideration for the Purchased Assets, PTI paid Spansion LLC cash in the amount of $34.2 million (paid in three installments over a six month period following the closing date) and paid an additional $6.0 million which was placed into an escrow account for a one-year period. At the expiration of the one-year escrow period, cash remaining in the escrow account not previously distributed, or reserved for distribution, to PTI pursuant to the terms of the Purchase Agreement will be delivered to Spansion LLC. As of December 26, 2010, cash remaining in the escrow account amounted to $1.5 million. In connection with the sale of the Purchased Assets, Spansion LLC and PTI entered into a Supply Agreement, effective the Closing Date, pursuant to which PTI will use the Suzhou Facility to perform assembly, mark, pack, and test services for Spansion products for a term of twelve months, which was extended up to an additional three months up to December 26, 2010.
21. Legal Proceedings
Tessera District Court Action
On October 7, 2005, Tessera, Inc. filed a complaint, Civil Action No. 05-04063, for patent infringement against Spansion LLC in the United States District Court for the Northern District of California under the patent laws of the United States of America, 35 U.S.C. section 1, et seq., including 35 U.S.C. section 271. The complaint alleges that Spansion LLC’s Ball Grid Array (BGA) and multichip packages infringe the following Tessera patents: United States Patent No. 5,679,977, United States Patent No. 5,852,326, United States Patent No. 6,433,419 and United States Patent No. 6,465,893. On December 16, 2005, Tessera filed a First Amended Complaint naming Spansion Inc. and Spansion Technology Inc., our wholly owned subsidiary, as defendants. On January 31, 2006, Tessera filed a Second Amended Complaint adding Advanced Semiconductor Engineering, Inc., Chipmos Technologies, Inc., Chipmos U.S.A., Inc., Silicon Precision Industries Co., Ltd., Siliconware USA, Inc., ST Microelectronics N.V., ST Microelectronics, Inc., Stats Chippac Ltd., Stats Chippac, Inc., and Stats 34 Chippac (BVI) Limited.
The Second Amended Complaint alleges that Spansion LLC’s BGA and multichip packages infringe the four Tessera patents identified above. The Second Amended Complaint further alleges that each of the newly named defendants is in breach of a Tessera license agreement and is infringing on a fifth Tessera patent, United States Patent No. 6,133,627. The Second Amended Complaint seeks unspecified damages and injunctive relief, a trebling of damages for alleged willful conduct and attorney’s fees (the “Tessera District Court Action”). On
124
Table of Contents
Spansion Inc.
Notes to Consolidated Financial Statements—(Continued)
February 9, 2006, Spansion filed an answer to the Second Amended Complaint and asserted counterclaims against Tessera. On April 18, 2006, the U.S. District Court issued a Case Management Order that set a trial date of January 28, 2008. On March 13, 2007, the U.S. District Court issued an order vacating the trial date. On April 12, 2007, the U.S. District Court issued an order referring case management scheduling issues to a Special Master, and directing that the court will appoint an expert in the case to testify on the ultimate merits of the technical issues relating to infringement and patent validity. On April 26, 2007, we, along with other defendants, filed a motion to stay the Tessera District Court action pending resolution of the proceeding before the International Trade Commission described below (the “ITC Action”). On May 24, 2007, the U.S. District Court issued an order staying the Tessera District Court action until final resolution of the ITC action.
On January 29, 2010, a claim estimation hearing was conducted in the U.S. Bankruptcy Court, and on February 9, 2010, the U.S. Bankruptcy Court issued a ruling estimating the potential damages in this case for post-petition infringement by Spansion to be approximately $4.2 million. The U.S. Bankruptcy Court as a result of a stipulation of the parties also set an estimated reserve of $130M for the pre-petition amount of Tessera’s claim.
The Company believes that the reasonably possible likelihood of potential loss or range of loss above the amounts estimated by the U.S. Bankruptcy Court is not material to the financial statements of the Company as a whole.
Tessera ITC Action
On May 20, 2009, the ITC issued a Final Determination reversing the Initial Determination by finding that there was a violation of 19 U.S.C. § 1337 by Spansion Inc. and Spansion LLC, Qualcomm, Inc., ATI Technologies, Motorola, Inc. STMicroelectronics N.V. and Freescale Semiconductor, Inc., and determined that the appropriate form of relief is (1) a limited exclusion order under 19 U.S.C. § 1337(d)(1) prohibiting the unlicensed entry of semiconductor chips with minimized chip package size and products incorporating these chips that infringe one or more of claims 1, 2, 6, 12, 16-19, 21, 24-26, and 29 of the ‘326 patent and claims 1-11, 14, 15,19, and 22-24 of the ‘419 patent, and are manufactured abroad by or on behalf of, or imported by or on behalf of, Spansion, Qualcomm, ATI, Motorola, STMicroelectronics N.V. and Freescale; and (2) cease and desist orders directed to Motorola, Qualcomm, Freescale and Spansion. The cease and desist order directed to Spansion prohibits importing, selling, marketing, advertising, distributing, offering for sale, transferring (except for exportation) and soliciting U.S. agents or distributors for certain semiconductor chips that are covered by the patents asserted in the action. On June 2, 2009, Spansion and the other respondents to the investigation jointly filed with the ITC a motion to stay the effect of the ITC decision pending appeal to the U.S. Court of Appeals for the Federal Circuit (the “Federal Circuit”). On July 17, 2009, the ITC denied the motion. On July 20, 2009, Spansion appealed the ITC decision to the Federal Circuit and filed an emergency motion for stay pending appeal and immediate temporary stay. The Federal Circuit denied the stay motions on September 8, 2009. The principal brief in the Federal Circuit appeal was filed on October 30, 2009. On September 24, 2010, the Asserted Patents expired, thereby terminating the exclusion order. Consolidated appeals 2009-1461, -1462 and -1465 were also filed along with Spansion’s appeal number 2009-1460 by appellants Freescale Semiconductor, Inc., ATI Technologies, ULC, STMicroelectronics N.V. and Qualcomm Incorporated. Oral arguments were heard in June 2010. On December 21, 2010, the Federal Circuit affirmed the Commission opinion.
Fast Memory Erase LLC v. Spansion Inc., et al.
The case was stayed against Spansion as a result of the Chapter 11 Cases until May 18, 2009. The U.S. Bankruptcy Court preliminarily lifted the stay and set June 23, 2009 as the date for a final determination on the stay. The parties subsequently agreed to lift the stay so that the U.S. District Court could proceed with a
125
Table of Contents
Spansion Inc.
Notes to Consolidated Financial Statements—(Continued)
Markman hearing to determine the meaning of certain claim terms, which was held on September 16, 2009. No ruling has yet been issued as a result of the Markman hearing.
The Company believes that the reasonably possible likelihood of potential loss or range of loss in this case cannot be estimated at this time.
LSI, Agere ITC Investigation
On February 3, 2009, the ITC issued an opinion affirming the ITC determination that the complainant is not precluded from re-litigating the validity of the patent at issue in the case. A hearing was held July 20, 2009 through July 27, 2009. The initial determination based upon that hearing was issued on September 21, 2009. The judge held that the patent asserted by LSI and Agree is invalid and that Spansion is not a proper party to the action. On April 19, 2010, the Commission issued its Opinion with a finding of no violation of Section 337 of the Tariff Act of 1930.
On May 14, 2010, LSI Corporation and Agere Systems Inc. filed an appeal to the United States Court of Appeals for the Federal Circuit. On November 15, 2010, the United States Court of Appeals for the Federal Circuit entered an order dismissing the appeal as moot and vacating the Commission’s opinion. On November 30, 2010, the Commission dismissed the investigation.
LSI, Agere v. Spansion, Inc., et al.
On April 18, 2008, LSI Corporation and Agere Systems, Inc. filed a complaint, Civil Action No. 2—08 CV -165, in the United States District Court for the Eastern District of Texas, against defendants United Microelectronics Corporation, Integrated Device Technology, Inc., AMIC Technology Corporation, Elpida Memory, Inc., Freescale Semiconductor, Inc., Grace Semiconductor Manufacturing Corporation, Microchip Technology, Inc., Micronas Semiconductor Holding, AG, National Semiconductor Corporation, Nanya Technology Corporation, NXP B.V., ON Semiconductor Corporation, Powerchip Semiconductor Corporation, ProMOS Technologies, Inc., Spansion, Inc., STMicroelectronics NV and Vanguard International Semiconductor Corporation (“Defendants”). The complaint alleges that certain Spansion Flash products, including Spansion’s 4 Mb CMOS 3.0 Volt-only Simultaneous Read/Write Flash Memory and 1 G MirrorBit NOR Flash products, infringe at least claim 1 of U.S. Patent No. 5,227, 335 (the “Asserted Patent”). The complaint seeks a declaration that Spansion infringes the Asserted Patent, permanent injunctive relief and unspecified reasonable royalty and other damages, a trebling of damages for alleged willful conduct and attorney’s fees. On June 13, 2008 Defendants filed an Unopposed Motion to stay the Eastern District of Texas action pending resolution of an International Trade Commission investigation (“ITC”) that is described above. On June 13, 2008, Judge T. John Ward issued an order staying the Eastern District of Texas action until a final determination of the ITC investigation described above. The stay has not yet been lifted in light of the dismissal of the ITC investigation described above.
The Company believes that the reasonably possible likelihood of potential loss or range of loss in this case is not material to the financial statements of the Company as a whole.
Samsung Litigation
Patent Litigation Settlement Agreement with Samsung Electronics Co., Ltd. (Samsung)
On April 7, 2009, the Company announced that it had settled its patent litigation lawsuits with Samsung. As part of the settlement, Samsung agreed to pay the Company $70 million and both parties agreed to exchange rights in their patent portfolios in the form of licenses and covenants subject to a settlement agreement. On
126
Table of Contents
Spansion Inc.
Notes to Consolidated Financial Statements—(Continued)
June 2, 2009, the U.S. Bankruptcy Court entered an order denying the Company’s motion seeking approval of the settlement agreement. By its terms, the settlement agreement has been terminated automatically as a result of the failure of the U.S. Bankruptcy Court to approve the settlement agreement. In addition, as a result of the U.S. Bankruptcy Court to approve the settlement agreement, the lawsuit by Samsung against Spansion Japan is no longer stayed, and the cases in the U.S. District Court and the ITC have resumed.
Samsung ITC Investigation
On March 12, 2009, this action was stayed pending U.S. Bankruptcy Court approval of a settlement agreement between Spansion and Samsung. On June 2, 2009, the U.S. Bankruptcy Court entered an order denying Spansion’s motion seeking approval of the settlement agreement. As a result of the failure of the U.S. Bankruptcy Court to approve the settlement agreement, Spansion’s case against Samsung in the ITC resumed. On June 30, 2009, the judge in the ITC investigation entered an order extending to January 18, 2011 the target date for completion of the investigation, setting the trial date for April 19, 2010, and issuing a new procedural schedule. A trial was held from May 3, 2010 through May 14, 2010. On October 22, 2010, the judge issued his Initial Determination concluding that there was no violation of 19 U.S.C. § 1337 with respect to either of the two remaining Asserted Patents. The investigation was terminated on December 23, 2010 with a decision by the ITC to not review the Initial Determination.
Spansion v. Samsung District Court Action
On March 31, 2009, this action was stayed pending U.S. Bankruptcy Court approval of a settlement agreement between Spansion and Samsung. On June 2, 2009, the U.S. Bankruptcy Court entered an order denying Spansion’s motion seeking approval of the settlement agreement. As a result of the failure of the U.S. Bankruptcy Court to approve the settlement agreement, Spansion’s case against Samsung in the U.S. District Court for District of Delaware has resumed. On August 3, 2009, Samsung amended its counterclaims to remove Patent Nos. 6,930,050 and 5,740,065, from the action. On August 13, 2009, Spansion responded to Samsung’s counterclaims as to the remaining patents asserted by Samsung (i.e., United States Patent Nos., 5,748,531, 5,567,987, and 5,173,442). The action is presently scheduled for trial on October 31, 2011 and discovery is underway. The U.S. Bankruptcy Court has set a reserve of $75 million for any pre-petition damages that Samsung may have for its counterclaims.
The Company believes that the reasonably possible likelihood of potential loss or range of loss above the amounts estimated by the U.S. Bankruptcy Court is not material to the financial statements of the Company as a whole.
Samsung v. Spansion Japan Ltd.
On January 28, 2009, Samsung filed two patent infringement actions in the Tokyo District Court in Japan against Spansion Japan Ltd. (“Spansion Japan”) alleging that certain flash memory chips manufactured or sold by Spansion Japan infringe certain Japanese patents allegedly owned by Samsung. The actions allege infringement of Japanese patents JP 3834189 and JP 3505324 respectively. The two actions have been consolidated for trial. The complaints seek both injunctive relief and damages. On March 31, 2009, this action by Samsung against Spansion Japan was stayed pending U.S. Bankruptcy Court approval in the U.S. and Japan of a settlement agreement between Spansion and Samsung.
On April 7, 2009, Spansion announced that it had settled its patent infringement litigation with Samsung including the proceedings referenced above. As part of the settlement, Samsung agreed to pay Spansion $70 million and both parties exchanged rights in their patent portfolios in the form of licenses and covenants subject
127
Table of Contents
Spansion Inc.
Notes to Consolidated Financial Statements—(Continued)
to a confidential settlement agreement. The settlement was subject to Bankruptcy Court approval in both the U.S. and Japan and, if approved, would end the patent disputes between the two companies. On May 18, 2009, the U.S. Bankruptcy Court held a hearing to review Spansion’s motion for approval of the settlement. On June 2, 2009, the U.S. Bankruptcy Court entered an order denying Spansion’s motion seeking approval of the settlement agreement. By its terms, the settlement agreement has been terminated automatically as a result of the failure of the U.S. Bankruptcy Court to approve the settlement agreement by June 2, 2009 (sixty days from when Spansion filed a motion seeking U.S. Bankruptcy Court approval). In addition, as a result of the failure of the U.S. Bankruptcy Court to approve settlement agreement, the action by Samsung against Spansion Japan is no longer stayed, and the cases in the U.S. District Court and the ITC have resumed. A technical hearing was held on December 18, 2009, and a subsequent hearing was held January 28, 2010. On August 31, 2010, the Tokyo High Court issued a decision in case H21-Wa-1986 that Spansion Japan did not infringe the Samsung patent at issue in that case. The Tokyo High Court subsequently expressed its view that the patent in case H21-Wa-39933 is invalid. On November 29, 2010 a hearing was held. In response to the court’s suggestion for Samsung to withdraw the claims, Samsung told the court that it had no intention to withdraw the claims. The court will now proceed to deliver the decisions on these two cases. A hearing was held on January 18, 2011 to terminate both cases. A decision of the Tokyo High Court is expected by the end of March 2011.
The Company believes that the reasonably possible likelihood of potential loss or range of loss in this case is not material to the financial statements of the Company as a whole.
Samsung v. Spansion ITC Investigation
On July 31, 2009, Samsung filed a patent infringement complaint with the ITC against Spansion Inc. and Spansion LLC (collectively, “Spansion”), Spansion Japan Limited, and the following downstream respondents: Alpine Electronics, Inc., Alpine Electronics of America, Inc., D-Link Corporation, D-Link Systems, inc., Slacker, Inc., Synology, Inc., Synology North America Corp., Shenzhen Egreat Co., Ltd., EGreat USA, and Appro International, Inc. The ITC commissioned its investigation of Samsung’s complaint on August 27, 2009. Subsequently, certain of Spansion’s creditors sought an order from the U.S. Bankruptcy Court seeking a stay of Samsung’s ITC action. On October 1, 2009, the U.S. Bankruptcy Court issued an order granting the motion to stay Samsung’s ITC action against Spansion. Both Samsung and the ITC have appealed this order. The investigation has been terminated with respect to Slacker, Synology, Shenzhen Egreat, Egreat, and Appro International based on consent order stipulations entered into by those respondents. On September 22, 2010 the investigation was terminated with respect to U.S. Patent No. 6,930,050 without prejudice on Samsung’s unopposed motion. A hearing was held December 6-14, 2010, and the Initial Determination of the judge is expected in February 2011.
Samsung v. Spansion International, Inc.
On July 31, 2009, Samsung Electronics Co., Ltd. commended an action in the Fourth Civil Division of the Federal Court in Dusseldorf, Germany against Spansion International Inc. and other third parties alleging patent infringement since March 2, 2009 of German patent DE 693 27 499 T2 (EP 0 591 009 B1). The action seeks damages in the amount of € 500,000 (approximately $655,750 as of December 26, 2010). An initial hearing to establish the schedule for the case was set for October 20, 2009. On September 4, 2009, Spansion filed a motion seeking to enforce the automatic stay as to this action, and on November 4, 2009, the U.S. Bankruptcy Court issued an order granting Spansion’s motion to stay this action. On August 27, 2010, Spansion filed a nullity action (Case no. 2 Ni 22/10 (EP)) in the Federal Patent Court in Munich, Germany seeking a decision that the patent asserted by Samsung is invalid. A hearing in the infringement action has been scheduled for October 25, 2011.
The Company believes that the reasonably possible likelihood of potential loss or range of loss in this case is not material to the financial statements of the Company as a whole.
128
Table of Contents
Spansion Inc.
Notes to Consolidated Financial Statements—(Continued)
Spansion LLC v. Samsung Electronics Co., Ltd., et al. (ITC)
On August 6, 2010, Spansion LLC filed a complaint (Investigation No. 337-TA-735) with the ITC seeking institution of an investigation by the ITC pursuant to Section 337 of the Tariff Act of 1930, as amended, with respect to violations of Section 337 based on the sale for importation into the United States, importation and/or sale within the United States after importation of Samsung Chips and downstream products containing those chips that infringe one or more claims of certain Spansion U.S. Patents. The proposed Respondents in the action are Samsung Electronics Co., Ltd., Samsung Electronics America, Inc., Samsung International, Inc., Samsung Semiconductor, Inc., Samsung Telecommunications America, LLC, Apple, Inc., BenQ Corp., BenQ America Corp., Qisda Corp., Kingston Technology Company, Inc., Kingston Technology (Shanghai) Co. Ltd., Kingston Technology Far East Co., Kingston Technology Far East (Malaysia) Sdn Bhd, MiTAC Digital Corporation (aka Magellan), MiTAC International Corporation, Nokia Corp., Nokia Inc., PNY Technologies, Inc., Research In Motion Ltd., Research In Motion Corporation, Sirius XM Radio Inc., Transcend Information Inc., Transcend Information, Inc. (US), and Transcend Information Inc. (Shanghai Factory).
The complaint alleges infringement of U.S. Patent Nos.: 7,018,922; 6,900,124; 6,459, 625; and 6,369,416, which are owned by Spansion. The Complaint seeks issuance of a permanent general exclusion order excluding from entry into the United States Samsung Chips and downstream products containing Samsung Chips as described and claimed in Spansion’s Patents, a permanent limited exclusion order excluding from entry into the United States Samsung Chips and all Respondents’ downstream products containing Samsung Chips as described and claimed in Spansion’s Patents, and a permanent cease and desist order prohibiting the importation, sale for importation, use, offering for sale, sale after importation, inventory for distribution, distribution, licensing, or otherwise transferring within the United States Samsung Chips and downstream products containing Samsung Chips.
On September 7, 2010, the ITC issued a Notice of Investigation advising us that it has instituted an investigation based upon the Complaint filed by Spansion. On October 7, 2010, the judge issued an order establishing the procedural schedule in this action. The order sets certain procedural due dates including June 20, 2011 as the trial date, September 12, 2011 as the due date for the Initial Determination, and January 12, 2012 as the Target Date for completion of the investigation.
Spansion LLC v. Samsung Electronics Co., Ltd., et al (N.D. Cal.)
On August 6, 2010, Spansion LLC filed a complaint in the U.S. District Court for the Northern District of California—San Jose Division (CV 10-03446 JCS) for patent infringement against Samsung Electronics Co., Ltd., Samsung Electronics America, Inc., Samsung Telecommunications America, LLC, and Samsung Austin Semiconductor, LLC (“Samsung Defendants”). The complaint alleges infringement of U.S. Patent Nos.: 7,018,922; 6,900,124; 6,459, 625; and 6,369,416, which are owned by Spansion (“Spansion Patents”).
The Complaint seeks entry of a judgment that:
| • | the Samsung Defendants have infringed the Spansion Patents; |
| • | the infringement of the Spansion Patents has been willful; |
| • | the Samsung Defendants be preliminarily and permanently enjoined from infringement of the Spansion Patents; |
| • | Spansion be awarded compensatory damages, together with prejudgment interest and costs; |
| • | Spansion be awarded treble damages for willful past infringement; |
| • | This case be adjudged an exceptional case under 35 U.S.C. § 285 in favor of Spansion and that Spansion be awarded its costs, attorneys’ fees, and all other expenses incurred in this action; and |
129
Table of Contents
Spansion Inc.
Notes to Consolidated Financial Statements—(Continued)
| • | Spansion be awarded such other relief as the Court deems just and proper. |
This action has been stayed pending the ITC Investigation No. 337-TA-735 referenced above.
Spansion LLC v. Samsung Electronics Co., Ltd, et al (E.D. Va.)
On August 6, 2010, Spansion LLC filed a complaint in the U.S. District Court for the Eastern District of Virginia—Alexandria Division (1-10 CV 881 CMH/JFA) for patent infringement against Samsung Electronics Co., Ltd., Samsung Electronics America, Inc., Samsung Telecommunications America, LLC, and Samsung Austin Semiconductor, LLC (“Samsung Defendants”). The complaint alleges infringement of U.S. Patent Nos.: 7,151,027; 6,359,307; and 6,232,630, which are owned by Spansion (“Spansion Patents”).
The Complaint seeks entry of a judgment that:
| • | the Samsung Defendants have infringed the Spansion Patents; |
| • | the infringement of the Spansion Patents has been willful; |
| • | the Samsung Defendants be preliminarily and permanently enjoined from infringement of the Spansion Patents; |
| • | Spansion be awarded compensatory damages, together with prejudgment interest and costs; |
| • | Spansion be awarded treble damages for willful past infringement; |
| • | This case be adjudged an exceptional case under 35 U.S.C. § 285 in favor of Spansion, and that Spansion be awarded its costs, attorneys’ fees, and all other expenses incurred in this action; and |
| • | Spansion be awarded such other relief as the Court deems just and proper. |
Samsung filed a motion to transfer this case to the Northern District of California. A hearing on this motion was held on October 22, 2010 at which the judge denied the motion. On October 28, 2010, Samsung filed an answer to the Complaint denying the allegations and alleging infringement by Spansion of three Samsung U.S. patent: 6,777,812; 6,602,733; and 5,508,564. On January 4, 2011, the court issued a scheduling order setting a final pretrial conference for April 21, 2011, with trial expected to be then set for a date four to eight weeks later.
The Company believes that the reasonably possible likelihood of potential loss or range of loss in this case cannot be estimated at this time.
Spansion LLC v. Samsung Electronics Co., Ltd, et al (W.D. Wi.)
On August 13, 2010, Spansion LLC filed a complaint in the U.S. District Court for the Western District of Wisconsin (Civil Action No. 3:10-cv-453) for patent infringement against Samsung Electronics Co., Ltd., Samsung Electronics America, Inc., Samsung Telecommunications America, LLC, and Samsung Austin Semiconductor, LLC (“Samsung Defendants”). The complaint alleges infringement of U.S. Patent Nos.: 5,793,677 (“Spansion Patent”).
The Complaint seeks entry of a judgment that:
| • | the Samsung Defendants have infringed the Spansion Patent; |
| • | the infringement of the Spansion Patent has been willful; |
| • | the Samsung Defendants be preliminarily and permanently enjoined from infringement of the Spansion Patent; |
130
Table of Contents
Spansion Inc.
Notes to Consolidated Financial Statements—(Continued)
| • | Spansion be awarded compensatory damages, together with prejudgment interest and costs; |
| • | Spansion be awarded treble damages for willful past infringement; |
| • | This case be adjudged an exceptional case under 35 U.S.C. § 285 in favor of Spansion, and that Spansion be awarded its costs, attorneys’ fees, and all other expenses incurred in this action; and |
| • | Spansion be awarded such other relief as the Court deems just and proper. |
On October 28, 2010, Samsung filed an answer to the Complaint denying the allegations and alleging infringement by Spansion of two Samsung U.S. patents: 6,734,065 and 6,828,229. In addition, on October 29, 2010, Samsung filed a motion to transfer this case to the Northern District of California. A hearing date on this motion has not yet been set. Discovery is ongoing. Trial has been set for February 27, 2012.
The Company believes that the reasonably possible likelihood of potential loss or range of loss in this case cannot be estimated at this time.
Spansion v. Samsung Electronics Co., Ltd, et al (W.D. Wi.)
On November 8, 2010, Spansion LLC filed a complaint in the U.S. District Court for the Western District of Wisconsin (Civil Action No. 3:10-cv-685) for patent infringement against Samsung Electronics Co., Ltd., Samsung Electronics America, Inc., Samsung Telecommunications America, LLC, and Samsung Austin Semiconductor, LLC (“Samsung Defendants”). The complaint alleges infringement of U.S. Patent Nos.: 5,715,194 (“Spansion Patent”).
The Complaint seeks entry of a judgment that:
| • | the Samsung Defendants have infringed the Spansion Patent; |
| • | the infringement of the Spansion Patent has been willful; |
| • | the Samsung Defendants be preliminarily and permanently enjoined from infringement of the Spansion Patent; |
| • | Spansion be awarded compensatory damages, together with prejudgment interest and costs; |
| • | Spansion be awarded treble damages for willful past infringement; |
| • | This case be adjudged an exceptional case under 35 U.S.C. § 285 in favor of Spansion, and that Spansion be awarded its costs, attorneys’ fees, and all other expenses incurred in this action; and |
| • | Spansion be awarded such other relief as the Court deems just and proper. |
On December 12, 2010, Samsung filed a motion to stay this action because of the Samsung ITC Investigation referenced above that involves the same patent. Samsung also filed a motion to transfer this case. These motions are pending. Trial has been set for March 19, 2012. On February 7, 2011 Samsung filed an answer to the Complaint denying the allegations and alleging infringement by Spansion of three Samsung U.S. patents: 6,383,882; 6,806,574; and 7,005,373. Samsung also alleged tortious interference with Samsung’s business relationships and malicious prosecution.
The Company believes that the reasonably possible likelihood of potential loss or range of loss in this case cannot be estimated at this time.
131
Table of Contents
Management’s Report on Internal Control Over Financial Reporting
Management is responsible for establishing and maintaining adequate internal control over financial reporting for the Company. Internal control over financial reporting is a process designed to provide reasonable assurance regarding the reliability of financial reporting and the preparation of financial statements for external purposes in accordance with generally accepted accounting principles. Internal control over financial reporting includes those policies and procedures that:
(1) Pertain to the maintenance of records that in reasonable detail accurately and fairly reflect the transactions and dispositions of the assets of the Company;
(2) Provide reasonable assurance that transactions are recorded as necessary to permit preparation of financial statements in accordance with U.S. generally accepted accounting principles, and that receipts and expenditures of the Company are being made only in accordance with authorizations of management and directors of the Company; and
(3) Provide reasonable assurance regarding prevention or timely detection of unauthorized acquisition, use or disposition of the Company’s assets that could have a material effect on the financial statements.
Because of its inherent limitations, internal control over financial reporting may not prevent or detect misstatements. Also, projections of any evaluation of effectiveness to future periods are subject to the risk that controls may become inadequate because of changes in conditions, or that the degree of compliance with the policies or procedures may deteriorate.
Management (with the participation of the principal executive officer and principal financial officer) conducted an evaluation of the effectiveness of company’s internal control over financial reporting based on the framework in Internal Control—Integrated Framework issued by the Committee of Sponsoring Organizations of the Treadway Commission. Based on this evaluation Management concluded that the Company’s internal control over financial reporting was effective as of December 26, 2010. PricewaterhouseCoopers LLP, an independent registered public accounting firm, has audited the effectiveness of Company’s internal control over financial reporting as of December 26, 2010, as stated in their report which appears on page 135 of this Annual Report on Form 10-K.
| /S/ JOHN H. KISPERT |
/S/ RANDY W. FURR | |
| John H. Kispert | Randy W. Furr | |
| President and Chief Executive Officer | Executive Vice President and Chief Financial Officer | |
| February 22, 2011 | February 22, 2011 |
132
Table of Contents
Report of Independent Registered Public Accounting Firm
To the Board of Directors and Stockholders of Spansion Inc.
In our opinion, the accompanying consolidated balance sheet and the related consolidated statements of operations, stockholders’ equity (deficit) and cash flows present fairly, in all material respects, the financial position of Spansion Inc. and its subsidiaries (Successor Company) at December 26, 2010, and the results of their operations and their cash flows for the period from May 11, 2010 through December 26, 2010 in conformity with accounting principles generally accepted in the United States of America.
Also in our opinion, the Company maintained, in all material respects, effective internal control over financial reporting as of December 26, 2010, based on criteria established in Internal Control—Integrated Framework issued by the Committee of Sponsoring Organizations of the Treadway Commission (COSO). The Company’s management is responsible for these financial statements, for maintaining effective internal control over financial reporting and for its assessment of the effectiveness of internal control over financial reporting, included in the accompanying Management’s Report on Internal Control Over Financial Reporting. Our responsibility is to express opinions on these financial statements and on the Company’s internal control over financial reporting based on our integrated audit. We conducted our audit in accordance with the standards of the Public Company Accounting Oversight Board (United States). Those standards require that we plan and perform the audit to obtain reasonable assurance about whether the financial statements are free of material misstatement and whether effective internal control over financial reporting was maintained in all material respects. Our audit of the financial statements included examining, on a test basis, evidence supporting the amounts and disclosures in the financial statements, assessing the accounting principles used and significant estimates made by management, and evaluating the overall financial statement presentation. Our audit of internal control over financial reporting included obtaining an understanding of internal control over financial reporting, assessing the risk that a material weakness exists, and testing and evaluating the design and operating effectiveness of internal control based on the assessed risk. Our audit also included performing such other procedures as we considered necessary in the circumstances. We believe that our audit provides a reasonable basis for our opinions.
As discussed in Note 2 to the consolidated financial statements, the Company filed a petition on March 1, 2009 with the United States Bankruptcy Court for the District of Delaware for reorganization under the provisions of Chapter 11 of the Bankruptcy Code. The United States Bankruptcy Court for the District of Delaware confirmed the Company’s plan of reorganization (the “Plan”) on April 16, 2010. Confirmation of the Plan resulted in the discharge of all claims against the Company that arose before May 10, 2010 and terminated all rights and interests of equity security holders as provided for in the Plan. The Plan was substantially consummated on May 10, 2010 and the Company emerged from bankruptcy. In connection with its emergence from bankruptcy, the Company adopted fresh start accounting on May 10, 2010.
A company’s internal control over financial reporting is a process designed to provide reasonable assurance regarding the reliability of financial reporting and the preparation of financial statements for external purposes in accordance with generally accepted accounting principles. A company’s internal control over financial reporting includes those policies and procedures that (i) pertain to the maintenance of records that, in reasonable detail, accurately and fairly reflect the transactions and dispositions of the assets of the company; (ii) provide reasonable assurance that transactions are recorded as necessary to permit preparation of financial statements in accordance with generally accepted accounting principles, and that receipts and expenditures of the company are being made only in accordance with authorizations of management and directors of the company; and (iii) provide reasonable assurance regarding prevention or timely detection of unauthorized acquisition, use, or disposition of the company’s assets that could have a material effect on the financial statements.
Because of its inherent limitations, internal control over financial reporting may not prevent or detect misstatements. Also, projections of any evaluation of effectiveness to future periods are subject to the risk that controls may become inadequate because of changes in conditions, or that the degree of compliance with the policies or procedures may deteriorate.
/s/ PricewaterhouseCoopers LLP
San Jose, California
February 22, 2011
133
Table of Contents
Report of Independent Registered Public Accounting Firm
To the Board of Directors and Stockholders of Spansion Inc.
In our opinion, the accompanying consolidated statements of operations, stockholder’s equity (deficit) and cash flows for the period from December 28, 2009 through May 10, 2010 present fairly, in all material respects, the results of operations and cash flows of Spansion Inc. and its subsidiaries (Predecessor Company) for the period from December 28, 2009 through May 10, 2010, in conformity with accounting principles generally accepted in the United States of America. These financial statements are the responsibility of the Company’s management. Our responsibility is to express an opinion on these financial statements based on our audit. We conducted our audit of these statements in accordance with the standards of the Public Company Accounting Oversight Board (United States). Those standards require that we plan and perform the audit to obtain reasonable assurance about whether the financial statements are free of material misstatement. An audit includes examining, on a test basis, evidence supporting the amounts and disclosures in the financial statements, assessing the accounting principles used and significant estimates made by management, and evaluating the overall financial statement presentation. We believe that our audit provides a reasonable basis for our opinion.
As discussed in Note 2 to the consolidated financial statements, the Company filed a petition on March 1, 2009 with the United States Bankruptcy Court for the district of Delaware for reorganization under the provisions of Chapter 11 of the Bankruptcy Code. The Company’s plan of reorganization was substantially consummated on May 10, 2010 and the Company emerged from bankruptcy. In connection with its emergence from bankruptcy, the Company adopted fresh start accounting.
/s/ PricewaterhouseCoopers LLP
San Jose, California
February 22, 2011
134
Table of Contents
Report of Ernst & Young LLP, Independent Registered Public Accounting Firm
The Board of Directors and Stockholders of Spansion Inc.
We have audited the accompanying consolidated balance sheet of Spansion Inc. as of December 27, 2009, and the related consolidated statements of operations, stockholders’ equity (deficit), and cash flows for each of the two fiscal years in the period ended December 27, 2009. These financial statements are the responsibility of the Company’s management. Our responsibility is to express an opinion on these financial statements based on our audits.
We conducted our audits in accordance with the standards of the Public Company Accounting Oversight Board (United States). Those standards require that we plan and perform the audit to obtain reasonable assurance about whether the financial statements are free of material misstatement. An audit includes examining, on a test basis, evidence supporting the amounts and disclosures in the financial statements. An audit also includes assessing the accounting principles used and significant estimates made by management, as well as evaluating the overall financial statement presentation. We believe that our audits provide a reasonable basis for our opinion.
In our opinion, the financial statements referred to above present fairly, in all material respects, the consolidated financial position of Spansion Inc. as of December 27, 2009, and the consolidated results of its operations and its cash flows for each of the two fiscal years in the period ended December 27, 2009, in conformity with U.S. generally accepted accounting principles.
/s/ Ernst & Young LLP
San Jose, California
February 12, 2011
135
Table of Contents
Supplementary Financial Data
(Unaudited)
Quarter Ended
(in thousands, except per share amounts)
| Quarter Ended June 27, 2010 |
||||||||||||||||||||||||||||||||||||||||
| Successor | Successor | Successor | Predecessor | Predecessor | Predecessor | Predecessor | Predecessor | Predecessor | ||||||||||||||||||||||||||||||||
| Quarter Ended December 26, 2010 |
Quarter Ended September 27, 2010 |
Period from May 11, 2010 to June 27, 2010 |
Period from March 29, 2010 to May 10, 2010, 2010 |
Quarter Ended March 28, 2010 |
Quarter Ended December 27, 2009 |
Quarter Ended September 27, 2009 |
Quarter Ended June 28, 2009 |
Quarter Ended March 29, 2009 |
||||||||||||||||||||||||||||||||
| Net sales |
$ | 327,723 | $ | 307,594 | $ | 124,569 | $ | 101,786 | $ | 223,128 | $ | 236,449 | $ | 245,246 | $ | 272,117 | $ | 307,675 | ||||||||||||||||||||||
| Net sales to related party |
— | — | 4,801 | 24,496 | 54,209 | 70,697 | 82,332 | 104,184 | 91,953 | |||||||||||||||||||||||||||||||
| Total net sales |
327,723 | 307,594 | 129,370 | 126,282 | 277,337 | 307,146 | 327,578 | 376,301 | 399,628 | |||||||||||||||||||||||||||||||
| Cost of sales |
259,130 | 276,838 | 111,413 | 85,697 | 189,120 | 205,504 | 234,952 | 280,266 | 383,035 | |||||||||||||||||||||||||||||||
| Gross profit (loss) |
68,593 | 30,756 | 17,957 | 40,585 | 88,217 | 101,642 | 92,626 | 96,035 | 16,593 | |||||||||||||||||||||||||||||||
| Research and development |
25,748 | 26,246 | 13,420 | 12,115 | 22,953 | 25,533 | 28,281 | 37,889 | 44,746 | |||||||||||||||||||||||||||||||
| Sales, general and administrative |
44,271 | 59,948 | 18,259 | 20,497 | 47,608 | 41,661 | 36,820 | 33,788 | 104,029 | |||||||||||||||||||||||||||||||
| Restructuring charges |
— | — | — | (2,785 | ) | 13 | 1,206 | 7,492 | 14,212 | 23,942 | ||||||||||||||||||||||||||||||
| Asset impairment charges |
— | — | — | — | — | 12,538 | — | — | — | |||||||||||||||||||||||||||||||
| Operating income (loss) before reorganization items |
(1,426 | ) | (55,438 | ) | (13,722 | ) | 10,758 | 17,643 | 20,704 | 20,033 | 10,146 | (156,124 | ) | |||||||||||||||||||||||||||
| Interest and other income (expense), net |
(1,567 | ) | 1,378 | 364 | (3,190 | ) | 286 | 1,110 | 532 | 1,916 | 480 | |||||||||||||||||||||||||||||
| Interest expense(1) |
(10,179 | ) | (9,124 | ) | (4,877 | ) | (11,237 | ) | (19,336 | ) | (8,099 | ) | (9,199 | ) | (9,212 | ) | (24,466 | ) | ||||||||||||||||||||||
| Gain on deconsolidation of subsidiary |
— | — | — | — | — | — | — | — | 30,100 | |||||||||||||||||||||||||||||||
| Gain (loss) before reorganization items and income taxes |
(13,172 | ) | (63,184 | ) | (18,235 | ) | (3,669 | ) | (1,407 | ) | 13,715 | 11,366 | 2,850 | (150,010 | ) | |||||||||||||||||||||||||
| Reorganization |
— | — | — | 364,876 | 5,464 | (9,736 | ) | (9,348 | ) | (9,842 | ) | (362,457 | ) | |||||||||||||||||||||||||||
| Income (loss) before income taxes |
(13,172 | ) | (63,184 | ) | (18,235 | ) | 361,207 | 4,057 | 3,979 | 2,018 | (6,992 | ) | (512,467 | ) | ||||||||||||||||||||||||||
| (Provision) benefit for income taxes |
(454 | ) | (1,670 | ) | 21 | (1,235 | ) | (405 | ) | 350 | (518 | ) | (261 | ) | (168 | ) | ||||||||||||||||||||||||
| Net income (loss) |
$ | (13,626 | ) | $ | (64,854 | ) | $ | (18,214 | ) | $ | 359,972 | $ | 3,652 | $ | 4,329 | $ | 1,500 | $ | (7,253 | ) | $ | (512,635 | ) | |||||||||||||||||
| Net income (loss) per share |
||||||||||||||||||||||||||||||||||||||||
| Basic |
$ | (0.22 | ) | $ | (1.09 | ) | $ | (0.31 | ) $ | 2.22 | $ | 0.02 | $ | 0.03 | $ | 0.01 | $ | (0.04 | ) | $ | (3.18 | ) | ||||||||||||||||||
| Diluted |
$ | (0.22 | ) | $ | (1.09 | ) | $ | (0.31 | ) $ | 2.21 | $ | 0.02 | $ | 0.02 | $ | 0.01 | $ | (0.04 | ) | $ | (3.18 | ) | ||||||||||||||||||
| Shares used in per share calculation |
||||||||||||||||||||||||||||||||||||||||
| Basic |
62,332 | 59,271 | 59,271 | 162,513 | 162,403 | 162,239 | 162,090 | 161,778 | 161,283 | |||||||||||||||||||||||||||||||
| Diluted |
62,332 | 59,271 | 59,271 | 162,518 | 174,471 | 174,139 | 173,925 | 161,778 | 161,283 | |||||||||||||||||||||||||||||||
| (1) | Contractual interest expense for the three months ended March 29, 2009, June 28, 2009, September 27, 2009, and December 27, 2009 was approximately $27.0 million, $21.0 million, $21.1 million and $19.6 million respectively. |
136
Table of Contents
| December
27, 2009(2) |
September
27, 2009(2) |
June
28, 2009(2) |
March
29, 2009(2) |
|||||||||||||
| Effect of Change | ||||||||||||||||
| Interest expense |
$ | — | $ | — | $ | — | $ | 1,439 | ||||||||
| Other income (expense), net |
— | — | — | 1,439 | ||||||||||||
| Loss before income taxes |
— | — | — | 1,439 | ||||||||||||
| Net loss |
— | — | — | 1,439 | ||||||||||||
| Net loss per share: |
||||||||||||||||
| Basic |
$ | — | $ | — | $ | — | $ | 0.01 | ||||||||
| Diluted |
— | — | — | 0.01 | ||||||||||||
| Shares used in per share calculation: |
||||||||||||||||
| Basic |
162,239 | 162,090 | 161,778 | 161,283 | ||||||||||||
| Diluted |
174,139 | 173,925 | 161,778 | 161,283 | ||||||||||||
| (2) | Pursuant to the accounting guidance for entities in reoragnization, interest expense recorded subsequent to March 1, 2009 only includes amounts expected to be actually paid during the Creditor Protection Proceedings, and as a result amortization of the discounted carrying value ceased. |
137
Table of Contents
| ITEM 9. | CHANGES IN AND DISAGREEMENTS WITH ACCOUNTANTS ON ACCOUNTING AND FINANCIAL DISCLOSURE |
None.
| ITEM 9A. | CONTROLS AND PROCEDURES |
Disclosure Controls and Procedures
We maintain disclosure controls and procedures that are designed with the objective of providing reasonable assurance that information required to be disclosed in our Exchange Act reports is recorded, processed, summarized and reported within the time periods specified in the SEC’s rules and forms, and that such information is accumulated and communicated to our management, including our Chief Executive Officer and Chief Financial Officer, as appropriate, to allow timely decisions regarding required disclosure. In designing and evaluating our disclosure controls and procedures, our management recognizes that any controls and procedures, no matter how well designed and operated, can provide only reasonable assurance of achieving the desired control objectives, and our management is required to apply its judgment in evaluating the cost-benefit relationship of possible controls and procedures.
Management, with the participation of our Chief Executive Officer and Chief Financial Officer, evaluated the effectiveness of our disclosure controls and procedures as of the end of the period covered by this Report. Based on that evaluation, our Chief Executive Officer and Chief Financial Officer have concluded that our disclosure controls and procedures were effective as of December 26, 2010, at the reasonable assurance level.
Management’s Report on Internal Control Over Financial Reporting
See Management’s Report on Internal Control Over Financial Reporting in Item 8, which is incorporated herein by reference.
Changes in Internal Control over Financial Reporting
There was no change in our internal control over financial reporting during the quarter ended December 26, 2010 that has materially affected, or is reasonably likely to materially affect, our internal control over financial reporting.
| ITEM 9B. | OTHER INFORMATION |
None.
138
Table of Contents
PART III
| ITEM 10. | DIRECTORS AND EXECUTIVE OFFICERS AND CORPORATE GOVERNANCE |
The information under the captions, “Election of Directors,” “Corporate Governance,” “Committee and Meetings of the Board of Directors,” “Executive Officers,” “Code of Ethics” and “Section 16(a) Beneficial Ownership Reporting Compliance” in our 2011 Proxy Statement is incorporated herein by reference.
| ITEM 11. | EXECUTIVE COMPENSATION |
The information under the captions, “Director Compensation” and “Executive Compensation” in our 2011 Proxy Statement is incorporated herein by reference.
| ITEM 12. | SECURITY OWNERSHIP OF CERTAIN BENEFICIAL OWNERS AND MANAGEMENT AND RELATED STOCKHOLDER MATTERS |
The information under the captions, “Security Ownership” and “Equity Compensation Plan Information” in our 2011 Proxy Statement is incorporated herein by reference.
| ITEM 13. | CERTAIN RELATIONSHIPS AND RELATED TRANSACTIONS, AND DIRECTOR INDEPENDENCE |
The information under the captions, “Certain Relationships and Related Transactions” and “Corporate Governance” in our 2011 Proxy Statement is incorporated herein by reference.
| ITEM 14. | PRINCIPAL ACCOUNT FEES AND SERVICES |
The information under the captions, “Ratification of Independent Registered Public Accounting Firm” in our 2011 Proxy Statement is incorporated herein by reference.
With the exception of the information specifically incorporated by reference in Part III to this Annual Report on Form 10-K from our 2011 Proxy Statement, our 2011 Proxy Statement shall not be deemed to be filed as part of this Report.
139
Table of Contents
PART IV
| ITEM 15. | EXHIBITS AND FINANCIAL STATEMENT SCHEDULES |
1. Financial Statements
The financial statements are set forth in Item 8 of this Annual Report on Form 10-K.
2. Exhibits
The exhibits listed in the accompanying Index to Exhibits are filed as part of, or incorporated by reference into, this Annual Report on Form 10-K (except for such exhibits that are marked on such exhibit list as furnished and not filed). The following is a list of such Exhibits:
| Exhibit No. |
Description of Exhibit | |
| 3.1 | Amended and Restated Certificate of Incorporation of Spansion Inc., filed as Exhibit 3.1 to Spansion’s Current Report on Form 8-K dated May 14, 2010, is hereby incorporated by reference. | |
| 3.2 | Amended and Restated Bylaws of Spansion Inc., as amended, filed as Exhibit 3.2 to Spansion’s Current Report on Form 8-K dated May 14, 2010, is hereby incorporated by reference. | |
| 4.1 | Specimen of Class A Common Stock Certificate, filed as Exhibit 4.1 to Spansion’s Amendment No. 6 to Form S-1 Registration Statement (No. 333-124041), is hereby incorporated by reference. | |
| 4.2 | Indenture, including the form of the Note, dated November 9, 2010, by and among Spansion LLC, as issuer, Spansion Inc. and Spansion Technology LLC, as guarantors, and Wells Fargo Bank, National Association, as trustee, filed as Exhibit 4.1 to Spansion’s Current Report on Form 8-K dated November 3, 2010, is hereby incorporated by reference. | |
| 10.1 | Bailment Agreement by and between Spansion LLC and Spansion Japan Limited, entered into February 2, 2010, filed as Exhibit 10.2 to Spansion’s Quarterly Report on Form 10-Q for the quarter ended March 28, 2010, is hereby incorporated by reference. | |
| 10.2* | Sort Services Agreement executed April 9, 2010, between Spansion LLC and ChipMOS TECHNOLOGIES INC, filed as Exhibit 10.3 to Spansion’s Quarterly Report on Form 10-Q for the quarter ended March 28, 2010, is hereby incorporated by reference. | |
| 10.3*** | Form of Indemnification Agreement, filed as Exhibit 10.3 to Spansion’s Current Report on Form 8-K dated May 14, 2010, is hereby incorporated by reference. | |
| 10.4(a)*** | Form of Change of Control Severance Agreement, filed as Exhibit 10.4 to Spansion’s Current Report on Form 8-K dated May 14, 2010, is hereby incorporated by reference. | |
| 10.4(b)*** | Form of Spansion Inc. Change of Control Severance Agreement, filed as Exhibit 10.1 to Spansion’s Current Report on Form 8-K dated August 26, 2010, is hereby incorporated by reference. | |
| 10.5*** | Spansion Inc. Key Employee Incentive Plan and Centurion Plan, as approved August 27, 2009, filed as Exhibit 10.9 to Spansion’s Quarterly Report on Form 10-Q for the quarter ended March 29, 2009, is hereby incorporated by reference. | |
| 10.6(a)*** | Employment Offer Letter for John H. Kispert, dated February 12, 2009, filed as Exhibit 10.1 to Spansion’s Current Report on Form 8-K dated February 17, 2009, is hereby incorporated by reference. | |
140
Table of Contents
| Exhibit No. |
Description of Exhibit | |
| 10.6(b)*** | Amendment No. 1 to Employment Offer Letter for John H. Kispert, dated July 9, 2009, filed as Exhibit 10.1 to Spansion’s Current Report on Form 8-K dated July 9, 2009, is hereby incorporated by reference. | |
| 10.7*** | Consulting Agreement between Spansion Inc. and Nathan Sarkisian, effective as of May 20, 2009, filed as Exhibit 10.3 to Spansion’s Quarterly Report on Form 10-Q for the quarter ended March 29, 2009, is hereby incorporated by reference. | |
| 10.8*** | Employment Offer Letter for Randy W. Furr, dated June 4, 2009, filed as Exhibit 10.5 to Spansion’s Quarterly Report on Form 10-Q for the quarter ended March 29, 2009, is hereby incorporated by reference. | |
| 10.9*** | Stockholders Agreement, dated as of December 21, 2005, by and among AMD Investments, Spansion Inc., Advanced Micro Devices, Inc., and Fujitsu Limited, filed as Exhibit 10.3 to Spansion’s Current Report on Form 8-K dated December 21, 2005, is hereby incorporated by reference. | |
| 10.10(a) | Amended and Restated Fujitsu Distribution Agreement between Spansion Inc. and Fujitsu Microelectronics Ltd., as successor-in-interest to Fujitsu Ltd., filed as Exhibit 10.4 to Spansion’s Current Report on Form 8-K dated December 21, 2005, is hereby incorporated by reference. | |
| 10.10(b) | Amendment No. 1 to the Amended and Restated Fujitsu Distribution Agreement between Spansion Inc. and Fujitsu Microelectronics Ltd., as successor-in-interest to Fujitsu Ltd., effective as of October 1, 2007 between Spansion Inc. and Fujitsu Limited, filed as Exhibit 10.8 to Spansion’s Annual Report on Form 10-K dated December 30, 2007, is hereby incorporated by reference. | |
| 10.10(c) | Amendment No. 2 to the Amended and Restated Fujitsu Distribution Agreement between Spansion Inc. and Fujitsu Microelectronics Ltd., as successor-in-interest to Fujitsu Ltd., effective as of September 28, 2008 between Spansion Inc. and Fujitsu Limited, filed as Exhibit 10.4 to Spansion’s Quarterly Report on Form 10-Q for the quarter ended September 28, 2008, is hereby incorporated by reference. | |
| 10.10(d) | Amendment No. 3 and Letter Supplement to the Amended and Restated Fujitsu Distribution Agreement between Spansion Inc. and Fujitsu Microelectronics Ltd., as successor-in-interest to Fujitsu Ltd., effective as of January 15, 2009, filed as Exhibit 10.1(a) to Spansion’s Quarterly Report on Form 10-Q for the quarter ended March 29, 2009, is hereby incorporated by reference. | |
| 10.10(e) | Amendment No. 4 to the Amended and Restated Fujitsu Distribution Agreement between Spansion Inc. and Fujitsu Microelectronics Ltd., as successor-in-interest to Fujitsu Ltd., effective as of February 23, 2009, filed as Exhibit 10.1(b) to Spansion’s Quarterly Report on Form 10-Q for the quarter ended March 29, 2009, is hereby incorporated by reference. | |
| 10.10(f) | Amendment No. 5 to the Amended and Restated Fujitsu Distribution Agreement between Spansion Inc. and Fujitsu Microelectronics Ltd., as successor-in-interest to Fujitsu Ltd., effective as of April 23, 2009, filed as Exhibit 10.1(c) to Spansion’s Quarterly Report on Form 10-Q for the quarter ended March 29, 2009, is hereby incorporated by reference. | |
| 10.10(g) | Amendment No. 6 to the Amended and Restated Fujitsu Distribution Agreement between Spansion Inc. and Fujitsu Microelectronics Ltd., as successor-in-interest to Fujitsu Ltd., effective as of June 25, 2009, filed as Exhibit 10.1(d) to Spansion’s Quarterly Report on Form 10-Q for the quarter ended March 29, 2009, is hereby incorporated by reference. | |
141
Table of Contents
| Exhibit No. |
Description of Exhibit | |
| 10.10(h) | Amendment No. 7 to the Amended and Restated Fujitsu Distribution Agreement between Spansion Inc. and Fujitsu Microelectronics Ltd., as successor-in-interest to Fujitsu Ltd., effective as of October 30, 2009, filed as Exhibit 10.1(e) to Spansion’s Quarterly Report on Form 10-Q for the quarter ended March 29, 2009, is hereby incorporated by reference. | |
| 10.11 | Amended and Restated Fujitsu-Spansion Patent Cross-License Agreement between Fujitsu Limited and Spansion Inc., filed as Exhibit 10.5 to Spansion’s Current Report on Form 8-K dated December 21, 2005, is hereby incorporated by reference. | |
| 10.12 | Amended and Restated AMD-Spansion Patent Cross-License Agreement between Advanced Micro Devices, Inc. and Spansion Inc., filed as Exhibit 10.6 to Spansion’s Current Report on Form 8-K dated December 21, 2005, is hereby incorporated by reference. | |
| 10.13 | Amended and Restated Intellectual Property Contribution and Ancillary Matters Agreement among Fujitsu Limited, Advanced Micro Devices, Inc., AMD Investments, Inc. and Spansion Inc., filed as Exhibit 10.7 to Spansion’s Current Report on Form 8-K dated December 21, 2005, is hereby incorporated by reference. | |
| 10.14 | Amended and Restated Information Technology Services Agreement between Spansion Inc. and Fujitsu Limited, filed as Exhibit 10.8 to Spansion’s Current Report on Form 8-K dated December 21, 2005, is hereby incorporated by reference. | |
| 10.15* | Amended and Restated Non-Competition Agreement among Spansion Inc., Advanced Micro Devices, Inc. and Fujitsu Limited, filed as Exhibit 10.13 to Spansion’s Current Report on Form 8-K dated December 21, 2005, is hereby incorporated by reference. | |
| 10.16(a)* | Master Semiconductor Foundry and Technology Transfer Agreement, dated August 11, 2005, between Spansion LLC and Taiwan Semiconductor Manufacturing Company, filed as Exhibit 10.33 to Spansion’s Amendment No. 9 to Form S-1 Registration Statement (No. 333-124041), is hereby incorporated by reference. | |
| 10.16(b)** | Second Amendment, dated December 14, 2010, to the Foundry Agreement, dated August 31, 2007, between Spansion LLC and Semiconductor Manufacturing International Company. | |
| 10.17* | Foundry Agreement, dated March 31, 2005, between Spansion Japan and Fujitsu Limited, filed as Exhibit 10.34 to Spansion’s Amendment No. 3 to Form S-1 Registration Statement (No. 333-124041), is hereby incorporated by reference. | |
| 10.18(a) | Foundry Agreement, effective as of September 28, 2006, by and among Spansion Japan Limited, Spansion Inc., Spansion Technology Inc. and Spansion LLC, in their capacities as guarantors of Spansion Japan Limited, and Fujitsu Limited, filed as Exhibit 10.74 to Spansion’s Quarterly Report on Form 10-Q for the quarter ended October 1, 2006, is hereby incorporated by reference. | |
| 10.18(b) | Amendment No. 1 to the Amended and Restated Foundry Agreement, effective March 21, 2008 and entered into as of June 19, 2008, by and among Spansion Japan Limited, Spansion Inc., Spansion Technology, Inc. and Spansion LLC, in their capacities as guarantors of Spansion Japan Limited, and Fujitsu Limited and its assignee, Fujitsu Microelectronics Limited, filed as Exhibit 10.37(a) to Spansion’s Quarterly Report on Form 10-Q for the quarter ended June 29, 2008, is hereby incorporated by reference. | |
| 10.18(c) | Amendment No. 2 to the Amended and Restated Foundry Agreement, effective as of March 21, 2008 and entered into as of December 31, 2008, by and among Spansion Japan Limited, Spansion Inc., Spansion Technology, Inc. and Spansion LLC, in their capacities as guarantors of Spansion Japan Limited, and Fujitsu Limited and its assignee, Fujitsu Microelectronics Limited, filed as Exhibit 10.32(c) to Spansion’s Annual Report on Form 10-K dated May 13, 2009, is hereby incorporated by reference. | |
142
Table of Contents
| Exhibit No. |
Description of Exhibit | |
| 10.18(d) | Waiver of Payment Terms, dated June 30, 2008, by Fujitsu Microelectronics Limited, and agreed to by Spansion Inc., Spansion Technology, Inc., Spansion LLC and Spansion Japan Limited, filed as Exhibit 10.37(b) to Spansion’s Quarterly Report on Form 10-Q for the quarter ended June 29, 2008, is hereby incorporated by reference. | |
| 10.18(e) | Amendment No. 3 to the Amended and Restated Foundry Agreement, by and among Spansion Inc., Spansion LLC and Spansion Technology LLC, in their capacities as guarantors, Spansion Japan Limited and Fujitsu Microelectronics Limited, entered into as of June 30, 2009, filed as Exhibit 10.4 to Spansion’s Quarterly Report on Form 10-Q for the quarter ended March 29, 2009, is hereby incorporated by reference. | |
| 10.18(f)* | Restatement, effective February 2, 2010, to the Amended and Restated Foundry Agreement, by and between Spansion LLC and Spansion Japan Limited, filed as Exhibit 10.1(a) to Spansion’s Quarterly Report on Form 10-Q for the quarter ended March 28, 2010, is hereby incorporated by reference. | |
| 10.18(g) | Amendment, dated April 5, 2010, to the Amended and Restated Foundry Agreement, by and between Spansion LLC and Spansion Japan, filed as Exhibit 10.1(b) to Spansion’s Quarterly Report on Form 10-Q for the quarter ended March 28, 2010, is hereby incorporated by reference. | |
| 10.18(h) | Amendment No. 4, in the form of a Guaranty, to the Amended and Restated Foundry Agreement, by and among Spansion Inc., Spansion LLC and Spansion Technology LLC, in their capacities as guarantors, Nihon Spansion Limited (successor in interest to Spansion Japan Limited) and Fujitsu Microelectronics Limited, entered into as of May 21, 2010. | |
| 10.18(i) | Guaranty of Spansion LLC of Nihon Spansion Trading Limited’s Obligations Under the Amended and Restated Foundry Agreement, dated November 30, 2010. | |
| 10.18(j) | Amendment No. 5 to the Amended and Restated Foundry Agreement, by and among Spansion Inc., Spansion LLC and Spansion Technology LLC, in their capacities as guarantors, Nihon Spansion Trading Limited (as successor in interest to Nihon Spansion Limited) and Fujitsu Microelectronics Limited, entered into as of December 27, 2010. | |
| 10.19 | Second Amendment and Transfer Agreement, dated as of September 28, 2006, between Spansion Japan Limited and Fujitsu Limited, filed as Exhibit 10.75 to Spansion’s Quarterly Report on Form 10-Q for the quarter ended October 1, 2006, is hereby incorporated by reference. | |
| 10.20 | Supply Agreement by and between Spansion LLC and Powertech Technology Inc., dated August 21, 2009, filed as Exhibit 10.2 to Spansion’s Current Report on Form 8-K dated August 25, 2009, is hereby incorporated by reference. | |
| 10.21 | Transition Services Agreement by and between Spansion LLC and Powertech Technology Inc., dated August 21, 2009, filed as Exhibit 10.3 to Spansion’s Current Report on Form 8-K dated August 25, 2009, is hereby incorporated by reference. | |
| 10.22 | Agreement between Spansion LLC and Spansion Japan Limited, entered into as of June 30, 2009, filed as Exhibit 10.10 to Spansion’s Quarterly Report on Form 10-Q for the quarter ended March 29, 2009, is hereby incorporated by reference. | |
| 10.23 | Memorandum of Understanding Regarding Non-Competition Agreement between Spansion Inc. and Fujitsu Microelectronics Limited, dated as of June 30, 2009, filed as Exhibit 10.10 to Spansion’s Quarterly Report on Form 10-Q for the quarter ended March 29, 2009, is hereby incorporated by reference. | |
| 10.24 | Assignment of Amended and Restated Information Technology Services Agreement between Spansion Inc., Spansion Japan Limited, and Fujitsu Microelectronics Limited, effective as of March 31, 2009, filed as Exhibit 10.12 to Spansion’s Quarterly Report on Form 10-Q for the quarter ended March 29, 2009, is hereby incorporated by reference. | |
143
Table of Contents
| Exhibit No. |
Description of Exhibit | |
| 10.25(a) | Schedule to Lease Agreement, dated as of September 28, 2006, between Banc of America Leasing & Capital, LLC and Spansion LLC, filed as Exhibit 10.62(k) to Spansion’s Quarterly Report on Form 10-Q for the quarter ended October 1, 2006, is hereby incorporated by reference. | |
| 10.25(b) | Schedule to Lease Agreement, dated as of September 28, 2006, between Banc of America Leasing & Capital, LLC and Spansion LLC, filed as Exhibit 10.62(l) to Spansion’s Quarterly Report on Form 10-Q for the quarter ended October 1, 2006, is hereby incorporated by reference. | |
| 10.26(a)* | Foundry Agreement by and between Semiconductor Manufacturing International Corporation and Spansion LLC dated August 31, 2007, filed as Exhibit 10.1 to Spansion’s Quarterly Report on Form 10-Q for the quarter ended September 28, 2008, is hereby incorporated by reference. | |
| 10.26(b)* | First Amendment to the Foundry Agreement by and between Semiconductor Manufacturing International Corporation and Spansion LLC dated August 15, 2008, filed as Exhibit 10.2 to Spansion’s Quarterly Report on Form 10-Q for the quarter ended September 28, 2008, is hereby incorporated by reference. | |
| 10.27 | Agreement by and among Spansion Inc., Fujitsu Limited and Fujitsu Microelectronics Limited dated September 11, 2008, filed as Exhibit 10.3 to Spansion’s Quarterly Report on Form 10-Q for the quarter ended September 28, 2008, is hereby incorporated by reference. | |
| 10.28 | Credit Line Account Application and Agreement for Organizations and Businesses between Spansion LLC and UBS Bank USA, dated as of December 29, 2008, filed as Exhibit 10.54 to Spansion’s Annual Report on Form 10-K dated May 13, 2009, is hereby incorporated by reference. | |
| 10.29(a) | Lease Agreement, dated as of September 30, 2005, between Banc of America Leasing & Capital, LLC and Spansion LLC, filed as Exhibit 10.1(a) to Spansion’s Current Report on Form 8-K dated December 27, 2005, is hereby incorporated by reference. | |
| 10.29(b) | First Amendment to Schedule to Lease Agreement, entered into September 10, 2010, by and between Spansion LLC and AIG Commercial Equipment Finance Inc., filed as Exhibit 10.6 to Spansion’s Quarterly Report on Form 10-Q for the quarter ended September 26, 2010, is hereby incorporated by reference. | |
| 10.30(a) | Amended Schedule to Lease Agreement, dated as of December 23, 2005, between General Electric Capital Corporation and Spansion LLC, filed as Exhibit 10.1(b) to Spansion’s Current Report on Form 8-K dated December 27, 2005, is hereby incorporated by reference. | |
| 10.30(b) | Amended Schedule to Lease Agreement, dated as of December 23, 2005, between General Electric Capital Corporation and Spansion LLC, filed as Exhibit 10.1(e) to Spansion’s Current Report on Form 8-K dated December 27, 2005, is hereby incorporated by reference. | |
| 10.31 | Master Lease Agreement, dated as of September 28, 2006, by and among Spansion Japan Limited, Spansion Inc., Spansion Technology Inc. and Spansion LLC, in their capacities as guarantors of Spansion Japan Limited, and Fujitsu Limited, filed as Exhibit 10.73 to Spansion’s Quarterly Report on Form 10-Q for the quarter ended October 1, 2006, is hereby incorporated by reference. | |
| 10.32 | Settlement Agreement among Spansion LLC, Spansion Inc. and Samsung Electronics Co., Ltd., dated as of March 16, 2009, filed as Exhibit 10.59 to Spansion’s Annual Report on Form 10-K dated May 13, 2009, is hereby incorporated by reference. | |
| 10.33 | Backstop Rights Purchase Agreement between Spansion Inc. and SLS Spansion Holdings, LLC, dated as of January 25, 2010, filed as Exhibit 10.68 to Spansion’s Annual Report on Form 10-K dated February 12, 2010, is hereby incorporated by reference. | |
144
Table of Contents
| Exhibit No. |
Description of Exhibit | |
| 10.34(a) | Credit Agreement dated as of February 9, 2010 among Spansion LLC, as the Borrower, Spansion Inc., and Spansion Technology LLC, as Guarantors, Barclays Bank PLC, as Administrative Agent, Collateral Agent and Documentation Agent, the Lenders Party Hereto, Barclays Capital, as Joint Lead arranger and Joint Book Runner, and Morgan Stanley Senior Funding, Inc., as Joint Lead Arranger, Joint Book Runner and Syndication Agent, filed as Exhibit 10.69 to Spansion’s Annual Report on Form 10-K dated February 12, 2010, is hereby incorporated by reference. | |
| 10.34(b) | Amendment No. 1, dated as of April 9, 2010, to the Credit Agreement dated as of February 9, 2010 among Spansion LLC, as the Borrower, Spansion Inc., and Spansion Technology LLC, as Guarantors, Barclays Bank PLC, as Administrative Agent, Collateral Agent and Documentation Agent, the Lenders Party Hereto, Barclays Capital, as Joint Lead arranger and Joint Book Runner, and Morgan Stanley Senior Funding, Inc., as Joint Lead Arranger, Joint Book Runner and Syndication Agent. | |
| 10.34(c) | Amendment No. 2, dated as of May 7, 2010, to the Credit Agreement dated as of February 9, 2010 among Spansion LLC, as the Borrower, Spansion Inc., and Spansion Technology LLC, as Guarantors, Barclays Bank PLC, as Administrative Agent, Collateral Agent and Documentation Agent, the Lenders Party Hereto, Barclays Capital, as Joint Lead arranger and Joint Book Runner, and Morgan Stanley Senior Funding, Inc., as Joint Lead Arranger, Joint Book Runner and Syndication Agent, filed as Exhibit 10.7 to Spansion’s Quarterly Report on Form 10-Q for the quarter ended September 26, 2010, is hereby incorporated by reference. | |
| 10.34(d) | Amendment No. 3 and Consent, dated as of October 18, 2010, to the Credit Agreement dated as of February 9, 2010 among Spansion LLC, as the Borrower, Spansion Inc., and Spansion Technology LLC, as Guarantors, Barclays Bank PLC, as Administrative Agent, Collateral Agent and Documentation Agent, the Lenders Party Hereto, Barclays Capital, as Joint Lead arranger and Joint Book Runner, and Morgan Stanley Senior Funding, Inc., as Joint Lead Arranger, Joint Book Runner and Syndication Agent, filed as Exhibit 10.8 to Spansion’s Quarterly Report on Form 10-Q for the quarter ended September 25, 2010, is hereby incorporated by reference. | |
| 10.34(e) | Amendment No. 4, dated as of November 9, 2010, to the Credit Agreement dated as of February 9, 2010, among Spansion LLC, Spansion Inc., Spansion Technology LLC, each lender from time to time party thereto, Barclays Bank PLC, as Administrative Agent, Collateral Agent and Documentation Agent, Barclays Capital, as Joint Lead Arranger and Joint Book Runner, and Morgan Stanley Senior Funding, Inc., as Joint Lead Arranger, Joint Book Runner and Syndication Agent, filed as Exhibit 10.2 to Spansion’s Current Report on Form 8-K dated November 3, 2010, is hereby incorporated by reference. | |
| 10.35* | Foundry Agreement, dated August 28, 2010, by and among Spansion LLC, Nihon Spansion Limited and Texas Instruments Incorporated, filed as Exhibit 10.70 to Spansion’s Registration Statement on Form S-1 filed September 17, 2010, is hereby incorporated by reference. | |
| 10.36(a) | Amendment No. 1 to Foundry Agreement, entered into September 15, 2010, by and between Spansion LLC, Nihon Spansion Limited and Texas Instruments Incorporated, filed as Exhibit 10.4(a) to Spansion’s Quarterly Report on Form 10-Q for the quarter ended September 26, 2010, is hereby incorporated by reference. | |
| 10.36(b) | Amendment No. 2 to Foundry Agreement, entered into October 15, 2010, by and between Spansion LLC, Nihon Spansion Limited and Texas Instruments Incorporated. | |
| 10.36(c) | Assignment of Foundry Agreement from Nihon Spansion Limited to Nihon Spansion Trading, dated November 30, 2010. | |
| 10.37*** | Spansion Inc. 2010 Equity Incentive Award Plan, filed as Exhibit 10.1 to the Company’s Registration Statement on Form S-8 dated May 10, 2010, is hereby incorporated by reference. | |
145
Table of Contents
| Exhibit No. |
Description of Exhibit | |
| 10.37(a)*** | Amendment to Spansion Inc. 2010 Equity Incentive Award Plan, filed as Exhibit 10.2(a) to Spansion’s Current Report on Form 8-K dated May 14, 2010, is hereby incorporated by reference. | |
| 10.37(b)*** | U.S. Employees Form of Stock Option Agreement and Terms and Conditions for Awards Under the Spansion Inc. 2010 Equity Incentive Award Plan, filed as Exhibit 10.1(a) to Spansion’s Quarterly Report on Form 10-Q for the quarter ended June 27, 2010, is hereby incorporated by reference. | |
| 10.37(c)*** | U.S. Employees Form of Restricted Stock Unit Agreement and Terms and Conditions for Awards Under the Spansion Inc. 2010 Equity Incentive Award Plan, filed as Exhibit 10.1(b) to Spansion’s Quarterly Report on Form 10-Q for the quarter ended June 27, 2010, is hereby incorporated by reference. | |
| 10.37(d)*** | Non-U.S. Employees Form of Stock Option Agreement Terms and Conditions (With Foreign Exhibit) for Awards Under the Spansion Inc. 2010 Equity Incentive Award Plan, filed as Exhibit 10.1(c) to Spansion’s Quarterly Report on Form 10-Q for the quarter ended June 27, 2010, is hereby incorporated by reference. | |
| 10.37(e)*** | Non-U.S. Employees Form of Restricted Stock Unit Agreement and Terms and Conditions (With Foreign Exhibit) for Awards Under the Spansion Inc. 2010 Equity Incentive Award Plan, filed as Exhibit 10.1(d) to Spansion’s Quarterly Report on Form 10-Q for the quarter ended June 27, 2010, is hereby incorporated by reference. | |
| 10.37(f)*** | Spansion Inc. 2010 Equity Incentive Award Plan—French Sub-Plan—Options, filed as Exhibit 10.1(e) to Spansion’s Quarterly Report on Form 10-Q for the quarter ended June 27, 2010, is hereby incorporated by reference. | |
| 10.37(g)*** | Spansion Inc. 2010 Equity Incentive Award Plan—French Sub-Plan—Restricted Stock/Restricted Stock Units, filed as Exhibit 10.2 to Spansion’s Quarterly Report on Form 10-Q for the quarter ended 26, 2010, is hereby incorporated by reference. | |
| 10.37(h)*** | Spansion Inc. 2010 Equity Incentive Award Plan—Sub-Plan—Israel, filed as Exhibit 10.1(g) to Spansion’s Quarterly Report on Form 10-Q for the quarter ended June 27, 2010, is hereby incorporated by reference. | |
| 10.37(i)*** | Form of Performance-Based Restricted Stock Unit Award. | |
| 10.38*** | Spansion Inc. 2010 Employee Incentive Plan, filed as Exhibit 10.2 to Spansion’s Quarterly Report on Form 10-Q for the quarter ended June 27, 2010, is hereby incorporated by reference. | |
| 10.39*** | Spansion Inc. 2010 Executive Compensation Plan, filed as Exhibit 10.3 to Spansion’s Quarterly Report on Form 10-Q for the quarter ended June 27, 2010, is hereby incorporated by reference. | |
| 10.40*** | Form of Spansion Inc. Indemnity Agreement with Directors (Silver Lake), filed as Exhibit 10.4 to Spansion’s Quarterly Report on Form 10-Q for the quarter ended June 27, 2010, is hereby incorporated by reference. | |
| 10.41(a) | Loan and Security Agreement dated as of May 10, 2010, by and between Spansion Inc., as Parent and Spansion LLC, and Certain of its Subsidiaries Party Hereto, as Borrowers, and Certain Financial Institutions, as Lenders and Bank of America, N.A., as Administrative Agent, Sole Lead Arranger, Sole Bookrunner, and Agent, filed as Exhibit 10.5 to Spansion’s Quarterly Report on Form 10-Q for the quarter ended June 27, 2010, is hereby incorporated by reference. | |
146
Table of Contents
| Exhibit No. |
Description of Exhibit | |
| 10.41(b) | Amendment Number One, dated as of October 15, 2010, to Loan and Security Agreement dated as of May 10, 2010, by and between Spansion Inc., as Parent and Spansion LLC, and Certain of its Subsidiaries Party Hereto, as Borrowers, and Certain Financial Institutions, as Lenders and Bank of America, N.A., as Administrative Agent, Sole Lead Arranger, Sole Bookrunner, and Agent, filed as Exhibit 10.6 to Spansion’s Quarterly Report on Form 10-Q for the quarter ended September 26, 2010, is hereby incorporated by reference. | |
| 10.41(c) | Amendment Number Two, dated as of November 9, 2010, to Loan and Security Agreement dated as of May 10, 2010, by and between Spansion Inc., as Parent and Spansion LLC, and Certain of its Subsidiaries Party Hereto, as Borrowers, and Certain Financial Institutions, as Lenders and Bank of America, N.A., as Administrative Agent, Sole Lead Arranger, Sole Bookrunner, and Agent, filed as Exhibit 10.2 to Spansion’s Current Report on Form 8-K dated November 3, 2010, is hereby incorporated by reference. | |
| 10.42 | Registration Rights Agreement, dated November 9, 2010, among Spansion LLC, Spansion Technology LLC, Spansion Inc., Barclays Capital Inc. and Morgan Stanley & Co. Incorporated, filed as Exhibit 10.1 to Spansion’s Current Report on Form 8-K dated November 3, 2010, is hereby incorporated by reference. | |
| 16.1 | Letter to Securities and Exchange Commission from Ernst & Young LLP, dated May 19, 2010, filed as Exhibit 16.1 to Spansion’s Current Report on Form 8-K dated May 20, 2010, is hereby incorporated by reference. | |
| 21.1 | Subsidiaries of Spansion Inc. | |
| 23.1 | Consent of Ernst & Young LLP, Independent Registered Public Accounting Firm. | |
| 23.2 | Consent of PricewaterhouseCoopers LLP, Independent Registered Public Accounting Firm. | |
| 31.1 | Certification of Chief Executive Officer Pursuant to Section 302 of the Sarbanes-Oxley Act 2002. | |
| 31.2 | Certification of Chief Financial Officer Pursuant to Section 302 of the Sarbanes-Oxley Act of 2002. | |
| 32.1+ | Certification of the Chief Executive Officer Pursuant to 18 U.S.C. Section 1350, as adopted pursuant to Section 906 of the Sarbanes-Oxley Act of 2002. | |
| 32.2+ | Certification of the Chief Financial Officer Pursuant to 18 U.S.C. Section 1350, as adopted pursuant to Section 906 of the Sarbanes-Oxley Act of 2002. | |
| * | Confidential treatment has been granted with respect to portions of this exhibit. |
| ** | Confidential treatment has been requested with respect to portions of this exhibit. |
| *** | Management Agreement or Compensation Plan. |
| + | Exhibits 32.1 and 32.2 are being furnished and shall not be deemed to be “filed” for purposes of Section 18 of the Securities Exchange Act of 1934, as amended (the Exchange Act), or otherwise subject to the liability of that section, nor shall such exhibits be deemed to be incorporated by reference in any registration statement or other document filed under the Securities Act of 1933, as amended, or the Exchange Act, except as otherwise specifically stated in such filing. |
147
Table of Contents
Pursuant to the requirements of Section 13 or 15(d) of the Securities Exchange Act of 1934, the registrant has duly caused this report to be signed on its behalf by the undersigned, thereunto duly authorized.
| February 22, 2011 |
SPANSION INC. | |||||
| By: |
/s/ Randy W. Furr | |||||
| Randy W. Furr Executive Vice President and | ||||||
POWER OF ATTORNEY
KNOW ALL PERSONS BY THESE PRESENTS, that each person whose signature appears below constitutes and appoints John H. Kispert and Randy W. Furr, and each of them, their true and lawful attorneys-in-fact, each with full power of substitution, for them in any and all capacities, to sign any amendments to this report on Form 10-K and to file the same, with exhibits thereto and other documents in connection therewith, with the Securities and Exchange Commission, hereby ratifying and confirming all that each of said attorneys-in-fact or their substitute or substitutes may do or cause to be done by virtue hereof.
Pursuant to the requirements of the Securities Exchange Act of 1933, this report has been signed below by the following persons, on behalf of the registrant and in the capacities and on the dates indicated.
| Signature |
Title |
Date | ||
| /s/ John H. Kispert John H. Kispert |
President, Chief Executive Officer and Director (Principal Executive Officer) |
February 22, 2011 | ||
| /s/ Randy W. Furr Randy W. Furr |
Executive Vice President and Chief Financial Officer (Principal Financial and Accounting Officer) |
February 22, 2011 | ||
| /s/ Raymond Bingham Raymond Bingham |
Chairman of the Board of Directors |
February 22, 2011 | ||
| /s/ Eugene I. Davis Eugene I. Davis |
Director |
February 22, 2011 | ||
| /s/ Hans Geyer Hans Geyer |
Director |
February 22, 2011 | ||
| /s/ Paul Mercadante Paul Mercadante |
Director |
February 22, 2011 | ||
| /s/ Ajay Shah Ajay Shah |
Director |
February 22, 2011 | ||
| /s/ Clifton Thomas Weatherford Clifton Thomas Weatherford |
Director |
February 22, 2011 | ||
148