Attached files
| file | filename |
|---|---|
| EX-21.1 - EX-21.1 - Macquarie Infrastructure Corp | d27893_ex21-1.htm |
| EX-23.1 - EX-23.1 - Macquarie Infrastructure Corp | d27893_ex23-1.htm |
| EX-32.1 - EX-32.1 - Macquarie Infrastructure Corp | d27893_ex32-1.htm |
| EX-32.2 - EX-32.2 - Macquarie Infrastructure Corp | d27893_ex32-2.htm |
| EX-99.(1) - EX-99.(1) - Macquarie Infrastructure Corp | d27893_ex99-1.htm |
| EX-31.2 - EX-31.2 - Macquarie Infrastructure Corp | d27893_ex31-2.htm |
| EX-23.2 - EX-23.2 - Macquarie Infrastructure Corp | d27893_ex23-2.htm |
| EX-31.1 - EX-31.1 - Macquarie Infrastructure Corp | d27893_ex31-1.htm |
| EX-10.28 - EX-10.28 - Macquarie Infrastructure Corp | d27893_ex10-28.htm |
| EX-10.27 - EX-10.27 - Macquarie Infrastructure Corp | d27893_ex10-27.htm |
UNITED STATES
SECURITIES AND EXCHANGE COMMISSION
SECURITIES AND EXCHANGE COMMISSION
Washington, D.C. 20549
FORM 10-K
(Mark One)
[X] |
ANNUAL REPORT PURSUANT TO SECTION 13 OR 15(d) OF THE SECURITIES EXCHANGE ACT OF 1934 |
For the Fiscal Year Ended December 31, 2010
OR
OR
[ ] |
TRANSITION REPORT PURSUANT TO SECTION 13 OR 15(d) OF THE SECURITIES EXCHANGE ACT OF 1934 |
For the transition period from _________________ to _________________
Commission File Number: 001-32384
MACQUARIE INFRASTRUCTURE COMPANY LLC
(Exact Name of Registrant as Specified in Its Charter)
(Exact Name of Registrant as Specified in Its Charter)
Delaware |
43-2052503 |
||||||
(Jurisdiction
of Incorporation or Organization) |
(IRS Employer Identification No.) |
||||||
125 West 55th Street New York, New York 10019 (Address of Principal Executive Offices) (Zip Code) Registrant’s Telephone Number, Including Area Code: (212) 231-1000 Securities registered pursuant to Section 12(b) of the Act: |
|||||||
Title of
Each Class: |
Name of Exchange on Which Registered: |
|||||
Limited
Liability Company Interests of Macquarie Infrastructure Company LLC (“LLC Interests”) |
New York Stock Exchange |
|||||
Securities registered pursuant to Section 12(g) of the Act: None
Indicate by check mark
if the registrant is a well-known seasoned issuer, as defined in Rule 405 of the Securities Act.
Yes [ ] No [X]
Yes [ ] No [X]
Indicate by check mark if the
registrant is not required to file reports pursuant to Section 13 or Section 15(d) of the Act.
Yes [ ] No [X]
Yes [ ] No [X]
Indicate by check mark whether the
registrant (1) has filed all reports required to be filed by Section 13 or 15(d) of the Securities Exchange Act of 1934 during the preceding 12 months
(or for such shorter period that the registrant was required to file such reports), and (2) has been subject to such filing requirements for the past
90 days. Yes [X] No [ ]
Indicate by check mark if disclosure of
delinquent filers pursuant to Item 405 of Regulation S-K is not contained herein, and will not be contained, to the best of registrants’
knowledge, in definitive proxy or information statements incorporated by reference in Part III of this Form 10-K or any amendment to this Form
10-K. [ ]
Indicate by check mark whether the
registrant has submitted electronically and posted on its corporate Web site, if any, every Interactive Data File required to be submitted and posted
pursuant to Rule 405 of Regulation S-T (§232.405 of this chapter) during the preceding 12 months (or for such shorter period that the registrant
was required to submit and post such files). Yes [ ] No [ ]
Indicate by check mark whether the
registrant is a large accelerated filer, an accelerated filer, a non-accelerated filer, or a smaller reporting company. See the definitions of
“large accelerated filer,” “accelerated filer” and “smaller reporting company” in Rule 12b-2 of the Exchange
Act.
Large Accelerated Filer
[ ] Accelerated Filer [X] Non-Accelerated Filer [ ] Smaller Reporting Company [ ]
Indicate by check mark whether the
registrant is a shell company (as defined in Rule 12b-2 of the Exchange Act). Yes [ ] No [X]
The aggregate market value of the
outstanding shares of stock held by non-affiliates of Macquarie Infrastructure Company LLC at June 30, 2010 was $531,493,528 based on the closing price
on the New York Stock Exchange on that date. This calculation does not reflect a determination that persons are affiliates for any other
purposes.
There were 45,715,448 shares of stock
without par value outstanding at February 23, 2011.
DOCUMENTS INCORPORATED BY REFERENCE
The definitive proxy statement relating
to Macquarie Infrastructure Company LLC’s Annual Meeting of Shareholders for fiscal year ended December 31, 2010, to be held June 2, 2011, is
incorporated by reference in Part III to the extent described therein.
MACQUARIE INFRASTRUCTURE COMPANY LLC
TABLE OF CONTENTS
| Page |
||||||||||||
|---|---|---|---|---|---|---|---|---|---|---|---|---|
| PART I |
||||||||||||
Item
1. |
Business
|
3 | ||||||||||
Item
1A. |
Risk Factors
|
23 | ||||||||||
Item
1B. |
Unresolved Staff
Comments |
39 | ||||||||||
Item
2. |
Properties
|
39 | ||||||||||
Item
3. |
Legal Proceedings
|
41 | ||||||||||
Item
4. |
[Removed and
Reserved] |
41 | ||||||||||
PART II |
||||||||||||
Item
5. |
Market for
Registrant’s Common Equity, Related Stockholder Matters and Issuer Purchases of Equity Securities |
42 | ||||||||||
Item
6. |
Selected
Financial Data |
43 | ||||||||||
Item
7. |
Management’s
Discussion and Analysis of Financial Condition and Results of Operations |
46 | ||||||||||
Item
7A. |
Quantitative and
Qualitative Disclosures About Market Risk |
99 | ||||||||||
Item
8. |
Financial
Statements and Supplementary Data |
102 | ||||||||||
Item
9. |
Changes in and
Disagreements With Accountants on Accounting and Financial Disclosure |
151 | ||||||||||
Item
9A. |
Controls and
Procedures |
151 | ||||||||||
Item
9B. |
Other Information
|
153 | ||||||||||
PART III |
||||||||||||
Item
10. |
Directors and
Executive Officers of the Registrant |
153 | ||||||||||
Item
11. |
Executive
Compensation |
153 | ||||||||||
Item
12. |
Security
Ownership of Certain Beneficial Owners and Management and Related Stockholder Matters |
153 | ||||||||||
Item
13. |
Certain
Relationships and Related Transactions |
154 | ||||||||||
Item
14. |
Principal
Accountant Fees and Services |
154 | ||||||||||
PART IV |
||||||||||||
Item
15. |
Exhibits,
Financial Statement Schedules |
154 | ||||||||||
i
FORWARD-LOOKING STATEMENTS
We have included or incorporated by
reference into this report, and from time to time may make in our public filings, press releases or other public statements, certain statements that
may constitute forward-looking statements. These include without limitation those under “Risk Factors” in Part I, Item 1A, “Legal
Proceedings” in Part I, Item 3, “Management’s Discussion and Analysis of Financial Condition and Results of Operations” in Part II,
Item 7, and “Quantitative and Qualitative Disclosures about Market Risk” in Part II, Item 7A. In addition, our management may make
forward-looking statements to analysts, investors, representatives of the media and others. These forward-looking statements are not historical facts
and represent only our beliefs regarding future events, many of which, by their nature, are inherently uncertain and beyond our control. We may, in
some cases, use words such as “project,” “believe,” “anticipate,” “plan,” “expect,”
“estimate,” “intend,” “should,” “would,” “could,” “potentially,” “may” or other
words that convey uncertainty of future events or outcomes to identify these forward-looking statements.
In connection with the “safe
harbor” provisions of the Private Securities Litigation Reform Act of 1995, we are identifying important factors that, individually or in the
aggregate, could cause actual results to differ materially from those contained in any forward-looking statements made by us. Any such forward-looking
statements are qualified by reference to the following cautionary statements.
Forward-looking statements in this
report are subject to a number of risks and uncertainties, some of which are beyond our control, including, among other things:
• |
changes in general economic, business or demographic conditions or trends in the United States or changes in the political environment, level of travel or construction or transportation costs where we operate, including changes in interest rates and price levels; |
• |
changes in patterns of commercial or general aviation air travel, including variations in customer demand for our business; |
• |
our Manager’s affiliation with the Macquarie Group, which may affect the market price of our LLC interests; |
• |
our limited ability to remove our Manager for underperformance and our Manager’s right to resign; |
• |
our holding company structure, which may limit our ability to pay or increase a dividend; |
• |
our ability to service, comply with the terms of and refinance at maturity our substantial indebtedness; |
• |
our ability to make, finance and integrate acquisitions; |
• |
our ability to implement our operating and internal growth strategies; |
• |
the regulatory environment, including U.S. energy policy, in which our businesses and the businesses in which we hold investments operate and our ability to estimate compliance costs, comply with any changes thereto, rates implemented by regulators of our businesses and the businesses in which we hold investments, and our relationships and rights under and contracts with governmental agencies and authorities; |
• |
technological innovations leading to a change in energy consumption patterns; |
• |
changes in electricity or other energy costs; |
• |
the competitive environment for attractive acquisition opportunities facing our businesses and the businesses in which we hold investments; |
• |
environmental risks, including the impact of climate change and weather conditions, pertaining to our businesses and the businesses in which we hold investments; |
• |
work interruptions or other labor stoppages at our businesses or the businesses in which we hold investments; |
1
• |
changes in the current treatment of qualified dividend income and long-term capital gains under current U.S. federal income tax law and the qualification of our income and gains for such treatment; |
• |
disruptions or other extraordinary or force majeure events affecting the facilities or operations of our businesses and the businesses in which we hold investments and our ability to insure against any losses resulting from such events or disruptions; |
• |
fluctuations in fuel costs, or the costs of supplies upon which our gas production and distribution business is dependent, and our ability to recover increases in these costs from customers; |
• |
our ability to make alternate arrangements to account for any disruptions or shutdowns that may affect the facilities of the suppliers or the operation of the barges upon which our gas production and distribution business is dependent; and |
• |
changes in U.S. domestic demand for chemical, petroleum and vegetable and animal oil products, the relative availability of tank storage capacity and the extent to which such products are imported. |
Our actual results, performance,
prospects or opportunities could differ materially from those expressed in or implied by the forward-looking statements. A description of risks that
could cause our actual results to differ appears under the caption “Risk Factors” in Part I, Item 1A and elsewhere in this report. It is not
possible to predict or identify all risk factors and you should not consider that description to be a complete discussion of all potential risks or
uncertainties that could cause our actual results to differ.
In light of these risks, uncertainties
and assumptions, you should not place undue reliance on any forward-looking statements. The forward-looking events discussed in this report may not
occur. These forward-looking statements are made as of the date of this report. We undertake no obligation to publicly update or revise any
forward-looking statements, whether as a result of new information, future events or otherwise. You should, however, consult further disclosures we may
make in future filings with the Securities and Exchange Commission, or the SEC.
Macquarie Infrastructure Company LLC
is not an authorized deposit-taking institution for the purposes of the Banking Act 1959 (Commonwealth of Australia) and its obligations do not
represent deposits or other liabilities of Macquarie Bank Limited ABN 46 008 583 542 (MBL). MBL does not guarantee or otherwise provide assurance in
respect of the obligations of Macquarie Infrastructure Company LLC.
2
PART I
ITEM 1. BUSINESS
Macquarie Infrastructure Company, LLC,
a Delaware limited liability company, was formed on April 13, 2004. Except as otherwise specified, “Macquarie Infrastructure Company”,
“MIC,” “the Company”, “we,” “us,” and “our” refer to Macquarie Infrastructure Company LLC and its
subsidiaries together. References to our “shareholders” herein means holders of LLC interests. The holders of LLC interests are also the
members of our company. Macquarie Infrastructure Management (USA) Inc., the company that we refer to as our Manager, is part of the Macquarie Group of
companies. References to the Macquarie Group means Macquarie Group Limited and its respective subsidiaries and affiliates worldwide.
General
We own, operate and invest in a
diversified group of infrastructure businesses in the United States. We believe our infrastructure businesses, which provide basic services, have a
sustainable and stable cash flow profile and offer the potential for capital growth. We offer investors an opportunity to participate directly in the
ownership of infrastructure businesses, which traditionally have been owned by governments or private investors, or have formed part of vertically
integrated companies.
The Company’s four operating
segments are classified into either energy-related businesses or aviation-related business, Atlantic Aviation. The energy-related businesses consist of
three operating segments: The Gas Company, District Energy and an investment in IMTT, which is accounted for under the equity method. All of the
business segments are managed separately and management has chosen to organize the Company around the distinct products and services
offered.
The Energy-Related Businesses:
• |
a 50% interest in a bulk liquid storage terminal business (“International Matex Tank Terminals” or “IMTT”), which provides bulk liquid storage and handling services at ten marine terminals in the United States and two in Canada and is one of the largest participants in this industry in the U.S., based on storage capacity; |
• |
a gas production and distribution business (“The Gas Company”), which is a full-service gas energy company, making gas products and services available in Hawaii; and |
• |
a 50.01% controlling interest in a district energy business (“District Energy”), which operates the largest district cooling system in the U.S., serving various customers in Chicago, Illinois and Las Vegas, Nevada. |
Atlantic Aviation — an airport services
business providing products and services, including fuel and aircraft hangaring/parking, to owners and operators of private jets at 66 airports and one
heliport in the U.S.
On June 2, 2010, we concluded the sale
in bankruptcy of an airport parking business (“Parking Company of America Airports” or “PCAA”), resulting in a pre-tax gain of
$130.3 million, of which $76.5 million related to the forgiveness of debt, and the elimination of $201.0 million of current debt from liabilities from
our consolidated balance sheet. The results of operations from this business and the gain from the bankruptcy sale are separately reported as a
discontinued operations in the Company’s consolidated financial statements. This business is no longer a reportable segment. As a part of the
bankruptcy sale process, substantially all of the cash proceeds were used to pay the creditors of this business and were not paid to us. We received
$602,000 from the PCAA bankruptcy estate for expenses paid on behalf of PCAA during its operations. See Note 4, “Discontinued Operations”, in
our consolidated financial statements in “Financial Statements and Supplementary Data” in Part II, Item 8, of this Form 10-K for financial
information and further discussions.
We have elected to treat MIC as a
corporation for federal tax purposes. As a result, all investor tax reporting with respect to distributions made is based on our being a corporation
for U.S. federal tax purposes and such reporting will be provided on Form 1099.
3
Our Manager
Our Manager is a member of the
Macquarie Group, a diversified international provider of financial, advisory and investment services. The Macquarie Group is headquartered in Sydney,
Australia and is a global leader in management of infrastructure investment vehicles on behalf of third-party investors and advising on the
acquisition, disposition and financing of infrastructure assets.
We have entered into a management
services agreement with our Manager. Our Manager is responsible for our day-to-day operations and affairs and oversees the management teams of our
operating businesses. The Company neither has, nor will have, any employees. Our Manager has assigned, or seconded, to the Company, on a permanent and
wholly dedicated basis, two of its employees to assume the offices of chief executive officer and chief financial officer and seconds or makes other
personnel available as required. The services performed for the Company are provided at our Manager’s expense, and includes the compensation of
our seconded personnel.
We pay our Manager a quarterly base
management fee based primarily on our market capitalization. Our Manager can also earn a performance fee if the quarterly total return to shareholders
(capital appreciation plus dividends) exceeds the quarterly total return of a U.S. utilities index. The performance fee is equal to 20% of the
difference between the benchmark return and the return for our shareholders. To be eligible for the performance fee, our Manager must deliver quarterly
total returns that are positive and in excess of any prior underperformance. Please see the management services agreement filed as an exhibit to this
Annual Report on Form 10-K for the full terms of this agreement.
We believe that Macquarie Group’s
demonstrated expertise and experience in the management, acquisition and funding of infrastructure businesses will provide us with a significant
advantage in pursuing our strategy. Our Manager is part of the Macquarie Funds Group, the asset management division of Macquarie globally.
Macquarie-managed entities own, operate and/or invest in a global portfolio of approximately 100 businesses including toll roads, airports and
airport-related infrastructure, ports, communications, media, electricity and gas distribution networks, water utilities, renewable energy generation,
aged care, rail and ferry assets across 24 countries.
Industry
Infrastructure businesses, in general,
tend to generate sustainable and growing cash flows resulting from relatively inelastic customer demand and strong competitive positions of the
businesses. Characteristics of infrastructure businesses include:
• |
ownership of long-lived, high-value physical assets that are difficult to replicate or substitute around; |
• |
predictable maintenance capital expenditure requirements; |
• |
consistent, relatively inelastic demand for their services, such as those provided by our energy-related businesses; |
• |
strong competitive positions, largely due to high barriers to entry, including: |
• |
high initial development and construction costs; |
• |
difficulty in obtaining suitable land; |
• |
long-term, exclusive concessions or leases and customer contracts; and |
• |
lack of cost-effective alternatives to customers in the foreseeable future; |
• |
scalability, such that relatively small amounts of growth can generate significant increases in earnings before interest, taxes, depreciation and amortization, or EBITDA; and |
• |
the provision of basic, often essential services. |
4
In addition to the benefits related to
these characteristics, the revenues generated by our infrastructure businesses generally can be expected to keep pace with inflation. The price
escalators built into customer contracts, and the inflation and cost pass-through adjustments typically a part of pricing terms in user pays businesses
or provided for by the regulatory process to regulated businesses, serve to insulate infrastructure businesses to a significant degree from the
negative effects of inflation and commodity price risk. We also employ interest rate swaps in connection with our businesses’ floating rate debt
to effectively fix our interest expense and hedge variability from interest rate change.
We focus on the ownership and operation
of infrastructure businesses in the following categories:
• |
“contracted,” such as IMTT, the revenues of which are derived from per-use or rental charges in medium-term contracts, and District Energy, a majority of the revenues of which are derived from long-term contracts with businesses and governments; |
• |
“regulated,” such as the utility operations of The Gas Company; and |
• |
“user pays,” such as Atlantic Aviation, the revenues of which are based on patronage. |
Strategy
There are three components to our
strategy:
• |
programs to improve the operating performance of each of our businesses; |
• |
a sustainable balance between distributions to our shareholders of available cash and investment in the growth of new or existing businesses; and |
• |
continued debt reduction at Atlantic Aviation to levels at which it is again prudent to distribute cash from the business to MIC. |
Our Businesses and Investments
We provide below information about our
businesses and investments, including key financial information for each business. We are disclosing earnings before interest, taxes, depreciation and
amortization (EBITDA) excluding non-cash items as defined by us. We believe EBITDA excluding non-cash items provides additional insight into the
performance of our operating businesses relative to each other and similar businesses without regard to their capital structure, and their ability to
service or reduce debt, fund capital expenditures and/or support distributions to the holding company. Additionally, EBITDA excluding non-cash items is
a key performance metric relied on by management in evaluating the performance of the Company and our operating segments. Therefore, this Annual Report
on Form 10-K discloses EBITDA excluding non-cash items in addition to the other financial information provided in accordance with GAAP. See
“Management’s Discussion and Analysis of Financial Conditions and Results of Operations — Results of Operations” in Part II, Item 7
for a reconciliation of net income (loss) to EBITDA excluding non-cash items for the Company and its operating segments.
Energy-Related Businesses
IMTT
Business Overview
We own 50% of International-Matex Tank
Terminals, or IMTT. The 50% we do not own is owned by members of the founding family. IMTT stores and handles petroleum products, various chemicals,
renewable fuels and vegetable and animal oils. IMTT is one of the largest independent providers of bulk liquid storage terminal services in the U.S.,
based on capacity.
For the year ended December 31, 2010,
IMTT generated approximately 42% of its terminal revenue and approximately 40% of its terminal gross profit at its Bayonne, New Jersey facility in New
York Harbor.
5
Energy-Related
Businesses: IMTT – (continued)
Approximately 42% of IMTT’s total terminal revenue and approximately 50% of its terminal gross profit was generated by its St. Rose, Gretna, Avondale and Geismar facilities, which together service the lower Mississippi River region (with St. Rose as the largest contributor).
IMTT also owns Oil Mop, an
environmental response and spill clean-up business. Oil Mop has a network of facilities along the U.S. Gulf Coast between Houston and New Orleans.
These facilities service predominantly the Gulf region, but also respond to spill events as needed throughout the United States and
internationally.
The table below summarizes the
proportion of the terminal revenue generated from the commodities stored at IMTT’s U.S. terminals for the year ended December 31,
2010:
| Proportion of Terminal Revenue from Major
Commodities Stored |
||||||||||||||||
|---|---|---|---|---|---|---|---|---|---|---|---|---|---|---|---|---|
| Petroleum/Asphalt |
Chemical |
Renewable/Vegetable & Animal Oil |
Other |
|||||||||||||
60% |
27% |
9% |
4% |
|||||||||||||
Financial information for 100% of this
business is as follows ($ in millions):
| As of, and for the Year Ended, December 31, |
|||||||||||||||
|---|---|---|---|---|---|---|---|---|---|---|---|---|---|---|---|
| 2010 |
2009 |
2008 |
|||||||||||||
Revenue
|
$ | 557.2 | $ | 346.2 | $ | 352.6 | |||||||||
EBITDA
excluding non-cash items |
236.8 | 147.7 | 136.6 | ||||||||||||
Total assets
|
1,221.9 | 1,064.8 | 1,006.3 | ||||||||||||
Industry Overview
Bulk liquid storage terminals provide
an essential link in the supply chain for liquid commodities such as crude oil, refined petroleum products and basic and specialized chemicals. In
addition to renting storage tanks, bulk liquid storage terminals generate revenues by offering ancillary services including product transfer
(throughput), heating and blending. Pricing for storage and other services typically reflects local supply and demand as well as the specific
attributes of each terminal including access to deepwater berths and connections to land-based infrastructure such as roads, pipelines and
rail.
Both domestic and international factors
influence demand for bulk liquid storage in the United States. Demand for storage rises and falls according to local and regional consumption, which
largely reflects the underlying economic activity over the medium term. In addition to these domestic forces, import and export activity also accounts
for a material portion of the business. Shippers require storage for the staging, aggregation and/or distribution of products before and after
shipment. The extent of import/export activity depends on macroeconomic trends such as currency fluctuations as well as industry-specific conditions,
such as supply and demand balances in different geographic regions. The medium-term length of storage contracts tends to offset short-term fluctuations
in demand for storage in both the domestic and import/export markets.
Potential entrants into the bulk liquid
storage terminal business face several substantial barriers. Strict environmental regulations, limited availability of waterfront land with the
necessary access to land-based infrastructure, local community resistance to new fuel/chemical sites, and high initial investment costs impede the
construction of new bulk liquid storage facilities. These deterrents are most formidable around New York Harbor and other waterways near major urban
centers. As a consequence, new supply is generally created by the addition of tankage to existing terminals where existing infrastructure can be
leveraged, resulting in higher returns on invested capital. However, restrictions on land use, difficulties in securing environmental permits, and the
potential for operational bottlenecks due to infrastructure constraints may limit the ability of existing terminals to expand the storage capacity of
their facilities.
6
Energy-Related
Businesses: IMTT – (continued)
Strategy
The key components of IMTT’s
strategy are to drive growth in revenue and cash flows by attracting and retaining customers who place a premium on flexibility, speed and efficiency
in bulk liquid storage and to invest, where prudent, in additional storage capacity. IMTT believes that the successful execution of this strategy will
be aided by its size, technology and service capability.
Flexibility: Operational flexibility is essential to making IMTT an attractive supplier of bulk liquid storage
services in its key markets. Its facilities operate 24/7 providing shippers, refiners, manufacturers, traders and distributors with prompt access to a
wide range of storage services. In each of its two key markets, IMTT’s scale ensures availability of sophisticated product handling and storage
capabilities along with ancillary services such as heating and blending. IMTT continues to improve its facilities’ speed and flexibility of
operations by investing in upgrades of its docks, pipelines and pumping infrastructure and facility management systems.
Investment in
Growth: IMTT seeks to increase its available storage capacity, especially in New York Harbor and the lower Mississippi
River, by building new tankage at existing facilities when supported by customer demand.
Locations
The following table summarizes the
location of each IMTT facility and the corresponding millions of barrels of storage capacity in service and ship and barge docks available for product
transfer. This information is as of December 31, 2010 and does not include tanks used in packaging, recovery tanks, and/or other storage capacity not
typically available for rent.
| Facility |
Land |
Aggregate Capacity of Storage Tanks in Service |
Number of Ship & Barge Berths in Service |
|||||||||||
|---|---|---|---|---|---|---|---|---|---|---|---|---|---|---|
| (Millions of Barrels) | ||||||||||||||
Facilities
in the United States: |
||||||||||||||
Bayonne, NJ
|
Owned |
16.0 | 20 | |||||||||||
St. Rose, LA*
|
Owned |
14.7 | 16 | |||||||||||
Gretna, LA*
|
Owned |
2.0 | 5 | |||||||||||
Avondale, LA*
|
Owned |
1.1 | 4 | |||||||||||
Geismar, LA*
|
Owned |
0.9 | 3 | |||||||||||
Lemont, IL
|
Owned/Leased |
1.0 | 1 | |||||||||||
Joliet, IL
|
Owned |
0.9 | 3 | |||||||||||
Richmond, CA
|
Owned |
0.7 | 2 | |||||||||||
Chesapeake, VA
|
Owned |
1.0 | 1 | |||||||||||
Richmond, VA
|
Owned |
0.4 | 1 | |||||||||||
Facilities
in Canada: |
||||||||||||||
Quebec City,
Quebec(1) |
Leased |
2.0 | 2 | |||||||||||
Placentia Bay,
Newfoundland(2) |
Leased |
3.0 | 2 | |||||||||||
Total
|
43.7 | 60 | ||||||||||||
* |
Collectively the “Louisiana” facilities. |
(1) |
Indirectly 66.7% owned and managed by IMTT. |
(2) |
Indirectly 20.1% owned and managed by IMTT. |
7
Energy-Related
Businesses: IMTT – (continued)
All facilities have marine access, road
access and, except for Richmond, Virginia and Placentia Bay, Newfoundland, all sites have rail access.
Bayonne, New Jersey
The 16.0 million barrel storage
terminal at Bayonne, New Jersey has the most storage capacity of any IMTT site. Located on the Kill Van Kull between New Jersey and Staten Island, the
terminal occupies a strategically advantageous position in New York Harbor, or NYH. As the largest independent bulk liquid storage facility in NYH,
IMTT-Bayonne has substantial market share for third-party storage of refined petroleum products and chemicals.
NYH serves as the main petroleum
trading hub in the northeast United States and the physical delivery point for the gasoline and heating oil futures contracts traded on New York
Mercantile Exchange (NYMEX). In addition to waterborne shipments, products reach NYH through petroleum product pipelines from the U.S. Gulf region and
elsewhere. NYH also serves as the starting point for refined product pipelines linked to inland markets and as a key port for refined petroleum product
imports. IMTT-Bayonne has connections to the Colonial, Buckeye and Harbor refined petroleum product pipelines as well as rail and road connections. As
a result, IMTT-Bayonne provides its customers with substantial logistical flexibility.
IMTT-Bayonne has the capability to
quickly load and unload the largest bulk liquid transport ships entering NYH. The U.S. Army Corp of Engineers (USACE) has dredged the Kill Van Kull
channel passing the IMTT-Bayonne docks to 45 feet (IMTT has dredged some but not all of its docks to that depth). Most competitors in NYH have
facilities located on the southern portion of the Arthur Kill (water depth of approximately 35 feet) and force large ships to transfer product through
lightering (transferring cargo to barges at anchorage) before docking. This technique substantially increases the cost of loading and unloading
vessels. This competitive advantage for Bayonne may improve as the USACE is in the process of dredging the Kill Van Kull to 50 feet (with no planned
increase in the depth of the southern portion of the Arthur Kill). Demand for third-party bulk liquid storage in NYH has remained strong during the
past several years.
St. Rose/Gretna/Avondale/Geismar
On the lower Mississippi River, IMTT
currently operates four terminals (St. Rose, Gretna, Avondale and Geismar). With combined storage capacity of 18.7 million barrels, the four sites give
IMTT substantial market share in storage for black oil, bulk liquid chemicals, and vegetable oils on the lower Mississippi River.
The Louisiana facilities give IMTT a
substantial presence in a key domestic transport hub. The lower Mississippi River serves as a major transshipment point between the central United
States and the rest of the world for exported agricultural products (such as vegetable oils) and imported commodity chemicals (such as methanol). The
region also has substantial domestic traffic related to the petroleum industry. Gulf Coast refiners send their products to other regions of the U.S.
and overseas and require storage capacity and ancillary services to facilitate distribution. IMTT’s Louisiana facilities, with their deep water
ship and barge docks as well as access to rail, road and pipeline infrastructure, are highly capable of performing these functions. Demand for
third-party bulk liquid storage on the lower Mississippi River has remained strong during the past several years.
Competition
The competitive environment in which
IMTT operates varies by terminal location. The principal competition for each of IMTT’s facilities comes from other bulk liquid storage facilities
located in the same regional market. Kinder Morgan, which owns three bulk liquid storage facilities in New Jersey and Staten Island, New York,
represents IMTT’s major competitor in the NYH market. Kinder Morgan also owns facilities along the lower Mississippi River near New Orleans. In
both the NYH and lower Mississippi River markets, IMTT operates the largest terminal by capacity which, combined with the capabilities of IMTT’s
facilities, provides IMTT with a strong competitive position in both of these key bulk liquid storage markets.
8
Energy-Related
Businesses: IMTT – (continued)
IMTT’s minor facilities in
Illinois, California and Virginia represent only a small proportion of available bulk liquid storage capacity in their respective markets and have
numerous competitors with facilities of similar or larger size and with similar capabilities.
Secondary competition for IMTT’s
facilities comes from bulk liquid storage facilities located in the same broad geographic region as IMTT’s terminals. For example, bulk liquid
storage facilities located on the Houston Ship Channel provide indirect competition for IMTT’s Louisiana facilities.
Customers
IMTT provides bulk liquid storage
services principally to vertically integrated petroleum product producers and refiners, chemical manufacturers, food processors and traders of bulk
liquid petroleum, chemical and agricultural products. BP represented more than 10% of IMTT’s consolidated revenues and accounts receivable for the
year ended and at December 31, 2010, primarily due to the non-recurring oil spill response activity in the Gulf of Mexico.
Customer Contracts
IMTT generally rents storage tanks to
customers under contracts with terms of three to five years. Pursuant to these contracts, customers generally pay for the tank storage whether they use
it or not. The contracts generally have no early termination provisions. Customers generally pay rental charges monthly at rates stated in terms of
cents per barrel of storage capacity per month. Tank rental rates vary by commodity stored and by location. IMTT’s standard form of customer
contract generally permits a certain number of free product movements into and out of the storage tank with charges for throughput exceeding the
prescribed levels. In cases where stored liquids require heating to keep viscosity at acceptable levels, IMTT generally charges the customer for the
heating with such charges essentially reflecting a pass-through of IMTT’s cost. Heating charges principally cover the cost of fuel used to produce
steam. Pursuant to IMTT’s standard form of customer contract, tank rental rates, throughput rates and the rates for other services generally
increase based on annual inflation indices. Customers retain title to products stored in the tanks and have responsibility for securing insurance
against loss. As a result, IMTT has no commodity price risk related to the liquids stored in its tanks and has limited liability from product loss.
IMTT is responsible for ensuring appropriate care of products stored at its facilities and maintains adequate insurance with respect to its
exposure.
Regulation
The rates that IMTT charges for its
services are not subject to regulation. However, a number of regulatory bodies oversee IMTT’s operations. IMTT must comply with numerous federal,
state and local environmental, occupational health and safety, security, tax and planning statutes and regulations. These regulations require IMTT to
obtain and maintain permits to operate its facilities and impose standards that govern the way IMTT operates its business. If IMTT does not comply with
the relevant regulations, it could lose its operating permits and/or incur fines and increased liability. As a result, IMTT has developed environmental
and health and safety compliance functions which are overseen by the terminal managers at the terminal level, IMTT’s Director of Environmental,
Health and Safety, Chief Operating Officer and Chief Executive Officer. While changes in environmental, health and safety regulations pose a risk to
IMTT’s operations, such changes are generally phased in over time to manage the impact on industry.
The Bayonne terminal was acquired and
expanded over a 27 year period. It has significant remediation requirements that were partially assumed at the time of purchase from the various former
owners. One former owner retained environmental remediation responsibilities for a purchased site as well as sharing other remediation costs.
Remediation efforts entail removal of the free product, groundwater control and treatment, soil treatment, repair/replacement of sewer systems, and the
implementation of containment and monitoring systems. These remediation activities are expected to continue for ten to twenty years.
9
Energy-Related
Businesses: IMTT – (continued)
The Lemont terminal has entered into a
consent order with the State of Illinois to remediate contamination at the site that pre-dated IMTT’s ownership. This remediation effort,
including the implementation of extraction and monitoring wells and soil treatment, is estimated to continue for ten to twenty years.
See “Management’s Discussion
and Analysis of Financial Condition and Results of Operations — Liquidity and Capital Resources” in Part II, Item 7 for discussion of the
expected future capitalized cost of environmental remediation.
Management
The day-to-day operations of
IMTT’s terminals are overseen by individual terminal managers who are responsible for all aspects of the operations at their respective sites.
IMTT’s terminal managers have on average 28 years experience in the bulk liquid storage industry and 17 years of service with
IMTT.
The IMTT head office in New Orleans
provides the business with central management, performs support functions such as accounting, tax, finance, human resources, insurance, information
technology and legal services and provides support for functions that have been partially de-centralized to the terminal level such as engineering and
environmental and occupational health and safety regulatory compliance. IMTT’s senior management team, other than the terminal managers, have on
average 36 years experience in the bulk liquid storage industry and 29 years service with IMTT.
The Board of IMTT Holdings consists of
six members with three appointees each from Macquarie Terminal Holdings, LLC, our wholly owned subsidiary, and our co-investor. All decisions of the
Board require majority approval, including the approval of at least one member appointed by Macquarie Terminal Holdings, LLC and one member appointed
by our co-investor. The Shareholders’ Agreement to which we became a party at the time of our investment in IMTT contains a customary list of
items that must be referred to the Board for approval. The Shareholders’ Agreement is included as an exhibit to this Annual Report on Form
10-K.
Distribution of funds to the Company
from IMTT is governed by the Shareholders’ Agreement between the Company and the co-investor that owns the remaining 50% stake. The co-investor
has refused to vote in favor of distributing these funds, and the Company believes that such a refusal violates the Shareholders’
Agreement.
As a result, the Company has formally
initiated the dispute resolution process in the Shareholders’ Agreement, and intends to proceed to arbitration with the co-investor if a
satisfactory resolution cannot be reached within the timeframe prescribed in the Shareholders’ Agreement.
Employees
As of December 31, 2010, IMTT
(excluding non-consolidated sites) had a total of 1,024 employees, including 135 employed by Oil Mop. At the Bayonne terminal, 138 employees are
unionized, 52 of the employees are unionized at the Lemont and Joliet terminals and 35 employees are unionized at the Quebec terminal. We believe
employee relations at IMTT are good.
The Gas Company
Business Overview
The Gas Company is Hawaii’s only
government franchised full-service gas company, manufacturing and distributing gas products and services in Hawaii. The market includes Hawaii’s
approximately 1.4 million residents and approximately 7.0 million visitors in 2010. The Gas Company manufactures synthetic natural gas, or SNG, for its
utility customers on Oahu, and distributes Liquefied Petroleum Gas, or LPG, to utility and non-utility customers throughout the state’s six
primary islands.
10
Energy-Related Businesses: The Gas
Company – (continued)
The Gas Company has two primary
businesses, utility (or regulated) and non-utility (or unregulated):
• |
The utility business serves approximately 35,300 customers through localized pipeline distribution systems located on the islands of Oahu, Hawaii, Maui, Kauai, Molokai and Lanai. The utility business includes the manufacture, distribution and sale of SNG on the island of Oahu and distribution and sale of LPG. Utility revenue consists principally of sales of SNG and LPG. The operating costs for the utility business include the cost of locally purchased feedstock, the cost of manufacturing SNG from the feedstock, LPG purchase costs and the cost of distributing SNG and LPG to customers. Utility sales comprised approximately 43% of The Gas Company’s total contribution margin in 2010. |
• |
The non-utility business sells and distributes LPG to approximately 33,300 customers. LPG is delivered by truck to individual tanks located on customer sites on Oahu, Hawaii, Maui, Kauai, Molokai and Lanai. Non-utility revenue is generated primarily from the sale of LPG delivered to customers. The operating costs for the non-utility business include the cost of purchased LPG and the cost of distributing the LPG to customers. Non-utility sales comprised approximately 57% of The Gas Company’s total contribution margin in 2010. |
The Gas Company’s two products,
SNG and LPG, are relatively clean-burning fuels that produce lower levels of carbon emissions than other hydrocarbon fuels such as coal or oil. This is
particularly important in Hawaii where heightened public awareness of environmental impact makes lower emission products attractive to
customers.
SNG and LPG have a wide number of
commercial and residential applications including water heating, drying, cooking, emergency power generation and tiki torches. LPG is also used as a
fuel for specialty vehicles such as forklifts. Gas customers include residential customers and a wide variety of commercial, hospitality, military,
public sector and wholesale customers.
Financial information for this business
is as follows ($ in millions):
| As of, and for the Year Ended, December 31, |
|||||||||||||||
|---|---|---|---|---|---|---|---|---|---|---|---|---|---|---|---|
| 2010 |
2009 |
2008 |
|||||||||||||
Revenue |
$ | 210.6 | $ | 175.4 | $ | 213.0 | |||||||||
EBITDA
excluding non-cash items |
44.4 | 37.6 | 27.9 | ||||||||||||
Total
assets |
350.4 | 344.9 | 330.2 | ||||||||||||
% of our
consolidated revenue |
25.0 | % | 24.7 | % | 21.8 | % | |||||||||
Strategy
The Gas Company’s long-term
strategy is to increase and diversify its customer base. The business intends to increase penetration of the residential, the expanding government
(primarily military) and the tourism-related markets. The business also intends to invest in and promote the value of The Gas Company’s products
and services and its attractiveness as a cleaner alternative to other energy sources in Hawaii.
As a second component of its strategy,
The Gas Company intends to diversify its sources of feedstock and LPG to ensure reliable supply and to mitigate any potential cost increases to its
customers. The Gas Company is exploring other clean and renewable energy alternatives that may be distributed using its existing
infrastructure.
The Gas Company also recognizes the
important role it plays in the local community and, as a component of its strategy, will focus on maintaining good relationships with regulators,
governments and the communities it serves.
11
Energy-Related Businesses: The Gas
Company – (continued)
Products
While the mainland U.S. obtains natural
gas from wells drilled into underground reservoirs of porous rock, Hawaii relies solely on manufactured and imported alternatives. Hawaii has no
natural gas reserves.
Synthetic Natural
Gas. The business converts a light hydrocarbon feedstock (currently naphtha) to SNG. The product is chemically similar in
most respects to natural gas and has a similar heating value on a per cubic foot basis. The Gas Company has the only SNG manufacturing capability in
Hawaii at its plant located on the island of Oahu. SNG is delivered by underground piping systems to customers on Oahu.
Liquefied Petroleum
Gas. LPG is a generic name for a mixture of hydrocarbon gases, typically propane and butane. LPG liquefies at a relatively
low pressure under normal temperature conditions. As a result, LPG can be stored or transported more easily than natural or synthetic natural gas. LPG
is typically transported in cylinders or tanks. Domestic and commercial applications of LPG are similar to those of natural gas and synthetic natural
gas.
Utility Regulation
The Gas Company’s utility business
is regulated by the Hawaii Public Utilities Commission, or HPUC, while the business’ non-utility business is not. The HPUC exercises broad
regulatory oversight and investigative authority over all public utility companies in the state of Hawaii.
Rate
Regulation. The HPUC establishes the rates that The Gas Company can charge its utility customers via cost of service
regulation. The rate approval process is intended to ensure that a public utility has a reasonable opportunity to recover costs that are prudently
incurred and earn a fair return on its investments, while protecting consumer interests.
Although the HPUC sets the base rate
for the SNG and LPG sold by The Gas Company’s utility business, the business is permitted to pass through changes in its raw materials cost by
means of a monthly fuel adjustment charge, or FAC. The adjustment protects the business’ earnings from volatility in feedstock commodity
costs.
The business’ utility rates are
established by the HPUC in periodic rate cases typically initiated by The Gas Company. The business initiates a rate case by submitting a request to
the HPUC for an increase in rates based, for example, upon materially higher costs related to providing the service. Following initiation of the rate
increase request by The Gas Company and submission by the Division of Consumer Advocacy and other intervening parties of their positions on the rate
request, and potentially an evidentiary hearing, the HPUC issues a decision establishing the revenue requirements and the resulting rates that The Gas
Company will be allowed to charge.
Other
Regulations. The HPUC regulates all franchised or certificated public service companies operating in Hawaii; prescribes
rates, tariffs, charges and fees; determines the allowable rate of earnings in establishing rates; issues guidelines concerning the general management
of franchised or certificated utility businesses; and acts on requests for the acquisition, sale, disposition or other exchange of utility properties,
including mergers and consolidations. When we acquired The Gas Company, we agreed to 14 regulatory conditions with the HPUC that address a variety of
matters including: a requirement that the ratio of consolidated debt to total capital for The Gas Company, LLC and HGC Holdings LLC, or HGC, does not
exceed 65%; and a requirement to maintain $20.0 million in readily-available cash resources at The Gas Company, HGC or MIC.
Competition
Depending upon the end-use, the
business competes with electricity, diesel, solar energy, geo-thermal, wind, other gas providers and alternative energy sources. Hawaii’s
electricity is generated by four electric utilities and various non-utility generators.
12
Energy-Related Businesses: The Gas
Company – (continued)
Utility
Business. The Gas Company holds the only government franchise for regulated gas services in Hawaii. This enables it to
utilize public easements for its pipeline distribution systems. This franchise also provides protection from competition within the same gas-energy
sector since the business has developed and owns extensive below-ground distribution infrastructure. The costs associated with developing distribution
infrastructure are significant. However, in most instances, the business’ utility customers also have the ability to use non-utility gas supplied
by The Gas Company or its competitors by using LPG tanks.
Non-Utility
Business. The Gas Company also sells LPG in an unregulated market on the six primary islands of Hawaii. There are two other
wholesale companies and several small retail distributors that share the LPG market. The Gas Company believes it has a competitive advantage because of
its established customer base, storage facilities, distribution network and reputation for reliable service.
Fuel Supply, SNG Plant and Distribution
System
Fuel Supply
The business obtains its LPG from
foreign sources and each of the Chevron and Tesoro oil refineries located on Oahu. The Gas Company has LPG supply agreements with each refinery. The
business purchases its LPG from foreign sources under foreign supply agreements and through spot-market purchases, if needed.
In 2010, Chevron considered converting
its Hawaii refinery to a storage terminal. Chevron concluded that it would continue operating as a refinery in Hawaii; however, Chevron has publicly
stated that it is considering other alternatives for this facility. Chevron’s Hawaii refinery supplied The Gas Company with approximately
one-third of its total LPG purchases in 2010. The refinery also supplies the business’ principal competitor in the non-utility
market.
Any decision by Chevron regarding its
operations in Hawaii could affect the business’ cost of LPG and may adversely impact its non-utility contribution margin and profitability. In an
effort to mitigate the risk of supply disruption and/or a potential increase in costs, the business has been evaluating a number of alternatives,
including additional shipments of foreign sourced product and additional storage.
The business also obtains its feedstock
and fuel for SNG production, naphtha, from the Tesoro refinery on Oahu. The Gas Company has an agreement with Tesoro that expires August 31, 2011. The
agreement was effective as of September 1, 2010 and remains subject to final HPUC approval expected by mid-2011. Under the rate structures in place in
Hawaii, The Gas Company expects its utility business will have the ability to pass fluctuations in the cost of feedstock through to its
customers.
SNG Plant and Distribution System (Utility
Business)
The Gas Company manufactures SNG at its
plant located west of the Honolulu business district. The SNG plant has an estimated remaining economic life of approximately 20 years. The economic
life of the plant may be extended with additional capital investment.
A 22-mile transmission pipeline links
the SNG plant to a distribution system that ends at Pier 38 in south Oahu. From Pier 38 a pipeline distribution system consisting of approximately 900
miles of distribution and service pipelines takes the gas to customers. Additionally, LPG is trucked to holding tanks on Oahu and shipped by barge to
the neighboring islands where it is distributed via pipelines to utility customers that are not connected to the Oahu SNG pipeline system.
Approximately 90% of the business’ pipeline system is on Oahu.
Distribution System (Non-Utility
Business)
The non-utility business provides gas
on all six primary islands to customers that are not connected to the business’ utility pipeline system. The majority of The Gas Company’s
non-utility customers are on the neighboring islands. LPG is distributed to the neighboring islands by direct deliveries from overseas
suppliers
13
Energy-Related Businesses: The Gas
Company – (continued)
and by barge delivery. The business also owns the infrastructure to distribute LPG to its customers, such as harbor pipelines, trucks, several holding facilities and storage base-yards on Kauai, Maui and Hawaii.
Employees and Management
As of December 31, 2010, The Gas
Company had 315 employees, of which 213 are unionized. The unionized employees are subject to a collective bargaining agreement that expires on April
30, 2013. The business believes it has a good relationship with the union and there have been no major disruptions in operations due to labor matters
for over 30 years. Management of the business is headquartered in Honolulu, Oahu with branch office management at operating locations.
Environmental Matters
Environmental
Permits: Gas manufacturing requires environmental operating permits. The most significant are air and wastewater permits
that are required for the SNG plant. The Gas Company is in compliance in all material respects with all applicable provisions of these
permits.
Environmental
Compliance: The business believes that it is in compliance in all material respects with applicable state and federal
environmental laws and regulations. Under normal operating conditions, its facilities do not generate hazardous waste. Hazardous waste, when produced,
poses little ongoing risk to the facilities from a regulatory standpoint because SNG and LPG dissipates quickly if released.
District Energy
Business Overview
Through December 22, 2009, District
Energy consisted of a 100% ownership of Thermal Chicago and a 75% interest in Northwind Aladdin and all of the senior debt of Northwind Aladdin. The
remaining 25% equity interest in Northwind Aladdin is owned by Nevada Electric Investment Company, or NEICO, an indirect subsidiary of NV Energy, Inc.
On December 23, 2009, we sold 49.99% of our membership interests in District Energy to John Hancock Life Insurance Company and John Hancock Life
Insurance Company (U.S.A.) (collectively “John Hancock”) for $29.5 million. The financial results discussed below reflect 100% of District
Energy’s full year performance.
District Energy operates the largest
district cooling system in the United States. The system currently serves approximately 100 customers in downtown Chicago under long-term contracts and
one customer outside the downtown area. District Energy produces chilled water at five plants located in downtown Chicago and distributes it through a
closed loop of underground piping for use in the air conditioning systems of large commercial, retail and residential buildings in the central business
district. The first of the plants became operational in 1995, and the most recent came on line in June 2002. With modifications made in 2009, the
downtown system has the capacity to produce approximately 92,000 tons of chilled water, although it has approximately 103,000 tons of cooling under
contract. The business is able to sell continuous service capacity in excess of the total system capacity because not all customers use their full
capacity at the same time.
District Energy also owns a
site-specific heating and cooling plant that serves a single customer in Chicago outside the downtown area. This plant has the capacity to produce
4,900 tons of cooling and 58 million British Thermal Units, or BTUs, of heating per hour.
District Energy’s Las Vegas
operation owns and operates a stand-alone facility that provides cold and hot water (for chilling and heating, respectively) to three customers in Las
Vegas, Nevada. These customers consist of a resort and casino, a condominium that began receiving full service in February 2010 and a shopping complex.
The three customers represent approximately 48%, 45% and 7% of the Las Vegas operation’s cash flows, respectively. All three Las Vegas contracts
expire in February 2020. The Las Vegas operation represented approximately 25% of the cash flows of District Energy in 2010.
14
Energy-Related Businesses: District
Energy – (continued)
Financial information for 100% of this
business is as follows ($ in millions):
| As of, and for the Year Ended, December 31, |
|||||||||||||||
|---|---|---|---|---|---|---|---|---|---|---|---|---|---|---|---|
| 2010 |
2009 |
2008 |
|||||||||||||
Revenue
|
$ | 56.8 | $ | 48.6 | $ | 48.0 | |||||||||
EBITDA
excluding non-cash items |
22.8 | 20.8 | 21.1 | ||||||||||||
Total assets
|
228.5 | 234.8 | 227.1 | ||||||||||||
% of our
consolidated revenue |
6.8 | % | 6.8 | % | 4.9 | % | |||||||||
Industry Overview
District energy systems provide chilled
water, steam and/or hot water from a centralized plant through underground piping for cooling and heating purposes. A typical district energy customer
is the owner/manager of a large office or residential building or facilities such as hospitals, universities or municipal buildings. District energy
systems exist in many major North American and European cities and some have been in operation for over 100 years.
Strategy
District Energy’s strategy is to
position the business in the market as the most effective and value-added method of providing building chilled water such that it attracts and connects
new customers to the system and can invest in further expansion. We believe that District Energy will continue to generate consistent revenue and
stable cash flows as a result of the long-term contractual relationships with its customers and the management team’s proven ability to improve
the operating performance of the business.
Growth: This business intends to grow revenue and profits by marketing its services to developers in the
downtown Chicago market. Its value proposition is centered on high reliability, ease of operation and maintenance. The management team develops and
maintains relationships with property developers, engineers, architects and city planners as a means of keeping District Energy and these attributes
“top of mind” when they select among building cooling systems and services.
Business
Management: The business focuses on minimizing the cost of electricity consumed per unit of chilled water produced by its
plants. District Energy is able to maintain and potentially increase its competitive advantage over self cooling by consuming electricity efficiently.
District Energy has the ability to create ice during off-peak hours when electricity costs are typically lower. District Energy uses the cold energy in
the ice to produce chilled water during the day when electricity prices are typically higher. The resulting cost savings are passed through to its
customers.
System
Expansion: Since our acquisition in 2004, system modifications and expansion at the business’ plants have increased
total cooling capacity by approximately 15,000 tons or 15%. Projects currently under development will further expand the system capability and
accommodate an expected increase in demand for district cooling in Chicago.
Operations
Maintenance is typically performed by
qualified contract personnel and off-season maintenance is performed by a combination of plant staff and contract personnel. The majority of preventive
maintenance is conducted off-season.
15
Energy-Related Businesses: District
Energy – (continued)
Customers
District Energy currently serves
approximately 100 customers in downtown Chicago and one outside the downtown area. Its customer base is diverse and consists of retail stores, office
buildings, residential buildings, theaters and government facilities. Office and commercial buildings constitute approximately 70% of its customer
base. No one customer accounts for more than 10% of total contracted capacity at December 31, 2010.
The business typically enters into
contracts with the owners of the buildings to which the chilled water service is provided. The weighted average life of customer contracts as of
December 31, 2010 is approximately 9 years. The majority require a termination payment if a customer wishes to terminate a contract early or if the
business terminates the contract for customer default. The termination payment allows the business to recover the remaining capital that it invested to
provide service to the customer.
Customers pay two charges to receive
chilled water services: a fixed capacity charge and a variable consumption charge. The capacity charge is a fixed monthly amount based on the maximum
number of tons of chilled water that the business has contracted to make available to the customer at any point in time whether they use it or not. The
consumption charge is a variable amount based on the volume of chilled water actually used during a billing period.
Contractual adjustments to the capacity
charge and consumption charge occur periodically, typically annually. Capacity charges generally increase at a fixed rate or are indexed to the
Consumer Price Index, or CPI, as a broad measure of inflation. Consumption payments generally increase in line with a number of indices that reflect
the cost of electricity, labor and other input costs relevant to the operations of the business. The largest and most variable direct expense of the
operation is electricity. District Energy passes through to its customers changes in electricity costs. The business focuses on minimizing the cost of
electricity consumed per unit of chilled water produced by operating its plants to maximize efficient use of electricity.
Seasonality
Consumption revenue is higher in the
summer months when the demand for chilled water is at its highest. Approximately 80% of consumption revenue is received in the second and third
quarters combined each year.
Competition
District Energy is not subject to
substantial competitive pressures. Customers are generally not allowed to cool their premises by means other than the chilled water service the
business provides. In addition, the primary alternative available to building owners is the installation of a stand-alone water chilling system
(self-cooling). While competition from self-cooling exists, the business expects that the vast majority of its current contracts will be renewed at
maturity. Installation of a water chilling system can require significant building reconfiguration as well as space for reconfiguration, and capital
expenditure, whereas District Energy has the advantage of economies of scale in terms of efficiency, staff and electricity
procurement.
District Energy believes competition
from an alternative district energy system in the Chicago downtown market is unlikely. There are significant barriers to entry including the
considerable capital investment required, the need to obtain City of Chicago consent and the difficulty in obtaining sufficient customers given the
number of buildings in downtown Chicago already committed under long-term contracts to use its system.
City of Chicago Use Agreement
The business is not subject to specific
government regulation, but its downtown Chicago system operates under the terms of a Use Agreement with the City of Chicago. The Use Agreement
establishes the rights and obligations of District Energy and the City of Chicago with respect to its use of the public ways. Under the Use Agreement,
the business has a non-exclusive right to construct, install, repair, operate and maintain the
16
Energy-Related Businesses: District
Energy – (continued)
plants, facilities and piping essential in providing district cooling chilled water service to customers. During 2008, the Chicago City Council extended the term of the Use Agreement for an additional 20 years until December 31, 2040. Any proposed renewal, extension or modification of the Use Agreement will be subject to the approval by the City Council of Chicago.
Management
The day-to-day operations of District
Energy are managed by a team located in Chicago, Illinois. The management team has a broad range of experience that includes engineering, construction
and project management, business development, operations and maintenance, project consulting, energy performance contracting and retail electricity
sales. The team also has significant financial and accounting experience.
The business is governed by a board of
directors on which we have three representatives and our co-shareholder has two. Although we control decisions that require a simple majority, certain
issues require super majority approval including sale or other disposal of all or substantially all of the business’ property or assets, entry
into a new line of business, modifications of constituent or governing documents and pursuit of an initial public offering of any membership
interests.
Employees
As of December 31, 2010, District
Energy had 40 full-time employees and one part-time employee. In Chicago, 27 plant staff members are employed under a three-year collective bargaining
agreement expiring on January 14, 2012. In Las Vegas, 6 plant staff members are employed under a four-year labor agreement expiring on March 31, 2013.
We believe employee relations at District Energy are good.
Aviation-Related Business
Atlantic Aviation
Business Overview
The business, Atlantic Aviation,
operates fixed-based operations, or FBOs, at 66 airports and one heliport throughout the United States. Atlantic Aviation’s FBOs provide fueling
and fuel-related services, aircraft parking and hangar services to owners/operators of jet aircraft, primarily in the general aviation sector of the
air transportation industry, but also commercial, military, freight and government aviation customers.
Financial information for this business
is as follows ($ in millions):
| As of, and for the Year Ended, December 31, |
|||||||||||||||
|---|---|---|---|---|---|---|---|---|---|---|---|---|---|---|---|
| 2010 |
2009 |
2008 |
|||||||||||||
Revenue
|
$ | 573.4 | $ | 486.1 | $ | 716.3 | |||||||||
EBITDA
excluding non-cash items |
117.5 | 106.5 | 137.1 | ||||||||||||
Total assets
|
1,410.1 | 1,473.2 | 1,660.8 | ||||||||||||
% of our
consolidated revenue |
68.2 | % | 68.5 | % | 73.3 | % | |||||||||
Industry Overview
FBOs predominantly service the general
aviation segment of the air transportation industry. General aviation includes corporate and leisure flying and does not include commercial air
carriers or military operations. Local airport authorities, the owners of the airport property, grant FBO operators the right to provide fueling and
other services pursuant to a long-term ground lease. Fuel sales provide the majority of an FBO’s revenue and gross profit.
17
Aviation-Related Business: Atlantic
Aviation – (continued)
FBOs generally operate in environments
with high barriers to entry. Airports often have limited physical space for additional FBOs. Airport authorities generally do not have an incentive to
add additional FBOs unless there is a significant demand for additional capacity, as profit-making FBOs are more likely to reinvest in the airport and
provide a broad range of services, thus attracting increased airport traffic. The increased traffic tends to generate additional revenue for the
airport authority in the form of landing and fuel flowage fees. Government approvals and design and construction of a new FBO can also take significant
time.
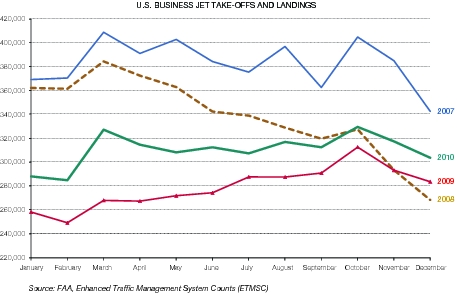
Demand for FBO services is driven by
the level of general aviation aircraft activity. General aviation activity level can be measured by the number of take-offs and landings in a given
period. General aviation business jet take-offs and landings increased in 2010. According to flight data reported by the Federal Aviation
Administration, or “FAA”, take-offs and landings increased 6.9% and 11.3% in the fourth quarter and the year ended December 31, 2010,
respectively, as compared to the prior comparable periods. However, as stated by the FAA on their website, the data has several limitations and
challenges. Nonetheless, the business believes it is a useful directional tool to assess trends in the general aviation sector. The business believes
business jet traffic will continue to expand if economic activity continues to recover.
Strategy
Atlantic Aviation is pursuing a
strategy that has five principal components. The first component encompasses an overarching commitment to provide superior service and safety to its
customers. The second component is to continue to reduce debt. The third component addresses organic growth of the business and focuses on leveraging
the size of the Atlantic Aviation network and its information technology capabilities to identify marketing leads and implement cross-selling
initiatives. The fourth is to aggressively manage the business so as to minimize, to the extent possible, its operating expenses. The fifth is to
optimize the portfolio through selective site acquisition and divestitures. These components are discussed in greater detail in the Operations
and Marketing sections below.
18
Aviation-Related Business: Atlantic
Aviation – (continued)
Operations
The business has high-quality
facilities and focuses on attracting customers who desire a high level of personal service. Fuel and fuel-related services generated 79% of Atlantic
Aviation’s revenue and accounted for 65% of Atlantic Aviation’s gross profit in 2010. Other services, including de-icing, aircraft parking,
hangar rental and catering, provided the balance. Fuel is stored in fuel tank farms and each FBO operates refueling vehicles owned or leased by the
FBO. The FBO either owns or has access to the fuel storage tanks to support its fueling activities. At some of Atlantic Aviation’s locations,
services are also provided to commercial carriers. These may include refueling from the carrier’s own fuel supplies stored in the carrier’s
fuel farm, de-icing and/or ground and ramp handling services.
Atlantic Aviation buys fuel at a
wholesale price and sells fuel to customers at a contracted price, or at a price negotiated at the point of purchase. While fuel costs can be volatile,
Atlantic Aviation generally passes fuel cost changes through to customers and attempts to maintain and, when possible, grow a dollar-based margin per
gallon of fuel sold. Atlantic Aviation also fuels aircraft with fuel owned by other parties and charges customers a service fee.
Atlantic Aviation has limited exposure
to commodity price risk as it generally carries a limited inventory of jet fuel on its books and passes fluctuations in the wholesale cost of fuel
through to its customers.
Atlantic Aviation is particularly
focused on managing costs effectively. In light of the recent slowdown in general aviation activity, initiatives have been implemented that have
reduced operating costs by more than $30.0 million per year. These cost savings did not impair Atlantic’s ability to continue to deliver superior
customer service. Atlantic Aviation will continue to evaluate opportunities to reduce expenses through, for example, business reengineering, more
efficient purchasing and capturing synergies resulting from acquisitions.
Atlantic Aviation has recently
completed a strategic review of its portfolio of FBOs. During this process, the business concluded that several of its sites did not have sufficient
scale or serve a market with sufficiently strong growth prospects to warrant continued operations at these sites. As a result, Atlantic Aviation has
undertaken to exit certain markets and redeploy resources that may be made available in the process into markets which it views as having better growth
profiles. Consistent with this, Atlantic Aviation anticipates opening a new FBO that is currently under construction at Will Rogers Airport in Oklahoma
City in May of 2011. Atlantic Aviation expects to pursue opportunities to acquire or develop additional FBOs on an opportunistic basis over the coming
year.
Locations
Atlantic Aviation’s FBO facilities
operate pursuant to long-term leases from airport authorities or local government agencies. The business and its predecessors have a strong history of
successfully renewing leases, and have held some leases for over 40 years.
The existing leases have a weighted
average remaining length of 16.8 years including extension options. The leases at 13 of Atlantic Aviation’s FBOs, accounting for 13.2% of
Atlantic’s gross profit, will expire within the next five years. No individual FBO generates more than 10% of the gross profit of the business at
December 31, 2010.
The airport authorities have
termination rights in each of Atlantic Aviation’s leases. Standard terms allow for termination if Atlantic Aviation defaults on the terms and
conditions of the lease, abandons the property or becomes insolvent or bankrupt. Less than ten leases may be terminated with notice by the airport
authority for convenience or other similar reasons. In each of these cases, there are compensation agreements or obligations of the authority to make
best efforts to relocate the FBO. Most of the leases allow for termination if liens are filed against the property.
19
Aviation-Related Business: Atlantic
Aviation – (continued)
Marketing
Atlantic Aviation has a number of
marketing programs, each utilizing an internally-developed point-of-sale system that tracks general aviation flight movements. One program supports
flight tracking and provides customer relationship management data that facilitates upselling of fuel and optimization of revenue per
customer.
Another program is a loyalty scheme for
pilots known as “Atlantic Awards”. Atlantic Awards has gained wide acceptance among pilots. These awards are recorded as a reduction in
fuel-revenue in Atlantic Aviation’s consolidated financial statements.
Competition
Atlantic Aviation competes with other
FBO operators at about half of its locations. The FBOs compete on the basis of location of the facility relative to runways and street access, service,
value-added features, reliability and price. To a lesser extent, each FBO also faces competitive pressure from the fact that aircraft may take on
sufficient fuel at one location and not need to refuel at a specific destination. FBO operators also face indirect competition from facilities located
at nearby airports.
Atlantic Aviation believes there are
fewer than 10 competitors with operations at five or more U.S. airports. These include Signature Flight Support, Landmark Aviation and Million Air
Interlink. Other than Signature, these competitors are privately owned. Atlantic Aviation’s aggregate market share at the airports on which it
operates increased in 2010.
Regulation
The aviation industry is overseen by a
number of regulatory bodies, but primarily the FAA. The business is also regulated by the local airport authorities through lease contracts with those
authorities. The business must comply with federal, state and local environmental statutes and regulations associated in part with the operation of
underground fuel storage tanks. These requirements include, among other things, tank and pipe testing for tightness, soil sampling for evidence of
leaking and remediation of detected leaks and spills. Atlantic Aviation’s FBO operations are subject to regular inspection by federal and local
environmental agencies and local fire and airline quality control departments. The business does not expect that compliance and related remediation
work will have a material negative impact on earnings or the competitive position of Atlantic Aviation. The business has not received notice requiring
it to cease operations at any location or of any abatement proceeding by any government agency as a result of failure to comply with applicable
environmental laws and regulations.
Management
The day-to-day operations of Atlantic
Aviation are managed by individual site managers who are responsible for all aspects of the operations at their site. Responsibilities include ensuring
that customer requirements are met by the staff employed at the site and that revenue is collected, and expenses incurred, in accordance with internal
guidelines. Local managers are, within the specified guidelines, empowered to make decisions as to fuel pricing and other services, thereby improving
responsiveness and customer service. Local managers within a geographic region are supervised by one of four regional managers covering the United
States.
Atlantic Aviation’s operations are
overseen by senior personnel with an average of approximately 20 years experience each in the aviation industry. The business management team has
established close and effective working relationships with local authorities, customers, service providers and subcontractors. The team is responsible
for overseeing the FBO operations, setting strategic direction and ensuring compliance with all contractual and regulatory
obligations.
20
Aviation-Related Business: Atlantic
Aviation – (continued)
Atlantic Aviation’s head office is
in Plano, Texas. The head office provides the business with overall management and performs centralized functions including accounting, information
technology, risk management, human resources, payroll and insurance arrangements. We believe Atlantic Aviation’s head office facilities are
adequate to meet its present and foreseeable operational needs.
Atlantic Aviation’s management is
evaluating various options to optimize Atlantic’s FBO portfolio. These options include selective dispositions at locations where Atlantic’s
operations are sub-scale relative to their markets, and redeployment of sales proceeds in new or existing markets with attractive growth
prospects.
Employees
As of December 31, 2010, the business
employed 1,721 people across all of its sites. Approximately 8.1% of the employee population is covered by collective bargaining agreements. We believe
employee relations at Atlantic Aviation are good.
Our Employees — Consolidated
Group
As of December 31, 2010, we employed
approximately 2,100 people across our three ongoing, consolidated businesses (excluding IMTT) of which approximately 18% were subject to collective
bargaining agreements. The Company itself does not have any employees.
21
AVAILABLE INFORMATION
We file annual, quarterly and current
reports, proxy statements and other information with the SEC. You may read and copy any document we file with the SEC at the SEC’s public
reference room at 100 F Street, NE, Washington, DC 20549. Please call the SEC at 1-800-SEC-0330 for information on the operations of the public
reference room. The SEC maintains a website that contains annual, quarterly and current reports, proxy and information statements and other information
that issuers (including Macquarie Infrastructure Company LLC) file electronically with the SEC. The SEC’s website is
www.sec.gov.
Our website is
www.macquarie.com/mic. You can access our Investor Center through this website. We make available free of charge, on or through our Investor
Center, our proxy statements, annual reports to shareholders, annual reports on Form 10-K, quarterly reports on Form 10-Q, current reports on Form 8-K
and any amendments to these filed or furnished pursuant to Section 13(a) or 15(d) of the Securities Exchange Act of 1934, or the Exchange Act, as
amended, as soon as reasonably practicable after such material is electronically filed with, or furnished to, the SEC. We also make available through
our Investor Center statements of beneficial ownership of the LLC interests filed by our Manager, our directors and officers, any holders of 10% or
more of our LLC interests outstanding and others under Section 16 of the Exchange Act.
You can also find information on the
Governance page on our website where we post documents including:
• |
Third Amended and Restated Operating Agreement of Macquarie Infrastructure Company; |
• |
Amended and Restated Management Services Agreement, as further amended; |
• |
Corporate Governance Guidelines; |
• |
Code of Ethics and Conduct; |
• |
Charters for our Audit Committee, Compensation Committee and Nominating and Corporate Governance Committee; |
• |
Policy for Shareholder Nomination of Candidates to Become Directors of Macquarie Infrastructure Company; and |
• |
Information for Shareholder Communication with our Board of Directors, our Audit Committee and our Lead Independent Director. |
Our Code of Ethics and Conduct applies
to all of our directors, officers and employees as well as all directors, officers and employees of our Manager involved in the management of the
Company and its businesses. We will post any amendments to the Code of Ethics and Conduct, and any waivers that are required to be disclosed by the
rules of either the SEC or the New York Stock Exchange (“NYSE”), on our website. The information on our website is not incorporated by
reference into this report.
You can request a copy of these
documents at no cost, excluding exhibits, by contacting Investor Relations at 125 West 55 th Street, New York, NY 10019 (212-231-1000).
22
ITEM 1A. RISK FACTORS
An investment in our LLC interests
involves a number of risks. Any of these risks could result in a significant or material adverse effect on our results of operations or financial
condition and a corresponding decline in the market price of the LLC interests.
Risks Related to Our Business
Operations
We own, and may acquire in the future, investments in which we share voting control with third parties and, consequently, our ability to
exercise significant influence over the business or level of their distributions to us may be limited.
We own 50% of IMTT and 50.01% of
District Energy and may acquire less than majority ownership in other businesses in the future. Our ability to influence the management of jointly
owned businesses, and the ability of these businesses to continue operating without disruption, depends on our reaching agreement with our co-investors
and reconciling investment and performance objectives for these businesses. Our co-investors may become bankrupt or may have economic or other business
interests that are inconsistent with our interests and goals. To the extent that we are unable to agree with co-investors regarding the business and
operations of the relevant investment, the performance of the investment and the operations may suffer, we may not receive anticipated distributions or
such distributions may be delayed and there may be a material adverse impact on our results. In addition, we may become involved in costly litigation
or other dispute resolution procedures to resolve disagreements with our co-investors, which would divert management’s attention.
Furthermore, we may, from time to time,
own non-controlling interests in investments. Management and controlling shareholders of these investments may develop different objectives than we
have and we may be unable to control the timing or amount of distributions we receive from these investments. Our inability to exercise significant
influence over the operations, strategies and policies of non-controlled investments means that decisions could be made that could adversely affect our
results and our ability to generate cash and pay distributions on our LLC interests. See also “Risks Related to IMTT — We share ownership
and voting control of IMTT with a third party. Our ability to exercise significant influence over the business or level of distributions from IMTT is
limited, and we may be negatively impacted by disagreements with our co-investor regarding IMTT’s business and
operations.”
Our holding company structure may limit our ability to make
regular distributions in the future to our shareholders because we will rely on the cash flows and distributions from our
businesses.
The Company is a holding company with
no operations. Therefore, it is dependent upon the ability of our businesses and investments to pay dividends and make distributions to the Company to
enable it to meet its expenses, and to make distributions to shareholders in the future. The ability of our operating subsidiaries and the businesses
in which we will hold investments to make distributions to the Company is subject to limitations based on their operating performance, the terms of
their debt agreements and the applicable laws of their respective jurisdictions. In addition, the ability of each business to reduce its outstanding
debt will be similarly limited by its operating performance, as discussed below and in Part II, Item 7, “Management’s Discussion and Analysis
of Financial Condition and Results of Operations.”
The recent economic recession and adverse equity and credit
market conditions may have a material adverse effect on our results of operations, our liquidity or our ability to obtain credit on acceptable
terms.
We have recently experienced the worst
economic period since the Great Depression. The equity and credit markets experienced volatility and disruption. In some cases, the markets exerted
downward pressure on the availability of liquidity and credit capacity. Should the credit and financial market conditions become disrupted again, our
ability to raise equity or obtain capital, to repay or refinance credit facilities at maturity, pay significant capital expenditures or fund growth, is
likely to be costly and/or impaired. Our access to debt financing in particular will depend on a variety of factors such as market conditions, the
general availability of credit, the overall availability of credit to our industry, our credit history and credit capacity, as well as the historical
performance of our businesses and lender perceptions of their and our financial prospects. In the
23
event we are unable to obtain debt financing, particularly as significant credit facilities mature, our internal sources of liquidity may not be sufficient.
The current economic recession also
increases our counterparty risk, particularly in those businesses whose revenues are determined under multi-year contracts, such as IMTT and District
Energy. In this environment, we would expect to see increases in counterparty defaults and/or bankruptcies, which could result in an increase in bad
debt expense and may cause our operating results to decline.
The volatility in the financial markets
makes projections regarding future obligations under pension plans difficult. Two of our businesses, The Gas Company and IMTT, have defined benefit
retirement plans. Future funding obligations under those plans depend in large part on the future performance of plan assets and the mix of investment
assets. Our defined benefit plans hold a significant amount of equity securities as well as fixed income securities. If the market values of these
securities decline or if interest rates decline, our pension expense and cash funding requirements would increase and, as a result, could materially
adversely affect our results and liquidity.
If borrowing costs increase or if debt terms become more restrictive, the cost of refinancing and servicing our debt will increase,
reducing our profitability and ability to freely deploy free cash flow.
The majority of indebtedness at our
businesses matures within three to four years. Refinancing this debt may result in substantially higher interest rates or margins or substantially more
restrictive covenants. Either event may limit operational flexibility or reduce dividends and/or distributions from our operating businesses to us,
which would have an adverse impact on our ability to freely deploy free cash flow. We also cannot provide assurance that we or the other owners of any
of our businesses will be able to make capital contributions to repay some or all of the debt if required.
The debt facilities at our businesses
contain terms that become more restrictive over time, with stricter covenants and increased amortization schedules. Those terms will limit our ability
to freely deploy free cash flow.
Our businesses are subject to environmental risks that may impact our future profitability.
Our businesses (including businesses in
which we invest) are subject to numerous statutes, rules and regulations relating to environmental protection. Atlantic Aviation is subject to
environmental protection requirements relating to the storage, transport, pumping and transfer of fuel, and District Energy is subject to requirements
relating mainly to its handling of significant amounts of hazardous materials. The Gas Company is subject to risks and hazards associated with the
refining, handling, storage and transportation of combustible products. These risks could result in substantial losses due to personal injury, loss of
life, damage or destruction of property and equipment and environmental damage. Any losses we face could be greater than insurance levels maintained by
our businesses, which could have an adverse effect on their and our financial results. In addition, disruptions to physical assets could reduce our
ability to serve customers and adversely affect sales and cash flows.
IMTT’s operations in particular
are subject to complex, stringent and expensive environmental regulation and future compliance costs are difficult to estimate with certainty. IMTT
also faces risks relating to the handling and transportation of significant amounts of hazardous materials. Failure to comply with regulations or other
claims may give rise to interruptions in operations and civil or criminal penalties and liabilities that could adversely affect the profitability of
this business and the distributions it makes to us, as could significant unexpected compliance costs. Further, these rules and regulations are subject
to change and compliance with any changes that could result in a restriction of the activities of our businesses, significant capital expenditures
and/or increased ongoing operating costs.
A number of the properties owned by
IMTT have been subject to environmental contamination in the past and require remediation for which IMTT is liable. These remediation obligations exist
principally at IMTT’s Bayonne and Lemont facilities and could cost more than anticipated or could be incurred earlier than anticipated or both. In
addition, IMTT may discover additional environmental contamination at its Bayonne, Lemont or other facilities that may require remediation at
significant cost to IMTT. Further, the past
24
contamination of the properties owned by IMTT, including by former owners or operators of such properties, could result in remediation obligations, personal injury, property damage, environmental damage or similar claims by third parties.
We may also be required to address
other prior or future environmental contamination, including soil and groundwater contamination that results from the spillage of fuel, hazardous
materials or other pollutants. Under various federal, state, local and foreign environmental statutes, rules and regulations, a current or previous
owner or operator of real property may be liable for noncompliance with applicable environmental and health and safety requirements and for the costs
of investigation, monitoring, removal or remediation of hazardous materials. These laws often impose liability, whether or not the owner or operator
knew of, or was responsible for, the presence of hazardous materials. Persons who arrange for the disposal or treatment of hazardous materials may also
be liable for the costs of removal or remediation of those materials at the disposal or treatment facility, whether or not that facility is or ever was
owned or operated by that person and whether or not the original disposal or treatment activity accorded with all regulatory requirements. The presence
of hazardous materials on a property could result in personal injury, loss of life, damage or destruction of property and equipment, environmental
damage and/or claims by third parties that could have a material adverse effect on our financial condition or operating results.
Climate change, climate change regulations and greenhouse
effects may adversely impact our operations and markets.
Climate change is receiving increased
attention from the scientific and political communities. There is an ongoing debate as to the extent to which our climate is changing, the possible
causes of this change and its potential impacts. Some attribute global warming to increased levels of greenhouse gases, including carbon dioxide, which
has led to significant legislative and regulatory efforts to limit greenhouse gas emissions. The outcome of federal and state actions to address global
climate change could result in significant new regulations, additional changes to fund energy efficiency activities or other regulatory actions. These
actions could increase the costs of operating our businesses, reduce the demand for our products and services and impact the prices we charge our
customers, any or all of which could adversely affect our results of operations. In addition, climate change could make severe weather events more
frequent, which would increase the likelihood of capital expenditures to replace damaged infrastructure at our businesses.
Energy efficiency and technology advances, as well as
conservation efforts, may result in reduced demand for our products and services.
The trend toward increased
conservation, as well as technological advances, including installation of improved insulation, the development of more efficient heating and cooling
devices and advances in energy generation technology, may reduce demand for certain of our products and services. During periods of high energy
commodity costs, the prices of certain of our products and services generally increase, which may lead to customer conservation. In addition, federal
and/or state regulation may require mandatory conservation measures, which would also reduce demand. A reduction in demand for our products and
services could adversely affect our results of operations.
Our businesses are dependent on our relationships, on a
contractual and regulatory level, with government entities that may have significant leverage over us. Government entities may be influenced by
political considerations to take actions adverse to us.
Our businesses generally are, and will
continue to be, subject to substantial regulation by governmental agencies. In addition, our businesses rely on obtaining and maintaining government
permits, licenses, concessions, leases or contracts. Government entities, due to the wide-ranging scope of their authority, have significant leverage
over us in their contractual and regulatory relationships with us that they may exercise in a manner that causes us delays in the operation of our
businesses or pursuit of our strategy, or increased administrative expense. Furthermore, government permits, licenses, concessions, leases and
contracts are generally very complex, which may result in periods of non-compliance, or disputes over interpretation or enforceability. If we fail to
comply with these regulations or contractual obligations, we could be subject to
25
monetary penalties or we may lose our rights to operate the affected business, or both. Where our ability to operate an infrastructure business is subject to a concession or lease from the government, the concession or lease may restrict our ability to operate the business in a way that maximizes cash flows and profitability. Further, our ability to grow our current and future businesses will often require consent of numerous government regulators. Increased regulation restricting the ownership or management of U.S. assets, particularly infrastructure assets, by non-U.S. persons, given the non-U.S. ultimate ownership of our Manager, may limit our ability to pursue acquisitions. Any such regulation may also limit our Manager’s ability to continue to manage our operations, which could cause disruption to our businesses and a decline in our performance. In addition, any required government consents may be costly to seek and we may not be able to obtain them. Failure to obtain any required consents could limit our ability to achieve our growth strategy.
Our contracts with government entities
may also contain clauses more favorable to the government counterparty than a typical commercial contract. For instance, a lease, concession or general
service contract may enable the government to terminate the agreement without requiring them to pay adequate compensation. In addition, government
counterparties also may have the discretion to change or increase regulation of our operations, or implement laws or regulations affecting our
operations, separate from any contractual rights they may have. Governments have considerable discretion in implementing regulations that could impact
these businesses. Because our businesses provide basic services, and face limited competition, governments may be influenced by political
considerations to take actions that may hinder the efficient and profitable operation of our businesses and investments.
Governmental agencies may determine the prices we charge
and may be able to restrict our ability to operate our businesses to maximize profitability.
Where our businesses or investments are
sole or predominant service providers in their respective service areas and provide services that are essential to the community, they are likely to be
subject to rate regulation by governmental agencies that will determine the prices they may charge. We may also face fees or other charges imposed by
government agencies that increase our costs and over which we have no control. We may be subject to increases in fees or unfavorable price
determinations that may be final with no right of appeal or that, despite a right of appeal, could result in our profits being negatively affected. In
addition, we may have very little negotiating leverage in establishing contracts with government entities, which may decrease the prices that we
otherwise might be able to charge or the terms upon which we provide products or services. Businesses and investments we acquire in the future may also
be subject to rate regulation or similar negotiating limitations.
Our income may be affected adversely if additional
compliance costs are required as a result of new safety, health or environmental regulation.
Our businesses and investments are
subject to federal, state and local safety, health and environmental laws and regulations. These laws and regulations affect all aspects of their
operations and are frequently modified. There is a risk that any one of our businesses or investments may not be able to comply with some aspect of
these laws and regulations, resulting in fines or penalties. Additionally, if new laws and regulations are adopted or if interpretations of existing
laws and regulations change, we could be required to increase capital spending and incur increased operating expenses in order to comply. Because the
regulatory environment frequently changes, we cannot predict when or how we may be affected by such changes.
A significant and sustained increase in the price of oil
could have a negative impact on the revenue of a number of our businesses.
A significant and sustained increase in
the price of oil could have a negative impact on the profitability of a number of our businesses. Higher prices for jet fuel could result in less use
of aircraft by general aviation customers, which would have a negative impact on the profitability of Atlantic Aviation. Higher fuel prices could
increase the cost of power to our businesses generally which they may not be able to fully pass on to customers.
26
We may face a greater exposure to terrorism than other
companies because of the nature of our businesses and investments.
We believe that infrastructure
businesses face a greater risk of terrorist attack than other businesses, particularly those businesses that have operations within the immediate
vicinity of metropolitan and suburban areas. Specifically, because of the combustible nature of the products of The Gas Company and consumer reliance
on these products for basic services, the business’ SNG plant, transmission pipelines, barges and storage facilities may be at greater risk for
terrorism attacks than other businesses, which could affect its operations significantly. Any terrorist attacks that occur at or near our business
locations would likely cause significant harm to our employees and assets. As a result of the terrorist attacks in New York on September 11, 2001,
insurers significantly reduced the amount of insurance coverage available for liability to persons other than employees or passengers for claims
resulting from acts of terrorism, war or similar events. A terrorist attack that makes use of our property, or property under our control, may result
in liability far in excess of available insurance coverage. In addition, any further terrorist attack, regardless of location, could cause a disruption
to our business and a decline in earnings. Furthermore, it is likely to result in an increase in insurance premiums and a reduction in coverage, which
could cause our profitability to suffer.
We are dependent on certain key personnel, and the loss of
key personnel, or the inability to retain or replace qualified employees, could have an adverse effect on our businesses, financial condition and
results of operations.
We operate our businesses on a
stand-alone basis, relying on existing management teams for day-to-day operations. Consequently, our operational success, as well as the success of our
internal growth strategy, will be dependent on the continued efforts of the management teams of our businesses, who have extensive experience in the
day-to-day operations of these businesses. Furthermore, we will likely be dependent on the operating management teams of businesses that we may acquire
in the future. The loss of key personnel, or the inability to retain or replace qualified employees, could have an adverse effect on our business,
financial condition and results of operations.
Risks Related to IMTT
We share ownership and voting control of IMTT with a third
party. Our ability to exercise significant influence over the business or level of distributions from IMTT is limited, and we may be negatively
impacted by disagreements with our co-investor regarding IMTT’s business and operations.
We own 50% of IMTT; the 50% we do not
own is owned by members of IMTT’s founding family. Our co-investor manages the day to day operations of IMTT, and our ability to influence the
business is limited to our rights under the shareholder agreement governing our investment in IMTT. Our co-investor may have economic or other business
interests that are inconsistent with our interests and goals, and may take actions that are contrary to our business objectives and requests. We may
not agree with our co-investor as to the payment, amount or timing of distributions or as to transactions such as significant capital expenditures,
acquisitions or dispositions of assets and financings. Disputes with our co-investor may result in litigation or arbitration that could be costly and
would divert the attention of our management. Our inability to exercise control over the management of IMTT’s business could materially adversely
affect IMTT’s and our results of operations.
Distribution of funds to the Company
from IMTT is governed by the Shareholders’ Agreement between the Company and the co-investor that owns the remaining 50% stake. The co-investor
has refused to vote in favor of distributing certain of these funds, and the Company believes that such a refusal violates the Shareholders’
Agreement.
As a result, the Company has formally
initiated the dispute resolution process in the Shareholders’ Agreement, and intends to proceed to arbitration with the co-investor if a
satisfactory resolution cannot be reached within the timeframe prescribed in the Shareholders’ Agreement. Although we expect that the day to day
operations of existing facilities will run as usual at IMTT during this dispute, no assurance can be given that this dispute will not adversely impact
the operations of IMTT. We also cannot assure you that this dispute will be resolved favorably for us or within the time frame expected, that any
negative publicity will not adversely effect
27
the Company or IMTT, or that the costs involved, and the possible diversion of management’s attention, will not adversely impact our results of operations. In addition, the value and trading price of our LLC interests may be negatively impacted by the uncertainty surrounding the outcome of this dispute.
IMTT’s business is dependent on the demand for bulk liquid storage capacity in the locations where it
operates.
Demand for IMTT’s bulk liquid
storage is largely a function of U.S. domestic demand for chemical, petroleum and vegetable and animal oil products and, less significantly, the extent
to which such products are imported into and/or exported out of the United States. U.S. domestic demand for chemical, petroleum and vegetable and
animal oil products is influenced by a number of factors, including economic conditions, growth in the U.S. economy, the pricing of chemical, petroleum
and vegetable and animal oil products and their substitutes. Import and export volumes of these products to and from the United States are influenced
by demand and supply imbalances in the United States and overseas, the cost of producing chemical, petroleum and vegetable and animal oil products
domestically vis-|$$|Aga-vis overseas and the cost of transporting the products between the United States and overseas destinations. Specifically,
production of natural gas from mainland North America may increase or decrease the demand for bulk liquid storage. This is a developing situation and
the effects are not yet predictable.
In addition, changes in government
regulations that affect imports and exports of bulk chemical, petroleum and vegetable and animal oil products, including the imposition of surcharges
or taxes on imported or exported products, could adversely affect import and export volumes to and from the United States. A reduction in demand for
bulk liquid storage, particularly in the New York Harbor or the lower Mississippi River, as a consequence of lower U.S. domestic demand for, or
imports/exports of, chemical, petroleum or vegetable and animal oil products, could lead to a decline in storage rates and tankage volumes rented out
by IMTT and adversely affect IMTT’s revenue and profitability and the distributions it makes to us.
IMTT’s business could be adversely affected by a substantial increase in bulk liquid storage capacity in the locations where it
operates.
An increase in available bulk liquid
storage capacity in excess of growth in demand for such storage in the key locations in which IMTT operates, such as New York Harbor and the lower
Mississippi River, could result in overcapacity and a decline in storage rates and tankage volumes rented out by IMTT and could adversely affect
IMTT’s revenue and profitability and the distributions it makes to us.
IMTT’s business could be adversely affected by the insolvency of one or more large customers.
IMTT has a number of customers that
together generate a material proportion of IMTT’s revenue and gross profit. In 2010, excluding BP, IMTT’s ten largest customers by revenue
generated approximately 55.0% of terminal revenue. The insolvency of any of these large customers could result in an increase in unutilized storage
capacity in the absence of such capacity being rented to other customers and adversely affect IMTT’s revenue and profitability and the
distributions it makes to us.
IMTT’s business involves hazardous activities and is partly located in a region with a history of significant adverse weather
events and is potentially a target for terrorist attacks. We cannot assure you that IMTT is, or will be in the future, adequately insured against all
such risks.
The transportation, handling and
storage of petroleum, chemical and vegetable and animal oil products are subject to the risk of spills, leakage, contamination, fires and explosions.
Any of these events may result in loss of revenue, loss of reputation or goodwill, fines, penalties and other liabilities. In certain circumstances,
such events could also require IMTT to halt or significantly alter operations at all or part of the facility at which the event occurred. Consistent
with industry practice, IMTT carries insurance to protect against most of the accident-related risks involved in the conduct of the business; however,
the limits of IMTT’s coverage mean IMTT cannot insure against all risks. In addition, because IMTT’s facilities are not insured against loss
from terrorism or acts of war, such an attack that significantly damages one or more of IMTT’s major facilities would have a negative impact on
IMTT’s future cash flow and profitability and the distributions it
28
makes to us. Further, future losses sustained by insurers during hurricanes in the U.S. Gulf region may result in lower insurance coverage and/or increased insurance premiums for IMTT’s properties in Louisiana.
Risks Related to The Gas Company
Disruptions or shutdowns at either of the oil refineries on
Oahu from which The Gas Company obtains both LPG and the primary feedstock for its SNG plant may have an adverse effect on the operations of the
business.
The Gas Company manufactures SNG and
distributes SNG and LPG. SNG feedstock or LPG supply disruptions or refinery shutdowns that limit the business’ ability to manufacture and/or
deliver gas to customers could increase costs as a result of an inability to source feedstock at acceptable rates. The extended unavailability of one
or both of the refineries or disruption to crude oil supplies or feedstock to Hawaii could also result in an increased reliance on imported sources. An
inability to purchase LPG from foreign sources would adversely affect operations. The business is also limited in its ability to store LPG, and any
disruption in supply may cause a depletion of LPG stocks. Currently, the business has only one contracted source of feedstock for SNG, the Tesoro
refinery, and if Tesoro chooses to discontinue the production or sale of feedstock to the business, which they could do with little notice, The Gas
Company’s utility business would suffer a significant disruption and potentially incur significant operating cost increases and/or capital
expenditures until alternative supplies of feedstock could be developed. All supply disruptions of SNG or LPG, if occurring for an extended period,
could adversely impact the business’ contribution margin and cash flows.
In 2010, Chevron considered converting
its Hawaii refinery to a storage terminal. Chevron concluded that it would continue operating as a refinery in Hawaii; however, Chevron has publicly
stated that it is considering other alternatives for this facility. Chevron’s Hawaii refinery supplied The Gas Company with approximately
one-third of its total LPG purchases in 2010. Any decision by Chevron regarding its operations in Hawaii could affect the business’ cost of LPG
and may adversely impact its non-utility contribution margin and profitability.
The most significant costs for The Gas Company are
locally-sourced LPG, LPG imports and feedstock for the SNG plant, the costs of which are directly related to petroleum prices. To the extent that these
costs cannot be passed on to customers, the business’ contribution margin and cash flows will be adversely affected.
The profitability of The Gas Company is
based on the margin of sales prices over costs. Since LPG and feedstock for the SNG plant are commodities, changes in global supply of and demand for
these products can have a significant impact on costs. In addition, increased reliance on higher-priced foreign sources of LPG, whether as a result of
disruptions to or shortages in local sources or otherwise, could also have a significant impact on costs. The Gas Company has no control over these
costs, and, to the extent that these costs cannot be passed on to customers, the business’ financial condition and the results of operations would
be adversely affected. Higher prices could result in reduced customer demand or customer conversion to alternative energy sources, or both, that would
reduce the volume of gas sold and adversely affect the profitability of The Gas Company.
The Gas Company relies on its SNG plant, including its
transmission pipeline, for a significant portion of its sales. Disruptions at that facility could adversely affect the business’ ability to serve
customers.
Disruptions at the SNG plant resulting
from mechanical or operational problems or power failures could affect the ability of The Gas Company to produce SNG. Most of the utility sales on Oahu
are of SNG and all SNG is produced at the Oahu plant. Disruptions to the primary and redundant production systems would have a significant adverse
effect on The Gas Company’s sales and cash flows.
29
The operations of The Gas Company are subject to a variety
of competitive pressures and the actions of competitors, particularly those involved in other energy sources, could have a materially adverse effect on
operating results.
Other fuel sources such as electricity,
diesel, solar energy, geo-thermal, wind, other gas providers and alternative energy sources may be substituted for certain gas end-use applications,
particularly if the price of gas increases relative to other fuel sources, whether due to higher commodity supply costs or otherwise. Customers could,
for a number of reasons, including increased gas prices, lower costs of alternative energy or convenience, meet their energy needs through alternative
sources. This could have an adverse effect on the business’ revenue and cash flows.
The Gas Company’s utility business is subject to
regulation by the Hawaii Public Utilities Commission, or HPUC, and actions by the HPUC or changes to the regulatory environment may constrain the
operation or profitability of the business.
If the business fails to comply with
certain HPUC regulatory conditions, the profitability of The Gas Company could be adversely impacted. The business agreed to 14 regulatory conditions
with the HPUC that address a variety of matters including: a requirement that The Gas Company and HGC’s ratio of consolidated debt to total
capital does not exceed 65%; and a requirement to maintain $20.0 million in readily-available cash resources at The Gas Company, HGC or MIC. The HPUC
regulates all franchised or certificated public service companies operating in Hawaii; prescribes rates, tariffs, charges and fees; determines the
allowable rate of earnings in establishing rates; issues guidelines concerning the general management of franchised or certificated utility businesses;
and acts on requests for the acquisition, sale, disposition or other exchange of utility properties, including mergers and consolidations. Any adverse
decision by the HPUC concerning the level or method of determining utility rates, the items and amounts that may be included in the rate base, the
returns on equity or rate base found to be reasonable, the potential consequences of exceeding or not meeting such returns, or any prolonged delay in
rendering a decision in a rate or other proceeding, could have an adverse effect on the business.
The Gas Company’s operations on the islands of Hawaii,
Maui and Kauai rely on LPG that is transported to those islands by Jones Act qualified barges from Oahu and from non-Jones Act vessels from foreign
ports. Disruptions to service by those vessels could adversely affect the business’ results of operations.
The Jones Act requires that all goods
transported by water between U.S. ports be carried in U.S.-flag ships and that they meet certain other requirements. The business has time charter
agreements allowing the use of two barges that currently have a cargo capacity of approximately 420,000 gallons and 550,000 gallons of LPG each. The
barges used by the business are the only two Jones Act qualified barges available in the Hawaiian Islands capable of carrying large volumes of LPG.
They are near the end of their useful economic lives. If the barges are unable to transport LPG from Oahu and the business is not able to secure
foreign-source LPG or obtain an exemption to the Jones Act, that would permit importation of a sufficient quantity of LPG from the mainland U.S., the
profitability of the business could be adversely impacted.
The Gas Company is subject to risks associated with
volatility in the Hawaii economy.
Tourism and government activities
(including the military) are two of the largest components of Hawaii’s economy. Hawaii’s economy is heavily influenced by economic conditions
in the U.S. and Asia and their impact on tourism, as well as by government spending. As a result of the economic downturn, Hawaii has experienced
significant declines in levels of tourism which have affected the local economy generally. A large portion of The Gas Company’s sales are
generated by businesses that rely on tourism. If the local economy fails to improve or declines, the volume of gas sold could be negatively affected by
business closures and/or lower usage and adversely impact the business’ financial performance. Additionally, a lack of growth in the Hawaii
economy could reduce the level of new residential construction, and adversely impact growth in volume from new residential customers. A reduction in
government activity, particularly military activity, or a shift by either away from the use of gas products, could also have a negative impact on The
Gas Company’s results.
30
Because of its geographic location, Hawaii, and in turn The
Gas Company, is subject to earthquakes and certain weather risks that could materially disrupt operations.
Hawaii is subject to earthquakes and
certain weather risks, such as hurricanes, floods, heavy and sustained rains and tidal waves. Because the business’ SNG plant, SNG transmission
line and several storage facilities are close to the ocean, weather-related disruptions to operations are possible. In addition, earthquakes may cause
disruptions. These events could damage the business’ assets or could result in wide-spread damage to its customers, thereby reducing the volume of
gas sold and, to the extent such damages are not covered by insurance, the business’ revenue and cash flows.
Risks Related to District Energy
Pursuant to the terms of a use agreement with the City of
Chicago, the City of Chicago has rights that, if exercised, could have a significant negative impact on District Energy.
In order to operate the district
cooling system in downtown Chicago, the business has obtained the right to use certain public ways of the City of Chicago under a use agreement, which
we refer to as the Use Agreement. Under the terms of the Use Agreement, the City of Chicago retains the right to use the public ways for a public
purpose and has the right in the interest of public safety or convenience to cause the business to remove, modify, replace or relocate its facilities
at the expense of the business. If the City of Chicago exercises these rights, District Energy could incur significant costs and its ability to provide
service to its customers could be disrupted, which would have an adverse effect on the business’ financial condition and results of operations. In
addition, the Use Agreement is non-exclusive, and the City of Chicago is entitled to enter into use agreements with the business’ potential
competitors.
The Use Agreement expires on December
31, 2040 and may be terminated by the City of Chicago for any uncured material breach of its terms and conditions. The City of Chicago also may require
District Energy to pay liquidated damages of $6,000 a day if the business fails to remove, modify, replace or relocate its facilities when required to
do so, if it installs any facilities that are not properly authorized under the Use Agreement or if the district cooling system does not conform to the
City of Chicago’s standards. Each of these non-compliance penalties could result in substantial financial loss or effectively shut down the
district cooling system in downtown Chicago.
Any proposed renewal, extension or
modification of the Use Agreement requires approval by the City Council of Chicago. Extensions and modifications subject to the City of Chicago’s
approval include those to enable the expansion of chilling capacity and the connection of new customers to the district cooling system. The City of
Chicago’s approval is contingent upon the timely filing of an Economic Disclosure Statement, or EDS, (disclosure required by Illinois state law
and Chicago city ordinances to certify compliance with various laws and ordinances) by us and certain of the beneficial owners of our stock. If any of
these investors fails to file a completed EDS form within 30 days of the City of Chicago’s request or files an incomplete or inaccurate EDS, the
City of Chicago has the right to refuse to provide the necessary approval for any extension or modification of the Use Agreement or to rescind the Use
Agreement altogether. If the City of Chicago declines to approve extensions or modifications to the Use Agreement, District Energy may not be able to
increase the capacity of its district cooling system and pursue its growth strategy. Furthermore, if the City of Chicago rescinds or voids the Use
Agreement, the district cooling system in downtown Chicago would be effectively shut down and the business’ financial condition and results of
operations would be materially and adversely affected as a result.
31
A certain number of our investors may be required to comply
with certain disclosure requirements of the City of Chicago and non-compliance may result in the City of Chicago’s rescission or voidance of the
Use Agreement and any other arrangements District Energy may have with the City of Chicago at the time of the non-compliance.
In order to secure any amendment to the
Use Agreement with the City of Chicago to pursue expansion plans or otherwise, or to enter into other contracts with the City of Chicago, the City of
Chicago may require any person who owns or acquires 15% or more of our LLC interests to make a number of representations to the City of Chicago by
filing a completed EDS. Our LLC agreement requires that in the event that we need to obtain approval from the City of Chicago in the future for any
specific matter, including to expand the district cooling system or to amend the Use Agreement, we and each of our then 15% investors would need to
submit an EDS to the City of Chicago within 30 days of the City of Chicago’s request. In addition, our LLC agreement requires each 15% investor to
provide any supplemental information needed to update any EDS filed with the City of Chicago as required by the City of Chicago and as requested by us
from time to time.
Any EDS filed by an investor may become
publicly available. By completing and signing an EDS, an investor will have waived and released any possible rights or claims which it may have against
the City of Chicago in connection with the public release of information contained in the EDS and also will have authorized the City of Chicago to
verify the accuracy of information submitted in the EDS. The requirements and consequences of filing an EDS with the City of Chicago will make
compliance with the EDS requirements difficult for our investors.
If any investor fails to comply with
the EDS requirements on time or the City of Chicago determines that any information provided in any EDS is false, incomplete or inaccurate, the City of
Chicago may rescind or void the Use Agreement or any other arrangements Thermal Chicago has with the City of Chicago, and pursue any other remedies
available to them. If the City of Chicago rescinds or voids the Use Agreement, the business’ district cooling system in downtown Chicago would be
effectively shut down and the business’ financial condition and results of operations would be adversely affected as a result.
If certain events within or beyond the control of District
Energy occur, District Energy may be unable to perform its contractual obligations to provide chilling and heating services to its customers. If, as a
result, its customers elect to terminate their contracts, District Energy may suffer loss of revenue. In addition, District Energy may be required to
make payments to such customers for damages.
In the event of a shutdown of one or
more of District Energy’s plants due to operational breakdown, strikes, the inability to retain or replace key technical personnel or events
outside its control, such as an electricity blackout, or unprecedented weather conditions in Chicago, District Energy may be unable to continue to
provide chilling and heating services to all of its customers. As a result, District Energy may be in breach of the terms of some or all of its
customer contracts. In the event that such customers elect to terminate their contracts with District Energy as a consequence of their loss of service,
its revenue may be materially adversely affected. In addition, under a number of contracts, District Energy may be required to pay damages to a
customer in the event that a cessation of service results in loss to that customer.
Northwind Aladdin currently derives a majority of its
operating cash flows from a contract with a single customer, the Planet Hollywood Resort and Casino, which emerged from bankruptcy several years ago.
If this customer were to enter into bankruptcy again, Northwind’s Aladdin’s contract may be amended or terminated and the business may
receive no compensation, which could result in the loss of our investment in Northwind Aladdin.
Northwind Aladdin derives a majority of
its cash flows from a contract with the Planet Hollywood resort and casino (formerly known as the Aladdin resort and casino) in Las Vegas to supply
cold and hot water and back-up electricity. The Aladdin resort and casino emerged from bankruptcy immediately prior to District Energy’s
acquisition of Northwind Aladdin in September 2004, and, during the course of those proceedings, the contract with Northwind Aladdin was amended to
reduce the payment obligations of the Aladdin resort and casino. If the Planet Hollywood resort and casino were to enter into bankruptcy again and a
cheaper
32
source of the services that Northwind Aladdin provides can be found, this contract may be terminated or amended. This could result in a total loss or significant reduction in District Energy’s income from Northwind Aladdin, for which the business may receive no compensation.
Weather conditions and conservation efforts may negatively
impact District Energy’s results of operations.
District Energy’s earnings are
generated by the sale of cooling and heating services. Weather conditions that are significantly cooler or warmer than normal in District Energy’s
service areas may reduce demand for the services it provides. Demand for our services may also be reduced by the conservation efforts of our customers
and by any conservation mandated by regulations to curb the effects of climate change and global warming. A reduction in demand for District
Energy’s services could adversely affect District Energy’s results of operations.
Risks Related to Atlantic Aviation
Deterioration of business jet traffic at airports where
Atlantic Aviation operates would cause Atlantic Aviation to default on its debt obligations.
As of December 31, 2010, Atlantic
Aviation had total long-term debt outstanding of $763.3 million in term loan debt and $45.5 million in capital expenditure facilities. The terms of
these debt arrangements require compliance with certain operating and financial covenants. The ability of Atlantic Aviation to meet their respective
debt service obligations and to refinance or repay their outstanding indebtedness will depend primarily upon cash produced by this
business.
At December 31, 2010, Atlantic
Aviation’s current debt-to-EBITDA ratio, as defined under its loan agreement, was 6.91x. This compares with a maximum permitted debt-to-EBITDA
ratio of 8.00x. The maximum permitted debt-to-EBITDA ratio drops to 7.50x in March 31, 2011. A decline in business jet take-offs and landings at
airports where Atlantic Aviation operates FBOs could result in a reduction of Atlantic Aviation’s EBITDA as defined under its loan agreement.
Consequently, Atlantic Aviation could exceed the maximum permitted debt-to-EBITDA ratio under its loan agreement and default on its debt obligations.
If the default remains uncured, the lenders under the loan agreement, may accelerate the repayment of the outstanding balance of the borrowings under
the agreement. If Atlantic Aviation is unable to repay or refinance this debt, it may be rendered insolvent. A default on the debt obligations leading
to bankruptcy or insolvency would cause Atlantic Aviation to default on its FBO leases and would allow the local airport authorities to terminate the
leases.
Deterioration in the economy in general or in the aviation
industry that results in less air traffic at airports that Atlantic Aviation services would have a material adverse impact on our
business.
A large part of the business’
revenue is derived from fuel sales and other services provided to general aviation customers and, to a lesser extent, commercial air travelers. An
economic downturn could reduce the level of air travel, adversely affecting Atlantic Aviation. General aviation travel is primarily a function of
economic activity. Consequently, during periods of economic downturn, FBO customers are more likely to curtail air travel.
The economic downturn of 2008 and 2009
had a significant impact on the activity levels of many FBO customers, which resulted in significant declines in the gross profit of this business.
According to general aviation traffic data reported by the FAA, business jet take-offs and landings in the United States decreased by 11.6% and 17.7%
in 2008 and 2009, respectively. As a result of these traffic declines, business jet traffic levels in 2009 were 27.2% below their 2007 levels. General
aviation traffic recovered in 2010 as economic activity improved. Business jet take-offs and landings increased by 11.3% compared with 2009 levels.
However, 2010 business jet traffic levels remain 19.0% lower than their 2007 levels. The trajectory and pace of further general aviation traffic
recovery could be impacted by the change in seasonal demand for FBO services or extreme adverse weather conditions. If the economy experiences a
renewed deterioration or
33
negative sentiment regarding corporate jet usage re-emerges, the business may experience a decline in the volumes of fuel sold, which could materially adversely affect the results of this business.
Air travel and air traffic volume can
also be affected by events that have nationwide and industry-wide implications, such as the events of September 11, 2001, as well as local
circumstances. Events such as wars, outbreaks of disease such as SARS, and terrorist activities in the United States or overseas may reduce air travel.
Local circumstances include downturns in the general economic conditions of the area where an airport is located or other situations in which the
business’ major FBO customers relocates their home base or preferred fueling stop to alternative locations.
In addition, changes to regulations
governing the tax treatment relating to general aviation travel, either for businesses or individuals, may cause a reduction in general aviation
travel. Increased environmental regulation restricting or increasing the cost of aviation activities could also cause the business’ revenue to
decline.
Atlantic Aviation is subject to a variety of competitive
pressures, and the actions of competitors may have a material adverse effect on its revenue.
FBO operators at a particular airport
compete based on a number of factors, including location of the facility relative to runways and street access, service, value added features,
reliability and price. Many of Atlantic Aviation’s FBOs compete with one or more FBOs at their respective airports, and, to a lesser extent, with
FBOs at nearby airports. Furthermore, leases related to FBO operations may be subject to competitive bidding at the end of their term. Some present and
potential competitors have or may obtain greater financial and marketing resources than Atlantic Aviation, which may negatively impact Atlantic’s
Aviation ability to compete at each airport or for lease renewal. Some competitors may aggressively or irrationally price their bids for airport
concessions, which may limit our ability to grow or renew our portfolio.
Atlantic Aviation’s FBOs do not
have the right to be the sole provider of FBO services at any of its FBO locations. The authority responsible for each airport has the ability to grant
other FBO leases at the airport and new competitors could be established at those FBO locations. The addition of new competitors may reduce, or impair
Atlantic Aviation’s ability to increase, the revenue of the FBO business.
Increased pricing competition at Atlantic Aviation may have
an adverse effect on market share and fuel margins, causing a decline in the profitability of that business.
Some of Atlantic Aviation’s
competitors have recently pursued more aggressive pricing strategies. These competitors operate FBOs at a number of airports where Atlantic Aviation
operates or at airports near where it operates. Excessive price discounting may cause fuel volume and market share decline, potential decline in hangar
rentals and de-icing and may result in increased margin pressure, adversely affecting the profitability of this business.
The termination for cause or convenience of one or more of
the FBO leases would damage Atlantic Aviation’s operations significantly.
Atlantic Aviation’s revenue is
derived from long-term leases at 66 airports and one heliport. If Atlantic Aviation defaults on the terms and conditions of its leases, including upon
insolvency, the relevant authority may terminate the lease without compensation. Additionally, leases at Chicago Midway, Philadelphia, North East
Philadelphia, New Orleans International and Orange County airports and the Metroport 34 th
Street Heliport in New York City, representing approximately 12.1% of Atlantic Aviation’s gross profit in 2010, allow the relevant authority to
terminate the lease at their convenience. In each case, Atlantic Aviation would then lose the income from that location and potentially the expected
returns from prior capital expenditures. Atlantic Aviation would also likely be in default under the loan agreements and be obliged to repay its
lenders a portion or the entire outstanding loan amount. Any such events would have a material adverse effect on Atlantic Aviation’s results of
operations.
34
The Transportation Security Administration, or TSA, is
considering new regulations which could impair the relative convenience of general aviation and adversely affect demand for Atlantic Aviation’s
services.
The TSA has proposed new regulations
known as the Large Aircraft Security Program (LASP), which would require all U.S. operators of general aviation aircraft exceeding 12,500 pounds
maximum take-off weight to implement security programs that are subject to TSA audit. In addition, the proposed regulations would require airports
servicing these aircraft to implement security programs involving additional security measures, including passenger and baggage screening. The business
believes these new regulations, if implemented, will affect many of Atlantic Aviation’s customers and all of the airports at which it operates.
These rules, if adopted, could decrease the convenience and attractiveness of general aviation travel relative to commercial air travel and, therefore,
may adversely impact demand for Atlantic Aviation’s services.
The lack of accurate and reliable industry data can result
in unfavorable strategic planning, mergers and acquisitions and macro pricing decisions.
The business uses industry and
airport-specific general aviation traffic data published by the FAA to identify trends in the FBO industry. The business also uses this traffic data as
a key input to decision-making in strategic planning, mergers and acquisitions and macro pricing matters. However, as noted by the FAA on their
website, the data has several limitations and challenges. As a result, the use of the FAA traffic data may result in conclusions in strategic planning,
mergers and acquisitions or macro pricing decisions that are ultimately unfavorable.
Risks Related to Ownership of Our
Stock
MIC’s inherently complex structure and financial
reporting may make it difficult for some investors to value our LLC interests.
We are a limited liability company
structured as a non-operating holding company of three operating businesses and one substantial, unconsolidated investment. We have elected to be
treated as a corporation for tax purposes. Our consolidated federal income tax group is comprised of two of our operating businesses. Our investment
and one of our operating businesses file stand-alone federal income tax returns. To the extent we receive distributions either from our investment or
operating business that is not a part of our tax group, and these distributions are characterized as a dividend for tax purposes (as opposed to a
return of capital), such distributions would be eligible for the federal dividends received deductions (80% exclusion in calculating taxes). These
factors may make it difficult for some potential investors, particularly those without a moderate level of financial acumen, to accurately assess the
value of our LLC interests and may adversely impact the market for our LLC interests.
Our Manager’s decision to reinvest its quarterly base
management fees in LLC interests or retain the cash will affect holders of LLC interests differently.
Our Manager, in its sole discretion,
may elect to retain base management fees paid in cash or to reinvest such payments in additional LLC interests. In the event the Manager chooses not to
reinvest the fees to which it is entitled in additional LLC interests, the amount paid will reduce the cash that may otherwise be distributed as a
dividend to all shareholders. In the event the Manager chooses to reinvest the fees to which it is entitled in additional LLC interests, effectively
returning the cash to us, such reinvestment will dilute existing shareholders by the increase in the percentage of shares owned by the Manager. Either
option may adversely impact the market for our LLC interests.
Our total assets include a substantial amount of goodwill
and intangible assets. The write-off of a significant portion of intangible assets would negatively affect our reported
earnings.
Our total assets reflect a substantial
amount of goodwill and other intangible assets. At December 31, 2010, goodwill and other intangible assets, net, represented approximately 55.5% of
total assets from continuing operations. Goodwill and other intangible assets were primarily recognized as a result of the
35
acquisitions of our businesses and investments. Other intangible assets consist primarily of airport operating rights, trade names and customer relationships. On at least an annual basis, we assess whether there has been an impairment in the value of goodwill and assess for impairment of other intangible assets with indefinite lives when there are triggering events or circumstances. If the carrying value of the tested asset exceeds its estimated fair value, impairment is deemed to have occurred. In this event, the amount is written down to fair value. Under current accounting rules, this would result in a charge to reported earnings. We have recognized significant impairments in the past, and any future determination requiring the write-off of a significant portion of goodwill or other intangible assets would negatively affect our reported earnings and total capitalization, and could be material.
Our total assets include a substantial amount of goodwill,
intangible assets and fixed assets. The depreciation and amortization of these assets may negatively impact our reported
earnings.
The high level of intangible and
physical assets written up to fair value upon acquisition of our businesses generates substantial amounts of depreciation and amortization. These
non-cash items serve to lower net income as reported in our statement of operations as well as our taxable income. The generation of net losses or
relatively small net income may contribute to a net operating loss (“NOL”) carryforward that can be used to offset currently taxable income
in future periods. However, the continued reporting of little or negative net income may adversely affect the attractiveness of the Company among some
potential investors and may reduce the market for our LLC interests.
Our Manager’s affiliation with Macquarie Group Limited
and the Macquarie Group may result in conflicts of interest or a decline in our stock price.
Our Manager is an affiliate of
Macquarie Group Limited and a member of the Macquarie Group. From time to time, we have entered into, and in the future we may enter into, transactions
and relationships involving Macquarie Group Limited, its affiliates, or other members of the Macquarie Group. Such transactions have included and may
include, among other things, the entry into debt facilities and derivative instruments with members of the Macquarie Group serving as lender or
counterparty, and financial advisory services provided to us by the Macquarie Group.
Although our audit committee, all of
the members of which are independent directors, is required to approve of any related party transactions, including those involving members of the
Macquarie Group or its affiliates, the relationship of our Manager to the Macquarie Group may result in conflicts of interest.
In addition, as a result of our
Manager’s being a member of the Macquarie Group, negative market perceptions of Macquarie Group Limited generally or of Macquarie’s
infrastructure management model, or Macquarie Group statements or actions with respect to other managed vehicles, may affect market perceptions of our
Company and cause a decline in the price of our LLC interests unrelated to our financial performance and prospects.
Our Manager can resign with 90 days notice and we may not
be able to find a suitable replacement within that time, resulting in a disruption in our operations, which could adversely affect our financial
results and negatively impact the market price of our LLC interests.
Our Manager has the right, under the
management services agreement, to resign at any time with 90 days notice, whether we have found a replacement or not. The resignation of our Manager
will trigger mandatory repayment obligations under debt facilities at all of our operating companies other than IMTT. If our Manager resigns, we may
not be able to find a new external manager or hire internal management with similar expertise within 90 days to provide the same or equivalent services
on acceptable terms, or at all. If we are unable to do so quickly, our operations are likely to experience a disruption, our financial results could be
adversely affected, perhaps materially, and the market price of our LLC interests may decline substantially. In addition, the coordination of our
internal management, acquisition activities and supervision of our businesses and investments are likely to suffer if we were unable to identify and
reach an agreement with a single institution or group of executives having the expertise possessed by our Manager and its affiliates.
36
Furthermore, if our Manager resigns,
the Company and its subsidiaries will be required to cease use of the Macquarie brand entirely, and change their names to remove any reference to
“Macquarie.” This may cause the value of the Company and the market price of our LLC interests to decline.
In the event of the underperformance of our Manager, we may
be unable to remove our Manager, which could limit our ability to improve our performance and could adversely affect the market price of our LLC
interests.
Under the terms of the management
services agreement, our Manager must significantly underperform in order for the management services agreement to be terminated. The Company’s
Board of Directors cannot remove our Manager unless:
• |
our LLC interests underperform a weighted average of two benchmark indices by more than 30% in relative terms and more than 2.5% in absolute terms in 16 out of 20 consecutive quarters prior to and including the most recent full quarter, and the holders of a minimum of 66.67% of the outstanding LLC interests (excluding any LLC interests owned by our Manager or any affiliate of the Manager) vote to remove our Manager; |
• |
our Manager materially breaches the terms of the management services agreement and such breach continues unremedied for 60 days after notice; |
• |
our Manager acts with gross negligence, willful misconduct, bad faith or reckless disregard of its duties in carrying out its obligations under the management services agreement, or engages in fraudulent or dishonest acts; or |
• |
our Manager experiences certain bankruptcy events. |
Because our Manager’s performance
is measured by the market performance of our LLC interests relative to a benchmark index, even if the absolute market performance of our LLC interests
does not meet expectations, the Company’s Board of Directors cannot remove our Manager unless the market performance of our LLC interests also
significantly underperforms the benchmark index. If we were unable to remove our Manager in circumstances where the absolute market performance of our
LLC interests does not meet expectations, the market price of our LLC interests could be negatively affected.
Certain provisions of the management services agreement and
the operating agreement of the Company makes it difficult for third parties to acquire control of the Company and could deprive investors of the
opportunity to obtain a takeover premium for their LLC interests.
In addition to the limited
circumstances in which our Manager can be terminated under the terms of the management services agreement, the management services agreement provides
that in circumstances where the stock ceases to be listed on a recognized U.S. exchange as a result of the acquisition of stock by third parties in an
amount that results in the stock ceasing to meet the distribution and trading criteria on such exchange or market, the Manager has the option to either
propose an alternate fee structure and remain our Manager or resign, terminate the management services agreement upon 30 days’ written notice and
be paid a substantial termination fee. The termination fee payable on the Manager’s exercise of its right to resign as our Manager subsequent to a
delisting of our LLC interests could delay or prevent a change in control that may favor our shareholders. Furthermore, in the event of such a
delisting, any proceeds from the sale, lease or exchange of a significant amount of assets must be reinvested in new assets of our Company, subject to
debt repayment obligations. We would also be prohibited from incurring any new indebtedness or engaging in any transactions with shareholders of the
Company or its affiliates without the prior written approval of the Manager. These provisions could deprive shareholders of opportunities to realize a
premium on the LLC interests owned by them.
37
The operating agreement of the Company,
which we refer to as the LLC agreement, contains a number of provisions that could have the effect of making it more difficult for a third-party to
acquire, or discouraging a third-party from acquiring, control of the Company. These provisions include:
• |
restrictions on the Company’s ability to enter into certain transactions with our major shareholders, with the exception of our Manager, modeled on the limitation contained in Section 203 of the Delaware General Corporation Law; |
• |
allowing only the Company’s Board of Directors to fill vacancies, including newly created directorships and requiring that directors may be removed only for cause and by a shareholder vote of 66-2/3%; |
• |
requiring that only the Company’s chairman or Board of Directors may call a special meeting of our shareholders; |
• |
prohibiting shareholders from taking any action by written consent; |
• |
establishing advance notice requirements for nominations of candidates for election to the Company’s Board of Directors or for proposing matters that can be acted upon by our shareholders at a shareholders’ meeting; |
• |
having a substantial number of additional LLC interests authorized but unissued; |
• |
providing the Company’s Board of Directors with broad authority to amend the LLC agreement; and |
• |
requiring that any person who is the beneficial owner of 15% or more of our LLC interests make a number of representations to the City of Chicago in its standard form of EDS, the current form of which is included in our LLC agreement, which is incorporated by reference as an exhibit to this report. |
The market price and marketability of our LLC interests may
from time to time be significantly affected by numerous factors beyond our control, which may adversely affect our ability to raise capital through
future equity financings.
The market price of our LLC interests
may fluctuate significantly. Many factors that are beyond our control may significantly affect the market price and marketability of our LLC interests
and may adversely affect our ability to raise capital through equity financings. These factors include the following:
• |
price and volume fluctuations in the stock markets generally; |
• |
significant volatility in the market price and trading volume of securities of Macquarie Group Limited and/or vehicles managed by the Macquarie Group or branded under the Macquarie name or logo; |
• |
significant volatility in the market price and trading volume of securities of registered investment companies, business development companies or companies in our sectors, which may not be related to the operating performance of these companies; |
• |
changes in our earnings or variations in operating results; |
• |
any shortfall in revenue or net income or any increase in losses from levels expected by securities analysts; |
• |
changes in regulatory policies or tax law; |
• |
operating performance of companies comparable to us; and |
• |
loss of funding sources. |
38
Risks Related to Taxation
We have significant income tax Net Operating Losses which
may not be realized before they expire.
We have accumulated over $140.0 million
in federal NOL carryforwards. While we have concluded that all but $7.8 million of the NOLs will more likely than not be realized, there can be no
assurance that we will utilize the NOLs generated to date or any NOLs we might generate in the future. In addition, we have incurred state NOLs and
have provided a valuation allowance against a portion of those state NOLs. As with our federal NOLs, there is also no assurance that we will utilize
those state losses or future losses. Further, the State of Illinois has suspended the use of NOL carryforwards through 2014, similar to the State of
California’s suspension of an NOL deduction through 2011 for large corporations. There can be no assurance that other states will not suspend the
use of NOL carryforwards or that California and Illinois will not further suspend the use of NOL carryforwards.
The current treatment of qualified dividend income and
long-term capital gains under current U.S. federal income tax law may be adversely affected, changed or repealed in the
future.
Under current law, qualified dividend
income and long-term capital gains are taxed to non-corporate investors at a maximum U.S. federal income tax rate of 15%. This tax treatment may be
adversely affected, changed or repealed by future changes in tax laws at any time and is currently scheduled to expire for tax years beginning after
December 31, 2012. This may affect market perceptions of our Company and the market price of our LLC interests could be negatively
affected.
ITEM 1B. UNRESOLVED STAFF COMMENTS
[None].
ITEM 2. PROPERTIES
In general, the assets of our
businesses, including real property, are pledged to secure the financing arrangements of each business on a stand-alone basis. See
“Management’s Discussion and Analysis of Financial Condition and Results of Operations — Liquidity and Capital Resources” in Part
II, Item 7 for a further discussion of these financing arrangements.
Energy-Related Businesses
IMTT
IMTT operates ten wholly-owned bulk
liquid storage facilities in the United States and has part ownership in two companies that each own bulk liquid storage facilities in Canada. The land
on which the facilities are located is either owned or leased by IMTT with leased land comprising a small proportion of the total land in use. IMTT
also owns the storage tanks, piping and transportation infrastructure such as truck and rail loading equipment located at the facilities and related
ship docks, except in Quebec and Geismar, where the docks are leased. The business believes that the aforementioned equipment is generally well
maintained and adequate for the present operations. For further details, see “Our Businesses and Investments — IMTT — Locations” in
Part I, Item 1.
The Gas Company
The Gas Company has facilities and
equipment on all major Hawaiian Islands including: land beneath the SNG plant; several LPG holding tanks and cylinders; approximately 1,000 miles of
underground piping, of which approximately 900 miles are on Oahu; and a 22-mile transmission pipeline from the SNG plant to Pier 38 in
Honolulu.
39
A summary of property, by island,
follows. For more information regarding The Gas Company’s operations, see “Our Businesses and Investments — The Gas Company — Fuel
Supply, SNG Plant and Distribution System” in Part I, Item 1.
| Island |
Description |
Use |
Own/Lease |
|||||||||||
|---|---|---|---|---|---|---|---|---|---|---|---|---|---|---|
Oahu |
SNG
Plant |
Production of
SNG |
Lease |
|||||||||||
Kamakee Street
Buildings and Maintenance yard |
Engineering,
Maintenance Facility, Warehouse |
Own |
||||||||||||
LPG
Baseyard |
Storage facility
for tanks and cylinders |
Lease |
||||||||||||
Topa Fort Street
Tower |
Executive
Offices |
Lease |
||||||||||||
Various Holding
Tanks |
Store and supply
LPG to utility customers |
Lease |
||||||||||||
Maui |
Office, tank
storage facilities and baseyard |
Island-wide
operations |
Lease |
|||||||||||
Kauai |
Office |
Island-wide
operations |
Own |
|||||||||||
Kauai |
Tank storage
facility and baseyard |
Island-wide
operations |
Lease |
|||||||||||
Hawaii |
Office, tank
storage facilities and baseyard |
Island-wide
operations |
Own |
|||||||||||
District Energy
District Energy owns or leases six
plants in Chicago as follows:
| Plant Number |
Ownership or Lease Information |
|||||
|---|---|---|---|---|---|---|
P-1 |
The building and
equipment are owned by District Energy and the business has a long-term property lease until 2043 with an option to renew for 49
years. |
|||||
P-2 |
Property,
building and equipment are owned by District Energy. |
|||||
P-3 |
District Energy
has a property lease that expires in 2033 with a right to renew for ten years. The equipment is owned by District Energy but the landlord has a
purchase option over approximately one-fourth of the equipment. |
|||||
P-4 |
District Energy
has a property lease that expires in 2016 and the business may renew the lease for another 10 years for the P-4B property unilaterally, and for P-4A,
with the consent of the landlord. The equipment at P-4A and P-4B is owned by District Energy. The landlord can terminate the service agreement and the
P-4A property lease upon transfer of the property, on which P-4A and P-4B are located, to a third-party. |
|||||
P-5 |
District Energy
has an exclusive perpetual easement for the use of the basement where the equipment is located. The equipment is owned by District
Energy. |
|||||
Stand-Alone |
District Energy
has a contractual right to use the property pursuant to a service agreement and will own the equipment until the earliest of 2025 when the equipment
reverts to the customer or if the customer exercises an early purchase option. |
|||||
District Energy also owns approximately
14 miles of underground piping through which it distributes chilled water from its facilities to the customers in downtown Chicago.
The equipment at District Energy’s
Las Vegas facility is housed in its own building on a parcel of leased property within the perimeter of the Planet Hollywood resort. The property lease
expires in 2020 and is co-terminus with the supply contract with the Planet Hollywood resort. The building and equipment are owned by District Energy
and upon expiration of the lease the business is required to either abandon the building and equipment or remove them at the landlord’s expense.
For further details, see “Our Business and Investments — District Energy — Business Overview” in Part I, Item 1.
40
Aviation-Related Business
Atlantic Aviation
Atlantic Aviation does not own any real
property. Its operations are carried out under various long-term leases. The business leases office space for its head office in Plano, Texas. For more
information regarding Atlantic Aviation’s FBO locations, see “Our Businesses and Investments — Atlantic Aviation — Business —
Locations” in Part I, Item 1. The lease in Plano expires in 2012. We believe that these facilities are adequate to meet current and foreseeable
future needs.
Atlantic Aviation owns or leases a
number of vehicles, including fuel trucks and other equipment needed to provide service to customers. Routine maintenance is performed on this
equipment and a portion is replaced in accordance with a pre-determined schedule. Atlantic Aviation believes that the equipment is generally well
maintained and adequate for present operations.
ITEM 3. LEGAL PROCEEDINGS
Dispute Proceedings between MIC and Co-Investor in
IMTT
The Company has formally initiated the
dispute resolution process in the Shareholders’ Agreement governing the Company’s investment in IMTT as a result of a disagreement with our
co-investor regarding the distribution of certain funds from the cash flow of IMTT. The Company intends to proceed to arbitration with the co-investor
if a satisfactory resolution cannot be reached within the timeframe prescribed in the Shareholders’ Agreement. See “Management’s
Discussion and Analysis of Financial Condition and Results of Operations — Distributions.”
IMTT Bayonne Clean Air Act
Section 185 of the Clean Air Act (CAA)
requires states (or in the absence of state action, the EPA) in severe and extreme non-attainment areas to adopt a penalty for major stationary sources
of volatile organic compounds and nitrogen oxides if the area fails to attain the one-hour ozone National Ambient Air Quality Standard (NAAQS) set by
the EPA. IMTT’s Bayonne facility is a major stationary source of volatile organic compounds and nitrogen oxides in the New Jersey-Connecticut
severe non-attainment area. Although we believe IMTT’s Bayonne facility is in substantial compliance with CAA obligations, the subject area failed
to meet the required NAAQS by the attainment date in 2007 and as a consequence IMTT-Bayonne believes it is likely to be assessed a penalty linked to
its 2008 and 2009 emissions that were in excess of baseline levels. IMTT expects that the penalty related to these matters will be less than $500,000
in the aggregate and that it will not be payable until 2011 or later. IMTT continues to work to reduce, to the extent feasible, its emissions in order
to avoid or reduce potential future penalties.
Except noted above, there are no legal
proceedings pending that we believe will have a material adverse effect on us other than ordinary course litigation incidental to our businesses. We
are involved in ordinary course legal, regulatory, administrative and environmental proceedings. Typically, expenses associated with these proceedings
are covered by insurance.
ITEM 4. [Removed and Reserved].
41
PART II
ITEM 5. MARKET FOR REGISTRANT’S COMMON EQUITY, RELATED
STOCKHOLDER MATTERS AND ISSUER PURCHASES OF EQUITY SECURITIES
Market Information
Our LLC interests are traded on the
NYSE under the symbol “MIC.” The following table sets forth, for the fiscal periods indicated, the high and low closing prices per LLC
interest on the NYSE:
| High |
Low |
|||||||||
|---|---|---|---|---|---|---|---|---|---|---|
Fiscal
2009 |
||||||||||
First Quarter
|
$ | 5.74 | $ | 0.79 | ||||||
Second Quarter
|
4.36 | 1.50 | ||||||||
Third Quarter
|
9.38 | 3.10 | ||||||||
Fourth Quarter
|
12.60 | 7.38 | ||||||||
Fiscal
2010 |
||||||||||
First Quarter
|
$ | 14.13 | $ | 12.20 | ||||||
Second Quarter
|
16.95 | 12.79 | ||||||||
Third Quarter
|
15.50 | 12.49 | ||||||||
Fourth Quarter
|
21.17 | 15.40 | ||||||||
Fiscal
2011 |
||||||||||
First Quarter
(through February 15, 2011) |
$ | 24.39 | $ | 20.56 | ||||||
As of February 23, 2011, we had
45,715,448 LLC interests issued and outstanding that we believe were held by 105 holders of record, representing approximately 20,000 beneficial
holders.
Distribution Policy
In February 2009 we suspended payment
of quarterly cash distributions to shareholders in favor of applying the cash generated by our operating businesses to the reduction of holding company
debt and operating company debt, principally at Atlantic Aviation. Our circumstances have changed over the intervening two years. We have repaid all of
our holding company debt and improved the financial condition of our operating businesses. In particular we have strengthened the balance sheet of our
Atlantic Aviation business by reducing its long-term debt and we have improved the financial flexibility of our bulk liquid storage by increasing the
size and extending the maturity of its primary debt facility. As a result of these improvements, and taking into consideration the prospect of
continued generation of excess cash by our businesses, we expect to resume payment of quarterly cash distributions to shareholders commencing with a
distribution for the first quarter of 2011 to be paid during the second quarter of 2011.
The declaration and payment of any
future distribution will be subject to a decision of the Company’s Board of Directors, which includes a majority of independent directors. The
Company’s Board of Directors will take into account such matters as the state of the capital markets and general business conditions, our
financial condition, results of operations, capital requirements and any contractual, legal and regulatory restrictions on the payment of distributions
by us to our shareholders or by our subsidiaries to us, and any other factors that the Board of Directors deems relevant. In particular, each of our
businesses and investments have substantial debt commitments and restrictive covenants, which must be satisfied before any of them can pay dividends or
make distributions to us. Any or all of these factors could affect both the timing and amount, if any, of future distributions. See
“Management’s Discussion and Analysis of Financial Condition and Results of Operations — Liquidity and Capital Resources” in Part
II, Item 7.
42
ITEM 6. SELECTED FINANCIAL DATA
The selected financial data includes
the results of operations, cash flow and balance sheet data for the years ended, and as of, December 31, 2010, 2009, 2008, 2007 and 2006 for our
consolidated group, with the results of businesses acquired during those years being included from the date of each acquisition.
| Macquarie Infrastructure Company LLC |
|||||||||||||||||||||||
|---|---|---|---|---|---|---|---|---|---|---|---|---|---|---|---|---|---|---|---|---|---|---|---|
| Year Ended Dec 31, 2010 |
Year Ended Dec 31, 2009(1) |
Year Ended Dec 31, 2008(1) |
Year Ended Dec 31, 2007(1) |
Year Ended Dec 31, 2006(1) |
|||||||||||||||||||
| ($ In Thousands, Except Per LLC Interest
Data) |
|||||||||||||||||||||||
Statement of operations data: |
|||||||||||||||||||||||
Revenue |
|||||||||||||||||||||||
Revenue from
product sales |
$ | 514,344 | $ | 394,200 | $ | 586,054 | $ | 445,852 | $ | 262,432 | |||||||||||||
Revenue from
product sales – utility |
113,752 | 95,769 | 121,770 | 95,770 | 50,866 | ||||||||||||||||||
Service revenue
|
204,852 | 215,349 | 264,851 | 207,680 | 125,773 | ||||||||||||||||||
Financing and
equipment lease income |
7,843 | 4,758 | 4,686 | 4,912 | 5,118 | ||||||||||||||||||
Total revenue
|
840,791 | 710,076 | 977,361 | 754,214 | 444,189 | ||||||||||||||||||
Cost of
revenue |
|||||||||||||||||||||||
Cost of product
sales |
326,734 | 233,376 | 408,690 | 303,796 | 193,821 | ||||||||||||||||||
Cost of product
sales – utility |
90,542 | 73,907 | 105,329 | 66,226 | 16,127 | ||||||||||||||||||
Cost of
services(2) |
53,088 | 46,317 | 63,850 | 53,387 | 37,905 | ||||||||||||||||||
Gross profit
|
370,427 | 356,476 | 399,492 | 330,805 | 196,336 | ||||||||||||||||||
Selling,
general and administrative expenses |
201,787 | 209,783 | 227,288 | 181,830 | 111,006 | ||||||||||||||||||
Fees to manager
– related party |
10,051 | 4,846 | 12,568 | 65,639 | 18,631 | ||||||||||||||||||
Goodwill
impairment(3) |
— | 71,200 | 52,000 | — | — | ||||||||||||||||||
Depreciation(4) |
29,721 | 36,813 | 40,140 | 20,502 | 12,102 | ||||||||||||||||||
Amortization of
intangibles(5) |
34,898 | 60,892 | 61,874 | 32,356 | 18,283 | ||||||||||||||||||
Loss on
disposal of assets(6) |
17,869 | — | — | — | — | ||||||||||||||||||
Total operating
expenses |
294,326 | 383,534 | 393,870 | 300,327 | 160,022 | ||||||||||||||||||
Operating
income (loss) |
76,101 | (27,058 | ) | 5,622 | 30,478 | 36,314 | |||||||||||||||||
Dividend income
|
— | — | — | — | 8,395 | ||||||||||||||||||
Interest income
|
29 | 119 | 1,090 | 5,705 | 4,670 | ||||||||||||||||||
Interest
expense(7) |
(106,834 | ) | (95,456 | ) | (88,652 | ) | (65,356 | ) | (60,484 | ) | |||||||||||||
Loss on
extinguishment of debt |
— | — | — | (27,512 | ) | — | |||||||||||||||||
Equity in
earnings (losses) and amortization charges of investees |
31,301 | 22,561 | 1,324 | (32 | ) | 12,558 | |||||||||||||||||
Loss on
derivative instruments |
— | (25,238 | ) | (2,843 | ) | (1,362 | ) | (822 | ) | ||||||||||||||
Gain on sale of
equity investment |
— | — | — | — | 3,412 | ||||||||||||||||||
Gain on sale of
investment |
— | — | — | — | 49,933 | ||||||||||||||||||
Gain on sale of
marketable securities |
— | — | — | — | 6,737 | ||||||||||||||||||
Other income
(expense), net |
712 | 570 | (198 | ) | (1,260 | ) | (89 | ) | |||||||||||||||
Net income
(loss) from continuing operations before income taxes |
1,309 | (124,502 | ) | (83,657 | ) | (59,339 | ) | 60,624 | |||||||||||||||
Benefit for
income taxes |
8,697 | 15,818 | 14,061 | 16,764 | 4,287 | ||||||||||||||||||
Net income
(loss) from continuing operations |
$ | 10,006 | $ | (108,684 | ) | $ | (69,596 | ) | $ | (42,575 | ) | $ | 64,911 | ||||||||||
Net income
(loss) from discontinued operations, net of taxes |
81,323 | (21,860 | ) | (110,045 | ) | (9,960 | ) | (15,016 | ) | ||||||||||||||
Net income
(loss) |
$ | 91,329 | $ | (130,544 | ) | $ | (179,641 | ) | $ | (52,535 | ) | $ | 49,895 | ||||||||||
Less: net
income (loss) attributable to noncontrolling interests |
659 | (1,377 | ) | (1,168 | ) | (481 | ) | (23 | ) | ||||||||||||||
Net income
(loss) attributable to MIC LLC |
$ | 90,670 | $ | (129,167 | ) | $ | (178,473 | ) | $ | (52,054 | ) | $ | 49,918 | ||||||||||
Basic income
(loss) per share from continuing operations attributable to MIC LLC interest holders |
$ | 0.21 | $ | (2.43 | ) | $ | (1.56 | ) | $ | (1.05 | ) | $ | 2.23 | ||||||||||
Basic income
(loss) per share from discontinued operations attributable to MIC LLC interest holders |
1.78 | (0.44 | ) | (2.41 | ) | (0.22 | ) | (0.50 | ) | ||||||||||||||
Basic income
(loss) per share attributable to MIC LLC interest holders |
$ | 1.99 | $ | (2.87 | ) | $ | (3.97 | ) | $ | (1.27 | ) | $ | 1.73 | ||||||||||
Weighted
average number of shares outstanding: basic |
45,549,803 | 45,020,085 | 44,944,326 | 40,882,067 | 28,895,522 | ||||||||||||||||||
43
| Macquarie Infrastructure Company LLC |
|||||||||||||||||||||||
|---|---|---|---|---|---|---|---|---|---|---|---|---|---|---|---|---|---|---|---|---|---|---|---|
| Year Ended Dec 31, 2010 |
Year Ended Dec 31, 2009(1) |
Year Ended Dec 31, 2008(1) |
Year Ended Dec 31, 2007(1) |
Year Ended Dec 31, 2006(1) | |||||||||||||||||||
| ($ In Thousands, Except Per LLC Interest
Data) |
|||||||||||||||||||||||
Diluted income
(loss) per share from continuing operations attributable to MIC LLC interest holders |
$ | 0.21 | $ | (2.43 | ) | $ | (1.56 | ) | $ | (1.05 | ) | $ | 2.23 | ||||||||||
Diluted income
(loss) per share from discontinued operations attributable to MIC LLC interest holders |
1.78 | (0.44 | ) | (2.41 | ) | (0.22 | ) | (0.50 | ) | ||||||||||||||
Diluted income
(loss) per share attributable to MIC LLC interest holders |
$ | 1.99 | $ | (2.87 | ) | $ | (3.97 | ) | $ | (1.27 | ) | $ | 1.73 | ||||||||||
Weighted
average number of shares outstanding: diluted |
45,631,610 | 45,020,085 | 44,944,326 | 40,882,067 | 28,912,346 | ||||||||||||||||||
Cash
distributions declared per share |
$ | — | $ | — | $ | 2.125 | $ | 2.385 | $ | 2.075 | |||||||||||||
Statement of cash flows data: |
|||||||||||||||||||||||
Cash flow from continuing operations |
|||||||||||||||||||||||
Cash provided
by operating activities |
$ | 98,555 | $ | 82,976 | $ | 95,579 | $ | 93,499 | $ | 38,979 | |||||||||||||
Cash used in
investing activities |
(24,774 | ) | (516 | ) | (56,716 | ) | (638,853 | ) | (681,994 | ) | |||||||||||||
Cash (used in)
provided by financing activities |
(76,528 | ) | (117,818 | ) | 1,698 | 570,618 | 556,259 | ||||||||||||||||
Effect of
exchange rate |
— | — | — | (1 | ) | (272 | ) | ||||||||||||||||
Net (decrease)
increase in cash |
$ | (2,747 | ) | $ | (35,358 | ) | $ | 40,561 | $ | 25,263 | $ | (87,028 | ) | ||||||||||
Cash flow from discontinued operations |
|||||||||||||||||||||||
Cash (used in)
provided by operating activities |
$ | (12,703 | ) | $ | (4,732 | ) | $ | (1,904 | ) | $ | 3,051 | $ | 7,386 | ||||||||||
Cash provided
by (used in) investing activities |
134,356 | (445 | ) | (26,684 | ) | (5,157 | ) | (4,202 | ) | ||||||||||||||
Cash (used in)
provided by financing activities |
(124,183 | ) | 2,144 | (1,215 | ) | (3,072 | ) | 6,069 | |||||||||||||||
Cash (used in)
provided by discontinued operations (8) |
$ | (2,530 | ) | $ | (3,033 | ) | $ | (29,803 | ) | $ | (5,178 | ) | $ | 9,253 | |||||||||
Change in cash
of discontinued operations held for sale(8) |
$ | 2,385 | $ | (208 | ) | $ | 2,459 | $ | 5,902 | $ | (2,740 | ) | |||||||||||
(1) |
Reclassified to conform to current period presentation. |
(2) |
Includes depreciation expense of $6.6 million, $6.1 million, $5.8 million, $5.8 million and $5.7 million for the years ended December 31, 2010, 2009, 2008, 2007 and 2006, respectively, relating to District Energy. |
(3) |
Reflects non-cash impairment charge of $71.2 million and $52.0 million recorded during the first six months of 2009 and the fourth quarter of 2008, respectively, at Atlantic Aviation. |
(4) |
Includes a non-cash impairment charge of $7.5 million and $13.8 million recorded during the first six months of 2009 and the fourth quarter of 2008, respectively, at Atlantic Aviation. |
(5) |
Includes a non-cash impairment charge of $23.3 million and $21.7 million for contractual arrangements recorded during the first six months of 2009 and the fourth quarter of 2008, respectively, at Atlantic Aviation and a $1.3 million non-cash impairment charge on the airport management contracts at Atlantic Aviation in 2007. |
(6) |
Loss on disposal includes write-offs of intangible assets of $10.4 million, property, equipment, land and leasehold improvements of $5.6 million and goodwill of $1.9 million at Atlantic Aviation. |
(7) |
Interest expense includes non-cash losses on derivative instruments of $23.4 million and $4.3 million for the years ended December 31, 2010 and 2009, respectively. |
(8) |
Cash of discontinued operations held for sale is reported in assets of discontinued operations held for sale in our consolidated balance sheets. The net cash (used in) provided by discontinued operations is different than the change in cash of discontinued operations held for sale due to intercompany transactions that are eliminated in consolidation. |
44
| Macquarie Infrastructure Company LLC |
|||||||||||||||||||||||
|---|---|---|---|---|---|---|---|---|---|---|---|---|---|---|---|---|---|---|---|---|---|---|---|
| Year Ended Dec 31, 2010 |
Year Ended Dec 31, 2009 |
Year Ended Dec 31, 2008 |
Year Ended Dec 31, 2007 |
Year Ended Dec 31, 2006 |
|||||||||||||||||||
| ($ In Thousands) |
|||||||||||||||||||||||
Balance
sheet data: |
|||||||||||||||||||||||
Assets of
discontinued operations held for sale |
$ | — | $ | 86,695 | $ | 105,725 | $ | 258,899 | $ | 268,327 | |||||||||||||
Total current
assets from continuing operations |
125,427 | 129,866 | 193,890 | 201,604 | 216,620 | ||||||||||||||||||
Property,
equipment, land and leasehold improvements, net(1) |
563,451 | 580,087 | 592,435 | 577,498 | 425,045 | ||||||||||||||||||
Intangible
assets, net(2) |
705,862 | 751,081 | 811,973 | 846,941 | 513,466 | ||||||||||||||||||
Goodwill(3) |
514,253 | 516,182 | 586,249 | 636,336 | 352,213 | ||||||||||||||||||
Total assets
|
$ | 2,196,742 | $ | 2,339,221 | $ | 2,552,436 | $ | 2,813,029 | $ | 2,097,531 | |||||||||||||
Liabilities
of discontinued operations held for sale |
$ | — | $ | 220,549 | $ | 224,888 | $ | 225,042 | $ | 220,452 | |||||||||||||
Total current
liabilities from continuing operations |
171,286 | 174,647 | 135,311 | 121,892 | 62,981 | ||||||||||||||||||
Deferred
income taxes |
156,328 | 107,840 | 83,228 | 202,683 | 163,923 | ||||||||||||||||||
Long-term
debt, net of current portion |
1,089,559 | 1,166,379 | 1,327,800 | 1,225,150 | 758,400 | ||||||||||||||||||
Total
liabilities |
1,510,047 | 1,764,453 | 1,918,175 | 1,841,159 | 1,227,946 | ||||||||||||||||||
Members’
equity |
$ | 691,149 | $ | 578,526 | $ | 628,838 | $ | 966,552 | $ | 864,425 | |||||||||||||
(1) |
Includes a non-cash impairment charge of $7.5 million and $13.8 million recorded during the first six months of 2009 and the fourth quarter of 2008, respectively, at Atlantic Aviation. |
(2) |
Includes a non-cash impairment charge of $23.3 million and $21.7 million for contractual arrangements recorded during the first six months of 2009 and the fourth quarter of 2008, respectively, at Atlantic Aviation and a $1.3 million non-cash impairment charge on the airport management contracts at Atlantic Aviation in 2007. |
(3) |
Reflects non-cash impairment charge of $71.2 million and $52.0 million recorded during the first six months of 2009 and the fourth quarter of 2008, respectively, at Atlantic Aviation. |
45
ITEM 7. MANAGEMENT’S DISCUSSION AND ANALYSIS OF FINANCIAL
CONDITION AND RESULTS OF OPERATIONS
The following discussion of the
financial condition and results of operations of the Company should be read in conjunction with the consolidated financial statements and the notes to
those statements included elsewhere herein.
We own, operate and invest in a
diversified group of infrastructure businesses that provide basic services, such as chilled water for building cooling and gas utility services to
businesses and individuals primarily in the U.S. The businesses we own and operate are energy-related businesses consisting of: a 50% interest in IMTT,
The Gas Company, and our controlling interest in District Energy; and an aviation-related business, Atlantic Aviation.
Our infrastructure businesses generally
operate in sectors with limited competition and significant barriers to entry, including high initial development and construction costs, the existence
of long-term contracts or the requirement to obtain government approvals and a lack of immediate cost-efficient alternatives to the services provided.
Overall they tend to generate sustainable long-term cash flows.
Distributions
We believe we achieved prudent levels
of cash reserves at both our holding company and operating companies. In addition, our results of operations and balance sheet have improved
sufficiently, along with improved capital market conditions, to give us confidence in our ability to refinance our debt on or before maturity. As a
result, we expect to declare a quarterly cash dividend for the first quarter of 2011 of $0.20 per share to be paid during the second quarter of 2011.
We currently expect to sustain this dividend for the foreseeable future.
In determining the amount of the
dividend, we had expected to include certain funds from the cash flow of IMTT. Distribution of funds to us from IMTT is governed by the
Shareholders’ Agreement between us and the co-investor that owns the remaining 50% stake. The co-investor has refused to vote in favor of
distributing certain of these funds, and we believe that such a refusal violates the Shareholders’ Agreement. As a result, we have formally
initiated the dispute resolution process in the Shareholders’ Agreement, and intend to proceed to arbitration with the co-investor if a
satisfactory resolution cannot be reached within the timeframe prescribed in the Shareholders’ Agreement. Contingent upon the favorable outcome of
the arbitration and the continued recovery of operating and capital market environments, we believe we could increase the quarterly dividend to as much
as $0.375 per share.
The precise timing and amount of any
future distribution will be based on the continued stable performance of the Company’s businesses and the economic conditions prevailing at the
time of any authorization. Management believes that any distribution would be characterized as a dividend for tax purposes rather than as a return of
capital.
Continuing Operations
Our energy-related businesses were
largely resistant to the recent economic downturn, primarily due to the contracted or utility-like nature of their revenues combined with the essential
services they provide and the contractual or regulatory ability to pass through most cost increases to customers. We believe these businesses are
generally able to generate consistent cash flows throughout the business cycle.
The results of Atlantic Aviation have
been negatively affected since mid-2008 by the slower economy and declining general aviation activity levels through mid-2009. However, general
aviation activity levels stabilized in the second half of 2009 and showed year on year growth in December 2009 and through 2010. This stabilization,
combined with expense reduction efforts, results in an improving outlook for the business.
We will continue to apply excess cash
flow generated by Atlantic Aviation to the reduction of that business’ term loan principal, consistent with the amendments to the debt facility
that we agreed to in
46
February 2009. Such repayments are expected to enhance our ability to successfully refinance this debt when it matures in 2014.
Discontinued Operations — PCAA
Bankruptcy
On June 2, 2010, we concluded the sale
in bankruptcy of an airport parking business (“Parking Company of America Airports” or “PCAA”), resulting in a pre-tax gain of
$130.3 million, of which $76.5 million related to the forgiveness of debt, and the elimination of $201.0 million of current debt from liabilities from
our consolidated balance sheet. The results of operations from this business and the gain from the bankruptcy sale are separately reported as a
discontinued operations in the Company’s consolidated financial statements. This business is no longer a reportable segment. As a part of the
bankruptcy sale process, substantially all of the cash proceeds were used to pay the creditors of this business and were not paid to us. See Note 4,
“Discontinued Operations”, in our consolidated financial statements in “Financial Statements and Supplementary Data” in Part II,
Item 8, of this Form 10-K for financial information and further discussions.
Disposal of Assets at Atlantic
Aviation
During 2010, Atlantic Aviation
completed a strategic review of its portfolio of FBOs. As a result of this process, the business concluded that several of its sites did not have
sufficient scale or serve a market with sufficiently strong growth prospects to warrant continued operations at these sites. Therefore, Atlantic
Aviation has undertaken to exit certain markets and redeploy resources that may be made available in the process into markets which it views as having
better growth profiles and recorded $17.9 million in loss on disposal of assets in both the Atlantic Aviation and our consolidated statement of
operations.
In 2010, Atlantic Aviation bid for
renewal of an operating lease at Atlanta’s Hartsfield airport. This lease had been operating on a month to month basis since being acquired by
Atlantic in August 2007. In November 2010, the lease was tentatively awarded to a party other than Atlantic. As a result, in December 2010, Atlantic
recorded a non-cash loss on disposal of its assets totaling $3.7 million. As of February 23, 2011, Atlantic Aviation continues to operate at this FBO
on a month to month basis, while the airport negotiates with the third party.
On January 31, 2011, Atlantic Aviation
concluded the sale of FBOs at Fresno Yosemite International Airport and Cleveland Cuyahoga County Airport. As a result, during the fourth quarter of
2010, the business recorded a non-cash loss on disposal of its assets totaling $9.8 million.
In February 2011 Atlantic Aviation
entered into an asset purchase agreement pertaining to an FBO. As a result, during the fourth quarter of 2010, the business recorded a non-cash loss on
disposal of its assets totaling $4.4 million. This sale is pending as of this report date.
MIC Inc. Revolving Credit Facility
Until March 31, 2010, the Company had a
revolving credit facility provided by various financial institutions, including entities within the Macquarie Group. The facility was repaid in full in
December 2009 and no amounts were outstanding under the revolving credit facility as of December 31, 2009 or at the facility’s maturity on March
31, 2010. This facility was not renewed or replaced. We have no holding company debt.
Income Taxes
We file a consolidated federal income
tax return that includes the taxable income of The Gas Company and Atlantic Aviation. IMTT and District Energy file separate federal income tax
returns. Distributions from IMTT and District Energy may be characterized as non-taxable returns of capital, and reduce our tax basis in these
companies, or as a taxable dividend. We will include in our taxable income the taxable portion of any distributions from IMTT and District Energy
characterized as a dividend. Such dividends are eligible for the 80% dividend received deduction.
47
As a result of our having federal NOL
carryforwards, we do not expect to have consolidated regular federal taxable income or regular federal tax payments at least through the 2012 tax year.
The cash state and local taxes paid by our individual businesses are discussed in the sections entitled “Income Taxes” for each of our
individual businesses.
Tax Relief, Unemployment Insurance Reauthorization and Job
Creation Act of 2010
In December 2010, the Tax Relief,
Unemployment Insurance Reauthorization and Job Creation Act of 2010 (the “Act”) was signed. The Act provides for 100% bonus depreciation for
certain fixed assets placed in service after September 8, 2010 and before January 1, 2012, and 50% bonus depreciation for certain fixed assets placed
in service during 2012 for federal income tax purposes. Importantly, Illinois and Louisiana, two states in which we have significant operations, do
permit the use of bonus depreciation in calculating state taxable income. Generally, states do not allow this bonus depreciation deduction in
determining state taxable income. The Company will take into consideration the benefits of these accelerated depreciation provisions of the Act when
evaluating our capital expenditure plans for 2011 and 2012.
Operating Segments and Businesses
Energy-Related Businesses
IMTT
IMTT provides bulk liquid storage and
handling services in North America through ten terminals located on the East, West and Gulf Coasts, the Great Lakes region of the United States and
partially owned terminals in Quebec and Newfoundland, Canada. IMTT has its largest terminals in the strategic locations of New York Harbor and the
lower Mississippi River near New Orleans. IMTT stores and handles petroleum products, various chemicals, renewable fuels, and vegetable and animal oils
and, based on storage capacity, operates one of the largest independent bulk liquid storage terminal businesses in the United States.
The key drivers of IMTT’s revenue
and gross profit include the amount of tank capacity rented to customers and the rental rates. Customers generally rent tanks under contracts with
terms between three and five years that require payment regardless of actual tank usage. Demand for storage capacity within a particular region (e.g.
New York Harbor) serves as the key driver of storage capacity utilization and tank rental rates. This demand for capacity reflects both the level of
consumption of the bulk liquid products stored by the terminals as well as import and export activity of such products. We believe major constraints on
increases in the supply of new bulk liquid storage capacity in IMTT’s key markets have been and will continue to be limited by availability of
waterfront land with access to the infrastructure necessary for land based receipt and distribution of stored product (road, rail and pipelines),
lengthy environmental permitting processes and high capital costs. We believe a favorable supply/demand balance for bulk liquid storage currently
exists in the markets serviced by IMTT’s major facilities. This condition, when combined with the attributes of IMTT’s facilities such as
deep water drafts and access to land based infrastructure, have allowed IMTT to increase prices while maintaining high storage capacity utilization
rates.
IMTT earns revenue at its terminals
from a number of sources including storage charges for bulk liquids (per barrel, per month rental), throughput of liquids (handling charges), heating
(a pass through of the cost associated with heating liquids to prevent excessive viscosity) and other (revenue from blending, packaging and
warehousing, etc.). Most customer contracts include provisions for annual price increases based on inflation.
In operating its terminals, IMTT incurs
labor costs, fuel costs, repair and maintenance costs, real and personal property taxes and other costs (which include insurance and other operating
costs such as utilities and inventory used in packaging and drumming activities).
In 2010, IMTT generated approximately
42% of its total terminal revenue and approximately 40% of its terminal gross profit at its Bayonne facility, which services New York Harbor, and
approximately 42% of its total terminal revenue and approximately 50% of its terminal gross profit at its St. Rose, Gretna, Avondale
and
48
Energy-Related
Businesses: IMTT – (continued)
Geismar facilities, which together service the lower Mississippi River region (with St. Rose being the largest contributor).
IMTT also owns Oil Mop, an
environmental response and spill clean-up business. Oil Mop has a network of facilities along the U.S. Gulf Coast between Houston and New Orleans.
These facilities service predominantly the Gulf region, but also respond to spill events as needed throughout the United States and internationally. In
2010, Oil Mop was involved in the clean up of the spill in the Gulf of Mexico and contributed 33% of total revenues. This level of activity is not
expected to recur in 2011.
Our interest in IMTT Holdings, from the
date of closing our acquisition, May 1, 2006, is reflected in our equity in earnings and amortization charges of investee line in our consolidated
statements of operations. Cash distributions received by us in excess of our equity in IMTT’s earnings and amortization charges are reflected in
our consolidated statements of cash flows from investing activities under return on investment in unconsolidated business.
The Gas Company
The Gas Company is Hawaii’s only
government franchised full-service gas company, manufacturing and distributing gas products and services in Hawaii. The market includes Hawaii’s
approximately 1.4 million residents and approximately 7.0 million visitors in 2010. The Gas Company manufactures synthetic natural gas, or SNG, for its
utility customers on Oahu, and distributes Liquefied Petroleum Gas, or LPG, to utility and non-utility customers throughout the state’s six
primary islands.
The Gas Company has two primary
businesses: utility (or regulated) and non-utility (or unregulated).
• |
The utility business serves approximately 35,300 customers through localized distribution systems located on the islands of Oahu, Hawaii, Maui, Kauai, Molokai and Lanai. The utility business includes the manufacture, distribution and sale of SNG on the island of Oahu and distribution and sale of LPG. Utility revenue consists principally of sales of SNG and LPG. The operating costs for the utility business include the cost of locally purchased feedstock, the cost of manufacturing SNG from the feedstock, LPG purchase costs and the cost of distributing SNG and LPG to customers. Utility sales comprised approximately 43% of The Gas Company’s total contribution margin in 2010. |
• |
The non-utility business sells and distributes LPG to approximately 33,300 customers. Trucks deliver LPG to individual tanks located on customer sites on Oahu, Hawaii, Maui, Kauai, Molokai and Lanai. Non-utility revenue is generated primarily from the sale of LPG delivered to customers. The operating costs for the non-utility business include the cost of purchased LPG and the cost of distributing the LPG to customers. Non-utility sales comprised approximately 57% of The Gas Company’s total contribution margin in 2010. |
SNG and LPG have a wide number of
commercial and residential applications, including water heating, drying, cooking, emergency power generation and tiki torches. LPG is also used as a
fuel for specialty vehicles such as forklifts. Gas customers include residential customers and a wide variety of commercial, hospitality, military,
public sector and wholesale customers.
Revenue is primarily a function of the
volume of SNG and LPG consumed by customers and the price per thermal unit or gallon charged to customers. Because both SNG and LPG are derived from
crude oil, revenue levels, without volume changes, will generally track global oil prices. Utility revenue includes fuel adjustment charges through
which the changes in feedstock costs are passed through to customers. Evaluating the performance of this business based on contribution margin removes
the volatility associated with fluctuations in the price of feedstock.
Prices charged by The Gas Company to
its customers for the utility gas business are based on HPUC utility rates that enable the business to recover its costs of providing utility gas
service, including operating expenses and taxes, and capital investments through recovery of depreciation and a return on the capital
49
Energy-Related Businesses: The Gas
Company – (continued)
invested. The Gas Company’s rate structure generally allows it to maintain a relatively consistent dollar-based margin per thermal unit by passing increases or decreases in fuel costs through to customers via fuel adjustment charges without filing a general rate case.
The rates that are charged to
non-utility customers are based on the cost of LPG plus delivery costs, and on the cost of alternative fuels and competitive factors.
The Gas Company incurs expenses in
operating and maintaining its facilities and distribution network, comprising a SNG plant, a 22-mile transmission line, 1,000 miles of distribution and
service pipelines, several tank storage facilities and a fleet of vehicles. These costs are generally fixed in nature. Other operating expenses
incurred, such as for LPG, feedstock for the SNG plant and revenue-based taxes, generally fluctuate with the volume of product sold. In addition, the
business incurs general and administrative expenses at its executive office that include expenses for senior management, accounting, information
technology, human resources, environmental compliance, regulatory compliance, employee benefits, rents, utilities, insurance and other normal business
costs.
District Energy
District Energy consists of Thermal
Chicago and Northwind Aladdin, which are 50.01% and 37.51% indirectly owned by us, respectively. Thermal Chicago sells chilled water under long-term
contracts to approximately 100 customers in downtown Chicago and one customer outside of the downtown area. Under the long-term contracts, Thermal
Chicago receives both capacity and consumption payments. Capacity payments (cooling capacity revenue) are received regardless of the volume of chilled
water used by a customer and these payments generally increase in line with inflation.
Consumption payments (cooling
consumption revenue) are per unit charges for the volume of chilled water used. Such payments are higher in the second and third quarters of each year
when the demand for building cooling is at its highest. Consumption payments also fluctuate moderately from year to year depending on weather
conditions. By contract, consumption payments generally increase in line with a number of indices that reflect the cost of electricity, labor and other
input costs relevant to the operations of Thermal Chicago. The weighting of the individual indices broadly reflects the composition of Thermal
Chicago’s direct expenses.
Thermal Chicago’s principal direct
expense is electricity. Other direct expenses are water, labor, operations and maintenance and depreciation and accretion. Electricity usage, and to a
lesser extent water usage, fluctuates in line with the volume of chilled water produced. Thermal Chicago focuses on minimizing the cost of electricity
consumed per unit of chilled water produced by operating its plants to maximize efficient use of electricity. Other direct expenses are largely fixed
regardless of the volumes of chilled water produced.
Thermal Chicago has entered into a
contract with a retail energy supplier to provide the majority of the business’ electricity in 2011 at a fixed price. Electricity for one of the
plants is purchased by the landlord/customer and the cost is passed through to the business. Thermal Chicago passes through changes in electricity
costs to its customers. The business anticipates it will enter into supply contracts for 2012 and subsequent years and prices will fluctuate based on
underlying power costs.
Northwind Aladdin services customers (a
hotel/casino complex, a condominium and a shopping mall) in Las Vegas, Nevada. Under its customer contracts, Northwind Aladdin receives monthly fixed
payments totaling approximately $6.4 million per annum through March 2016 and monthly fixed payments totaling approximately $3.0 million per year
thereafter through February 2020.
50
Aviation-Related Business
Atlantic Aviation
The performance of Atlantic Aviation
depends upon the level of general aviation activity, and jet fuel consumption, for the largest portion of its gross profit. General aviation activity
is in turn a function of economic activity and demographic trends in the regions serviced by the airport at which the business operates and the general
level of economic activity in the United States. A number of these airports are located near key business centers such as New York, New York; Chicago,
Illinois and Philadelphia, Pennsylvania as well as recreational destinations such as Aspen, Colorado and Sun Valley, Idaho.
Fuel gross profit is a function of the
volume (gallons) sold and the average dollar margin per gallon. The average price per gallon is based on our cost of fuel plus, where applicable, fees
and taxes paid to airports or other local authorities (cost of revenue — fuel), plus Atlantic Aviation’s margin. Dollar-based margins per
gallon have been relatively insensitive to the wholesale price of fuel with both increases and decreases in the wholesale price of fuel generally
passed through to customers, subject to the level of price competition that exists at the various FBOs. The average dollar-based margin varies based on
business considerations and customer mix. Base tenants generally benefit from price discounts based on a higher utilization of Atlantic Aviation’s
networks. Transient customers typically pay a higher price.
Atlantic Aviation also earns revenue
from activities other than fuel sales (non-fuel revenue). For example, Atlantic Aviation earns revenue from refueling some general aviation customers
on a “pass-through basis,” where it acts as a fueling agent for fuel suppliers. Atlantic Aviation receives a fee for this service, generally
calculated on a per gallon basis. In addition, the business earns revenue from aircraft parking and hangar rental fees and by providing general
aviation customers with other services, such as de-icing. At some sites where Atlantic Aviation operates an FBO business, it also earns revenue from
refueling and de-icing some commercial airlines on a fee for service basis.
Expenses associated with non-fuel
revenue (cost of revenue — non-fuel) include de-icing fluid costs and payments to airport authorities which vary from site to site. Cost of
revenue — non-fuel is directly related to the volume of services provided and therefore generally increases in line with non-fuel revenue in
dollar terms.
Atlantic Aviation incurs expenses in
operating and maintaining each FBO. Operating expenses include rent and insurance, which are generally fixed in nature and other expenses, such as
salaries, that generally increase with the level of activity. In addition, Atlantic Aviation incurs general and administrative expenses at the head
office that include senior management expenses as well as accounting, information technology, human resources, environmental compliance and other
corporate costs.
Results of Operations
Consolidated
Key Factors Affecting Operating
Results
• |
strong performance in our energy-related businesses reflecting: |
• |
increase in revenue and gross profit from IMTT spill response activity in the Gulf Coast; |
• |
increases in average storage rates and storage capacity at IMTT; |
• |
increase in underlying margins at The Gas Company; and |
• |
increase in gross profit at District Energy driven by higher average temperatures and new customers. |
• |
improved contribution from Atlantic Aviation reflecting: |
• |
higher general aviation fuel volumes and margins; |
• |
cost reductions; and |
• |
lower interest expense as a result of the early repayment of the outstanding term loan debt; partially offset by |
• |
a decrease in non-fuel revenue. |
51
Results of
Operations: Consolidated – (continued)
Our consolidated results of operations
are as follows:
| Year Ended December 31, |
Change (From 2009 to 2010) Favorable/(Unfavorable) |
Change (From 2008 to 2009) Favorable/(Unfavorable) |
|||||||||||||||||||||||||||||
|---|---|---|---|---|---|---|---|---|---|---|---|---|---|---|---|---|---|---|---|---|---|---|---|---|---|---|---|---|---|---|---|
| 2010 |
2009(1) |
2008(1) |
$ |
% |
$ |
% |
|||||||||||||||||||||||||
| ($ In Thousands) (Unaudited) | |||||||||||||||||||||||||||||||
Revenue |
|||||||||||||||||||||||||||||||
Revenue from
product sales |
$ | 514,344 | $ | 394,200 | $ | 586,054 | 120,144 | 30.5 | (191,854 | ) | (32.7 | ) | |||||||||||||||||||
Revenue from
product sales – utility |
113,752 | 95,769 | 121,770 | 17,983 | 18.8 | (26,001 | ) | (21.4 | ) | ||||||||||||||||||||||
Service revenue
|
204,852 | 215,349 | 264,851 | (10,497 | ) | (4.9 | ) | (49,502 | ) | (18.7 | ) | ||||||||||||||||||||
Financing and
equipment lease income |
7,843 | 4,758 | 4,686 | 3,085 | 64.8 | 72 | 1.5 | ||||||||||||||||||||||||
Total revenue
|
840,791 | 710,076 | 977,361 | 130,715 | 18.4 | (267,285 | ) | (27.3 | ) | ||||||||||||||||||||||
Costs and expenses |
|||||||||||||||||||||||||||||||
Cost of product
sales |
326,734 | 233,376 | 408,690 | (93,358 | ) | (40.0 | ) | 175,314 | 42.9 | ||||||||||||||||||||||
Cost of product
sales — utility |
90,542 | 73,907 | 105,329 | (16,635 | ) | (22.5 | ) | 31,422 | 29.8 | ||||||||||||||||||||||
Cost of
services |
53,088 | 46,317 | 63,850 | (6,771 | ) | (14.6 | ) | 17,533 | 27.5 | ||||||||||||||||||||||
Gross
profit |
370,427 | 356,476 | 399,492 | 13,951 | 3.9 | (43,016 | ) | (10.8 | ) | ||||||||||||||||||||||
Selling,
general and administrative |
201,787 | 209,783 | 227,288 | 7,996 | 3.8 | 17,505 | 7.7 | ||||||||||||||||||||||||
Fees to manager
— related party |
10,051 | 4,846 | 12,568 | (5,205 | ) | (107.4 | ) | 7,722 | 61.4 | ||||||||||||||||||||||
Goodwill
impairment |
— | 71,200 | 52,000 | 71,200 | NM | (19,200 | ) | (36.9 | ) | ||||||||||||||||||||||
Depreciation
|
29,721 | 36,813 | 40,140 | 7,092 | 19.3 | 3,327 | 8.3 | ||||||||||||||||||||||||
Amortization of
intangibles |
34,898 | 60,892 | 61,874 | 25,994 | 42.7 | 982 | 1.6 | ||||||||||||||||||||||||
Loss on
disposal of assets |
17,869 | — | — | (17,869 | ) | NM | — | — | |||||||||||||||||||||||
Total operating
expenses |
294,326 | 383,534 | 393,870 | 89,208 | 23.3 | 10,336 | 2.6 | ||||||||||||||||||||||||
Operating
income (loss) |
76,101 | (27,058 | ) | 5,622 | 103,159 | NM | (32,680 | ) | NM | ||||||||||||||||||||||
Other income (expense) |
|||||||||||||||||||||||||||||||
Interest income
|
29 | 119 | 1,090 | (90 | ) | (75.6 | ) | (971 | ) | (89.1 | ) | ||||||||||||||||||||
Interest
expense(2) |
(106,834 | ) | (95,456 | ) | (88,652 | ) | (11,378 | ) | (11.9 | ) | (6,804 | ) | (7.7 | ) | |||||||||||||||||
Equity in
earnings and amortization charges of investees |
31,301 | 22,561 | 1,324 | 8,740 | 38.7 | 21,237 | NM | ||||||||||||||||||||||||
Loss on
derivative instruments |
— | (25,238 | ) | (2,843 | ) | 25,238 | NM | (22,395 | ) | NM | |||||||||||||||||||||
Other income
(expense), net |
712 | 570 | (198 | ) | 142 | 24.9 | 768 | NM | |||||||||||||||||||||||
Net income
(loss) from continuing operations before income taxes |
1,309 | (124,502 | ) | (83,657 | ) | 125,811 | 101.1 | (40,845 | ) | (48.8 | ) | ||||||||||||||||||||
Benefit for
income taxes |
8,697 | 15,818 | 14,061 | (7,121 | ) | (45.0 | ) | 1,757 | 12.5 | ||||||||||||||||||||||
Net income
(loss) from continuing operations |
$ | 10,006 | $ | (108,684 | ) | $ | (69,596 | ) | 118,690 | 109.2 | (39,088 | ) | (56.2 | ) | |||||||||||||||||
Net income
(loss) from discontinued operations, net of taxes |
81,323 | (21,860 | ) | (110,045 | ) | 103,183 | NM | 88,185 | 80.1 | ||||||||||||||||||||||
Net income
(loss) |
$ | 91,329 | $ | (130,544 | ) | $ | (179,641 | ) | 221,873 | 170.0 | 49,097 | 27.3 | |||||||||||||||||||
Less: net
income (loss) attributable to noncontrolling interests |
659 | (1,377 | ) | (1,168 | ) | (2,036 | ) | (147.9 | ) | 209 | 17.9 | ||||||||||||||||||||
Net income
(loss) attributable to MIC LLC |
$ | 90,670 | $ | (129,167 | ) | $ | (178,473 | ) | 219,837 | 170.2 | 49,306 | 27.6 | |||||||||||||||||||
NM — Not
meaningful
(1) |
Reclassified to conform to current period presentation. |
(2) |
Interest expense includes non-cash losses on derivative instruments of $23.4 million and $4.3 million for the years ended December 31, 2010 and 2009, respectively. |
52
Results of
Operations: Consolidated – (continued)
Gross Profit
Consolidated gross profit increased
from 2009 to 2010 reflecting improved results at our energy-related businesses and for fuel-related services at Atlantic Aviation, offset by a decrease
in non-fuel gross profit from Atlantic Aviation.
The decrease in our consolidated gross
profit from 2008 to 2009 was due to a decline in fuel volumes at Atlantic Aviation, partially offset by improved results at our consolidated
energy-related businesses.
Selling, General and Administrative
Expenses
Selling, general and administrative
expenses for 2010 decreased at all of our consolidated businesses, especially at Atlantic Aviation.
The decrease in our selling, general
and administrative expenses in 2009 was primarily a result of cost reduction efforts at Atlantic Aviation, partially offset by higher costs at the
holding company mainly attributable to the sale of the noncontrolling stake in District Energy and increased incentive compensation, pension expense
and professional services at our consolidated energy-related businesses.
Fees to Manager
Base management fees to our Manager
increased due to increased market capitalization. Our Manager elected to reinvest its first quarter 2010 base management fees in additional LLC
interests, which were issued to our Manager during the second quarter of 2010. The base management fee for the second and third quarters of 2010 was
paid in cash to our Manager during the second half of 2010. Our Manager has elected to reinvest its fourth quarter 2010 base management fee of $3.2
million in LLC interests, which will be issued during the first quarter of 2011.
Base management fees to our Manager
decreased in 2009 due to decreased market capitalization. Our Manager elected to reinvest the base management fees for the second, third and fourth
quarters of 2009 in additional LLC interests. LLC interests for the second and third quarters of 2009 were issued to our Manager during the second half
of 2009. LLC interests for the fourth quarter of 2009 were issued to our Manager during the first quarter of 2010.
Goodwill Impairment
During the first six months of 2009 and
the fourth quarter of 2008, we recognized goodwill impairment charges of $71.2 million and $52.0 million, respectively, at Atlantic Aviation. There
were no impairment charges in 2010.
Depreciation
Depreciation includes non-cash asset
impairment charges of $7.5 million during the first six months of 2009 and $13.8 million during the fourth quarter of 2008, recorded at Atlantic
Aviation. Excluding these impairment charges, depreciation expense increased each year as a result of capital expenditures by our businesses resulting
in higher asset balances. There were no impairment charges in 2010.
Amortization of Intangibles
Amortization of intangibles expense
includes non-cash asset impairment charges of $23.3 million during the first six months of 2009 and $21.7 million during the fourth quarter of 2008,
recorded by Atlantic Aviation. The impairments reduced the amortizable balance. There were no impairment charges in 2010.
53
Results of
Operations: Consolidated – (continued)
Loss on disposal of assets
During 2010, Atlantic Aviation
completed a strategic review of its portfolio of FBOs. As a result of this process, the business concluded that several of its sites did not have
sufficient scale or serve a market with sufficiently strong growth prospects to warrant continued operations at these sites. Therefore, Atlantic
Aviation has undertaken to exit certain markets and redeploy resources that may be made available in the process into markets which it views as having
better growth profiles and recorded $17.9 million in loss on disposal of assets in the consolidated statement of operations.
Interest Expense and Loss on Derivative
Instruments
Interest expense includes non-cash
losses on derivative instruments of $23.4 million and $4.3 million for 2010 and 2009, respectively. The change in the non-cash losses on derivatives
recorded both in interest expense and in loss on derivative instruments is attributable to the change in fair value of interest rate swaps, interest
rate swap break fees related to the pay down of debt at Atlantic Aviation and includes the reclassification of amounts from accumulated other
comprehensive loss into earnings, as Atlantic Aviation paid down its debt more quickly than anticipated.
Excluding the portion related to
non-cash losses on derivatives, interest expense decreased due to a $136.7 million reduction of term loan debt at Atlantic Aviation and the repayment
in the full amount of the outstanding balance of $66.4 million of MIC holding company debt during December 2009.
Interest expense increased from 2008 to
2009 primarily at Atlantic Aviation due to payments of interest rate swap breakage fees. Given the downward movement in interest rates since the
interest rate swap contracts were put in place, this business pays interest rate swap breakage fees as it pays down its term loan debt. This increase
was partially offset by the favorable LIBOR movements on unhedged debt during the year, primarily the MIC Inc. revolving credit facility, which was
repaid in December 2009.
Equity in Earnings and Amortization Charges of
Investees
Our equity in the earnings of IMTT
increased from 2009 to 2010 reflecting our share of the improved operating results of the business, offset by our share of non-cash derivative losses
of $7.8 million for 2010 compared with our share of non-cash derivative gains of $15.3 million.
Our equity in the earnings of IMTT
increased from 2008 to 2009 due to improved operating results of the business for that period, together with our share of the non-cash derivative gains
of $15.3 million compared with our share of non-cash derivative losses of $23.1 million in 2008.
Income Taxes
For 2010, we expect to report a
consolidated net operating loss, for which we will record a deferred tax benefit, and we do not expect to pay a federal Alternative Minimum Tax for
2010. Further, we expect taxable income for 2010 to include a capital loss of approximately $10.4 million on the disposal of our airport parking
business, which we will carryback to 2009. Accordingly, our 2009 consolidated taxable income will be reduced to approximately $1.1
million.
For 2009, we reported consolidated
federal taxable income of $11.5 million, which was offset by a portion of our consolidated federal NOL carryforward. For 2009, we paid a federal
Alternative Minimum tax of $203,000.
For 2008, we reported consolidated
federal taxable loss of $14.5 million, for which we recorded a deferred tax benefit. The benefit recorded in 2008 was net of certain state NOLs and a
portion of our impairments attributable to non-deductible goodwill.
As we own less than 80% of IMTT and
District Energy, these businesses are not included in our consolidated federal tax return. These businesses file separate consolidated income tax
returns, and we include
54
Results of
Operations: Consolidated – (continued)
the dividends received from IMTT and District Energy in our consolidated income tax return. Further, we expect that any dividends from IMTT and District Energy in 2010 will be treated as taxable dividends, which qualify for the 80% Dividends Received Deduction (DRD).
Valuation allowance:
As discussed in Note 17, “Income
Taxes”, in our consolidated financial statements in “Financial Statements and Supplementary Data” in Part II, Item 8, of this Form 10-K
for financial information and further discussions, from the date of sale of the noncontrolling interest in District Energy and onwards, we evaluate the
need for a valuation allowance against our deferred tax assets without taking into consideration the deferred tax liabilities of District Energy. As of
December 31, 2009, our valuation allowance was approximately $20.6 million.
During 2010 we reduced the valuation
allowance to approximately $9.2 million, resulting in a net decrease of $11.4 million. Of this decrease, $1.8 million has been recorded as part of the
benefit for federal and state income taxes included in continuing operations on the consolidated statements of operations. The remaining $9.6 million
of the decrease is included in net income from discontinued operations.
In calculating our consolidated state
income tax provision, we have provided a valuation allowance for certain state income tax NOL carryforwards, the utilization of which is not assured
beyond a reasonable doubt. In addition, we expect to incur certain expenses that will not be deductible in determining state taxable income.
Accordingly, these expenses have also been excluded in determining our state income tax expense.
Discontinued Operations
On June 2, 2010, we concluded the sale
in bankruptcy of PCAA, resulting in a pre-tax gain of $130.3 million, of which $76.5 million related to the forgiveness of debt. The results of
operations from this business and the gain from the bankruptcy sale are separately reported as a discontinued operations in our consolidated financial
statements and prior comparable periods have been restated to conform to the current period presentation. See Note 4, “Discontinued
Operations”, in our consolidated financial statements in “Financial Statements and Supplementary Data” in Part II, Item 8, of this Form
10-K for financial information and further discussions.
Earnings Before Interest, Taxes, Depreciation and Amortization
(EBITDA) excluding non-cash items and Free Cash Flow
In accordance with GAAP, we have
disclosed EBITDA excluding non-cash items for our Company and each of our operating segments in Note 15, “Reportable Segments”, in our
consolidated financial statements in “Financial Statements and Supplementary Data” in Part II, Item 8, of this Form 10-K, as a key
performance metric relied on by management in evaluating our performance. EBITDA excluding non-cash items is defined as earnings before interest,
taxes, depreciation and amortization and noncash items, which includes impairments, derivative gains and losses and adjustments for other non-cash
items reflected in the statements of operations. We believe EBITDA excluding non-cash items provides additional insight into the performance of our
operating businesses relative to each other and similar businesses without regard to their capital structure, and their ability to service or reduce
debt, fund capital expenditures and/or support distributions to the holding company.
We also disclose Free Cash Flow, as
defined by us, as a means of assessing the amount of cash generated by our businesses and supplementing other information provided in accordance with
GAAP. We define Free Cash Flow as cash from operating activities, less maintenance capital expenditures and changes in working capital. Working capital
movements are excluded on the basis that these are largely timing differences in payables and receivables, and are therefore not reflective of our
ability to generate cash.
We believe that reporting Free Cash
Flow will provide our investors with additional insight into our ability to deploy cash, as GAAP metrics such as net income and cash from operating
activities do not reflect all of the items that our management considers in estimating the amount of cash generated by our operating
55
Results of
Operations: Consolidated – (continued)
entities. In this Annual Report on Form 10-K, we have disclosed Free Cash Flow for our consolidated results and for each of our operating segments.
We note that Free Cash Flow does not
fully reflect our ability to freely deploy generated cash, as it does not reflect required payments to be made on our indebtedness, pay dividends and
other fixed obligations or the other cash items excluded when calculating Free Cash Flow. We also note that Free Cash Flow may be calculated in a
different manner by other companies, which limits its usefulness as a comparative measure. Therefore, our Free Cash Flow should be used as a
supplemental measure and not in lieu of our financial results reported under GAAP.
In 2008, we disclosed EBITDA only. The
following tables, reflecting results of operations for the consolidated group and for our businesses for the years ended December 31, 2010, 2009 and
2008, have been conformed to current periods’ presentation reflecting EBITDA excluding non-cash items and Free Cash Flow.
A reconciliation of net income (loss)
attributable to MIC LLC from continuing operations to free cash flow from continuing operations, on a consolidated basis, is provided
below:
| Year Ended December 31, |
Change (From 2009 to 2010) Favorable/(Unfavorable) |
Change (From 2008 to 2009) Favorable/(Unfavorable) |
|||||||||||||||||||||||||||||
|---|---|---|---|---|---|---|---|---|---|---|---|---|---|---|---|---|---|---|---|---|---|---|---|---|---|---|---|---|---|---|---|
| 2010 |
2009(1) |
2008(1) |
$ |
% |
$ |
% |
|||||||||||||||||||||||||
| ($ in Thousands) (Unaudited) | |||||||||||||||||||||||||||||||
Net income
(loss) attributable to MIC LLC from continuing operations(2) |
$ | 9,483 | $ | (109,170 | ) | $ | (70,181 | ) | |||||||||||||||||||||||
Interest
expense, net(3) |
106,805 | 95,337 | 87,562 | ||||||||||||||||||||||||||||
Benefit for
income taxes |
(8,697 | ) | (15,818 | ) | (14,061 | ) | |||||||||||||||||||||||||
Depreciation(4) |
29,721 | 36,813 | 40,140 | ||||||||||||||||||||||||||||
Depreciation
– cost of services(4) |
6,555 | 6,086 | 5,813 | ||||||||||||||||||||||||||||
Amortization of
intangibles(5) |
34,898 | 60,892 | 61,874 | ||||||||||||||||||||||||||||
Goodwill
impairment |
— | 71,200 | 52,000 | ||||||||||||||||||||||||||||
Loss on
disposal of assets |
17,869 | — | — | ||||||||||||||||||||||||||||
Loss on
derivative instruments |
— | 25,238 | 2,843 | ||||||||||||||||||||||||||||
Equity in
earnings and amortization charges of investees(6) |
(16,301 | ) | (15,561 | ) | — | ||||||||||||||||||||||||||
Base management
fees settled in LLC interests |
5,403 | 4,384 | — | ||||||||||||||||||||||||||||
Other non-cash
expense, net |
2,753 | 2,784 | 4,883 | ||||||||||||||||||||||||||||
EBITDA
excluding non-cash items from continuing operations |
$ | 188,489 | $ | 162,185 | $ | 170,873 | 26,304 | 16.2 | (8,688 | ) | (5.1 | ) | |||||||||||||||||||
EBITDA
excluding non-cash items from continuing operations |
$ | 188,489 | $ | 162,185 | $ | 170,873 | |||||||||||||||||||||||||
Interest
expense, net(3) |
(106,805 | ) | (95,337 | ) | (87,562 | ) | |||||||||||||||||||||||||
Interest rate
swap breakage fee(3) |
(5,528 | ) | (8,776 | ) | — | ||||||||||||||||||||||||||
Non-cash
derivative losses recorded in interest expense(3) |
28,938 | 13,078 | — | ||||||||||||||||||||||||||||
Amortization
of debt financing costs(3) |
4,347 | 5,121 | 4,762 | ||||||||||||||||||||||||||||
Equipment lease
receivables, net |
2,761 | 2,752 | 2,460 | ||||||||||||||||||||||||||||
Provision for
income taxes, net of changes in deferred taxes |
(3,032 | ) | (2,105 | ) | (1,976 | ) | |||||||||||||||||||||||||
Changes in
working capital |
(10,615 | ) | 6,058 | 7,022 | |||||||||||||||||||||||||||
Cash provided
by operating activities |
98,555 | 82,976 | 95,579 | ||||||||||||||||||||||||||||
Changes in
working capital |
10,615 | (6,058 | ) | (7,022 | ) | ||||||||||||||||||||||||||
Maintenance
capital expenditures |
(14,509 | ) | (9,453 | ) | (14,846 | ) | |||||||||||||||||||||||||
Free cash flow
from continuing operations |
$ | 94,661 | $ | 67,465 | $ | 73,711 | 27,196 | 40.3 | (6,246 | ) | (8.5 | ) | |||||||||||||||||||
56
Results of
Operations: Consolidated – (continued)
(1) |
Reclassified to conform to current period presentation. |
(2) |
Net income (loss) attributable to MIC LLC from continuing operations excludes net income attributable to noncontrolling interests of $523,000, $486,000 and $585,000 for the years ended December 31, 2010, 2009 and 2008, respectively. |
(3) |
Interest expense, net, includes non-cash losses on derivative instruments, non-cash amortization of deferred financing fees and interest rate swap breakage fees. |
(4) |
Depreciation — cost of services includes depreciation expense for District Energy, which is reported in cost of services in our consolidated statements of operations. Depreciation and Depreciation — cost of services does not include acquisition-related step-up depreciation expense of $6.9 million for each year in connection with our investment in IMTT, which is reported in equity in earnings and amortization charges of investees in our consolidated statements of operations. |
(5) |
Amortization of intangibles does not include acquisition-related step-up amortization expense of $1.1 million for each year related to intangible assets in connection with our investment in IMTT, which is reported in equity in earnings and amortization charges of investees in our consolidated statements of operations. |
(6) |
Equity in earnings and amortization charges of investees in the above table includes our 50% share of IMTT’s earnings, offset by distributions we received only up to our share of the earnings recorded. |
Energy-Related Businesses
IMTT
We account for our 50% interest in IMTT
under the equity method. We recognized income of $31.3 million in our consolidated results for 2010. This includes our 50% share of IMTT’s net
income, equal to $36.0 million for the period, offset by $4.7 million of acquisition-related step up depreciation and amortization expense (net of
taxes). For the year ended December 31, 2009, we recognized income of $22.6 million in our consolidated results. This included our 50% share of
IMTT’s net income, equal to $27.3 million for the period, offset by $4.7 million of acquisition-related step up depreciation and amortization
expense (net of taxes).
Distributions from IMTT, to the degree
classified as taxable dividends and not a return of capital for income tax purposes, qualify for the federal dividends received deduction. Therefore,
80% of any taxable dividend is excluded in calculating our consolidated federal taxable income. Any distributions classified as a return of capital for
income tax purposes will reduce our tax basis in IMTT.
57
Energy-Related
Businesses: IMTT – (continued)
To enable meaningful analysis of
IMTT’s performance across periods, IMTT’s overall performance is discussed below, rather than IMTT’s contribution to our consolidated
results.
| Year Ended December 31, |
|||||||||||||||||||||||||||||||||||
|---|---|---|---|---|---|---|---|---|---|---|---|---|---|---|---|---|---|---|---|---|---|---|---|---|---|---|---|---|---|---|---|---|---|---|---|
| 2010 |
2009(1) |
Change Favorable/(Unfavorable) |
2009(1) |
2008 |
Change Favorable/(Unfavorable) |
||||||||||||||||||||||||||||||
| $ |
$ |
$ |
% |
$ |
$ |
$ |
% |
||||||||||||||||||||||||||||
| ($ In Thousands) (Unaudited) |
|||||||||||||||||||||||||||||||||||
Revenue |
|||||||||||||||||||||||||||||||||||
Terminal
revenue |
372,205 | 330,380 | 41,825 | 12.7 | 330,380 | 306,103 | 24,277 | 7.9 | |||||||||||||||||||||||||||
Environmental
response revenue |
184,979 | 15,795 | 169,184 | NM | 15,795 | 46,480 | (30,685 | ) | (66.0 | ) | |||||||||||||||||||||||||
Total revenue
|
557,184 | 346,175 | 211,009 | 61.0 | 346,175 | 352,583 | (6,408 | ) | (1.8 | ) | |||||||||||||||||||||||||
Costs and
expenses |
|||||||||||||||||||||||||||||||||||
Terminal
operating costs |
168,713 | 156,552 | (12,161 | ) | (7.8 | ) | 156,552 | 155,000 | (1,552 | ) | (1.0 | ) | |||||||||||||||||||||||
Environmental
response operating costs |
115,937 | 14,792 | (101,145 | ) | NM |
14,792 | 34,658 | 19,866 | 57.3 | ||||||||||||||||||||||||||
Total operating
costs |
284,650 | 171,344 | (113,306 | ) | (66.1 | ) | 171,344 | 189,658 | 18,314 | 9.7 | |||||||||||||||||||||||||
Terminal gross
profit |
203,492 | 173,828 | 29,664 | 17.1 | 173,828 | 151,103 | 22,725 | 15.0 | |||||||||||||||||||||||||||
Environmental
response gross profit |
69,042 | 1,003 | 68,039 | NM | 1,003 | 11,822 | (10,819 | ) | (91.5 | ) | |||||||||||||||||||||||||
Gross profit
|
272,534 | 174,831 | 97,703 | 55.9 | 174,831 | 162,925 | 11,906 | 7.3 | |||||||||||||||||||||||||||
General and
administrative expenses |
37,125 | 27,437 | (9,688 | ) | (35.3 | ) | 27,437 | 30,076 | 2,639 | 8.8 | |||||||||||||||||||||||||
Depreciation
and amortization |
61,277 | 55,998 | (5,279 | ) | (9.4 | ) | 55,998 | 44,615 | (11,383 | ) | (25.5 | ) | |||||||||||||||||||||||
Operating
income |
174,132 | 91,396 | 82,736 | 90.5 | 91,396 | 88,234 | 3,162 | 3.6 | |||||||||||||||||||||||||||
Interest
expense, net(2) |
(50,335 | ) | (2,130 | ) | (48,205 | ) | NM | (2,130 | ) | (23,540 | ) | 21,410 | 91.0 | ||||||||||||||||||||||
Other income
|
1,953 | 522 | 1,431 | NM | 522 | 2,141 | (1,619 | ) | (75.6 | ) | |||||||||||||||||||||||||
Unrealized
gains (losses) on derivative instruments |
— | 3,306 | (3,306 | ) | NM | 3,306 | (46,277 | ) | 49,583 | 107.1 | |||||||||||||||||||||||||
Provision for
income taxes |
(53,521 | ) | (38,842 | ) | (14,679 | ) | (37.8 | ) | (38,842 | ) | (9,452 | ) | (29,390 | ) | NM |
||||||||||||||||||||
Noncontrolling
interest |
(165 | ) | 332 | (497 | ) | (149.7 | ) | 332 | 1,003 | (671 | ) | (66.9 | ) | ||||||||||||||||||||||
Net
income |
72,064 | 54,584 | 17,480 | 32.0 | 54,584 | 12,109 | 42,475 | NM |
|||||||||||||||||||||||||||
Reconciliation of net income to EBITDA excluding non-cash items: |
|||||||||||||||||||||||||||||||||||
Net income
|
72,064 | 54,584 | 54,584 | 12,109 | |||||||||||||||||||||||||||||||
Interest
expense, net(2) |
50,335 | 2,130 | 2,130 | 23,540 | |||||||||||||||||||||||||||||||
Provision for
income taxes |
53,521 | 38,842 | 38,842 | 9,452 | |||||||||||||||||||||||||||||||
Depreciation
and amortization |
61,277 | 55,998 | 55,998 | 44,615 | |||||||||||||||||||||||||||||||
Unrealized
(gains) losses on derivative instruments |
— | (3,306 | ) | (3,306 | ) | 46,277 | |||||||||||||||||||||||||||||
Other non-cash
(income) expenses |
(361 | ) | (590 | ) | (590 | ) | 601 | ||||||||||||||||||||||||||||
EBITDA
excluding non-cash items |
236,836 | 147,658 | 89,178 | 60.4 | 147,658 | 136,594 | 11,064 | 8.1 | |||||||||||||||||||||||||||
EBITDA
excluding non-cash items |
236,836 | 147,658 | 147,658 | 136,594 | |||||||||||||||||||||||||||||||
Interest
expense, net(2) |
(50,335 | ) | (2,130 | ) | (2,130 | ) | (23,540 | ) | |||||||||||||||||||||||||||
Non-cash
derivative losses (gains) recorded in interest expense(2) |
15,653 | (27,380 | ) | (27,380 | ) | — | |||||||||||||||||||||||||||||
Amortization
of debt financing costs(2) |
2,011 | 543 | 543 | 473 | |||||||||||||||||||||||||||||||
Provision for
income taxes, net of changes in deferred taxes |
(12,514 | ) | (1,593 | ) | (1,593 | ) | (4,053 | ) | |||||||||||||||||||||||||||
Changes in
working capital |
4,536 | 16,284 | 16,284 | (15,387 | ) | ||||||||||||||||||||||||||||||
Cash provided
by operating activities |
196,187 | 133,382 | 133,382 | 94,087 | |||||||||||||||||||||||||||||||
Changes in
working capital |
(4,536 | ) | (16,284 | ) | (16,284 | ) | 15,387 | ||||||||||||||||||||||||||||
Maintenance
capital expenditures |
(44,995 | ) | (39,977 | ) | (39,977 | ) | (42,690 | ) | |||||||||||||||||||||||||||
Free cash
flow |
146,656 | 77,121 | 69,535 | 90.2 | 77,121 | 66,784 | 10,337 | 15.5 | |||||||||||||||||||||||||||
NM — Not
meaningful
(1) |
Reclassified to conform to current period presentation. |
(2) |
Interest expense, net, includes non-cash gains (losses) on derivative instruments and non-cash amortization of deferred financing fees. |
58
Energy-Related
Businesses: IMTT – (continued)
Year Ended December 31, 2010 Compared with Year Ended
December 31, 2009
Key Factors Affecting Operating
Results
• |
environmental response service revenue and gross profit increased principally due to spill response work and other activities related to the oil spill in the Gulf of Mexico; and |
• |
terminal revenue and gross profit increased principally due to: |
• |
increases in average tank rental rates; and |
• |
increase in volume of storage under contract. |
Revenue and Gross Profit
The increase in terminal revenue
primarily reflects growth in storage revenue. Storage revenue grew due to an increase in average rental rates of 7.2% during the year and an increase
in storage capacity mainly attributable to certain expansion projects at IMTT’s Louisiana facilities.
Capacity utilization was essentially
flat at 93.6% during 2010 compared with 94.0% in 2009. Utilization rates were lower in the second half of 2010, primarily due to tanks being taken out
of service for inspection and repairs and maintenance. Many of these tanks were returned to service in early 2011; however, cleaning and inspection
activity is anticipated to remain at elevated levels through 2014. IMTT expects utilization rates to be approximately 93.0% to 94.0% during
2011.
Terminal operating costs increased
during the year ended December 31, 2010 primarily as a result of an increase in salaries and wages and higher repairs and maintenance.
Revenue and gross profit from
environmental response services increased substantially during 2010 primarily due to the increase in spill response activities following the April 20,
2010 BP oil spill in the Gulf of Mexico. The business has substantially reduced its clean-up efforts in the Gulf relating to the BP spill and
anticipates that Oil Mop’s contribution to revenue and gross profit in 2011 will be materially less than 2010.
General and Administrative Expenses
General and administrative expenses for
the year increased primarily due to the increase in environmental response services activity compared with the prior comparable period. The increase
reflects a year to date $9.1 million increase from the environmental response service business, primarily related to cash and accrued bonuses and sales
commissions.
Depreciation and Amortization
Depreciation and amortization expense
increased as IMTT completed several major expansion projects, resulting in higher asset balances.
Interest Expense, Net
Interest expense, net, includes
non-cash losses on derivative instruments of $15.7 million in 2010 and non-cash gains of $27.4 million in 2009. Excluding the non-cash (losses) gains
on derivative instruments, interest expense is higher due to increased rates on the revolving credit facility, an increase in the notional value of the
hedged portion of the revolving credit facility and letter of credit fees associated with the additional issuance of Gulf Opportunity Zone Bonds,
partially offset by a lower outstanding amount on the revolving credit facility.
59
Energy-Related
Businesses: IMTT – (continued)
Cash interest paid was $34.1 million
and $29.0 million for years ended December 31, 2010 and 2009, respectively.
Income Taxes
The business files a consolidated
federal income tax return and files a separate state income tax return in six states. For the year ended December 31, 2009, the business paid state
income taxes of approximately $1.6 million.
For the year ended December 31, 2010,
IMTT recorded $5.5 million of current federal income tax expense and $7.0 million of current state income tax expense. At December 31, 2009, IMTT had a
federal net operating loss of $50.5 million, of which $5.8 million was carriedback to and used in year 2008 and $44.7 million was carriedforward to and
was fully utilized in 2010.
A significant difference between
IMTT’s book and federal taxable income relates to depreciation of terminalling fixed assets. For book purposes, these fixed assets are depreciated
primarily over 15 to 30 years using the straight-line method of depreciation. For federal income tax purposes, these fixed assets are depreciated
primarily over 5 to 15 years using accelerated methods. Most terminalling fixed assets placed in service in 2010 qualify for the federal 50% or 100%
bonus depreciation, except assets placed in service in Louisiana financed with GO Zone Bonds. A significant portion of Louisiana terminalling fixed
assets constructed since Hurricane Katrina are or will be financed with GO Zone Bonds. GO Zone Bond financed assets are depreciated primarily over 9 to
20 years using the straight-line depreciation method. Most of the states in which the business operates do not allow the use of the federal bonus
depreciation calculation methods.
Year Ended December 31, 2009 Compared with Year Ended
December 31, 2008
Key Factors Affecting Operating
Results
• |
terminal revenue and terminal gross profit increased principally due to: |
• |
increases in average tank rental rates and volume of storage under contract; and |
• |
increases in revenue from the provision of storage and other services with the full year of operations at IMTT’s Geismar storage facility. |
• |
lower environmental response gross profit due to reduced spill activity in 2009. |
Revenue and Gross Profit
The increase in terminal revenue
primarily reflects growth in storage and other services revenues, partially offset by declines in throughput and heating revenues. Storage revenue grew
primarily as average rental rates increased by 9.7% during the year. The increase in storage revenue also reflected an increase in storage capacity
mainly attributable to certain expansion projects at IMTT’s Louisiana facilities.
Gross profit increased primarily due to
an increase in storage revenues and $15.2 million of additional revenue as a result of a full year of storage and related logistics services at
IMTT’s Geismar terminal, which was partially offset by a customer reimbursement for capital projects completed at Bayonne in 2008 which did not
recur. Throughput and heating revenues declined reflecting lower activity levels at IMTT’s facilities and lower heating costs due to the decline
in fuel prices passed through to customers. Storage capacity utilization, defined as storage capacity rented divided by total capacity available,
remained relatively constant at 94.0% and 94.3% during 2009 and 2008, respectively.
60
Energy-Related
Businesses: IMTT – (continued)
The terminal operating costs increased
primarily as a result of increased health insurance claims, pension costs, salaries and wages, pipeline related work and a full year of operations at
Geismar, partially offset by a $2.0 million excise tax settlement in the first half of 2008 that did not recur in 2009.
Gross profit from environmental
services decreased from 2008 to 2009 primarily due to higher spill response activity in 2008 relating to IMTT’s central role in response
activities following the July 23, 2008 fuel oil spill on the Mississippi River near New Orleans.
General and Administrative Expenses
Lower general and administrative costs
during 2009 resulted primarily from the recovery of receivables that had been fully provisioned for in prior periods and reserves under bad debt
expense in 2008 that did not recur in 2009.
Depreciation and Amortization
Depreciation and amortization expense
increased as IMTT completed several major expansion projects, resulting in higher asset balances.
Interest Expense, Net
Interest expense, net, includes
non-cash gains on derivative instruments of $27.4 million for the year ended December 31, 2009. Excluding the non-cash gains on derivative instruments,
interest expense is higher due to higher borrowings to fund growth capital expenditures along with the discontinuation of the capitalization of
construction period interest upon the commencement of operations at Geismar, partially offset by a decrease in interest rates on unhedged debt
balances.
Cash interest paid was $29.0 million
and $25.7 million for years ended December 31, 2009 and 2008, respectively.
Income Taxes
For the year ended December 31, 2009,
IMTT generated a loss for federal income tax purposes. This loss was carriedforward and utilized to reduce current taxable income in
2010.
61
Energy-Related Businesses: The Gas
Company
The Gas Company
| Year Ended December 31, |
|||||||||||||||||||||||||||||||||||
|---|---|---|---|---|---|---|---|---|---|---|---|---|---|---|---|---|---|---|---|---|---|---|---|---|---|---|---|---|---|---|---|---|---|---|---|
| 2010 |
2009(1) |
Change Favorable/(Unfavorable) |
2009(1) |
2008(1) |
Change Favorable/(Unfavorable) |
||||||||||||||||||||||||||||||
| $ |
$ |
$ |
% |
$ |
$ |
$ |
% |
||||||||||||||||||||||||||||
| ($ In Thousands) (Unaudited) |
|||||||||||||||||||||||||||||||||||
Contribution
margin |
|||||||||||||||||||||||||||||||||||
Revenue –
utility |
113,752 | 95,769 | 17,983 | 18.8 | 95,769 | 121,770 | (26,001 | ) | (21.4 | ) | |||||||||||||||||||||||||
Cost of revenue
– utility |
76,891 | 60,227 | (16,664 | ) | (27.7 | ) | 60,227 | 91,978 | 31,751 | 34.5 | |||||||||||||||||||||||||
Contribution
margin – utility |
36,861 | 35,542 | 1,319 | 3.7 | 35,542 | 29,792 | 5,750 | 19.3 | |||||||||||||||||||||||||||
Revenue –
non-utility |
96,855 | 79,597 | 17,258 | 21.7 | 79,597 | 91,244 | (11,647 | ) | (12.8 | ) | |||||||||||||||||||||||||
Cost of revenue
– non-utility |
48,896 | 36,580 | (12,316 | ) | (33.7 | ) | 36,580 | 55,504 | 18,924 | 34.1 | |||||||||||||||||||||||||
Contribution
margin – non-utility |
47,959 | 43,017 | 4,942 | 11.5 | 43,017 | 35,740 | 7,277 | 20.4 | |||||||||||||||||||||||||||
Total
contribution margin |
84,820 | 78,559 | 6,261 | 8.0 | 78,559 | 65,532 | 13,027 | 19.9 | |||||||||||||||||||||||||||
Production
|
6,725 | 6,471 | (254 | ) | (3.9 | ) | 6,471 | 6,488 | 17 | 0.3 | |||||||||||||||||||||||||
Transmission
and distribution |
19,269 | 19,152 | (117 | ) | (0.6 | ) | 19,152 | 17,947 | (1,205 | ) | (6.7 | ) | |||||||||||||||||||||||
Gross
profit |
58,826 | 52,936 | 5,890 | 11.1 | 52,936 | 41,097 | 11,839 | 28.8 | |||||||||||||||||||||||||||
Selling,
general and administrative expenses |
16,684 | 16,720 | 36 | 0.2 | 16,720 | 14,389 | (2,331 | ) | (16.2 | ) | |||||||||||||||||||||||||
Depreciation
and amortization |
6,649 | 6,829 | 180 | 2.6 | 6,829 | 6,739 | (90 | ) | (1.3 | ) | |||||||||||||||||||||||||
Operating
income |
35,493 | 29,387 | 6,106 | 20.8 | 29,387 | 19,969 | 9,418 | 47.2 | |||||||||||||||||||||||||||
Interest
expense, net(2) |
(16,505 | ) | (9,250 | ) | (7,255 | ) | (78.4 | ) | (9,250 | ) | (9,390 | ) | 140 | 1.5 | |||||||||||||||||||||
Other expense
|
(90 | ) | (355 | ) | 265 | 74.6 | (355 | ) | (31 | ) | (324 | ) | NM | ||||||||||||||||||||||
Unrealized
losses on derivative instruments |
— | (327 | ) | 327 | NM | (327 | ) | (221 | ) | (106 | ) | (48.0 | ) | ||||||||||||||||||||||
Provision for
income taxes |
(7,400 | ) | (7,619 | ) | 219 | 2.9 | (7,619 | ) | (4,044 | ) | (3,575 | ) | (88.4 | ) | |||||||||||||||||||||
Net
income(3) |
11,498 | 11,836 | (338 | ) | (2.9 | ) | 11,836 | 6,283 | 5,553 | 88.4 | |||||||||||||||||||||||||
Reconciliation of net income to EBITDA excluding non-cash items: |
|||||||||||||||||||||||||||||||||||
Net income(3) |
11,498 | 11,836 | 11,836 | 6,283 | |||||||||||||||||||||||||||||||
Interest
expense, net(2) |
16,505 | 9,250 | 9,250 | 9,390 | |||||||||||||||||||||||||||||||
Provision for
income taxes |
7,400 | 7,619 | 7,619 | 4,044 | |||||||||||||||||||||||||||||||
Depreciation
and amortization |
6,649 | 6,829 | 6,829 | 6,739 | |||||||||||||||||||||||||||||||
Unrealized
losses on derivative instruments |
— | 327 | 327 | 221 | |||||||||||||||||||||||||||||||
Other non-cash
expenses |
2,384 | 1,771 | 1,771 | 1,180 | |||||||||||||||||||||||||||||||
EBITDA
excluding non-cash items |
44,436 | 37,632 | 6,804 | 18.1 | 37,632 | 27,857 | 9,775 | 35.1 | |||||||||||||||||||||||||||
EBITDA
excluding non-cash items |
44,436 | 37,632 | 37,632 | 27,857 | |||||||||||||||||||||||||||||||
Interest
expense, net(2) |
(16,505 | ) | (9,250 | ) | (9,250 | ) | (9,390 | ) | |||||||||||||||||||||||||||
Non-cash
derivative losses recorded in interest expense(2) |
7,334 | 309 | 309 | — | |||||||||||||||||||||||||||||||
Amortization
of debt financing costs(2) |
478 | 478 | 478 | 478 | |||||||||||||||||||||||||||||||
Provision for
income taxes, net of changes in deferred taxes |
(4,333 | ) | (4,936 | ) | (4,936 | ) | — | ||||||||||||||||||||||||||||
Changes in
working capital |
(2,079 | ) | 1,327 | 1,327 | 8,133 | ||||||||||||||||||||||||||||||
Cash provided
by operating activities |
29,331 | 25,560 | 25,560 | 27,078 | |||||||||||||||||||||||||||||||
Changes in
working capital |
2,079 | (1,327 | ) | (1,327 | ) | (8,133 | ) | ||||||||||||||||||||||||||||
Maintenance
capital expenditures |
(6,275 | ) | (3,939 | ) | (3,939 | ) | (6,202 | ) | |||||||||||||||||||||||||||
Free cash
flow |
25,135 | 20,294 | 4,841 | 23.9 | 20,294 | 12,743 | 7,551 | 59.3 | |||||||||||||||||||||||||||
NM — Not
meaningful
(1) |
Reclassified to conform to current period presentation. For the year ended December 31, 2010, payroll taxes and certain employee welfare and benefit costs that were previously recorded in selling, general and administrative costs were reclassified to production, transmission and distribution and other expense where the |
62
Energy-Related Businesses: The Gas
Company – (continued)
| costs were incurred. Accordingly, the years ended December 31, 2009 and 2008 were restated to reflect this change. |
(2) |
Interest expense, net, includes non-cash losses on derivative instruments and non-cash amortization of deferred financing fees. |
(3) |
Corporate allocation expense, other intercompany fees and the federal tax effect have been excluded from the above table as they are eliminated on consolidation at the MIC Inc. level. |
Year Ended December 31, 2010 Compared with Year Ended
December 31, 2009
Key Factors Affecting Operating
Results
• |
utility rate increase effective June 11, 2009; and |
• |
effective non-utility margin management. |
Although the presentation and analysis
of contribution margin is a non-GAAP performance measure, management believes that it is meaningful to understanding the business’ performance
under both a utility rate structure and a non-utility competitive pricing structure. Regulation of the utility portion of The Gas Company’s
operations provides for the pass through of increases or decreases in feedstock costs to utility customers. Changes in the cost of propane distributed
to non-utility customers can be recovered in pricing, subject to competitive conditions generally.
Contribution margin should not be
considered an alternative to revenue, gross profit, operating income, or net income, determined in accordance with U.S. GAAP. A reconciliation of
contribution margin to gross profit is presented in the above table. The business calculates contribution margin as revenue less direct costs of
revenue other than production and transmission and distribution costs. Other companies may calculate contribution margin differently or may use
different metrics and, therefore, the contribution margin presented for The Gas Company is not necessarily comparable with metrics of other
companies.
Contribution Margin and Operating Income
Utility contribution margin was higher
for 2010 due to implementation of a rate increase from June 11, 2009, partially offset by the timing of fuel adjustment charge reconciliations, higher
gas hauling and transportation costs and the implementation of the final rate case order. The volume of gas products sold for 2010 was relatively flat
compared with 2009.
The Gas Company renegotiated its
synthetic natural gas, or SNG, feedstock contract with Tesoro during 2010. The contract is subject to approval by the Hawaii Public Utilities
Commission (HPUC) that is expected by mid-2011. The Gas Company expects that the changes in cost of feedstock will be passed through to consumers via
the fuel adjustment charge mechanism and will have no impact on utility contribution margin.
Non-utility contribution margin was
higher for 2010 as a result of effective margin management. The volume of gas products sold in 2010 was approximately 1.7% higher than 2009. The Gas
Company renegotiated its liquefied petroleum gas, or LPG, supply contracts which are expected to increase the amount of locally supplied propane. In
the fourth quarter, Chevron had an unexpected shut down, which impacted the business’ local supplies, requiring the business to procure
higher-priced foreign sources of LPG.
Production, transmission and
distribution and selling, general and administrative expenses are primarily comprised of labor-related expenses and professional fees. On a combined
basis, these costs were 0.8% higher than 2009 primarily due to higher salary and electricity costs, mostly offset by capitalized labor
costs.
Interest Expense, Net
Interest expense, net, includes
non-cash losses on derivative instruments of $7.3 million and $309,000 for 2010 and 2009, respectively. Excluding the non-cash losses on derivative
instruments, interest expense was
63
Energy-Related Businesses: The Gas
Company – (continued)
slightly higher in 2010 compared with 2009 due to the expiration of an interest rate basis swap agreement. Cash interest paid was $8.6 million and $8.5 million for 2010 and 2009, respectively.
Income Taxes
Income from The Gas Company is included
in our consolidated federal income tax return and is subject to Hawaii state income taxes. The tax expense in the table above includes both state taxes
and the portion of the consolidated federal tax liability attributable to the business.
The business’ federal taxable
income differs from book income primarily as a result of differences in the depreciation of fixed assets. The state of Hawaii does not allow for the
federal bonus depreciation deduction of 50% or 100% in determining state taxable income. For 2010, the business expects to have a current state income
tax expense of approximately $1.4 million on current state taxable income of approximately $18.7 million. In 2011, the business expects its cash state
income taxes to be the same relative percentage of book income.
Year Ended December 31, 2009 Compared with Year Ended
December 31, 2008
Key Factors Affecting Operating Results
• |
increased utility contribution margin due to an interim rate increase implemented from June 11, 2009; |
• |
increased non-utility contribution margin resulting from new business processes that improved the business’ ability to acquire and price the non-utility LPG; partially offset by |
• |
a marginal reduction in volumes. |
Contribution Margin and Operating Income
Utility contribution margin was higher,
primarily due to implementation of the interim rate increase from June 11, 2009, partially offset by volume declines related almost entirely to
commercial customers, who are more exposed to the variability of the economic cycle. The volume of gas sold in 2009 was approximately 3.0% lower than
2008. Non-utility contribution margin was higher, primarily due to lower input costs, partially offset by a 0.6% volume decline from
2008.
Selling, general and administrative
costs increased due to an approximate $930,000 increase in pension expense, higher incentive compensation based upon strong 2009 performance and
professional service costs primarily related to the implementation of a profit center structure in 2009.
Interest Expense, net
Interest expense, net, includes
non-cash losses on derivative instruments of $309,000 for 2009. Excluding the non-cash losses on derivative instruments, interest expense decreased
$449,000 primarily due to a lower weighted average annual interest rate on the business’ primary facilities due to the basis swap agreement
entered into in March 2009.
Cash interest paid was $8.5 million and
$8.8 million for 2009 and 2008, respectively.
Income Taxes
When preparing its 2009 income tax
returns, The Gas Company elected to change its method of tax accounting for certain repair expenditures that were previously capitalized and
depreciated in determining both book and taxable income. This change reduced current federal and state taxable income by approximately $7.8 million, of
which $2.4 million was attributable to the 2009, and the balance attributable to the tax write-off of expenditures capitalized in prior
years.
64
Energy-Related Businesses: The Gas
Company – (continued)
The business’ federal taxable
income differs from book income primarily as a result of differences in the depreciation of fixed assets. Net book income before taxes includes
depreciation based on asset values and lives that differ from those used in determining taxable income. The Gas Company’s current state income tax
liability for 2009 was $462,000.
District Energy
Customers of District Energy pay two
charges to receive chilled water services: a fixed charge based on contracted capacity and a variable charge based on the consumption of chilled water.
Capacity charges are typically adjusted annually at a fixed rate or are indexed to the Consumer Price Index (CPI). The terms of the
business’customer contracts provide for the pass through of increases or decreases in electricity costs, the largest component of the
business’ direct expenses.
65
Energy-Related Businesses: District
Energy – (continued)
The financial results discussed below
reflect 100% of District Energy’s full year performance.
| Year Ended December 31, |
|||||||||||||||||||||||||||||||||||
|---|---|---|---|---|---|---|---|---|---|---|---|---|---|---|---|---|---|---|---|---|---|---|---|---|---|---|---|---|---|---|---|---|---|---|---|
| 2010 |
2009(1) |
Change Favorable/(Unfavorable) |
2009(1) |
2008(1) |
Change Favorable/(Unfavorable) |
||||||||||||||||||||||||||||||
| $ |
$ |
$ |
% |
$ |
$ |
$ |
% |
||||||||||||||||||||||||||||
| ($ In Thousands) (Unaudited) |
|||||||||||||||||||||||||||||||||||
Cooling
capacity revenue |
21,162 | 20,430 | 732 | 3.6 | 20,430 | 19,350 | 1,080 | 5.6 | |||||||||||||||||||||||||||
Cooling
consumption revenue |
24,386 | 20,236 | 4,150 | 20.5 | 20,236 | 20,894 | (658 | ) | (3.1 | ) | |||||||||||||||||||||||||
Other revenue
|
3,371 | 3,137 | 234 | 7.5 | 3,137 | 3,115 | 22 | 0.7 | |||||||||||||||||||||||||||
Finance lease
revenue |
7,843 | 4,758 | 3,085 | 64.8 | 4,758 | 4,686 | 72 | 1.5 | |||||||||||||||||||||||||||
Total revenue
|
56,762 | 48,561 | 8,201 | 16.9 | 48,561 | 48,045 | 516 | 1.1 | |||||||||||||||||||||||||||
Direct expenses
– electricity |
16,343 | 13,356 | (2,987 | ) | (22.4 | ) | 13,356 | 13,842 | 486 | 3.5 | |||||||||||||||||||||||||
Direct expenses
– other(2) |
20,349 | 18,647 | (1,702 | ) | (9.1 | ) | 18,647 | 17,809 | (838 | ) | (4.7 | ) | |||||||||||||||||||||||
Direct
expenses – total |
36,692 | 32,003 | (4,689 | ) | (14.7 | ) | 32,003 | 31,651 | (352 | ) | (1.1 | ) | |||||||||||||||||||||||
Gross profit
|
20,070 | 16,558 | 3,512 | 21.2 | 16,558 | 16,394 | 164 | 1.0 | |||||||||||||||||||||||||||
Selling,
general and administrative expenses |
3,217 | 3,407 | 190 | 5.6 | 3,407 | 3,390 | (17 | ) | (0.5 | ) | |||||||||||||||||||||||||
Amortization of
intangibles |
1,368 | 1,368 | — | — | 1,368 | 1,372 | 4 | 0.3 | |||||||||||||||||||||||||||
Operating
income |
15,485 | 11,783 | 3,702 | 31.4 | 11,783 | 11,632 | 151 | 1.3 | |||||||||||||||||||||||||||
Interest
expense, net(3) |
(20,671 | ) | (8,995 | ) | (11,676 | ) | (129.8 | ) | (8,995 | ) | (10,341 | ) | 1,346 | 13.0 | |||||||||||||||||||||
Other income
|
1,804 | 1,235 | 569 | 46.1 | 1,235 | 201 | 1,034 | NM | |||||||||||||||||||||||||||
Unrealized
(losses) gains on derivative instruments |
— | (1,378 | ) | 1,378 | NM | (1,378 | ) | 26 | (1,404 | ) | NM | ||||||||||||||||||||||||
Benefit
(provision) for income taxes |
1,844 | (773 | ) | 2,617 | NM | (773 | ) | (242 | ) | (531 | ) | NM | |||||||||||||||||||||||
Noncontrolling
interest |
(1,284 | ) | (690 | ) | (594 | ) | (86.1 | ) | (690 | ) | (585 | ) | (105 | ) | (17.9 | ) | |||||||||||||||||||
Net (loss)
income(4) |
(2,822 | ) | 1,182 | (4,004 | ) | NM | 1,182 | 691 | 491 | 71.1 | |||||||||||||||||||||||||
Reconciliation of net (loss) income to EBITDA excluding non-cash items: |
|||||||||||||||||||||||||||||||||||
Net (loss)
income(4) |
(2,822 | ) | 1,182 | 1,182 | 691 | ||||||||||||||||||||||||||||||
Interest
expense, net(3) |
20,671 | 8,995 | 8,995 | 10,341 | |||||||||||||||||||||||||||||||
(Benefit)
provision for income taxes |
(1,844 | ) | 773 | 773 | 242 | ||||||||||||||||||||||||||||||
Depreciation(2) |
6,555 | 6,086 | 6,086 | 5,813 | |||||||||||||||||||||||||||||||
Amortization of
intangibles |
1,368 | 1,368 | 1,368 | 1,372 | |||||||||||||||||||||||||||||||
Unrealized
losses (gains) on derivative instruments |
— | 1,378 | 1,378 | (26 | ) | ||||||||||||||||||||||||||||||
Other non-cash
(income) expenses |
(1,082 | ) | 1,009 | 1,009 | 2,654 | ||||||||||||||||||||||||||||||
EBITDA
excluding non-cash items |
22,846 | 20,791 | 2,055 | 9.9 | 20,791 | 21,087 | (296 | ) | (1.4 | ) | |||||||||||||||||||||||||
EBITDA
excluding non-cash items |
22,846 | 20,791 | 20,791 | 21,087 | |||||||||||||||||||||||||||||||
Interest
expense, net(3) |
(20,671 | ) | (8,995 | ) | (8,995 | ) | (10,341 | ) | |||||||||||||||||||||||||||
Non-cash
derivative losses (gains) recorded in interest expense(3) |
10,136 | (1,158 | ) | (1,158 | ) | — | |||||||||||||||||||||||||||||
Amortization
of debt financing costs(3) |
681 | 681 | 681 | 682 | |||||||||||||||||||||||||||||||
Equipment lease
receivable, net |
2,761 | 2,752 | 2,752 | 2,460 | |||||||||||||||||||||||||||||||
Changes in
working capital |
(794 | ) | 377 | 377 | 3,878 | ||||||||||||||||||||||||||||||
Cash provided
by operating activities |
14,959 | 14,448 | 14,448 | 17,766 | |||||||||||||||||||||||||||||||
Changes in
working capital |
794 | (377 | ) | (377 | ) | (3,878 | ) | ||||||||||||||||||||||||||||
Maintenance
capital expenditures |
(1,207 | ) | (1,001 | ) | (1,001 | ) | (989 | ) | |||||||||||||||||||||||||||
Free cash
flow |
14,546 | 13,070 | 1,476 | 11.3 | 13,070 | 12,899 | 171 | 1.3 | |||||||||||||||||||||||||||
NM — Not
meaningful
(1) |
Reclassified to conform to current period presentation. |
66
Energy-Related Businesses: District
Energy – (continued)
(2) |
Includes depreciation expense of $6.6 million, $6.1 million and $5.8 million for the years ended December 31, 2010, 2009 and 2008, respectively. |
(3) |
Interest expense, net, includes non-cash (losses) gains on derivative instruments and non-cash amortization of deferred financing fees. |
(4) |
Corporate allocation expense and the federal tax effect have been excluded from the above table as they are eliminated on consolidation at the MIC Inc. level. |
Year Ended December 31, 2010 Compared with Year Ended
December 31, 2009
Key Factors Affecting Operating
Results
• |
an increase in consumption gross profit driven by warmer average temperatures in 2010; and |
• |
a net increase in contracted capacity revenue from new customers. |
Gross Profit
Gross profit increased primarily due to
warmer average temperatures during the second and third quarters of 2010 compared with the comparable period in 2009 resulting in higher ton-hour
sales. Additionally, cooling capacity revenue increased due to a net increase in contracted capacity provided to new customers that began service
predominantly in the second quarter of 2009, and annual inflation-related increases of contract capacity rates in accordance with customer contract
terms.
Finance Lease Revenue
Finance lease revenue is comprised of
the interest portion of lease payments received from equipment leases with various customers. The principal cash receipts on these equipment leases are
recorded in the operating activities of the cash flow statement.
Finance lease revenue increased by $3.1
million from 2009 to 2010 primarily due to a one-time $2.5 million adjustment primarily in the allocation of cash received from customers between
principal and interest since the inception of the lease. The increase in the interest portion of the lease in 2010 was directly offset by a decrease in
other non-cash (income) expenses on District Energy and the consolidated statement of cash flows in 2010. This has no effect on free cash flow or cash
flow, as discussed in “Management’s Discussion and Analysis of Financial Condition and Results of Operations — Liquidity and Capital
Resources” in Part II, Item 7.
Selling, General and Administrative
Expenses
Selling, general and administrative
expenses decreased due to a reduction in incentives. This decrease was offset by a reimbursement from a customer for professional fees related to the
Las Vegas plant expansion that occurred in 2009.
Other Income
Other income increased due to the
timing of payments earned under agreements to review and manage the business’ energy demand during periods of peak demand in
2010.
67
Energy-Related Businesses: District
Energy – (continued)
Interest Expense, Net
Interest expense, net, includes
non-cash losses on derivative instruments of $10.1 million for 2010 and non-cash gains of $1.2 million for 2009. Excluding the non-cash (losses) gains
on derivative instruments, interest expense was higher in 2010 compared with 2009 due to the expiration of an interest rate basis swap agreement, and a
higher debt balance during 2010 compared with 2009. Cash interest paid was $9.8 million and $9.5 million for 2010 and 2009,
respectively.
Income Taxes
For periods prior to the sale of a
49.99% noncontrolling interest in the business, the income from District Energy was included in our consolidated federal income tax return and District
Energy filed a separate Illinois state income tax return.
Beginning with periods subsequent to
the sale of the 49.99% noncontrolling interest, District Energy files a separate federal income tax return and will continue to file a separate
Illinois state income tax return. The business has approximately $18.5 million in federal and $18.0 million in state NOL carryforwards available to
offset positive taxable income. The business expects to have federal taxable income in 2011 and 2012, which will be wholly offset by NOL
carryforwards.
In 2011, the State of Illinois enacted
legislation that will increase the state corporate income tax rate by 2.2% through 2014 and suspend the use of NOL carryovers through 2014. Had this
legislation been enacted in 2010, District Energy’s 2010 current state income tax liability would have been approximately $645,000. District
Energy will not pay state income taxes for 2010 because of its state NOL carryforwards.
Year Ended December 31, 2009 Compared with Year Ended
December 31, 2008
Key Factors Affecting Operating Results
• |
cooler average temperatures through the summer of 2009 compared with 2008, resulting in decreased cooling consumption revenue and decreased electricity costs due to lower ton-hour sales, partially offset by |
• |
increase in contracted capacity as new customers began service and annual inflation-linked increases in contract capacity rates. |
Gross Profit
Gross profit increased primarily due to
a net increase in contract capacity as six new customers began service and annual inflation-related increases of contract capacity rates in accordance
with customer contract terms. This was partially offset by reduced cooling consumption revenue related to lower ton-hour sales resulting from cooler
average temperatures through the summer of 2009 compared with 2008, and an adjustment for electricity costs passed through in 2008. A cooler summer in
the Chicago area, compared with 2008, contributed to a significant decrease in chilled water demand.
Other Income
Other income increased due to payments
received under agreements to review and manage the business’ energy demand during periods of peak demand in 2008 and 2009 and a one-time
termination payment received from a customer in 2009.
Interest Expense, Net
Interest expense, net, includes
non-cash gains on derivative instruments of $1.2 million for the year ended December 31, 2009. Excluding the non-cash gains on derivative instruments,
interest expense was
68
Energy-Related Businesses: District
Energy – (continued)
slightly lower in 2009 compared with 2008 due to the interest rate basis swap agreement. Cash interest paid was $9.5 million for the years ended December 31, 2009 and 2008.
Income Taxes
For the period preceding the sale of a
49.99% noncontrolling interest in the business, the income from District Energy was included in our consolidated federal income tax return, and
District Energy filed a separate Illinois state income tax return.
Subsequent to the sale of the 49.99%
noncontrolling interest, District Energy filed a separate consolidated federal income tax return, and continued to file a combined Illinois state
income tax return. At December 31, 2009, the business had approximately $26.0 million in federal and state NOL carryforwards available to offset
positive taxable income. The business did not have positive taxable income in 2009.
69
Aviation-Related Business
Atlantic Aviation
| Year Ended December 31, |
|||||||||||||||||||||||||||||||||||
|---|---|---|---|---|---|---|---|---|---|---|---|---|---|---|---|---|---|---|---|---|---|---|---|---|---|---|---|---|---|---|---|---|---|---|---|
| 2010 |
2009(1) |
Change Favorable/(Unfavorable) |
2009(1) |
2008 |
Change Favorable/(Unfavorable) |
||||||||||||||||||||||||||||||
| $ |
$ |
$ |
% |
$ |
$ |
$ |
% |
||||||||||||||||||||||||||||
| ($ In Thousands) (Unaudited) |
|||||||||||||||||||||||||||||||||||
Revenue |
|||||||||||||||||||||||||||||||||||
Fuel revenue
|
417,489 | 314,603 | 102,886 | 32.7 | 314,603 | 494,810 | (180,207 | ) | (36.4 | ) | |||||||||||||||||||||||||
Non-fuel
revenue |
155,933 | 171,546 | (15,613 | ) | (9.1 | ) | 171,546 | 221,492 | (49,946 | ) | (22.5 | ) | |||||||||||||||||||||||
Total revenue
|
573,422 | 486,149 | 87,273 | 18.0 | 486,149 | 716,302 | (230,153 | ) | (32.1 | ) | |||||||||||||||||||||||||
Cost of
revenue |
|||||||||||||||||||||||||||||||||||
Cost of
revenue-fuel |
265,493 | 184,853 | (80,640 | ) | (43.6 | ) | 184,853 | 342,102 | 157,249 | 46.0 | |||||||||||||||||||||||||
Cost of
revenue-non-fuel |
16,397 | 14,314 | (2,083 | ) | (14.6 | ) | 14,314 | 32,198 | 17,884 | 55.5 | |||||||||||||||||||||||||
Total cost of
revenue |
281,890 | 199,167 | (82,723 | ) | (41.5 | ) | 199,167 | 374,300 | 175,133 | 46.8 | |||||||||||||||||||||||||
Fuel gross
profit |
151,996 | 129,750 | 22,246 | 17.1 | 129,750 | 152,708 | (22,958 | ) | (15.0 | ) | |||||||||||||||||||||||||
Non-fuel
gross profit |
139,536 | 157,232 | (17,696 | ) | (11.3 | ) | 157,232 | 189,294 | (32,062 | ) | (16.9 | ) | |||||||||||||||||||||||
Gross profit
|
291,532 | 286,982 | 4,550 | 1.6 | 286,982 | 342,002 | (55,020 | ) | (16.1 | ) | |||||||||||||||||||||||||
Selling,
general and administrative expenses(2) |
174,526 | 179,949 | 5,423 | 3.0 | 179,949 | 205,304 | 25,355 | 12.3 | |||||||||||||||||||||||||||
Goodwill
impairment |
— | 71,200 | 71,200 | NM | 71,200 | 52,000 | (19,200 | ) | (36.9 | ) | |||||||||||||||||||||||||
Depreciation
and amortization |
56,602 | 89,508 | 32,906 | 36.8 | 89,508 | 93,903 | 4,395 | 4.7 | |||||||||||||||||||||||||||
Loss on
disposal of assets |
17,869 | — | (17,869 | ) | NM | — | — | — | — | ||||||||||||||||||||||||||
Operating
income (loss) |
42,535 | (53,675 | ) | 96,210 | 179.2 | (53,675 | ) | (9,205 | ) | (44,470 | ) | NM | |||||||||||||||||||||||
Interest
expense, net(3) |
(69,409 | ) | (72,929 | ) | 3,520 | 4.8 | (72,929 | ) | (62,967 | ) | (9,962 | ) | (15.8 | ) | |||||||||||||||||||||
Other expense
|
(917 | ) | (1,451 | ) | 534 | 36.8 | (1,451 | ) | (241 | ) | (1,210 | ) | NM | ||||||||||||||||||||||
Unrealized
losses on derivative instruments |
— | (23,331 | ) | 23,331 | NM | (23,331 | ) | (1,871 | ) | (21,460 | ) | NM | |||||||||||||||||||||||
Benefit for
income taxes |
9,497 | 61,009 | (51,512 | ) | (84.4 | ) | 61,009 | 29,936 | 31,073 | 103.8 | |||||||||||||||||||||||||
Net loss(4) |
(18,294 | ) | (90,377 | ) | 72,083 | 79.8 | (90,377 | ) | (44,348 | ) | (46,029 | ) | (103.8 | ) | |||||||||||||||||||||
Reconciliation of net loss to EBITDA excluding non-cash items: |
|||||||||||||||||||||||||||||||||||
Net loss(4) |
(18,294 | ) | (90,377 | ) | (90,377 | ) | (44,348 | ) | |||||||||||||||||||||||||||
Interest
expense, net(3) |
69,409 | 72,929 | 72,929 | 62,967 | |||||||||||||||||||||||||||||||
Benefit for
income taxes |
(9,497 | ) | (61,009 | ) | (61,009 | ) | (29,936 | ) | |||||||||||||||||||||||||||
Depreciation
and amortization |
56,602 | 89,508 | 89,508 | 93,903 | |||||||||||||||||||||||||||||||
Goodwill
impairment |
— | 71,200 | 71,200 | 52,000 | |||||||||||||||||||||||||||||||
Loss on
disposal of assets |
17,869 | — | — | — | |||||||||||||||||||||||||||||||
Unrealized
losses on derivative instruments |
— | 23,331 | 23,331 | 1,871 | |||||||||||||||||||||||||||||||
Other non-cash
expenses |
1,388 | 903 | 903 | 624 | |||||||||||||||||||||||||||||||
EBITDA
excluding non-cash items |
117,477 | 106,485 | 10,992 | 10.3 | 106,485 | 137,081 | (30,596 | ) | (22.3 | ) | |||||||||||||||||||||||||
EBITDA
excluding non-cash items |
117,477 | 106,485 | 106,485 | 137,081 | |||||||||||||||||||||||||||||||
Interest
expense, net(3) |
(69,409 | ) | (72,929 | ) | (72,929 | ) | (62,967 | ) | |||||||||||||||||||||||||||
Interest rate
swap breakage fees(3) |
(5,528 | ) | (8,776 | ) | (8,776 | ) | — | ||||||||||||||||||||||||||||
Non-cash
derivative losses recorded in interest expense(3) |
11,473 | 13,722 | 13,722 | — | |||||||||||||||||||||||||||||||
Amortization
of debt financing costs(3) |
2,984 | 3,144 | 3,144 | 2,613 | |||||||||||||||||||||||||||||||
Provision for
income taxes, net of changes in deferred taxes |
(1,486 | ) | (190 | ) | (190 | ) | (7,950 | ) | |||||||||||||||||||||||||||
Changes in
working capital |
(1,476 | ) | 9,474 | 9,474 | 4,351 | ||||||||||||||||||||||||||||||
Cash provided
by operating activities |
54,035 | 50,930 | 50,930 | 73,128 | |||||||||||||||||||||||||||||||
Changes in
working capital |
1,476 | (9,474 | ) | (9,474 | ) | (4,351 | ) | ||||||||||||||||||||||||||||
Maintenance
capital expenditures |
(7,027 | ) | (4,513 | ) | (4,513 | ) | (7,655 | ) | |||||||||||||||||||||||||||
Free cash
flow |
48,484 | 36,943 | 11,541 | 31.2 | 36,943 | 61,122 | (24,179 | ) | (39.6 | ) | |||||||||||||||||||||||||
NM — Not
meaningful
70
Aviation-Related Business: Atlantic
Aviation – (continued)
(1) |
Reclassified to conform to current period presentation. |
(2) |
Includes $2.4 million increase in the bad debt reserve in the first quarter of 2009 due to the deterioration of accounts receivable aging. |
(3) |
Interest expense, net, includes non-cash losses on derivative instruments, non-cash amortization of deferred financing fees and interest rate swap breakage fees. |
(4) |
Corporate allocation expense and the federal tax effect have been excluded from the above table as they are eliminated on consolidation at the MIC Inc. level. |
Results for 2008 include SevenBar FBOs
from March 4, 2008 (acquisition date) to December 31, 2008. Results for 2009 include SevenBar FBOs for the full year ended December 31, 2009. Results
for the two months ended February 28, 2009 have not been presented separately as they are not significant.
Year Ended December 31, 2010 Compared with Year Ended
December 31, 2009
Key Factors Affecting Operating Results
• |
higher general aviation (“GA”) fuel volumes and higher weighted average GA fuel margins; |
• |
lower selling, general and administrative expenses due to ongoing expense reduction initiatives; and |
• |
lower interest expense driven by reduced debt levels; partially offset by |
• |
a decrease in other non-fuel revenue primarily driven by lower landing fees and miscellaneous fixed based operations related-services. |
Revenue and Gross Profit
The majority of the revenue and gross
profit in Atlantic Aviation is generated through fueling GA aircrafts at 66 airports and one heliport in the U.S. Revenue is categorized according to
who owns the fuel used to service these aircraft. If our business owns the fuel, it records the cost to purchase that fuel as cost of revenue-fuel. The
business’ corresponding fuel revenue is its cost to purchase that fuel plus a margin. The business generally pursues a strategy of maintaining,
and where appropriate increasing, dollar-based margins, thereby passing any increase in fuel prices to the customer.
Atlantic Aviation also has into-plane
arrangements whereby it fuels aircraft with fuel owned by another party. It collects a fee for this service that is recorded as non-fuel revenue. Other
non-fuel revenue also includes various services such as hangar rentals, de-icing, landing fees, tie-down fees and miscellaneous
services.
The business’ fuel-related revenue
and gross profit are driven by fuel volume and dollar-based margin per gallon. This applies to both fuel and into-plane revenue. Customers will
sometimes move from one category to the other.
The business believes discussing total
fuel-related revenue and gross profit, including both fuel sales and into-plane arrangements (as recorded in the non-fuel revenue line) and related key
metrics on an aggregate basis, provides a more meaningful analysis of Atlantic Aviation. In 2010, the business derived 65.1% of total gross profit from
fuel and fuel-related services. In 2009, Atlantic Aviation derived 63.3% from these services.
Gross profit for 2010 increased 1.6%
compared with 2009 as a result of an increase in aggregate fuel-related gross profit, offset by lower gross profit from other services. The increase in
aggregate fuel-related gross profit resulted from a 2.8% increase in GA fuel volume, driven by increased business jet traffic. The full year GA fuel
volume increase reflects volume growth in the first nine months of the year and relatively flat volume in the fourth quarter as a result of weaker fuel
sales to military customers. Weighted average fuel margin increased by 2.0% compared with the previous year. Margins started to increase in the third
quarter and expanded at an accelerated rate in the fourth quarter.
71
Aviation-Related Business: Atlantic
Aviation – (continued)
The year-on-year change in fuel-related
gross profit includes a number of events which will not reoccur in any given year, such as the G-20 meeting in Pittsburgh in 2009 and the temporary
closure of the runway at Rifle airport in 2010. Excluding such events, GA fuel volume would have increased 5.8%, and weighted average fuel related
margin would have remained flat in 2010. Margin contraction in the first half of the year was offset by margin expansion in the second half of the
year. On the same basis, gross profit from other services would have decreased 1.1% for the year ended December 31, 2010.
Gross profit from other services
decreased by 3.9% for the quarter ended December 31, 2010 compared with the fourth quarter in 2009. The decrease in other services gross profit mainly
reflects non-recurring revenue recorded at a location in December 2009.
Selling, General and Administrative
Expenses
Selling, general and administrative
expenses decreased from 2009 to 2010 due to the ongoing cost reduction initiatives and a one time increase of $2.0 million to the bad debt reserve in
the first quarter of 2009 due to the deterioration of the accounts receivable aging. Accounts receivables aging improved significantly since the first
quarter of 2009. No further adjustment to the bad debt reserve was necessary in subsequent periods as a result of continued improvement in the aging of
accounts receivables. Excluding this one-time adjustment in 2009, the underlying selling, general and administrative expenses would have decreased by a
1.9% in 2010.
Atlantic Aviation expects selling,
general and administrative expense to be less than $175.0 million for 2011.
Goodwill Impairment
In addition to its annual impairment
test in the fourth quarter, the business performed an impairment test at the reporting unit level during the first six months of 2009. Goodwill is
considered impaired when the carrying amount of a reporting unit’s goodwill exceeds its implied fair value, as determined under a two step
approach. Based on the testing performed, the business recognized goodwill impairment charges of $71.2 million in the first six months of 2009. There
were no impairment charges in 2010.
Depreciation and Amortization
The decrease in depreciation and
amortization expense was due to non-cash impairment charges of $30.8 million incurred in the first half of 2009. There were no impairment charges in
2010.
Loss on disposal of assets
During 2010, Atlantic Aviation
completed a strategic review of its portfolio of FBOs. As a result of this process, the business concluded that several of its sites did not have
sufficient scale or serve a market with sufficiently strong growth prospects to warrant continued operations at these sites. Therefore, Atlantic
Aviation has undertaken to exit certain markets and redeploy resources that may be made available in the process into markets which it views as having
better growth profiles and recorded $17.9 million in loss on disposal of assets in the consolidated statement of operations.
Interest Expense, Net
Interest expense, net, primarily
includes interest incurred on the business’ debt, amortization of deferred financing costs and non-cash losses on derivatives instruments. These
items are summarized in the table below.
72
Aviation-Related Business: Atlantic
Aviation – (continued)
| Year Ended December 31, |
|||||||||||||||||||
|---|---|---|---|---|---|---|---|---|---|---|---|---|---|---|---|---|---|---|---|
| 2010 |
2009 |
Change Favorable/(Unfavorable) |
|||||||||||||||||
| $ |
$ |
$ |
% |
||||||||||||||||
| ($ In Thousands) | |||||||||||||||||||
Interest
income |
(17 | ) | (89 | ) | (72 | ) | (80.9 | ) | |||||||||||
Interest paid
on debt facility |
54,616 | 57,213 | 2,597 | 4.5 | |||||||||||||||
Amortization
of deferred financing costs |
2,984 | 3,144 | 160 | 5.1 | |||||||||||||||
Non-cash
losses on derivative instruments |
11,473 | 13,722 | 2,249 | 16.4 | |||||||||||||||
Less:
capitalized interest |
353 | (1,061 | ) | (1,414 | ) | (133.3 | ) | ||||||||||||
Total interest
expense, net |
69,409 | 72,929 | 3,520 | 4.8 | |||||||||||||||
The decrease in interest paid on debt
facility primarily reflects an aggregate $136.7 million of prepayments of the term loan principal since February 2009.
Income Taxes
Income generated by Atlantic Aviation
is included in our consolidated federal income tax return. The business files state income tax returns in more than 30 states in which it operates. The
tax expense in the table above includes both state taxes and the portion of the consolidated federal tax liability attributable to the
business.
While Atlantic Aviation as a whole
expects to generate a current year federal income tax loss, certain entities within the business will generate state taxable income. For the year ended
December 31, 2010, the business expects to pay state income taxes of approximately $1.0 million.
The business has approximately $59.0
million of state NOL carryforwards. State NOL carryforwards are specific to the state in which the NOL was generated and various states impose
limitations on the utilization of NOL carryforwards. Therefore, the business may incur state income tax liabilities in the near future, even if its
consolidated state taxable income is less than $59.0 million.
Year Ended December 31, 2009 Compared with Year Ended December 31, 2008
Key Factors Affecting Operating Results
• |
lower GA fuel volumes and essentially flat weighted average fuel margins; |
• |
higher interest expense related to interest rate swap break fee costs associated with prepayment of debt during 2009; partially offset by |
• |
lower compensation expense resulting from staff rationalization and decreased credit card fees stemming from lower jet fuel prices and lower activity levels. |
Revenue and Gross Profit
Gross profit for 2009 declined compared
with 2008 mainly due to lower volume of GA fuel sold. Fuel volumes declined 15.6% as compared with 2008. Weighted average margins, including into-plane
sales, were essentially flat. Excluding the results from the Charter operations and Management Contracts business, which were sold in the second half
of 2008, gross profit from other services (including hangar rentals, de-icing and miscellaneous services) decreased by 7.0% for the year, primarily due
to lower hangar rentals resulting from lower transient traffic.
Gross profit for the quarter ended
December 31, 2009 decreased by 6.5% compared with the fourth quarter of 2008 as a result of lower fuel volume, decreased weighted average fuel margin
and weaker de-icing activities. Gross profit for the fourth quarter of 2009 is sequentially flat compared with the third quarter of 2009 as de-icing
revenue, higher fuel volume and miscellaneous FBO services were offset by lower weighted average fuel margins resulting from customer mix. GA fuel
volume increased 5.4% as compared with third quarter of 2009 as business jet traffic at Atlantic Aviation’s FBOs improved.
73
Aviation-Related Business: Atlantic
Aviation – (continued)
Selling, General and Administrative Expenses
The decrease in selling, general and
administrative expenses is primarily due to integration synergies and the implementation of cost reduction initiatives. These cost savings were offset
by a $2.4 million increase in the bad debt reserve in the first quarter of 2009 due to the deterioration of the accounts receivables aging. Account
receivables aging improved significantly since the first quarter of 2009.
Selling, general and administrative
expenses for the quarter ended December 31, 2009 declined 6.5% compared with the fourth quarter of 2008 as a result of cost reduction initiatives.
Operating cost sequentially increased by 4.2% reflecting typical seasonality of the business driven by increase utilities expense, repairs and
maintenance expense and overtime expense related to snow removal.
Goodwill Impairment
In addition to its annual impairment
test in the fourth quarter, the business performed an impairment test at the reporting unit level during the first six months of 2009. Goodwill is
considered impaired when the carrying amount of a reporting unit’s goodwill exceeds its implied fair value, as determined under a two step
approach. Based on the testing performed, the business recognized goodwill impairment charges of $71.2 million in the first six months of 2009 and
$52.0 million in the fourth quarter of 2008, respectively.
Depreciation and Amortization
The decrease in depreciation and
amortization expense was due to non-cash impairment charges of $30.8 million incurred in the first half of 2009 as compared with a non-cash cash
impairment charge of $35.5 million in the fourth quarter of 2008.
Interest Expense, Net
Interest expense, net, primarily
includes interest incurred on the business’ debt, amortization of deferred financing costs and non-cash losses on derivatives instruments. These
items are summarized in the table below.
| Year Ended December 31, |
|||||||||||||||||||
|---|---|---|---|---|---|---|---|---|---|---|---|---|---|---|---|---|---|---|---|
| 2009 |
2008 |
Change Favorable/(Unfavorable) |
|||||||||||||||||
| $ |
$ |
$ |
% |
||||||||||||||||
| ($ In Thousands) | |||||||||||||||||||
Interest
income |
(89 | ) | (576 | ) | (487 | ) | (84.5 | ) | |||||||||||
Interest paid
on debt facility |
57,213 | 62,622 | 5,409 | 8.6 | |||||||||||||||
Amortization
of deferred financing costs |
3,144 | 2,613 | (531 | ) | (20.3 | ) | |||||||||||||
Non-cash
losses on derivative instruments |
13,722 | — | (13,722 | ) | NM | ||||||||||||||
Less:
capitalized interest |
(1,061 | ) | (1,692 | ) | (631 | ) | (37.3 | ) | |||||||||||
Total interest
expense, net |
72,929 | 62,967 | (9,962 | ) | (15.8 | ) | |||||||||||||
NM — Not
meaningful
Interest expense increased despite a
reduction of $81.6 million of debt due to the payment of $8.8 million of swap termination fees paid during 2009.
Income Taxes
Income generated by Atlantic Aviation
is included in our consolidated federal income tax return. The business files separate state income tax returns in more than 30 states in which it
operates. The tax expense in
74
Aviation-Related Business: Atlantic
Aviation – (continued)
the table above includes both state taxes and the portion of the consolidated federal tax liability attributable to the business.
While the business as a whole generated
a current year federal income tax loss, certain entities within the business did generate state taxable income. The current state income tax expense in
2009 was approximately $1.0 million.
Liquidity and Capital Resources
Consolidated
Our primary cash requirements include
normal operating expenses, debt service, debt principal payments, payments of dividends and maintenance capital expenditures. Our primary source of
cash is operating activities, although we may borrow against existing credit facilities for growth capital expenditures, issue additional LLC interests
or sell assets to generate cash.
We believe we achieved prudent levels
of cash reserves at both our holding company and operating companies. In addition, our results of operations and balance sheet have improved
sufficiently, along with improved capital market conditions, to give us confidence in our ability to refinance our debt on or before maturity. As a
result, we expect to declare a quarterly cash dividend for the first quarter of 2011 of $0.20 per share to be paid during the second quarter of 2011.
We currently expect to sustain this dividend for the foreseeable future.
In determining the amount of the
dividend, we had expected to include certain funds from the cash flow of IMTT. Distribution of funds to us from IMTT is governed by the
Shareholders’ Agreement between us and the co-investor that owns the remaining 50% stake. The co-investor has refused to vote in favor of
distributing certain of these funds, and we believe that such a refusal violates the Shareholders’ Agreement. As a result, we have formally
initiated the dispute resolution process in the Shareholders’ Agreement, and intend to proceed to arbitration with the co-investor if a
satisfactory resolution cannot be reached within the timeframe prescribed in the Shareholders’ Agreement. Contingent upon the favorable outcome of
the arbitration and the continued recovery of operating and capital market environments, we believe we could increase the quarterly dividend to as much
as $0.375 per share.
The precise timing and amount of any
future distribution will be based on the continued stable performance of the Company’s businesses and the economic conditions prevailing at the
time of any authorization. Management believes that any distribution would be characterized as a dividend for tax purposes rather than as a return of
capital.
We believe that our operating
businesses will have sufficient liquidity and capital resources to meet future requirements, including servicing long-term debt obligations and making
distribution payments. We base our assessment of the sufficiency of our liquidity and capital resources on the following assumptions:
• |
our businesses and investments overall generate, and we expect will continue to generate, significant operating cash flow; |
• |
the ongoing maintenance capital expenditures associated with our businesses are readily funded from their respective operating cash flow or available financing; |
• |
all significant short-term growth capital expenditures will be funded with cash on hand or from committed undrawn credit facilities; and |
• |
we will be able to refinance, extend and/or repay the principal amount of maturing long-term debt on terms that can be supported by our businesses. |
We have capitalized our businesses, in
part, using project finance style debt. Project finance style debt is limited-recourse, floating rate, non-amortizing debt with a medium term maturity
of between five and seven
75
Liquidity and Capital
Resources: Consolidated – (continued)
years, although the principal balance on the term loan debt at Atlantic Aviation is being prepaid using the excess cash generated by the business. At December 31, 2010, the average remaining maturity of the drawn balances of the primary debt facilities across all of our businesses, including our proportional interest in the revolving credit facility of IMTT, was approximately 3.6 years. In light of the improvement in the functioning of the credit markets generally, and the leverage and interest coverage ratios, we expect each of these businesses to successfully refinance their long-term debt on economically reasonable terms on or before maturity.
Until March 31, 2010, MIC Inc. had a
revolving credit facility provided by various financial institutions, including entities within the Macquarie Group. The facility was repaid in full in
December 2009 and no amounts were outstanding under the revolving credit facility as of December 31, 2009 or at the facility’s maturity on March
31, 2010. This facility was not renewed or replaced. We have no holding company debt.
The section below discusses the sources
and uses of cash on a consolidated basis and for each of our businesses and investments. All inter-company activities such as corporate allocations,
capital contributions to our businesses and distributions from our businesses have been excluded from the tables as these transactions are eliminated
in consolidation.
COMMITMENTS AND CONTINGENCIES
The following table summarizes our
future obligations, due by period, as of December 31, 2010, under our various contractual obligations and commitments. We had no off-balance sheet
arrangement at that date or currently. The following information does not include IMTT, which is not consolidated.
| Payments Due by Period |
|||||||||||||||||||||||
|---|---|---|---|---|---|---|---|---|---|---|---|---|---|---|---|---|---|---|---|---|---|---|---|
| Total |
Less than One Year |
1–3 Years |
3–5 Years |
More than 5 Years |
|||||||||||||||||||
| ($ In Thousands) | |||||||||||||||||||||||
Long-term
debt(1) |
$ | 1,138,884 | $ | 49,325 | $ | 290,405 | $ | 799,154 | $ | — | |||||||||||||
Interest
obligations |
208,919 | 74,610 | 104,845 | 29,464 | — | ||||||||||||||||||
Capital lease
obligations(2) |
148 | 85 | 50 | 13 | — | ||||||||||||||||||
Notes payable
|
1,347 | 990 | 186 | 171 | — | ||||||||||||||||||
Operating
lease obligations(3) |
411,773 | 33,358 | 63,605 | 57,857 | 256,953 | ||||||||||||||||||
Time charter
obligations(4) |
1,880 | 768 | 1,112 | — | — | ||||||||||||||||||
Pension
benefit obligations |
24,894 | 2,136 | 4,746 | 4,883 | 13,129 | ||||||||||||||||||
Post-retirement benefit obligations |
2,059 | 213 | 429 | 385 | 1,032 | ||||||||||||||||||
Other
|
533 | 417 | 116 | — | — | ||||||||||||||||||
Total
contractual cash obligations(5) |
$ | 1,790,437 | $ | 161,902 | $ | 465,494 | $ | 891,927 | $ | 271,114 | |||||||||||||
(1) |
The long-term debt represents the consolidated principal obligations to various lenders. The debt facilities, which are obligations of the operating businesses and have maturities between 2013 and 2014, are subject to certain covenants, the violation of which could result in acceleration of the maturity dates. |
(2) |
Capital lease obligations are for the lease of certain transportation equipment. Such equipment could be subject to repossession upon violation of the terms of the lease agreements. |
(3) |
This represents the minimum annual rentals required to be paid under non-cancelable operating leases with terms in excess of one year. |
(4) |
The Gas Company currently has a time charter arrangement for the use of two barges for transporting liquefied petroleum gas between Oahu and its neighbor islands. |
(5) |
The above table does not reflect certain long-term obligations, such as deferred taxes, for which we are unable to estimate the period in which the obligation will be incurred. |
76
Liquidity and Capital
Resources: Consolidated – (continued)
In addition to these commitments and
contingencies, we typically incur capital expenditures on a regular basis to:
• |
maintain our existing revenue-producing assets in good working order (“maintenance capital expenditures”); and |
• |
expand our existing revenue-producing assets or acquire new ones (“growth capital expenditures”). |
See “Investing Activities”
below for further discussion of capital expenditures.
We also have other contingencies,
including pending threatened legal and administrative proceedings that are not reflected above as amounts at this time are not ascertainable. See
“Legal Proceedings” in Part I, Item 3.
Our sources of cash to meet these
obligations are as follows:
• |
cash generated from our operations (see “Operating Activities” below); |
• |
sale of all or part of any of our businesses (see “Investing Activities” below); |
• |
refinancing our current credit facilities on or before maturity (see “Financing Activities” below); and |
• |
cash available from our undrawn credit facilities (see “Financing Activities” below). |
Analysis of Consolidated Historical Cash Flows from Continuing
Operations
| Year Ended December 31, |
|||||||||||||||||||||||||||||||
|---|---|---|---|---|---|---|---|---|---|---|---|---|---|---|---|---|---|---|---|---|---|---|---|---|---|---|---|---|---|---|---|
| 2010 |
2009 |
2008 |
Change (From 2009 to 2010) Favorable/(Unfavorable) |
Change (From 2008 to 2009) Favorable/(Unfavorable) |
|||||||||||||||||||||||||||
| ($ In Thousands) |
$ |
$ |
$ |
$ |
% |
$ |
% |
||||||||||||||||||||||||
Cash provided
by operating activities |
98,555 | 82,976 | 95,579 | 15,579 | 18.8 | (12,603 | ) | (13.2 | ) | ||||||||||||||||||||||
Cash used in
investing activities |
(24,774 | ) | (516 | ) | (56,716 | ) | (24,258 | ) | NM | 56,200 | 99.1 | ||||||||||||||||||||
Cash (used in)
provided by financing activities |
(76,528 | ) | (117,818 | ) | 1,698 | 41,290 | 35.0 | (119,516 | ) | NM | |||||||||||||||||||||
NM — Not
meaningful
Operating Activities
Consolidated cash provided by operating
activities comprises primarily the cash from operations of the businesses we own, as described in each of the business discussions below. The cash flow
from our consolidated business’ operations is partially offset by expenses paid at the holding company, including base management fees paid in
cash, professional fees and interest incurred in the prior periods on any amounts drawn on our revolving credit facility.
The increase in consolidated cash
provided by operating activities from 2009 to 2010 was primarily due to:
• |
improved operating performance at Atlantic Aviation due to stable gross profit and cost savings; |
• |
lower interest paid on the reduced term loan balance for Atlantic Aviation and no interest paid on holding company debt; |
• |
a larger dividend received from IMTT; and |
• |
improved operating results at the consolidated energy-related businesses. |
77
Liquidity and Capital
Resources: Consolidated – (continued)
The decrease in consolidated cash
provided by operating activities from 2008 to 2009 was due primarily to:
• |
lower operating performance at Atlantic Aviation; and |
• |
payment of interest rate swap breakage fees relating to the prepayment of the outstanding principal balance on Atlantic Aviation’s term loan debt; partially offset by |
• |
lower interest paid on the reduced term loan balance for Atlantic Aviation; |
• |
reduced levels of working capital, reflecting decreased activities combined with receivable collection efforts at Atlantic Aviation; and |
• |
improved operating results at The Gas Company. |
Distributions from IMTT are reflected
in our consolidated cash provided by operating activities only up to our 50% share of IMTT’s positive earnings. Amounts in excess of this, and any
distributions when IMTT records a net loss, are reflected in our consolidated cash from investing activities as a return of investment in
unconsolidated business. For 2010, $15.0 million in distributions were included in cash from operating activities compared with $7.0 million in 2009.
In 2008, $1.3 million of the $28.0 million dividends received were included in cash from operating activities and $26.7 million were included in cash
from investing activities.
We believe our operating activities
overall provide a source of sustainable and stable cash flows over the long-term with the opportunity for future growth due to:
• |
consistent customer demand driven by the basic nature of the services provided; |
• |
our strong competitive position due to factors including: |
• |
high initial development and construction costs; |
• |
difficulty in obtaining suitable land near many of our operations (for example, airports, waterfront near ports); |
• |
long-term concessions/contracts; |
• |
required government approvals, which may be difficult or time-consuming to obtain; |
• |
lack of cost-efficient alternatives to the services we provide in the foreseeable future; and |
• |
product/service pricing that we expect to generally keep pace with price changes due to factors including: |
• |
consistent demand; |
• |
limited alternatives; |
• |
contractual terms; and |
• |
regulatory rate setting. |
Investing Activities
The increase in consolidated cash used
in investing activities from 2009 to 2010 was primarily due to:
• |
cash received from the sale of the noncontrolling stake in District Energy in 2009; and |
• |
higher capital expenditures at The Gas Company; partially offset by |
• |
lower capital expenditures at District Energy in 2010; and |
• |
cash received in 2010 from the PCAA bankruptcy estate for expenses paid on behalf of PCAA during its operations. |
78
Liquidity and Capital
Resources: Consolidated – (continued)
The decrease in consolidated cash used
in investing activities from 2008 to 2009 was primarily due to:
• |
the absence of acquisition activity in 2009; |
• |
cash received from the sale of the noncontrolling stake in District Energy in 2009 compared with the sale of two small, non-core businesses at Atlantic Aviation in 2008; |
• |
lower capital expenditures at Atlantic Aviation and The Gas Company; partially offset by |
• |
cash retained by IMTT to fund growth capital expenditures during 2009; and |
• |
increase in capital expenditures at District Energy in 2009 for the expansion of a new plant. |
The primary driver of cash used in
investing activities in our consolidated cash flows has been acquisitions of businesses in new and existing segments, and the sale of the
noncontrolling stake in District Energy. The other main driver is capital expenditures. Maintenance capital expenditures are generally funded by cash
from operating activities and growth capital expenditures generally have been funded by drawing on our available credit facilities or by equity
capital. We may fund maintenance capital expenditures from credit facilities or equity capital and growth capital expenditures from operating
activities from time to time. We expect that our growth capital expenditures will generally be yield accretive once placed in service. Acquisitions of
businesses are generally funded on a long-term basis through raising additional equity capital and/or project-financing style credit facilities. On
December 28, 2009, with the cash received from the sale of the 49.99% noncontrolling interest in District Energy, and cash on hand, we paid off the
outstanding principal balance of the facility.
In December 2010, the Tax Relief,
Unemployment Insurance Reauthorization and Job Creation Act of 2010 (the “Act”) was signed. The Act provides for 100% bonus depreciation for
certain fixed assets placed in service after September 8, 2010 and before January 1, 2012, and 50% bonus depreciation for certain fixed assets placed
in service during 2012 for federal income tax purposes. Generally, states do not allow this bonus depreciation deduction in determining state taxable
income. Importantly, Illinois and Louisiana, two states in which we have significant operations, do permit the use of bonus depreciation in calculating
state taxable income. We will take into consideration the benefits of these accelerated depreciation provisions of the Act when evaluating our capital
expenditure plans for 2011 and 2012.
Financing Activities
The decrease in consolidated cash used
in financing activities from 2009 to 2010 was primarily due to:
• |
higher debt repayment during 2009 at Atlantic Aviation; and |
• |
full repayment of the MIC Inc. revolving credit facility during 2009; partially offset by |
• |
debt draw downs at District Energy and The Gas Company to fund capital expenditures during 2009; |
• |
full repayment on The Gas Company working capital facility during 2010; and |
• |
distributions paid to the noncontrolling interest at District Energy. |
The increase in consolidated cash used
in financing activities from 2008 to 2009 was primarily due to:
• |
debt repayment during 2009 at Atlantic Aviation; |
• |
debt draw downs in 2008, primarily against the MIC Inc. revolving credit facility, to fund acquisitions; and |
• |
full repayment of the MIC Inc. revolving credit facility; partially offset by |
• |
the suspension of distributions to shareholders in 2009; and |
• |
the increase in debt draw downs at District Energy to fund capital expenditures. |
79
Liquidity and Capital
Resources: Consolidated – (continued)
The primary drivers of cash provided by
financing activities are equity offerings, debt financing of acquisitions and capital expenditures, the subsequent refinancing of our businesses and
the repayment of the outstanding principal balance on maturing debt. A smaller portion of cash provided by financing activities relates to principal
payments on capital leases.
For 2011, we expect to apply
substantially all excess cash flows from Atlantic Aviation to prepay the debt principal under the amended terms of the credit facility. Actual
prepayment amounts through the maturity of the facility will depend on the operating performance of the business.
Our businesses are capitalized with a
mix of equity and project-financing style debt. We believe we can prudently maintain relatively high levels of leverage due to the generally
sustainable and stable long-term cash flows our businesses have provided in the past and which we currently expect to continue in the future as
discussed above. Our project finance debt is non-amortizing and we expect to be able to refinance the outstanding balances of the term loan on or
before maturity, except at Atlantic Aviation, where all excess cash flow from the business is being used to prepay the outstanding principal balance of
the term loan. Similarly, excess cash flow generated at District Energy will be applied toward the principal balance of the term loan during the last
two years before maturity. The majority of our businesses also maintain revolving capital expenditure and/or working capital
facilities.
See below for further description of
the cash flows related to our businesses.
Energy-Related Businesses
IMTT
The following analysis represents 100%
of the cash flows of IMTT, rather than just the composition of cash flows that are included in our consolidated cash flows. We believe this is the most
appropriate and meaningful approach to discussing the historical cash flow trends of IMTT. We account for our 50% ownership of this business using the
equity method. Distributions from IMTT when IMTT records a net loss, or pays distributions in excess of our share of its earnings, are reflected in
investing activities in our consolidated cash flow.
| Year Ended December 31, |
|||||||||||||||||||||||||||||||
|---|---|---|---|---|---|---|---|---|---|---|---|---|---|---|---|---|---|---|---|---|---|---|---|---|---|---|---|---|---|---|---|
| 2010 |
2009 |
2008 |
Change (From 2009 to 2010) Favorable/(Unfavorable) |
Change (From 2008 to 2009) Favorable/(Unfavorable) |
|||||||||||||||||||||||||||
| ($ In Thousands) |
$ |
$ |
$ |
$ |
% |
$ |
% |
||||||||||||||||||||||||
Cash provided
by operating activities |
196,187 | 133,382 | 94,087 | 62,805 | 47.1 | 39,295 | 41.8 | ||||||||||||||||||||||||
Cash used in
investing activities |
(168,084 | ) | (141,216 | ) | (166,640 | ) | (26,868 | ) | (19.0 | ) | 25,424 | 15.3 | |||||||||||||||||||
Cash (used in)
provided by financing activities |
(20,249 | ) | 6,262 | 71,815 | (26,511 | ) | NM | (65,553 | ) | (91.3 | ) | ||||||||||||||||||||
NM — Not
meaningful
Operating Activities
Cash provided by operating activities
at IMTT is generated primarily from storage rentals and ancillary services that are billed monthly and paid on various terms. Cash used in operating
activities is mainly for payroll and benefits costs, maintenance and repair of fixed assets, utilities and professional services, interest payments and
payments to tax jurisdictions. Cash provided by operating activities increased primarily due to cash received from customers in connection with the oil
spill in the Gulf of Mexico and improved terminal operating results.
Cash provided by operating activities
in 2009 increased primarily due to the collection of accounts receivable outstanding at 2008 and improved operating results, partially offset by an
increase in cash interest paid.
80
Energy-Related
Businesses: IMTT – (continued)
Investing Activities
Cash used in investing activities
primarily relates to capital expenditures and an investment in a tax-exempt bond escrow in 2010.
The increase in cash used in investing
activities was primarily due to the tax-exempt bond escrow, partially offset by lower capital expenditures in 2010 as compared with 2009. Total capital
expenditures decreased from $137.0 million in 2009 to $107.8 million in 2010 primarily reflecting a reduction in growth capital expenditures, partially
offset by an increase in maintenance capital expenditures.
Capital expenditures decreased from
$221.7 million in 2008 to $137.0 million in 2009, reflecting a reduction in growth capital expenditures as projects were completed. Maintenance capital
expenditures also decreased in the same period, resulting from reduced levels of tank inspections and repairs and remediation work at the Bayonne
facility. However, cash used in investing activities in 2008 was offset by $55.5 million of proceeds received from the sale of GO Zone Bond
investments, which did not recur in 2009.
Maintenance Capital Expenditure
IMTT incurs maintenance capital
expenditures to prolong the useful lives and increase the service capacity of existing revenue-producing assets. Maintenance capital expenditures
include the refurbishment of storage tanks, piping, dock facilities, and environmental capital expenditures, principally in relation to improvements in
containment measures and remediation.
During the years ended December 31,
2010, 2009 and 2008, IMTT incurred $45.0 million, $40.0 million and $42.7 million, respectively, on maintenance capital expenditures, including (i)
$37.5 million, $36.0 million and $35.4 million, respectively, principally in relation to refurbishments of tanks, docks and other infrastructure and
(ii) $7.5 million, $4.0 million and $7.3 million, respectively, on environmental capital expenditures, principally in relation to improvements in
containment measures and remediation.
For the full-year 2011, IMTT expects to
spend approximately $55.0 million on maintenance capital expenditures. IMTT anticipates that maintenance capital expenditures will remain at elevated
levels through 2014.
Growth Capital Expenditure
During 2010, IMTT incurred growth
capital expenditures of $65.8 million. This compares to growth capital expenditures incurred of $82.6 million and $187.6 million for 2009 and 2008,
respectively.
The 2010 expenditure included the
completion of the majority of projects for the construction or refurbishment of barrels of storage that had been previously announced. In total, the
projects outstanding at December 31, 2009 cost $94.2 million and added 2.2 million barrels of storage which are expected to contribute $19.2 million to
gross profit and EBITDA on an annualized basis. These projects were commissioned at various points in 2010 and contributed $12.2 million to the 2010
results.
During 2010, IMTT committed to
construct or refurbish 2.9 million barrels of storage. These projects are expected to cost $125.0 million in total and contribute $21.4 million to
gross profit and EBITDA on an annualized basis. The projects are expected to be commissioned during 2011 and early 2012. At December 31, 2010, $100.2
million of the $125.0 million remained to be spent.
In addition, IMTT is engaged in the
construction or upgrade of storage related infrastructure. During 2010, IMTT spent $25.6 million on infrastructure projects with $11.2 million
remaining to be spent.
In December 2010, the Tax Relief,
Unemployment Insurance Reauthorization and Job Creation Act of 2010 (the “Act”) was signed. The Act provides for 100% bonus depreciation for
certain fixed assets placed in service after September 8, 2010 and before January 1, 2012, and 50% bonus depreciation for certain fixed assets placed
in service during 2012 for federal income tax purposes. Generally, states do not allow this bonus
81
Energy-Related
Businesses: IMTT – (continued)
depreciation deduction in determining state taxable income. Importantly, Louisiana, in which IMTT has significant operations, does permit the use of bonus depreciation in calculating state taxable income. IMTT will take into consideration the benefits of these accelerated depreciation provisions of the Act when evaluating its capital expenditure plans for 2011 and 2012.
Financing Activities
Cash flows from financing activities
decreased primarily due to net debt repayments in 2010 as compared with net borrowings in 2009 and increased distributions to its shareholders. During
2010, IMTT made $15.0 million of distributions to each of its shareholders, compared with $7.0 million to each of its shareholders in 2009. Cash flows
provided by financing activities decreased from 2008 to 2009 primarily due to decreases in debt draw downs on the revolving credit facility, offset by
the Regions term loan used to fund growth capital expenditures, lower dividend payments and the repayment of shareholder loans in
2009.
At December 31, 2010, the outstanding
balance on IMTT’s debt facilities, excluding capitalized leases, consisted of $98.2 million in revolving credit facilities, $336.3 million in
letter of credit backed tax exempt bonds, $190.0 million in bank owned tax exempt bonds and $31.3 million in shareholder loans. The weighted average
interest rate of the outstanding debt facilities, including any interest rate swaps and fees associated with outstanding letters of credit is 4.84%.
Cash interest paid was $34.1 million, $29.0 million and $25.7 million for 2010, 2009 and 2008, respectively.
The following tables summarize the key
terms of IMTT’s senior debt facilities as of December 31, 2010.
Revolving Credit Facility
On June 7, 2007, IMTT entered into a
Revolving Credit Agreement with Suntrust Bank, Citibank N.A., Regions Bank, Rabobank Nederland, Branch Banking & Trust Co., DNB NOR Bank ASA, Bank
of America N.A., BNP Paribas, Bank of Montreal, The Royal Bank of Scotland PLC, Mizuho Corporate Bank Ltd. and eight other banks establishing a $600.0
million U.S. dollar denominated revolving credit facility and a $25.0 million equivalent Canadian dollar revolving credit facility. The Agreement also
allowed for an increase in the U.S. dollar denominated revolving credit facility of up to $300.0 million on the same terms at the election of IMTT. No
increased commitments were sought from the lenders.
On June 18, 2010, IMTT amended its
revolving credit facility. The amendment increased the size of the facility from $625.0 million to $1.1 billion and extended the maturity on $970.0
million by two years from June 7, 2012 to June 7, 2014, with the remaining $130.0 million maturing on June 7, 2012. The facility was used to fully
repay the $30.0 million Regions Term Loan as well as the $65.0 million DNB Term Loan in full. Subsequently, an additional $55.0 million has been
extended to June 7, 2014. The facility is guaranteed by IMTT’s key operating subsidiaries.
In addition, the amendment now allows
IMTT to agree, in other debt agreements, that if IMTT is ever required to collateralize the revolving credit facility, it will collateralize the other
debt on a pari-passu basis. The increased commitment will be used to fund IMTT’s expansion and is expected to be more than adequate to fully fund
existing and reasonably foreseeable growth capital expenditure plans.
The revolving credit facilities have
been used primarily to fund IMTT’s growth capital expenditures in the U.S. and Canada. The terms of IMTT’s U.S. dollar and Canadian dollar
denominated revolving credit facilities are summarized in the table below.
82
Energy-Related
Businesses: IMTT – (continued)
| USD Revolving Credit Facility — Extended |
USD Revolving Credit Facility — Non Extended |
USD DNB Nor Loans |
CAD Revolving Credit Facility — Extended |
|||||||||||||||
|---|---|---|---|---|---|---|---|---|---|---|---|---|---|---|---|---|---|---|
Total Committed
Amount |
$930.0
million |
$75.0
million |
$65.0
million |
$30.0
million |
||||||||||||||
Maturity |
June 7,
2014 |
June 7,
2012 |
December 31, 2012
(at which time it converts to USD Revolving Credit Facility – Extended) |
June 7,
2014 |
||||||||||||||
Amortization |
Revolving,
payable at maturity |
Revolving,
payable at maturity |
Term loan,
payable at maturity |
Revolving,
payable at maturity |
||||||||||||||
Interest
Rate |
Floating at LIBOR
plus a margin based on the ratio of Debt to adjusted EBITDA of IMTT and its affiliates as follows: |
Floating at LIBOR
plus a margin based on the ratio of Debt to adjusted EBITDA of IMTT and its affiliates as follows: |
Floating at LIBOR
plus 1.0% through December 2012, thereafter per the terms of the USD Revolving Credit Facility |
Floating at
Bankers’ Acceptances (BA) Rate plus a margin based on the ratio of Debt to adjusted EBITDA of IMTT and its affiliates, as
follows: |
||||||||||||||
< 2.0x
L+1.50% |
< 2.0x
L+0.55% |
< 2.0x
BA+1.50% |
||||||||||||||||
< 2.5x
L+1.75% |
< 2.5x
L+0.70% |
< 2.5x
BA+1.75% |
||||||||||||||||
< 3.0x
L+2.00% |
< 3.0x
L+0.85% |
< 3.0x
BA+2.00% |
||||||||||||||||
< 3.75x
L+2.25% |
< 3.75x
L+1.00% |
< 3.75x
BA+2.25% |
||||||||||||||||
< 4.0x
L+2.50% |
< 4.0x
L+1.25% |
< 4.0x
BA+2.50% |
||||||||||||||||
> = 4.0x
L+2.75% |
> = 4.0x
L+1.50% |
> = 4.0x
BA+2.75% |
||||||||||||||||
Commitment
Fees |
A percentage of
undrawn committed amounts based on the ratio of Debt to adjusted EBITDA of IMTT and its affiliates, as follows: |
A percentage of
undrawn committed amounts based on the ratio of Debt to adjusted EBITDA of IMTT and its affiliates, as follows: |
N/A |
A percentage of
undrawn committed amounts based on the ratio of Debt to adjusted EBITDA of IMTT and its affiliates, as follows: |
||||||||||||||
< 2.0x
0.250% |
< 2.0x
0.125% |
< 2.0x
0.250% |
||||||||||||||||
< 2.5x
0.250% |
< 2.5x
0.150% |
< 2.5x
0.250% |
||||||||||||||||
< 3.0x
0.250% |
< 3.0x
0.175% |
< 3.0x
0.250% |
||||||||||||||||
< 3.75x
0.375% |
< 3.75x
0.200% |
< 3.75x
0.375% |
||||||||||||||||
< 4.0x
0.375% |
< 4.0x
0.250% |
< 4.0x
0.375% |
||||||||||||||||
> = 4.0x
0.500% |
> = 4.0x
0.250% |
> = 4.0x
0.500% |
||||||||||||||||
Restrictions on
Payments of Dividends |
None, provided no
default as a result of payment |
None, provided no
default as a result of payment |
None, provided no
default as a result of payment |
None, provided no
default as a result of payment |
||||||||||||||
The Revolving Credit Facility is
unsecured except for a pledge of 65% of shares in IMTT’s two Canadian affiliates.
Each of the above components of
IMTT’s Revolving Credit Facility includes a covenant limiting the Debt to EBITDA ratio to a maximum of 4.75x. At December 31, 2010, IMTT’s
Debt to EBITDA ratio was 2.36x. IMTT’s Revolving Credit Facility is also limited by a minimum Interest Coverage Ratio of 3.0x. At December 31,
2010, IMTT’s Interest Coverage Ratio was 7.82x.
Of the $449.0 million outstanding
balance against the revolving credit facility, IMTT had drawn $98.2 million in cash and issued $350.8 million in letters of credit primarily backing
tax-exempt GO Zone bonds and NJEDA bonds.
To partially hedge the interest rate
risk associated with IMTT’s current floating rate borrowings under the revolving credit agreement, IMTT entered into a 10 year fixed quarterly
LIBOR swap, maturing in March 2017, with a notional amount of $135.0 million as of December 31, 2010 increasing to $200.0 million by December 31, 2012,
at a fixed rate of 5.507%.
83
Energy-Related
Businesses: IMTT – (continued)
IMTT has also entered into a $52.0
million, 6.29% fixed vs. LIBOR interest rate swap expiring December, 2012.
Gulf Opportunity Zone Bonds (“GO Zone
Bonds”)
In August, November and December of
2010, IMTT closed on $85.0 million, $100.0 million and $90.0 million of additional GO Zone Bonds, respectively. Proceeds were/will be used to reimburse
IMTT for qualified project costs and/or fund future projects.
IMTT sold $190.0 million of the
additional GO Zone Bonds issued in 2010 to banking institutions. This issuance does not need to be backed by a letter of credit and will incur a lower
interest rate, equal to 68% of 30 day LIBOR plus 65% of the applicable margin (per the revolving credit agreement).
The $300.0 million of GO Zone Bonds
that were not sold to banking institutions are required to be supported at all times by bank letters of credit issued under the revolving credit
facility.
The key terms of the GO Zone Bonds
issued are summarized in the table below:
| Facility Term |
Gulf Opportunity Zone Bonds I |
Gulf Opportunity Zone Bonds II |
Gulf Opportunity Zone Bonds III |
Gulf Opportunity Zone Bonds IV |
||||||||||||||
|---|---|---|---|---|---|---|---|---|---|---|---|---|---|---|---|---|---|---|
Amount
outstanding as of December 31, 2010 |
$215.0
million |
$85.0
million |
$100.0
million |
$90.0
million |
||||||||||||||
Maturity |
July
2043 |
August
2046 |
December
2040 |
December
2040 |
||||||||||||||
Amortization |
Payable at
maturity |
Payable at
maturity |
Payable at
maturity. Monthly amortization beginning July 2011 and mandatory tender for purchase by the company five years after issuance. |
Payable at
maturity. Monthly amortization beginning July 2011 and mandatory tender for purchase by the company five years after issuance. |
||||||||||||||
Interest
Rate |
Floating at tax
exempt bond weekly tender rates |
Floating at tax
exempt bond weekly tender rates |
Monthly at 68% of
1-month LIBOR plus 65% of LIBOR margin under Revolving Credit Agreement |
Monthly at 68% of
1-month LIBOR plus 65% of LIBOR margin under Revolving Credit Agreement |
||||||||||||||
Security |
Secured (required
to be supported at all times by bank letter of credit issued under the revolving credit facility) |
Secured (required
to be supported at all times by bank letter of credit issued under the revolving credit facility) |
Unsecured |
Unsecured |
||||||||||||||
Financial
Covenants (applicable to IMTT’s key operating subsidiaries on a combined basis) |
None |
None |
Same as Revolving
Credit Facility |
Same as Revolving
Credit Facility |
||||||||||||||
Restrictions on
Payments of Dividends |
None, provided no
default as a result of payment |
None, provided no
default as a result of payment |
None, provided no
default as a result of payment |
None, provided no
default as a result of payment |
||||||||||||||
Interest Rate
Hedging |
Hedged through
June 2017 with $215.0 million at 3.662% fixed vs. 67% of monthly LIBOR interest rate swap |
None |
None |
None |
||||||||||||||
84
Energy-Related
Businesses: IMTT – (continued)
New Jersey Economic Development Authority Bonds (“NJEDA Bonds”)
The key terms of the NJEDA Bonds issued
are summarized in the table below:
| Facility Term |
New Jersey Economic Development Authority Dock Facility Revenue Refund Bonds |
New Jersey Economic Development Authority Variable-Rate Demand Revenue Refunding Bond |
||||||||
|---|---|---|---|---|---|---|---|---|---|---|
Amount
outstanding as of December 31, 2010 |
$30.0
million |
$6.3
million |
||||||||
Maturity |
December
2027 |
December
2021 |
||||||||
Amortization |
Payable at
maturity |
Payable at
maturity |
||||||||
Interest
Rate |
Floating at tax
exempt bond daily tender rates |
Floating at tax
exempt bond daily tender rates |
||||||||
Security |
Secured (required
to be supported at all times by bank letter of credit issued under the revolving credit facility) |
Secured (required
to be supported at all times by bank letter of credit issued under the revolving credit facility) |
||||||||
Financial
Covenants (applicable to IMTT’s operating subsidiaries on a combined basis) |
None |
None |
||||||||
Restrictions on
Payments of Dividends |
None, provided no
default as a result of payment |
None, provided no
default as a result of payment |
||||||||
Interest Rate
Hedging |
Hedged through
November, 2012 with $30.0 million at 3.41% fixed vs.67% of LIBOR interest rate swap |
Hedged through
November, 2012 with $6.3 million at 3.41% fixed vs. 67% of LIBOR interest rate swap |
||||||||
In addition to the debt facilities
discussed above, IMTT Holdings Inc. received loans from its shareholders other than MIC from 2006 to 2008. The shareholder loans have a fixed interest
rate of 5.5% and will be repaid over 15 years by IMTT Holdings Inc. with equal quarterly amortization that commenced March 31, 2008. Shareholder loans
of $31.3 million were outstanding as of December 31, 2010.
The Gas Company
| Year Ended December 31, |
|||||||||||||||||||||||||||||||
|---|---|---|---|---|---|---|---|---|---|---|---|---|---|---|---|---|---|---|---|---|---|---|---|---|---|---|---|---|---|---|---|
| 2010 |
2009 |
2008 |
Change (From 2009 to 2010) Favorable/(Unfavorable) |
Change (From 2008 to 2009) Favorable/(Unfavorable) |
|||||||||||||||||||||||||||
| ($ In Thousands) |
$ |
$ |
$ |
$ |
% |
$ |
% |
||||||||||||||||||||||||
Cash provided
by operating activities |
29,331 | 25,560 | 27,078 | 3,771 | 14.8 | (1,518 | ) | (5.6 | ) | ||||||||||||||||||||||
Cash used in
investing activities |
(10,549 | ) | (7,105 | ) | (9,424 | ) | (3,444 | ) | (48.5 | ) | 2,319 | 24.6 | |||||||||||||||||||
Cash (used in)
provided by financing activities |
(19,000 | ) | 10,000 | 2,000 | (29,000 | ) | NM | 8,000 | NM | ||||||||||||||||||||||
NM — Not
meaningful
85
Energy-Related Businesses: The Gas
Company – (continued)
Operating Activities
The main driver for cash provided by
operating activities is customer receipts. These are offset in part by the timing of payments for fuel, materials, pipeline repairs, vendor services
and supplies, payroll and benefit costs, revenue-based taxes and payment of administrative costs. Customers are generally billed monthly and make
payments on account. Vendors and suppliers generally bill the business when services are rendered or when products are shipped.
The increase from 2009 to 2010 was
primarily due to improved operating results and lower cash pension payments in 2010 as compared with 2009, partially offset by an increased dollar
value of inventory held at December 31, 2010 due to higher input prices.
The decrease from 2008 to 2009 was
primarily due to higher cash pension payments and the exhaustion in 2008 of the escrow account established at acquisition, partially offset by improved
operating results.
Investing Activities
Cash used in investing activities is
primarily comprised of capital expenditures. Capital expenditures for the non-utility business are funded by cash from operating activities and capital
expenditures for the utility business are funded by drawing on credit facilities as well as cash from operating activities.
Maintenance Capital Expenditure
Maintenance capital expenditures
include replacement of pipeline sections, improvements to the business’ transmission system and SNG plant, improvements to buildings and other
property and the purchase of equipment.
Growth Capital Expenditure
Growth capital expenditures include the
purchase of meters, regulators and propane tanks for new customers, the cost of installing pipelines for new residential and commercial construction
and the renewable feedstock pilot program.
The following table sets forth
information about capital expenditures in The Gas Company:
| Maintenance |
Growth |
|||||||||
|---|---|---|---|---|---|---|---|---|---|---|
2008
|
$5.8 million |
$3.9 million |
||||||||
2009
|
$3.3 million |
$4.1 million |
||||||||
2010
|
$5.3 million |
$5.5 million |
||||||||
2011 projected
|
$7.6 million |
$6.0 million |
||||||||
Commitments at
December 31, 2010 |
$1.7 million |
$ 276,000 |
||||||||
The business expects to fund its total
2011 capital expenditures primarily from cash from operating activities and available debt facilities. Capital expenditures for 2011 are expected to be
higher than 2010 due to completion of the renewable feedstock project, required pipeline maintenance and inspection projects related to the integrity
management program due by 2012 and expansion of storage facilities.
Capital expenditures in 2010 were
higher than previous years due to required pipeline maintenance and inspection projects and the renewable feedstock project at the SNG plant. Capital
expenditures in 2009 were lower than 2008 primarily due to the deferral of several large projects primarily related to the repair and upgrade of the
transmission pipeline near the SNG plant and improvements to the backup utility propane system completed in 2008.
Commitments at December 31, 2010
include renewable feedstock project and pipeline maintenance and inspection projects.
86
Energy-Related Businesses: The Gas
Company – (continued)
Financing Activities
The main drivers for cash from
financing activities are debt financings for capital expenditures and the repayment of outstanding credit facilities. At December 31, 2010, the
outstanding balance on the business’ debt facilities consisted of $160.0 million in term loan facility borrowings. In 2010, the business repaid
$19.0 million of its capital expenditure facility borrowings and no amount was outstanding at December 31, 2010.
The Gas Company has interest rate swaps
hedging 100% of the interest rate exposure under the two $80.0 million term loan facilities that effectively fix the interest rate at 4.8375%
(excluding the margin). In March 2009, The Gas Company entered into an interest rate basis swap agreement with its existing debt and swap
counterparties. The basis swap, which reduced the weighted average annual interest rate on the business’ primary debt facilities by approximately
24.75 basis points, expired in March 2010. The resulting weighted average interest rate of the outstanding debt facilities, including any interest rate
swaps at December 31, 2010, was 5.34%. The business paid $8.6 million, $8.5 million and $8.8 million in interest expense related to its debt facilities
during 2010, 2009 and 2008, respectively.
The Gas Company also has an uncommitted
unsecured short-term borrowing facility of $7.5 million that was renewed during the second quarter of 2010. This credit line bears interest at the
lending bank’s quoted rate or prime rate. The facility is available for working capital needs. No amount was outstanding for this facility at
December 31, 2010.
The change from 2009 to 2010 was due to
the repayment of the capital expenditure facility of $19.0 million during 2010 compared with draw down of $10.0 million in 2009. The change from 2008
to 2009 was primarily due to the timing of borrowings to fund capital expenditures.
Additionally, the HPUC requires the
consolidated debt to total capital for HGC Holdings not to exceed 65% and $20.0 million to be readily available in cash resources at The Gas Company,
HGC Holdings or MIC. At December 31, 2010, the debt to total capital ratio was 58.0% and $20.0 million in cash resources was readily
available.
The facilities include events of
default, representations and warranties and other covenants that are customary for facilities of this type. A change of control will occur if the
Macquarie Group, or any fund or entity managed by the Macquarie Group, fails to control majority of the respective borrowers. Material terms of the
credit facilities are summarized below:
| Facility Terms |
Holding Company Debt |
Operating Company Debt |
|||||||||||||
|---|---|---|---|---|---|---|---|---|---|---|---|---|---|---|---|
Borrowers |
HGC |
The Gas Company,
LLC |
|||||||||||||
Facilities |
$80.0 million
Term Loan (fully drawn at December 31, 2010 and 2009) |
$80.0 million
Term Loan (fully drawn at December 31, 2010 and 2009) |
$20.0 million
Revolver (no amount drawn at December 31, 2010 and $19.0 million drawn at December 31, 2009) |
||||||||||||
Collateral |
First priority
security interest on HGC’s assets and equity interests |
First priority
security interest on The Gas Company’s assets and equity interests |
|||||||||||||
Maturity |
June,
2013 |
June,
2013 |
June,
2013 |
||||||||||||
Amortization |
Payable at
maturity |
Payable at
maturity |
Payable at
maturity for utility capital expenditures |
||||||||||||
87
Energy-Related Businesses: The Gas
Company – (continued)
| Facility Terms |
Holding Company Debt |
Operating Company Debt |
|||||||||||||
|---|---|---|---|---|---|---|---|---|---|---|---|---|---|---|---|
Interest Rate:
Years 1–5 |
LIBOR plus
0.60% |
LIBOR plus
0.40% |
LIBOR plus
0.40% |
||||||||||||
Commitment
Fees: Years 1–5 |
— |
— |
0.14% on undrawn
portion |
||||||||||||
Interest Rate:
Years 6–7 |
LIBOR plus
0.70% |
LIBOR plus
0.50% |
LIBOR plus
0.50% |
||||||||||||
Commitment
Fees: Years 6–7 |
— |
— |
0.18% on undrawn
portion |
||||||||||||
Distributions
Lock-Up Test |
— |
12 mo.
look-forward and 12 mo. look-backward adjusted EBITDA/interest <3.5x (at December 31, 2010: 7.7x and 7.4x, respectively) |
— |
||||||||||||
Mandatory
Prepayments |
— |
12 mo.
look-forward and 12 mo. look-backward adjusted EBITDA/interest <3.5x for 3 consecutive quarters |
— |
||||||||||||
Events of
Default Financial Triggers |
— |
12 mo.
look-backward adjusted EBITDA/interest <2.5x |
12 mo.
look-backward adjusted EBITDA/interest <2.5x |
||||||||||||
District Energy
| Year Ended December 31, |
|||||||||||||||||||||||||||||||
|---|---|---|---|---|---|---|---|---|---|---|---|---|---|---|---|---|---|---|---|---|---|---|---|---|---|---|---|---|---|---|---|
| 2010 |
2009 |
2008 |
Change (From 2009 to 2010) Favorable/(Unfavorable) |
Change (From 2008 to 2009) Favorable/(Unfavorable) |
|||||||||||||||||||||||||||
| ($ In Thousands) |
$ |
$ |
$ |
$ |
% |
$ |
% |
||||||||||||||||||||||||
Cash provided
by operating activities |
14,959 | 14,448 | 17,766 | 511 | 3.5 | (3,318 | ) | (18.7 | ) | ||||||||||||||||||||||
Cash used in
investing activities |
(4,479 | ) | (12,095 | ) | (5,378 | ) | 7,616 | 63.0 | (6,717 | ) | (124.9 | ) | |||||||||||||||||||
Cash (used in)
provided by financing activities |
(469 | ) | 17,917 | 986 | (18,386 | ) | (102.6 | ) | 16,931 | NM | |||||||||||||||||||||
NM — Not
meaningful
Operating Activities
Cash provided by operating activities
is primarily driven by customer receipts for services provided and leased equipment payments received (including non-revenue lease principal). Cash
used in operating activities is driven by the timing of payments for electricity, vendor services or supplies and the payment of payroll and benefit
costs. The increase in cash provided by operating activities from 2009 to 2010 was primarily due to improved operating results.
Non-revenue lease principal is the
principal portion of lease payments received from equipment leases with various customers. This cash inflow is not included in EBITDA, as there is no
impact to income, but an adjustment to calculate cash from operating activities. Non-revenue lease principal, net of the cash payments
88
Energy-Related Businesses: District
Energy – (continued)
made to noncontrolling interests, was $2.8 million, $2.8 million and $2.5 million in 2010, 2009 and 2008, respectively.
The decline in cash provided by
operating activities from 2008 to 2009 was primarily due to new customer reimbursements received in 2008 for costs to connect to the business’
system, the timing of payments to vendors in 2009 compared with 2008 and a one-time capacity paydown from a customer in 2008. Excluding these payments,
the cash contribution from ongoing operations was relatively flat period over period.
As provided in the agreement between
MIC and John Hancock, the owners of the noncontrolling interest of District Energy (collectively, the “members”), all “available
cash” will be distributed pro rata to the members on a quarterly basis. “Available cash” is calculated as cash from operating activities
plus cash from investing activities (excluding debt funded capital expenditures, and acquisitions net of cash) plus net debt proceeds minus
distributions paid to minority shareholders of the Nevada district energy business. The distribution of available cash may be reduced to comply with
any contractual or legal limitations, including restrictions on distributions contained in the business’ credit facility, and to provide for
reserves for working capital requirements.
Investing Activities
Cash used in investing activities
mainly comprises capital expenditures, which are generally funded by drawing on available facilities. Cash used in investing activities in 2010, 2009
and 2008 primarily funded growth capital expenditures for new customer connections and plant expansion.
Maintenance Capital Expenditure
The business expects to spend
approximately $1.0 million per year on capital expenditures relating to the replacement of parts, system reliability, customer service improvements and
minor system modifications. Maintenance capital expenditures will be funded from available facilities and cash from operating activities. These
expenditures were higher in 2010 due to the timing of spend on ordinary course maintenance projects.
Growth Capital Expenditure
District Energy signed contracts with
three additional customers and committed to spend $1.3 million on interconnection, of which it had spent $300,000 during 2010. Of the net $1.0 million
remaining to be spent, the business anticipates it will receive reimbursements from customers of approximately $755,000. These additional customers are
expected to contribute $460,000 to gross profit and EBITDA on an annualized basis.
The business continues to actively
market to new potential customers. New customers will typically reimburse the business for a substantial portion of expenditures related to connecting
them to the business’ system, thereby reducing the impact of this element of capital expenditure.
The following table sets forth
information about District Energy’s capital expenditures:
| Maintenance |
Growth |
|||||||||
|---|---|---|---|---|---|---|---|---|---|---|
2008 |
$ | 987,000 | $ | 4.4 | million | |||||
2009 |
$ | 875,000 | $ | 11.2 | million | |||||
2010 |
$ | 1.1 | million | $ | 407,000 | |||||
2011
projected |
$ | 1.0 | million | $ | 245,000 | |||||
Commitments at
December 31, 2010 |
$ | 58,000 | $ | 131,000 | ||||||
In 2009, District Energy incurred
capital expenditures related to the Chicago plant renovation and expansion in addition to connecting new customers to its district cooling system. This
resulted in higher growth capital expenditures in 2009 as compared with both 2010 and 2008.
89
Energy-Related Businesses: District
Energy – (continued)
In early 2009, District Energy’s
Las Vegas operation began providing service to a new customer building. This new customer began receiving full service in February 2010 and is expected
to contribute approximately $300,000 per year to gross profit and EBITDA. This service required a $3.0 million system expansion of the Las Vegas
facility, of which $300,000 was funded through a capital contribution from the noncontrolling interest shareholder of District Energy’s Las Vegas
operation during 2010 (see “Financing Activities” below).
Financing Activities
At December 31, 2010, the outstanding
balance on the business’ debt facilities consisted of $170.0 million in term loan facilities.
In March 2009, District Energy entered
into an interest rate basis swap agreement with its existing debt and swap counterparties. The basis swap, which reduced the weighted average annual
interest rate on the business’ primary debt facility by approximately 24.75 basis points, expired in March 2010. The resulting weighted average
interest rate of the outstanding debt facilities, including any interest rate swaps and fees associated with outstanding letters of credit at December
31, 2010, was 5.51%. Cash interest paid was $9.8 million, $9.5 million and $9.5 million for 2010, 2009 and 2008, respectively.
To hedge the interest commitments under
the term loan, District Energy entered into interest rate swaps fixing 100% of the term loan at 5.074% (excluding the margin).
The decrease in cash provided by
financing activities from 2009 to 2010 was primarily due to decreased borrowings under the business’ credit facility to finance growth and
maintenance capital expenditures, partially offset by a $300,000 capital contribution from the noncontrolling interest shareholder of District
Energy’s Las Vegas operations (as discussed above in “Investing Activities”).
The increase in cash provided by
financing activities from 2008 to 2009 was primarily due to $18.5 million of borrowings on the business’ credit facility in 2009 to finance growth
and maintenance capital expenditures.
Material terms of the facility are
presented below:
| Facility Terms |
||||||
|---|---|---|---|---|---|---|
Borrower |
Macquarie
District Energy LLC, or MDE |
|||||
Facilities |
• $150.0 million term loan facility (fully drawn at December 31, 2010 and 2009) |
|||||
• $20.0 million capital expenditure loan facility (fully drawn at December 31, 2010 and 2009) |
||||||
• $18.5 million revolving loan facility and letter of credit ($7.1 million utilized at December 31, 2010 and 2009 for letters
of credit) |
||||||
Amortization |
Payable at
maturity |
|||||
Interest
Type |
Floating |
|||||
Interest
rate and fees |
• Interest rate: |
|||||
• LIBOR plus 1.175% or |
||||||
• Base Rate (for capital expenditure loan and revolving loan facilities only): 0.5% above the greater of the prime rate or the
federal funds rate |
||||||
• Commitment fee: 0.35% on the undrawn portion. |
||||||
Maturity |
September, 2014
for the term loan and capital expenditure facilties; September, 2012 for the revolving loan facility |
|||||
90
Energy-Related Businesses: District
Energy – (continued)
| Facility Terms | ||||||
|---|---|---|---|---|---|---|
Mandatory
prepayment |
• With net proceeds that exceed $1.0 million from the sale of assets not used for replacement assets: |
|||||
• With insurance proceeds that exceed $1.0 million not used to repair, restore or replace assets; |
||||||
• In the event of a change of control; |
||||||
• In years 6 and 7, with 100% of excess cash flow applied to repay the term loan and capital expenditure loan
facilities; |
||||||
• With net proceeds from equity and certain debt issuances; and |
||||||
Mandatory
prepayment (continued) |
||||||
• With net proceeds that exceed $1.0 million in a fiscal year from contract terminations that are not
reinvested. |
||||||
Distribution covenant |
Distributions
permitted if the following conditions are met: |
|||||
• Backward interest coverage ratio greater than 1.5x (at December 31, 2010: 2.2x); |
||||||
• Leverage ratio (funds from operations to net debt) for the previous 12 months equal to or greater than 6.0% (at December 31,
2010: 8.8%); |
||||||
• No termination, non-renewal or reduction in payment terms under the service agreement with the Planet Hollywood (formerly
Aladdin) hotel, casino and the shopping mall, unless MDE meets certain financial conditions on a projected basis, including through prepayment;
and |
||||||
• No default or event of default. |
||||||
Collateral |
First lien on the
following (with limited exceptions): |
|||||
• Project revenues; |
||||||
• Equity of the Borrower and its subsidiaries; |
||||||
• Substantially all assets of the business; and |
||||||
• Insurance policies and claims or proceeds. |
||||||
The facility includes events of
default, representations and warranties and other covenants that are customary for facilities of this type. A change of control will occur if the
Macquarie Group, or any fund or entity managed by the Macquarie Group, fails to control a majority of the Borrower.
Aviation-Related Business
Atlantic Aviation
| Year Ended December 31, |
|||||||||||||||||||||||||||||||
|---|---|---|---|---|---|---|---|---|---|---|---|---|---|---|---|---|---|---|---|---|---|---|---|---|---|---|---|---|---|---|---|
| 2010 |
2009 |
2008 |
Change (From 2009 to 2010) Favorable/(Unfavorable) |
Change (From 2008 to 2009) Favorable/(Unfavorable) |
|||||||||||||||||||||||||||
| ($ In Thousands) |
$ |
$ |
$ |
$ |
% |
$ |
% |
||||||||||||||||||||||||
Cash provided
by operating activities |
54,035 | 50,930 | 73,128 | 3,105 | 6.1 | (22,198 | ) | (30.4 | ) | ||||||||||||||||||||||
Cash used in
investing activities |
(10,346 | ) | (10,817 | ) | (68,002 | ) | 471 | 4.4 | 57,185 | 84.1 | |||||||||||||||||||||
Cash (used in)
provided by financing activities(1) |
(52,424 | ) | (76,736 | ) | 27,069 | 24,312 | 31.7 | (103,805 | ) | NM | |||||||||||||||||||||
NM — Not
meaningful
(1) |
During the first quarter of 2009, we provided Atlantic Aviation with a capital contribution of $50.0 million to pay down $44.6 million of debt. The remainder of the capital contribution was used to pay interest rate swap breakage fees and expenses. This contribution has been excluded from the above table as it is eliminated on consolidation. |
91
Aviation-Related Business: Atlantic
Aviation – (continued)
Operating Activities
Operating cash at Atlantic Aviation is
generated from sales transactions primarily paid by credit cards. Some customers have extended payment terms and are billed accordingly. Cash is used
in operating activities mainly for payments to vendors of fuel, aircraft services and professional services, as well as payroll costs and payments to
tax jurisdictions.
Cash provided by operating activities
increased from 2009 to 2010 mainly due to:
• |
improved operating results; and |
• |
reduced interest expense from lower debt levels, partially offset by |
• |
higher level of collection of accounts receivable in 2009 compared with 2010. |
Cash provided by operating activities
decreased from 2008 to 2009 mainly due to:
• |
a decline in gross profit resulting from the decrease in volume of fuel sold; and |
• |
payment of interest rate swap breakage fees associated with the prepayment of the term loan debt; partially offset by |
• |
reduced interest expense, other than swap breakage fees, from lower debt levels; and |
• |
collection of aged accounts receivable. |
Investing Activities
Cash used in investing activities
relates primarily to capital expenditures. Cash used in investing activities was flat from 2009 to 2010. The decrease in cash used in investing
activity from 2008 to 2009 was primarily due to the SevenBar acquisition in March 2008 and lower capital expenditures by the business.
Maintenance Capital Expenditure
Maintenance capital expenditures
encompass repainting, replacing equipment as necessary and any ongoing environmental or required regulatory expenditure, such as installing safety
equipment. These expenditures are generally funded from cash flow from operating activities.
Growth Capital Expenditure
Growth capital expenditures are
incurred primarily in connection with lease extensions and only where the business expects to receive an appropriate return relative to its cost of
capital. Historically these expenditures have included development of hangars, terminal buildings and ramp upgrades. The business has generally funded
these projects through its growth capital expenditure facility or capital contributions from MIC.
The following table sets forth
information about capital expenditures in Atlantic Aviation:
| Maintenance |
Growth |
|||||||||
|---|---|---|---|---|---|---|---|---|---|---|
2008 |
$ | 7.7 | million | $ | 26.8 | million | ||||
2009 |
$ | 4.5 | million | $ | 6.3 | million | ||||
2010 |
$ | 6.8 | million | $ | 3.6 | million | ||||
2011
projected |
$ | 12.1 | million | $ | 7.6 | million | ||||
Commitments at
December 31, 2010 |
$ | 196,000 | $ | 902,000 | ||||||
Growth capital expenditures incurred in 2010 primarily reflects the ongoing construction costs of a new FBO at Will Rogers Airport in Oklahoma City. The decrease in growth capital expenditures from 2009 to 2010 was primarily related to the completion of a terminal and ramp project in Nashville, Tennessee during 2009. Growth capital expenditures declined from 2008 to 2009 since various major projects were completed in
92
Aviation-Related Business: Atlantic
Aviation – (continued)
2008. These include the construction of a new hangar at the San Jose FBO and a ramp repair and extension at the Teterboro location that were completed in 2008. Growth capital expenditures in 2011 includes the completion of the FBO at Oklahoma City, construction of a hangar at Atlanta Peachtree and the construction of a new fuel farm at El Paso.
Maintenance capital expenditures
increased in 2010 as Atlantic Aviation upgraded FBO facilities at a number of locations. The decreases in maintenance capital expenditures from 2008 to
2009 was primarily due to the deferral of maintenance capital expenditures in response to the overall soft economy. The increase from 2010 to 2011
reflects a specific project at LAX FBO, as well as a return to historical levels of maintenance capital expenditures.
In December 2010, the Tax Relief,
Unemployment Insurance Reauthorization and Job Creation Act of 2010 (the “Act”) was signed. The Act provides for 100% bonus depreciation for
certain fixed assets placed in service after September 8, 2010 and before January 1, 2012, and 50% bonus depreciation for certain fixed assets placed
in service during 2012 for federal income tax purposes. Generally, states do not allow this bonus depreciation deduction in determining state taxable
income. The business will take into consideration the benefits of these accelerated depreciation provisions of the Act when evaluating its capital
expenditure plans for 2011 and 2012.
Financing Activities
At December 31, 2010, the outstanding
balance on Atlantic’s debt facilities consisted of $763.3 million in term loan facility borrowings, which is 100% hedged with interest rate swaps,
and $45.4 million in capital expenditure facility borrowings. In March 2009, Atlantic Aviation entered into an interest rate basis swap agreement with
its existing debt and swap counterparties. The basis swap, which reduced the weighted average annual interest rate on the business’ primary debt
facility by approximately 19.50 basis points, expired in March 2010. The resulting weighted average interest rate on the term loan was 6.79%. The
interest rate applicable on the capital expenditure facility is the three-month U.S. Libor plus a margin of 1.60%. For 2010, 2009 and 2008, the
business paid approximately $54.6 million, $57.2 million and $62.6 million, respectively, in interest expense, excluding interest rate swap breakage
fees, related to its debt facilities.
In addition to the debt facilities
described above, Atlantic Aviation raised a $3.5 million stand-alone debt facility to partially fund the construction of a new FBO at Oklahoma City
Will Rogers Airport. At December 31, 2010, the outstanding balance on the stand-alone facility was $141,000.
The decrease in cash used in financing
activities is primarily due to a larger debt prepayment in the first half of 2009. During 2010 and 2009, the business pre-paid $55.0 million and $81.6
million, respectively, of debt principal. The decrease in cash provided by financing activities from 2008 to 2009 was primarily due to the debt
prepayment made in 2009.
In February 2011, the business prepaid
$14.5 million of term loan principal and incurred $1.1 million in swap breakage fees. As a result of this prepayment, the proforma leverage ratio would
decrease to 6.79x based upon the trailing twelve months December 31, 2010 EBITDA, as calculated under the facility. The maximum permitted
debt-to-EBITDA ratio drops to 7.50x on March 31, 2011. The business expects to remain in compliance with the maximum leverage covenant through the
maturity of its debt facilities if the performance of the business remains at current levels.
93
Aviation-Related Business: Atlantic
Aviation – (continued)
The terms of the loan agreement of
Atlantic Aviation have been revised in accordance with the amendment completed and effective on February 25, 2009. A summary of key terms is presented
below.
| Facility Terms |
||||||
|---|---|---|---|---|---|---|
Borrower |
Atlantic
Aviation |
|||||
Facilities |
• $900.0 million term loan facility (outstanding balance of $763.3 million and $818.4 million at December 31, 2010 and 2009,
respectively) |
|||||
• $50.0 million capital expenditure facility ($45.4 million and $44.9 million drawn at December 31, 2010 and 2009,
respectively) |
||||||
• $18.0 million revolving working capital and letter of credit facility ($11.7 million and $6.5 million utilized to back
letter of credit at December 31, 2010 and 2009, respectively) |
||||||
Amortization |
• Payable at maturity |
|||||
• Years 1 to 5, amortization per leverage grid below: |
||||||
• 100% excess cash flow when Leverage Ratio is 6.0x or above |
||||||
• 50% excess cash flow when Leverage Ratio is between 6.0x and 5.5x |
||||||
• 100% of excess cash flow in years 6 and 7 |
||||||
Interest
type |
Floating |
|||||
Interest
rate and fees |
• Years 1–5: |
|||||
• LIBOR plus 1.6% or |
||||||
• Base Rate (for revolving credit facility only): 0.6% above the greater of: (i) the prime rate or (ii) the federal funds rate
plus 0.5% |
||||||
• Years 6–7: |
||||||
• LIBOR plus 1.725% or |
||||||
• Base Rate (for revolving credit facility only): 0.725% above the greater of: (i) the prime rate or (ii) the federal funds
rate plus 0.5% |
||||||
Maturity |
October,
2014 |
|||||
Mandatory
prepayment |
• With net proceeds that exceed $1.0 million from the sale of assets not used for replacement assets; |
|||||
• With net proceeds of any debt other than permitted debt; |
||||||
• With net insurance proceeds that exceed $1.0 million not used to repair, restore or replace assets; |
||||||
• In the event of a change of control; |
||||||
• Additional mandatory prepayment based on leverage grid (see distribution covenant below); |
||||||
• With any FBO lease termination payments received; and |
||||||
• With excess cash flows in years 6 and 7. |
||||||
Financial
covenants |
• Debt service coverage ratio >1.2x (at December 31, 2010: 1.99x) |
|||||
• Leverage ratio (outstanding debt to EBITDA) for the trailing twelve months < 8.00x (default threshold) (at December 31,
2010: 6.91x) |
||||||
• Maximum leverage ratio for subsequent periods modified as follows: |
||||||
• 2009: 8.25x• 2012: 6.75x |
||||||
• 2010: 8.00x• 2013: 6.00x |
||||||
• 2011: 7.50x• 2014: 5.00x |
||||||
94
Aviation-Related Business: Atlantic
Aviation – (continued)
| Facility Terms | ||||||
|---|---|---|---|---|---|---|
Distribution covenant |
Distributions
permitted if the following conditions are met: |
|||||
• Backward and forward debt service coverage ratio equal to or greater than 1.6x; |
||||||
• No default; |
||||||
• All mandatory prepayments have been made; |
||||||
• Replaced by a test based on the Leverage Ratio: |
||||||
• 100% of excess cash flow permitted to be distributed when leverage ratio is below 5.5x |
||||||
• 50% of excess cash to be distributed when leverage ratio is equal to or greater than 5.5x and less than
6.0x |
||||||
• No distribution permitted when leverage ratio is 6.0x or above |
||||||
• No revolving loans outstanding. |
||||||
Collateral |
First lien on the
following (with limited exceptions): |
|||||
• Project revenues; |
||||||
• Equity of the borrower and its subsidiaries; and |
||||||
• Insurance policies and claims or proceeds. |
||||||
EBITDA
definition |
Excludes (i) all
extraordinary or non-recurring non-cash income or losses during the relevant period (including losses resulting from write-off of goodwill or other
assets); and (ii) any non-cash income or losses due to change in market value of the hedging agreements. |
|||||
95
CRITICAL ACCOUNTING POLICIES AND
ESTIMATES
The preparation of our financial
statements requires management to make estimates and judgments that affect the amounts reported in the financial statements and accompanying notes. We
base our estimates on historical experience and on various other assumptions that we believe to be reasonable under the circumstances. Actual results
could differ from these estimates under different assumptions and judgments and uncertainties, and potentially could result in materially different
results under different conditions. Our critical accounting policies and estimates are discussed below. These estimates and policies are consistent
with the estimates and accounting policies followed by the businesses we own.
Business Combinations
Our acquisitions of businesses that we
control are accounted for under the purchase method of accounting. The amounts assigned to the identifiable assets acquired and liabilities assumed in
connection with acquisitions are based on estimated fair values as of the date of the acquisition, with the remainder, if any, recorded as goodwill.
The fair values are determined by our management, taking into consideration information supplied by the management of acquired entities and other
relevant information. Such information includes valuations supplied by independent appraisal experts for significant business combinations. The
valuations are generally based upon future cash flow projections for the acquired assets, discounted to present value. The determination of fair values
require significant judgment both by management and outside experts engaged to assist in this process.
Goodwill, Intangible Assets and Property, Plant and
Equipment
Significant assets acquired in
connection with our acquisition of The Gas Company, District Energy and Atlantic Aviation include contract rights, customer relationships, non-compete
agreements, trademarks, property and equipment and goodwill.
Trademarks are generally considered to
be indefinite life intangibles. Trademarks and goodwill are not amortized in most circumstances. It may be appropriate to amortize some trademarks.
However, for unamortized intangible assets, we are required to perform annual impairment reviews and more frequently in certain
circumstances.
The goodwill impairment test is a
two-step process, which requires management to make judgments in determining what assumptions to use in the calculation. The first step of the process
consists of estimating the fair value of each reporting unit based on a discounted cash flow model using revenue and profit forecasts and comparing
those estimated fair values with the carrying values, which included the allocated goodwill. If the estimated fair value is less than the carrying
value, a second step is performed to compute the amount of the impairment by determining an “implied fair value” of goodwill. The
determination of a reporting unit’s “implied fair value” of goodwill requires the allocation of the estimated fair value of the
reporting unit to the assets and liabilities of the reporting unit. Any unallocated fair value represents the “implied fair value” of
goodwill, which is compared with its corresponding carrying value. The Gas Company, District Energy and Atlantic Aviation are separate reporting units
for purposes of this analysis. The impairment test for trademarks, which are not amortized, requires the determination of the fair value of such
assets. If the fair value of the trademarks are less than their carrying value, an impairment loss is recognized in an amount equal to the difference.
We cannot predict the occurrence of certain future events that might adversely affect the reported value of goodwill and/or intangible assets. Such
events include, but are not limited to, strategic decisions made in response to economic and competitive conditions, the impact of the economic
environment on our customer base, or material negative change in relationship with significant customers.
Property and equipment is initially
stated at cost. Depreciation on property and equipment is computed using the straight-line method over the estimated useful lives of the property and
equipment after consideration of historical results and anticipated results based on our current plans. Our estimated useful lives represent the period
the asset remains in service assuming normal routine maintenance. We review the estimated useful lives assigned to property and equipment when our
business experience suggests that they do not properly reflect the consumption of economic benefits embodied in the property and equipment nor
result
96
in the appropriate matching of cost against revenue. Factors that lead to such a conclusion may include physical observation of asset usage, examination of realized gains and losses on asset disposals and consideration of market trends such as technological obsolescence or change in market demand.
Significant intangibles, including
contract rights, customer relationships, non-compete agreements and technology are amortized using the straight-line method over the estimated useful
lives of the intangible asset after consideration of historical results and anticipated results based on our current plans. With respect to contract
rights in our Atlantic Aviation business, we take into consideration the history of contract right renewals in determining our assessment of useful
life and the corresponding amortization period.
We perform impairment reviews of
property and equipment and intangibles subject to amortization, when events or circumstances indicate that assets are less than their carrying amount
and the undiscounted cash flows estimated to be generated by those assets are less than the carrying amount of those assets. In this circumstance, the
impairment charge is determined based upon the amount by which the net book value of the assets exceeds their fair market value. Any impairment is
measured by comparing the fair value of the asset to its carrying value.
The “implied fair value” of
reporting units and fair value of property and equipment and intangible assets is determined by our management and is generally based upon future cash
flow projections for the acquired assets, discounted to present value. We use outside valuation experts when management considers that it is
appropriate to do so.
We test for goodwill and
indefinite-lived intangible assets when there is an indicator of impairment. Impairments of goodwill, property, equipment, land and leasehold
improvements and intangible assets during 2009 and 2008 relating to Atlantic Aviation, are discussed in “Management’s Discussion and Analysis
of Financial Condition and Results of Operations — Results of Operations” in Part II, Item 7.
Revenue Recognition
The Gas Company recognizes revenue when
the services are provided. Sales of gas to customers are billed on a monthly cycle basis. Most revenue is based upon consumption; however, certain
revenue is based upon a flat rate.
District Energy recognizes revenue from
cooling capacity and consumption at the time of performance of service. Cash received from customers for services to be provided in the future are
recorded as unearned revenue and recognized over the expected services period on a straight-line basis.
Fuel revenue from Atlantic Aviation is
recorded when fuel is provided or when services are rendered. Atlantic Aviation also records hangar rental fees, which are recognized during the month
for which service is provided.
Hedging
We have in place variable-rate debt.
Management believes that it is prudent to limit the variability of a portion of its interest payments. To meet this objective, the Company enters into
interest rate swap agreements to manage fluctuations in cash flows resulting from interest rate risk on a majority of its debt with a variable-rate
component.
As of February 25, 2009 for Atlantic
Aviation and effective April 1, 2009 for our other businesses, we elected to discontinue hedge accounting. From the dates that hedge accounting was
discontinued, all movements in the fair value of the interest rate swaps are recorded directly through earnings. As a result of the discontinuance of
hedge accounting, we will reclassify into earnings net derivative losses included in accumulated other comprehensive loss over the remaining life of
the existing interest rate swaps. Our derivative instruments are recorded on the balance sheet at fair value with changes in fair value of interest
rate swaps recorded directly through earnings. We measure derivative instruments at fair value using the income approach, which discounts the future
net cash settlements expected under the derivative contracts to a present value. See Note 12, “Derivative Instruments and Hedging
Activities”, in our consolidated financial statements
97
in “Financial Statements and Supplementary Data” in Part II, Item 8, of this Form 10-K for financial information and further discussions.
Income Taxes
We account for income taxes using the
asset and liability method of accounting. Under this method, deferred tax assets and liabilities are recognized for the future tax consequences
attributable to differences between the financial statement carrying amounts of existing assets and liabilities and their respective tax basis and for
operating loss and tax credit carryforwards. Deferred tax assets and liabilities are measured using enacted tax rates expected to apply to taxable
income in the years in which those temporary differences are expected to be recovered or settled.
In assessing the need for a valuation
allowance, management considers whether it is more likely than not that some portion or all of the deferred tax assets will not be realized. The
ultimate realization of deferred tax assets is dependent upon the generation of future taxable income during the periods in which those temporary
differences become deductible. Management considers the scheduled reversal of deferred tax liabilities, projected future taxable income, and tax
planning strategies in making this assessment.
Accounting Policies, Accounting Changes and Future
Application of Accounting Standards
See Note 2, “Summary of
Significant Accounting Policies”, in our consolidated financial statements in “Financial Statements and Supplementary Data” in Part II,
Item 8, of this Form 10-K for financial information and further discussions, for a summary of the Company’s significant accounting policies,
including a discussion of recently adopted and issued accounting pronouncements.
98
ITEM 7A. QUANTITATIVE AND QUALITATIVE DISCLOSURES ABOUT MARKET
RISK
The discussion that follows describes
our exposure to market risks and the use of derivatives to address those risks. See “Critical Accounting Policies and Estimates —
Hedging” for a discussion of the related accounting.
Interest Rate Risk
We are exposed to interest rate risk in
relation to the borrowings of our businesses. Our current policy is to enter into derivative financial instruments to fix variable-rate interest
payments covering at least half of the interest rate risk associated with the borrowings of our businesses, subject to the requirements of our lenders.
As of December 31, 2010, we had $1.1 billion of current and long-term debt for our consolidated continuing operations, $1.1 billion of which was
economically hedged with interest rate swaps and $65.5 million of which was unhedged.
IMTT
At December 31, 2010, IMTT had two
issues of New Jersey Economic Development Authority tax exempt revenue bonds outstanding with a total balance of $36.3 million where the interest rate
is reset daily by tender. A 1% increase in interest rates on this tax exempt debt would result in a $363,000 increase in interest cost per year and a
corresponding 1% decrease would result in a $363,000 decrease in interest cost per year. IMTT’s exposure to interest rate changes through this tax
exempt debt has been hedged from October 2007 through November 2012 through the use of a $36.3 million face value 67% of LIBOR swap. As this interest
rate swap is fixed against 67% of 30-day LIBOR and not the daily tax exempt tender rate, it does not result in a perfect hedge for short-term rates on
tax exempt debt although it will largely offset any additional interest rate expense incurred as a result of increases in interest rates. If interest
rates decrease, the fair market value of this interest rate swap will also decrease. A 10% relative decrease in interest rates would result in a
decrease in the fair market value of the interest rate swap of $35,000 and a corresponding 10% relative increase would result in a $35,000 increase in
the fair market value.
At December 31, 2010, IMTT had issued
$490.0 million in Gulf Opportunity Zone Bonds (GO Zone Bonds) to fund qualified project costs at its St. Rose, Gretna and Geismar storage facilities. A
1% increase in interest rates on the outstanding GO Zone Bonds would result in a $4.9 million increase in interest cost per year and a corresponding 1%
decrease would result in a $4.9 million decrease in interest cost per year. IMTT’s exposure to interest rate changes through the GO Zone Bonds has
been partially hedged until June 2017 through the use of an interest rate swap which has a notional value of $215.0 million. As the interest rate swap
is fixed against 67% of the 30-day LIBOR rate and not the tax exempt tender rate, it does not result in a perfect hedge for short-term rates on tax
exempt debt although it will largely offset any additional interest rate expense incurred as a result of increases in interest rates. If interest rates
decrease, the fair market value of the interest rate swap will also decrease. A 10% relative decrease in interest rates would result in a decrease in
the fair market value of the interest rate swap of $2.5 million and a corresponding 10% relative increase would result in a $2.5 million increase in
the fair market value.
On December 31, 2010, IMTT had $75.0
million outstanding under its USD Revolving Credit Facility which includes $65.0 million associated with the USD DNB Loan. A 1% increase in interest
rates on this debt would result in a $750,000 increase in interest cost per year and a corresponding 1% decrease would result in a $750,000 decrease in
interest cost per year. IMTT’s exposure to interest rate changes on its U.S. revolving credit facility has been partially hedged against 90-day
LIBOR from October 2007 through March 2017 through the use of an interest rate swap which has a notional value of $135.0 million as of December 31,
2010 which increases to $140.0 million on December 31, 2011 and $200.0 million from December 31, 2012 to maturity. If interest rates decrease, the fair
market value of the interest rate swap will also decrease. A 10% relative decrease in interest rates would result in a decrease in the fair market
value of the interest rate swap of $3.2 million and a corresponding 10% relative increase would result in a $3.2 million increase in the fair market
value. Before the USD DNB Loan was incorporated into the USD Revolving Credit Facility, its interest was hedged through a swap with a notional value
that matched the original amortization schedule of
99
the loan. From December 31, 2010 to maturity at December 31, 2012, the notional value of the swap is fixed at $52.0 million. This hedging arrangement will partially offset any additional interest rate expense incurred as a result of increases in interest rates. However, if interest rates decrease, the fair market value of the interest rate swap will also decrease. A 10% relative decrease in interest rates would result in a decrease in the fair market value of the interest rate swap of $92,000. A corresponding 10% relative increase in interest rates would result in a $92,000 increase in the fair market value of the interest rate swap.
On December 31, 2010, IMTT had $23.2
million outstanding under its Canadian revolving credit facility. A 1% increase in interest rates on this debt would result in a $232,000 increase in
interest cost per year and a corresponding 1% decrease would result in a $232,000 decrease in interest cost per year.
The Gas Company
The senior term-debt for The Gas
Company and HGC comprise two non-amortizing term facilities totaling $160.0 million and a senior secured revolving credit facility totaling $20.0
million. At December 31, 2010, the entire $160.0 million in term debt had been drawn. These variable-rate facilities mature on June 7,
2013.
A 1% increase in the interest rate on
The Gas Company and HGC’s term debt would result in a $1.6 million increase in interest cost per year. A corresponding 1% decrease would result in
a $1.6 million decrease in annual interest cost. The Gas Company and HGC’s exposure to interest rate changes for the term facilities has, however,
been fully hedged from September 1, 2006 until maturity through interest rate swaps. These derivative hedging arrangements will offset any interest
rate increases or decreases during the term of the notes, resulting in stable interest rates of 5.24% for The Gas Company (rising to 5.34% in years 6
and 7 of the facility) and 5.44% for HGC (rising to 5.54% in years 6 and 7 of the facility). A 10% relative decrease in market interest rates from
December 31, 2010 levels would decrease the fair market value of the hedge instruments by $449,000. A corresponding 10% relative increase would
increase their fair market value by $448,000.
The Gas Company also has a $20.0
million revolver of which no amount was outstanding at December 31, 2010.
District Energy
District Energy has a $150.0 million
floating rate term loan facility maturing in 2014. A 1% increase in the interest rate on the $150.0 million District Energy debt would result in a $1.5
million increase in the interest cost per year. A corresponding 1% decrease would result in a $1.5 million decrease in interest cost per
year.
District Energy’s exposure to
interest rate changes through the term loan facility has been fully hedged to maturity through the use of interest rate swaps. These hedging
arrangements will offset any additional interest rate expense incurred as a result of increases in interest rates. However, if interest rates decrease,
the value of District Energy’s hedge instruments will also decrease. A 10% relative decrease in interest rates would result in a decrease in the
fair market value of the hedge instruments of approximately $1.0 million. A corresponding 10% relative increase would result in an approximately $1.0
million increase in the fair market value.
District Energy also has a $20.0
million capital expenditure loan facility which was fully drawn at December 31, 2010. A 1% increase in the interest rate on District Energy’s
capital expenditure loan facility would result in a $200,000 increase in interest cost per year. A corresponding 1% decrease would result in a $200,000
decrease in annual interest cost.
Atlantic Aviation
As of December 31, 2010, the
outstanding balance of the floating rate senior debt for Atlantic Aviation was $808.9 million. A 1% increase in the interest rate on Atlantic
Aviation’s debt would result in an $8.1 million increase in the interest cost per year. A corresponding 1% decrease would result in an $8.1
million decrease in interest cost per year.
100
The exposure of the term loan portion
of the senior debt (which at December 31, 2010 was $763.3 million) to interest rate changes has been 100% hedged until October 2012 through the use of
interest rate swaps. These hedging arrangements will offset any additional interest rate expense incurred as a result of increases in interest rates
during that period. However, if interest rates decrease, the value of our hedge instruments will also decrease. A 10% relative decrease in interest
rates would result in a decrease in the fair market value of the hedge instruments of $1.0 million. A corresponding 10% relative increase would result
in a $1.0 million increase in the fair market value.
101
ITEM 8. FINANCIAL STATEMENTS AND SUPPLEMENTARY
DATA
MACQUARIE INFRASTRUCTURE COMPANY LLC
INDEX TO FINANCIAL STATEMENTS
| Page Number |
||||||
|---|---|---|---|---|---|---|
Consolidated
Balance Sheets as of December 31, 2010 and 2009 |
104 | |||||
Consolidated
Statements of Operations for the Years Ended December 31, 2010, 2009 and 2008 |
105 | |||||
Consolidated
Statements of Members’ Equity and Comprehensive Income (Loss) for the Years Ended December 31, 2010, 2009 and 2008 |
106 | |||||
Consolidated
Statements of Cash Flows for the Years Ended December 31, 2010, 2009 and 2008 |
108 | |||||
Notes to
Consolidated Financial Statements |
110 | |||||
Schedule II
— Valuation and Qualifying Accounts |
150 | |||||
102
REPORT OF INDEPENDENT REGISTERED PUBLIC ACCOUNTING
FIRM
The Board of Directors and Stockholders
Macquarie Infrastructure Company LLC:
Macquarie Infrastructure Company LLC:
We have audited the accompanying
consolidated balance sheets of Macquarie Infrastructure Company LLC and subsidiaries as of December 31, 2010 and 2009, and the related consolidated
statements of operations, members’ equity and comprehensive income (loss), and cash flows for each of the years in the three-year period ended
December 31, 2010. In connection with our audits of the consolidated financial statements, we also have audited the financial statement schedule. These
consolidated financial statements are the responsibility of the Company’s management. Our responsibility is to express an opinion on these
consolidated financial statements and financial statement schedule based on our audits.
We conducted our audits in accordance
with the standards of the Public Company Accounting Oversight Board (United States). Those standards require that we plan and perform the audit to
obtain reasonable assurance about whether the financial statements are free of material misstatement. An audit includes examining, on a test basis,
evidence supporting the amounts and disclosures in the financial statements. An audit also includes assessing the accounting principles used and
significant estimates made by management, as well as evaluating the overall financial statement presentation. We believe that our audits provide a
reasonable basis for our opinion.
In our opinion, the consolidated
financial statements referred to above present fairly, in all material respects, the financial position of Macquarie Infrastructure Company LLC and
subsidiaries as of December 31, 2010 and 2009, and the results of their operations and their cash flows for each of the years in the three-year period
ended December 31, 2010, in conformity with U.S. generally accepted accounting principles. Also in our opinion, the related financial statement
schedule, when considered in relation to the basic consolidated financial statements taken as a whole, presents fairly, in all material respects, the
information set forth therein.
We also have audited, in accordance
with the standards of the Public Company Accounting Oversight Board (United States), Macquarie Infrastructure Company LLC’s internal control over
financial reporting as of December 31, 2010, based on criteria established in Internal Control — Integrated Framework issued by the
Committee of Sponsoring Organizations of the Treadway Commission (COSO), and our report dated February 23, 2011 expressed an unqualified opinion on the
effectiveness of the Company’s internal control over financial reporting.
/s/ KPMG LLP
Dallas, Texas
February 23, 2011
Dallas, Texas
February 23, 2011
103
MACQUARIE INFRASTRUCTURE COMPANY LLC
CONSOLIDATED BALANCE SHEETS
($ in Thousands, Except Share Data)
($ in Thousands, Except Share Data)
| December 31, 2010 |
December 31, 2009 |
||||||||||
|---|---|---|---|---|---|---|---|---|---|---|---|
ASSETS |
|||||||||||
Current
assets: |
|||||||||||
Cash and cash
equivalents |
$ | 24,563 | $ | 27,455 | |||||||
Accounts
receivable, less allowance for doubtful accounts of $613 and $1,629, respectively |
47,845 | 47,256 | |||||||||
Inventories
|
17,063 | 14,305 | |||||||||
Prepaid
expenses |
6,321 | 6,688 | |||||||||
Deferred income
taxes |
19,030 | 23,323 | |||||||||
Other
|
10,605 | 10,839 | |||||||||
Assets of
discontinued operations held for sale |
— | 86,695 | |||||||||
Total current
assets |
125,427 | 216,561 | |||||||||
Property,
equipment, land and leasehold improvements, net |
563,451 | 580,087 | |||||||||
Restricted cash
|
13,780 | 16,016 | |||||||||
Equipment lease
receivables |
35,663 | 33,266 | |||||||||
Investment in
unconsolidated business |
223,792 | 207,491 | |||||||||
Goodwill
|
514,253 | 516,182 | |||||||||
Intangible
assets, net |
705,862 | 751,081 | |||||||||
Deferred
financing costs, net of accumulated amortization |
12,927 | 17,088 | |||||||||
Other
|
1,587 | 1,449 | |||||||||
Total assets
|
$ | 2,196,742 | $ | 2,339,221 | |||||||
LIABILITIES AND MEMBERS’ EQUITY |
|||||||||||
Current
liabilities: |
|||||||||||
Due to
manager–related party |
$ | 3,282 | $ | 1,977 | |||||||
Accounts
payable |
39,768 | 44,575 | |||||||||
Accrued
expenses |
19,315 | 17,432 | |||||||||
Current portion
of notes payable and capital leases |
1,075 | 235 | |||||||||
Current portion
of long-term debt |
49,325 | 45,900 | |||||||||
Fair value of
derivative instruments |
43,496 | 49,573 | |||||||||
Customer
deposits |
4,635 | 5,617 | |||||||||
Other
|
10,390 | 9,338 | |||||||||
Liabilities of
discontinued operations held for sale |
— | 220,549 | |||||||||
Total current
liabilities |
171,286 | 395,196 | |||||||||
Notes payable
and capital leases, net of current portion |
420 | 1,498 | |||||||||
Long-term debt,
net of current portion |
1,089,559 | 1,166,379 | |||||||||
Deferred income
taxes |
156,328 | 107,840 | |||||||||
Fair value of
derivative instruments |
51,729 | 54,794 | |||||||||
Other
|
40,725 | 38,746 | |||||||||
Total
liabilities |
1,510,047 | 1,764,453 | |||||||||
Commitments and
contingencies |
— | — | |||||||||
Members’
equity: |
|||||||||||
LLC interests,
no par value; 500,000,000 authorized; 45,715,448 LLC interests issued and outstanding at December 31, 2010 and 45,292,913 LLC interests issued and
outstanding at December 31, 2009 |
964,430 | 959,897 | |||||||||
Additional paid
in capital |
21,956 | 21,956 | |||||||||
Accumulated
other comprehensive loss |
(25,812 | ) | (43,232 | ) | |||||||
Accumulated
deficit |
(269,425 | ) | (360,095 | ) | |||||||
Total
members’ equity |
691,149 | 578,526 | |||||||||
Noncontrolling
interests |
(4,454 | ) | (3,758 | ) | |||||||
Total equity
|
686,695 | 574,768 | |||||||||
Total
liabilities and equity |
$ | 2,196,742 | $ | 2,339,221 | |||||||
See accompanying notes to the consolidated financial
statements.
104
MACQUARIE INFRASTRUCTURE COMPANY LLC
CONSOLIDATED STATEMENTS OF OPERATIONS
($ in Thousands, Except Share and Per Share Data)
($ in Thousands, Except Share and Per Share Data)
| Year Ended December 31, 2010 |
Year Ended December 31, 2009(1) |
Year Ended December 31, 2008(1) |
||||||||||||
|---|---|---|---|---|---|---|---|---|---|---|---|---|---|---|
Revenue |
||||||||||||||
Revenue from
product sales |
$ | 514,344 | $ | 394,200 | $ | 586,054 | ||||||||
Revenue from
product sales — utility |
113,752 | 95,769 | 121,770 | |||||||||||
Service
revenue |
204,852 | 215,349 | 264,851 | |||||||||||
Financing and
equipment lease income |
7,843 | 4,758 | 4,686 | |||||||||||
Total
revenue |
840,791 | 710,076 | 977,361 | |||||||||||
Costs and
expenses |
||||||||||||||
Cost of product
sales |
326,734 | 233,376 | 408,690 | |||||||||||
Cost of product
sales — utility |
90,542 | 73,907 | 105,329 | |||||||||||
Cost of
services |
53,088 | 46,317 | 63,850 | |||||||||||
Selling,
general and administrative |
201,787 | 209,783 | 227,288 | |||||||||||
Fees to manager
— related party |
10,051 | 4,846 | 12,568 | |||||||||||
Goodwill
impairment |
— | 71,200 | 52,000 | |||||||||||
Depreciation |
29,721 | 36,813 | 40,140 | |||||||||||
Amortization of
intangibles |
34,898 | 60,892 | 61,874 | |||||||||||
Loss on
disposal of assets |
17,869 | — | — | |||||||||||
Total operating
expenses |
764,690 | 737,134 | 971,739 | |||||||||||
Operating
income (loss) |
76,101 | (27,058 | ) | 5,622 | ||||||||||
Other income
(expense) |
||||||||||||||
Interest
income |
29 | 119 | 1,090 | |||||||||||
Interest
expense(2) |
(106,834 | ) | (95,456 | ) | (88,652 | ) | ||||||||
Equity in
earnings and amortization charges of investee |
31,301 | 22,561 | 1,324 | |||||||||||
Loss on
derivative instruments |
— | (25,238 | ) | (2,843 | ) | |||||||||
Other income
(expense), net |
712 | 570 | (198 | ) | ||||||||||
Net income
(loss) from continuing operations before income taxes |
1,309 | (124,502 | ) | (83,657 | ) | |||||||||
Benefit for
income taxes |
8,697 | 15,818 | 14,061 | |||||||||||
Net income
(loss) from continuing operations |
$ | 10,006 | $ | (108,684 | ) | $ | (69,596 | ) | ||||||
Net income
(loss) from discontinued operations, net of taxes |
81,323 | (21,860 | ) | (110,045 | ) | |||||||||
Net income
(loss) |
$ | 91,329 | $ | (130,544 | ) | $ | (179,641 | ) | ||||||
Less: net
income (loss) attributable to noncontrolling interests |
659 | (1,377 | ) | (1,168 | ) | |||||||||
Net income
(loss) attributable to MIC LLC |
$ | 90,670 | $ | (129,167 | ) | $ | (178,473 | ) | ||||||
Basic income
(loss) per share from continuing operations attributable to MIC LLC interest holders |
$ | 0.21 | $ | (2.43 | ) | $ | (1.56 | ) | ||||||
Basic income
(loss) per share from discontinued operations attributable to MIC LLC interest holders |
1.78 | (0.44 | ) | (2.41 | ) | |||||||||
Basic income
(loss) per share attributable to MIC LLC interest holders |
$ | 1.99 | $ | (2.87 | ) | $ | (3.97 | ) | ||||||
Weighted
average number of shares outstanding: basic |
45,549,803 | 45,020,085 | 44,944,326 | |||||||||||
Diluted income
(loss) per share from continuing operations attributable to MIC LLC interest holders |
$ | 0.21 | $ | (2.43 | ) | $ | (1.56 | ) | ||||||
Diluted income
(loss) per share from discontinued operations attributable to MIC LLC interest holders |
1.78 | (0.44 | ) | (2.41 | ) | |||||||||
Diluted income
(loss) per share attributable to MIC LLC interest holders |
$ | 1.99 | $ | (2.87 | ) | $ | (3.97 | ) | ||||||
Weighted
average number of shares outstanding: diluted |
45,631,610 | 45,020,085 | 44,944,326 | |||||||||||
Cash
distributions declared per share |
$ | — | $ | — | $ | 2.125 | ||||||||
(1) |
Reclassified to conform to current period presentation. |
(2) |
Interest expense includes non-cash losses on derivative instruments of $23.4 million and $4.3 million for the years ended December 31, 2010 and 2009, respectively. |
See accompanying notes to the consolidated financial
statements.
105
MACQUARIE INFRASTRUCTURE COMPANY LLC
CONSOLIDATED STATEMENTS OF MEMBERS’
EQUITY AND COMPREHENSIVE INCOME (LOSS)
($ in Thousands, Except Share and Per Share Data)
EQUITY AND COMPREHENSIVE INCOME (LOSS)
($ in Thousands, Except Share and Per Share Data)
| Macquarie Infrastructure Company LLC Member’s
Equity |
|||||||||||||||||||||||||||||||||||
|---|---|---|---|---|---|---|---|---|---|---|---|---|---|---|---|---|---|---|---|---|---|---|---|---|---|---|---|---|---|---|---|---|---|---|---|
| LLC Interests |
|||||||||||||||||||||||||||||||||||
| Number of Shares |
Amount |
Additional Paid in Capital |
Accumulated Deficit |
Accumulated Other Comprehensive (Loss) Income |
Total Members’ Equity |
Noncontrolling Interests |
Total Equity |
||||||||||||||||||||||||||||
Balance at
December 31, 2007 |
44,938,380 | $ | 1,052,062 | $ | — | $ | (52,455 | ) | $ | (33,055 | ) | $ | 966,552 | $ | 7,172 | $ | 973,724 | ||||||||||||||||||
Offering costs
related to prior period issuance of LLC interests |
— | (47 | ) | — | — | — | (47 | ) | — | (47 | ) | ||||||||||||||||||||||||
Issuance of LLC
interests to independent directors |
10,314 | 450 | — | — | — | 450 | — | 450 | |||||||||||||||||||||||||||
Distributions
to holders of LLC interests (comprising $0.635 per share paid on 44,938,380 shares, $0.645 per share paid on 44,948,694 shares, $0.645 per share paid
on 44,948,694 shares and $0.20 per share paid on 44,948,694 shares) |
— | (95,509 | ) | — | — | — | (95,509 | ) | — | (95,509 | ) | ||||||||||||||||||||||||
Distributions
to noncontrolling interest members |
— | — | — | — | — | — | (481 | ) | (481 | ) | |||||||||||||||||||||||||
Purchase of
subsidiary interest from noncontrolling interest |
— | — | — | — | — | — | (100 | ) | (100 | ) | |||||||||||||||||||||||||
Other
comprehensive loss: |
|||||||||||||||||||||||||||||||||||
Net loss for
the year ended December 31, 2008 |
— | — | — | (178,473 | ) | — | (178,473 | ) | (1,168 | ) | (179,641 | ) | |||||||||||||||||||||||
Translation
adjustment |
— | — | — | — | (4 | ) | (4 | ) | — | (4 | ) | ||||||||||||||||||||||||
Change in
fair value of derivatives, net of taxes of $49,188 |
— | — | — | — | (74,267 | ) | (74,267 | ) | — | (74,267 | ) | ||||||||||||||||||||||||
Reclassification of realized losses of derivatives into earnings, net of taxes of $10,255 |
— | — | — | — | 15,639 | 15,639 | — | 15,639 | |||||||||||||||||||||||||||
Unrealized
loss on marketable securities |
— | — | — | — | (1 | ) | (1 | ) | — | (1 | ) | ||||||||||||||||||||||||
Change in
post-retirement benefit plans, net of taxes of $3,539 |
— | — | — | — | (5,502 | ) | (5,502 | ) | — | (5,502 | ) | ||||||||||||||||||||||||
Total
comprehensive loss for the year ended December 31, 2008 |
(242,608 | ) | (1,168 | ) | (243,776 | ) | |||||||||||||||||||||||||||||
Balance at
December 31, 2008 |
44,948,694 | $ | 956,956 | $ | — | $ | (230,928 | ) | $ | (97,190 | ) | $ | 628,838 | $ | 5,423 | $ | 634,261 | ||||||||||||||||||
Issuance of LLC
interests to manager |
330,104 | 2,491 | — | — | — | 2,491 | — | 2,491 | |||||||||||||||||||||||||||
Issuance of LLC
interests to independent directors |
14,115 | 450 | — | — | — | 450 | — | 450 | |||||||||||||||||||||||||||
Distributions
to noncontrolling interest members |
— | — | — | — | — | — | (583 | ) | (583 | ) | |||||||||||||||||||||||||
Sale of
subsidiary interest to noncontrolling interest |
— | — | 21,956 | — | 4,685 | 26,641 | (7,352 | ) | 19,289 | ||||||||||||||||||||||||||
Other
comprehensive loss: |
|||||||||||||||||||||||||||||||||||
Net loss for
the year ended December 31, 2009 |
— | — | — | (129,167 | ) | — | (129,167 | ) | (1,377 | ) | (130,544 | ) | |||||||||||||||||||||||
Change in
fair value of derivatives, net of taxes of $1,050 |
— | — | — | — | 1,498 | 1,498 | — | 1,498 | |||||||||||||||||||||||||||
Reclassification of realized losses of derivatives into earnings, net of taxes of $31,885 |
— | — | — | — | 47,857 | 47,857 | 131 | 47,988 | |||||||||||||||||||||||||||
Change in
post-retirement benefit plans, net of taxes of $53 |
— | — | — | — | (82 | ) | (82 | ) | — | (82 | ) | ||||||||||||||||||||||||
Total
comprehensive loss for the year ended December 31, 2009 |
(79,894 | ) | (1,246 | ) | (81,140 | ) | |||||||||||||||||||||||||||||
Balance at
December 31, 2009 |
45,292,913 | $ | 959,897 | $ | 21,956 | $ | (360,095 | ) | $ | (43,232 | ) | $ | 578,526 | $ | (3,758 | ) | $ | 574,768 | |||||||||||||||||
See accompanying notes to the consolidated financial
statements.
106
MACQUARIE INFRASTRUCTURE COMPANY LLC
CONSOLIDATED STATEMENTS OF MEMBERS’
EQUITY AND COMPREHENSIVE INCOME (LOSS) – (continued)
($ in Thousands, Except Share and Per Share Data)
EQUITY AND COMPREHENSIVE INCOME (LOSS) – (continued)
($ in Thousands, Except Share and Per Share Data)
| Macquarie Infrastructure Company LLC Member’s
Equity |
|||||||||||||||||||||||||||||||||||
|---|---|---|---|---|---|---|---|---|---|---|---|---|---|---|---|---|---|---|---|---|---|---|---|---|---|---|---|---|---|---|---|---|---|---|---|
| LLC Interests |
|||||||||||||||||||||||||||||||||||
| Number of Shares |
Amount |
Additional Paid in Capital |
Accumulated Deficit |
Accumulated Other Comprehensive (Loss) Income |
Total Members’ Equity |
Noncontrolling Interests |
Total Equity |
||||||||||||||||||||||||||||
Issuance of LLC
interests to manager |
294,330 | $ | 4,083 | $ | — | $ | — | $ | — | $ | 4,083 | $ | — | $ | 4,083 | ||||||||||||||||||||
Issuance of LLC
interests to independent directors |
128,205 | 450 | — | — | — | 450 | — | 450 | |||||||||||||||||||||||||||
Distributions
to noncontrolling interest members |
— | — | — | — | — | — | (5,346 | ) | (5,346 | ) | |||||||||||||||||||||||||
Contributions
from noncontrolling interest members |
— | — | — | — | — | — | 300 | 300 | |||||||||||||||||||||||||||
Sale of
subsidiary noncontrolling interest |
— | — | — | — | — | — | 1,727 | 1,727 | |||||||||||||||||||||||||||
Other
comprehensive income: |
|||||||||||||||||||||||||||||||||||
Net income
for the year ended December 31, 2010 |
— | — | — | 90,670 | — | 90,670 | 659 | 91,329 | |||||||||||||||||||||||||||
Reclassification of realized losses of derivatives into earnings, net of taxes of $11,720 |
— | — | — | — | 17,572 | 17,572 | 1,964 | 19,536 | |||||||||||||||||||||||||||
Change in
post-retirement benefit plans, net of taxes of $98 |
— | — | — | — | (152 | ) | (152 | ) | — | (152 | ) | ||||||||||||||||||||||||
Total
comprehensive income for the year ended December 31, 2010 |
108,090 | 2,623 | 110,713 | ||||||||||||||||||||||||||||||||
Balance at
December 31, 2010 |
45,715,448 | $ | 964,430 | $ | 21,956 | $ | (269,425 | ) | $ | (25,812 | ) | $ | 691,149 | $ | (4,454 | ) | $ | 686,695 | |||||||||||||||||
See accompanying notes to the consolidated financial
statements.
107
MACQUARIE INFRASTRUCTURE COMPANY LLC
CONSOLIDATED STATEMENTS OF CASH FLOWS
($ in Thousands)
($ in Thousands)
| Year Ended December 31, 2010 |
Year Ended December 31, 2009(1) |
Year Ended December 31, 2008(1) |
||||||||||||
|---|---|---|---|---|---|---|---|---|---|---|---|---|---|---|
Operating
activities |
||||||||||||||
Net income
(loss) |
$ | 91,329 | $ | (130,544 | ) | $ | (179,641 | ) | ||||||
Adjustments
to reconcile net income (loss) to net cash provided by operating activities from continuing operations: |
||||||||||||||
Net (income)
loss from discontinued operations before noncontrolling interests |
(81,323 | ) | 21,860 | 110,045 | ||||||||||
Non-cash
goodwill impairment |
— | 71,200 | 52,000 | |||||||||||
Depreciation
and amortization of property and equipment |
36,276 | 42,899 | 45,953 | |||||||||||
Amortization
of intangible assets |
34,898 | 60,892 | 61,874 | |||||||||||
Loss on
disposal of assets |
17,869 | — | — | |||||||||||
Equity in
earnings and amortization charges of investees |
(31,301 | ) | (22,561 | ) | (1,324 | ) | ||||||||
Equity
distributions from investees |
15,000 | 7,000 | 1,324 | |||||||||||
Amortization
of debt financing costs |
4,347 | 5,121 | 4,762 | |||||||||||
Non-cash
derivative loss |
23,410 | 29,540 | 2,843 | |||||||||||
Base
management fees settled in LLC interests |
5,403 | 4,384 | — | |||||||||||
Equipment
lease receivable, net |
2,761 | 2,752 | 2,460 | |||||||||||
Deferred rent
|
413 | 183 | 183 | |||||||||||
Deferred
taxes |
(11,729 | ) | (17,923 | ) | (16,037 | ) | ||||||||
Other
non-cash expenses, net |
1,817 | 2,115 | 4,115 | |||||||||||
Changes in
other assets and liabilities, net of acquisitions: |
||||||||||||||
Restricted
cash |
50 | — | — | |||||||||||
Accounts
receivable |
(2,424 | ) | 13,020 | 16,392 | ||||||||||
Inventories
|
(2,833 | ) | 1,233 | 2,698 | ||||||||||
Prepaid
expenses and other current assets |
453 | 2,944 | 6,840 | |||||||||||
Due to
manager — related party |
(15 | ) | (3,438 | ) | (2,216 | ) | ||||||||
Accounts
payable and accrued expenses |
(4,821 | ) | (4,670 | ) | (17,132 | ) | ||||||||
Income taxes
payable |
1,051 | 535 | (1,108 | ) | ||||||||||
Other, net
|
(2,076 | ) | (3,566 | ) | 1,548 | |||||||||
Net cash
provided by operating activities from continuing operations |
98,555 | 82,976 | 95,579 | |||||||||||
Investing
activities |
||||||||||||||
Acquisitions
of businesses and investments, net of cash acquired |
— | — | (41,804 | ) | ||||||||||
Proceeds from
sale of investment |
— | 29,500 | 7,557 | |||||||||||
Purchases of
property and equipment |
(22,690 | ) | (30,320 | ) | (49,560 | ) | ||||||||
Investment in
capital leased assets |
(2,976 | ) | — | — | ||||||||||
Return of
investment in unconsolidated business |
— | — | 26,676 | |||||||||||
Other
|
892 | 304 | 415 | |||||||||||
Net cash used
in investing activities from continuing operations |
(24,774 | ) | (516 | ) | (56,716 | ) | ||||||||
See accompanying notes to the consolidated financial
statements.
108
MACQUARIE INFRASTRUCTURE COMPANY LLC
CONSOLIDATED STATEMENTS OF CASH FLOWS –
(continued)
($ in Thousands)
($ in Thousands)
| Year Ended December 31, 2010 |
Year Ended December 31, 2009(1) |
Year Ended December 31, 2008(1) |
||||||||||||
|---|---|---|---|---|---|---|---|---|---|---|---|---|---|---|
Financing
activities |
||||||||||||||
Proceeds from
long-term debt |
$ | 141 | $ | 10,000 | $ | 5,000 | ||||||||
Net proceeds
(payments) on line of credit facilities |
500 | (45,400 | ) | 96,150 | ||||||||||
Offering and
equity raise costs paid |
— | — | (65 | ) | ||||||||||
Distributions
paid to holders of LLC interests |
— | — | (95,509 | ) | ||||||||||
Contributions
received from noncontrolling interests |
300 | — | — | |||||||||||
Distributions
paid to noncontrolling interests |
(5,346 | ) | (583 | ) | (481 | ) | ||||||||
Payment of
long-term debt |
(74,036 | ) | (81,621 | ) | — | |||||||||
Debt
financing costs paid |
(186 | ) | — | (1,879 | ) | |||||||||
Change in
restricted cash |
2,236 | (33 | ) | (865 | ) | |||||||||
Payment of
notes and capital lease obligations |
(137 | ) | (181 | ) | (653 | ) | ||||||||
Net cash
(used in) provided by financing activities from continuing operations |
(76,528 | ) | (117,818 | ) | 1,698 | |||||||||
Net change in
cash and cash equivalents from continuing operations |
(2,747 | ) | (35,358 | ) | 40,561 | |||||||||
Cash flows
(used in) provided by discontinued operations: |
||||||||||||||
Net cash used
in operating activities |
(12,703 | ) | (4,732 | ) | (1,904 | ) | ||||||||
Net cash
provided by (used in) investing activities |
134,356 | (445 | ) | (26,684 | ) | |||||||||
Net cash
(used in) provided by financing activities |
(124,183 | ) | 2,144 | (1,215 | ) | |||||||||
Cash used in
discontinued operations(2) |
(2,530 | ) | (3,033 | ) | (29,803 | ) | ||||||||
Change in
cash of discontinued operations held for sale(2) |
2,385 | (208 | ) | 2,459 | ||||||||||
Net change in
cash and cash equivalent |
(2,892 | ) | (38,599 | ) | 13,217 | |||||||||
Cash and cash
equivalents, beginning of period |
27,455 | 66,054 | 52,837 | |||||||||||
Cash and cash
equivalents, end of period-continuing operations |
$ | 24,563 | $ | 27,455 | $ | 66,054 | ||||||||
Supplemental disclosures of cash flow information for continuing operations: |
||||||||||||||
Non-cash
investing and financing activities: |
||||||||||||||
Accrued
purchases of property and equipment |
$ | 431 | $ | 1,277 | $ | 883 | ||||||||
Acquisition
of equipment through capital leases |
$ | 139 | $ | — | $ | — | ||||||||
Issuance of
LLC interests to manager for base management fees |
$ | 4,083 | $ | 2,490 | $ | — | ||||||||
Issuance of
LLC interests to independent directors |
$ | 450 | $ | 450 | $ | 450 | ||||||||
Taxes paid
|
$ | 1,655 | $ | 1,231 | $ | 3,048 | ||||||||
Interest paid
|
$ | 78,718 | $ | 87,308 | $ | 84,235 | ||||||||
(1) |
Reclassified to conform to current period presentation. |
(2) |
Cash of discontinued operations held for sale is reported in assets of discontinued operations held for sale in the accompanying consolidated balance sheets. The cash used in discontinued operations is different than the change in cash of discontinued operations held for sale due to intercompany transactions that are eliminated in consolidation. |
See accompanying notes to the consolidated financial
statements.
109
MACQUARIE INFRASTRUCTURE COMPANY LLC
NOTES TO CONSOLIDATED FINANCIAL STATEMENTS
NOTES TO CONSOLIDATED FINANCIAL STATEMENTS
1. Organization and Description of
Business
Macquarie Infrastructure Company LLC, a
Delaware limited liability company, was formed on April 13, 2004. Macquarie Infrastructure Company LLC, both on an individual entity basis and together
with its consolidated subsidiaries, is referred to in these financial statements as the “Company” or “MIC”. The Company owns,
operates and invests in a diversified group of infrastructure businesses in the United States. Macquarie Infrastructure Management (USA) Inc. is the
Company’s manager and is referred to in these financial statements as the Manager. The Manager is a wholly-owned subsidiary within the Macquarie
Group of companies, which is comprised of Macquarie Group Limited and its subsidiaries and affiliates worldwide. Macquarie Group Limited is
headquartered in Australia and is listed on the Australian Stock Exchange.
MIC LLC is a holding company with no
operations. MIC LLC is an operating entity with Board of Directors and other corporate governance responsibilities generally consistent with those of a
Delaware corporation. MIC LLC has made an election to be treated as a corporation for tax purposes.
The Company owns its businesses through
its wholly-owned subsidiary, Macquarie Infrastructure Company Inc., or MIC Inc. The Company’s businesses operate predominantly in the United
States and consist of the following:
The Energy-Related Businesses:
• |
a 50% interest in a bulk liquid storage terminal business (“International Matex Tank Terminals” or “IMTT”), which provides bulk liquid storage and handling services at ten marine terminals in the United States and two in Canada and is one of the largest participants in this industry in the U.S., based on storage capacity; |
• |
a gas production and distribution business (“The Gas Company”), which is a full-service gas energy company, making gas products and services available in Hawaii; and |
• |
a 50.01% controlling interest in a district energy business (“District Energy”), which operates the largest district cooling system in the U.S., serving various customers in Chicago, Illinois and Las Vegas, Nevada. |
Atlantic Aviation — an airport services
business providing products and services, including fuel and aircraft hangaring/parking, to owners and operators of private jets at 66 airports and one
heliport in the U.S.
2. Summary of Significant Accounting
Policies
Principles of Consolidation
The consolidated financial statements
include the accounts of the Company and its wholly-owned subsidiaries. All intercompany balances and transactions have been eliminated in
consolidation. Except as otherwise specified, we refer to Macquarie Infrastructure Company LLC and its subsidiaries collectively as the
“Company”. The Company consolidates investments where it has a controlling financial interest. The usual condition for a controlling
financial interest is ownership of a majority of the voting interest and, therefore, as a general rule, ownership, directly or indirectly, of over 50%
of the outstanding voting shares is a condition for consolidation. For investments in variable interest entities, the Company consolidates when it is
determined to be the primary beneficiary of the variable interest entity. As of December 31, 2010, the Company was not the primary beneficiary of any
variable interest entity in which it did not own a majority of the outstanding voting stock.
110
MACQUARIE INFRASTRUCTURE COMPANY LLC
NOTES TO CONSOLIDATED FINANCIAL STATEMENTS (Continued)
NOTES TO CONSOLIDATED FINANCIAL STATEMENTS (Continued)
2. Summary of Significant Accounting
Policies (Continued)
Investments
The Company accounts for 50% or less
owned companies over which it has the ability to exercise significant influence using the equity method of accounting, otherwise the cost method is
used. The Company’s share of net income or losses of equity investments is included in equity in earnings (loss) and amortization charges of
investee in the consolidated statements of operations. Losses are recognized in other income (expense) when a decline in the value of the investment is
deemed to be other than temporary. In making this determination, the Company considers factors to be evaluated in determining whether a loss in value
should be recognized, including the Company’s ability to hold its investment and inability of the investee to sustain an earnings capacity, which
would justify the carrying amount of the investment.
Use of Estimates
The preparation of our consolidated
financial statements, which are in conformity with generally accepted accounting principles, or GAAP, requires the Company to make estimates and
assumptions. These estimates and assumptions affect the reported amounts of assets and liabilities, the disclosure of contingent assets and liabilities
at the date of the consolidated financial statements, and the reported amounts of revenue and expenses during the reporting period. The Company
evaluates these estimates and judgments on an ongoing basis and the estimates are based on experience, current and expected future conditions,
third-party evaluations and various other assumptions that the Company believes are reasonable under the circumstances. Significant items subject to
such estimates and assumptions include the carrying amount of property, equipment and leasehold improvements, intangibles, asset retirement obligations
and goodwill; valuation allowances for receivables, inventories and deferred income tax assets; assets and obligations related to employee benefits;
environmental liabilities; and valuation of derivative instruments. The results of these estimates form the basis for making judgments about the
carrying values of assets and liabilities as well as identifying and assessing the accounting treatment with respect to commitments and contingencies.
Actual results may differ from the estimates and assumptions used in the financial statements and related notes.
Cash and Cash Equivalents
The Company considers all highly liquid
investments with a maturity of three months or less when purchased to be cash equivalents. Commercial paper, issued by a counterparty with Standard
& Poor rating of A1+ are also considered cash and cash equivalents. At December 31, 2010 and 2009, the Company did not have any commercial
paper.
Restricted Cash
The Company classifies all cash pledged
as collateral on the outstanding senior debt as restricted cash in the consolidated balance sheets relating to Atlantic Aviation. The Company recorded
$13.8 million and $16.0 million of cash pledged as collateral in the consolidated balance sheets at December 31, 2010 and at December 31, 2009,
respectively. In addition, the Company had $52,000 as restricted cash in other current assets at December 31, 2009.
Allowance for Doubtful Accounts
The Company uses estimates to determine
the amount of the allowance for doubtful accounts necessary to reduce billed and unbilled accounts receivable to their net realizable value. The
Company estimates the required allowance by reviewing the status of past-due receivables and analyzing historical bad debt trends. Actual collection
experience has not varied significantly from estimates primarily due to credit policies and a lack of concentration of accounts receivable. The Company
writes off receivables deemed to be uncollectible to the allowance for doubtful accounts.
111
MACQUARIE INFRASTRUCTURE COMPANY LLC
NOTES TO CONSOLIDATED FINANCIAL STATEMENTS (Continued)
NOTES TO CONSOLIDATED FINANCIAL STATEMENTS (Continued)
2. Summary of Significant Accounting
Policies (Continued)
Inventory
Inventory consists principally of fuel
purchased from various third-party vendors and materials and supplies at Atlantic Aviation and The Gas Company. Fuel inventory is stated at the lower
of cost or market. Materials and supplies inventory is valued at the lower of average cost or market. Inventory sold is recorded using the
first-in-first-out method at Atlantic Aviation and an average cost method at The Gas Company. Cash flows related to the sale of inventory are
classified in net cash provided by operating activities in the consolidated statements of cash flows. The Company’s inventory balance at December
31, 2010 comprised $12.8 million of fuel and $4.3 million of materials and supplies. The Company’s inventory balance at December 31, 2009
comprised $10.1 million of fuel and $4.2 million of materials and supplies.
Property, Equipment, Land and Leasehold
Improvements
Property, equipment and land are
initially recorded at cost. Leasehold improvements are recorded at the initial present value of the minimum lease payments less accumulated
amortization. Major renewals and improvements are capitalized while maintenance and repair expenditures are expensed when incurred. Interest expense
relating to construction in progress is capitalized as an additional cost of the asset. The Company depreciates property, equipment and leasehold
improvements over their estimated useful lives on a straight-line basis. Depreciation expense for District Energy is included within cost of services
in the consolidated statements of operations. The estimated economic useful lives range according to the table below:
Buildings
|
10 to 68
years |
|||||
Leasehold and
land improvements |
5 to 40
years |
|||||
Machinery and
equipment |
5 to 62
years |
|||||
Furniture and
Fixtures |
3 to 25
years |
|||||
Goodwill and Intangible Assets
Goodwill consists of costs in excess of
the aggregate purchase price over the fair value of tangible and identifiable intangible net assets acquired in the purchase business combinations. The
cost of intangible assets with determinable useful lives are amortized over their estimated useful lives ranging as follows:
Customer
relationships |
5 to 10
years |
|||||
Contract rights
|
5 to 40
years |
|||||
Non-compete
agreements |
2 to 5
years |
|||||
Leasehold
interests |
3 to 14
years |
|||||
Trade names
|
Indefinite |
|||||
Technology
|
5
years |
|||||
Impairment of Long-lived Assets, Excluding
Goodwill
Long-lived assets, including
amortizable intangible assets, are reviewed for impairment whenever events or changes in circumstances indicate that the carrying amount of an asset or
group of assets may not be fully recoverable. These events or changes in circumstances may include a significant deterioration of operating results,
changes in business plans, or changes in anticipated future cash flows. If an impairment indicator is present, the Company evaluates recoverability by
a comparison of the carrying amount of the assets to future undiscounted net cash flows expected to be generated by the assets. If the assets are
impaired, the impairment recognized is measured by the amount by which the carrying amount exceeds the fair value of the assets. Fair value is
generally determined by estimates of discounted cash flows or value expected to be realized in a third
112
MACQUARIE INFRASTRUCTURE COMPANY LLC
NOTES TO CONSOLIDATED FINANCIAL STATEMENTS (Continued)
NOTES TO CONSOLIDATED FINANCIAL STATEMENTS (Continued)
2. Summary of Significant Accounting
Policies (Continued)
party sale. The discount rate used in any estimate of discounted cash flows would be the rate required for a similar investment of like risk.
Impairment of Goodwill
Goodwill is tested for impairment at
least annually or when there is a triggering event that indicates impairment. Goodwill is considered impaired when the carrying amount of a reporting
unit’s goodwill exceeds its implied fair value, as determined under a two-step approach. The first step is to determine the estimated fair value
of each reporting unit with goodwill. The reporting units of the Company, for purposes of the impairment test, are those components of operating
segments for which discrete financial information is available and segment management regularly reviews the operating results of that component.
Components are combined when determining reporting units have similar economic characteristics.
The Company estimates the fair value of
each reporting unit by estimating the present value of the reporting unit’s future discounted cash flows or value expected to be realized in a
third party sale. If the recorded net assets of the reporting unit are less than the reporting unit’s estimated fair value, then no impairment is
indicated. Alternatively, if the recorded net assets of the reporting unit exceed its estimated fair value, then goodwill is assumed to be impaired and
a second step is performed. In the second step, the implied fair value of goodwill is determined by deducting the estimated fair value of all tangible
and identifiable intangible net assets of the reporting unit from the estimated fair value of the reporting unit. If the recorded amount of goodwill
exceeds this implied fair value, an impairment charge is recorded for the excess.
Impairment of Indefinite-lived Intangibles, Excluding
Goodwill
Indefinite-lived intangibles,
trademarks, are considered impaired when the carrying amount of the asset exceeds its implied fair value.
The Company estimates the fair value of
each trademark using the relief-from-royalty method that discounts the estimated net cash flows the Company would have to pay to license the trademark
under an arm’s length licensing agreement.
If the recorded indefinite-lived
intangible is less than its estimated fair value, then no impairment is indicated. Alternatively, if the recorded intangible asset exceeds its fair
value, an impairment loss is recognized in an amount equal to that excess.
Debt Issuance Costs
The Company capitalizes all direct
costs incurred in connection with the issuance of debt as debt issuance costs. These costs are amortized over the contractual term of the debt
instrument, which ranges from 3 to 7 years, using the effective interest method.
Derivative Instruments
The Company accounts for derivatives
and hedging activities in accordance with ASC 815 Derivatives and Hedging, which requires that all derivative instruments be recorded on the
balance sheet at their respective fair values.
Previously, the Company applied hedge
accounting to its derivative instruments. On the date a derivative contract was entered into, the Company designated the derivative as either a hedge
of the fair value of a recognized asset or liability or of an unrecognized firm commitment (fair value hedge), a hedge of a forecasted transaction or
the variability of cash flows to be received or paid related to a recognized asset or liability (cash flow hedge) or a foreign-currency fair-value or
cash-flow hedge (foreign currency hedge).
113
MACQUARIE INFRASTRUCTURE COMPANY LLC
NOTES TO CONSOLIDATED FINANCIAL STATEMENTS (Continued)
NOTES TO CONSOLIDATED FINANCIAL STATEMENTS (Continued)
2. Summary of Significant Accounting
Policies (Continued)
The Company formally documented the
hedging relationship and its risk-management objective and strategy for undertaking the hedge, the hedging instrument, the hedged item, the nature of
the risk being hedged, how the hedging instrument’s effectiveness in offsetting the hedged risk would be assessed prospectively and
retrospectively, and a description of the method of measuring ineffectiveness. This process included linking all derivatives that were designated as
hedges to specific assets and liabilities on the balance sheet or to specific firm commitments or forecasted transactions. The Company also formally
assessed, both at the hedge’s inception and on an ongoing basis, whether the derivatives used in hedging transactions were highly effective in
offsetting changes in fair values or cash flows of hedged items. Changes in the fair value of a derivative that were highly effective and that were
designated and qualified as a cash-flow hedge were recorded in other comprehensive income to the extent that the derivative was effective as a hedge,
until earnings were affected by the variability in cash flows of the designated hedged item. The ineffective portion of the change in fair value of a
derivative instrument that qualified as a cash-flow hedge was reported in earnings.
The Company discontinues hedge
accounting prospectively when it is determined that the derivative is no longer effective in offsetting changes in the fair value or cash flows of the
hedged item; the derivative expires or is sold, terminated, or exercised; the derivative is no longer designated as a hedging instrument because it is
unlikely that a forecasted transaction will occur; a hedged firm commitment no longer meets the definition of a firm commitment; or management
determines that designation of the derivative as a hedging instrument is no longer appropriate.
In all situations in which hedge
accounting is discontinued, the Company continues to carry the derivative at its fair value on the balance sheet and recognizes any subsequent changes
in its fair value in earnings. When hedge accounting is discontinued because it is probable that a forecasted transaction will not occur, the Company
recognizes immediately in earnings gains and losses that were accumulated in other comprehensive income.
As of February 25, 2009 for Atlantic
Aviation and effective April 1, 2009 for the other businesses, the Company elected to discontinue hedge accounting. From the dates that hedge
accounting was discontinued, all movements in the fair value of the interest rate swaps are recorded directly through earnings. As a result of the
discontinuance of hedge accounting, the Company will reclassify into earnings net derivative losses included in accumulated other comprehensive loss
over the remaining life of the existing interest rate swaps. See Note 12, “Derivative Instruments and Hedging Activities”, for further
discussion.
Financial Instruments
The Company’s financial
instruments, including cash and cash equivalents, accounts receivable, accounts payable and variable-rate senior debt, are carried at cost, which
approximates their fair value because of either the short-term maturity, or variable or competitive interest rates assigned to these financial
instruments.
Concentrations of Credit Risk
Financial instruments that potentially
expose the Company to concentrations of credit risk consist primarily of cash and cash equivalents and accounts receivable. The Company places its cash
and cash equivalents with financial institutions and its balances may exceed federally insured limits. The Company’s accounts receivable are
mainly derived from fuel and gas sales and services rendered under contract terms with commercial and private customers located primarily in the United
States. At December 31, 2010 and 2009, there were no outstanding accounts receivable due from a single customer that accounted for more than 10% of the
total accounts receivable. Additionally, no single customer accounted for more than 10% of the Company’s revenue during the years ended December
31, 2010, 2009 and 2008.
114
MACQUARIE INFRASTRUCTURE COMPANY LLC
NOTES TO CONSOLIDATED FINANCIAL STATEMENTS (Continued)
NOTES TO CONSOLIDATED FINANCIAL STATEMENTS (Continued)
2. Summary of Significant Accounting
Policies (Continued)
Income (Loss) per Share
The Company calculates income (loss)
per share using the weighted average number of common shares outstanding during the period. Diluted income (loss) per share is computed using the
weighted average number of common and dilutive common equivalent shares outstanding during the period. Common equivalent shares consist of shares
issuable upon the exercise of stock options (using the treasury stock method) and stock units granted to the Company’s independent directors;
common equivalent shares are excluded from the calculation if their effect is anti-dilutive.
Comprehensive Income (Loss)
The Company follows the requirements of
ASC 220 Comprehensive Income, for the reporting and presentation of comprehensive income (loss) and its components. This guidance requires
unrealized gains or losses on the Company’s available for sale securities, foreign currency translation adjustments, minimum pension liability
adjustments and changes in fair value of derivatives, where hedge accounting is applied, to be included in other comprehensive income
(loss).
Advertising
Advertising costs are expensed as
incurred. Costs associated with direct response advertising programs may be prepaid and are expensed once the printed materials are distributed to the
public.
Revenue Recognition
The Company recognizes revenue when
persuasive evidence of an arrangement exists, delivery has occurred or services have been rendered, the seller’s price to the buyer is fixed and
determinable and collectability is probable.
The Gas Company
The Gas Company recognizes revenue when
the services are provided. Sales of gas to customers are billed on a monthly-cycle basis. Earned but unbilled revenue is accrued and included in
accounts receivable and revenue based on the amount of gas that is delivered but not billed to customers from the latest meter reading or billed
delivery date to the end of an accounting period, and the related costs are charged to expense. Most revenue is based upon consumption; however,
certain revenue is based upon a flat rate.
District Energy
Revenue from cooling capacity and
consumption are recognized at the time of performance of service. Cash received from customers for services to be provided in the future are recorded
as unearned revenue and recognized over the expected service period on a straight-line basis.
Atlantic Aviation
Revenue on fuel sales is recognized
when the fuel has been delivered to the customer, collection of the resulting receivable is probable, persuasive evidence of an arrangement exists and
the fee is fixed or determinable. Fuel sales are recorded net of volume discounts and rebates.
Service revenue includes certain
fuelling fees. The Company receives a fuelling fee for fuelling certain carriers with fuel owned by such carriers. Revenue from these transactions is
recorded based on the service fee earned and does not include the cost of the carriers’ fuel.
115
MACQUARIE INFRASTRUCTURE COMPANY LLC
NOTES TO CONSOLIDATED FINANCIAL STATEMENTS (Continued)
NOTES TO CONSOLIDATED FINANCIAL STATEMENTS (Continued)
2. Summary of Significant Accounting
Policies (Continued)
Other FBO revenue consists principally
of de-icing services, landing and fuel distribution fees as well as rental income for hangar and terminal use. Other FBO revenue is recognized as the
services are rendered to the customer.
Regulatory Assets and Liabilities
The regulated utility operations of The
Gas Company are subject to regulations with respect to rates, service, maintenance of accounting records, and various other matters by the Hawaii
Public Utilities Commission, or HPUC. The established accounting policies recognize the financial effects of the rate-making and accounting practices
and policies of the HPUC. Regulated utility operations are subject to the provisions of ASC 980, Regulated Operations. This guidance requires
regulated entities to disclose in their financial statements the authorized recovery of costs associated with regulatory decisions. Accordingly,
certain costs that otherwise would normally be charged to expense may, in certain instances, be recorded as an asset in a regulatory entity’s
balance sheet. The Gas Company records regulatory assets for costs that have been deferred for which future recovery through customer rates has been
approved by the HPUC. Regulatory liabilities represent amounts included in rates and collected from customers for costs expected to be incurred in the
future.
ASC 980 may, at some future date, be
deemed inapplicable because of changes in the regulatory and competitive environments or other factors. If the Company were to discontinue the
application of this guidance, the Company would be required to write off its regulatory assets and regulatory liabilities and would be required to
adjust the carrying amount of any other assets, including property, plant and equipment, that would be deemed not recoverable related to these affected
operations. The Company believes its regulated operations in The Gas Company continue to meet the criteria of ASC 980 and that the carrying value of
its regulated property, plant and equipment is recoverable in accordance with established HPUC rate-making practices.
Income Taxes
The Company uses the asset and
liability method in accounting for income taxes. Under this method, deferred income tax assets and liabilities are determined based on differences
between financial reporting and tax basis of assets and liabilities and are measured using the enacted tax rates and laws that will be in effect when
the differences are expected to reverse. Commencing 2007, the Company and its subsidiaries file a consolidated U.S. federal income tax return. The
Company’s consolidated income tax return does not include the taxable income of IMTT and, subsequent to the sale of 49.99% of the business, the
taxable income of District Energy. Those businesses file separate income tax returns.
Reclassifications
Certain reclassifications were made to
the financial statements for the prior period to conform to current year presentation.
116
MACQUARIE INFRASTRUCTURE COMPANY LLC
NOTES TO CONSOLIDATED FINANCIAL STATEMENTS (Continued)
NOTES TO CONSOLIDATED FINANCIAL STATEMENTS (Continued)
3. Income (loss) per
Share
Following is a reconciliation of the
basic and diluted number of shares used in computing income (loss) per share:
| Year Ended December 31, |
|||||||||||||||
|---|---|---|---|---|---|---|---|---|---|---|---|---|---|---|---|
| 2010 |
2009 |
2008 |
|||||||||||||
Weighted
average number of shares outstanding: basic |
45,549,803 | 45,020,085 | 44,944,326 | ||||||||||||
Dilutive
effect of restricted stock unit grants |
81,807 | — | — | ||||||||||||
Weighted
average number of shares outstanding: diluted |
45,631,610 | 45,020,085 | 44,944,326 | ||||||||||||
The effect of potentially dilutive
shares for the year ended December 31, 2010 is calculated assuming that the 128,205 restricted stock unit grants provided to the independent directors
on June 4, 2009, which vested in 2010, and the 31,989 restricted stock unit grants on June 3, 2010, which will vest in 2011, had been fully converted
to shares on those grant dates. However, the restricted stock unit grants were anti-dilutive for the years ended December 31, 2009 and 2008, due to the
Company’s net loss for those periods.
4. Discontinued
Operations
PCAA operated 31 facilities comprising
over 40,000 parking spaces near 20 major airports across the United States. PCAA provided customers with 24-hour secure parking close to airport
terminals, as well as transportation via shuttle bus to and from their vehicles and the terminal. Operations were carried out on either owned or leased
land at locations near the airports.
On June 2, 2010, the Company concluded
the sale in bankruptcy of an airport parking business (“Parking Company of America Airports” or “PCAA”) resulting in a pre-tax gain
of $130.3 million, of which $76.5 million related to the forgiveness of debt, and the elimination of $201.0 million of current debt from liabilities
from the Company’s consolidated balance sheet. As a part of the bankruptcy sale process, substantially all of the cash proceeds were used to pay
the creditors of this business and were not paid to the Company. The Company received $602,000 from the PCAA bankruptcy estate for expenses paid on
behalf of PCAA during its operations.
As a result of the approval of the sale
of PCAA’s assets in bankruptcy and the expected dissolution of PCAA during 2010, the Company has reduced its valuation allowance on the
realization of a portion of the deferred tax assets attributable to its basis in PCAA and its consolidated federal net operating losses. The change in
the valuation allowance recorded in discontinued operations was $9.6 million.
The results of operations from this
business, for all periods presented, and the gain from the bankruptcy sale are separately reported as a discontinued operations in the Company’s
consolidated financial statements. This business is no longer a reportable segment. The assets and liabilities of the business are included in assets
of discontinued operations held for sale and liabilities of discontinued operations held for sale on the Company’s consolidated balance sheet at
December 31, 2009.
117
MACQUARIE INFRASTRUCTURE COMPANY LLC
NOTES TO CONSOLIDATED FINANCIAL STATEMENTS (Continued)
NOTES TO CONSOLIDATED FINANCIAL STATEMENTS (Continued)
4. Discontinued Operations
(Continued)
The following is a summary of the
assets and liabilities of discontinued operations held for sale related to PCAA at December 31, 2009:
| December 31, 2009 |
||||||
|---|---|---|---|---|---|---|
| ($ in Thousands) | ||||||
Assets |
||||||
Total current
assets |
$ | 7,676 | ||||
Property,
equipment, land and leasehold improvements, net |
77,524 | |||||
Other
non-current assets |
1,495 | |||||
Total assets
|
$ | 86,695 | ||||
Liabilities |
||||||
Current
portion of long-term debt |
$ | 200,999 | ||||
Other current
liabilities |
10,761 | |||||
Total current
liabilities |
211,760 | |||||
Other
non-current liabilities |
8,789 | |||||
Total
liabilities |
220,549 | |||||
Noncontrolling interest |
(1,863 | ) | ||||
Total
liabilities and noncontrolling interest |
$ | 218,686 | ||||
Summarized financial information for
discontinued operations related to PCAA for the years ended December 31, 2010, 2009 and 2008 are as follows:
| For the Year Ended December 31, |
|||||||||||||||
|---|---|---|---|---|---|---|---|---|---|---|---|---|---|---|---|
| 2010 |
2009 |
2008 |
|||||||||||||
| ($ in Thousands, Except Share and Per Share Data) | |||||||||||||||
Service
revenue |
$ | 28,826 | $ | 68,457 | $ | 74,692 | |||||||||
Gain on sale
of assets through bankruptcy (pre-tax) |
130,260 | — | — | ||||||||||||
Net income
(loss) from discontinued operations before income taxes and noncontrolling interest |
$ | 132,709 | $ | (23,647 | ) | $ | (180,104 | ) | |||||||
(Provision)
benefit for income taxes |
(51,386 | ) | 1,787 | 70,059 | |||||||||||
Net income
(loss) from discontinued operations |
81,323 | (21,860 | ) | (110,045 | ) | ||||||||||
Less: net
income (loss) attributable to noncontrolling interests |
136 | (1,863 | ) | (1,753 | ) | ||||||||||
Net income
(loss) from discontinued operations attributable to MIC LLC |
$ | 81,187 | $ | (19,997 | ) | $ | (108,292 | ) | |||||||
Basic income
(loss) per share from discontinued operations attributable to MIC LLC interest holders |
$ | 1.78 | $ | (0.44 | ) | $ | (2.41 | ) | |||||||
Weighted
average number of shares outstanding at the Company level: basic |
45,549,803 | 45,020,085 | 44,944,326 | ||||||||||||
Diluted income
(loss) per share from discontinued operations attributable to MIC LLC interest holders |
$ | 1.78 | $ | (0.44 | ) | $ | (2.41 | ) | |||||||
Weighted
average number of shares outstanding at the Company level: diluted |
45,631,610 | 45,020,085 | 44,944,326 | ||||||||||||
118
MACQUARIE INFRASTRUCTURE COMPANY LLC
NOTES TO CONSOLIDATED FINANCIAL STATEMENTS (Continued)
NOTES TO CONSOLIDATED FINANCIAL STATEMENTS (Continued)
5. Dispositions
Disposal of Assets at Atlantic
Aviation
During 2010, Atlantic Aviation
completed a strategic review of its portfolio of FBOs. As a result of this process, the business concluded that several of its sites did not have
sufficient scale or serve a market with sufficiently strong growth prospects to warrant continued operations at these sites. Therefore, Atlantic
Aviation has undertaken to exit certain markets and redeploy resources that may be made available in the process into markets which it views as having
better growth profiles and recorded $17.9 million in loss on disposal of assets for Atlantic Aviation in the consolidated statement of
operations.
In 2010, Atlantic Aviation bid for
renewal of an operating lease at Atlanta’s Hartsfield airport. This lease had been operating on a month to month basis since being acquired by
Atlantic in August 2007. In November 2010, the lease was tentatively awarded to a party other than Atlantic. As a result, in December 2010, Atlantic
recorded a non-cash loss on disposal of its assets totaling $3.7 million. As of February 23, 2011, Atlantic Aviation continues to operate at this FBO
on a month to month basis, while the airport negotiates with the third party.
On January 31, 2011, Atlantic Aviation
concluded the sale of FBOs at Fresno Yosemite International Airport and Cleveland Cuyahoga County Airport. As a result, during the fourth quarter of
2010, the business recorded a non-cash loss on disposal of its assets totaling $9.8 million.
In February 2011, Atlantic Aviation
entered into an asset purchase agreement pertaining to an FBO. As a result, during the fourth quarter of 2010, the business recorded a non-cash loss on
disposal of its assets totaling $4.4 million.
District Energy Noncontrolling Interest 49.99%
Sale
District Energy consists of Thermal
Chicago, which services customers in Chicago, Illinois and a 75% interest in Northwind Aladdin, which services customers in Las Vegas, Nevada. The
remaining 25% equity interest in Northwind Aladdin is owned by Nevada Electric Investment Company, or NEICO, an indirect subsidiary of NV Energy, Inc.
On December 23, 2009, the Company sold 49.99% of the membership interests of District Energy to John Hancock Life Insurance Company and John Hancock
Life Insurance Company (U.S.A.) (collectively “John Hancock”) for $29.5 million.
As the Company has retained majority
ownership and control in District Energy, the business continues to be reported as part of the Company’s consolidated financial statements. The
noncontrolling interest portion of the business’ results are recorded in the consolidated financial statements since the date of sale. The
difference between the sale price and the Company’s portion of the investment sold and associated recognition of the noncontrolling interests was
$22.0 million (net of taxes), which has been recorded in additional paid in capital in the consolidated balance sheets in accordance with ASC
810-10.
For a description of related party
transactions relating to this transaction, see Note 16, “Related Party Transactions”.
119
MACQUARIE INFRASTRUCTURE COMPANY LLC
NOTES TO CONSOLIDATED FINANCIAL STATEMENTS (Continued)
NOTES TO CONSOLIDATED FINANCIAL STATEMENTS (Continued)
6. Direct Financing Lease Transactions
The Company has entered into energy
service agreements containing provisions to lease equipment to customers. Under these agreements, title to the leased equipment will transfer to the
customer at the end of the lease terms, which range from 5 to 25 years. The lease agreements are accounted for as direct financing leases. The
components of the Company’s consolidated net investments in direct financing leases at December 31, 2010 and 2009 are as follows ($ in
thousands):
| December 31, 2010 |
December 31, 2009 |
|||||||||
|---|---|---|---|---|---|---|---|---|---|---|
Minimum lease
payments receivable |
$ | 65,816 | $ | 65,116 | ||||||
Less: unearned
financing lease income |
(26,282 | ) | (28,481 | ) | ||||||
Net investment in
direct financing leases |
$ | 39,534 | $ | 36,635 | ||||||
Equipment
lease: |
||||||||||
Current portion
|
$ | 3,871 | $ | 3,369 | ||||||
Long-term portion
|
35,663 | 33,266 | ||||||||
| $ | 39,534 | $ | 36,635 | |||||||
At December 31, 2010 and 2009, the
Company did not have a reserve for the allowance for credit losses for its direct financing lease receivables.
Unearned financing lease income is
recognized over the terms of the leases. Minimum lease payments to be received by the Company total approximately $65.8 million as follows ($ in
thousands):
2011 |
$ | 8,293 | ||||
2012 |
8,016 | |||||
2013 |
8,028 | |||||
2014 |
8,022 | |||||
2015 |
7,993 | |||||
Thereafter |
25,464 | |||||
Total |
$ | 65,816 |
7. Property, Equipment, Land and Leasehold
Improvements
Property, equipment, land and leasehold
improvements at December 31, 2010 and 2009 consist of the following ($ in thousands):
| December 31, 2010 |
December 31, 2009 |
|||||||||
|---|---|---|---|---|---|---|---|---|---|---|
Land
|
$ | 4,618 | $ | 4,618 | ||||||
Easements
|
5,624 | 5,624 | ||||||||
Buildings
|
24,796 | 24,789 | ||||||||
Leasehold and
land improvements |
320,170 | 312,881 | ||||||||
Machinery and
equipment |
337,595 | 330,226 | ||||||||
Furniture and
fixtures |
9,240 | 9,395 | ||||||||
Construction in
progress |
17,070 | 16,519 | ||||||||
Property held for
future use |
1,573 | 1,561 | ||||||||
| 720,686 | 705,613 | |||||||||
Less: accumulated
depreciation |
(157,235 | ) | (125,526 | ) | ||||||
Property,
equipment, land and leasehold improvements, net(1) |
$ | 563,451 | $ | 580,087 | ||||||
(1) |
Includes $136,000 and $1.3 million of capitalized interest for the years ended December 31, 2010 and 2009, respectively. |
120
MACQUARIE INFRASTRUCTURE COMPANY LLC
NOTES TO CONSOLIDATED FINANCIAL STATEMENTS (Continued)
NOTES TO CONSOLIDATED FINANCIAL STATEMENTS (Continued)
7. Property, Equipment, Land and Leasehold Improvements
(Continued)
During the first six months of 2009,
the Company recognized non-cash impairment charges of $7.5 million primarily relating to leasehold and land improvements; buildings; machinery and
equipment; and furniture and fixtures at Atlantic Aviation. These charges are recorded in depreciation expense in the consolidated statements of
operations. There were no impairment charges recorded during the year ended December 31, 2010, except for the loss on disposal of assets discussed in
Note 5, “Dispositions”.
8. Intangible Assets
Intangible assets at December 31, 2010
and 2009 consist of the following ($ in thousands):
| Weighted Average Life (Years) |
December 31, 2010 |
December 31, 2009 |
||||||||||||
|---|---|---|---|---|---|---|---|---|---|---|---|---|---|---|
Contractual
arrangements |
31.0 |
$ | 762,595 | $ | 774,309 | |||||||||
Non-compete
agreements |
2.5 |
9,515 | 9,515 | |||||||||||
Customer
relationships |
10.6 |
77,842 | 78,596 | |||||||||||
Leasehold
rights |
12.5 |
3,330 | 3,331 | |||||||||||
Trade names
|
Indefinite |
15,401 | 15,401 | |||||||||||
Technology
|
5.0 |
460 | 460 | |||||||||||
| 869,143 | 881,612 | |||||||||||||
Less:
accumulated amortization |
(163,281 | ) | (130,531 | ) | ||||||||||
Intangible
assets, net |
$ | 705,862 | $ | 751,081 | ||||||||||
As a result of a decline in the
performance of certain asset groups during the first six months of 2009, the Company evaluated such asset groups for impairment and determined that the
asset groups were impaired. The Company estimated the fair value of each of the impaired asset groups using the discounted cash flow model.
Accordingly, the Company recognized non-cash impairment charges of $23.3 million related to contractual arrangements at Atlantic Aviation during the
first six months of 2009. These charges are recorded in amortization of intangibles in the consolidated statement of operations. There were no
impairment charges recorded during the year ended December 31, 2010, except for the loss on disposal of assets discussed in Note 5,
“Dispositions”.
Amortization expense of intangible
assets for the years ended December 31, 2010, 2009 and 2008 totaled $34.9 million, $60.9 million and $61.9 million, respectively.
The estimated future amortization
expense for intangible assets to be recognized is as follow ($ in thousands):
2011 |
$ | 39,658 | ||||
2012 |
34,253 | |||||
2013 |
34,222 | |||||
2014 |
34,097 | |||||
2015 |
33,631 | |||||
Thereafter |
514,600 | |||||
Total |
$ | 690,461 |
121
MACQUARIE INFRASTRUCTURE COMPANY LLC
NOTES TO CONSOLIDATED FINANCIAL STATEMENTS (Continued)
NOTES TO CONSOLIDATED FINANCIAL STATEMENTS (Continued)
8. Intangible Assets (Continued)
The goodwill balance as of December 31,
2010 is comprised of the following ($ in thousands):
Goodwill
acquired in business combinations, net of disposals |
$ | 639,382 | ||||
Less:
accumulated impairment charges |
(123,200 | ) | ||||
Less: write
off of goodwill with disposal of assets |
(1,929 | ) | ||||
Balance at
December 31, 2010 |
$ | 514,253 |
The Company tests for goodwill
impairment at the reporting unit level on an annual basis and between annual tests if a triggering event indicates impairment. The decline in the
Company’s stock price, over the latter part of 2008 and the first half of 2009, has caused the book value of the Company to exceed its market
capitalization. The Company performed goodwill impairment tests during the first six months of 2009 and fourth quarter of 2008. The goodwill impairment
test is a two-step process, which requires management to make judgments in determining what assumptions to use in the test. The first step of the
process consists of estimating the fair value of each reporting unit based on a discounted cash flow model using cash flow forecasts and comparing
those estimated fair values with the carrying values, which includes the allocated goodwill. If the estimated fair value is less than the carrying
value, a second step is performed to compute the amount of the impairment by determining an implied fair value of goodwill. The determination of a
reporting unit’s “implied fair value” of goodwill requires the allocation of the estimated fair value of the reporting unit to the
assets and liabilities of the reporting unit. Any unallocated fair value represents the “implied fair value” of goodwill, which is compared
to its corresponding carrying value. If the corresponding carrying value is higher than the “implied fair value”, goodwill is written down to
reflect the impairment. Based on the testing performed, the Company recorded goodwill impairment charge of $71.2 million and $52.0 million at Atlantic
Aviation during the first six months of 2009 and the quarter ended December 31, 2008, respectively. The Company also performed its annual goodwill
impairment test in the fourth quarter of 2010 and 2009, and concluded that no further goodwill impairment was required, except for the loss on disposal
of assets discussed in Note 5, “Dispositions”.
9. Nonfinancial Assets Measured at Fair
Value
The following major categories of
nonfinancial assets at the impaired asset groups were written down to fair value during the first six months of 2009 at Atlantic
Aviation:
| As of, and for the Year Ended December 31, 2009 |
|||||||||||||||
|---|---|---|---|---|---|---|---|---|---|---|---|---|---|---|---|
| Description |
Carrying Value |
Fair Value Measurements Using Significant Unobservable Inputs (Level 3)(1) |
Total Losses |
||||||||||||
| ($ in Thousands) | |||||||||||||||
Property,
equipment, land and leasehold improvements, net(2) |
$ | 12,643 | $ | 5,122 | $ | (7,521 | ) | ||||||||
Intangible
assets(3) |
37,756 | 14,430 | (23,326 | ) | |||||||||||
Goodwill(4) |
448,543 | 377,343 | (71,200 | ) | |||||||||||
Total |
$ | 498,942 | $ | 396,895 | $ | (102,047 | ) | ||||||||
(1) |
At December 31, 2009, there were no nonfinancial assets measured at fair value using quoted prices in active markets for identical assets (“level 1”) or significant other observable inputs (“level 2”). |
(2) |
The non-cash impairment charge was recorded in depreciation expense in the consolidated statement of operations. |
122
MACQUARIE INFRASTRUCTURE COMPANY LLC
NOTES TO CONSOLIDATED FINANCIAL STATEMENTS (Continued)
NOTES TO CONSOLIDATED FINANCIAL STATEMENTS (Continued)
9. Nonfinancial Assets Measured at Fair Value
(Continued)
(3) |
The non-cash impairment charge was recorded in amortization of intangibles expense in the consolidated statement of operations. |
(4) |
The non-cash impairment charge was recorded in goodwill impairment in the consolidated statement of operations. |
The Company estimated the fair value of
each of the impaired asset groups using discounted cash flows. The significant unobservable inputs (“level 3”) used for all fair value
measurements in the above table included forecasted cash flows of Atlantic Aviation and its asset groups, the discount rate and, in the case of
goodwill, the terminal value. The forecasted cash flows for this business were developed using actual cash flows from 2009, forecasted jet fuel volumes
from the Federal Aviation Administration, forecasted consumer price indices and forecasted LIBOR rates based on proprietary models using various
published sources. The discount rate was developed using a capital asset pricing model.
Model inputs included:
• |
a risk free rate equal to the rate on 20 year U.S. treasury securities; |
• |
a risk premium based on the risk premium for the U.S. equity market overall; |
• |
the observed beta of comparable listed companies; |
• |
a small company risk premium based on historical data provided by Ibbotsons; and |
• |
a specific company risk premium based on the uncertainty in the market conditions. |
The terminal value was based on
observed earnings before interest, taxes, depreciation and amortization, or EBITDA, and multiples historically paid in transactions for comparable
businesses.
10. Accrued Expenses
Accrued expenses at December 31, 2010
and 2009 consist of the following ($ in thousands):
| December 31, 2010 |
December 31, 2009 |
|||||||||
|---|---|---|---|---|---|---|---|---|---|---|
Payroll and
related liabilities |
$ | 6,506 | $ | 6,030 | ||||||
Interest |
695 | 609 | ||||||||
Insurance |
1,446 | 1,770 | ||||||||
Real estate
taxes |
987 | 887 | ||||||||
Other |
9,681 | 8,136 | ||||||||
| $ | 19,315 | $ | 17,432 | |||||||
11. Long-Term Debt
The Company capitalizes its operating
businesses separately using non-recourse, project finance style debt. In addition, it had a credit facility at its subsidiary, MIC Inc., with various
financial institutions primarily to finance acquisitions and capital expenditures, which matured on March 31, 2010. The facility was repaid in full in
December 2009 and no amounts were outstanding under the revolving credit facility as of December 31, 2009 or at the facility’s maturity on March
31, 2010. The Company currently has no indebtedness at the holding company level.
All of the term debt facilities
described below contain customary financial covenants, including maintaining or exceeding certain financial ratios, and limitations on capital
expenditures and additional debt.
For a description of related party
transactions associated with the Company’s long-term debt, see Note 16, “Related Party Transactions”.
123
MACQUARIE INFRASTRUCTURE COMPANY LLC
NOTES TO CONSOLIDATED FINANCIAL STATEMENTS (Continued)
NOTES TO CONSOLIDATED FINANCIAL STATEMENTS (Continued)
11. Long-Term Debt (Continued)
At December 31, 2010 and 2009, the
Company’s consolidated long-term debt comprised the following ($ in thousands):
| December 31, 2010 |
December 31, 2009 |
|||||||||
|---|---|---|---|---|---|---|---|---|---|---|
The Gas Company
|
$ | 160,000 | $ | 179,000 | ||||||
District Energy
|
170,000 | 170,000 | ||||||||
Atlantic
Aviation |
808,884 | 863,279 | ||||||||
Total
|
1,138,884 | 1,212,279 | ||||||||
Less: current
portion |
(49,325 | ) | (45,900 | ) | ||||||
Long-term
portion |
$ | 1,089,559 | $ | 1,166,379 | ||||||
At December 31, 2010, future maturities
of long-term debt are as follows ($ in thousands):
2011 |
$ | 49,325 | ||||
2012 |
31,135 | |||||
2013 |
259,270 | |||||
2014 |
799,154 | |||||
2015 |
— | |||||
Total |
$ | 1,138,884 |
The Gas Company
The acquisition of The Gas Company in
June 2006 was partially financed with $160.0 million of term loans borrowed under the two amended and restated loan agreements. One of these loan
agreements provides for an $80.0 million term loan borrowed by HGC Holdings LLC, or HGC, the parent company of The Gas Company, LLC, or TGC. The other
loan agreement provides for an $80.0 million term loan borrowed by TGC and a $20.0 million revolving credit facility, including a $5.0 million letter
of credit facility. TGC generally intends to utilize the $20.0 million revolving credit facility to finance its working capital and to finance or
refinance its capital expenditures for regulated assets.
The obligations under the credit
agreements are secured by security interests in the assets of TGC as well as the equity interests of TGC and HGC. Material terms of the term and
revolving credit facilities are presented below:
| Facility Terms |
Holding Company Debt |
Operating Company Debt |
|||||||||||||
|---|---|---|---|---|---|---|---|---|---|---|---|---|---|---|---|
Borrowers |
HGC |
The Gas Company, LLC |
|||||||||||||
Facilities |
$80.0 million Term Loan (fully drawn at December 31, 2010 and 2009) |
$80.0 million Term Loan (fully drawn at December 31, 2010 and 2009) |
$20.0
million Revolver (no amount drawn at December 31, 2010 and $19.0 million drawn at December 31,2009) |
||||||||||||
Collateral |
First priority security interest on HGC’s assets and equity interests |
First priority security interest on The Gas Company’s assets and equity interests |
|||||||||||||
Maturity |
June, 2013 |
June, 2013 |
June,
2013 |
||||||||||||
124
MACQUARIE INFRASTRUCTURE COMPANY LLC
NOTES TO CONSOLIDATED FINANCIAL STATEMENTS (Continued)
NOTES TO CONSOLIDATED FINANCIAL STATEMENTS (Continued)
11. Long-Term Debt (Continued)
| Facility Terms |
Holding Company Debt |
Operating Company Debt |
|||||||||||||
|---|---|---|---|---|---|---|---|---|---|---|---|---|---|---|---|
Amortization |
Payable at maturity |
Payable at maturity |
Payable at maturity for utility capital expenditures |
||||||||||||
Interest Rate:
Years 1–5 |
LIBOR plus 0.60% |
LIBOR plus 0.40% |
LIBOR
plus 0.40% |
||||||||||||
Commitment
Fees: Years 1–5 |
— |
— |
0.14%
on undrawn portion |
||||||||||||
Interest Rate:
Years 6–7 |
LIBOR plus 0.70% |
LIBOR plus 0.50% |
LIBOR
plus 0.50% |
||||||||||||
Commitment
Fees: Years 6–7 |
— |
— |
0.18%
on undrawn portion |
||||||||||||
To hedge the interest commitments under
the new term loan, The Gas Company entered into interest rate swaps fixing 100% of the term loans at 4.8375% (excluding the margin).
In addition to customary terms and
conditions for secured term loan and revolving credit agreements, the agreements provide that The Gas Company:
• |
may not incur more than $7.5 million of new debt; and |
• |
may not sell or dispose of more than $10.0 million of assets per year. |
The facilities also require mandatory
repayment if the Company or another entity managed by the Macquarie Group fails to either own 75% of the respective borrowers or control the management
and policies of the respective borrowers.
As part of the regulatory approval
process of the Company’s acquisition of The Gas Company, the Company agreed to 14 regulatory conditions from The Hawaii Public Utilities
Commission that address a variety of matters. The more significant conditions include:
• |
the non-recoverability of goodwill, transaction or transition costs in future rate cases; |
• |
a requirement that The Gas Company and HGC’s ratio of consolidated debt to total capital does not exceed 65%; and, |
• |
a requirement to maintain $20.0 million in readily available cash resources at The Gas Company, HGC or the Company. |
This ratio was 58.0% and 63.2% at
December 31, 2010 and 2009, respectively, and $20.0 million in cash resources was readily available at December 31, 2010 and 2009.
The Gas Company also has an uncommitted
unsecured short-term borrowing facility of $7.5 million that was renewed during the second quarter of 2010. This credit line bears interest at the
lending bank’s quoted rate or prime rate. The facility is available for working capital needs. At December 31, 2010 and December 31, 2009, no
amounts were outstanding.
District Energy
District Energy has in place a term
loan facility, a capital expenditure loan facility and a revolving loan facility. Proceeds of $150.0 million, drawn under the term loan facility in
2007, were used to repay the previously existing debt outstanding, to pay a $14.7 million make-whole payment, and to pay accrued interest, fees and
transaction costs.
125
MACQUARIE INFRASTRUCTURE COMPANY LLC
NOTES TO CONSOLIDATED FINANCIAL STATEMENTS (Continued)
NOTES TO CONSOLIDATED FINANCIAL STATEMENTS (Continued)
11. Long-Term Debt (Continued)
Material terms of the facility are
presented below:
| Facility Terms |
||||||
|---|---|---|---|---|---|---|
Borrower |
Macquarie
District Energy LLC, or MDE |
|||||
Facilities |
• $150.0 million term loan facility (fully drawn at December 31, 2010 and 2009) |
|||||
• $20.0 million capital expenditure loan facility (fully drawn at December 31, 2010 and 2009) |
||||||
• $18.5 million revolving loan facility and letter of credit ($7.1 million utilized at December 31, 2010 and 2009 for letters
of credit) |
||||||
Amortization |
Payable at
maturity |
|||||
Interest Type |
Floating |
|||||
Interest rate and fees |
• Interest rate: |
|||||
• LIBOR plus 1.175% or |
||||||
• Base Rate (for capital expenditure loan and revolving loan facilities only): 0.5% above the greater of the prime rate or the
federal funds rate |
||||||
• Commitment fee: 0.35% on the undrawn portion. |
||||||
Maturity |
September, 2014
for the term loan and capital expenditure facilties; September, 2012 for the revolving loan facility |
|||||
Mandatory prepayment |
• With net proceeds that exceed $1.0 million from the sale of assets not used for replacement assets: |
|||||
• With insurance proceeds that exceed $1.0 million not used to repair, restore or replace assets; |
||||||
• In the event of a change of control; |
||||||
• In years 6 and 7, with 100% of excess cash flow applied to repay the term loan and capital expenditure loan
facilities; |
||||||
• With net proceeds from equity and certain debt issuances; and |
||||||
• With net proceeds that exceed $1.0 million in a fiscal year from contract terminations that are not
reinvested. |
||||||
Collateral |
First lien on the
following (with limited exceptions): |
|||||
• Project revenues; |
||||||
• Equity of the Borrower and its subsidiaries; |
||||||
• Substantially all assets of the business; and |
||||||
• Insurance policies and claims or proceeds. |
||||||
To hedge the interest commitments under
the term loan facility, District Energy entered into an interest rate swap fixing 100% of the term loan facility at 5.074% (excluding the
margin).
Atlantic Aviation
Atlantic Aviation has in place a term
loan facility, a capital expenditure facility and a revolving credit facility. On February 25, 2009, Atlantic Aviation amended its credit facility to
provide the business additional financial flexibility over the near and medium term. Additionally, under the amended terms, the business will apply all
excess cash flow from the business to prepay additional debt whenever the leverage ratio (debt to EBITDA as defined under the loan agreement) is equal
to or greater than 6.0x to 1.0 for the trailing twelve
126
MACQUARIE INFRASTRUCTURE COMPANY LLC
NOTES TO CONSOLIDATED FINANCIAL STATEMENTS (Continued)
NOTES TO CONSOLIDATED FINANCIAL STATEMENTS (Continued)
11. Long-Term Debt (Continued)
months and will use 50% of excess cash flow to prepay debt whenever the leverage ratio is equal to or greater than 5.5x to 1.0 and below 6.0x to 1.0.
During the first quarter of 2009, the
Company provided the business with a capital contribution of $50.0 million. The business paid down $44.6 million of debt and used the remainder of the
capital contribution to pay interest rate swap breakage fees and debt amendment costs. In addition, during 2009 the business used $40.6 million of its
excess cash flow to prepay $37.0 million of the outstanding principal balance of the term loan and $3.6 million in interest rate swap breakage fees.
During 2010, the business used $60.5 million of its excess cash flow to prepay $55.0 million of the outstanding principal balance of the term loan and
$5.5 million in interest rate swap breakage fees. The Company has classified $49.3 million relating to Atlantic Aviation’s debt in current portion
of long-term debt in the consolidated 2010 balance sheet as it expects to repay this amount during 2011.
In February 2011, Atlantic Aviation
used $15.6 million of excess cash flow to prepay $14.5 million of the outstanding principal balance of the term loan debt under this facility and
incurred $1.1 million in interest rate swap breakage fees.
The key terms of the loan agreement of
Atlantic Aviation, as revised on February 25, 2009, are presented below:
| Facility Terms |
||||||
|---|---|---|---|---|---|---|
Borrower |
Atlantic
Aviation |
|||||
Facilities |
• $900.0 million term loan facility (outstanding balance of $763.3 million and $818.4 million at December 31, 2010 and 2009,
respectively) |
|||||
• $50.0 million capital expenditure facility ($45.4 million and $44.9 million drawn at December 31, 2010 and 2009,
respectively) |
||||||
• $18.0 million revolving working capital and letter of credit facility ($11.7 million and $6.5 million utilized to back
letter of credit at December 31, 2010 and 2009, respectively) |
||||||
Amortization |
• Payable at maturity |
|||||
• Years 1 to 5: |
||||||
• 100% excess cash flow when Leverage Ratio is 6.0x or above |
||||||
• 50% excess cash flow when Leverage Ratio is between 6.0x and 5.5x |
||||||
• 100% of excess cash flow in years 6 and 7 |
||||||
Interest type |
Floating |
|||||
Interest rate and fees |
• Years 1–5: |
|||||
• LIBOR plus 1.6% or |
||||||
• Base Rate (for revolving credit facility only): 0.6% above the greater of: (i) the prime rate or (ii) the federal funds rate
plus 0.5% |
||||||
• Years 6–7: |
||||||
• LIBOR plus 1.725% or |
||||||
• Base Rate (for revolving credit facility only): 0.725% above the greater of: (i) the prime rate or (ii) the federal funds
rate plus 0.5% |
||||||
Maturity |
October,
2014 |
|||||
127
MACQUARIE INFRASTRUCTURE COMPANY LLC
NOTES TO CONSOLIDATED FINANCIAL STATEMENTS (Continued)
NOTES TO CONSOLIDATED FINANCIAL STATEMENTS (Continued)
11. Long-Term Debt (Continued)
| Facility Terms | ||||||
|---|---|---|---|---|---|---|
Mandatory prepayment |
• With net proceeds that exceed $1.0 million from the sale of assets not used for replacement assets; |
|||||
• With net proceeds of any debt other than permitted debt; |
||||||
• With net insurance proceeds that exceed $1.0 million not used to repair, restore or replace assets; |
||||||
• In the event of a change of control; |
||||||
• Additional mandatory prepayment based on leverage grid |
||||||
• With any FBO lease termination payments received; |
||||||
• With excess cash flows in years 6 and 7. |
||||||
Collateral |
First lien on the
following (with limited exceptions): |
|||||
• Project revenues; |
||||||
• Equity of the borrower and its subsidiaries; and |
||||||
• Insurance policies and claims or proceeds. |
||||||
To hedge the interest risk associated
with commitments under Atlantic Aviation’s term loan, Atlantic Aviation entered into a number of interest rate swaps with various maturity dates
to hedge 100% of the term loan through October 16, 2012. As of December 31, 2010, Atlantic has only one remaining swap hedging 100% of the outstanding
balance of the term loan, with a hedge rate of 5.19%.
In addition to the debt facilities
described above, Atlantic Aviation raised a $3.5 million stand-alone debt facility to partially fund the construction of a new FBO at Oklahoma City
Will Rogers Airport. At December 31, 2010, the outstanding balance on the stand-alone facility was $141,000.
12. Derivative Instruments and Hedging
Activities
The Company has interest rate-related
derivative instruments to manage its interest rate exposure on its debt instruments. The Company does not enter into derivative instruments for any
purpose other than economic interest rate hedging. That is, the Company does not speculate using derivative instruments.
By using derivative financial
instruments to hedge exposures to changes in interest rates, the Company exposes itself to credit risk and market risk. Credit risk is the failure of
the counterparty to perform under the terms of the derivative contract. When the fair value of a derivative contract is positive, the counterparty owes
the Company, which creates credit risk for the Company. When the fair value of a derivative contract is negative, the Company owes the counterparty
and, therefore, it does not possess credit risk. The Company minimizes the credit risk in derivative instruments by entering into transactions with
high-quality counterparties.
Market risk is the adverse effect on
the value of a financial instrument that results from a change in interest rates. The market risk associated with interest rates is managed by
establishing and monitoring parameters that limit the types and degree of market risk that may be undertaken.
Debt Obligations
The Company and its businesses have in
place variable-rate debt. Management believes that it is prudent to limit the variability of a portion of the business’ interest payments. To meet
this objective, the Company enters into interest rate swap agreements to manage fluctuations in cash flows resulting from interest rate risk on a
majority of its debt with a variable-rate component. These swaps change the variable-rate cash flow exposure on the debt obligations to fixed cash
flows. Under the terms of the interest rate swaps, the Company receives variable interest rate payments and makes fixed interest rate payments, thereby
creating the equivalent of fixed-rate debt for the portion of the debt that is swapped.
128
MACQUARIE INFRASTRUCTURE COMPANY LLC
NOTES TO CONSOLIDATED FINANCIAL STATEMENTS (Continued)
NOTES TO CONSOLIDATED FINANCIAL STATEMENTS (Continued)
12. Derivative Instruments and Hedging Activities
(Continued)
At December 31, 2010, the Company had
$1.1 billion of current and long-term debt, $1.1 billion of which was economically hedged with interest rate swaps and $65.5 million of which was
unhedged. At December 31, 2009, the Company had $1.2 billion of current and long-term debt, $1.1 billion of which was economically hedged with interest
rate swaps and $83.9 million of which was unhedged.
As discussed in Note 11,
“Long-Term Debt”, Atlantic Aviation applies its excess cash flow to prepay debt. As a result, $1.5 million of accumulated other comprehensive
loss in the consolidated balance sheet related to Atlantic Aviation’s derivatives was reclassified to interest expense in the consolidated
statement of operations for the year ended December 31, 2010. Atlantic Aviation will record additional reclassifications from accumulated other
comprehensive loss to interest expense as the business continues to pay down its debt more quickly than anticipated.
In March 2009, Atlantic Aviation, The
Gas Company and District Energy entered into interest rate basis swap contracts that expired on March 31, 2010. These contracts effectively changed the
interest rate index on each business’ existing swap contracts from the 90-day LIBOR rate to the 30-day LIBOR rate plus a margin of 19.50 basis
points for Atlantic Aviation and 24.75 basis points for The Gas Company and District Energy. This transaction, adjusted for the prepayments of
outstanding principal on the term loan debt at Atlantic Aviation, resulted in $580,000 and $1.8 million lower interest expense for these businesses for
the quarter ended March 31, 2010 and the year ended December 31, 2009, respectively.
Effective February 25, 2009 for
Atlantic Aviation and effective April 1, 2009 for the Company’s other businesses, the Company elected to discontinue hedge accounting. In prior
periods, when the Company applied hedge accounting, changes in the fair value of derivatives that effectively offset the variability of cash flows on
the Company’s debt interest obligations were recorded in other comprehensive income or loss. From the dates that hedge accounting was
discontinued, all movements in the fair value of the interest rate swaps are recorded directly through earnings. As interest payments are made, a
portion of the other comprehensive loss recorded under hedge accounting is also reclassified into earnings. The Company will reclassify into earnings
$44.1 million of net derivative losses, included in accumulated other comprehensive loss as of December 31, 2010 over the remaining life of the
existing interest rate swaps, of which approximately $20.2 million will be reclassified over the next 12 months.
The Company measures derivative
instruments at fair value using the income approach which discounts the future net cash settlements expected under the derivative contracts to a
present value. These valuations utilize primarily observable (“level 2”) inputs, including contractual terms, interest rates and yield curves
observable at commonly quoted intervals.
The Company’s fair value
measurements of its derivative instruments and the related location of the liabilities associated with the hedging instruments within the consolidated
balance sheets at December 31, 2010 and December 31, 2009 were as follows:
| Liabilities at Fair Value(1) |
|||||||||||
|---|---|---|---|---|---|---|---|---|---|---|---|
| Interest Rate Swap Contracts Not Designated as Hedging Instruments |
|||||||||||
| Balance Sheet Location |
December 31, 2010 |
December 31, 2009 |
|||||||||
| ($ in Thousands) |
|||||||||||
Fair value of
derivative instruments – current liabilities |
$ | (43,496 | ) | $ | (49,573 | ) | |||||
Fair value of
derivative instruments – non-current liabilities |
(51,729 | ) | (54,794 | ) | |||||||
Total interest
rate derivative contracts |
$ | (95,225 | ) | $ | (104,367 | ) | |||||
(1) |
Fair value measurements at reporting date were made using significant other observable inputs (“level 2”). |
129
MACQUARIE INFRASTRUCTURE COMPANY LLC
NOTES TO CONSOLIDATED FINANCIAL STATEMENTS (Continued)
NOTES TO CONSOLIDATED FINANCIAL STATEMENTS (Continued)
12. Derivative Instruments and Hedging Activities
(Continued)
The Company’s hedging activities
for the years ended December 31, 2010 and 2009 and the related location within the consolidated financial statements were as follows:
| Derivatives Designated as Hedging Instruments(1) |
Derivatives Not Designated as Hedging Instruments(1) |
||||||||||||||||||||||||||||||||||
|---|---|---|---|---|---|---|---|---|---|---|---|---|---|---|---|---|---|---|---|---|---|---|---|---|---|---|---|---|---|---|---|---|---|---|---|
| Amount of Gain Recognized in OCI on Derivatives (Effective Portion) for the Year Ended December 31, |
Amount of Loss Reclassified from OCI into Income (Effective Portion) for the Year Ended December 31, |
Amount of Loss Recognized in Loss on Derivative Instruments (Ineffective Portion) for the Year Ended December 31, |
Amount of Loss Recognized in Interest Expense for the Year Ended December 31, |
||||||||||||||||||||||||||||||||
| Financial Statement Account |
2010 |
2009 |
2010 |
2009(2) |
2010 |
2009 |
2010(3) |
2009(4) |
|||||||||||||||||||||||||||
($ in
Thousands) |
|||||||||||||||||||||||||||||||||||
Interest
expense |
$ | — | $ | — | $ | — | $ | (15,691 | ) | $ | — | $ | — | $ | (85,387 | ) | $ | (48,239 | ) | ||||||||||||||||
Loss on
derivative instruments |
— | — | — | (25,154 | ) | — | (84 | ) | — | — | |||||||||||||||||||||||||
Accumulated
other comprehensive loss |
— | 2,848 | — | — | — | — | — | — | |||||||||||||||||||||||||||
Total
|
$ | — | $ | 2,848 | $ | — | $ | (40,845 | ) | $ | — | $ | (84 | ) | $ | (85,387 | ) | $ | (48,239 | ) | |||||||||||||||
(1) |
All derivatives are interest rate swap contracts. |
(2) |
Includes $22.7 million of accumulated other comprehensive losses reclassified into earnings (loss on derivative instruments) resulting from the $44.6 million repayment of debt principal at Atlantic Aviation in the first quarter of 2009. Interest expense represents cash interest paid on derivative instruments, of which $5.2 million is related to the payment of interest rate swap breakage fees in the first quarter of 2009. |
(3) |
Loss recognized in interest expense for the year ended December 31, 2010 includes $56.5 million in interest rate swap payments and $28.9 million in unrealized derivative losses arising from: |
• |
the change in fair value of interest rate swaps from the discontinuation of hedge accounting; |
• |
interest rate swap break fees related to the pay down of debt at Atlantic Aviation; and |
• |
the reclassification of amounts from accumulated other comprehensive loss into earnings, as Atlantic Aviation pays down its debt more quickly than anticipated. |
(4) |
Loss recognized in interest expense for the year ended December 31, 2009 includes $40.3 million in interest rate swap payments and $7.9 million in unrealized derivative losses. |
All of the Company’s derivative
instruments are collateralized by all of the assets of the respective businesses.
13. Notes Payable and Capital Leases
The Company has existing notes payable
with various finance companies for the purchase of equipment. The notes are secured by the equipment and require monthly payments of principal and
interest. The Company also leases certain equipment under capital leases. The following is a summary of the maturities of the notes payable and the
future minimum lease payments under capital leases, together with the present value of the minimum lease payments, as of December 31, 2010 ($ in
thousands):
130
MACQUARIE INFRASTRUCTURE COMPANY LLC
NOTES TO CONSOLIDATED FINANCIAL STATEMENTS (Continued)
NOTES TO CONSOLIDATED FINANCIAL STATEMENTS (Continued)
13. Notes Payable and Capital Leases
(Continued)
| Notes Payable |
Capital Leases |
|||||||||
|---|---|---|---|---|---|---|---|---|---|---|
2011
|
$ | 990 | $ | 85 | ||||||
2012
|
93 | 36 | ||||||||
2013
|
93 | 14 | ||||||||
2014
|
93 | 7 | ||||||||
2015
|
78 | 6 | ||||||||
Thereafter
|
— | — | ||||||||
Present value
of minimum payments |
1,347 | 148 | ||||||||
Less: current
portion |
(990 | ) | (85 | ) | ||||||
Long-term
portion |
$ | 357 | $ | 63 | ||||||
The net book value of equipment under
capital leases at December 31, 2010 and 2009 was $238,000 and $291,000, respectively.
14. Members’ Equity
The Company is authorized to issue
500,000,000 LLC interests. Each outstanding LLC interest of the Company is entitled to one vote on any matter with respect to which holders of LLC
interests are entitled to vote.
Independent Director Equity Plan
The Company has an independent director
equity plan, which provides for automatic, non-discretionary awards of director stock units as an additional fee for the independent directors’
services on the Board. The purpose of this plan is to promote the long-term growth and financial success of the Company by attracting, motivating and
retaining independent directors of outstanding ability. Only the Company’s independent directors may participate in the plan.
On the date of each annual meeting,
each director receives a grant of stock units equal to $150,000 divided by the average closing sale price of the stock during the 10-day period
immediately preceding the annual meeting of the Company’s stockholders. The stock units vest, assuming continued service by the director, on the
date immediately preceding the next annual meeting of the Company’s stockholders.
The Company has issued the following
stock to the Board of Directors under this plan:
| Date of Grant |
Stock Units Granted |
Price of Stock Units Granted |
Date of Vesting |
|||||||||||
|---|---|---|---|---|---|---|---|---|---|---|---|---|---|---|
December 21,
2004 |
7,644(1 | ) | $ | 25.00 | May 24, 2005 | |||||||||
May 25,
2005 |
15,873 | $ | 28.35 | May 25, 2006 | ||||||||||
May 25,
2006 |
16,869 | $ | 26.68 | May 23, 2007 | ||||||||||
May 24,
2007 |
10,314 | $ | 43.63 | May 26, 2008 | ||||||||||
May 27,
2008 |
14,115 | $ | 31.88 | June 3, 2009 | ||||||||||
June 4,
2009 |
128,205 | $ | 3.51 | June 2, 2010 | ||||||||||
June 3,
2010 |
31,989 | $ | 14.07 | (2) |
||||||||||
(1) |
Pro rata basis relating to the period from the closing of the initial public offering through the anticipated date of the Company’s first annual meeting of stockholders. |
(2) |
Date of vesting will be the day immediately preceding the 2011 annual meeting of the Company’s LLC interest holders. |
131
MACQUARIE INFRASTRUCTURE COMPANY LLC
NOTES TO CONSOLIDATED FINANCIAL STATEMENTS (Continued)
NOTES TO CONSOLIDATED FINANCIAL STATEMENTS (Continued)
15. Reportable Segments
The Company’s operations are
broadly classified into the energy-related businesses and an aviation-related business, Atlantic Aviation. The energy-related businesses consist of two
reportable segments: The Gas Company and District Energy. The energy-related businesses also include a 50% investment in IMTT, which is accounted for
under the equity method. Financial information for IMTT’s business as a whole is presented below ($ in thousands):
| As of, and for the Year Ended, December 31, |
|||||||||||||||
|---|---|---|---|---|---|---|---|---|---|---|---|---|---|---|---|
| 2010 |
2009 |
2008 |
|||||||||||||
Revenue
|
$ | 557,184 | $ | 346,175 | $ | 352,583 | |||||||||
Net income
|
$ | 72,064 | $ | 54,584 | $ | 12,109 | |||||||||
Interest
expense, net |
50,335 | 2,130 | 23,540 | ||||||||||||
Provision of
income taxes |
53,521 | 38,842 | 9,452 | ||||||||||||
Depreciation
and amortization |
61,277 | 55,998 | 44,615 | ||||||||||||
Unrealized
(gains) losses on derivative instruments |
— | (3,306 | ) | 46,277 | |||||||||||
Other
non-cash (income) expenses |
(361 | ) | (590 | ) | 601 | ||||||||||
EBITDA
excluding non-cash items(1) |
$ | 236,836 | $ | 147,658 | $ | 136,594 | |||||||||
Capital
expenditures paid |
$ | 107,832 | $ | 137,008 | $ | 221,700 | |||||||||
Property,
equipment, land and leasehold improvements, net |
1,041,339 | 987,075 | 912,887 | ||||||||||||
Total assets
balance |
1,221,862 | 1,064,849 | 1,006,289 | ||||||||||||
(1) |
EBITDA consists of earnings before interest, taxes, depreciation and amortization. Non-cash items that are excluded consist of impairments, derivative gains and losses and all other non-cash income and expense items. |
All of the business segments are
managed separately and management has chosen to organize the Company around the distinct products and services offered.
Energy-Related Businesses
IMTT provides bulk liquid storage and
handling services in North America through ten terminals located on the East, West and Gulf Coasts, the Great Lakes region of the United States and
partially owned terminals in Quebec and Newfoundland, Canada. IMTT derives the majority of its revenue from storage and handling of petroleum products,
various chemicals, renewable fuels, and vegetable and animal oils. Based on storage capacity, IMTT operates one of the largest third-party bulk liquid
storage terminal businesses in the United States.
The revenue from The Gas Company
segment is included in revenue from product sales. Revenue is generated from the distribution and sales of synthetic natural gas, or SNG, and liquefied
petroleum gas, or LPG. Revenue is primarily a function of the volume of SNG and LPG consumed by customers and the price per thermal unit or gallon
charged to customers. Because both SNG and LPG are derived from petroleum, revenue levels, without organic growth, will generally track global oil
prices. The utility revenue of The Gas Company reflects fuel adjustment charges, or FACs, through which changes in fuel costs are passed through to
customers.
The revenue from the District Energy
segment is included in service revenue and financing and equipment lease income. Included in service revenue is capacity revenue, which relates to
monthly fixed contract charges, and consumption revenue, which relates to contractual rates applied to actual usage. Financing and equipment lease
income relates to direct financing lease transactions and equipment leases to the business’ various customers. Finance lease revenue, recorded on
the consolidated statement of operations,
132
MACQUARIE INFRASTRUCTURE COMPANY LLC
NOTES TO CONSOLIDATED FINANCIAL STATEMENTS (Continued)
NOTES TO CONSOLIDATED FINANCIAL STATEMENTS (Continued)
15. Reportable Segments (Continued)
is comprised of the interest portion of lease payments received from equipment leases with various customers. The principal cash receipts on these equipment leases are recorded in the operating activities of the consolidated cash flow statement. District Energy provides its services to buildings primarily in the downtown Chicago, Illinois area and to a casino and a shopping mall located in Las Vegas, Nevada.
Atlantic Aviation
The Atlantic Aviation segment derives
the majority of its revenues from fuel sales and from other airport services, including de-icing, aircraft hangarage and other aviation services. All
of the revenue of Atlantic Aviation is generated in the United States at 66 airports and one heliport.
Selected information by segment is
presented in the following tables. The tables do not include financial data for the Company’s equity investment in IMTT.
Revenue from external customers for the
Company’s consolidated reportable segments was as follows ($ in thousands):
| Year Ended December 31, 2010 |
|||||||||||||||||||
|---|---|---|---|---|---|---|---|---|---|---|---|---|---|---|---|---|---|---|---|
| Energy-related Businesses |
|||||||||||||||||||
| The Gas Company |
District Energy |
Atlantic Aviation |
Total Reportable Segments |
||||||||||||||||
Revenue
from Product Sales |
|||||||||||||||||||
Product sales
|
$ | 96,855 | $ | — | $ | 417,489 | $ | 514,344 | |||||||||||
Product sales
– utility |
113,752 | — | — | 113,752 | |||||||||||||||
| 210,607 | — | 417,489 | 628,096 | ||||||||||||||||
Service
Revenue |
|||||||||||||||||||
Other
services |
— | 3,371 | 155,933 | 159,304 | |||||||||||||||
Cooling
capacity revenue |
— | 21,162 | — | 21,162 | |||||||||||||||
Cooling
consumption revenue |
— | 24,386 | — | 24,386 | |||||||||||||||
| — | 48,919 | 155,933 | 204,852 | ||||||||||||||||
Financing
and Lease Income |
|||||||||||||||||||
Financing and
equipment lease |
— | 7,843 | — | 7,843 | |||||||||||||||
| — | 7,843 | — | 7,843 | ||||||||||||||||
Total
Revenue |
$ | 210,607 | $ | 56,762 | $ | 573,422 | $ | 840,791 | |||||||||||
| Year Ended December 31, 2009 |
|||||||||||||||||||
|---|---|---|---|---|---|---|---|---|---|---|---|---|---|---|---|---|---|---|---|
| Energy-related Businesses |
|||||||||||||||||||
| The Gas Company |
District Energy |
Atlantic Aviation |
Total Reportable Segments |
||||||||||||||||
Revenue
from Product Sales |
|||||||||||||||||||
Product sales
|
$ | 79,597 | $ | — | $ | 314,603 | $ | 394,200 | |||||||||||
Product sales
– utility |
95,769 | — | — | 95,769 | |||||||||||||||
| 175,366 | — | 314,603 | 489,969 | ||||||||||||||||
Service
Revenue |
|||||||||||||||||||
Other
services |
— | 3,137 | 171,546 | 174,683 | |||||||||||||||
Cooling
capacity revenue |
— | 20,430 | — | 20,430 | |||||||||||||||
Cooling
consumption revenue |
— | 20,236 | — | 20,236 | |||||||||||||||
| — | 43,803 | 171,546 | 215,349 | ||||||||||||||||
Financing
and Lease Income |
|||||||||||||||||||
Financing and
equipment lease |
— | 4,758 | — | 4,758 | |||||||||||||||
| — | 4,758 | — | 4,758 | ||||||||||||||||
Total
Revenue |
$ | 175,366 | $ | 48,561 | $ | 486,149 | $ | 710,076 | |||||||||||
133
MACQUARIE INFRASTRUCTURE COMPANY LLC
NOTES TO CONSOLIDATED FINANCIAL STATEMENTS (Continued)
NOTES TO CONSOLIDATED FINANCIAL STATEMENTS (Continued)
15. Reportable Segments (Continued)
| Year Ended December 31, 2008 |
|||||||||||||||||||
|---|---|---|---|---|---|---|---|---|---|---|---|---|---|---|---|---|---|---|---|
| Energy-related Businesses |
|||||||||||||||||||
| The Gas Company |
District Energy |
Atlantic Aviation |
Total Reportable Segments |
||||||||||||||||
Revenue
from Product Sales |
|||||||||||||||||||
Product sales
|
$ | 91,244 | $ | — | $ | 494,810 | $ | 586,054 | |||||||||||
Product sales
– utility |
121,770 | — | — | 121,770 | |||||||||||||||
| 213,014 | — | 494,810 | 707,824 | ||||||||||||||||
Service
Revenue |
|||||||||||||||||||
Other
services |
— | 3,115 | 221,492 | 224,607 | |||||||||||||||
Cooling
capacity revenue |
— | 19,350 | — | 19,350 | |||||||||||||||
Cooling
consumption revenue |
— | 20,894 | — | 20,894 | |||||||||||||||
| — | 43,359 | 221,492 | 264,851 | ||||||||||||||||
Financing
and Lease Income |
|||||||||||||||||||
Financing and
equipment lease |
— | 4,686 | — | 4,686 | |||||||||||||||
| — | 4,686 | — | 4,686 | ||||||||||||||||
Total
Revenue |
$ | 213,014 | $ | 48,045 | $ | 716,302 | $ | 977,361 | |||||||||||
In accordance with FASB ASC 280
Segment Reporting , the Company has disclosed earnings before interest, taxes, depreciation and amortization (EBITDA) excluding non-cash items
as a key performance metric relied on by management in the evaluation of the Company’s performance. Non-cash items include impairments, derivative
gains and losses and adjustments for other non-cash items reflected in the statements of operations. The Company believes EBITDA excluding non-cash
items provides additional insight into the performance of the operating businesses relative to each other and similar businesses without regard to
their capital structure, and their ability to service or reduce debt, fund capital expenditures and/or support distributions to the holding company.
EBITDA excluding non-cash items is reconciled to net income or loss.
EBITDA excluding non-cash items for the
Company’s consolidated reportable segments is shown in the tables below ($ in thousands). Allocation of corporate expense and the federal tax
effect have been excluded as they are eliminated on consolidation.
| Year Ended December 31, 2010 |
|||||||||||||||||||
|---|---|---|---|---|---|---|---|---|---|---|---|---|---|---|---|---|---|---|---|
| Energy-related Businesses |
|||||||||||||||||||
| The Gas Company |
District Energy |
Atlantic Aviation |
Total Reportable Segments |
||||||||||||||||
Net income
(loss) |
$ | 11,498 | $ | (2,822 | ) | $ | (18,294 | ) | $ | (9,618 | ) | ||||||||
Interest
expense, net |
16,505 | 20,671 | 69,409 | 106,585 | |||||||||||||||
Provision
(benefit) for income taxes |
7,400 | (1,844 | ) | (9,497 | ) | (3,941 | ) | ||||||||||||
Depreciation
|
5,826 | 6,555 | 23,895 | 36,276 | |||||||||||||||
Amortization
of intangibles |
823 | 1,368 | 32,707 | 34,898 | |||||||||||||||
Loss on
disposal of assets(1) |
— | — | 17,869 | 17,869 | |||||||||||||||
Other
non-cash expense (income) |
2,384 | (1,082 | ) | 1,388 | 2,690 | ||||||||||||||
EBITDA
excluding non-cash items |
$ | 44,436 | $ | 22,846 | $ | 117,477 | $ | 184,759 | |||||||||||
(1) |
Loss on disposal includes write-offs of intangible assets of $10.4 million, property, equipment, land and leasehold improvements of $5.6 million and goodwill of $1.9 million at Atlantic Aviation. |
134
MACQUARIE INFRASTRUCTURE COMPANY LLC
NOTES TO CONSOLIDATED FINANCIAL STATEMENTS (Continued)
NOTES TO CONSOLIDATED FINANCIAL STATEMENTS (Continued)
15. Reportable Segments (Continued)
| Year Ended December 31, 2009(1) |
|||||||||||||||||||
|---|---|---|---|---|---|---|---|---|---|---|---|---|---|---|---|---|---|---|---|
| Energy-related Businesses |
|||||||||||||||||||
| The Gas Company |
District Energy |
Atlantic Aviation(2) |
Total Reportable Segments |
||||||||||||||||
Net income
(loss) |
$ | 11,836 | $ | 1,182 | $ | (90,377 | ) | $ | (77,359 | ) | |||||||||
Interest
expense, net |
9,250 | 8,995 | 72,929 | 91,174 | |||||||||||||||
Provision
(benefit) for income taxes |
7,619 | 773 | (61,009 | ) | (52,617 | ) | |||||||||||||
Depreciation
|
5,991 | 6,086 | 30,822 | 42,899 | |||||||||||||||
Amortization
of intangibles |
838 | 1,368 | 58,686 | 60,892 | |||||||||||||||
Goodwill
impairment |
— | — | 71,200 | 71,200 | |||||||||||||||
Loss on
derivative instruments |
327 | 1,378 | 23,331 | 25,036 | |||||||||||||||
Other
non-cash expense |
1,771 | 1,009 | 903 | 3,683 | |||||||||||||||
EBITDA
excluding non-cash items |
$ | 37,632 | $ | 20,791 | $ | 106,485 | $ | 164,908 | |||||||||||
(1) |
Reclassified to conform to current period presentation. |
(2) |
Includes non-cash impairment charges of $102.0 million recorded during the first six months of 2009, consisting of $71.2 million related to goodwill, $23.3 million related to intangible assets (in amortization of intangibles) and $7.5 million related to property, equipment, land and leasehold improvements (in depreciation). |
| Year Ended December 31, 2008 |
|||||||||||||||||||
|---|---|---|---|---|---|---|---|---|---|---|---|---|---|---|---|---|---|---|---|
| Energy-related Businesses |
|||||||||||||||||||
| The Gas Company |
District Energy |
Atlantic Aviation(1) |
Total Reportable Segments |
||||||||||||||||
Net income
(loss) |
$ | 6,283 | $ | 691 | $ | (44,348 | ) | $ | (37,374 | ) | |||||||||
Interest
expense, net |
9,390 | 10,341 | 62,967 | 82,698 | |||||||||||||||
Provision
(benefit) for income taxes |
4,044 | 242 | (29,936 | ) | (25,650 | ) | |||||||||||||
Depreciation
|
5,883 | 5,813 | 34,257 | 45,953 | |||||||||||||||
Amortization
of intangibles |
856 | 1,372 | 59,646 | 61,874 | |||||||||||||||
Goodwill
impairment |
— | — | 52,000 | 52,000 | |||||||||||||||
Loss (gain)
on derivative instruments |
221 | (26 | ) | 1,871 | 2,066 | ||||||||||||||
Other
non-cash expense |
1,180 | 2,654 | 624 | 4,458 | |||||||||||||||
EBITDA
excluding non-cash items |
$ | 27,857 | $ | 21,087 | $ | 137,081 | $ | 186,025 | |||||||||||
(1) |
Includes non-cash impairment charges of $87.5 million recorded during the fourth quarter of 2008, consisting of $52.0 million related to goodwill, $21.7 million related to intangible assets (in amortization of intangibles) and $13.8 million related to property, equipment, land and leasehold improvements (in depreciation). |
135
MACQUARIE INFRASTRUCTURE COMPANY LLC
NOTES TO CONSOLIDATED FINANCIAL STATEMENTS (Continued)
NOTES TO CONSOLIDATED FINANCIAL STATEMENTS (Continued)
15. Reportable Segments (Continued)
Reconciliations of consolidated
reportable segments’ EBITDA excluding non-cash items to consolidated net income (loss) from continuing operations before income taxes are as
follows ($ in thousands):
| Year Ended December 31, |
|||||||||||||||
|---|---|---|---|---|---|---|---|---|---|---|---|---|---|---|---|
| 2010 |
2009 |
2008 |
|||||||||||||
Total
reportable segments EBITDA excluding non-cash items |
$ | 184,759 | $ | 164,908 | $ | 186,025 | |||||||||
Interest
income |
29 | 119 | 1,090 | ||||||||||||
Interest
expense |
(106,834 | ) | (95,456 | ) | (88,652 | ) | |||||||||
Depreciation(1) |
(36,276 | ) | (42,899 | ) | (45,953 | ) | |||||||||
Amortization
of intangibles(2) |
(34,898 | ) | (60,892 | ) | (61,874 | ) | |||||||||
Selling,
general and administrative—corporate |
(7,360 | ) | (9,707 | ) | (4,205 | ) | |||||||||
Fees to
manager |
(10,051 | ) | (4,846 | ) | (12,568 | ) | |||||||||
Equity in
earnings and amortization charges of investees |
31,301 | 22,561 | 1,324 | ||||||||||||
Goodwill
impairment |
— | (71,200 | ) | (52,000 | ) | ||||||||||
Loss on
disposal of assets(3) |
(17,869 | ) | — | — | |||||||||||
Loss on
derivative instruments |
— | (25,238 | ) | (2,843 | ) | ||||||||||
Other
expense, net |
(1,492 | ) | (1,852 | ) | (4,001 | ) | |||||||||
Total
consolidated net income (loss) from continuing operations before income taxes |
$ | 1,309 | $ | (124,502 | ) | $ | (83,657 | ) | |||||||
(1) |
Depreciation includes depreciation expense for District Energy, which is reported in cost of services in the consolidated statement of operations. Depreciation also includes non-cash impairment charges of $7.5 million and $13.8 million recorded by Atlantic Aviation during the first six months of 2009 and the fourth quarter of 2008, respectively. |
(2) |
Amortization expense includes non-cash impairment charges of $23.3 million and $21.7 million for contractual arrangements recorded by Atlantic Aviation during the first six months of 2009 and the fourth quarter of 2008, respectively. |
(3) |
Loss on disposal includes write-offs of intangible assets of $10.4 million, property, equipment, land and leasehold improvements of $5.6 million and goodwill of $1.9 million at Atlantic Aviation. |
Capital expenditures for the
Company’s reportable segments were as follows ($ in thousands):
| Year Ended December 31, |
|||||||||||||||
|---|---|---|---|---|---|---|---|---|---|---|---|---|---|---|---|
| 2010 |
2009 |
2008 |
|||||||||||||
The Gas
Company |
$ | 10,755 | $ | 7,388 | $ | 9,720 | |||||||||
District
Energy |
1,504 | 12,095 | 5,378 | ||||||||||||
Atlantic
Aviation |
10,431 | 10,837 | 34,462 | ||||||||||||
Total
|
$ | 22,690 | $ | 30,320 | $ | 49,560 | |||||||||
136
MACQUARIE INFRASTRUCTURE COMPANY LLC
NOTES TO CONSOLIDATED FINANCIAL STATEMENTS (Continued)
NOTES TO CONSOLIDATED FINANCIAL STATEMENTS (Continued)
15. Reportable Segments (Continued)
Property, equipment, land and leasehold
improvements, goodwill and total assets for the Company’s reportable segments as of December 31 were as follows ($ in thousands):
| Property, Equipment, Land and Leasehold Improvements |
Goodwill |
Total Assets |
|||||||||||||||||||||||||
|---|---|---|---|---|---|---|---|---|---|---|---|---|---|---|---|---|---|---|---|---|---|---|---|---|---|---|---|
| 2010 |
2009(1) |
2010 |
2009(2) |
2010 |
2009 |
||||||||||||||||||||||
The Gas
Company |
$ | 149,542 | $ | 143,783 | $ | 120,193 | $ | 120,193 | $ | 350,428 | $ | 344,876 | |||||||||||||||
District
Energy |
146,623 | 151,543 | 18,647 | 18,647 | 228,480 | 234,847 | |||||||||||||||||||||
Atlantic
Aviation |
267,286 | 284,761 | 375,413 | 377,342 | 1,410,052 | 1,473,228 | |||||||||||||||||||||
Total
|
$ | 563,451 | $ | 580,087 | $ | 514,253 | $ | 516,182 | $ | 1,988,960 | $ | 2,052,951 | |||||||||||||||
(1) |
Includes non-cash impairment charge of $7.5 million recorded during the first six months of 2009 at Atlantic Aviation. |
(2) |
Includes a non-cash goodwill impairment charge of $71.2 million recorded during the first six months of 2009 at Atlantic Aviation. |
Reconciliation of reportable
segments’ total assets to consolidated total assets ($ in thousands):
| As of December 31, |
|||||||||||
|---|---|---|---|---|---|---|---|---|---|---|---|
| 2010 |
2009 |
||||||||||
Total assets
of reportable segments |
$ | 1,988,960 | $ | 2,052,951 | |||||||
Investment in
IMTT |
223,792 | 207,491 | |||||||||
Assets of
discontinued operations held for sale |
— | 86,695 | |||||||||
Corporate and
other |
(16,010 | ) | (7,916 | ) | |||||||
Total
consolidated assets |
$ | 2,196,742 | $ | 2,339,221 | |||||||
16. Related Party Transactions
Management Services Agreement with Macquarie Infrastructure
Management (USA) Inc. (the Manager)
The Manager acquired 2,000,000 shares
of trust stock concurrently with the closing of the initial public offering in December 2004, with an aggregate purchase price of $50.0 million, at a
purchase price per share equal to the initial public offering price of $25.00, which were exchanged for LLC interests on June 25, 2007. Pursuant to the
terms of the Management Agreement (discussed below), the Manager may sell these LLC interests at any time. The Manager has also received additional
shares of trust stock and LLC interests (the LLC interests replacing the trust stock following the dissolution of the Trust in June 2007) by
reinvesting some performance fees and base management fees. As part of the equity offering which closed in July 2007, the Manager sold 599,000 of its
LLC interests at a price of $40.99 per LLC interest. At December 31, 2010, the Manager held 3,797,557 LLC interests of the Company.
The Company entered into a management
services agreement, or Management Agreement, with the Manager pursuant to which the Manager manages the Company’s day-to-day operations and
oversees the management teams of the Company’s operating businesses. In addition, the Manager has the right to appoint the Chairman of the Board
of the Company, and an alternate, subject to minimum equity ownership, and to assign, or second, to the Company, on a permanent and wholly-dedicated
basis, employees to assume the role of Chief Executive Officer and Chief Financial Officer and second or make other personnel available as
required.
137
MACQUARIE INFRASTRUCTURE COMPANY LLC
NOTES TO CONSOLIDATED FINANCIAL STATEMENTS (Continued)
NOTES TO CONSOLIDATED FINANCIAL STATEMENTS (Continued)
16. Related Party Transactions
(Continued)
In accordance with the Management
Agreement, the Manager is entitled to a quarterly base management fee based primarily on the Company’s market capitalization, and a performance
fee, based on the performance of the Company’s stock relative to a U.S. utilities index. Base management fee payable to the Manager, and the
Manager’s reinvestment of the base management fee in the Company’s LLC interests, for the years ended December 31, 2010, 2009 and 2008 were
as follows ($ in thousands):
| Year Ended December 31, |
|||||||||||||||
|---|---|---|---|---|---|---|---|---|---|---|---|---|---|---|---|
| 2010(1) |
2009(2) |
2008 |
|||||||||||||
Base
management fee |
$ | 10,051 | $ | 4,846 | $ | 12,568 | |||||||||
(1) |
During 2010, the Manager elected to reinvest the base management fee for the first quarter of 2010 in LLC interests and the Company issued 155,375 LLC interests to the Manager during the second quarter of 2010. The base management fee for the fourth quarter of 2010 will be reinvested in LLC interests during the first quarter of 2011. |
(2) |
During 2009, the Manager elected to reinvest the base management fee for the second, third and fourth quarters of 2009 in LLC interests and the Company issued 149,795 LLC interests, 180,309 LLC interests and 138,955 LLC interests, respectively, to the Manager during the third and fourth quarters of 2009 and first quarter of 2010, respectively. |
The unpaid portion of the fees at the
end of each reporting period is included in due to manager-related party in the consolidated balance sheets.
During the third quarter of 2008, the
Manager had offered to reinvest its base fee for the third quarter of 2008 in additional LLC interests of the Company. However in the fourth quarter of
2008, the Board of Directors requested that the Manager reverse its decision to reinvest its base management fees in stock under the terms of the
management services agreement due to the significant decline in the market price of the LLC interests between the end of the third quarter of 2008 and
the time at which the Company would have issued those LLC interests and the resulting potential substantial dilution to existing shareholders. The
Manager agreed to this request and subsequently, both the third and fourth quarter 2008 base fees have been paid in cash during the first quarter of
2009.
The Manager is not entitled to any
other compensation and all costs incurred by the Manager, including compensation of seconded staff, are paid by the Manager out of its base management
fee. However, the Company is responsible for other direct costs including, but not limited to, expenses incurred in the administration or management of
the Company and its subsidiaries and investments, income taxes, audit and legal fees, acquisitions and dispositions and its compliance with applicable
laws and regulations. During the years ended December 31, 2010, 2009 and 2008, the Manager charged the Company $323,000, $275,000 and $274,000,
respectively, for reimbursement of out-of-pocket expenses. The unpaid portion of the out-of-pocket expenses at the end of the reporting period is
included in due to manager-related party in the consolidated balance sheet.
Advisory and Other Services from the Macquarie
Group
The Macquarie Group, and wholly-owned
subsidiaries within the Macquarie Group, including Macquarie Bank Limited, or MBL, and Macquarie Capital (USA) Inc., or MCUSA, have provided various
advisory and other services and incurred expenses in connection with the Company’s equity raising activities, acquisitions and debt structuring
for the Company and its businesses. Underwriting fees are recorded in members’ equity as a direct cost of equity offerings. Advisory fees and
out-of-pocket expenses relating to acquisitions are expensed as incurred. Debt arranging fees are deferred and amortized over the term of the credit
facility. Amounts relating to these transactions comprise of the following ($ in thousands):
138
MACQUARIE INFRASTRUCTURE COMPANY LLC
NOTES TO CONSOLIDATED FINANCIAL STATEMENTS (Continued)
NOTES TO CONSOLIDATED FINANCIAL STATEMENTS (Continued)
16. Related Party Transactions
(Continued)
Year Ended December 31, 2010 |
||||||||||
Holding
company debt restructuring advice |
— advisory services from MCUSA |
$ | 500 | |||||||
Year Ended December 31, 2009 |
||||||||||
Sale of
49.99% of noncontrolling |
— advisory services from MCUSA |
$ | 1,294 | |||||||
interest stake of District Energy to John Hancock |
— reimbursement of out-of-pocket expenses to MCUSA |
15 | ||||||||
Strategic review of alternatives |
— advisory services from MCUSA |
300 | ||||||||
available to the Company |
— reimbursement of out-of-pocket expenses to MCUSA |
2 | ||||||||
Atlantic Aviation’s accounts receivable management consulting services |
— consulting services from Macquarie Business Improvement and Strategy, or MBIS |
159 | ||||||||
— reimbursement of out-of-pocket expenses to MBIS |
71 | |||||||||
PCAA
restructuring advice |
— advisory services from MCUSA |
200 | ||||||||
— reimbursement of out-of-pocket expenses to MCUSA |
3 | |||||||||
Atlantic Aviation’s debt amendment |
— debt arranging services from MCUSA |
970 | ||||||||
Long-Term Debt
Until March 31, 2010, the Company had a
revolving credit facility provided by various financial institutions, including entities within the Macquarie Group. The facility was repaid in full
during 2009 and no amounts were outstanding under the revolving credit facility as of December 31, 2009 or at the facility’s maturity on March 31,
2010. Amounts relating to the Macquarie Group’s portion of this revolving credit facility comprised of the following ($ in
thousands):
Year
Ended December 31, 2010 |
||||||
Revolving
credit facility commitment provided by Macquarie Group during January 1, 2010 through March 30, 2010(1) |
$ | 4,444 | ||||
Revolving
credit facility commitment provided by Macquarie Group at March 31, 2010(2) |
— | |||||
Portion of
revolving credit facility commitment from Macquarie Group drawn down, as of March 31, 2010(2)(3) |
— | |||||
Interest
expense on Macquarie Group portion of the drawn down commitment, for the quarter ended March 31, 2010 |
— | |||||
Commitment
fees to the Macquarie Group, for quarter ended March 31, 2010 |
5 | |||||
Year
Ended December 31, 2009 |
||||||
Revolving
credit facility commitment provided by Macquarie Group during the period January 1, 2009 through April 13, 2009(4) |
$ | 66,667 | ||||
Revolving
credit facility commitment provided by Macquarie Group during the period April 14, 2009 through December 30, 2009(1) |
21,556 | |||||
Revolving
credit facility commitment provided by Macquarie Group on December 31, 2009 |
4,444 | |||||
Portion of
revolving credit facility commitment from Macquarie Group drawn down, as of December 31, 2009(5) |
— | |||||
Macquarie
Group portion of the principal payments made to the revolving credit facility during the year ended December 31, 2009(5) |
15,333 |
139
MACQUARIE INFRASTRUCTURE COMPANY LLC
NOTES TO CONSOLIDATED FINANCIAL STATEMENTS (Continued)
NOTES TO CONSOLIDATED FINANCIAL STATEMENTS (Continued)
16. Related Party Transactions
(Continued)
Interest
expense on Macquarie Group portion of the drawn down commitment, for the year ended December 31, 2009 |
599 | |||||
Commitment
fees to the Macquarie Group, for year ended December 31, 2009 |
100 |
(1) |
On December 31, 2009, the Company elected to reduce the available principal on its revolving credit facility from $97.0 million to $20.0 million. This resulted in a decrease in the Macquarie Group’s total commitment under its revolving credit facility from $21.6 million to $4.4 million. |
(2) |
The holding company’s revolving credit facility matured on March 31, 2010. |
(3) |
On December 28, 2009, the Company repaid the entire outstanding principal balance on its revolving credit facility. |
(4) |
On April 14, 2009, the Company elected to reduce the available principal on its revolving credit facility from $300.0 million to $97.0 million. This resulted in a decrease in the Macquarie Group’s total commitment under the revolving credit facility from $66.7 million to $21.6 million. |
(5) |
On December 28, 2009, using the net cash proceeds from the sale of the 49.99% noncontrolling interest in District Energy, and cash on hand, the Company repaid the outstanding principal balance on the MIC Inc. revolving credit facility. |
Derivative Instruments and Hedging
Activities
The Company has derivative instruments
in place to fix the interest rate on certain outstanding variable-rate term loan facilities. MBL has provided interest rate swaps for Atlantic
Aviation, which matured in December 2010, and The Gas Company. At December 31, 2009, Atlantic Aviation had $818.4 million of its variable-rate term
loans hedged, of which MBL was providing the interest rate swaps for a notional amount of $307.0 million. The remainder of the swaps are from an
unrelated third party. During the years ended December 31, 2010, 2009 and 2008, Atlantic Aviation made net payments to MBL of $13.0 million, $14.1
million and $5.8 million, respectively, in relation to these swaps.
As discussed in Note 11,
“Long-Term Debt”, for years ended December 31, 2010 and 2009, Atlantic Aviation paid $5.5 million and $8.8 million, respectively, in interest
rate swap breakage fees, of which $496,000 and $1.8 million, respectively, was paid to MBL.
At December 31, 2010 and 2009, The Gas
Company had $160.0 million of its term loans hedged, of which MBL was providing the interest rate swaps for a notional amount of $48.0 million. The
remainder of the swaps are from an unrelated third party. During the years ended December 31, 2010, 2009 and 2008, The Gas Company made net payments to
MBL of $2.1 million, $1.9 million and $685,000, respectively, in relation to these swaps.
Other Transactions
In September 2010, The Gas Company
purchased casualty insurance coverage from insurance underwriters who pay commission to Macquarie Insurance Facility, or MIF, an indirect subsidiary of
Macquarie Group Limited. The Gas Company does not make any payments directly to MIF.
In August 2010, Macquarie AirFinance,
or MAF, an indirect subsidiary of Macquarie Group Limited, parked an aircraft at one of Atlantic Aviation’s airports. During the year ended
December 31, 2010, Atlantic Aviation recorded $11,000 in revenue from MAF’s agent. As of December 31, 2010, there were no receivable balance
outstanding from MAF.
During the year ended December 31,
2010, Atlantic Aviation entered into a copiers lease agreement with Macquarie Equipment Finance, or MEF, an indirect subsidiary of Macquarie Group
Limited. For the year ended December 31, 2010, Atlantic Aviation incurred $31,000 in lease expense on these copiers. As of
140
MACQUARIE INFRASTRUCTURE COMPANY LLC
NOTES TO CONSOLIDATED FINANCIAL STATEMENTS (Continued)
NOTES TO CONSOLIDATED FINANCIAL STATEMENTS (Continued)
16. Related Party Transactions
(Continued)
December 31, 2010, Atlantic Aviation had prepaid the January 2011 monthly payment to MEF for $2,000, which is included in prepaid expenses in the consolidated balance sheet.
On March 30, 2009, The Gas Company
entered into licensing agreements with Utility Service Partners, Inc. and America’s Water Heater Rentals, LLC, both indirect subsidiaries of
Macquarie Group Limited, to enable these entities to offer products and services to The Gas Company’s customer base. No payments were made under
these arrangements during the years ended December 31, 2010 and 2009.
On August 29, 2008, Macquarie Global
Opportunities Partners, or MGOP, a private equity fund managed by the Macquarie Group, completed the acquisition of the jet membership, retail charter
and fuel management business units previously owned by Sentient Jet Holdings, LLC. The new company is called Sentient Flight Group (referred to
hereafter as “Sentient”). Sentient was an existing customer of Atlantic Aviation. For the years ended December 31, 2010, 2009 and 2008,
Atlantic Aviation recorded $16.6 million, $9.6 million and $3.6 million, respectively, in revenue from Sentient. As of December 31, 2010 and 2009,
Atlantic Aviation had $269,000 and $195,000, respectively, in receivables from Sentient, which is included in accounts receivable in the consolidated
balance sheets. During the year ended December 31, 2010, Atlantic Aviation paid $15,000 to Sentient for charter services rendered.
In addition, the Company and several of
its subsidiaries have entered into a licensing agreement with the Macquarie Group related to the use of the Macquarie name and trademark. The Macquarie
Group does not charge the Company any fees for this license.
17. Income Taxes
The Company and its wholly-owned
subsidiaries are subject to income taxes. The Company files a consolidated U.S. income tax return with its wholly-owned subsidiaries. District Energy
and IMTT each file separate consolidated federal income tax returns with their respective subsidiaries. The Company includes in its taxable income, the
taxable portion of distributions received from its interests in IMTT and District Energy. Generally, the taxable portion of these distributions qualify
for the 80% dividends received deduction.
Components of the Company’s income
tax benefit related to loss from continuing operations for the years ended December 31, 2010, 2009 and 2008 were as follows ($ in
thousands):
| Year Ended December 31, |
|||||||||||||||
|---|---|---|---|---|---|---|---|---|---|---|---|---|---|---|---|
| 2010 |
2009 |
2008 |
|||||||||||||
Current
taxes: |
|||||||||||||||
Federal
|
$ | — | $ | 334 | $ | — | |||||||||
State
|
2,401 | 1,859 | 2,536 | ||||||||||||
Total current
taxes |
$ | 2,401 | $ | 2,193 | $ | 2,536 | |||||||||
Deferred tax
benefit: |
|||||||||||||||
Federal
|
$ | (6,122 | ) | $ | (20,175 | ) | $ | (12,849 | ) | ||||||
State
|
(3,171 | ) | (7,333 | ) | (3,748 | ) | |||||||||
Total
deferred tax benefit |
(9,293 | ) | (27,508 | ) | (16,597 | ) | |||||||||
Change in
valuation allowance |
(1,805 | ) | 9,497 | — | |||||||||||
Total tax
benefit |
$ | (8,697 | ) | $ | (15,818 | ) | $ | (14,061 | ) | ||||||
The Company’s sale in 2010 of its
investment in the off airport parking business, PCAA, resulted in a capital loss of approximately $10.4 million, which the Company expects to carryback
to offset, in part, the 2009 capital gain on the sale of the 49.99% interest in District Energy. This carryback will reduce the federal NOL used in
2009 by approximately $10.4 million.
141
MACQUARIE INFRASTRUCTURE COMPANY LLC
NOTES TO CONSOLIDATED FINANCIAL STATEMENTS (Continued)
NOTES TO CONSOLIDATED FINANCIAL STATEMENTS (Continued)
17. Income Taxes (Continued)
The Company sold 49.99% of District
Energy in 2009 and converted a holding company within the District Energy group from an entity disregarded for income tax purposes to a taxable
corporation, resulting in $10.2 million income tax provision. This provision has been reflected as a reduction in the $32.2 million gain on the sale
and recorded in additional paid in capital in the consolidated 2009 balance sheet. This taxable income was offset by the Company’s other
consolidated taxable loss and its NOL carryforwards in 2009.
The tax effects of temporary
differences that give rise to significant portions of the deferred tax assets and deferred tax liabilities at December 31, 2010 and 2009 are presented
below ($ in thousands):
| At December 31, |
|||||||||||
|---|---|---|---|---|---|---|---|---|---|---|---|
| 2010 |
2009 |
||||||||||
Deferred tax
assets: |
|||||||||||
Net operating
loss carryforwards |
$ | 66,901 | $ | 58,801 | |||||||
Lease
transaction costs |
1,478 | 1,638 | |||||||||
Deferred
revenue |
1,286 | 1,311 | |||||||||
Accrued
compensation |
9,616 | 9,136 | |||||||||
Accrued
expenses |
1,953 | 1,503 | |||||||||
Partnership
basis differences |
— | 50,466 | |||||||||
Other
|
1,630 | 1,403 | |||||||||
Unrealized
losses |
38,093 | 41,904 | |||||||||
Allowance for
doubtful accounts |
244 | 653 | |||||||||
Total gross
deferred tax assets |
121,201 | 166,815 | |||||||||
Less:
valuation allowance |
(9,173 | ) | (20,571 | ) | |||||||
Net deferred
tax assets after valuation allowance |
$ | 112,028 | $ | 146,244 | |||||||
Deferred tax
liabilities: |
|||||||||||
Intangible
assets |
$ | (162,615 | ) | $ | (148,286 | ) | |||||
Investment
basis difference |
(4,043 | ) | — | ||||||||
Property and
equipment |
(81,500 | ) | (81,041 | ) | |||||||
Prepaid
expenses |
(1,168 | ) | (1,434 | ) | |||||||
Total
deferred tax liabilities |
(249,326 | ) | (230,761 | ) | |||||||
Net deferred
tax liability |
(137,298 | ) | (84,517 | ) | |||||||
Less: current
deferred tax asset |
(19,030 | ) | (23,323 | ) | |||||||
Noncurrent
deferred tax liability |
$ | (156,328 | ) | $ | (107,840 | ) | |||||
At December 31, 2010, the Company and
its wholly owned subsidiaries had NOL carryforwards for federal income tax purposes of approximately $140.9 million, which are available to offset
future taxable income, if any, through 2029. Approximately $35.0 million of these NOLs may be limited, on an annual basis, due to the change of control
for tax purposes of the respective subsidiaries in which such losses were incurred. In addition, District Energy has NOL carryforwards of approximately
$19.8 million, all of which are subject to limitations on realization due to a change in control for tax purposes in 2010.
In assessing the need for a valuation
allowance, management considers whether it is more likely than not that some portion of the deferred tax assets will not be realized. The ultimate
realization of deferred tax assets is dependent upon the generation of future taxable income during the periods in which those temporary differences
become deductible. Management considers the scheduled reversal of deferred tax liabilities, projected future taxable income, and tax planning
strategies in making this assessment. The sale of a 49.99% interest in District Energy precludes including that business in the Company’s
consolidated federal income tax return from the date of sale. Accordingly, the net deferred tax liabilities of that business, approximately $43.8
million, cannot be considered in evaluating the ultimate realization of the Company’s deferred tax assets.
142
MACQUARIE INFRASTRUCTURE COMPANY LLC
NOTES TO CONSOLIDATED FINANCIAL STATEMENTS (Continued)
NOTES TO CONSOLIDATED FINANCIAL STATEMENTS (Continued)
17. Income Taxes (Continued)
In 2010, the Company’s management
concluded that the reversal of deferred tax liabilities should more likely than not result in the ultimate realization of all but approximately $2.8
million of federal deferred tax assets. The Company has also provided a valuation allowance of approximately $6.4 million for the realization of
certain state NOL carryforwards, for a total valuation allowance of approximately $9.2 million. In 2010, the Company’s valuation allowance for
both federal and state deferred tax assets decreased by approximately $11.4 million from approximately $20.6 million at December 31, 2009. The net
decrease includes an approximate $9.6 million decrease reflected in net income from discontinued operations, an approximate $2.5 million decrease
reflected in federal tax expense or benefit from continuing operations and an increase of approximately $745,000 included in state income tax expense
or benefit from continuing operations.
As of December 31, 2010, the Company
had approximately $137.3 million in net deferred tax liabilities. A significant portion of the Company’s deferred tax liabilities relates to tax
basis temporary differences of both intangible assets and property and equipment and the Company’s unrealized liability on derivatives. The
Company records the acquisitions of consolidated businesses under the purchase method of accounting and accordingly recognizes a significant increase
to the value of the intangible assets and to property and equipment. For tax purposes, the Company may assume the existing tax basis of the acquired
businesses, in which cases the Company records a deferred tax liability to reflect the increase in the purchase accounting basis of the assets acquired
over the carryover income tax basis. This liability will reduce in future periods as these temporary differences reverse.
Income tax benefit attributable to
income from continuing operations was $8.7 million, $15.8 million and $14.1 million for the years ended December 31, 2010, 2009 and 2008, respectively,
and differed from the amounts computed by applying the U.S. federal income tax rate of 35% to pretax income from continuing operations as a result of
the following:
| Year Ended December 31, |
|||||||||||||||
|---|---|---|---|---|---|---|---|---|---|---|---|---|---|---|---|
| 2010 |
2009 |
2008 |
|||||||||||||
Tax provision
(benefit) at U.S. statutory rate |
$ | 458 | $ | (43,746 | ) | $ | (29,484 | ) | |||||||
Impairment of
non-deductible intangibles |
675 | 18,601 | 13,684 | ||||||||||||
Permanent and
other differences between book and federal taxable income |
(1,680 | ) | 1,073 | (49 | ) | ||||||||||
State income
taxes, net of federal benefit |
(502 | ) | (3,559 | ) | (788 | ) | |||||||||
Income
attributable to joint venture partner in Northwind Aladdin |
(449 | ) | — | — | |||||||||||
District
Energy taxable dividend income in excess of book income |
3,584 | — | — | ||||||||||||
IMTT book
income in excess of taxable dividend income |
(5,693 | ) | (7,895 | ) | 5,425 | ||||||||||
Federal
dividends received deduction on IMTT and District Energy dividends |
(7,068 | ) | — | (4,710 | ) | ||||||||||
Increase in
book basis in excess of tax basis in IMTT |
4,043 | — | — | ||||||||||||
Change in
District Energy tax status |
— | 10,211 | — | ||||||||||||
True-up of
deferred tax balances |
— | — | 1,861 | ||||||||||||
Change in
valuation allowance |
(2,065 | ) | 9,497 | — | |||||||||||
Total tax
benefit |
$ | (8,697 | ) | $ | (15,818 | ) | $ | (14,061 | ) | ||||||
Uncertain Tax Positions
It is expected that the amount of
unrecognized tax benefits will change in the next 12 months; however, the Company does not expect the change to have a significant impact on the
results of operations or the financial position of the Company.
143
MACQUARIE INFRASTRUCTURE COMPANY LLC
NOTES TO CONSOLIDATED FINANCIAL STATEMENTS (Continued)
NOTES TO CONSOLIDATED FINANCIAL STATEMENTS (Continued)
17. Income Taxes (Continued)
The Company recognizes interest and
penalties related to unrecognized tax benefits in income tax expense in the statements of operations, which is consistent with the recognition of these
items in prior reporting periods.
During the quarter and year ended
December 31, 2008, the Company determined that the statute of limitations expired on unrecognized benefits of approximately $782,000. Approximately
$690,000 of that amount was an acquired reserve and accordingly, recognition of its benefit was treated as an adjustment of goodwill. The balance of
the reversal, approximately $92,000, was included in income as a reduction of state income tax expense.
During the year ended December 31,
2009, the IRS completed its audit of PCAA for 2004 and 2003. The conclusion of the audit did not result in material assessment.
In 2010, the Internal Revenue Service
began an audit of the Company’s amended 2006 federal income tax return. The Company does not expect the audit will result in any changes to the
return as filed. Also, in 2010, New York State, Illinois and Mississippi began examinations of various state income returns filed by the Company or its
subsidiaries. The Company does not expect the results of those state income tax return audits to be material to its financial
statements.
The following table sets forth a
reconciliation of the Company’s unrecognized tax benefits from January 1, 2010 to December 31, 2010 ($ in thousands).
Balance as of
January 1, 2010 |
$ | 336 | ||||
Current year
increases |
32 | |||||
Balance as of
December 31, 2010 |
$ | 368 |
18. Leases
The Company leases land, buildings,
office space and certain office equipment under noncancellable operating lease agreements that expire through April 2057.
Future minimum rental commitments at
December 31, 2010 are as follows ($ in thousands):
2011
|
$ | 33,358 | ||||
2012
|
32,322 | |||||
2013
|
31,283 | |||||
2014
|
29,969 | |||||
2015
|
27,888 | |||||
Thereafter
|
256,953 | |||||
Total
|
$ | 411,773 |
Rent expense under all operating leases
for the years ended December 31, 2010, 2009 and 2008 was $35.9 million, $34.9 million and $34.2 million, respectively.
144
MACQUARIE INFRASTRUCTURE COMPANY LLC
NOTES TO CONSOLIDATED FINANCIAL STATEMENTS (Continued)
NOTES TO CONSOLIDATED FINANCIAL STATEMENTS (Continued)
19. Employee Benefit Plans
401(k) Savings Plan
In 2006, MIC Inc. established a defined
contribution plan under section 401(k) of the Internal Revenue Code, allowing eligible employees of the consolidated businesses to contribute a
percentage of their annual compensation up to an annual amount as set by the IRS. Prior to this, each of the consolidated businesses maintained their
own plans. Following the establishment of the MIC Inc. Plan, Atlantic Aviation, District Energy and PCAA consolidated their plans under the MIC Inc.
Plan. Subsequent to the sale in bankruptcy of PCAA in June 2010, the eligible employees of PCAA are no longer allowed to participate in the Plan. In
addition, District Energy started their own defined contribution plan following the sale of 49.99% of noncontrolling interest in December 2009. The Gas
Company also sponsored a 401(k) plan for eligible employees of that business. On January 1, 2008, employees in The Gas Company 401(k) plan were added
to the MIC Inc. Plan. The Company completed the merger of The Gas Company plan into the MIC Inc. Plan in the first quarter of 2008.
The employer contribution to these
plans ranges from 0% to 6% of eligible compensation. For the years ended December 31, 2010, 2009 and 2008, contributions were approximately $1.0
million, $1.3 million and $1.1 million, respectively.
Union Pension Plan
The Gas Company has a Defined Benefit
Pension Plan for Classified Employees of GASCO, Inc. (the DB Plan) that accrues benefits pursuant to the terms of a collective bargaining agreement.
The DB Plan is non-contributory and covers all bargaining unit employees who have met certain service and age requirements. The benefits are based on a
flat rate per year of service through the date of employment termination or retirement. The Gas Company made contributions to the DB Plan of $2.6
million during 2010 and $2.9 million during 2009. Future contributions will be made to meet ERISA funding requirements. The DB Plan’s trustee,
First Hawaiian Bank, handles the DB Plan’s assets and as an investment manager, invests them in a diversified portfolio of equity and fixed-income
securities. The projected benefit obligation for the DB Plan totaled $38.2 million at December 31, 2010 and $35.3 million at December 31, 2009. The DB
Plan has assets of $25.6 million and $21.9 million at December 31, 2010 and 2009, respectively.
The Gas Company expects to make
contributions in 2011 and annually for at least five years as it complies with the requirements of the Pension Protection Act of 2006. The annual
amount of contributions will be dependent upon a number of factors such as market conditions and changes to regulations. However, for the 2011 calendar
year, the Company expects to make contributions of approximately $2.1 million.
In May 2008, The Gas Company entered
into a new five-year collective bargaining agreement which increased the benefits for participants and that immediately froze the plan to new
participants. The benefit increases will occur annually for three years after which there will be no further increase to the flat rate. Participants
will, however, continue to accrue years of service toward their final benefit. The financial effects of the new agreement are included below as
“Plan amendments”.
Other Benefits Plan
The Gas Company has a postretirement
plan. The GASCO, Inc. Hourly Postretirement Medical and Life Insurance Plan (the “PMLI Plan”) covers all bargaining unit participants who
were employed by The Gas Company on May 1, 1999 and who retire after the attainment of age 62 with 15 years of service. Prior to the establishment of
this plan, the participants were covered under a multiemployer plan administered by the Hawaii Teamsters Health and Welfare Trust; the PMLI Plan was
formed when the multiemployer plan was dissolved. Under the provisions of the PMLI Plan, The Gas Company pays for medical premiums of
the
145
MACQUARIE INFRASTRUCTURE COMPANY LLC
NOTES TO CONSOLIDATED FINANCIAL STATEMENTS (Continued)
NOTES TO CONSOLIDATED FINANCIAL STATEMENTS (Continued)
19. Employee Benefit Plans
(Continued)
retirees and spouses up until age 65. After age 65, The Gas Company pays for medical premiums up to a maximum of $150 per month. The retirees are also provided $1,000 of life insurance benefits.
Additional information about the fair
value of the benefit plan assets, the components of net periodic cost, and the projected benefit obligation as of December 31, 2010 and 2009, and for
the years ended December 31, 2010 and 2009 is as follows ($ in thousands):
| DB Plan Benefits |
PMLI Benefits |
||||||||||||||||||
|---|---|---|---|---|---|---|---|---|---|---|---|---|---|---|---|---|---|---|---|
| 2010 |
2009 |
2010 |
2009 |
||||||||||||||||
Change in
benefit obligation: |
|||||||||||||||||||
Benefit
obligation – beginning of period |
$ | 35,250 | $ | 31,167 | $ | 2,095 | $ | 1,744 | |||||||||||
Service cost
|
696 | 629 | 45 | 42 | |||||||||||||||
Interest cost
|
1,950 | 1,888 | 113 | 113 | |||||||||||||||
Participant
contributions |
— | — | 63 | 60 | |||||||||||||||
Actuarial
losses |
2,039 | 3,251 | 62 | 252 | |||||||||||||||
Benefits paid
|
(1,718 | ) | (1,685 | ) | (141 | ) | (116 | ) | |||||||||||
Benefit
obligation – end of year |
$ | 38,217 | $ | 35,250 | $ | 2,237 | $ | 2,095 | |||||||||||
Change in plan
assets: |
|||||||||||||||||||
Fair value of
plan assets – beginning of period |
$ | 21,911 | $ | 16,652 | $ | — | $ | — | |||||||||||
Actual return
on plan assets |
2,807 | 4,170 | — | — | |||||||||||||||
Employer/participant contributions |
2,648 | 2,901 | 141 | 116 | |||||||||||||||
Expenses paid
|
(96 | ) | (127 | ) | — | — | |||||||||||||
Benefits paid
|
(1,718 | ) | (1,685 | ) | (141 | ) | (116 | ) | |||||||||||
Fair value of
plan assets – end of year |
$ | 25,552 | $ | 21,911 | $ | — | $ | — | |||||||||||
The funded status of The Gas
Company’s balance sheet at December 31, 2010 and 2009, are presented in the following table ($ in thousands):
| DB Plan Benefits |
PMLI Benefits |
||||||||||||||||||
|---|---|---|---|---|---|---|---|---|---|---|---|---|---|---|---|---|---|---|---|
| 2010 |
2009 |
2010 |
2009 |
||||||||||||||||
Funded
status |
|||||||||||||||||||
Funded status
at end of year |
$ | (12,664 | ) | $ | (13,339 | ) | $ | (2,237 | ) | $ | (2,095 | ) | |||||||
Net amount
recognized in balance sheet |
$ | (12,664 | ) | $ | (13,339 | ) | $ | (2,237 | ) | $ | (2,095 | ) | |||||||
Amounts
recognized in balance sheet consists of: |
|||||||||||||||||||
Current
liabilities |
$ | — | $ | — | $ | (168 | ) | $ | (120 | ) | |||||||||
Noncurrent
liabilities |
(12,664 | ) | (13,339 | ) | (2,069 | ) | (1,975 | ) | |||||||||||
Net amount
recognized in balance sheet |
$ | (12,664 | ) | $ | (13,339 | ) | $ | (2,237 | ) | $ | (2,095 | ) | |||||||
Amounts not
yet reflected in net periodic benefit cost and included in accumulated other comprehensive loss: |
|||||||||||||||||||
Prior service
cost |
$ | (310 | ) | $ | (465 | ) | $ | — | $ | — | |||||||||
Accumulated
loss |
(7,908 | ) | (7,379 | ) | (376 | ) | (325 | ) | |||||||||||
Accumulated
other comprehensive loss |
(8,218 | ) | (7,844 | ) | (376 | ) | (325 | ) | |||||||||||
Net periodic
benefit cost in excess of cumulative employer contributions |
(4,446 | ) | (5,495 | ) | (1,861 | ) | (1,770 | ) | |||||||||||
Net amount
recognized in balance sheet |
$ | (12,664 | ) | $ | (13,339 | ) | $ | (2,237 | ) | $ | (2,095 | ) | |||||||
146
MACQUARIE INFRASTRUCTURE COMPANY LLC
NOTES TO CONSOLIDATED FINANCIAL STATEMENTS (Continued)
NOTES TO CONSOLIDATED FINANCIAL STATEMENTS (Continued)
19. Employee Benefit Plans
(Continued)
The components of net periodic benefit
cost and other changes in other comprehensive income for the plans are shown below ($ in thousands):
| DB Plan Benefits |
PMLI Benefits |
||||||||||||||||||
|---|---|---|---|---|---|---|---|---|---|---|---|---|---|---|---|---|---|---|---|
| 2010 |
2009 |
2010 |
2009 |
||||||||||||||||
Components of
net periodic benefit cost: |
|||||||||||||||||||
Service cost
|
$ | 696 | $ | 629 | $ | 45 | $ | 42 | |||||||||||
Interest cost
|
1,950 | 1,888 | 113 | 113 | |||||||||||||||
Expected
return on plan assets |
(1,566 | ) | (1,221 | ) | — | — | |||||||||||||
Recognized
actuarial loss |
364 | 413 | 11 | — | |||||||||||||||
Amortization
of prior service cost |
155 | 155 | — | — | |||||||||||||||
Net periodic
benefit cost |
$ | 1,599 | $ | 1,864 | $ | 169 | $ | 155 | |||||||||||
Other changes
recognized in other comprehensive loss: |
|||||||||||||||||||
Prior service
cost arising during period |
$ | — | $ | — | $ | — | $ | — | |||||||||||
Net loss
arising during period |
894 | 429 | 62 | 253 | |||||||||||||||
Amortization
of prior service cost |
(155 | ) | (155 | ) | — | — | |||||||||||||
Amortization
of loss |
(364 | ) | (412 | ) | (11 | ) | — | ||||||||||||
Total
recognized in other comprehensive loss |
$ | 375 | $ | (138 | ) | $ | 51 | $ | 253 | ||||||||||
| DB Plan Benefits |
PMLI Benefits |
||||||||||||||||||
|---|---|---|---|---|---|---|---|---|---|---|---|---|---|---|---|---|---|---|---|
| 2010 |
2009 |
2010 |
2009 |
||||||||||||||||
Estimated
amounts that will be amortized from accumulated other comprehensive loss over the next year: |
|||||||||||||||||||
Amortization
of prior service cost |
$ | 155 | $ | 155 | $ | — | $ | — | |||||||||||
Amortization
of net loss |
394 | 395 | 17 | 17 | |||||||||||||||
Weighted
average assumptions to determine benefit obligations: |
|||||||||||||||||||
Discount rate
|
5.20 | % | 5.70 | % | 5.00 | % | 5.60 | % | |||||||||||
Rate of
compensation increase |
N/A |
N/A |
N/A |
N/A |
|||||||||||||||
Measurement
date |
December 31 |
December 31 |
December 31 |
December 31 |
|||||||||||||||
Weighted
average assumptions to determine net cost: |
|||||||||||||||||||
Discount rate
|
5.70 | % | 6.20 | % | 5.60 | % | 6.30 | % | |||||||||||
Expected
long-term rate of return on plan assets during fiscal year |
7.25 | % | 7.25 | % | N/A | N/A | |||||||||||||
Rate of
compensation increase |
N/A | N/A | N/A | N/A | |||||||||||||||
Assumed
healthcare cost trend rates: |
|||||||||||||||||||
Initial health
care cost trend rate |
8.70 | % | 9.00 | % | |||||||||||||||
Ultimate rate
|
4.50 | % | 4.50 | % | |||||||||||||||
Year ultimate
rate is reached |
2028 | 2028 | |||||||||||||||||
147
MACQUARIE INFRASTRUCTURE COMPANY LLC
NOTES TO CONSOLIDATED FINANCIAL STATEMENTS (Continued)
NOTES TO CONSOLIDATED FINANCIAL STATEMENTS (Continued)
19. Employee Benefit Plans
(Continued)
The Gas Company’s overall
investment strategy is to achieve a mix of approximately 65% of investments in equities for long-term growth and 35% in fixed income securities for
asset allocation purposes as well as near-term needs. The Gas Company has instructed the trustee, the investment manager, to maintain the allocation of
the DB Plan’s assets between equity mutual fund securities and fixed income mutual fund securities within the pre-approved parameters set by the
management of The Gas Company. The DB Plan weighted average asset allocation at December 31, 2010 and 2009 was:
| 2010 |
2009 |
|||||||||
|---|---|---|---|---|---|---|---|---|---|---|
Equity
instruments |
65 | % | 65 | % | ||||||
Fixed income
securities |
34 | % | 34 | % | ||||||
Cash
|
1 | % | 1 | % | ||||||
Total
|
100 | % | 100 | % | ||||||
The expected return on plan assets of
7.25% was estimated based on the allocation of assets and management’s expectations regarding future performance of the investments held in the
investment portfolio. The asset allocations of The Gas Company’s pension benefits as of December 31, 2010 measurement dates were as follows ($ in
thousands):
| Fair Value Measurements at December 31, 2010 Pension Benefits — Plan Assets |
|||||||||||||||||||
|---|---|---|---|---|---|---|---|---|---|---|---|---|---|---|---|---|---|---|---|
| Total |
Quoted Prices in Active Markets for Identical Assets (Level 1) |
Significant Observable Inputs (Level 2) |
Significant Unobservable Inputs (Level 3) |
||||||||||||||||
Asset
category: |
|||||||||||||||||||
Cash and money
market |
$ | 309 | $ | 25 | $ | 284 | $ | — | |||||||||||
Equity
securities: |
|||||||||||||||||||
U.S. large-cap
growth(1) |
2,295 | 2,295 | — | — | |||||||||||||||
U.S. large-cap
blend(2) |
6,591 | 6,591 | — | — | |||||||||||||||
U.S. large-cap
value(3) |
2,309 | 2,309 | — | — | |||||||||||||||
U.S. mid-cap
blend(4) |
983 | 983 | — | — | |||||||||||||||
U.S. small-cap
growth(5) |
985 | 985 | — | — | |||||||||||||||
International
large-cap blend(6) |
3,314 | 3,314 | — | — | |||||||||||||||
Fixed income
securities: |
|||||||||||||||||||
Intermediate
term corporate bonds(7) |
7,024 | 7,024 | — | — | |||||||||||||||
Short term
corporate bonds(8) |
1,742 | 1,742 | — | — | |||||||||||||||
Total |
$ | 25,552 | $ | 25,268 | $ | 284 | $ | — | |||||||||||
(1) |
This fund seeks to track the performance of the MSCI U.S. Prime Market Growth Index, a broadly diversified index of growth stocks of large U.S. companies. |
(2) |
This fund seeks to track the performance of the MSCI U.S. Broad Market Index, which consists of all the U.S. common stocks traded regularly on the New York Stock Exchange and the Nasdaq over-the counter market. |
(3) |
This fund seeks long-term capital appreciation and income. The fund invests mainly in mid- and large- capitalization companies whose stocks are considered by an advisor to be undervalued. |
(4) |
This fund seeks long-term capital appreciation. The fund normally invests in small- and mid- capitalization domestic stocks based on an advisor’s assessment of the relative return potential of the securities. |
148
MACQUARIE INFRASTRUCTURE COMPANY LLC
NOTES TO CONSOLIDATED FINANCIAL STATEMENTS (Continued)
NOTES TO CONSOLIDATED FINANCIAL STATEMENTS (Continued)
19. Employee Benefit Plans
(Continued)
(5) |
This fund seeks to provide long-term capital appreciation. The fund invests mainly in the stocks of small companies. |
(6) |
This fund seeks to track the performance of a benchmark index that measures the investment return of stocks issued by companies located in Europe, the Pacific region and emerging markets countries. |
(7) |
These funds seek to provide a moderate and sustainable level of current income by investing in bonds with an average weighted maturity of between five and ten years. |
(8) |
This fund seeks to provide current income. It invests at least 80% of assets in short and intermediate term corporate bonds and other corporate fixed income obligations. It typically maintains an average weighted maturity of between one and four years. |
The discount rates of 5.20% and 5.00%
for the DB Plan and PMLI Plan, respectively, were based on high quality corporate bond rates that approximate the expected settlement of obligations.
The estimated future benefit payments for the next ten years are as follows ($ in thousands):
| DB Plans Benefits |
PMLI Benefits |
|||||||||
|---|---|---|---|---|---|---|---|---|---|---|
2011 |
2,136 | 168 | ||||||||
2012 |
2,270 | 179 | ||||||||
2013 |
2,370 | 185 | ||||||||
2014 |
2,475 | 158 | ||||||||
2015 |
2,516 | 177 | ||||||||
Thereafter |
13,129 | 858 | ||||||||
20. Legal Proceedings and Contingencies
The subsidiaries of MIC Inc. are
subject to legal proceedings arising in the ordinary course of business. In management’s opinion, the Company has adequate legal defenses and/or
insurance coverage with respect to the eventuality of such actions, and does not believe the outcome of any pending legal proceedings will be material
to the Company’s financial position or results of operations.
Dispute Proceedings between MIC and Co-investor in
IMTT
The Company has formally initiated the
dispute resolution process in the Shareholders’ Agreement governing the Company’s investment in IMTT as a result of disagreement with the
co-investor regarding the distribution of certain funds from the cash flow of IMTT. The Company intends to proceed to arbitration with the co-investor
if a satisfactory resolution cannot be reached within the timeframe prescribed in the Shareholders’ Agreement.
Except noted above, there are no
material legal proceedings pending other than ordinary routine litigation incidental to the Company’s businesses.
21. Dividends
The Company’s Board of Directors
declared the following dividends during 2008:
| Date Declared |
Quarter Ended |
Holders of Record Date |
Payment Date |
Dividend per LLC Interest |
||||||||||||||
|---|---|---|---|---|---|---|---|---|---|---|---|---|---|---|---|---|---|---|
February 25, 2008 |
December 31,
2007 |
March 5,
2008 |
March 10,
2008 |
$0.635 |
||||||||||||||
May 5,
2008 |
March 31,
2008 |
June 4,
2008 |
June 10,
2008 |
$0.645 |
||||||||||||||
August
4, 2008 |
June 30,
2008 |
September 4,
2008 |
September 11,
2008 |
$0.645 |
||||||||||||||
November 4, 2008 |
September 30,
2008 |
December 3,
2008 |
December 10,
2008 |
$0.200 |
||||||||||||||
149
MACQUARIE INFRASTRUCTURE COMPANY LLC
NOTES TO CONSOLIDATED FINANCIAL STATEMENTS (Continued)
NOTES TO CONSOLIDATED FINANCIAL STATEMENTS (Continued)
21. Dividends (Continued)
The distributions declared have been
recorded as a reduction to LLC interests or accumulated (deficit) gain in the members’ equity section of the consolidated balance
sheets.
The declaration and payment of any
future distribution will be subject to a decision of the Company’s Board of Directors, which includes a majority of independent directors. The
Company’s Board of Directors will take into account such matters as the state of the capital markets and general business conditions, the
Company’s financial condition, results of operations, capital requirements and any contractual, legal and regulatory restrictions on the payment
of distributions by the Company to its shareholders or by its subsidiaries to the Company, and any other factors that the Board of Directors deems
relevant. In particular, each of the Company’s businesses and investments have substantial debt commitments and restrictive covenants, which must
be satisfied before any of them can pay dividends or make distributions to the Company. Any or all of these factors could affect both the timing and
amount, if any, of future distributions.
22. Quarterly Data (Unaudited)
The data shown below relates to the
Company’s continuing operations and includes all adjustments which the Company considers necessary for a fair presentation of such
amounts.
| Operating Revenue |
Operating Income (Loss) |
Net (Loss) Income |
|||||||||||||||||||||||||||||||||||||
|---|---|---|---|---|---|---|---|---|---|---|---|---|---|---|---|---|---|---|---|---|---|---|---|---|---|---|---|---|---|---|---|---|---|---|---|---|---|---|---|
| 2010 |
2009 |
2008 |
2010 |
2009 |
2008 |
2010 |
2009 |
2008 |
|||||||||||||||||||||||||||||||
($ in
Thousands) |
|||||||||||||||||||||||||||||||||||||||
Quarter
ended: |
|||||||||||||||||||||||||||||||||||||||
March
31 |
$ | 201,304 | $ | 167,496 | $ | 259,808 | $ | 22,476 | $ | (26,748 | ) | $ | 26,886 | $ | (5,465 | ) | $ | (46,435 | ) | $ | 843 | ||||||||||||||||||
June
30 |
204,692 | 163,408 | 267,123 | 20,604 | (39,433 | ) | 24,308 | 400 | (26,838 | ) | 10,329 | ||||||||||||||||||||||||||||
September 30 |
213,298 | 185,562 | 258,312 | 26,781 | 22,095 | 24,613 | 8,976 | (16,716 | ) | 2,516 | |||||||||||||||||||||||||||||
December
31 |
221,497 | 193,610 | 192,118 | 6,240 | 17,028 | (70,185 | ) | 6,095 | (18,695 | ) | (83,284 | ) | |||||||||||||||||||||||||||
SCHEDULE II — VALUATION AND QUALIFYING
ACCOUNTS
| Balance at Beginning of Year |
Charged to Costs and Expenses |
Deductions |
Balance at End of Year |
|||||||||||||||
|---|---|---|---|---|---|---|---|---|---|---|---|---|---|---|---|---|---|---|
($ in
Thousands) |
||||||||||||||||||
Allowance for
Doubtful Accounts |
||||||||||||||||||
For the Year
Ended December 31, 2008 |
$ | 1,899 | $ | 1,543 | $ | (1,301 | ) | $ | 2,141 | |||||||||
For the Year
Ended December 31, 2009 |
2,141 | 3,401 | (3,913 | ) | 1,629 | |||||||||||||
For the Year
Ended December 31, 2010 |
1,629 | 483 | (1,499 | ) | 613 | |||||||||||||
150
ITEM 9. CHANGES IN AND DISAGREEMENTS WITH ACCOUNTANTS ON
ACCOUNTING AND FINANCIAL DISCLOSURE
None.
ITEM 9A. CONTROLS AND PROCEDURES
(a) Management’s Evaluation of Disclosure Controls and
Procedures
Under the direction and with the
participation of our chief executive officer and chief financial officer, we evaluated our disclosure controls and procedures (as such term is defined
under Rule 13(a)-15(e) of the Exchange Act). Based on that evaluation, our chief executive officer and chief financial officer concluded that our
disclosure controls and procedures were effective as of December 31, 2010.
(b) Management’s Annual Report on Internal Control over
Financial Reporting
Management of the Company is
responsible for establishing and maintaining effective internal control over financial reporting, and for performing an assessment of the effectiveness
of internal control over financial reporting as of December 31, 2010. Internal control over financial reporting is defined in Rule 13a-15(f) or
15d-15(f) promulgated under the Securities Exchange Act of 1934 as a process designed by, or under the supervision of, the Company’s principal
executive and principal financial officers and effected by the Company’s Board of Directors, management and other personnel, to provide reasonable
assurance regarding the reliability of financial reporting and the preparation of financial statements for external purposes in accordance with U.S.
generally accepted accounting principles.
Internal control over financial
reporting includes those policies and procedures that (1) pertain to the maintenance of records that, in reasonable detail, accurately and fairly
reflect the transactions and dispositions of the assets of the Company; (2) provide reasonable assurance that transactions are recorded as necessary to
permit the preparation of financial statements in accordance with U.S. generally accepted accounting principles, and that receipts and expenditures of
the Company are being made only in accordance with authorizations of management and directors of the Company; and (3) provide reasonable assurance
regarding prevention or timely detection of unauthorized acquisition, use or disposition of the Company’s assets that could have a material effect
on the financial statements.
All internal control systems, no matter
how well designed, have inherent limitations. Because of the inherent limitations, internal control over financial reporting may not prevent or detect
misstatements. Projections of any evaluation of effectiveness to future periods are subject to the risk that controls may become inadequate because of
changes in conditions, or the degree of compliance with the policies or procedures may deteriorate. Accordingly, even those systems determined to be
effective can provide only reasonable assurance with respect to financial statement preparation and presentation.
Management used the framework set forth
in the report entitled “Internal Control-Integrated Framework” published by the Committee of Sponsoring Organizations of the Treadway
Commission (referred to as “COSO”) to evaluate the effectiveness of the Company’s internal control over financial reporting as of
December 31, 2010.
As a result of its evaluation,
management has concluded that the Company’s internal control over financial reporting was effective as of December 31, 2010.
The effectiveness of the Company’s
internal control over financial reporting as of December 31, 2010 has been audited by KPMG LLP, the Company’s independent registered public
accounting firm, as stated in their report appearing on page 152, which expressed an unqualified opinion on the effectiveness of the Company’s
internal control over financial reporting as of December 31, 2010.
151
(c) Attestation Report of Registered Public Accounting
Firm
REPORT OF INDEPENDENT REGISTERED PUBLIC ACCOUNTING
FIRM
The Board of Directors and Stockholders
Macquarie Infrastructure Company LLC:
Macquarie Infrastructure Company LLC:
We have audited Macquarie
Infrastructure Company LLC’s internal control over financial reporting as of December 31, 2010, based on criteria established in Internal
Control — Integrated Framework issued by the Committee of Sponsoring Organizations of the Treadway Commission (COSO). Macquarie Infrastructure
Company LLC’s management is responsible for maintaining effective internal control over financial reporting and for its assessment of the
effectiveness of internal control over financial reporting, included in the accompanying Management’s Annual Report on Internal Control over
Financial Reporting. Our responsibility is to express an opinion on the Company’s internal control over financial reporting based on our
audit.
We conducted our audit in accordance
with the standards of the Public Company Accounting Oversight Board (United States). Those standards require that we plan and perform the audit to
obtain reasonable assurance about whether effective internal control over financial reporting was maintained in all material respects. Our audit
included obtaining an understanding of internal control over financial reporting, assessing the risk that a material weakness exists, and testing and
evaluating the design and operating effectiveness of internal control based on the assessed risk. Our audit also included performing such other
procedures as we considered necessary in the circumstances. We believe that our audit provides a reasonable basis for our opinion.
A company’s internal control over
financial reporting is a process designed to provide reasonable assurance regarding the reliability of financial reporting and the preparation of
financial statements for external purposes in accordance with generally accepted accounting principles. A company’s internal control over
financial reporting includes those policies and procedures that (1) pertain to the maintenance of records that, in reasonable detail, accurately and
fairly reflect the transactions and dispositions of the assets of the company; (2) provide reasonable assurance that transactions are recorded as
necessary to permit preparation of financial statements in accordance with generally accepted accounting principles, and that receipts and expenditures
of the company are being made only in accordance with authorizations of management and directors of the company; and (3) provide reasonable assurance
regarding prevention or timely detection of unauthorized acquisition, use, or disposition of the company’s assets that could have a material
effect on the financial statements.
Because of its inherent limitations,
internal control over financial reporting may not prevent or detect misstatements. Also, projections of any evaluation of effectiveness to future
periods are subject to the risk that controls may become inadequate because of changes in conditions, or that the degree of compliance with the
policies or procedures may deteriorate.
In our opinion, Macquarie
Infrastructure Company LLC maintained, in all material respects, effective internal control over financial reporting as of December 31, 2010, based on
criteria established in Internal Control — Integrated Framework issued by the Committee of Sponsoring Organizations of the Treadway
Commission.
We also have audited, in accordance
with the standards of the Public Company Accounting Oversight Board (United States), the consolidated balance sheets of Macquarie Infrastructure
Company LLC and subsidiaries as of December 31, 2010 and 2009, and the related consolidated statements of operations, members’ equity and
comprehensive income (loss), and cash flows for each of the years in the three-year period ended December 31, 2010, and our report dated February 23,
2011 expressed an unqualified opinion on those consolidated financial statements.
/s/ KPMG LLP
Dallas, Texas
February 23, 2011
Dallas, Texas
February 23, 2011
152
(d) Changes in Internal Control Over Financial
Reporting
No change in our internal control over
financial reporting (as such term is defined in Exchange Act Rule 13a-15(f)) was identified in connection with the evaluation described in (b) above
during the fiscal quarter ended December 31, 2010 that materially affected, or is reasonably likely to materially affect, our internal control over
financial reporting.
ITEM 9B. OTHER INFORMATION
Not Applicable.
PART III
ITEM 10. DIRECTORS AND EXECUTIVE OFFICERS OF THE
REGISTRANT
The Company will furnish to the
Securities and Exchange Commission a definitive proxy statement not later than 120 days after the end of the fiscal year ended December 31,
2010.
The information required by this Item
10 is included under the captions “Election of Directors,” “Governance Information” and “Section 16(A) Beneficial Ownership
Reporting Compliance” in our proxy statement for our 2011 annual meeting of shareholders and is incorporated herein by reference.
Our Code of Ethics and Conduct applies
to all of our directors, officers and employees as well as all directors, officers and employees of our Manager involved in the management of the
Company and its businesses. Our Code of Ethics and Conduct is posted on the Governance page of our website, www.macquarie.com/mic. You may request a
copy of our Code of Ethics and Conduct by contacting Investor Relations at 125 West 55th
Street, New York, NY 10019 ((212) 231-1000). We will post any amendment to the Code of Ethics and Conduct, and any waivers that are required to be
disclosed by the rules of either the SEC or the NYSE, on our website.
ITEM 11. EXECUTIVE COMPENSATION
The information required by this Item
11 is included under the captions “Director Compensation,” “Compensation Discussion and Analysis,” “Executive
Compensation,” “Governance Information” and “Compensation Committee Report” in our proxy statement for our 2011 annual meeting
of shareholders and is incorporated herein by reference.
ITEM 12. SECURITY OWNERSHIP OF CERTAIN BENEFICIAL OWNERS AND
MANAGEMENT AND RELATED STOCKHOLDER MATTERS
Securities Authorized for Issuance Under Equity Compensation
Plans
The table below sets forth information
with respect to LLC interests authorized for issuance as of December 31, 2010:
| Plan Category |
Number of Securities to Be Issued Upon Exercise of Outstanding Options, Warrants and Rights (a) |
Weighted-Average Exercise Price of Outstanding Options, Warrants and Rights (b) |
Number of Securities Remaining Available for Future Issuance Under Equity Compensation Plans (Excluding Securities Under Column (a)) (c) |
|||||||||||
|---|---|---|---|---|---|---|---|---|---|---|---|---|---|---|
Equity
compensation plans approved by securityholders(1) |
31,989 | $ | — | (1 | ) | |||||||||
Equity
compensation plans not approved by securityholders |
— | — | — | |||||||||||
Total
|
31,989 | $ | — | (1 | ) | |||||||||
153
(1) |
Information represents number of LLC interests issuable upon the vesting of director stock units pursuant to our independent directors’ equity plan, which was approved and became effective in December 2004. Under the plan, each independent director elected at our annual meeting of shareholders is entitled to receive a number of director stock units equal to $150,000 divided by the average closing sale price of the stock during the 10-day period immediately preceding our annual meeting. The units vest on the day prior to the following year’s annual meeting. We granted 10,663 restricted stock units to each of our independent directors elected at our 2010 annual shareholders’ meeting based on the average closing price per share over a 10 trading day period of $14.07. We have 474,624 LLC interests reserved for future issuance under the plan. |
The remaining information required by
this Item 12 is included under the caption “Share Ownership of Directors, Executive Officers and Principal Shareholders” in our proxy
statement for our 2011 annual meeting of shareholders and is incorporated herein by reference.
ITEM 13. CERTAIN RELATIONSHIPS AND RELATED
TRANSACTIONS
The information required by this Item
13 is included under the caption “Certain Relationships and Related Party Transactions” in our proxy statement for our 2011 annual meeting of
shareholders and is incorporated herein by reference.
ITEM 14. PRINCIPAL ACCOUNTANT FEES AND
SERVICES
The information required by this Item
14 is included under the caption “Ratification of Selection of Independent Auditor” in our proxy statement for our 2011 annual meeting of
shareholders and is incorporated herein by reference.
PART IV
ITEM 15. EXHIBITS, FINANCIAL STATEMENT
SCHEDULES
Financial Statements and Schedules
The consolidated financial statements
in Part II, Item 8, and schedule listed in the accompanying exhibit index are filed as part of this report.
Exhibits
The exhibits listed on the accompanying
exhibit index are filed as a part of this report.
154
SIGNATURES
Pursuant to the requirements of Section
13 or 15(d) of the Securities Exchange Act of 1934, Macquarie Infrastructure Company LLC has duly caused this report to be signed on its behalf by the
undersigned, thereunto duly authorized, on February 23, 2011.
MACQUARIE INFRASTRUCTURE COMPANY
LLC
(Registrant)
(Registrant)
By: |
/s/ James Hooke Chief Executive Officer |
We, the undersigned directors and
executive officers of Macquarie Infrastructure Company LLC, hereby severally constitute James Hooke and Todd Weintraub, and each of them singly, our
true and lawful attorneys with full power to them and each of them to sign for us, and in our names in the capacities indicated below, any and all
amendments to the Annual Report on Form 10-K filed with the Securities and Exchange Commission, hereby ratifying and confirming our signatures as they
may be signed by our said attorneys to any and all amendments to said Annual Report on Form 10-K.
Pursuant to the requirements of the
Securities Exchange Act of 1934, this report has been signed below by the following persons on behalf of Macquarie Infrastructure Company LLC and in
the capacities indicated on the 23rd day of February 2011.
| Signature |
Title |
|||||
|---|---|---|---|---|---|---|
/s/ James
Hooke James Hooke |
Chief Executive
Officer (Principal Executive Officer) |
|||||
/s/ Todd
Weintraub Todd Weintraub |
Chief Financial
Officer (Principal Financial Officer and Principal Accounting Officer) |
|||||
/s/ John
Roberts John Roberts |
Chairman of the
Board of Directors |
|||||
/s/ Norman H.
Brown, Jr. Norman H. Brown, Jr. |
Director |
|||||
/s/ George W.
Carmany III George W. Carmany III |
Director |
|||||
/s/ William H.
Webb William H. Webb |
Director |
|||||
155
EXHIBIT INDEX
2.1 |
Asset Purchase
Agreement, dated as of April 29, 2010, among PCAA Parent, LLC, its subsidiaries listed on the signature pages thereto and Commercial Finance Services
2907 Inc. (incorporated by reference to Exhibit 2.1 of the Registrant’s June 30, 2010 Quarterly Report on Form-10Q) |
|||||
2.2 |
Purchase
Agreement by and among Macquarie Infrastructure Company Inc., John Hancock Life Insurance Company, and John Hancock Life Insurance Company (U.S.A.),
dated as of November 20, 2009 (the “Thermal Chicago Agreement”) (incorporated by reference to Exhibit 2.2 of the Registrant’s 2009
Annual Report on Form-10K) |
|||||
2.3 |
Amendment to
Purchase Agreement, dated as of December 21, 2009, regarding the Thermal Chicago Agreement (incorporated by reference to Exhibit 2.3 of the
Registrant’s 2009 Annual Report on Form-10K) |
|||||
3.1 |
Third Amended and
Restated Operating Agreement of Macquarie Infrastructure Company LLC (incorporated by reference to Exhibit 3.1 of the Registrant’s Current Report
on Form 8-K filed with the SEC on June 22, 2007 (the “June 22, 2007 8-K”)) |
|||||
3.2 |
Amended and
Restated Certificate of Formation of Macquarie Infrastructure Assets LLC (incorporated by reference to Exhibit 3.8 of Amendment No. 2 to the
Registrant’s Registration Statement on Form S-1 (Registration No. 333-116244) (“Amendment No. 2”) |
|||||
4.1 |
Specimen
certificate evidencing LLC interests of Macquarie Infrastructure Company LLC (incorporated by reference to Exhibit 4.1 of the Registrant’s 2009
Annual Report on Form-10K) |
|||||
10.1 |
Amended and
Restated Management Services Agreement, dated as of June 22, 2007, among Macquarie Infrastructure Company LLC, Macquarie Infrastructure Company Inc.,
Macquarie Yorkshire LLC, South East Water LLC, Communications Infrastructure LLC and Macquarie Infrastructure Management (USA) Inc. (incorporated by
reference to Exhibit 10.1 of the June 22, 2007 8-K) |
|||||
10.2 |
Amendment No. 1
to the Amended and Restated Management Services Agreement, dated as of February 7, 2008, among Macquarie Infrastructure Company LLC, Macquarie
Infrastructure Company Inc., Macquarie Yorkshire LLC, South East Water LLC, Communications Infrastructure LLC and Macquarie Infrastructure Management
(USA) Inc. (incorporated by reference to Exhibit 10.2 to the Registrant’s Annual Report on Form 10-K for the year ended December 31, 2007 (the
“2007 Annual Report”)) |
|||||
10.3 |
Registration
Rights Agreement among Macquarie Infrastructure Company Trust, Macquarie Infrastructure Company LLC and Macquarie Infrastructure Management (USA) Inc.,
dated as of December 21, 2004 (incorporated by reference to Exhibit 99.4 of the Registrant’s Current Report on Form 8-K, filed with the SEC on
December 27, 2004) |
|||||
10.4 |
Macquarie
Infrastructure Company LLC — Independent Directors Equity Plan (incorporated by reference to Exhibit 10.1 to the Registrant’s Quarterly
Report on Form 10-Q for the quarter ended September 30, 2008) |
|||||
10.5 |
Second Amended
and Restated Credit Agreement, dated as of February 13, 2008, among Macquarie Infrastructure Company Inc., Macquarie Infrastructure Company LLC, the
Lenders (as defined therein), the Issuers (as defined therein) and Citicorp North America, Inc., as administrative agent (incorporated by reference to
Exhibit 10.5 to the Registrant’s 2007 Annual Report) |
|||||
10.6 |
Loan Agreement,
dated as of September 1, 2006 between Parking Company of America Airports, LLC, Parking Company of America Airports Phoenix, LLC, PCAA SP, LLC and PCA
Airports, Ltd., as borrowers, and Capmark Finance Inc., as lender (incorporated by reference to Exhibit 10.1 of the Registrant’s Current Report on
Form 8-K filed with the SEC on September 7, 2006) |
|||||
156
10.7 |
District Cooling
System Use Agreement, dated as of October 1, 1994, between the City of Chicago, Illinois and MDE Thermal Technologies, Inc., as amended on June 1,
1995, July 15, 1995, February 1, 1996, April 1, 1996, October 1, 1996, November 7, 1996, January 15, 1997, May 1, 1997, August 1, 1997, October 1,
1997, March 12, 1998, June 1, 1998, October 8, 1998, April 21, 1999, March 1, 2000, March 15, 2000, June 1, 2000, August 1, 2001, November 1, 2001,
June 1, 2002, and June 30, 2004 (incorporated by reference to Exhibit 10.25 of Amendment No. 2) |
|||||
10.8 |
Twenty-Third
Amendment to the District Cooling System Use Agreement, dated as of November 1, 2005, by and between the City of Chicago and Thermal Chicago
Corporation (incorporated by reference to Exhibit 10.5 to the Registrant’s Quarterly Report on Form 10-Q for the quarter ended June 30, 2006 (the
“June 2006 Quarterly Report”)) |
|||||
10.9 |
Twenty-Fourth
Amendment to District Cooling System Use Agreement, dated as of November 1, 2006, by and between the City of Chicago, Illinois and MDE Thermal
Technologies, Inc. (incorporated by reference to Exhibit 10.3 to the Registrant’s Quarterly Report on Form 10-Q for the quarter ended March 31,
2007 (the “March 2007 Quarterly Report”)) |
|||||
10.10 |
Twenty-Fifth
Amendment to District Cooling System Use Agreement, dated as of October 1, 2008, by and between the City of Chicago, Illinois and Thermal Chicago
Corporation (incorporated by reference to Exhibit 10.16 to Registrant’s Annual Report on Form 10-K for the year ended December 31, 2009 (the
“2009 10-K Report”)) |
|||||
10.11 |
Loan Agreement,
dated as of September 21, 2007, among Macquarie District Energy, Inc., the Lenders defined therein, Dresdner Bank AG New York Branch, as administrative
agent and LaSalle Bank National Association, as issuing bank (incorporated by reference to Exhibit 10.1 to the Registrant’s Current Report on Form
8-K filed with the SEC on September 27, 2007). |
|||||
10.12 |
Amendment Number
One to Loan Agreement, dated as of December 21, 2007, among Macquarie District Energy, Inc., the several banks and other financial institutions
signatories hereto, LaSalle Bank National Association, as Issuing Bank and Dresdner Bank AG New York Branch, as Administrative Agent (incorporated by
reference to Exhibit 10.11 to the Registrant’s 2007 Annual Report) |
|||||
10.13 |
Amendment Number
Two to Loan Agreement, dated as of February 22, 2008, among Macquarie District Energy, Inc., the several banks and other financial institutions
signatories thereto; LaSalle Bank National Association, as Issuing Bank and Dresdner Bank AG New York Branch, as Administrative Agent (incorporated by
reference to Exhibit 10.12 to the Registrant’s 2007 Annual Report) |
|||||
10.14 |
Shareholder’s Agreement, dated April 14, 2006, between Macquarie Terminal Holdings LLC, IMTT Holdings Inc., the Current Shareholders and
the Current Beneficial Owners named therein (incorporated by reference to Exhibit 10.1 of the Registrant’s Current Report on Form 8-K, filed with
the SEC on April 17, 2006) |
|||||
10.15 |
Letter Agreement,
dated January 23, 2007, between Macquarie Terminal Holdings LLC, IMTT Holdings Inc., the Current Shareholders and the Current Beneficial Owners named
therein (incorporated by reference to Exhibit 10.10 to the Registrant’s 2006 Annual Report) |
|||||
10.16 |
Letter Agreement
entered into as of June 20, 2007 among IMTT Holdings Inc. (IMTT Holdings), Macquarie Terminal Holdings LLC and the Current Beneficial Shareholders of
IMTT Holdings, amending the Shareholders Agreement dated April 14, 2006 (as amended) between IMTT Holdings and the Shareholders thereof (incorporated
by reference to Exhibit 10.5 to the June 2007 Quarterly Report) |
|||||
10.17 |
Letter Agreement,
dated as of July 30, 2007, among IMTT Holdings Inc. (IMTT), Macquarie Terminal Holdings LLC and the other current beneficial shareholders of IMTT
amending the Shareholders Agreement dated April 14, 2006 (as amended) between the same parties (incorporated by reference to Exhibit 10.6 to the June
2007 Quarterly Report) |
|||||
10.18 |
Loan Agreement,
dated as of September 27, 2007, among Atlantic Aviation FBO Inc., the Lenders, as defined therein, and Depfa Bank plc, as Administrative Agent, and
Amendments No. 1 and No. 2 thereto (incorporated by reference to Exhibit 10.1 of the September 2007 Quarterly Report) |
|||||
157
10.19 |
Waiver and
Amendment Number Three to Loan Agreement, dated as of November 30, 2007, among Atlantic Aviation FBO Inc., the several banks and other financial
institutions signatories thereto and Depfa Bank plc, as Administrative Agent (incorporated by reference to Exhibit 10.19 to the Registrant’s 2007
Annual Report) |
|||||
10.20 |
Waiver and
Amendment Number Four to Loan Agreement, dated as of December 27, 2007, among Atlantic Aviation FBO INC. and the several banks and other financial
institutions signatories thereto (incorporated by reference to Exhibit 10.20 to the Registrant’s 2007 Annual Report) |
|||||
10.21 |
Consent and
Amendment Number Five to Loan Agreement, dated as of January 31, 2008, among Atlantic Aviation FBO INC., Atlantic Aviation FBO Holdings LLC (formerly
known as Macquarie FBO Holdings LLC) and the several banks and other financial institutions signatories thereto (incorporated by reference to Exhibit
10.21 to the Registrant’s 2007 Annual Report). |
|||||
10.22 |
Amendment Number
Six to Loan Agreement, dated as of February 25, 2009, among Atlantic Aviation FBO Inc and the bank or banks and other financial institutions
signatories thereto (incorporated by reference to Exhibit 10.29 to the 2009 10-K Report) |
|||||
10.23 |
Amended and
Restated Loan Agreement, dated as of June 7, 2006, among HGC Holdings LLC, Macquarie Gas Holdings LLC, the Lenders named herein and Dresdner Bank AG
London Branch (incorporated by reference to Exhibit 10.1 of the Registrant’s Current Report on Form 8-K, filed with the SEC on June 12,
2006) |
|||||
10.24 |
Amended and
Restated Loan Agreement, dated as of June 7, 2006, among The Gas Company LLC, Macquarie Gas Holdings LLC, the Lenders defined therein and Dresdner Bank
AG London Branch (incorporated by reference to Exhibit 10.2 of the Registrant’s Current Report on Form 8-K, filed with the SEC on June 12,
2006) |
|||||
10.25 |
Letter Amendment,
dated August 18, 2006, amending the Amended and Restated Loan Agreement dated as of June 7, 2006, among HGC Holdings LLC, Macquarie Gas Holdings LLC,
the Lenders named herein and Dresdner Bank AG London Branch and the Amended and Restated Loan Agreement, dated as of June 7, 2006, among The Gas
Company LLC, Macquarie Gas Holdings LLC, the Lenders defined therein and Dresdner Bank AG London Branch (incorporated by reference to Exhibit 10.1 of
the Registrant’s Quarterly Report on Form 10-Q for the quarter ended June 30, 2008 (the “June 2008 Quarterly Report”)) |
|||||
10.26 |
Amendment Number
Two to Amended and Restated Loan Agreement, dated as of July 16, 2008, among The Gas Company, LLC, Macquarie Gas Holdings LLC, the several banks and
other financial institutions signatories hereto and Dresdner Bank AG Niederlassung Luxemburg (successor administrative agent to Dresdner Bank AG London
Branch) (incorporated by reference to Exhibit 10.2 of the June 2008 Quarterly Report) |
|||||
10.27* |
Loan Agreement,
dated as of December 1, 2010 between Louisiana Public Facilities Authority, as issuer, IMTT Finco, LLC., and Wells Fargo Bank National Association, as
trustee |
|||||
10.28* |
Loan Agreement,
dated as of November 1, 2010 between Louisiana Public Facilities Authority, as issuer, IMTT Finco, LLC., and Wells Fargo Bank National Association, as
trustee |
|||||
10.29 |
Loan Agreement,
dated as of August 1, 2010 between Louisiana Public Facilities Authority, as issuer, IMTT Finco, LLC., and US Bank National Association, as trustee
(incorporated by reference to Exhibit 10.1 of the Registrant’s Current Report on Form 10-Q for the quarter ended September 30,
2010) |
|||||
158
10.30 |
Second Amendment
to Revolving Credit Agreement, dated as of June 18, 2010, by and among International-Matex Tank Terminals and IMTT-Bayonne as US Borrowers, IMTT-QUEBEC
INC. IMTT and IMTT-NTL, LTD., as Canadian Borrowers, the several banks and other financial institutions, party and hereto, as Lenders, SunTrust Bank,
in its capacity as administrative agent for the Lenders, the US issuing bank, as swingline lender, and Royal Bank of Canada, as Canadian funding agent
for the Canadian Lenders and as the Canadian issuing bank and the Amended and Restated Revolving Credit Agreement, dated June 18, 2010, among the
several banks and other financial institutions party thereto, Suntrust Robinson Humphrey, Inc. and Regions Capital Markets, as Joint Lead Arrangers and
the U.S. Borrowers and Canadian Borrowers (incorporated by reference to Exhibit 10.1 of the Registrant’s Current Report on Form 10-Q for the
quarter ended June 30, 2010) |
|||||
21.1* |
Subsidiaries of
the Registrant |
|||||
23.1* |
Consent of KPMG
LLP |
|||||
23.2* |
Consent of KPMG
LLP (IMTT) |
|||||
24.1* |
Powers of
Attorney (included in signature pages) |
|||||
31.1* |
Rule
13a-14(a)/15d-14(a) Certification of the Chief Executive Officer |
|||||
31.2* |
Rule
13a-14(a)/15d-14(a) Certification of the Chief Financial Officer |
|||||
32.1** |
Section 1350
Certification of Chief Executive Officer |
|||||
32.2** |
Section 1350
Certification of Chief Financial Officer |
|||||
99.1* |
Consolidated
Financial Statements for IMTT Holdings Inc., for the Years Ended December 31, 2010 and December 31, 2009 |
|||||
* |
Filed herewith. |
** |
A signed original of this written statement required by Section 906 has been provided to Macquarie Infrastructure Company LLC. and will be retained by Macquarie Infrastructure Company LLC. and furnished to the Securities and Exchange Commission or its staff upon request. |
159