Attached files
| file | filename |
|---|---|
| EX-99.1 - EX-99.1 - SUPERMEDIA INC. | a11-6462_1ex99d1.htm |
| 8-K - CURRENT REPORT OF MATERIAL EVENTS OR CORPORATE CHANGES - SUPERMEDIA INC. | a11-6462_18k.htm |
Exhibit 99.2
|
|
Q4 2010 Earnings Presentation February 23, 2011 Peter McDonald, CEO Dee Jones, CFO |
|
|
Safe Harbor Statement Certain statements included in this presentation constitute forward-looking statements within the meaning of the Private Securities Litigation Reform Act of 1995 and the federal securities laws. Statements that include the words “may,” “will,” “could,” “should,” “would,” “believe,” “anticipate,” “forecast,” “estimate,” “expect,” “preliminary,” “intend,” “plan,” “project,” “outlook” and similar statements of a future or forward-looking nature identify forward-looking statements. You should not place undue reliance on these statements. These forward-looking statements include statements that reflect the current views of our senior management with respect to our financial performance and future events with respect to our business and industry in general. Forward-looking statements address matters that involve risks and uncertainties. Accordingly, there are or will be important factors that could cause our actual results to differ materially from those indicated in these statements. We believe that these factors include, but are not limited to, the risks related to the following: the inability to provide assurance for the long-term continued viability of our business reduced advertising spending and contract cancellations by our clients, which drives reduced revenue; declining use of print yellow pages directories by consumers; competition from other yellow pages directory publishers and other traditional and new media and our ability to anticipate or respond to changes in technology and user preferences; changes in our operating performance; our post-restructuring financial condition, financing requirements and cash flow; limitations on our operating and strategic flexibility and the ability to operate our business, finance our capital needs or expand business strategies under the terms of our debt agreements; failure to comply with the financial covenants and other restrictive covenants in our debt agreements; limited access to capital markets and increased borrowing costs resulting from our leveraged capital structure and debt ratings; our ability to resolve any remaining bankruptcy claims; changes in the availability and cost of paper and other raw materials used to print our directories and our reliance on third-party providers for printing, publishing and distribution services; credit risk associated with our reliance on small- and medium-sized businesses as clients; our ability to attract and retain qualified key personnel; our ability to maintain good relations with our unionized employees; changes in labor, business, political and economic conditions; changes in governmental regulations and policies and actions of regulatory bodies; and the outcome of pending or future litigation and other claims. The foregoing factors should not be construed as exhaustive and should be read together with the other cautionary statements included in this and other reports we file with the Securities and Exchange Commission, including the information in “Item 1A. Risk Factors” in Part I of our Annual Report on Form 10-K for the year ended December 31, 2010. If one or more events related to these or other risks or uncertainties materialize, or if our underlying assumptions prove to be incorrect, actual results may differ materially from what we anticipate. All forward-looking statements included in this report are expressly qualified in their entirety by these cautionary statements. The forward-looking statements speak only as of the date made and, other than as required by law, we undertake no obligation to publicly update or revise any forward-looking statements, whether as a result of new information, future events or otherwise. |
|
|
Peter McDonald, CEO |
|
|
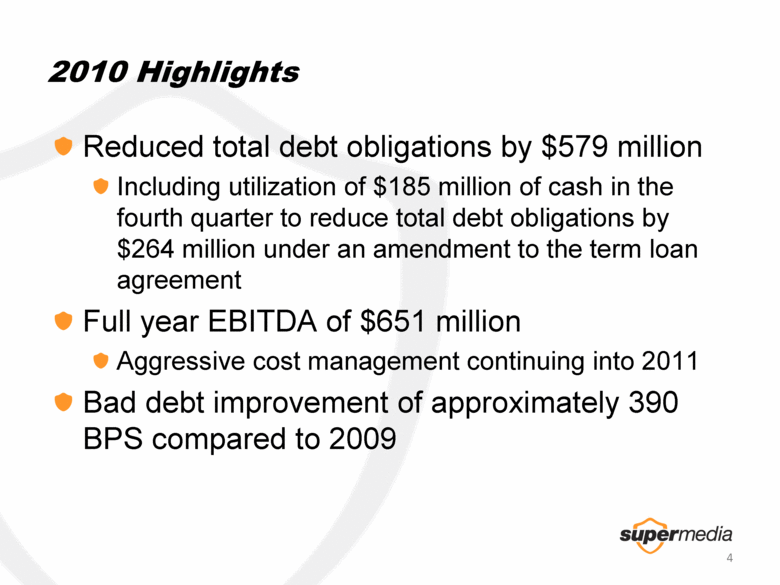
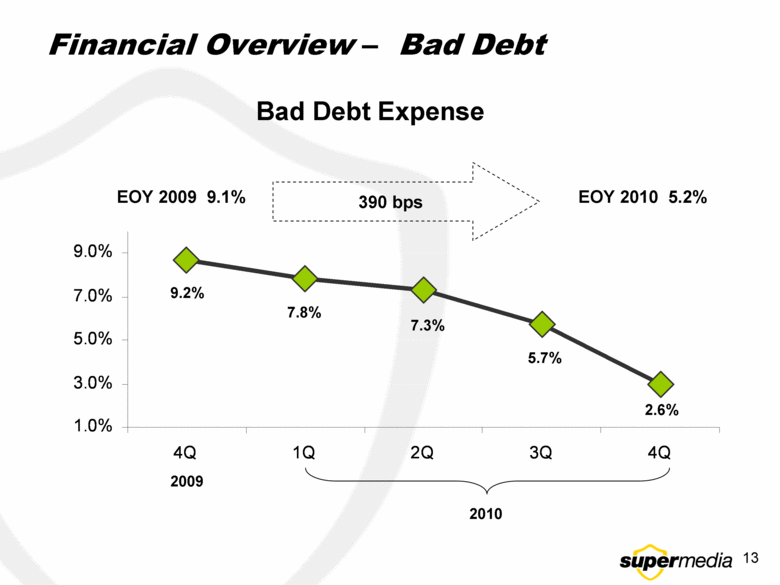
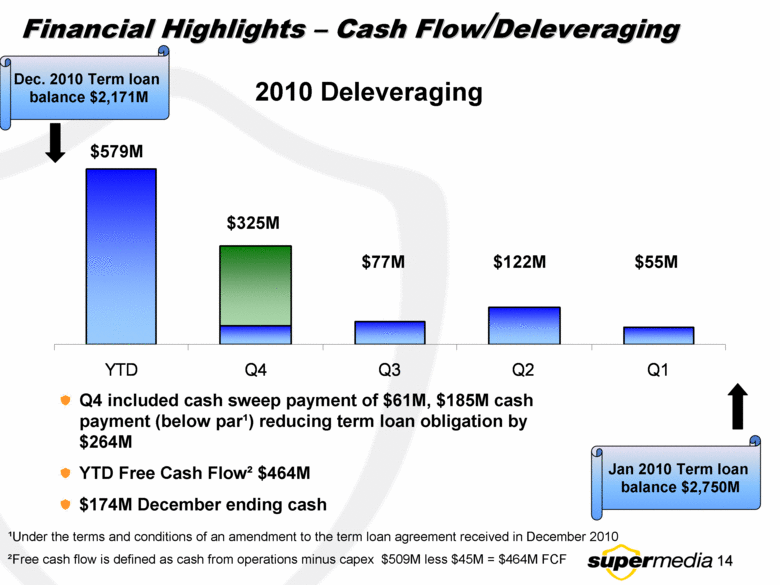
2010 Highlights Reduced total debt obligations by $579 million Including utilization of $185 million of cash in the fourth quarter to reduce total debt obligations by $264 million under an amendment to the term loan agreement Full year EBITDA of $651 million Aggressive cost management continuing into 2011 Bad debt improvement of approximately 390 BPS compared to 2009 4 |
|
|
Developing the Approach New sales leaders Long track-record of driving results Met with key resources to assess company Advertisers Media consultants Sales management 5 |
|
|
The Approach Selling the customer the products that produce the best results for their business Customer needs vary on location and type of business Areas of change Sales training and compensation Operational and marketing 6 |
|
|
Messages to All Employees Aligning our cost structure around our current customer base and needs Paying down debt, stabilizing EBITDA Robust local advertising products producing best results for customer Simplifying what we do and how we do it Adjusting sales compensation training and our approach to marketing Support and reflect customer’s needs Support sales and needs in the marketplace 7 |
|
|
Financials – Dee Jones, EVP and CFO 8 |
|
|
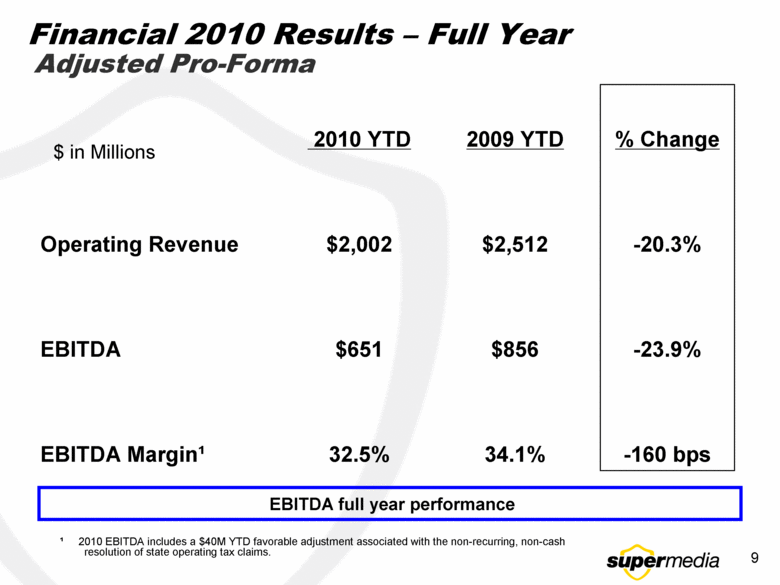
Financial 2010 Results – Full Year Adjusted Pro-Forma $ in Millions ¹ 2010 EBITDA includes a $40M YTD favorable adjustment associated with the non-recurring, non-cash resolution of state operating tax claims. -160 bps 34.1% 32.5% EBITDA Margin¹ -23.9% $856 $651 EBITDA -20.3% $2,512 $2,002 Operating Revenue % Change 2009 YTD 2010 YTD EBITDA full year performance 9 |
|
|
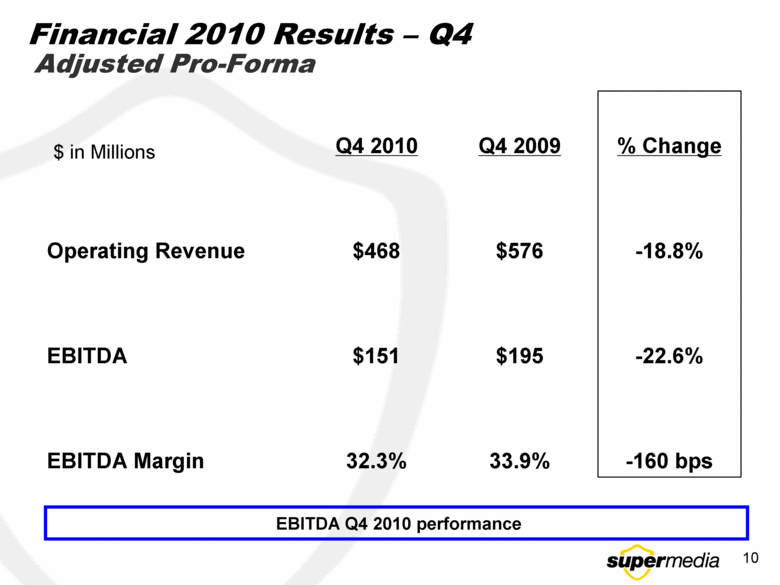
Financial 2010 Results – Q4 EBITDA Q4 2010 performance Adjusted Pro-Forma $ in Millions -160 bps 33.9% 32.3% EBITDA Margin -22.6% $195 $151 EBITDA -18.8% $576 $468 Operating Revenue % Change Q4 2009 Q4 2010 10 |
|
|
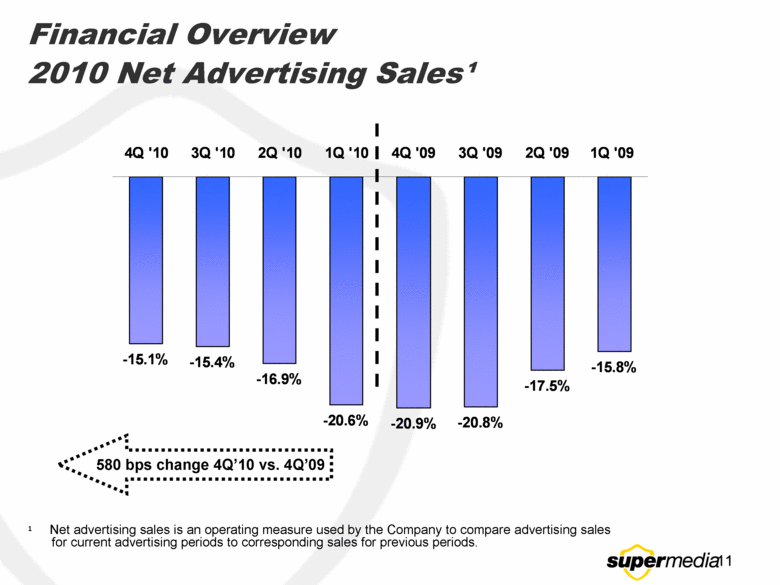
Financial Overview ¹ Net advertising sales is an operating measure used by the Company to compare advertising sales for current advertising periods to corresponding sales for previous periods. 2010 Net Advertising Sales¹ 580 bps change 4Q’10 vs. 4Q’09 -15.8% -17.5% -20.8% -20.9% -20.6% -16.9% -15.4% -15.1% 1Q '09 2Q '09 3Q '09 4Q '09 1Q '10 2Q '10 3Q '10 4Q '10 11 |
|
|
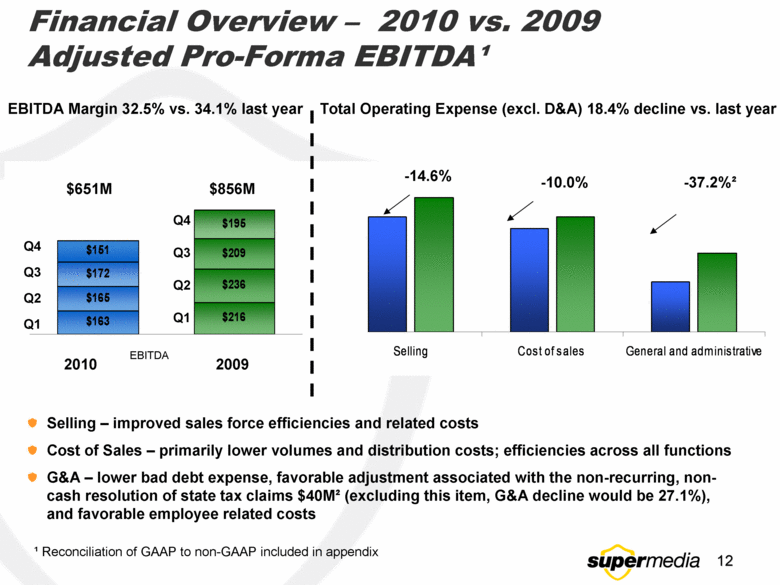
2010 2009 $651M $856M -14.6% -10.0% EBITDA Margin 32.5% vs. 34.1% last year Financial Overview – 2010 vs. 2009 Adjusted Pro-Forma EBITDA¹ ¹ Reconciliation of GAAP to non-GAAP included in appendix Selling – improved sales force efficiencies and related costs Cost of Sales – primarily lower volumes and distribution costs; efficiencies across all functions G&A – lower bad debt expense, favorable adjustment associated with the non-recurring, non-cash resolution of state tax claims $40M² (excluding this item, G&A decline would be 27.1%), and favorable employee related costs Total Operating Expense (excl. D&A) 18.4% decline vs. last year -37.2%² EBITDA Q1 Q1 Q3 Q2 Q3 Q2 Q4 Q4 Selling Cost of sales General and administrative $163 $216 $165 $236 $209 $172 $195 $151 12 |
|
|
Financial Overview – Bad Debt 2009 2010 Bad Debt Expense 9.2% 5.7% EOY 2009 9.1% 390 bps 7.8% 7.3% 2.6% EOY 2010 5.2% 1.0% 3.0% 5.0% 7.0% 9.0% 4Q 1Q 2Q 3Q 4Q 13 |
|
|
Financial Highlights – Cash Flow/Deleveraging 2010 Deleveraging $55M Q4 included cash sweep payment of $61M, $185M cash payment (below par¹) reducing term loan obligation by $264M YTD Free Cash Flow² $464M $174M December ending cash $122M $77M Jan 2010 Term loan balance $2,750M Dec. 2010 Term loan balance $2,171M $579M ¹Under the terms and conditions of an amendment to the term loan agreement received in December 2010 ²Free cash flow is defined as cash from operations minus capex $509M less $45M = $464M FCF $325M YTD Q4 Q3 Q2 Q1 14 |
|
|
Questions and Answers 15 |
|
|
[LOGO] 16 |
|
|
Appendix 17 |
|
|
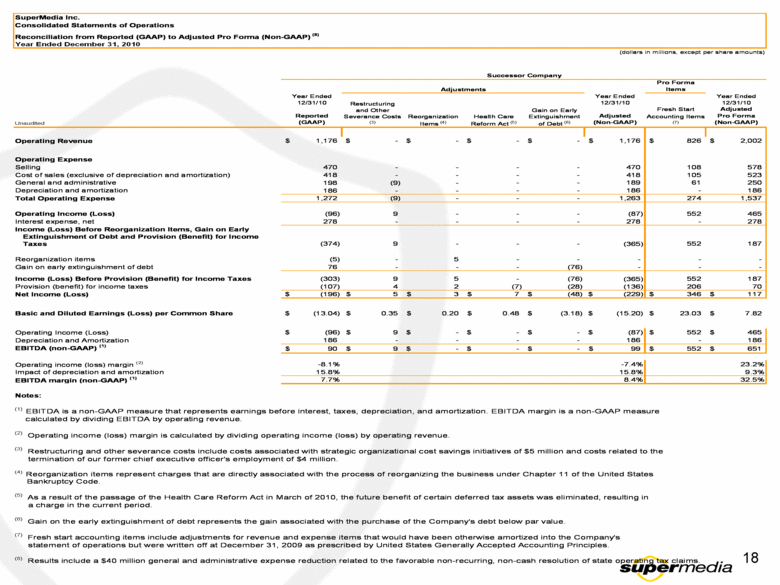
SuperMedia Inc. Consolidated Statements of Operations Reconciliation from Reported (GAAP) to Adjusted Pro Forma (Non-GAAP) (8) Year Ended December 31, 2010 (dollars in millions, except per share amounts) Pro Forma Items Year Ended 12/31/10 Year Ended 12/31/10 Year Ended 12/31/10 Unaudited Reported (GAAP) Adjusted (Non-GAAP) Adjusted Pro Forma (Non-GAAP) Operating Revenue 1,176 $ - $ - $ - $ - $ 1,176 $ 826 $ 2,002 $ Operating Expense Selling 470 - - - - 470 108 578 Cost of sales (exclusive of depreciation and amortization) 418 - - - - 418 105 523 General and administrative 198 (9) - - - 189 61 250 Depreciation and amortization 186 - - - - 186 - 186 Total Operating Expense 1,272 (9) - - - 1,263 274 1,537 Operating Income (Loss) (96) 9 - - - (87) 552 465 Interest expense, net 278 - - - - 278 - 278 (374) 9 - - - (365) 552 187 Reorganization items (5) - 5 - - - - - Gain on early extinguishment of debt 76 - - - (76) - - - (303) 9 5 - (76) (365) 552 187 Provision (benefit) for income taxes (107) 4 2 (7) (28) (136) 206 70 Net Income (Loss) (196) $ 5 $ 3 $ 7 $ (48) $ (229) $ 346 $ 117 $ Basic and Diluted Earnings (Loss) per Common Share (13.04) $ 0.35 $ 0.20 $ 0.48 $ (3.18) $ (15.20) $ 23.03 $ 7.82 $ Operating Income (Loss) (96) $ 9 $ - $ - $ - $ (87) $ 552 $ 465 $ Depreciation and Amortization 186 - - - - 186 - 186 EBITDA (non-GAAP) (1) 90 $ 9 $ - $ - $ - $ 99 $ 552 $ 651 $ Operating income (loss) margin (2) -8.1% -7.4% 23.2% Impact of depreciation and amortization 15.8% 15.8% 9.3% EBITDA margin (non-GAAP) (1) 7.7% 8.4% 32.5% Notes: (1) EBITDA is a non-GAAP measure that represents earnings before interest, taxes, depreciation, and amortization. EBITDA margin is a non-GAAP measure calculated by dividing EBITDA by operating revenue. (2) Operating income (loss) margin is calculated by dividing operating income (loss) by operating revenue. (3) Restructuring and other severance costs include costs associated with strategic organizational cost savings initiatives of $5 million and costs related to the termination of our former chief executive officer's employment of $4 million. (4) Reorganization items represent charges that are directly associated with the process of reorganizing the business under Chapter 11 of the United States Bankruptcy Code. (5) As a result of the passage of the Health Care Reform Act in March of 2010, the future benefit of certain deferred tax assets was eliminated, resulting in a charge in the current period. (6) Gain on the early extinguishment of debt represents the gain associated with the purchase of the Company's debt below par value. (7) Fresh start accounting items include adjustments for revenue and expense items that would have been otherwise amortized into the Company's statement of operations but were written off at December 31, 2009 as prescribed by United States Generally Accepted Accounting Principles. (8) Results include a $40 million general and administrative expense reduction related to the favorable non-recurring, non-cash resolution of state operating tax claims. Reorganization Items (4) Income (Loss) Before Provision (Benefit) for Income Taxes Income (Loss) Before Reorganization Items, Gain on Early Taxes Successor Company Fresh Start Accounting Items (7) Adjustments Extinguishment of Debt and Provision (Benefit) for Income Gain on Early Extinguishment of Debt (6) Restructuring and Other Severance Costs (3) Health Care Reform Act (5) 18 |
|
|
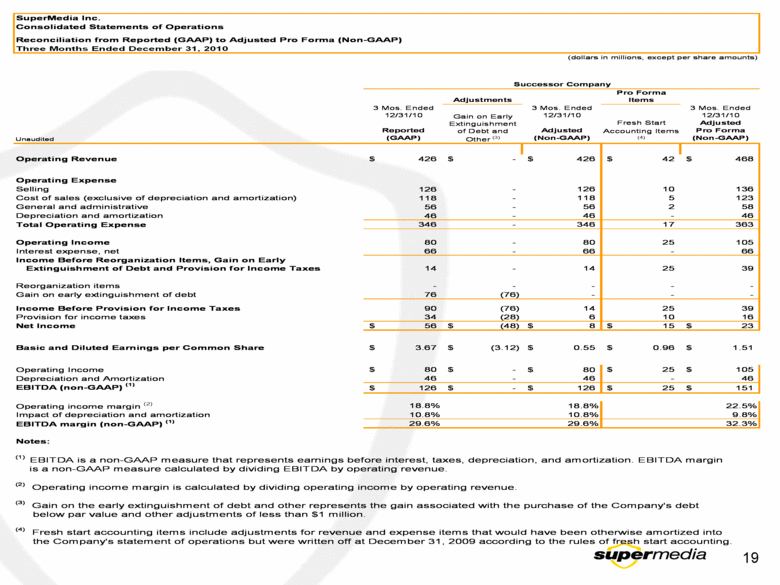
SuperMedia Inc. Consolidated Statements of Operations Reconciliation from Reported (GAAP) to Adjusted Pro Forma (Non-GAAP) Three Months Ended December 31, 2010 (dollars in millions, except per share amounts) Adjustments Pro Forma Items 3 Mos. Ended 12/31/10 3 Mos. Ended 12/31/10 3 Mos. Ended 12/31/10 Unaudited Reported (GAAP) Adjusted (Non-GAAP) Adjusted Pro Forma (Non-GAAP) Operating Revenue 426 $ - $ 426 $ 42 $ 468 $ Operating Expense Selling 126 - 126 10 136 Cost of sales (exclusive of depreciation and amortization) 118 - 118 5 123 General and administrative 56 - 56 2 58 Depreciation and amortization 46 - 46 - 46 Total Operating Expense 346 - 346 17 363 Operating Income 80 - 80 25 105 Interest expense, net 66 - 66 - 66 14 - 14 25 39 Reorganization items - - - - - Gain on early extinguishment of debt 76 (76) - - - 90 (76) 14 25 39 Provision for income taxes 34 (28) 6 10 16 Net Income 56 $ (48) $ 8 $ 15 $ 23 $ Basic and Diluted Earnings per Common Share 3.67 $ (3.12) $ 0.55 $ 0.96 $ 1.51 $ Operating Income 80 $ - $ 80 $ 25 $ 105 $ Depreciation and Amortization 46 - 46 - 46 EBITDA (non-GAAP) (1) 126 $ - $ 126 $ 25 $ 151 $ Operating income margin (2) 18.8% 18.8% 22.5% Impact of depreciation and amortization 10.8% 10.8% 9.8% EBITDA margin (non-GAAP) (1) 29.6% 29.6% 32.3% Notes: (1) EBITDA is a non-GAAP measure that represents earnings before interest, taxes, depreciation, and amortization. EBITDA margin is a non-GAAP measure calculated by dividing EBITDA by operating revenue. (2) Operating income margin is calculated by dividing operating income by operating revenue. (3) Gain on the early extinguishment of debt and other represents the gain associated with the purchase of the Company's debt below par value and other adjustments of less than $1 million. (4) Fresh start accounting items include adjustments for revenue and expense items that would have been otherwise amortized into the Company's statement of operations but were written off at December 31, 2009 according to the rules of fresh start accounting. Fresh Start Accounting Items (4) Successor Company Income Before Provision for Income Taxes Extinguishment of Debt and Provision for Income Taxes Gain on Early Extinguishment of Debt and Other (3) Income Before Reorganization Items, Gain on Early 19 |

