Attached files
| file | filename |
|---|---|
| 8-K - FORM 8-K - Fidelity National Information Services, Inc. | g26212e8vk.htm |
Exhibit
99.1

| R.W. Baird & Co. 2011 Business Solutions Conference February 24, 2011 |

| Forward-Looking Statements This presentation contains "forward-looking statements" within the meaning of the U.S. federal securities laws. Statements that are not historical facts, including statements about 2010 and 2011 adjusted revenue, organic revenue, earnings per share, margin expansion and cash flow, as well as other statements about our expectations, hopes, intentions, or strategies regarding the future, are forward-looking statements. These statements relate to future events and our future results, and involve a number of risks and uncertainties. Forward-looking statements are based on management's beliefs, as well as assumptions made by, and information currently available to, management. Any statements that refer to beliefs, expectations, projections or other characterizations of future events or circumstances and other statements that are not historical facts are forward-looking statements. Actual results, performance or achievement could differ materially from those contained in these forward-looking statements. The risks and uncertainties that forward-looking statements are subject to include without limitation: changes and conditions in general economic, business and political conditions, including the possibility of intensified international hostilities, acts of terrorism, and changes and conditions in either or both the United States and international lending, capital and financial markets; the effect of legislative initiatives or proposals, statutory changes, governmental or other applicable regulations and/or changes in industry requirements, including privacy regulations; the effects of our substantial leverage which may limit the funds available to make acquisitions and invest in our business; the risks of reduction in revenue from the elimination of existing and potential customers due to consolidation in or new laws or regulations affecting the banking, retail and financial services industries or due to financial failures or other setbacks suffered by firms in those industries; changes in the growth rates of the markets for core processing, card issuer, and transaction processing services; failures to adapt our services and products to changes in technology or in the marketplace; internal or external security breaches of our systems, including those relating to the theft of personal information and computer viruses affecting our software; the failure to achieve some or all of the benefits that we expect from acquisitions; our potential inability to find suitable acquisition candidates or finance such acquisitions, which depends upon the availability of adequate cash reserves from operations or of acceptable financing terms and the variability of our stock price, or difficulties in integrating past and future acquired technology or business' operations, services, clients and personnel; competitive pressures on product pricing and services including the ability to attract new, or retain existing, customers; an operational or natural disaster at one of our major operations centers; and other risks detailed in "Risk Factors" and other sections of the Company's Annual Report on Form 10-K for the fiscal year ended December 31, 2009 and other filings with the SEC. Other unknown or unpredictable factors also could have a material adverse effect on our business, financial condition, results of operations and prospects. Accordingly, readers should not place undue reliance on these forward-looking statements. These forward-looking statements are inherently subject to uncertainties, risks and changes in circumstances that are difficult to predict. Except as required by applicable law or regulation, we do not undertake (and expressly disclaim) any obligation and do not intend to publicly update or review any of these forward- looking statements, whether as a result of new information, future events or otherwise. 2 |

| Use of Non-GAAP Financial and Pro Forma Measures Generally Accepted Accounting Principles (GAAP) is the term used to refer to the standard framework of guidelines for financial accounting. GAAP includes the standards, conventions, and rules accountants follow in recording and summarizing transactions and in the preparation of financial statements. In addition to reporting financial results in accordance with GAAP, the company has provided non-GAAP financial measures, which it believes are useful to help investors better understand its financial performance, competitive position and prospects for the future. These non-GAAP measures include: Adjusted revenue Organic revenue Adjusted earnings before interest, taxes, depreciation and amortization (EBITDA) Adjusted net earnings Free cash flow These non-GAAP measures should be considered in context with the GAAP financial presentation and should not be considered in isolation or as a substitute for GAAP financial measures. Further, FIS' non-GAAP measures may be calculated differently from similarly titled measures of other companies. Additional information about these non-GAAP measures is provided in the appendix to this presentation, and reconciliations to the related GAAP measures are provided in the Investor Relations section of the FIS Web site, www.fisglobal.com. On October 1, 2009, FIS completed the acquisition of Metavante Technologies, Inc. The transaction was treated as a purchase and the results of Metavante are included in the consolidated results of FIS beginning October , 2009. For comparative purposes, in accordance with management's desire to improve the understanding of the Company's operating performance, the information provided in this presentation assumes the merger was completed on January 1, 2009 and combines Metavante's revenue and EBITDA with FIS' historical results on a pro forma basis. 1 |
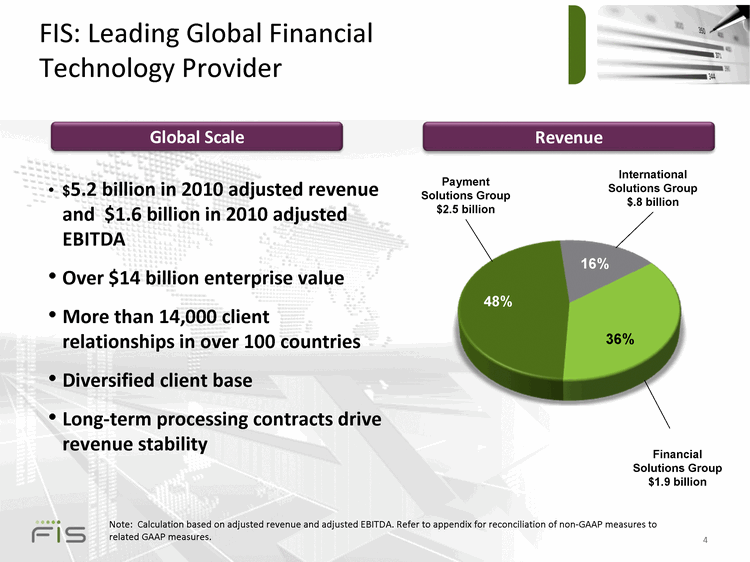
| FIS: Leading Global Financial Technology Provider 4 $5.2 billion in 2010 adjusted revenue and $1.6 billion in 2010 adjusted EBITDA Over $14 billion enterprise value More than 14,000 client relationships in over 100 countries Diversified client base Long-term processing contracts drive revenue stability International Solutions Group $.8 billion Financial Solutions Group $1.9 billion Payment Solutions Group $2.5 billion Global Scale Revenue 16% 48% 36% Note: Calculation based on adjusted revenue and adjusted EBITDA. Refer to appendix for reconciliation of non-GAAP measures to related GAAP measures. |

| Strategic Operating Centers FIS presence No FIS presence Established Global Presence Milwaukee, WI Little Rock, AR Jacksonville, FL Orlando, FL London Birmingham, England Munich, Germany Sao Paulo, Brazil Melbourne, Australia Mumbai, Bangalore, Chandigarh, Chennai, India Manila, Philippines St. Petersburg, FL Established operating centers in 27 countries $800+ million in revenue outside North America Over 15,000 employees outside the U.S. 5 |
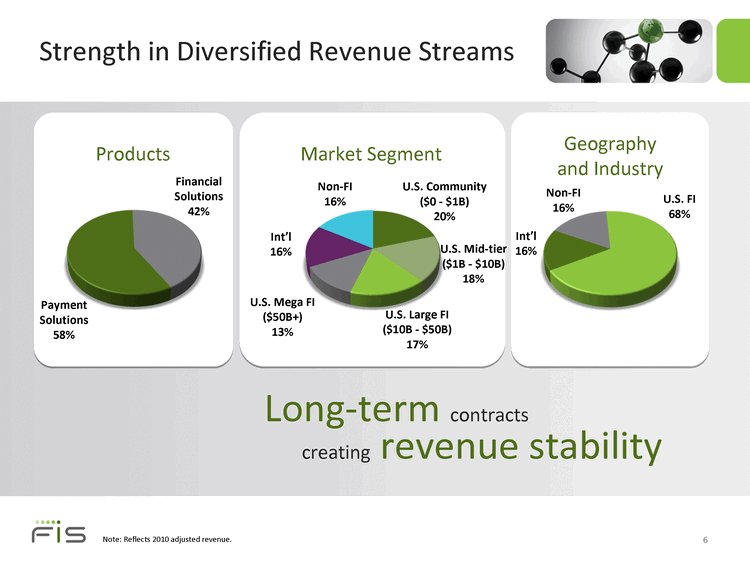
| Strength in Diversified Revenue Streams Long-term contracts creating revenue stability Market Segment Geography and Industry Products 2 Financial Solutions 42% Payment Solutions 58% U.S. FI 68% Non-FI 16% Int'l 16% U.S. Large FI ($10B - $50B) 17% U.S. Mega FI ($50B+) 13% Non-FI 16% U.S. Community ($0 - $1B) 20% U.S. Mid-tier ($1B - $10B) 18% Int’l 16% Note: Reflects 2010 adjusted revenue. |

| Stable Revenue Base Contractual revenue Account based Transaction based Monthly maintenance Consulting services Implementation services Software Equipment Termination fees Processing and Maintenance Professional Services Other Revenue driven predominantly by contractual processing and maintenance 7 |

| Financial Solutions Group $1.9 Billion 2010 Adjusted Revenue Deposit and Loan Account Processing Accounting and General Ledger Data Access and Integration Account Origination Lending Solutions Trust and Wealth Management Risk and Regulatory Compliance Branch Platforms Online Banking Mobile Banking Voice Response Core Processing Channel Solutions The only provider with core solutions tailored to financial institutions of every size and type Services Consulting Information Technology Outsourcing Business Process Outsourcing Infrastructure Outsourcing 36% 8 |
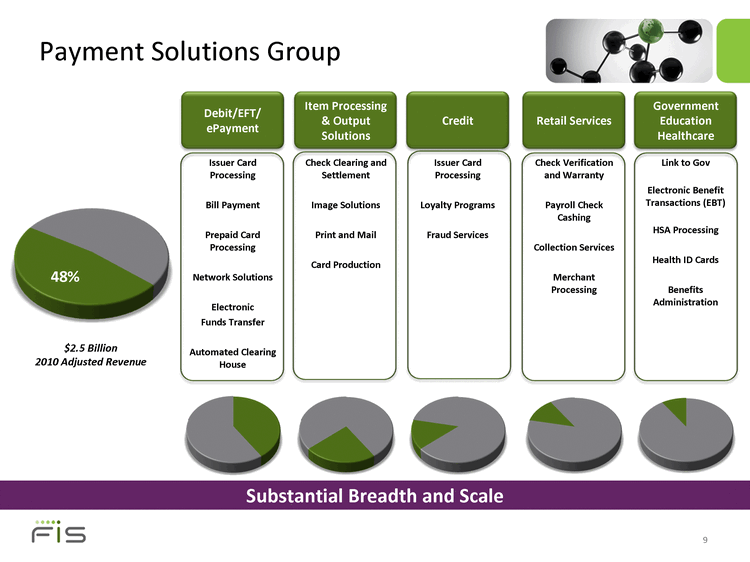
| Link to Gov Electronic Benefit Transactions (EBT) HSA Processing Health ID Cards Benefits Administration Substantial Breadth and Scale Payment Solutions Group Issuer Card Processing Bill Payment Prepaid Card Processing Network Solutions Electronic Funds Transfer Automated Clearing House Debit/EFT/ ePayment Issuer Card Processing Loyalty Programs Fraud Services Credit Check Verification and Warranty Payroll Check Cashing Collection Services Merchant Processing Retail Services Check Clearing and Settlement Image Solutions Print and Mail Card Production Item Processing & Output Solutions Government Education Healthcare $2.5 Billion 2010 Adjusted Revenue 48% 9 |

| International Solutions Group $0.8 Billion 2010 Adjusted Revenue Core Banking Payment Switch Credit Card Origination Core Banking Credit Card Payment Switch Prepaid Merchants Commercial Lending Latin America and Brazil 39% of Revenue EMEA 43% of Revenue Asia Pacific 18% of Revenue Core Banking Credit Card Payment Switch ATM (India) Commercial Lending Emerging Market Mature Market Emerging Market Significant Global Presence 16% 64% Payment Solutions 36% Core Solutions Payments Core Core Core Payments Payments Services 10 |

| Capco Company Highlights Leading global provider of integrated consulting, technology and transformation services 11 Dedicated solely to financial services Well regarded for thought leadership, deep domain expertise and client-centric approach Facilitates partnership between business and technology organizations Positions FIS to further expand footprint across large U.S. and global financial institutions Provides strategic extension of core and payment processing solutions |

| Financial Overview |

| Strong Execution in Challenging Environment ($ Billions, except per share data) Adjusted Revenue Adjusted EBITDA Adjusted EPS Consistent earnings growth Reflects FIS and Metavante pro forma 2008 and 2009 revenue and EBITDA. Refer to www.investor.fisglobal.com for reconciliation of GAAP to non-GAAP items. 3 +4.2% Reported +3.2% Organic +13.9% |
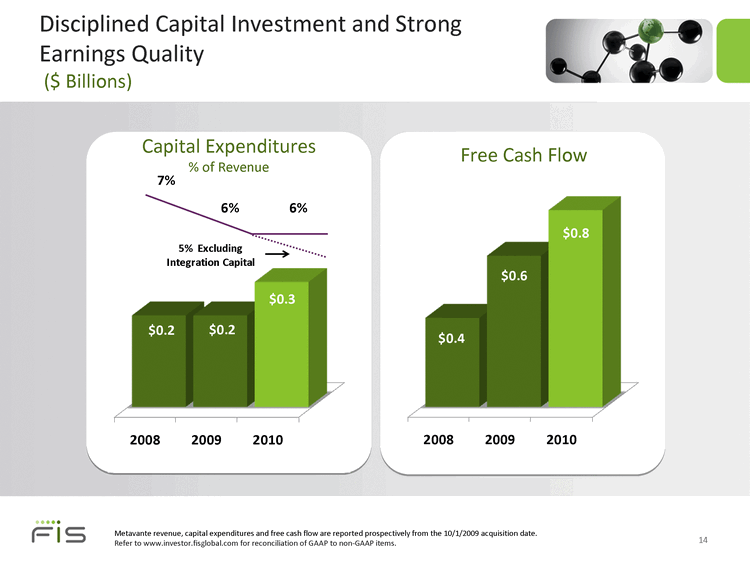
| Disciplined Capital Investment and Strong Earnings Quality ($ Billions) Metavante revenue, capital expenditures and free cash flow are reported prospectively from the 10/1/2009 acquisition date. Refer to www.investor.fisglobal.com for reconciliation of GAAP to non-GAAP items. Free Cash Flow 14 Capital Expenditures % of Revenue |

| Improving Trends Accelerating revenue growth Strong Earnings growth Revenue Growth 15 |

| Refer to www.investor.fisglobal.com for reconciliation of GAAP to non-GAAP items. 16 Solid Financial Performance ($ millions, except per share) Q4-2010 FY 2010 Adjusted revenue $1,397 $5,205 Growth 7.6% 4.2% Organic growth 6.1% 3.2% Adjusted EBITDA $445 1,628 Growth 14.4% 13.9% Margin 31.8% 31.3% Adjusted EPS from continuing operations $0.64 $2.02 Weighted average diluted shares 305.4 352.0 Adjusted free cash flow $222 $791 |

| 2011 Outlook Continued strong performance Revenue growth Reported +9% to 11% Organic +4% to 6% Adjusted EBITDA growth +7% to 9% Adjusted EPS(1) Growth $2.24 to $2.34 +11% to 16% Free cash flow conversion ~ 100% of adjusted earnings (1) Adjusted EPS exclude the after-tax impact of acquisition related amortization. Refer to www.investor.fisglobal.com for 2010 continuing operations data. 17 |
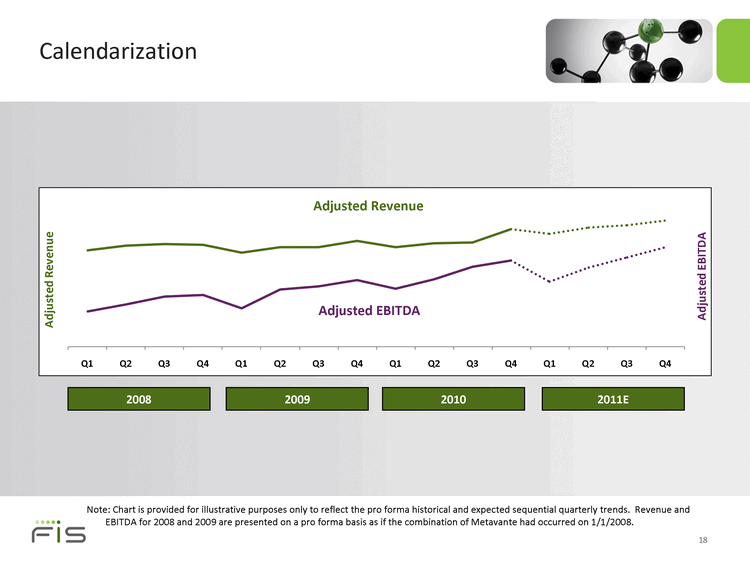
| 18 Calendarization 2009 2011E 2010 Adjusted Revenue Adjusted EBITDA 2008 Note: Chart is provided for illustrative purposes only to reflect the pro forma historical and expected sequential quarterly trends. Revenue and EBITDA for 2008 and 2009 are presented on a pro forma basis as if the combination of Metavante had occurred on 1/1/2008. |

| 19 Q1 2011 Outlook ($ millions, except per share) Adjusted Revenue $1,355 to $1,375 Adjusted EBITDA $370 to $380 Adjusted EPS $0.44 to $0.46 Range |

| 20 Financial Policy |

| Appendix |
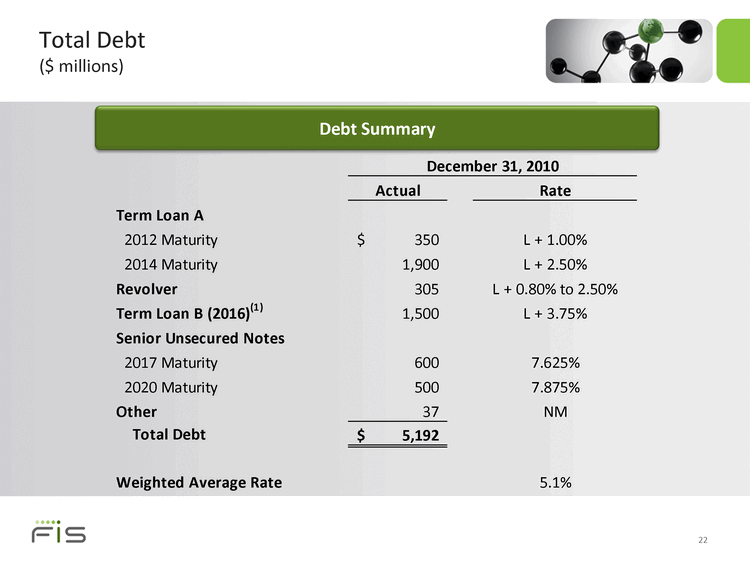
| 22 Total Debt ($ millions) Debt Summary |

| Revenue Composition by Segment 23 Financial Solutions Payment Solutions International Solutions Other 6% Processing and Maintenance 74% Professional Services 20% Processing and Maintenance 95% Other 3% Professional Services 2% Processing and Maintenance 83% Other 8% Professional Services 9% Revenue Model Number of accounts processed New account openings Software maintenance fees Project based fees License fees Revenue Model Transaction fees Project based fees License fees Revenue Model Number of accounts processed Software maintenance fees Transaction fees Project based fees License fees Note: Reflects 2010 adjusted revenue. |

| 24 2011 Assumptions ($ millions) Pre-tax acquisition related purchase amortization $240 to $250 After-tax(1) $150 to $160 Other depreciation and amortization $365 to $380 Interest expense, net $270 to $280 Effective tax rate 35% to 36% Average diluted shares ~310M Tax rate of 35% to 36% assumed for book purposes. Approximately 40% of purchase amortization is assumed to be deductible for tax purposes. |
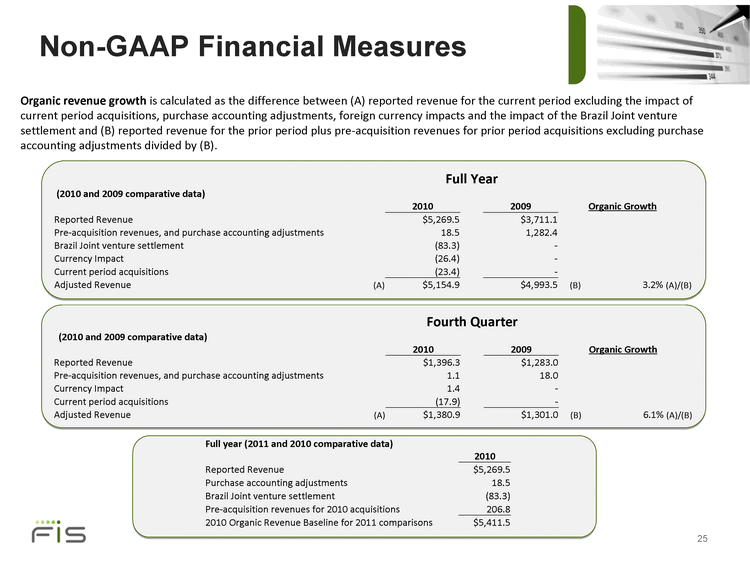
| 25 Full Year Full Year Full Year (2010 and 2009 comparative data) 2010 2009 Organic Growth Reported Revenue Reported Revenue $5,269.5 $3,711.1 Pre-acquisition revenues, and purchase accounting adjustments 18.5 1,282.4 Brazil Joint venture settlement (83.3) - Currency Impact Currency Impact (26.4) - Current period acquisitions Current period acquisitions (23.4) - Adjusted Revenue (A) $5,154.9 $4,993.5 (B) 3.2% (A)/(B) Full year (2011 and 2010 comparative data) 2010 Reported Revenue $5,269.5 Purchase accounting adjustments 18.5 Brazil Joint venture settlement (83.3) Pre-acquisition revenues for 2010 acquisitions 206.8 2010 Organic Revenue Baseline for 2011 comparisons $5,411.5 Fourth Quarter Fourth Quarter Fourth Quarter (2010 and 2009 comparative data) 2010 2009 Organic Growth Reported Revenue Reported Revenue $1,396.3 $1,283.0 Pre-acquisition revenues, and purchase accounting adjustments 1.1 18.0 Currency Impact Currency Impact 1.4 - Current period acquisitions Current period acquisitions (17.9) - Adjusted Revenue (A) $1,380.9 $1,301.0 (B) 6.1% (A)/(B) Non-GAAP Financial Measures Organic revenue growth is calculated as the difference between (A) reported revenue for the current period excluding the impact of current period acquisitions, purchase accounting adjustments, foreign currency impacts and the impact of the Brazil Joint venture settlement and (B) reported revenue for the prior period plus pre-acquisition revenues for prior period acquisitions excluding purchase accounting adjustments divided by (B). |

| Non-GAAP Financial Measures EBITDA is earnings from continuing operations before interest, taxes and depreciation and amortization. Adjusted EBITDA (2010 and 2009 comparative data) excludes the impact of merger and acquisition and integration expenses, accelerated stock compensation charges associated with merger and acquisition activity, costs associated with the 2010 recapitalization plan, settlement revenue and an impairment charge related to the card processing joint venture in Brazil, deferred revenue purchase accounting and certain other costs. Adjusted net earnings (2011 comparative data) exclude the after-tax impact of acquisition related amortization. Adjusted net earnings (2010 comparative data) exclude the after-tax impact of merger and acquisition and integration expenses, accelerated stock compensation charges associated with merger and acquisition activity, costs associated with the 2010 recapitalization plan, an impairment charge and settlement related to the card processing joint venture in Brazil, acquisition related amortization, deferred revenue purchase accounting and certain other costs. 26 |

| Non-GAAP Financial Measures Adjusted net earnings per share is equal to adjusted net earnings divided by the weighted average diluted shares outstanding. Adjusted free cash flow (2011 comparative data) is GAAP operating cash flow less capital expenditures. Adjusted free cash flow (2010 and 2009) is GAAP operating cash flow less capital expenditures, acquisition related cash items, cash items associated with the 2010 recapitalization plan and the settlement related to the card processing joint venture in Brazil in 2010. 27 |

| Thank you |
