FRANKLIN STREET PROPERTIES CORP /MA/ - FORM 8-K - EX-99.2 - SUPPLEMENTAL OPERATING AND FINANCIAL DATA - February 23, 2011
Attached files
Exhibit 99.2
Supplemental Operating and Financial Data
Fourth Quarter 2010
Franklin Street Properties Corp. ● 401 Edgewater Place ● Wakefield, MA 01880 ● (781) 557-1300
www.franklinstreetproperties.com
| |
 |
Table of Contents |
| |
Page |
|
|
Page |
| |
|
|
|
|
| Company Overview |
3-5 |
|
Tenant Analysis |
|
| |
|
|
20 Largest tenants with annualized rent and remaining term |
21-22 |
| Key Financial Data |
|
|
20 Largest Tenants, Industry Profile |
23 |
| Financial Highlights |
6 |
|
Lease Expirations by Square Feet |
24 |
| Management’s Key Operating Measures |
7 |
|
Lease Expirations with annualized rent per square foot |
25 |
| Income Statements |
8 |
|
|
|
| EPS, FFO, GOS and FFO+GOS |
9 |
|
Transactional Drivers |
|
| Balance Sheets |
10 |
|
Capital Recycling: Acquisitions and Dispositions |
26 |
| Cash Flow Statements |
11 |
|
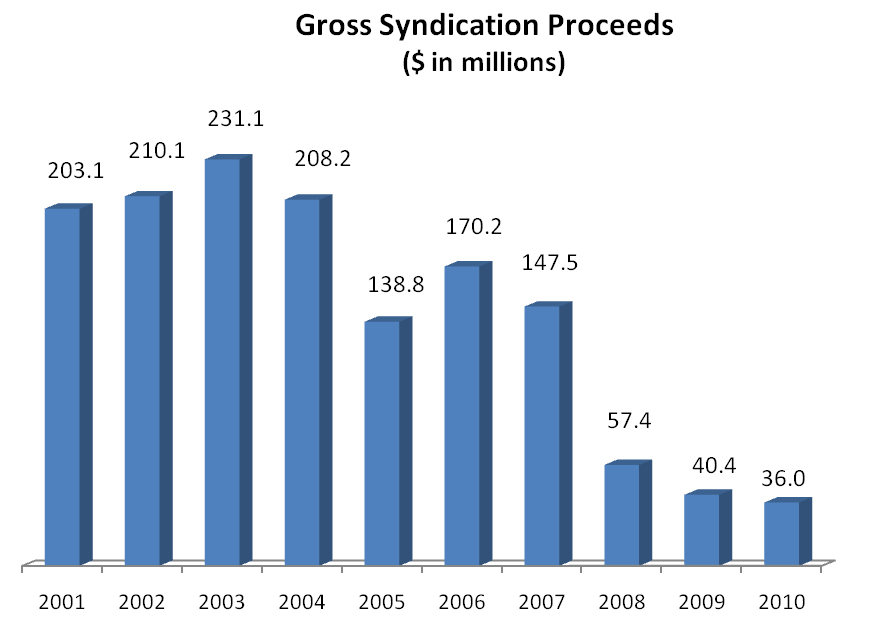
Investment Banking Performance |
27 |
| Segment Information |
12-13 |
|
|
|
| Property Net Operating Income (NOI): Cash and GAAP Basis |
14 |
|
FFO and FFO+GOS Reconciliations |
28 |
| Capital Analysis |
15 |
|
FFO and FFO+GOS Definitions |
29 |
| |
|
|
FAD Reconciliation and Definition |
30 |
| Portfolio Overview |
|
|
EBITDA Reconciliation and Definition |
31 |
| Property by Form of FSP Participation |
16 |
|
NOI Reconciliation and Definition |
32 |
| Regional Analysis, Map |
17 |
|
|
|
| Owned Property List |
18 |
|
|
|
| Properties with annualized rent per square foot |
19 |
|
|
|
| Capital Expenditures |
20 |
|
|
|
All financial information contained in this supplemental
information package is unaudited. In addition, certain statements contained in this supplemental information package may be deemed
to be forward-looking statements within the meaning of the federal securities laws. Although FSP believes that the expectations
reflected in such forward-looking statements are based upon reasonable assumptions, it can give no assurance that its expectations
will be achieved. Factors that could cause actual results to differ materially from FSP’s current expectations include general
economic conditions, local real estate conditions, the performance of properties that FSP has acquired or may acquire, the timely
lease-up of properties and other risks, detailed from time to time in FSP’s SEC reports. FSP assumes no obligation to update
or supplement forward-looking statements that become untrue because of subsequent events.
| |
|
Company Overview |
Overview
Franklin Street Properties Corp. (FSP) (NYSE Amex: FSP)
is an investment firm focused on achieving current income and long-term growth through investments in commercial properties. FSP’s
portfolio of real estate assets consists primarily of suburban office buildings and includes select investments in central business
district (CBD) properties. FSP’s real estate operations include property acquisitions and dispositions, interim acquisition
and short-term financing, leasing, development and asset management. FSP’s subsidiary, FSP Investments LLC (member, FINRA
and SIPC), is a real estate investment banking firm and registered broker/dealer.
Our Business
FSP operates in two business segments and has two principal
sources of revenue; real estate operations and investment banking/investment services. Real estate operations include rental income
from real estate leasing, interest income from loans made for interim acquisition or other purposes, and fee income from asset
management. Investment banking/investment services generate brokerage commissions, loan origination fees, development services
and other fees related to the organization of single-purpose entities that own real estate and the private placement of equity
in those entities.
Strategy
FSP’s investment strategy is to make selective acquisitions
based on market and/or property specific criteria, actively manage the property to maximize its value and dispose of the property
when the ideal time or situation arises. Proceeds from property sales are redeployed into other specific real estate assets, used
for other corporate purposes and/or paid out to shareholders as special dividends. Unlike many real estate investment companies,
which have utilized significant leverage in an attempt to enhance their real estate portfolio’s returns, FSP has used very
moderate leverage. FSP’s historical growth has been achieved without the use of permanent mortgage debt on any of our properties.
This model has significantly reduced FSP’s risk profile by reducing foreclosure, financing and refinancing risk. The Company’s
strategy is to employ modest leverage to accelerate its growth and capitalize on market conditions and opportunities as they arise.
In addition, FSP believes that it can lower investment risk while enhancing current income and long-term appreciation potential
by owning properties in diversified geographic locations that have sound long-term economic growth potential.
| Snapshot |
|
| (as of December 31, 2010) |
|
| Corporate Headquarters |
Wakefield, MA |
| Fiscal Year-End |
31-Dec |
| Total Properties |
33 |
| Total Square Feet |
6.4 Million |
| Common Shares Outstanding |
81,437,405 |
| Quarterly Dividend |
$0.19 |
| Dividend Yield |
5.33% |
| Total Market Capitalization |
$1,445 Million |
| Insider Holdings |
13.0% |
| |
|
Company Overview |
Structure of the Company
FSP has elected to be taxed as a Real Estate Investment
Trust (REIT) under the Internal Revenue Code. To qualify as a REIT, we must meet a number of organizational and operational requirements,
including a requirement to distribute at least 90% of our adjusted taxable income to our shareholders. Management intends to continue
to adhere to these requirements and to maintain our REIT status. As a REIT we are entitled to a tax deduction for some or all of
the dividends we pay to shareholders. Accordingly, we generally will not be subject to federal income taxes as long as we distribute
an amount equal to or in excess of our taxable income to shareholders.
Dividend Philosophy
FSP has been able to offer shareholders high-quality, risk-adjusted
returns. The ongoing and recurring rental revenue stream provides stability to our regular quarterly dividend. In addition, the
possibility exists for the payment of annual special dividends resulting from the sale of properties in the portfolio and the income
from FSP’s investment banking business.
| Board of Directors and Management |
|
|
|
|
| |
|
|
|
|
| George J. Carter |
|
Dennis J. McGillicuddy |
|
Scott H. Carter |
| President, Chief Executive Officer |
|
Director |
|
Executive Vice President, General |
| Chairman of the Board |
|
Member, Audit Committee |
|
Counsel and Assistant Secretary |
| |
|
Member, Compensation Committee |
|
|
| Barbara J. Fournier |
|
|
|
John G. Demeritt |
| Executive Vice President, Chief Operating Officer, |
|
Georgia Murray |
|
Executive Vice President and |
| Treasurer, Secretary and Director |
|
Director |
|
Chief Financial Officer |
| |
|
Chair, Compensation Committee |
|
|
| Janet Notopoulos |
|
Member, Audit Committee |
|
William W. Gribbell |
| Executive Vice President and Director |
|
|
|
Executive Vice President |
| |
|
Barry Silverstein |
|
|
| John N. Burke |
|
Director |
|
R. Scott MacPhee |
| Director |
|
Member, Audit Committee |
|
Executive Vice President |
| Chair, Audit Committee |
|
Member, Compensation Committee |
|
|
| Member, Compensation Committee |
|
|
|
|
| |
|
Company Overview |
|
Corporate Headquarters
|
|
Trading Symbol
|
|
Inquiries
|
|
401 Edgewater Place, Suite 200
|
|
NYSE Amex
|
|
Inquires should be directed to:
|
|
Wakefield, MA 01880
|
|
Symbol: FSP
|
|
John Demeritt, CFO
|
|
(t) 781-557-1300
|
|
|
|
877-686-9496 or InvestorRelations@
|
|
(f) 781-246-2807
|
|
|
|
franklinstreetproperties.com
|
|
www.franklinstreetproperties.com
|
|
|
|
|
| Common Stock Data (NYSE Amex: FSP) |
|
|
|
|
|
|
|
|
| |
For the Three Months Ended |
| |
31-Dec-10 |
30-Sep-10 |
30-Jun-10 |
31-Mar-10 |
31-Dec-09 |
30-Sep-09 |
30-Jun-09 |
31-Mar-09 |
| High Price |
14.42 |
12.86 |
15.70 |
15.01 |
15.36 |
15.20 |
14.84 |
14.88 |
| Low Price |
12.2 |
10.99 |
11.04 |
11.64 |
10.35 |
12.00 |
11.43 |
9.57 |
| Closing Price, at the end of the quarter |
14.25 |
12.42 |
11.81 |
14.43 |
14.61 |
13.10 |
13.25 |
12.30 |
| Dividends paid per share – quarterly |
0.19 |
0.19 |
0.19 |
0.19 |
0.19 |
0.19 |
0.19 |
0.19 |
| Closing dividend yield – annualized |
5.33% |
6.12% |
6.44% |
5.27% |
5.20% |
5.80% |
5.74% |
6.18% |
| Common shares outstanding (millions) |
81.44 |
79.84 |
79.68 |
79.68 |
79.68 |
79.68 |
70.48 |
70.48 |
Timing
Quarterly and Annual results are expected to be announced during
the week ending on these dates:
| First Quarter: |
|
6-May-11 |
|
Third Quarter: |
4-Nov-11 |
| Second Quarter: |
|
5-Aug-11 |
|
Fourth Quarter: |
24-Feb-12 |
| |
|
Financial Highlights
(in thousands, except per share data)
|
| | |
| |
| |
| |
| |
For the Year | |
| |
| |
| |
| |
For the Year |
| | |
For the Three Months Ended: | |
Ended | |
For the Three Months Ended: | |
Ended |
| | |
31-Mar-10 | |
30-Jun-10 | |
30-Sep-10 | |
31-Dec-10 | |
31-Dec-10 | |
31-Mar-09 | |
30-Jun-09 | |
30-Sep-09 | |
31-Dec-09 | |
31-Dec-09 |
| Income Items: | |
| | | |
| | | |
| | | |
| | | |
| | | |
| | | |
| | | |
| | | |
| | | |
| | |
| Revenue: | |
| | | |
| | | |
| | | |
| | | |
| | | |
| | | |
| | | |
| | | |
| | | |
| | |
| Rental | |
$ | 28,757 | | |
$ | 27,219 | | |
$ | 29,391 | | |
$ | 29,953 | | |
$ | 115,320 | | |
$ | 29,818 | | |
$ | 29,254 | | |
$ | 31,682 | | |
$ | 29,259 | | |
$ | 120,013 | |
| Related party revenue | |
| 800 | | |
| 1,852 | | |
| 896 | | |
| 4,162 | | |
| 7,710 | | |
| 583 | | |
| 860 | | |
| 371 | | |
| 4,434 | | |
| 6,248 | |
| Other | |
| 9 | | |
| 6 | | |
| 20 | | |
| 54 | | |
| 89 | | |
| 18 | | |
| 18 | | |
| 19 | | |
| 6 | | |
| 61 | |
| Total revenue | |
| 29,566 | | |
| 29,077 | | |
| 30,307 | | |
| 34,169 | | |
| 123,119 | | |
| 30,419 | | |
| 30,132 | | |
| 32,072 | | |
| 33,699 | | |
| 126,322 | |
| | |
| | | |
| | | |
| | | |
| | | |
| | | |
| | | |
| | | |
| | | |
| | | |
| | |
| Total expenses | |
| 25,384 | | |
| 24,547 | | |
| 27,047 | | |
| 29,319 | | |
| 106,297 | | |
| 23,738 | | |
| 25,821 | | |
| 25,538 | | |
| 27,149 | | |
| 102,246 | |
| | |
| | | |
| | | |
| | | |
| | | |
| | | |
| | | |
| | | |
| | | |
| | | |
| | |
Income before interest income, equity in earnings in
non-consolidated REITs and taxes | |
| 4,182 | | |
| 4,530 | | |
| 3,260 | | |
| 4,850 | | |
| 16,822 | | |
| 6,681 | | |
| 4,311 | | |
| 6,534 | | |
| 6,550 | | |
| 24,076 | |
| Interest income | |
| 8 | | |
| 9 | | |
| 4 | | |
| 4 | | |
| 25 | | |
| 36 | | |
| 36 | | |
| 16 | | |
| 8 | | |
| 96 | |
| Equity in earnings in non-consolidated REITs | |
| 253 | | |
| 380 | | |
| 404 | | |
| 229 | | |
| 1,266 | | |
| 792 | | |
| 443 | | |
| 475 | | |
| 284 | | |
| 1,994 | |
| | |
| | | |
| | | |
| | | |
| | | |
| | | |
| | | |
| | | |
| | | |
| | | |
| | |
| Income before taxes | |
| 4,443 | | |
| 4,919 | | |
| 3,668 | | |
| 5,083 | | |
| 18,113 | | |
| 7,509 | | |
| 4,790 | | |
| 7,025 | | |
| 6,842 | | |
| 26,166 | |
| Income tax expense (benefit) | |
| (68 | ) | |
| 5 | | |
| (37 | ) | |
| 317 | | |
| 217 | | |
| (299 | ) | |
| (75 | ) | |
| (270 | ) | |
| 65 | | |
| (579 | ) |
| | |
| | | |
| | | |
| | | |
| | | |
| | | |
| | | |
| | | |
| | | |
| | | |
| | |
| Income from continuing operations | |
| 4,511 | | |
| 4,914 | | |
| 3,705 | | |
| 4,766 | | |
| 17,896 | | |
| 7,808 | | |
| 4,865 | | |
| 7,295 | | |
| 6,777 | | |
| 26,745 | |
| Income from discontinued operations | |
| 1,051 | | |
| 1,040 | | |
| 1,052 | | |
| 1,054 | | |
| 4,197 | | |
| — | | |
| — | | |
| (353 | ) | |
| 1,056 | | |
| 703 | |
| Gain on sale of assets | |
| — | | |
| — | | |
| — | | |
| — | | |
| — | | |
| — | | |
| — | | |
| — | | |
| 424 | | |
| 424 | |
| | |
| | | |
| | | |
| | | |
| | | |
| | | |
| | | |
| | | |
| | | |
| | | |
| | |
| Net income | |
$ | 5,562 | | |
$ | 5,954 | | |
$ | 4,757 | | |
$ | 5,820 | | |
$ | 22,093 | | |
$ | 7,808 | | |
$ | 4,865 | | |
$ | 6,942 | | |
$ | 8,257 | | |
$ | 27,872 | |
| | |
| | | |
| | | |
| | | |
| | | |
| | | |
| | | |
| | | |
| | | |
| | | |
| | |
| FFO+GOS*: | |
| | | |
| | | |
| | | |
| | | |
| | | |
| | | |
| | | |
| | | |
| | | |
| | |
| FFO | |
$ | 16,650 | | |
$ | 16,702 | | |
$ | 16,052 | | |
$ | 17,518 | | |
$ | 66,922 | | |
$ | 17,338 | | |
$ | 17,409 | | |
$ | 17,537 | | |
$ | 19,075 | | |
$ | 71,359 | |
| GOS | |
| — | | |
| — | | |
| — | | |
| — | | |
| — | | |
| — | | |
| — | | |
| — | | |
| 424 | | |
| 424 | |
| FFO+GOS | |
$ | 16,650 | | |
$ | 16,702 | | |
$ | 16,052 | | |
$ | 17,518 | | |
$ | 66,922 | | |
$ | 17,338 | | |
$ | 17,409 | | |
$ | 17,537 | | |
$ | 19,499 | | |
$ | 71,783 | |
| | |
| | | |
| | | |
| | | |
| | | |
| | | |
| | | |
| | | |
| | | |
| | | |
| | |
| Per Share Data: | |
| | | |
| | | |
| | | |
| | | |
| | | |
| | | |
| | | |
| | | |
| | | |
| | |
| EPS | |
$ | 0.07 | | |
$ | 0.07 | | |
$ | 0.06 | | |
$ | 0.07 | | |
$ | 0.28 | | |
$ | 0.11 | | |
$ | 0.07 | | |
$ | 0.10 | | |
$ | 0.10 | | |
$ | 0.38 | |
| FFO | |
| 0.21 | | |
| 0.21 | | |
| 0.20 | | |
| 0.22 | | |
| 0.84 | | |
| 0.25 | | |
| 0.25 | | |
| 0.25 | | |
| 0.24 | | |
| 0.98 | |
| GOS | |
| — | | |
| — | | |
| — | | |
| — | | |
| — | | |
| — | | |
| — | | |
| — | | |
| — | | |
| — | |
| FFO+GOS | |
| 0.21 | | |
| 0.21 | | |
| 0.20 | | |
| 0.22 | | |
| 0.84 | | |
| 0.25 | | |
| 0.25 | | |
| 0.25 | | |
| 0.24 | | |
| 0.98 | |
| | |
| | | |
| | | |
| | | |
| | | |
| | | |
| | | |
| | | |
| | | |
| | | |
| | |
| Weighted Aveage Shares (diluted) | |
| 79,681 | | |
| 79,681 | | |
| 79,751 | | |
| 80,187 | | |
| 79,826 | | |
| 70,481 | | |
| 70,481 | | |
| 71,281 | | |
| 79,681 | | |
| 73,001 | |
| | |
| | | |
| | | |
| | | |
| | | |
| | | |
| | | |
| | | |
| | | |
| | | |
| | |
| Balance Sheet Items: | |
| | | |
| | | |
| | | |
| | | |
| | | |
| | | |
| | | |
| | | |
| | | |
| | |
| Real estate, net | |
$ | 855,661 | | |
$ | 874,558 | | |
$ | 872,038 | | |
$ | 867,608 | | |
$ | 867,608 | | |
$ | 839,826 | | |
$ | 869,557 | | |
$ | 864,370 | | |
$ | 860,218 | | |
$ | 860,218 | |
| Other assets, net | |
| 295,770 | | |
| 311,492 | | |
| 316,340 | | |
| 371,127 | | |
| 371,127 | | |
| 178,682 | | |
| 195,939 | | |
| 281,405 | | |
| 294,632 | | |
| 294,632 | |
| Total assets, net | |
| 1,151,431 | | |
| 1,186,050 | | |
| 1,188,378 | | |
| 1,238,735 | | |
| 1,238,735 | | |
| 1,018,508 | | |
| 1,065,496 | | |
| 1,144,827 | | |
| 1,154,850 | | |
| 1,154,850 | |
| Total liabilities, net | |
| 223,654 | | |
| 267,198 | | |
| 278,091 | | |
| 317,177 | | |
| 317,177 | | |
| 175,075 | | |
| 229,903 | | |
| 200,848 | | |
| 217,576 | | |
| 217,576 | |
| Shareholders' equity | |
| 927,777 | | |
| 918,852 | | |
| 910,287 | | |
| 921,558 | | |
| 921,558 | | |
| 843,433 | | |
| 835,593 | | |
| 943,979 | | |
| 937,274 | | |
| 937,274 | |
* See page 28 for a reconciliation of Net Income to FFO and FFO+GOS
and page 29 for definitions of FFO and FFO+GOS
| |
|
Management’s Key Operating Measures
|
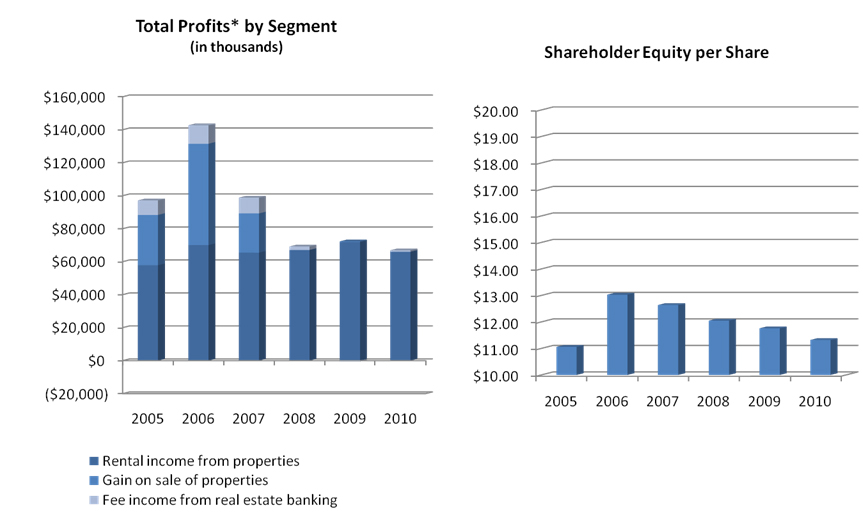
* See page 28 for a reconciliation of Net Income to FFO and FFO+GOS
(Total Profits) and page 29 for definitions of FFO and FFO+GOS
| |
|
Condensed Consolidated Income Statements
($ in thousands, except per share amounts)
|
| | |
| |
| |
| |
| |
For the | |
| |
| |
| |
| |
For the |
| | |
For the Three Months Ended: | |
Year Ended | |
For the Three Months Ended: | |
Year Ended |
| | |
31-Mar-10 | |
30-Jun-10 | |
30-Sep-10 | |
31-Dec-10 | |
31-Dec-10 | |
31-Mar-09 | |
30-Jun-09 | |
30-Sep-09 | |
31-Dec-09 | |
31-Dec-09 |
| | |
| |
| |
| |
| |
| |
| |
| |
| |
| |
|
| Revenue: | |
| | | |
| | | |
| | | |
| | | |
| | | |
| | | |
| | | |
| | | |
| | | |
| | |
| Rental | |
$ | 28,757 | | |
$ | 27,219 | | |
$ | 29,391 | | |
$ | 29,953 | | |
$ | 115,320 | | |
$ | 29,818 | | |
$ | 29,254 | | |
$ | 31,682 | | |
$ | 29,259 | | |
$ | 120,013 | |
| Related party revenue: | |
| | | |
| | | |
| | | |
| | | |
| | | |
| | | |
| | | |
| | | |
| | | |
| | |
| Syndication fees | |
| 121 | | |
| 541 | | |
| 20 | | |
| 1,862 | | |
| 2,544 | | |
| 10 | | |
| 29 | | |
| — | | |
| 2,389 | | |
| 2,428 | |
| Transaction fees | |
| 146 | | |
| 753 | | |
| 246 | | |
| 1,582 | | |
| 2,727 | | |
| 28 | | |
| 514 | | |
| 1 | | |
| 1,537 | | |
| 2,080 | |
| Management fees and interest income from loans | |
| 533 | | |
| 558 | | |
| 630 | | |
| 718 | | |
| 2,439 | | |
| 545 | | |
| 317 | | |
| 370 | | |
| 508 | | |
| 1,740 | |
| Other | |
| 9 | | |
| 6 | | |
| 20 | | |
| 54 | | |
| 89 | | |
| 18 | | |
| 18 | | |
| 19 | | |
| 6 | | |
| 61 | |
| Total revenue | |
| 29,566 | | |
| 29,077 | | |
| 30,307 | | |
| 34,169 | | |
| 123,119 | | |
| 30,419 | | |
| 30,132 | | |
| 32,072 | | |
| 33,699 | | |
| 126,322 | |
| | |
| | | |
| | | |
| | | |
| | | |
| | | |
| | | |
| | | |
| | | |
| | | |
| | |
| Expenses: | |
| | | |
| | | |
| | | |
| | | |
| | | |
| | | |
| | | |
| | | |
| | | |
| | |
| Real estate operating expenses | |
| 7,955 | | |
| 7,335 | | |
| 8,715 | | |
| 9,604 | | |
| 33,609 | | |
| 7,280 | | |
| 7,144 | | |
| 7,752 | | |
| 8,634 | | |
| 30,810 | |
| Real estate taxes and insurance | |
| 4,996 | | |
| 4,061 | | |
| 4,659 | | |
| 4,454 | | |
| 18,170 | | |
| 4,829 | | |
| 4,686 | | |
| 5,364 | | |
| 4,102 | | |
| 18,981 | |
| Depreciation and amortization | |
| 8,496 | | |
| 8,521 | | |
| 9,691 | | |
| 9,764 | | |
| 36,472 | | |
| 7,914 | | |
| 10,225 | | |
| 8,801 | | |
| 8,630 | | |
| 35,570 | |
| Selling, general and administrative | |
| 2,171 | | |
| 2,559 | | |
| 2,074 | | |
| 2,482 | | |
| 9,286 | | |
| 2,008 | | |
| 2,127 | | |
| 1,869 | | |
| 2,510 | | |
| 8,514 | |
| Commissions | |
| 114 | | |
| 336 | | |
| 16 | | |
| 1,011 | | |
| 1,477 | | |
| 130 | | |
| 40 | | |
| 8 | | |
| 1,623 | | |
| 1,801 | |
| Interest | |
| 1,652 | | |
| 1,735 | | |
| 1,892 | | |
| 2,004 | | |
| 7,283 | | |
| 1,577 | | |
| 1,599 | | |
| 1,744 | | |
| 1,650 | | |
| 6,570 | |
| Total expenses | |
| 25,384 | | |
| 24,547 | | |
| 27,047 | | |
| 29,319 | | |
| 106,297 | | |
| 23,738 | | |
| 25,821 | | |
| 25,538 | | |
| 27,149 | | |
| 102,246 | |
| | |
| | | |
| | | |
| | | |
| | | |
| | | |
| | | |
| | | |
| | | |
| | | |
| | |
| Income before interest income, equity in earnings of non-consolidated REITs and taxes | |
| 4,182 | | |
| 4,530 | | |
| 3,260 | | |
| 4,850 | | |
| 16,822 | | |
| 6,681 | | |
| 4,311 | | |
| 6,534 | | |
| 6,550 | | |
| 24,076 | |
| Interest income | |
| 8 | | |
| 9 | | |
| 4 | | |
| 4 | | |
| 25 | | |
| 36 | | |
| 36 | | |
| 16 | | |
| 8 | | |
| 96 | |
| Equity in earnings of non-consolidated REITs | |
| 253 | | |
| 380 | | |
| 404 | | |
| 229 | | |
| 1,266 | | |
| 792 | | |
| 443 | | |
| 475 | | |
| 284 | | |
| 1,994 | |
| | |
| | | |
| | | |
| | | |
| | | |
| | | |
| | | |
| | | |
| | | |
| | | |
| | |
| | |
| 4,443 | | |
| 4,919 | | |
| 3,668 | | |
| 5,083 | | |
| 18,113 | | |
| 7,509 | | |
| 4,790 | | |
| 7,025 | | |
| 6,842 | | |
| 26,166 | |
| Income tax expense (benefit) | |
| (68 | ) | |
| 5 | | |
| (37 | ) | |
| 317 | | |
| 217 | | |
| (299 | ) | |
| (75 | ) | |
| (270 | ) | |
| 65 | | |
| (579 | ) |
| | |
| | | |
| | | |
| | | |
| | | |
| | | |
| | | |
| | | |
| | | |
| | | |
| | |
| Income from continuing operations | |
| 4,511 | | |
| 4,914 | | |
| 3,705 | | |
| 4,766 | | |
| 17,896 | | |
| 7,808 | | |
| 4,865 | | |
| 7,295 | | |
| 6,777 | | |
| 26,745 | |
| Income from discontinued operations | |
| 1,051 | | |
| 1,040 | | |
| 1,052 | | |
| 1,054 | | |
| 4,197 | | |
| — | | |
| — | | |
| (353 | ) | |
| 1,056 | | |
| 703 | |
| Gain on sale of assets | |
| — | | |
| — | | |
| — | | |
| — | | |
| — | | |
| — | | |
| — | | |
| — | | |
| 424 | | |
| 424 | |
| | |
| | | |
| | | |
| | | |
| | | |
| | | |
| | | |
| | | |
| | | |
| | | |
| | |
| Net income | |
$ | 5,562 | | |
$ | 5,954 | | |
$ | 4,757 | | |
$ | 5,820 | | |
$ | 22,093 | | |
$ | 7,808 | | |
$ | 4,865 | | |
$ | 6,942 | | |
$ | 8,257 | | |
$ | 27,872 | |
| | |
| | | |
| | | |
| | | |
| | | |
| | | |
| | | |
| | | |
| | | |
| | | |
| | |
| Weighted average number of shares outstanding, basic and diluted | |
| 79,681 | | |
| 79,681 | | |
| 79,751 | | |
| 80,187 | | |
| 79,826 | | |
| 70,481 | | |
| 70,481 | | |
| 71,281 | | |
| 79,681 | | |
| 73,001 | |
| | |
| | | |
| | | |
| | | |
| | | |
| | | |
| | | |
| | | |
| | | |
| | | |
| | |
| Earnings per share, basic and diluted, attributable to: | |
| | | |
| | | |
| | | |
| | | |
| | | |
| | | |
| | | |
| | | |
| | | |
| | |
| Continuing operations | |
$ | 0.06 | | |
$ | 0.06 | | |
$ | 0.05 | | |
$ | 0.06 | | |
$ | 0.23 | | |
$ | 0.11 | | |
$ | 0.07 | | |
$ | 0.10 | | |
$ | 0.09 | | |
$ | 0.37 | |
| Discontinued operations | |
| 0.01 | | |
| 0.01 | | |
| 0.01 | | |
| 0.01 | | |
| 0.05 | | |
| — | | |
| — | | |
| — | | |
| 0.01 | | |
| 0.01 | |
| Gains on sales of assets | |
| — | | |
| — | | |
| — | | |
| — | | |
| — | | |
| — | | |
| — | | |
| — | | |
| — | | |
| — | |
| Net income per share, basic and diluted | |
$ | 0.07 | | |
$ | 0.07 | | |
$ | 0.06 | | |
$ | 0.07 | | |
$ | 0.28 | | |
$ | 0.11 | | |
$ | 0.07 | | |
$ | 0.10 | | |
$ | 0.10 | | |
$ | 0.38 | |
| |
|
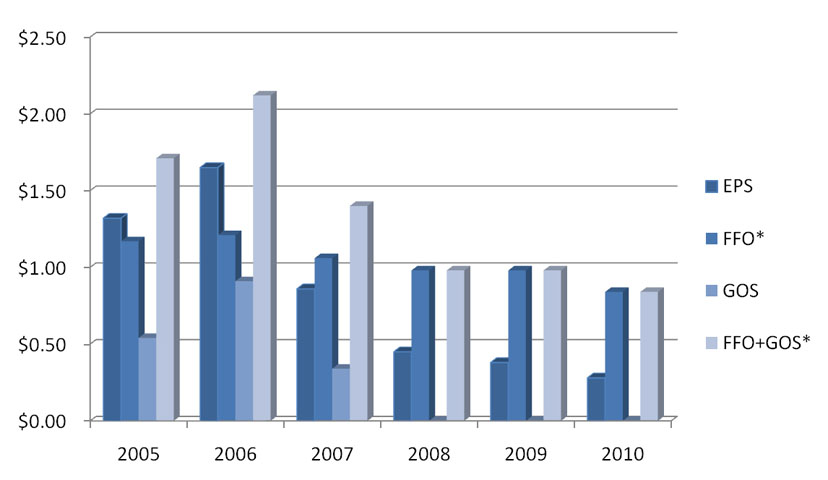
EPS, FFO, GOS and FFO+GOS*
|
*See page 28 for a reconciliation of Net Income to FFO and FFO+GOS and page 29 for definitions of FFO and FFO+GOS
| |
|
Condensed Consolidated Balance Sheets
(in thousands)
|
| | |
March 31, | |
June 30, | |
September 30, | |
December 31, | |
March 31, | |
June 30, | |
September 30, | |
December 31, |
| | |
2010 | |
2010 | |
2010 | |
2010 | |
2009 | |
2009 | |
2009 | |
2009 |
| Assets: | |
| | | |
| | | |
| | | |
| | | |
| | | |
| | | |
| | | |
| | |
| Real estate assets: | |
| | | |
| | | |
| | | |
| | | |
| | | |
| | | |
| | | |
| | |
| Land | |
$ | 114,677 | | |
$ | 123,305 | | |
$ | 123,305 | | |
$ | 123,305 | | |
$ | 107,153 | | |
$ | 114,677 | | |
$ | 114,677 | | |
$ | 114,677 | |
| Buildings and improvements | |
| 845,504 | | |
| 861,986 | | |
| 865,810 | | |
| 867,858 | | |
| 812,470 | | |
| 840,605 | | |
| 841,751 | | |
| 843,845 | |
| Fixtures and equipment | |
| 354 | | |
| 458 | | |
| 458 | | |
| 578 | | |
| 299 | | |
| 310 | | |
| 310 | | |
| 328 | |
| | |
| 960,535 | | |
| 985,749 | | |
| 989,573 | | |
| 991,741 | | |
| 919,922 | | |
| 955,592 | | |
| 956,738 | | |
| 958,850 | |
| Less accumulated depreciation | |
| 104,874 | | |
| 111,191 | | |
| 117,535 | | |
| 124,133 | | |
| 80,096 | | |
| 86,035 | | |
| 92,368 | | |
| 98,632 | |
| Real estate assets, net | |
| 855,661 | | |
| 874,558 | | |
| 872,038 | | |
| 867,608 | | |
| 839,826 | | |
| 869,557 | | |
| 864,370 | | |
| 860,218 | |
| | |
| | | |
| | | |
| | | |
| | | |
| | | |
| | | |
| | | |
| | |
| Acquired real estate leases, net | |
| 30,822 | | |
| 45,871 | | |
| 43,185 | | |
| 40,578 | | |
| 26,042 | | |
| 38,996 | | |
| 36,240 | | |
| 33,395 | |
| Investment in non-consolidated REITs | |
| 91,787 | | |
| 90,782 | | |
| 89,995 | | |
| 89,327 | | |
| 82,388 | | |
| 94,579 | | |
| 93,936 | | |
| 92,910 | |
| Assets held for syndication, net | |
| 2,791 | | |
| — | | |
| — | | |
| 2,976 | | |
| 13,004 | | |
| — | | |
| — | | |
| 4,827 | |
| Assets held for sale | |
| 71,593 | | |
| 70,991 | | |
| 70,391 | | |
| 69,790 | | |
| — | | |
| — | | |
| 73,001 | | |
| 72,182 | |
| Cash and cash equivalents | |
| 22,815 | | |
| 21,487 | | |
| 20,554 | | |
| 68,213 | | |
| 27,650 | | |
| 24,542 | | |
| 26,385 | | |
| 27,404 | |
| Restricted cash | |
| 50 | | |
| 59 | | |
| 55 | | |
| 420 | | |
| 336 | | |
| 335 | | |
| 331 | | |
| 334 | |
| Tenant rent receivables, net | |
| 1,385 | | |
| 900 | | |
| 2,123 | | |
| 1,922 | | |
| 1,084 | | |
| 720 | | |
| 1,400 | | |
| 1,782 | |
| Straight-line rent receivable, net | |
| 13,994 | | |
| 14,645 | | |
| 15,757 | | |
| 18,752 | | |
| 9,190 | | |
| 9,219 | | |
| 9,723 | | |
| 10,633 | |
| Prepaid expenses | |
| 2,236 | | |
| 2,280 | | |
| 2,511 | | |
| 1,654 | | |
| 2,253 | | |
| 2,267 | | |
| 3,430 | | |
| 2,594 | |
| Related party mortgage loan receivable | |
| 41,325 | | |
| 46,270 | | |
| 53,756 | | |
| 57,684 | | |
| 4,725 | | |
| 12,115 | | |
| 23,264 | | |
| 36,535 | |
| Other assets | |
| 1,220 | | |
| 1,620 | | |
| 1,387 | | |
| 1,356 | | |
| 1,517 | | |
| 2,271 | | |
| 1,860 | | |
| 1,228 | |
| Deferred leasing commissions, net | |
| 15,752 | | |
| 16,587 | | |
| 16,626 | | |
| 18,455 | | |
| 10,493 | | |
| 10,895 | | |
| 10,887 | | |
| 10,808 | |
| Total assets | |
$ | 1,151,431 | | |
$ | 1,186,050 | | |
$ | 1,188,378 | | |
$ | 1,238,735 | | |
$ | 1,018,508 | | |
$ | 1,065,496 | | |
$ | 1,144,827 | | |
$ | 1,154,850 | |
| | |
| | | |
| | | |
| | | |
| | | |
| | | |
| | | |
| | | |
| | |
| Liabilities and Stockholders’ Equity: | |
| | | |
| | | |
| | | |
| | | |
| | | |
| | | |
| | | |
| | |
| Liabilities: | |
| | | |
| | | |
| | | |
| | | |
| | | |
| | | |
| | | |
| | |
| Bank note payable | |
$ | 119,968 | | |
| 162,968 | | |
| 167,968 | | |
| 209,968 | | |
$ | 72,468 | | |
$ | 124,038 | | |
$ | 91,008 | | |
$ | 109,008 | |
| Term loan payable | |
| 75,000 | | |
| 75,000 | | |
| 75,000 | | |
| 74,850 | | |
| 75,000 | | |
| 75,000 | | |
| 75,000 | | |
| 75,000 | |
| Accounts payable and accrued expenses | |
| 20,467 | | |
| 18,766 | | |
| 25,064 | | |
| 22,435 | | |
| 17,687 | | |
| 21,252 | | |
| 25,351 | | |
| 23,787 | |
| Accrued compensation | |
| 274 | | |
| 1,040 | | |
| 1,334 | | |
| 1,803 | | |
| 250 | | |
| 500 | | |
| 750 | | |
| 1,416 | |
| Tenant security deposits | |
| 1,696 | | |
| 2,004 | | |
| 1,922 | | |
| 1,930 | | |
| 1,795 | | |
| 1,765 | | |
| 1,757 | | |
| 1,808 | |
| Other liabilities: derivative termination value | |
| 1,995 | | |
| 1,735 | | |
| 1,416 | | |
| 1,077 | | |
| 3,080 | | |
| 2,394 | | |
| 2,269 | | |
| 2,076 | |
| Acquired unfavorable real estate leases, net | |
| 4,254 | | |
| 5,685 | | |
| 5,387 | | |
| 5,114 | | |
| 4,795 | | |
| 4,954 | | |
| 4,713 | | |
| 4,481 | |
| Total liabilities | |
| 223,654 | | |
| 267,198 | | |
| 278,091 | | |
| 317,177 | | |
| 175,075 | | |
| 229,903 | | |
| 200,848 | | |
| 217,576 | |
| | |
| | | |
| | | |
| | | |
| | | |
| | | |
| | | |
| | | |
| | |
| Commitments and contingencies | |
| | | |
| | | |
| | | |
| | | |
| | | |
| | | |
| | | |
| | |
| | |
| | | |
| | | |
| | | |
| | | |
| | | |
| | | |
| | | |
| | |
| Stockholders’ Equity: | |
| | | |
| | | |
| | | |
| | | |
| | | |
| | | |
| | | |
| | |
| Preferred stock | |
| — | | |
| — | | |
| — | | |
| — | | |
| — | | |
| — | | |
| — | | |
| — | |
| Common stock | |
| 8 | | |
| 8 | | |
| 8 | | |
| 8 | | |
| 7 | | |
| 7 | | |
| 8 | | |
| 8 | |
| Additional paid-in capital | |
| 1,003,712 | | |
| 1,003,712 | | |
| 1,005,211 | | |
| 1,025,491 | | |
| 889,019 | | |
| 889,019 | | |
| 1,003,729 | | |
| 1,003,713 | |
| Accumulated other comprehensive loss | |
| (1,995 | ) | |
| (1,735 | ) | |
| (1,416 | ) | |
| (1,077 | ) | |
| (3,080 | ) | |
| (2,394 | ) | |
| (2,269 | ) | |
| (2,076 | ) |
| Accumulated distributions in excess of accumulated earnings | |
| (73,948 | ) | |
| (83,133 | ) | |
| (93,516 | ) | |
| (102,864 | ) | |
| (42,513 | ) | |
| (51,039 | ) | |
| (57,489 | ) | |
| (64,371 | ) |
| Total stockholders’ equity | |
| 927,777 | | |
| 918,852 | | |
| 910,287 | | |
| 921,558 | | |
| 843,433 | | |
| 835,593 | | |
| 943,979 | | |
| 937,274 | |
| Total liabilities and stockholders’ equity | |
$ | 1,151,431 | | |
$ | 1,186,050 | | |
$ | 1,188,378 | | |
$ | 1,238,735 | | |
$ | 1,018,508 | | |
$ | 1,065,496 | | |
$ | 1,144,827 | | |
$ | 1,154,850 | |
| |
|
Condensed Consolidated Statements of Cash Flows
(in thousands)
|
| | |
Twelve Months ended December 31 |
| | |
2010 | |
2009 | |
2008 |
| | |
| |
| |
|
| Cash flows from operating activities: | |
| | | |
| | | |
| | |
| Net income | |
$ | 22,093 | | |
$ | 27,872 | | |
$ | 31,959 | |
Adjustments to reconcile net income to net cash
provided by operating activities: | |
| | | |
| | | |
| | |
| Gains on assets sold | |
| — | | |
| (424 | ) | |
| — | |
| Depreciation and amortization expense | |
| 39,627 | | |
| 36,561 | | |
| 30,444 | |
| Amortization of above market lease | |
| 1,362 | | |
| 3,359 | | |
| 4,283 | |
| Equity in earnings (losses) from non-consolidated REITs | |
| (1,183 | ) | |
| (2,012 | ) | |
| (2,747 | ) |
| Distributions from non-consolidated REITs | |
| 5,170 | | |
| 5,628 | | |
| 5,348 | |
| Increase in bad debt reserve | |
| 980 | | |
| 111 | | |
| 79 | |
| Changes in operating assets and liabilities: | |
| | | |
| | | |
| | |
| Restricted cash | |
| (86 | ) | |
| 2 | | |
| — | |
| Tenant rent receivables | |
| (1,120 | ) | |
| (564 | ) | |
| 64 | |
| Straight-line rents | |
| (4,249 | ) | |
| (1,879 | ) | |
| (1,406 | ) |
| Prepaid expenses and other assets | |
| 865 | | |
| 907 | | |
| (901 | ) |
| Accounts payable and accrued expenses | |
| (351 | ) | |
| 2,760 | | |
| 448 | |
| Accrued compensation | |
| 387 | | |
| (238 | ) | |
| 90 | |
| Tenant security deposits | |
| 122 | | |
| (66 | ) | |
| — | |
| Payment of deferred leasing commissions | |
| (10,515 | ) | |
| (2,659 | ) | |
| (3,353 | ) |
| | |
| | | |
| | | |
| | |
| Net cash provided by operating activities | |
| 53,102 | | |
| 69,358 | | |
| 64,308 | |
| | |
| | | |
| | | |
| | |
| Cash flows from investing activities: | |
| | | |
| | | |
| | |
Purchase of real estate assets, office computers and
furniture, capitalized merger costs and acquired real estate leases | |
| (54,344 | ) | |
| (132,323 | ) | |
| (78,396 | ) |
| Investment in non-consolidated REITs | |
| (11 | ) | |
| (13,218 | ) | |
| (10 | ) |
| Investment in related party mortgage loan receivable | |
| (21,149 | ) | |
| (35,410 | ) | |
| (1,125 | ) |
| Changes in deposits on real estate assets | |
| (200 | ) | |
| — | | |
| (1,300 | ) |
| Investment in assets held for syndication, net | |
| 1,319 | | |
| 8,159 | | |
| 12,236 | |
| Proceeds received on sales of real estate assets | |
| — | | |
| 672 | | |
| — | |
| | |
| | | |
| | | |
| | |
| Net cash used in investing activities | |
| (74,385 | ) | |
| (172,120 | ) | |
| (68,595 | ) |
| | |
| | | |
| | | |
| | |
| Cash flows from financing activities: | |
| | | |
| | | |
| | |
| Distributions to stockholders | |
| (60,586 | ) | |
| (55,313 | ) | |
| (70,481 | ) |
| Proceeds from equity offering, net | |
| 21,868 | | |
| 114,695 | | |
| — | |
| Borrowings under bank note payable, net | |
| 100,960 | | |
| 41,540 | | |
| (17,282 | ) |
| Borrowings (principal payments) under term note payable | |
| (150 | ) | |
| — | | |
| 75,000 | |
| Deferred financing costs | |
| — | | |
| — | | |
| (694 | ) |
| | |
| | | |
| | | |
| | |
| Net cash (used in) provided by financing activities | |
| 62,092 | | |
| 100,922 | | |
| (13,457 | ) |
| | |
| | | |
| | | |
| | |
| Net decreases in cash and cash equivalents | |
| 40,809 | | |
| (1,840 | ) | |
| (17,744 | ) |
| | |
| | | |
| | | |
| | |
| Cash and cash equivalents, beginning of period | |
| 27,404 | | |
| 29,244 | | |
| 46,988 | |
| | |
| | | |
| | | |
| | |
| Cash and cash equivalents, end of period | |
$ | 68,213 | | |
$ | 27,404 | | |
$ | 29,244 | |
| |
|
Segment Information*
($ in thousands except per share amounts)
|
| | |
Three Months Ended
December 31, 2010 | |
Year Ended
December 31, 2010 | |
Three Months
Ended December 31, 2009 | |
Year Ended
December 31, 2009 |
| | |
Real | |
Investment | |
| |
Real | |
Investment | |
| |
Real | |
Investment | |
| |
Real | |
Investment | |
|
| | |
Estate | |
Banking | |
Total | |
Estate | |
Banking | |
Total | |
Estate | |
Banking | |
Total | |
Estate | |
Banking | |
Total |
| Revenue: | |
| | | |
| | | |
| | | |
| | | |
| | | |
| | | |
| | | |
| | | |
| | | |
| | | |
| | | |
| | |
| Rental Income | |
$ | 29,953 | | |
$ | — | | |
$ | 29,953 | | |
$ | 115,320 | | |
$ | — | | |
$ | 115,320 | | |
$ | 29,259 | | |
$ | — | | |
$ | 29,259 | | |
$ | 120,013 | | |
$ | — | | |
$ | 120,013 | |
| Syndication Fees | |
| — | | |
| 1,862 | | |
| 1,862 | | |
| — | | |
| 2,544 | | |
| 2,544 | | |
| — | | |
| 2,389 | | |
| 2,389 | | |
| — | | |
| 2,428 | | |
| 2,428 | |
| Transaction Fees | |
| — | | |
| 1,582 | | |
| 1,582 | | |
| — | | |
| 2,727 | | |
| 2,727 | | |
| — | | |
| 1,537 | | |
| 1,537 | | |
| — | | |
| 2,080 | | |
| 2,080 | |
| Management Fees & Interest Income | |
| 718 | | |
| — | | |
| 718 | | |
| 2,439 | | |
| — | | |
| 2,439 | | |
| 508 | | |
| — | | |
| 508 | | |
| 1,740 | | |
| — | | |
| 1,740 | |
| Other Income | |
| 54 | | |
| — | | |
| 54 | | |
| 89 | | |
| — | | |
| 89 | | |
| 6 | | |
| — | | |
| 6 | | |
| 61 | | |
| — | | |
| 61 | |
| | |
| | | |
| | | |
| | | |
| | | |
| | | |
| | | |
| | | |
| | | |
| | | |
| | | |
| | | |
| | |
| Total Revenue | |
| 30,725 | | |
| 3,444 | | |
| 34,169 | | |
| 117,848 | | |
| 5,271 | | |
| 123,119 | | |
| 29,773 | | |
| 3,926 | | |
| 33,699 | | |
| 121,814 | | |
| 4,508 | | |
| 126,322 | |
| | |
| | | |
| | | |
| | | |
| | | |
| | | |
| | | |
| | | |
| | | |
| | | |
| | | |
| | | |
| | |
| Expenses | |
| | | |
| | | |
| | | |
| | | |
| | | |
| | | |
| | | |
| | | |
| | | |
| | | |
| | | |
| | |
| Rental Operating Expenses | |
| 9,604 | | |
| — | | |
| 9,604 | | |
| 33,609 | | |
| — | | |
| 33,609 | | |
| 8,634 | | |
| — | | |
| 8,634 | | |
| 30,810 | | |
| — | | |
| 30,810 | |
| Real Estate Taxes and Insurance | |
| 4,454 | | |
| — | | |
| 4,454 | | |
| 18,170 | | |
| — | | |
| 18,170 | | |
| 4,102 | | |
| — | | |
| 4,102 | | |
| 18,981 | | |
| — | | |
| 18,981 | |
| Depreciation and Amortization | |
| 9,729 | | |
| 35 | | |
| 9,764 | | |
| 36,299 | | |
| 173 | | |
| 36,472 | | |
| 8,591 | | |
| 39 | | |
| 8,630 | | |
| 35,447 | | |
| 123 | | |
| 35,570 | |
| Selling, general and administrative | |
| 1,698 | | |
| 784 | | |
| 2,482 | | |
| 6,399 | | |
| 2,887 | | |
| 9,286 | | |
| 1,356 | | |
| 1,154 | | |
| 2,510 | | |
| 4,452 | | |
| 4,062 | | |
| 8,514 | |
| Commissions and Broker Expenses | |
| — | | |
| 1,011 | | |
| 1,011 | | |
| — | | |
| 1,477 | | |
| 1,477 | | |
| — | | |
| 1,623 | | |
| 1,623 | | |
| — | | |
| 1,801 | | |
| 1,801 | |
| Interest & Commitment Fees | |
| 2,004 | | |
| — | | |
| 2,004 | | |
| 7,283 | | |
| — | | |
| 7,283 | | |
| 1,650 | | |
| — | | |
| 1,650 | | |
| 6,570 | | |
| — | | |
| 6,570 | |
| Total Expenses | |
| 27,489 | | |
| 1,830 | | |
| 29,319 | | |
| 101,760 | | |
| 4,537 | | |
| 106,297 | | |
| 24,333 | | |
| 2,816 | | |
| 27,149 | | |
| 96,260 | | |
| 5,986 | | |
| 102,246 | |
| | |
| | | |
| | | |
| | | |
| | | |
| | | |
| | | |
| | | |
| | | |
| | | |
| | | |
| | | |
| | |
| Income before Equity, Interest and Taxes | |
| 3,236 | | |
| 1,614 | | |
| 4,850 | | |
| 16,088 | | |
| 734 | | |
| 16,822 | | |
| 5,440 | | |
| 1,110 | | |
| 6,550 | | |
| 25,554 | | |
| (1,478 | ) | |
| 24,076 | |
| Interest Income | |
| 4 | | |
| — | | |
| 4 | | |
| 24 | | |
| 1 | | |
| 25 | | |
| 8 | | |
| — | | |
| 8 | | |
| 92 | | |
| 4 | | |
| 96 | |
| Equity Income SARs | |
| 229 | | |
| — | | |
| 229 | | |
| 1,266 | | |
| — | | |
| 1,266 | | |
| 284 | | |
| — | | |
| 284 | | |
| 1,994 | | |
| — | | |
| 1,994 | |
| Income before Taxes | |
| 3,469 | | |
| 1,614 | | |
| 5,083 | | |
| 17,378 | | |
| 735 | | |
| 18,113 | | |
| 5,732 | | |
| 1,110 | | |
| 6,842 | | |
| 27,640 | | |
| (1,474 | ) | |
| 26,166 | |
| Income Taxes | |
| 55 | | |
| 262 | | |
| 317 | | |
| 217 | | |
| — | | |
| 217 | | |
| 56 | | |
| 9 | | |
| 65 | | |
| 248 | | |
| (827 | ) | |
| (579 | ) |
| Income from continuing operations | |
| 3,414 | | |
| 1,352 | | |
| 4,766 | | |
| 17,161 | | |
| 735 | | |
| 17,896 | | |
| 5,676 | | |
| 1,101 | | |
| 6,777 | | |
| 27,392 | | |
| (647 | ) | |
| 26,745 | |
| Income from discontinued operations | |
| 1,054 | | |
| — | | |
| 1,054 | | |
| 4,197 | | |
| — | | |
| 4,197 | | |
| 1,056 | | |
| — | | |
| 1,056 | | |
| 703 | | |
| — | | |
| 703 | |
| Gain on sale of assets | |
| — | | |
| — | | |
| — | | |
| — | | |
| — | | |
| — | | |
| 424 | | |
| — | | |
| 424 | | |
| 424 | | |
| — | | |
| 424 | |
| Net Income (loss) | |
$ | 4,468 | | |
$ | 1,352 | | |
$ | 5,820 | | |
$ | 21,358 | | |
$ | 735 | | |
$ | 22,093 | | |
$ | 7,156 | | |
$ | 1,101 | | |
$ | 8,257 | | |
$ | 28,519 | | |
$ | (647 | ) | |
$ | 27,872 | |
| | |
| | | |
| | | |
| | | |
| | | |
| | | |
| | | |
| | | |
| | | |
| | | |
| | | |
| | | |
| | |
| Funds From Operations (FFO)* | |
| | | |
| | | |
| | | |
| | | |
| | | |
| | | |
| | | |
| | | |
| | | |
| | | |
| | | |
| | |
| Net Income | |
$ | 4,468 | | |
$ | 1,352 | | |
$ | 5,820 | | |
$ | 21,358 | | |
$ | 735 | | |
$ | 22,093 | | |
$ | 7,156 | | |
$ | 1,101 | | |
$ | 8,257 | | |
$ | 28,519 | | |
$ | (647 | ) | |
$ | 27,872 | |
| Gain on sale of assets, net | |
| — | | |
| — | | |
| — | | |
| — | | |
| — | | |
| — | | |
| (424 | ) | |
| — | | |
| (424 | ) | |
| (424 | ) | |
| — | | |
| (424 | ) |
| Equity in income of SARs | |
| (153 | ) | |
| — | | |
| (153 | ) | |
| (1,190 | ) | |
| — | | |
| (1,190 | ) | |
| (301 | ) | |
| — | | |
| (301 | ) | |
| (2,012 | ) | |
| — | | |
| (2,012 | ) |
| Cash received from SARs | |
| 1,247 | | |
| — | | |
| 1,247 | | |
| 5,170 | | |
| — | | |
| 5,170 | | |
| 1,371 | | |
| — | | |
| 1,371 | | |
| 5,628 | | |
| — | | |
| 5,628 | |
| Acquisition costs | |
| — | | |
| — | | |
| — | | |
| 125 | | |
| — | | |
| 125 | | |
| 4 | | |
| — | | |
| 4 | | |
| 643 | | |
| — | | |
| 643 | |
| Depreciation and amortization | |
| 10,570 | | |
| 35 | | |
| 10,605 | | |
| 40,551 | | |
| 173 | | |
| 40,724 | | |
| 10,129 | | |
| 39 | | |
| 10,168 | | |
| 39,529 | | |
| 123 | | |
| 39,652 | |
| Funds From Operations (FFO)* | |
| 16,132 | | |
| 1,387 | | |
| 17,519 | | |
| 66,014 | | |
| 908 | | |
| 66,922 | | |
| 17,935 | | |
| 1,140 | | |
| 19,075 | | |
| 71,883 | | |
| (524 | ) | |
| 71,359 | |
| | |
| | | |
| | | |
| | | |
| | | |
| | | |
| | | |
| | | |
| | | |
| | | |
| | | |
| | | |
| | |
| EPS | |
$ | 0.05 | | |
$ | 0.02 | | |
$ | 0.07 | | |
$ | 0.27 | | |
$ | 0.01 | | |
$ | 0.28 | | |
$ | 0.09 | | |
$ | 0.01 | | |
$ | 0.10 | | |
$ | 0.39 | | |
$ | (0.01 | ) | |
$ | 0.38 | |
| FFO per Share* | |
$ | 0.20 | | |
$ | 0.02 | | |
$ | 0.22 | | |
$ | 0.83 | | |
$ | 0.01 | | |
$ | 0.84 | | |
$ | 0.23 | | |
$ | 0.01 | | |
$ | 0.24 | | |
$ | 0.99 | | |
$ | (0.01 | ) | |
$ | 0.98 | |
| | |
| | | |
| | | |
| | | |
| | | |
| | | |
| | | |
| | | |
| | | |
| | | |
| | | |
| | | |
| | |
| Weighted Average Shares | |
| | | |
| | | |
| 80,187 | | |
| | | |
| | | |
| 79,826 | | |
| | | |
| | | |
| 79,681 | | |
| | | |
| | | |
| 73,001 | |
*See page 28 for a reconciliation of Net Income to FFO and FFO+GOS
and page 29 for definitions of FFO and FFO+GOS
| |
|
Segment Information*
($ in thousands except per share amounts)
|
| | |
Year Ended December 31, 2010 | |
Year Ended December 31, 2009 | |
Year Ended December 31, 2008 |
| | |
| Real | | |
| Investment | | |
| | | |
| Real | | |
| Investment | | |
| | | |
| Real | | |
| Investment | | |
| | |
| | |
| Estate | | |
| Banking | | |
| Total | | |
| Estate | | |
| Banking | | |
| Total | | |
| Estate | | |
| Banking | | |
| Total | |
| Revenue: | |
| | | |
| | | |
| | | |
| | | |
| | | |
| | | |
| | | |
| | | |
| | |
| Rental Income | |
$ | 115,320 | | |
$ | — | | |
$ | 115,320 | | |
$ | 120,013 | | |
$ | — | | |
$ | 120,013 | | |
$ | 111,198 | | |
$ | — | | |
$ | 111,198 | |
| Syndication Fees | |
| — | | |
| 2,544 | | |
| 2,544 | | |
| — | | |
| 2,428 | | |
| 2,428 | | |
| — | | |
| 3,766 | | |
| 3,766 | |
| Transaction Fees | |
| — | | |
| 2,727 | | |
| 2,727 | | |
| — | | |
| 2,080 | | |
| 2,080 | | |
| — | | |
| 3,641 | | |
| 3,641 | |
| Management Fees & Interest Income | |
| 2,439 | | |
| — | | |
| 2,439 | | |
| 1,740 | | |
| — | | |
| 1,740 | | |
| 1,739 | | |
| — | | |
| 1,739 | |
| Other Income | |
| 89 | | |
| — | | |
| 89 | | |
| 61 | | |
| — | | |
| 61 | | |
| 72 | | |
| — | | |
| 72 | |
| | |
| | | |
| | | |
| | | |
| | | |
| | | |
| | | |
| | | |
| | | |
| | |
| Total Revenue | |
| 117,848 | | |
| 5,271 | | |
| 123,119 | | |
| 121,814 | | |
| 4,508 | | |
| 126,322 | | |
| 113,009 | | |
| 7,407 | | |
| 120,416 | |
| | |
| | | |
| | | |
| | | |
| | | |
| | | |
| | | |
| | | |
| | | |
| | |
| Expenses | |
| | | |
| | | |
| | | |
| | | |
| | | |
| | | |
| | | |
| | | |
| | |
| Rental Operating Expenses | |
| 33,609 | | |
| — | | |
| 33,609 | | |
| 30,810 | | |
| — | | |
| 30,810 | | |
| 28,999 | | |
| — | | |
| 28,999 | |
| Real Estate Taxes and Insurance | |
| 18,170 | | |
| — | | |
| 18,170 | | |
| 18,981 | | |
| — | | |
| 18,981 | | |
| 17,740 | | |
| — | | |
| 17,740 | |
| Depreciation and Amortization | |
| 36,299 | | |
| 173 | | |
| 36,472 | | |
| 35,447 | | |
| 123 | | |
| 35,570 | | |
| 30,222 | | |
| 138 | | |
| 30,360 | |
| Selling, general and administrative | |
| 6,399 | | |
| 2,887 | | |
| 9,286 | | |
| 4,452 | | |
| 4,062 | | |
| 8,514 | | |
| 4,229 | | |
| 4,039 | | |
| 8,268 | |
| Commissions and Broker Expenses | |
| — | | |
| 1,477 | | |
| 1,477 | | |
| — | | |
| 1,801 | | |
| 1,801 | | |
| 100 | | |
| 2,051 | | |
| 2,151 | |
| Interest & Commitment Fees | |
| 7,283 | | |
| — | | |
| 7,283 | | |
| 6,570 | | |
| — | | |
| 6,570 | | |
| 4,921 | | |
| — | | |
| 4,921 | |
| Total Expenses | |
| 101,760 | | |
| 4,537 | | |
| 106,297 | | |
| 96,260 | | |
| 5,986 | | |
| 102,246 | | |
| 86,211 | | |
| 6,228 | | |
| 92,439 | |
| | |
| | | |
| | | |
| | | |
| | | |
| | | |
| | | |
| | | |
| | | |
| | |
| Income before Equity, Interest and Taxes | |
| 16,088 | | |
| 734 | | |
| 16,822 | | |
| 25,554 | | |
| (1,478 | ) | |
| 24,076 | | |
| 26,798 | | |
| 1,179 | | |
| 27,977 | |
| Interest Income | |
| 24 | | |
| 1 | | |
| 25 | | |
| 92 | | |
| 4 | | |
| 96 | | |
| 709 | | |
| 36 | | |
| 745 | |
| Equity Income SARs | |
| 1,266 | | |
| — | | |
| 1,266 | | |
| 1,994 | | |
| — | | |
| 1,994 | | |
| 2,747 | | |
| — | | |
| 2,747 | |
| Income before Taxes | |
| 17,378 | | |
| 735 | | |
| 18,113 | | |
| 27,640 | | |
| (1,474 | ) | |
| 26,166 | | |
| 30,254 | | |
| 1,215 | | |
| 31,469 | |
| Income Taxes | |
| 217 | | |
| — | | |
| 217 | | |
| 248 | | |
| (827 | ) | |
| (579 | ) | |
| 246 | | |
| (736 | ) | |
| (490 | ) |
| Income from continuing operations | |
| 17,161 | | |
| 735 | | |
| 17,896 | | |
| 27,392 | | |
| (647 | ) | |
| 26,745 | | |
| 30,008 | | |
| 1,951 | | |
| 31,959 | |
| Income from discontinued operations | |
| 4,197 | | |
| — | | |
| 4,197 | | |
| 703 | | |
| — | | |
| 703 | | |
| — | | |
| — | | |
| — | |
| Gain on sale of assets | |
| — | | |
| — | | |
| — | | |
| 424 | | |
| — | | |
| 424 | | |
| — | | |
| — | | |
| — | |
| Net Income | |
$ | 21,358 | | |
$ | 735 | | |
$ | 22,093 | | |
$ | 28,519 | | |
$ | (647 | ) | |
$ | 27,872 | | |
$ | 30,008 | | |
$ | 1,951 | | |
$ | 31,959 | |
| | |
| | | |
| | | |
| | | |
| | | |
| | | |
| | | |
| | | |
| | | |
| | |
| Funds From Operations (FFO)* | |
| | | |
| | | |
| | | |
| | | |
| | | |
| | | |
| | | |
| | | |
| | |
| Net Income | |
$ | 21,358 | | |
$ | 735 | | |
$ | 22,093 | | |
$ | 28,519 | | |
$ | (647 | ) | |
$ | 27,872 | | |
$ | 30,008 | | |
$ | 1,951 | | |
$ | 31,959 | |
| Gain on sale of assets, net | |
| — | | |
| — | | |
| — | | |
| (424 | ) | |
| — | | |
| (424 | ) | |
| — | | |
| — | | |
| — | |
| Equity in income of SARs | |
| (1,190 | ) | |
| — | | |
| (1,190 | ) | |
| (2,012 | ) | |
| — | | |
| (2,012 | ) | |
| (2,747 | ) | |
| — | | |
| (2,747 | ) |
| Cash received from SARs | |
| 5,170 | | |
| — | | |
| 5,170 | | |
| 5,628 | | |
| — | | |
| 5,628 | | |
| 5,348 | | |
| — | | |
| 5,348 | |
| Acquisition costs | |
| 125 | | |
| — | | |
| 125 | | |
| 643 | | |
| — | | |
| 643 | | |
| — | | |
| — | | |
| — | |
| Depreciation and amortization | |
| 40,551 | | |
| 173 | | |
| 40,724 | | |
| 39,529 | | |
| 123 | | |
| 39,652 | | |
| 34,505 | | |
| 138 | | |
| 34,643 | |
| Funds From Operations (FFO)* | |
| 66,014 | | |
| 908 | | |
| 66,922 | | |
| 71,883 | | |
| (524 | ) | |
| 71,359 | | |
| 67,114 | | |
| 2,089 | | |
| 69,203 | |
| | |
| | | |
| | | |
| | | |
| | | |
| | | |
| | | |
| | | |
| | | |
| | |
| EPS | |
$ | 0.27 | | |
$ | 0.01 | | |
$ | 0.28 | | |
$ | 0.39 | | |
$ | (0.01 | ) | |
$ | 0.38 | | |
$ | 0.43 | | |
$ | 0.03 | | |
$ | 0.45 | |
| FFO per Share* | |
$ | 0.83 | | |
$ | 0.01 | | |
$ | 0.84 | | |
$ | 0.99 | | |
$ | (0.01 | ) | |
$ | 0.98 | | |
$ | 0.95 | | |
$ | 0.03 | | |
$ | 0.98 | |
| | |
| | | |
| | | |
| | | |
| | | |
| | | |
| | | |
| | | |
| | | |
| | |
| Weighted Average Shares | |
| | | |
| | | |
| 79,826 | | |
| | | |
| | | |
| 73,001 | | |
| | | |
| | | |
| 70,481 | |
*See page 28 for a reconciliation of Net Income to FFO and FFO+GOS
and page 29 for definitions of FFO and FFO+GOS
| |
|
Property Net Operating Income (NOI):
Cash and GAAP Basis
(in thousands)
|
Property NOI Cash*
| | |
| |
| |
| |
| |
| |
| |
Year | |
| |
| |
| |
| |
Year |
| | |
| |
| |
Three Months Ended | |
Ended | |
Three Months Ended | |
Ended |
| | |
| |
31-Dec-10 | |
| |
| |
| |
| |
| |
| |
| |
| |
| |
|
| Region | |
Division | |
Sq Feet | |
31-Mar-10 | |
30-Jun-10 | |
30-Sep-10 | |
31-Dec-10 | |
2010 | |
31-Mar-09 | |
30-Jun-09 | |
30-Sep-09 | |
31-Dec-09 | |
2009 |
| | |
| |
| |
| |
| |
| |
| |
| |
| |
| |
| |
| |
|
| Eastern | |
| Mideast | | |
| 1,543 | | |
$ | 4,031 | | |
$ | 4,390 | | |
$ | 5,551 | | |
$ | 4,931 | | |
$ | 18,903 | | |
$ | 3,740 | | |
$ | 3,803 | | |
$ | 4,401 | | |
$ | 4,839 | | |
$ | 16,783 | |
| | |
| | | |
| | | |
| | | |
| | | |
| | | |
| | | |
| | | |
| | | |
| | | |
| | | |
| | | |
| | |
| Midwest | |
| East North Central | | |
| 597 | | |
| 1,103 | | |
| 1,574 | | |
| 1,184 | | |
| 1,123 | | |
| 4,984 | | |
| 1,524 | | |
| 1,578 | | |
| 1,108 | | |
| 1,129 | | |
| 5,339 | |
| |
| West North Central | | |
| 1,104 | | |
| 2,034 | | |
| 2,000 | | |
| 2,991 | | |
| 3,028 | | |
| 10,053 | | |
| 1,689 | | |
| 1,758 | | |
| 2,653 | | |
| 1,867 | | |
| 7,967 | |
| | |
| | | |
| 1,701 | | |
| 3,137 | | |
| 3,574 | | |
| 4,175 | | |
| 4,151 | | |
| 15,037 | | |
| 3,213 | | |
| 3,336 | | |
| 3,761 | | |
| 2,996 | | |
| 13,306 | |
| | |
| | | |
| | | |
| | | |
| | | |
| | | |
| | | |
| | | |
| | | |
| | | |
| | | |
| | | |
| | |
| South | |
| Southeast | | |
| 600 | | |
| 2,307 | | |
| 2,251 | | |
| 2,285 | | |
| 1,917 | | |
| 8,760 | | |
| 2,220 | | |
| 2,213 | | |
| 2,353 | | |
| 2,138 | | |
| 8,924 | |
| |
| Southwest | | |
| 1,489 | | |
| 4,234 | | |
| 4,238 | | |
| 3,597 | | |
| 3,564 | | |
| 15,633 | | |
| 5,203 | | |
| 4,953 | | |
| 4,718 | | |
| 4,370 | | |
| 19,244 | |
| | |
| | | |
| 2,089 | | |
| 6,541 | | |
| 6,489 | | |
| 5,882 | | |
| 5,481 | | |
| 24,393 | | |
| 7,423 | | |
| 7,166 | | |
| 7,071 | | |
| 6,508 | | |
| 28,168 | |
| | |
| | | |
| | | |
| | | |
| | | |
| | | |
| | | |
| | | |
| | | |
| | | |
| | | |
| | | |
| | |
| West | |
| Mountain | | |
| 790 | | |
| 3,254 | | |
| 2,212 | | |
| 810 | | |
| 894 | | |
| 7,170 | | |
| 3,194 | | |
| 3,519 | | |
| 3,003 | | |
| 3,126 | | |
| 12,842 | |
| |
| Pacific | | |
| 299 | | |
| 443 | | |
| 491 | | |
| 498 | | |
| 480 | | |
| 1,912 | | |
| 375 | | |
| 311 | | |
| 460 | | |
| 364 | | |
| 1,510 | |
| | |
| | | |
| 1,089 | | |
| 3,697 | | |
| 2,703 | | |
| 1,308 | | |
| 1,374 | | |
| 9,082 | | |
| 3,569 | | |
| 3,830 | | |
| 3,463 | | |
| 3,490 | | |
| 14,352 | |
| | |
| | | |
| | | |
| | | |
| | | |
| | | |
| | | |
| | | |
| | | |
| | | |
| | | |
| | | |
| | |
| Total | |
| | | |
| 6,422 | | |
$ | 17,406 | | |
$ | 17,156 | | |
$ | 16,916 | | |
$ | 15,937 | | |
$ | 67,415 | | |
$ | 17,945 | | |
$ | 18,135 | | |
$ | 18,696 | | |
$ | 17,833 | | |
$ | 72,609 | |
Property NOI GAAP*
| | |
| |
| |
| |
| |
| |
| |
Year | |
| |
| |
| |
| |
Year |
| | |
| |
| |
Three Months Ended | |
Ended | |
Three Months Ended | |
Ended |
| | |
| |
31-Dec-10 | |
| |
| |
| |
| |
| |
| |
| |
| |
| |
|
| Region | |
Division | |
Sq Feet | |
31-Mar-10 | |
30-Jun-10 | |
30-Sep-10 | |
31-Dec-10 | |
2010 | |
31-Mar-09 | |
30-Jun-09 | |
30-Sep-09 | |
31-Dec-09 | |
2009 |
| | |
| |
| |
| |
| |
| |
| |
| |
| |
| |
| |
| |
|
| Eastern | |
| Mideast | | |
| 1,543 | | |
$ | 4,666 | | |
$ | 5,002 | | |
$ | 5,992 | | |
$ | 5,362 | | |
$ | 21,022 | | |
$ | 3,749 | | |
$ | 3,726 | | |
$ | 4,483 | | |
$ | 5,232 | | |
$ | 17,190 | |
| | |
| | | |
| | | |
| | | |
| | | |
| | | |
| | | |
| | | |
| | | |
| | | |
| | | |
| | | |
| | |
| Midwest | |
| East North Central | | |
| 597 | | |
| 1,110 | | |
| 1,602 | | |
| 1,210 | | |
| 1,166 | | |
| 5,088 | | |
| 1,570 | | |
| 1,592 | | |
| 1,161 | | |
| 1,191 | | |
| 5,514 | |
| |
| West North Central | | |
| 1,104 | | |
| 2,164 | | |
| 2,106 | | |
| 3,136 | | |
| 3,135 | | |
| 10,541 | | |
| 1,606 | | |
| 1,667 | | |
| 2,626 | | |
| 2,016 | | |
| 7,915 | |
| | |
| | | |
| 1,701 | | |
| 3,274 | | |
| 3,708 | | |
| 4,346 | | |
| 4,301 | | |
| 15,629 | | |
| 3,176 | | |
| 3,259 | | |
| 3,787 | | |
| 3,207 | | |
| 13,429 | |
| | |
| | | |
| | | |
| | | |
| | | |
| | | |
| | | |
| | | |
| | | |
| | | |
| | | |
| | | |
| | |
| South | |
| Southeast | | |
| 600 | | |
| 2,356 | | |
| 2,355 | | |
| 2,359 | | |
| 2,033 | | |
| 9,103 | | |
| 2,391 | | |
| 2,343 | | |
| 2,477 | | |
| 2,245 | | |
| 9,456 | |
| |
| Southwest | | |
| 1,489 | | |
| 4,404 | | |
| 4,395 | | |
| 3,797 | | |
| 3,778 | | |
| 16,374 | | |
| 5,265 | | |
| 4,828 | | |
| 4,820 | | |
| 4,643 | | |
| 19,556 | |
| | |
| | | |
| 2,089 | | |
| 6,760 | | |
| 6,750 | | |
| 6,156 | | |
| 5,811 | | |
| 25,477 | | |
| 7,656 | | |
| 7,171 | | |
| 7,297 | | |
| 6,888 | | |
| 29,012 | |
| | |
| | | |
| | | |
| | | |
| | | |
| | | |
| | | |
| | | |
| | | |
| | | |
| | | |
| | | |
| | |
| West | |
| Mountain | | |
| 790 | | |
| 3,229 | | |
| 2,502 | | |
| 1,100 | | |
| 1,231 | | |
| 8,062 | | |
| 3,334 | | |
| 3,548 | | |
| 3,019 | | |
| 3,114 | | |
| 13,015 | |
| |
| Pacific | | |
| 299 | | |
| 497 | | |
| 533 | | |
| 524 | | |
| 513 | | |
| 2,067 | | |
| 404 | | |
| 339 | | |
| 515 | | |
| 425 | | |
| 1,683 | |
| | |
| | | |
| 1,089 | | |
| 3,726 | | |
| 3,035 | | |
| 1,624 | | |
| 1,744 | | |
| 10,129 | | |
| 3,738 | | |
| 3,887 | | |
| 3,534 | | |
| 3,539 | | |
| 14,698 | |
| | |
| | | |
| | | |
| | | |
| | | |
| | | |
| | | |
| | | |
| | | |
| | | |
| | | |
| | | |
| | |
| Total | |
| | | |
| 6,422 | | |
$ | 18,426 | | |
$ | 18,495 | | |
$ | 18,118 | | |
$ | 17,218 | | |
$ | 72,257 | | |
$ | 18,319 | | |
$ | 18,043 | | |
$ | 19,101 | | |
$ | 18,866 | | |
$ | 74,329 | |
*See page 32 for a reconciliation and definition of Net Income to
Property NOI cash and Property NOI GAAP.
| |
|
Capital Analysis
(in thousands, except per share amounts)
|
| | |
31-Mar-10 | |
30-Jun-10 | |
30-Sep-10 | |
31-Dec-10 | |
31-Mar-09 | |
30-Jun-09 | |
30-Sep-09 | |
31-Dec-09 |
| Market Data: | |
| | | |
| | | |
| | | |
| | | |
| | | |
| | | |
| | | |
| | |
| Shares Outstanding | |
| 79,681 | | |
| 79,681 | | |
| 79,837 | | |
| 81,437 | | |
| 70,481 | | |
| 70,481 | | |
| 79,681 | | |
| 79,681 | |
| Closing market price per share | |
$ | 14.43 | | |
$ | 11.81 | | |
$ | 12.42 | | |
$ | 14.25 | | |
$ | 12.30 | | |
$ | 13.25 | | |
$ | 13.10 | | |
$ | 14.61 | |
| Market capitalization | |
$ | 1,149,793 | | |
$ | 941,029 | | |
$ | 991,581 | | |
$ | 1,160,483 | | |
$ | 866,913 | | |
$ | 933,869 | | |
$ | 1,043,817 | | |
$ | 1,164,135 | |
| Total Debt | |
| 194,968 | | |
| 237,968 | | |
| 242,968 | | |
$ | 284,118 | | |
| 147,468 | | |
| 199,038 | | |
| 166,008 | | |
| 184,008 | |
| Total Market Capitalization | |
$ | 1,344,761 | | |
$ | 1,178,997 | | |
$ | 1,234,549 | | |
$ | 1,444,601 | | |
$ | 1,014,381 | | |
$ | 1,132,907 | | |
$ | 1,209,825 | | |
$ | 1,348,143 | |
| | |
| | | |
| | | |
| | | |
| | | |
| | | |
| | | |
| | | |
| | |
| Dividend Data: | |
| | | |
| | | |
| | | |
| | | |
| | | |
| | | |
| | | |
| | |
| Total dividends paid | |
$ | 15,139 | | |
$ | 15,139 | | |
$ | 15,139 | | |
$ | 15,169 | | |
$ | 13,391 | | |
$ | 13,391 | | |
$ | 13,391 | | |
$ | 15,140 | |
| Common dividend per share | |
$ | 0.19 | | |
$ | 0.19 | | |
$ | 0.19 | | |
$ | 0.19 | | |
$ | 0.19 | | |
$ | 0.19 | | |
$ | 0.19 | | |
$ | 0.19 | |
| Quarterly dividend as a % of FFO* | |
| 90% | | |
| 90% | | |
| 95% | | |
| 86% | | |
| 76% | | |
| 79% | | |
| 76% | | |
| 79% | |
| | |
| | | |
| | | |
| | | |
| | | |
| | | |
| | | |
| | | |
| | |
| Liquidity: | |
| | | |
| | | |
| | | |
| | | |
| | | |
| | | |
| | | |
| | |
| Cash and cash equivalents | |
$ | 22,815 | | |
$ | 21,487 | | |
$ | 20,554 | | |
$ | 68,213 | | |
$ | 27,650 | | |
$ | 24,542 | | |
$ | 26,385 | | |
$ | 27,404 | |
| Revolving credit facilities: | |
| | | |
| | | |
| | | |
| | | |
| | | |
| | | |
| | | |
| | |
| Gross potential available under current credit facilities | |
| 250,000 | | |
| 250,000 | | |
| 250,000 | | |
| 250,000 | | |
| 250,000 | | |
| 250,000 | | |
| 250,000 | | |
| 250,000 | |
| Less: | |
| | | |
| | | |
| | | |
| | | |
| | | |
| | | |
| | | |
| | |
| Outstanding balance | |
| (119,968 | ) | |
| (162,968 | ) | |
| (167,968 | ) | |
| (209,968 | ) | |
| (72,468 | ) | |
| (124,038 | ) | |
| (91,008 | ) | |
| (109,008 | ) |
| Total Liquidity | |
$ | 152,847 | | |
$ | 108,519 | | |
$ | 102,586 | | |
$ | 108,245 | | |
$ | 205,182 | | |
$ | 150,504 | | |
$ | 185,377 | | |
$ | 168,396 | |
*See page 28 for a reconciliation of Net Income to FFO and FFO+GOS
and page 29 for definitions of FFO and FFO+GOS
| |
|
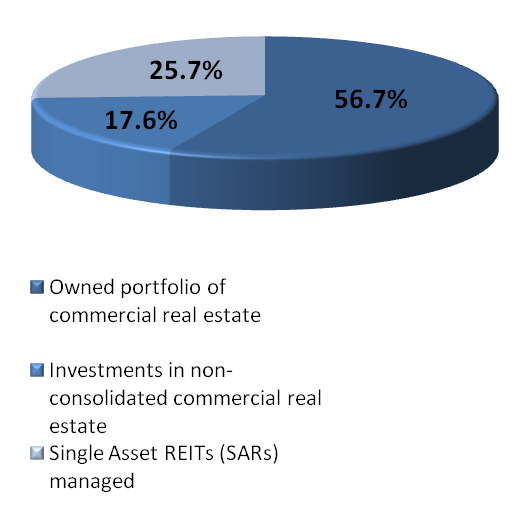
Portfolio Overview |
| |
31-Dec-10 |
30-Sep-10 |
30-Jun-10 |
31-Mar-10 |
31-Dec-09 |
30-Sep-09 |
30-Jun-09 |
31-Mar-09 |
| Owned portfolio of commercial real estate: |
|
|
|
|
|
|
|
|
| Number of properties (1) |
33 |
33 |
33 |
32 |
32 |
32 |
31 |
29 |
| Square feet |
6,422,357 |
6,417,299 |
6,418,835 |
5,942,299 |
5,942,414 |
5,934,624 |
5,682,011 |
5,417,515 |
| Leased percentage |
86% |
82% |
85% |
85% |
84% |
90% |
92% |
93% |
| |
|
|
|
|
|
|
|
|
| Investments in non-consolidated commercial real estate: |
|
|
|
|
|
|
|
|
| Number of properties |
3 |
3 |
3 |
3 |
3 |
3 |
3 |
2 |
| Square feet |
1,995,913 |
1,998,519 |
1,998,519 |
1,995,041 |
1,995,041 |
1,995,041 |
1,994,686 |
1,461,224 |
| Leased percentage |
77% |
76% |
77% |
78% |
78% |
78% |
78% |
79% |
| |
|
|
|
|
|
|
|
|
| Single Asset REITs (SARs) managed: |
|
|
|
|
|
|
|
|
| Number of properties |
12 |
11 |
11 |
11 |
11 |
9 |
9 |
10 |
| Square feet * |
2,915,896 |
2,702,287 |
2,406,370 |
2,406,370 |
2,406,370 |
2,155,201 |
2,154,079 |
2,684,561 |
| Leased percentage* |
75% |
73% |
76% |
76% |
91% |
90% |
87% |
88% |
| |
|
|
|
|
|
|
|
|
| Total owned, investments and managed properties: |
|
|
|
|
|
|
|
|
| Number of properties |
48 |
47 |
47 |
46 |
46 |
44 |
43 |
41 |
| Square feet * |
11,334,166 |
11,118,105 |
10,823,724 |
10,343,710 |
10,343,825 |
10,084,866 |
9,830,776 |
9,563,300 |
| Leased percentage* |
81% |
79% |
82% |
82% |
85% |
88% |
88% |
90% |
(1) Includes asset held for sale
*Prior to September 30, 2010, excludes a property that completed
construction on July 9, 2010 with approximately 295,891 square feet
| |
|
Regional Analysis and Map
|
| Owned: |
|
|
|
|
| Name |
City |
State |
Region |
Square Feet |
| Park Seneca |
Charlotte |
NC |
East |
109,550 |
| Forest Park |
Charlotte |
NC |
East |
62,212 |
| Meadow Point |
Chantilly |
VA |
East |
138,537 |
| Stonecroft |
Chantilly |
VA |
East |
111,469 |
| Fairview (1) |
Falls Church |
VA |
East |
252,613 |
| Innsbrook |
Glen Allen |
VA |
East |
308,803 |
| East Baltimore |
Baltimore |
MD |
East |
325,445 |
| Loudoun Tech Center |
Dulles |
VA |
East |
135,888 |
| Bollman Place (2) |
Savage |
MD |
East |
98,745 |
| Southfield Centre |
Southfield |
MI |
MidWest |
214,697 |
| Northwest Point |
Elk Grove Village |
IL |
MidWest |
176,848 |
| River Crossing |
Indianapolis |
IN |
MidWest |
205,059 |
| Timberlake |
Chesterfield |
MO |
MidWest |
232,766 |
| Timberlake East |
Chesterfield |
MO |
MidWest |
116,197 |
| Lakeside Crossing |
Maryland Heights |
MO |
MidWest |
127,778 |
| Eden Bluff |
Eden Prairie |
MN |
MidWest |
153,028 |
| 121 South 8th Street |
Minneapolis |
MN |
MidWest |
474,661 |
| Blue Lagoon Drive |
Miami |
FL |
South |
212,619 |
| One Overton Place |
Atlanta |
GA |
South |
387,267 |
| Willow Bend Office Center |
Plano |
TX |
South |
116,622 |
| Park Ten |
Houston |
TX |
South |
155,715 |
| Addison Circle |
Addison |
TX |
South |
293,787 |
| Collins Crossing |
Richardson |
TX |
South |
298,766 |
| Eldridge Green |
Houston |
TX |
South |
248,399 |
| Park Ten Phase II |
Houston |
TX |
South |
156,746 |
| Liberty Plaza |
Addison |
TX |
South |
218,934 |
| Centennial Technology Center |
Colorado Springs |
CO |
West |
110,730 |
| 380 Interlocken |
Broomfield |
CO |
West |
240,184 |
| Greenwood Plaza |
Englewood |
CO |
West |
197,527 |
| 390 Interlocken |
Broomfield |
CO |
West |
241,516 |
| Hillview Center |
Milpitas |
CA |
West |
36,288 |
| Federal Way |
Federal Way |
WA |
West |
117,010 |
| Montague Business Center |
San Jose |
CA |
West |
145,951 |
| Total |
|
|
|
6,422,357 |
| |
| Managed: |
|
|
|
|
| Name |
City |
State |
Region |
Square Feet |
| 1441 Main Street |
Columbia |
SC |
East |
267,982 |
| 303 East Wacker Drive |
Chicago |
IL |
MidWest |
844,953 |
| Monument Circle |
Indianapolis |
IN |
MidWest |
213,609 |
| 505 Waterford |
Plymouth |
MN |
MidWest |
256,348 |
| 50 South Tenth Street |
Minneapolis |
MN |
MidWest |
498,768 |
| Grand Boulevard |
Kansas City |
MO |
MidWest |
532,453 |
| Lakeside Crossing II |
Maryland Heights |
MO |
MidWest |
116,000 |
| Centre Pointe V |
West Chester |
OH |
MidWest |
135,936 |
| Satellite Place |
Duluth |
GA |
South |
134,785 |
| 5601 Executive Drive |
Irving |
TX |
South |
152,121 |
| Galleria North |
Dallas |
TX |
South |
379,518 |
| Energy Tower I |
Houston |
TX |
South |
325,796 |
| Phoenix Tower |
Houston |
TX |
South |
618,507 |
| Highland Place I |
Centennial |
CO |
West |
139,142 |
| 385 Interlocken |
Broomfield |
CO |
West |
295,891 |
| Total |
|
|
|
4,911,809 |
(1) Asset held for sale
(2) Industrial property, all others are office properties
| Properties by Division/Region |
| ($ in thousands) |
| |
|
|
|
|
|
|
NBV (a) |
|
% Leased |
| |
# of Properties |
|
Square Feet |
|
% of Portfolio |
|
31-Dec-10 |
|
31-Dec-10 |
| |
|
|
|
|
|
|
|
|
|
| East Region Total (b) |
9 |
|
1,543,262 |
|
24.0 |
|
$ 236,058 |
|
87.5% |
| East North Central Division |
3 |
|
596,604 |
|
9.3 |
|
79,212 |
|
84.3% |
| West North Central |
5 |
|
1,104,430 |
|
17.2 |
|
108,573 |
|
96.4% |
| Midwest Region Total |
8 |
|
1,701,034 |
|
26.5 |
|
187,785 |
|
92.1% |
| Southeast |
2 |
|
599,886 |
|
9.3 |
|
120,853 |
|
95.1% |
| Southwest |
7 |
|
1,488,969 |
|
23.2 |
|
221,569 |
|
82.0% |
| South Region Total |
9 |
|
2,088,855 |
|
32.5 |
|
342,422 |
|
85.7% |
| Mountain |
4 |
|
789,957 |
|
12.3 |
|
126,201 |
|
72.0% |
| Pacific |
3 |
|
299,249 |
|
4.7 |
|
35,470 |
|
74.0% |
| West Region Total |
7 |
|
1,089,206 |
|
17.0 |
|
161,671 |
|
72.5% |
| |
|
|
|
|
|
|
|
|
|
| Grand Total |
33 |
|
6,422,357 |
|
100.0 |
|
$ 927,936 |
|
85.6% |
(a) NBV is for real estate assets, excluding intangibles
(b) Includes asset held for sale
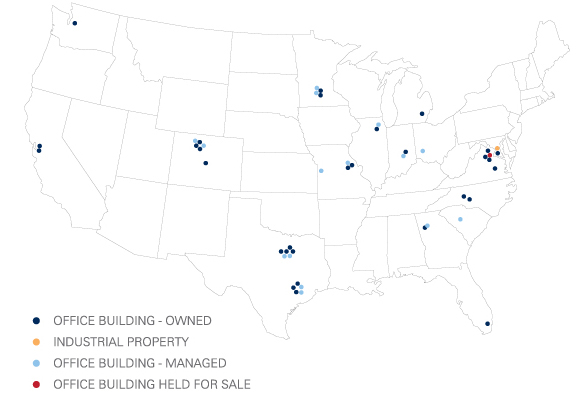
| |
|
Owned Property List
(in thousands)
|
| |
|
|
|
|
|
NBV (1) |
% Leased |
| Region |
Division |
Name |
City |
State |
S.F. |
31-Dec-10 |
31-Dec-10 |
| |
|
|
|
|
|
|
|
| West |
Pacific |
Hillview Center |
Milpitas |
CA |
36 |
4,174 |
100.0% |
| West |
Pacific |
Montague |
San Jose |
CA |
146 |
16,884 |
100.0% |
| West |
Mountain |
380 Interlocken |
Broomfield |
CO |
240 |
42,800 |
85.1% |
| West |
Mountain |
390 Interlocken |
Broomfield |
CO |
241 |
42,980 |
98.3% |
| West |
Mountain |
Centennial Technology Center |
Colorado Springs |
CO |
111 |
11,479 |
66.9% |
| West |
Mountain |
Greenwood Plaza |
Englewood |
CO |
198 |
28,941 |
26.6% |
| South |
Southeast |
Blue Lagoon Drive |
Miami |
FL |
213 |
46,986 |
100.0% |
| South |
Southeast |
One Overton Place |
Atlanta |
GA |
387 |
73,867 |
92.4% |
| MidWest |
East North Central |
Northwest Point |
Elk Grove Village |
IL |
177 |
28,794 |
100.0% |
| MidWest |
East North Central |
River Crossing |
Indianapolis |
IN |
205 |
35,761 |
97.5% |
| East |
Mideast |
East Baltimore |
Baltimore |
MD |
325 |
55,689 |
84.5% |
| East |
Mideast |
Bollman Place |
Savage |
MD |
99 |
4,910 |
100.0% |
| MidWest |
East North Central |
Southfield Centre |
Southfield |
MI |
215 |
14,658 |
58.6% |
| MidWest |
West North Central |
Eden Bluff |
Eden Prairie |
MN |
153 |
14,359 |
100.0% |
| MidWest |
West North Central |
121 South 8th Street |
Minneapolis |
MN |
474 |
23,878 |
92.1% |
| MidWest |
West North Central |
Timberlake |
Chesterfield |
MO |
233 |
35,193 |
99.0% |
| MidWest |
West North Central |
Timberlake East |
Chesterfield |
MO |
116 |
17,913 |
100.0% |
| MidWest |
West North Central |
Lakeside Crossing |
Maryland Heights |
MO |
128 |
17,229 |
100.0% |
| East |
Mideast |
Park Seneca |
Charlotte |
NC |
110 |
7,547 |
81.0% |
| East |
Mideast |
Forest Park |
Charlotte |
NC |
62 |
6,233 |
100.0% |
| South |
Southwest |
Addison Circle |
Addison |
TX |
294 |
46,730 |
95.8% |
| South |
Southwest |
Liberty Plaza |
Addison |
TX |
219 |
24,419 |
73.7% |
| South |
Southwest |
Park Ten |
Houston |
TX |
156 |
18,378 |
48.2% |
| South |
Southwest |
Eldridge Green |
Houston |
TX |
248 |
42,497 |
100.0% |
| South |
Southwest |
Park Ten Phase II |
Houston |
TX |
157 |
30,899 |
97.8% |
| South |
Southwest |
Willow Bend Office Center |
Plano |
TX |
117 |
17,586 |
55.5% |
| South |
Southwest |
Collins Crossing |
Richardson |
TX |
299 |
41,061 |
79.1% |
| East |
Mideast |
Meadow Point |
Chantilly |
VA |
138 |
23,424 |
97.9% |
| East |
Mideast |
Stonecroft |
Chantilly |
VA |
111 |
19,412 |
100.0% |
| East |
Mideast |
Loudoun Tech Center |
Dulles |
VA |
136 |
17,417 |
100.0% |
| East |
Mideast |
Fairview (2) |
Falls Church |
VA |
253 |
60,328 |
100.0% |
| East |
Mideast |
Innsbrook |
Glen Allen |
VA |
309 |
41,098 |
61.4% |
| West |
Pacific |
Federal Way |
Federal Way |
WA |
117 |
14,412 |
33.6% |
| |
|
|
|
|
6,422 |
$ 927,936 |
85.6% |
(1) NBV is for real estate assets, excluding intangibles
(2) Asset held for sale
| |
|
Properties with Annualized Rent per Square Foot
(includes
asset held for sale)
|
| |
|
|
|
|
|
|
|
|
|
|
|
|
Percentage |
|
|
|
Average |
|
| |
|
|
|
|
|
|
Year Built |
|
|
|
|
|
Leased
as of |
|
Annualized Rent |
|
Annualized |
|
| |
|
|
|
|
|
|
or |
|
Net Rentable |
|
Leased |
|
December 31, |
|
as of December 31, |
|
Rent per Leased |
|
| Property Name |
|
City |
|
State |
Type |
|
Renovated |
|
Square Feet |
|
Sq. Ft. |
|
2010 (a) |
|
2010 (b) |
|
Square Feet (c) |
|
| |
|
|
|
|
|
|
|
|
|
|
|
|
|
|
|
|
|
|
| Park Seneca |
|
Charlotte |
|
NC |
Office |
|
1969 |
|
109,550 |
|
88,770 |
|
81.0% |
|
1,438,039 |
|
$16.20 |
|
| Forest Park |
|
Charlotte |
|
NC |
Office |
|
1999 |
|
62,212 |
|
62,212 |
|
100.0% |
|
987,940 |
|
15.88 |
|
| Meadow Point |
|
Chantilly |
|
VA |
Office |
|
1999 |
|
138,537 |
|
135,664 |
|
97.9% |
|
2,379,464 |
|
17.54 |
|
| Innsbrook |
|
Glen Allen |
|
VA |
Office |
|
1999 |
|
308,803 |
|
189,686 |
|
61.4% |
|
1,273,806 |
|
6.72 |
(b) |
| East Baltimore |
|
Baltimore |
|
MD |
Office |
|
1989 |
|
325,445 |
|
275,113 |
|
84.5% |
|
7,289,593 |
|
26.50 |
|
| Loudoun Tech Center |
|
Dulles |
|
VA |
Office |
|
1999 |
|
135,888 |
|
135,888 |
|
100.0% |
|
1,736,340 |
|
12.78 |
|
| Bollman Place |
|
Savage |
|
MD |
Industrial |
|
1984 |
|
98,745 |
|
98,745 |
|
100.0% |
|
624,068 |
|
6.32 |
|
| Stonecroft |
|
Chantilly |
|
VA |
Office |
|
2008 |
|
111,469 |
|
111,469 |
|
100.0% |
|
4,043,600 |
|
36.28 |
|
| Fairview Park |
|
Falls Church |
|
VA |
Office |
|
2001 |
|
252,613 |
|
252,613 |
|
100.0% |
|
6,644,676 |
|
26.30 |
|
| East total |
|
|
|
|
|
|
|
|
1,543,262 |
|
1,350,160 |
|
87.5% |
|
26,417,527 |
|
19.57 |
|
| Southfield Centre |
|
Southfield |
|
MI |
Office |
|
1977 |
|
214,697 |
|
125,835 |
|
58.6% |
|
1,394,585 |
|
11.08 |
|
| Northwest Point |
|
Elk Grove Village |
|
IL |
Office |
|
1999 |
|
176,848 |
|
176,848 |
|
100.0% |
|
3,334,487 |
|
18.86 |
|
| River Crossing |
|
Indianapolis |
|
IN |
Office |
|
1998 |
|
205,059 |
|
199,966 |
|
97.5% |
|
4,854,327 |
|
24.28 |
|
| Timberlake |
|
Chesterfield |
|
MO |
Office |
|
1999 |
|
232,766 |
|
230,347 |
|
99.0% |
|
4,743,489 |
|
20.59 |
|
| Timberlake East |
|
Chesterfield |
|
MO |
Office |
|
2000 |
|
116,197 |
|
116,197 |
|
100.0% |
|
2,713,159 |
|
23.35 |
|
| Lakeside Crossing |
|
Maryland Heights |
|
MO |
Office |
|
2008 |
|
127,778 |
|
127,778 |
|
100.0% |
|
3,011,727 |
|
23.57 |
|
| Eden Bluff |
|
Eden Praire |
|
MN |
Office |
|
2006 |
|
153,028 |
|
153,028 |
|
100.0% |
|
3,977,266 |
|
25.99 |
|
| 121 South 8th Street |
|
Minneapolis |
|
MN |
Office |
|
1974 |
|
474,661 |
|
437,065 |
|
92.1% |
|
6,732,231 |
|
15.40 |
|
| Midwest total |
|
|
|
|
|
|
|
|
1,701,034 |
|
1,567,064 |
|
92.1% |
|
30,761,273 |
|
19.63 |
|
| Blue Lagoon Drive |
|
Miami |
|
FL |
Office |
|
2002 |
|
212,619 |
|
212,619 |
|
100.0% |
|
4,505,691 |
|
21.19 |
|
| One Overton Place |
|
Atlanta |
|
GA |
Office |
|
2002 |
|
387,267 |
|
357,790 |
|
92.4% |
|
9,341,668 |
|
26.11 |
|
| Willow Bend Office Center |
|
Plano |
|
TX |
Office |
|
1999 |
|
116,622 |
|
64,731 |
|
55.5% |
|
1,313,090 |
|
20.29 |
|
| Park Ten |
|
Houston |
|
TX |
Office |
|
1999 |
|
155,715 |
|
74,997 |
|
48.2% |
|
2,157,090 |
|
28.76 |
|
| Addison Circle |
|
Addison |
|
TX |
Office |
|
1999 |
|
293,787 |
|
281,503 |
|
95.8% |
|
6,663,018 |
|
23.67 |
|
| Collins Crossing |
|
Richardson |
|
TX |
Office |
|
1999 |
|
298,766 |
|
236,267 |
|
79.1% |
|
2,197,140 |
|
9.30 |
(b) |
| Eldridge Green |
|
Houston |
|
TX |
Office |
|
1999 |
|
248,399 |
|
248,399 |
|
100.0% |
|
7,075,482 |
|
28.48 |
|
| Park Ten Phase II |
|
Houston |
|
TX |
Office |
|
2006 |
|
156,746 |
|
153,326 |
|
97.8% |
|
4,004,324 |
|
26.12 |
|
| Liberty Plaza |
|
Addison |
|
TX |
Office |
|
1985 |
|
218,934 |
|
161,440 |
|
73.7% |
|
3,058,159 |
|
18.94 |
|
| South Total |
|
|
|
|
|
|
|
|
2,088,855 |
|
1,791,072 |
|
85.7% |
|
40,315,662 |
|
22.51 |
|
| Centennial Technology Center |
|
Colorado Springs |
|
CO |
Office |
|
1999 |
|
110,730 |
|
74,030 |
|
66.9% |
|
1,256,733 |
|
16.98 |
|
| 380 Interlocken |
|
Broomfield |
|
CO |
Office |
|
2000 |
|
240,184 |
|
204,347 |
|
85.1% |
|
6,305,123 |
|
30.85 |
|
| Greenwood Plaza |
|
Englewood |
|
CO |
Office |
|
2000 |
|
197,527 |
|
52,499 |
|
26.6% |
|
804,066 |
|
15.32 |
|
| 390 Interlocken |
|
Broomfield |
|
CO |
Office |
|
2002 |
|
241,516 |
|
237,518 |
|
98.3% |
|
5,036,748 |
|
21.21 |
|
| Hillview Center |
|
Milpitas |
|
CA |
Office |
|
1984 |
|
36,288 |
|
36,288 |
|
100.0% |
|
544,262 |
|
15.00 |
|
| Federal Way |
|
Federal Way |
|
WA |
Office |
|
1982 |
|
117,010 |
|
39,308 |
|
33.6% |
|
604,910 |
|
15.39 |
|
| Montague Business Center |
|
San Jose |
|
CA |
Office |
|
1982 |
|
145,951 |
|
145,951 |
|
100.0% |
|
2,184,672 |
|
14.97 |
|
| West Total |
|
|
|
|
|
|
|
|
1,089,206 |
|
789,941 |
|
72.5% |
|
16,736,515 |
|
21.19 |
|
| |
|
|
|
|
|
|
|
|
|
|
|
|
|
|
|
|
|
|
| Grand Total |
|
|
|
|
|
|
|
|
6,422,357 |
|
5,498,237 |
|
85.6% |
|
$114,230,977 |
|
$20.78 |
|
(a) Based on all leases in effect,
including month-to-month tenants, divided by the Property's net rentable square footage.
(b) Represents gross rental charges
for the month of December 2010 (including month-to-month leases) multiplied by 12, which can result in unusual per square foot
amounts calculated when there are free rent periods (usually with new leases).
(c) Represents the annualized
rent as of December 2010 divided by leased square feet.
| |
|
Owned Property Capital Expenditures
(in thousands)
|
| |
|
|
|
|
Year |
| |
For the Three Months Ended |
Ended |
| |
31-Mar-10 |
30-Jun-10 |
29-Sep-10 |
31-Dec-10 |
31-Dec-10 |
| Tenant improvements |
$ 1,305 |
$ 935 |
$ 3,634 |
$ 1,126 |
$ 7,000 |
| Deferred leasing costs |
5,566 |
1,519 |
808 |
2,622 |
10,515 |
| Building improvements |
380 |
498 |
671 |
1,053 |
2,602 |
| Total |
$ 7,251 |
$ 2,952 |
$ 5,113 |
$ 4,801 |
$ 20,117 |
| |
|
|
|
|
|
| |
|
|
|
|
|
| |
|
|
|
|
Year |
| |
For the Three Months Ended |
Ended |
| |
31-Mar-09 |
30-Jun-09 |
30-Sep-09 |
31-Dec-09 |
31-Dec-09 |
| Tenant improvements |
$ 1,373 |
$ 912 |
$ 931 |
$ 1,528 |
$ 4,744 |
| Deferred leasing costs |
162 |
1,395 |
645 |
457 |
2,659 |
| Building improvements |
466 |
116 |
265 |
619 |
1,466 |
| Total |
$ 2,001 |
$ 2,423 |
$ 1,841 |
$ 2,604 |
$ 8,869 |
| |
|
20 Largest Tenants with Annualized Rent
and Remaining Term
|
| |
|
|
|
Remaining |
Aggregate |
% of Aggregate |
Annualized |
% of |
| |
Tenant |
|
Number of |
Lease Term |
Leased |
Lease |
Rent (a) |
Aggregate |
| |
Name |
Note |
Leases |
in Months |
Square Feet |
Square Feet |
(in 000's) |
Annualized Rent |
| |
|
|
|
|
|
|
|
|
| 1 |
TCF National Bank |
1 |
1 |
60 |
266,495 |
4.15% |
2,893 |
2.53% |
| 2 |
Noblis, Inc. |
2 |
1 |
73 |
252,613 |
3.93% |
6,645 |
5.82% |
| 3 |
CITGO Petroleum Corporation |
3 |
1 |
134 |
248,399 |
3.87% |
7,075 |
6.19% |
| 4 |
Burger King Corporation |
|
1 |
93 |
212,619 |
3.31% |
4,506 |
3.94% |
| 5 |
RGA Reinsurance Company |
|
1 |
48 |
185,501 |
2.89% |
3,707 |
3.25% |
| 6 |
Citicorp Credit Services, Inc |
4 |
1 |
72 |
176,848 |
2.75% |
3,334 |
2.92% |
| 7 |
C.H. Robinson Worldwide, Inc. |
|
1 |
126 |
153,028 |
2.38% |
3,977 |
3.48% |
| 8 |
SunTrust Bank |
5 |
2 |
70 & 129 |
145,204 |
2.26% |
1,423 |
1.25% |
| 9 |
Geisecke & Devrient America, Inc. |
|
1 |
50 |
135,888 |
2.12% |
1,736 |
1.52% |
| 10 |
Murphy Exploration & Production Company |
|
1 |
76 |
133,786 |
2.08% |
3,515 |
3.08% |
| 11 |
Monsanto Company |
|
1 |
49 |
127,778 |
1.99% |
3,012 |
2.64% |
| 12 |
Vail Holdings, Inc. |
6 |
1 |
147 |
121,913 |
1.90% |
1,882 |
1.65% |
| 13 |
Northrop Grumman Systems Corporation |
|
1 |
88 |
111,469 |
1.74% |
4,044 |
3.54% |
| 14 |
Maines Paper & Food Service, Inc. |
|
1 |
35 |
98,745 |
1.54% |
624 |
0.55% |
| 15 |
Federal National Mortgage Association |
7 |
1 |
32 |
92,358 |
1.44% |
1,755 |
1.54% |
| 16 |
Amdocs, Inc. |
|
1 |
5 |
91,928 |
1.43% |
2,139 |
1.87% |
| 17 |
County of Santa Clara |
|
1 |
84 |
90,467 |
1.41% |
1,347 |
1.18% |
| 18 |
Ober, Kaler, Grimes & Shriver |
|
1 |
3 |
88,736 |
1.38% |
2,472 |
2.16% |
| 19 |
VCE Company, LLC |
8 |
1 |
105 |
85,650 |
1.33% |
- |
0.00% |
| 20 |
ARGO Data Resource Corporation |
|
1 |
68 |
83,944 |
1.31% |
2,029 |
1.78% |
| |
|
|
|
|
2,903,369 |
45.21% |
$ 58,115 |
50.89% |
| (a) |
Annualized rent represents the monthly rent, including tenant reimbursements, for each lease in effect at December 31, 2010 mulitplied by 12. |
| |
Tenant reimbursements generally include payment of real estate taxes, operating expenses and common area maintenance and utility charges. |
| |
|
20 Largest Tenants with Annualized Rent
and Remaining Term Footnotes
|
1. Property was acquired on
June 29, 2010.
2. Property was sold January
21, 2011.
3. On January 20, 2010, the
Company signed a new lease at a Houston, Texas property, for approximately 248,000 square feet of space with one of its tenants,
CITGO Petroleum Corporation, effectively extending the lease expiration from February 29, 2012 to February 28, 2022.
4. The lease with Citicorp Credit
Services, Inc. is guaranteed by Citigroup.
5. On December 22, 2010 the
Company signed a lease for approximately 90,000 square feet at a Glen Allen, Virginia property. The lease expires on September
30, 2021. The tenant also leases approximately 55,000 square feet at a Baltimore, Maryland property. The lease that expires on
October 31, 2016.
6. On March 22, 2010, the Company
signed a lease for approximate 38,000 square feet of space with one of its tenants, Vail Holdings, Inc. through March 2019. The
remaining space of approximately 84,000 square feet is leased through March 2023.
7. On June 7, 2010, Federal
National Mortgage Association commenced a lease for approximately 92,000 square feet of space at an Addison, Texas property. The
lease expires September 6, 2013.
8. On December 20, 2010, the
Company signed a lease for approximately 86,000 square feet of space at a Richardson, Texas property. The lease expires on September
30, 2019 and is guaranteed by EMC Corporation.
| |
|
Tenant Analysis – 20 Largest Tenants, Industry Profile
(as
a % of square feet and includes asset held for sale)
|
| |
|
Lease Expirations by Square Feet
(includes asset held for sale)
|
| Year |
|
Total
Square Feet |
|
% of
Square Feet
Commercial |
|
| |
|
|
|
|
|
| 2011 |
|
655,783 |
|
10.2% |
|
| 2012 |
|
399,528 |
|
6.2% |
|
| 2013 |
|
543,235 |
|
8.4% |
|
| 2014 |
|
595,886 |
|
9.3% |
|
| 2015 |
|
813,023 |
|
12.7% |
|
| 2016 |
|
555,571 |
|
8.6% |
|
| 2017 |
|
523,853 |
|
8.2% |
|
| 2018 |
|
401,496 |
|
6.3% |
|
| 2019 |
|
129,042 |
|
2.0% |
|
| 2020 |
|
142,313 |
|
2.2% |
|
| 2021 |
|
406,488 |
|
6.3% |
|
| 2022 |
|
248,399 |
|
3.9% |
|
| 2023 |
|
83,620 |
|
1.3% |
|
| Vacant |
|
924,120 |
|
14.4% |
|
| |
|
|
|
|
|
| Total |
|
6,422,357 |
|
100.0% |
|
| |
|
Lease Expirations
with Annualized Rent per Square Foot
(includes asset held for sale)
|
| |
|
|
Rentable |
|
|
|
Annualized |
|
Percentage |
| |
Number of |
|
Square |
|
|
|
Rent |
|
of Total Final |
| Year of |
Leases |
|
Footage |
|
Annualized |
|
Per Square |
|
Annualized |
| Lease |
Expiring |
|
Subject to |
|
Rent Under |
|
Foot Under |
|
Rent Under |
| Expiration |
Within the |
|
Expiring |
|
Expiring |
|
Expiring |
|
Expiring |
| December 31, |
Year |
|
Leases |
|
Leases (a) |
|
Leases |
|
Leases |
| 2011 |
103 |
(b) |
655,783 |
|
13,529,015 |
|
20.63 |
|
11.84% |
| 2012 |
55 |
|
399,528 |
|
8,698,826 |
|
21.77 |
|
7.62% |
| 2013 |
51 |
|
543,235 |
|
10,069,311 |
|
18.54 |
|
8.81% |
| 2014 |
32 |
|
595,886 |
|
13,505,503 |
|
22.66 |
|
11.82% |
| 2015 |
28 |
|
813,023 |
|
13,897,329 |
|
17.09 |
|
12.17% |
| 2016 |
17 |
|
555,571 |
|
12,872,449 |
|
23.17 |
|
11.27% |
| 2017 |
6 |
|
523,853 |
|
12,774,531 |
|
24.39 |
|
11.18% |
| 2018 |
7 |
|
401,496 |
|
10,507,743 |
|
26.17 |
|
9.20% |
| 2019 |
3 |
|
129,042 |
|
1,029,009 |
|
7.97 |
|
0.90% |
| 2020 and thereafter |
15 |
|
880,820 |
|
17,347,261 |
|
19.69 |
|
15.19% |
| |
317 |
|
5,498,237 |
|
114,230,977 |
|
20.78 |
|
100.00% |
| |
|
|
|
|
|
|
|
|
|
| Vacancies as of December 31, 2010 |
|
924,120 |
|
|
|
|
|
|
| Total Portfolio Square Footage |
|
6,422,357 |
|
|
|
|
|
|
| (a) |
Annualized rent represents the monthly rent, including tenant reimbursements, for each lease in effect at December 31,2010 multiplied by 12. Tenant reimbursements generally include payment of real estate taxes, operating expenses and common area maintenance and utility charges. |
| |
|
| (b) |
34 leases are Month to Month and 5 leases expired on December 31, 2010. |
| |
|
Capital Recycling
($ in thousands)
|
| Acquisitions: |
|
|
|
Property |
|
|
|
Date |
|
Purchase |
|
|
| |
|
State/Region |
|
Type |
|
Square Feet |
|
Acquired |
|
Price |
|
|
| 2010 |
|
|
|
|
|
|
|
|
|
|
|
|
| 121 South 8th Street |
|
MN/Midwest |
|
Office |
|
474,661 |
|
6/29/10 |
|
$39,405 |
|
|
| |
|
|
|
|
|
|
|
|
|
|
|
|
| 2009 |
|
|
|
|
|
|
|
|
|
|
|
|
| Stonecroft-Chantilly |
|
VA/East |
|
Office |
|
111,469 |
|
6/26/09 |
|
29,000 |
|
|
| Eden Bluff - Eden Prairie |
|
MN/Midwest |
|
Office |
|
153,028 |
|
6/30/09 |
|
22,784 |
|
|
| Fairview |
|
VA/East |
|
Office |
|
252,613 |
|
9/30/09 |
|
73,000 |
|
|
| |
|
|
|
|
|
|
|
|
|
|
|
|
| 2008 |
|
|
|
|
|
|
|
|
|
|
|
|
| Park Ten Phase II |
|
TX/South |
|
Office |
|
156,746 |
|
5/15/08 |
|
35,079 |
|
|
| Lakeside Crossing |
|
MO/Midwest |
|
Office |
|
127,778 |
|
12/11/08 |
|
20,003 |
|
|
| Loudoun Tech Center |
|
VA/East |
|
Office |
|
135,888 |
|
12/23/08 |
|
18,628 |
|
|
| |
|
|
|
|
|
|
|
|
|
|
|
|
| 2007 |
|
|
|
|
|
|
|
|
|
|
|
|
| East Baltimore |
|
MD/East |
|
Office |
|
325,298 |
|
6/13/07 |
|
63,592 |
|
|
| |
|
|
|
|
|
|
|
|
|
|
|
|
| 2006 |
|
|
|
|
|
|
|
|
|
|
|
|
| Liberty Plaza |
|
TX/South |
|
Office |
|
218,934 |
|
2/24/06 |
|
26,472 |
|
|
| Innsbrook |
|
VA/East |
|
Office |
|
297,789 |
|
5/1/06 |
|
48,240 |
|
|
| 380 Interlocken |
|
CO/West |
|
Office |
|
240,184 |
|
5/1/06 |
|
47,587 |
|
|
| Blue Lagoon Drive |
|
FL/South |
|
Office |
|
212,619 |
|
5/1/06 |
|
56,051 |
|
|
| Eldridge Green |
|
TX/South |
|
Office |
|
248,399 |
|
5/1/06 |
|
53,435 |
|
|
| Willow Bend Office Center |
|
TX/South |
|
Office |
|
116,622 |
|
5/1/06 |
|
19,713 |
|
|
| One Overton Place |
|
GA/South |
|
Office |
|
387,267 |
|
6/27/06 |
|
85,284 |
|
|
| 390 Interlocken |
|
CO/West |
|
Office |
|
241,516 |
|
12/21/06 |
|
46,459 |
|
|
| |
|
|
|
|
|
|
|
|
|
|
|
|
| 2005 |
|
|
|
|
|
|
|
|
|
|
|
|
| Greenwood Plaza |
|
CO/West |
|
Office |
|
199,077 |
|
2/24/05 |
|
44,116 |
|
|
| Addison Circle |
|
TX/South |
|
Office |
|
293,787 |
|
5/1/05 |
|
56,295 |
|
|
| Royal Ridge |
|
GA/South |
|
Office |
|
161,366 |
|
5/1/05 |
|
27,391 |
|
|
| Collins Crossing |
|
TX/South |
|
Office |
|
298,766 |
|
5/1/05 |
|
53,667 |
|
|
| Montague Business Center |
|
CA/West |
|
Office |
|
145,951 |
|
5/1/05 |
|
20,147 |
|
|
| River Crossing |
|
IN/Midwest |
|
Office |
|
205,059 |
|
7/6/05 |
|
42,016 |
|
|
| |
|
|
|
|
|
|
|
|
|
|
|
|
| Dispositions: |
|
|
|
|
|
|
|
|
|
|
|
|
| |
|
|
|
Property |
|
|
|
|
|
Net Sales |
|
Gain (Loss) |
| 2007 |
|
State/Region |
|
Type |
|
Square Feet |
|
Date Sold |
|
Proceeds |
|
on Sale |
| Piedmont Center |
|
SC/East |
|
Office |
|
144,029 |
|
1/31/07 |
|
$5,830 |
|
$(4,849) |
| Royal Ridge |
|
GA/South |
|
Office |
|
161,366 |
|
6/21/07 |
|
32,535 |
|
6,601 |
| Goldentop Technology Center |
|
CA/West |
|
Office |
|
141,405 |
|
6/27/07 |
|
36,199 |
|
14,741 |
| Lyberty Way |
|
MA/East |
|
Office |
|
104,711 |
|
7/16/07 |
|
10,861 |
|
1,942 |
| Austin N.W. (Canyon Hills) |
|
TX/South |
|
Office |
|
68,533 |
|
12/20/07 |
|
10,429 |
|
257 |
| |
|
|
|
|
|
|
|
|
|
|
|
|
| 2006 |
|
|
|
|
|
|
|
|
|
|
|
|
| Merrywood Apartments |
|
TX/South |
|
Apt |
|
231,363 |
|
5/24/06 |
|
18,204 |
|
2,373 |
| Santa Clara |
|
CA/West |
|
Office |
|
40,280 |
|
5/31/06 |
|
8,188 |
|
1,557 |
| Fair Lakes |
|
VA/East |
|
Office |
|
210,613 |
|
5/31/06 |
|
61,412 |
|
24,240 |
| One Technology Drive |
|
MA/East |
|
Industrial |
|
188,000 |
|
8/10/06 |
|
15,995 |
|
6,366 |
| Plaza Ridge |
|
VA/East |
|
Office |
|
158,016 |
|
11/16/06 |
|
58,022 |
|
27,941 |
| North Andover Office Park |
|
MA/East |
|
Office |
|
92,913 |
|
11/21/06 |
|
11,362 |
|
3,810 |
| |
|
|
|
|
|
|
|
|
|
|
|
|
| 2005 |
|
|
|
|
|
|
|
|
|
|
|
|
| Blue Ravine |
|
CA/West |
|
Office |
|
47,058 |
|
7/13/05 |
|
4,764 |
|
(1,124) |
| Silverside Plantation |
|
LA/South |
|
Apt |
|
223,812 |
|
9/19/05 |
|
22,280 |
|
7,265 |
| Gateway Crossing |
|
MD/East |
|
Office |
|
188,819 |
|
9/20/05 |
|
25,949 |
|
6,807 |
| Essex Lane Associates |
|
TX/South |
|
Apt |
|
118,798 |
|
10/5/05 |
|
13,752 |
|
5,112 |
| Gael Apartments |
|
TX/South |
|
Apt |
|
187,338 |
|
10/5/05 |
|
22,715 |
|
5,151 |
| Telecom Business Center |
|
CA/West |
|
Office |
|
101,726 |
|
12/8/05 |
|
22,570 |
|
6,943 |
| |
|
Investment Banking Performance
|
| |
|
FFO and FFO+GOS Reconciliations
(in thousands, except per share amounts)
|
| | |
For the three months ended | |
For the year ended |
| | |
31-Mar-10 | |
30-Jun-10 | |
30-Sep-10 | |
31-Dec-10 | |
31-Mar-09 | |
30-Jun-09 | |
30-Sep-09 | |
31-Dec-09 | |
2010 | |
2009 | |
2008 |
| | |
| |
| |
| |
| |
| |
| |
| |
| |
| |
| |
|
| Net income | |
$ | 5,562 | | |
$ | 5,954 | | |
$ | 4,757 | | |
$ | 5,820 | | |
$ | 7,808 | | |
$ | 4,865 | | |
$ | 6,941 | | |
$ | 8,258 | | |
$ | 22,093 | | |
$ | 27,872 | | |
$ | 31,958 | |
| (Gain) Loss on sale of assets | |
| — | | |
| — | | |
| — | | |
| — | | |
| — | | |
| — | | |
| — | | |
| (424 | ) | |
| — | | |
| (424 | ) | |
| — | |
| GAAP income from non-consolidated REITs | |
| (253 | ) | |
| (380 | ) | |
| (404 | ) | |
| (153 | ) | |
| (792 | ) | |
| (443 | ) | |
| (475 | ) | |
| (301 | ) | |
| (1,190 | ) | |
| (2,011 | ) | |
| (2,746 | ) |
| Distributions from non-consolidated REITs | |
| 1,407 | | |
| 1,324 | | |
| 1,192 | | |
| 1,247 | | |
| 1,615 | | |
| 1,523 | | |
| 1,119 | | |
| 1,371 | | |
| 5,170 | | |
| 5,628 | | |
| 5,348 | |
| Acquisition costs | |
| — | | |
| 129 | | |
| (4 | ) | |
| — | | |
| — | | |
| 248 | | |
| 391 | | |
| 4 | | |
| 125 | | |
| 643 | | |
| — | |
| Depreciation & amortization | |
| 9,934 | | |
| 9,675 | | |
| 10,510 | | |
| 10,605 | | |
| 8,707 | | |
| 11,216 | | |
| 9,561 | | |
| 10,167 | | |
| 40,724 | | |
| 39,651 | | |
| 34,644 | |
| Funds From Operations (FFO) | |
| 16,650 | | |
| 16,702 | | |
| 16,051 | | |
| 17,519 | | |
| 17,338 | | |
| 17,409 | | |
| 17,537 | | |
| 19,075 | | |
| 66,922 | | |
| 71,359 | | |
| 69,204 | |
| Plus gains on sales of assets (GOS) | |
| — | | |
| — | | |
| — | | |
| — | | |
| — | | |
| — | | |
| — | | |
| 424 | | |
| — | | |
| 424 | | |
| — | |
| FFO+GOS (Total Profits) | |
$ | 16,650 | | |
$ | 16,702 | | |
$ | 16,051 | | |
$ | 17,519 | | |
$ | 17,338 | | |
$ | 17,409 | | |
$ | 17,537 | | |
$ | 19,499 | | |
$ | 66,922 | | |
$ | 71,783 | | |
$ | 69,204 | |
| | |
| | | |
| | | |
| | | |
| | | |
| | | |
| | | |
| | | |
| | | |
| | | |
| | | |
| | |
| Per Share Data: | |
| | | |
| | | |
| | | |
| | | |
| | | |
| | | |
| | | |
| | | |
| | | |
| | | |
| | |
| EPS | |
$ | 0.07 | | |
$ | 0.07 | | |
$ | 0.06 | | |
$ | 0.07 | | |
$ | 0.11 | | |
$ | 0.07 | | |
$ | 0.10 | | |
$ | 0.10 | | |
$ | 0.28 | | |
$ | 0.38 | | |
$ | 0.45 | |
| FFO | |
| 0.21 | | |
| 0.21 | | |
| 0.20 | | |
| 0.22 | | |
| 0.25 | | |
| 0.25 | | |
| 0.25 | | |
| 0.24 | | |
| 0.84 | | |
| 0.98 | | |
| 0.98 | |
| GOS | |
| — | | |
| — | | |
| — | | |
| — | | |
| — | | |
| — | | |
| — | | |
| — | | |
| — | | |
| — | | |
| — | |
| FFO+GOS | |
| 0.21 | | |
| 0.21 | | |
| 0.20 | | |
| 0.22 | | |
| 0.25 | | |
| 0.25 | | |
| 0.25 | | |
| 0.24 | | |
| 0.84 | | |
| 0.98 | | |
| 0.98 | |
| | |
| | | |
| | | |
| | | |
| | | |
| | | |
| | | |
| | | |
| | | |
| | | |
| | | |
| | |
| Weighted Average Shares (basic and diluted) | |
| 79,681 | | |
| 79,681 | | |
| 79,751 | | |
| 80,187 | | |
| 70,481 | | |
| 70,481 | | |
| 71,281 | | |
| 79,681 | | |
| 79,826 | | |
| 73,001 | | |
| 70,481 | |
| |
|
FFO and FFO+GOS Definitions
|
Definition of Funds From Operations (“FFO”),
and FFO plus Gains on Sales (“FFO+GOS”)
The Company evaluates the performance of its reportable segments
based on several measures including, Funds From Operations (“FFO”) and FFO plus Gains on Sales (“FFO+GOS”
or “Total Profits”) as management believes they represent important measures of activity and are an important consideration
in determining distributions paid to equity holders. The Company defines FFO as net income (computed in accordance with generally
accepted accounting principles, or GAAP), excluding gains (or losses) from sales of property, and acquisition costs of newly acquired
properties that are not capitalized, plus depreciation and amortization, and after adjustments to exclude non-cash income (or losses)
from non-consolidated or Sponsored REITs, plus distributions received from non-consolidated or Sponsored REITs. The Company defines
FFO+GOS as FFO as defined above, plus gains (or losses) from sales of properties and provisions for assets held for sale, if applicable.
FFO and FFO+GOS should not be considered as alternatives to net
income (determined in accordance with GAAP), as indicators of the Company’s financial performance, nor as alternatives to
cash flows from operating activities (determined in accordance with GAAP), nor as measures of the Company’s liquidity, nor
are they necessarily indicative of sufficient cash flow to fund all of the Company’s needs. Other real estate companies may
define these terms in a different manner. We believe that in order to facilitate a clear understanding of the results of the Company,
FFO and FFO+GOS should be examined in connection with net income and cash flows from operating, investing and financing activities
in the consolidated financial statements.
| |
|
Funds Available for Distribution (FAD)
Reconciliation and Definition
(in thousands, except per share amounts)
|
| | |
Three Months Ended: |
| | |
31-Mar-10 | |
30-Jun-10 | |
30-Sep-10 | |
31-Dec-10 | |
31-Mar-09 | |
30-Jun-09 | |
30-Sep-09 | |
31-Dec-09 |
| | |
| |
| |
| |
| |
| |
| |
| |
|
| Net income | |
$ | 5,562 | | |
$ | 5,954 | | |
$ | 4,757 | | |
$ | 5,820 | | |
$ | 7,808 | | |
$ | 4,865 | | |
$ | 6,941 | | |
$ | 8,258 | |
| (Gain) Loss on sale of assets | |
| — | | |
| — | | |
| — | | |
| — | | |
| — | | |
| — | | |
| — | | |
| (424 | ) |
| GAAP income from non-consolidated REITs | |
| (253 | ) | |
| (380 | ) | |
| (404 | ) | |
| (153 | ) | |
| (792 | ) | |
| (443 | ) | |
| (475 | ) | |
| (301 | ) |
| Distributions from non-consolidated REITs | |
| 1,407 | | |
| 1,324 | | |
| 1,192 | | |
| 1,247 | | |
| 1,615 | | |
| 1,522 | | |
| 1,119 | | |
| 1,371 | |
| Acquisition costs | |
| — | | |
| 129 | | |
| (4 | ) | |
| — | | |
| — | | |
| 248 | | |
| 391 | | |
| 4 | |
| Depreciation & amortization | |
| 9,934 | | |
| 9,675 | | |
| 10,510 | | |
| 10,605 | | |
| 8,707 | | |
| 11,217 | | |
| 9,561 | | |
| 10,167 | |
| Funds From Operations (FFO) | |
| 16,650 | | |
| 16,702 | | |
| 16,051 | | |
| 17,519 | | |
| 17,338 | | |
| 17,409 | | |
| 17,537 | | |
| 19,075 | |
| Plus gains on sales of assets (GOS) | |
| — | | |
| — | | |
| — | | |
| — | | |
| — | | |
| — | | |
| — | | |
| 424 | |
| FFO+GOS (Total Profits) | |
$ | 16,650 | | |
$ | 16,702 | | |
$ | 16,051 | | |
$ | 17,519 | | |
$ | 17,338 | | |
$ | 17,409 | | |
$ | 17,537 | | |
$ | 19,499 | |
| | |
| | | |
| | | |
| | | |
| | | |
| | | |
| | | |
| | | |
| | |
| Funds Available for Distribution: | |
| | | |
| | | |
| | | |
| | | |
| | | |
| | | |
| | | |
| | |
| Funds From Operations (FFO) | |
| 16,650 | | |
| 16,702 | | |
| 16,051 | | |
| 17,519 | | |
| 17,338 | | |
| 17,409 | | |
| 17,537 | | |
| 19,075 | |
| Straight-line rent | |
| (1,018 | ) | |
| (740 | ) | |
| (1,203 | ) | |
| (1,288 | ) | |
| (374 | ) | |
| (69 | ) | |
| (405 | ) | |
| (1,030 | ) |
| Capital expenditures | |
| (380 | ) | |
| (498 | ) | |
| (671 | ) | |
| (1,053 | ) | |
| (466 | ) | |
| (115 | ) | |
| (265 | ) | |
| (619 | ) |
| Funds Available for Distribution (FAD) | |
$ | 15,252 | | |
$ | 15,464 | | |
$ | 14,177 | | |
$ | 15,178 | | |
$ | 16,498 | | |
$ | 17,225 | | |
$ | 16,867 | | |
$ | 17,426 | |
| | |
| | | |
| | | |
| | | |
| | | |
| | | |
| | | |
| | | |
| | |
| Per Share Data: | |
| | | |
| | | |
| | | |
| | | |
| | | |
| | | |
| | | |
| | |
| EPS | |
$ | 0.07 | | |
$ | 0.07 | | |
$ | 0.06 | | |
$ | 0.07 | | |
$ | 0.11 | | |
$ | 0.07 | | |
$ | 0.10 | | |
$ | 0.10 | |
| FFO | |
| 0.21 | | |
| 0.21 | | |
| 0.20 | | |
| 0.22 | | |
| 0.25 | | |
| 0.25 | | |
| 0.25 | | |
| 0.24 | |
| GOS | |
| — | | |
| — | | |
| — | | |
| — | | |
| — | | |
| — | | |
| — | | |
| 0 | |
| FFO+GOS | |
| 0.21 | | |
| 0.21 | | |
| 0.20 | | |
| 0.22 | | |
| 0.25 | | |
| 0.25 | | |
| 0.25 | | |
| 0.24 | |
| FAD | |
| 0.19 | | |
| 0.19 | | |
| 0.18 | | |
| 0.19 | | |
| 0.23 | | |
| 0.24 | | |
| 0.24 | | |
| 0.22 | |
| | |
| | | |
| | | |
| | | |
| | | |
| | | |
| | | |
| | | |
| | |
| Weighted Average Shares (basic and diluted) | |
| 79,681 | | |
| 79,681 | | |
| 79,751 | | |
| 80,187 | | |
| 70,481 | | |
| 70,481 | | |
| 71,281 | | |
| 79,681 | |
The Company defines FAD as the sum of (1) FFO, (2) less the effect
of straight-line rent, (3) less recurring capital expenditures that are generally for maintenance of properties and are not recovered
through rental income from tenants, and (4) plus non-cash compensation expenses, if any. FAD should not be considered as an alternative
to net income (determined in accordance with GAAP), as an indicator of the Company’s financial performance, nor as an alternative
to cash flows from operating activities (determined in accordance with GAAP), nor as a measure of the Company’s liquidity,
nor is it necessarily indicative of sufficient cash flow to fund all of the Company’s needs. Other real estate companies
may define this term in a different manner. We believe that in order to facilitate a clear understanding of the results of the
Company, FAD should be examined in connection with net income and cash flows from operating, investing and financing activities
in the consolidated financial statements.
| |
|
EBITDA Reconciliation and Definition
(in thousands, except ratio amounts)
|
| | |
For the three months ended: | |
Year Ended | |
|
For the three months ended: | |
Year Ended |
| | |
31-Mar-10 | |
30-Jun-10 | |
30-Sep-10 | |
31-Dec-10 | |
31-Dec-10 | |
|
31-Mar-09 | |
30-Jun-09 | |
30-Sep-09 | |
31-Dec-09 | |
31-Dec-09 |
| | |
| |
| |
| |
| |
| |
|
| |
| |
| |
| |
|
| Net income | |
$ | 5,562 | | |
$ | 5,954 | | |
$ | 4,757 | | |
$ | 5,820 | | |
$ | 22,093 | | |
|
$ | 7,808 | | |
$ | 4,865 | | |
$ | 6,941 | | |
$ | 8,258 | | |
$ | 27,872 | |
| Interest expense | |
| 1,652 | | |
| 1,735 | | |
| 1,892 | | |
| 2,004 | | |
| 7,283 | | |
|
| 1,577 | | |
| 1,599 | | |
| 1,744 | | |
| 1,650 | | |
| 6,570 | |
| Depreciation and amortization | |
| 9,934 | | |
| 9,675 | | |
| 10,510 | | |
| 10,605 | | |
| 40,724 | | |
|
| 8,707 | | |
| 11,216 | | |
| 9,561 | | |
| 10,167 | | |
| 39,651 | |
| Income taxes | |
| (68 | ) | |
| 5 | | |
| (37 | ) | |
| 317 | | |
| 217 | | |
|
| (299 | ) | |
| (75 | ) | |
| (270 | ) | |
| 65 | | |
| (579 | ) |
| EBITDA | |
| 17,080 | | |
| 17,369 | | |
| 17,122 | | |
| 18,746 | | |
| 70,317 | | |
|
| 17,793 | | |
| 17,605 | | |
| 17,976 | | |
| 20,140 | | |
| 73,514 | |
| | |
| | | |
| | | |
| | | |
| | | |
| | | |
|
| | | |
| | | |
| | | |
| | | |
| | |
| Interest expense | |
$ | 1,652 | | |
$ | 1,735 | | |
$ | 1,892 | | |
$ | 2,004 | | |
$ | 7,283 | | |
|
$ | 1,577 | | |
$ | 1,599 | | |
$ | 1,744 | | |
$ | 1,650 | | |
$ | 6,570 | |
| Scheduled principal payments (1) | |
| — | | |
| — | | |
| — | | |
| 150 | | |
| 150 | | |
|
| — | | |
| — | | |
| — | | |
| — | | |
| — | |
| Interest and scheduled principal payments | |
$ | 1,652 | | |
$ | 1,735 | | |
$ | 1,892 | | |
$ | 2,154 | | |
$ | 7,433 | | |
|
$ | 1,577 | | |
$ | 1,599 | | |
$ | 1,744 | | |
$ | 1,650 | | |
$ | 6,570 | |
| | |
| | | |
| | | |
| | | |
| | | |
| | | |
|
| | | |
| | | |
| | | |
| | | |
| | |
| Interest coverage ratio | |
| 10.34 | | |
| 10.01 | | |
| 9.05 | | |
| 9.35 | | |
| 9.65 | | |
|
| 11.28 | | |
| 11.01 | | |
| 10.31 | | |
| 12.21 | | |
| 11.19 | |
| | |
| | | |
| | | |
| | | |
| | | |
| | | |
|
| | | |
| | | |
| | | |
| | | |
| | |
| Debt service coverage ratio | |
| 10.34 | | |
| 10.01 | | |
| 9.05 | | |
| 8.70 | | |
| 9.46 | | |
|
| 11.28 | | |
| 11.01 | | |
| 10.31 | | |
| 12.21 | | |
| 11.19 | |
(1) Scheduled principal payments
include required principal payments on our unsecured term debt, which commenced in November 2011 using a 30 year amortization schedule.
EBITDA, a non-GAAP financial measure, is defined as net income,
plus interest expense, income tax expense and depreciation and amortization expense. EBITDA is not intended to represent cash flow
for the period, is not presented as an alternative to operating income as an indicator of operating performance, should not be
considered in isolation or as a substitute for measures of performance prepared in accordance with GAAP and is not indicative of
operating income or cash provided by operating activities as determined under GAAP. EBITDA is presented solely as a supplemental
disclosure with respect to liquidity because the Company believes it provides useful information regarding the Company's ability
to service or incur debt. Because all companies do not calculate EBITDA the same way, this presentation of EBITDA may not be comparable
to similarly titled measures of other companies. The Company believes that net income is the financial measure calculated and presented
in accordance with GAAP that is most directly comparable to EBITDA.
| |
|
Reconciliation of Net Income to Property NOI:
Cash & GAAP Basis and Definition
(in thousands)
|
| | |
Three months ended: | |
2010 | |
|
Three months ended: | |
2009 |
| | |
31-Mar-10 | |
30-Jun-10 | |
30-Sep-10 | |
31-Dec-10 | |
Total | |
|
31-Mar-09 | |
30-Jun-09 | |
30-Sep-09 | |
31-Dec-09 | |
Total |
| | |
| |
| |
| |
| |
| |
|
| |
| |
| |
| |
|
| Net Income | |
$ | 5,562 | | |
$ | 5,954 | | |
$ | 4,757 | | |
$ | 5,820 | | |
$ | 22,093 | | |
|
$ | 7,808 | | |
$ | 4,865 | | |
$ | 6,941 | | |
$ | 8,258 | | |
$ | 27,872 | |
| Add (deduct): | |
| | | |
| | | |
| | | |
| | | |
| | | |
|
| | | |
| | | |
| | | |
| | | |
| | |
| Investment banking segment net loss (income) | |
| 479 | | |
| (263 | ) | |
| 401 | | |
| (1,352 | ) | |
| (735 | ) | |
|
| 778 | | |
| 346 | | |
| 625 | | |
| (1,103 | ) | |
| 646 | |
| Gain on sale of assets | |
| — | | |
| — | | |
| — | | |
| — | | |
| — | | |
|
| — | | |
| — | | |
| — | | |
| (424 | ) | |
| (424 | ) |
| Management fees (before elimination) | |
| (484 | ) | |
| (359 | ) | |
| (362 | ) | |
| (535 | ) | |
| (1,740 | ) | |
|
| (425 | ) | |
| (398 | ) | |
| (402 | ) | |
| (408 | ) | |
| (1,633 | ) |
| Depreciation and Amortization | |
| 9,184 | | |
| 9,205 | | |
| 10,348 | | |
| 10,453 | | |
| 39,190 | | |
|
| 7,887 | | |
| 10,200 | | |
| 8,768 | | |
| 9,314 | | |
| 36,169 | |
| Amortization of favorable leases | |
| 716 | | |
| 432 | | |
| 96 | | |
| 119 | | |
| 1,363 | | |
|
| 793 | | |
| 992 | | |
| 759 | | |
| 815 | | |
| 3,359 | |
| Selling, general and administrative | |
| 1,447 | | |
| 1,854 | | |
| 1,400 | | |
| 1,698 | | |
| 6,399 | | |
|
| 983 | | |
| 1,163 | | |
| 1,324 | | |
| 1,359 | | |
| 4,829 | |
| Interest expense | |
| 1,652 | | |
| 1,736 | | |
| 1,892 | | |
| 2,003 | | |
| 7,283 | | |
|
| 1,577 | | |
| 1,599 | | |
| 1,744 | | |
| 1,650 | | |
| 6,570 | |
| Interest income | |
| (338 | ) | |
| (374 | ) | |
| (431 | ) | |
| (491 | ) | |
| (1,634 | ) | |
|
| (347 | ) | |
| (136 | ) | |
| (170 | ) | |
| (278 | ) | |
| (931 | ) |
| Equity in earnings of nonconsolidated REITs | |
| (253 | ) | |
| (380 | ) | |
| (404 | ) | |
| (229 | ) | |
| (1,266 | ) | |
|
| (792 | ) | |
| (443 | ) | |
| (475 | ) | |
| (283 | ) | |
| (1,993 | ) |
| Non-property specific income and expenses, net | |
| 461 | | |
| 690 | | |
| 421 | | |
| (268 | ) | |
| 1,304 | | |
|
| 57 | | |
| (145 | ) | |
| (13 | ) | |
| (34 | ) | |
| (135 | ) |
| GAAP Property NOI | |
| 18,426 | | |
| 18,495 | | |
| 18,118 | | |
| 17,218 | | |
| 72,257 | | |
|
| 18,319 | | |
| 18,043 | | |
| 19,101 | | |
| 18,866 | | |
| 74,329 | |
| Straight-line rent | |
| (1,020 | ) | |
| (1,339 | ) | |
| (1,202 | ) | |
| (1,281 | ) | |
| (4,842 | ) | |
|
| (374 | ) | |
| 92 | | |
| (405 | ) | |
| (1,033 | ) | |
| (1,720 | ) |
| Cash Property NOI | |
$ | 17,406 | | |
$ | 17,156 | | |
$ | 16,916 | | |
$ | 15,937 | | |
$ | 67,415 | | |
|
$ | 17,945 | | |
$ | 18,135 | | |
$ | 18,696 | | |
$ | 17,833 | | |
$ | 72,609 | |
GAAP Property NOI is a non-GAAP financial
measure equal to net income, the most directly comparable GAAP financial measure, plus selling, general and administrative expenses,
depreciation and amortization, interest expense, less equity in earnings of nonconsolidated REITs, interest income, management
fee income, gains or losses on the sale of assets and excludes non-property specific income and expenses. The Company also presents
this on a cash basis (Cash Property NOI), which is GAAP Property NOI after eliminating the effects of straight-line rent. GAAP
Property NOI and Cash Property NOI presented by the Company may not be comparable to NOI reported by other REITs that define NOI
differently. NOI should not be considered an alternative to net income as an indication of our performance or to cash flows as
a measure of the Company's liquidity or its ability to make distributions.