Attached files
| file | filename |
|---|---|
| EX-23 - EX-23 - EAGLE BANCORP INC | a2199328zex-23.htm |
| EX-31.2 - EX-31.2 - EAGLE BANCORP INC | a2199328zex-31_2.htm |
| EX-31.1 - EX-31.1 - EAGLE BANCORP INC | a2199328zex-31_1.htm |
| EX-32.1 - EX-32.1 - EAGLE BANCORP INC | a2199328zex-32_1.htm |
| EX-32.2 - EX-32.2 - EAGLE BANCORP INC | a2199328zex-32_2.htm |
| EX-10.12 - EX-10.12 - EAGLE BANCORP INC | a2199328zex-10_12.htm |
UNITED STATES
SECURITIES AND EXCHANGE COMMISSION
Washington, D.C. 20549
FORM 10-K/A
(Amendment No. 1)
ý |
Annual report pursuant to Section 13 or 15(d) of the Securities Exchange Act of 1934 |
|
For the fiscal year ended December 31, 2009 |
||
o |
Transition report pursuant to Section 13 or 15(d) of the Securities Exchange Act of 1934 |
|
For the transition period from to |
||
Commission file number: 0-25923
Eagle Bancorp, Inc.
(Exact Name of Registrant as Specified in its Charter)
| Maryland (State or other jurisdiction of incorporation or organization) |
52-2061461 (I.R.S. Employer Identification Number) |
|
7815 Woodmont Avenue, Bethesda, Maryland (Address of Principal Executive Offices) |
20814 (Zip Code) |
Registrant's Telephone Number, including area code: (301) 986-1800
Securities registered pursuant to Section 12(b) of the Act:
| Title of class | Name of each exchange on which registered | |
|---|---|---|
| Common Stock, $0.01 par value | The NASDAQ Capital Market |
Securities registered pursuant to Section 12(g) of the Act: None
Indicate by check mark if the registrant is a well-known seasoned issuer, as defined in Section 405 of the Securities Act. Yes o No ý
Indicate by check mark if the registrant is not required to file reports pursuant to Section 13 or Section 15(d) of the Act. Yes o No ý
Indicate by check mark whether the registrant; (1) has filed all reports required to be filed by Section 13 or 15(d) of the Securities Exchange Act of 1934 during the preceding 12 months (or for such shorter period that the registrant was required to file such reports; and (2) has been subject to such filing requirements for the past 90 days. Yes ý No o
Indicate by checkmark whether the registrant has submitted electronically and posted on its corporate Website, if any, every Interactive Data File required to be submitted and posted pursuant to Rule 405 of Regulation S-T (§232.405 of this chapter) during the preceding 12 months (or for such shorter period that the registrant was required to submit and post such files). Yes o No o
Indicate by check mark if disclosure of delinquent filers pursuant to Item 405 of Regulation S-K is not contained herein, and will not be contained, to the best of registrant's knowledge, in definitive proxy or information statements incorporated by reference in Part III of this Form 10-K or any amendment to this Form 10-K. o
Indicate by check mark whether the registrant is a large accelerated filer, an accelerated filer, a non-accelerated filer or a smaller reporting company. See definitions of "large accelerated filer," "accelerated filer" and "smaller reporting company" in Rule 12b-2 of the Exchange Act.
| Large accelerated filer o | Accelerated filer ý | Non-accelerated filer o | Smaller reporting company o |
Indicate by check mark whether the registrant is a shell company (as defined in Rule 12b-2 of the Act. Yes o No ý
The aggregate market value of the outstanding Common Stock held by nonaffiliates as of June 30, 2009 was approximately $86.8 million.
As of March 4, 2010, the number of outstanding shares of the Common Stock, $0.01 par value, of Eagle Bancorp, Inc. was 19,631,164.
DOCUMENTS INCORPORATED BY REFERENCE
Portions of the Company's definitive Proxy Statement for the Annual Meeting of Shareholders to be held on May 20, 2010 are incorporated by reference in part III hereof.
EXPLANATORY NOTE
We filed our Annual Report on Form 10-K for the year ended December 31, 2009 on March 15, 2010 (the "Original Report"). We are filing this Amendment No. 1 on Form 10-K/A (this "Amendment") to:
- •
- correct inadvertent errors in the Cross Reference Sheet;
- •
- include a reconciliation of non-GAAP financial measures included in the Six Year Summary of Financial
Information
- •
- provide additional disclosures relating to the Company's troubled debt restructurings, potential problem loans, use of
updated appraisals and accounting for securities sold under agreements to repurchase;
- •
- provide certain additional information regarding targets during 2009 under our Senior Executive Incentive Plan;
- •
- to eliminate certain qualifications to our description of applicable supervisory and regulatory matters; and
- •
- to reflect certain inadvertently omitted exhibits.
No other changes to the Original Report are included in this Amendment other than the items mentioned above and to provide currently-dated Exhibit Nos. 23, 31.1, 31.2, 32.1 and 32.2.
This Amendment is being filed in response to comments we received from the staff of the Division of Corporation Finance of the Securities and Exchange Commission (the "SEC") in connection with the staff's review of the Original Report. We have made no attempt in this Amendment to modify or update the disclosures presented in the Original Report other than as noted above. Also, this Amendment does not reflect events occurring after the filing of the Original Report. Accordingly, this Amendment should be read in conjunction with the Original Report, as amended and our other filings with the SEC subsequent to the filing of the Original Report.
Form 10-K Cross Reference Sheet
The following shows the location in this Annual Report on Form 10-K or the Company's Proxy Statement for the Annual Meeting of Stockholders to be held on May 20, 2010, of the information required to be disclosed by the United States Securities and Exchange Commission Form 10-K. References to pages only are to pages in this report.
| PART I | Item 1. | Business. See "Business" at Pages 92 through 97, "Employees" at Page 106, "Market Area and Competition" at Pages 107 through 108 and "Regulation" at Pages 109 through 114. | ||
Item 1A. |
Risk Factors. See "Risk Factors" at Pages 98 through 106. |
|||
Item 1B. |
Unresolved Staff Comments. None |
|||
Item 2. |
Properties. See "Properties" at Pages 114 through 116. |
|||
Item 3. |
Legal Proceedings. From time to time the Company is a participant in various legal proceedings incidental to its business. In the opinion of management, the liabilities (if any) resulting from such legal proceedings will not have a material effect on the financial position of the Company. |
|||
Item 4. |
Submission of Matters to a Vote of Security Holders. No matter was submitted to a vote of the security holders of the Company during the fourth quarter of 2009. |
|||
PART II |
Item 5. |
Market for Registrant's Common Equity, Related Stockholder Matters and Issuer Purchases of Equity Securities. See "Market for Common Stock and Dividends" at Pages 45 though 47. |
||
Item 6. |
Selected Financial Data. See "Six Year Summary of Financial Information" at Pages 3 through 4. |
|||
Item 7. |
Management's Discussion and Analysis of Financial Condition and Results of Operation. See "Management's Discussion and Analysis of Financial Condition and Results of Operation" at Pages 5 through 44. |
|||
Item 7A. |
Quantitative and Qualitative Disclosures about Market Risk. See "Interest Rate Risk Management—Asset/Liability Management and Quantitative and Qualitative Disclosures About Market Risk" at Pages 37 through 41. |
|||
Item 8. |
Financial Statements and Supplementary Data. See Consolidated Financial Statements and Notes thereto at Pages 52 through 91. |
|||
Item 9. |
Changes in and Disagreements with Accountants on Accounting and Financial Disclosure. None. |
|||
Item 9A. |
Controls and Procedures. See "Disclosure Controls and Procedures" at Page 48 and "Management Report on Internal Control Over Financial Reporting" at Page 49. |
|||
Item 9B. |
Other Information. None. |
|||
PART III |
Item 10. |
Directors, Executive Officers and Corporate Governance. The information required by this Item is incorporated by reference to the material appearing under the captions "Election of Directors" and "Compliance with Section 16(a) of the Securities Exchange Act of 1934" in the Proxy Statement. |
||
The Company has adopted a code of ethics that applies to its Chief Executive Officer and Chief Financial Officer. A copy of the code of ethics will be provided to any person, without charge, upon written request directed to Jane Cornett, Corporate Secretary, Eagle Bancorp, Inc., 7815 Woodmont Avenue, Bethesda, Maryland 20814. |
||||
There have been no material changes in the procedures previously disclosed by which shareholders may recommend nominees to the Company's Board of Directors. |
||||
Item 11. |
Executive Compensation. The information required by this Item is incorporated by reference to the material appearing under the captions "Election of Directors—Director's Compensation" and "Executive Compensation" in the Proxy Statement, as amended under "Executive Compensation" at Pages 117 through 137. |
|||
Item 12. |
Security Ownership of Certain Beneficial Owners and Management and Related Stockholder Matters. See "Market for Common Stock and Dividends—Securities Authorized for Issuance Under Equity Compensation Plans" at page 46. The remainder of the information required by this Item is incorporated by reference to the material appearing under the caption "Voting Securities and Principal Shareholders" in the Proxy Statement. |
|||
Item 13. |
Certain Relationships and Related Transactions and Director Independence. The information required by this Item is incorporated by reference to the material appearing under the captions "Election of Directors" and "Certain Relationships and Related Transactions" in the Proxy Statement. |
|||
Item 14. |
Principal Accountant Fees and Services. The information required by this Item is incorporated by reference to the material appearing under the caption "Ratification of Appointment of Independent Registered Public Accounting Firm—Fees Paid to Independent Accounting Firm" in the Proxy Statement. |
|||
PART IV |
Item 15. |
Exhibits, Financial Statement Schedules. See "Exhibits and Financial Statements" at Pages 138 through 139. |
2
Six Year Summary of Selected Financial Data
The following table shows selected historical consolidated financial data for Eagle Bancorp, Inc. (the "Company"). It should be read in conjunction with the Company's audited Consolidated Financial Statements appearing elsewhere in this report.
| |
Year ended December 31, | ||||||||||||||||||
|---|---|---|---|---|---|---|---|---|---|---|---|---|---|---|---|---|---|---|---|
| (dollars in thousands except per share data) |
2009 | 2008 | 2007 | 2006 | 2005 | 2004 | |||||||||||||
Balance Sheet—Period End |
|||||||||||||||||||
Securities |
$ | 245,644 | $ | 169,079 | $ | 87,117 | $ | 91,140 | $ | 68,050 | $ | 64,098 | |||||||
Loans held for sale |
1,550 | 2,718 | 2,177 | 2,157 | 2,924 | 2,208 | |||||||||||||
Loans |
1,399,311 | 1,265,640 | 716,677 | 625,773 | 549,212 | 415,509 | |||||||||||||
Allowance for credit losses |
20,619 | 18,403 | 8,037 | 7,373 | 5,985 | 4,240 | |||||||||||||
Intangible assets, net |
4,379 | 2,533 | 236 | 255 | 168 | — | |||||||||||||
Total assets |
1,805,504 | 1,496,827 | 846,400 | 773,451 | 672,252 | 553,453 | |||||||||||||
Deposits |
1,460,274 | 1,129,380 | 630,936 | 628,515 | 568,893 | 462,287 | |||||||||||||
Borrowings |
150,090 | 215,952 | 128,408 | 68,064 | 32,139 | 30,316 | |||||||||||||
Subordinated debt |
9,300 | 12,150 | — | — | — | — | |||||||||||||
Total liabilities |
1,617,183 | 1,354,456 | 765,234 | 700,535 | 607,288 | 494,919 | |||||||||||||
Preferred stockholders' equity |
22,612 | 36,312 | — | — | — | — | |||||||||||||
Common stockholders' equity |
165,709 | 106,059 | 81,166 | 72,916 | 64,964 | 58,534 | |||||||||||||
Total stockholders' equity |
188,321 | 142,371 | 81,166 | 72,916 | 64,964 | 58,534 | |||||||||||||
Tangible common equity(1) |
161,330 | 102,568 | 80,930 | 72,661 | 64,796 | 58,534 | |||||||||||||
Statement of Operations |
|||||||||||||||||||
Interest income |
$ | 84,338 | $ | 65,657 | $ | 57,077 | $ | 50,318 | $ | 36,726 | $ | 24,195 | |||||||
Interest expense |
24,809 | 23,676 | 23,729 | 17,880 | 8,008 | 4,328 | |||||||||||||
Provision for credit losses |
7,669 | 3,979 | 1,643 | 1,745 | 1,843 | 675 | |||||||||||||
Noninterest income |
7,297 | 4,366 | 5,186 | 3,846 | 3,998 | 3,753 | |||||||||||||
Noninterest expense |
42,773 | 30,817 | 24,921 | 21,824 | 18,960 | 14,952 | |||||||||||||
Income before taxes |
16,384 | 11,551 | 11,970 | 12,715 | 11,913 | 7,993 | |||||||||||||
Income tax expense |
5,965 | 4,123 | 4,269 | 4,690 | 4,369 | 2,906 | |||||||||||||
Net income |
10,419 | 7,428 | 7,701 | 8,025 | 7,544 | 5,087 | |||||||||||||
Preferred dividends |
2,307 | 177 | — | — | — | — | |||||||||||||
Net income available to common shareholders |
8,112 | 7,251 | 7,701 | 8,025 | 7,544 | 5,087 | |||||||||||||
Per Common Share Data(2) |
|||||||||||||||||||
Net income, basic |
$ | 0.55 | $ | 0.63 | $ | 0.73 | $ | 0.77 | $ | 0.74 | $ | 0.51 | |||||||
Net income, diluted |
0.55 | 0.62 | 0.71 | 0.74 | 0.70 | 0.48 | |||||||||||||
Dividends declared |
— | 0.11 | 0.22 | 0.21 | 0.20 | — | |||||||||||||
Book value |
8.48 | 8.19 | 7.59 | 6.99 | 6.32 | 5.80 | |||||||||||||
Tangible book value(1) |
8.26 | 7.92 | 7.57 | 6.97 | 6.31 | 5.80 | |||||||||||||
Common shares outstanding |
19,534,226 | 12,714,355 | 10,693,447 | 10,425,870 | 10,274,394 | 10,078,712 | |||||||||||||
Weighted average common shares outstanding |
14,643,294 | 11,556,569 | 10,531,236 | 10,373,080 | 10,177,948 | 10,062,368 | |||||||||||||
Ratios |
|||||||||||||||||||
Net interest margin |
3.85 | % | 4.05 | % | 4.37 | % | 4.81 | % | 4.99 | % | 4.35 | % | |||||||
Efficiency ratio(3) |
64.01 | % | 66.49 | % | 66.54 | % | 60.15 | % | 57.95 | % | 63.30 | % | |||||||
Return on average assets |
0.65 | % | 0.69 | % | 0.96 | % | 1.13 | % | 1.24 | % | 1.04 | % | |||||||
Return on average common equity |
6.60 | % | 8.05 | % | 10.03 | % | 11.63 | % | 12.25 | % | 9.16 | % | |||||||
Total capital (to risk weighted assets) |
13.57 | % | 11.93 | % | 11.21 | % | 11.91 | % | 12.05 | % | 13.45 | % | |||||||
Tier 1 capital (to risk weighted assets) |
11.82 | % | 9.78 | % | 10.20 | % | 10.82 | % | 11.04 | % | 12.52 | % | |||||||
Tier 1 capital (to average assets) |
10.29 | % | 9.22 | % | 9.46 | % | 9.67 | % | 9.94 | % | 11.98 | % | |||||||
Asset Quality |
|||||||||||||||||||
Nonperforming assets and loans 90+ past due |
$ | 27,131 | $ | 26,366 | $ | 5,324 | $ | 2,013 | $ | 491 | $ | 156 | |||||||
Nonperforming assets and loans 90+ past due to total assets |
1.50 | % | 1.76 | % | 0.63 | % | 0.26 | % | 0.07 | % | 0.03 | % | |||||||
Allowance for credit losses to loans |
1.47 | % | 1.45 | % | 1.12 | % | 1.18 | % | 1.09 | % | 1.02 | % | |||||||
Allowance for credit losses to nonperforming assets |
76.00 | % | 69.80 | % | 150.96 | % | 366.27 | % | 1218.94 | % | 2717.95 | % | |||||||
Net charge-offs |
$ | 5,454 | $ | 1,123 | $ | 979 | $ | 357 | $ | 98 | $ | 115 | |||||||
Net charge-offs to average loans |
0.42 | % | 0.12 | % | 0.15 | % | 0.06 | % | 0.02 | % | 0.03 | % | |||||||
- (1)
- The information set forth below contains certain financial information determined by methods other than in accordance with generally accepted accounting policies in the United States ("GAAP"). These non-GAAP financial measures are "tangible common equity," and "tangible book value per common share." Our management uses these non-GAAP measures in its
3
analysis of our performance because it believes these measures are material and will be used as a measure of our performance by investors. These disclosures should not be considered in isolation or a substitute for results determined in accordance with GAAP, and are not necessarily comparable to non-GAAP performance measures which may be presented by other bank holding companies. Management compensates for these limitations by providing detailed reconciliations between GAAP information and the non-GAAP financial measures. A reconciliation of these non-GAAP measures to the most comparable GAAP measure is set forth below.
| |
Year ended December 31, | ||||||||||||||||||
|---|---|---|---|---|---|---|---|---|---|---|---|---|---|---|---|---|---|---|---|
(dollars in thousands except per share data)
|
2009 | 2008 | 2007 | 2006 | 2005 | 2004 | |||||||||||||
Common stockholders' equity |
$ | 165,709 | $ | 106,059 | $ | 81,166 | $ | 72,916 | $ | 64,964 | $ | 58,534 | |||||||
Less: Intangible assets |
(4,379 | ) | (2,533 | ) | (236 | ) | (255 | ) | (168 | ) | — | ||||||||
Tangible common equity |
$ | 161,330 | $ | 103,526 | $ | 80,930 | $ | 72,661 | $ | 64,796 | $ | 58,534 | |||||||
Book value per common share |
$ | 8.48 | $ | 8.34 | $ | 7.59 | $ | 6.99 | $ | 6.32 | $ | 5.80 | |||||||
Less: Intangible book value per common share |
(0.22 | ) | (0.20 | ) | (0.02 | ) | (0.02 | ) | (0.01 | ) | — | ||||||||
Tangible book value per common share |
$ | 8.26 | $ | 8.14 | $ | 7.57 | $ | 6.97 | $ | 6.31 | $ | 5.80 | |||||||
- (2)
- Presented
giving retroactive effect to the 10% stock dividend paid on the common stock on October 1, 2008 and the stock splits in the form of 30%
dividend on the common stock paid on July 5, 2006 and February 28, 2005. In July 2008, the Company discontinued the payment of its quarterly cash dividend.
- (3)
- Computed by dividing noninterest expense by the sum of net interest income and noninterest income.
4
MANAGEMENT'S DISCUSSION AND ANALYSIS OF FINANCIAL CONDITION
AND RESULTS OF OPERATIONS
The following discussion provides information about the results of operations, financial condition, liquidity, and capital resources of Eagle Bancorp, Inc. (the "Company"). The Company's primary subsidiaries are EagleBank (the "Bank") and Eagle Commercial Ventures ("ECV"). This discussion and analysis should be read in conjunction with the audited Consolidated Financial Statements and Notes thereto, appearing elsewhere in this report.
Caution About Forward Looking Statements. This report contains forward looking statements within the meaning of Section 27A of the Securities Act of 1933, as amended, or the Securities Act, and Section 21E of the Securities Exchange Act of 1934, as amended, or the Exchange Act. These forward looking statements represent plans, estimates, objectives, goals, guidelines, expectations, intentions, projections and statements of our beliefs concerning future events, business plans, objectives, expected operating results and the assumptions upon which those statements are based. Forward looking statements include without limitation, any statement that may predict, forecast, indicate or imply future results, performance or achievements, and are typically identified with words such as "may," "could," "should," "will," "would," "believe," "anticipate," "estimate," "expect," "intend," "plan," or words or phases of similar meaning. These forward looking statements are based largely on our expectations and are subject to a number of known and unknown risks and uncertainties that are subject to change based on factors which are, in many instances, beyond our control. Actual results, performance or achievements could differ materially from those contemplated, expressed, or implied by the forward looking statements.
The following factors, among others, could cause our financial performance to differ materially from that expressed in such forward looking statements:
- •
- The strength of the United States economy in general and the strength of the local economies in which we conduct
operations;
- •
- Geopolitical conditions, including acts or threats of terrorism, actions taken by the United States or other governments
in response to acts or threats of terrorism and/or military conflicts, which could impact business and economic conditions in the United States and abroad;
- •
- The effects of, and changes in, trade, monetary and fiscal policies and laws, including interest rate policies of the
Board of Governors of the Federal Reserve System (the "Federal Reserve Board;" inflation, interest rate, market and monetary fluctuations;
- •
- The timely development of competitive new products and services and the acceptance of these products and services by new
and existing customers;
- •
- The willingness of users to substitute competitors' products and services for our products and services;
- •
- The impact of changes in financial services policies, laws and regulations, including laws, regulations and policies
concerning taxes, banking, securities and insurance, and the application thereof by regulatory bodies;
- •
- The effect of changes in accounting policies and practices, as may be adopted from time-to-time by
bank regulatory agencies, the Securities and Exchange Commission (the "SEC"), the Public Company Accounting Oversight Board, the Financial Accounting Standards Board or other accounting standards
setters;
- •
- Technological changes;
- •
- The effect of acquisitions we may make, including, without limitation, the failure to achieve the expected revenue growth and/or expense savings from such acquisitions;
5
- •
- The growth and profitability of non-interest or fee income being less than expected;
- •
- Changes in the level of our non-performing assets and charge-offs;
- •
- Changes in consumer spending and savings habits; and
- •
- Unanticipated regulatory or judicial proceedings.
If one or more of the factors affecting our forward looking information and statements proves incorrect, then our actual results, performance or achievements could differ materially from those expressed in, or implied by, forward looking information and statements contained in this report. You should not to place undue reliance on our forward looking information and statements. We will not update the forward looking statements to reflect actual results or changes in the factors affecting the forward looking statements.
GENERAL
The Company is a growth oriented, one-bank holding company headquartered in Bethesda, Maryland. The Company provides general commercial and consumer banking services through the Bank, its wholly owned banking subsidiary, a Maryland chartered bank which is a member of the Federal Reserve System. The Company was organized in October 1997, to be the holding company for the Bank. The Bank was organized as an independent, community oriented, full service banking alternative to the super regional financial institutions, which dominate the primary market area. The Company's philosophy is to provide superior, personalized service to its customers. The Company focuses on relationship banking, providing each customer with a number of services, becoming familiar with and addressing customer needs in a proactive, personalized fashion. The Bank currently has a total of fourteen offices which is comprised of eight offices serving Montgomery County, Maryland, five offices in the District of Columbia and one office in Fairfax County, Virginia. Our eighth office in Montgomery County, located in Potomac, Maryland, opened in the fourth quarter of 2009.
The Company offers a broad range of commercial banking services to its business and professional clients as well as full service consumer banking services to individuals living and/or working primarily in the service area. The Company emphasizes providing commercial banking services to sole proprietors, small and medium-sized businesses, partnerships, corporations, non-profit organizations and associations, and investors living and working in and near the primary service area. A full range of retail banking services are offered to accommodate the individual needs of both corporate customers as well as the community the Company serves. These services include the usual deposit functions of commercial banks, including business and personal checking accounts, "NOW" accounts and money market and savings accounts, business, construction, and commercial loans, residential mortgages and consumer loans and cash management services. The Company has developed significant expertise and commitment as an SBA lender, and has been designated a Preferred Lender by the Small Business Administration ("SBA").
Throughout 2009, the financial services industry continued to encounter significant volatility and stress following severe contraction in worldwide economic activity, credit defaults and asset value declines in the fourth quarter of 2008 and first quarter of 2009. Generally weak economic conditions persisted in the U.S. economy and regionally in the twelve months ended December 31, 2009, with unemployment levels increasing, real estate values declining, personal income levels remaining flat, and average interest rates declining sharply. In this difficult operating environment, the Company was able to produce positive earnings in each quarter of 2009. The Company's primary market, the Washington, D.C. metropolitan area, has been relatively less impacted by the severe recessionary climate than other parts of the country, due in part to the significant economic impact of the federal government. The Company did not make subprime residential mortgage loans to retail customers, and did not invest in private label mortgage backed securities, securities backed by subprime or Alt A mortgages, or the preferred stock of Freddie Mac and Fannie Mae, factors which have negatively impacted many banking companies. Notably, the
6
Company was successful in raising a significant amount of additional common equity in the third quarter of 2009 to fund additional growth, at a time when many community banks did not have access to capital markets. The new capital allowed the Company to redeem $15 million of the preferred stock which had been sold to the United States Department of the Treasury (the "Treasury") under the Troubled Asset Relief Program Capital Purchase Program (the "Capital Purchase Program") in December 2008.
While the slowdown in the economy was less severe in the Company's marketplace than many other areas of the country, declines in housing construction and real estate values, and the related impact on contractors and other small and medium sized businesses' activity, has impacted the Company's customers and business. However, the Company has continued had the resources to continue to meet the credit needs of its community. The Company believes its strategies during these difficult economic times are providing substantial new relationships and future growth opportunities.
CRITICAL ACCOUNTING POLICIES
The Company's Consolidated Financial Statements are prepared in accordance with accounting principles generally accepted in the United States of America ("GAAP") and follow general practices within the banking industry. Application of these principles requires management in certain circumstances to make estimates, assumptions, and judgments that affect the amounts reported in the financial statements and accompanying notes. These estimates, assumptions and judgments are based on information available as of the date of the Consolidated Financial Statements; accordingly, as this information changes, the Consolidated Financial Statements could reflect different estimates, assumptions, and judgments. Certain policies inherently have a greater reliance on the use of estimates, assumptions and judgments and as such have a greater possibility of producing results that could be materially different than originally reported.
Estimates, assumptions, and judgments are necessary when assets and liabilities are required to be recorded at fair value, when a decline in the value of an asset warrants an impairment write-down or a valuation reserve to be established, or when an asset or liability needs to be recorded contingent upon a future event. Carrying assets and liabilities at fair value inherently results in more financial statement volatility.
The fair values and the information used to record valuation adjustments for investment securities available for sale are based either on quoted market prices or are provided by other third-party sources, when available. The Company's investment portfolio is categorized as available for sale with unrealized gains and losses net of tax being a component of stockholders' equity and comprehensive income. Refer to the fair value disclosures at page 19 and Note 19 to the Consolidated Financial Statements at page 83 for further discussion of the carrying value of the investment portfolio and certain loans.
The allowance for credit losses is an estimate of the losses that may be sustained in our loan portfolio. The allowance is based on two principles of accounting: (a) ASC Topic 450, "Contingencies," which requires that losses be accrued when they are probable of occurring and are estimable and (b) ASC Topic 310, "Receivables," which requires that losses be accrued when it is probable that the Company will not collect all principal and interest payments according to the contractual terms of the loan. The loss, if any, can be determined by the difference between the loan balance and the value of collateral, the present value of expected future cash flows, or values observable in the secondary markets.
Three components comprise our allowance for credit losses: a specific allowance, a formula allowance and a nonspecific or environmental factors allowance. Each component is determined based on estimates that can and do change when actual events occur.
The specific allowance allocates a reserve to identified impaired loans. Loans identified in the risk rating evaluation as substandard, doubtful and loss (classified loans), are segregated from non-classified loans. Classified loans are assigned specific reserves based on an impairment analysis. Under ASC Topic
7
310, "Receivables," a loan for which reserves are individually allocated may show deficiencies in the borrower's overall financial condition, payment record, support available from financial guarantors and the fair market value of collateral. When a loan is identified as impaired, a specific reserve is established based on the Company's assessment of the loss that may be associated with the individual loan.
The formula allowance is used to estimate the loss on internally risk rated loans, exclusive of those identified as requiring specific reserves. The portfolio of unimpaired loans is stratified by loan type and risk assessment. Allowance factors relate to the type of loan and level of the internal risk rating, with loans exhibiting higher risk and loss experience receiving a higher allowance factor.
The environmental allowance is used to estimate the loss associated with pools of non-classified loans. These unclassified loans are also stratified by loan type, and environmental allowance factors are assigned by management based upon a number of conditions, including delinquencies, loss history, changes in lending policy and procedures, changes in business and economic conditions, changes in the nature and volume of the portfolio, management expertise, concentrations within the portfolio, quality of internal and external loan review systems, competition, and legal and regulatory requirements.
The allowance captures losses inherent in the portfolio which have not yet been recognized. Allowance factors and the overall size of the allowance may change from period to period based upon management's assessment of the above described factors, the relative weights given to each factor, and portfolio composition.
Management has significant discretion in making the judgments inherent in the determination of the provision and allowance for credit losses, including, in connection with the valuation of collateral, a borrower's prospects of repayment, and in establishing allowance factors on the formula allowance and environmental allowance components of the allowance. The establishment of allowance factors involves a continuing evaluation, based on management's ongoing assessment of the global factors discussed above and their impact on the portfolio. The allowance factors may change from period to period, resulting in an increase or decrease in the amount of the provision or allowance, based upon the same volume and classification of loans. Changes in allowance factors can have a direct impact on the amount of the provision, and a related after tax effect on net income. Errors in management's perception and assessment of the global factors and their impact on the portfolio could result in the allowance not being adequate to cover losses in the portfolio, and may result in additional provisions or charge-offs. Alternatively, errors in management's perception and assessment of the global factors and their impact on the portfolio could result in the allowance being in excess of amounts necessary to cover losses in the portfolio, and may result in lower provisions in the future. For additional information regarding the allowance for credit losses, refer to the discussion under the caption "Allowance for Credit Losses" at page 24.
The Company follows the provisions of ASC Topic 718"Compensation," which requires the expense recognition for the fair value of share based compensation awards, such as stock options, restricted stock units, and performance based shares. This standard allows management to establish modeling assumptions as to expected stock price volatility, option terms, forfeiture rates and dividend rates which directly impact estimated fair value. The accounting standard also allows for the use of alternative option pricing models which may impact fair value as determined. The Company's practice is to utilize reasonable and supportable assumptions which are reviewed with the appropriate Board Committee.
In accounting for the acquisition of Fidelity & Trust Financial Corporation ("Fidelity") and its subsidiary Fidelity & Trust Bank ("F&T Bank"), the Company followed the provisions of ASC Topic 805 "Business Combinations," which mandates the use of the purchase method of accounting and ASC Topic 310-30, "Loans and Debt Securities Acquired with Deteriorated Credit Quality." Accordingly, the tangible assets and liabilities and identifiable intangibles acquired were recorded at their respective fair values on the date of acquisition, with any impaired loans acquired being recorded at fair value outside the allowance for loan losses. The valuation of the loan and time deposit portfolios acquired were made by independent analysis for the difference between the instruments' stated interest rates and the instruments' current
8
origination interest rate, with premiums and discounts being amortized to interest income and interest expense to achieve an effective market interest rate. An identified intangible asset related to core deposits was recorded based on independent valuation. Deferred tax assets were recorded for the future value of a net operating loss and for the tax effect of temporary timing differences between the accounting and tax basis of assets and liabilities. The Company recorded an unidentified intangible (goodwill) for the excess of the purchase price of the acquisition (including direct acquisition costs) over the fair value of net tangible and identifiable intangible assets acquired. See "Allowance for Credit Losses" at page 24, "Nonperforming Assets" at page 26, "Intangible Assets" at page 29, and Note 4 "Loans and Allowance for Credit Losses;" to the Consolidated Financial Statements, for further information on the acquisition of Fidelity.
RESULTS OF OPERATIONS
Overview
The Company reported net income of $10.4 million for the year ended December 31, 2009, a 40% increase from net income of $7.4 million for the year ended December 31, 2008, as compared to $7.7 million for the year ended December 31, 2007. Net income available to common stockholders, which is after accrual of preferred stock dividends, was $8.1 million for year ended December 31, 2009, a 12% increase from net income available to common stockholders of $7.3 million for the year ended December 31, 2008.
The increase in net income for the twelve months ended December 31, 2009 can be attributed primarily to an increase in net interest income of 42% as compared to the same period in 2008. Net interest income growth was due substantially to growth in average earning assets of 49% in 2009.
Earnings per basic common share were $0.55 for the year ended December 31, 2009, as compared to $0.63 for 2008 and $0.73 for 2007. Earnings per diluted common share were $0.55 for the year ended December 31, 2009, as compared to $0.62 for 2008 and $0.71 for 2007. Per common share amounts and the number of shares have been adjusted to give effect to the 10% stock dividend paid on October 1, 2008. The decline in net income per common share for 2009 in part reflects the significant increase in the number of shares outstanding as a result of the Company's successful offering of common stock completed in September 2009.
For the three months ended December 31, 2009, the Company reported net income of $3.0 million as compared to $1.7 million for the same period in 2008. Earnings per basic and diluted common shares were $0.12 for the three months ended December 31, 2009 and for the same period in 2008, respectively.
The Company had a return on average assets of 0.65% and a return on average common equity of 6.60% for the year of 2009, as compared to returns on average assets and average equity of 0.69% and 8.05%, respectively, for the year of 2008 and 0.96% and 10.03%, respectively, for the year of 2007.
The Company's earnings are largely dependent on net interest income, which represented 89% of total revenue in 2009 and 91% in 2008. For the twelve months ended December 31, 2009, the net interest margin, which measures the difference between interest income and interest expense (i.e. net interest income) as a percentage of earning assets declined from 4.05% for the twelve months ended December 31, 2008 to 3.85% for the twelve months ended December 31, 2009. This decline was due primarily to a reduced benefit of noninterest funding sources from 63 basis points in 2008 to 48 basis points for 2009, as average interest rates were lower in 2009 than in 2008. Average interest bearing liabilities funding average earning assets decreased to 77% as compared to 78% for the year of 2008. Additionally, while the average rate on earning assets for the twelve month period ended December 31, 2009, as compared to 2008 decreased by 87 basis points from 6.33% to 5.46%, the cost of interest bearing liabilities decreased by 82 basis points from 2.91% to 2.09%, resulting in a net interest spread of 3.37% for the twelve months ended December 31, 2009, as compared to 3.42% for the same period in 2008, a slight decline of 5 basis points.
9
For the twelve months ended December 31, 2009, average noninterest sources funding earning assets were $355 million as compared to $225 million for the same period in 2008.
For the three months ended December 31, 2009 and 2008, average interest bearing liabilities were 75% and 79%, respectively, of average earning assets. Additionally, while the average rate on earning assets for the three months ended December 31, 2009 has declined by 61 basis points from 5.91% to 5.30%, as compared to 2008, the cost of interest bearing liabilities has decreased by 92 basis points from 2.73% to 2.81%, resulting in a increase in the net interest spread of 31 basis points from 3.18% for the quarter ended December 31, 2008 to 3.49% for the three months ended December 31, 2009. The net interest margin increased 22 basis points from 3.74% for the three months ended December 31, 2008 to 3.96% for the three months ended December 31, 2009. The higher margin in the fourth quarter of 2009 was due primarily to lower funding costs resulting from a decline in money market rates and a higher mix of noninterest bearing deposits. Noninterest sources funding earning assets declined from 56 basis points for the three months ended December 31, 2008 to 47 basis points for the three months ended December 31, 2009. As with the twelve month period comparisons, this decline was due to the lower level of interest rates in 2009 as compared to 2008.
The Company believes it has effectively managed its net interest margin and net interest income over the past twelve months as market interest rates have declined. This factor has been significant to overall earnings performance over the past twelve months as net interest income represents the most significant component of the Company's revenues.
Due to favorable core deposit growth over the past twelve months, the need to meet loan funding objectives has not required the expanded use of alternative funding sources, such as Federal Home Loan Bank ("FHLB") advances, correspondent bank lines of credit and brokered time deposits, the balances of which have declined since December 31, 2008. The major component of the growth in core deposits has been growth in a special money market account originally promoted through advertisements, but which is now promoted primarily through direct sales effort by the business development staff.
In terms of the average balance sheet composition or mix, loans, which generally have higher yields than securities and other earning assets, decreased from 88% of average earning assets in 2008 to 85% of average earning assets for 2009, as balance sheet liquidity evidenced by an increased level of average federal funds sold and other short term investments increased in 2009. Investment securities accounted for 12% and 11% of average earning assets for 2009 and 2008, respectively. Federal funds sold averaged 3% and 1% of average earning assets for 2009 and 2008, respectively. The higher average level of investments and federal funds sold in 2009 (i.e. higher average liquidity) contributed to the decline in the net interest margin in 2009 as compared to 2008.
For the three months ended December 31, 2009, average loans were 81% of average earning assets as compared to 87% for the same period in 2008. Loan growth amounted to $82.2 million in the fourth quarter, as compared to $128.3 million of deposit growth. The loan growth is attributable to both seasonality and to third quarter end loan commitments whose fundings carried into the fourth quarter of 2009. The significant increase in deposits in the fourth quarter is primarily attributable to strong sales force efforts and some seasonal inflows. Average investment securities for the three months ended December 31, 2009 amounted to 13% of average earning assets, an increase of 1% from an average of 12% for the same period in 2008. Average federal funds sold averaged 6% of average earning assets for the three months ended December 31, 2009 as compared to 1% for the same period in 2008, the increase due to higher average deposit growth as compared to average loan growth.
The provision for credit losses was $7.7 million for the year ended December 31, 2009 as compared to $4.0 million in 2008. The higher provisioning in 2009 as compared to 2008 is attributable to higher net charge-offs in 2009, $134 million in loan growth, risk migration within the portfolio due to a weaker economy and to increased reserves for problem loans. For the full year 2009, the Company recorded net charge-offs of $5.5 million, as compared to $1.1 million for the same period in 2008. The ratio of net
10
charge-offs to average loans was 0.42% for 2009 and 0.12% for 2008. The amount of net charge-offs in 2009 was attributable to charge-offs in the unguaranteed portion of SBA loans ($496 thousand), commercial and industrial loans ($3.2 million), consumer loans ($568 thousand), mortgage loans ($552 thousand), commercial real estate investment property loans ($488 thousand) and owner occupied commercial real estate loans ($175 thousand).
At December 31, 2009, the allowance for credit losses was $20.6 million or 1.47% of total loans, as compared to $18.4 million or 1.45% of total loans at December 31, 2008. The higher allowance percentage in 2009, as compared to 2008, is primarily attributable to higher levels of classified loans and related reserve allocations.
The provision for credit losses was $2.5 million for the three months ended December 31, 2009 as compared to $1.5 million for the same period in 2008, the increase being primarily attributable to both higher levels of net credit losses and substantial loan growth in the fourth quarter of 2009. For the fourth quarter of 2009, the Company recorded net charge-offs of $1.8 million, as compared to $166 thousand net charge-offs for the fourth quarter of 2008. The charge-offs in the fourth quarter of 2009 were attributable to charge-offs in the unguaranteed portion of SBA loans ($194 thousand), commercial and industrial loans ($1.0 million), consumer loans ($188 thousand), mortgage loans ($161 thousand), commercial real estate investment property loans ($115 thousand), and owner occupied commercial real estate loans ($137 thousand).
Total noninterest income was $7.3 million for the year 2009 as compared to $4.4 million for 2008, an increase of 67%. This increase was due primarily to higher service charges on deposit accounts of $839 thousand resulting primarily from increased number of deposit accounts, gains realized on the sale of residential and SBA loans of $628 thousand, and gains realized on the investment securities portfolio of $1.5 million. Investment gains realized in the second quarter of 2009 were the result of asset/liability management decisions to reduce call risk in the portfolio of U.S. Agency securities, to reduce potential extension risk in longer term U.S. Agency mortgage backed securities and to better position the investment portfolio for potentially higher interest rates over future years. Increased gains from mortgage banking activities in 2009 reflect higher levels of mortgage refinancing given lower market interest rates.
Total noninterest income for the three months ended December 31, 2009 increased slightly to $1.28 million from $1.26 million for the three months ended December 31, 2008, a 1% increase. This slight increase was due to higher gains realized on the sale of residential and SBA loans and securities of $138 thousand offset by a decrease of $123 thousand in service charges and other income, primarily from lower levels of overdraft charges.
Total noninterest expenses increased from $30.8 million for 2008 to $42.8 million for 2009, an increase of 39%. The primary reason for this increase was the Fidelity acquisition (completed August 31, 2008) and staff additions which increased the size of the organization, and other related personnel and benefit costs of $4.2 million, increased occupancy costs of $1.9 million, related in part to one new office and increased data processing costs of $734 thousand. In addition, higher costs were incurred for legal, accounting and professional fees of $1.7 million and Federal Deposit Insurance Corporation ("FDIC") deposit insurance premiums of $2.1 million, which includes the special FDIC assessment of approximately $723 thousand recorded in the second quarter of 2009 and reflects higher base premium rates and increased levels of insured deposits. Other expenses increased $1.3 million primarily due to $304 thousand in OREO expenses, other losses of $299 thousand resulting from the write-off of ATM/Overdrafts fees, director fees of $169 thousand and $123 thousand of intangible amortization. The efficiency ratio, which measures the level of non-interest expense to total revenue (defined as the sum of net interest income and noninterest income) was 64.01% for the year of 2009 as compared to 66.49% for 2008. While the Company continues to make strategic investments in infrastructure, attention to post-merger integration was emphasized in 2009, resulting in more efficient operations.
11
Total noninterest expenses were $10.6 million for the three months ended December 31, 2009, as compared to $10.5 million for the three months ended December 31, 2008, a 1% increase. Higher costs were incurred for salaries and benefits of $142 thousand, data processing of $106 thousand, legal, accounting and professional fees of $292 thousand, and FDIC insurance of $35 thousand. The higher costs were offset by a reduction in other expenses of $95 thousand and in marketing and advertising of $343 thousand resulting from the second year of sponsorship costs for the EagleBank Bowl being accrued over the twelve months of 2009, compared to 2008 where the costs were expensed primarily in the fourth quarter. The efficiency ratio was 59.02% for the fourth quarter of 2009, as compared to 72.54% for the fourth quarter of 2008, as the Company has enhanced its productivity since the acquisition.
Net Interest Income and Net Interest Margin
Net interest income is the difference between interest income on earning assets and the cost of funds supporting those assets. Earning assets are composed primarily of loans and investment securities. The cost of funds represents interest expense on deposits, customer repurchase agreements and other borrowings, which comprise federal funds purchased and other borrowings. Noninterest bearing deposits and capital are other components representing funding sources. Changes in the volume and mix of assets and funding sources, along with the changes in yields earned and rates paid, determine changes in net interest income. Net interest income in 2009 was $59.5 million compared to $42.0 million in 2008 and $33.3 million in 2007. For the three months ended December 31, 2009, net interest income was $16.7 million as compared to $13.2 million and $8.8 million for the same period in 2008 and 2007, respectively.
The tables below labeled "Average Balances, Interest Yields and Rates and Net Interest Margin" present the average balances and rates of the various categories of the Company's assets and liabilities for the years and three months ended December 31, 2009, 2008 and 2007. Included in the tables are measurements of interest rate spread and margin. Interest spread is the difference (expressed as a percentage) between the interest rate earned on earning assets less the interest expense on interest bearing liabilities. While net interest spread provides a quick comparison of earnings rates versus cost of funds, management believes that margin provides a better measurement of performance. Margin includes the effect of noninterest bearing sources in its calculation and is net interest income expressed as a percentage of average earning assets.
12
Average Balances, Interest Yields and Rates, and Net Interest Margin
| |
Year Ended December 31, | ||||||||||||||||||||||||||||
|---|---|---|---|---|---|---|---|---|---|---|---|---|---|---|---|---|---|---|---|---|---|---|---|---|---|---|---|---|---|
| |
2009 | 2008 | 2007 | ||||||||||||||||||||||||||
| (dollars in thousands) |
Average Balance |
Interest | Average Yield/Rate |
Average Balance |
Interest | Average Yield/Rate |
Average Balance |
Interest | Average Yield/Rate |
||||||||||||||||||||
ASSETS: |
|||||||||||||||||||||||||||||
Interest earning assets: |
|||||||||||||||||||||||||||||
Interest bearing deposits with other banks and other short-term investments |
$ | 3,928 | $ | 94 | 2.39 | % | $ | 3,750 | $ | 98 | 2.61 | % | $ | 4,565 | $ | 293 | 6.42 | % | |||||||||||
Loans(1)(2)(3) |
1,312,537 | 77,004 | 5.87 | % | 911,329 | 59,901 | 6.57 | % | 659,204 | 51,931 | 7.88 | % | |||||||||||||||||
Investment securities available for sale(3) |
182,073 | 7,138 | 3.92 | % | 111,398 | 5,459 | 4.90 | % | 85,177 | 4,177 | 4.90 | % | |||||||||||||||||
Federal funds sold |
46,412 | 102 | 0.22 | % | 11,255 | 199 | 1.77 | % | 13,682 | 676 | 4.94 | % | |||||||||||||||||
Total interest earning assets |
1,544,950 | 84,338 | 5.46 | % | 1,037,732 | 65,657 | 6.33 | % | 762,628 | 57,077 | 7.48 | % | |||||||||||||||||
Noninterest earning assets |
70,012 | 50,050 | 45,217 | ||||||||||||||||||||||||||
Less: allowance for credit losses |
19,344 | 11,581 | 7,408 | ||||||||||||||||||||||||||
Total noninterest earning assets |
50,668 | 38,469 | 37,809 | ||||||||||||||||||||||||||
TOTAL ASSETS |
$ | 1,595,618 | $ | 1,076,201 | $ | 800,437 | |||||||||||||||||||||||
LIABILITIES AND STOCKHOLDERS' EQUITY |
|||||||||||||||||||||||||||||
Interest bearing liabilities: |
|||||||||||||||||||||||||||||
Interest bearing transaction |
$ | 52,083 | $ | 161 | 0.31 | % | $ | 48,094 | $ | 306 | 0.64 | % | $ | 51,465 | $ | 306 | 0.59 | % | |||||||||||
Savings and money market |
401,912 | 6,144 | 1.53 | % | 225,126 | 4,212 | 1.87 | % | 177,312 | 6,044 | 3.41 | % | |||||||||||||||||
Time deposits |
566,686 | 14,651 | 2.59 | % | 402,232 | 15,025 | 3.74 | % | 270,480 | 13,461 | 4.98 | % | |||||||||||||||||
Total interest bearing deposits |
1,020,681 | 20,956 | 2.05 | % | 675,452 | 19,543 | 2.89 | % | 499,257 | 19,811 | 3.97 | % | |||||||||||||||||
Customer repurchase agreements and federal funds purchased |
93,363 | 957 | 1.03 | % | 68,696 | 1,406 | 2.05 | % | 44,992 | 1,886 | 4.19 | % | |||||||||||||||||
Other short-term borrowings |
30,562 | 611 | 1.97 | % | 15,577 | 546 | 3.51 | % | 11,093 | 611 | 5.51 | % | |||||||||||||||||
Long-term borrowings |
45,322 | 2,285 | 5.04 | % | 53,750 | 2,181 | 4.06 | % | 29,033 | 1,421 | 4.89 | % | |||||||||||||||||
Total interest bearing liabilities |
1,189,928 | 24,809 | 2.09 | % | 813,475 | 23,676 | 2.91 | % | 584,375 | 23,729 | 4.06 | % | |||||||||||||||||
Noninterest bearing liabilities: |
|||||||||||||||||||||||||||||
Noninterest bearing demand |
236,340 | 164,116 | 135,075 | ||||||||||||||||||||||||||
Other liabilities |
8,702 | 5,718 | 4,227 | ||||||||||||||||||||||||||
Total noninterest bearing liabilities |
245,042 | 169,834 | 139,302 | ||||||||||||||||||||||||||
Stockholders' equity |
160,648 | 92,892 | 76,760 | ||||||||||||||||||||||||||
TOTAL LIABILITIES AND STOCKHOLDERS' EQUITY |
$ | 1,595,618 | $ | 1,076,201 | $ | 800,437 | |||||||||||||||||||||||
Net interest income |
$ | 59,529 | $ | 41,981 | $ | 33,348 | |||||||||||||||||||||||
Net interest spread |
3.37 | % | 3.42 | % | 3.42 | % | |||||||||||||||||||||||
Net interest margin |
3.85 | % | 4.05 | % | 4.37 | % | |||||||||||||||||||||||
- (1)
- Includes
loans held for sale.
- (2)
- Loans
placed on nonaccrual status are included in average balances. Net loan fees and late charges included in interest income on loans totaled
$2.1 million, $1.6 million and $1 million for 2009, 2008 and 2007, respectively.
- (3)
- Interest and fees on loans and investment securities available for sale exclude tax equivalent adjustments.
13
Average Balances, Interest Yields and Rates, and Net Interest Margin
| |
Three Months Ended December 31, | ||||||||||||||||||||||||||||
|---|---|---|---|---|---|---|---|---|---|---|---|---|---|---|---|---|---|---|---|---|---|---|---|---|---|---|---|---|---|
| |
2009 | 2008 | 2007 | ||||||||||||||||||||||||||
| (dollars in thousands) |
Average Balance |
Interest | Average Yield/Rate |
Average Balance |
Interest | Average Yield/Rate |
Average Balance |
Interest | Average Yield/Rate |
||||||||||||||||||||
ASSETS: |
|||||||||||||||||||||||||||||
Interest earning assets: |
|||||||||||||||||||||||||||||
Interest bearing deposits with other banks and other short-term investments |
$ | 7,470 | $ | 39 | 2.07 | % | $ | 6,648 | $ | 24 | 1.44 | % | $ | 4,675 | $ | 112 | 9.50 | % | |||||||||||
Loans(1)(2)(3) |
1,352,076 | 20,576 | 6.04 | % | 1,218,067 | 18,804 | 6.14 | % | 687,032 | 13,299 | 7.68 | % | |||||||||||||||||
Investment securities available for sale(3) |
224,225 | 1,747 | 3.09 | % | 166,803 | 2,040 | 4.87 | % | 102,643 | 1,218 | 4.71 | % | |||||||||||||||||
Federal funds sold |
93,802 | 51 | 0.22 | % | 14,903 | 36 | 0.96 | % | 21,839 | 250 | 4.54 | % | |||||||||||||||||
Total interest earning assets |
1,677,573 | 22,413 | 5.30 | % | 1,406,421 | 20,904 | 5.91 | % | 816,189 | 14,879 | 7.23 | % | |||||||||||||||||
Noninterest earning assets |
74,569 | 62,433 | 43,556 | ||||||||||||||||||||||||||
Less: allowance for credit losses |
19,974 | 17,559 | 7,503 | ||||||||||||||||||||||||||
Total noninterest earning assets |
54,595 | 44,874 | 36,053 | ||||||||||||||||||||||||||
TOTAL ASSETS |
$ | 1,732,168 | $ | 1,451,295 | $ | 852,242 | |||||||||||||||||||||||
LIABILITIES AND STOCKHOLDERS' EQUITY |
|||||||||||||||||||||||||||||
Interest bearing liabilities: |
|||||||||||||||||||||||||||||
Interest bearing transaction |
$ | 55,434 | $ | 44 | 0.31 | % | $ | 51,536 | $ | 53 | 0.41 | % | $ | 47,809 | $ | 92 | 0.76 | % | |||||||||||
Savings and money market |
527,300 | 1,845 | 1.39 | % | 282,534 | 1,232 | 1.73 | % | 196,283 | 1,490 | 3.01 | % | |||||||||||||||||
Time deposits |
524,860 | 2,975 | 2.25 | % | 605,022 | 5,128 | 3.37 | % | 274,035 | 3,341 | 4.84 | % | |||||||||||||||||
Total interest bearing deposits |
1,107,594 | 4,864 | 1.74 | % | 939,092 | 6,413 | 2.72 | % | 518,127 | 4,923 | 3.77 | % | |||||||||||||||||
Customer repurchase agreements and federal funds purchased |
82,106 | 184 | 0.89 | % | 99,071 | 388 | 1.56 | % | 55,698 | 511 | 3.64 | % | |||||||||||||||||
Other short-term borrowings |
23,696 | 184 | 3.08 | % | 16,717 | 124 | 2.95 | % | 21,752 | 302 | 5.51 | % | |||||||||||||||||
Long-term borrowings |
35,604 | 453 | 5.05 | % | 62,166 | 755 | 4.84 | % | 30,249 | 300 | 3.93 | % | |||||||||||||||||
Total interest bearing liabilities |
1,249,000 | 5,685 | 1.81 | % | 1,117,046 | 7,680 | 2.73 | % | 625,826 | 6,036 | 3.83 | % | |||||||||||||||||
Noninterest bearing liabilities: |
|||||||||||||||||||||||||||||
Noninterest bearing demand |
273,711 | 213,284 | 141,229 | ||||||||||||||||||||||||||
Other liabilities |
7,453 | 7,719 | 5,130 | ||||||||||||||||||||||||||
Total noninterest bearing liabilities |
281,164 | 221,003 | 146,359 | ||||||||||||||||||||||||||
Stockholders' equity |
202,004 | 113,245 | 80,057 | ||||||||||||||||||||||||||
TOTAL LIABILITIES AND STOCKHOLDERS' EQUITY |
$ | 1,732,168 | $ | 1,451,294 | $ | 852,242 | |||||||||||||||||||||||
Net interest income |
$ | 16,728 | $ | 13,224 | $ | 8,843 | |||||||||||||||||||||||
Net interest spread |
3.49 | % | 3.18 | % | 3.40 | % | |||||||||||||||||||||||
Net interest margin |
3.96 | % | 3.74 | % | 4.30 | % | |||||||||||||||||||||||
- (1)
- Includes
loans held for sale.
- (2)
- Loans
placed on nonaccrual status are included in average balances. Net loan fees and late charges included in interest income on loans totaled
$752 thousand, $514 thousand and $263 thousand for the three months ended December 31, 2009, 2008 and 2007, respectively.
- (3)
- Interest and fees on loans and investment securities available for sale exclude tax equivalent adjustments.
14
The rate/volume table below presents the composition of the change in net interest income for the periods indicated, as allocated between the change in net interest income due to changes in the volume of average earning assets and interest bearing liabilities, and the changes in net interest income due to changes in interest rates. As the table shows, the increase in net interest income in 2009 as compared to 2008 was a function of a significant increase in the volume of earning assets, partially offset by a decrease in the net interest margin on earning assets, due to the lower value of noninterest funding sources in 2009 as compared to 2008. For 2008 over 2007, the change is due to growth in the volume of earning assets offset by a decrease in the net interest margin on earning assets.
Rate/Volume Analysis of Net Interest Income
| |
2009 compared with 2008 | 2008 compared with 2007 | |||||||||||||||||||
|---|---|---|---|---|---|---|---|---|---|---|---|---|---|---|---|---|---|---|---|---|---|
| (dollars in thousands) |
Change Due to Volume |
Change Due to Rate |
Total Increase (Decrease) |
Change Due to Volume |
Change Due to Rate |
Total Increase (Decrease) |
|||||||||||||||
Interest earned on: |
|||||||||||||||||||||
Loans |
$ | 26,371 | $ | (9,268 | ) | $ | 17,103 | $ | 19,862 | $ | (11,892 | ) | $ | 7,970 | |||||||
Investment securities |
3,463 | (1,784 | ) | 1,679 | 1,286 | (4 | ) | 1,282 | |||||||||||||
Interest bearing bank deposits |
5 | (9 | ) | (4 | ) | (52 | ) | (143 | ) | (195 | ) | ||||||||||
Federal funds sold |
622 | (719 | ) | (97 | ) | (120 | ) | (357 | ) | (477 | ) | ||||||||||
Total interest income |
30,461 | (11,780 | ) | 18,681 | 20,976 | (12,396 | ) | 8,580 | |||||||||||||
Interest paid on: |
|||||||||||||||||||||
Interest bearing transaction |
25 | (170 | ) | (145 | ) | (20 | ) | 20 | — | ||||||||||||
Savings and money market |
3,308 | (1,376 | ) | 1,932 | 1,630 | (3,462 | ) | (1,832 | ) | ||||||||||||
Time deposits |
6,143 | (6,517 | ) | (374 | ) | 6,557 | (4,993 | ) | 1,564 | ||||||||||||
Customer repurchase agreements |
505 | (954 | ) | (449 | ) | 994 | (1,474 | ) | (480 | ) | |||||||||||
Other borrowings |
183 | (14 | ) | 169 | 1,457 | (762 | ) | 695 | |||||||||||||
Total interest expense |
10,164 | (9,031 | ) | 1,133 | 10,617 | (10,670 | ) | (53 | ) | ||||||||||||
Net interest income |
$ | 20,297 | $ | (2,749 | ) | $ | 17,548 | $ | 10,359 | $ | (1,726 | ) | $ | 8,633 | |||||||
Provision for Credit Losses
The provision for credit losses represents the amount of expense charged to current earnings to fund the allowance for credit losses. The amount of the allowance for credit losses is based on many factors which reflect management's assessment of the risk in the loan portfolio. Those factors include economic conditions and trends, the value and adequacy of collateral, volume and mix of the portfolio, performance of the portfolio, and internal loan processes of the Company and Bank.
Management has developed a comprehensive analytical process to monitor the adequacy of the allowance for credit losses. This process and guidelines were developed utilizing among other factors, the guidance from federal banking regulatory agencies. The results of this process, in combination with conclusions of the Bank's outside loan review consultant, support management's assessment as to the adequacy of the allowance at the balance sheet date. Please refer to the discussion under the caption "Critical Accounting Policies" for an overview of the methodology management employs on a quarterly basis to assess the adequacy of the allowance and the provisions charged to expense. Also, refer to the table in the section titled "Allowance for Credit Losses" at page 24, which reflects the comparative charge-offs and recoveries.
15
During the year of 2009, the allowance for credit losses increased $2.2 million reflecting $7.7 million in provision for credit losses and $5.5 million in net charge-offs during the period. The provision for credit losses of $7.7 million for 2009 compared to a provision for credit losses of $4.0 million for the same period in 2008. For 2009, net charge-offs amounted to $5.5 million as compared to $1.1 million for 2008. The higher provisioning in 2009 as compared to 2008 is attributable to higher net charge-offs in 2009, $134 million in loan growth, risk migration within the portfolio due to a weaker economy and to increased reserves for problem loans.
During the three months ended December 31, 2009, the allowance for credit losses increased $690 thousand reflecting $2.5 million in provision for credit losses and $1.8 million in net charge-offs during the period. The provision for credit losses was $2.5 million for the three months ended December 31, 2009 as compared to $1.4 million for the three months ended December 31, 2008. For the fourth quarter of 2009, net charge-offs amounted to $1.8 million as compared to $166 thousand of net charge-offs for the same period in 2008. The higher provision for the fourth quarter of 2009 is primarily attributable to loan growth in the fourth quarter of 2009, migration within the portfolio to higher risk assessments, and increases in specific reserves for problem loans.
As part of its comprehensive loan review process, the Bank's Board of Directors and Loan Committee or Company's Credit Review Committees carefully evaluate loans which are past-due 30 days or more. The Committees make a thorough assessment of the conditions and circumstances surrounding each delinquent loan. The Bank's loan policy requires that loans be placed on nonaccrual if they are ninety days past-due, unless they are well secured and in the process of collection. Additionally, Credit Administration specifically analyzes the status of development and construction projects, sales activities and utilization of interest reserves in order to carefully and prudently assesses potential increased levels of risk requiring additional reserves.
The maintenance of a high quality loan portfolio, with an adequate allowance for possible credit losses, will continue to be a primary management objective for the Company.
Noninterest Income
Total noninterest income includes service charges on deposits, gain on sale of loans, gain on sale of investments, income from bank owned life insurance ("BOLI") and other income.
Total noninterest income for the 2009 was $7.3 million compared to $4.4 million for 2008, an increase of 67%. The increase was attributed primarily to $1.5 million of income in 2009 from the gain on sale of investment securities. Other factors were higher service charges on deposit accounts of $839 thousand ($2.9 million in 2009 versus $2.1 million in 2008), and gains realized on the sale of residential and SBA loans of $628 thousand ($1.1 million in 2009 versus $426 thousand in 2008).
Total noninterest income for the fourth quarter of 2009 and 2008 was $1.3 million. Increases in gains realized on the sale of residential and SBA loans of $85 thousand and gain on sale of investment securities of $53 thousand were offset by decreases in service charges on deposit accounts of $51 thousand, due substantially to lower overdraft fees and decrease in other income of $72 thousand, primarily a result of lower loan prepayment fees.
For the year ended December 31, 2009, service charges on deposit accounts increased to $2.9 million from $2.1 million, an increase of 41% over 2008. The increase in service charges was primarily related to fee increases due in part to the impact of lower interest rates on customer earnings credits and to new relationships. For the three months ended December 31, 2009, service charges on deposit accounts decreased from $767 thousand to $716 thousand compared to the same period in 2008, a decrease of 7%. This decrease was due to a lower amount of overdraft fees.
Gain on sale of loans consists of SBA and residential mortgage loans. For the year ended December 31, 2009, gain on sale of loans increased from $426 thousand to $1.1 million compared to the
16
same period in 2008 or 147%. For the three months ended December 31, 2009, gain on sale of loans increased from $19 thousand to $104 thousand compared to the same period in 2008. The higher amount of gains is due substantially to lower interest rates in 2009 which provided more attractive borrower refinancing opportunities.
The Company is an originator of SBA loans and its current practice is to sell the insured portion of those loans at a premium. Income from this source was $372 thousand for the year ended December 31, 2009 compared to $212 thousand for the year ended December 31, 2008. For the three months ended December 31, 2009, gains on the sale of SBA loans amounted to $75 thousand as compared to no sales for the same period in 2008. Activity in SBA loan sales to secondary markets can vary widely from quarter to quarter. Beginning in 2010, the Company's earnings from the sale of the guaranteed portion of SBA loans originated may be negatively impacted by a new accounting standard, ASC Topic 860, "Transfers and Servicing," which will require that the recognition of profit on the sale of loans will be deferred until all re-purchase recourse provisions are met, which is typically a period of 90-120 days.
The Company originates residential mortgage loans on a pre-sold basis, servicing released. Sales of these mortgage loans yielded gains of $682 thousand for the year of 2009 compared to $214 thousand in the same period in 2008. For the three months ended December 31, 2009, gains on the sale of residential mortgage loans were $29 thousand as compared to $26 thousand for the same three months of 2008. The Company continues its efforts to originate and sell residential mortgages on a servicing released basis. Loans sold are subject to repurchase in circumstances where documentation is deficient or the underlying loan becomes delinquent within a specified period following sale and loan funding. The Bank considers these potential recourse provisions to be a minimal risk. The Bank does not originate so called "sub-prime" loans and has no exposure to this market segment. Higher refinancing activity resulting from a decline in residential mortgage rates in 2009 as compared to 2008 was the primary reason for the increase in income. In 2010, the Company's earnings from residential mortgage loan origination and sale will be negatively impacted by new accounting guidance, ASC Topic 860, "Transfers and Servicing," which will require that the recognition of profit on the sale of loans will be deferred until all re-purchase recourse provisions are met, which is a period of 90-120 days.
Other income totaled $1.3 million for the year ended 2009 as compared to $1.4 million for the same period in 2008, a decrease of 5%. The major components of income in this category consist of ATM fees, SBA service fees, noninterest loan fees and other noninterest fee income. ATM fees increased from $352 thousand for the year ended 2008 to $430 thousand for the year ended 2009, a 22% increase. SBA service fees increased from $163 thousand for the year ended 2008 to $184 thousand for the year ended 2009, a 13% increase. Noninterest loan fees decreased to $461 thousand for the year ended 2009 from $622 thousand for the same period in 2008, a 26% decrease, primarily due to lower levels of prepayment fees. Other noninterest fee income was $246 thousand for the year 2009 compared to $277 thousand for the same period in 2008. Other income totaled $340 thousand for the three months ended December 31, 2009 as compared to $412 thousand for the same period in 2008, a decrease of 17%.
Net investment gains amounted to $1.5 million and $1 thousand for the year and quarter ended December 31, 2009, respectively, as compared to net investment gains of $2 thousand and a loss of $52 thousand for the year and quarter ended December 31, 2008, respectively. The increase in gains for the year of 2009 was the result of asset/liability management decisions to reduce call risk in the portfolio of U.S. Agency securities, to reduce potential extension risk in longer term U.S. Agency mortgage backed securities, and to better position the investment portfolio for potentially higher interest rates over future years.
17
Noninterest Expense
Total noninterest expense consists of salaries and employee benefits, premises and equipment expenses, marketing and advertising, data processing, legal, accounting and professional fees, FDIC insurance and other expenses.
Total noninterest expenses were $42.8 million for 2009, as compared to $30.8 million for 2008, a 39% increase, which primarily reflects the larger organization subsequent to the Fidelity acquisition. For the three months ended December 31, 2009, total noninterest expenses were $10.6 million for the fourth quarter of 2009, as compared to $10.5 million for 2008, a 1% increase.
Salaries and employee benefits were $20.9 million for the year ended 2009, as compared to $16.7 million for 2008, a 25% increase. For the three months ended December 31, 2009, salaries and employee benefits amounted to $5.4 million versus $5.3 million for the same period in 2008, a 3% increase. These increases were due to staff additions and related personnel costs, primarily resulting from the Fidelity acquisition, merit increases, incentive based compensation and increased benefit costs. The higher salaries and employee benefits in 2009 as compared to 2008, were the result of have the additional staff for the full year compared to four months in 2008. At December 31, 2009 and 2008, the Company's staff numbered 235, as compared to 175 at December 31, 2007.
Premises and equipment expenses amounted to $7.3 million for the year ended December 31, 2009 as compared to $5.4 million for the same period in 2008. This increase of 35% was due primarily to new banking offices acquired in the Fidelity acquisition. Additionally, ongoing operating expense increases associated with the Company's facilities, all of which are leased, and increased equipment costs contributed to the overall increase in expense. For the year ended December 31, 2009, the Company recognized $366 thousand of sublease revenue as compared to $293 thousand for the same period in 2008. The sublease revenue is a direct offset of premises and equipment expenses. For the three months ended December 31, 2009, premises and equipment expenses amounted to $1.8 million versus $1.9 million for the same period in 2008. For the three months ended December 31, 2009, the Company recognized $97 thousand in sublease revenue compared to $75 thousand for the three months ended December 31, 2008.
Marketing and advertising costs remained the same at $1.1 million for the years ended December 31, 2009 and 2008. For the three months ended December 31, 2009, advertising expenses amounted to $313 thousand versus $656 thousand for the same period in 2008, a decrease of 52%. The primary reason for the decrease was the accrual of sponsorship costs for the 2009 EagleBank Bowl over full year, while the expenses for the inaugural event were expensed primarily in the fourth quarter of 2008.
Data processing costs were $2.4 million for 2009, as compared to $1.6 million in 2008, an increase of 45%. For the three months ended December 31, 2009, data processing costs amounted to $576 thousand compared to $470 thousand for the same period in 2008, an increase of 23%. Increases for the year and quarter were due to the addition of new banking offices and an increase in the volume of data processing activity following the Fidelity acquisition and organic account growth.
Legal, accounting and professional fees were $2.7 million for the year ended 2009, as compared to $1.1 million for 2008, a 159% increase. This increase was primarily due to collection costs related to higher levels of problem assets and professional fees for consulting services. For the three months ended December 31, 2009, legal, accounting and professional fees amounted to $690 thousand compared to $398 thousand for the same period in 2008, a 73% increase. The same factors responsible for the year over year increase were responsible for the increase in the fourth quarter.
FDIC insurance premiums were $2.7 million for the year ended 2009, as compared to $642 thousand in 2008, an increase of 328%. The primary reasons for the increase were an increase in the base FDIC premium rates charged on deposits, a special FDIC assessment of approximately $723 thousand recorded in the second quarter of 2009, and higher deposit balances, resulting both from the Fidelity acquisition and organic growth. For the three months ended December 31, 2009, FDIC insurance premiums amounted to $278 thousand as compared to $243 thousand for the same period in 2008, a 14% increase. This increase was due to an increase in the base FDIC premium rates charged on deposits and to higher deposit balances.
18
Other expenses increased to $5.6 million in the year ended 2009 from $4.3 million for the year ended December 31, 2008, or an increase of 31%. For the three months ended December 31, 2009, other expenses amounted to $1.5 million compared to $1.6 million for the same period in 2008, a decrease of 6%. The major components of cost in this category include insurance expenses, broker fees, record management and storage costs, communication expenses, director fees, OREO expenses, other losses and stockholder and NASDAQ related expenses. For the year ended December 31, 2009, as compared to the same period in 2008, the significant increases in this category were primarily OREO expenses, director fees, other losses and amortization of the core deposit intangible recorded in the acquisition of Fidelity.
Income Tax Expense
The Company recorded income tax expense of $6.0 million in 2009 compared to $4.1 million in 2008 and $4.3 million in 2007, resulting in an effective tax rate of 36.4%, 35.7% and 35.7%, respectively. The higher effective tax rate for 2009 relates to a higher marginal tax rate on increases in income.
BALANCE SHEET ANALYSIS
Overview
At December 31, 2009, the Company's total assets were $1.8 billion, loans were $1.4 billion, deposits were $1.5 billion, other borrowings, including customer repurchase agreements, were $150.1 million and stockholders' equity was $188.3 million. As compared to December 31, 2008, assets grew in 2009 by $308.7 million (21%), loans by $133.7 million (11%), deposits by $330.9 million (29%), borrowings decreased by $65.9 million (30%) and stockholders' equity increased by $46.0 million (32%).
A substantial portion of the growth in deposits during 2009 is due to a successful money market campaign, commenced in the second quarter of 2009 which resulted in stronger deposit growth than loan growth in the second half of the year, and a resulting higher liquidity position in federal funds sold.
On September 21, 2009, the Company completed an underwritten public offering of 6,731,640 shares its common stock, at $8.20 per share, including 878,040 shares subject to the underwriter's over-allotment option. As a result of the capital raise, the number of shares of common stock subject to the warrants issued to the Treasury in December 2008 was reduced by 50% to 385,434.
Investment Securities Available for Sale ("AFS") and Short-Term Investments
The tables below and Note 3 to the Consolidated Financial Statements provide additional information regarding the Company's investment securities categorized as "available for sale" ("AFS"). The Company classifies all its investment securities as AFS. This classification requires that investment securities be recorded at their fair value with any difference between the fair value and amortized cost (the purchase price adjusted by any discount accretion or premium amortization) reported as a component of stockholders' equity (accumulated other comprehensive income), net of deferred income taxes. At December 31, 2009, the Company had a net unrealized gain in AFS securities of $3.9 million as compared to a net unrealized gain in AFS securities of $3.9 million at December 31, 2008. The deferred income tax liability/benefit at December 31, 2009 and 2008 of these unrealized gains and losses was $1.6 million and $1.6 million, respectively.
The AFS portfolio is comprised of U.S. Government agency securities (32% of AFS securities) with an average duration of 2.2 years, seasoned mortgage backed securities that are 100% agency issued (53% of AFS securities) which have an average expected lives of 2.7 years with contractual maturities of the underlying mortgages of up to thirty years, municipal bonds ($33.3 million or 14% of AFS securities) and equity investments which comprise less than 1% of AFS securities. The equity investment includes common stock of three community banking companies which have an estimated fair value of $359 thousand and two tax lien certificates which have an estimated fair value of $40 thousand. Ninety nine
19
percent (99%) of the investment securities which are debt instruments are rated AAA or AA. The remaining one percent (1%) of the investment securities which are debt instruments is municipal bonds which have a rating of A. All ratings represent high investment grade issues.
At December 31, 2009, the investment portfolio amounted to $235.2 million as compared to a balance of $159.5 million at December 31, 2008, an increase of 47%. The growth in the portfolio was due in large part to investing a significant portion of the deposit growth in excess of loan growth that occurred in the twelve months ended December 31, 2009. The investment portfolio is managed to achieve goals related to income, liquidity, interest rate risk management and to provide collateral for customer repurchase agreements and other borrowing relationships.
The following table provides information regarding the composition of the Company's investment securities portfolio at the dates indicated. Amounts are reported at estimated fair value. The change in composition of the portfolio at December 31, 2009 as compared to 2008 was due principally to Asset Liability Committee decisions to increase the mix of municipal bonds, which was believed to represent good value and safety, and to increase holdings of structured mortgaged backed securities issued by U.S. Government agencies or government sponsored enterprises which are believed to well position the company in an increasing interest rate environment, which is anticipated over the next few years.
| |
December 31, | ||||||||||||||||||
|---|---|---|---|---|---|---|---|---|---|---|---|---|---|---|---|---|---|---|---|
| |
2009 | 2008 | 2007 | ||||||||||||||||
| (dollars in thousands) |
Balance | Percent of Total |
Balance | Percent of Total |
Balance | Percent of Total |
|||||||||||||
U. S. Government agency securities |
$ | 76,107 | 32.4 | % | $ | 74,029 | 46.4 | % | $ | 51,295 | 62.4 | % | |||||||
Mortgage backed securities |
125,396 | 53.3 | % | 79,770 | 50.0 | % | 29,303 | 35.6 | % | ||||||||||
Municipal bonds |
33,325 | 14.2 | % | 4,708 | 3.0 | % | 351 | 0.4 | % | ||||||||||
Other equity investments |
399 | 0.1 | % | 973 | 0.6 | % | 1,298 | 1.6 | % | ||||||||||
|
$ | 235,227 | 100 | % | $ | 159,480 | 100 | % | $ | 82,247 | 100 | % | |||||||
The increase in the investment portfolio in 2008, and the increased percentage of the portfolio consisting of mortgage backed securities, was due primarily to the acquisition of Fidelity.
The following table provides information, on an amortized cost basis, regarding the contractual maturity and weighted average yield of the investment portfolio at December 31, 2009. Expected maturities will differ from contractual maturities because borrowers may have the right to call or prepay obligations with or without call or prepayment penalties. Yields on tax exempt securities have not been calculated on a tax equivalent basis.
At December 31, 2009, there were no issuers, other than the U.S. Government and its agencies, whose securities owned by the Company had a book or fair value exceeding 10% of the Company's stockholders' equity.
| |
One Year or Less | After One Year Through Five Years |
After Five Years Through Ten Years |
After Ten Years | Total | ||||||||||||||||||||||||||
|---|---|---|---|---|---|---|---|---|---|---|---|---|---|---|---|---|---|---|---|---|---|---|---|---|---|---|---|---|---|---|---|
| (dollars in thousands) |
Amortized Cost |
Weighted Average Yield |
Amortized Cost |
Weighted Average Yield |
Amortized Cost |
Weighted Average Yield |
Amortized Cost |
Weighted Average Yield |
Amortized Cost |
Weighted Average Yield |
|||||||||||||||||||||
U. S. Government agency securities |
$ | 8,095 | 4.49 | % | $ | 67,885 | 2.50 | % | $ | — | — | $ | — | — | $ | 75,980 | 3.04 | % | |||||||||||||
Mortgage backed securities |
3,069 | 4.19 | % | 2,910 | 4.17 | % | 19,934 | 4.94 | % | 96,163 | 5.10 | % | 122,076 | 5.03 | % | ||||||||||||||||
Muncipal bonds |
— | — | — | — | 3,023 | 4.47 | % | 29,822 | 4.12 | % | 32,845 | 4.15 | % | ||||||||||||||||||
Other equity investments |
— | — | — | — | — | — | — | — | 436 | 4.79 | % | ||||||||||||||||||||
|
$ | 11,164 | 4.41 | % | $ | 70,795 | 2.57 | % | $ | 22,957 | 4.88 | % | $ | 125,985 | 4.87 | % | $ | 231,337 | 4.25 | % | |||||||||||
20
The Company also has a portfolio of short-term investments utilized for asset liability management needs which consists from time-to-time of discount notes, money market investments, and other bank certificates of deposit This portfolio amounted to $7.5 million at December 31, 2009 as compared to $2.5 million at December 31, 2008.
Federal funds sold amounted to $88.2 million at December 31, 2009 as compared to $191 thousand at December 31, 2008. These funds represent excess daily liquidity which is invested on an unsecured basis with well capitalized banks, in amounts generally limited both in the aggregate and to any one bank.
Loan Portfolio
In its lending activities, the Company seeks to develop sound relationships with clients whose businesses and individual banking needs will grow with the Bank. There has been a significant effort to grow the loan portfolio and to be responsive to the lending needs in the markets served, while maintaining sound asset quality.
Loan growth over the past year has been favorable, with loans outstanding reaching $1.4 billion at December 31, 2009, an increase of $133.7 million or 11% as compared to $1.3 billion at December 31, 2008, and were $716.7 million at December 31, 2007, an increase of $549.0 million or 77% in 2008 over 2007.
The Company had loan growth of $134 million during 2009, with $82 million being recorded in the fourth quarter of 2009. Approximately 62% of the Company's loan growth was recorded in the fourth quarter of 2009. The loan growth was predominantly in the commercial real estate segment. As conduits and Commercial Mortgage-Backed Securities ("CMBS") credit sources dried up in late 2008 and through 2009, capital for real estate transactions became scarce. Many banks retracted their lending appetites as well, further contracting the supply of credit. The Company was able to capitalize on the demand/supply imbalance for credit with new loan fundings. Construction loans declined as projects came to completion and were paid off by permanent financing or sale. Demand for new construction loans declined sharply decreasing loan growth in that category during the year. Commercial and industrial loan growth was flat through the first half of the year, but picked up strongly during the second half of 2009. Consumer loan balances, a relatively minor focus of the Company's lending efforts, were essentially unchanged as consumers retrenched in the recessionary environment.
The Bank is primarily commercial oriented and as can be seen in the chart below, has a large proportion of its loan portfolio related to real estate with 69% consisting of commercial real estate, residential mortgage real estate and commercial construction and residential loans. Real estate also serves as collateral for loans made for other purposes, resulting in 75% of loans being secured by real estate.
21
The following table shows the trends in the composition of the loan portfolio over the past five years.
| |
Year Ended December 31, | |||||||||||||||||||||||||||||||
|---|---|---|---|---|---|---|---|---|---|---|---|---|---|---|---|---|---|---|---|---|---|---|---|---|---|---|---|---|---|---|---|---|
| |
2009 | 2008 | 2007 | 2006 | 2005 | |||||||||||||||||||||||||||
| (dollars in thousands) |
Amount | % | Amount | % | Amount | % | Amount | % | Amount | % | ||||||||||||||||||||||
Commercial |
$ | 346,692 | 25 | % | $ | 334,999 | 27 | % | $ | 149,332 | 21 | % | $ | 132,981 | 21 | % | $ | 118,928 | 22 | % | ||||||||||||
Owner occupied—commercial |
196,433 | 14 | % | 184,059 | 15 | % | 127,079 | 18 | % | 95,782 | 15 | % | 79,697 | 15 | % | |||||||||||||||||
Investment—commercial real estate |
499,501 | 36 | % | 365,010 | 28 | % | 265,678 | 37 | % | 253,262 | 41 | % | 204,970 | 37 | % | |||||||||||||||||
Real estate mortgage—residential |
9,236 | 1 | % | 9,757 | 1 | % | 2,160 | — | 1,523 | — | 1,130 | — | ||||||||||||||||||||
Construction—commercial and residential(1) |
252,695 | 18 | % | 283,020 | 22 | % | 110,115 | 15 | % | 86,524 | 14 | % | 90,035 | 16 | % | |||||||||||||||||
Home equity |
87,283 | 6 | % | 80,295 | 6 | % | 57,515 | 8 | % | 50,572 | 8 | % | 50,776 | 9 | % | |||||||||||||||||
Other consumer |
7,471 | — | 8,500 | 1 | % | 4,798 | 1 | % | 5,129 | 1 | % | 3,676 | 1 | % | ||||||||||||||||||
Total loans |
1,399,311 | 100 | % | 1,265,640 | 100 | % | 716,677 | 100 | % | 625,773 | 100 | % | 549,212 | 100 | % | |||||||||||||||||
Less: Allowance for credit losses |
(20,619 | ) | (18,403 | ) | (8,037 | ) | (7,373 | ) | (5,985 | ) | ||||||||||||||||||||||
Net loans |
$ | 1,378,692 | $ | 1,247,237 | $ | 708,640 | $ | 618,400 | $ | 543,227 | ||||||||||||||||||||||
- (1)
- Includes loans for land acquisition and development.
As discussed under the captions "Business" and "Risk Factors," the Company has directly made higher risk loans that entail additional risks as compared to loans made following normal underwriting practices. These higher risk loan transactions, representing financing subordinated to loans made by the Bank, and occasionally referred to in this report as "subordinated financings" are currently made through the Company's subsidiary, ECV. This activity is limited as to individual transaction amount and total exposure amounts based on capital levels and is carefully monitored. Transactions are structured to provide ECV with returns commensurate to the risk through the requirement of additional interest following payoff of all loans, which additional interest is recorded as a component of non-interest income:
- •
- For the years ended December 31, 2009 and 2008, the Company recorded no noninterest income and for 2007 recorded
$1.3 million of noninterest income from one subordinated financing transaction.
- •
- At December 31, 2009, ECV has a $1.6 million higher risk loan transaction relating to a real estate project which is currently in a construction/sales phase. The loan is expected to be outstanding throughout mid 2011, with marketing and sales continuing until that time. Due to delays in scheduled sales activity, the borrower has posted additional interest reserves to keep the loan current through January 2011.
Although the Company carefully underwrites each higher risk loan transaction and expects these transactions to provide additional revenues, there can be no assurance that any higher risk loan transaction, or the related loans made by the Bank, will prove profitable for the Company and Bank, that the Company will be able to receive any additional interest payments in respect of these loans, that any additional interest payments will be significant, or that the Company and Bank will not incur losses in respect of these transactions.
As noted above, a significant portion of the loan portfolio consists of commercial, construction and commercial real estate loans, primarily made in the Washington, D.C. metropolitan area and secured by real estate or other collateral in that market. Although these loans are made to a diversified pool of
22
unrelated borrowers across numerous businesses, adverse developments in the Washington D.C. metropolitan real estate market could have an adverse impact on this portfolio of loans and the Company's income and financial position. While our basic market area is the Washington, D.C. metropolitan area, in which 97% of our commercial real estate exposure exists, the Bank has made loans outside that market area where the nature and quality of such loans was consistent with the Bank's lending policies. At present, the Company believes that commercial real estate values are stable in the specific sub-markets of the Washington, D.C. metropolitan market in which the Company has its most significant real estate exposure.
The federal banking regulators have issued guidance for those institutions which are deemed to have concentrations in commercial real estate lending. Pursuant to the supervisory criteria contained in the guidance for identifying institutions with a potential commercial real estate concentration risk, institutions which have (1) total reported loans for construction, land development, and other land which represent in total 100% or more of an institutions total risk-based capital; or (2) total commercial real estate loans representing 300% or more of the institutions total risk-based capital and the institution's commercial real estate loan portfolio has increased 50% or more during the prior 36 months are identified as having potential commercial real estate concentration risk. Institutions which are deemed to have concentrations in commercial real estate lending are expected to employ heightened levels of risk management with respect to their commercial real estate portfolios, and may be required to hold higher levels of capital. The Company, like many community banks, has a concentration in commercial real estate loans. Management has extensive experience in commercial real estate lending, and has implemented and continues to maintain heightened portfolio monitoring and reporting, and strong underwriting criteria with respect to its commercial real estate portfolio. The Company is well capitalized. Nevertheless, the Company could be required to maintain higher levels of capital as a result of our commercial real estate concentration, which could require us to obtain additional capital, and may adversely affect shareholder returns.
At December 31, 2009, the Company had no other concentrations of loans in any one industry exceeding 10% of its total loan portfolio. An industry for this purpose is defined as a group of businesses that are engaged in similar activities and have similar economic characteristics that would cause their ability to meet contractual obligations to be similarly affected by changes in economic or other conditions.
Loan Maturity
The following table sets forth the time to contractual maturity of the loan portfolio as of December 31, 2009.
| |
Due In | |||||||||||||||
|---|---|---|---|---|---|---|---|---|---|---|---|---|---|---|---|---|
| (dollars in thousands) |
Total | One Year or Less |
Over One to Five Years |
Over Five to Ten Years |
Over Ten Years |
|||||||||||
Commercial |
$ | 346,692 | $ | 131,609 | $ | 157,383 | $ | 34,205 | $ | 23,495 | ||||||
Owner occupied—commercial |
196,433 | 12,281 | 50,944 | 116,890 | 16,318 | |||||||||||
Investment—commercial real estate |
499,501 | 65,868 | 245,005 | 179,122 | 9,506 | |||||||||||
Real estate mortgage—residential |
9,236 | 65 | 397 | 1,137 | 7,637 | |||||||||||
Construction—commercial and residential |
252,695 | 147,811 | 85,691 | 16,195 | 2,998 | |||||||||||
Home equity |
87,283 | 618 | 3,748 | 10,747 | 72,170 | |||||||||||
Other consumer |
7,471 | 3,773 | 2,279 | 110 | 1,309 | |||||||||||
Total loans |
$ | 1,399,311 | $ | 362,025 | $ | 545,447 | $ | 358,406 | $ | 133,433 | ||||||
Loans with: |
||||||||||||||||
Predetermined fixed interest rate |
$ | 470,209 | $ | 57,228 | $ | 321,963 | $ | 71,889 | $ | 19,129 | ||||||
Floating interest rate |
929,102 | 304,798 | 223,487 | 286,514 | 114,303 | |||||||||||
Total loans |
$ | 1,399,311 | $ | 362,026 | $ | 545,450 | $ | 358,403 | $ | 133,432 | ||||||
23
Loans are shown in the period based on final contractual maturity. Demand loans, having no contractual maturity and overdrafts, are reported as due in one year or less.
Allowance for Credit Losses
The provision for credit losses represents the amount of expense charged to current earnings to fund the allowance for credit losses. The amount of the allowance for credit losses is based on many factors which reflect management's assessment of the risk in the loan portfolio. Those factors include economic conditions and trends, the value and adequacy of collateral, volume and mix of the portfolio, performance of the portfolio, and internal loan processes of the Company and Bank.
Management has developed a comprehensive analytical process to monitor the adequacy of the allowance for credit losses. This process and guidelines were developed utilizing, among other factors, the guidance from federal banking regulatory agencies. The results of this process, in combination with conclusions of the Bank's outside loan review consultant, support management's assessment as to the adequacy of the allowance at the balance sheet date. During 2009, a provision for credit losses was made in the amount of $7.7 million and net charge-offs amounted to $5.5 million. A full discussion of the accounting for allowance for credit losses is contained in Note 1 to the Consolidated Financial Statements and activity in the allowance for credit losses is contained in Note 4 to the Consolidated Financial Statements. Also, please refer to the discussion under the caption, "Critical Accounting Policies" within Management's Discussion and Analysis of Financial Condition and Results of Operation for further discussion of the methodology which management employs to maintain an adequate allowance for credit losses, as well as the discussion under the caption "Provision for Credit Losses."
The allowance for credit losses represented 1.47% of total loans at December 31, 2009 as compared to 1.45% at December 31, 2008. This increase in the ratio of the allowance for credit losses was due substantially to increased reserves for problem loans. At December 31, 2009, the allowance represented 94% of nonperforming loans as compared to 72% at December 31, 2008. The increase in the coverage ratio was due substantially to loan growth during 2009 as new credits exhibit lower levels of potential credit risk.
As part of its comprehensive loan review process, the Bank's Board of Directors, Director's Loan Committee and Credit Review Committee. Carefully evaluate loans which are past-due 30 days or more. The Committees make a thorough assessment of the conditions and circumstances surrounding each delinquent loan. The Bank's loan policy requires that loans be placed on nonaccrual if they are ninety days past-due, unless they are well secured and in the process of collection. Additionally, Credit Administration specifically analyzes the status of development and construction projects, sales activities and utilization of interest reserves in order to carefully and prudently assesses potential increased levels of risk which may require additional reserves.
At December 31, 2009, the Company had $22.0 million of loans classified as nonperforming, and $20.9 million of potential problem loans, as compared to $25.5 million of nonperforming loans and $3.6 million of potential problem loans at December 31, 2008. Please refer to Note 1 to the Consolidated Financial Statements under the caption "Loans" for a discussion of the Company's policy regarding impairment of loans. Please refer to "Nonperforming Assets" at page 26 for a discussion of problem and potential problem assets.
As the loan portfolio and allowance for credit losses review process continues to evolve, there may be changes to elements of the allowance and this may have an effect on the overall level of the allowance maintained. Historically, the Bank has enjoyed a high quality loan portfolio with relatively low levels of net charge-offs and low delinquency rates. In 2009, the Company witnessed an increased level of net charge-offs due to a weaker economy, but believes its level of net charge-offs and problem assets were below those of its peer banking companies. The maintenance of a high quality portfolio will continue to be a high priority for both management and the Board of Directors.
24
Management, being aware of the significant loan growth experienced by the Company, is intent on maintaining a strong credit review function and risk rating process. The Company has an experienced Credit Administration function, which provides independent analysis of credit requests and the management of problem credits. The area was further enhanced as part of the Fidelity acquisition. The Credit Department has developed and implemented analytical procedures for evaluating credit requests, has refined the Company's risk rating system, and has adopted enhanced monitoring of the loan portfolio (in particular the construction loan portfolio) and the adequacy of the allowance for credit losses. The loan portfolio analysis process is ongoing and proactive in order to maintain a portfolio of quality credits and to quickly identify any weaknesses before they become more severe.
The following table sets forth activity in the allowance for credit losses for the past five years.
| |
Year Ended December 31, | ||||||||||||||||
|---|---|---|---|---|---|---|---|---|---|---|---|---|---|---|---|---|---|
| (dollars in thousands) |
2009 | 2008 | 2007 | 2006 | 2005 | ||||||||||||
Balance at beginning of year |
$ | 18,403 | $ | 8,037 | $ | 7,373 | $ | 5,985 | $ | 4,240 | |||||||
Charge-offs: |
|||||||||||||||||
Commercial(1) |
3,944 | 481 | 1,005 | 369 | 122 | ||||||||||||
Real estate—commercial(2) |
488 | 29 | — | — | — | ||||||||||||
Real estate mortgage—residential |
553 | — | — | — | — | ||||||||||||
Construction—commercial and residential(2) |
177 | 497 | — | — | — | ||||||||||||
Home equity |
427 | 124 | — | 15 | — | ||||||||||||
Other consumer |
191 | 86 | 26 | 5 | 17 | ||||||||||||
Total charge-offs |
5,780 | 1,217 | 1,031 | 389 | 139 | ||||||||||||
Recoveries: |
|||||||||||||||||
Commercial(1) |
274 | 44 | 37 | 27 | 41 | ||||||||||||
Real estate—commercial(2) |
— | — | — | — | — | ||||||||||||
Real estate mortgage—residential |
2 | — | — | — | — | ||||||||||||
Construction—commercial and residential(2) |
2 | 50 | — | — | — | ||||||||||||
Home equity |
— | — | — | — | — | ||||||||||||
Other consumer |
49 | — | 15 | 5 | — | ||||||||||||
Total recoveries |
327 | 94 | 52 | 32 | 41 | ||||||||||||
Net charge-offs |
5,453 | 1,123 | 979 | 357 | 98 | ||||||||||||
Additions charged to operations |
7,669 | 3,979 | 1,643 | 1,745 | 1,843 | ||||||||||||
Acquired allowance—Fidelity |
— | 7,510 | — | — | — | ||||||||||||
Balance at end of year |
$ | 20,619 | $ | 18,403 | $ | 8,037 | $ | 7,373 | $ | 5,985 | |||||||
Ratio of allowance for credit losses to total loans outstanding at year end |
1.47 | % | 1.45 | % | 1.12 | % | 1.18 | % | 1.09 | % | |||||||
Ratio of net charge-offs during the year to average loans outstanding during the year |
0.42 | % | 0.12 | % | 0.15 | % | 0.06 | % | 0.02 | % | |||||||
- (1)
- Includes
SBA loans.
- (2)
- Includes loans for land acquisition and development.
The following table presents the allocation of the allowance for credit losses by loan category and the percent of loans each category bears to total loans. The allocation of the allowance at December 31, 2009 includes specific reserves of $2.7 million against impaired loans of $22.0 million as compared to specific reserves of $1.5 million against impaired loans of $25.5 million at December 31, 2008. The allocation of the allowance to each category is not necessarily indicative of future losses or charge-offs and does not restrict
25
the usage of the allowance for any specific loan or category. The larger allowance at December 31, 2008, as compared to December 31, 2007, reflects in large part the $7.5 million allowance acquired in the Fidelity acquisition.
| |
Year Ended December 31, | |||||||||||||||||||||||||||||||
|---|---|---|---|---|---|---|---|---|---|---|---|---|---|---|---|---|---|---|---|---|---|---|---|---|---|---|---|---|---|---|---|---|
| |
2009 | 2008 | 2007 | 2006 | 2005 | |||||||||||||||||||||||||||
| (dollars in thousands) |
Amount | %(1) | Amount | %(1) | Amount | %(1) | Amount | %(1) | Amount | %(1) | ||||||||||||||||||||||
Commercial |
$ | 9,871 | 25 | % | $ | 8,923 | 27 | % | $ | 3,300 | 21 | % | $ | 3,379 | 21 | % | $ | 2,594 | 22 | % | ||||||||||||
Real estate—commercial(2) |
6,495 | 50 | % | 4,849 | 43 | % | 3,053 | 55 | % | 2,800 | 56 | % | 2,395 | 52 | % | |||||||||||||||||
Real estate mortgage—residential |
28 | 1 | % | 58 | 1 | % | 21 | — | 40 | — | 48 | — | ||||||||||||||||||||
Construction—commercial and residential(2) |
3,680 | 18 | % | 3,972 | 22 | % | 1,314 | 15 | % | 854 | 14 | % | 602 | 16 | % | |||||||||||||||||
Home equity |
382 | 6 | % | 394 | 6 | % | 233 | 8 | % | 176 | 8 | % | 176 | 9 | % | |||||||||||||||||
Other consumer |
163 | — | 207 | 1 | % | 116 | 1 | % | 124 | 1 | % | 84 | 1 | % | ||||||||||||||||||
Unallocated |
— | — | — | — | — | — | — | — | 86 | — | ||||||||||||||||||||||
Total loans |
$ | 20,619 | 100 | % | $ | 18,403 | 100 | % | $ | 8,037 | 100 | % | $ | 7,373 | 100 | % | $ | 5,985 | 100 | % | ||||||||||||
- (1)
- Represents
the percent of loans in each category to total loans.
- (2)
- Includes loans for land acquisition and development.
Nonperforming Assets
As shown in the table below, the Company's level of nonperforming assets (NPAs), which are comprised of loans delinquent 90 days or more, nonaccrual loans, restructured loans and other real estate owned, totaled $27.1 million, at December 31, 2009, representing 1.50% of total assets. While the total amount of NPAs at December 31, 2009 was slightly higher than at December 31, 2008, the ratio of NPAs to total assets and non-performing loans to total loans were both lower at December 31, 2009 as compared to December 31, 2008. The Company has been highly proactive in addressing existing and potential problem loans resulting from a weaker economy, which has resulted in an improved level of NPAs as a percentage of total assets at December 31, 2009 as compared to December 31, 2008. Management remains attentive to early signs of deterioration in borrowers' financial conditions and to taking the appropriate action to mitigate risk. Furthermore, the Company is diligent in placing loans on nonaccrual status and believes, based on its loan portfolio risk analysis, that its allowance for loan losses at 1.47% of total loans at December 31, 2009 is adequate to absorb potential credit losses in the loan portfolio at that date.
Included in nonperforming assets at December 31, 2009 is Other Real Estate Owned ("OREO") of $5.1 million, consisting of twelve foreclosed properties. The Company had four OREO properties with a net carrying value of $909 thousand at December 31, 2008. OREO properties are carried at the lower of cost or appraised value less costs to sell. It is the Company's policy to obtain current third party appraisals prior to foreclosure, and to obtain updated third party appraisals on OREO properties not less than annually. Generally, the Company would obtain updated appraisals or evaluations where it has reason to believe, based upon market indications (such as comparable sales, legitimate offers below carrying value, broker indications and similar factors), that the current appraisal does not accurately reflect current value. During the year of 2009, the Company sold six foreclosed properties with a net carrying value of $1.6 million, realizing a net gain of $164 thousand.
Included in NPAs are loans that we consider impaired. Impaired loans are defined as those which we believe it is probable that we will not collect all amounts due according to the contractual terms of the loan agreement, as well as those loans whose terms have been modified in a troubled debt restructuring ("TDR"). Valuation allowances for those loans determined to be impaired are evaluated in accordance
26
with ASC Topic 310—Receivables, and updated quarterly. For collateral dependent impaired loans, the carrying amount of the loan is determined by current appraised value less costs to sell the underlying collateral, which may be adjusted downward under certain circumstances for actual events and/or changes in market conditions. For example, current average actual selling prices less average actual closing costs on an impaired multi unit real estate project may indicate the need for an adjustment in the appraised valuation of the project, which in turn could increase the associated ASC Topic 310 specific reserve for the loan. Generally, all appraisals associated with impaired loans are updated on a not less than annual basis.
Loans are considered to have been modified in a TDR when due to a borrower's financial difficulties, the Company makes concessions to the borrower that it would not otherwise consider. Concessions could include interest rate reductions, principal or interest forgiveness, forbearance, and other actions intended to minimize economic loss and to avoid foreclosure or repossession of collateral. Alternatively, Management, from time-to-time and in the ordinary course of business, implements renewals, modifications, extensions, and/or changes in terms of loans to borrowers who have the ability to repay on reasonable market-based terms, as circumstances may warrant. Such modifications are not considered to be TDR's as the accommodation of a borrower's request does not rise to the level of a concession and/or the borrower is not experiencing financial difficulty. For example, (1) adverse weather conditions may create a short term cash flow issue for an otherwise profitable retail business which suggests a temporary interest only period on an amortizing loan; (2) there may be delays in absorption on a real estate project which reasonably suggests extension of the loan maturity at market terms; or (3) there may be maturing loans to borrowers with demonstrated repayment ability who are not in a position at the time of maturity to obtain alternate long-term financing. The most common change in terms provided by the Company is an extension of interest only term. The determination of whether a restructured loan is a TDR requires consideration of all of the facts and circumstances surrounding the change in terms, and the exercise of prudent business judgment. The Company had no TDRs at either December 31, 2009 or 2008 and had made no modifications to loans resulting in principal or interest forgiveness or below market terms during the years ended December 31, 2009 and 2008. Impaired loans consisted of $22.0 million of nonaccrual loans at December 31, 2009, with $2.7 million of specific reserves, compared to $25.5 million of impaired loans at December 31, 2008 with $1.5 million of specific reserves.
Total nonperforming loans amounted to $22.0 million at December 31, 2009 (1.57% of total loans), compared to $25.5 million at December 31, 2008 (2.01% of total loans). The decline in the ratio is due to both a decrease in nonperforming loans of $3.4 million year over year and to a larger loan portfolio at December 31, 2009.
27
The following table shows the amounts and relevant ratios of nonperforming assets at December 31 for the past five years:
| (dollars in thousands) |
2009 | 2008 | 2007 | 2006 | 2005 | |||||||||||||
|---|---|---|---|---|---|---|---|---|---|---|---|---|---|---|---|---|---|---|
Nonaccrual Loans: |
||||||||||||||||||
Commercial |
$ | 4,364 | $ | 3,506 | $ | 1,174 | $ | 1,976 | $ | 362 | ||||||||
Real estate—commercial |
2,426 | 4,167 | 641 | — | — | |||||||||||||
Construction—commercial and residential |
15,192 | 17,588 | 3,386 | — | — | |||||||||||||
Home equity |
42 | 196 | 123 | — | — | |||||||||||||
Other consumer |
— | — | — | — | 129 | |||||||||||||
Accrual loans—past due 90 days: |
||||||||||||||||||
Commercial |
— | — | — | 37 | — | |||||||||||||
Real estate—commercial |
— | — | — | — | — | |||||||||||||
Other consumer |
— | — | — | — | — | |||||||||||||
Restructured loans |
— | — | — | — | — | |||||||||||||
Total nonperforming loans(1) |
22,024 | 25,457 | 5,324 | 2,013 | 491 | |||||||||||||
Other real estate owned |
5,106 | 909 | — | — | — | |||||||||||||
Total nonperforming assets |
$ | 27,130 | $ | 26,366 | $ | 5,324 | $ | 2,013 | $ | 491 | ||||||||
Coverage ratio, allowance for credit losses to total nonperforming loans |
93.62 | % | 72.29 | % | 150.96 | % | 366.27 | % | 1218.94 | % | ||||||||
Ratio of nonperforming loans to total loans |
1.57 | % | 2.01 | % | 0.74 | % | 0.32 | % | 0.09 | % | ||||||||
Ratio of nonperforming assets to total assets |
1.50 | % | 1.76 | % | 0.63 | % | 0.26 | % | 0.07 | % | ||||||||
- (1)
- Gross interest income that would have been recorded in 2009 if nonaccrual loans and leases shown above had been current and in accordance with their original terms was $1.4 million, while interest actually recorded on such loans was $1.4 million, while interest actually recorded on such loans was $546 thousand. See Note 1 to the Consolidated Financial Statements for a description of the Company's policy for placing loans on nonaccrual status.
Significant variation in the amount of nonperforming loans may occur from period to period because the amount of nonperforming loans depends largely on the condition of a relatively small number of individual credits and borrowers relative to the total loan portfolio.
At December 31, 2009, there were $20.9 million of performing loans considered potential problem loans, defined as loans which are not included in the 90 day past due, nonaccrual or restructured categories, but for which known information about possible credit problems causes management to be uncertain as to the ability of the borrowers to comply with the present loan repayment terms which may in the future result in disclosure in the past due, nonaccrual or restructured loan categories. Approximately 6.2% of $21.2 million in loans reported as potential problem loans at September 30, 2009 migrated to non performing loans at December 31, 2009. The $20.9 million in potential problem loans at December 31, 2009 compares to $3.6 million at December 31, 2008. The significant increase over December 31, 2008 is in part associated with loans acquired in connection with the August 2008 merger with F&T and subsequently identified as potential problem loans. The Company has taken a conservative posture with respect to risk rating its loan portfolio, which has also resulted in significant increases in the level of potential problem loans over the past year. Based upon their status as potential problem loans, these loans receive heightened scrutiny and ongoing intensive risk management. Additionally, the Company's loan loss allowance methodology incorporates increased reserve factors for certain loans considered potential problem loans as compared to the general portfolio. See Allowance for Loan Credit Losses page 24 for a description of the allowance methodology. Of the $20.9 million in potential problem loans at December 31, 2009, 52.5% are secured commercial real estate loans, 33.2% are real estate secured C&I owner occupied real estate loans, and 14.2% are C&I loans.
28
Other Earning Assets
Residential mortgage loans held for sale amounted to $1.6 million at December 31, 2009 compared to $2.7 million at December 31, 2008. Origination and sale of these loans on a servicing released basis is emphasized by the Company in order to enhance noninterest income, which emphasis is expected to continue in 2010. The Bank did not engage in the origination of subprime or "exotic" mortgage loans. See "Business" at page 92 for a description of the Bank's mortgage lending and brokerage activities.
Bank owned life insurance is utilized by the Company in accordance with income tax regulations as part of the Company's financing of its benefit programs. At December 31, 2009 this asset amounted to $12.9 million as compared to $12.4 million at December 31, 2008, which reflected an increase in cash surrender values, and not new investments.
Intangible Assets
The Company recognizes a servicing asset for the computed value of servicing fees on the sale of the guaranteed portion of SBA loans, which is in excess of a normal servicing fee. Assumptions related to loan term and amortization is made to arrive at the initial recorded value, which is included in intangible assets, net, on the Consolidated Balance Sheets.
For 2009, excess servicing fees of $62 thousand were recorded, and $88 thousand was amortized as a reduction of actual service fees collected, which is a component of other income. At December 31, 2009, the balance of excess servicing fees was $159 thousand. For 2008, excess servicing fees of $54 thousand were recorded, of which $105 thousand was amortized as a reduction of actual service fees collected, which is a component of other income. At December 31, 2008, the balance of excess servicing fees was $185 thousand.
In connection with the Fidelity acquisition, the Company made an allocation of the purchase price to a core deposit intangible which was determined by independent evaluation and is included in intangible assets, net, on the Consolidated Balance Sheets. The initial amount recorded was $2.3 million, which is being amortized over its economic life of 6.44 years as a component of other noninterest expense. The amounts amortized in 2009 and 2008 were $186 thousand $62 thousand, respectively. The unamortized assets at December 31, 2009 and 2008 were $2.1 million and $2.2 million, respectively.
The Company recorded an initial amount of unidentified intangible (goodwill) incident to the acquisition of Fidelity of approximately $360 thousand. Based on allowable adjustments through August 31, 2009, the unidentified intangible (goodwill) amounted to approximately $2.2 million. The increase in goodwill year over year was the result of purchase accounting adjustments during the first year after the acquisition for write downs of assets that were overvalued at the date of the acquisition. The Company's testing of potential goodwill impairment (which is required annually) at December 31, 2009, resulted in no impairment being recorded.
Deposits and Other Borrowings
The principal sources of funds for the Bank are core deposits, consisting of demand deposits, NOW accounts, money market accounts, savings accounts and certificates of deposits from the local market areas surrounding the Bank's offices. The deposit base includes transaction accounts, time and savings accounts and accounts which customers use for cash management and which provide the Bank with a source of fee income and cross-marketing opportunities, as well as an attractive source of lower cost funds. To meet funding needs during periods of high loan demand and seasonal variations in core deposits, the Bank utilizes alternative funding sources such as secured borrowings from the Federal Home Loan Bank of Atlanta ("FHLB"); federal funds purchased lines of credit from correspondent banks and brokered deposits from a regional brokerage firm, a national brokered funds network and from the Promontory Interfinancial Network, LLC network.
For the twelve months ended December 31, 2009, noninterest bearing deposits increased $84.4 million as compared to December 31, 2008 to $308.0 million or 21% of total deposits, while interest bearing
29
deposits increased by $246.5 million during the same period, primarily attributable to a marketing campaign begun in the second quarter of 2009 for money market accounts. Money market accounts and savings accounts collectively amounted to $582.9 million at December 31, 2009 or 40% of total deposits, as compared to $271.8 million, or 24% of total deposits, at December 31, 2008, a 114% increase.
For the year ended December 31, 2009, total deposits increased $331 million, from $1.13 billion to $1.46 billion, or 29%, due largely to focus sales efforts in 2009 to attract more core deposit customers, and also to the emphasis on requiring loan customers to place deposits with the Bank. Approximately 35% of the Bank's deposits at December 31, 2009 ($509.7 million) were time deposits, which are generally the most expensive form of deposit because of their fixed rate and term, as compared to 51% at December 31, 2008 ($579.2 million). This decrease in the time deposit category at December 31, 2009 as compared to December 31, 2008 was due in part to migration of funds in response to higher rate money market account promotions.
The following table sets forth the maturities of time deposits with balances of $100,000 or more, which represent 20% of total deposits as of December 31, 2009, compared to 22% at December 31, 2008. See Note 7 to the Consolidated Financial Statements for additional information regarding the maturities of time deposits and the Average Balances Table at page 13 above for the average rates paid on interest-bearing deposits. Time deposits of $100 thousand or more can be more volatile and more expensive than time deposits of less than $100 thousand. However, because the Bank focuses on relationship banking, and its marketplace demographics are favorable, its historical experience has been that large time deposits have not been more volatile or significantly more expensive than smaller denomination certificates.
| |
December 31, | |||||||||
|---|---|---|---|---|---|---|---|---|---|---|
| (dollars in thousands) |
2009 | 2008 | 2007 | |||||||
Three months or less |
$ | 89,318 | $ | 109,283 | $ | 52,570 | ||||
More than three months through six months |
74,189 | 23,448 | 56,540 | |||||||
More than six months through twelve months |
74,152 | 91,832 | 61,117 | |||||||
Over twelve months |
58,540 | 24,953 | 3,359 | |||||||
Total |
$ | 296,199 | $ | 249,516 | $ | 173,586 | ||||
From time to time, when appropriate in order to fund strong loan demand, the Bank accepts brokered time deposits, generally in denominations of less than $100 thousand, from a regional brokerage firm, and other national brokerage networks, including the Promontory Interfinancial Network, LLC for one-way purchased transactions. Additionally, the Bank participates in the Certificates of Deposit Account Registry Service ("CDARS"), which provides for reciprocal ("two-way") transactions among banks facilitated by the Promontory Interfinancial Network, LLC for the purpose of maximizing FDIC insurance. These reciprocal CDARS funds are classified as brokered deposits. At December 31, 2009, total time deposits included $106.7 million of brokered deposits, which represented 7% of total deposits. The CDARS component represented $38.8 million or 3% of total deposits. These sources are believed to represent a reliable and cost efficient alternative funding source for the Company. At December 31, 2008, total time deposits included $192.7 million of brokered deposits, which represented 17% of total deposits. The CDARS component represented $81.1 million, or 7% of total deposits. The lower level of wholesale funding during 2009 is attributable to favorable growth in core deposits.
At December 31, 2009, the Company had approximately $308 million in noninterest bearing demand deposits, representing 21% of total deposits. This compared to approximately $223.6 million of these deposits at December 31, 2008 or 20% of total deposits. These deposits are primarily business checking accounts on which the payment of interest is prohibited by regulations of the Federal Reserve. Proposed legislation has been introduced in past Congresses which would permit banks to pay interest on checking and demand deposit accounts established by businesses. If legislation effectively permitting the payment of interest on business demand deposits is enacted, of which there can be no assurance, it is likely that we may be required to pay interest on some portion of our noninterest bearing deposits in order to compete with
30
other banks. Payment of interest on these deposits could have a significant negative impact on our net interest income and net interest margin, net income, and the return on assets and equity.
As an enhancement to the basic noninterest bearing demand deposit account, the Company offers a sweep account, or "customer repurchase agreement," allowing qualifying businesses to earn interest on short-term excess funds which are not suited for either a certificate of deposit or a money market account. The balances in these accounts were $90.8 million at December 31, 2009 compared to $93.9 million at December 31, 2008, the decrease being attributed primarily to clients' reduced safety concerns over condition of the financial markets at December 31, 2009 as compared to the end of 2008, when financial markets were experiencing a period of heightened stress. Customer repurchase agreements are not deposits and are not insured by the FDIC, but are collateralized by U.S. government agency securities or U.S. government agency mortgage backed securities. These accounts are particularly suitable to businesses with significant fluctuation in the levels of cash flows. Attorney and title company escrow accounts are an example of accounts which can benefit from this product, as are customers who may require collateral for deposits in excess of FDIC insurance limits but do not qualify for other pledging arrangements. This program requires the Company to maintain sufficient investment securities for pledging purposes to accommodate the fluctuations in balances which may occur in these customer repurchase agreement accounts.
At December 31, 2009 the Company had no outstanding balances under its federal funds lines of credit provided by correspondent banks, as compared to $5.0 million outstanding at December 31, 2008. This decrease was due to the Company having an ample supply of core deposits to meet loan funding needs throughout 2009. At December 31, 2009, the Bank had $50 million of borrowings outstanding under its credit facility from the FHLB, as compared to $105 million at December 31, 2008. This decrease in borrowed funding was due to larger amounts of core deposits, primarily money market accounts, attributable in part to special rate promotions over the March-September 2009 period. Outstanding FHLB advances are secured by collateral consisting of a blanket lien on qualifying loans in the Bank's commercial mortgage and home equity loan portfolios.
On August 11, 2008, the Company entered into a Loan Agreement and related Stock Security Agreement and Promissory Note (the "credit facility") with United Bank, pursuant to which the Company may borrow, on a revolving basis, up to $20 million for working capital purposes, to finance capital contributions to the Bank and ECV. The terms of this facility were modified in July 2009. The credit facility is secured by a first lien on all of the stock of the Bank, and bears interest at a floating rate equal to the Wall Street Journal Prime Rate minus 0.25% with a floor interest rate of 4.75%. Interest is payable on a monthly basis. The term of the credit facility expires on June 25, 2010. At any time, provided no event of default exists, the Company may term out repayment of the outstanding principal balance of the credit facility over a five year term. At December 31, 2009 and 2008, there were no amounts outstanding under this credit facility.
On August 28, 2008, the Company accepted subscriptions for and sold an aggregate of $12.15 million of subordinated notes (the "Notes"), on a private placement basis. This offering, which was funded by several Directors of the Company, was utilized to provide additional Tier 2 regulatory capital in the wake of the acquisition of Fidelity, absent availability of other capital sources during 2008. The capital treatment of the Notes will be phased out during the last 5 years of the Notes' term, at a rate of 20% of the original principal amount per year commencing in October 2009. The Notes bear interest, payable on the first day of each month, commencing in October 2008, at a fixed rate of 10% per year. The Notes have a term of approximately six years, and have a maturity of September 30, 2014. On September 17, 2009, the Company redeemed an aggregate of $2.85 million of the Notes from certain directors of the Company. At December 31, 2009, $9.3 million of the Notes remaining outstanding, and are included in long-term borrowings on the Consolidated Balance Sheets.
Please refer to Note 8 to the Consolidated Financial Statements for additional information regarding the Company's short and long-term borrowings.
31
COMPARISON OF 2008 VERSUS 2007
The results of operation of the Company include the results of operation of Fidelity, acquired on August 31, 2008, for the period September 1, 2008 through December 31, 2008 only.
The Company reported net income of $7.4 million for the year ended December 31, 2008, a 4% decrease from net income of $7.7 million for the year ended December 31, 2007, as compared to $8.0 million for the year ended December 31, 2006.
The decrease in net income for the twelve months ended December 31, 2008 can be attributed substantially to an increase in the provision for credit losses of 142% and a 24% increase in noninterest expense while interest income increased by only 15% as compared to the same period in 2007. Net interest income showed an increase of 26% on growth in average earning assets of 36%. For the twelve months ended December 31, 2008, the Company experienced a 32 basis point decline in its net interest margin from 4.37% in 2007 to 4.05% in 2008. This change was primarily due to a lesser value for noninterest funding sources (0.63% as compared to 0.95%) as interest rates declined significantly during 2008. Additionally, a portion of the decline was due to lower margins on the assets and liabilities acquired in the Fidelity acquisition.
Earnings per basic common share were $0.63 for the year ended December 31, 2008, as compared to $0.73 for 2007. Earnings per diluted common share were $0.62 for the year ended December 31, 2008, as compared to $0.71 for 2007. Per common share amounts and the number of shares have been adjusted to give effect to the 10% stock dividend paid on October 1, 2008.
The Company had a return on average assets of 0.69% and a return on average common equity of 8.05% for the year of 2008, as compared to returns on average assets and average equity of 0.96% and 10.03%, respectively, for the year of 2007.
For the twelve months ended December 31, 2008, average interest bearing liabilities funding average earning assets increased to 78% as compared to 77% for the year of 2007. Additionally, while the average rate on earning assets for the twelve month period ended December 31, 2008, as compared to 2007, decreased by 115 basis points from 7.48% to 6.33%, the cost of interest bearing liabilities also decreased by 115 basis points from 4.06% to 2.91%, resulting in a net interest spread of 3.42% for both the twelve months ended December 31, 2008 and 2007. The 32 basis point decline in the net interest margin from 4.37% for the twelve months ended December 31, 2007 to 4.05% for the twelve months ended December 31, 2008 reflects the effects of a steep decline in market interest rates that reduced the benefit of noninterest funding sources from 95 basis points in 2007 to 63 basis points for 2008. For the twelve months ended December 31, 2008, average noninterest sources funding earning assets were $225 million as compared to $179 million for the same period in 2007.
Due to the need to meet loan funding objectives in excess of deposit growth during 2008, the Bank has relied to a larger extent on alternative funding sources, such as FHLB advances and brokered time deposits, which sources provided favorable funding costs.
Loans, which generally have higher yields than securities and other earning assets, increased to 88% of average earning assets in 2008 from 86% of average earning assets for 2007. Investment securities accounted for 11% of average earning assets for both 2008 and 2007. Federal funds sold averaged 1% and 2% of average earning assets for 2008 and 2007, respectively.
The provision for credit losses was $4.0 million for the year ended December 31, 2008 as compared to $1.6 million in 2007. The higher provision for the year ended December 31, 2008, as compared to 2007, is attributable to substantially higher levels of loan growth, migration of loans to higher risk assessments within the portfolio and increases in reserve allocations on classified loans. For the full year 2008, the Company recorded net charge-offs of $1.1 million, as compared to $979 thousand for the same period in 2007. The ratio of net charge-offs to average loans was 0.12% for 2008 and 0.15% for 2007. The increase in
32
the amount of net charge-offs in 2008 over 2007 was attributable to charge-offs in commercial construction and land development loans ($446 thousand versus $0), the unguaranteed portion of SBA loans ($337 thousand versus $0 thousand), non-real estate commercial business loans ($100 thousand versus $968 thousand), consumer loans ($210 thousand versus $11 thousand), and commercial real estate investment property loans ($29 thousand versus $0).
At December 31, 2008, the allowance for credit losses was $18.4 million (including the assumed balance of the Fidelity allowance for credit losses of $7.5 million), or 1.45% of total loans, as compared to $8.0 million or 1.12% of total loans at December 31, 2007. The primary factor in the increase of the balance of the allowance was the acquisition of Fidelity and the assumption of its allowance related to unimpaired loans. The increase in the allowance as a percentage of total loans reflects a higher risk profile of the loans acquired from Fidelity, as well as a change in the mix of loans as a result of the acquisition of Fidelity.
Total noninterest income was $4.4 million for 2008 as compared to $5.2 million for 2007, a decrease of 16%. These amounts include net investment gains of $2 thousand for the year of 2008 and $6 thousand in 2007. The decrease was attributable primarily to $1.3 million of income in 2007 from the settlement of a subordinated financing transaction. Excluding this transaction, noninterest income increased 10%, which includes the impact of the Fidelity acquisition. Other factors were higher service charges on deposit accounts of $919 thousand ($2.4 million in 2008 versus $1.5 million in 2007), partially offset by lower volume of SBA and residential mortgage loan sales activity ($426 thousand in 2008 versus $1.0 million in 2007). Income from subordinated financing activities can fluctuate greatly between periods, as it is based on the progress of a limited number of development projects.
Total noninterest expenses were $30.8 million for 2008, as compared to $24.9 million for 2007, a 24% increase, which reflects the larger organization subsequent to the Fidelity acquisition. The other primary reasons for this increase were merit increases, higher personnel costs, increased broker fees, higher internet and license agreement fees, increased legal, accounting and professional fees, including loan collection costs, and acquisition related expenses. In addition, higher costs were incurred for marketing, sponsorship, and professional services associated with the inaugural EagleBank Bowl. The efficiency ratio was 66.49% for the year of 2008 as compared to 64.67% for 2007.
The Company recorded income tax expense of $4.1 million in 2008 compared to $4.3 million in 2007 resulting in an effective tax rate of 35.7%, and 35.7%, respectively.
At December 31, 2008, the Company's total assets were $1.5 billion, loans were $1.3 billion, deposits were $1.1 billion, other borrowings, including customer repurchase agreements were $216.0 million and stockholders' equity was $142.4 million. As compared to December 31, 2007, assets grew in 2008 by $651.2 million (77%), loans by $549.0 million (77%), deposits by $498.4 million (79%), borrowings by $87.5 million (68%) and stockholders' equity by $61.2 million (75%).
A substantial portion of the growth in all balance sheet categories in 2008 resulted from the Fidelity acquisition. A significant portion of the growth in stockholders' equity was due to the issuance of $38.235 million of preferred stock pursuant to the Capital Purchase Program. For additional information regarding the Company's participation in the Capital Purchase Program, please refer to page 40 and Note 9 to the Consolidated Financial Statements.
The Company paid a cash dividend of $0.0545 per common share for each of the first and second quarters of 2008 and $0.0545 per common share for each quarter of 2007. In July 2008, the Company, in an action to conserve capital, discontinued the payment of its quarterly cash dividend. On October 1, 2008, the Company issued a 10% stock dividend on the common stock.
At December 31, 2008, the investment portfolio amounted to $169.1 million as compared to a balance of $87.1 million at December 31, 2007, an increase of 94%, most of the growth being associated with the Fidelity acquisition consummated as of August 31, 2008. The investment portfolio is managed to achieve
33
goals related to income, liquidity, interest rate risk management and providing collateral for customer repurchase agreements and other borrowing relationships. The Company's short-term investment portfolio amounted to $2.5 million at December 31, 2008 as compared to $4.5 million at December 31, 2007.
Federal funds sold amounted to $191 thousand at December 31, 2008 as compared to $244 thousand at December 31, 2007. These funds represent excess daily liquidity which is invested on an unsecured basis with well capitalized banks, in amounts generally limited both in the aggregate and to any one bank.
Loan growth over the year 2008 was favorable, with loans outstanding reaching $1.3 billion at December 31, 2008, an increase of $549.0 million or 77% as compared to $716.7 million at December 31, 2007.
The Company had strong loan growth throughout the year 2008. In August, $360 million of loans were added as a result of the acquisition of Fidelity. Approximately 50% of the Company's organic growth was recorded in the fourth quarter of 2008. The fourth quarter experienced growth in investment real estate lending which is attributable to various factors, including the Company having the opportunity to lend on local income producing commercial real estate projects which were typically financed in the CMBS market, and which was not functioning during most of 2008. The commercial portfolio growth is also attributable to various factors including increasing SBA guaranteed loans made for business acquisition; recording new commercial term loans to assist local business in various financing needs including equipment financing and providing ESOP financing so that the employees of a local company could acquire their company. New commercial lines of credit booked grew providing local businesses working capital; and new owner occupied commercial real estate loans grew allowing business owners to purchase and/or refinance the real estate in which their company operates.
The allowance for credit losses represented 1.45% of total loans at December 31, 2008 as compared to 1.12% at December 31, 2007. This increase in the ratio of the allowance for credit losses was due substantially to the acquisition of Fidelity whose allowance for credit losses was approximately $7.5 million or 2.10% of Fidelity loans outstanding at August 31, 2008.
At December 31, 2008, the Company had $25.5 million of loans classified as nonperforming, and $3.6 million of potential problem loans, as compared to $5.3 million of nonperforming loans and $1.9 million of potential problem loans at December 31, 2007. The percentage of nonperforming assets to total assets was 1.76% at December 31, 2008 compared to 0.63% at December 31, 2007. Included in nonperforming assets at December 31, 2008 is other real estate owned ("OREO") of $909 thousand and $0 at December 31, 2007, respectively. Excluding OREO from nonperforming assets, total nonperforming loans amounted to $25.5 million at December 31, 2008 (2.01% of total loans) as compared to $5.3 million (0.74% of total loans) at December 31, 2007. The increase in nonperforming loans at December 31, 2008 as compared to December 31, 2007 relates primarily to nonperforming loans acquired from Fidelity of $10.7 million and to two commercial loan relationships (approximately $4.4 million) which include commercial real estate loans secured by residential properties which have experienced cost overruns and/or delays in the development and construction processes.
Residential mortgage loans held for sale amounted to $2.7 million at December 31, 2008 compared to $2.2 million at December 31, 2007.
Bank owned life insurance is utilized by the Company in accordance with tax regulations as part of the Company's financing of its benefit programs. At December 31, 2008 this asset amounted to $12.4 million as compared to $12.0 million at December 31, 2007, which reflected an increase in cash surrender values, and not new investments.
For the year ended December 31, 2008, total deposits increased $498.4 million, from $630.9 million to $1.1 billion or 79%. Approximately 51% of the Bank's deposits at December 31, 2008 ($579.2 million) are made up of time deposits, which are generally the most expensive form of deposit because of their fixed rate and term, as compared to 41% at December 31, 2007 ($257.3 million). This increase in the time
34
deposit category at December 31, 2008 as compared to December 31, 2007 was due to both the acquisition of Fidelity, which had a higher proportion of its deposits in time deposits, and to customer preferences toward higher interest FDIC insured products in the fourth quarter of 2008 as economic conditions worsened. Average time deposits amounted to $402.2 million in 2008 (48% of average total deposits), compared to $270.5 million in 2007 (43% of average total deposits), an increase of $131.7 million or 49%.
At December 31, 2008, the Company had approximately $223.6 million in noninterest bearing demand deposits, representing 20% of total deposits. This compared to approximately $142.5 million of these deposits at December 31, 2007 or 23% of total deposits.
As an enhancement to the basic noninterest bearing demand deposit account, the Company offers a sweep account, or "customer repurchase agreement," allowing qualifying businesses to earn interest on short-term excess funds which are not suited for either a certificate of deposit or a money market account. The balances in these accounts were $93.9 million at December 31, 2008 compared to $52.9 million at December 31, 2007, the increase being attributed primarily to the acquisition of Fidelity. Customer repurchase agreements are not deposits and are not insured by the FDIC, but are collateralized by U.S. government agency securities.
At December 31, 2008 the Company had $5.0 million outstanding balances under its federal funds lines of credit provided by correspondent banks, as compared to $23.5 million outstanding at December 31, 2007. This decrease was due to changes in the funding mix to the less expensive funding provided by the FHLB. At December 31, 2008, the Bank had $105 million borrowings outstanding under its credit facility from the FHLB, as compared to $52 million at December 31, 2007. Outstanding advances are secured by collateral consisting of a blanket lien on qualifying loans in the Bank's commercial mortgage loan portfolio.
CONTRACTUAL OBLIGATIONS
The Company has various financial obligations, including contractual obligations and commitments that may require future cash payments. Except for its loan commitments, as shown in Note 15 to the Consolidated Financial Statements—Financial Instruments with Off-Balance Sheet Risk, the following table shows details on these fixed and determinable obligations as of December 31, 2009 in the time period indicated.
(dollars in thousands)
|
Within One Year |
One to Three Years |
Three to Five Years |
Over Five Years |
Total | ||||||||||||
|---|---|---|---|---|---|---|---|---|---|---|---|---|---|---|---|---|---|
Deposits without a stated maturity(1) |
$ | 950,533 | $ | — | $ | — | $ | — | $ | 950,533 | |||||||
Time deposits(1) |
358,962 | 106,019 | 44,760 | — | 509,741 | ||||||||||||
Borrowed funds(2) |
100,790 | 10,000 | 30,000 | 9,300 | 150,090 | ||||||||||||
Operating lease obligations |
3,942 | 6,674 | 5,804 | 5,655 | 22,075 | ||||||||||||
Outside data processing(3) |
1,090 | 2,229 | 287 | — | 3,606 | ||||||||||||
Total |
$ | 1,415,317 | $ | 124,922 | $ | 80,851 | $ | 14,955 | $ | 1,636,045 | |||||||
- (1)
- Excludes
accrued interest payable at December 31, 2009.
- (2)
- Borrowed
funds include customer repurchase agreements, federal funds purchased and other short-term and long-term borrowings.
- (3)
- The Bank has outstanding obligations under its current core data processing contract that expires in May 2013 and one other vendor arrangement that relates to data communications and data software that expires in December 2012.
35
OFF-BALANCE SHEET ARRANGEMENTS
The Company is party to financial instruments with off-balance-sheet risk in the normal course of business to meet the financing needs of its customers and to reduce its own exposure to fluctuations in interest rates. These financial instruments include commitments to extend credit and standby letters of credit. They involve, to varying degrees, elements of credit risk in excess of the amount recognized in the balance sheets. The contract or notional amounts of those instruments reflect the extent of involvement the Company has in particular classes of financial instruments.
The Company's exposure to credit loss in the event of nonperformance by the other party to the financial instrument for commitments to extend credit and standby letters of credit is represented by the contractual amount of those instruments. The Company uses the same credit policies in making commitments and conditional obligations as it does for on-balance-sheet instruments. See Note 15 to the Consolidated Financial Statements for a summary list of loan commitments at December 31, 2009 and 2008.
Loan commitments represent agreements to lend to a customer as long as there is no violation of any condition established in the contract and which have been accepted in writing by the borrower. Commitments generally have fixed expiration dates or other termination clauses and may require payment of a fee. Since some of the commitments may expire without being drawn upon, the total commitment amounts do not necessarily represent future cash requirements. The Company evaluates each customer's creditworthiness on a case-by-case basis. The amount of collateral obtained is based on management's credit evaluation of the borrower. Collateral obtained varies, and may include certificates of deposit, accounts receivable, inventory, property and equipment, residential and commercial real estate.
Standby letters of credit are conditional commitments issued by the Company which guarantee the performance of a customer to a third party. The credit risk involved in issuing letters of credit is essentially the same as that involved in extending loan facilities to customers. Collateral held varies as specified above and is required in instances which the Company deems necessary. At December 31, 2009, approximately 98% of the dollar amount of standby letters of credit was collateralized.
With the exception of these off-balance sheet arrangements, the Company has no off-balance sheet arrangements that have or are reasonably likely to have a current or future effect on the Company's financial condition, changes in financial condition, revenues or expenses, results of operations, capital expenditures or capital resources, that is material to investors.
LIQUIDITY MANAGEMENT
Liquidity is a measure of the Company's and Bank's ability to meet loan demand and to satisfy depositor withdrawal requirements in an orderly manner. The Bank's primary sources of liquidity consist of cash and cash balances due from correspondent banks, loan repayments, federal funds sold and other short-term investments, maturities and sales of investment securities and income from operations. The Bank's investment portfolio of debt securities is held 100% in an available-for-sale status and has a substantial unrealized gain position, which allows for flexibility, subject to holdings held as collateral for customer repurchase agreements; to generate cash from sales as needed to meet ongoing loan demand. These sources of liquidity are considered primary and are supplemented by the ability of the Company and Bank to borrow funds, which are termed secondary sources and which are substantial. The Company's secondary sources of liquidity include a $20 million line of credit with a regional bank, secured by the stock of the Bank, against which there were no amounts outstanding at December 31, 2009. Additionally, the Bank can purchase up to $70.0 million in federal funds on an unsecured basis from its correspondents, against which there were no amounts outstanding at December 31, 2009 and can borrow unsecured funds under one-way CDARS brokered deposits in the amount of $82.0 million, against which there was $448 thousand outstanding at December 31, 2009. At December 31, 2009, the Bank was also eligible to make advances from the FHLB up to $112.4 million based on collateral at the FHLB, of which it had
36
$50 million of advances outstanding at December 31, 2009. Also, the Bank may enter into repurchase agreements as well as obtain additional borrowing capabilities from the FHLB provided adequate collateral exists to secure these lending relationships. In the fourth quarter of 2009, the Bank finalized a back-up borrowing facility through the Discount Window at the Federal Reserve Bank of Richmond ("Federal Reserve"). This facility, which amounts to approximately $163 million, is collateralized with specific loan assets identified to the Federal Reserve. It is anticipated, except for periodic testing, that this facility would be utilized for contingency funding only.
The loss of deposits, through disintermediation, is one of the greater risks to liquidity. Disintermediation occurs most commonly when rates rise and depositors withdraw deposits seeking higher rates in alternative savings and investment sources than the Bank may offer. The Bank was founded under a philosophy of relationship banking and, therefore, believes that it has less of an exposure to disintermediation and resultant liquidity concerns than do many banks. There is, however, a risk that some deposits would be lost if rates were to increase and the Bank elected not to remain competitive with its deposit rates. Under those conditions, the Bank believes that it is well positioned to use other sources of funds such as FHLB borrowings, brokered deposits and correspondent bank lines of credit to offset a decline in core deposits in the short run and may also utilize the Federal Reserve's Discount Window facility. Over the long-term, an adjustment in assets and change in business emphasis could compensate for a potential loss of deposits. The Bank also maintains a marketable investment portfolio to provide flexibility in the event of significant liquidity needs. The Bank's Asset Liability Committee has adopted policy guidelines which emphasize the importance of core deposits and their continued growth. In the year ended December 31, 2009, the Bank was able to substantially increase its core deposits through both new relationships and increases to accounts of existing relationships.
At December 31, 2009, under the Bank's liquidity formula, it had $463.8 million of primary and secondary liquidity sources, which was deemed adequate to meet current and projected funding needs.
INTEREST RATE RISK MANAGEMENT
Asset/Liability Management and Quantitative and Qualitative Disclosures about Market Risk
A fundamental risk in banking is exposure to market risk, or interest rate risk, since a bank's net income is largely dependent on net interest income. The Bank's Asset Liability Committee ("ALCO") of the Board of Directors formulates and monitors the management of interest rate risk through policies and guidelines established by it and the full Board of Directors and through review of detailed analysis reports quarterly. In its consideration of risk limits, the ALCO considers the impact on earnings and capital, the level and direction of interest rates, liquidity, local economic conditions, outside threats and other factors. Banking is generally a business of managing the maturity and re-pricing mismatch inherent in its asset and liability cash flows and to provide net interest income growth consistent with the Company's profit objectives. During the year ended December 31, 2009, the Company was able to both increase substantially its net interest income and manage its overall interest rate risk position.
The Company, through its ALCO, monitors the interest rate environment in which it operates and adjusts the rates and maturities of its assets and liabilities to remain competitive and to achieve its overall financial objectives subject to established risk limits. In the current and expected future interest rate environment, the Company has been restructuring its investment portfolio to mitigate call risk should rates remain at current levels and to mitigate extension risk should rates increase. Additionally, the Company has been acquiring longer-term fixed rate liabilities given the very low interest rate environment, in an effort to secure attractive funding rates over the next three to four years. Also, and very importantly, the growth of core deposits, which enhance franchise value and provide a stable funding source, has been a major objective which has been met by the Company during 2009, adding liquidity and enhanced asset sensitivity to the year-end 2009 balance sheet. The re-pricing duration of the deposit portfolio increased to 30 months at December 31, 2009 from 22 months at December 31, 2008, as the mix of deposits shifted
37
from time deposits with relatively short duration to money market and demand accounts with longer durations.
In the current very low interest rate environment, the Company has continued its emphasis on funding loans in its marketplace, and has been able to achieve favorable loan pricing, including interest rate floors on many loan originations. These factors have resulted in less pressure on loan yields over the past twelve months as average interest rates have declined, thereby enhancing the Company's net interest margin. Also, approximately 66% of total loans at December 31, 2009 (70% at December 31, 2008) have either variable interest rates, indexed primarily to the Wall Street Journal prime interest rate or are adjustable rate indexed primarily to the five year U.S. Treasury interest rate, with 34% of the loan portfolio at December 31, 2009 (30% at December 31, 2008) being fixed rate. Subject to interest rate floor rates, these variable and adjustable rate loans provide additional income opportunities should interest rates rise from current levels. The re-pricing duration of the loan portfolio remained low at 12 months at both December 31, 2009 and 2008.
Within the investment portfolio, during 2009, the Company has increased the mix of longer duration tax exempt municipal bonds and has added collateralized mortgage obligations which provide more structured cash flows and limited extension risk. We decreased the mix of U.S. Agency bonds exhibiting call risk and 30 year mortgaged backed securities. Also, the overall size of the portfolio has increased as average deposit growth exceeded average loan growth during 2009, in addition to the need to add to the portfolio to provide adequate collateral for potential growth in customer repurchase agreements. Both call risk and extension risk were reduced somewhat in the portfolio in the second quarter of 2009. Proceeds from the sale of callable agencies and longer-term mortgage backed securities were reinvested in a combination of high quality tax exempt municipal securities and seasoned 15 and 20 year and structured mortgage backed issues. The results of these actions were to increase the duration of the investment portfolio from 18 months at December 31, 2008 to 40 months at December 31, 2009, while the gross unrealized gain was approximately $3.9 million at both December 31, 2008 and 2009 with $1.5 million of net investment gain being realized in income for the year ended December 31, 2009.
There can be no assurance that the Company will be able to successfully achieve its optimal asset liability mix, as a result of competitive pressures, customer preferences and the inability to perfectly forecast future interest rates and movements.
One of the tools used by the Company to manage its interest rate risk is a static GAP analysis presented below. The Company also uses an earnings simulation model (simulation analysis) on a quarterly basis to monitor its interest rate sensitivity and risk and to model its balance sheet cash flows and its income statement effects in different interest rate scenarios. The model utilizes current balance sheet data and attributes and is adjusted for assumptions as to investment maturities (calls), loan prepayments, interest rates, the level of noninterest income and noninterest expense. The data is then subjected to a "shock test" which assumes a simultaneous change in interest rates up 100 and 200 basis points or down 100 and 200 basis points, along the entire yield curve, but not below zero. The results are analyzed as to the impact on net interest income, and net income over the next twelve and twenty-four month periods and to the market value of equity impact.
For the analysis presented below, at December 31, 2009, the Bank's assumption for the re-pricing of interest bearing transaction, savings and money market deposit accounts reflects a 70 basis point change in interest rates for each 100 basis point change in market interest rates in both a decreasing and increasing interest rate shock scenario with a floor of 10 basis points. This assumption was updated as of December 31, 2009, as compared to a 50 basis point change previously employed. With the prospect of increasing interest rates, the Company desires to be conservative in this assumption.
As quantified in the table below, the Company's analysis at December 31, 2009 shows a moderate effect on net interest income (over the next 12 months) as well as to the economic value of equity when interest rates are shocked both down 100 and 200 basis points and up 100 and 200 basis points due to the
38
significant level of variable rate and repriceable assets and liabilities. The re-pricing duration of the investment portfolio at December 31, 2009 is 3.4 years, the loan portfolio 1.0 years, the interest bearing deposit portfolio 2.24 years and the borrowed funds portfolio 1.25 years.
The following table reflects the result of simulation analysis on the December 31, 2009 asset and liabilities balances:
| Change in interest rates (basis points) |
Percentage change in net interest income |
Percentage change in net income |
Percentage change in market value of portfolio equity |
||||||||
|---|---|---|---|---|---|---|---|---|---|---|---|
| +200 | +2.1 | % | +6.7 | % | -0.1 | % | |||||
| +100 | +0.6 | % | +2.0 | % | +0.9 | % | |||||
| 0 | — | — | — | ||||||||
| -100 | +2.6 | % | +8.2 | % | -4.6 | % | |||||
| -200 | +8.3 | % | +26.5 | % | -9.6 | % | |||||
The results of simulation are within the policy limits adopted by the Company. For net interest income, the Company has adopted a policy limit of negative 10% for a 100 basis point change and negative 12% for a 200 basis point change. For the market value of equity, the Company has adopted a policy limit of negative 12% for a 100 basis point change and negative 15% for a 200 basis point change. Any potential negative effects in both net interest income and the economic value of equity in both a higher and lower interest rate shock scenario at December 31, 2009 is not material.
During 2009, the Company increased its asset sensitivity in anticipation of higher interest rates. This change is manifested in a positive impact on both net interest income, net income and the market value in portfolio equity in the chart above at December 31, 2009 as compared to the position at December 31, 2008, disclosed in the Company's Annual Report on Form 10-K for the year ended December 31, 2008.
Generally speaking, the loss of market value of portfolio equity in a lower interest rate environment is due to lower values of core deposits more than offsetting the gains in loan and investment values; while the loss of market value of portfolio equity in a higher interest rate environment is due to lower values of fixed rate loans and investments more than offsetting the higher value of core deposits, neither effect as mentioned above is considered material or unmanageable.
Certain shortcomings are inherent in the method of analysis presented in the foregoing table. For example, although certain assets and liabilities may have similar maturities or repricing periods, they may react in different degrees to changes in market interest rates. Also, the interest rates on certain types of assets and liabilities may fluctuate in advance of changes in market interest rates, while interest rates on other types may lag behind changes in market rates. Additionally, certain assets, such as adjustable-rate mortgage loans, have features that limit changes in interest rates on a short-term basis and over the life of the loan. Further, in the event of a change in interest rates, prepayment and early withdrawal levels could deviate significantly from those assumed in calculating the tables. Finally, the ability of many borrowers to service their debt may decrease in the event of a significant interest rate increase.
During the year 2009, average market interest rates declined as compared to 2008 and the yield curve steepened as average short-term rates declined more than average long-term rates. The average two year U.S. Treasury rate declined by about 105 basis points and the average ten year U.S. Treasury rate declined by about 40 basis points. In that environment, the Company was able to increase its net interest spread and margin in 2009 as compared to the fourth quarter of 2008. The Company believes that the change in the net interest spread in 2009 as compared to 2008 has been consistent with its risk analysis at December 31, 2008.
GAP Analysis
Banks and other financial institutions earnings are significantly dependent upon net interest income, which is the difference between interest earned on earning assets and interest expense on interest bearing liabilities. This revenue represented 89% of the Company's revenue for the year ended December 31, 2009, as compared to 91% of the Company's revenue for the year ended December 31, 2008 and 87% of the Company's revenue for the year ended December 31, 2007.
39
In falling interest rate environments, net interest income is maximized with longer term, higher yielding assets being funded by lower yielding short-term funds, or what is referred to as a negative mismatch or GAP. Conversely, in a rising interest rate environment, net interest income is maximized with shorter term, higher yielding assets being funded by longer-term liabilities or what is referred to as a positive mismatch or GAP.
Based on the current economic environment, and anticipating higher interest rates over the next few years management, in the second quarter of 2009, restructured the composition of its investment portfolio by selling U.S. Agency securities to mitigate call risk, by selling 30 year mortgage backed securities to mitigate extension risk and by purchasing seasoned 15 and 20 year mortgage backed securities and structured mortgage backed products to provide enhanced cash flows by increasing the portion of the investment portfolio that was amortizing. Additionally, the Company has increased the proportion of its tax exempt securities in the 10–15 year maturity range to provide attractive fully tax equivalent yields in a barbell approach to investing. These actions have had the effect of increasing the duration of the investment portfolio. On the liability side of the balance sheet, management has acquired longer maturities in its brokered deposit portfolio and its FHLB advances and has attracted large amounts of core money market accounts (which have longer durations) in an effort to build more client relationships. As noted above, the Company's net interest spread and margin for the twelve months ended December 31, 2009 of 3.37% and 3.85% respectively were both improved from the net interest spread and margin in the fourth quarter of 2008 of 3.18% and 3.74% respectively, evidence that the Company was well positioned at December 31, 2008 for lower interest rates, which did occur in 2009.
The Company's net interest margin decreased during 2009 as compared to 2008 by 20 basis points (from 4.05% to 3.85%) due to higher average liquidity during 2009 as compared to 2008. The higher average liquidity is reflected in higher average federal funds sold as both the average and year end growth in deposits during 2009 exceeded loan growth.
The GAP position, which is a measure of the difference in maturity and re-pricing volume between assets and liabilities, is a means of monitoring the sensitivity of a financial institution to changes in interest rates. The chart below provides an indication of the sensitivity of the Company to changes in interest rates. A negative GAP indicates the degree to which the volume of repriceable liabilities exceeds repriceable assets in given time periods.
At December 31, 2009, the Company had a positive GAP position of approximately 15.8% of total assets out to three months and a positive cumulative GAP position of 11.5% out to 12 months; as compared to a positive GAP position of approximately 13% of total assets out to three months and a positive cumulative GAP position of 1.5% out to 12 months at December 31, 2008, and a positive GAP position of 11.8% out to three months and a positive cumulative GAP position of 4.6% out to 12 months at September 30, 2009. The change in the GAP position at December 31, 2009 as compared to December 31, 2008 relates primarily to higher amounts of liquidity and short-term investments, to the acquisition of large amounts of money market and demand deposits which have longer lives (duration) and to the extension of the term for brokered deposits and FHLB advances. The current position is within guideline limits established by the Asset Liability Committee.
While management believes that this overall position creates a reasonable balance in managing its interest rate risk and maximizing its net interest margin within plan objectives, there can be no assurance as to actual results. Management has carefully considered its strategy to maximize interest income by reviewing interest rate levels, economic indicators and call features within its investment portfolio, as well as interest rate floors within its loan portfolio. These factors have been discussed with the ALCO and management believes that current strategies are appropriate to current economic and interest rate trends.
If interest rates increase, the Company's net interest income and net interest margin are expected to increase due to an excess of rate sensitive assets over liabilities at December 31, 2009, that reprice within a 12 month period.
40
If interest rates decline, the Company's net interest income and margin are also expected to increase as the floors on the loan portfolio provide added value and variable rate deposits are reduced.
Because competitive market behavior does not necessarily track the trend of interest rates but at times moves ahead of financial market influences, the change in the cost of liabilities may be different than anticipated by the GAP model. If this were to occur, the effects of a declining interest rate environment may not be in accordance with management's expectations.
GAP Analysis
December 31, 2009
(dollars in thousands)
| |
0–3 months | 4–12 months | 13–36 months | 37–60 months | Over 60 months | Total Rate Sensitive |
Non- sensitive |
Total Assets | |||||||||||||||||||
|---|---|---|---|---|---|---|---|---|---|---|---|---|---|---|---|---|---|---|---|---|---|---|---|---|---|---|---|
Repriceable in: |
|||||||||||||||||||||||||||
RATE SENSITIVE ASSETS: |
|||||||||||||||||||||||||||
Investments securities |
$ | 21,624 | $ | 46,613 | $ | 85,130 | $ | 32,893 | $ | 48,967 | $ | 235,227 | |||||||||||||||
Loans (1)(2) |
764,952 | 115,732 | 273,566 | 218,650 | 27,961 | 1,400,861 | |||||||||||||||||||||
Fed funds and other short-term investments |
88,248 | — | — | — | — | 88,248 | |||||||||||||||||||||
Other earning assets |
— | 12,912 | — | — | — | 12,912 | |||||||||||||||||||||
Total |
$ | 874,824 | $ | 175,257 | $ | 358,696 | $ | 251,543 | $ | 76,928 | $ | 1,737,248 | $ | 68,256 | $ | 1,805,504 | |||||||||||
RATE SENSITIVE LIABILITIES: |
|||||||||||||||||||||||||||
Noninterest bearing demand |
$ | 9,073 | $ | 27,219 | $ | 72,585 | $ | 72,585 | $ | 126,497 | $ | 307,959 | |||||||||||||||
Interest bearing transaction |
59,720 | — | — | — | — | 59,720 | |||||||||||||||||||||
Savings and money market |
286,840 | — | 118,405 | 118,405 | 59,204 | 582,854 | |||||||||||||||||||||
Time deposits |
133,906 | 225,056 | 106,019 | 44,760 | — | 509,741 | |||||||||||||||||||||
Customer repurchase agreements and fed funds purchased |
90,790 | — | — | — | — | 90,790 | |||||||||||||||||||||
Other borrowings |
10,000 | — | 10,000 | 30,000 | 9,300 | 59,300 | |||||||||||||||||||||
Total |
$ | 590,329 | $ | 252,275 | $ | 307,009 | $ | 265,750 | $ | 195,001 | $ | 1,610,364 | $ | 6,819 | $ | 1,617,183 | |||||||||||
GAP |
$ | 284,495 | $ | (77,018 | ) | $ | 51,687 | $ | (14,207 | ) | $ | (118,073 | ) | $ | 126,884 | ||||||||||||
Cumulative GAP |
$ | 284,495 | $ | 207,477 | $ | 259,164 | $ | 244,957 | $ | 126,884 | |||||||||||||||||
Cumulative gap as percent of total assets |
15.76 | % | 11.49 | % | 14.35 | % | 13.57 | % | 7.03 | % | |||||||||||||||||
- (1)
- Includes
loans held for sale.
- (2)
- Non-accrual loans are included in the over 60 months category.
Over the next twelve months, as reflected in the GAP table above, the Company has an excess of rate sensitive assets over rate sensitive liabilities of 11.5% out to 12 months. During 2009, the Company has recognized the probability of higher interest rates and has repositioned both its investment portfolio and its borrowed funds to better position the Company for that probability, while not exposing the Company to negative effects should interest rates either stay fairly stable or decline.
Although NOW and MMA accounts are subject to immediate repricing, the Bank's GAP model has incorporated a repricing schedule to account for a lag in rate changes based on our experience, as measured by the amount of those deposit rate changes relative to the amount of rate change in assets.
41
CAPITAL RESOURCES AND ADEQUACY
The assessment of capital adequacy depends on a number of factors such as asset quality and mix, liquidity, earnings performance, changing competitive conditions and economic forces, regulatory measures and policy, as well as the overall level of growth and complexity of the balance sheet. The adequacy of the Company's current and future capital needs is monitored by management on an ongoing basis. Management seeks to maintain a capital structure that will assure an adequate level of capital to support anticipated asset growth and to absorb potential losses.
The federal banking regulators have issued guidance for those institutions which are deemed to have concentrations in commercial real estate lending. Pursuant to the supervisory criteria contained in the guidance for identifying institutions with a potential commercial real estate concentration risk, institutions which have (1) total reported loans for construction, land development, and other land acquisitions which represent in total 100% or more of an institution's total risk-based capital; or (2) total commercial real estate loans representing 300% or more of the institution's total risk-based capital and the institution's commercial real estate loan portfolio has increased 50% or more during the prior 36 months are identified as having potential commercial real estate concentration risk. Institutions which are deemed to have concentrations in commercial real estate lending are expected to employ heightened levels of risk management with respect to their commercial real estate portfolios, and may be required to hold higher levels of capital. The Company, like many community banks, has a concentration in commercial real estate loans. Management has extensive experience in commercial real estate lending, and has implemented and continues to maintain heightened risk management procedures, and strong underwriting criteria with respect to its commercial real estate portfolio. Nevertheless, we may be required to maintain higher levels of capital as a result of our commercial real estate concentration, which could require us to obtain additional capital, and may adversely affect shareholder returns.
On August 28, 2008 the Company accepted subscriptions for and sold an aggregate of $12.15 million of subordinated notes (the "Notes"), on a private placement basis, to seven parties, all of whom were directors of the Company or the Bank. The Notes, which qualify as Tier 2 capital for regulatory purposes, to the extent permitted, were issued in connection with an effort to meet regulatory requirements for the consummation of the acquisition of Fidelity, completed as of August 31, 2008. The qualifying capital treatment of the Notes are phased out during the last 5 years of the Notes' term (commencing in October 2009), at a rate of 20% of the original principal amount per year. The Notes bear interest, payable on the first day of each month, commencing in October 2008, at a fixed rate of 10.0% per year. The Notes have a term of approximately six years, and have a maturity of September 30, 2014.
In connection with the common stock qualifying capital raise in September 2009 referred to below, $2.85 million of the Notes were redeemed, leaving an outstanding balance of Notes of $9.3 million at December 31, 2009. These Notes are included in long-term borrowings on the balance sheet.
On December 5, 2008, the Company entered into and consummated an agreement with the Treasury, pursuant to which the Company issued 38,235 shares of its Fixed Rate Cumulative Perpetual Preferred Stock, Series A, $1,000 liquidation amount per share (the "Series A Preferred Stock"), for a total purchase price of $38,235,000. The Series A Preferred Stock pays cumulative dividends at a rate of 5% per year for the first five years and thereafter at a rate of 9% per year. The Series A Preferred Stock is non-voting, except in limited circumstances. Prior to the third anniversary of issuance, unless the Company has redeemed all of the Series A Preferred Stock or the Treasury has transferred all of the Series A Preferred Stock to a third party, the consent of the Treasury will be required for the Company to increase its common stock dividend or repurchase its common stock or other equity or capital securities, other than in connection with benefit plans consistent with past practice and certain other circumstances specified in the Purchase Agreement. In connection with the purchase of the Series A Preferred Stock, the Treasury was issued a warrant (the "Warrant") to purchase 770,867 shares of the Company's common stock at an initial exercise price of $7.44 per share. The Warrant provides for the adjustment of the exercise price and the
42
number of shares of the common stock issuable upon exercise pursuant to customary anti-dilution provisions, such as upon stock splits or distributions of securities or other assets to holders of the common stock, and upon certain issuances of the common stock (or securities exercisable or exchangeable for, or convertible into, common stock) at or below 90% of the market price of the common stock on the trading day prior to the date of the agreement on pricing such securities. The Warrants expires ten years from the date of issuance. The number of shares of common stock issuable pursuant to the Warrant will be reduced by one-half if, on or prior to December 31, 2009, the Company receives aggregate gross cash proceeds of not less than $38,235,000 from "qualified equity offerings" announced after October 13, 2008. The Treasury has agreed not to exercise voting power with respect to any shares of common stock issued upon exercise of the Warrant.
On September 21, 2009, the Company completed an underwritten public offering of 6,731,640 shares of its common stock at an offering price of $8.20 per share, including 878,040 shares subject to the underwriter's over-allotment option. The offering, which constituted a "qualified equity offering" for purposes of the Series A Preferred Stock, generated gross cash proceeds of $55,199,448. As a result of the offering, the Company, in November 2009, received Treasury approval of the reduction of the number of shares of common stock subject to the Warrant. Accordingly, the discount on the preferred stock and the warrants were reduced by $946 thousand in November 2009.
On December 23, 2009, the Company redeemed 15,000 shares of its Fixed Rate Cumulative Perpetual Preferred Stock, Series A, $1,000 liquidation amount per share (the "Series A Preferred Stock") issued to the Treasury on December 5, 2008 (see above) pursuant to the Troubled Asset Relief Program Capital Purchase Program. The aggregate redemption price for the shares was $15,079,166, including accrued but unpaid dividends on the shares. Following the repurchase, 23,235 shares of Series A Preferred Stock ($23,235,000) remain outstanding, held by the Treasury.
At December 31, 2009, the capital position of the Company and its wholly-owned subsidiary, the Bank, continues to exceed regulatory requirements and guidelines. The primary indicators relied on by bank regulators in measuring the capital position are the Tier 1 risk-based capital ratio, Total risk-based capital ratio, and the Leverage ratio. Tier 1 capital consists of common and qualifying preferred stockholders' equity (including without limit the preferred stock issued to the Treasury) less goodwill and other intangibles. Total risk-based capital consists of Tier 1 capital, plus qualifying subordinated debt, and the qualifying portion of the allowance for credit losses, and for the Company to a limited extent, excess amounts of restricted core capital elements. At December 31, 2009 and 2008, respectively, 8.9% and 7.5% of the allowance for credit losses was included in Total risk-based capital. Risk-based capital ratios are calculated with reference to risk-weighted assets, which are prescribed by regulation. The measure of Tier 1 capital to average assets for the prior quarter is often referred to as the Leverage ratio.
The Company's capital ratios were all well in excess of guidelines established by the Federal Reserve and the Bank's capital ratios were in excess of those required to be classified as a "well capitalized" institution under the prompt corrective action provisions of the Federal Deposit Insurance Act. The Company's and Bank's capital ratios at December 31, 2009 and 2008 are shown in Note 17 to the Consolidated Financial Statements.
The ability of the Company to continue to grow is dependent on its earnings and those of the Bank, the ability to obtain additional funds for contribution to the Bank's capital, through additional borrowings, through the sale of additional common stock or preferred stock, or through the issuance of additional qualifying equity equivalents, such as subordinated debt or trust preferred securities. The capital levels required to be maintained by the Company and Bank may be impacted as a result of the Bank's concentrations in commercial real estate loans. See "Risk Factors" at page 98 and "Regulation" at page 109.
43
IMPACT OF INFLATION AND CHANGING PRICES
The Consolidated Financial Statements and Notes thereto have been prepared in accordance with accounting principles generally accepted in the United States of America, which require the measurement of financial position and operating results in terms of historical dollars without considering the changes in the relative purchasing power of money over time due to inflation. The impact of inflation is reflected in the increased cost of operations. Unlike most industrial companies, nearly all of our assets and liabilities are monetary in nature. As a result, interest rates have a greater impact on our performance than do the effects of general levels of inflation. Interest rates do not necessarily move in the same direction or to the same extent as the price of goods or services.
NEW AUTHORITATIVE ACCOUNTING GUIDANCE
Refer to Note 1 to the Consolidated Financial Statements for New Authoritative Accounting Guidance and their expected impact on the Company's Financial Statements at page 56.
44
MARKET FOR COMMON STOCK AND DIVIDENDS
Market for Common Stock. The Company's common stock is listed for trading on the NASDAQ Capital Market under the symbol "EGBN." Over the twelve month period ended December 31, 2009, the average daily trading volume amounted to approximately 38,400 shares, an increase from approximately 5,600 shares over the twelve month period ended December 31, 2008. No assurance can be given that a highly active trading market will develop or can be maintained. The following table sets forth the high and low sale prices for the common stock during each calendar quarter during the last two fiscal years, and dividends declared during such periods, as adjusted for the 10% stock dividend paid on October 1, 2008. As of March 4, 2010, there were 19,631,164 shares of common stock outstanding, held by approximately 3,500 beneficial shareholders, including approximately 919 shareholders of record.
| |
2009 | 2008 | |||||||||||||||||
|---|---|---|---|---|---|---|---|---|---|---|---|---|---|---|---|---|---|---|---|
Quarter
|
High | Low | Dividends Declared per Share |
High | Low | Dividends Declared per Share |
|||||||||||||
First |
$ | 7.10 | $ | 5.36 | $ | 0.00 | $ | 11.97 | $ | 9.30 | $ | 0.0545 | |||||||
Second |
$ | 11.20 | $ | 6.15 | $ | 0.00 | $ | 11.09 | $ | 7.15 | $ | 0.0545 | |||||||
Third |
$ | 10.19 | $ | 7.70 | $ | 0.00 | $ | 10.44 | $ | 6.37 | $ | 0.00 | |||||||
Fourth |
$ | 11.00 | $ | 8.89 | $ | 0.00 | $ | 9.00 | $ | 5.35 | $ | 0.00 | |||||||
Dividends. The Company commenced paying a quarterly cash dividend in January 2005. The Company paid a cash dividend of $0.0545 per share for each of the first and second quarters of 2008. In July 2008, the Company, in order to conserve capital, discontinued the payment of the quarterly cash dividend on the common stock. The Company paid a 10% stock dividend paid on the common stock on October 1, 2008.
The resumption of payment of a cash dividend on common stock is prohibited for the first three years that the Series A Preferred Stock is outstanding, unless all of the Series A Preferred Stock is redeemed. Any resumption of cash dividends on the common stock will also depend largely upon the ability of the Bank, the Company's principal operating business, to declare and pay dividends to the Company. Resumption of dividends on the common stock will also depend upon the Bank's earnings, financial condition, and need for funds, as well as governmental policies and regulations applicable to the Company and the Bank.
Regulations of the Federal Reserve Board and Maryland law place limits on the amount of dividends the Bank may pay to the Company without prior approval. Prior regulatory approval is required to pay dividends which exceed the Bank's net profits for the current year plus its retained net profits for the preceding two calendar years, less required transfers to surplus. Under Maryland law, dividends may only be paid out of retained earnings. State and federal bank regulatory agencies also have authority to prohibit a bank from paying dividends if such payment is deemed to be an unsafe or unsound practice, and the Federal Reserve Board has the same authority over bank holding companies. At December 31, 2008, subject to prior approval by the Maryland Commissioner of Financial Regulation, the Bank could pay dividends to the parent to the extent of its earnings so long as it maintained required capital ratios.
The Federal Reserve Board has established guidelines with respect to the maintenance of appropriate levels of capital by registered bank holding companies. Compliance with such standards, as presently in effect, or as they may be amended from time to time, could possibly limit the amount of dividends that the Company may pay in the future. In 1985, the Federal Reserve Board issued a policy statement on the payment of cash dividends by bank holding companies. In the statement, the Federal Reserve Board expressed its view that a holding company experiencing earnings weaknesses should not pay cash dividends exceeding its net income, or which could only be funded in ways that weaken the holding company's financial health, such as by borrowing. As a depository institution, the deposits of which are insured by the FDIC, the Bank may not pay dividends or distribute any of its capital assets while it remains in default on
45
any assessment due the FDIC. The Bank currently is not in default under any of its obligations to the FDIC. Refer to above discussion on conditions precedent to resuming the payment of the cash common stock dividend.
Issuer Repurchase of Common Stock. No shares of the Company's Common Stock were repurchased by or on behalf of the Company during 2009 or 2008.
Internet Access To Company Documents. The Company provides access to its SEC filings through its web site at www.eaglebankcorp.com by linking to the SEC's web site. After accessing the web site, the filings are available upon selecting "Investor Relations SEC Filings." Reports available include the annual report on Form 10-K, quarterly reports on Form 10-Q, current reports on Form 8-K, and all amendments to those reports as soon as reasonably practicable after the reports are electronically filed or furnished to the SEC.
Securities Authorized for Issuance Under Equity Compensation Plans. The following table sets forth information regarding outstanding options and other rights to purchase or acquire common stock granted under the Company's compensation plans as of December 31, 2009:
Plan category
|
Number of securities to be issued upon exercise of outstanding options, warrants and rights |
Weighted average exercise price of outstanding options, warrants and rights |
Number of securities remaining available for future issuance under equity compensation plans excluding securities reflected in column (a) |
||||||||
|---|---|---|---|---|---|---|---|---|---|---|---|
| |
(a) |
(b) |
(c) |
||||||||
Equity compensation plans approved by security holders(1) |
1,282,994 | $ | 11.46 | 668,715 | (2) | ||||||
Equity compensation plans not approved by security holders |
0 | 0 | 0 | ||||||||
Total |
1,282,994 | $ | 11.46 | 668,715 | |||||||
- (1)
- Consists
of the Company's 2006 Stock Option Plan, 1998 Stock Plan, the 2004 Employee Stock Purchase Plan and the Fidelity Plans. Outstanding options,
warrants and rights includes nominal number of shares subject to awards of SARS and shares subject to unvested performance based restricted stock awards. For additional information, see Note 13
to the Consolidated Financial Statements.
- (2)
- Shares include 530,970 available for issuance under the 2006 Stock Option Plan and 137,745 under the Employee Stock Purchase Plan.
46
Stock Price Performance. The following table compares the cumulative total return on a hypothetical investment of $100 in the Company's common stock on December 31, 2004 through December 31, 2009, with the hypothetical cumulative total return on the NASDAQ Stock Market Index (U.S. Companies) and the NASDAQ Bank Index for the comparable period, including reinvestment of dividends.
Total Return Performance
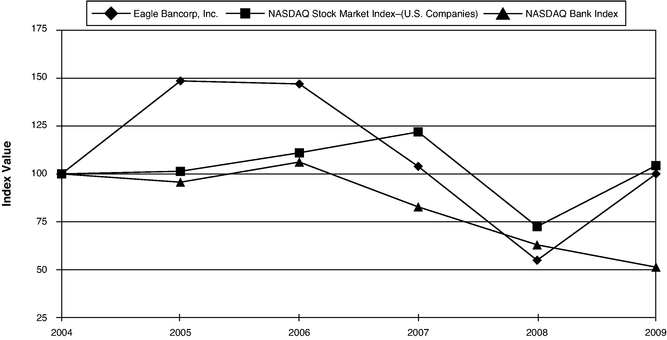
| |
Year Ended December 31, | ||||||||||||||||||
|---|---|---|---|---|---|---|---|---|---|---|---|---|---|---|---|---|---|---|---|
Index
|
2004 | 2005 | 2006 | 2007 | 2008 | 2009 | |||||||||||||
Eagle Bancorp, Inc. |
$ | 100.00 | $ | 148.57 | $ | 147.00 | $ | 103.89 | $ | 54.90 | $ | 99.97 | |||||||
NASDAQ Stock Market Index—(U.S. Companies) |
$ | 100.00 | $ | 101.37 | $ | 111.03 | $ | 121.92 | $ | 72.49 | $ | 104.31 | |||||||
NASDAQ Bank Index |
$ | 100.00 | $ | 95.67 | $ | 106.20 | $ | 82.76 | $ | 62.96 | $ | 51.31 | |||||||
47
DISCLOSURE CONTROLS AND PROCEDURES
The Company's management, under the supervision and with the participation of the Chief Executive Officer and Chief Financial Officer, evaluated, as of the last day of the period covered by this report, the effectiveness of the design and operation of the Company's disclosure controls and procedures, as defined in Rule 13a-15(e) under the Securities Exchange Act of 1934. Based on that evaluation, the Chief Executive Officer and Chief Financial Officer concluded that the Company's disclosure controls and procedures were effective.
48
MANAGEMENT REPORT ON INTERNAL CONTROL OVER FINANCIAL REPORTING
The management of Eagle Bancorp, Inc. (the "Company") is responsible for the preparation, integrity and fair presentation of the financial statements included in this Annual Report. The financial statements have been prepared in conformity with accounting principles generally accepted in the United States of America and reflect management's judgments and estimates concerning the effects of events and transactions that are accounted for or disclosed.
Management is also responsible for establishing and maintaining effective internal control over financial reporting. The Company's internal control over financial reporting includes those policies and procedures that pertain to the Company's ability to record, process, summarize and report reliable financial data. The internal control system contains monitoring mechanisms, and appropriate actions taken to correct identified deficiencies. Management believes that internal controls over financial reporting, which are subject to scrutiny by management and the Company's internal auditors, support the integrity and reliability of the financial statements. Management recognizes that there are inherent limitations in the effectiveness of any internal control system, including the possibility of human error and the circumvention or overriding of internal controls. Accordingly, even effective internal control over financial reporting can provide only reasonable assurance with respect to financial statement preparation. In addition, because of changes in conditions and circumstances, the effectiveness of internal control over financial reporting may vary over time. The Audit Committee of the Board of Directors (the "Committee"), is comprised entirely of outside directors who are independent of management. The Committee is responsible for the appointment and compensation of the independent auditors and makes decisions regarding the appointment or removal of members of the internal audit function. The Committee meets periodically with management, the independent auditors, and the internal auditors to ensure that they are carrying out their responsibilities. The Committee is also responsible for performing an oversight role by reviewing and monitoring the financial, accounting, and auditing procedures of the Company in addition to reviewing the Company's financial reports. The independent auditors and the internal auditors have full and unlimited access to the Audit Committee, with or without the presence of management, to discuss the adequacy of internal control over financial reporting, and any other matters which they believe should be brought to the attention of the Audit Committee.
Management assessed the Company's system of internal control over financial reporting as of December 31, 2009. This assessment was conducted based on the Committee of Sponsoring Organizations ("COSO") of the Treadway Commission "Internal Control—Integrated Framework." Based on this assessment, management believes that the Company maintained effective internal control over financial reporting as of December 31, 2009. Management's assessment concluded that there were no material weaknesses within the Company's internal control structure.
There were no changes in the Company's internal control over financial reporting (as defined in Rule 13a-15 under the Securities Act of 1934) during the quarter ended December 31, 2009 that have materially affected, or are reasonably likely to materially affect, the Company's internal control over financial reporting.
The 2009 financial statements have been audited by the independent registered public accounting firm of Stegman & Company ("Stegman"). Personnel from Stegman were given unrestricted access to all financial records and related data, including minutes of all meetings of the Board of Directors and committees thereof. Management believes that all representations made to the independent auditors were valid and appropriate. The resulting report from Stegman accompanies the financial statements. Stegman has also issued a report on the effectiveness of internal control over financial reporting. That report has also been made a part of this Annual Report.
| |
|
|
|
|||
|---|---|---|---|---|---|---|
| /s/ RONALD D. PAUL Chairman, President and Chief Executive Officer of the Company and Chief Executive Officer of the Bank |
/s/ MICHAEL T. FLYNN Executive Vice President and Chief Operating Officer of the Company and Executive Vice President of the Bank |
/s/ SUSAN G. RIEL Senior Executive Vice President and Chief Operating Officer of the Bank |
/s/ JAMES H. LANGMEAD Executive Vice President and Chief Financial Officer of the Company and the Bank |
49
REPORT OF STEGMAN & COMPANY
INDEPENDENT REGISTERED PUBLIC ACCOUNTING FIRM
To
the Board of Directors and
Stockholders of Eagle Bancorp, Inc.
We have audited the accompanying consolidated balance sheets of Eagle Bancorp, Inc. (the "Company") as of December 31, 2009 and 2008, and the consolidated statements of operations, changes in stockholders' equity and cash flows for each of the years in the three-year period ended December 31, 2009. We also have audited the Company's internal control over financial reporting as of December 31, 2009, based on criteria established in Internal Control—Integrated Framework issued by the Committee of Sponsoring Organizations of the Treadway Commission (COSO). The Company's management is responsible for these financial statements, for maintaining effective internal control over financial reporting, and for its assessment of the effectiveness of internal control over financial reporting, included in the accompanying Management's Report on Internal Control over Financial Reporting. Our responsibility is to express an opinion on these consolidated financial statements and an opinion on the Company's internal control over financial reporting based on our audits.
We conducted our audits in accordance with the standards of the Public Company Accounting Oversight Board (United States). Those standards require that we plan and perform the audits to obtain reasonable assurance about whether the financial statements are free of material misstatement and whether effective internal control over financial reporting was maintained in all material respects. Our audits of the consolidated financial statements included examining, on a test basis, evidence supporting the amounts and disclosures in the financial statements, assessing the accounting principles used and significant estimates made by management, and evaluating the overall financial statement presentation. Our audit of internal control over financial reporting included obtaining an understanding of internal control over financial reporting, assessing the risk that a material weakness exists, and testing and evaluating the design and operating effectiveness of internal control based on the assessed risk. Our audits also included performing such other procedures as we considered necessary in the circumstances. We believe that our audits provide a reasonable basis for our opinions.
A company's internal control over financial reporting is a process designed to provide reasonable assurance regarding the reliability of financial reporting and the preparation of financial statements for external purposes in accordance with generally accepted accounting principles. A company's internal control over financial reporting includes those policies and procedures that (1) pertain to the maintenance of records that, in reasonable detail, accurately and fairly reflect the transactions and dispositions of the assets of the company; (2) provide reasonable assurance that transactions are recorded as necessary to permit preparation of financial statements in accordance with generally accepted accounting principles, and that receipts and expenditures of the company are being made only in accordance with authorizations of management and directors of the company; and (3) provide reasonable assurance regarding prevention or timely detection of unauthorized acquisition, use, or disposition of the company's assets that could have a material effect on the financial statements.
Because of its inherent limitations, internal control over financial reporting may not prevent or detect misstatements. Also, projections of any evaluation of effectiveness to future periods are subject to the risk that controls may become inadequate because of changes in conditions, or that the degree of compliance with the policies or procedures may deteriorate.
50
In our opinion, the consolidated financial statements referred to above present fairly, in all material respects, the financial position of Eagle Bancorp, Inc. as of December 31, 2009 and 2008, and the results of its operations and its cash flows for each of the years in the three-year period ended December 31, 2009 in conformity with accounting principles generally accepted in the United States of America. Also in our opinion, Eagle Bancorp, Inc. maintained, in all material respects, effective internal control over financial reporting as of December 31, 2009, based on criteria established in Internal Control—Integrated Framework issued by the Committee of Sponsoring Organizations of the Treadway Commission (COSO).
/s/ Stegman and Company
Baltimore,
Maryland
March 12, 2010
51
EAGLE BANCORP, INC.
Consolidated Balance Sheets
(dollars in thousands, except per share data)
| |
December 31, 2009 | December 31, 2008 | |||||||
|---|---|---|---|---|---|---|---|---|---|
Assets |
|||||||||
Cash and due from banks |
$ | 21,955 | $ | 27,157 | |||||
Federal funds sold |
88,248 | 191 | |||||||
Interest bearing deposits with banks and other short-term investments |
7,484 | 2,489 | |||||||
Investment securities available for sale, at fair value |
235,227 | 159,480 | |||||||
Federal Reserve and Federal Home Loan Bank stock |
10,417 | 9,599 | |||||||
Loans held for sale |
1,550 | 2,718 | |||||||
Loans |
1,399,311 | 1,265,640 | |||||||
Less allowance for credit losses |
(20,619 | ) | (18,403 | ) | |||||
Loans, net |
1,378,692 | 1,247,237 | |||||||
Premises and equipment, net |
9,253 | 9,666 | |||||||
Deferred income taxes |
12,455 | 11,106 | |||||||
Bank owned life insurance |
12,912 | 12,450 | |||||||
Intangible assets, net |
4,379 | 2,533 | |||||||
Other real estate owned |
5,106 | 909 | |||||||
Other assets |
17,826 | 11,292 | |||||||
Total Assets |
$ | 1,805,504 | $ | 1,496,827 | |||||
Liabilities and Stockholders' Equity Liabilities |
|||||||||
Deposits: |
|||||||||
Noninterest bearing demand |
$ | 307,959 | $ | 223,580 | |||||
Interest bearing transaction |
59,720 | 54,801 | |||||||
Savings and money market |
582,854 | 271,791 | |||||||
Time, $100,000 or more |
296,199 | 249,516 | |||||||
Other time |
213,542 | 329,692 | |||||||
Total deposits |
1,460,274 | 1,129,380 | |||||||
Customer repurchase agreements and federal funds purchased |
90,790 | 98,802 | |||||||
Other short-term borrowings |
10,000 | 55,000 | |||||||
Long-term borrowings |
49,300 | 62,150 | |||||||
Other liabilities |
6,819 | 9,124 | |||||||
Total liabilities |
1,617,183 | 1,354,456 | |||||||
Stockholders' Equity |
|||||||||
Preferred stock, par value $.01 per share, shares authorized 1,000,000, Series A, $1,000 per share liquidation preference, shares issued and outstanding 23,235 and 38,235, respectively, discount of $570 and $1,892, respectively, net |
22,612 | 36,312 | |||||||
Common stock, par value $.01per share; shares authorized 50,000,000, shares issued and outstanding 19,534,226 and 12,714,355, respectively |
195 | 127 | |||||||
Warrants |
946 | 1,892 | |||||||
Additional paid in capital |
129,211 | 76,822 | |||||||
Retained earnings |
33,024 | 24,866 | |||||||
Accumulated other comprehensive income |
2,333 | 2,352 | |||||||
Total stockholders' equity |
188,321 | 142,371 | |||||||
Total Liabilities and Stockholders' Equity |
$ | 1,805,504 | $ | 1,496,827 | |||||
See notes to consolidated financial statements.
52
EAGLE BANCORP, INC.
Consolidated Statements of Operations
Years Ended December 31,
(dollars in thousands, except per share data)
| |
2009 | 2008 | 2007 | ||||||||||
|---|---|---|---|---|---|---|---|---|---|---|---|---|---|
Interest Income |
|||||||||||||
Interest and fees on loans |
$ | 77,004 | $ | 59,901 | $ | 51,931 | |||||||
Taxable interest and dividends on investment securities |
7,138 | 5,459 | 4,177 | ||||||||||
Interest on balances with other banks and short-term investments |
94 | 98 | 293 | ||||||||||
Interest on federal funds sold |
102 | 199 | 676 | ||||||||||
Total interest income |
84,338 | 65,657 | 57,077 | ||||||||||
Interest Expense |
|||||||||||||
Interest on deposits |
20,956 | 19,543 | 19,810 | ||||||||||
Interest on customer repurchase agreements and federal funds purchased |
957 | 1,406 | 1,887 | ||||||||||
Interest on short-term borrowings |
611 | 546 | 611 | ||||||||||
Interest on long-term borrowings |
2,285 | 2,181 | 1,421 | ||||||||||
Total interest expense |
24,809 | 23,676 | 23,729 | ||||||||||
Net Interest Income |
59,529 | 41,981 | 33,348 | ||||||||||
Provision for Credit Losses |
7,669 | 3,979 | 1,643 | ||||||||||
Net Interest Income After Provision For Credit Losses |
51,860 | 38,002 | 31,705 | ||||||||||
Noninterest Income |
|||||||||||||
Service charges on deposits |
2,898 | 2,059 | 1,249 | ||||||||||
Gain on sale of loans |
1,054 | 426 | 1,036 | ||||||||||
Gain on sale of investment securities |
1,538 | 2 | 6 | ||||||||||
Increase in the cash surrender value of bank owned life insurance |
463 | 466 | 455 | ||||||||||
Income from subordinated financing |
— | — | 1,252 | ||||||||||
Other income |
1,344 | 1,413 | 1,188 | ||||||||||
Total noninterest income |
7,297 | 4,366 | 5,186 | ||||||||||
Noninterest Expense |
|||||||||||||
Salaries and employee benefits |
20,889 | 16,728 | 14,167 | ||||||||||
Premises and equipment expenses |
7,343 | 5,424 | 4,829 | ||||||||||
Marketing and advertising |
1,099 | 1,054 | 552 | ||||||||||
Data processing |
2,356 | 1,622 | 1,231 | ||||||||||
Legal, accounting and professional fees |
2,731 | 1,054 | 613 | ||||||||||
FDIC insurance |
2,743 | 642 | 449 | ||||||||||
Other expenses |
5,612 | 4,293 | 3,080 | ||||||||||
Total noninterest expense |
42,773 | 30,817 | 24,921 | ||||||||||
Income Before Income Tax Expense |
16,384 | 11,551 | 11,970 | ||||||||||
Income Tax Expense |
5,965 | 4,123 | 4,269 | ||||||||||
Net Income |
10,419 | 7,428 | 7,701 | ||||||||||
Preferred Stock Dividends and Discount Accretion |
2,307 | 177 | — | ||||||||||
Net Income Available to Common Shareholders |
$ | 8,112 | $ | 7,251 | $ | 7,701 | |||||||
Earnings Per Common Share |
|||||||||||||
Basic |
$ | 0.55 | $ | 0.63 | $ | 0.73 | |||||||
Diluted |
$ | 0.55 | $ | 0.62 | $ | 0.71 | |||||||
Dividends Declared Per Common Share |
$ | — | $ | 0.11 | $ | 0.22 | |||||||
See notes to consolidated financial statements.
53
EAGLE BANCORP, INC.
Consolidated Statements of Changes in Stockholders' Equity
For The Years Ended December 31, 2009, 2008 and 2007
(dollars in thousands, except share and per share data)
| |
Preferred Stock |
Warrants | Common Stock |
Additional Paid in Capital |
Retained Earnings |
Accumulated Other Comprehensive Income (Loss) |
Total Stockholders' Equity |
|||||||||||||||||
|---|---|---|---|---|---|---|---|---|---|---|---|---|---|---|---|---|---|---|---|---|---|---|---|---|
Balance January 1, 2007 |
$ | — | $ | — | $ | 95 | $ | 50,278 | $ | 22,796 | $ | (253 | ) | $ | 72,916 | |||||||||
Comprehensive Income |
||||||||||||||||||||||||
Net Income |
7,701 | 7,701 | ||||||||||||||||||||||
Other comprehensive income: |
||||||||||||||||||||||||
Unrealized gain on securities available for sale (net of taxes) |
841 | 841 | ||||||||||||||||||||||
Less: reclassification adjustment for gains net of taxes of $2 included in net income |
(4 | ) | (4 | ) | ||||||||||||||||||||
Total Comprehensive Income |
837 | 8,538 | ||||||||||||||||||||||
Cash Dividends ($0.22 per share) |
(2,302 | ) | (2,302 | ) | ||||||||||||||||||||
Stock-based compensation |
224 | 224 | ||||||||||||||||||||||
Shares issued under dividend reinvestment plan—47,000 shares |
0 | 689 | 689 | |||||||||||||||||||||
Exercise of options for 196,251 shares of common stock |
2 | 1,080 | 1,082 | |||||||||||||||||||||
Tax benefit on non-qualified options exercise |
19 | 19 | ||||||||||||||||||||||
Balance December 31, 2007 |
— | — | 97 | 52,290 | 28,195 | 584 | 81,166 | |||||||||||||||||
Comprehensive Income |
||||||||||||||||||||||||
Net Income |
7,428 | 7,428 | ||||||||||||||||||||||
Other comprehensive income: |
||||||||||||||||||||||||
Unrealized gain on securities available for sale (net of taxes) |
1,769 | 1,769 | ||||||||||||||||||||||
Less: reclassification adjustment for gains net of taxes of $1 included in net income |
(1 | ) | (1 | ) | ||||||||||||||||||||
Total Comprehensive Income |
1,768 | 9,196 | ||||||||||||||||||||||
Cash Dividends ($0.11 per share) |
(1,178 | ) | (1,178 | ) | ||||||||||||||||||||
Stock-based compensation |
311 | 311 | ||||||||||||||||||||||
Shares issued under dividend reinvestment plan—76,246 shares |
1 | 806 | 807 | |||||||||||||||||||||
Exercise of options for 126,827 shares of common stock |
1 | 441 | 442 | |||||||||||||||||||||
Tax benefit on non-qualified options exercise |
195 | 195 | ||||||||||||||||||||||
Shares issued to effect merger with Fidelity 1,638,031 shares, net of issuance costs of $96 |
16 | 13,037 | 13,053 | |||||||||||||||||||||
Net tangible asset value of Fidelity assets acquired |
181 | 181 | ||||||||||||||||||||||
Preferred shares and warrants issued, net of issuance costs |
36,312 | 1,892 | 38,204 | |||||||||||||||||||||
10% common stock dividend |
12 | 9,567 | (9,579 | ) | — | |||||||||||||||||||
Cash paid in lieu of fractional shares |
(6 | ) | (6 | ) | ||||||||||||||||||||
Balance December 31, 2008 |
36,312 | 1,892 | 127 | 76,822 | 24,866 | 2,352 | 142,371 | |||||||||||||||||
Comprehensive Income |
||||||||||||||||||||||||
Net Income |
10,419 | 10,419 | ||||||||||||||||||||||
Other comprehensive income: |
||||||||||||||||||||||||
Unrealized gain on securities available for sale (net of taxes) |
966 | 966 | ||||||||||||||||||||||
Less: reclassification adjustment for gains net of taxes of $553 included in net income |
(985 | ) | (985 | ) | ||||||||||||||||||||
Total Comprehensive Income |
(19 | ) | 10,400 | |||||||||||||||||||||
Stock-based compensation |
578 | 578 | ||||||||||||||||||||||
Exercise of options for 38,646 shares of common stock |
1 | 122 | 123 | |||||||||||||||||||||
Tax benefit on non-qualified options exercise |
98 | 98 | ||||||||||||||||||||||
Shares issued in public offering—6,731,640 shares, net of issuance costs of $3,541 |
67 | 51,591 | 51,658 | |||||||||||||||||||||
Preferred stock dividends |
(1,885 | ) | (1,885 | ) | ||||||||||||||||||||
Preferred stock: |
— | |||||||||||||||||||||||
Redemption of Series A Preferred Stock (15,000 shares) |
(15,000 | ) | (15,000 | ) | ||||||||||||||||||||
Warrants reduced by 385,434 warrants |
946 | (946 | ) | — | ||||||||||||||||||||
Issuance costs |
(22 | ) | (22 | ) | ||||||||||||||||||||
Discount accretion |
376 | (376 | ) | — | ||||||||||||||||||||
Balance December 31, 2009 |
$ | 22,612 | $ | 946 | $ | 195 | $ | 129,211 | $ | 33,024 | $ | 2,333 | $ | 188,321 | ||||||||||
See notes to consolidated financial statements.
54
EAGLE BANCORP, INC.
Consolidated Statements of Cash Flows
Years Ended December 31,
(dollars in thousands)
| |
2009 | 2008 | 2007 | |||||||||||
|---|---|---|---|---|---|---|---|---|---|---|---|---|---|---|
Cash Flows From Operating Activities: |
||||||||||||||
Net income |
$ | 10,419 | $ | 7,428 | $ | 7,701 | ||||||||
Adjustments to reconcile net income to net cash provided by (used in) operating activities: |
||||||||||||||
Decrease in deferred income taxes |
(1,310 | ) | (1,643 | ) | (868 | ) | ||||||||
Provision for credit losses |
7,669 | 3,979 | 1,643 | |||||||||||
Depreciation and amortization |
2,084 | 1,613 | 1,347 | |||||||||||
Gains on sale of loans |
(1,054 | ) | (426 | ) | (1,036 | ) | ||||||||
Origination of loans held for sale |
(88,547 | ) | (29,071 | ) | (52,455 | ) | ||||||||
Proceeds from sale of loans held for sale |
90,769 | 28,956 | 53,471 | |||||||||||
Gain on sale of investment securities |
(1,538 | ) | (2 | ) | (6 | ) | ||||||||
Net increase in surrender value of Bank-owned life insurance |
(463 | ) | (466 | ) | (455 | ) | ||||||||
Stock-based compensation expense |
578 | 311 | 224 | |||||||||||
Excess tax benefit from stock-based compensation |
(98 | ) | (195 | ) | (19 | ) | ||||||||
(Increase) decrease in other assets |
(8,361 | ) | (19,579 | ) | 119 | |||||||||
(Decrease) increase in other liabilities |
(2,207 | ) | 2,163 | 1,953 | ||||||||||
Net cash provided by (used in) by operating activities |
7,941 | (6,932 | ) | 11,619 | ||||||||||
Cash Flows From Investing Activities: |
||||||||||||||
(Increase) decrease in interest bearing deposits—other banks |
(4,995 | ) | 2,001 | 365 | ||||||||||
Purchases of available for sale investment securities |
(179,555 | ) | (63,056 | ) | (32,655 | ) | ||||||||
Proceeds from maturities of available for sale securities |
52,210 | 20,399 | 9,784 | |||||||||||
Proceeds from sale / call of available for sale securities |
53,136 | 64,830 | 29,326 | |||||||||||
Purchases of federal reserve and federal home loan bank stock |
(818 | ) | (4,729 | ) | (1,041 | ) | ||||||||
Net increase in loans |
(144,966 | ) | (191,577 | ) | (91,882 | ) | ||||||||
Net cash received in acquisition |
— | 10,885 | — | |||||||||||
Proceeds from the sale of other real estate owned |
1,547 | — | — | |||||||||||
Bank premises and equipment acquired |
(1,671 | ) | (1,422 | ) | (1,094 | ) | ||||||||
Net cash used in investing activities |
(225,112 | ) | (162,669 | ) | (87,197 | ) | ||||||||
Cash Flows From Financing Activities: |
||||||||||||||
Increase in deposits |
330,894 | 111,708 | 2,421 | |||||||||||
(Decrease) increase in customer repurchase agreements and fed funds purchased |
(8,012 | ) | (29,878 | ) | 38,344 | |||||||||
(Decrease) increase in other short-term borrowings |
(45,000 | ) | 28,847 | 14,000 | ||||||||||
(Decrease) increase in long-term borrowings |
(12,850 | ) | 32,150 | 8,000 | ||||||||||
Issuance of preferred stock and warrants |
— | 38,204 | — | |||||||||||
Issuance of common stock |
51,781 | 1,249 | 1,771 | |||||||||||
Excess tax benefit from stock-based compensation |
98 | 195 | 19 | |||||||||||
Redemption of Series A Preferred Stock |
(15,000 | ) | — | — | ||||||||||
Payment of dividends on preferred stock |
(1,885 | ) | — | — | ||||||||||
Payment of dividends and payment in lieu of fractional shares |
— | (1,178 | ) | (2,302 | ) | |||||||||
Net cash provided by financing activities |
300,026 | 181,297 | 62,253 | |||||||||||
Net Increase (Decrease) in Cash |
82,855 |
11,696 |
(13,325 |
) |
||||||||||
Cash and Cash Equivalents at Beginning of Year |
27,348 | 15,652 | 28,977 | |||||||||||
Cash and Cash Equivalents at End of Year |
$ | 110,203 | $ | 27,348 | $ | 15,652 | ||||||||
Supplemental Cash Flows Information: |
||||||||||||||
Interest paid |
$ | 25,898 | $ | 22,380 | $ | 23,640 | ||||||||
Income taxes paid |
$ | 7,575 | $ | 6,088 | $ | 4,052 | ||||||||
Stock issued for acquisition of Fidelity |
$ | — | $ | 13,330 | $ | — | ||||||||
Non-Cash Financing Activities |
||||||||||||||
Reclassification of borrowings from long-term to short-term |
$ | — | $ | — | $ | 22,000 | ||||||||
Non-Cash Investing Activities |
||||||||||||||
Transfers from loans to other real estate owned |
$ | 7,178 | $ | 909 | $ | — | ||||||||
See notes to consolidated financial statements.
55
Eagle Bancorp, Inc.
Notes to Consolidated Financial Statements
for the Years Ended December 31, 2009, 2008 and 2007:
Note 1—Summary of Significant Accounting Policies
The Consolidated Financial Statements include the accounts of Eagle Bancorp, Inc. (the "Company") and its subsidiaries, EagleBank (the "Bank"), Eagle Commercial Ventures LLC ("ECV") and Bethesda Leasing, LLC (which holds title to and manages Other Real Estate Owned ("OREO") assets) with all significant intercompany transactions eliminated. The investment in subsidiaries is recorded on the Company's books (Parent Only) on the basis of its equity in the net assets of the subsidiary. The accounting and reporting policies of the Company conform to accounting principles generally accepted in the United States of America and to general practices in the banking industry. Certain reclassifications have been made to amounts previously reported to conform to the classification made in 2009. The following is a summary of the more significant accounting policies.
Management has evaluated subsequent events for potential recognition and/or disclosure and has determined that no material subsequent events have occurred since December 31, 2009 that required recognition or disclosure in these financial statements.
Nature of Operations
The Company, through EagleBank, its bank subsidiary (the "Bank"), conducts a full service community banking business, primarily in Montgomery County, Maryland, Washington, D.C. and Fairfax County in Northern Virginia. On August 31, 2008, the Company completed the acquisition of Fidelity & Trust Financial Corporation ("Fidelity") and Fidelity & Trust Bank ("F&T Bank"). Refer to Note 18 for a discussion of this transaction. The primary financial services offered by the Bank include real estate, commercial and consumer lending, as well as traditional deposit and repurchase agreement products. The Bank is also active in the origination and sale of residential mortgage loans and the origination of small business loans. The guaranteed portion of small business loans is typically sold through the Small Business Administration, in a transaction apart from the loan's origination. The Bank offers its products and services through fourteen banking offices and various electronic capabilities, including remote deposit services. Eagle Commercial Ventures, LLC ("ECV"), a direct subsidiary of the Company provides subordinated financing for the acquisition, development and construction of real estate projects, where the primary financing is provided by the Bank. Prior to the formation of ECV, the Company engaged directly in occasional subordinated financing transactions, which involve higher levels of risk, together with commensurate returns. Refer to—Higher Risk Lending—Revenue Recognition below.
Use of Estimates
The preparation of financial statements in conformity with accounting principles generally accepted in the United States requires management to make estimates and assumptions that affect the reported amounts of assets and liabilities and disclosure of contingent assets and liabilities at the date of the financial statements and the reported amounts of revenues and expenses during the reported period. Actual results could differ from those estimates.
Cash Flows
For purposes of reporting cash flows, cash and cash equivalents include cash and due from banks, and federal funds sold.
56
Eagle Bancorp, Inc.
Notes to Consolidated Financial Statements
for the Years Ended December 31, 2009, 2008 and 2007: (Continued)
Note 1—Summary of Significant Accounting Policies (Continued)
Loans Held for Sale
The Company engages in sales of residential mortgage loans and the guaranteed portion of Small Business Administration ("SBA") loans originated by the Bank. Loans held for sale are carried at the lower of aggregate cost or fair value. Fair value is derived from secondary market quotations for similar instruments. Gains and losses on sales of these loans are recorded as a component of noninterest income in the Consolidated Statements of Operations.
The Company's current practice is to sell residential mortgage loans on a servicing released basis, and, therefore, it has no intangible asset recorded for the value of such servicing as of December 31, 2009 or 2008. The sale of the guaranteed portion of SBA loans on a servicing retained basis gives rise to an Excess Servicing Asset, which is computed on a loan by loan basis and which unamortized amount is included in other assets. This Excess Servicing Asset is being amortized on a straight line basis (with adjustment for prepayments) as an offset of servicing fees collected and is included in other noninterest income. Also, please refer to the discussion under the caption, "Intangible Assets" within Management's Discussion and Analysis of Financial Condition and Results of Operation for further information on excess servicing rights.
The Company enters into commitments to originate residential mortgage loans whereby the interest rate on the loan is determined prior to funding (i.e. rate lock commitments). Such rate lock commitments on mortgage loans to be sold in the secondary market are considered to be derivatives. The period of time between issuance of a loan commitment and closing and sale of the loan generally ranges from 15 to 60 days. The Company protects itself from changes in interest rates through the use of best efforts forward delivery commitments, whereby the Company commits to sell a loan at the time the borrower commits to an interest rate with the intent that the buyer has assumed interest rate risk on the loan. As a result, the Company is not exposed to losses nor will it realize gains related to its rate lock commitments due to changes in interest rates.
The market values of rate lock commitments and best efforts contracts are not readily ascertainable with precision because rate lock commitments and best efforts contracts are not actively traded. Because of the high correlation between rate lock commitments and best efforts contracts, no gain or loss occurs on the rate lock commitments.
Investment Securities
The Company has no securities classified as trading, nor are any investment securities classified as held to maturity. Marketable equity securities and debt securities not classified as held to maturity or trading are classified as available for sale. Securities available for sale are acquired as part of the Company's asset/liability management strategy and may be sold in response to changes in interest rates, loan demand, changes in prepayment risk and other factors. Securities available for sale are carried at fair value, with unrealized gains or losses being reported as accumulated other comprehensive income, a separate component of stockholders' equity, net of deferred tax. Realized gains and losses, using the specific identification method, are included as a separate component of noninterest income. Premiums and discounts on investment securities are amortized/accreted to the earlier of call or maturity based on expected lives, which lives are adjusted for securities based on prepayments and call optionality. Declines in the fair value of individual available for sale securities below their cost that are other-than-temporary in nature result in write-downs of the individual securities to their fair value. Factors affecting the determination of whether other-than-temporary impairment has occurred include a downgrading of the
57
Eagle Bancorp, Inc.
Notes to Consolidated Financial Statements
for the Years Ended December 31, 2009, 2008 and 2007: (Continued)
Note 1—Summary of Significant Accounting Policies (Continued)
security by a rating agency, a significant deterioration in the financial condition of the issuer, or a change in management's intent and ability to hold a security for a period of time sufficient to allow for any anticipated recovery in fair value. Management systematically evaluates investment securities for other-than-temporary declines in fair value on a quarterly basis. This analysis requires management to consider various factors, which include (1) duration and magnitude of the decline in value, (2) the financial condition of the issuer or issuers and (3) structure of the security.
An impairment loss is recognized in earnings only when (1) the Company intends to sell the debt security; (2) it is more likely than not that the Company will have to sell the security before recovery of its amortized cost basis or (3) the Company does not expect to recover the entire amortized cost basis of the security, the entire impairment loss must be recognized in earnings. In all other situations, only the portion of the impairment loss representing the credit loss that must be recognized in earnings, with the remaining portion being recognized in stockholders' equity as a comprehensive income, net of deferred taxes.
Loans
Loans are stated at the principal amount outstanding, net of unamortized deferred costs and fees. Interest income on loans is accrued at the contractual rate on the principal amount outstanding. It is the Company's policy to discontinue the accrual of interest when circumstances indicate that collection is doubtful. Deferred fees and costs on loans originated through October 2005 are being amortized on the straight line method over the term of the loan. Deferred fees and costs on loans originated subsequent to October 2005 are being amortized on the interest method over the term of the loan. The difference between the straight line method and the interest method was considered immaterial.
Management considers loans impaired when, based on current information, it is probable that the Company will not collect all principal and interest payments according to contractual terms. Loans are evaluated for impairment in accordance with the Company's portfolio monitoring and ongoing risk assessment procedures. Management considers the financial condition of the borrower, cash flow of the borrower, payment status of the loan, and the value of the collateral, if any, securing the loan. Generally, impaired loans do not include large groups of smaller balance homogeneous loans such as residential real estate and consumer type loans which loans are evaluated collectively for impairment and are generally placed on non-accrual when the loan becomes 90 days past due as to principal or interest. Loans specifically reviewed for impairment are not considered impaired during periods of "minimal delay" in payment (ninety days or less) provided eventual collection of all amounts due is expected. The impairment of a loan is measured based on the present value of expected future cash flows discounted at the loan's effective interest rate, or the fair value of the collateral if repayment is expected to be provided solely by the collateral. In appropriate circumstances, interest income on impaired loans may be recognized on the cash basis.
Higher Risk Lending—Revenue Recognition
The Company has occasionally made higher risk acquisition, development, and construction (ADC) loans that entail higher risks than ADC loans made following normal underwriting practices ("higher risk loan transactions"). These higher risk loan transactions are currently made through the Company's subsidiary, ECV. This activity is limited as to individual transaction amount and total exposure amounts based on capital levels and is carefully monitored. The loans are carried on the balance sheet at amounts outstanding and meet the loan classification requirements of the Accounting Standard Executive
58
Eagle Bancorp, Inc.
Notes to Consolidated Financial Statements
for the Years Ended December 31, 2009, 2008 and 2007: (Continued)
Note 1—Summary of Significant Accounting Policies (Continued)
Committee ("AcSEC") guidance reprinted from the CPA Letter, Special Supplement, dated February 10, 1986 (also referred to as Exhibit 1 to AcSEC Practice Bulletin No. 1). Additional interest earned on these higher risk loan transactions (as defined in the individual loan agreements) is recognized as realized under the provisions contained in AcSEC's guidance reprinted from the CPA Letter, Special Supplement, dated February 10, 1986 (also referred to as Exhibit 1 to AcSEC Practice Bulletin No.1) and Staff Accounting Bulletin No. 101 (Revenue Recognition in Financial Statements). The additional interest is included as a component of noninterest income. ECV recorded no additional interest on higher risk transactions during 2009 and 2008 (although normal interest income was recorded) and had one higher risk lending transaction outstanding as of December 31, 2009 and December 31, 2008, amounting to $1.6 million and $1.8 million, respectively.
Allowance for Credit Losses
The allowance for credit losses represents an amount which, in management's judgment, is adequate to absorb probable losses on existing loans and other extensions of credit that may become uncollectible. The adequacy of the allowance for credit losses is determined through careful and continuous review and evaluation of the loan portfolio and involves the balancing of a number of factors to establish a prudent level of allowance. Among the factors considered in evaluating the adequacy of the allowance for credit losses are lending risks associated with growth and entry into new markets, loss allocations for specific credits, the level of the allowance to nonperforming loans, historical loss experience, economic conditions, portfolio trends and credit concentrations, changes in the size and character of the loan portfolio, and management's judgment with respect to current and expected economic conditions and their impact on the existing loan portfolio. Allowances for impaired loans are generally determined based on collateral values. Loans or any portion thereof deemed uncollectible are charged against the allowance, while recoveries are credited to the allowance. Management adjusts the level of the allowance through the provision for credit losses, which is recorded as a current period operating expense. The allowance for credit losses consists of allocated and unallocated components.
The components of the allowance for credit losses represent an estimation done pursuant to Accounting Standards Codification ("ASC") Topic 450, "Contingencies," or ASC Topic 310, "Receivables." Specific allowances are established in cases where management has identified significant conditions or circumstances related to a specific credit that management believes indicate the probability that a loss may be incurred. For potential problem credits for which specific allowance amounts have not been determined, the Company establishes allowances according to the application of credit risk factors. These factors are set by management and approved by the appropriate Board Committee to reflect its assessment of the relative level of risk inherent in each risk grade. A third component of the allowance computation, termed a nonspecific or environmental factors allowance, is based upon management's evaluation of various environmental conditions that are not directly measured in the determination of either the specific allowance or formula allowance. Such conditions include general economic and business conditions affecting key lending areas, credit quality trends (including trends in delinquencies and nonperforming loans expected to result from existing conditions), loan volumes and concentrations, specific industry conditions within portfolio categories, recent loss experience in particular loan categories, duration of the current business cycle, bank regulatory examination results, findings of outside review consultants, and management's judgment with respect to various other conditions including credit administration and management and the quality of risk identification systems. Executive management reviews these environmental conditions quarterly, and documents the rationale for all changes.
59
Eagle Bancorp, Inc.
Notes to Consolidated Financial Statements
for the Years Ended December 31, 2009, 2008 and 2007: (Continued)
Note 1—Summary of Significant Accounting Policies (Continued)
Management believes that the allowance for credit losses is adequate; however, determination of the allowance is inherently subjective and requires significant estimates. While management uses available information to recognize losses on loans, future additions to the allowance may be necessary based on changes in economic conditions. Evaluation of the potential effects of these factors on estimated losses involves a high degree of uncertainty, including the strength and timing of economic cycles and concerns over the effects of a prolonged economic downturn in the current cycle. In addition, various regulatory agencies, as an integral part of their examination process, and independent consultants engaged by the Bank periodically review the Bank's loan portfolio and allowance for credit losses. Such review may result in recognition of additions to the allowance based on their judgments of information available to them at the time of their examination.
Premises and Equipment
Premises and equipment are stated at cost less accumulated depreciation and amortization computed using the straight-line method for financial reporting purposes. Premises and equipment are depreciated over the useful lives of the assets, which generally range from seven years for furniture, fixtures and equipment, three to five years for computer software and hardware, and ten to forty years for buildings and building improvements. Leasehold improvements are amortized over the terms of the respective leases, which may include renewal options where management has the positive intent to exercise such options, or the estimated useful lives of the improvements, whichever is shorter. The costs of major renewals and betterments are capitalized, while the costs of ordinary maintenance and repairs are expensed as incurred. These costs are included as a component of premises and equipment expenses on the Consolidated Statements of Operations.
Other Real Estate Owned (OREO)
Assets acquired through loan foreclosure are held for sale and are initially recorded at the lower of cost or fair value less estimated selling costs when acquired, establishing a new cost basis. The new basis is supported by recent appraisals. Costs after acquisition are generally expensed. If the fair value of the asset declines, a write-down is recorded through expense. The valuation of foreclosed assets is subjective in nature and may be adjusted in the future because of changes in economic conditions or review by regulatory examiners.
Goodwill and Other Intangible Assets
Goodwill and other intangible assets are subject to impairment testing at least annually, or when events or changes in circumstances indicate the assets might be impaired. Intangible assets (other than goodwill) are amortized to expense using accelerated or straight-line methods over their respective estimated useful lives. The Company's testing of potential goodwill impairment (which is required annually) at December 31, 2009, resulted in no impairment being recorded.
Customer Repurchase Agreements
The Company enters into agreements under which it sells securities subject to an obligation to repurchase the same securities. Under these arrangements, the Company may transfer legal control over the assets but still retain effective control through an agreement that both entitles and obligates the Company to repurchase the assets. As a result, securities sold under agreements to repurchase are
60
Eagle Bancorp, Inc.
Notes to Consolidated Financial Statements
for the Years Ended December 31, 2009, 2008 and 2007: (Continued)
Note 1—Summary of Significant Accounting Policies (Continued)
accounted for as collateralized financing arrangements and not as a sale and subsequent repurchase of securities. The agreements are entered into primarily as accommodations for large commercial deposit customers. The obligation to repurchase the securities is reflected as a liability in the Company's Consolidated Statement of Condition, while the securities underlying the securities sold under agreements to repurchase remain in the respective assets accounts and are delivered to and held as collateral by third party trustees.
Marketing and Advertising
Marketing and advertising costs are generally expensed as incurred.
Income Taxes
The Company employs the liability method of accounting for income taxes as required by ASC Topic 740, "Income Taxes." Under the liability method, deferred-tax assets and liabilities are determined based on differences between the financial statement carrying amounts and the tax bases of existing assets and liabilities (i.e., temporary timing differences) and are measured at the enacted rates that will be in effect when these differences reverse. The Company utilizes statutory requirements for its income tax accounting, and avoids risks associated with potentially problematic tax positions that may incur challenge upon audit, where an adverse outcome is more likely than not. Therefore, no provisions are made for either uncertain tax positions nor accompanying potential tax penalties and interest for underpayments of income taxes in the Company's tax reserves. In accordance with ASC Topic 740, the Company may establish a reserve against deferred tax assets in those cases where realization is less than certain.
Transfer of Financial Assets
Transfers of financial assets are accounted for as sales, when control over the assets has been surrendered. Control over transferred assets is deemed to be surrendered when (1) the assets have been isolated from the Company, (2) the transferee obtain the right (free of conditions that constrain it from taking advantage of that right) to pledge or exchange the transferred assets, and (3) the Company does not maintain effective control over the transferred assets through an agreement to repurchase them before their maturity. In certain cases, the recourse to the Bank to repurchase assets may exist but be deemed immaterial based on the specific facts and circumstances.
Earnings per Common Share
Basic net income per common share is derived by dividing net income available to common stockholders by the weighted-average number of common shares outstanding during the period measured. Diluted earnings per common share is computed by dividing net income available to common stockholders by the weighted-average number of common shares outstanding during the period measured including the potential dilutive effects of common stock equivalents. Earnings per common share has been adjusted to give retroactive effect to all stock splits and stock dividends.
Stock-Based Compensation
Effective January 2006, in accordance with ASC Topic 718"Compensation," the Company records as compensation expense an amount equal to the amortization (over the remaining service period) of the fair value (computed at the date of option grant) of any outstanding fixed stock option grants which vest
61
Eagle Bancorp, Inc.
Notes to Consolidated Financial Statements
for the Years Ended December 31, 2009, 2008 and 2007: (Continued)
Note 1—Summary of Significant Accounting Policies (Continued)
subsequent to December 31, 2005. Compensation expense on variable stock option grants (i.e. performance based grants) is recorded based on the probability of achievement of the goals underlying the performance grant. Refer to Note 13 for a description of stock-based compensation awards, activity and expense for the years ended December 31, 2009, 2008 and 2007.
New Authoritative Accounting Guidance
On July 1, 2009, the Accounting Standards Codification became Financial Accounting Standards Board's ("FASB") officially recognized source of authoritative U.S. generally accepted accounting principles applicable to all public and non-public non-governmental entities, superseding existing FASB, AICPA, EITF and related literature. Rules and interpretive releases of the SEC under the authority of federal securities laws are also sources of authoritative GAAP for SEC registrants. All other accounting literature is considered non-authoritative. The switch to the ASC affects the way companies refer to U.S. GAAP in financial statements and accounting policies. Citing particular content in the ASC involves specifying the unique numeric path to the content through the Topic, Subtopic, Section and Paragraph structure.
All pending but not yet effective Accounting Standards Updates ("ASU") were evaluated and only those listed below could have a material impact on the Company's financial condition or results of operations.
FASB ASC Topic 260, "Earnings Per Share." On January 1, 2009, the Company adopted new authoritative accounting guidance under ASC Topic 260, "Earnings Per Share," which provides that unvested share-based payment awards that contain nonforfeitable rights to dividends or dividend equivalents (whether paid or unpaid) are participating securities and shall be included in the computation of earnings per share pursuant to the two-class method. Since the Company is not currently paying a dividend on its common stock, adoption of this standard will not have any impact on the Company's financial statements.
FASB ASC Topic 320, "Investments—Debt and Equity Securities." New authoritative accounting guidance under ASC Topic 320, "Investments—Debt and Equity Securities," (i) changes existing guidance for determining whether an impairment is other-than-temporary to debt securities and (ii) replaces the existing requirement that the entity's management assert it has both the intent and ability to hold an impaired security until recovery with a requirement that management assert: (a) it does not have the intent to sell the security; and (b) it is more likely than not it will not have to sell the security before recovery of its cost basis. Under ASC Topic 320, declines in the fair value of held to maturity and available for sale securities below their cost that are deemed to be other-than-temporary are reflected in earnings as realized losses to the extent the impairment is related to credit losses. The amount of the impairment related to other factors is recognized in other comprehensive income. The Company adopted the provisions of the new authoritative accounting guidance under ASC Topic 320 during the first quarter of 2009. Adoption of the new guidance did not significantly impact the Company's financial statements.
FASB ASC Topic 805, "Business Combinations." On January 1, 2009, new authoritative accounting guidance under ASC Topic 805, "Business Combinations," became applicable to the Company's accounting for business combinations closing on or after January 1, 2009. ASC Topic 805 applies to all transactions and other events in which one entity obtains control over one or more other businesses. ASC Topic 805 requires an acquirer, upon initially obtaining control of another entity, to recognize the assets,
62
Eagle Bancorp, Inc.
Notes to Consolidated Financial Statements
for the Years Ended December 31, 2009, 2008 and 2007: (Continued)
Note 1—Summary of Significant Accounting Policies (Continued)
liabilities and any non-controlling interest in the acquiree at fair value as of the acquisition date. Contingent consideration is required to be recognized and measured at fair value on the date of acquisition rather than at a later date when the amount of that consideration may be determinable beyond a reasonable doubt. This fair value approach replaces the cost allocation process required under previous accounting guidance whereby the cost of an acquisition was allocated to the individual assets acquired and liabilities assumed based on their estimated fair value. ASC Topic 805 requires acquirers to expense acquisition related costs as incurred rather than allocating such costs to the assets acquired and liabilities assumed, as was previously the case under prior accounting guidance. Assets acquired and liabilities assumed in a business combination that arise from contingencies are to be recognized at fair value if fair value can be reasonably estimated. If fair value of such an asset or liability cannot be reasonably estimated, the asset or liability would generally be recognized in accordance with ASC Topic 450, "Contingencies." Under ASC Topic 805, the requirements of ASC Topic 420, "Exit or Disposal Cost Obligations," would have to be met in order to accrue for a restructuring plan in purchase accounting. Pre-acquisition contingencies are to be recognized at fair value, unless it is a non-contractual contingency that is not likely to materialize, in which case, nothing should be recognized in purchase accounting and, instead, that contingency would be subject to the probable and estimable recognition criteria of ASC Topic 450, "Contingencies."
FASB ASC Topic 810, "Consolidation." New authoritative accounting guidance under ASC Topic 810, "Consolidation," amended prior guidance to establish accounting and reporting standards for the non-controlling interest in a subsidiary and for the deconsolidation of a subsidiary. Under ASC Topic 810, a non-controlling interest in a subsidiary, which is sometimes referred to as minority interest, is an ownership interest in the consolidated entity that should be reported as a component of equity in the Consolidated Financial Statements. Among other requirements, ASC Topic 810 requires consolidated net income to be reported at amounts that include the amounts attributable to both the parent and the non-controlling interest. It also requires disclosure, on the face of the Consolidated Income Statement, of the amounts of consolidated net income attributable to the parent and to the non-controlling interest. The new authoritative accounting guidance under ASC Topic 810 became effective for the Company on January 1, 2009 and did not have a significant impact on the Company's financial statements.
Further new authoritative accounting guidance under ASC Topic 810 amends prior guidance to change how a company determines when an entity that is insufficiently capitalized or is not controlled through voting (or similar rights) should be consolidated. The determination of whether a company is required to consolidate an entity is based on, among other things, an entity's purpose and design and a company's ability to direct the activities of the entity that most significantly impact the entity's economic performance. The new authoritative accounting guidance requires additional disclosures about the reporting entity's involvement with variable-interest entities and any significant changes in risk exposure due to that involvement as well as its affect on the entity's financial statements. The new authoritative accounting guidance under ASC Topic 810 will be effective January 1, 2010 and is not expected to have a significant impact on the Company's financial statements.
FASB ASC Topic 820, "Fair Value Measurements and Disclosures." ASC Topic 820, "Fair Value Measurements and Disclosures," defines fair value, establishes a framework for measuring fair value in generally accepted accounting principles, and expands disclosures about fair value measurements. The provisions of ASC Topic 820 became effective for the Company on January 1, 2008 for financial assets and financial liabilities and on January 1, 2009 for non-financial assets and non-financial liabilities (see Note 19—Fair Value Measurements).
63
Eagle Bancorp, Inc.
Notes to Consolidated Financial Statements
for the Years Ended December 31, 2009, 2008 and 2007: (Continued)
Note 1—Summary of Significant Accounting Policies (Continued)
Additional new authoritative accounting guidance under ASC Topic 820 affirms that the objective of fair value when the market for an asset is not active is the price that would be received to sell the asset in an orderly transaction, and clarifies and includes additional factors for determining whether there has been a significant decrease in market activity for an asset when the market for that asset is not active. ASC Topic 820 requires an entity to base its conclusion about whether a transaction was not orderly on the weight of the evidence. The new accounting guidance amended prior guidance to expand certain disclosure requirements. The Company adopted the new authoritative accounting guidance under ASC Topic 820 during the first quarter of 2009. Adoption of the new guidance did not significantly impact the Company's financial statements.
Further new authoritative accounting guidance (Accounting Standards Update No. 2009-5) under ASC Topic 820 provides guidance for measuring the fair value of a liability in circumstances in which a quoted price in an active market for the identical liability is not available. In such instances, a reporting entity is required to measure fair value utilizing a valuation technique that uses (i) the quoted price of the identical liability when traded as an asset, (ii) quoted prices for similar liabilities or similar liabilities when traded as assets, or (iii) another valuation technique that is consistent with the existing principles of ASC Topic 820, such as an income approach or market approach. The new authoritative accounting guidance also clarifies that when estimating the fair value of a liability, a reporting entity is not required to include a separate input or adjustment to other inputs relating to the existence of a restriction that prevents the transfer of the liability. The forgoing new authoritative accounting guidance under ASC Topic 820 became effective for the Company's financial statements for periods ending after October 1, 2009 and did not have a significant impact on the Company's financial statements.
FASB ASC Topic 855, "Subsequent Events." New authoritative accounting guidance under ASC Topic 855, "Subsequent Events," establishes general standards of accounting for and disclosure of events that occur after the balance sheet date but before financial statements are issued or available to be issued. ASC Topic 855 defines (i) the period after the balance sheet date during which a reporting entity's management should evaluate events or transactions that may occur for potential recognition or disclosure in the financial statements, (ii) the circumstances under which an entity should recognize events or transactions occurring after the balance sheet date in its financial statements, and (iii) the disclosures an entity should make about events or transactions that occurred after the balance sheet date. The new authoritative accounting guidance under ASC Topic 855 became effective for the Company's financial statements for periods ending after June 15, 2009 and did not have a significant impact on the Company's financial statements.
FASB ASC Topic 860, "Transfers and Servicing." New authoritative accounting guidance under ASC Topic 860, "Transfers and Servicing," amends prior accounting guidance to enhance reporting about transfers of financial assets, including securitizations, and where companies have continuing exposure to the risks related to transferred financial assets. The new authoritative accounting guidance eliminates the concept of a "qualifying special-purpose entity" and changes the requirements for derecognizing financial assets. The new authoritative accounting guidance also requires additional disclosures about all continuing involvements with transferred financial assets including information about gains and losses resulting from transfers during the period. The new authoritative accounting guidance under ASC Topic 860 will be effective January 1, 2010 and is not expected to have a significant impact on the Company's financial statements.
64
Eagle Bancorp, Inc.
Notes to Consolidated Financial Statements
for the Years Ended December 31, 2009, 2008 and 2007: (Continued)
Note 2—Cash and Due from Banks
Regulation D of the Federal Reserve Act requires that banks maintain noninterest reserve balances with the Federal Reserve Bank based principally on the type and amount of their deposits. During 2009, the Bank maintained balances at the Federal Reserve (in addition to vault cash) to meet the reserve requirements as well as balances to partially compensate for services. Late in 2008, the Federal Reserve in connection with the Emergency Economic Stabilization Act of 2008 began paying a nominal amount of interest on balances held. Additionally, the Bank maintained interest bearing balances with the Federal Home Loan Bank and noninterest bearing balances with nine domestic correspondents as compensation for services they provide to the Bank.
Note 3—Investment Securities Available for Sale
The amortized cost and estimated fair values of investments available for sale at December 31, 2009 and 2008 are as follows:
December 31, 2009
|
Amortized Cost |
Gross Unrealized Gains |
Gross Unrealized Losses |
Estimated Fair Value |
|||||||||
|---|---|---|---|---|---|---|---|---|---|---|---|---|---|
| (dollars in thousands) |
|
|
|
|
|||||||||
U. S. Government agency securities |
$ | 75,980 | $ | 412 | $ | 285 | $ | 76,107 | |||||
Mortgage backed securities—GSEs |
122,076 | 3,501 | 181 | 125,396 | |||||||||
Municipal bonds |
32,845 | 717 | 237 | 33,325 | |||||||||
Other equity investments |
436 | — | 37 | 399 | |||||||||
|
$ | 231,337 | $ | 4,630 | $ | 740 | $ | 235,227 | |||||
December 31, 2008
|
Amortized Cost |
Gross Unrealized Gains |
Gross Unrealized Losses |
Estimated Fair Value |
|||||||||
|---|---|---|---|---|---|---|---|---|---|---|---|---|---|
| (dollars in thousands) |
|
|
|
|
|||||||||
U. S. Government agency securities |
$ | 71,837 | $ | 2,197 | $ | 5 | $ | 74,029 | |||||
Mortgage backed securities—GSEs |
77,242 | 2,559 | 31 | 79,770 | |||||||||
Municipal bonds |
5,061 | — | 353 | 4,708 | |||||||||
Other equity investments |
1,396 | — | 423 | 973 | |||||||||
|
$ | 155,536 | $ | 4,756 | $ | 812 | $ | 159,480 | |||||
Ninety nine percent (99%) of the debt instruments reflected in the above table are rated AAA or AA. The remaining one percent (1%) of the debt instruments consists of municipal bonds which have a rating of A; all ratings of which represent high investment grade issues. The debt instruments have a net unrealized gain representing 1.7% of amortized cost. The debt instruments have a weighted average duration of 3.4 years, and low credit risk. The gross unrealized loss on other equity investments represents common stock of the three local banking companies owned by the Company (parent only), and traded on a broker "bulletin board" exchange. The estimated fair value is determined by broker quoted prices. If quoted prices are not available, fair value is measured using independent pricing models or other model-based valuation techniques such as the present value of future cash flows, adjusted for the security's credit rating, prepayment assumptions and other factors such as credit loss assumptions. The unrealized gross losses that exist on the debt and equity securities are the result of market changes in interest rates since the
65
Eagle Bancorp, Inc.
Notes to Consolidated Financial Statements
for the Years Ended December 31, 2009, 2008 and 2007: (Continued)
Note 3—Investment Securities Available for Sale (Continued)
original purchase and widening interest rate spreads on debt and common stock issues during 2009. The Company does not intend to sell the investments and it is more likely than not that the Company will not have to sell the securities before recovery of its amortized cost basis, which may be maturity. In addition, at December 31, 2009, the Company held $10.4 million in equity securities in a combination of Federal Reserve Bank ("FRB") and Federal Home Loan Bank ("FHLB") stocks which are held for regulatory purposes and are not marketable.
Gross unrealized losses and fair value by length of time that the individual available for sale securities have been in a continuous unrealized loss position as of December 31, 2009 and 2008 are as follows:
| |
Less than 12 Months | 12 Months or Greater | Total | ||||||||||||||||
|---|---|---|---|---|---|---|---|---|---|---|---|---|---|---|---|---|---|---|---|
December 31, 2009
|
Estimated Fair Value |
Unrealized Losses |
Estimated Fair Value |
Unrealized Losses |
Estimated Fair Value |
Unrealized Losses |
|||||||||||||
| (dollars in thousands) |
|
|
|
|
|
|
|||||||||||||
U. S. Government agency securities |
$ | 37,357 | $ | 285 | $ | — | $ | — | $ | 37,357 | $ | 285 | |||||||
Mortgage backed securities—GSEs |
11,681 | 181 | — | — | 11,681 | 181 | |||||||||||||
Municipal bonds |
13,850 | 237 | — | — | 13,850 | 237 | |||||||||||||
Other equity investments |
140 | 37 | — | — | 140 | 37 | |||||||||||||
|
$ | 63,028 | $ | 740 | $ | — | $ | — | $ | 63,028 | $ | 740 | |||||||
| |
Less than 12 Months | 12 Months or Greater | Total | ||||||||||||||||
|---|---|---|---|---|---|---|---|---|---|---|---|---|---|---|---|---|---|---|---|
December 31, 2008
|
Estimated Fair Value |
Unrealized Losses |
Estimated Fair Value |
Unrealized Losses |
Estimated Fair Value |
Unrealized Losses |
|||||||||||||
| (dollars in thousands) |
|
|
|
|
|
|
|||||||||||||
U. S. Government agency securities |
$ | 4,480 | $ | 5 | $ | — | $ | — | $ | 4,480 | $ | 5 | |||||||
Mortgage backed securities—GSEs |
7,715 | 31 | — | — | 7,715 | 31 | |||||||||||||
Municipal bonds |
4,707 | 353 | — | — | 4,707 | 353 | |||||||||||||
Other equity investments |
576 | 423 | — | — | 576 | 423 | |||||||||||||
|
$ | 17,478 | $ | 812 | $ | — | $ | — | $ | 17,478 | $ | 812 | |||||||
66
Eagle Bancorp, Inc.
Notes to Consolidated Financial Statements
for the Years Ended December 31, 2009, 2008 and 2007: (Continued)
Note 3—Investment Securities Available for Sale (Continued)
The amortized cost and estimated fair values of investments available for sale at December 31, 2009 and 2008 by contractual maturity are shown below. Expected maturities will differ from contractual maturities because borrowers may have the right to call or prepay obligations with or without call or prepayment penalties.
| |
2009 | 2008 | ||||||||||||
|---|---|---|---|---|---|---|---|---|---|---|---|---|---|---|
| (dollars in thousands) |
Amortized Cost |
Estimated Fair Value |
Amortized Cost |
Estimated Fair Value |
||||||||||
U. S. Government agency securities maturing: |
||||||||||||||
One year or less |
$ | 8,095 | $ | 8,186 | $ | 2,014 | $ | 2,011 | ||||||
After one year through five years |
67,885 | 67,921 | 34,805 | 35,632 | ||||||||||
After five years through ten years |
— | — | 35,018 | 36,386 | ||||||||||
Mortgage backed securities |
122,076 | 125,396 | 77,242 | 79,770 | ||||||||||
Municipal bonds maturing: |
||||||||||||||
Five years through ten years |
3,023 | 3,072 | — | — | ||||||||||
After ten years |
29,822 | 30,253 | 5,061 | 4,708 | ||||||||||
Other equity investments |
436 | 399 | 1,396 | 973 | ||||||||||
|
$ | 231,337 | $ | 235,227 | $ | 155,536 | $ | 159,480 | ||||||
In 2009, realized gains on sales of investment securities were $1.6 million and realized losses on sales of investment securities were $14 thousand. In 2008, realized gains on sales of investment securities were $54 thousand and realized losses on sales of investment securities were $52 thousand. In 2007, realized gains on sales of investment securities were $49 thousand and realized losses on sales of investment securities were $43 thousand.
Proceeds from sales and calls of investment securities in 2009 were $53.1 million, in 2008 were $64.8 million, and in 2007 were $29.3 million.
At December 31, 2009, $179.6 million (fair value) of securities were pledged as collateral for certain government deposits, and securities sold under agreement to repurchase. The outstanding balance of no single issuer, except for U.S. Government and U.S. Government agency securities, exceeded ten percent of stockholders' equity at December 31, 2009 or 2008.
Note 4—Loans and Allowance for Credit Losses
The Bank makes loans to customers primarily in the Washington, D.C. metropolitan statistical area and surrounding communities. A substantial portion of the Bank's loan portfolio consists of loans to businesses secured by real estate and other business assets.
67
Eagle Bancorp, Inc.
Notes to Consolidated Financial Statements
for the Years Ended December 31, 2009, 2008 and 2007: (Continued)
Note 4—Loans and Allowance for Credit Losses (Continued)
Loans, net of unamortized net deferred fees, at December 31, 2009 and 2008 are summarized by type as follows:
| (dollars in thousands) |
2009 | 2008 | ||||||
|---|---|---|---|---|---|---|---|---|
Commercial |
$ | 346,692 | $ | 334,999 | ||||
Owner occupied—commercial |
196,433 | 184,059 | ||||||
Investment—commercial real estate |
499,501 | 365,010 | ||||||
Real estate mortgage—residential |
9,236 | 9,757 | ||||||
Construction—commercial & residential(1) |
252,695 | 283,020 | ||||||
Home equity |
87,283 | 80,295 | ||||||
Other consumer |
7,471 | 8,500 | ||||||
Total loans |
1,399,311 | 1,265,640 | ||||||
Less: Allowance for Credit Losses |
(20,619 | ) | (18,403 | ) | ||||
Loans net |
$ | 1,378,692 | $ | 1,247,237 | ||||
- (1)
- Includes loans for land acquisition and owner occupied properties.
Unamortized net deferred fees amounted to $2.6 million and $1.8 million at December 31, 2009 and 2008, respectively, of which $520 thousand and $550 thousand, respectively at December 31, 2009 and 2008 represented net deferred costs on home equity loans.
As of December 31, 2009 and 2008, the Bank serviced $25.8 million and $23.1 million, respectively, of SBA loans participations which are not reflected as loan balances on the Consolidated Balance Sheets.
Activity in the allowance for credit losses for the past three years is shown below.
| (dollars in thousands) |
2009 | 2008 | 2007 | |||||||
|---|---|---|---|---|---|---|---|---|---|---|
Balance at beginning of year |
$ | 18,403 | $ | 8,037 | $ | 7,373 | ||||
Provision for credit losses |
7,669 | 3,979 | 1,643 | |||||||
Acquired allowance—Fidelity |
— | 7,510 | — | |||||||
Loan charge-offs |
(5,780 | ) | (1,217 | ) | (1,031 | ) | ||||
Loan recoveries |
327 | 94 | 52 | |||||||
Balance at end of year |
$ | 20,619 | $ | 18,403 | $ | 8,037 | ||||
Information regarding impaired loans at December 31, 2009 and 2008 is as follows:
| (dollars in thousands) |
2009 | 2008 | ||||||
|---|---|---|---|---|---|---|---|---|
Interest income that would have been recognized |
$ | 1,367 | $ | 1,602 | ||||
Interest income recognized |
546 | 406 | ||||||
Interest income not recognized |
$ | 821 | $ | 1,196 | ||||
68
Eagle Bancorp, Inc.
Notes to Consolidated Financial Statements
for the Years Ended December 31, 2009, 2008 and 2007: (Continued)
Note 4—Loans and Allowance for Credit Losses (Continued)
| (dollars in thousands) |
2009 | 2008 | ||||||
|---|---|---|---|---|---|---|---|---|
Impaired loans with a valuation allowance |
$ | 5,434 | $ | 2,810 | ||||
Impaired loans without a valuation allowance |
16,591 | 22,647 | ||||||
Total impaired loans |
$ | 22,025 | $ | 25,457 | ||||
Allowance for credit losses related to impaired loans |
$ | 2,190 | $ | 1,165 | ||||
Allowance for credit losses related to other than impaired loans |
18,429 | 17,238 | ||||||
Total allowance for credit losses |
$ | 20,619 | $ | 18,403 | ||||
Average impaired loans for the year |
$ | 31,183 | $ | 17,353 | ||||
Interest income on impaired loans recognized on a cash basis |
$ | 546 | $ | 406 | ||||
At December 31, 2009, the nonperforming loans acquired from Fidelity have a carrying value of $5.6 million and an unpaid principal balance of $15.3 million and were evaluated separately in accordance with ASC Topic 310-30, "Loans and Debt Securities Acquired with Deteriorated Credit Quality." The various impaired loans were recorded at estimated fair value with any excess being charged-off or treated as a non-accretable discount. Subsequent downward adjustments to the valuation of impaired loans acquired will result in additional loan loss provisions and related allowance for credit losses. Subsequent upward adjustments to the valuation of impaired loans acquired will result in accretable discount. No adjustments have been made to the fair value amounts of impaired loans recorded at the date of acquisition.
Note 5—Premises and Equipment
Premises and equipment include the following at December 31:
| |
2009 | 2008 | ||||||
|---|---|---|---|---|---|---|---|---|
Leasehold improvements |
$ | 9,498 | $ | 8,468 | ||||
Furniture and equipment |
9,361 | 8,810 | ||||||
Less accumulated depreciation and amortization |
(9,606 | ) | (7,612 | ) | ||||
Total premises and equipment, net |
$ | 9,253 | $ | 9,666 | ||||
The Company leases banking and office space in twenty two locations under non-cancelable lease arrangements accounted for as operating leases. The initial lease periods range from 5 to 10 years and provide for one or more five year renewal options. The leases in some cases provide for scheduled annual rent escalations and require that the Bank (lessee) pay certain operating expenses applicable to the leased space. Rent expense applicable to operating leases amounted to $4.7 million for 2009, $3.4 million in 2008, and $2.7 million in 2007. The Company subleased three leased premises during 2009 and two leased premises during 2008. The Company has recorded $366 thousand and $293 thousand respectively, as a
69
Eagle Bancorp, Inc.
Notes to Consolidated Financial Statements
for the Years Ended December 31, 2009, 2008 and 2007: (Continued)
Note 5—Premises and Equipment (Continued)
reduction of rent expense during 2009 and 2008. At December 31, 2009, future minimum lease payments under non-cancelable operating leases having an initial term in excess of one year are as follows:
| (dollars in thousands) |
|
||||
|---|---|---|---|---|---|
Years ending December 31: |
|||||
2010 |
$ | 3,942 | |||
2011 |
3,485 | ||||
2012 |
3,189 | ||||
2013 |
2,987 | ||||
2014 |
2,817 | ||||
Thereafter |
5,655 | ||||
Total minimum lease payments |
$ | 22,075 | |||
Note 6—Intangible Assets
Intangible assets are included in the Consolidated Balance Sheets as a separate line item, net of accumulated amortization.
| (dollars in thousands) |
Gross Intangible Assets |
Adjustments | Additions | Accumulated Amortization |
Net Intangible Assets |
||||||||||||
|---|---|---|---|---|---|---|---|---|---|---|---|---|---|---|---|---|---|
2009 |
|||||||||||||||||
Goodwill(1) |
$ | 105 | $ | 2,058 | $ | — | $ | — | $ | 2,163 | |||||||
Core deposit(2) |
2,243 | — | — | (186 | ) | 2,057 | |||||||||||
Excess servicing(3) |
185 | — | 62 | (88 | ) | 159 | |||||||||||
|
$ | 2,533 | $ | 2,058 | $ | 62 | $ | (274 | ) | $ | 4,379 | ||||||
2008 |
|||||||||||||||||
Goodwill(1) |
$ | 105 | $ | — | $ | — | $ | — | $ | 105 | |||||||
Core deposit(2) |
2,305 | — | — | (62 | ) | 2,243 | |||||||||||
Excess servicing(3) |
236 | — | 54 | (105 | ) | 185 | |||||||||||
|
$ | 2,646 | $ | — | $ | 54 | $ | (167 | ) | $ | 2,533 | ||||||
Future estimated annual amortization expense is presented below:
| (dollars in thousands) |
|
|||
|---|---|---|---|---|
2010 |
$ | 273 | ||
2011 |
251 | |||
2012 |
217 | |||
2013 |
358 | |||
2014 |
309 | |||
Thereafter |
804 | |||
- (1)
- The Company recorded an initial amount of unidentified intangible (goodwill) incident to the acquisition of Fidelity of approximately $360 thousand. Based on allowable adjustments
70
Eagle Bancorp, Inc.
Notes to Consolidated Financial Statements
for the Years Ended December 31, 2009, 2008 and 2007: (Continued)
Note 6—Intangible Assets (Continued)
through August 31, 2009, the unidentified intangible (goodwill) amounted to approximately $2.2 million.
- (2)
- In
connection with the Fidelity acquisition, the Company made an allocation of the purchase price to a core deposit intangible which was determined by
independent evaluation and is included in intangible assets, net on the Consolidated Balance Sheets. The initial amount was $2.3 million, which is being amortized over 5.2 years as a
component of other noninterest expenses.
- (3)
- The Company recognizes a servicing asset for the computed value of servicing fees on the sale of the guaranteed portion of SBA loans, which is in excess of a normal servicing fee. Assumptions related to loan term and amortization are made to arrive at the initial recorded value, which is included in other assets.
Note 7—Deposits
The following table provides information regarding the Bank's deposit composition at December 31 for the years indicated and shows the average rate being paid on the interest bearing deposits in December of each year.
| |
2009 | 2008 | 2007 | |||||||||||||||||
|---|---|---|---|---|---|---|---|---|---|---|---|---|---|---|---|---|---|---|---|---|
| (dollars in thousands) |
Balance | Average Rate |
Balance | Average Rate |
Balance | Average Rate |
||||||||||||||
Noninterest bearing demand |
$ | 307,959 | — | $ | 223,580 | — | $ | 142,477 | — | |||||||||||
Interest bearing transaction |
59,720 | 0.31 | % | 54,801 | 0.25 | % | 54,090 | 0.73 | % | |||||||||||
Savings and money market |
582,854 | 1.39 | % | 271,791 | 1.79 | % | 177,081 | 2.96 | % | |||||||||||
Time, $100,000 or more |
296,199 | 2.12 | % | 249,516 | 3.21 | % | 173,586 | 4.63 | % | |||||||||||
Other time |
213,542 | 2.33 | % | 329,692 | 3.27 | % | 83,702 | 5.66 | % | |||||||||||
Total |
$ | 1,460,274 | $ | 1,129,380 | $ | 630,936 | ||||||||||||||
The remaining maturity of time deposits at December 31, 2009 and 2008 are as follows:
| (dollars in thousands) |
2009 | 2008 | |||||
|---|---|---|---|---|---|---|---|
Three months or less |
$ | 132,861 | $ | 172,826 | |||
More than three months through six months |
120,460 | 127,618 | |||||
More than six months through twelve months |
105,641 | 229,926 | |||||
Over twelve months |
150,779 | 48,838 | |||||
Total |
$ | 509,741 | $ | 579,208 | |||
71
Eagle Bancorp, Inc.
Notes to Consolidated Financial Statements
for the Years Ended December 31, 2009, 2008 and 2007: (Continued)
Note 7—Deposits (Continued)
Interest expense on deposits for the years ended December 31, 2009, 2008 and 2007 is as follows:
| (dollars in thousands) |
2009 | 2008 | 2007 | ||||||||
|---|---|---|---|---|---|---|---|---|---|---|---|
Interest bearing transaction |
$ | 161 | $ | 306 | $ | 305 | |||||
Savings and money market |
6,144 | 4,212 | 6,044 | ||||||||
Time, $100,000 or more |
6,502 | 7,672 | 7,973 | ||||||||
Other time |
8,149 | 7,353 | 5,489 | ||||||||
Total |
$ | 20,956 | $ | 19,543 | $ | 19,811 | |||||
Note 8—Borrowings
Information relating to short-term and long-term borrowings is as follows for the years ended December 31:
| |
2009 | 2008 | 2007 | ||||||||||||||||||
|---|---|---|---|---|---|---|---|---|---|---|---|---|---|---|---|---|---|---|---|---|---|
| (dollars in thousands) |
Amount | Rate | Amount | Rate | Amount | Rate | |||||||||||||||
Short-term: |
|||||||||||||||||||||
At Year-End: |
|||||||||||||||||||||
Customer repurchase agreements and federal funds purchased |
$ | 90,790 | 0.85 | % | $ | 98,802 | 1.73 | % | $ | 76,408 | 4.45 | % | |||||||||
Federal Home Loan Bank—current portion |
10,000 | 0.14 | % | 55,000 | 0.70 | % | 22,000 | 4.44 | % | ||||||||||||
Total |
$ | 100,790 | $ | 153,802 | $ | 98,408 | |||||||||||||||
Average Daily Balance for the Year: |
|||||||||||||||||||||
Customer repurchase agreements and federal funds purchased |
$ | 93,363 | 1.03 | % | $ | 68,696 | 2.05 | % | $ | 44,992 | 4.19 | % | |||||||||
Federal Home Loan Bank—current portion |
30,562 | 1.97 | % | 15,577 | 2.56 | % | 11,093 | 5.51 | % | ||||||||||||
Maximum Month-end Balance: |
|||||||||||||||||||||
Customer repurchase agreements and federal funds purchased |
$ | 120,918 | 1.16 | % | $ | 104,243 | 1.92 | % | $ | 76,408 | 4.45 | % | |||||||||
Federal Home Loan Bank—current portion |
50,000 | 0.38 | % | 55,000 | 0.70 | % | 30,000 | 5.44 | % | ||||||||||||
Long-term: |
|||||||||||||||||||||
At Year-End: |
|||||||||||||||||||||
Federal Home Loan Bank |
$ | 40,000 | 3.03 | % | $ | 50,000 | 3.56 | % | $ | 30,000 | 4.40 | % | |||||||||
Subordinated Debentures |
9,300 | 10.00 | % | 12,150 | 10.00 | % | — | 0 | % | ||||||||||||
United Bank Line of Credit |
— | 0 | % | — | 0 | % | — | 0 | % | ||||||||||||
Average Daily Balance for the Year: |
|||||||||||||||||||||
Federal Home Loan Bank |
$ | 34,000 | 3.35 | % | $ | 46,202 | 3.84 | % | $ | 29,033 | 4.89 | % | |||||||||
Subordinated Debentures |
11,322 | 10.00 | % | 4,187 | 10.00 | % | — | 0 | % | ||||||||||||
United Bank Line of Credit |
— | 0 | % | 3,361 | 4.39 | % | — | 0 | % | ||||||||||||
Maximum Month-end Balance: |
|||||||||||||||||||||
Federal Home Loan Bank |
$ | 50,000 | 3.56 | % | $ | 50,000 | 3.56 | % | $ | 45,000 | 4.57 | % | |||||||||
Subordinated Debentures |
12,150 | 10.00 | % | 12,150 | 10.00 | % | — | 0 | % | ||||||||||||
United Bank Line of Credit |
— | 0 | % | 18,000 | 3.75 | % | — | 0 | % | ||||||||||||
72
Eagle Bancorp, Inc.
Notes to Consolidated Financial Statements
for the Years Ended December 31, 2009, 2008 and 2007: (Continued)
Note 8—Borrowings (Continued)
The Company offers its business customers a repurchase agreement sweep account in which it collateralizes these funds with U. S. Government agency and mortgaged backed securities segregated in its investment portfolio safekeeping for this purpose. By entering into the agreement, the customer agrees to have the Bank repurchase the designated securities on the business day following the initial transaction in consideration of the payment of interest at the rate prevailing on the day of the transaction.
The Bank has commitments from correspondent banks under which it can purchase up to $70 million in federal funds on an unsecured basis, against which there were no amounts outstanding at December 31, 2009 and can borrow unsecured funds under one-way CDARS brokered deposits in the amount of $82.0 million, against which there was $448 thousand outstanding at December 31, 2009. At December 31, 2009, the Bank was also eligible to make advances from the FHLB up to $112.4 million based on collateral at the FHLB, of which it had $50 million of advances outstanding at December 31, 2009. Also, the Bank may enter into repurchase agreements as well as obtaining additional borrowing capabilities from the FHLB provided adequate collateral exists to secure these lending relationships.
On August 11, 2008, the Company entered into a Loan Agreement and related Stock Security Agreement and Promissory Note (the "credit facility") with United Bank, pursuant to which the Company may borrow, on a revolving basis, up to $20 million for working capital purposes, to finance capital contributions to the Bank and ECV. The terms of this facility were modified in July 2009. The credit facility is secured by a first lien on all of the stock of the Bank, and bears interest at a floating rate equal to the Wall Street Journal Prime Rate minus 0.25% with a floor interest rate of 4.75%. Interest is payable on a monthly basis. The term of the credit facility expires on June 25, 2010. At any time, provided no event of default exists, the Company may term out repayment of the outstanding principal balance of the credit facility over a five year term. The credit facility contains certain customary representations, warranties, covenants and events of default, including the following financial covenants: (1) maintaining an allowance for loan losses of not less than 35% of nonperforming assets (as calculated in the Loan Agreement); (2) maintaining the Bank's Tier 1 Capital Leverage Ratio, Total Risk Based Capital Ratio and Tier 1 Risk Based Capital Ratio as "well capitalized;" (3) maintaining the Company's Tier 1 Capital Leverage Ratio, Total Risk Based Capital Ratio and Tier 1 Risk Based Capital Ratio as "adequately capitalized" as defined for purposes of Section 38 of the FDI Act; (4) maintaining the Company's and Bank's consolidated nonperforming assets at less than 35% of primary equity capital, as defined; (5) maintaining consolidated net income (exclusive of extraordinary and nonrecurring items) to average total assets for the Company and Bank at not less than 0.50%; and (6) maintaining a ratio of investment in bank subsidiary to consolidated equity less goodwill of not more than 125% as of any fiscal quarter end. Upon the occurrence of any event of default (as defined in the Loan Agreement) which is continuing, Lender shall have the right to declare the amount owed under the credit facility to be immediately due and payable. The Company paid $30 thousand term-out fee in connection with the modification of this facility. At December 31, 2009, there were no borrowings outstanding under this United Bank credit facility and the Company was in compliance with all covenants.
On August 28, 2008, the Company accepted subscriptions for and sold an aggregate of $12.15 million of subordinated notes (the "Notes"), on a private placement basis. This offering, which was funded by several Directors of the Company, was utilized to provide additional Tier 2 regulatory capital in the wake of the acquisition of Fidelity, absent availability of other capital sources during 2008. The capital treatment of the Notes will be phased out during the last 5 years of the Notes' term, at a rate of 20% of the original principal amount per year commencing in October 2009. The Notes bear interest, payable on the first day
73
Eagle Bancorp, Inc.
Notes to Consolidated Financial Statements
for the Years Ended December 31, 2009, 2008 and 2007: (Continued)
Note 8—Borrowings (Continued)
of each month, commencing in October 2008, at a fixed rate of 10% per year. The Notes have a term of approximately six years, and have a maturity of September 30, 2014. On September 17, 2009, the Company redeemed an aggregate of $2.85 million of the Notes from certain directors of the Company. At December 31, 2009, $9.3 million of the Notes remaining outstanding and are included in long-term borrowings on the Consolidated Balance Sheets.
Note 9—Preferred Stock and Warrants
On December 5, 2008, the Company entered into and consummated a Letter Agreement (the "Purchase Agreement") with the United States Department of the Treasury (the "Treasury"), pursuant to which the Company issued 38,235 shares of the Company's Fixed Rate Cumulative Perpetual Preferred Stock, Series A (the "Series A Preferred Stock'), having a liquidation amount per share equal to $1,000, for a total purchase price of $38,235,000. The Series A Preferred Stock pays cumulative dividends at a rate of 5% per year for the first five years and thereafter at a rate of 9% per year. As a result of legislative changes during 2009, and subject to consultation with the Company's and Bank's federal regulators, the Company may, at its option, redeem the Series A Preferred Stock at the liquidation amount plus accrued and unpaid dividends. The Series A Preferred Stock is non-voting, except in limited circumstances. Prior to the third anniversary of issuance, unless the Company has redeemed all of the Series A Preferred Stock or the Treasury has transferred all of the Series A Preferred Stock to a third party, the consent of the Treasury will be required for the Company to increase its common stock dividend or repurchase its common stock or other equity or capital securities, other than in connection with benefit plans consistent with past practice and certain other circumstances specified in the Purchase Agreement.
The Company redeemed 15,000 shares of Series A Preferred Stock on December 23, 2009. The aggregate redemption price for the shares was $15,079,166.67, including accrued but unpaid dividends on the shares. Following the repurchase, 23,235 shares of Series A Preferred Stock ($23,235,000 aggregate liquidation amount) remain outstanding, held by the Treasury. For additional information see "Capital Resources and Adequacy" at page 42 of the Company's Annual Report on Form 10-K for the year ended December 31, 2009.
In connection with the purchase of the Series A Preferred Stock, the Treasury was issued a warrant (the "Warrant") to purchase 770,867 shares of the Company's common stock at an initial exercise price of $7.44 per share. The Warrant provides for the adjustment of the exercise price and the number of shares of the common stock issuable upon exercise pursuant to customary anti-dilution provisions, such as upon stock splits or distributions of securities or other assets to holders of the common stock, and upon certain issuances of the common stock (or securities exercisable or exchangeable for, or convertible into, common stock) at or below 90% of the market price of the common stock on the trading day prior to the date of the agreement on pricing such securities. The Warrants expires ten years from the date of issuance. As a result of the completion of a "qualified equity offering" by the Company, the number of share of common stock issuable pursuant to the Warrant has been reduced by one-half to 385,434. Accordingly, the discount on the preferred stock and the warrants was reduced by $946 thousand in November 2009. The Treasury has agreed not to exercise voting power with respect to any shares of common stock issued upon exercise of the Warrant.
74
Eagle Bancorp, Inc.
Notes to Consolidated Financial Statements
for the Years Ended December 31, 2009, 2008 and 2007: (Continued)
Note 10—Income Taxes
Federal and state income tax expense consists of the following for the years ended December 31:
| (dollars in thousands) |
2009 | 2008 | 2007 | ||||||||
|---|---|---|---|---|---|---|---|---|---|---|---|
Current federal income tax |
$ | 6,027 | $ | 5,052 | $ | 4,456 | |||||
Current state income tax |
1,248 | 714 | 681 | ||||||||
Total current |
7,275 | 5,766 | 5,137 | ||||||||
Deferred federal income tax benefit |
(1,087 | ) | (1,418 | ) | (742 | ) | |||||
Deferred state income tax benefit |
(223 | ) | (225 | ) | (126 | ) | |||||
Total deferred |
(1,310 | ) | (1,643 | ) | (868 | ) | |||||
Total income tax expense |
$ | 5,965 | $ | 4,123 | $ | 4,269 | |||||
Temporary timing differences between the amounts reported in the financial statements and the tax bases of assets and liabilities result in deferred taxes. Gross deferred tax assets and liabilities, shown as the sum of the appropriate tax effect for each significant type of temporary difference, is presented below for the years ended December 31:
| |
2009 | 2008 | 2007 | |||||||
|---|---|---|---|---|---|---|---|---|---|---|
Deferred tax assets: |
||||||||||
Allowance for credit losses |
$ | 8,336 | $ | 7,440 | $ | 3,251 | ||||
Deferred loan fees and costs |
1,040 | 746 | 664 | |||||||
Stock based compensation |
90 | 49 | 53 | |||||||
Net operating loss |
4,526 | 4,778 | — | |||||||
Deferred rent |
357 | 278 | 106 | |||||||
Premises and equipment |
446 | — | — | |||||||
Other |
200 | 310 | 39 | |||||||
Total deferred tax assets |
14,995 | 13,601 | 4,113 | |||||||
Deferred tax liabilities: |
||||||||||
Unrealized gain on securities available for sale |
(1,555 | ) | (1,594 | ) | (382 | ) | ||||
Excess servicing |
(64 | ) | (74 | ) | (95 | ) | ||||
Intangible assets |
(921 | ) | (755 | ) | — | |||||
Premises and equipment |
— | (72 | ) | (39 | ) | |||||
Total deferred tax liabilities |
(2,540 | ) | (2,495 | ) | (516 | ) | ||||
Net deferred income tax account |
$ | 12,455 | $ | 11,106 | $ | 3,597 | ||||
75
Eagle Bancorp, Inc.
Notes to Consolidated Financial Statements
for the Years Ended December 31, 2009, 2008 and 2007: (Continued)
Note 10—Income Taxes (Continued)
A reconciliation of the statutory federal income tax rate to the Company's effective income tax rate for the years ended December 31 follows:
| |
2009 | 2008 | 2007 | ||||||||
|---|---|---|---|---|---|---|---|---|---|---|---|
Statutory federal income tax rate |
35.00 | % | 35.00 | % | 35.00 | % | |||||
Increase (decrease) due to: |
|||||||||||
State income taxes, net of federal income tax benefit |
4.07 | 2.75 | 3.02 | ||||||||
Tax exempt interest and dividend income |
(3.23 | ) | (3.48 | ) | (2.70 | ) | |||||
Share-based compensation expense |
0.98 | 0.95 | 0.52 | ||||||||
Other |
(0.41 | ) | 0.47 | (0.17 | ) | ||||||
Effective tax rates |
36.41 | % | 35.69 | % | 35.67 | % | |||||
The net operating loss carry forward acquired in conjunction with the Fidelity acquisition is subject to annual limits under IRC section 382 of $718 thousand and expires in 2027.
As a result of the issuance of the Series A Preferred Stock to the Treasury, the Company is required to comply with certain restrictions on executive compensation included in the Emergency Economic Stabilization Act of 2008, as amended (the "EESA"). Certain of these provisions could limit the tax deductibility of compensation the Company pays to its executive officers, although no such effect has impacted the Company.
Note 11—Net Income per Common Share
The calculation of net income per common share for the years ended December 31 was as follows:
| (dollars and shares in thousands, except per share data) |
2009 | 2008 | 2007 | |||||||
|---|---|---|---|---|---|---|---|---|---|---|
Basic: |
||||||||||
Net income allocable to common stockholders |
$ | 8,112 | $ | 7,251 | $ | 7,701 | ||||
Average common shares outstanding |
14,643 | 11,557 | 10,531 | |||||||
Basic net income per common share |
$ | 0.55 | $ | 0.63 | $ | 0.73 | ||||
Diluted: |
||||||||||
Net income allocable to common stockholders |
$ | 8,112 | $ | 7,251 | $ | 7,701 | ||||
Average common shares outstanding |
14,643 | 11,557 | 10,531 | |||||||
Adjustment for common share equivalents |
141 | 135 | 319 | |||||||
Average common shares outstanding—diluted |
14,784 | 11,692 | 10,850 | |||||||
Diluted net income per common share |
$ | 0.55 | $ | 0.62 | $ | 0.71 | ||||
Per share amounts and the number of outstanding shares have been adjusted to give effect to the 10% common dividend paid on October 1, 2008.
There were 951,399, 1,628,274 and 184,482 common shares equivalents at December 31, 2009, 2008 and 2007, respectively that were excluded from the diluted net income per common share computation because their effects were anti-dilutive.
76
Eagle Bancorp, Inc.
Notes to Consolidated Financial Statements
for the Years Ended December 31, 2009, 2008 and 2007: (Continued)
Note 12—Related Party Transactions
Certain directors and executive officers have had loan transactions with the Company. Such loans were made in the ordinary course of business on substantially the same terms, including interest rates and collateral, as those prevailing at the time for comparable transactions with outsiders. The following table summarizes changes in amounts of loans outstanding, both direct and indirect, to those persons during 2009 and 2008.
| (dollars in thousands) |
2009 | 2008 | |||||
|---|---|---|---|---|---|---|---|
Balance at January 1 |
$ | 24,647 | $ | 18,203 | |||
Additions |
6,190 | 15,991 | |||||
Repayments |
(5,505 | ) | (9,547 | ) | |||
Balance at December 31 |
$ | 25,332 | $ | 24,647 | |||
A significant portion of the additions in 2008 in the table above were due to the acquisition of Fidelity which resulted in the addition of two directors to the Board of Directors of the Company and four directors to the Board of Directors of the Bank.
On August 28, 2008, the Company sold an aggregate of $12.15 million of subordinated notes (the "Notes"), on a private placement basis, to seven parties, six of whom are currently directors of the Company or the Bank. Refer to Note 8 to the Consolidated Financial Statements for further description of the terms of the Notes. In September 2009, $2.85 million of the Notes were redeemed, leaving an outstanding balance of Notes of $9.3 million at December 31, 2009. These Notes are included in long-term borrowings on the Consolidated Balance Sheets.
The Bank leases certain office space, at a current monthly base rental of $46,716, excluding certain pass through expenses, from limited liability companies in which a trust for the benefit of an executive officer's children has an 85% interest in one instance and a 51% interest in another.
The Bank has obtained certain deposits through title company clients in which a director of the Bank has a direct interest and for which a broker fee of 0.50% of average deposits is paid monthly in arrears. During 2009, approximately $102 thousand in broker fees was paid.
Note 13—Stock-Based Compensation
The Company maintains the 1998 Stock Option Plan ("1998 Plan") and the 2006 Stock Plan ("2006 Plan"), and in connection with the Fidelity acquisition assumed the Fidelity 2004 Long Term Incentive Plan and 2005 Long Term Incentive Plan (the "Fidelity Plans"). No additional options may be granted under the 1998 Plan or the Fidelity Plans.
The 2006 Plan provides for the issuance of awards of incentive options, nonqualifying options, restricted stock and stock appreciation rights to selected key employees and members of the Board. As amended, 1,215,000 shares of common stock are subject to issuance pursuant to awards under the 2006 Plan. Option awards are made with an exercise price equal to the average of the high and low price of the Company's shares at the date of grant.
For awards that are service based, compensation expense is being recognized over the service (vesting) period based on fair value, which for stock option grants is computed using the Black Scholes model, and for restricted stock awards is based on the average of the high and low stock price of the Company's shares at the date of grant. For awards that are performance based, compensation expense is recorded based on the probability of achievement of the goals underlying the grant.
77
Eagle Bancorp, Inc.
Notes to Consolidated Financial Statements
for the Years Ended December 31, 2009, 2008 and 2007: (Continued)
Note 13—Stock-Based Compensation (Continued)
In January 2009, the Company awarded options to purchase 315,437 shares of common stock and 30,763 shares of restricted stock to employees, senior officers and to a Director. Of the total options awarded, 263,700 have a ten year term and vest in five substantially equal annual installments beginning on the first anniversary of the date of grant. The remaining options have a ten year term and vest in four annual installments beginning on the seventh anniversary of the date of grant. The restricted stock is service based, which vest in five substantially equal annual installments beginning on the first anniversary of the date of grant.
In April 2009, the Company awarded options to purchase 1,500 shares to an employee under the 2006 Plan which have a ten-year term and vest in five substantially equal annual installments beginning on the first anniversary of the date of grant.
In June 2009, the Company awarded 18,822 shares of restricted stock to eighteen nonemployee Directors of the Company and Bank. The restricted stock vests in three substantially equal annual installments beginning on the first anniversary of the date of grant.
In August 2009, the Company awarded options to purchase 5,000 shares to an employee under the 2006 Plan which have a five year term and vest in four substantially equal annual installments beginning on the first anniversary of the date of grant.
In September 2009, the Company awarded options to purchase 3,000 shares to an employee under the 2006 Plan which have a five year term and vest in three substantially equal annual installments beginning on the date of grant.
In December 2009, the Company awarded options to purchase 1,500 shares to an employee under the 2006 Plan which have a five year term and vest in four substantially equal annual installments beginning on the first anniversary of the date of grant.
Below is a summary of stock option activity (split adjusted) for the twelve months ended December 31, 2009, 2008 and 2007. The information excludes restricted stock units and awards.
| |
2009 | 2008 | 2007 | ||||||||||||||||
|---|---|---|---|---|---|---|---|---|---|---|---|---|---|---|---|---|---|---|---|
| |
Shares | Weighted-Average Grant Date Fair Value |
Shares | Weighted-Average Grant Date Fair Value |
Shares | Weighted-Average Grant Date Fair Value |
|||||||||||||
Outstanding at Beginning of Year |
1,028,580 | $ | 2.57 | 828,089 | $ | 2.98 | 989,610 | $ | 2.79 | ||||||||||
Issued |
326,437 | 2.06 | 429,715 | 1.30 | 104,433 | 2.89 | |||||||||||||
Exercised |
(38,645 | ) | 1.38 | (139,494 | ) | 1.40 | (215,859 | ) | 2.07 | ||||||||||
Forfeited |
(39,673 | ) | 2.13 | (15,047 | ) | 2.53 | (16,881 | ) | 3.19 | ||||||||||
Expired |
(50,932 | ) | 1.09 | (74,683 | ) | 1.93 | (33,214 | ) | 2.76 | ||||||||||
Outstanding at End of Year |
1,225,767 | 2.55 | 1,028,580 | 2.57 | 828,089 | 2.98 | |||||||||||||
78
Eagle Bancorp, Inc.
Notes to Consolidated Financial Statements
for the Years Ended December 31, 2009, 2008 and 2007: (Continued)
Note 13—Stock-Based Compensation (Continued)