Attached files
| file | filename |
|---|---|
| EX-31.2 - CERTIFICATION OF CFO - SECTION 302 - STEC, INC. | dex312.htm |
| EX-23.1 - CONSENT OF PRICEWATERHOUSECOOPERS LLP - STEC, INC. | dex231.htm |
| EX-31.1 - CERTIFICATION OF CEO - SECTION 302 - STEC, INC. | dex311.htm |
| EX-32.1 - CERIFICATION OF CEO - SECTION 906 - STEC, INC. | dex321.htm |
| EX-21.1 - LIST OF SUBSIDIARIES OF THE REGISTRANT - STEC, INC. | dex211.htm |
| EXCEL - IDEA: XBRL DOCUMENT - STEC, INC. | Financial_Report.xls |
| EX-32.2 - CERTIFICATION OF CFO - SECTION 906 - STEC, INC. | dex322.htm |
Table of Contents
UNITED STATES
SECURITIES AND EXCHANGE COMMISSION
Washington, D.C. 20549
FORM 10-K
(Mark One)
| x | ANNUAL REPORT PURSUANT TO SECTION 13 OR 15(d) OF THE SECURITIES EXCHANGE ACT OF 1934 |
For the fiscal year ended December 31, 2010
OR
| ¨ | TRANSITION REPORT PURSUANT TO SECTION 13 OR 15(d) OF THE SECURITIES EXCHANGE ACT OF 1934 |
For the transition period from to
Commission file number 000-31623
STEC, INC.
(Exact Name of Registrant as Specified in Its Charter)
| California | 33-0399154 | |
| (State or Other Jurisdiction of Incorporation or Organization) |
(I.R.S. Employer Identification No.) |
3001 Daimler Street
Santa Ana, California 92705-5812
(Address of principal executive offices, including zip code)
Registrant’s Telephone Number, Including Area Code: (949) 476-1180
Securities registered pursuant to Section 12(b) of the Act:
| Title of each class |
Name of each exchange on which registered | |
| Common Stock, $0.001 par value | The NASDAQ Global Select Market |
Securities registered pursuant to Section 12(g) of the Act: None
Indicate by check mark if the registrant is a well-known seasoned issuer, as defined in Rule 405 of the Securities Act. Yes x No ¨
Indicate by check mark if the registrant is not required to file reports pursuant to Section 13 or Section 15(d) of the Act. Yes ¨ No x
Indicate by check mark whether the registrant: (1) has filed all reports required to be filed by Section 13 or 15(d) of the Securities Exchange Act of 1934 during the preceding 12 months (or for such shorter period that the registrant was required to file such reports), and (2) has been subject to such filing requirements for the past 90 days. Yes x No ¨
Indicate by check mark whether the registrant has submitted electronically and posted on its corporate Web site, if any, every Interactive Data File required to be submitted and posted pursuant to Rule 405 of Regulation S-T (§232.405 of this chapter) during the preceding 12 months (or for such shorter period that the registrant was required to submit and post such files). Yes x No ¨
Indicate by a check mark if disclosure of delinquent filers pursuant to Item 405 of Regulation S-K is not contained herein, and will not be contained, to the best of registrant’s knowledge, in definitive proxy or information statements incorporated by reference in Part III of this Form 10-K or any amendment to this Form 10-K. x
Indicate by check mark whether the registrant is a large accelerated filer, an accelerated filer, a non-accelerated filer, or a smaller reporting company. See definitions of “accelerated filer,” “large accelerated filer,” and “smaller reporting company” in Rule 12b-2 of the Exchange Act.
| Large Accelerated Filer | x | Accelerated Filer | ¨ | |||
| Non-Accelerated Filer | ¨ (Do not check if a smaller reporting company) | Smaller reporting company | ¨ |
Indicate by check mark whether the registrant is a shell company (as defined in Rule 12b-2 of the Exchange Act). Yes ¨ No x
As of June 30, 2010, the last business day of the registrant’s most recently completed second fiscal quarter, the approximate aggregate market value of voting and non-voting common stock held by non-affiliates of the registrant was $545,632,889 (based upon the last closing price for shares of the registrant’s common stock as reported by The NASDAQ Global Select Market as of that date). Shares of common stock held by each officer, director, and holder of 10% or more of the outstanding common stock have been excluded in that such persons may be deemed to be affiliates. This determination of affiliate status is not necessarily a conclusive determination for other purposes.
As of February 8, 2011 there were approximately 51,147,057 shares of common stock outstanding.
Documents Incorporated By Reference
Certain information required in Part III hereto is incorporated by reference to the Proxy Statement for the Registrant’s 2011 Annual Meeting of Shareholders to be filed with the Securities and Exchange Commission pursuant to Regulation 14A not later than 120 days after the end of the fiscal year covered by this Form 10-K.
Table of Contents
STEC, INC.
FORM 10-K ANNUAL REPORT
i
Table of Contents
Forward-Looking Statements
Certain statements in this Annual Report on Form 10-K are forward-looking statements within the meaning of the Private Securities Litigation Reform Act of 1995, Section 21E of the Securities Exchange Act of 1934, as amended, and Section 27A of the Securities Act of 1933, as amended. These forward-looking statements often can be, but are not always, identified by the use of words such as “anticipate,” “assume,” “believe,” “could,” “estimate,” “expect,” “goal,” “intend,” “may,” “might,” “plan,” “potential,” “predict,” “project,” “should,” and similar expressions, or the negative of such expressions. They include, but are not limited to: statements regarding our revenue growth initiatives; growing acceptance, adoption and qualification of SSDs within the enterprise-storage and enterprise-server markets; evolving storage industry; changes in the average selling prices of our products; the loss of, or reduction in sales to, any of our key customers; our ability to deliver new and enhanced products on a timely basis; statements concerning customer adoption and utilization of our technologies and solutions; the capabilities and performance of our products; the adoption of our products into new applications; our sales, operating results and anticipated cash flows; our ability to forecast customer demand; the availability of certain components in our products that we obtain from a limited number of suppliers; competition from other companies in our industry; changes in political and economic conditions and local regulations, particularly outside of the United States; our ability to protect our intellectual property rights; and fluctuations in foreign currency exchange rates.
We base these forward-looking statements on our current expectations and projections about future events, our assumptions regarding these events and our knowledge of facts at the time the statements are made. These forward-looking statements are subject to various risks and uncertainties, including those described in this Annual Report on Form 10-K under the heading “Risk Factors” and in other filings we make from time to time with the U.S. Securities and Exchange Commission or SEC. Some of these risks and uncertainties may be outside our control and our actual results could differ materially from our projected results. We are not able to predict all of the factors that may affect future results. Forward-looking statements speak only as of the date of this Annual Report on Form 10-K. Except as required by applicable laws or regulations, we do not undertake any obligation to update or revise any forward-looking statement, whether as a result of new information, future events or otherwise.
The following discussion should be read in conjunction with our consolidated financial statements and notes thereto included elsewhere in this Annual Report on Form 10-K.
ii
Table of Contents
| ITEM 1. | BUSINESS |
Overview
STEC, Inc. (collectively with our subsidiaries, is referred to in this Report as “STEC”, “we”, “our” and “us”) is a leading global provider of enterprise-class Flash-based solid-state drives (“SSDs”) that are designed to increase the performance of enterprise-class hardware that companies use to retain and access their critical data. Our products are designed specifically for storage systems and enterprise hardware that run applications requiring a high level of input/output operations per second (“IOPS”) performance, capacity and reliability, as well as low latency.
We design and develop our SSD controllers, enhance them with proprietary firmware and combine them with multi-sourced Flash media to form high-performance SSDs, which provide a level of IOPS performance not currently possible with traditional hard disk drives (“HDDs”). We sell our SSDs to leading global enterprise hardware original equipment manufacturers (“OEMs”), which integrate them into products used by enterprises in a variety of industries including cloud computing, financial services, virtualization, Web 2.0, government, transportation, defense and transaction processing. We also manufacture small form factor Flash-based SSDs, cards and modules, as well as custom high density dynamic random access memory (“DRAM”) modules for networking, communications and industrial applications. We are headquartered in Santa Ana, California and have operations in Penang, Malaysia. We also have sales and engineering offices located in Europe and Asia.
We market our products to OEMs and OEM distributors, leveraging our custom design capabilities to offer memory solutions to address their specific needs.
We are focusing on certain revenue growth initiatives, including:
| • | Continuing to develop and qualify customized SSDs, including our ZeusIOPS® and MACH-class of products; and |
| • | Exploring new market opportunities that leverage our core SSD expertise. |
Over the past several years, we have expanded our custom design capabilities of Flash-based products for OEM applications. We have invested significantly in the design and development of customized Flash controllers, firmware and hardware. Prior strategic acquisitions also have enabled us to improve our Flash controller design capabilities, expand our product offering, add intellectual property to our portfolio, and enhance our capabilities to use third-party controllers.
Flash-based Products
Flash-based product revenue was $237.4 million, $308.2 million and $150.3 million in 2010, 2009 and 2008, respectively. Sales of Flash-based products represented 85%, 87% and 66% of our total revenues in 2010, 2009 and 2008, respectively. We expect to continue to make investments in Flash custom design capabilities and controller development.
A significant development in enterprise SSDs is the use of Multi-Level Cell (“MLC”) Flash, which is more cost-effective than Single Level Cell (“SLC”) Flash. Incorporating MLC Flash into SSDs is an increasingly important factor driving adoption of SSDs within the enterprise-storage market given the growing need for cost-effective, high-performance enterprise-storage solutions. In addition, our MLC-based SSDs are enhanced by our in-house developed technologies. As examples, our CellCare™ technology increases endurance of MLC Flash to meet enterprise life requirement levels and our Secure Array of Flash Elements (S.A.F.E.)TM technology provides added data reliability. Our MLC-based SSDs also use our proprietary controller technology to achieve fast write speeds and improved performance.
1
Table of Contents
A major area of our research and development investment has been applied to developing and advancing our SSD technologies. We believe the advantages of SSDs are currently being defined in several distinct markets including: a) enterprise-storage applications, b) enterprise-server applications, and c) government, defense and industrial applications. We see opportunities to leverage our SSD expertise across each of these markets where we believe our technology can outperform existing HDD solutions.
Although the enterprise Flash-based SSD market is relatively new, evolving and difficult to predict, we are encouraged by the variety of applications that our SSDs are able to support. As more of our customers and end-users experience the benefits of SSD technology, we believe that adoption will continue to expand. The increased use of data-tiering software by storage OEMs is also helping to increase SSD adoption as the combination of data-tiering software and SSDs enhance the overall performance level of enterprise-storage systems. In addition, we have employed certain marketing programs and sales initiatives on a selective basis with our customers, in an effort to help accelerate the adoption of our SSD products.
DRAM Products
We also offer both monolithic DRAM modules and DRAM modules based on our proprietary stacking technology. We derived $42.5 million, $38.8 million, and $71.0 million in revenues from the sale of DRAM products during 2010, 2009, and 2008, respectively. Sales of DRAM products represented 15%, 11%, and 31% of our total revenues in 2010, 2009, and 2008, respectively. The increase in sales of DRAM products in absolute dollars and as a percentage of our total revenues from 2009 to 2010 was due primarily to an increase in product sales to a single customer. The decrease in sales of DRAM products in absolute dollars and as a percentage of our total revenues from 2008 to 2009 was due primarily to a focus on growing SSD-based product sales which resulted in a change in the composition of our product mix in 2009, reflecting a greater percentage of SSD revenues and a decrease in DRAM revenues.
Recent Developments
With respect to the government, defense and industrial market, we signed an OEM Agreement (“Agreement”) in May 2009 to supply a defense systems contractor (“Defense Contractor”) with approximately $28 million of our MACH-family product through a distributor over a 14-month period that ended on July 31, 2010. At the expiration of the Agreement, the Defense Contractor had only purchased approximately $14 million of its $28 million order commitment. As a result, we agreed to a termination settlement with the Defense Contractor in September 2010. The terms of the settlement included provisions for the Defense Contractor to pay STEC a $2.0 million cash settlement, which we received on October 19, 2010, plus an additional final resolution payment if the Defense Contractor does not meet a certain minimum future SSD purchase target by January 1, 2013. The settlement also grants us preferred supplier status with the Defense Contractor through January 1, 2013.
Malaysia Tax Holiday
We have been granted a fifteen-year tax holiday for our operations in Malaysia subject to meeting certain conditions. This tax holiday in Malaysia is effective through September 30, 2022. The impact of the Malaysia tax holiday decreased the provision for income taxes by $4.9 million or $0.09 per share, $3.2 million or $0.06 per share and $1.8 million or $0.04 per share in 2010, 2009 and 2008, respectively.
Customers
Historically, a limited number of customers have accounted for a significant percentage of our revenues. Our ten largest customers accounted for an aggregate of 88.0% of our revenues in 2010, compared to 86.9% of
2
Table of Contents
our revenues in 2009, and 77.2% of our revenues in 2008. With certain exceptions, sales of our products are generally made through individual purchase orders and, in certain cases, are made under master agreements governing the terms and conditions of the customer relationships.
We expect that sales of our products to a limited number of customers will continue to account for a majority of our revenues in the foreseeable future and believe that our financial results will depend in significant part upon the success of our customers. The composition of our major customer base changes from quarter to quarter as the market demand for our products changes, and we expect this variability will continue in the future. The loss of, or a significant reduction in purchases by, any of our major customers would harm our business, financial condition and results of operations. See Item 1A, “Risk Factors—Historically, sales to a limited number of customers, particularly EMC Corporation, have comprised a significant portion of our revenues and the loss of, or significant reduction in purchases by, any key customer could materially impact our financial results.”
Our Industry
For the past half century, computing system OEMs have relied primarily on two storage technologies: DRAM and HDDs. Over time, microprocessor capabilities in their computing systems have dramatically outpaced the performance capabilities of HDDs, thus creating the need for faster access to storage; DRAM is cost- and power-prohibitive for many applications. As a result, we have developed SSDs that represent a new tier of storage that allows users to access data faster and on a more efficient basis than HDDs.
A well-designed SSD delivers a valuable and unique set of characteristics, which are a combination of faster performance, better reliability and improved energy efficiency when compared to an HDD. We believe that, across the range of enterprise-storage and enterprise-server OEMs, SSDs are a vital tier of storage which renders compelling value to the end-users of those enterprise systems by delivering enhanced performance and significant power savings over comparative systems built only with HDDs.
We believe that we are a leader in solid-state storage technology. Throughout our history, we have delivered advanced memory and storage solutions to a wide range of customers in various market segments, and we continue to develop products to meet the need of enterprises that consistently improve the retention of, and access to, critical data at high-performance levels.
Our Solutions
STEC designs, manufactures and markets enterprise-class SSDs for use in high-performance enterprise applications, and high-density DRAM modules for networking, communications and industrial applications. We are a global design and manufacturing company focused on customized storage solutions for a broad spectrum of system platforms, with most sales based on a cooperative design effort with our customers. We offer our customers a comprehensive technology solution from concept to design to the creation of prototypes through volume production and testing.
Product Features
The key features of our products include:
| • | Proprietary controller Integrated Circuit (“IC”) technology. In order to be first-to-market with innovative storage technologies, we typically design the fundamental logic for our SSD products. The controllers and their operating firmware within our various SSD products are the key to enabling high levels of performance and reliability. |
| • | High degree of customization. Products sold to our customers are typically customized by our design and engineering teams to meet our customers’ specific design requirements. |
3
Table of Contents
| • | High performance. Our SSD technology is optimized for low-latency, fast access times and sustained high megabyte-per-second speeds. |
| • | Endurance. Products enabled with our CellCare™ technology have increased endurance to meet enterprise life requirements. |
| • | High reliability. Our products are built utilizing sophisticated error detection and correction processes to provide high data reliability and integrity. In addition, our products are designed to withstand high levels of shock and vibration as well as extreme temperature fluctuations. Products enabled with our Secure Array of Flash Elements (S.A.F.E.)TM technology provide added data reliability. |
| • | Low power consumption. Since fewer SSDs are required to achieve similar IOPS performance as multiple HDDs, systems built with SSDs can consume significantly less power than similarly performing HDD-based systems. |
| • | Compact size. We are able to manufacture high-density products with some of the smallest form factors in the market in order to meet the ever-reducing size requirements of our customers’ products. |
| • | High density. Our patented stacking technologies allow us to design and manufacture products in which multiple memory chips are stacked vertically to increase the capacities without increasing the product footprint. In some cases, our IC Tower and stacking memory technologies allow us to create high capacity solutions. |
Solid-State Drive/Flash-based Products
Our SSD products are used in a wide range of applications, all of which demand high-reliability, high-capacity, and/or high IOPS performance.
We offer a broad line of SSD products in various form factors and capacities, including:
| • | ZeusIOPS®. STEC’s ZeusIOPS® SSDs are high-performance enterprise-class data storage solutions. Built for speed, one ZeusIOPS® drive can replace multiple hard drives or eliminate the need to utilize additional DRAM to overcome performance bottlenecks, resulting in reduced energy and space requirements. |
| • | MACH-class. STEC’s MACH-class SSDs are small form factor, high throughput storage solutions for mission-critical systems in a variety of industries. The MACH-class SSDs are ideal for enterprise-storage and servers that expose drives to challenging workloads typified by randomly mixed reads and writes under rigorous workloads. |
| • | ZeusRAM SSD. STEC’s ZeusRAM-class SSD is a product offering for enterprise-storage subsystems built specifically for fast and continuous read/write workloads, including metadata logging, journaling, and database indexing applications. Our ZeusRAM-class SSD utilizes fully-backed up DRAM to Flash, providing power back-up protection in the event of a host system’s power loss, and provide an enterprise drive that is highly reliable with superior wear-resistance. |
Flash Cards and Flash Modules
CompactFlash Memory. CompactFlash products provide full PC Card ATA functionality but are only one-fourth the size of a standard PC Card. CompactFlash memory cards are characterized by their small size, durability, and low power consumption. CompactFlash products provide interoperability with systems based on the PC Card ATA standard by using a low-cost passive adapter, thus making CompactFlash widely used by a variety of applications.
Flash Modules. Our Flash module products include USB and Serial ATA interfaces and are targeted toward embedded systems where device footprint and low power are critical design parameters. Flash modules have
4
Table of Contents
several distinct advantages over traditional HDDs in that they are typically easier to incorporate into designs because they are less than one-quarter of the size of a 2.5-inch hard drive, plug directly into the motherboard, eliminating the need for cables, and consume less than half the power. There is no electrical circuitry or software interface change required when replacing a standard hard drive with a Flash module.
USB Flash Drive. Built upon an industrial-grade Flash controller technology ranging in capacity from 1GB to 8GB, STEC’s USB Flash Drive (“UFD”) couples convenience and portability with performance and reliability. Advanced OEM features include boot capability, endurance for industrial operating conditions and laser-etched manufacturing information including a unique serial number.
Single Chip Drive. Available with an Integrated Drive Electronics (“IDE”) interface, the Single Chip Drive™ (“SCD”) is a small form factor, solid-state Flash disk with no moving parts. Using STEC’s patented IC Tower Stacking Technology, SCDs are available in the highest capacities in the industry. The standard USB or IDE interface provides designers with a true “plug-n-play” storage device, allowing for short design cycles and fast time-to-market.
DRAM Products
We offer a full range of DRAM products, including dual in-line memory modules (“DIMMs”), small-outline DIMMs (“SODIMMs”), mini-registered DIMMs (“mini-RDIMMs”), very low profile registered DIMMs (“VLP RDIMMs”) and Fully-Buffered DIMMs (“FB-DIMMs”). Our DRAM products are used in higher performance computing, communications, and industrial applications. We offer these products with different DRAM architectures such as FB-DIMM, double data rate (“DDR”), DDR2, DDR3 and synchronous DRAM (“SDRAM”).
Stacked ICs on Products
IC Tower Stacked Components. Our patented IC Tower semiconductor stacking technology enables the manufacturing of high-capacity memory products. We offer a wide selection of stacked components for both thin small outline package (“TSOP”) and ball grid array (“BGA”) semiconductor packages for use on memory modules and within our high-capacity Flash-based products. This technology is used in complex, high-capacity module designs and systems. It provides a cost effective solution for our customers by offering chip densities that are less expensive than non-stacked components on a per megabyte (“MB”) basis.
Research and Development
Our research and development staff develops reliable, high-performance and cost-effective storage products to address the needs of traditional and emerging computing applications. We believe the timely development of new products is essential to maintaining our competitive position. Our engineering staff, which consisted of 268 persons as of December 31, 2010, is focused on all facets of complex system-level product design. Functionally, the engineering team has dedicated expertise in IC design, firmware for media management, firmware for host compatibility, and system-level product integration. An important aspect of our research and development effort is to understand the challenges presented by our customers’ requirements and satisfy them by utilizing our proprietary technologies and our technical expertise. In the course of meeting our customers’ challenges, we are often required to develop new technologies and processes, which are later added to our product offerings.
A part of the engineering and development effort is associated with processes which enable high-volume manufacturing. Our research and development efforts include test software development in the form of proprietary tools and utilities that are tightly integrated with our SSD controller development and innovative approaches to the manufacturing test processes required to deliver STEC’s SSDs, Flash and DRAM products.
Research and development expense was $44.1 million, $27.5 million and $21.1 million in 2010, 2009 and 2008, respectively.
5
Table of Contents
Design, Manufacturing and Testing
Design and production. The typical production cycle consists of a design stage followed by a prototype stage and ends with full production of the final product. By working with our customers early in the design and prototype stages, we believe we are able to resolve critical design issues effectively and efficiently. In addition, we believe working closely with our customers throughout the design and production stages, allows us to gain important insights into their future product requirements.
Manufacturing. Our manufacturing processes are highly automated and involve the use of specialized equipment for the production of SSD and memory products. Our manufacturing systems have been optimized to support the placement of a large number of IC devices on each SSD board. We believe we are able to achieve a high manufacturing yield and minimize direct labor costs as a result of our design efficiencies, high level of automation and general manufacturing expertise. Because our manufacturing systems can be easily configured for different memory products, we have the ability to offer our customers short manufacturing and test cycles on small and large projects. We also have developed an automated method of manufacturing our stacking products which we believe results in further manufacturing efficiencies. Our manufacturing processes are ISO 9001 and ISO 14001 certified.
Test engineering. An important aspect of our manufacturing operations is our focus on test engineering. We test all of our SSD and memory products upon completion of manufacturing, which we believe results in low returns due to product defects. We believe our test engineering expertise will continue to grow in importance as the speed and complexity of SSD and memory products increase. Our test engineering group develops proprietary processes which, together with our continued investment in advanced testing equipment, have enabled us to consistently produce high-quality products.
Customers
We market our products to OEMs and OEM distributors, leveraging industry leadership in SSD technology to address their specific needs. In 2010, we sold to more than 210 customers, comprised of direct sales and sales through distributors and contract manufacturers. Our OEM customers make the purchasing decisions on substantially all of the products that we sell through distributors and contract manufacturers. Our ten largest customers accounted for an aggregate of 88.0% of our total revenues in 2010, 86.9% of our total revenues in 2009, and 77.2% of our total revenues in 2008. EMC Corporation (“EMC”) accounted for 37.8%, 45.1% and 15.2% of our total revenues in 2010, 2009 and 2008, respectively. IBM accounted for 13.2% of our total revenues in 2010 and less than 10% of our total revenues in 2009 and 2008. SMART Modular accounted for 13.0% and 34.4% of our total revenues in 2010 and 2008, respectively, and less than 10% of our total revenues in 2009. Hitachi accounted for 10.8% of our total revenues in 2010 and less than 10% of our total revenues in 2009 and 2008. There were no other customers that accounted for more than 10% of our revenues in 2010, 2009 and 2008. EMC and IBM accounted for 51.8% and 20.7%, respectively, of accounts receivable as of December 31, 2010. EMC accounted for 78.1% of accounts receivable as of December 31, 2009.
6
Table of Contents
Revenues and Assets by Geographic Region
Sales, which are derived from billings to customers, by geographic region are presented as a percentage of total revenues as follows:
| 2010 | 2009 | 2008 | ||||||||||
| United States |
40.9 | % | 49.8 | % | 73.7 | % | ||||||
| Singapore |
22.9 | % | * | * | ||||||||
| Czech Republic |
12.2 | % | 16.1 | % | * | |||||||
| Malaysia |
10.9 | % | 12.0 | % | 11.1 | % | ||||||
| Other |
13.1 | % | 22.1 | % | 15.2 | % | ||||||
| Total |
100.0 | % | 100.0 | % | 100.0 | % | ||||||
| * | Less than 10% |
Substantially all of our foreign sales are shipped internationally through our facility in Malaysia. For additional information regarding our international sales, see Item 1A, “Risk Factors—We face risks associated with doing business in foreign countries, including foreign currency fluctuations and trade barriers, that could lead to a decrease in demand for our products or an increase in the cost of the components used in our products.”
Total assets by geographic region for the years ended December 31, 2010 and 2009 were as follows (amounts in thousands):
| December 31, 2010 |
December 31, 2009 |
|||||||
| United States |
$ | 183,724 | $ | 180,076 | ||||
| Malaysia |
156,407 | 136,913 | ||||||
| Other |
25,523 | 8,573 | ||||||
| Total |
$ | 365,654 | $ | 325,562 | ||||
Sales and Marketing
We primarily use an internal direct sales force and OEM distributors for sales to our customers in the U.S. and internationally. We support our customer base through an integrated sales force based on vertical market segments. We have developed our sales force to have the local presence, market knowledge and strategic insight to allow us to more effectively market our products to a focused number of large OEM customers who represent the vast majority of the enterprise-storage market. In addition, as part of our sales and marketing efforts, our experienced application engineers work closely with our customers’ engineering teams both in designing our products into their systems, as well as with addressing any issues that arise during the implementation of our products in deployed systems.
Customer Service and Support
We provide our customers with comprehensive product service and support. We work closely with our customers to monitor the performance of their product designs and to provide application design and support. This also provides us with insight into defining their needs and subsequent generations of products. Our standard customer support package is generally offered with all product sales and includes full technical documentation and application design assistance. During our customers’ production phase, we provide extensive support which includes training, system-level design, implementation and integration support. We believe that tailoring our technical support to our customers’ needs is essential to the success of our product introductions and customer satisfaction.
7
Table of Contents
Competition
We conduct business in an industry characterized by competition, rapid technological change, evolving industry standards, declining average sales prices and product obsolescence. We primarily compete with Hitachi GST, Intel, Micron, Samsung, SanDisk, Seagate, SMART Modular, Toshiba, and Western Digital in connection with the sale of our products. Our competitors include many large U.S. and international companies that have substantially greater financial, technical, marketing, distribution and other resources, broader product lines, lower cost structures, greater brand recognition and longer-standing relationships with customers and suppliers.
We expect to face competition from existing competitors as well as new and emerging companies that may enter our existing or future markets. These companies may have similar or alternative products that are less costly or provide additional features. In addition, some of our significant suppliers, including Micron, Samsung and Toshiba are also our competitors and have the ability to manufacture competitive products at lower costs as a result of their higher levels of integration. Further, these suppliers may reduce the supply of memory chips available to the industry or us. We also face competition from current and prospective customers that evaluate our capabilities against the merits of manufacturing products internally. Competition may arise from new and emerging companies or from the development of cooperative relationships among our current and potential competitors or third parties to increase the ability of their products to address the needs of our prospective customers. Accordingly, it is possible that new competitors or alliances among competitors may emerge and rapidly acquire significant market share.
We compete in our target markets primarily on technology, quality, and service. We expect our competitors will continue to improve the performance of their current products, reduce their current product sales prices and introduce new products that may offer greater performance and improved pricing, any of which could cause a decline in sales or loss of market acceptance of our products.
To remain competitive, we must, among other things:
| • | Provide best-of-class design, manufacturing and test engineering services; |
| • | Maintain quality levels; |
| • | Provide technologically advanced products; |
| • | Successfully protect our intellectual property rights; |
| • | Accurately anticipate and prepare for new technological trends and standards in the industry; |
| • | Compete favorably on the basis of price; |
| • | Offer flexible delivery schedules; and |
| • | Deliver finished products on a timely basis in sufficient volume to satisfy our customers’ requirements. |
The enterprise-storage, enterprise-server, and government, defense and industrial applications markets are subject to rapid technological change, product obsolescence, frequent new product introductions and enhancements, changes in end-user requirements and evolving industry standards. Our ability to compete in these markets will depend in significant part upon our ability to successfully develop, introduce and sell new and enhanced products on a timely and cost-effective basis, and to respond to changing customer requirements.
Suppliers
Typically IC devices represent more than 80% of the component costs of our products. We are dependent on a small number of suppliers to supply Flash and DRAM IC devices. We periodically review opportunities to develop alternative sources for our Flash IC and DRAM IC device needs. However, our options are very limited because of the small number of memory manufacturers. Our dependence on a small number of suppliers and the
8
Table of Contents
lack of any guaranteed sources of supply expose us to several risks, including the inability to obtain an adequate supply of components, price increases, late deliveries and poor component quality. In 2010, Hynix, Samsung and Toshiba supplied substantially all of the IC devices used in our Flash-based products while Micron and Samsung supplied substantially all of the DRAM IC devices used in our DRAM products. For risks associated with our supplier relationships, see Item 1A, “Risk Factors—Our dependence on a small number of suppliers for components, including integrated circuit devices, and our inability to obtain a sufficient supply of these components on a timely basis could harm our ability to fulfill orders.”
Seasonality
In the past, we have had and expect to continue to experience some seasonality in our business resulting in higher sales generally in the fourth quarter of each year due to corporate customers seeking to spend their full capital budgets before the end of each year.
Backlog
With certain exceptions, sales of our products are generally made through individual purchase orders and, in certain cases, are made under master agreements governing the terms and conditions of the relationships. We include in our backlog only those customer orders for which we have accepted purchase orders and to which we have assigned shipment dates within the upcoming six months. Since orders constituting our backlog are subject to change due to, among other things, customer cancellations and reschedulings and our ability to procure necessary components, backlog is not necessarily an indication of future revenues. In addition, there can be no assurance that current backlog will necessarily lead to revenues in any future period. In the absence of a non-cancellable customer supply agreement, our ability to predict future sales is limited because a majority of our quarterly product revenues come from orders that are received just prior to or within the same quarter. In addition, our SSDs are currently offered as options in our customers’ systems. Therefore, the demand for these SSDs is unpredictable and fully dependent on end-user requirements. Unless and until our SSDs are offered as a standard feature in our customers’ systems, our demand visibility will continue to be limited. Our backlog was $48.9 million as of December 31, 2010 and $14.8 million as of December 31, 2009. Our backlog has increased due primarily to an increase in customer orders for our SSD products.
Intellectual Property Rights
We regard our patents, trademarks, trade secrets and other intellectual property as critical to our success. We rely on patents, trademarks, copyrights and trade secret laws, confidentiality procedures, and employee disclosure and invention assignment agreements to protect our intellectual property rights.
As of February 8, 2011, we owned 23 patents and 57 additional patent applications were pending. We have agreements to license certain of our intellectual property to third parties. In addition, we have entered into several licensing agreements to license the intellectual property of others. Although we consider the patents currently held by us to be critical to our success, there can be no assurance that any patents currently held by us or any patents that may be granted to us in the future will not be challenged, invalidated or circumvented, or that rights granted thereunder will provide meaningful protection or other commercial advantage to us. There can be no assurance that third parties will not develop similar products, duplicate our products or design around the patents currently owned by us or which may be granted to us in the future. Because we view intellectual property rights as critical to our success, we intend to pursue future patents and other intellectual property rights in the U.S. There can be no assurance that we will be successful in these endeavors. In addition, there can be no assurance that our trade secrets and know-how may not become known to third parties, or become part of the public domain, which in either case would harm our financial performance and business operations.
We have previously applied for, and may in the future apply for, patent protection in foreign countries. The laws of foreign countries, however, may not adequately protect our intellectual property rights. Many U.S.
9
Table of Contents
companies have encountered substantial infringement problems in some foreign countries. Because we sell our products internationally, we have exposure to foreign intellectual property risks.
Our industry is characterized by vigorous protection and pursuit of intellectual property rights. We believe that it may be necessary, from time to time, to initiate litigation against third parties to preserve our intellectual property rights. In addition, from time to time, third parties may bring suits against us.
In the event of an adverse result in any such litigation, we could be required to pay substantial damages, cease the manufacture, use and sale of certain products, expend significant resources to develop non-infringing technology, discontinue the use of certain processes or obtain licenses to use infringed technology. Any litigation in which we are either plaintiff or defendant would likely result in significant expense to us and divert the efforts of our technical and management personnel, whether or not such litigation is ultimately determined in our favor. In addition, the results of any litigation are inherently uncertain.
In the event we desire to incorporate third-party technology into our products or our products are found to infringe on others’ patents or intellectual property rights, we may be required to license such patents or intellectual property rights. If we obtain licenses from third parties, we may be required to pay license fees or make royalty payments, which could reduce our gross margins. If we are unable to obtain a license from a third party for technology, we could incur substantial liabilities or be required to expend substantial resources redesigning our products to eliminate the infringement. There can be no assurance that we would be successful in redesigning our products or that we could obtain licenses on commercially reasonable terms, if at all. In addition, any development or license negotiations could require substantial expenditures of time and other resources by us.
As is common in the industry, we currently have in effect a number of agreements in which we have agreed to defend, indemnify and hold harmless our customers and suppliers from damages and costs which may arise from the infringement by our products and services of third-party patents, trademarks or other proprietary rights. The scope of such indemnity varies, but may, in some instances, include indemnification for damages and expenses, including attorneys’ fees. We may from time to time be engaged in litigation as a result of such indemnification obligations. Our insurance does not cover intellectual property infringement. The term of these indemnification agreements is generally perpetual any time after execution of the agreement. The maximum potential amount of future payments we could be required to make under these indemnification agreements is generally unlimited. We may periodically have to respond to claims and litigate these types of indemnification obligations. Any such indemnification claims could require us to pay substantial damages that may result in a material adverse effect on our business and results of operations.
In our efforts to maintain the confidentiality and ownership of trade secrets and other confidential information, our employees are required to sign employee non-disclosure agreements and our engineers are required to sign invention assignment agreements. The invention assignment agreements require our engineers to disclose, document and assign their interest in all inventions, patents and copyrights developed while employed with us. Our employees agree to preserve all of our confidential information including trade secrets, customer information, know-how and other business information. There can be no assurance that these agreements will provide meaningful protection of our trade secrets or other confidential information in the event of unauthorized use or disclosure of such information. See Item 1A, “Risk Factors—Our intellectual property may not be adequately protected, which could harm our competitive position.”
Employees
As of December 31, 2010, we had 809 full-time employees, consisting of 348 in manufacturing (including test, quality assurance and material management), 86 in sales and marketing, 107 in administration and 268 in research and development. Our employees are not represented by any collective bargaining agreements and we have never experienced a work stoppage. Management believes that relations with our employees are satisfactory.
10
Table of Contents
During the first quarter of 2009, we commenced a reduction of our workforce primarily at our Santa Ana, California headquarters as part of the transition of certain of our operations to our facility in Penang, Malaysia. During the second quarter of 2010, we commenced the second phase of a reduction in our workforce, which also primarily impacted our Santa Ana, California headquarters and was completed as of December 31, 2010 (see Note 5 of Notes to Consolidated Financial Statements, included in Part IV, Item 15 of this Report).
Available Information
We are a California corporation, incorporated in 1990. Our principal executive offices are located at 3001 Daimler Street, Santa Ana, California, 92705, and our telephone number at that location is 949-476-1180. Our primary manufacturing facility is located in Penang, Malaysia. Our Internet address is www.stec-inc.com. The inclusion of our website address in this Report does not include or incorporate by reference into this Report any information on our website. We make available on our website, free of charge, our filings made with the U.S. Securities and Exchange Commission (“SEC”) electronically, including our reports on Form 10-K, Form 10-Q and Form 8-K, and any amendments to those filings. These reports are available on our website as soon as reasonably practicable after we electronically file them with the SEC. These reports, and any amendments to them, are also available at the internet website of the SEC, www.sec.gov. The public may also read and copy any materials we file with the SEC at the SEC’s Public Reference Room located at 100 F Street, N.E., Washington, D.C., 20549. In order to obtain information about the operation of the Public Reference Room, you may call 1-800-732-0330.
We have adopted a Code of Business Conduct and Ethics that applies to our employees (including our principal executive officer, principal financial officer, principal accounting officer or controller, or persons performing similar functions) and directors. A copy of our Code of Business Conduct and Ethics can be found under the “Investor Relations” section of our website. We may post amendments to or waivers of the provisions of the Code of Business Conduct and Ethics, if any, made with respect to any of our directors and executive officers on that website. The information on our website is not incorporated by reference in this Annual Report on Form 10-K.
| ITEM 1A. | RISK FACTORS |
Investing in our common stock involves a high degree of risk. Before deciding to purchase, hold or sell our common stock, you should carefully consider the risks described below in addition to the cautionary statements and risks described elsewhere and the other information contained in this report and in our other filings with the SEC, including subsequent reports on Forms 10-Q and 8-K. The risks and uncertainties described below are not the only ones we face. Additional risks and uncertainties not presently known to us or that we currently deem immaterial may also impair our business operations. If any of these known or unknown risks or uncertainties actually occurs with material adverse effects on STEC, our business, financial condition, results of operations and/or liquidity could be seriously harmed, which could cause our actual results to vary materially from recent results or from our anticipated future results. In addition, the trading price of our common stock could decline due to any of these known or unknown risks or uncertainties, and you could lose all or part of your investment.
Historically, sales to a limited number of customers, particularly EMC Corporation, have comprised a significant portion of our revenues and the loss of, or significant reduction in purchases by, any key customer could materially impact our financial results.
Historically, sales to a relatively limited number of customers have accounted for a significant percentage of our revenues. In 2010, 2009 and 2008, sales to our ten largest customers accounted for an aggregate of 88.0%, 86.9% and 77.2%, respectively, of our total revenues. In 2010 and 2009, our largest customer was EMC Corporation (“EMC”), which accounted for 37.8% and 45.1%, respectively, of our total revenues.
The major industries in which we participate are dominated by a limited number of OEM companies; therefore, the rate of SSD adoption will be driven by a limited number of potential customers. In addition, the
11
Table of Contents
industries in which many of our customers compete have experienced, and may continue to experience, consolidation which may result in increased customer concentration and/or the loss of customers. The composition of our major customer base changes from quarter to quarter as the market demand for our customers’ products changes, and we expect this variability to continue in the future. Our customers’ demand for our products can vary considerably from quarter to quarter, and it is difficult to forecast our customers’ demand beyond the immediate future, as purchases in one period may not be indicative of purchases in future periods. We expect that sales of our products to a limited number of customers will continue to comprise a substantial portion of our revenues for the foreseeable future. The loss of, or a significant reduction in purchases by, any of our major customers could materially harm our business, financial condition and results of operations. For example, the results of our operations during the first half of 2010 were negatively impacted due to an inventory carryover by EMC. If we are unable to secure significant purchase orders from EMC in the future, our financial results may be negatively impacted.
The market for enterprise Flash-based SSD products is relatively new and rapidly evolving, which makes it difficult to forecast end-user adoption rates and customer demand for our products.
The enterprise Flash-based SSD market is relatively new and rapidly evolving. As a result, we may encounter risks and uncertainties related to our business and future prospects. It is difficult to predict, with any precision, end-user adoption rates, customer demand for our products or the future growth rate and size of this market. Our ability to predict future sales is further limited because our SSDs are currently offered as options in our customers’ systems. Unless and until our SSDs are offered as a standard feature in our customers’ systems, this product runs the risk of serving a niche market and may never reach mass adoption, and our demand visibility may continue to be limited.
We may not be able to maintain or improve our competitive position because of the intense competition in the memory and storage industry.
We conduct business in an industry characterized by intense competition. We primarily compete with Hitachi GST, Intel, Micron, Samsung, SanDisk, Seagate, SMART Modular, Toshiba, and Western Digital in connection with the sale of our products. Our competitors include many large U.S. and international companies that have substantially greater financial, technical, marketing, distribution and other resources, broader product lines, lower cost structures, greater brand recognition and longer-standing relationships with customers and suppliers. As a result, our competitors may be in a better position than us to influence or respond to new or emerging technologies or standards and changes in customer requirements. Our competitors may also be able to devote greater resources to the development, promotion and sale of products, and may be able to deliver competitive products at a lower price.
Some of our competitors earn a significant portion of their revenue from business units outside the storage industry. Because they do not depend solely on sales of storage products to achieve profitability, they may sell storage devices at lower prices and operate their storage business unit at a loss over an extended period of time while choosing to offset these losses with profits from other business units. Our operating results may be adversely affected if we cannot successfully compete with the pricing by these companies.
Some of our significant suppliers, including Samsung and Toshiba, are also our competitors, and have the ability to manufacture competitive products at lower costs as a result of their higher levels of integration. In addition, these suppliers may reduce the supply of memory chips available to the industry or us. We also face competition from current and prospective customers that evaluate our capabilities against the merits of manufacturing products internally. Competition may arise from new and emerging companies or from the development of cooperative relationships among our current and potential competitors or third parties to develop products that address the needs of our customers. We expect our competitors will continue to improve the performance of their current products, reduce their prices and introduce new products that may offer greater
12
Table of Contents
performance, or otherwise render our technology or products obsolete or uncompetitive, any of which could cause a decline in our operating results or loss of market acceptance of our products.
The introduction and acceptance of new and enhanced versions of our products may cause fluctuations in our operating results.
The introduction of new and enhanced versions of our products may shorten the life cycle of our existing products, or replace sales of some of our current products, thereby offsetting the benefit of even a successful product introduction, and may cause customers to defer purchasing our existing products in anticipation of the new and enhanced versions. Conversely, customers may accelerate purchases of existing products and defer purchases of new life cycle products due to the cost and lead times involved in the qualification of new products. Any of these instances may cause volatility in our operating results and fluctuations in our inventory levels. The complexity and difficulties in managing product transitions at the end-of-life stage of a product can also create excess inventory associated with the outgoing product that can also lead to product obsolescence and increased expenses. Any or all of the above problems could materially harm our business and operating results.
Our dependence on a small number of suppliers for components, including integrated circuit devices, and our inability to obtain a sufficient supply of these components on a timely basis could harm our ability to fulfill orders.
Typically integrated circuit (“IC”) devices represent more than 80% of the component costs of our products. We are dependent on a small number of suppliers that supply key components used in the manufacture of our products. Since we have no long-term supply contracts, there is no assurance that our suppliers will agree to supply the quantities of components we may need to meet our production requirements. In 2010, Samsung and Toshiba supplied substantially all of the IC devices used in our Flash-based products while Micron and Samsung supplied substantially all of the DRAM IC devices used in our DRAM products.
Our customers typically qualify the specific controller and Flash and DRAM ICs that are components in our products as part of the product qualification process. If any of our suppliers experience quality control problems, our products that utilize that supplier’s ICs may be disqualified by one or more of our customers. A supplier disqualification would disrupt our supply of ICs, reduce the number of suppliers available to us and adversely affect our ability to fulfill our customers’ product orders. In some instances, we may be required to qualify a new supplier’s ICs, which could negatively impact our revenues during the new qualification process. There can be no assurance that we would be able to find and successfully qualify new suppliers in a timely manner or obtain ICs from new suppliers on commercially reasonable terms, which could damage our relationships with existing or potential customers and could materially harm our operating results.
Moreover, from time to time, our suppliers experience shortages in IC devices and foundry services which have resulted in placing their customers, including us, on component allocation. This means that while we may have customer orders, we may not be able to obtain the materials that we need to fill those orders in a timely manner or at competitive prices. As a result, our reputation could be harmed, we may lose business from our customers, our revenues may decline, and we may lose market share to our competitors.
In addition to Flash and DRAM ICs, a number of other components that we use in our products are available from only a single or limited number of suppliers. In the development of our own application-specific ICs (“ASICs”), we also depend on certain foundry subcontractors to manufacture these ASICs as well as on certain third-party subcontractors to assemble, obtain packaging materials for, and test these ASICs. Our dependence on a small number of suppliers and the lack of any guaranteed sources of supply expose us to several risks, including:
| • | The inability to obtain an adequate supply of components; |
| • | Price increases, late deliveries and poor component quality; |
13
Table of Contents
| • | An unwillingness of a supplier to supply such components to us; |
| • | A key supplier’s or sub-supplier’s inability to access credit necessary to operate its business; |
| • | Failure of a key supplier to remain in business or adjust to market conditions; |
| • | Consolidation among suppliers, resulting in some suppliers exiting the industry or discontinuing the manufacture of components; or |
| • | Failure of a supplier to meet our quality, yield or production requirements. |
Since we have no long-term supply contracts with these third-party foundry subcontractors, there is no guarantee that they will devote sufficient resources to manufacture our components. If we are unable to increase the capacity of our current subcontractors or qualify and engage additional subcontractors, we may not be able to meet demand for our products, which could adversely affect our revenue and results of operations. In addition, we are not able to directly control component delivery schedules.
We may be less competitive if we fail to develop new and enhanced products and introduce them in a timely manner.
The enterprise-storage, enterprise-server, and government, defense and industrial applications markets are subject to rapid technological change, product obsolescence, frequent new product introductions and enhancements, changes in end-user requirements and evolving industry standards. Our ability to compete in these markets will depend in significant part upon our ability to successfully develop, introduce and sell new and enhanced products on a timely and cost-effective basis, and to respond to changing customer requirements.
Delays in the development and introduction of new products could provide a competitor a first-to-market opportunity and allow a competitor to achieve greater market share. Once a customer designs a competitor’s product into its product offering, it becomes significantly more difficult for us to sell our products to that customer because changing suppliers involves significant cost, time, effort and risk for the customer. Our product development is inherently risky because it is difficult to foresee developments in technology, anticipate the adoption of new standards, coordinate our technical personnel, and identify and eliminate design flaws. Defects or errors found in our products after commencement of production could result in significant delays and damage our reputation and competitive position. New products, even if first introduced by us, may not gain market acceptance or result in future profitability. Lack of market acceptance for our new products will jeopardize our ability to recoup research and development expenditures, hurt our reputation and harm our business, financial condition and results of operations. In addition, after we have developed a new product, our customers will usually test and evaluate our products for three or more months before qualifying it for production and an additional three or more months to begin volume production of the equipment that incorporates our products. Even if a customer selects our product to incorporate into its equipment, we have no assurance that the customer will ultimately bring its product to market or that such effort by our customer will be successful.
We may also seek to develop products with new standards for our industry; however, it will take time for these new standards and products to be adopted, for customers to accept and transition to these new products and for significant sales to be generated from them, if this happens at all. Moreover, broad acceptance of new standards or products by customers may reduce demand for our older products. If this decreased demand is not offset by increased demand for our new products, our results of operations could be harmed. There can be no assurances that any new products or standards we develop will be commercially successful.
Disruption of operations at our manufacturing facilities in Penang, Malaysia would substantially harm our business.
Substantially all of our manufacturing operations are located in Penang, Malaysia. Due to this geographic concentration, a disruption of our manufacturing operations, whether as a result of sustained process
14
Table of Contents
abnormalities, human error, government intervention, political instability, power failures or natural disasters, including earthquakes, fires or floods, or otherwise, could cause us to cease or limit our manufacturing operations which would harm our business, financial condition and results of operations.
If our products fail to meet our or our customers’ specifications for quality and reliability, our results of operations may be adversely impacted and our competitive position may suffer.
Although we place great emphasis on product quality, we may from time to time experience problems with the performance of our products, which could result in one or more of the following:
| • | Increased costs related to fulfillment of our warranty obligations; |
| • | The reduction, delay or cancellation of orders or the return of a significant amount of products; |
| • | Focused failure analysis causing distraction of the sales, operations and management teams; or |
| • | The loss of reputations in the market and customer goodwill. |
These factors could cause our business, financial condition and results of operations to be materially and adversely affected.
Demand for storage capacity may not continue to grow at current industry estimates, which may lower the prices our customers are willing to pay for new products.
Our customers’ demand for storage capacity may not continue to grow at current industry estimates as a result of developments in the regulation and enforcement of digital rights management, the emergence of processes such as cloud computing, data deduplication and storage virtualization, or otherwise. These factors could lead to our customers’ storage capacity needs being satisfied at lower prices, thereby decreasing our revenue. As a result, even with increasing aggregate demand for storage capacity, our average selling prices could decline, which could adversely affect our operating results.
We may make acquisitions that are dilutive to existing shareholders, result in unanticipated accounting charges or otherwise adversely affect our results of operations.
We intend to grow our business through business combinations or other acquisitions of businesses, products or technologies that allow us to complement our existing product offerings, expand our market coverage, increase our engineering workforce or enhance our technological capabilities. If we make any future acquisitions, we could issue stock that would dilute our shareholders’ percentage ownership, incur substantial debt, reduce our cash reserves or assume contingent liabilities. Furthermore, acquisitions may require material charges and could result in adverse tax consequences, substantial depreciation, deferred compensation charges, in-process research and development charges, the amortization of amounts related to deferred compensation and identifiable purchased intangible assets or impairment of goodwill, any of which could negatively impact our results of operations.
Our limited experience in acquiring other businesses, product lines and technologies may make it difficult for us to overcome problems encountered in connection with any acquisitions we may undertake.
We continually evaluate and explore strategic opportunities as they arise, including business combinations, strategic partnerships, capital investments and the purchase, licensing or sale of assets. Our experience in acquiring other businesses, product lines and technologies is limited. The attention of our management team may be diverted from our core business if we undertake any future acquisitions. Any potential future acquisition involves numerous risks, including, among others:
| • | Problems or delays in successfully closing the acquisition; |
15
Table of Contents
| • | Problems or delays assimilating and integrating the purchased operations, personnel, technologies, products and information systems; |
| • | Unanticipated costs and expenditures associated with the acquisition, including any need to infuse significant capital into the acquired operations; |
| • | Adverse effects on existing business relationships with suppliers, customers and strategic partners; |
| • | Risks associated with entering markets and foreign countries in which we have limited or no prior experience; |
| • | Contractual, intellectual property or employment issues; |
| • | Potential loss of key employees of purchased organizations; and |
| • | Potential litigation arising from the acquired company’s operations before the acquisition. |
These risks could disrupt our ongoing business, distract our management and employees, harm our reputation and increase our expenses. Our inability to overcome problems encountered in connection with any acquisition could further divert the attention of management, utilize scarce corporate resources and otherwise harm our business. These challenges are magnified as the size of an acquisition increases, and we cannot assure you that we will realize the intended benefits of any acquisition.
We cannot assure that we will be able to consummate any pending or future acquisitions. We may not be able to find suitable acquisitions opportunities and even if we do find suitable acquisition opportunities, we may not be able to consummate the acquisitions on commercially acceptable terms or realize the anticipated benefits of any acquisitions we do undertake.
We expect our quarterly operating results to fluctuate in future periods, causing our stock price to fluctuate or decline.
Our quarterly operating results have fluctuated in the past, and we believe they will continue to do so in the future. Some of these fluctuations may be more pronounced than they were in the past due to the uncertain current global economic environment. Fluctuations in our operating results may be due to a number of factors, including, but not limited to, those identified throughout this “Risk Factors” section and the following:
| • | Impact of changing and recently volatile U.S. and global economic conditions; |
| • | Our suppliers’ production levels for the components used in our products; |
| • | Our ability to procure required components; |
| • | Market acceptance of new and enhanced versions of our products; |
| • | Expansion of our international business, including the opening of offices and facilities in foreign countries; |
| • | The timing of the introduction of new products or components and enhancements to existing products or components by us, our competitors or our suppliers; |
| • | Fluctuations in the cost of components and changes in the average sales prices of our products; |
| • | Fluctuating market demand for our products; |
| • | Changes in our customer or product revenue mix; |
| • | The loss of one or more of our customers; |
| • | Our ability to successfully integrate any acquired businesses or assets; |
| • | Expenses associated with the start up of new operations or divisions; |
16
Table of Contents
| • | Order cancellations, product returns, inventory buildups by customers and inventory write-downs; |
| • | Manufacturing inefficiencies associated with the start-up of new manufacturing operations, new products and volume production; |
| • | Expenses associated with strategic transactions, including acquisitions, joint ventures and capital investments; |
| • | Our ability to adequately support potential future rapid growth; |
| • | Our ability to absorb manufacturing overhead if revenues decline; |
| • | The effects of litigation; and |
| • | Increases in our sales and marketing and research and development expenses in connection with decisions to pursue new product initiatives. |
Due to such factors, quarterly revenues and results of operations are difficult to forecast, and period-to-period comparisons of our operating results may not be predictive of future performance.
Ineffective management of inventory levels or product mix, order cancellations, product returns and inventory write-downs could adversely affect our results of operations.
With certain exceptions, sales of our products are generally made through individual purchase orders and, in certain cases, are made under master agreements governing the terms and conditions of the customer relationships. Some customers may have the ability to change, cancel or delay orders with limited or no penalties. It is difficult to accurately predict what or how many products our customers will need in the future. Anticipating demand is challenging because our customers face volatile pricing and unpredictable demand for their products and are increasingly focused on cash preservation and tighter inventory management. We have experienced cancellations of orders and changes in order levels from period-to-period, and we expect to continue to experience similar cancellations and changes in the future, which could result in fluctuations in our revenues.
If we are unable to properly monitor, control and manage our inventory and maintain an appropriate level and mix of products to support our customers’ needs, we may incur increased and unexpected costs associated with our inventory. If we manufacture products in anticipation of future demand that does not materialize, or if a customer cancels outstanding orders, we could experience an unanticipated increase in our inventory that we may be unable to sell in a timely manner, if at all. If demand does not meet our expectations, we could incur increased expenses associated with writing off excess or obsolete inventory.
We also maintain third-party inventory hubbing arrangements with certain of our customers. Pursuant to these arrangements, we deliver products to a customer or a designated third-party warehouse based upon the customer’s projected needs but do not recognize product revenue unless and until the customer has removed our product from the warehouse to incorporate into its end products. If a customer does not take our products under a hubbing arrangement in accordance with the schedule it originally provided us, our predicted future revenue stream could vary substantially from our forecasts and our results of operations could be materially and adversely affected. Additionally, since we own inventory that is physically located in a third party’s warehouse, our ability to effectively manage inventory levels may be impaired, causing our total inventory turns to decrease, which could increase expenses associated with excess and obsolete inventory and negatively impact our cash flow. In addition, while we may not be contractually obligated to accept returned products, we may determine that it is in our best interest to accept returns in order to maintain good relationships with our customers. Product returns would increase our inventory and reduce our revenues. Alternatively, we could end up with too little inventory and we may not be able to satisfy demand, which could have a material adverse effect on our customer relationships. Our risks related to inventory management are exacerbated by our strategy of closely matching inventory levels with product demand, leaving limited margin for error. We have had to in the past and may need to in the future write down inventory for reasons such as obsolescence, excess quantities and declines in market
17
Table of Contents
value below our costs. These inventory write-downs can have a material adverse effect on our financial condition and operating results.
Declines in our average sales prices may result in declines in our revenues and gross profit.
Our industry is competitive and historically has been characterized by declines in average sales prices. Our average sales prices may decline due to several factors, including competition, overcapacity in the worldwide supply of DRAM and Flash memory components as a result of worldwide economic conditions, increased manufacturing efficiencies, implementation of new manufacturing processes and expansion of manufacturing capacity by component suppliers. In the past, overcapacity has resulted in significant declines in component prices, which in turn has negatively impacted our average sales prices, revenues and gross profit. In addition, since a large percentage of our sales are to a small number of customers that are primarily distributors and large OEMs, these customers have exerted, and we expect they will continue to exert, pressure on us to make price concessions. If not offset by increases in volume of sales or the sales of newly-developed products with higher margins, decreases in average sales prices would likely have a material adverse effect on our business and operating results.
Our business could be adversely affected by the cyclical nature of the semiconductor industry.
The semiconductor industry, including the memory markets in which we compete, is highly cyclical and characterized by constant and rapid technological change, rapid product obsolescence and price erosion, evolving standards, and wide fluctuations in product supply and demand. The industry has experienced significant downturns often connected with, or in anticipation of, maturing product cycles of both semiconductor companies’ and their customers’ products and declines in general economic conditions.
These downturns have been characterized by diminished product demand, production overcapacity, high inventory levels and accelerated erosion of average sales prices which have negatively impacted our average sales prices, revenues and earnings. Any future downturns could have a material adverse effect on our business and results of operations.
Further industry consolidation could provide competitive advantages to our competitors.
The storage industry has experienced consolidation over the past several years. Consolidation by our competitors may enhance their capacity, abilities and resources and lower their cost structure, causing us to be at a competitive disadvantage. Additionally, continued industry consolidation may lead to uncertainty in areas such as component availability, which could negatively impact our cost structure.
We have been named as a party to a purported class action lawsuit and purported shareholder derivative actions, and we may be named in additional litigation, all of which could require significant management time and attention and result in significant legal expenses. An unfavorable outcome in one or more of these lawsuits could have a material adverse effect on our business, financial condition, results of operations and cash flows.
As described in detail in Note 7 – “Commitments and Contingencies” to the Consolidated Financial Statements included in Part IV, Item 15 of this Annual Report on Form 10-K, purported class action is pending in the U.S. District Court for the Central District of California, alleging, among other things, that our company, certain of our officers and directors, and four of our underwriters violated the federal securities laws by issuing materially false and misleading statements. In addition, purported shareholder derivative actions are pending in Orange County Superior Court and U.S. District Court for the Central District of California against certain of our officers and directors based on allegations substantially similar to those set forth in the purported class action. Regardless of the merits, the expense of defending such litigation may have a substantial impact if our insurance carriers fail to cover the cost of the litigation, and the time required to defend the actions could divert management’s attention from the day-to-day operations of our business, which could adversely affect our
18
Table of Contents
business, results of operations and cash flows. An unfavorable outcome in such litigation could have a material adverse effect on our business, results of operations and cash flows.
The manufacturing of our products is complex and subject to production output yield problems, which could decrease available supply and increase costs.
The manufacture of our Flash controllers, Flash-based products and stacked DRAM products is a complex process, and it is often difficult for companies such as ours to achieve, after completed assembly and testing, acceptable production output yields (i.e., the ratio of usable product output to expected output based on given component inputs). Reduced production yields could decrease available supply and increase costs. Flash controller production output yields depend on both our product design and the manufacturing process technology unique to our semiconductor foundry partners. Because low yields may result from either design defects or process difficulties, we may not identify yield problems until well into the production cycle, when an actual product defect exists and can be analyzed and tested. In addition, many of these yield problems are difficult to diagnose and time consuming or expensive to remedy.
The execution of our business strategy depends on our ability to retain key personnel, including our executive officers, and to attract qualified personnel.
Competition for employees in our industry is intense. We have had and may continue to have difficulty hiring the necessary engineering, sales and marketing and management personnel to support our business strategy. The successful implementation of our business model and business strategy depends on the continued contributions of our senior management and other key research and development, sales and marketing and operations personnel, including Manouch Moshayedi, our Chief Executive Officer and Chairman of the Board of Directors, Mark Moshayedi, our President, Chief Operating Officer, Chief Technical Officer, Secretary and a Director, and Raymond Cook, our Chief Financial Officer. The loss of any key employee, the failure of any key employee to perform in his or her current position, or the inability of our officers and key employees to expand, train and manage our employee base would have an adverse effect on the execution of our business strategy.
Our efforts to expand our business internationally may not be successful and may expose us to additional risks that may not exist in the United States.
We sell our products to customers in foreign countries and seek to increase our level of international business activity through the expansion of our operations into select markets, including Asia and Europe. Such strategy may include opening sales offices in foreign countries, the outsourcing of manufacturing operations, establishing joint ventures with foreign partners, and the establishment of additional manufacturing operations in foreign countries.
A failure to successfully and timely integrate these operations into our global infrastructure will have a negative impact on our overall operations, cause us to delay or forego some of the original perceived benefits of operating internationally, such as lower average production and engineering labor costs, better access to global markets, improved supply chain efficiency, reduced lead times, increased manufacturing efficiency through investments in new state-of-the-art equipment and a lower overall long-term effective tax rate.
Establishing and running operations in a foreign country or region presents numerous risks, including:
| • | Difficulties and costs of staffing and managing operations in certain foreign countries; |
| • | Foreign laws and regulations, which may vary country by country, and may impact how we conduct our business; |
| • | Higher costs of doing business in certain foreign countries, including different employment laws; |
| • | Difficulty protecting our intellectual property rights from misappropriation or infringement; |
19
Table of Contents
| • | Political or economic instability; |
| • | Changes in import/export duties; |
| • | Necessity of obtaining government approvals; |
| • | Trade restrictions; |
| • | Work stoppages or other changes in labor conditions; |
| • | Difficulties in collecting accounts receivables on a timely basis or at all; |
| • | Changes in local tax regulations; |
| • | Changes to or untimely lapses in government incentives; |
| • | Longer payment cycles and foreign currency fluctuations; and |
| • | Seasonal reductions in business activity in some parts of the world, such as Europe. |
In addition, changes in policies and/or laws of the U.S. or foreign governments resulting in, among other things, higher taxation, currency conversion limitations, restrictions on fund transfers or the expropriation of private enterprises, could reduce the anticipated benefits of our international expansion. Moreover, as a result of our international operations, we are subject to tax in multiple jurisdictions. If any taxing authority (in the U.S. or otherwise) were to successfully challenge our interpretation of the applicable tax laws or our determination of the income and expenses attributable to operations in a specific jurisdiction, we could be required to pay additional taxes, interest and penalties. Furthermore, any actions by countries in which we conduct business to reverse policies that encourage foreign trade or investment could adversely affect our business. If we fail to realize the anticipated revenue growth of our future international operations, our business and operating results could suffer.
We expect that our strategy to expand our international operations will require the expenditure of significant resources and the efforts and attention of our management. Unlike some of our competitors, we have limited experience operating our business in foreign countries. Some of our competitors may have a substantial advantage over us in attracting customers in certain foreign countries due to earlier established operations in that country, greater knowledge with respect to cultural differences of customers residing in that country and greater brand recognition and longer-standing relationships with customers in that country. If our international expansion efforts in any foreign country are unsuccessful, we may decide to cease these foreign operations, which would likely harm our reputation and cause us to incur expenses and losses.
We face risks associated with doing business in foreign countries, including foreign currency fluctuations and trade barriers, that could lead to a decrease in demand for our products or an increase in the cost of the components used in our products.
The volatility of general economic conditions and fluctuations in currency exchange rates affect the prices of our products and the prices of the components used in our products. International sales, which are derived from billings to foreign customers, accounted for 59.1%, 50.2% and 26.3% of our revenues in 2010, 2009 and 2008, respectively. In 2010, 22.9%, 12.2% and 10.9% of our revenues were derived from billings to customers in Singapore, the Czech Republic and Malaysia, respectively. In 2009, 16.1% and 12.0% of our revenues were derived from billings to customers in the Czech Republic and Malaysia, respectively. In 2008, 11.1% of our revenues were derived from billings to customers in Malaysia. For 2010, 2009, and 2008 more than 95% of our international sales were denominated in U.S. dollars, and if the U.S. dollar experiences significant appreciation relative to the currency of a specific country, the prices of our products will rise in such country and our products may be less competitive. In addition, we cannot be sure that our international customers will continue to be willing to place orders denominated in U.S. dollars. If they do not, our revenues and results of operations will be subject to foreign exchange fluctuations, which could harm our business. We do not hedge against foreign currency exchange rate risks.
20
Table of Contents
Furthermore, we purchase a majority of the Flash and DRAM components used in our products from foreign suppliers. Although our purchases of Flash and DRAM components are currently denominated in U.S. dollars, a devaluation of the U.S. dollar relative to the currency of a foreign supplier would likely result in an increase in our cost of Flash and DRAM components.
Our intellectual property may not be adequately protected, which could harm our competitive position.
Our intellectual property is critical to our success. As of December 31, 2010, we owned 23 patents and 57 additional patent applications were pending. Although we protect our intellectual property rights through patents, trademarks, copyrights and trade secret laws, confidentiality procedures and employee disclosure and invention assignment agreements, it is possible that our efforts to protect our intellectual property rights may not:
| • | Prevent the challenge, invalidation or circumvention of our existing patents; |
| • | Result in patents that lead to commercially viable products or provide competitive advantages for our products; |
| • | Prevent our competitors from independently developing similar products, duplicating our products or designing around the patents owned by us; |
| • | Prevent third-party patents from having an adverse effect on our ability to do business; |
| • | Provide adequate protection for our intellectual property rights; |
| • | Prevent disputes with third parties regarding ownership of our intellectual property rights; |
| • | Prevent disclosure of our trade secrets and know-how to third parties or into the public domain; and |
| • | Result in patents from any of our pending applications. |
In addition, despite our efforts to protect our intellectual property rights and confidential information, third parties could copy or otherwise obtain and make unauthorized use of our technologies or independently develop similar technologies. Furthermore, if any of our patents are challenged and found to be invalid, our ability to exclude competitors from making, using or selling the same or similar products related to such patents would cease. From time to time, we receive letters from third parties suggesting that some or all of our products may be covered by third party patents. In each instance, our management determines whether the letters have sufficient justification and specificity to require a response. When they believe it is appropriate to do so, our management seeks the advice of counsel on these matters.
We have, on at least one occasion, applied for and may in the future apply for patent protection in foreign countries. The laws of foreign countries, however, may not adequately protect our intellectual property rights. Many U.S. companies have encountered substantial infringement problems in foreign countries. Because we sell some of our products overseas, we have exposure to foreign intellectual property risks.
We are involved from time to time in claims and litigation over intellectual property rights, which may adversely affect our ability to manufacture and sell our products.
Our industry is characterized by vigorous protection and pursuit of intellectual property rights. It may be necessary, from time to time, to initiate litigation against third parties to preserve our intellectual property rights. Some of our suppliers and licensors have generally agreed to provide us with various levels of intellectual property indemnification for products and technology we purchase or license from them. A third party could claim that our products infringe or contribute to the infringement of a patent or other proprietary right. From time to time, we have received, and may continue to receive in the future, notices that claim we have infringed upon, misappropriated or misused other parties’ proprietary rights. Any of the foregoing events or claims could result in litigation. Such litigation, whether as plaintiff or defendant, would likely result in significant expense to us and divert the efforts of our technical and management personnel, whether or not such litigation is ultimately
21
Table of Contents
determined in our favor. In the event of an adverse result in such litigation, we could be required to pay substantial damages, cease the manufacture, use and sale of certain products, expend significant resources to develop, license or acquire non-infringing technology, discontinue the use of certain processes or obtain licenses to use the infringed technology. In addition, our suppliers’ and licensors’ obligation to indemnify us for intellectual property infringement may be insufficient or inapplicable to any such litigation or other claims of intellectual property infringement.
Our failure to obtain a required license on commercially reasonable terms, or at all, could cause us to incur substantial costs and suspend manufacturing products using the infringed technology. If we obtain a license, we would likely be required to pay license fees or make royalty payments for sales under the license. Such payments would increase our costs of revenues and reduce our gross margins and gross profit. If we are unable to obtain a license from a third party for technology, we could incur substantial liabilities or be required to expend substantial resources redesigning our products to eliminate the infringement. There can be no assurance that we would be successful in redesigning our products or that we could obtain licenses on commercially reasonable terms, if at all. Product development or license negotiating would likely result in significant expense to us and divert the efforts of our technical and management personnel.
Our indemnification obligations for products that infringe the intellectual property rights of others could require us to pay substantial damages.
We currently have in effect a number of agreements in which we have agreed to defend, indemnify and hold harmless our customers and suppliers from damages and costs which may arise from the infringement by our products and services of third-party patents, trademarks or other proprietary rights. The scope of such indemnity varies, but may, in some instances, include indemnification for damages and expenses, including attorneys’ fees. We may from time to time be engaged in litigation as a result of such indemnification obligations. Our insurance does not cover intellectual property infringement. The term of these indemnification agreements is generally perpetual any time after execution of the agreement. The maximum potential amount of future payments we could be required to make under these indemnification agreements is generally unlimited. We may periodically have to respond to claims and litigate these types of indemnification obligations. Any such indemnification claims could require us to pay substantial damages that may result in a material adverse effect on our business and results of operations.
Our indemnification obligations to our customers and suppliers for product defects could require us to pay substantial damages.
A number of our product sales and product purchase agreements provide that we will defend, indemnify and hold harmless our customers and suppliers from damages and costs which may arise from product warranty claims or claims for injury or damage resulting from defects in our products. We maintain insurance to protect against certain claims associated with the use of our products, but our insurance coverage may not be adequate to cover all or any part of the claims asserted against us. A successful claim brought against us that is in excess of, or excluded from, our insurance coverage could substantially harm our business, financial condition and results of operations.
Global economic conditions and the global financial crisis may have an impact on our business and financial condition in ways that we currently cannot predict.
As a result of the prolonged downturn in global economic activity, spending on information technology has deteriorated significantly in the U.S. and many other countries may remain depressed for the foreseeable future. Uncertainty in the financial and credit markets have caused many of our customers to postpone or cancel purchases. These worldwide economic conditions make it extremely difficult for our customers, our vendors and us to accurately forecast and plan future business activities, and they could cause our customers to further reduce or slow spending on our products, which would delay and lengthen sales cycles. Furthermore, during challenging
22
Table of Contents
economic times our customers may face issues gaining timely access to sufficient credit, which could result in an impairment of their ability to make timely payments to us. If that were to occur, we may experience increased collection times or write-offs, which could have a material adverse effect on our revenues and cash flow. Similarly, our vendors may also face issues gaining timely access to sufficient credit, which could result in an impairment of their ability to supply us with components that are needed in the manufacture of our products. If that were to occur, we may experience delays in our production and increased costs associated with our qualification of additional new vendors and replacement of their components, which could have a material adverse effect on our revenues and cash flow. Finally, our ability to access the capital markets may be restricted, which could have an impact on our flexibility to pursue additional expansion opportunities and maintain our desired level of revenue growth in the future. These and other economic factors could have a material adverse effect on demand for our products and services and on our financial condition and operating results.
Failure to maintain effective internal control could cause our investors to lose confidence and adversely affect the market price of our common stock.
Section 404 of the Sarbanes-Oxley Act of 2002 requires that we maintain internal control over financial reporting that meets applicable standards. We may err in the design or operation of our controls, and all internal control systems, no matter how well designed and operated, can provide only reasonable assurance that the objectives of the control system are met. Because there are inherent limitations in all control systems, there can be no absolute assurance that all control issues have been or will be detected. In addition, a failure to maintain such controls could result in misstatements in our financial statements. If we are unable, or are perceived as unable, to produce reliable financial reports due to internal control deficiencies, investors could lose confidence in our reported financial information and operating results, which could result in a negative market reaction.
Failure to comply with governmental laws and regulations could harm our business.
Our business is subject to regulation by various U.S. federal, state, local and foreign governmental authorities and agencies. Such regulation includes employment and labor laws, workplace safety, product safety, environmental laws, consumer protection laws, import/export controls, federal securities laws and tax.
As a global company, we are subject to varied and complex laws, regulations and customs domestically and internationally. These laws and regulations relate to a number of aspects of our business, including trade protection, import and export control, data and transaction processing security, records management, gift policies, employment and labor relations laws, workplace safety, product safety, environmental laws, federal securities laws, tax regulations, and other regulatory requirements affecting our foreign operations. The application of these laws and regulations to our business is often unclear and may at times conflict. Compliance with these laws and regulations may involve significant costs or require changes in our business practices that result in reduced revenue and profitability. Non-compliance could also result in fines, damages, criminal sanctions against us, our officers, or our employees, prohibitions on the conduct of our business, and damage to our reputation. We incur additional legal compliance costs associated with our global operations and could become subject to legal penalties in foreign countries if we do not comply with local laws and regulations, which may be substantially different from those in the U.S. In many foreign countries, particularly in those with developing economies, it may be common to engage in business practices that are prohibited by U.S. regulations applicable to us, such as the U.S. Foreign Corrupt Practices Act. Although we implement policies and procedures designed to ensure compliance with these laws, there can be no assurance that all of our employees, contractors and agents, as well as those companies to which we outsource certain aspects of our business operations, including those based in foreign countries where practices which violate such U.S. laws may be customary, will not take actions in violation of our internal policies.
Noncompliance with applicable regulations or requirements could subject us to investigations, sanctions, mandatory product recalls, enforcement actions, disgorgement of profits, fines, damages, civil and criminal penalties, or injunctions. These actions could harm our business, financial condition, results of operations and
23
Table of Contents
cash flows. If any governmental sanctions or fines are imposed, or if we do not prevail in any possible civil or criminal litigation, our business, financial condition, results of operations and cash flows could be materially adversely affected. In addition, responding to any action will likely result in a significant diversion of management’s attention and resources and an increase in professional fees.
Currently, the U.S. Securities and Exchange Commission (“SEC”) is conducting a formal investigation involving trading in our securities. Certain of our officers and employees, including our CEO and President, have received subpoenas in connection with this investigation. We are fully cooperating with the SEC in regards to this matter.
In addition, from time to time, we have received, and expect to continue to receive, complaints from former employees who threaten to bring claims against us alleging that we have violated one or more labor and employment regulations. In certain of these instances, the former employees have brought formal claims against us and we expect that we will encounter similar actions against us in the future. An adverse outcome in any such litigation could require us to pay contractual damages, compensatory damages, punitive damages, attorneys’ fees and costs.
Compliance with evolving environmental regulations and standards could harm our business.
We may be required to meet and adjust to evolving environmental requirements relating to the material composition of our products. As environmental requirements change, substituting particular components with conforming components to meet new environmental standards may prove to be difficult or costly, and additional redesign efforts could result in production delays. Our operations may be affected by significant changes to existing or future environmental laws and regulations, including those imposed in response to climate change concerns and other actions commonly referred to as “green initiatives.” Although we cannot predict the ultimate impact of any such new laws and regulations, they may result in additional costs or decreased revenue, which could have a material adverse effect on our business.
Changes in the applicable tax laws could materially affect our future results.
We operate in different countries throughout the world and are subject to taxation in a variety of jurisdictions. As a result, our future effective tax rates could be impacted by changes in the applicable tax laws of such jurisdictions or the interpretation of such tax laws. It is not possible to accurately determine the likelihood of changes in tax laws or in the administration of those laws, but any increase in our effective tax rate would adversely affect our future after-tax profits.
We may have exposure to greater than anticipated tax liabilities.
Our future income taxes could be adversely affected if earnings are higher than anticipated in jurisdictions where we have higher statutory tax rates, by changes in the valuation of our deferred tax assets and liabilities, or changes in tax laws, regulations, accounting principles, or interpretations thereof. We are subject to regular review and audit by both domestic and foreign tax authorities. Any adverse outcome of such a review or audit could negatively impact our operating results and financial condition. In addition, the determination of our global provision for income taxes and other tax liabilities requires significant judgment and in the ordinary course of our business, there are many transactions where the ultimate tax determination is uncertain. Additionally, our calculations of income taxes are based on our interpretations of applicable tax laws in the jurisdictions in which we file. Although we believe our tax estimates are reasonable, the ultimate tax outcome may differ from the amounts recorded in our financial statements and may materially affect our financial results in the period or periods for which such determination is made.
24
Table of Contents
Two of our largest shareholders are executives and directors of our company and their interests may diverge from other shareholders.
Manouch Moshayedi and Mark Moshayedi are brothers who (along with a third brother Mike Moshayedi) founded our company. They have owned a substantial amount of shares since our inception. As of December 31, 2010, Manouch and Mark Moshayedi beneficially owned approximately 14% of our outstanding common stock. As shareholders, Manouch and Mark Moshayedi may have interests that diverge from those of other holders of our common stock. In addition, Manouch and Mark Moshayedi are executive officers and directors. As a result, they have the potential ability to control or influence all matters requiring approval by our shareholders, including approval of significant corporate transactions and the decision of whether a change in control will occur. This potential control could affect the price that certain investors may be willing to pay in the future for shares of our common stock.
Certain provisions in our charter documents and stock option plan could prevent or delay a change in control and, as a result, negatively impact our shareholders.
We have taken a number of actions that could have the effect of discouraging a takeover attempt. For example, provisions in our articles of incorporation and bylaws could make it more difficult for a third party to acquire us, even if doing so would be beneficial to our shareholders. These provisions also could limit the price that certain investors might be willing to pay in the future for shares of our common stock.
These provisions include:
| • | Limitations on who may call special meetings of shareholders; |
| • | Advance notice requirements for nominations for election to the board of directors or for proposing matters that can be acted upon by shareholders at shareholder meetings; |
| • | Elimination of cumulative voting in the election of directors; |
| • | The right of a majority of directors in office to fill vacancies on the board of directors; and |
| • | The ability of our board of directors to issue, without shareholder approval, “blank check” preferred stock to increase the number of outstanding shares and thwart a takeover attempt. |
In addition, provisions of our 2000 Stock Incentive Plan and 2010 Incentive Award Plan allow for the automatic vesting of all outstanding equity awards granted under the 2000 Stock Incentive Plan and 2010 Incentive Award Plan upon a change in control under certain circumstances. Such provisions may also have the effect of discouraging a third party from acquiring us, even if doing so would be beneficial to our shareholders.
Our stock price is volatile.
Our common stock has been publicly traded since September 2000. The market price of our common stock has been subject to significant fluctuations since the date of our initial public offering. The stock market has from time to time experienced significant price and volume fluctuations that have affected the market prices of securities, particularly securities of technology companies. As a result, the market price of our common stock may materially decline, regardless of our operating performance.
In addition, the market prices of securities of other technology companies have been and remain volatile. This volatility has significantly affected the market prices of securities of many technology companies for reasons frequently unrelated to the operating performance of the specific companies. Accordingly, you may not be able to resell your shares of common stock at or above the price you paid. In the past, we and other companies that have experienced volatility in the market price of their securities have been, and we currently are, the subject of securities class action litigation. Litigation of this type is often expensive, diverts management’s attention and resources and may have a material adverse effect on our business and operating results.
25
Table of Contents
| ITEM 1B. | UNRESOLVED STAFF COMMENTS |
None.
| ITEM 2. | PROPERTIES |
We occupy two leased facilities of approximately 24,500 and 48,600 square feet in Santa Ana, California, which serve as our corporate headquarters. In addition to our executive offices, these facilities also contain engineering and sales and marketing staff. We lease these facilities from MDC Land LLC, a limited liability company owned by Manouch Moshayedi, Mark Moshayedi and Mike Moshayedi, each of whom is a founder of STEC. In addition, Manouch Moshayedi and Mark Moshayedi are each an executive officer, director and major shareholder of STEC.
The base rents for the 24,500 and 48,600 square foot facilities were approximately $21,000 and $35,000 per month, respectively, during 2010. These leases expire in July 2017 and for the remainder of both of the lease terms, base rent shall be adjusted every two years based on the change in the Consumer Price Index.
We own a 210,000 square foot manufacturing facility in Penang, Malaysia that serves as a major hub for our international operational activities including manufacturing, engineering, sales and marketing, procurement, and logistics.
We also lease a number of small facilities in both foreign and domestic locations for our additional sales, research and development and engineering staff and for storage. We believe that our existing leased space is adequate for our current operations and that suitable replacement and additional space will be available in the future on commercially reasonable terms.
| ITEM 3. | LEGAL PROCEEDINGS |
The information set forth under Note 7 – “Commitments and Contingencies” to the Consolidated Financial Statements of this Annual Report on Form 10-K is incorporated herein by reference.
| ITEM 4. | REMOVED AND RESERVED |
26
Table of Contents
| ITEM 5. | MARKET FOR REGISTRANT’S COMMON EQUITY, RELATED SHAREHOLDER MATTERS AND ISSUER PURCHASES OF EQUITY SECURITIES |
Market Information
Our common stock is traded on the Nasdaq Global Select Market under the symbol “STEC.” The following table sets forth the high and low sales prices reported on the Nasdaq Global Select Market for our common stock for the periods indicated.
| Price range of Common Stock |
||||||||
| High | Low | |||||||
| Year Ended December 31, 2010: |
||||||||
| First Quarter |
$ | 20.45 | $ | 9.47 | ||||
| Second Quarter |
$ | 16.35 | $ | 10.63 | ||||
| Third Quarter |
$ | 16.25 | $ | 10.95 | ||||
| Fourth Quarter |
$ | 18.46 | $ | 12.01 | ||||
| Year Ended December 31, 2009: |
||||||||
| First Quarter |
$ | 8.74 | $ | 3.70 | ||||
| Second Quarter |
$ | 24.98 | $ | 7.31 | ||||
| Third Quarter |
$ | 42.50 | $ | 22.83 | ||||
| Fourth Quarter |
$ | 29.68 | $ | 11.25 | ||||
Recent Share Prices
The following table sets forth the closing sales prices per share of our common stock on the Nasdaq Global Market on December 31, 2010, the last trading day in 2010, and February 8, 2011. Because the market price of our common stock is subject to fluctuation, the market value of the shares of our common stock may increase or decrease.
| Closing Price |
||||
| December 31, 2010 |
$ | 17.65 | ||
| February 8, 2011 |
$ | 23.38 | ||
Holders
As of February 8, 2011, there were 23 holders of record of our common stock.
Dividend Policy
Since becoming a public company, we have not declared or paid any cash dividends on our common stock and do not expect to do so in the foreseeable future. We currently intend to retain all available funds for use in the operation and expansion of our business. Any future determination to pay dividends will be at the discretion of our board of directors and will depend principally upon our results of operations, financial conditions, capital requirements, contractual and legal restrictions and other factors our board of directors deems relevant.
27
Table of Contents
Stock Performance Graph
The following graph shows a comparison of cumulative total shareholder return, calculated on a dividend reinvested basis, for us, the Nasdaq Composite Index and the Standard & Poor’s Semiconductors Index, assuming an investment of $100 on December 31, 2005. No cash dividends have been declared on our common stock. The graph covers the period from December 31, 2005 to December 31, 2010. The comparisons in the graph below are based upon historical data and are not indicative of, nor intended to forecast, the future performance of our common stock.
COMPARISON OF 5 YEAR CUMULATIVE TOTAL RETURN*
Among STEC, Inc., the NASDAQ Composite Index
and the S&P Semiconductors Index
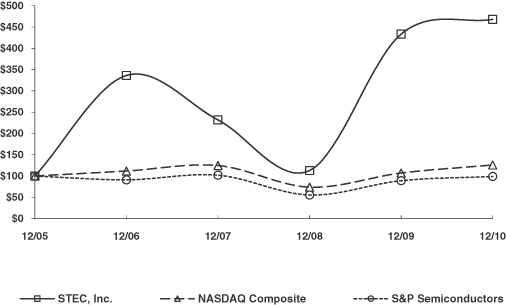
*$100 invested on 12/31/05 in stock or index, including reinvestment of dividends.
Fiscal year ending December 31.
Copyright© 2011 S&P, a division of The McGraw-Hill Companies Inc. All rights reserved.
Notwithstanding anything to the contrary set forth in any of our previous filings made under the Securities Act of 1933, as amended, or the Securities Exchange Act of 1934, as amended, that might incorporate future filings made by us under those statutes, the preceding Stock Performance Graph is not to be incorporated by reference into any such prior filings, nor shall such graph be incorporated by reference into any future filings made by us under those statutes.
Recent Sales of Unregistered Securities
None
Equity Compensation Plan Information
The equity compensation plan information required by this Item is set forth in Part III, Item 12, “Security Ownership Of Certain Beneficial Owners And Management And Related Shareholder Matters” of this Annual Report on Form 10-K.
28
Table of Contents
Issuer Purchases of Equity Securities
During the three months ended December 31, 2010, we had one outstanding stock repurchase program. The following is a summary of our common stock repurchased and average price paid per share for the three months ended December 31, 2010:
| Period |
Total Number of Shares Purchased |
Average Price Paid per Share |
Total Number of Shares Purchased as Part of Publicly Announced Programs (1) |
Maximum Dollar Value that May Yet be Purchased Under the Programs |
||||||||||||
| October 1 through October 31, 2010 |
— | — | — | |||||||||||||
| November 1 through November 30, 2010 |
— | — | — | |||||||||||||
| December 1 through December 31, 2010 |
— | — | — | |||||||||||||
| Total |
— | $ | — | — | $ | 75,000,000 | (1) | |||||||||
| (1) | In November 2009, our board of directors authorized a share repurchase program effective November 10, 2009, enabling us to repurchase up to $75 million of our common stock over an 18-month period expiring on May 9, 2011. Repurchases under our share repurchase program will be made in open market or privately negotiated transactions in compliance with Rule 10b-18 promulgated under the Exchange Act. There is no guarantee as to the exact number of shares that will be repurchased by us, and we may discontinue repurchases at any time that management determines that additional repurchases are not warranted. Repurchased shares were returned to the status of authorized but unissued shares of common stock and may be issued by us in the future. |
29
Table of Contents
| ITEM 6. | SELECTED FINANCIAL DATA |
You should read the following selected consolidated financial data in conjunction with our consolidated financial statements and related notes set forth in Part IV, Item 15, “Exhibits and Financial Statement Schedules,” and in Part II, Item 7, “Management’s Discussion and Analysis of Financial Condition and Results of Operations,” of this Annual Report on Form 10-K. The consolidated statements of income data for the years ended December 31, 2010, 2009 and 2008 and the consolidated balance sheet data at December 31, 2010 and 2009 were derived from our consolidated financial statements that have been audited by our independent registered public accounting firm, and are included elsewhere in this Form 10-K. The consolidated statements of income data for the years ended December 31, 2007 and 2006 and the consolidated balance sheet data at December 31, 2008, 2007 and 2006 were derived from our audited consolidated financial statements and are not included in this Form 10-K. On February 9, 2007, we entered into an Asset Purchase Agreement (“Purchase Agreement”) with Fabrik, Inc. (“Fabrik”) and Fabrik Acquisition Corp. (together with Fabrik, the “Purchasers”) for the sale of assets relating to a portion of our business which was engaged in the designing, final assembling, selling, marketing and distributing consumer-oriented products based on Flash memory, DRAM technologies and external storage solutions known as the Consumer Division. The selected financial data of all periods presented have been reclassified to reflect the assets, liabilities, revenues and expenses of the Consumer Division as a discontinued operation.
| Year Ended December 31, | ||||||||||||||||||||
| 2010 | 2009 | 2008 | 2007 | 2006 | ||||||||||||||||
| (in thousands, except per share amounts) | ||||||||||||||||||||
| Consolidated Statements of Income Data: |
||||||||||||||||||||
| Net revenues |
$ | 280,149 | $ | 354,183 | $ | 227,445 | $ | 188,652 | $ | 215,753 | ||||||||||
| Cost of revenues |
158,430 | 185,236 | 156,358 | 131,643 | 147,301 | |||||||||||||||
| Gross profit |
121,719 | 168,947 | 71,087 | 57,009 | 68,452 | |||||||||||||||
| Sales and marketing |
19,396 | 20,352 | 19,045 | 17,382 | 16,066 | |||||||||||||||
| General and administrative |
28,623 | 28,543 | 25,476 | 17,909 | 12,711 | |||||||||||||||
| Research and development |
44,148 | 27,481 | 21,081 | 14,971 | 10,071 | |||||||||||||||
| Special charges |
990 | 3,408 | — | — | — | |||||||||||||||
| Total operating expenses |
93,157 | 79,784 | 65,602 | 50,262 | 38,848 | |||||||||||||||
| Operating income |
28,562 | 89,163 | 5,485 | 6,747 | 29,604 | |||||||||||||||
| Other income |
2,579 | 601 | 1,380 | 3,786 | 3,653 | |||||||||||||||
| Income from continuing operations before provision for income taxes |
31,141 | 89,764 | 6,865 | 10,533 | 33,257 | |||||||||||||||
| Provision for income taxes |
(2,440 | ) | (18,221 | ) | (2,714 | ) | (4,723 | ) | (12,071 | ) | ||||||||||
| Income from continuing operations |
28,701 | 71,543 | 4,151 | 5,810 | 21,186 | |||||||||||||||
| (Loss) income from discontinued operations before benefit (provision) for income taxes |
(261 | ) | 1,838 | 238 | 7,094 | 1,103 | ||||||||||||||
| Benefit (provision) for income taxes |
98 | (768 | ) | (97 | ) | (2,890 | ) | (438 | ) | |||||||||||
| (Loss) income from discontinued operations |
(163 | ) | 1,070 | 141 | 4,204 | 665 | ||||||||||||||
| Net income |
$ | 28,538 | $ | 72,613 | $ | 4,292 | $ | 10,014 | $ | 21,851 | ||||||||||
| Net income (loss) per share: |
||||||||||||||||||||
| Basic: |
||||||||||||||||||||
| Continuing operations |
$ | 0.57 | $ | 1.45 | $ | 0.09 | $ | 0.12 | $ | 0.46 | ||||||||||
| Discontinued operations |
(0.01 | ) | 0.02 | — | 0.08 | 0.01 | ||||||||||||||
| Total |
$ | 0.56 | $ | 1.47 | $ | 0.09 | $ | 0.20 | $ | 0.47 | ||||||||||
| Diluted: |
||||||||||||||||||||
| Continuing operations |
$ | 0.56 | $ | 1.41 | $ | 0.08 | $ | 0.11 | $ | 0.44 | ||||||||||
| Discontinued operations |
(0.01 | ) | 0.02 | — | 0.08 | 0.01 | ||||||||||||||
| Total |
$ | 0.55 | $ | 1.43 | $ | 0.08 | $ | 0.19 | $ | 0.45 | ||||||||||
| Shares used in computation of net income (loss) per share: |
||||||||||||||||||||
| Basic |
50,699 | 49,350 | 49,956 | 49,843 | 46,313 | |||||||||||||||
| Diluted |
51,432 | 50,896 | 51,132 | 51,588 | 48,354 | |||||||||||||||
30
Table of Contents
| December 31, | ||||||||||||||||||||
| 2010 | 2009 | 2008 | 2007 | 2006 | ||||||||||||||||
| (in thousands) | ||||||||||||||||||||
| Consolidated Balance Sheet Data: |
||||||||||||||||||||
| Cash and cash equivalents |
$ | 170,457 | $ | 135,658 | $ | 33,379 | $ | 94,326 | $ | 40,907 | ||||||||||
| Short-term investments |
— | 10,000 | — | — | — | |||||||||||||||
| Working capital |
272,630 | 225,629 | 126,618 | 141,149 | 147,633 | |||||||||||||||
| Total assets |
365,654 | 325,562 | 206,429 | 210,486 | 206,656 | |||||||||||||||
| Total shareholders’ equity |
322,174 | 278,595 | 181,563 | 185,545 | 166,014 | |||||||||||||||
Special charges consist of restructuring charges and (gains) losses on assets held for sale.
31
Table of Contents
| ITEM 7. | MANAGEMENT’S DISCUSSION AND ANALYSIS OF FINANCIAL CONDITION AND RESULTS OF OPERATIONS |
The following discussion of our financial condition and results of operations should be read in conjunction with our consolidated financial statements and the related notes to such consolidated financial statements included elsewhere in this Form 10-K beginning on page F-1. The following discussion contains forward-looking statements that involve risks and uncertainties. Investors should not place undue reliance on these forward-looking statements. These forward-looking statements are based on current expectations and actual results could differ materially from those discussed herein. Factors that could cause or contribute to the differences are discussed in Item 1A, “Risk Factors” and elsewhere in this Form 10-K. Our actual results could differ materially from those predicted in these forward-looking statements, and the events anticipated in the forward-looking statements may not actually occur. Although we believe that the expectations reflected in these forward-looking statements are reasonable, we cannot guarantee future results, levels of activity, performance or achievements. We are under no duty to update any of the forward-looking statements after the date of this Form 10-K to conform these statements to actual results or to reflect the occurrence of unanticipated events, unless required by law.
Overview
STEC, Inc. (collectively with our subsidiaries, is referred to in this Report as “STEC”, “we”, “our” and “us”) is a leading global provider of enterprise-class Flash-based solid-state drives (“SSDs”) that are designed to increase the performance of enterprise-class hardware that companies use to retain and access their critical data. Our products are designed specifically for storage systems and enterprise hardware that run applications requiring a high level of input/output operations per second (“IOPS”) performance, capacity and reliability, as well as low latency.
We design and develop our SSD controllers, enhance them with proprietary firmware and combine them with multi-sourced Flash media to form high-performance SSDs which provide a level of IOPS performance not currently possible with traditional hard disk drives (“HDDs”). We sell our SSDs to leading global enterprise hardware original equipment manufacturers (“OEMs”) which integrate them into products used by enterprises in a variety of industries including cloud computing, financial services, virtualization, Web 2.0, government, transportation, defense and transaction processing. We also manufacture small form factor Flash-based SSDs, cards and modules, as well as custom high density dynamic random access memory (“DRAM”) modules for networking, communications and industrial applications. We are headquartered in Santa Ana, California and have operations in Penang, Malaysia. We also have sales and engineering offices located in Europe and Asia.
We market our products to OEMs and OEM distributors, leveraging our custom design capabilities to offer memory solutions to address their specific needs.
We are focusing on certain revenue growth initiatives, including:
| • | Continuing to develop and qualify customized SSDs, including our ZeusIOPS® and MACH-class of products; and |
| • | Exploring new market opportunities that leverage our core SSD expertise. |
Over the past several years, we have expanded our custom design capabilities of Flash-based products for OEM applications. We have invested significantly in the design and development of customized Flash controllers, firmware and hardware. Prior strategic acquisitions also have enabled us to improve our Flash controller design capabilities, expand our product offering, add intellectual property to our portfolio, and enhance our capabilities to use third-party controllers. Flash-based product revenue was $237.4 million, $308.2 million and $150.3 million in 2010, 2009 and 2008, respectively. An inventory carryover in early 2010 related to sales made to our largest customer during the second half of 2009 negatively impacted our Flash-based product revenues for the first half of 2010. Sales of Flash-based products represented 85%, 87% and 66% of our total revenues in 2010, 2009 and 2008, respectively. We expect to continue to make investments in Flash custom design capabilities and controller development.
32
Table of Contents
A major area of our research and development investment has been applied to developing and advancing our SSD technologies. We believe the advantages of SSDs are currently being defined in several distinct markets including: a) enterprise-storage applications, b) enterprise-server applications, and c) government, defense and industrial applications. We see opportunities to leverage our SSD expertise across each of these markets where we believe our technology can outperform existing HDD solutions.
Although the enterprise Flash-based SSD market is relatively new, evolving and difficult to predict, we are encouraged by the variety of applications that our SSDs are able to support. As more of our customers and end-users experience the benefits of SSD technology, we believe that adoption will continue to expand. The increased use of data-tiering software by storage OEMs may also help to increase SSD adoption as the combination of data-tiering software and SSDs enhance the overall performance level of enterprise-storage systems. In addition, we have employed certain marketing programs and sales initiatives on a selective basis with our customers, in an effort to help accelerate the adoption of our SSD products.
We also offer both monolithic DRAM modules and DRAM modules based on our proprietary stacking technology. We derived $42.5 million, $38.8 million, and $71.0 million in revenues from the sale of DRAM products during 2010, 2009, and 2008, respectively. Sales of DRAM products represented 15%, 11%, and 31% of our total revenues in 2010, 2009, and 2008, respectively. The increase in sales of DRAM products in absolute dollars and as a percentage of our total revenues from 2009 to 2010 was due primarily to an increase in product sales to a single customer. The decrease in sales of DRAM products in absolute dollars and as a percentage of our total revenues from 2008 to 2009 was due primarily to a focus on growing SSD-based product sales which resulted in a change in the composition of our product mix in 2009, reflecting a greater percentage of SSD revenues and a decrease in DRAM revenues.
With respect to the government, defense and industrial market, we signed an OEM Agreement (“Agreement”) in May 2009 to supply a defense systems contractor (“Defense Contractor”) with approximately $28 million of our MACH-family product through a distributor over a 14-month period that ended on July 31, 2010. At the expiration of the Agreement, the Defense Contractor had only purchased approximately $14 million of its $28 million order commitment. As a result, we agreed to a termination settlement with the Defense Contractor in September 2010. The terms of the settlement included provisions for the Defense Contractor to pay STEC a $2.0 million cash settlement, which we received on October 19, 2010, plus an additional final resolution payment if the Defense Contractor does not meet a certain minimum future SSD purchase target by January 1, 2013. The settlement also grants us preferred supplier status with the Defense Contractor through January 1, 2013.
We have been granted a fifteen-year tax holiday for our operations in Malaysia subject to meeting certain conditions. This tax holiday in Malaysia is effective through September 30, 2022. The impact of the Malaysia tax holiday decreased the provision for income taxes by $4.9 million or $0.09 per share, $3.2 million or $0.06 per share, and $1.8 million or $0.04 per share in 2010, 2009 and 2008, respectively.
Historically, a limited number of customers have accounted for a significant percentage of our revenues. Our ten largest customers accounted for an aggregate of 88.0% of our revenues in 2010, compared to 86.9% of our revenues in 2009, and 77.2% of our revenues in 2008. With certain exceptions, sales of our products are generally made through individual purchase orders and, in certain cases, are made under master agreements governing the terms and conditions of the customer relationships.
We expect that sales of our products to a limited number of customers will continue to account for a majority of our revenues in the foreseeable future and believe that our financial results will depend in significant part upon the success of our customers. The composition of our major customer base changes from quarter to quarter as the market demand for our products changes, and we expect this variability will continue in the future. The loss of, or a significant reduction in purchases by, any of our major customers would harm our business,
33
Table of Contents
financial condition and results of operations. See Item 1A, “Risk Factors—Historically, sales to a limited number of customers, particularly EMC Corporation, have comprised a significant portion of our revenues and the loss of, or significant reduction in purchases by, any key customer could materially impact our financial results.”
Sales, which are derived from billings to customers, by geographic region are presented as a percentage of total revenues as follows:
| 2010 | 2009 | 2008 | ||||||||||
| United States |
40.9 | % | 49.8 | % | 73.7 | % | ||||||
| Singapore |
22.9 | % | * | * | ||||||||
| Czech Republic |
12.2 | % | 16.1 | % | * | |||||||
| Malaysia |
10.9 | % | 12.0 | % | 11.1 | % | ||||||
| Other |
13.1 | % | 22.1 | % | 15.2 | % | ||||||
| Total |
100.0 | % | 100.0 | % | 100.0 | % | ||||||
| * | Less than 10% |
The increase in international sales as a percentage of revenues from 2008 to 2010 is due primarily to our focus on expanding our customer base globally through our sales offices in Europe and Asia and our manufacturing and distribution facilities in Malaysia.
Substantially all of our foreign sales are shipped internationally through our facility in Malaysia. For additional information regarding our international sales, see Item 1A, “Risk Factors—We face risks associated with doing business in foreign countries, including foreign currency fluctuations and trade barriers, that could lead to a decrease in demand for our products or an increase in the cost of the components used in our products.”
In the past, we have had and expect to continue to experience some seasonality in our business resulting in higher sales generally in the fourth quarter of each year due to corporate customers seeking to spend their full capital budgets before the end of each year.
Results of Operations
The following table sets forth, for the periods indicated, certain consolidated statements of income data reflected as a percentage of revenues.
| 2010 | 2009 | 2008 | ||||||||||
| Net revenues |
100.0 | % | 100.0 | % | 100.0 | % | ||||||
| Cost of revenues |
56.6 | 52.3 | 68.7 | |||||||||
| Gross profit |
43.4 | 47.7 | 31.3 | |||||||||
| Operating expenses: |
||||||||||||
| Sales and marketing |
6.9 | 5.7 | 8.4 | |||||||||
| General and administrative |
10.2 | 8.1 | 11.2 | |||||||||
| Research and development |
15.8 | 7.8 | 9.3 | |||||||||
| Special charges |
0.3 | 1.0 | 0.0 | |||||||||
| Total operating expenses |
33.2 | 22.6 | 28.9 | |||||||||
| Operating income |
10.2 | 25.1 | 2.4 | |||||||||
| Other income |
0.9 | 0.2 | 0.6 | |||||||||
| Income from continuing operations before income taxes |
11.1 | 25.3 | 3.0 | |||||||||
34
Table of Contents
Comparison of the years ended December 31, 2010 and 2009
Net Revenues. Our revenues decreased 21% from $354.2 million in 2009 to $280.1 million in 2010 due primarily to a 23% decrease in Flash-based product sales and a $6.9 million decrease in other revenues related to the sale of obsolete and excess inventory during 2009, partially offset by a $3.7 million, or 9%, increase in sales of DRAM products. Within Flash-based product sales, shipments of our Zeus IOPS SSDs into the enterprise-storage market decreased 18% from $217.9 million in 2009 to $179.1 million in 2010. An inventory carryover in early 2010 related to sales made to our largest customer during the second half of 2009 negatively impacted our Flash-based product revenues for the first half of 2010.
Our reported revenues are net of reserves for price protection, sales returns and sales and marketing incentives. With certain exceptions, sales of our products are generally made through individual purchase orders and, in certain cases, are made under master agreements governing the terms and conditions of the customer relationships. Some customers may have the ability to change, cancel or delay orders with limited or no penalties. In the absence of a non-cancellable customer supply agreement, our ability to predict future sales is limited because a majority of our quarterly product revenues come from orders that are received just prior to or within the same quarter. In addition, our SSDs are currently offered as options in our customers’ systems. Therefore, the demand for these SSDs is unpredictable and fully dependent on end-user requirements. Unless and until our SSDs are offered as a standard feature in our customers’ systems, our demand visibility will continue to be limited. Our backlog of sales orders waiting to be filled was $48.9 million as of December 31, 2010 and $14.8 million as of December 31, 2009. Our backlog has increased due primarily to an increase in customer orders for our SSD products.
Gross Profit. Our gross profit decreased 28% from $168.9 million in 2009 to $121.7 million in 2010. Gross profit as a percentage of revenues decreased from 47.7% in 2009 to 43.4% in 2010. The decrease in gross profit in absolute dollars and as a percentage of revenue was due primarily to a $70.8 million, or 23%, decrease in Flash-based product sales and decreased average selling prices of certain SSD products, partially offset by a $9.9 million, or 8%, decrease in material costs of Flash components and a $3.5 million decrease in write-downs of our inventory related to obsolescence, excess quantities and declines in market value below our costs.
Sales and Marketing. Sales and marketing expenses are primarily comprised of payroll and payroll-related for our domestic and international sales and marketing employees and expenses for tradeshows. Sales and marketing expenses decreased 5% from $20.4 million in 2009 to $19.4 million in 2010. Sales and marketing expenses as a percentage of revenues increased from 5.7% in 2009 to 6.9% in 2010. The decrease in sales and marketing expenses in absolute dollars was due primarily to a $2.6 million decrease in commissions as the result of lower revenues during 2010 and the termination of certain outside manufacturing representative firm commission agreements in the first quarter of 2009, partially offset by a $1.5 million increase in payroll and payroll-related costs due to an increase in employee headcount and stock-based compensation and a $570,000 increase in trade show expenses. The increase in sales and marketing expenses as a percentage of revenues was due primarily to the fixed nature of certain sales costs such as certain payroll and payroll-related expenses, excluding sales commissions.
General and Administrative. General and administrative expenses are comprised primarily of personnel costs for our executive and administrative employees, professional fees and facilities overhead. General and administrative expenses increased from $28.5 million in 2009 to $28.6 million in 2010. General and administrative expenses as a percentage of revenues increased from 8.1% in 2009 to 10.2% in 2010. The increase in general and administrative expenses in absolute dollars was due primarily to a $1.9 million increase in payroll and payroll-related costs due to an increase in employee headcount primarily at our Malaysia facility and an increase in our stock-based compensation, partially offset by a $1.4 million decrease in legal fees as a result of a prior period intellectual property litigation matter which began in the second quarter of 2008 and was settled in the first quarter of 2009 and a $420,000 decrease in the loss on impairment of fixed assets. The increase in general and administrative expenses as a percentage of revenues was due primarily to the fixed nature of certain general and administrative costs such as payroll and payroll-related expenses and the increase in revenues.
35
Table of Contents
Charges related to the second phase of a reduction in our workforce, which primarily impacted our Santa Ana, California headquarters and was completed as of December 31, 2010, are discussed under “Special Charges” below.
Research and Development. Research and development expenses are comprised primarily of personnel costs for our engineering staff, product design consulting fees and material costs related to new product designs. Research and development expenses increased 60% from $27.5 million in 2009 to $44.1 million in 2010. Research and development expenses as a percentage of revenues increased from 7.8% in 2009 to 15.8% in 2010. The increase in research and development expenses in absolute dollars and as a percentage of revenues was due primarily to a $11.7 million increase in payroll and payroll-related costs from an increase in research and development employee headcount from 217 as of December 31, 2009 to 268 as of December 31, 2010, as the result of our expanding global research and development efforts and a $2.5 million increase in new product development expenses that were predominantly related to our Flash-based product line, which includes the advancement of high-performance SSDs. We expect our research and development expenses to increase as we continue to focus on developing new and next generation Flash-based products.
Special Charges. Special charges, in connection with the first and second phase of the reduction in our workforce, consisted of approximately $1.1 million in employee severance and termination benefits and approximately $113,000 related to a gain on the sale of previously impaired assets in 2010. Special charges consisted of approximately $1.8 million in employee severance and termination benefits and approximately $1.6 million of loss on assets held for sale in 2009.
During the first quarter of 2009, we commenced a reduction of our workforce primarily at our Santa Ana, California headquarters as part of the transition of certain of our operations to our facility in Penang, Malaysia. During the second quarter of 2010, we commenced the second phase of a reduction in our workforce, which also primarily impacted our Santa Ana, California headquarters. The second phase of the reduction in our workforce was completed as of December 31, 2010. We do not expect to incur significant additional restructuring costs related to this restructuring plan in future periods.
We expect that the second phase of a reduction of our workforce will reduce annual operating expenses by approximately $2.8 million, including approximately $1.1 million in cost of revenues, approximately $200,000 in sales and marketing expenses, and approximately $1.5 million in research and development expenses that previously supported our Santa Ana, California production operations. We began to realize cost savings in the second quarter of 2010. We expect the cost savings from the restructuring plan to be partially offset by approximately $400,000 in incremental cost increases at our foreign subsidiaries, related primarily to manufacturing headcount increases for our Malaysia facility.
Other Income. Other income increased from $601,000 in 2009 to $2.6 million in 2010. Other income is comprised primarily of receipts from a legal settlement, government grant income received from the Malaysian government authority for qualified research and development expenses and interest earned on our cash, cash equivalents and short-term investments. This increase in other income resulted primarily from a $2.0 million cash settlement received from a customer during the fourth quarter of 2010 as the result of a contract termination. See “Recent Developments” under “Overview” above. Government grant income increased from $560,000 in 2009 to $754,000 in 2010. Interest income increased from $110,000 in 2009 to $288,000 in 2010.
Provision for Income Taxes. Provision for income taxes was $18.2 million in 2009 and $2.4 million in 2010. Provision for income taxes as a percentage of income before provision for income taxes decreased from 20.3% in 2009 compared to 7.8% in 2010. The decrease in the effective tax rate for 2010 from 2009 is due primarily to a change in the revenue composition, which resulted in increased international sales and earnings in jurisdictions outside of the U.S. that were taxed at rates lower than U.S. federal statutory rates. We operate under a tax holiday in Malaysia, which is effective through September 30, 2022. The impact of the Malaysia tax holiday decreased our provision for income taxes by $4.9 million, or $0.09 per share, and $3.2 million, or $0.06 per share, in 2010 and 2009, respectively.
36
Table of Contents
During 2010, our gross unrecognized tax benefits increased by $1.9 million.
Income from Continuing Operations. Income from continuing operations decreased from $71.5 million in 2009 to $28.7 million in 2010. The decrease in income from continuing operations was due primarily to a $47.2 million decrease in gross profit and a $13.4 million increase in operating expenses, partially offset by a $15.8 million decrease in the provision for income taxes and a $2.0 increase in other income in 2010.
(Loss) Income from Discontinued Operations. As a result of the sale of the assets of our Consumer Division on February 9, 2007, the Consumer Division is reflected as discontinued operations. Loss from discontinued operations was $163,000 in 2010 due primarily to a legal settlement related to the resolution of disputes with the acquiring company of our Consumer Division over the final purchase price. Income from discontinued operations was $1.1 million in 2009 due primarily to a cash settlement on a class action lawsuit received in 2009 from suppliers of DRAM to our former Consumer Division, partially offset by the write-off of amounts owed to us under the original purchase recorded as loss from discontinued operations in 2009.
Comparison of the years ended December 31, 2009 and 2008
Net Revenues. Our revenues increased 56% from $227.4 million in 2008 to $354.2 million in 2009 due primarily to a 105% increase in Flash-based product sales, partially offset by a 45% decrease in sales of DRAM products. Within Flash-based product sales, shipments of our Zeus IOPS SSDs into the enterprise-storage market grew to $217.9 million in 2009, an increase of 313% from $52.7 million in 2008. In 2009, the increase in sales of our ZeusIOPS® SSDs was primarily driven by a non-cancellable supply agreement with our largest customer for the sale of $120 million of ZeusIOPS® SSDs in the second half of 2009. Our shipments related to this agreement were approximately $120 million during the third and fourth quarters of 2009. As the supply agreement concluded, we received indications from this customer that they had inventory of our ZeusIOPS® SSDs at the end of 2009 which carried over into 2010.
The decrease in sales of DRAM products was due primarily to a focus on growing SSD-based product sales which resulted in a change in the composition of our product mix in 2009, reflecting a greater percentage of SSD revenues and a decrease in DRAM revenues.
Our backlog was $14.8 million as of December 31, 2009 and $25.7 million as of December 31, 2008. Our backlog decreased due primarily to a decrease in customer orders for our SSD products. Our reported revenues are net of reserves for price protection, sales returns and sales and marketing incentives.
Gross Profit. Our gross profit increased 138% from $71.1 million in 2008 to $168.9 million in 2009. Gross profit as a percentage of revenues increased from 31.3% in 2008 to 47.7% in 2009. Gross profit as a percentage of revenue increased in 2009 due primarily to a shift in product mix toward higher gross profit margin Flash-based products, partially offset by a $947,000 increase in write-downs of our inventory related to obsolescence, excess quantities and declines in market value below our costs.
Sales and Marketing. Sales and marketing expenses are comprised primarily of personnel costs and travel expenses for our domestic and international sales and marketing employees, commissions paid to internal salespersons and independent manufacturers’ representatives, shipping costs and marketing programs. Sales and marketing expenses increased 7% from $19.0 million in 2008 to $20.4 million in 2009. Sales and marketing expenses as a percentage of revenues decreased from 8.4% in 2008 to 5.7% in 2009. The increase in sales and marketing expenses in absolute dollars was due primarily to increased commissions related to higher revenues. The decrease in sales and marketing expenses as a percentage of revenues was due primarily to the termination of certain outside manufacturing representative firm commission agreements in the second half of 2008 and the first quarter of 2009.
General and Administrative. General and administrative expenses are comprised primarily of personnel costs for our executive and administrative employees, professional fees and facilities overhead. General and
37
Table of Contents
administrative expenses increased 12% from $25.5 million in 2008 to $28.5 million in 2009. General and administrative expenses as a percentage of revenues decreased from 11.2% in 2008 to 8.1% in 2009. The increase in general and administrative expenses in absolute dollars was due primarily to a $2.3 million increase in payroll and payroll-related costs and a $580,000 increase in loss on impairment of fixed assets. Payroll and payroll-related costs increased due to a $1.2 million increase in stock-based compensation and a $1.1 million increase in payroll expenses due primarily to an increase in employee headcount at our Malaysia facility. In the second quarter of 2009, we recorded an asset impairment charge of $320,000 to adjust the carrying value of certain production equipment related to a discontinued product line. The estimated fair value of the assets was based on market prices, prices of similar assets, and other available information.
Research and Development. Research and development expenses are comprised primarily of personnel costs for our engineering and design staff and the cost of prototype supplies. Research and development expenses increased 30% from $21.1 million in 2008 to $27.5 million in 2009. Research and development expenses as a percentage of revenues decreased from 9.3% in 2008 to 7.8% in 2009. The increase in research and development expenses in absolute dollars was due primarily to an increase in payroll and payroll-related costs from our expanding global research and development efforts from our facilities in the United States, United Kingdom, Taiwan and Malaysia that were predominantly related to our Flash-based product line which includes the advancement of high-performance SSDs.
Special Charges. Special charges consist of approximately $1.8 million in employee severance and termination benefits and approximately $1.6 million of asset impairment charges in 2009. There were no special charges in 2008.
During the first quarter of 2009, we commenced the first phase of a reduction of our workforce primarily at our Santa Ana, California headquarters as part of the transition of certain of our operations to our facility in Penang, Malaysia as described above. In connection with this reduction in workforce, we recorded a charge of approximately $1.8 million for severance and related costs during 2009. This phase of the restructuring plan was substantially complete as of December 31, 2009.
In connection with the transition of operations to Malaysia, we conducted an assessment for the impairment of certain property, plant and equipment and recorded asset impairments totaling $1.6 million during 2009.
Other Income. Other income decreased from $1.4 million in 2008 to $601,000 in 2009. Other income is comprised primarily of government grant income received from the Malaysian government authority for qualified research and development expenses and interest earned on our cash, cash equivalents and short-term investments. This decrease in other income resulted primarily from a decrease in interest income as a result of lower interest rates in 2009 compared to 2008 which was partially offset by a $300,000 increase in Malaysian government grant income.
Provision for Income Taxes. Provision for income taxes was $2.7 million in 2008 and $18.2 million in 2009. Provision for income taxes as a percentage of income before provision for income taxes decreased from 39.5% in 2008 compared to 20.3% in 2009. The decrease in the effective tax rate for 2009 from 2008 is due primarily to the transition of substantially all of our manufacturing operations and our foreign sales to international subsidiaries in lower tax rate jurisdictions. We operate under a tax holiday in Malaysia, which is effective through September 30, 2022. The impact of the Malaysia tax holiday decreased our provision for income taxes by $3.2 million, or $0.06 per share, and $1.8 million, or $0.04 per share, in 2009 and 2008, respectively.
During 2009, our gross unrecognized tax benefits increased by $2.2 million.
Income from Continuing Operations. Income from continuing operations increased from $4.2 million in 2008 to $71.5 million in 2009. The increase in income from continuing operations was due primarily to a $97.9 million increase in gross profit, offset by a $14.2 million increase in operating expenses, a $15.5 million increase
38
Table of Contents
in the provision for income taxes and a $779,000 decrease in other income in 2009. The increase in operating expenses was due primarily to special charges incurred in 2009 related to our restructuring plan, expansion efforts in Asia and Europe, an increase in employee compensation costs, and increased investments in research and development for new Flash-based products.
Income from Discontinued Operations. As a result of the sale of the assets of our Consumer Division on February 9, 2007, the Consumer Division is reflected as discontinued operations. Income from discontinued operations increased from $141,000 in 2008 to $1.1 million in 2009 due primarily to a cash settlement on a class action lawsuit received in 2009 from suppliers of DRAM to our former Consumer Division, partially offset by the write-off of amounts owed to us under the original purchase recorded as loss from discontinued operations in 2009.
Liquidity and Capital Resources
Working Capital, Cash, Cash Equivalents and Short-term Investments
As of December 31, 2010, we had working capital of $272.6 million, including $170.5 million of cash and cash equivalents, compared to working capital of $225.6 million, including $145.7 million of cash, cash equivalents and short-term investments at December 31, 2009, and compared to working capital of $126.6 million, including $33.4 million of cash and cash equivalents at December 31, 2008. Current assets were 7.9 times current liabilities at the end of 2010, compared to 6.1 times current liabilities at the end of 2009, and compared to 6.4 times current liabilities at the end of 2008.
Operating Activities
Net cash provided by operating activities was $25.1 million in 2010 and resulted primarily from a $30.5 million decrease in accounts receivable, net of reserves, net income of $28.5 million, non-cash depreciation and amortization of $12.3 million, and $9.2 million of stock-based compensation expense, partially offset by a $46.2 million increase in inventory, a $3.6 million decrease in accounts payable, a $2.7 million benefit from non-cash deferred income taxes, and $2.1 million of excess tax benefits from share-based payment arrangements. Accounts receivable, net of reserves, decreased due primarily to a decrease in sales at the end of the fourth quarter of 2010, compared to sales at the end of the fourth quarter of 2009. Inventory increased due primarily to an increase in purchases of raw materials under non-cancelable inventory purchase commitments and a decrease in our inventory turns in the fourth quarter of 2010, compared to the fourth quarter of 2009 as we prepare to meet anticipated demand in 2011. Accounts payable decreased as a result of lower inventory purchases in the fourth quarter of 2010, compared to the fourth quarter of 2009. During 2010, we incurred approximately $4.1 million of legal fees in excess of our insurance deductible under our director and officer insurance coverage. During 2010, our insurance carriers paid $3.7 million of claims for legal fees incurred by us. Accordingly, we have recognized a liability, with a corresponding receivable that offsets legal expense, until the remainder of our claims are paid by our insurance carrier.
Net cash provided by operating activities was $99.8 million in 2009 and resulted primarily from net income of $72.6 million, a $21.2 million decrease in inventory, a $14.5 million increase in accounts payable, a $16.0 million increase in income taxes, non-cash depreciation and amortization of $12.2 million, and $5.1 million of stock-based compensation expense, partially offset by a $34.9 million increase in accounts receivable, net of reserves and $9.8 million of excess tax benefits from share-based payment arrangements. Inventory decreased due primarily to an increase in sales in 2009 compared to 2008. In 2008 we had increased our purchases of Flash inventory in anticipation of increased production volumes for SSD products based on customer forecast and orders related to new product launches set for 2009. Accounts payable increased due to the timing of payments and as a result of higher inventory purchases in the three months ended December 31, 2009 compared to the three months ended December 31, 2008. Accounts receivable, net of reserves, increased due primarily to an increase in sales in the fourth quarter of 2009, compared to the fourth quarter of 2008.
39
Table of Contents
Net cash used in operating activities was $31.4 million in 2008 and resulted primarily from a $32.4 million increase in inventory, a $9.2 million increase in accounts receivable, net of reserves, and a $3.9 million decrease in accounts payable, partially offset by net income of $4.3 million and non-cash depreciation and amortization of $9.2 million. Inventory increased due primarily to an increase in purchases of Flash inventory in 2008 in anticipation of increased production volumes for SSD products based on customer forecast and orders related to new product launches set for the second half of 2008 and the first quarter of 2009. Accounts receivable, net of reserves, increased due primarily to an increase in overall sales, as well as higher sales in December 2008, compared to December 2007. Accounts payable decreased due to lower inventory purchases during the three months ended December 31, 2008 compared to the months ended December 31, 2007.
Investing Activities
Net cash flows provided by investing activities was $3.9 million in 2010 resulting primarily from a $10.0 million net decrease in short-term investments, partially offset by $6.4 million in purchases of property, plant and equipment primarily related to production and engineering equipment at our Malaysia and U.S. facilities.
As of December 31, 2010, we have made capital expenditures of approximately $40 million for our Malaysia facility primarily related to building construction costs, acquisition of leasehold interest in land and purchases of production equipment. We estimate that total investments in land, facilities and capital equipment will be approximately $20 million over the next five years ending December 31, 2015. We expect that the substantial majority of these estimated investments will relate to our Malaysia facility.
Net cash flows used in investing activities was $16.8 million in 2009 resulting primarily from a $10.0 million net increase in short-term investments and $7.4 million in purchases of property, plant and equipment primarily related to production equipment for manufacturing.
Net cash used in investing activities was $18.9 million in 2008 resulting primarily from $19.2 million in purchases of property, plant and equipment related to production equipment for our U.S. facility of $5.3 million and our Malaysia facility of $13.9 million. During the year, we had purchases and sales of short-term investments of $47.8 million.
Financing Activities
Net cash provided by financing activities was $5.9 million in 2010 and resulted primarily from $3.8 million in proceeds realized from the exercise of stock options and $2.1 million of excess tax benefits from share-based payment arrangements.
From time to time, our board of directors has authorized various programs to repurchase shares of our common stock depending on market conditions and other factors. In November 2009, our board of directors authorized a share repurchase program effective November 10, 2009, enabling us to repurchase up to $75 million of our common stock over an 18-month period expiring on May 9, 2011. At December 31, 2010, $75 million was still authorized for the repurchase of shares under these plans. We did not make any share repurchases under this plan during 2010.
Net cash provided by financing activities was $19.3 million in 2009 and resulted primarily from $9.5 million in proceeds realized from the exercise of stock options and $9.8 million of excess tax benefits from share-based payment arrangements.
Net cash used in financing activities was $10.7 million in 2008 and resulted from a $19.5 million repurchase of our common stock under our share repurchase program, partially offset by $5.9 million in proceeds realized from the exercise of stock options and $2.9 million of excess tax benefits from share-based payment arrangements. In July 2006, our board of directors authorized a share repurchase program enabling us to
40
Table of Contents
repurchase up to $10 million of our common stock over a 18-month period, which expired on February 14, 2008. In May 2007, our board of directors authorized the expansion of this repurchase program enabling us to repurchase up to $60 million of our common stock over an 18-month period, which expired on November 18, 2008. In November 2008, our board of directors authorized another share repurchase program enabling us to repurchase up to $10 million of our common stock over an 18-month period which expired on May 18, 2010. We repurchased 3,398,619 shares of common stock at an average share price of $5.73, including commissions during 2008 under these repurchase programs. Repurchased shares were returned to the status of authorized but unissued shares of common stock and may be reissued by us in the future. During 2008, we had borrowings of $35.0 million and repayments of $35.0 million under our line of credit.
On November 23, 2009, our subsidiary, STEC Technology Sdn. Bhd. (“STEC Malaysia”) entered into a short-term credit facility (the “Short-term Facility”) with Deutsche Bank (Malaysia) Berhad (“Deutsche”). The agreement allows STEC Malaysia to borrow an aggregate principal amount of $10 million in the form of letters of credit, trust receipts, bills acceptances/financing, banker’s acceptances, and banker’s and shipping guarantees which are commonly used to conduct business in Asia. Credit under the Short-term Facility will be available until notice of termination by either party. Borrowings under the Short-term Facility will bear interest at various rates with repayments due between 30 days and 14 months, depending on the form of borrowing. The Short-term Facility is guaranteed by STEC, Inc. and contains customary affirmative and negative covenants. As of December 31, 2010, there were no borrowings outstanding under the Short-term Facility and STEC Malaysia was in compliance with all required covenants. The Short-term Facility will be used to facilitate general business transactions and fund working capital requirements for STEC Malaysia on an as-needed basis.
We believe that our existing assets, cash and cash equivalents on hand, together with the $10 million Short-term Facility with Deutsche and cash that we expect to generate from our operations, will be sufficient to meet our capital needs for at least the next twelve months. However, it is possible that we may need or elect to raise additional cash to fund our activities beyond the next year to provide additional working capital if our revenues increase substantially, to expand our international operations or to consummate acquisitions of other businesses, products or technologies. We could raise such funds by accessing the capital or credit markets to issue equity or debt securities, or by borrowing money. In addition, even though we may not need additional funds, we may still elect to sell additional equity securities or obtain additional credit facilities for other reasons. There can be no assurance that we will be able to obtain additional funds on commercially favorable terms, or at all. If we raise additional funds by issuing more equity or new convertible debt securities, the ownership percentages of existing shareholders would be reduced. In addition, the equity or debt securities that we issue may have rights, preferences or privileges senior to those of the holders of our common stock.
We determine our future capital and operating requirements and liquidity based, in large part, upon our projected financial performance, and we regularly review and update these projections due to changes in general economic conditions, our current and projected operating and financial results, the competitive landscape and other factors. Although we believe we have sufficient capital to fund our activities for at least the next twelve months, our future capital requirements may vary materially from those now planned. The amount of capital that we will need in the future will depend on many factors, including:
| • | General economic and political conditions and specific conditions in the markets we address, including the continuing volatility in the technology sector and semiconductor industry, and fluctuation in the global economy; |
| • | The inability of certain of our customers who depend on credit to have access to their traditional sources of credit to finance the purchase of products from us, which may lead them to reduce their level of purchases or to seek credit or other accommodations from us; |
| • | Whether our revenues increase substantially; |
| • | Our relationships with suppliers and customers; |
| • | The market acceptance of our products; |
41
Table of Contents
| • | Expansion of our international business, including the opening of offices and facilities in foreign countries; |
| • | Price discounts on our products to our customers; |
| • | Our pursuit of strategic transactions, including acquisitions, joint ventures and capital investments; |
| • | Our business, product, capital expenditure and research and development plans and product and technology roadmaps; |
| • | The levels of inventory and accounts receivable that we maintain; |
| • | Our entrance into new markets; |
| • | Capital improvements to new and existing facilities; |
| • | Technological advances; and |
| • | Our responses to competitive products. |
Contractual Obligations and Off-Balance Sheet Arrangements
Other than lease commitments incurred in the normal course of business (see Contractual Obligation table below), we do not have any material off-balance sheet financing arrangements or liabilities, guarantee contracts, retained or contingent interest in transferred assets, or any obligations arising out of a material variable interest in an unconsolidated entity. We do not have any majority-owned subsidiaries that are not included in the consolidated financial statements. Additionally, we do not have any interest in, or relationship with, any special purpose entities.
In the ordinary course of business, we may provide indemnifications of varying scope and terms to customers, vendors, lessors, business partners and other parties with respect to certain matters, including, but not limited to, losses arising out of our breach of such agreements, services to be provided by us, or from intellectual property infringement claims made by third parties. In addition, we have entered into indemnification agreements with our directors and certain of our officers that will require us, among other things, to indemnify them against certain liabilities that may arise by reason of their status or service as directors or officers. We maintain director and officer insurance, which may cover certain liabilities arising from our obligation to indemnify our directors and officers in certain circumstances. It is not possible to determine the maximum potential amount under these indemnification agreements due to the limited history of prior indemnification claims and the unique facts and circumstances involved in each particular agreement. Such indemnification agreements may not be subject to maximum loss clauses. Historically, we have not incurred material costs as a result of obligations under these agreements.
Set forth in the table below is our estimate of our significant contractual obligations at December 31, 2010 (in thousands):
| Payment due by period | ||||||||||||||||||||
| Contractual Obligation |
Total | Less than 1 year |
1-3 years |
3-5 years |
More than 5 years |
|||||||||||||||
| Non-cancelable inventory purchase commitments |
$ | 10,205 | $ | 10,205 | $ | — | $ | — | $ | — | ||||||||||
| Operating lease obligations |
4,853 | 912 | 1,565 | 1,326 | 1,050 | |||||||||||||||
| Other non-cancelable purchase commitments |
1,011 | 1,011 | — | — | — | |||||||||||||||
| Non-cancelable capital equipment purchase commitments |
354 | 354 | — | — | — | |||||||||||||||
| Total |
$ | 16,423 | $ | 12,482 | $ | 1,565 | $ | 1,326 | $ | 1,050 | ||||||||||
As of December 31, 2010, we had a liability for unrecognized tax benefits, including interest and penalties of $5.7 million. We are unable to determine when cash settlement with tax authorities may occur.
42
Table of Contents
Inflation
Inflation was not a material factor in either revenue or operating expenses during the past three years ended December 31, 2010, 2009 and 2008.
New Accounting Pronouncements
We have implemented all new accounting pronouncements that are in effect and that may impact our consolidated financial statements and we do not believe that there are any other new accounting pronouncements that have been issued that might have a material impact on our consolidated financial statements.
Critical Accounting Policies and Estimates
Our discussion and analysis of our financial condition and results of operations are based upon our consolidated financial statements, which have been prepared in accordance with accounting principles generally accepted in the United States of America and include the accounts of STEC, Inc. and each of its subsidiaries. All accounts and transactions among STEC and its subsidiaries have been eliminated in consolidation. The preparation of these financial statements requires us to make estimates and judgments that affect the reported amount of assets and liabilities and disclosure of contingent assets and liabilities at the date of the financial statements and the reported amount of revenues and expenses for each period. The following represents a summary of our critical accounting policies, defined as those policies that we believe are: (a) the most important to the portrayal of our financial condition and results of operations, and (b) that require management’s most difficult, subjective or complex judgments, often as a result of the need to make estimates about the effects of matters that are inherently uncertain.
| • | Revenue recognition. Pursuant to Accounting Standards Codification (“ASC”) 605-10-S99, “SAB Topic 13, Revenue Recognition,” we recognize revenue when there is persuasive evidence of an arrangement, delivery has occurred or services have been rendered, the sales price is fixed or determinable, and collectibility is reasonably assured. A substantial portion of our product sales are on FOB shipping point terms where product title passes to our customer at the time it is shipped from our warehouse. Products sales on FOB destination terms are not recognized until delivered to the customer. We also maintain inventory, or hubbing, arrangements with certain of our customers. Pursuant to these arrangements, we deliver products to a customer or a designated third party warehouse based upon the customer’s projected needs but do not recognize product revenue unless and until the customer has removed our product from the warehouse to incorporate into its end products. |
In addition, during 2007 and 2008, we entered into value-add revenue agreements with two of our DRAM customers. Under the terms of the agreements, we are no longer the primary obligor, and our general inventory risk on DRAM chips used in the manufacture of memory modules for the customer has been eliminated. As a result, we record the related revenue on a value-add only basis, passing through the cost of the DRAM chips and charging the customer only for the manufacturing and kitting services provided by us. This accounting method conforms to ASC 605-45, “Principal Agent Considerations.”
| • | Write-down of inventory for excess, obsolescence and lower of market values over costs. We purchase raw materials in quantities that we anticipate will be fully used in the near term. Changes in operating strategy, customer demand and unpredictable fluctuations in market values of raw materials can limit our ability to effectively utilize all of the raw materials purchased and result in finished goods with above-market carrying costs which may cause losses on sales to customers. We regularly monitor potential excess or obsolete inventory by analyzing the length of time in stock and compare market values to cost. When necessary, we reduce the carrying amount of our inventory to its market value. |
| • | Allowances for doubtful accounts and price protection. We maintain allowances for doubtful accounts for estimated losses resulting from the inability of our customers to make required payments. We review our allowance for doubtful accounts quarterly and all past due balances over 90 days are |
43
Table of Contents
| reviewed for collectibility. Additionally, we maintain allowances for limited price protection rights for inventories of our products held by our customers as a result of recent sales transactions to them. If we reduce the list price of our products, these customers may receive a credit from us. By monitoring our inventory levels with our customers, we estimate the impact of such pricing changes on a regular basis and adjust our allowances accordingly. |
| • | Goodwill and intangible assets. In accordance with ASC 350, “Intangibles—Goodwill and Other,” goodwill and other intangible assets with indefinite lives are no longer subject to amortization but are tested for impairment annually or whenever events or changes in circumstances indicate that the asset might be impaired. Subsequent to the sale of the Consumer Division in 2007, we operate in one operating segment and have one reporting unit. We assess potential impairment on an annual basis on the last day of the year and compare the market capitalization of the reporting unit to its carrying amount, including goodwill. We completed our annual goodwill impairment analysis at December 31, 2010 and 2009 and determined that no adjustment to the carrying value of goodwill was required. A significant decrease in our future stock price could indicate a material impairment of goodwill which, after further analysis, could result in a material charge to operations. If goodwill is considered impaired, the impairment loss to be recognized is measured by the amount by which the carrying amount of the goodwill exceeds the implied fair value of that goodwill. Intangible assets with finite lives continue to be subject to amortization, and any impairment is determined in accordance with ASC 360. We continually monitor events and changes in circumstances that could indicate that the carrying balances of our intangible assets may not be recoverable in accordance with the provisions of ASC 360. When such events or changes in circumstances are present, we assess the recoverability of long-lived assets by determining whether the carrying value of such assets will be recovered through undiscounted expected future cash flows. If the total of the future cash flows is less than the carrying amount of those assets, we recognize an impairment loss based on the excess of the carrying amount over the fair value of the assets. Inherent in our fair value determinations are certain judgments and estimates, including projections of future cash flows, the discount rate reflecting the risk inherent in future cash flows, the interpretation of current economic indicators and market valuations, and strategic plans with regard to operations. A change in these underlying assumptions would cause a change in the results of the tests, which could cause the fair value of the reporting unit to be less than its respective carrying amount. There were no events or changes in circumstances that indicated potential impairment of intangible assets during 2010. |
| • | Product returns. While we may not be contractually obligated to accept returned products, we may determine that it is in our best interest to accept returns in order to maintain good relationships with our customers. We provide for estimated future returns of inventory at the time of sale based on historical experience, and actual results have been within our expectations. |
| • | Sales and marketing incentives. Sales and marketing incentives are offset against revenues or charged to operations in accordance with ASC 605-50, “Customer Payments and Incentives.” During 2010, a customer elected to discontinue a sales incentive program that we implemented at the beginning of the fourth quarter of 2009. As a result, we reversed the related sales incentive program liability and recognized additional revenue in the amount of $1.4 million in 2010. Other sales and marketing incentives of $61,000 were offset against revenues for the year ended December 31, 2010. Sales and marketing incentives, amounting to $4.2 million in 2009 and $1.1 million in 2008, were offset against revenues. |
Consideration generally given by us to a customer is presumed to be a reduction of selling price, and therefore, a reduction of revenue. However, if we receive an identifiable benefit in return for the consideration given to our customer that is sufficiently separable from our sales to that customer, such that we could have paid an independent company to receive that benefit and we can reasonably estimate the fair value of that benefit, then the consideration is characterized as an expense. We estimate the fair value of the benefits we receive by tracking the advertising done by our customers on our behalf and calculating the value of that advertising using a comparable rate for similar publications.
44
Table of Contents
| • | Stock-based compensation expense. We account for stock-based compensation in accordance with ASC 718, “Compensation – Stock Compensation.” Under the fair value recognition provisions of ASC 718, stock-based compensation cost is measured at the grant date based on the fair value of the award and is recognized as expense over the requisite service period, which is the vesting period. We use the Black-Scholes option-pricing model to estimate the fair values of stock options. The Black-Scholes option-pricing model requires the input of certain assumptions that require our judgment including the expected term and the expected stock price volatility of the underlying stock options. The assumptions used in calculating the fair value of stock-based compensation represent management’s best estimates, but these estimates involve inherent uncertainties and the application of judgment. As a result, if factors change resulting in the use of different assumptions, stock-based compensation expense could be materially different in the future. In addition, we are required to estimate the expected forfeiture rate and only recognize expense for those shares expected to vest. If the actual forfeiture rate is materially different from our estimates, the stock-based compensation expense could be significantly different from what we recorded in the current period. |
| • | Income taxes. The provision for income taxes is determined in accordance with ASC 740, “Income Taxes.” Deferred tax assets and liabilities are determined based on the temporary differences between the financial reporting and tax bases of assets and liabilities, applying enacted statutory tax rates in effect for the year in which the differences are expected to reverse. A valuation allowance is recorded when it is more likely than not that some or all of the deferred tax assets will not be realized. |
We use a two-step approach to recognizing and measuring uncertain tax positions accounted for in accordance with ASC 740. The first step is to evaluate the tax position for recognition by determining if the weight of available evidence indicates that it is more likely than not that the position will be sustained on audit, including resolution of related appeals or litigation processes, if any. The second step is to measure the tax benefit as the largest amount that is more than 50% likely of being realized upon settlement. We will classify the liability for unrecognized tax benefits as current to the extent that we anticipate payment (or receipt) of cash within one year. We recognizes interest and penalties related to unrecognized tax benefits in the tax provision.
| • | Litigation and other contingencies. We regularly evaluate our exposure to threatened or pending litigation and other business contingencies. Because of the uncertainties related to the amount of loss from litigation and other business contingencies, the recording of losses relating to such exposures requires significant judgment about the potential range of outcomes. As additional information about current or future litigation or other contingencies becomes available, we will assess whether such information warrants the recording of additional expense relating to our contingencies. We base our estimates on historical experience and on various other assumptions that are believed to be reasonable. The results of these estimates form the basis for making judgments about the carrying values of assets and liabilities that are not readily apparent from other sources. Actual results may differ from these estimates under different assumptions or conditions. |
45
Table of Contents
| ITEM 7A. | QUANTITATIVE AND QUALITATIVE DISCLOSURES ABOUT MARKET RISK |
Interest Rate Risk
At December 31, 2010, our cash and cash equivalents were $170.5 million invested primarily in money market funds. Our cash and cash equivalents are not subject to significant interest rate risk. As of December 31, 2010, the carrying value of our cash and cash equivalents approximated fair value. Our main investment objectives are the preservation of investment capital and the maximization of after-tax returns on our investment portfolio. Consequently, we invest in securities that meet high credit quality standards and we limit the amount of our credit exposure to any one issuer. We do not use derivative instruments for speculative or investment purposes.
At any time, fluctuations in interest rates could affect interest earnings on our cash and cash equivalents. We believe that the effect, if any, of reasonably possible near-term changes in interest rates on our financial position, results of operations and cash flows would not be material. Currently, we do not hedge these interest rate exposures.
In a declining interest rate environment, as short-term investments mature, reinvestment occurs at less favorable market rates. Given the short-term nature of certain investments, the current interest rate environment may negatively impact our investment income.
Global economic conditions have had widespread negative effects on the financial markets. Due to credit concerns and lack of liquidity in the short-term funding markets, we have shifted a larger percentage of our portfolio to high credit quality money market funds, which may negatively impact our investment income, particularly in the form of declining yields.
We are also exposed to interest rate risks due to the possibility of changing interest rates under the “Short-term Facility” described in “Liquidity and Capital Resources.” Loan draws under the Short-term Facility will bear interest at various rates depending on the type of borrowing. As of December 31, 2010, there were no borrowings outstanding under the Short-term Facility.
Foreign Currency Exchange Rate Risk
More than 95% of our international sales are denominated in U.S. dollars. Consequently, if the value of the U.S. dollar increases relative to a particular foreign currency, our products could become relatively more expensive. In addition, we purchase substantially all of our IC components from local distributors of Japanese, Korean and Taiwanese suppliers. Fluctuations in the currencies of Japan, Korea or Taiwan could have an adverse impact on the cost of our raw materials and our business in the future. To date, we have not entered any derivative instruments to manage risks related to interest rate or foreign currency exchange rates.
| ITEM 8. | FINANCIAL STATEMENTS AND SUPPLEMENTARY DATA |
STEC, Inc.’s consolidated financial statements and schedule required by this item are included in Part IV, Item 15 of this Annual Report on Form 10-K.
The supplementary data required by this item is included in Note 12 to STEC, Inc.’s consolidated financial statements.
| ITEM 9. | CHANGES IN AND DISAGREEMENTS WITH ACCOUNTANTS ON ACCOUNTING AND FINANCIAL DISCLOSURE |
None.
46
Table of Contents
| ITEM 9A. | CONTROLS AND PROCEDURES |
We maintain “disclosure controls and procedures,” as such term is defined under Rule 13a-15(e) of the Exchange Act, that are designed to ensure that information required to be disclosed in our Exchange Act reports is recorded, processed, summarized and reported within the time periods specified in the SEC’s rules and forms, and that such information is accumulated and communicated to our management, including our principal executive officer and principal financial officer, as appropriate, to allow timely decisions regarding required disclosures. In designing and evaluating the disclosure controls and procedures, our management recognized that any controls and procedures, no matter how well designed and operated, can provide only reasonable assurance of achieving the desired control objectives and, in reaching a reasonable level of assurance, our management necessarily was required to apply its judgment in evaluating and implementing possible controls and procedures.
Evaluation of Disclosure Controls and Procedures
We carried out an evaluation as of December 31, 2010, under the supervision and with the participation of our management, including our principal executive officer and principal financial officer, of the effectiveness of our disclosure controls and procedures. Based upon their evaluation and subject to the foregoing, our principal executive officer and principal financial officer concluded that, as of December 31, 2010, our disclosure controls and procedures were effective at the reasonable assurance level.
Management’s Report on Internal Control over Financial Reporting
Our management is responsible for establishing and maintaining an adequate system of internal control over financial reporting as defined in Rule 13a-15(f) under the Exchange Act. Our internal control over financial reporting was designed to provide reasonable assurance regarding the reliability of financial reporting and the preparation of financial statements for external purposes in accordance with generally accepted accounting principles.
Our management evaluated the effectiveness of our internal control over financial reporting as of December 31, 2010. In making their evaluation, management used the criteria set forth by the Committee of Sponsoring Organizations of the Treadway Commission (COSO) in Internal Control — Integrated Framework.
Based on this evaluation, our management concluded that, as of December 31, 2010, our internal control over financial reporting was effective based on the criteria set forth by COSO in Internal Control — Integrated Framework.
The effectiveness of our internal control over financial reporting as of December 31, 2010 has been audited by PricewaterhouseCoopers LLP, an independent registered public accounting firm, as stated in their report that appears under Part IV, Item 15.
Changes in Internal Control Over Financial Reporting
Our management determined that, as of December 31, 2010, there were no changes in our internal control over financial reporting that occurred during the fiscal quarter then ended that have materially affected, or are reasonably likely to materially affect, our internal control over financial reporting.
| ITEM 9A(T). | CONTROLS AND PROCEDURES |
Not applicable.
| ITEM 9B. | OTHER INFORMATION |
Not applicable.
47
Table of Contents
| ITEM 10. | DIRECTORS, EXECUTIVE OFFICERS AND CORPORATE GOVERNANCE |
The information required by this Item regarding our directors, executives and corporate governance will be set forth in our Proxy Statement to be filed in connection with our 2011 Annual Meeting of Shareholders (the “Proxy Statement”) and is incorporated herein by reference.
| ITEM 11. | EXECUTIVE COMPENSATION |
The information required by this Item regarding executive compensation will be set forth in our Proxy Statement and is incorporated herein by reference.
| ITEM 12. | SECURITY OWNERSHIP OF CERTAIN BENEFICIAL OWNERS AND MANAGEMENT AND RELATED SHAREHOLDER MATTERS |
The information required by this Item regarding security ownership of certain beneficial owners and management and related shareholder matters will be set forth in our Proxy Statement and is incorporated herein by reference.
| ITEM 13. | CERTAIN RELATIONSHIPS AND RELATED TRANSACTIONS, AND DIRECTOR INDEPENDENCE |
The information required by this Item regarding certain relationships and related transactions and director independence will be set forth in our Proxy Statement and is incorporated herein by reference.
| ITEM 14. | PRINCIPAL ACCOUNTANT FEES AND SERVICES |
The information required by this Item regarding principal accountant fees and services will be set forth in our Proxy Statement and is incorporated herein by reference.
48
Table of Contents
| ITEM 15. | EXHIBITS, FINANCIAL STATEMENT SCHEDULES |
(a) Documents filed as part of this Report:
1. Financial Statements. The following financial statements of STEC, Inc. are included in a separate section of this Annual Report on Form 10-K commencing on the pages referenced below:
| Page | ||||
| STEC, Inc. Consolidated Financial Statements |
||||
| F-2 | ||||
| F-3 | ||||
| Consolidated Statements of Income for each of the three years in the period ended December 31, 2010 |
F-4 | |||
| F-5 | ||||
| F-6 | ||||
| F-7 | ||||
2. Exhibits. The exhibits listed on the accompanying index immediately following the signature page are filed as part of, or hereby incorporated by reference into, this Annual Report on Form 10-K.
49
Table of Contents
STEC, INC.
INDEX TO CONSOLIDATED FINANCIAL STATEMENTS
| Page | ||||
| STEC, Inc., Consolidated Financial Statements |
||||
| F-2 | ||||
| F-3 | ||||
| Consolidated Statements of Income for each of the three years in the period ended December 31, 2010 |
F-4 | |||
| F-5 | ||||
| F-6 | ||||
| F-7 | ||||
F-1
Table of Contents
REPORT OF INDEPENDENT REGISTERED PUBLIC ACCOUNTING FIRM
To the Board of Directors and Stockholders of
STEC, Inc.
In our opinion, the accompanying consolidated balance sheets and the related consolidated statements of income, shareholders’ equity and cash flows present fairly, in all material respects, the financial position of STEC, Inc. and its subsidiaries at December 31, 2010 and 2009, and the results of their operations and their cash flows for each of the three years in the period ended December 31, 2010 in conformity with accounting principles generally accepted in the United States of America. Also in our opinion, the Company maintained, in all material respects, effective internal control over financial reporting as of December 31, 2010, based on criteria established in Internal Control - Integrated Framework issued by the Committee of Sponsoring Organizations of the Treadway Commission (COSO). The Company’s management is responsible for these financial statements, for maintaining effective internal control over financial reporting and for its assessment of the effectiveness of internal control over financial reporting, included in Management’s Report on Internal Control over Financial Reporting appearing under Item 9A. Our responsibility is to express opinions on these financial statements and on the Company’s internal control over financial reporting based on our integrated audits. We conducted our audits in accordance with the standards of the Public Company Accounting Oversight Board (United States). Those standards require that we plan and perform the audits to obtain reasonable assurance about whether the financial statements are free of material misstatement and whether effective internal control over financial reporting was maintained in all material respects. Our audits of the financial statements included examining, on a test basis, evidence supporting the amounts and disclosures in the financial statements, assessing the accounting principles used and significant estimates made by management, and evaluating the overall financial statement presentation. Our audit of internal control over financial reporting included obtaining an understanding of internal control over financial reporting, assessing the risk that a material weakness exists, and testing and evaluating the design and operating effectiveness of internal control based on the assessed risk. Our audits also included performing such other procedures as we considered necessary in the circumstances. We believe that our audits provide a reasonable basis for our opinions.
A company’s internal control over financial reporting is a process designed to provide reasonable assurance regarding the reliability of financial reporting and the preparation of financial statements for external purposes in accordance with generally accepted accounting principles. A company’s internal control over financial reporting includes those policies and procedures that (i) pertain to the maintenance of records that, in reasonable detail, accurately and fairly reflect the transactions and dispositions of the assets of the company; (ii) provide reasonable assurance that transactions are recorded as necessary to permit preparation of financial statements in accordance with generally accepted accounting principles, and that receipts and expenditures of the company are being made only in accordance with authorizations of management and directors of the company; and (iii) provide reasonable assurance regarding prevention or timely detection of unauthorized acquisition, use, or disposition of the company’s assets that could have a material effect on the financial statements.
Because of its inherent limitations, internal control over financial reporting may not prevent or detect misstatements. Also, projections of any evaluation of effectiveness to future periods are subject to the risk that controls may become inadequate because of changes in conditions, or that the degree of compliance with the policies or procedures may deteriorate.
| /s/ PRICEWATERHOUSECOOPERS LLP |
| PricewaterhouseCoopers LLP |
| Orange County, California |
| February 22, 2011 |
F-2
Table of Contents
CONSOLIDATED BALANCE SHEETS
(in thousands, except per share amounts)
| December 31, 2010 |
December 31, 2009 |
|||||||
| ASSETS: | ||||||||
| Current Assets: |
||||||||
| Cash and cash equivalents |
$ | 170,457 | $ | 135,658 | ||||
| Short-term investments |
— | 10,000 | ||||||
| Accounts receivable, net of allowances of $3,853 at December 31, 2010 and $3,557 at December 31, 2009 |
47,831 | 78,373 | ||||||
| Inventory |
88,968 | 42,739 | ||||||
| Other current assets |
4,606 | 2,840 | ||||||
| Total current assets |
311,862 | 269,610 | ||||||
| Leasehold interest in land |
2,596 | 2,543 | ||||||
| Property, plant and equipment, net |
35,037 | 39,911 | ||||||
| Goodwill |
1,682 | 1,682 | ||||||
| Other long-term assets |
5,173 | 5,368 | ||||||
| Deferred income taxes |
9,304 | 6,448 | ||||||
| Total assets |
$ | 365,654 | $ | 325,562 | ||||
| LIABILITIES AND SHAREHOLDERS’ EQUITY: | ||||||||
| Current Liabilities: |
||||||||
| Accounts payable |
$ | 25,762 | $ | 29,911 | ||||
| Accrued and other liabilities |
13,470 | 14,070 | ||||||
| Total current liabilities |
39,232 | 43,981 | ||||||
| Long-term income taxes payable |
4,248 | 2,986 | ||||||
| Commitments and contingencies (Note 7) |
— | — | ||||||
| Shareholders’ Equity: |
||||||||
| Preferred stock, $0.001 par value, 20,000 shares authorized, no shares outstanding |
— | — | ||||||
| Common stock, $0.001 par value, 100,000 shares authorized, 51,046 shares issued and outstanding as of December 31, 2010 and 50,284 shares issued and outstanding as of December 31, 2009 |
51 | 50 | ||||||
| Additional paid-in capital |
169,127 | 154,087 | ||||||
| Retained earnings |
152,996 | 124,458 | ||||||
| Total shareholders’ equity |
322,174 | 278,595 | ||||||
| Total liabilities and shareholders’ equity |
$ | 365,654 | $ | 325,562 | ||||
The accompanying notes are an integral part of these consolidated financial statements
F-3
Table of Contents
CONSOLIDATED STATEMENTS OF INCOME
(in thousands, except per share amounts)
| Year Ended December 31, | ||||||||||||
| 2010 | 2009 | 2008 | ||||||||||
| Net revenues |
$ | 280,149 | $ | 354,183 | $ | 227,445 | ||||||
| Cost of revenues |
158,430 | 185,236 | 156,358 | |||||||||
| Gross profit |
121,719 | 168,947 | 71,087 | |||||||||
| Sales and marketing |
19,396 | 20,352 | 19,045 | |||||||||
| General and administrative |
28,623 | 28,543 | 25,476 | |||||||||
| Research and development |
44,148 | 27,481 | 21,081 | |||||||||
| Special charges (Note 5) |
990 | 3,408 | — | |||||||||
| Total operating expenses |
93,157 | 79,784 | 65,602 | |||||||||
| Operating income |
28,562 | 89,163 | 5,485 | |||||||||
| Other income |
2,579 | 601 | 1,380 | |||||||||
| Income from continuing operations before provision for income taxes |
31,141 | 89,764 | 6,865 | |||||||||
| Provision for income taxes |
(2,440 | ) | (18,221 | ) | (2,714 | ) | ||||||
| Income from continuing operations |
28,701 | 71,543 | 4,151 | |||||||||
| Discontinued operations (Note 4): |
||||||||||||
| (Loss) income from operations of Consumer Division |
(261 | ) | 1,838 | 238 | ||||||||
| Benefit (provision) for income taxes |
98 | (768 | ) | (97 | ) | |||||||
| (Loss) income from discontinued operations |
(163 | ) | 1,070 | 141 | ||||||||
| Net income |
$ | 28,538 | $ | 72,613 | $ | 4,292 | ||||||
| Net income (loss) per share: |
||||||||||||
| Basic: |
||||||||||||
| Continuing operations |
$ | 0.57 | $ | 1.45 | $ | 0.09 | ||||||
| Discontinued operations |
(0.01 | ) | 0.02 | — | ||||||||
| Total |
$ | 0.56 | $ | 1.47 | $ | 0.09 | ||||||
| Diluted: |
||||||||||||
| Continuing operations |
$ | 0.56 | $ | 1.41 | $ | 0.08 | ||||||
| Discontinued operations |
(0.01 | ) | 0.02 | — | ||||||||
| Total |
$ | 0.55 | $ | 1.43 | $ | 0.08 | ||||||
| Shares used in per share computation: |
||||||||||||
| Basic |
50,699 | 49,350 | 49,956 | |||||||||
| Diluted |
51,432 | 50,896 | 51,132 | |||||||||
The accompanying notes are an integral part of these consolidated financial statements.
F-4
Table of Contents
CONSOLIDATED STATEMENTS OF SHAREHOLDERS’ EQUITY
(in thousands)
| Additional Paid In Capital |
Retained Earnings |
Total Shareholders’ Equity |
||||||||||||||||||
| Common Stock | ||||||||||||||||||||
| Shares | Amount | |||||||||||||||||||
| Balances, December 31, 2007 |
50,434 | $ | 50 | $ | 137,942 | $ | 47,553 | $ | 185,545 | |||||||||||
| Net income |
— | — | — | 4,292 | 4,292 | |||||||||||||||
| Repurchase of common shares |
(3,399 | ) | (3 | ) | (19,484 | ) | — | (19,487 | ) | |||||||||||
| Exercise of stock options |
1,264 | 1 | 5,924 | — | 5,925 | |||||||||||||||
| Vesting of restricted stock units |
130 | — | — | — | — | |||||||||||||||
| Excess tax benefits from share-based payment arrangements |
— | — | 2,883 | — | 2,883 | |||||||||||||||
| Stock-based compensation expense |
— | — | 2,405 | — | 2,405 | |||||||||||||||
| Balances, December 31, 2008 |
48,429 | 48 | 129,670 | 51,845 | 181,563 | |||||||||||||||
| Net income |
72,613 | 72,613 | ||||||||||||||||||
| Exercise of stock options |
1,787 | 2 | 9,469 | — | 9,471 | |||||||||||||||
| Vesting of restricted stock units |
68 | — | — | — | — | |||||||||||||||
| Excess tax benefits from share-based payment arrangements |
— | — | 9,817 | — | 9,817 | |||||||||||||||
| Stock-based compensation expense |
— | 5,131 | 5,131 | |||||||||||||||||
| Balances, December 31, 2009 |
50,284 | 50 | 154,087 | 124,458 | 278,595 | |||||||||||||||
| Net income |
28,538 | 28,538 | ||||||||||||||||||
| Exercise of stock options |
679 | 1 | 3,786 | 3,787 | ||||||||||||||||
| Vesting of restricted stock units |
83 | — | — | — | ||||||||||||||||
| Excess tax benefits from share-based payment arrangements |
2,074 | 2,074 | ||||||||||||||||||
| Stock-based compensation expense |
9,180 | 9,180 | ||||||||||||||||||
| Balances, December 31, 2010 |
51,046 | $ | 51 | $ | 169,127 | $ | 152,996 | $ | 322,174 | |||||||||||
The accompanying notes are an integral part of these consolidated financial statements.
F-5
Table of Contents
CONSOLIDATED STATEMENTS OF CASH FLOWS
(in thousands)
| Year Ended December 31, | ||||||||||||
| 2010 | 2009 | 2008 | ||||||||||
| Cash flow from operating activities: |
||||||||||||
| Net income |
$ | 28,538 | $ | 72,613 | $ | 4,292 | ||||||
| Loss (income) from discontinued operations |
163 | (1,070 | ) | (141 | ) | |||||||
| Adjustments to reconcile net income to net cash provided by (used in) operating activities: |
||||||||||||
| Depreciation and amortization |
12,265 | 12,193 | 9,233 | |||||||||
| Loss (gain) on sale of property, plant and equipment |
38 | 34 | (248 | ) | ||||||||
| Non-cash special charges and impairment loss |
(29 | ) | 2,144 | 318 | ||||||||
| Accounts receivable provisions |
427 | 2,641 | 786 | |||||||||
| Inventory excess and obsolescence expense |
1,262 | 4,774 | 3,827 | |||||||||
| Deferred income taxes |
(2,700 | ) | (693 | ) | (890 | ) | ||||||
| Stock-based compensation expense |
9,180 | 5,131 | 2,405 | |||||||||
| Excess tax benefits from share-based payment arrangements |
(2,074 | ) | (9,817 | ) | (2,883 | ) | ||||||
| Change in operating assets and liabilities: |
||||||||||||
| Accounts receivable |
30,115 | (37,498 | ) | (10,014 | ) | |||||||
| Inventory |
(47,491 | ) | 16,472 | (36,256 | ) | |||||||
| Leasehold interest in land |
(53 | ) | 44 | 78 | ||||||||
| Other assets |
(1,870 | ) | (2,245 | ) | (599 | ) | ||||||
| Accounts payable |
(3,635 | ) | 14,519 | (3,890 | ) | |||||||
| Income taxes |
1,774 | 15,952 | (101 | ) | ||||||||
| Accrued and other liabilities |
(590 | ) | 3,519 | 2,824 | ||||||||
| Net cash flows (used in) provided by discontinued operations |
(261 | ) | 1,070 | (145 | ) | |||||||
| Net cash provided by (used in) operating activities |
25,059 | 99,783 | (31,404 | ) | ||||||||
| Cash flows from investing activities: |
||||||||||||
| Purchases of short-term investments |
(4,998 | ) | (15,200 | ) | (47,770 | ) | ||||||
| Sales of short-term investments |
14,998 | 5,200 | 47,770 | |||||||||
| Purchase of property, plant and equipment |
(6,415 | ) | (7,357 | ) | (19,177 | ) | ||||||
| Proceeds from sale of furniture, fixtures and equipment |
294 | 565 | 313 | |||||||||
| Net cash provided by (used in) by investing activities |
3,879 | (16,792 | ) | (18,864 | ) | |||||||
| Cash flows from financing activities: |
||||||||||||
| Borrowings under line of credit |
— | — | 35,000 | |||||||||
| Payments made on borrowings under line of credit |
— | — | (35,000 | ) | ||||||||
| Proceeds from exercise of stock options |
3,787 | 9,471 | 5,925 | |||||||||
| Excess tax benefits from share-based payment arrangements |
2,074 | 9,817 | 2,883 | |||||||||
| Repurchase of common shares |
— | — | (19,487 | ) | ||||||||
| Net cash provided by (used in) financing activities |
5,861 | 19,288 | (10,679 | ) | ||||||||
| Net increase (decrease) in cash |
34,799 | 102,279 | (60,947 | ) | ||||||||
| Cash and cash equivalents at beginning of period |
135,658 | 33,379 | 94,326 | |||||||||
| Cash and cash equivalents at end of period |
$ | 170,457 | $ | 135,658 | $ | 33,379 | ||||||
| Supplemental disclosure of cash flow information: |
||||||||||||
| Cash paid during the year: |
||||||||||||
| Income taxes |
$ | 3,947 | $ | 7,939 | $ | 4,128 | ||||||
| Supplemental schedule of noncash investing activities: |
||||||||||||
| Additions to property, plant and equipment acquired under accounts payable |
$ | 1,277 | $ | 1,529 | $ | 175 | ||||||
The accompanying notes are an integral part of these consolidated financial statements.
F-6
Table of Contents
NOTES TO CONSOLIDATED FINANCIAL STATEMENTS
1. The Company:
STEC, Inc. is a leading global provider of enterprise-class Flash-based solid-state drives (“SSDs”) that are designed to increase the performance of enterprise-class hardware that companies use to retain and access their critical data. The Company’s products are designed specifically for enterprise-class hardware that run applications requiring a high level of input/output operations per second (“IOPS”) performance, capacity and reliability, as well as low latency.
2. Summary of Significant Accounting Policies:
Basis of Presentation:
The consolidated financial statements, prepared in accordance with generally accepted accounting principles in the United States of America, include the accounts of STEC, Inc., a California corporation, and its subsidiaries (the “Company”). All significant intercompany accounts and transactions have been eliminated in consolidation. In the opinion of management, the accompanying consolidated financial statements contain all adjustments (consisting of normal and recurring adjustments and the special charges discussed in Note 5) considered necessary to present fairly the Company’s financial position, results of operations and cash flows in accordance with generally accepted accounting principles in the United States of America.
Foreign Currency Remeasurement:
The functional currency of the Company’s foreign subsidiaries is the U.S. dollar. The local currency statements are translated into U.S. dollars using the current exchange rate for monetary assets and liabilities and the historical exchange rate for nonmonetary assets and liabilities. Revenues and expenses are translated using the average exchange rate for the period, except items related to nonmonetary assets and liabilities, which are translated using historical exchange rates. All remeasurement gains and losses are included in determining net income.
Reclassification:
Certain amounts previously reported have been reclassified to conform with the 2010 presentation.
Financial Instruments:
Financial instruments consist principally of cash equivalents and short-term investments, accounts receivable and accounts payable. Generally, the Company considers all highly liquid investments that are readily convertible into cash and have an original maturity of three months or less at the time of purchase to be cash equivalents.
As of December 31, 2010, cash equivalents consisted of money market funds. At December 31, 2009, cash, cash equivalents and short-term investments consisted of money market funds and FDIC-insured certificates of deposits. The Company determined the fair value of its cash equivalents and short-term investments based on “Level 1” inputs, which consist of quoted prices in active markets for identical assets. Short-term investments have been classified as available-for-sale securities.
F-7
Table of Contents
Cash, cash equivalents and short-term investments consist of the following (in thousands):
| December 31, 2010 |
December 31, 2009 |
|||||||
| Cash and cash equivalents: |
||||||||
| Cash |
$ | 32,216 | $ | 29,083 | ||||
| Money market funds |
138,241 | 106,575 | ||||||
| 170,457 | 135,658 | |||||||
| Short-term investments: |
||||||||
| Certificates of deposit |
— | 10,000 | ||||||
| Total cash, cash equivalents and short-term investments |
$ | 170,457 | $ | 145,658 | ||||
Inventory:
Inventory is stated at the lower of cost or market, with cost being determined on the first-in, first-out (“FIFO”) method of accounting. The Company purchases raw materials in quantities that it anticipates will be fully used in the near term. Changes in operating strategy, customer demand and unpredictable fluctuations in market values of raw materials can limit the Company’s ability to effectively utilize all of the raw materials purchased and result in finished goods with above-market carrying costs which may cause losses on sales to customers. The Company regularly monitors potential inventory excess, obsolescence and lower market values compared to costs and, when necessary, reduces the carrying amount of its inventory to its market value.
Property, Plant and Equipment, Net:
Property, plant and equipment are stated at cost and depreciated using the straight-line method. The Company’s estimated useful lives of the assets, other than leasehold improvements, range from four to five years for equipment and seven years for furniture and fixtures. Leasehold improvements are amortized using the straight-line method over the shorter of the lease term or the estimated useful life of the assets.
Expenditures for major renewals and betterments are capitalized, while minor replacements, maintenance and repairs, which do not extend the asset lives, are charged to operations as incurred. Upon sale or disposition, the cost and related accumulated depreciation are removed from the accounts and any gain or loss is included in operations.
The Company continually monitors events and changes in circumstances that could indicate that the carrying balances of its property, plant and equipment may not be recoverable in accordance with the provisions of Accounting Standards Codification (“ASC”) 360, “Property, Plant, and Equipment.” When such events or changes in circumstances are present, the Company assesses the recoverability of long-lived assets by determining whether the carrying value of such assets will be recovered through undiscounted expected future cash flows. If the total of the future cash flows is less than the carrying amount of those assets, the Company recognizes an impairment loss based on the excess of the carrying amount over the fair value of the assets.
Leasehold Interest in Land:
Leasehold interest in land represents payments made for the use of land in Malaysia over an extended period of time. The leasehold interests in land are amortized on a straight-line basis over the expected term of the related lease agreements.
Goodwill and Intangible Assets:
In accordance with ASC 350, “Intangibles—Goodwill and Other,” goodwill and other intangible assets with indefinite lives are no longer subject to amortization but are tested for impairment annually or whenever events
F-8
Table of Contents
or changes in circumstances indicate that the asset might be impaired. Subsequent to the sale of the Consumer Division in 2007, the Company operates in one operating segment and has one reporting unit; therefore, goodwill is tested for impairment at the consolidated level against the fair value of the Company. Per ASC 350, the fair value of a reporting unit refers to the amount at which the unit as a whole could be bought or sold in a current transaction between willing parties. Quoted market prices in active markets are the best evidence of fair value and shall be used as the basis on the last day of the year for the measurement, if available. The Company assesses potential impairment on an annual basis on the last day of the year and compares its market capitalization to its carrying amount, including goodwill. The Company completed its annual goodwill impairment analysis at December 31, 2010 and determined that no adjustment to the carrying value of goodwill was required. A significant decrease in its future stock price could indicate a material impairment of goodwill which, after further analysis, could result in a material charge to operations. If goodwill is considered impaired, the impairment loss to be recognized is measured by the amount by which the carrying amount of the goodwill exceeds the implied fair value of that goodwill. Inherent in the Company’s fair value determinations are certain judgments and estimates, including projections of future cash flows, the discount rate reflecting the risk inherent in future cash flows, the interpretation of current economic indicators and market valuations, and strategic plans with regard to operations. A change in these underlying assumptions would cause a change in the results of the tests, which could cause the fair value of the reporting unit to be less than its respective carrying amount.
Intangible assets with finite lives continue to be subject to amortization, and any impairment is determined in accordance with ASC 360. The Company continually monitors events and changes in circumstances that could indicate that the carrying balances of its intangibles assets may not be recoverable in accordance with the provisions of ASC 360. When such events or changes in circumstances are present, the Company assesses the recoverability of long-lived assets by determining whether the carrying value of such assets will be recovered through undiscounted expected future cash flows. If the total of the future cash flows is less than the carrying amount of those assets, the Company recognizes an impairment loss based on the excess of the carrying amount over the fair value of the assets. There were no events or changes in circumstances that indicated potential impairment of intangible assets during 2010.
Revenue Recognition:
Revenue is recognized in accordance with ASC 605-10-S99, “SAB Topic 13, Revenue Recognition.” Revenue is realized or realizable and earned when all of the following criteria are met: (1) persuasive evidence of an arrangement exists, (2) the sales price is fixed or determinable, (3) collectibility is reasonably assured, and (4) products have been shipped and the customer has taken ownership and assumed risk of loss. A substantial portion of the Company’s product sales are on FOB shipping point terms where product title passes to the Company’s customer at the time it is shipped from the Company’s warehouse. Products sales on FOB destination terms are not recognized until delivered to the customer. The Company also maintains inventory, or hubbing, arrangements with certain of its customers. Pursuant to these arrangements, the Company delivers products to a customer or a designated third party warehouse based upon the customer’s projected needs but does not recognize product revenue unless and until the customer has removed the product from the warehouse to incorporate into its end products. In addition, in 2008, the Company entered into value-add revenue agreements with two of its dynamic random access memory (“DRAM”) customers. Under the terms of the agreements, the Company is no longer the primary obligor, and the Company’s general inventory risk on DRAM chips used in the manufacture of memory modules for the customers has been eliminated. As a result, the Company records the related revenue on a value-add only basis, passing through the cost of the DRAM chips and charging the customers only for the manufacturing and kitting services provided by the Company. This accounting method conforms to ASC 605-45, “Principal Agent Considerations.”
Revenue is reduced by reserves for price protection and sales returns. The allowance for doubtful accounts is the Company’s best estimate of the amount of probable credit losses in its existing accounts receivable. The Company reviews its allowance for doubtful accounts quarterly. Past due balances over 90 days and over a specified amount are reviewed individually for collectibility. All other balances are reviewed on a pooled basis
F-9
Table of Contents
by type of receivable. Account balances are charged off against the allowance when the Company believes it is probable the receivable will not be recovered. The Company does not have any off-balance-sheet credit exposure related to its customers. If the Company reduces the list price of its products, certain customers may receive a credit from the Company. The Company estimates the impact of such pricing changes on a regular basis and adjusts its allowances accordingly. Amounts charged to operations for price protection are calculated based on actual price changes on individual products multiplied by customer inventory levels. The reserve is then reduced by actual credits given to these customers at the time the credits are issued. The sales returns reserve is based on historical relationship to revenues and current contract sales terms.
Following are the changes in the account receivable allowance for doubtful accounts, sales returns, price protection and other deductions, during the years ended December 31, 2010, 2009 and 2008 (in thousands):
| Balance at Beginning of Year |
Additions | Deductions | Balance at End of Year |
|||||||||||||
| December 31, 2010 |
$ | 3,557 | $ | 427 | $ | (131 | ) | $ | 3,853 | |||||||
| December 31, 2009 |
$ | 1,196 | $ | 2,641 | $ | (280 | ) | $ | 3,557 | |||||||
| December 31, 2008 |
$ | 944 | $ | 786 | $ | (534 | ) | $ | 1,196 | |||||||
Shipping and Handling Costs:
Shipping and handling costs incurred in a sales transaction to ship products to a customer are included in sales and marketing. For the years ended December 31, 2010, 2009 and 2008, shipping and handling costs were approximately $1.1 million, $930,000 and $1.7 million, respectively. Amounts billed to customers for shipping and handling are included in revenues. For the years ended December 31, 2010, 2009 and 2008, shipping and handling costs billed to customers were $35,000, $10,000 and $114,000, respectively.
Sales and Marketing Incentives:
Sales and marketing incentives are offset against revenues or charged to operations in accordance with ASC 605-50, “Customer Payments and Incentives.” During 2010, a customer elected to discontinue a sales incentive program that the Company implemented at the beginning of the fourth quarter of 2009. As a result, the Company reversed the related sales incentive program liability and recognized additional revenue in the amount of $1.4 million in 2010. Other sales and marketing incentives of $61,000 were offset against revenues for the year ended December 31, 2010. For the years ended December 31, 2009 and 2008, sales and marketing incentives amounted to $4.2 million and $1.1 million, respectively, and were offset against revenues.
Research and Development:
Research and development costs, which primarily relate to payroll-related costs, personnel costs for engineering staff, product design consulting fees and material costs related to new product designs, are expensed as incurred.
Income Taxes:
The provision for income taxes is determined in accordance with ASC 740, “Income Taxes.” Deferred tax assets and liabilities are determined based on the temporary differences between the financial reporting and tax bases of assets and liabilities, applying enacted statutory tax rates in effect for the year in which the differences are expected to reverse. A valuation allowance is recorded when it is more likely than not that some or all of the deferred tax assets will not be realized.
The Company uses a two-step approach to recognizing and measuring uncertain tax positions accounted for in accordance with ASC 740. The first step is to evaluate the tax position for recognition by determining if the
F-10
Table of Contents
weight of available evidence indicates that it is more likely than not that the position will be sustained on audit, including resolution of related appeals or litigation processes, if any. The second step is to measure the tax benefit as the largest amount that is more than 50% likely of being realized upon settlement. The Company will classify the liability for unrecognized tax benefits as current to the extent that the Company anticipates payment (or receipt) of cash within one year. The Company recognizes interest and penalties related to unrecognized tax benefits in the tax provision.
Other Income:
Other income is comprised primarily of proceeds from a legal settlement, government grant income received from the Malaysian government authority for qualified research and development expenses and interest earned on our cash, cash equivalents and short-term investments. Other income was $2.6 million, $601,000 and $1.4 million in 2010, 2009 and 2008, respectively.
In 2010, the Company received a $2.0 million cash settlement from a defense system contractor (“Defense Contractor”) as the result of a contract termination. The contract originally called for the Company to supply a Defense Contractor with approximately $28 million of its MACH-family product through a distributor over a 14-month period that ended July 31, 2010. At the expiration of the contract, the Defense Contractor had only purchased approximately $14 million of its $28 million order commitment. As a result, the Company agreed to a termination settlement with the Defense Contractor in September 2010. The terms of the settlement included provisions for the Defense Contractor to pay STEC a $2.0 million cash settlement, which was received on October 19, 2010 and recorded to other income, plus an additional final resolution payment if the Defense Contractor does not meet a certain minimum future SSD purchase target by January 1, 2013. The settlement also granted the Company preferred supplier status with the Defense Contractor through January 1, 2013.
Stock-based Compensation:
The Company accounts for stock-based compensation in accordance with ASC 718, “Compensation – Stock Compensation.” Under the fair value recognition provisions of ASC 718, stock-based compensation cost is measured at the grant date based on the fair value of the award and is recognized as expense over the requisite service period, which is the vesting period. The Company uses the Black-Scholes option-pricing model to estimate the fair values of stock options. The Black-Scholes option-pricing model requires the input of certain assumptions that require the Company’s judgment, including the expected term and the expected stock price volatility of the underlying stock options. The assumptions used in calculating the fair value of stock-based compensation represent management’s best estimates, but these estimates involve inherent uncertainties and the application of judgment. As a result, if factors change resulting in the use of different assumptions, stock-based compensation expense could be materially different in the future. In addition, the Company is required to estimate the expected forfeiture rate and only recognize expense for those shares expected to vest. If the actual forfeiture rate is materially different from management’s estimates, the stock-based compensation expense could be significantly different from what the Company has recorded in the current period.
Per Share Information:
Basic earnings per share is computed by dividing net income by the weighted average number of shares outstanding. In computing diluted earnings per share, the weighted average number of shares outstanding is adjusted to additionally reflect the effect of potentially dilutive securities. The dilutive effect of stock options and unvested restricted stock units is computed using the treasury stock method, which assumes any proceeds that could be obtained upon the exercise of stock options and vesting of restricted stock units would be used to purchase common shares at the average market price for the period. The assumed proceeds include the purchase price the grantee pays, the hypothetical windfall tax benefit that the Company receives upon assumed exercise or vesting and the hypothetical average unrecognized compensation expense for the period. The Company calculates the assumed proceeds from excess tax benefits based on the “as-if” deferred tax assets calculated under the provision of ASC 718.
F-11
Table of Contents
For the years ended December 31, 2010, 2009 and 2008, potentially dilutive securities consisted solely of options and restricted stock units and resulted in an upward adjustment to the weighted average number of shares outstanding of 733,000, 1,546,000, and 1,176,000, respectively.
Common stock equivalents of 2,074,000, 1,553,000 and 2,726,000 shares for the years ended December 31, 2010, 2009 and 2008, respectively, were outstanding but were not included in the computation of diluted earnings per share because the effect would have been anti-dilutive.
From time to time, the Company’s board of directors has authorized various programs to repurchase shares of its common stock depending on market conditions and other factors. The Company repurchased 3,398,619 shares of common stock at an average share price of $5.73, including commissions, under two separate stock repurchase plans in 2008. The first repurchase plan was originally approved by the Company’s board of directors in July 2006 to enable the Company to repurchase up to $10 million of its common stock over an 18-month period, which expired on February 14, 2008. This plan was expanded in May 2007 to enable the Company to repurchase up to $60 million of its common stock through the period ended November 18, 2008. In November 2008, the Company’s board of directors authorized a share repurchase program effective November 19, 2008, enabling the Company to repurchase up to $10 million of its common stock over an 18-month period, which expired on May 18, 2010. Additionally, in November 2009, the Company’s board of directors authorized a share repurchase program effective November 10, 2009, enabling the Company to repurchase up to $75 million of its common stock over an 18-month period expiring on May 9, 2011. At December 31, 2010, $75 million was still authorized for the repurchase of shares under these plans. The Company did not make any share repurchases in 2009 or 2010.
Risks and Uncertainties:
As shown in the table below, customer concentrations of accounts receivable and revenues of greater than 10% were as follows:
| Year Ended December 31, | ||||||||||||||||||||
| 2010 | 2009 | 2008 | ||||||||||||||||||
| Accounts Receivable |
Revenues | Accounts Receivable |
Revenues | Revenues | ||||||||||||||||
| Customer A |
51.8 | % | 37.8 | % | 78.1 | % | 45.1 | % | 15.2 | % | ||||||||||
| Customer B |
20.7 | % | 13.2 | % | * | * | * | |||||||||||||
| Customer C |
* | 13.0 | % | * | * | 34.4 | % | |||||||||||||
| Customer D |
* | 10.8 | % | * | * | * | ||||||||||||||
| * | Less than 10% |
The Company generally does not require collateral on accounts receivable as the majority of the Company’s customers are large, well-established companies. Historically, bad debt provisions have been consistent with management’s expectations.
F-12
Table of Contents
Sales, which are derived from billings to customers, by geographic region are presented as a percentage of total revenues as follows:
| 2010 | 2009 | 2008 | ||||||||||
| United States |
40.9 | % | 49.8 | % | 73.7 | % | ||||||
| Singapore |
22.9 | % | * | * | ||||||||
| Czech Republic |
12.2 | % | 16.1 | % | * | |||||||
| Malaysia |
10.9 | % | 12.0 | % | 11.1 | % | ||||||
| Other |
13.1 | % | 22.1 | % | 15.2 | % | ||||||
| Total |
100.0 | % | 100.0 | % | 100.0 | % | ||||||
| * | Less than 10% |
In 2010 and 2009, the majority of the Company’s international sales were export sales which are shipped primarily from the Company’s facility in Malaysia.
At December 31, 2010 and 2009, the Company had amounts on deposit with financial institutions that were in excess of the federally insured limit.
Certain of the Company’s products utilize components that are purchased from a small number of sources with whom the Company has no long-term contracts. An inability to obtain such components in the amounts needed on a timely basis or at commercially reasonable prices could result in delays in product introductions, interruptions in product shipments or increases in product costs, which could have a material adverse effect on the Company’s financial position and results of operations.
Total assets by geographic region for the year ended December 31, 2010 and 2009 were as follows (in thousands):
| December 31, 2010 |
December 31, 2009 |
|||||||
| United States |
$ | 183,724 | $ | 180,076 | ||||
| Malaysia |
156,407 | 136,913 | ||||||
| Other |
25,523 | 8,573 | ||||||
| Total |
$ | 365,654 | $ | 325,562 | ||||
Warranties:
The Company’s memory products are generally sold under various limited warranty arrangements ranging from two years to five years. The historical and estimated future costs of repair or replacement are immaterial.
Management Estimates:
The preparation of financial statements in conformity with accounting principles generally accepted in the United States of America requires management to make certain estimates and assumptions that affect the reported amounts of assets and liabilities (e.g., sales returns, bad debts, inventory reserves, asset impairments), disclosure of contingent assets and liabilities at the date of the financial statements and the reported amounts of revenues and expenses during the reporting period. The Company’s reported revenues are net of reserves for price protection, sales returns and sales and marketing incentives. Actual results could differ significantly from those estimates.
F-13
Table of Contents
Comprehensive Income:
ASC 220, “Comprehensive Income” establishes requirements for reporting and disclosure of comprehensive income (loss) and its components. Comprehensive income (loss) includes unrealized holding gains and losses and other items that have previously been excluded from net income and reflected instead in shareholders’ equity. The Company did not have any items of other comprehensive income or loss other than net income in the years ended December 31, 2010, 2009 and 2008.
New Accounting Pronouncements:
The Company has implemented all new accounting pronouncements that are in effect and that may impact its consolidated financial statements and does not believe that there are any other new accounting pronouncements that have been issued that might have a material impact on its consolidated financial statements.
3. Supplemental Financial Statement Data:
Inventory:
Inventory consists of the following (in thousands):
| December 31, 2010 |
December 31, 2009 |
|||||||
| Raw materials |
$ | 62,026 | $ | 34,293 | ||||
| Work-in-progress |
507 | 156 | ||||||
| Finished goods |
26,435 | 8,290 | ||||||
| $ | 88,968 | $ | 42,739 | |||||
The Company has written down inventory in the past for reasons such as obsolescence, excess quantities and declines in market value below its costs. These inventory write-downs were $1.3 million, $4.8 million and $3.8 million in 2010, 2009 and 2008, respectively.
Property, Plant and Equipment, Net:
Property, plant and equipment, net consist of the following (in thousands):
| December 31, 2010 |
December 31, 2009 |
|||||||
| Buildings and improvements |
$ | 20,902 | $ | 20,124 | ||||
| Furniture and fixtures |
1,351 | 1,186 | ||||||
| Equipment |
51,534 | 48,133 | ||||||
| 73,787 | 69,443 | |||||||
| Accumulated depreciation and amortization |
(38,750 | ) | (29,532 | ) | ||||
| $ | 35,037 | $ | 39,911 | |||||
For the years ended December 31, 2010, 2009 and 2008, the Company recorded depreciation expense of approximately $11.1 million, $10.6 million and $8.8 million, respectively.
F-14
Table of Contents
Other Long-term Assets:
Other long-term assets consist of the following (in thousands):
| As of December 31, 2010 | As of December 31, 2009 | |||||||||||||||||||||||
| Gross | Accumulated Amortization |
Net | Gross | Accumulated Amortization |
Net | |||||||||||||||||||
| Developed technology (five years) |
$ | 1,070 | $ | 958 | $ | 112 | $ | 1,070 | $ | 824 | $ | 246 | ||||||||||||
| Customer relationships (five years) |
792 | 792 | — | 792 | 746 | 46 | ||||||||||||||||||
| Acquisition-related intangible assets |
1,862 | 1,750 | 112 | 1,862 | 1,570 | 292 | ||||||||||||||||||
| Technology licenses |
6,771 | 1,710 | 5,061 | 5,831 | 755 | 5,076 | ||||||||||||||||||
| Total |
$ | 8,633 | $ | 3,460 | $ | 5,173 | $ | 7,693 | $ | 2,325 | $ | 5,368 | ||||||||||||
The Company recorded amortization expense for the years ended December 31, 2010, 2009 and 2008 of $1.1 million, $1.4 million and $442,000, respectively.
Other long-term assets are amortized on a straight-line basis over a period of three to five years. Estimated other long-term asset amortization expense for the years ending December 31, 2011, 2012, 2013 and 2014 is $1.2 million, $1.5 million, $1.5 million and $895,000, respectively. Amortization is estimated to be completed as of the end of 2014.
Accrued and Other Liabilities:
Accrued and Other Liabilities consisted of the following (in thousands):
| December 31, 2010 |
December 31, 2009 |
|||||||
| Payroll costs |
$ | 10,028 | $ | 7,510 | ||||
| Marketing |
568 | 3,112 | ||||||
| Other |
2,874 | 3,448 | ||||||
| Total |
$ | 13,470 | $ | 14,070 | ||||
4. Discontinued Operations:
On February 9, 2007, the Company entered into an Asset Purchase Agreement (“Purchase Agreement”) with Fabrik, Inc. (“Fabrik”) and Fabrik Acquisition Corp. (together with Fabrik, the “Purchasers”) for the sale of assets relating to a portion of the Company’s business which was engaged in the design, final assembling, sale, marketing and distribution of consumer-oriented products based on Flash memory, DRAM technologies and external storage solutions known as the Consumer Division of the Company. The consideration paid to the Company pursuant to the Purchase Agreement consisted of cash in the amount of approximately $43.0 million. The purchase price was subject to a post-closing adjustment for accrued expenses, reserves on inventory, reserves on accounts receivable and overhead capitalization of the Consumer Division (“Purchase Price Adjustment”). Subsequent to the closing of the sale, the Purchasers disputed certain amounts calculated by the Company in regards to the Purchase Price Adjustment. The original claim amount was approximately $6.7 million. In accordance with the Purchase Agreement, both parties agreed to resolve their Purchase Price Adjustment disputes through a third-party arbitrator. During the arbitration proceeding, the Purchasers conceded approximately $4.0 million of their original disputed amounts. In January 2008, the arbitrator rejected substantially all of the Purchasers’ claims. In March 2010, Fabrik filed a petition to confirm the January 2008 arbitration ruling, claiming it was owed an additional $486,784 plus accrued interest from the Company. In April 2010, the Company filed a response to the petition defending its position that Fabrik was seeking additional amounts outside of the arbitration ruling and was time barred from its attempt to modify or correct the arbitration award. In May 2010, Fabrik withdrew its petition and the parties satisfactorily resolved their dispute in July 2010.
F-15
Table of Contents
Operating results of the Consumer Division as discontinued operations for the three years ended December 31, 2010, 2009 and 2008 are summarized as follows (in thousands):
| For the Year Ended December 31, | ||||||||||||
| 2010 | 2009 | 2008 | ||||||||||
| Net revenues |
$ | — | $ | — | $ | — | ||||||
| (Loss) income from discontinued operations |
(261 | ) | 1,838 | 238 | ||||||||
| Benefit (provision) for income taxes |
98 | (768 | ) | (97 | ) | |||||||
| (Loss) income from discontinued operations |
$ | (163 | ) | $ | 1,070 | $ | 141 | |||||
5. Special Charges:
Special charges consist of the following (in thousands):
| For the Year Ended December 31, | ||||||||
| 2010 | 2009 | |||||||
| Employee severance and termination benefits |
$ | 1,103 | $ | 1,770 | ||||
| (Gain) loss on assets held for sale |
(113 | ) | 1,638 | |||||
| Total special charges |
$ | 990 | $ | 3,408 | ||||
There were no special charges during the year ended December 31, 2008.
During the three months ended March 31, 2009, the Company commenced the first phase of a reduction in its workforce primarily at its Santa Ana, California headquarters as part of the transition of certain of its operations to its facility in Penang, Malaysia. The first phase, which mostly impacted its U.S.-based workforce, affected 250 employees: 203 in manufacturing, 22 in sales and marketing, 20 in research and development, and 5 in administration. In connection with the first phase of a reduction in its workforce, which was completed by March 31, 2010, the Company recorded charges for employee severance and terminations benefits of approximately $39,000 and $1.8 million during the years ended December 31, 2010 and 2009, respectively.
During the three months ended June 30, 2010, the Company commenced the second phase of a reduction in its workforce, which also primarily impacted its Santa Ana, California headquarters. The second phase, which also mostly impacted its U.S.-based workforce, affected 26 employees, including 8 in manufacturing 15 in research and development, and 3 in sales and marketing. In connection with the second phase of the reduction in workforce, the Company recorded charges for employee severance and terminations benefits of approximately $1.1 million during the year ended December 31, 2010, all of which was paid by December 31, 2010. The second phase of the reduction in workforce, which mostly impacted its U.S.-based workforce, was completed as of December 31, 2010. The Company does not expect to incur significant additional restructuring costs related to this restructuring plan in future periods.
In connection with the transition of operations to Malaysia, the Company conducted an assessment for the impairment of certain property, plant and equipment. As the Company finalized its plans for the transition of operations to Malaysia in the second quarter of 2009, the Company determined that certain manufacturing-related property or equipment assets were impaired. Carrying value of the assets was adjusted to reflect estimated fair value, which was based on market prices, prices of similar assets, and other available information. The Company recorded asset impairments totaling $1.6 million during the year ended December 31, 2009. The Company recorded a gain on the sale of impaired assets of approximately $113,000 during the year ended December 31, 2010.
F-16
Table of Contents
The Company recognizes a liability for restructuring costs at fair value only when the liability is incurred. The two main components of the Company’s restructuring plan have been related to workforce reductions and asset impairments. Workforce-related charges are accrued when it is determined that a liability has been incurred, which is deemed to be after individuals have been notified of their termination dates and expected termination benefits.
6. Income Taxes:
Pre-tax income from continuing operations was taxed under the following jurisdictions (in thousands):
| For the Year Ended December 31, | ||||||||||||
| 2010 | 2009 | 2008 | ||||||||||
| Domestic |
$ | 4,428 | $ | 39,441 | $ | 11,781 | ||||||
| Foreign |
26,713 | 50,323 | (4,916 | ) | ||||||||
| $ | 31,141 | $ | 89,764 | $ | 6,865 | |||||||
The provision for income taxes from continuing operations consists of the following (in thousands):
| For the Year Ended December 31, | ||||||||||||
| 2010 | 2009 | 2008 | ||||||||||
| Current |
||||||||||||
| Federal |
$ | 3,303 | $ | 14,189 | $ | 2,328 | ||||||
| State |
1,314 | 4,274 | 882 | |||||||||
| Foreign |
424 | 383 | 397 | |||||||||
| 5,041 | 18,846 | 3,607 | ||||||||||
| Deferred |
||||||||||||
| Federal |
(1,480 | ) | 419 | 638 | ||||||||
| State |
(1,197 | ) | (1,048 | ) | (1,451 | ) | ||||||
| Foreign |
76 | 4 | (80 | ) | ||||||||
| (2,601 | ) | (625 | ) | (893 | ) | |||||||
| $ | 2,440 | $ | 18,221 | $ | 2,714 | |||||||
The provision for income taxes from continuing operations differs from the amount that would result from applying the federal statutory rate as follows:
| For the Year Ended December 31, | ||||||||||||
| 2010 | 2009 | 2008 | ||||||||||
| Statutory regular federal income tax |
34.0 | % | 35.0 | % | 35.0 | % | ||||||
| Foreign |
(24.5 | ) | (19.2 | ) | 29.7 | |||||||
| State taxes, including state tax credits net of federal benefit |
0.3 | 2.4 | (5.5 | ) | ||||||||
| Federal tax credits |
(4.7 | ) | (1.9 | ) | (20.2 | ) | ||||||
| Permanent differences |
2.6 | 2.1 | 2.5 | |||||||||
| Other |
0.1 | 1.9 | (2.0 | ) | ||||||||
| 7.8 | % | 20.3 | % | 39.5 | % | |||||||
F-17
Table of Contents
The provision for income taxes applicable to continuing operations and discontinued operations consists of the following (in thousands):
| For the Year Ended December 31, | ||||||||||||
| 2010 | 2009 | 2008 | ||||||||||
| Provision for income taxes from continuing operations: |
||||||||||||
| Current |
$ | 5,041 | $ | 18,846 | $ | 3,607 | ||||||
| Deferred |
(2,601 | ) | (625 | ) | (893 | ) | ||||||
| Total provision for income taxes from continuing operations |
2,440 | 18,221 | 2,714 | |||||||||
| (Benefit) provision for income taxes from discontinued operations: |
||||||||||||
| Current |
— | 835 | (100 | ) | ||||||||
| Deferred |
(98 | ) | (67 | ) | 197 | |||||||
| Total (benefit) provision for income taxes from discontinued operations |
(98 | ) | 768 | 97 | ||||||||
| Total income tax expense |
$ | 2,342 | $ | 18,989 | $ | 2,811 | ||||||
The components of deferred tax assets (liabilities) are as follows (in thousands):
| December 31, | ||||||||
| 2010 | 2009 | |||||||
| Current deferred tax liabilities: |
||||||||
| Accounts receivable and inventory reserves |
$ | 1,849 | $ | 1,473 | ||||
| Accrued expenses |
782 | 640 | ||||||
| State taxes |
(2,541 | ) | (1,883 | ) | ||||
| Other |
(292 | ) | (276 | ) | ||||
| Total current |
(202 | ) | (46 | ) | ||||
| Noncurrent deferred tax assets: |
||||||||
| Depreciation and amortization |
401 | 326 | ||||||
| Stock-based compensation expense |
2,516 | 900 | ||||||
| Operating loss carryforwards |
377 | 360 | ||||||
| Credit carryforwards |
6,630 | 5,154 | ||||||
| Other |
64 | 68 | ||||||
| 9,988 | 6,808 | |||||||
| Valuation allowance |
(684 | ) | (360 | ) | ||||
| Total noncurrent |
9,304 | 6,448 | ||||||
| $ | 9,102 | $ | 6,402 | |||||
At December 31, 2010, the Company had federal research and development credit carryforwards of approximately $483,000, which expire in 2030. At December 31, 2010, the Company had state research and development credit carryforwards of approximately $6.1 million, which carryforward indefinitely.
The Company has been granted a fifteen-year tax holiday for its operations in Malaysia subject to meeting certain conditions. This tax holiday in Malaysia is effective through September 30, 2022. The impact of the Malaysia tax holiday decreased the provision for income taxes by $4.9 million, or $0.09 per share, in 2010, $3.2 million, or $0.06 per share, in 2009, and $1.8 million, or $0.04 per share, in 2008. At December 31, 2010 and 2009, the Company had a Malaysian net operating loss carryforward of approximately $1.5 million and $1.4 million, respectively. The Malaysian carryforward amount is currently suspended and will be available to offset
F-18
Table of Contents
taxable income from operations following the expiration of the tax holiday period. The losses carryover indefinitely, unless certain changes in business operations occur during the carryover period. The Company has established a valuation allowance against this deferred tax asset since management believes that it is more likely than not that the Malaysian net operating loss carryforwards will not be fully utilized. In addition, the Company has established a valuation allowance against their U.K. deferred tax asset as management believes that it is more likely than not that they will not be realized due to the Company’s inability to project future taxable income. The change in valuation allowance was $324,000 and $93,000 for the years ended December 31, 2010 and 2009, respectively. The increase in valuation allowance from 2009 to 2010 was due to the increase to the Malaysian net operating loss carryforwards and the recording of a valuation allowance on the Company’s U.K. deferred tax asset.
The Company has not provided for U.S. taxes or foreign withholding taxes on approximately $64.7 million of undistributed earnings from its foreign subsidiaries because such earnings are to be reinvested indefinitely. Determination of the amount of unrecognized deferred tax liability for temporary differences related to these undistributed earnings is not practicable; however, if these earnings were distributed, foreign tax credits may become available under current law to reduce the resulting U.S. income tax liability.
To the extent that an ownership change has occurred under Internal Revenue Code Section 382 and 383, the Company’s use of its credit carryforwards to offset future taxable income may be limited.
As of December 31, 2010, the Company had approximately $6.6 million of total unrecognized tax benefits. Of the total unrecognized tax benefits, $5.7 million (net of the federal benefit on state issues) represent amounts as of December 31, 2010, that, if recognized, would favorably affect the effective income tax rate in any future periods.
A reconciliation of the beginning and ending amount of unrecognized tax benefits is as follows (in thousands):
| 2010 | 2009 | 2008 | ||||||||||
| Balance as of January 1 |
$ | 4,720 | $ | 2,531 | $ | 1,696 | ||||||
| Increases in tax positions for prior years |
39 | 83 | 365 | |||||||||
| Increases in tax positions for current year |
2,316 | 2,424 | 470 | |||||||||
| Decreases due to statute of limitations expiration |
(440 | ) | (318 | ) | — | |||||||
| Balance at December 31 |
$ | 6,635 | $ | 4,720 | $ | 2,531 | ||||||
The Company has uncertain tax positions estimated in the range of $0 to $216,000 which are reflected within its corporate tax filings for which the statute of limitations will expire in 2011.
The Company files federal, state and foreign income tax returns in jurisdictions with varying statutes of limitations. The 2007 through 2010 tax years generally remain subject to examination by federal and most state tax authorities. In foreign jurisdictions, the 2004 through 2010 tax years generally remain subject to examination by tax authorities.
The Company recognizes interest and penalties related to unrecognized tax benefits and penalties in the provision for income taxes. As of December 31, 2010 and 2009, the Company had recorded a liability of $145,000 and $98,000 for the payment of interest and penalties, respectively.
7. Commitments and Contingencies:
Class Action Litigation
From November 6, 2009 through March 2, 2010, seven purported class action complaints were filed against the Company and several of its senior officers and directors by the following plaintiffs, individually and on
F-19
Table of Contents
behalf of all others similarly situated, in the United States District Court for the Central District of California: Fred Jean (filed November 6, 2009), Hadi Sakhai (filed November 6, 2009), Fred Greenwald (filed November 9, 2009), Daniel Munter (filed November 10, 2009), Jonathan Fischer (filed November 19, 2009), Marcel Weinberger (filed December 11, 2009), and Ganesh Meda (filed March 2, 2010). The Court consolidated the first six actions on January 21, 2010, and appointed Lead Plaintiffs on February 8, 2010. Lead Plaintiffs filed a consolidated complaint on April 9, 2010, and the defendants moved to dismiss the consolidated complaint. On July 15, 2010, prior to hearing the defendants’ motion, the Court replaced the former Lead Plaintiffs with a new Lead Plaintiff. The new Lead Plaintiff filed a consolidated amended complaint on August 13, 2010, purportedly on behalf of all persons and entities who acquired the Company’s common stock between June 16, 2009 and February 23, 2010. The consolidated amended complaint alleged claims against the Company and several of its senior officers and directors for violations of Section 10(b) of the Securities and Exchange Act of 1934 (the “Exchange Act”) and Rule 10b-5 thereunder and claims against several of its senior officers and directors for violations of Section 20A and Section 20(a) of the Exchange Act. In addition, the consolidated amended complaint alleged claims against the Company, several of its senior officers and directors, and four of its underwriters for violations of Section 11 of the Securities Act of 1933 (the “Securities Act”); claims against the Company, several of its senior officers, and one of its underwriters for violations of Section 12(a)(2) of the Securities Act; and claims against several of the Company’s senior officers and directors for violations of Section 15 of the Securities Act. The consolidated amended complaint sought compensatory damages for all damages sustained as a result of the defendants’ alleged actions, including reasonable costs and expenses, rescission, and other relief the Court deemed just and proper. The defendants moved to dismiss the consolidated amended complaint and on January 21, 2011, the Court granted the defendants’ motions to dismiss without prejudice. Lead Plaintiff must file a second amended complaint by February 22, 2011, and any motions to dismiss must be filed by March 24, 2011. The motions will be fully briefed by May 16, 2011. The Company believes the lawsuit is without merit and intends to vigorously defend itself. No amounts have been recorded in the consolidated financial statements for this matter as the Company believes it is too early in the proceedings to determine an outcome.
Shareholder Derivative Litigation
From November 12, 2009 through December 3, 2009, four shareholder derivative actions were filed purportedly on the Company’s behalf against several of its senior officers and directors by the following parties in the Superior Court of Orange County, California: Linda Lewis (filed November 12, 2009), Cherfein Joint Venture, LLC (filed November 17, 2009), James Gotfredson (filed November 25, 2009), and Sanjay Israni (filed December 3, 2009). These cases were consolidated and have been stayed until further order by the Court. Despite the stay, the Company and the individual defendants each filed demurrers to the consolidated complaint on July 28, 2010, pursuant to court order. A status conference is currently scheduled for June 13, 2011. Additionally, two shareholder derivative actions were filed purportedly on the Company’s behalf against several of its senior officers and directors in the United States District Court for the Central District of California. These two federal lawsuits were consolidated on April 13, 2010, and stayed by order of the Court on June 23, 2010. On January 28, 2011, the Court ordered a continuation of the stay of the federal court action. The consolidated complaints in both the state and federal actions allege claims for breach of fiduciary duties for insider selling and misappropriation of information, abuse of control, gross mismanagement, waste of corporate assets, unjust enrichment and violations of the California Corporations Code (with respect to the state court action only) related to allegedly false and misleading statements regarding the Company’s business and alleged illegal stock sales. The shareholder derivative actions generally seek compensatory damages for all alleged losses sustained as a result of the defendants’ alleged actions, including interest, reasonable costs and expenses, corporate governance reforms, disgorgement of profits, treble damages (with respect to the state court action only), equitable relief (with respect to the federal court action only), and other relief as the Court may deem just and proper. No amounts have been recorded in the consolidated financial statements for these matters as the Company believes it is too early in the proceedings to determine an outcome.
F-20
Table of Contents
Shareholder Demand
From January 5, 2010 through August 2, 2010, the Company received letters from counsel for four purported shareholders demanding that the Company take action to remedy breaches of fiduciary duties by several of its senior officers and directors. The allegations in these letters are similar to those found in the shareholder derivative complaints filed in state and federal court, and demand that the Company take action to recover damages from its senior officers and directors and to correct alleged deficiencies in its internal controls. The demand letters state that if, within a reasonable time, the Company’s board of directors has not commenced the requested action, or if the board of directors refuses to commence the requested action, the named shareholders will commence derivative actions. In evaluating the demand letters, the independent members of the Company’s board of directors conducted a review of the issues and allegations raised by the purported shareholders. After considering a number of factors, including the legal and factual merits of the claims made in the demand letters, the independent members of the Company’s board of directors unanimously determined that it would not be in the Company’s best interests to pursue the claims alleged in the demand letters against any of the individuals mentioned therein. This determination was formally communicated to counsel for the four purported shareholders on December 17, 2010.
Other Legal Proceedings
The United States Securities and Exchange Commission (“SEC”) is conducting a formal investigation involving trading in the Company’s securities. Certain of the Company’s officers and employees, including its CEO and President, have received subpoenas in connection with the SEC’s investigation. The Company is fully cooperating with the SEC in regards to this matter.
The Company is involved in other suits and claims in the ordinary course of business, and the Company may from time to time become a party to other legal proceedings arising in the ordinary course of business. As is common in the industry, the Company currently has in effect a number of agreements in which it has agreed to defend, indemnify and hold harmless certain of its suppliers and customers from damages and costs which may arise from the infringement by the Company’s products of third-party patents, trademarks or other proprietary rights. In addition, the Company has entered into indemnification agreements with its directors and certain of its officers that will require the Company, among other things, to indemnify them against certain liabilities that may arise by reason of their status or service as directors or officers. The Company maintains director and officer insurance, which may cover certain liabilities arising from its obligation to indemnify its directors and officers in certain circumstances. It is not possible to determine the maximum potential amount under these indemnification agreements due to the limited history of prior indemnification claims and the unique facts and circumstances involved in each particular agreement. Further, such indemnification agreements may not be subject to maximum loss clauses. The scope of such indemnity varies, but may, in some instances, include indemnification for damages and expenses, including attorneys’ fees. The term of these indemnification agreements is generally perpetual any time after execution of the agreement. The maximum potential amount of future payments the Company could be required to make under these indemnification agreements is unlimited. The Company has never incurred significant costs to defend lawsuits or settle claims related to these indemnification agreements. As a result, and after consideration of the Company’s current director and officer insurance coverage, the Company believes the estimated fair value of these agreements is minimal. Accordingly, the Company has no liabilities recorded for these agreements as of December 31, 2010.
Lease Commitments
As discussed in Note 10, the Company leases its corporate office facilities from affiliates of Manouch Moshayedi, Mark Moshayedi and Mike Moshayedi as of December 31, 2010. Manouch Moshayedi and Mark Moshayedi are executive officers, directors and major shareholders of the Company. Mike Moshayedi is also a shareholder of the Company. The Company also leases a number of small facilities in both foreign and domestic locations for its additional sales, research and development and engineering staff and for storage from
F-21
Table of Contents
unaffiliated third parties under operating leases with initial non-cancelable lease terms ranging from 1 to 5 years. Future scheduled minimum annual lease payments for the years ending December 31 are as follows (in thousands):
| Operating Leases (Related Party) |
Operating Leases (Third Party) |
|||||||
| 2011 |
$ | 663 | $ | 249 | ||||
| 2012 |
663 | 234 | ||||||
| 2013 |
663 | 5 | ||||||
| 2014 |
663 | — | ||||||
| 2015 |
663 | — | ||||||
| Thereafter |
1,050 | — | ||||||
| Net minimum lease payments |
$ | 4,365 | $ | 488 | ||||
Rent expense for the years ended December 31, 2010, 2009 and 2008 was approximately $1.5 million, $1.6 million and $1.5 million, respectively, inclusive of related party balances.
Purchase Commitments
The following table presents the Company’s contractual payment obligations and commitments (in thousands):
| Payment due by period | ||||||||||||||||||||
| Contractual Obligation |
Total | Less than 1 year |
1-3 years |
3-5 years |
More than 5 years |
|||||||||||||||
| Non-cancelable inventory purchase commitments |
$ | 10,205 | $ | 10,205 | $ | — | $ | — | $ | — | ||||||||||
| Other non-cancelable purchase commitments |
1,011 | 1,011 | — | — | — | |||||||||||||||
| Non-cancelable capital equipment purchase commitments |
354 | 354 | — | — | — | |||||||||||||||
| Total |
$ | 11,570 | $ | 11,570 | $ | — | $ | — | $ | — | ||||||||||
Purchase obligations represent open purchase orders for inventory, capital equipment, and other commitments in the ordinary course of business as of December 31, 2010.
8. Employee Benefit Plan:
The Company has a 401(k) retirement savings plan, with Company matching contributions. Employees may make voluntary contributions of up to 75% of their annual pre-tax compensation to the plan, subject to the maximum limit allowed by the IRS guidelines. The Company makes matching contributions equal to each participating employee’s matchable contributions to the plan, up to 4% of their salary. The Company makes matching contributions equal to one half of each participating employee’s matchable contributions to the plan on the next 2% of their salary. The Company’s matching contributions to the plan vest immediately. For the years ended December 31, 2010, 2009 and 2008, the Company made matching contributions of approximately $1.2 million, $714,000 and $833,000, respectively.
9. Stock Option Plan:
The 2000 Stock Incentive Plan (the “2000 Plan”) was adopted by the Company’s board of directors and approved by its shareholders in June 2000. On April 17, 2006, the 2000 Plan was amended and restated by the board of directors and approved by the Company’s shareholders on May 25, 2006. The 2000 Plan provided for the direct issuance or sale of shares and the grant of options to purchase shares of the Company’s common stock to officers and other employees, non-employee board members and consultants. Under the 2000 Plan, eligible
F-22
Table of Contents
participants were granted options to purchase shares of common stock at an exercise price not less than 100% of the fair market value of those shares on the grant date. In addition, the 2000 Plan as amended and restated, allowed for the issuance of restricted stock units to officers and other employees, non-employee board members and consultants. The 2000 Plan expired pursuant to its terms on February 28, 2010, and no further shares may be issued under the 2000 Plan.
The 2010 Incentive Award Plan (the “2010 Plan”) was adopted by the Company’s board of directors on March 26, 2010, and was approved by its shareholders on May 27, 2010. The 2010 Plan provides for the direct issuance or sale of shares and the grant of options to purchase shares of the Company’s common stock to officers and other employees, non-employee board members and consultants. Under the 2010 Plan, eligible individuals may be granted options to purchase shares of common stock at an exercise price not less than 100% of the fair market value of those shares on the grant date. Other types of equity awards that may be granted under the 2010 Plan include performance awards, dividend equivalents, deferred stock units, stock payments, restricted stock, restricted stock units, stock appreciation rights and other incentive awards. The Company’s board of directors, its compensation committee, or its equity awards committee determines the eligibility and vesting schedules for awards granted under the 2010 Plan. Options expire within a period of not more than ten years from the date of grant. Restricted stock units are share awards that entitle the holder to receive shares of the Company’s common stock upon vesting.
The following table sets forth the total stock-based compensation expense resulting from stock options and restricted stock units included in the Company’s Consolidated Statements of Income (in thousands):
| Year Ended December 31, | ||||||||||||
| 2010 | 2009 | 2008 | ||||||||||
| Cost of revenues |
$ | 346 | $ | 307 | $ | 101 | ||||||
| Sales and marketing |
1,564 | 993 | 431 | |||||||||
| General and administrative |
3,241 | 1,875 | 697 | |||||||||
| Research and development |
4,029 | 1,956 | 1,176 | |||||||||
| Total stock-based compensation expense |
$ | 9,180 | $ | 5,131 | $ | 2,405 | ||||||
The total income tax benefit recognized for share-based compensation arrangements was $1.9 million, $903,000 and $362,000 in the years ended December 31, 2010, 2009 and 2008, respectively.
At December 31, 2010, the 2010 Plan provided for the issuance of up to 4,600,000 shares of common stock. At December 31, 2010 there were 2,161,988 shares of common stock that remained available for grant under the plan. Stock options and restricted stock units generally vest 25% on each anniversary of the grant date for a period of four years. The Plan expires on March 26, 2020.
F-23
Table of Contents
A summary of the option activity under the 2000 Plan and 2010 Plan is as follows:
| Shares Under Option |
Weighted Average Exercise Price |
Weighted Average Remaining Contractual Term |
Aggregate Intrinsic Value |
|||||||||||||
| Outstanding at 12/31/09 |
4,274,374 | $ | 11.60 | |||||||||||||
| Granted |
1,360,300 | $ | 13.30 | |||||||||||||
| Exercised |
(679,169 | ) | $ | 5.49 | ||||||||||||
| Expired/forfeited |
(210,500 | ) | $ | 14.22 | ||||||||||||
| Outstanding at 12/31/10 |
4,745,005 | $ | 12.84 | 7.39 | $ | 29,775,316 | ||||||||||
| Vested and expected to vest at 12/31/10 |
4,321,304 | $ | 12.63 | 7.26 | $ | 27,913,708 | ||||||||||
| Exercisable at 12/31/10 |
1,745,705 | $ | 9.15 | 5.04 | $ | 16,597,354 | ||||||||||
The above intrinsic values are before applicable taxes, based on the Company’s closing stock price of $17.65 on December 31, 2010.
During the year ended December 31, 2010, the Company received $3.8 million in cash proceeds from the exercise of 679,169 options and $2.1 million for excess tax benefits from share-based payment arrangements. The intrinsic value of stock options exercised in the years ended December 31, 2010, 2009 and 2008 was $6.0 million, $34.7 million and $7.7 million, respectively.
As of December 31, 2010, total unrecognized compensation expense related to unvested option-based compensation arrangements already granted under the 2000 Plan and the 2010 Plan was approximately $22.8 million, which the Company expects to recognize over a weighted-average period of 2.8 years.
A summary of the Company’s weighted average fair value for stock option activity in 2010 is as follows:
| Shares | Weighted Average Grant Date Fair Value |
|||||||
| Non-vested stock options at December 31, 2009 |
2,568,875 | $ | 9.11 | |||||
| Granted |
1,360,300 | $ | 8.03 | |||||
| Vested |
(729,375 | ) | $ | 8.55 | ||||
| Forfeited |
(200,500 | ) | $ | 8.75 | ||||
| Non-vested stock options at December 31, 2010 |
2,999,300 | $ | 8.78 | |||||
The weighted average grant date fair value of options granted in 2010, 2009 and 2008 was $8.03, $11.32 and $5.97, respectively.
The total fair value of shares vested in 2010, 2009 and 2008 was $6.2 million, $2.3 million and $534,000, respectively.
The fair value of stock grants is calculated using the Black-Scholes option valuation model. The Company has not and does not expect to pay dividends; therefore, no specific dividend yield is utilized under the Black-Scholes option pricing model. The risk-free interest rate assumption is based upon observed interest rates appropriate for the term of the Company’s employees’ stock option grants. The volatility assumption used to value option grants is based exclusively on the Company’s historical available closing stock price information. The Company can rely exclusively on this historical information if (1) the Company has no reason to believe that
F-24
Table of Contents
its future volatility over the expected or contractual term is likely to differ from the past, (2) the computation of historical volatility uses a simple average calculation method, (3) a sequential period of historical data at least equals the expected or contractual term of the share options is used and (4) a reasonably sufficient number of price observations are used. The expected term of employee stock options, which represents the period the stock options are expected to remain outstanding, was based on a combination of historical option exercise activity of prior grants with similar characteristics and expected future employee behavior. The expected life of employees’ stock option grants are impacted by all of the underlying assumptions used in the Company’s model. The Black-Scholes option pricing model assumes that employees’ exercise behavior is a function of the options’ remaining contractual life and the extent to which the option is in-the-money. The Black-Scholes option pricing model estimates the probability of exercise as a function of these two variables based on the history of exercises and cancellations of past option grants made by the Company.
The weighted average assumptions used to value the option grants are as follows:
| Year Ended December 31, | ||||||||||||
| 2010 | 2009 | 2008 | ||||||||||
| Expected term (years) |
5.8 | 5.8 | 5.8 | |||||||||
| Risk-free interest rate |
2.2 | % | 2.6 | % | 3.1 | % | ||||||
| Volatility |
66.7 | % | 64.3 | % | 64.9 | % | ||||||
| Dividend rate |
0.0 | % | 0.0 | % | 0.0 | % | ||||||
Grant fair value per share of restricted stock units is determined by the closing price of the common stock on the issuance date. Each unit represents the right to receive one share of the Company’s common stock as each restricted stock unit vests.
The following table presents a summary of the restricted stock unit activity:
| Restricted Units |
Weighted Average Grant Fair Value |
|||||||
| Non-vested restricted stock units at December 31, 2009 |
337,382 | $ | 13.56 | |||||
| Granted |
905,812 | $ | 14.08 | |||||
| Vested |
(101,098 | ) | $ | 9.39 | ||||
| Forfeited |
(51,142 | ) | $ | 13.42 | ||||
| Non-vested restricted stock units at December 31, 2010 |
1,090,954 | $ | 14.38 | |||||
The weighted average grant date fair value of restricted stock units granted in 2010, 2009 and 2008 was $14.08, $15.92 and $10.69, respectively.
The total fair value of restricted stock units vested in 2010, 2009 and 2008 was $949,000, $815,000 and $962,000, respectively.
As of December 31, 2010, total unrecognized compensation expense related to unvested restricted stock units already granted under the 2000 Plan and the 2010 Plan was approximately $13.8 million, which the Company expects to recognize over a weighted average period of 3.4 years.
10. Related Party Transactions:
The Company occupies two leased facilities of approximately 24,500 and 48,600 square feet in Santa Ana, California, which serves as its corporate headquarters. In addition to the Company’s executive offices, these facilities also contain engineering, administrative, and sales and marketing personnel. The Company leases both
F-25
Table of Contents
facilities from MDC Land LLC (“MDC”), a limited liability company owned by Manouch Moshayedi, Mark Moshayedi and Mike Moshayedi each of whom is a founder of the Company. Manouch Moshayedi and Mark Moshayedi are also executive officers, directors and major shareholders of the Company as of December 31, 2010. MDC has no operations other than leasing transactions with the Company.
An operating lease with MDC for the 24,500 square foot facility expires in July 2017. The monthly base rent was approximately $21,000 per month during 2010. Beginning August 1, 2009, the monthly base rent was adjusted to approximately $20,000 based on the change in the Consumer Price Index. For the remainder of the lease, base rent shall be adjusted every two years based on the change in the Consumer Price Index.
An operating lease with MDC for the 48,600 square foot facility expires in July 2017. The monthly base rent was approximately $35,000 per month during 2010. Beginning August 1, 2009, the monthly base rent was adjusted to approximately $34,000 based on the change in the Consumer Price Index. For the remainder of the lease, base rent shall be adjusted every two years based on the change in the Consumer Price Index.
Building rent expense for these two facilities amounted to approximately $672,000, $640,000 and $660,000 for the years ended December 31, 2010, 2009 and 2008, respectively. At December 31, 2010, 2009 and 2008, there was no outstanding facility rent owed to MDC.
In 2010, 2009 and 2008, the Company purchased $0, $14,000 and $0, respectively, in testing services from QualCenter, Inc., a Texas S Corporation company beneficially owned by Manouch Moshayedi, Mike Moshayedi and Mark Moshayedi. QualCenter is located in Houston, Texas and performs tests and qualification services on Hewlett-Packard desktop, laptop, server, and workstation memory modules. QualCenter performs these services on an exclusive basis for Hewlett-Packard under an arrangement whereby Hewlett-Packard defines and specifies all test and evaluation procedures and methodologies.
11. Credit Facilities:
On July 30, 2008, the Company entered into a $35 million two-year senior unsecured revolving credit facility (the “Credit Facility”) with Wachovia Bank, National Association (“Wachovia”). The Credit Facility bore interest at a floating rate equivalent to, at the option of the Company, either (i) LIBOR plus 0.70% - 1.20% depending on the Company’s leverage ratio at each quarter end or (ii) Wachovia’s prime rate, announced from time to time, less 1.00% - 1.50% depending on the Company’s leverage ratio at each quarter end.
On November 23, 2009, the Company’s subsidiary, STEC Malaysia, entered into an agreement for a short-term credit facility (the “Short-term Facility”) with Deutsche Bank (Malaysia) Berhad (“Deutsche”). The agreement allows STEC Malaysia to borrow an aggregate principal amount of $10 million in the form of letters of credit, trust receipts, bills acceptances/financing, banker’s acceptances, and banker’s and shipping guarantees which are commonly used to conduct business in Asia. Credit under the Short-term Facility will be available until notice of termination by either party. Borrowings under the Short-term Facility will bear interest at various rates with repayments due between 30 days and 14 months, depending on the form of borrowing. The Short-term Facility is guaranteed by STEC, Inc. and contains customary affirmative and negative covenants. As of December 31, 2010, there were no borrowings outstanding under the Short-term Facility and STEC Malaysia was in compliance with all required covenants. The Short-term Facility will be used to facilitate general business transactions and fund working capital requirements for STEC Malaysia, on an as needed basis.
F-26
Table of Contents
12. Selected Quarterly Financial Data (unaudited) (in thousands, except per share amounts):
| Quarter Ended: |
December 31, 2010 | September 30, 2010 | June 30, 2010 | March 31, 2010 | ||||||||||||
| Net revenues |
$ | 93,918 | $ | 86,074 | $ | 61,348 | $ | 38,809 | ||||||||
| Gross profit |
42,488 | 39,923 | 26,122 | 13,186 | ||||||||||||
| Operating income (loss) |
16,801 | 15,066 | 3,832 | (7,137 | ) | |||||||||||
| Income (loss) from continuing operations |
17,498 | 13,619 | 2,937 | (5,353 | ) | |||||||||||
| Loss from discontinued operations |
(11 | ) | (2 | ) | (150 | ) | — | |||||||||
| Net income (loss) |
$ | 17,487 | $ | 13,617 | $ | 2,787 | $ | (5,353 | ) | |||||||
| Net income (loss) per share: |
||||||||||||||||
| Basic: |
||||||||||||||||
| Continuing operations |
$ | 0.34 | $ | 0.27 | $ | 0.06 | $ | (0.11 | ) | |||||||
| Discontinued operations |
— | — | — | — | ||||||||||||
| Total |
$ | 0.34 | $ | 0.27 | $ | 0.06 | $ | (0.11 | ) | |||||||
| Diluted: |
||||||||||||||||
| Continuing operations |
$ | 0.34 | $ | 0.26 | $ | 0.06 | $ | (0.11 | ) | |||||||
| Discontinued operations |
— | — | — | — | ||||||||||||
| Total |
$ | 0.34 | $ | 0.26 | $ | 0.06 | $ | (0.11 | ) | |||||||
| Quarter Ended: |
December 31, 2009 | September 30, 2009 | June 30, 2009 | March 31, 2009 | ||||||||||||
| Net revenues |
$ | 106,004 | $ | 98,293 | $ | 86,350 | $ | 63,536 | ||||||||
| Gross profit |
53,926 | 48,815 | 43,173 | 23,033 | ||||||||||||
| Operating income |
30,538 | 30,418 | 24,009 | 4,198 | ||||||||||||
| Income from continuing operations |
24,508 | 24,478 | 19,363 | 3,194 | ||||||||||||
| Income (loss) from discontinued operations |
1,285 | — | — | (215 | ) | |||||||||||
| Net income |
$ | 25,793 | $ | 24,478 | $ | 19,363 | $ | 2,979 | ||||||||
| Net income (loss) per share: |
||||||||||||||||
| Basic: |
||||||||||||||||
| Continuing operations |
$ | 0.49 | $ | 0.49 | $ | 0.40 | $ | 0.07 | ||||||||
| Discontinued operations |
0.02 | — | — | (0.01 | ) | |||||||||||
| Total |
$ | 0.51 | $ | 0.49 | $ | 0.40 | $ | 0.06 | ||||||||
| Diluted: |
||||||||||||||||
| Continuing operations |
$ | 0.47 | $ | 0.47 | $ | 0.38 | $ | 0.07 | ||||||||
| Discontinued operations |
0.03 | — | — | (0.01 | ) | |||||||||||
| Total |
$ | 0.50 | $ | 0.47 | $ | 0.38 | $ | 0.06 | ||||||||
F-27
Table of Contents
SIGNATURES
Pursuant to the requirements of Section 13 or 15(d) of the Securities Exchange Act of 1934, the Registrant has duly caused this Annual Report on Form 10-K to be signed on its behalf by the undersigned, thereunto duly authorized, in the City of Santa Ana, State of California, on the 22nd day of February, 2011.
| STEC, Inc. | ||
| By: | /s/ MANOUCH MOSHAYEDI | |
| Name: | Manouch Moshayedi | |
| Title: | Chief Executive Officer and Chairman of the Board of Directors | |
Pursuant to the requirements of the Securities Exchange Act of 1934, this Report has been signed by the following persons in the capacities and on the dates indicated:
| Signature |
Title |
Date | ||
| /S/ MANOUCH MOSHAYEDI Manouch Moshayedi |
Chief Executive Officer and Chairman of the Board of Directors |
February 22, 2011 | ||
| /S/ MARK MOSHAYEDI Mark Moshayedi |
President, Chief Operating Officer, Chief Technical Officer, Secretary and Director |
February 22, 2011 | ||
| /S/ RAYMOND COOK Raymond Cook |
Chief Financial Officer (Principal Financial and Accounting Officer) |
February 22, 2011 | ||
| /S/ RAJAT BAHRI Rajat Bahri |
Director |
February 22, 2011 | ||
| /S/ F. MICHAEL BALL F. Michael Ball |
Director |
February 22, 2011 | ||
| /S/ CHRISTOPHER W. COLPITTS Christopher W. Colpitts |
Director |
February 22, 2011 | ||
| /S/ KEVIN C. DALY Kevin C. Daly, Ph.D. |
Director |
February 22, 2011 | ||
| /S/ MATTHEW L. WITTE Matthew L. Witte |
Director |
February 22, 2011 | ||
Table of Contents
EXHIBIT INDEX
| Incorporation by Reference | ||||||||
| Exhibit |
Exhibit Description |
Form |
Exhibit |
Filing Date | ||||
| 3.1 | Amended and Restated Articles of Incorporation | S-1/A | 3.1 | July 3, 2000 | ||||
| 3.1.1 | Certificate of Amendment to the Amended and Restated Articles of Incorporation, dated August 31, 2000 | S-1/A | 3.3 | September 27, 2000 | ||||
| 3.1.2 | Certificate of Amendment to the Amended and Restated Articles of Incorporation, dated May 1, 2001 | 10-Q | 3.1 | May 14, 2001 | ||||
| 3.1.3 | Certificate of Ownership as filed with the California Secretary of State on March 7, 2007 | 8-K | 3.1 | March 8, 2007 | ||||
| 3.2 | Amended and Restated Bylaws | 8-K | 3.2 | October 2, 2007 | ||||
| 4.1 | Specimen Stock Certificate | 10-K | 4.2 | March 30, 2007 | ||||
| 10.1 | Amended and Restated Real Estate Lease, dated April 1, 2000, by and between MDC Land LLC and the Registrant (24,500 sq. ft. facility) | S-1/A | 10.1 | July 3, 2000 | ||||
| 10.2 | Amendment No. 1 to Amended and Restated Real Estate Lease, dated April 29, 2002, by and between MDC Land, LLC and the Registrant (24,500 sq. ft. facility) | S-1/A | 10.10 | October 15, 2003 | ||||
| 10.3 | Amended and Restated Real Estate Lease, dated June 1, 2000, by and between MDC Land LLC and the Registrant (48,635 sq. ft. facility) | S-1/A | 10.2 | July 3, 2000 | ||||
| 10.4 | Amendment No. 1 to Amended and Restated Real Estate Lease, dated April 29, 2002, by and between MDC Land, LLC and the Registrant (48,635 sq. ft. facility) | S-1/A | 10.11 | October 15, 2003 | ||||
| 10.5 | Form of Indemnification Agreement between the Registrant and each of its directors and executive officers | S-1/A | 10.7 | July 3, 2000 | ||||
| 10.6 | Letter, dated August 25, 2006, from Malaysian Industrial Development Authority addressed to the Registrant offering special incentives | 8-K | 10.1 | August 30, 2006 | ||||
| 10.7 | Asset Purchase Agreement, dated February 9, 2007, by and among Fabrik, Inc., Fabrik Acquisition Corp. and the Registrant | 8-K | 10.1 | February 12, 2007 | ||||
| 10.8 | Credit Agreement, dated July 30, 2008, among the Registrant, its domestic subsidiaries, the lenders party thereto and Wachovia Bank, National Association, as Administrative Agent | 8-K | 10.1 | August 1, 2008 | ||||
Table of Contents
| Incorporation by Reference | ||||||||
| Exhibit |
Exhibit Description |
Form |
Exhibit |
Filing Date | ||||
| 10.9† | 2000 Stock Incentive Plan (as amended through April 17, 2006) | S-8 | 99.1 | August 11, 2006 | ||||
| 10.10† | 2000 Stock Incentive Plan form of Notice of Grant of Stock Option | 10-K | 10.14 | March 30, 2007 | ||||
| 10.11† | 2000 Stock Incentive Plan form of Stock Option Agreement | 10-K | 10.15 | March 30, 2007 | ||||
| 10.12† | 2000 Stock Incentive Plan form of Notice of Grant of Non-Employee Director Automatic Stock Option | 10-K | 10.16 | March 30, 2007 | ||||
| 10.13† | 2000 Stock Incentive Plan form of Automatic Stock Option Agreement for Non-Employee Directors | 10-K | 10.17 | March 30, 2007 | ||||
| 10.14† | 2000 Stock Incentive Plan form of Restricted Stock Unit Award Agreement | 10-K | 10.18 | March 30, 2007 | ||||
| 10.15† | Executive Cash Incentive Plan | 8-K | 10.1 | March 7, 2008 | ||||
| 10.16† | Employment Offer Letter, dated October 15, 2008, between the Registrant and Raymond Cook | 8-K | 10.1 | November 3, 2008 | ||||
| 10.17† | Form of Severance and Change in Control Agreement, dated February 22, 2010, entered into between the Registrant and Manouch Moshayedi and between the Registrant and Mark Moshayedi | 10-Q | 10.1 | May 6, 2010 | ||||
| 10.18† | Severance and Change in Control Agreement, dated February 22, 2010, entered into between the Registrant and Raymond Cook | 10-Q | 10.2 | May 6, 2010 | ||||
| 10.19† | 2010 Incentive Award Plan | DEF-14A | Appendix A | April 16, 2010 | ||||
| 10.20† | 2010 Incentive Award Plan form of Employee Stock Option Grant Notice and Stock Option Agreement | S-8 | 99.2 | May 28, 2010 | ||||
| 10.21† | 2010 Incentive Award Plan form of Restricted Stock Unit Award Grant Notice and Restricted Stock Unit Award Agreement | S-8 | 99.3 | May 28, 2010 | ||||
| 10.22† | 2010 Incentive Award Plan form of Non-Employee Director Stock Option Grant Notice and Stock Option Agreement | S-8 | 99.4 | May 28, 2010 | ||||
| 21.1 | List of Subsidiaries of the Registrant | Filed herewith | ||||||
| 23.1 | Consent of PricewaterhouseCoopers LLP | Filed herewith | ||||||
| 31.1 | Certification of Chief Executive Officer pursuant to Section 302 of the Sarbanes-Oxley Act of 2002 | Filed herewith | ||||||
Table of Contents
| Incorporation by Reference | ||||||||
| Exhibit |
Exhibit Description |
Form |
Exhibit |
Filing Date | ||||
| 31.2 | Certification of Chief Financial Officer pursuant to Section 302 of the Sarbanes-Oxley Act of 2002 | Filed herewith | ||||||
| 32.1* | Certification of Chief Executive Officer pursuant to 18 U.S.C. Section 1350, as adopted pursuant to Section 906 of the Sarbanes-Oxley Act of 2002 | Furnished herewith | ||||||
| 32.2* | Certification of Chief Financial Officer pursuant to 18 U.S.C. Section 1350, as adopted pursuant to Section 906 of the Sarbanes-Oxley Act of 2002 | Furnished herewith | ||||||
| 101.INS** | XBRL Instance Document | |||||||
| 101.SCH** | XBRL Taxonomy Extension Schema Document | |||||||
| 101.CAL** | XBRL Taxonomy Extension Calculation Linkbase Document | |||||||
| 101.DEF** | XBRL Taxonomy Extension Definition Linkbase Document | |||||||
| 101.LAB** | XBRL Taxonomy Extension Label Linkbase Document | |||||||
| 101.PRE** | XBRL Taxonomy Extension Presentation Linkbase Document | |||||||
| † | Management contract or compensatory plan or arrangement. |
| * | The information in Exhibits 32.1 and 32.2 shall not be deemed “filed” for purposes of Section 18 of the Securities Exchange Act of 1934, as amended (the “Exchange Act”), or otherwise subject to the liabilities of that section, nor shall they be deemed incorporated by reference in any filing under the Securities Act of 1933, as amended, or the Exchange Act (including this Report), unless the Registrant specifically incorporates the foregoing information into those documents by reference. |
| ** | Pursuant to applicable securities laws and regulations, the Company is deemed to have complied with the reporting obligation relating to the submission of interactive data files in such exhibits and are not subject to liability under any anti-fraud provisions of the federal securities laws as long as the Company has made a good faith attempt to comply with the submission requirements and promptly amend the interactive data files after becoming aware that the interactive data files fail to comply with the submission requirements. Users of this data are advised that, pursuant to Rule 406T, these interactive data files are deemed not filed and otherwise are not subject to liability. |