Attached files
Table of Contents
UNITED STATES
SECURITIES AND EXCHANGE COMMISSION
Washington, D.C. 20549
Form 10-K
(Mark One)
| x | ANNUAL REPORT PURSUANT TO SECTION 13 OR 15(d) OF THE SECURITIES EXCHANGE ACT OF 1934 |
For the fiscal year ended December 31, 2010
or
| ¨ | TRANSITION REPORT PURSUANT TO SECTION 13 OR 15(d) OF THE SECURITIES EXCHANGE ACT OF 1934 |
For the transition period from to
Commission file number: 000-30241
DDi CORP.
(Exact name of registrant as specified in its charter)
| Delaware | 06-1576013 | |
| (State or other jurisdiction of incorporation or organization) |
(I.R.S. Employer Identification No.) |
1220 N. Simon Circle,
Anaheim, California 92806
(Address and zip code of principal executive offices)
(714) 688-7200
(Registrant’s telephone number, including area code)
Securities registered pursuant to Section 12(b) of the Act:
| Title of each class |
Name of each exchange on which registered | |
| Common Stock, $0.001 par value | The NASDAQ Global Select Market |
Securities registered pursuant to Section 12(g) of the Act:
None
Indicate by check mark if the registrant is a well-known seasoned issuer, as defined in Rule 405 of the Securities Act. Yes ¨ No x
Indicate by check mark if the registrant is not required to file reports pursuant to Section 13 or 15(d) of the Act. Yes ¨ No x
Indicate by check mark whether the registrant (1) has filed all reports required to be filed by Section 13 or 15(d) of the Securities Exchange Act of 1934 during the preceding 12 months (or for such shorter period that the registrant was required to file such reports), and (2) has been subject to such filing requirements for the past 90 days. Yes x No ¨
Indicate by check mark whether the issuer has submitted electronically and posted on its corporate Web site, if any, every Interactive Data File required to be submitted and posted pursuant to Rule 405 of Regulation S-T (Section 232.405 of this chapter) during the preceding 12 months (or for such shorter period that the registrant was required to submit and post such files). Yes ¨ No ¨
Indicate by check mark if disclosure of delinquent filers pursuant to Item 405 of Regulation S-K is not contained herein, and will not be contained, to the best of the registrant’s knowledge, in the definitive proxy or information statements incorporated by reference in Part III of this Form 10-K or any amendment to this Form 10-K. x
Indicate by check mark whether the registrant is a large accelerated filer, an accelerated filer, a non-accelerated filer, or a smaller reporting company. See the definitions of “large accelerated filer,” “accelerated filer,” and “smaller reporting company” in Rule 12b-2 of the Exchange Act). (check one):
| Large accelerated filer ¨ | Accelerated filer x | Non-accelerated filer ¨ (Do not check if a smaller reporting company) |
Smaller reporting company ¨ |
Indicate by check mark whether the registrant is a shell company (as defined in Rule 12b-2 of the Act). Yes ¨ No x
The aggregate market value of the Common Stock held by non-affiliates of the registrant as of June 30, 2010 was approximately $96.9 million (computed using the closing price of $7.53 per share of Common Stock on June 30, 2010, as reported by the NASDAQ Stock Market).
As of February 22, 2011, DDi Corp. had 20,196,243 shares of common stock, par value $0.001 per share, outstanding.
DOCUMENTS INCORPORATED BY REFERENCE
Portions of the registrant’s definitive proxy statement prepared in connection with the Annual Meeting of Stockholders to be held in 2011 are incorporated by reference in Part III of this Form 10-K.
Table of Contents
DDi CORP.
FORM 10-K
Table of Contents
PART I
This Annual Report on Form 10-K contains “forward-looking statements” – that is, statements related to future, not past, events. In this context, forward-looking statements often address our assumptions, projections, targets, intentions or beliefs about expected future business, financial performance and financial condition. All statements other than statements of historical facts included in this Annual Report on Form 10-K relating to expectation of future financial performance, continued growth, changes in economic conditions or capital markets, and changes in customer usage patterns and preferences are forward-looking statements.
Unless the context requires otherwise, references to “the Company,” “we,” “us,” “our,” “DDi,” and “DDi Corp.” refer specifically to DDi Corp. and its consolidated subsidiaries. You should carefully consider the risk factors described below, as well as the other information included in this Annual Report on Form 10-K prior to making a decision to invest in our securities.
Words or phrases such as “anticipates,” “believes,” “estimates,” “expects,” “intends,” “plans,” “predicts,” “projects,” “targets,” “will likely result,” “will continue,” “may,” “could” or similar expressions identify forward-looking statements. Forward-looking statements involve risks and uncertainties which could cause actual results or outcomes to differ materially from those expressed. We caution that while we make such statements in good faith and we believe such statements are based on reasonable assumptions, including without limitation, management’s examination of historical operating trends, data contained in records, and other data available from third parties, we cannot assure you that our expectations will be realized.
For us, particular uncertainties that could cause our actual results to be materially different than those expressed in our forward-looking statements include: the severity and duration of current economic and financial conditions, including volatility in interest and exchange rates, commodity and equity prices; the impact of U.S. and foreign government programs to restore liquidity and stimulate national and global economies; the impact of conditions in the financial and credit markets on the availability and cost of credit for DDi and its customers; the level of demand and financial performance of the major industries we serve, including, without limitation, communications, computing, military/aerospace, industrial electronics, instrumentation and medical; increased competition; increased costs; the impact of state, federal or foreign legislation or regulation; investigative and legal proceedings and legal compliance risks; strategic actions, including acquisitions and dispositions and our success in integrating acquired businesses; and numerous other matters of national, regional and global scale, including those of a political, economic, business and competitive nature. These uncertainties are described in more detail in Part 1, Item 1A, “Risk Factors” of this Annual Report on Form 10-K.
Any forward-looking statement speaks only as of the date on which such statement is made, and, except as required by law, we undertake no obligation to update any forward-looking statement to reflect events or circumstances after the date on which such statement is made or to reflect the occurrence of unanticipated events. The risks and uncertainties described below are not the only ones facing our company. Additional risks and uncertainties not presently known or that we currently believe to be less significant may also adversely affect us. New factors emerge from time to time, and it is not possible for management to predict all such factors.
| Item 1. | Business. |
Overview
We are a leading provider of time-critical, technologically-advanced printed circuit board (“PCB”) engineering and manufacturing services. We specialize in engineering and fabricating complex multi-layer PCBs on a quick-turn basis, with lead times as short as 24 hours, and in manufacturing products with high levels of complexity and reliability with low-to-moderate production volumes. We have over 1,000 PCB customers in various market segments including communications, computing, military/aerospace, industrial electronics, instrumentation, medical and high-durability commercial markets. Our customers include both original equipment manufacturers (“OEMs”) and electronic manufacturing services (“EMS”) providers. With such a broad customer base and approximately 60 new PCB designs tooled per day, we have accumulated significant process and engineering expertise. Our core strength is developing innovative, high-performance solutions for customers during the engineering, test and launch phases of new electronic product development and supporting long-term requirements for low and mid-volume requirements, such as with the military/aerospace market. Our entire organization is focused on rapidly and reliably filling complex customer orders and building long-term customer relationships. Our engineering capabilities and seven manufacturing facilities located in the United States and Canada, together with our suppliers in Asia, enable us to respond to time-critical orders and technology challenges for our customers.
1
Table of Contents
On December 31, 2009, we completed the acquisition of Coretec Inc. (“Coretec”), a Canadian-based PCB manufacturer whose shares previously were publicly traded on the Toronto Stock Exchange. In 2010, this acquisition has allowed us to increase our overall North American production capacity, extend our presence in the military/aerospace and medical markets and strengthen our flex and rigid-flex product capabilities. We believe that these positive impacts from the acquisition will continue into the future.
We operate in one reportable business segment through our primary operating subsidiary, DDi Global Corp. Our consolidated revenues in 2010, 2009 and 2008 were $267.8 million, $158.0 million, and $190.8 million, respectively, our net income (loss) for the same periods were $20.7 million, $1.8 million and ($33.4 million) and our total assets for the same periods were $139.9 million, $120.5 million and $90.8 million. Revenues are attributable to the country in which the customer buying the product is located. For financial information about our geographical operations and long-lived assets,, see Note 2 of the Notes to Consolidated Financial Statements - Significant Accounting Policies.
Industry Overview
Printed circuit boards are a fundamental component of virtually all electronic equipment. A PCB is comprised of layers of laminate and copper and contains patterns of electrical circuitry to connect electronic components. The level of PCB complexity is determined by several characteristics, including interconnect and circuit density, size, layer count, material type and functionality. High-end commercial and military/aerospace equipment manufacturers require complex PCBs fabricated with higher layer counts, greater interconnect and circuit density and advanced materials, and demand highly complex and sophisticated manufacturing capabilities. By contrast, other PCBs, such as those used in non-wireless consumer electronic products, are generally less complex and have less sophisticated manufacturing requirements.
We see several significant trends within the PCB manufacturing industry, including:
| • | Short product life cycles for electronics. Rapid advances in technology are significantly shortening product life-cycles and placing increased pressure on OEMs to develop new products in shorter periods of time. In response to these pressures, OEMs look to PCB manufacturers to offer design and engineering support and quick-turn manufacturing services to reduce time to market. Many OEMs, in an effort to increase electronic supply chain efficiency, work with a small number of technically qualified suppliers that have sophisticated manufacturing expertise and are able to offer a broad range of PCB products. |
| • | Increasing complexity of electronic equipment. OEMs are continually designing more complex and higher performance electronic equipment, which requires sophisticated PCBs that accommodate higher signal speeds and frequencies and increased component densities and operating temperatures. Further, the semiconductor industry continues to design and manufacture integrated circuits with higher speeds or smaller sizes and requires PCBs to meet the densities of the semiconductor industry. In turn, OEMs rely on PCB manufacturers that can provide advanced engineering and manufacturing services early in the new product development cycle. OEMs are also requiring more lead-free materials and other “green” products which add to the complexity of the materials utilized in the manufacturing of PCBs. |
| • | Military and aerospace products. The military/aerospace market is characterized by time-consuming and complex certification processes, long product life cycles, and a unique combination of demand for leading-edge technology with extremely high reliability and durability. An increased focus on incorporating technology in products for reconnaissance and intelligence combined with continued spending on military communications, aerospace, and weapons systems applications are anticipated to drive steady end-market growth. Success in the military/aerospace market is generally achieved after manufacturers demonstrate the long-term ability to pass extensive OEM and government certification processes, numerous product inspections, audits for quality and performance, and extensive administrative requirements associated with participation in government programs. Export controls represent a barrier to entry for international competition as they restrict the overseas export of defense-related materials, services, and sensitive technologies that are associated with government programs. In addition, the complexity of the end products serves as a barrier to entry to potential new suppliers. |
| • | Shifting of high volume production to Asia. Asian-based PCB manufacturers have been able to capitalize on lower labor costs to increase their market share of production of PCBs used in higher-volume consumer electronics applications, such as personal computers and cell phones. |
Our Customer Solution
Our customer solution combines reliable, time-critical, industry-leading engineering expertise with advanced process and manufacturing technologies. We play an integral role in our customers’ product development and manufacturing strategies. We believe our core strengths in the engineering, test and launch phases of new electronic product development provide a competitive advantage in delivering our services to customers in industries characterized by significant research and development, high-quality complex end product requirements, rapid product introduction cycles and demand for time-critical services.
2
Table of Contents
Our customers benefit from the following:
| • | Customized engineering solutions. We are actively involved in the early stages of our customers’ product development cycles. This positions us at the leading-edge of technical innovation in the engineering of complex PCBs. Our engineering and sales teams collaborate to identify the specific needs of our customers and work with them to develop innovative, high performance solutions. This method of product development provides us with an in-depth understanding of our customers’ businesses and enables us to better anticipate and serve their needs. |
| • | Strong process and technology expertise. We deliver time-critical and highly complex manufacturing services through our advanced manufacturing processes and material and technology expertise. We regularly manufacture PCBs with fine line circuitry and complex via structures. Vias are drilled holes which provide electrical connectivity between layers of circuitry in a PCB. All of our production facilities are ISO 9001:2008/AS9100B certified. These certifications require that we meet standards related to management, production and quality control, among others. |
| • | Military/aerospace capabilities. We provide a comprehensive product offering in the military/aerospace market and provide customers with comprehensive PCB fabrication capabilities, exotic material expertise and technological experience. In addition, some of our production facilities are MIL-PRF-55110, AS9100, MIL-PRF-31032 MIL-P-50884, and NADCAP certified, which requires us to meet certain military standards related to production and quality control. |
| • | Advanced manufacturing technologies. We are committed to offering advanced manufacturing processes and focus on enhancing existing capabilities, providing reliable products to our customers and developing new technologies. We are consistently among the first to adopt advances in PCB manufacturing technology. For example, we believe that we were the first PCB manufacturer in North America to manufacture PCBs utilizing stacked microvia, or SMV® technology, and we continue to evolve the SMV® technology with new and enhanced capabilities. Further, we introduced the FLAT-WRAP™ technology which addresses critical design and manufacturing issues for IPC Class 2 and Class 3 copper wrap plating requirements. We believe we are the industry leader in this technology. |
| • | Time-critical services. In addition to customized engineering solutions and advanced manufacturing technologies, we specialize in providing time-critical, or quick-turn, PCB engineering and manufacturing services. Our engineering, fabrication and customer service systems enable us to respond to customers’ needs with quick-turn services. Our personnel are trained and experienced in providing our services with speed and precision. For example, we are able to issue price quotes to our customers in hours, rather than days. Approximately 23% of our PCB sales in 2010 were generated from orders with manufacturing delivery of 10 days or less, and we fill some of our customers’ orders in as little as 24 hours. As we continue to increase our penetration into the military/aerospace market and see the complexity of our products increase, the percentage of our total sales with lead times of 10 days or less may continue to decline. |
Our Strategy
Our goal is to be the leading provider of technologically-advanced, time-critical PCB engineering and manufacturing services in North America. To achieve this goal, through some combination of organic growth and corporate development activities, we:
| • | Focus on engineering services and support for high-technology and complex PCBs. We focus on offering leading-edge engineering, high-technology, high-reliability, services that address the high mix, low volume and complex PCBs market demand because we believe it provides us a competitive advantage in the North American marketplace. This also enables us to better anticipate and serve our customers’ needs. We seek to work with our customers to provide innovative and high performance solutions. |
| • | Maintain our technology leadership. We work to continually develop new technology and engineering expertise as we work closely with our broad customer base in the introduction of their new products. We believe this expertise and ability positions us as an industry leader in providing technologically-advanced, time-critical services. |
| • | Continue to expand our presence in the military/aerospace market. We have targeted the military/aerospace market as a growth opportunity for DDi as we believe this type of work is less likely to move offshore. Although historically DDi has been more focused on commercial markets, we believe this shift in focus may result in improved revenue growth in the future. In 2010, our sales in the military/aerospace market increased approximately 76%. We intend to continue to pursue internal initiatives aimed at increasing our presence in the military/aerospace market and better serving existing customers within this market. |
3
Table of Contents
| • | Focus on time-critical services. We focus on the quick-turn segment of the PCB industry. We target the time-critical services market because the significant value of these services to our customers allows us to charge a premium and generate higher margins. We also believe that the market dynamics for time-critical services and products are more resistant to pricing pressure and commoditization, and are less likely to move offshore. |
| • | Continue to serve our large and diverse customer base. We believe that maintaining a broad customer base enables us to further enhance our engineering expertise while reducing end-market and customer concentration risk. We maintain a sales and technical marketing staff focused solely on building and maintaining customer relationships. We are focused on becoming an integral part of customers’ new product initiatives and work closely with their research and development personnel. |
| • | Pursue new customers and markets with high growth potential. We continue to pursue new customers with high growth characteristics and target additional high growth end-markets that are characterized by rapid product introduction cycles and demand for time-critical services. |
| • | Corporate Development. DDi intends to explore strategic alliances and acquisition opportunities that enable us to address our customers’ key requirements. We intend to selectively pursue strategic opportunities that give us access to innovative technologies, complementary product lines or new markets, yet remain consistent with our focus on being a leading provider of technologically-advanced, time-critical PCB engineering and manufacturing services. In addition, our position as a leader in North American markets that we currently operate in provides us a platform for expanding our operations outside of North America. |
Our Services
PCB Prototype, Design, Engineering and Manufacturing. We engineer and manufacture highly complex, technologically-advanced multi-layer PCB prototypes on a quick-turn basis. Our advanced development and manufacturing technologies facilitate production with delivery times ranging from 24 hours to 10 days.
Pre-Production and Production Fabrication Services. We provide quick-turn and longer lead time pre-production fabrication services to our customers when they introduce products to the market and require PCBs in a short period of time. We also provide our customers low volume production fabrication services. Our pre-production and production fabrication services typically have delivery dates ranging from 2 days to 20 days, or longer in some cases. We do not specifically target the high-volume commercial markets which are more likely to have their PCB demands met from off-shore low cost suppliers.
In addition to the engineering and manufacturing services we offer our customers from our seven manufacturing suppliers located in North America, we also support customer requirements for a transition to higher volume needs by sourcing from facilities located in Asia. This transition support is a small part of our business and approximates 5% of our net sales.
Manufacturing Technologies and Processes
The manufacture of PCBs involves multiple steps: etching the circuit image on copper-clad laminate, pressing the laminates together to form a panel, drilling holes and depositing copper or other conductive material to form the inter-layer electrical connections and, lastly, cutting the panels to shape. Our advanced interconnect products require additional critical steps, including accurate dry film imaging, via filling, planarization, photoimageable soldermask processing, computer numeric controlled optical mechanical drilling and routing, precision laser drilling, automated plating systems with process controls and achievement of controlled impedance.
Multi-layering, which involves placing multiple layers of electrical circuitry on a single PCB or backpanel, expands the number of circuits and components that can be contained on the interconnect product and increases the operating speed of the system by reducing the distance that electrical signals must travel. Increasing the density of the circuitry in each layer is accomplished by reducing the width of the circuit tracks and placing them closer together on the PCB or backpanel.
Interconnect products having narrow, closely-spaced circuit tracks are known as fine line products. The manufacture of complex multi-layer interconnect products often requires the use of sophisticated circuit interconnections, called blind or buried vias, between PCB layers and adherence to strict electrical characteristics to maintain consistent signal transmission speeds, referred to as controlled impedance. These technologies require very precise and tight lamination, drilling, plating and etching tolerances and are especially critical for today’s high-technology PCBs.
4
Table of Contents
We use a number of advanced technologies which allow us to manufacture complex PCBs with increased functionality and quality, including the following:
| • | Laser direct imaging (“LDI”). LDI is a process that allows us to process high-density products by direct writing onto photoresist with a high-precision laser technology. LDI is a high-resolution tool that is capable of imaging sub .002 inch line width and spacing and also gives us the ability to image solder mask especially where tolerances are tightly defined. |
| • | Blind or buried vias. Vias are drilled holes which, when plated with a conductive material, provide electrical connectivity between layers of circuitry in a PCB. Blind vias connect the surface layer of the PCB to any inner layer. Buried vias are holes that do not reach either surface of the PCB but allow inner layers to be interconnected. Products with blind and buried vias can be made thinner, smaller, lighter and with higher component density and more functionality than products with traditional vias. This technology may lead to reduction in layer count. |
| • | Laser drilling microvias. We have a variety of laser technologies capable of laser drilling any material for any customer driven application including UV, UV/CO2 and CO2. Microvias are small vias with diameters generally between 0.003inches and 0.0059 inches after laser drilling. The fabrication of PCBs with microvias requires specialized equipment and highly skilled process knowledge. These tools are also capable of solder mask ablation and precision milling. |
| • | Stacked microvias (SMV® technology). Stacked microvias are microvias plated with solid copper that can be stacked, connecting multiple layers sequentially on each side of a center buried via core. This technology provides improved current carrying capability and thermal characteristics, and a planar surface for ball-grid array (BGA). SMV® technology provides solutions for next generation component technologies that include high input/output count to enable fabrication of fine pitch arrays; 0.65mm, 0.50mm, 0.40mm and 0.25mm pitch devices. This is done by allowing extra routing channels directly under the bonding pads, as compared to a conventional microvia that is limited to 1 or 2 layer deep routing. We believe we remain one of the leading PCB manufacturers in North America that currently offers fabrication of PCBs utilizing SMV® technology. |
| • | Buried passives. Buried passive technology involves embedding the capacitor and resistor elements inside the PCB, which allows for removal of passive components from the surface of the PCB, leaving more surface area for active components. We have offered buried resistor products since the early 1990s. This technology is used in the high speed interconnect space as well as single-chip or multi-chip modules, memory and high-speed switches. This process is used to eliminate surface mount resistors and allows for termination to occur directly under other surface mounted components such as ball-grid arrays and quad-flat packs. We have offered embedded capacitance layers since the mid-1990s. The buried capacitance layers are currently used mostly as a signal noise reduction method. |
| • | Fine line traces and spaces. Traces are the connecting copper lines between the different components of the PCB and spaces are the distances between traces. Smaller traces and tighter spaces increase the density on the PCB and require greater expertise to achieve a desired final yield on a customer required order. We are able to provide 0.002 inch traces and spaces. |
| • | DDi FLAT-WRAP™ technology. Industry specifications for PCBs with certain designs require wrap-around copper plating for filled holes on blind, buried and through via technology. Current industry practices produce excess plated copper on the surface of the required layer and limit the capability for manufacturing high-density surface features (line width and space dimensions). DDi’s new FLAT-WRAP™ technology eliminates this excess surface plated copper and is compliant with the IPC specification for wrap plating and facilitates improved design capabilities. FLAT-WRAP™ technology is suited for design applications with multiple wrap plating requirements and fine pitch line and space on plated layers, typically sequential lamination product or standard through hole via-in-pad technology requiring conductive or non-conductive via fill. This technology is particularly beneficial for products in the high reliability and military/aerospace markets. |
| • | High aspect ratios. The aspect ratio is the ratio between the thickness of the PCB and the diameter of a drilled hole. The higher the ratio, the greater the difficulty to reliably form, electroplate and finish all the holes on a PCB. We are able to provide aspect ratios of up to 30:1. We are currently developing a solution to provide a 50:1 and greater aspect ratio. |
| • | NextGen SMV® technology. This newly developed technology allows us to fabricate multi-layer PCBs by electrically connecting different via configurations to accommodate customer designs with blind, buried and stacked microvias. The manufacturing process involves a parallel processing methodology that makes use of laser generated microvias and conductive pastes. NextGen SMV® enables us to offer reduced lead times on complex, sequentially-laminated PCBs and is of value to customers with high aspect ratio requirements. |
5
Table of Contents
| • | Thin core processing. A core is the basic inner-layer building block material from which PCBs are constructed. A core consists of a flat sheet of material comprised of glass-reinforced resin with copper foil on either side. The overall thickness of the PCB is determined by the thickness of inner-layer cores and the number of layers required. The demand for thinner cores derives from requirements of thinner PCBs, higher layer counts and various electrical parameters. Core thickness in our PCBs ranges from as little as 0.001 inches up to 0.062 inches. |
| • | Flexible and rigid-flex PCBs. The use of flexible and rigid-flex PCB technology offers certain advantages over traditional rigid PCBs. Flexible printed circuits consist of copper conductive patterns that have been etched or printed while affixed to flexible substrate materials such as polyimide or polyester. The circuits are manufactured by subjecting the base materials to multiple processes, such as drilling, screening, photo imaging, etching, plating and finishing. We manufacture flexible PCBs using a “static” or “flex-to-install” application which enables interconnection to be made between two or more mechanical units in areas that have mechanical constraints or non-standard packaging that cannot accommodate conventional interconnects. This application is useful in the military/aerospace market. |
A rigid-flex PCB is a hybrid construction of rigid and flexible circuitry that is stacked and then laminated. Rigid-flex PCBs can accommodate special mechanical and packing requirements while at the same time offer a high number of interconnections between two or more rigid boards. For this reason the rigid-flex PCB is often used in “back plane” or “mother board” applications to interface multiple systems. The rigid-flex PCB offers superior reliability of interconnects in environments that are subject to vibration, shock and thermal extremes. The rigid flex application is frequently found in the military/aerospace market and would include cockpit instrumentation, electronic warfare systems, missiles, rockets, satellites and radar.
| • | Materials. We offer a full range of materials for microwave, radio frequency and high speed applications. These materials can be used in hybrid stack-ups to allow for maximum performance in a cost-reduced package. We currently use approximately 50 different materials and have added environmentally friendly “green” materials such as halogen-free and materials suitable for “lead free” assembly. The use of these materials requires advanced capabilities in the areas of drilling, hole cleaning, plating, registration, and reliability testing. |
We are qualified under various industry standards, including Bellcore compliance for communications products and Underwriters Laboratories approval for electronics products. All of our production facilities are ISO-9001:2000 certified. These certifications require that we meet standards related to management, production and quality control. In addition, some of our production facilities are MIL-PRF-55110, AS9100, MIL-PRF-31032 MIL-P-50884, and NADCAP certified, which require us to meet certain military and aerospace standards related to production and quality control.
Our Customers and Markets
As of December 31, 2010, we had over 1,000 PCB customers in various market sectors including communications, computing, military/aerospace, industrial electronics, instrumentation, medical, and high-durability commercial markets. We sell to OEMs both directly and through electronic manufacturing service companies. We measure customers as those companies that have placed at least one order with us in the preceding six-month period. During 2010, 2009 and 2008, sales to our largest customer accounted for approximately 5%, 6%, and 8%, respectively, of our net sales. During 2010, 2009 and 2008, sales to our ten largest customers accounted for approximately 29%, 30% and 30%, respectively, of our net sales.
The following table shows the percentage of our net sales attributable to each of the principal end markets we served during the years ended December 31, 2010, 2009, and 2008. In 2010 we updated the classifications of certain customers. Accordingly, we updated the 2008 and 2009 data to conform to the 2010 updated end-market classifications.
| Year Ended December 31, | ||||||||||||
| 2010 | 2009 | 2008 | ||||||||||
| End Market (1) |
||||||||||||
| Communications |
21 | % | 22 | % | 22 | % | ||||||
| Computer |
13 | 16 | 18 | |||||||||
| Military/Aerospace |
32 | 30 | 26 | |||||||||
| Industrial Electronics |
22 | 18 | 20 | |||||||||
| Instrumentation and Medical |
7 | 6 | 6 | |||||||||
| Consumer Electronics |
5 | 6 | 7 | |||||||||
| Automotive |
— | 1 | 1 | |||||||||
| Business Retail |
— | 1 | — | |||||||||
| Total |
100 | % | 100 | % | 100 | % | ||||||
| (1) | Sales to EMS providers are classified by the end markets of their customers, if known to us, or to the primary market served by that EMS provider if not known. |
6
Table of Contents
Sales and Marketing
Our sales and marketing efforts are focused on developing long-term relationships with research and development and new product introduction personnel at current and prospective customers. Our sales personnel and engineering staff advise our customers with respect to applicable technology, manufacturing feasibility of designs and cost implications through on-line computer technical support and direct customer communication. Our customers are serviced by a support team consisting of sales, engineering, manufacturing and customer service employees.
We market our engineering and manufacturing services through both an internal sales force and manufacturers’ representatives. Approximately 80% of our net sales are typically generated through our internal sales force with the balance generated through manufacturers’ representatives. For many of these manufacturers’ representatives, we are their largest revenue source and their exclusive supplier of quick-turn and pre-production PCBs.
Research and Development
We maintain a strong commitment to research and development and focus our efforts on enhancing existing capabilities as well as developing new technologies and integrating them across all of our facilities. Our close involvement with our customers in the early stages of their product development cycle positions us at the leading-edge of technical innovation in the design and manufacture of quick-turn and complex PCBs. Our experienced engineers, chemists and laboratory technicians work in conjunction with our sales staff to identify specific needs and develop innovative, high performance solutions to customer issues and to align our technology roadmap with that of our customers’ requirements. Because our research and development efforts are an integral part of our production process, our research and development expenditures are not separately identifiable. Accordingly, we do not segregate these costs as a separate item, but instead include such costs in our consolidated financial statements as part of cost of goods sold.
Proprietary Processes
We believe our business depends on our effective execution of fabrication techniques and our ability to improve our manufacturing processes to meet evolving industry standards. Depending on our technology strategy, we may periodically enter into joint technology development agreements with certain of our suppliers to develop new processes. We generally enter into confidentiality and non-disclosure agreements with our employees, consultants, vendors and customers, as needed, and generally limit access to and distribution of our proprietary information and processes. We also file patent applications with respect to certain manufacturing processes, several of which are pending and one of which has been issued.
Our Suppliers
Our raw materials inventory must be regularly and rapidly replenished. We use just-in-time procurement practices to minimize raw materials inventory and we utilize preferred suppliers for some of these materials. We evaluate all of our suppliers and create strategic relationships where appropriate. Adequate amounts of all raw materials have been available in the past, and we believe this will continue in the foreseeable future. As part of our strategy to migrate the risk of a long-term supply shortage, we have expanded our evaluation of suppliers and begun to include those domiciled in Asia.
The primary raw materials that we use in production are core materials (copper-clad layers of fiberglass of varying thickness impregnated with bonding materials), chemical solutions for plating operations (copper, gold, silver, nickel, etc.), cleaning and etching solutions, photographic film and carbide drill bits. We work closely with our suppliers to incorporate technology advances in the raw materials we purchase.
Competition
Our principal competitors include Viasystems Group, Inc., TTM Technologies, Endicott Interconnect Technologies, FTG, Multek Corporation (a division of Flextronics International Ltd.), Sanmina-SCI, and a number of smaller companies. The barriers to entry in the quick-turn segment of the PCB industry are many. In order to compete effectively in this industry, companies must have a sufficient customer base, a staff of qualified sales and marketing personnel, considerable engineering resources and the proper tooling and equipment to permit fast and reliable product turnaround.
We believe we compete favorably based on the following factors:
| • | ability to offer quick time-to-market capabilities (we believe we are a North American market leader in this regard); |
| • | capability and flexibility to produce technologically complex products; |
| • | engineering and design services to complement the manufacturing process; |
7
Table of Contents
| • | additional available manufacturing capacity without significant additional capital expenditures; |
| • | consistent high-quality products; and |
| • | sales and customer service with direct interface with our customers. |
Backlog
Although we obtain firm purchase orders from our customers, our customers typically do not make firm orders for delivery of products more than 30 to 90 days in advance. We do not believe the backlog of expected product sales covered by firm purchase orders is a meaningful measure of future sales since orders may be rescheduled or canceled and a significant portion of our sales result from orders with manufacturing delivery of less than 20 days.
Environmental Matters
PCB manufacturing requires the use of a variety of materials, including metals and chemicals. As a result, our operations are subject to certain federal, state and local laws and regulatory requirements relating to environmental compliance and site cleanups, waste management and health and safety matters. Among others, we are subject to regulations promulgated by:
| • | the Occupational Safety and Health Administration pertaining to health and safety in the workplace; and |
| • | the Environmental Protection Agency pertaining to the use, storage, discharge and disposal of hazardous chemicals used in the manufacturing processes. |
We are required to comply with various regulations relating to the storage, use, labeling, disposal and human exposure to chemicals, solid waste and other hazardous materials, as well as air quality regulations. Many of our activities are also subject to permits issued by authorized governmental agencies. These permits must be renewed periodically and are subject to revocation in the event of violations of environmental laws. Certain waste materials and byproducts generated by our manufacturing processes are either processed by us or sent to third parties for recycling, reclamation, treatment or disposal. Water used in our manufacturing process must be properly treated prior to discharge.
We incur expenses relating to compliance with these laws and regulations. To date, the costs of compliance and environmental remediation have not been material to us. Nevertheless, additional or modified requirements may be imposed in the future. If such additional or modified requirements are imposed on us, or if conditions requiring remediation were found to exist, we may be required to incur substantial additional expenditures.
Employees
As of December 31, 2010, we had approximately 1,676 employees, none of whom were represented by unions. Of these employees, approximately 82% were involved in manufacturing, 5% were involved in engineering, 8% were involved in sales and marketing and 6% were involved in administration and other capacities. We have not experienced any labor problems resulting in a work stoppage and believe we have good relations with our employees.
Executive Officers of the Registrant
The following table sets forth the executive officers of DDi Corp., their ages as of February 25, 2011, and the positions currently held by each person:
| Name |
Age | Position | ||
| Mikel H. Williams | 54 | President, Chief Executive Officer and Director | ||
| J. Michael Dodson | 50 | Senior Vice President and Chief Financial Officer | ||
| Michael R. Mathews | 50 | Senior Vice President and Chief Operations Officer | ||
| Gerald P. Barnes | 52 | Senior Vice President — Sales |
The executive officers of the Company are elected each year at the organizational meeting of the board of directors, which follows the annual meeting of stockholders, and at other board of directors meetings, as appropriate. Executive officers serve at the discretion of, the board of directors. There are no arrangements or understandings pursuant to which any of the persons listed below was selected as an executive officer.
Mikel H. Williams has served as President and Chief Executive Officer since November 2005. From November 2004 to October 2005, Mr. Williams served as Senior Vice President and Chief Financial Officer of the Company. Before joining the Company, Mr. Williams served as the sole member of Constellation Management Group, LLC providing strategic, operational and financial/capital advisory consulting services to companies in the telecom, software and high-tech industries from May to November 2004; and as Chief Operating Officer of LNG Holdings, a European telecommunications company
8
Table of Contents
where he oversaw the restructuring and sale of the business from June 2002 to December 2003. Prior to that, from November 1996 to June 2001, Mr. Williams held the following executive positions with Global TeleSystems, Inc. and its subsidiaries, a leading telecommunications company providing data and internet services in Europe: Senior Vice President, Ebone Sales from December 2000 through June 2001; President, GTS Broadband Services from August 2000 through November 2000; President, GTS Wholesale Services from January 2000 through July 2000; and prior thereto, Vice President, Finance of Global TeleSystems, Inc. Mr. Williams began his career as a certified public accountant in the State of Maryland working as an auditor for Price Waterhouse. Mr. Williams holds a Bachelor of Science degree in Accounting from the University of Maryland and a Masters of Business Administration degree from Georgetown University.
J. Michael Dodson has served as Senior Vice President and Chief Financial Officer of the Company since January 2010. Before joining the Company, Mr. Dodson served as a partner at Tatum, LLC, a provider of executive services on an interim or special project basis, from October 2009 to January 2010. From December 2005 to January 2009, Mr. Dodson served as Chief Financial Officer of eTelecare Global Solutions, Inc., a provider of business process outsourcing services. From May 2003 to December 2005, Mr. Dodson served as Senior Vice-President of Administration and Chief Financial Officer of Electro Scientific Industries, Inc., a supplier of production laser systems for microengineering applications. From July 1999 to December 2002, Mr. Dodson served as Chief Financial Officer of SpeedFam-IPEC, Inc., a developer of semiconductor equipment. Mr. Dodson also previously served as Corporate Controller and Chief Accounting Officer for Novellus Systems, an S&P 500 high technology manufacturer of semiconductor equipment. Mr. Dodson holds a B.B.A. degree with majors in Accounting and Information Systems Analysis and Design from the University of Wisconsin-Madison.
Michael R. Mathews has served as the Company’s Senior Vice President and Chief Operations Officer since March 2010. From September 2006 to March 2010, Mr. Mathews served as our Senior Vice President — Manufacturing Operations. From February to September 2006, he served as the Company’s Vice President of Quality and Process Engineering. Prior to joining the Company, Mr. Mathews served in various management roles with Sanmina-SCI, an electronics manufacturing services company, from July 1995 to February 2006, most recently as Vice President Operations & Quality, PWB and Enclosures. While at Sanmina-SCI, Mr. Mathews also served as Operations Manager, Vice President American Eastern Region Enclosure Division and Vice President and General Manager PCB Division. Mr. Matthews joined Raytheon Company in August of 1983 in the Missile Systems Division, where he rose to Manufacturing Operations Manager prior to his departure in July 1995. Mr. Mathews began his career at Lockheed Missiles and Space where he worked from July 1982 to August 1983. Mr. Mathews holds a Bachelor of Science degree in Chemical Engineering and a Master of Science degree in Plastics Engineering both from the University of Massachusetts Lowell.
Gerald P. Barnes has served as Senior Vice President — Sales of the Company since January 2007. Before joining the Company, Mr. Barnes served as Vice President of Sales for TTM Technologies, a PCB manufacturer, from September 2005 to January 2007. From 2004 to 2005, he served as Vice President of Sales and Marketing for Cosmotronic, a PCB manufacturer. Mr. Barnes served as President and Chief Executive Officer of Winonic, Inc., a privately held PCB design and manufacturing company, from 2003 to 2004. From 1990 to 2003, he served in numerous capacities for the Advanced Interconnect Division of Toppan Electronics, a division of Toppan Printing Co. Ltd., including President and Chief Operating Officer from 1999 to 2003, Vice President of Sales and Marketing from 1995 to 1999, and Director of Sales and Marketing from 1993 to 1995. Mr. Barnes holds a Bachelor of Science in Business Administration degree from Delaware State University.
Available Information
Our Internet address is www.ddiglobal.com. There we make available, free of charge, our annual report on Form 10-K, quarterly reports on Form 10-Q, current reports on Form 8-K, and any amendments to those reports, as soon as reasonably practicable after we electronically file such material with or furnish it to the Securities and Exchange Commission (“SEC”). Our SEC reports can be accessed through the investor relations section of our website. Reports filed with the SEC may be viewed at www.sec.gov or obtained at the SEC Public Reference Room in Washington, D.C. Information regarding the operation of the Public Reference Room may be obtained by calling the SEC at 1-800-SEC-0330. References to our website addressed in this Annual Report on Form 10-K are provided as a convenience and do not constitute, or should not be viewed as, an active link or to otherwise incorporate the contents of the website into this Annual Report on Form 10-K.
| Item 1A. | Risk Factors. |
Current conditions in the global economy and the major industry sectors that we serve may materially and adversely affect our business and results of operations.
Our business and operating results will continue to be affected by worldwide economic conditions and, in particular, conditions in the communications, computing, military/aerospace, industrial electronics, instrumentation, medical, high-durability commercial markets, and other significant industries we serve. As a result of continuing slow global economic
9
Table of Contents
growth, uncertain consumer and business confidence, high levels of unemployment, reduced levels of capital expenditures, fluctuating commodity prices, bankruptcies and other challenges currently affecting the global economy, our customers may experience deterioration of their businesses, cash flow shortages, and difficulty obtaining financing. As a result, existing or potential customers may delay or cancel plans to purchase products produced by our customers which would have a material adverse effect on us. Further, our vendors may experience similar conditions, which may impact their ability to fulfill their obligations to us. If the global economic slowdown continues for a significant period or there is significant further deterioration in the global economy, our results of operations, financial position and cash flows could be materially adversely affected.
There are risks in owning our common stock.
The market price and volume of our common stock have been, and may continue to be, subject to significant fluctuations. These may arise from general stock market conditions, the impact of the risk factors described in this Annual Report on our financial condition and results of operations, a change in sentiment in the market regarding us or our business prospects or from other factors, many of which are beyond our control. These factors include, among other things, actual or anticipated variations in our operating results and cash flows, the nature and content of our earnings releases and our competitors’ earnings releases, announcements of technological innovations that impact our services, customers, competitors or markets, changes in financial estimates by securities analysts, business conditions in our markets and the general state of the securities markets and the market for similar stocks, changes in capital markets that affect the perceived availability of capital to companies in our industry, the amount and frequency of share repurchases, governmental legislation or regulation, currency and exchange rate fluctuations, as well as general economic and market conditions. Our common stock is listed on the NASDAQ Global Select Market. Limited trading volume of our common stock could affect the trading price by magnifying the effect of larger purchase or sale orders and could increase the trading price volatility in general. No prediction can be made as to future trading volumes of our common stock on the NASDAQ Global Select Market.
We may need additional capital in the future and it may not be available on acceptable terms, or at all.
Looking ahead at long-term needs, we may need to raise additional funds for a number of purposes, including:
| • | to fund our operations beyond 2011; |
| • | to fund working capital requirements for future growth that we may experience; |
| • | to enhance or expand the range of services we offer; |
| • | to increase our sales and marketing activities; or |
| • | to respond to competitive pressures or perceived opportunities, such as investment, acquisition and international expansion activities. |
If such funds are not available when required or on acceptable terms, our business and financial results could suffer. Further, if we attempt to obtain future additional financing, the issues facing the credit market could negatively impact our ability to obtain such financing.
We may issue additional shares of common stock that may dilute the value of our common stock and adversely affect the market price of our common stock.
In addition to the approximately 20.2 million shares of our common stock outstanding at December 31, 2010, we may issue additional shares of common stock in the following scenarios:
| • | up to approximately 2.7 million shares of our common stock may be required to be issued pursuant to outstanding and/or future equity compensation awards; |
| • | a significant number of additional shares of our common stock may be issued if we seek to raise capital through offerings of our common stock, securities convertible into our common stock, or rights to acquire such securities or our common stock. |
A large issuance of shares of our common stock, in any or all of the above scenarios, will decrease the ownership percentage of current outstanding stockholders and will likely result in a decrease in the market price of our common stock. Any large issuance may also result in a change in control of DDi.
The terms of our credit facility may restrict our financial and operational flexibility.
The terms of our credit facility restrict, among other things, our ability to incur additional indebtedness, pay dividends or make certain other restricted payments, consummate certain asset sales, enter into certain transactions with affiliates, merge or consolidate with other persons, or sell, assign, transfer, lease, convey or otherwise dispose of all or substantially all
10
Table of Contents
of our assets. Further, we may be required to maintain specified financial ratios and satisfy certain financial conditions. Our ability to meet those financial ratios and tests can be affected by events beyond our control, and there can be no assurance that we will meet those tests. Substantially all of our assets, except equipment and real property, are pledged as collateral under our credit facility.
We cannot assure that we will continue to pay dividends, and our dividends may not grow over time.
In 2010, our board of directors adopted a cash dividend policy. The actual declaration of future cash dividends, and the establishment of record and payment dates, is subject to final determination by our board of directors each quarter after its review of our financial performance Our ability to pay dividends in any period will depend upon factors including satisfying the requirements under our revolving credit facility and applicable provisions of Delaware law.
We cannot assure that we will pay any dividends on our common stock in the future. All dividend determinations (including the size and frequency of dividends) will depend upon, among other things, our future operations and earnings, capital requirements and surplus, general financial condition , contractual restrictions, alternative uses for our cash including acquisitions, and other factors as our board of directors may deem relevant. Our board of directors may change our dividend policy at any time, and from time to time.
We are dependent upon the electronics industry, which is highly cyclical and suffers significant downturns in demand resulting in excess manufacturing capacity and increased price competition.
The electronics industry, on which a substantial portion of our business depends, is cyclical and subject to significant downturns characterized by diminished product demand, rapid declines in average selling prices and over-capacity. This industry has experienced periods characterized by relatively low demand and price depression and is likely to experience recessionary periods in the future. Economic conditions affecting the electronics industry in general, or specific customers in particular, have adversely affected our operating results in the past and may do so in the future.
The electronics industry is characterized by intense competition, rapid technological change, relatively short product life cycles and pricing and profitability pressures. These factors adversely affect our customers and we suffer similar effects. Our customers are primarily high-technology equipment manufacturers in the communications and computing, military and aerospace, industrial electronics, instrument, medical, and high-durability commercial markets of the electronics industry. Due to the uncertainty in the markets served by most of our customers, we cannot accurately predict our future financial results or accurately anticipate future orders. At any time, our customers can discontinue or modify products containing components manufactured by us, adjust the timing of orders and shipments or affect our mix of consolidated net sales generated from quick-turn and premium services revenues versus standard lead time production, any of which could have a material adverse effect on our results of operations.
Our customers are subject to economic cycles and fluctuations in product demand. A significant downturn in demand for our customers’ products would similarly affect demand for our products and as such, our sales, gross margin and operating performance would be adversely affected.
Our customers that purchase PCB engineering and manufacturing services from us are subject to their own business cycles. Some of these cycles show predictability from year to year. However, other cycles are unpredictable in commencement, depth and duration. A downturn, or any other event leading to additional excess capacity, will negatively impact our sales, gross margin and operating performance.
We cannot accurately predict the continued demand for our customers’ products and the demands of our customers for our products and services. As a result of this uncertainty, our past operating performance and cash flows may not be indicative of our future operating performance and cash flows.
Unless we are able to respond to technological change at least as quickly as our competitors, our services could be rendered obsolete, which would reduce our sales and operating margins.
The market for our services is characterized by rapidly changing technology and continuing process development. The future success of our business will depend in large part upon our ability to maintain and enhance our technological capabilities, to develop and market services that meet evolving customer needs and to successfully anticipate or respond to technological changes on a cost-effective and timely basis.
In addition, the PCB engineering and manufacturing services industry could in the future encounter competition from new or revised technologies that render existing technology less competitive or obsolete or that reduce the demand for our services. It is possible that we will not effectively respond to the technological requirements of the changing market. To the extent we determine that new technologies and equipment are required to remain competitive, the development, acquisition
11
Table of Contents
and implementation of such technologies and equipment may require us to make significant capital investments. It is possible that we will not be able to obtain capital for these purposes in the future or that any investments in new technologies will not result in commercially viable technological processes.
We may experience significant fluctuation in our revenue because we sell primarily on a purchase order basis, rather than pursuant to long-term contracts.
Our operating results fluctuate because we sell primarily on a purchase-order basis rather than pursuant to long-term contracts, and we expect these fluctuations to continue in the future. We are therefore sensitive to variability in demand by our customers. Because we time our expenditures in anticipation of future sales, our operating results may be less than we estimate if the timing and volume of customer orders do not match our expectations. Furthermore, we may not be able to capture all potential revenue in a given period if our customers’ demand for quick-turn services exceeds our capacity during that period. Because a significant portion of our operating expenses are fixed, even a small revenue shortfall can have a disproportionate effect on our operating results.
We rely on a core group of significant customers for a substantial portion of our revenue, and a reduction in demand from, or an inability to pay by, this core group could adversely affect our revenue.
Although we have a large number of customers, net sales to our ten largest customers accounted for approximately 27%, 30% and 30% of our net sales in 2010, 2009 and 2008, respectively. We may continue to depend upon a core group of customers for a material percentage of our net sales in the future. In addition, we generate significant accounts receivable in connection with providing services to our customers. If one or more of our significant customers were to become insolvent or otherwise were unable to pay us for the services provided, our results of operations and cash flows would be adversely affected.
If we experience lower sales due to variability in customer demand, our gross margins may decline.
We maintain our production facilities at less than full capacity to retain our ability to respond to quick-turn orders. However, if these orders are not received, we could experience losses due to excess capacity. Whenever we experience excess capacity, our revenue may be insufficient to fully cover our fixed overhead expenses and our gross margins would decline. Conversely, we may not be able to capture all potential revenue in a given period if our customers’ demands for quick-turn services exceed our capacity during that period.
We are subject to intense competition, and our business may be adversely affected by these competitive pressures.
The PCB industry is highly fragmented and characterized by intense competition. We principally compete with independent and captive manufacturers of complex quick-turn and longer-lead PCBs. Our principal competitors include other established public companies, smaller private companies and integrated subsidiaries of more broadly based volume producers that also manufacture multi-layer PCBs. We also expect that competition will increase as a result of industry consolidation. For us to be competitive in the quick-turn sector, we must maintain a large customer base, a large staff of qualified sales and marketing personnel, considerable engineering resources and proper tooling and equipment to permit fast turnaround of small lots on a daily basis.
Some of our competitors and potential competitors may have a number of advantages over us, including:
| • | significantly greater financial, technical, marketing and manufacturing resources; |
| • | preferred vendor status with some of our existing and potential customers; |
| • | more focused production facilities that may allow them to produce and sell products at lower price points; |
| • | more capital; and |
| • | larger customer bases. |
In addition, these competitors may have the ability to respond more quickly to new or emerging technologies, be more successful in entering or adapting to existing or new end markets, adapt more quickly to changes in customer requirements and devote greater resources to the development, promotion and sale of their products than we can.
12
Table of Contents
If Asian-based production capabilities increase in sophistication, we may lose market share, and our gross margins may be adversely affected by increased pricing pressure.
Price competition from PCB manufacturers based in Asia and other locations with lower production costs may play an increasing role in the PCB markets in which we compete. While PCB manufacturers in these locations have historically competed primarily in markets for less technologically-advanced products with high volumes, they are expanding their manufacturing capabilities to produce higher layer count and higher technology PCBs. In the future, competitors in Asia may be able to effectively compete in our higher technology markets, which may result in decreased net sales or force us to lower our prices, reducing our gross margins.
Defects in our products could result in financial or other damages to our customers, which could result in reduced demand for our services and liability claims against us.
We manufacture highly complex products to our customers’ specifications. These products may contain manufacturing errors or failures despite our quality control and quality assurance efforts. Defects in the products we manufacture, whether caused by a design, manufacturing or materials failure or error, may result in delayed shipments, increased warranty costs, customer dissatisfaction, or a reduction in or cancellation of purchase orders. If these defects occur either in large quantities or too frequently, our business reputation may be impaired. Since our products are used in products that are integral to our customers’ businesses, errors, defects or other performance problems could result in financial or other damages to our customers beyond the cost of the PCB, for which we may be liable in some cases. Although we generally attempt to sell our products on terms designed to limit our exposure to warranty, product liability and related claims, in certain cases, the terms of our agreements allocate to us substantial exposure for product defects. In addition, even if we can contractually limit our exposure, existing or future laws or unfavorable judicial decisions could negate these limitations of liability provisions. Product liability litigation against us, even if it were unsuccessful, would be time consuming and costly to defend. Although we maintain a warranty reserve, this reserve may not be sufficient to cover our warranty or other expenses that could arise as a result of defects in our products.
If we are unable to protect our intellectual property or infringe or are alleged to infringe others’ intellectual property, our operating results may be adversely affected.
We primarily rely on trade secret laws and restrictions on disclosure to protect our intellectual property rights. We cannot be certain that the steps we have taken to protect our intellectual property rights will prevent unauthorized use of our technology. Our inability to protect our intellectual property rights could diminish or eliminate the competitive advantages that we derive from our proprietary technology.
We may become involved in litigation in the future to protect our intellectual property or in defense of allegations that we infringe others’ intellectual property rights. These claims and any resulting litigation could subject us to significant liability for damages and invalidate our property rights. In addition, these lawsuits, regardless of their merits, could be time consuming and expensive to resolve and could divert management’s time and attention. Any potential intellectual property litigation alleging our infringement of a third-party’s intellectual property also could force us or our customers to:
| • | stop producing products that use the intellectual property in question; |
| • | obtain an intellectual property license to sell the relevant technology at an additional cost, which license may not be available on reasonable terms, or at all; and |
| • | redesign those products or services that use the technology in question. |
The costs to us resulting from having to take any of these actions could be substantial and our operating results could be adversely affected.
Complying with applicable environmental laws requires significant resources and, if we fail to comply, we could be subject to substantial liability.
Our operations are regulated under a number of federal, state, local and foreign environmental and safety laws and regulations that govern, among other things, the discharge of hazardous materials into the air and water, as well as the handling, storage and disposal of such materials. These laws and regulations include the Clean Air Act, the Clean Water Act, the Resource Conservation and Recovery Act and the Comprehensive Environmental Response, Compensation and Liability Act, as well as analogous state and foreign laws. Compliance with these environmental laws is a major consideration for us because we use in our manufacturing process materials classified as hazardous such as ammoniacal etching solutions, copper and nickel. Our efforts to comply with applicable environmental laws require an ongoing and significant commitment of our resources. Over the years, environmental laws have become, and may in the future become, more stringent, imposing greater compliance costs on us. In addition, because we are a generator of hazardous wastes and our sites may become contaminated, we may be subject to potential financial liability for costs associated with an investigation and any remediation of such sites. Even if we fully comply with applicable environmental laws and are not directly at fault for the contamination, we may still be liable. The wastes we generate include spent ammoniacal etching solutions, solder stripping solutions and hydrochloric acid solutions containing palladium, waste water which contains heavy metals, acids, cleaners and conditioners and filter cake from equipment used for on-site waste treatment.
13
Table of Contents
Violations of environmental laws could subject us to revocation of the environmental permits we require to operate our business. Any such revocations could require us to cease or limit production at one or more of our facilities, thereby negatively impacting revenues and potentially causing the market price of our common stock to decline. Additionally, if we are liable for any violation of environmental laws, we could be required to undertake expensive remedial actions and be subject to additional penalties.
We depend on our key personnel and may have difficulty attracting and retaining skilled employees.
Our future success will depend to a significant degree upon the continued contributions of our key management, marketing, technical, financial, accounting and operational personnel, including Mikel H. Williams, our President and Chief Executive Officer. The loss of the services of one or more key employees could have a material adverse effect on our results of operations. We also believe that our future success will depend in large part upon our ability to attract and retain additional highly skilled managerial and technical resources. Competition for such personnel is intense. There can be no assurance that we will be successful in attracting and retaining such personnel. In addition, potential future facility shutdowns and workforce reductions could have a negative impact on employee recruiting and retention.
Our manufacturing processes depend on the collective industry experience of our employees. If these employees were to leave and take this knowledge with them, our manufacturing processes may suffer, and we may not be able to compete effectively.
Other than our trade secret protection, we rely on the collective experience of our employees to ensure that we continuously evaluate and adopt new technologies in our industry. If a significant number of employees involved in our manufacturing processes were to leave our employment and we are not able to replace these people with new employees with comparable experience, our manufacturing processes may suffer as we may be unable to keep up with innovations in the industry. As a result, we may not be able to continue to compete effectively.
There may be shortages of, or price fluctuations with respect to, raw materials which could disrupt our operations or negatively impact our operating margins.
To manufacture printed circuit boards, we use raw materials such as laminated layers of fiberglass, copper foil, chemical solutions, gold, and other commodity products, which we order from our suppliers. From time to time, we may experience increases in raw material prices, based on demand trends, which can negatively affect our gross margins. In addition, shortages of raw materials may occur in the future, which could negatively impact our ability to deliver our products on a timely basis. Such shortages of raw materials or increases in raw material prices could have a material adverse effect on our operating margins, financial condition, operating results and cash flows.
If we are unable to maintain satisfactory capacity utilization rates, our results of operations and financial condition would be adversely affected.
Given the high fixed costs of our operations, decreases in capacity utilization rates can have a significant effect on our business. Accordingly, our ability to maintain or enhance gross margins depends, in part, on maintaining satisfactory capacity utilization rates. Our ability to maintain satisfactory capacity utilization depends on the demand for our products, the volume of orders we receive, and our ability to properly allocate the workload among our facilities in an efficient manner. If current or future production capacity fails to match current or future customer demands, or we fail to properly allocate the workload among our facilities, our facilities would be underutilized, which could result in decreased operating margins.
We rely on suppliers for the timely delivery of materials used in manufacturing our PCBs, and an increase in industry demand or a shortage of raw materials may increase the price of the raw materials we use and may limit our ability to manufacture certain products and adversely impact our gross margins.
To manufacture our PCBs, we use materials such as laminated layers of fiberglass, copper foil and chemical solutions which we order from our suppliers. Suppliers of laminates and other raw materials that we use may from time to time extend lead times, limit supplies or increase prices due to capacity constraints or other factors, which could adversely affect our gross margins and our ability to deliver our products on a timely basis. In previous years we experienced, and may experience again, increases in the cost of materials, including laminate, copper products, gold, and oil-based or oil-derivative raw materials, which could adversely impact our gross margins. Some of our products use types of laminates that are only available from a single supplier that holds a patent on the material. Although other manufacturers of advanced PCBs also must use the single supplier and our OEM customers generally determine the type of laminates used, a failure to obtain the material from the single supplier for any reason may cause a disruption, and possible cancellation, of orders for PCBs using that type of laminate, which in turn would cause a decrease in our sales.
14
Table of Contents
Our acquisition strategy involves numerous risks.
As part of our business strategy, we have made and may continue to make acquisitions of, or investments in, companies, products or technologies that complement our current products, augment our market coverage, enhance our technical capabilities or production capacity or that may otherwise offer growth opportunities. In connection with our previous acquisitions or any future acquisitions or investments, we could experience:
| • | problems integrating the purchased operations, technologies or products; |
| • | failure to achieve potential sales, materials costs and other synergies: |
| • | unanticipated expenses and working capital requirements, including those associated with assumed actual or contingent liabilities; |
| • | difficulty achieving sufficient sales to offset increased expenses associated with acquisitions; |
| • | diversion of management’s attention; |
| • | adverse effects on business relationships with our or the acquired company’s suppliers and customers; |
| • | difficulty in entering markets in which we have limited or no prior experience; |
| • | losses of key employees, particularly those of the acquired organization; and |
| • | problems implementing adequate internal controls and procedures. |
In addition, in connection with any future acquisitions or investments, we could:
| • | issue stock that would dilute our current stockholders’ percentage ownership; |
| • | incur debt and assume liabilities that could impair our liquidity; |
| • | incur substantial transaction-related costs, regardless of whether the proposed acquisition or investment is actually consummated; |
| • | incur amortization expenses related to intangible assets; or |
| • | incur large and immediate write-offs that would negatively impact our results of operations. |
Any of these factors could prevent us from realizing anticipated benefits of an acquisition or investment, including operational synergies, economies of scale and increased profit margins and revenue. Acquisitions are inherently risky, and any acquisition may not be successful. Failure to manage and successfully integrate acquisitions could harm our business and operating results in a material way.
Damage to our manufacturing facilities due to fire, natural disaster, or other event could harm our financial results.
We have manufacturing facilities in California, Colorado, Ohio, Virginia, and Ontario, Canada. The destruction or closure of any of our facilities for a significant period of time as a result of fire; explosion; blizzard; act of war or terrorism; or flood, tornado, earthquake, lightning, or other natural disaster could harm us financially, increasing our costs of doing business and limiting our ability to deliver our manufacturing services on a timely basis.
Pending or future litigation could have a material adverse effect on our operating results and financial condition.
We are involved, from time to time, in litigation incidental to our business. This litigation could result in substantial costs and could divert management’s attention and resources which could harm our business. Risks associated with legal liability are often difficult to assess or quantify, and their existence and magnitude can remain unknown for significant periods of time. In cases where we record a liability, the amount of our estimates could be wrong. In addition to the direct costs of litigation, pending or future litigation could divert management’s attention and resources from the operation of our business. While we maintain director and officer insurance, the amount of insurance coverage may not be sufficient to cover a claim and the continued availability of this insurance cannot be assured. As a result, there can be no assurance that the actual outcome of pending or future litigation will not have a material adverse effect on our results of operations or financial condition.
A trend toward consolidation among our customers could adversely affect our business.
Recently, some of our large customers have consolidated and further consolidation of customers may occur. Depending on which organization becomes the controller of the supply chain function following the consolidation, we may not be retained as a preferred or approved supplier. In addition, product duplication could result in the termination of a product line
15
Table of Contents
that we currently support. While there is potential for increasing our position with the combined company, the potential exists for decreased revenue if we are not retained as a continuing supplier. We also face the risk of increased pricing pressure from the combined customer because of its increased market share.
We are exposed to the credit risk of some of our customers and to credit exposures in weakened markets.
Most of our sales are on an “open credit” basis, with standard industry payment terms. We monitor individual customer payment capability in granting such open credit arrangements, seek to limit such open credit to amounts we believe the customers can pay, and maintain reserves we believe are adequate to cover exposure for doubtful accounts. During periods of economic downturn in the electronics industry and the global economy, our exposure to credit risks from our customers increases. Although we have programs in place to monitor and mitigate the associated risks, such programs may not be effective in reducing our credit risks.
Our 10 largest customers accounted for approximately 27% of our net sales in 2010. Additionally, our OEM customers often direct a significant portion of their purchases through a relatively limited number of EMS companies. Our contractual relationship is often with the EMS companies, who are obligated to pay us for our products. Because we expect our OEM customers to continue to direct our sales to EMS companies, we expect to continue to be subject to the credit risk with a limited number of EMS customers. If one or more of our significant customers were to become insolvent or were otherwise unable to pay us, our results of operations would be harmed.
Some of our customers are EMS companies located abroad. Our exposure has increased as these foreign customers continue to expand. Our foreign sales are denominated in U.S. dollars and are typically on the same “open credit” basis and terms described above. Our foreign receivables were approximately 17% of our net accounts receivable as of December 31, 2010 and may grow as a percentage of our total receivables. We do not utilize credit insurance as a risk management tool.
The increasing prominence of EMS providers in the PCB industry could reduce our gross margins, potential sales, and customers.
Sales to EMS providers represented approximately 39% of our net sales in 2010. Sales to EMS providers include sales directed by OEMs as well as orders placed with us at the EMS providers’ discretion. EMS providers source on a global basis to a greater extent than OEMs. The growth of EMS providers increases the purchasing power of such providers and could result in increased price competition or the loss of existing OEM customers. In addition, some EMS providers, including some of our customers, have the ability to directly manufacture PCBs. If a significant number of our other EMS customers were to acquire these abilities, our customer base might shrink, and our sales might decline substantially. Moreover, if any of our OEM customers outsource the production of PCBs to these EMS providers, our business, results of operations and financial condition may be harmed.
Increasingly, our larger customers are requesting that we enter into supply agreements with them that have increasingly restrictive terms and conditions. These agreements typically include provisions that increase our financial exposure, which could result in significant costs to us.
Increasingly, our larger customers are requesting that we enter into supply agreements with them. These agreements typically include provisions that generally serve to increase our exposure for product liability and warranty claims — as compared to our standard terms and conditions — which could result in higher costs to us as a result of such claims. In addition, these agreements typically contain provisions that seek to limit our operational and pricing flexibility and extend payment terms, which can adversely impact our cash flow and results of operations.
We export military and commercial products from the United States to other countries. If we fail to comply with export laws, we could be subject to fines and other punitive actions.
Exports from the United States are regulated by the U.S. Department of State and U.S. Department of Commerce. Failure to comply with these regulations can result in significant fines and penalties. Additionally, violations of these laws can result in punitive penalties, which would restrict or prohibit us from exporting certain products, resulting in significant harm to our business.
We may not be able to fully recover our costs for providing design services to our customers, which could harm our financial results.
16
Table of Contents
Although we enter into design service activities with purchase order commitments, the cost of labor and equipment to provide these services may in fact exceed what we are able to fully recover through purchase order coverage. We also may be subject to agreements with customers in which the cost of these services is recovered over a period of time or through a certain number of units shipped as part of the ongoing product price. While we may make contractual provisions to recover these costs in the event that the product does not go into production, the actual recovery can be difficult and may not happen in full. In other instances, the business relationship may involve investing in these services for a customer as an ongoing service not directly recoverable through purchase orders. In any of these cases, the possibility exists that some or all of these activities are considered costs of doing business, are not directly recoverable, and may adversely impact our operating results.
We may have exposure to income tax rate fluctuations as well as to additional tax liabilities, which would impact our financial position.
We are subject to taxes in the United States and Canada. Our effective tax rate is subject to fluctuation as the income tax rates for each year are a function of the following factors, among others:
| • | the effects of a mix of profits or losses earned by us and our subsidiaries in numerous tax jurisdictions with a broad range of income tax rates; |
| • | our ability to utilize net operating losses; |
| • | changes in contingencies related to taxes, interest or penalties resulting from tax audits; and |
| • | changes in tax laws or the interpretation of such laws. |
Changes in the mix of these items and other items may cause our effective tax rate to fluctuate between periods, which could have a material adverse effect on our financial position.
In addition, changes in the ownership of our common stock could further limit our ability to utilize our net operating losses, which could have a material adverse effect on our financial position.
We are also subject to non-income taxes, such as payroll, sales, use, value-added, net worth, property and goods and services taxes, in both the United States and Canada.
Significant judgment is required in determining our provision for income taxes and other tax liabilities. Our tax determinations are regularly subject to audit by tax authorities, and developments in those audits could adversely affect our income tax provision. Although we believe that our tax estimates are reasonable, the final determination of tax audits or tax disputes may be different from what is reflected in our historical income tax provisions, which could affect our operating results.
We are subject to risks associated with currency fluctuations, which could have a material effect on our results of operations and/or financial condition.
A portion of our cash and other current assets is held in the Canadian dollar. Changes in the exchange rates of the Canadian dollar and the U.S. dollar will affect the value of these assets as translated to U.S. dollars on our balance sheet. To the extent that we ultimately decide to repatriate some portion of these funds to the United States, the actual value transferred could be impacted by movements in exchange rates. Any such type of movement could negatively impact the amount of cash available to fund operations or to repay debt.
In addition, a portion of our business operations are transacted in Canadian dollars, and as a result, similar changes in exchange rates of the Canadian dollar and the U. S. dollar could result in exchange losses, which could impact our results of operations.
The impact of future exchange rate fluctuations on our results of operations and/or financial condition cannot be predicted.
We lease a number of our manufacturing facilities on leases that expire in the near future, and renewals or replacements of the leases may not be available on acceptable terms, or at all.
We lease approximately 56% of the building space we utilize for the manufacture of quick-turn PCBs and administrative purposes. Our lease agreements expire at various dates through 2015. There can be no assurance that we will be able to renew these leases on acceptable terms, or at all. If we are unable to renew a lease, we would be required to relocate or close the affected manufacturing facility. Relocation of a manufacturing facility could result in significant exit costs with respect to the existing facility, the diversion of management’s attention from normal daily operations, increased
17
Table of Contents
expenses and capital expenditures associated with the relocation of the operations, difficulties in managing production and coordinating operations at the new site, a potential decrease in overall gross margins associated with the relocation. The closure of a facility could result in our recording restructuring charges such as severance, other exit costs, and asset impairments.
If we are unable to provide our customers with high-end technology, high quality products, and responsive service, or if we are unable to deliver our products to our customers in a timely manner, our results of operations and financial condition may suffer.
In order to maintain our existing customer base and obtain business from new customers, we must demonstrate our ability to produce our products at the level of technology, quality, responsiveness of service, timeliness of delivery, and at costs that our customers require. If our products are of substandard quality, if they are not delivered on time, if we are not responsive to our customers’ demands, or if we cannot meet our customers’ technological requirements, our reputation as a reliable supplier would likely be damaged. If we are unable to meet these product and service standards, we may be unable to obtain new contracts or keep our existing customers, and this could have a material adverse effect on our results of operations and financial condition.
If events or circumstances occur in our business that indicate our goodwill and definite-lived intangibles may not be recoverable, we could incur impairment charges that would negatively affect our earnings.
As of December 31, 2010, our consolidated balance sheet reflected $4.3 million of goodwill and definite-lived intangible assets. We periodically evaluate whether events and circumstances have occurred, such that the potential for reduced expectations for future cash flows coupled with further decline in the market price of our stock and market capitalization may indicate that the remaining balance of goodwill and definite-lived intangible assets may not be recoverable. If factors indicate that assets are impaired, we would be required to reduce the carrying value of our goodwill and definite-lived intangible assets, which could harm our results during the periods in which such a reduction is recognized. Our goodwill and definite-lived intangible assets may increase in future periods if we consummate other acquisitions. Amortization or impairment of these additional intangibles would, in turn, reduce our earnings.
A significant portion of our business is derived from products and services ultimately sold to the U.S. government by our customers. Changes affecting the government’s capacity to do business with us or our direct customers or the effects of competition in the defense industry could have a material adverse effect on our business.
A significant portion of our revenues is derived from products and services ultimately sold to the U.S. government and is therefore affected by, among other things, the federal budget process. We are a supplier, primarily as a subcontractor, to the U.S. government and its agencies as well as foreign governments and agencies. These contracts are subject to the respective customers’ political and budgetary constraints and processes, changes in customers’ short-range and long-range strategic plans, the timing of contract awards, and in the case of contracts with the U.S. government, the congressional budget authorization and appropriation processes, the government’s ability to terminate contracts for convenience or for default, as well as other risks such as contractor suspension or debarment in the event of certain violations of legal and regulatory requirements. Additionally, defense expedite (DX)-rated orders from the U.S. federal government, which by law receive priority, can interrupt scheduled shipments to our other customers. The termination or failure to fund one or more significant contracts by the U.S. government could have a material adverse effect on our business, results of operations or prospects.
Our business has benefited from OEMs deciding to outsource their PCB manufacturing needs to us. If OEMs choose to provide these services in-house or select other providers, our business could suffer.
Our future revenue growth partially depends on new outsourcing opportunities from OEMs. Current and prospective customers continuously evaluate our performance against other providers. They also evaluate the potential benefits of manufacturing their products themselves. To the extent that outsourcing opportunities are not available either due to OEM decisions to produce these products themselves or to use other providers, our financial results and future growth could be adversely affected.
If we are unable to manage our growth effectively, our business could be negatively affected.
We have experienced, and expect to continue to experience, growth in the scope and complexity of our operations. This growth may strain our managerial, financial, manufacturing, and other resources. In order to manage our growth, we may be required to continue to implement additional operating and financial controls and hire and train additional personnel. There
18
Table of Contents
can be no assurance that we will be able to do so in the future, and failure to do so could jeopardize our expansion plans and seriously harm our operations. In addition, growth in our capacity could result in reduced capacity utilization and a corresponding decrease in gross margins.
Our development plans involve significant capital expenditures and financing requirements, which are subject to a number of risks and uncertainties.
Our business is capital intensive. Our ability to increase revenue, profit, and cash flow depends upon continued capital spending. There can be no assurance as to whether — or at what cost — our anticipated capital projects will be completed, if they will be completed on schedule, or as to the success of these projects if completed. In addition, we may be unable to generate sufficient cash flows from operations or obtain necessary external financing to finance our capital expenditures and investments. Further, our ability to obtain external financing in the future is subject to a variety of uncertainties, including the following:
| • | our future results of operations, financial condition, and cash flows; |
| • | the condition of the global economy generally and the demand for our products, specifically; and |
| • | the cost of financing and the condition of financial markets. |
If adequate funds are not available on satisfactory terms, we may be forced to curtail our expansion plans, which could result in a loss of customers, the inability to successfully implement our business strategy, and limitations on the growth of our business.
Our business and operations could be adversely impacted by climate change initiatives.
Our manufacturing processes require that we purchase significant quantities of energy from third parties, which results in the generation of greenhouse gases, either directly on-site or indirectly at electric utilities. Both domestic and international legislation to address climate change by reducing greenhouse gas emissions and establishing a price on carbon could create increases in energy costs and price volatility. Considerable international attention is now focused on development of an international policy framework to guide international action to address climate change. Proposed and existing legislative efforts to control or limit greenhouse gas emissions could affect our energy source and supply choices as well as increase the cost of energy and raw materials derived from sources that generate greenhouse gas emissions.
A material disruption at one of our manufacturing facilities could harm our financial condition and operating results.
If one of our manufacturing facilities were to be shut down unexpectedly, or certain of our manufacturing operations within an otherwise operational facility were to cease production unexpectedly, our revenue and profit margins would be adversely affected. Such a disruption could be caused by a number of different events, including:
| • | maintenance outages; |
| • | information technology systems outages or disruptions; |
| • | prolonged power failures; |
| • | an equipment failure; |
| • | fires, floods, earthquakes or other catastrophes; |
| • | potential unrest or terrorist activity; |
| • | labor difficulties; or |
| • | other operational problems. |
If any of these or other events were to result in a material disruption of our manufacturing operations, our ability to meet our production capacity targets and satisfy customer requirements may be impaired.
We could be adversely affected by violations of the U.S. Foreign Corrupt Practices Act and similar worldwide anti-bribery laws.
The U.S. Foreign Corrupt Practices Act (“FCPA”) and similar worldwide anti-bribery laws generally prohibit companies and their intermediaries from making improper payments to non-U.S. government officials for the purpose of obtaining or retaining business. Our policies mandate compliance with these laws. Despite our compliance program, we
19
Table of Contents
cannot assure you that our internal control policies and procedures always will protect us from reckless or negligent acts committed by our employees or agents. Violations of these laws, or allegations of such violations, may have a negative effect on our results of operations, financial condition and reputation.
| Item 1B. | Unresolved Staff Comments. |
None.
| Item 2. | Properties. |
We lease approximately 289,000 square feet of building space in locations throughout North America for the manufacture of quick-turn PCBs and administrative purposes. Our lease agreements expire at various dates through 2015 and represent an average annual commitment of approximately $1.7 million.
We also own four buildings with remaining mortgages totaling approximately $3.9 million at December 31, 2010 and that consist of approximately 225,000 square feet of manufacturing and office space. Associated with these buildings are land parcels totaling approximately 18.5 acres.
Our significant facilities are as follows:
| Total Square Feet (approx.) | ||||||||||||||
| Location |
Primary Function |
Leased | Owned | Total | ||||||||||
| Sterling, Virginia |
Manufacturing | 101,000 | 101,000 | |||||||||||
| Anaheim, California |
Manufacturing and corporate headquarters | 92,000 | 92,000 | |||||||||||
| Milpitas, California |
Manufacturing | 62,000 | 62,000 | |||||||||||
| Toronto, Canada |
Manufacturing | 15,000 | 95,000 | 110,000 | ||||||||||
| North Jackson, Ohio |
Manufacturing | 9,000 | 68,000 | 77,000 | ||||||||||
| Cuyahoga Falls, Ohio |
Manufacturing | 40,000 | 40,000 | |||||||||||
| Littleton, Colorado |
Manufacturing | 2,000 | 22,000 | 24,000 | ||||||||||
| Richardson, Texas |
Data Center | 8,000 | 8,000 | |||||||||||
| Total |
289,000 | 225,000 | 514,000 | |||||||||||
We believe that our current facilities are sufficient for the operation of our business and we believe that suitable additional space in various local markets is available to accommodate any needs that may arise.
| Item 3. | Legal Proceedings. |
From time to time we are involved in litigation and government proceedings incidental to our business. These proceedings are in various procedural stages. We believe as of the date of this report that provisions or accruals made for any potential losses, to the extent estimable, are adequate and that any liabilities or costs arising out of these proceedings are not likely to have a materially adverse effect on our financial position, results of operations or liquidity. The outcome of any of these proceedings, however, is inherently uncertain, and if unfavorable outcomes were to occur, there is a possibility that they would, individually or in the aggregate, have a materially adverse effect on our financial position, results of operations or liquidity.
| Item 4. | Removed and Reserved. |
PART II
| Item 5. | Market for the Registrants’ Common Equity, Related Stockholder Matters and Issuer Purchases of Equity Securities. |
Market for Common Stock
Our common stock is traded on the NASDAQ Global Select Market under the symbol “DDIC.”
20
Table of Contents
The following table sets forth the high and low sales prices per share of our common stock for the quarterly periods indicated, which correspond to our quarterly fiscal periods for financial reporting purposes.
| DDi Corp. Common Stock |
||||||||
| High | Low | |||||||
| Fiscal Year Ended December 31, 2010: |
||||||||
| Fourth Quarter |
$ | 12.30 | $ | 8.60 | ||||
| Third Quarter |
$ | 10.02 | $ | 7.24 | ||||
| Second Quarter |
$ | 10.01 | $ | 5.69 | ||||
| First Quarter |
$ | 6.00 | $ | 4.13 | ||||
| Fiscal Year Ended December 31, 2009: |
||||||||
| Fourth Quarter |
$ | 5.10 | $ | 3.78 | ||||
| Third Quarter |
$ | 5.16 | $ | 3.88 | ||||
| Second Quarter |
$ | 5.07 | $ | 3.07 | ||||
| First Quarter |
$ | 3.75 | $ | 2.76 | ||||
As of February 22, 2011, the number of common stockholders of record was 29.
Dividend Policy
The Company intends to retain earnings for use in operations and payments of cash dividends on its common stock. Cash dividends are discussed quarterly by the Company’s board of directors and management. The actual declaration of future cash dividends, and the establishment of record and payment dates, is subject to final determination by our board of directors after its review of our financial performance, expected future operations and earnings, capital requirements and surplus, contractual restrictions, alternative uses of cash, and other factors as our board of directors may deem relevant. Our dividend policy may be changed at any time, and from time to time, by our board of directors.
The Company did not declare any dividends prior to 2010. During 2010 and through the Form 10-K filing date, our board of directors declared the following dividends (in thousands except per share data):
| Declaration Date |
Record Date |
Payment Date |
Dividend per Share |
Number of Shares |
Total Payment | |||||||||||
| May 11, 2010 | Jun 21, 2010 | Jul 6, 2010 | $ | 0.06 | 19,943 | $ | 1,197 | |||||||||
| Aug 5, 2010 | Sep 15, 2010 | Sep 30, 2010 | $ | 0.06 | 19,952 | $ | 1,197 | |||||||||
| Oct 19, 2010 | Nov 15, 2010 | Nov 30, 2010 | $ | 0.10 | 20,170 | $ | 2,017 | |||||||||
| (a) |
Feb 17, 2011 | Mar 15, 2011 | Mar 30, 2011 | $ | 0.10 | 21,000 | $ | 2,100 | ||||||||
| (a) | The first quarter of 2011 dividend declaration occurred after December 31, 2010. The numbers of shares outstanding and total payment as of the Record Date are estimated. |
Share Repurchases
Our board of directors (the “Board”) previously authorized a common stock repurchase program of up to 3,000,000 shares of our common stock in the open market at prevailing market prices or in privately-negotiated transactions. In February 2009, the Board amended the stock repurchase program to increase the amount of shares of common stock authorized to be repurchased by up to an additional $10 million worth of shares. The stock repurchase program is subject to applicable legal and regulatory requirements, may be modified or discontinued at any time, and the stock repurchase authorization does not have an expiration date. We will continue to review the value in repurchasing shares after considering our cash levels and operating needs as well as other uses for our cash that could create greater shareholder value.
No shares were repurchased during the year ended December 31, 2010. As of December 31, 2010, we repurchased a total of 2,946,986 shares since the inception of the program in August 2007.
Pursuant to our credit agreement dated September 23, 2010 (the “Credit Agreement”) with JPMorgan Chase Bank, N.A., as Administrative Agent and U.S. Lender, and JPMorgan Chase Bank, N.A. Toronto Branch, as Canadian Administrative Agent and Canadian Lender, while we have borrowings outstanding under the Credit Agreement, we may make no more than $8 million in dividend payments and stock purchases during any 12 month period and no more than $25 million over the term of the facility. As of December 31, 2010, we had no borrowings outstanding under the Credit Agreement.
21
Table of Contents
Performance Graph
The following Performance Graph and related information shall not be deemed “soliciting material” or to be “filed” with the SEC, nor shall such information be incorporated by reference into any future filing under the Securities Act of 1933 or Securities Exchange Act of 1934, each as amended, except to the extent that we specifically incorporate it by reference into such filing.
The following graph compares the cumulative total stockholder return on our common stock since December 30, 2005 with the cumulative total return of (a) the NASDAQ Composite Index and (b) an index of two peer companies selected by us. The peer group is comprised of TTM Technologies, Inc. and Viasystems Group, Inc. This peer group index will be subject to occasional change as we or our competitors change their focus, merge or are acquired, undergo significant changes, or as new competitors emerge. The comparison assumes $100 was invested on December 30, 2005 in DDi Corp. common stock and in each of the indices shown and assumes that all dividends were reinvested.
The comparisons in this table are required by the SEC and, therefore, are not intended to forecast or be indicative of possible future performance of our common stock.
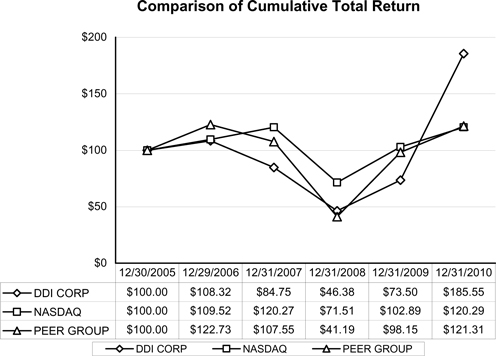
22
Table of Contents
| Item 6. | Selected Financial Data. |
The following selected consolidated financial data as of and for the dates and periods indicated have been derived from our consolidated financial statements for the years ended December 31, 2010, 2009, 2008, 2007 and 2006. On February 3, 2006, the Company completed a one-for-seven reverse stock split. All share and per share information has been retroactively adjusted to reflect the reverse stock split. You should read the data set forth below in conjunction with “Management’s Discussion and Analysis of Financial Condition and Results of Operations” in Part II, Item 7 of this Annual Report on Form 10-K and our audited consolidated financial statements and the related notes thereto set forth in Part II, Item 8 of this Annual Report on Form 10-K.
| Year Ended December 31, | ||||||||||||||||||||
| 2010 | 2009 | 2008 | 2007 | 2006 | ||||||||||||||||
| (In millions, except percentages and per share data) | ||||||||||||||||||||
| Consolidated Statements of Operations Data: |
||||||||||||||||||||
| Net sales |
$ | 267.8 | $ | 158.0 | $ | 190.8 | $ | 181.1 | $ | 198.1 | ||||||||||
| Cost of goods sold |
208.4 | 128.8 | 152.0 | 146.2 | 160.2 | |||||||||||||||
| Gross profit |
59.4 | 29.2 | 38.8 | 34.9 | 37.9 | |||||||||||||||
| Gross profit percentage |
22.2 | % | 18.5 | % | 20.3 | % | 19.3 | % | 19.1 | % | ||||||||||
| Operating expenses: |
||||||||||||||||||||
| Sales and marketing |
17.4 | 11.7 | 12.5 | 12.2 | 15.2 | |||||||||||||||
| General and administrative |
16.7 | 13.3 | 14.0 | 14.5 | 14.6 | |||||||||||||||
| Amortization of intangible assets |
0.8 | 0.8 | 5.0 | 5.4 | 4.7 | |||||||||||||||
| Loss on sale of assembly business |
— | — | — | — | 4.6 | |||||||||||||||
| Litigation reserve |
— | — | — | — | 1.7 | |||||||||||||||
| Restructuring and other related charges |
1.1 | — | 0.3 | 0.6 | 1.1 | |||||||||||||||
| Goodwill impairment |
— | — | 38.9 | — | — | |||||||||||||||
| Operating income (loss) |
23.4 | 3.4 | (31.9 | ) | 2.2 | (4.0 | ) | |||||||||||||
| Interest and other (income) expense, net |
1.9 | 0.9 | (0.2 | ) | 0.5 | 1.4 | ||||||||||||||
| Income (loss) from continuing operations before income taxes |
21.5 | 2.5 | (31.7 | ) | 1.7 | (5.4 | ) | |||||||||||||
| Income tax expense |
0.8 | 0.7 | 1.7 | 1.0 | 1.8 | |||||||||||||||
| Net income (loss) |
20.7 | 1.8 | (33.4 | ) | 0.7 | (7.2 | ) | |||||||||||||
| Less: Series B Preferred Stock dividends, accretion and redemption charge |
— | — | — | — | 16.4 | |||||||||||||||
| Net income (loss) applicable to common stockholders |
$ | 20.7 | $ | 1.8 | $ | (33.4 | ) | $ | 0.7 | $ | (23.6 | ) | ||||||||
| Other Financial Data: |
||||||||||||||||||||
| Net income (loss) per share: |
||||||||||||||||||||
| Basic |
$ | 1.04 | $ | 0.09 | $ | (1.60 | ) | $ | 0.03 | $ | (1.21 | ) | ||||||||
| Diluted |
$ | 1.01 | $ | 0.09 | $ | (1.60 | ) | $ | 0.03 | $ | (1.21 | ) | ||||||||
| Dividends declared per share |
$ | 0.22 | — | — | — | — | ||||||||||||||
| Weighted-average shares used in per share computations: |
||||||||||||||||||||
| Basic |
19.9 | 19.7 | 21.0 | 22.6 | 19.6 | |||||||||||||||
| Diluted |
20.6 | 19.8 | 21.0 | 22.6 | 19.6 | |||||||||||||||
| As of December 31, | ||||||||||||||||||||
| 2010 | 2009 | 2008 | 2007 | 2006 | ||||||||||||||||
| (In millions) | ||||||||||||||||||||
| Consolidated Balance Sheet Data: |
||||||||||||||||||||
| Cash and cash equivalents (excluding restricted cash) |
$ | 28.3 | $ | 19.4 | $ | 20.1 | $ | 20.4 | $ | 15.9 | ||||||||||
| Working capital |
51.0 | 36.2 | 37.7 | 40.0 | 31.2 | |||||||||||||||
| Total assets |
140.0 | 120.5 | 90.8 | 136.8 | 139.6 | |||||||||||||||
| Total debt, including current maturities |
11.5 | 17.2 | 1.5 | 1.8 | 2.0 | |||||||||||||||
| Stockholders’ equity |
88.6 | 69.3 | 65.1 | 111.2 | 109.6 | |||||||||||||||
23
Table of Contents
| Item 7. | Management’s Discussion and Analysis of Financial Condition and Results of Operations. |
The following discussion and analysis presents the factors that had a material effect on the results of operations of DDi Corp. during the three years ended December 31, 2010. Also discussed is DDi Corp.’s financial position as of December 31, 2010. You should read this discussion in conjunction with the historical consolidated financial statements and related notes included elsewhere in this Report.
Overview
We are a leading provider of time-critical, technologically-advanced PCB engineering and manufacturing services. We specialize in engineering and fabricating complex multi-layer PCBs on a quick-turn basis, with lead times as short as 24 hours. We have over 1,000 PCB customers in various market segments including communications and computing, military and aerospace, industrial electronics, instrumentation, medical, and high-durability commercial markets.
On December 31, 2009, we completed the acquisition of Coretec Inc., a Canadian-based PCB manufacturer whose shares previously were publicly traded on the Toronto Stock Exchange. In 2010, this acquisition has allowed us to increase our overall North American production capacity, extend our presence in the military/aerospace and medical markets and strengthen our flex and rigid-flex product capabilities. We believe that these positive impacts from the acquisition will continue into the future. As the acquisition closed on December 31, 2009, none of Coretec’s results of operations from 2009 were included in our 2009 Consolidated Statement of Operations.
Critical Accounting Policies and Estimates
Our discussion and analysis of our financial condition and results of operations are based upon our audited consolidated financial statements, which have been prepared in accordance with accounting principles generally accepted in the United States of America. The preparation of these financial statements requires us to make estimates and judgments that affect the reported amount of assets and liabilities and disclosure of contingent assets and liabilities at the date of the financial statements and the reported amount of revenues and expenses for each period.
Our critical accounting policies are defined as those policies that we believe: (i) are the most important to the portrayal of our financial condition and results of operations; and (ii) require management’s most difficult, subjective or complex judgments, often as a result of the need to make estimates about the effects of matters that are inherently uncertain.
Revenue recognition — Our revenue consists primarily of the sale of PCBs using customer supplied engineering and design plans. Revenue from the sale of products is recognized when title and risk of loss has passed to the customer, typically at the time of shipment, persuasive evidence of an arrangement exists, including a fixed price, and collectability is reasonably assured. We do not have customer acceptance provisions, but we do provide our customers a limited right of return for defective PCBs. We record warranty expense at the time revenue is recognized and we maintain a warranty accrual for the estimated future warranty obligation based upon the relationship between historical sales volumes and anticipated costs. Factors that affect our warranty liability include the number of units sold, historical and anticipated rates of warranty claims and the estimated cost of repair. We assess the adequacy of the warranty accrual each quarter. To date, actual warranty claims and costs have been in line with our estimates.
Receivables and allowance for doubtful accounts — Trade accounts receivable are recorded at the invoiced amount and do not bear interest. The allowance for doubtful accounts is our best estimate of the amount of probable credit losses in our existing accounts receivable. We determine the allowance based on historical write-off experience and specific account review. We review our allowance for doubtful accounts at least quarterly. Past due balances over 90 days are reviewed individually for collectability. All other balances are reviewed on a pooled basis by age of receivable. Account balances are charged off against the allowance when it is probable the receivable will not be recovered. We do not have any off-balance-sheet credit exposure related to our customers.
Goodwill and other long-lived assets — Goodwill and other intangible assets with indefinite lives are not subject to amortization but are tested for impairment annually or whenever events or changes in circumstances indicate that the asset might be impaired. We operate in one operating segment and have one reporting unit; therefore, we test goodwill for impairment at the consolidated level against the fair value of the Company. The fair value of a reporting unit refers to the amount at which the unit as a whole could be bought or sold in a current transaction between willing parties. Quoted market prices in active markets are the best evidence of fair value and are used as the basis on the last day of the year for the measurement, if available. We assess potential impairment on an annual basis as of September 30, 2010 on the last day of the year and compare our market capitalization to the book value of the Company including goodwill. A significant decrease in our stock price could indicate a material impairment of goodwill which, after further analysis, could result in a material charge to operations. If goodwill is considered impaired, the impairment loss to be recognized is measured by the amount by
24
Table of Contents
which the carrying amount of the goodwill exceeds the implied fair value of that goodwill. Inherent in our fair value determinations are certain judgments and estimates, including projections of future cash flows, the discount rate reflecting the risk inherent in future cash flows, the interpretation of current economic indicators and market valuations, and strategic plans with regard to operations. A change in these underlying assumptions would cause a change in the results of the tests, which could cause the fair value of the reporting unit to be less than its respective carrying amount.
In connection with our annual impairment test as of December 31, 2008, we recorded a non-cash charge of $38.9 million to write-off the entire carrying value of our goodwill existing as of that date. The charge was driven by a decrease in our stock price and market capitalization as a result of the weakened economy and adverse capital market conditions. The impairment charge did not affect our normal business operations, liquidity position or availability under our previous credit facility, and we believe does not reflect the actual performance of the business. On December 31, 2009, in connection with our acquisition of Coretec, we recorded additional goodwill of approximately $3.0 million on our balance sheet. During 2010, we made adjustments to the initially determined estimate of goodwill, increasing goodwill to approximately $3.7 million at December 31, 2010. The annual impairment test of this goodwill as of September 30, 2010 indicated no impairment in the carrying value.
Applicable accounting guidelines require impairment losses for long-lived assets, including intangible assets subject to amortization, to be recorded when indicators of impairment, such as changes in our operations strategy, reductions in demand for our products or significant economic slowdowns in the PCB industry, are present. Reviews are performed to determine whether the carrying value of an asset is impaired, based on comparisons to undiscounted expected future cash flows. If this comparison indicates that there is impairment, the impaired asset is written down to fair value, which is typically calculated using discounted expected future cash flows.
Inventory obsolescence — We purchase raw materials in quantities that we anticipate will be fully used in the near term. However, changes in operating strategy, such as the closure of a facility or changes in technology can limit our ability to effectively utilize all of the raw materials purchased. If inventory is not utilized, then an inventory impairment may be recorded.
Income taxes — As part of the process of preparing our consolidated financial statements, we are required to estimate our income taxes in each of the jurisdictions in which we operate. The process incorporates a determination of the proper current tax balances together with temporary differences resulting from different treatment of transactions for tax and financial statement purposes. Such differences result in deferred tax assets and liabilities, which are included within the Consolidated Balance Sheets. The recovery of deferred tax assets from future taxable income must be assessed and, to the extent that recovery is not likely, we establish a valuation allowance. Currently, our net deferred tax asset is fully reserved. Due to the volatility in the PCB industry and in the Company’s operating results over the prior five years, management believes that up to two more years of generating significant operating income is required before we may determine that it is more likely than not that some or all of the net deferred tax asset may be realizable and, therefore, the valuation allowance may be reduced to less than 100% of such asset. If our ultimate tax liability differs from the periodic tax provision reflected in the Consolidated Statements of Operations, additional tax expense will be recorded.
Effective January 1, 2009, as prescribed by the authoritative guidance, any reduction of the U.S. valuation allowance that was related to net deferred tax assets that were in existence as of applying fresh-start accounting and any adjustments to uncertain tax positions for years prior to our emergence from bankruptcy in 2003 or related to the Coretec acquisition will now be recognized as a U.S. tax benefit as opposed to a reduction of goodwill and additional-paid-in-capital as was done in the past.
Effective January 1, 2007, as prescribed by the authoritative guidance, we utilize a two-step approach to recognizing and measuring uncertain tax positions. The first step is to evaluate the tax position for recognition by determining if the weight of available evidence indicates it is more likely than not that the position will be sustained on audit, including resolution of related appeals or litigation processes, if any. The second step is to measure the tax benefit as the largest amount which is more than 50% likely to be realized upon ultimate settlement. We consider many factors when evaluating and estimating our tax positions and tax benefits, which may require periodic adjustments and which may not accurately anticipate actual outcomes.
Litigation and other contingencies — Management regularly evaluates our exposure to threatened or pending litigation and other business contingencies. Because of the uncertainties related to the amount of loss from litigation and other business contingencies, the recording of losses relating to such exposures requires significant judgment about the potential range of outcomes. As additional information about current or future litigation or other contingencies becomes available, management will assess whether such information warrants the recording of expense relating to the contingencies. Such additional expense could potentially have a material impact on our results of operations, cash flows and financial position.
25
Table of Contents
Stock-based compensation — Stock-based compensation cost is measured at the grant date based on the fair value of the award and is recognized as expense over the requisite service period, which is the vesting period. We use the Black-Scholes option-pricing model to estimate the fair values of stock options. The Black Scholes option-pricing model requires the input of certain assumptions that require our judgment including the expected term, the expected stock price volatility of the underlying stock options and expected forfeiture rate. The assumptions used in calculating the fair value of stock-based compensation represent management’s best estimates, but these estimates involve inherent uncertainties and the application of judgment. As a result, if factors change and we use different assumptions, our stock-based compensation expense could be materially different in the future. In addition, if our actual forfeiture rate is materially different from our estimate, the stock-based compensation expense could be significantly different from what we have recorded in the current period.
Results of Operations and Other Financial Data
The following table sets forth select data from our Consolidated Statements of Operations (in thousands):
| Year Ended December 31, | ||||||||||||
| 2010 | 2009 | 2008 | ||||||||||
| Net sales |
$ | 267,784 | $ | 157,991 | $ | 190,842 | ||||||
| Cost of goods sold |
208,385 | 128,778 | 152,058 | |||||||||
| Gross profit |
59,399 | 29,213 | 38,784 | |||||||||
| 22.2 | % | 18.5 | % | 20.3 | % | |||||||
| Operating expenses: |
||||||||||||
| Sales and marketing |
17,372 | 11,710 | 12,540 | |||||||||
| General and administrative |
16,688 | 13,329 | 14,004 | |||||||||
| Amortization of intangible assets |
760 | 760 | 4,975 | |||||||||
| Restructuring and other related charges |
1,138 | — | 295 | |||||||||
| Goodwill impairment |
— | — | 38,898 | |||||||||
| Operating income (loss) |
23,441 | 3,414 | (31,928 | ) | ||||||||
| Interest expense, net |
1,421 | 624 | 371 | |||||||||
| Other expense (income), net |
489 | 318 | (562 | ) | ||||||||
| Income (loss) before income taxes |
21,531 | 2,472 | (31,737 | ) | ||||||||
| Income tax expense |
796 | 688 | 1,702 | |||||||||
| Net income (loss) |
$ | 20,735 | $ | 1,784 | $ | (33,439 | ) | |||||
Year Ended December 31, 2010 Compared to the Year Ended December 31, 2009
During 2010, the overall economy, both globally and in the U.S., continued to face challenges, however, the PCB industry as a whole experienced increased demand. We experienced a 21.8% increase in proforma sales compared to the prior year versus a 17.2% decrease in sales in 2009 compared to 2008. Likewise, profitability improved significantly in 2010 with gross margins of 22.2% and net income of $20.7 million compared with 2009 gross margins of 18.5% and a net income of $1.8 million. The 2009 proforma sales include Coretec for the entire year. Despite mixed economic reports about the general economy, the increased demand we experienced in 2010 was driven by stronger commercial markets as well as continued strength in the military and aerospace sector. Moving on to 2011, the year-over-year growth rate for the broader North American PCB industry is forecasted to be in the mid-single digits. As we continue to execute on our long-term strategic plan, we believe our technical capabilities, our sales distribution network and our extensive customer base, position us to exceed the anticipated industry growth rate in 2011 and take incremental market share.
Net Sales
Net sales are derived from the engineering and manufacture of complex, technologically-advanced multi-layer PCBs.
Net sales increased by $109.8 million, or 69.5%, to $267.8 million in 2010 from $158.0 million in 2009. The increase in net sales over 2009 proforma sales that included Coretec was $47.9 million, or 21.8%. The improvement in net sales was due to an increase in general demand plus the additional sales as a result of the Coretec acquisition.
Gross Profit
Gross profit for 2010 was $59.4 million, or 22.2% of net sales, compared to $29.2 million, or 18.5% of net sales, in 2009. The increase in gross profit as a percentage of net sales was primarily due to more efficient absorption of labor, depreciation and overhead costs on higher sales, partially offset by higher material costs.
26
Table of Contents
Non-Cash Compensation
The following table sets forth select data related to non-cash compensation expense (in thousands):
| Year Ended December 31, | ||||||||
| 2010 | 2009 | |||||||
| Non-cash compensation: |
||||||||
| Cost of goods sold |
$ | 440 | $ | 532 | ||||
| Sales and marketing expenses |
241 | 362 | ||||||
| General and administrative expenses |
628 | 1,013 | ||||||
| Total non-cash compensation |
$ | 1,309 | $ | 1,907 | ||||
Non-cash compensation expense was recorded based on estimated fair value. The decrease in non-cash compensation expense was related to a significant number of stock-based awards which became fully amortized in 2009 and early 2010, partially offset by amortization from grants made in late 2009 and during 2010. We expect non-cash compensation expense to be approximately $0.8 million in 2011 based on unvested stock-based awards outstanding as of December 31, 2010.
Sales and Marketing Expenses
Sales and marketing expenses increased by $5.7 million or 48.4%, to $17.4 million, or 6.5% of net sales, from $11.7 million, or 7.4% of net sales, in 2009. The absolute dollar increase was primarily due to the inclusion of the sales and marketing expenses of Coretec during 2010 and the increased sales due to improved general market demand. Sales and marketing expenses decreased as a percentage of net sales primarily due to the positive operating leverage as a result of the Coretec acquisition and overall higher sales levels.
General and Administrative Expenses
General and administrative expenses increased by $3.4 million, or 25.2%, to $16.7 million, or 6.4% of net sales in 2010, compared to $13.3 million, or 8.4% of net sales in 2009. The absolute dollar increase was primarily due to the inclusion of the general and administrative expenses of Coretec during 2010. The decrease in general and administrative expenses as a percentage of net sales was primarily due to the positive operating leverage that results from higher sales levels, despite incurring $0.4 million of incremental professional fees in connection with the Coretec acquisition.
Amortization of Intangibles
Amortization of intangible assets relates to customer relationships identified in connection with the purchase of Sovereign Circuits in the fourth quarter of 2006. These intangible assets are being amortized using the straight-line method over an estimated useful life of five years resulting in approximately $0.2 million per quarter for the remaining Sovereign customer relationships through October 2011. Amortization expense for 2011 is expected to be approximately $0.6 million based on customer relationships that are recorded as of December 31, 2010.
Restructuring
During 2010, restructuring charges of $1.1 million were incurred related to the integration of DDi’s legacy facility in Toronto (McNicoll) with Coretec’s Toronto facility (Sheppard). These costs are composed of site remediation, asset disposals, severance and other typical integration expenses.
We had no accrued restructuring costs as of December 31, 2010. At December 31, 2009, in connection with the acquisition of Coretec, the Company assumed a liability of $1.3 million for an accrual for remediation costs to exit a leased Coretec facility in Toronto, Ontario. The Company completed the remediation successfully in August 2010 for $1.3 million.
Goodwill Impairment
On December 31, 2009, in connection with our acquisition of Coretec, we recorded additional goodwill on our balance sheet. The annual impairment test of this goodwill as of September 30, 2010 indicated no impairment in the carrying value.
Interest Expense, Net
Net interest expense consists of amortization of debt issuance costs and fees related to our asset-based credit facility with JPMorgan Chase, interest on our long-term debt that includes a mortgage on the North Jackson, Ohio facility, long-term debt assumed upon the acquisition of Coretec and expense associated with long-term leases, net of interest income. Net interest expense increased to $1.4 million for the year ended December 31, 2010 from $0.6 million for 2009. The increase was primarily due to interest paid on the debt assumed upon the acquisition of Coretec. To a lesser extent, the increase in net interest expense was due to lower interest income earned during the year as a result of lower interest rates and lower average cash balances during the year.
27
Table of Contents
Other Expense (Income), Net
Net other expense (income) consists of foreign exchange transaction gains or losses related to our operations in Canada and other miscellaneous non-operating items. For the year ended December 31, 2010, net other expense was $0.5 million compared to net other expense of $0.3 million for the year ended December 31, 2009 and was primarily due to the change in currency exchange rates between the U.S. and Canadian dollar.
Income Tax Expense
The Company recorded an income tax expense for 2010 of $0.8 million or 3.7% of pre-tax income, compared to an income tax expense of $0.7 million, or 27.8% of pre-tax income for the same period in 2009. The increase in income tax expense was primarily due to an increase in Canadian income tax expense in the first quarter of 2010. The effective tax rate declined from 2009 to 2010 primarily due to the effect of Canadian net operating loss carry-forwards on current earnings. Our effective income tax rate differs from the U.S. federal statutory tax rate of 35% primarily as a result of the mix of earnings between tax jurisdictions, research and development credits, state income taxes and our continuous evaluation of the realization of our deferred tax assets and uncertain tax positions, and the impact of the recognition of the tax benefit of net operating loss carry forwards to the extent of current earnings.
Year Ended December 31, 2009 Compared to the Year Ended December 31, 2008
During 2009, the overall economy, both globally and in the U.S., continued to face significant challenges, and the PCB industry as a whole experienced reduced demand. We experienced a 17.2% decrease in sales in 2009 versus the prior year with a decrease in gross margins of 1.8%, to 18.5% in 2009 during the same period. Beginning in the third quarter of 2008, we experienced four consecutive quarters of declining revenues. However, we experienced the beginning of an increase in demand during the second half of 2009 as sales increased sequentially over the last two quarters of 2009. The sequential growth was driven primarily by the improving demand in the commercial markets, led by the communications, industrial, instrumentation, medical, and consumer electronics segments. The Company recorded gross margins of 20.5% in the fourth quarter of 2009 which was the highest rate in the last five quarters.
Net Sales
Net sales decreased by $32.8 million, or 17.2%, to $158.0 million in 2009 from $190.8 million in 2008. The decrease in net sales was primarily due to a decline in customer demand related to general economic conditions.
Gross Profit
Gross profit for 2009 was $29.2 million, or 18.5% of net sales, compared to $38.8 million, or 20.3% of net sales, in 2008. The decrease in gross profit as a percentage of net sales was primarily due to less efficient absorption of fixed costs on lower sales, partially offset by reductions in variable operating expenses along with decreases in depreciation expense and management incentives.
Non-Cash Compensation
The following table sets forth select data related to non-cash compensation expense (in thousands):
| Year Ended December 31, | ||||||||
| 2009 | 2008 | |||||||
| Non-cash compensation: |
||||||||
| Cost of goods sold |
$ | 532 | $ | 528 | ||||
| Sales and marketing expenses |
362 | 298 | ||||||
| General and administrative expenses |
1,013 | 1,825 | ||||||
| Total non-cash compensation |
$ | 1,907 | $ | 2,651 | ||||
Non-cash compensation expense was recorded based on estimated fair value as prescribed by the authoritative guidance. The decrease in non-cash compensation expense was related to a significant number of higher-valued stock-based awards which became fully amortized in 2008 and early 2009.
28
Table of Contents
Sales and Marketing Expenses
Sales and marketing expenses decreased by $0.8 million, or 6.6%, to $11.7 million, or 7.4% of net sales, from $12.5 million, or 6.6% of net sales, in 2008. The decrease was primarily due to lower commissions on reduced sales levels and lower management incentives.
General and Administrative Expenses
General and administrative expenses decreased by $0.7 million, or 4.8%, to $13.3 million, or 8.4% of net sales in 2009, compared to $14.0 million, or 7.3% of net sales in 2008. The decrease was primarily due to reductions in non-cash compensation expense, travel, management incentives and Sarbanes Oxley consulting fees, offset by transaction costs related to our acquisition of Coretec as well as higher professional fees.
Amortization of Intangibles
Amortization of intangible assets relates to customer relationships identified during the allocation of the reorganized value of the Company subsequent to our emergence from bankruptcy in December 2003 and to customer relationships identified in connection with the purchase of Sovereign in the fourth quarter of 2006. These intangible assets are being amortized using the straight-line method over an estimated useful life of five years resulting in $1.3 million of amortization expense per quarter through November 2008, when the customer relationships identified in the bankruptcy became fully amortized, and thereafter $0.2 million per quarter for the remaining Sovereign customer relationships through October 2011.
Restructuring
In May 2005, our Board approved plans to close our Arizona-based mass lamination operation. We completed remediation of the Arizona facility (encompassing three separate buildings) and exited the last building in the third quarter of 2006. During 2008, we incurred approximately $0.3 million in ongoing fees and expenses related to litigation with the landlord of one of the buildings. A ruling was issued in July 2008 in the landlord’s favor awarding it approximately $0.05 million. This award was accrued for in the second quarter of 2008 and paid to the landlord in January 2009, following which the case was dismissed with prejudice. As of December 31, 2009, we had incurred a total of $6.7 million in charges relating to the closure and do not anticipate any additional charges.
We had no accrued restructuring costs as of December 31, 2008. At December 31, 2009, in connection with the acquisition of Coretec, the Company assumed a liability of $1.3 million for an accrual for remediation costs to exit a leased Coretec facility in Toronto, Ontario.
Goodwill Impairment
In connection with our annual impairment test of goodwill at December 31, 2008, we recorded a non-cash charge of $38.9 million to write-off the entire carrying value of this goodwill. The charge was driven by a decrease in our stock price and market capitalization as a result of the weakened economy and adverse capital market conditions during 2008. Substantially all of the goodwill written-off was established in fresh-start accounting when we exited from the 2003 restructuring and was not related to any acquisition or transaction for which we paid cash.
The impairment charge did not affect our normal business operations, liquidity position or availability under our previous credit facility, and we believe does not reflect the actual performance of the business. On December 31, 2009, in connection with our acquisition of Coretec, we recorded additional goodwill on our balance sheet. The annual impairment test of this goodwill as of September 30, 2010 indicated no impairment in the carrying value.
Interest Expense, Net
Net interest expense consists of amortization of debt issuance costs, interest and fees related to our previous asset-based credit facility with GE Capital, interest on our note payable on our North Jackson, Ohio facility and expense associated with long-term leases, net of interest income. Net interest expense increased to $0.6 million for the year ended December 31, 2009 from $0.4 million for 2008. The increase was primarily the result of the amortization of previously capitalized debt issuance costs as a result of the termination in December 2009 of our line of credit with GE Capital and increased interest expense related to deferred lease liabilities, offset somewhat by an increase in interest income earned on higher average cash balances.
Other Expense (Income), Net
Net other expense (income) consists of foreign exchange transaction gains or losses related to our operations in Canada and other miscellaneous non-operating items. For the year ended December 31, 2009, net other expense was $0.3 million compared to net other income of $0.6 million for the year ended December 31, 2008 and was primarily due to the change in currency exchange rates between the U.S. and Canadian dollar.
29
Table of Contents
Income Tax Expense
Income tax expense decreased by $1.0 million to $0.7 million for the year ended December 31, 2009 compared to $1.7 million for the year ended December 31, 2008. Our income tax expense consists of both U.S. and Canadian jurisdictional taxes. U.S. and Canadian tax expense was lower in 2009 due to decreases in U.S. income which lowered our federal and state income taxes by approximately $0.9 million. In 2009, we completed a tax audit with Canada for years 2005 through 2008. The settlement of this audit and other tax matters increased our effective tax rate by approximately 35%.
Quarterly Financial Information
The following table presents selected quarterly financial information for 2010 and 2009. This information is unaudited but, in our opinion, reflects all adjustments consisting only of normal recurring adjustments that we consider necessary for a fair statement of this information in accordance with generally accepted accounting principles. These quarterly results are not necessarily indicative of future results.
| Three Months Ended | ||||||||||||||||||||||||||||||||
| Dec 31, 2010 |
Sep 30, 2010 |
Jun 30, 2010 |
Mar 31, 2010 |
Dec 31, 2009 |
Sep 30, 2009 |
Jun 30, 2009 |
Mar 31, 2009 |
|||||||||||||||||||||||||
| (In millions except per share data) | ||||||||||||||||||||||||||||||||
| Net sales |
$ | 65.7 | $ | 69.0 | $ | 68.4 | $ | 64.7 | $ | 42.2 | $ | 39.3 | $ | 37.2 | $ | 39.3 | ||||||||||||||||
| Gross profit |
14.6 | 15.5 | 15.3 | 14.0 | 8.7 | 6.6 | 6.7 | 7.3 | ||||||||||||||||||||||||
| Net income |
4.4 | 6.5 | 6.0 | 3.8 | 0.6 | 0.2 | 0.4 | 0.5 | ||||||||||||||||||||||||
| Net income per share — basic |
$ | 0.22 | $ | 0.33 | $ | 0.30 | $ | 0.19 | $ | 0.03 | $ | 0.01 | $ | 0.02 | $ | 0.03 | ||||||||||||||||
| Net income per share — diluted |
$ | 0.21 | $ | 0.31 | $ | 0.29 | $ | 0.19 | $ | 0.03 | $ | 0.01 | $ | 0.02 | $ | 0.03 | ||||||||||||||||
| Dividends declared per share |
$ | 0.10 | $ | 0.06 | $ | 0.06 | — | — | — | — | — | |||||||||||||||||||||
Liquidity and Capital Resources
| As of December 31, | ||||||||
| 2010 | 2009 | |||||||
| (Dollars in thousands) | ||||||||
| Working capital |
$ | 51,026 | $ | 36,170 | ||||
| Current ratio (current assets to current liabilities) |
2.2:1.0 | 1.9:1.0 | ||||||
| Cash and cash equivalents |
$ | 28,347 | $ | 19,392 | ||||
| Long-term debt, including current portion |
$ | 11,455 | $ | 17,200 | ||||
Our principal sources of liquidity to fund ongoing operations have been existing cash on hand and cash generated from operations.
As of December 31, 2010, we had total cash and cash equivalents of $28.3 million. Management defines cash and cash equivalents as highly liquid deposits with original maturities of 90 days or less when purchased. We maintain cash and cash equivalents balances at certain financial institutions in excess of amounts insured by federal agencies. Management does not believe this concentration subjects the Company to any unusual financial risk beyond the normal risk associated with commercial banking relationships. We frequently monitor the third-party depository institutions that hold our cash and cash equivalents. Our emphasis is primarily on safety of principal and secondarily on maximizing yield on those funds.
The increase in our cash and cash equivalents by $9.0 million at December 31, 2010 compared to December 31, 2009 was primarily due to $29.5 million net cash provided by operations in 2010 and $1.5 million in proceeds from the exercise of stock options, partially off-set by the payment of cash dividends of $4.4 million, payments on borrowings of $6.2 million and by purchases of property and equipment of approximately $11.0 million.
The Company entered into a new revolving credit agreement on September 23, 2010. The primary purpose the of revolving credit agreement will be to provide an additional source of funds to continue to fuel the Company’s growth both through acquisition and organically through product research and capital improvements. We believe that our current cash balance, in combination with net cash expected to be generated from operations and available borrowing under our revolving line of credit will fund ongoing operations for at least the next twelve months.
30
Table of Contents
Revolving Credit Facilities
JPMorgan Chase Credit Agreement. On September 23, 2010, the Company entered into a Credit Agreement (the “Credit Agreement”) with JPMorgan Chase Bank, N.A., as Administrative Agent and U.S. Lender, and JPMorgan Chase Bank, N.A., Toronto Branch, as Canadian Administrative Agent and Canadian Lender (the “Credit Agreement”).
The Credit Agreement provides for a revolving credit in an aggregate principal amount of $25 million, with a Canadian sub-limit of $10 million, and we have never drawn on this facility. The revolving credit agreement has an accordion provision that allows the Company to increase the size to $40 million under certain circumstances. The maturity date for the revolving credit agreement is 3 years from the date of the Credit Agreement (September 23, 2013). Availability under the revolving credit agreement is based on various liquidity and borrowing base tests including the Company’s eligible accounts receivable and inventories.
The Credit Agreement requires us to comply with customary covenants, including restrictions on incurring additional debt and liens, making acquisitions, our subsidiaries paying dividends to us and our ability to pay dividends or repurchase equity, liquidations, mergers and asset sales, changes in our business as well as incurring capital expenditures in excess of $20 million in any fiscal year. Additional covenants apply only when we have, in addition to other conditions, availability under the Credit Agreement of less than a certain amount. These additional covenants include (i) a requirement that we maintain a fixed charge coverage ratio of greater than 1.1 to 1 and (ii) a limitation that we make no more than $8 million in cash dividend payments and stock repurchases in any 12 months period and no more than $25 million over the term of the facility. As of December 31, 2010, we had no borrowings outstanding under the Credit Agreement and availability under the facility was above the applicable measurement levels.
The interest rates payable under the Credit Agreement will depend on the type of loan and are based on published rates plus an applicable margin. The current applicable rates for loans made under the Credit Agreement are: (i) 3.25% for any CB Floating Rate loan; (ii) 3.56% for any Eurodollar loan; (iii) 4.00% for any Canadian Prime Rate loan; and (iv) 4.65% for any Canadian Deposit Offered Rate (“CDOR”) loan. A commitment fee of 0.5% accrues on unused amounts of the commitments under the revolving credit agreement. In 2010, the company paid approximately $0.03 million in fees for the unused amounts of the commitments.
All obligations under the Credit Agreement are guaranteed by the Company and each of the Company’s domestic wholly-owned subsidiaries (the “U.S. Subsidiary Guarantors”). All such obligations under the Credit Agreement and the guarantees of those obligations, are secured by (i) all of the capital stock of each of the U.S. Borrowers and the U.S. Subsidiary Guarantors, except that with respect to DDi Toronto Corp. such security interest is limited to 65% of its capital stock, and (ii) substantially all of the tangible and intangible assets of the Company other than real property and equipment pursuant to a Pledge and Security Agreement dated September 23, 2010 (the “U.S. Security Agreement”). The obligations of the Canadian Borrower are secured by substantially all of the assets of the Canadian Borrower other than real property and equipment pursuant to a Pledge and Security Agreement dated September 23, 2010 (the “Canadian Security Agreement”).
General Electric Capital Credit Agreement. On December 21, 2009, we terminated the Amended and Restated Credit Agreement, dated as of March 30, 2007, among the Company, certain of its subsidiaries, and General Electric Capital Credit and the related Canadian credit facility with GE Canada Finance Holding Company (the “Credit Agreements”). The terminations became effective on December 31, 2009 under the terms of the Credit Agreements. The Credit Agreements provided for a revolving unsecured credit facility of up to $25 million with a term of three years from the effective date of March 31, 2007. No borrowings were outstanding under the Credit Agreements at the time of termination, and no penalties resulted from the early terminations.
Coretec Credit Line/Wells Fargo Canada. In connection with the acquisition of Coretec on December 31, 2009, we assumed the liability for the outstanding balance on Coretec’s revolving credit line with Wells Fargo Canada. The three year, CAD $10 million asset-based lending facility was entered into by Coretec on March 24, 2009 and was to be used for day-to-day working capital and other expenditures. At December 31, 2009, the total outstanding principal and interest owed under the credit line was approximately USD $4.2 million. We terminated this credit line effective February 26, 2010 and paid the balance owed of approximately USD $3.1 million on that date in full as well as an additional fee of approximately USD $0.1 million for early termination and legal fees.
The Company expects its available cash generated from operations, together with existing sources of cash, if required, from our credit agreements and long term debt (See Note 6 to the Notes to the Consolidated Financial Statements) will be sufficient to fund our long-term and short-term capital expenditures, working capital and other cash requirements. The primary purpose of the Credit Agreement is to provide an additional source of funds to continue to fuel the Company’s growth both through acquisition and organically through product research and capital improvements. In addition, from time-to-time, we may attempt to raise capital through either debt or equity arrangements. We cannot provide assurance that we will enter into new debt or equity arrangements or that required capital would be available on acceptable terms, if at all, or that any financing activity would not be dilutive to our current stockholders.
31
Table of Contents
Concentration of Credit Risk
Financial instruments which potentially expose us to concentration of credit risk consist principally of trade accounts receivable. To minimize this risk, we perform ongoing credit evaluations of customers’ financial condition and maintain relationships with their customers which allow us to monitor current changes in business operations so we can respond as needed. We do not, generally, require collateral. In 2010, 2009 and 2008, no individual customer accounted for 10% or more of our net sales. At December 31, 2010 and 2009, one customer accounted for 8.6% and 6.9% of our total accounts receivable, respectively.
Receivables and Allowance for Doubtful Accounts
Trade accounts receivable are recorded at the invoiced amount and do not bear interest. The allowance for doubtful accounts is our best estimate of the amount of probable credit losses in the existing accounts receivable. We determine the allowance based on historical write-off experience and specific account review. We also review our allowance for doubtful accounts at least quarterly. Past due balances over 90 days are reviewed individually for collectability. All other balances are reviewed on a pooled basis by age of receivable. Account balances are charged off against the allowance when it is probable the receivable will not be recovered. We do not have any off-balance-sheet credit exposure related to its customers.
Consolidated Cash Flows
The following table summarizes our statements of cash flows for the years ended December 31, 2010, 2009 and 2008 (in thousands):
| Year Ended December 31, | ||||||||||||
| 2010 | 2009 | 2008 | ||||||||||
| Net cash provided by (used in): |
||||||||||||
| Operating activities |
$ | 29,511 | $ | 9,329 | $ | 25,125 | ||||||
| Investing activities |
(11,011 | ) | (9,449 | ) | (11,495 | ) | ||||||
| Financing activities |
(9,691 | ) | (294 | ) | (14,692 | ) | ||||||
| Effect of exchange rates on cash |
146 | (275 | ) | 698 | ||||||||
| Net change in cash and cash equivalents |
$ | 8,955 | $ | (689 | ) | $ | (364 | ) | ||||
Year Ended December 31, 2010 Compared to the Year Ended December 31, 2009
Net cash provided by operating activities represents net income adjusted for non-cash charges and working capital changes. The $20.2 million increase in net cash provided by operating activities for the year ended December 31, 2010 compared to the year ended December 31, 2009 was primarily due to improved profitability of $19.0 million in 2010 over 2009 and to a lesser extent, a lower net use of cash by the operating assets and liabilities in 2010 compared to 2009.
Net cash used in investing activities for 2010 was $1.6 million higher than 2009 due to (i) increased purchases of machinery and equipment across all facilities of $7.4 million in 2010 off-set by the use of approximately $5.8 million to purchase Coretec in 2009.
The $9.4 million increase in net cash used in financing activities for 2010 compared to 2009 was primarily due to two financing activities: $6.2 million to pay off the borrowings from the revolver credit facility that was assumed upon the acquisition of Coretec at the end of 2009 and required principal payments made on Coretec term debt that was also assumed. The remaining $4.4 million are dividend payments made to common shareholders of record over the last three quarters of 2010. These 2010 payments were partially off-set by $1.5 million in proceeds from the exercise of stock options during 2010.
Year Ended December 31, 2009 Compared to the Year Ended December 31, 2008
Net cash provided by operating activities represents net income adjusted for non-cash charges and working capital changes. The $15.8 million decrease in net cash provided by operating activities for the year ended December 31, 2009 compared to the year ended December 31, 2008 was primarily due to a decrease in operating income after the non-cash goodwill impairment charge is excluded from operating income for the year ended December 31, 2008 and a decrease in accounts payable as a result of the timing of payments made, offset by decreases in depreciation expense, intangible asset amortization and income taxes payable and a decrease in accrued expenses.
32
Table of Contents
The $2.0 million decrease in net cash used in investing activities for the year ended December 31, 2009 compared to the year ended December 31, 2008 was due to a decrease in capital equipment investments in 2009, offset by our acquisition of Coretec.
The $14.4 million decrease in net cash used in financing activities for the year ended December 31, 2009 compared to the year ended December 31, 2008 was due to repurchases of our common stock totaling $14.4 million during 2008 compared with no repurchases during 2009.
Contractual Obligations
The following table shows our material contractual obligations and commitments as of December 31, 2010 (in thousands):
| Payments Due by Period | ||||||||||||||||||||
| Commitments |
Total | Less Than One Year |
One to Three Years |
Three to Five Years |
More Than Five Years |
|||||||||||||||
| Long-term debt (a) |
$ | 16,580 | $ | 2,301 | $ | 2,995 | $ | 2,537 | $ | 8,747 | ||||||||||
| Operating leases |
8,814 | 3,955 | 2,915 | 1,944 | — | |||||||||||||||
| Total commitments (b) |
$ | 25,394 | $ | 6,243 | $ | 5,910 | $ | 4,481 | $ | 8,760 | ||||||||||
| (a) | Long-term debt consists of mortgage obligations and term notes acquired in connection with the purchase of Sovereign in 2006 and Coretec in 2009. In calculating future payments due by period, we used the interest rates in effect for the mortgages and term notes at December 31, 2010. |
| (b) | As of December 31, 2010, we have recorded tax reserves for tax contingencies of approximately $0.4 million. We are unable to make a reasonable estimate regarding the settlement of these tax contingencies, and as such, these contingencies have been excluded from the table. See Note 11 of the Notes to Consolidated Financial Statements—Income Tax Matters for a discussion of tax contingencies. |
Recent Accounting Pronouncements
In January 2010, the Financial Accounting Standards Board (“FASB”) issued Accounting Standards Update (“ASU”) No. 2010-06, “Fair Value Measurements and Disclosures (Topic 820) – Improving Disclosures about Fair Value Measurements”. ASU 2010-06 amends the fair value disclosure guidance to include new disclosures and changes to clarify existing disclosure requirements. These amended standards require disclosures about inputs and valuation techniques used to measure fair value as well as disclosures about significant transfers, beginning in the first quarter of 2010. Additionally, these amended standards require presentation of disaggregated activity within the reconciliation for fair value measurements using significant unobservable inputs (Level 3), beginning in the first quarter of 2011. The adoption of these new standards did not materially impact the Company’s consolidated financial statements.
Off-Balance Sheet Arrangements
We do not have any off-balance sheet arrangements that have or are reasonably likely to have a material current or future effect on our financial condition, changes in financial condition, revenues or expenses, results of operations, liquidity, capital expenditures or capital resources.
| Item 7A. | Quantitative and Qualitative Disclosures About Market Risk. |
Interest Rate Risk
Variable Rate Debt
In connection with our acquisitions of Sovereign and Coretec, we assumed variable-rate debt including notes payable and mortgages previously used to finance the purchase of certain real estate holdings, infrastructure or plant and equipment. The interest rates on our variable rate debt are tied to various floating base rates as such as the London Interbank Offered Rate (“LIBOR”). These debt obligations, therefore, expose us to variability in interest payments due to changes in these rates. If interest rates increase, interest expense increases. Conversely, if interest rates decrease, interest expense decreases.
Our variable-rate notes payable and variable rate mortgages subject us to market risk exposure. At December 31, 2010, we had $11.5 million outstanding under such agreements at interest rates ranging from 1.76% to 7.55% per annum. A 10% increase in interest rates would increase annual interest expense by approximately $0.1 million based on amounts outstanding at December 31, 2010.
33
Table of Contents
Fixed Rate Debt
The fair market value of our one long-term fixed interest rate mortgage assumed in connection with our acquisition of Coretec is subject to interest rate risk. If interest rates fall, we will be locked into paying above-market interest rates on our fixed-rate mortgages unless we can refinance at more advantageous rates. Conversely, if interest rates rise we may benefit from paying below-market interest rates on our fixed-rate mortgages. The interest rate changes affect the fair market value but do not impact earnings or cash flows.
Foreign Currency Exchange Risk
A portion of the sales and expenses of our Canadian operations are transacted in Canadian dollars, which is deemed to be the functional currency for our Canadian entities. Thus, assets and liabilities are translated to U.S. dollars at period end exchange rates in effect. Sales and expenses are translated to U.S. dollars using an average monthly exchange rate. Translation adjustments are included in accumulated other comprehensive income in stockholders’ equity, except for translation adjustments related to an intercompany note denominated in Canadian dollars between our U.S. entity and our Canadian entities. Settlement of the note is planned in the foreseeable future; therefore currency adjustments are included in determining net income (loss) for the period, and could have a material impact on results of operations and cash flows in the event of significant currency fluctuations. Gains and losses on foreign currency transactions are included in operations. We have foreign currency translation risk equal to our net investment in those operations. We do not use forward exchange contracts to hedge exposures to foreign currency denominated transactions and do not utilize any other derivative financial instruments for trading or speculative purposes.
34
Table of Contents
| Item 8. | Financial Statements and Supplementary Data. |
Quarterly Financial Information
Quarterly financial information is set forth in Part II of this report under “Item 7. Management’s Discussion and Analysis of Financial Condition and Results of Operations — Quarterly Financial Information,” and is incorporated herein by reference.
35
Table of Contents
REPORT OF INDEPENDENT REGISTERED PUBLIC ACCOUNTING FIRM
To the Board of Directors and
Stockholders of DDi Corp. and Subsidiaries
We have audited the accompanying consolidated balance sheets of DDi Corp. and subsidiaries (the Company) as of December 31, 2010 and 2009 and the related consolidated statements of operations, comprehensive income (loss), stockholders’ equity, and cash flows for the years then ended. Our audit of the basic financial statements included the financial statement Schedule II listed in the index appearing under Item 15(a)2. These consolidated financial statements and financial statement schedule are the responsibility of the Company’s management. Our responsibility is to express an opinion on these consolidated financial statements and financial statement schedule based on our audits.
We conducted our audits in accordance with the standards of the Public Company Accounting Oversight Board (United States). Those standards require that we plan and perform the audit to obtain reasonable assurance about whether the financial statements are free of material misstatement. An audit includes examining, on a test basis, evidence supporting the amounts and disclosures in the financial statements. An audit also includes assessing the accounting principles used and significant estimates made by management, as well as evaluating the overall financial statement presentation. We believe that our audits provide a reasonable basis for our opinion.
In our opinion, the consolidated financial statements referred to above present fairly, in all material respects, the financial position of DDi Corp. and subsidiaries as of December 31, 2010 and 2009, and the results of their operations and their cash flows for the years then ended in conformity with accounting principles generally accepted in the United States of America. Also in our opinion, the related financial statement Schedule II, when considered in relation to the basic consolidated financial statements taken as a whole, presents fairly, in all material respects, the information set forth therein.
We also have audited, in accordance with the standards of the Public Company Accounting Oversight Board (United States), DDi Corp. and subsidiaries’ internal control over financial reporting as of December 31, 2010, based on criteria established in Internal Control—Integrated Framework issued by the Committee of Sponsoring Organizations of the Treadway Commission and our report dated February 22, 2011 expressed an unqualified opinion on the effectiveness of internal control over financial reporting.
| /s/ Grant Thornton LLP |
| Irvine, California |
| February 22, 2011 |
36
Table of Contents
REPORT OF INDEPENDENT REGISTERED PUBLIC ACCOUNTING FIRM
To the Board of Directors and
Stockholders of DDi Corp. and Subsidiaries
We have audited DDi Corp. and subsidiaries’ internal control over financial reporting as of December 31, 2010, based on criteria established in Internal Control—Integrated Framework issued by the Committee of Sponsoring Organizations of the Treadway Commission (COSO). DDi Corp. and subsidiaries’ management is responsible for maintaining effective internal control over financial reporting and for its assessment of the effectiveness of internal control over financial reporting, included in the accompanying Management’s Report on Internal Control Over Financial Reporting. Our responsibility is to express an opinion on DDi Corp. and subsidiaries’ internal control over financial reporting based on our audit. We conducted our audit in accordance with the standards of the Public Company Accounting Oversight Board (United States). Those standards require that we plan and perform the audit to obtain reasonable assurance about whether effective internal control over financial reporting was maintained in all material respects. Our audit included obtaining an understanding of internal control over financial reporting, assessing the risk that a material weakness exists, testing and evaluating the design and operating effectiveness of internal control based on the assessed risk, and performing such other procedures as we considered necessary in the circumstances. We believe that our audit provides a reasonable basis for our opinion.
A company’s internal control over financial reporting is a process designed to provide reasonable assurance regarding the reliability of financial reporting and the preparation of financial statements for external purposes in accordance with generally accepted accounting principles. A company’s internal control over financial reporting includes those policies and procedures that (1) pertain to the maintenance of records that, in reasonable detail, accurately and fairly reflect the transactions and dispositions of the assets of the company; (2) provide reasonable assurance that transactions are recorded as necessary to permit preparation of financial statements in accordance with generally accepted accounting principles, and that receipts and expenditures of the company are being made only in accordance with authorizations of management and directors of the company; and (3) provide reasonable assurance regarding prevention or timely detection of unauthorized acquisition, use, or disposition of the company’s assets that could have a material effect on the financial statements.
Because of its inherent limitations, internal control over financial reporting may not prevent or detect misstatements. Also, projections of any evaluation of effectiveness to future periods are subject to the risk that controls may become inadequate because of changes in conditions, or that the degree of compliance with the policies or procedures may deteriorate.
In our opinion, DDi Corp. and subsidiaries maintained, in all material respects, effective internal control over financial reporting as of December 31, 2010, based on criteria established in Internal Control—Integrated Framework issued by COSO.
We also have audited, in accordance with the standards of the Public Company Accounting Oversight Board (United States), the consolidated balance sheets of DDi Corp. and subsidiaries as of December 31, 2010 and 2009, and the related consolidated statements of operations, comprehensive income (loss), stockholders’ equity, and cash flows for the years then ended and our report dated February 22, 2011 expressed an unqualified opinion on those consolidated financial statements.
| /s/ Grant Thornton LLP |
| Irvine, California |
| February 22, 2011 |
37
Table of Contents
REPORT OF INDEPENDENT REGISTERED PUBLIC ACCOUNTING FIRM
To the Board of Directors and
Stockholders of DDi Corp.:
In our opinion, the consolidated balance sheet as of December 31, 2008 and the related consolidated statements of operations, of comprehensive income (loss), of stockholders’ equity and of cash flows for the year ended December 31, 2008 present fairly, in all material respects, the financial position of DDi Corp. and its subsidiaries at December 31, 2008, and the results of their operations and their cash flows for the year ended December 31, 2008, in conformity with accounting principles generally accepted in the United States of America. In addition, in our opinion, the financial statement schedule for the year ended December 31, 2008 listed in the index appearing under Item 15(a)(2) presents fairly, in all material respects, the information set forth therein when read in conjunction with the related consolidated financial statements. These financial statements and financial statement schedule are the responsibility of the Company’s management. Our responsibility is to express an opinion on these financial statements and financial statement schedule based on our audit. We conducted our audit of these statements in accordance with the standards of the Public Company Accounting Oversight Board (United States). Those standards require that we plan and perform the audit to obtain reasonable assurance about whether the financial statements are free of material misstatement. An audit includes examining, on a test basis, evidence supporting the amounts and disclosures in the financial statements, assessing the accounting principles used and significant estimates made by management, and evaluating the overall financial statement presentation. We believe that our audit provide a reasonable basis for our opinion.
/s/ PricewaterhouseCoopers LLP
Irvine, California
February 22, 2011
38
Table of Contents
CONSOLIDATED BALANCE SHEETS
(In thousands, except per share amounts)
| As of December 31, | ||||||||
| 2010 | 2009 | |||||||
| ASSETS | ||||||||
| Current assets: |
||||||||
| Cash and cash equivalents |
$ | 28,347 | $ | 19,392 | ||||
| Accounts receivable, net |
40,821 | 35,280 | ||||||
| Inventories |
20,970 | 19,342 | ||||||
| Prepaid expenses and other current assets |
1,889 | 1,265 | ||||||
| Total current assets |
92,027 | 75,279 | ||||||
| Property, plant and equipment, net |
42,605 | 40,175 | ||||||
| Intangible assets, net |
614 | 1,374 | ||||||
| Goodwill |
3,664 | 2,986 | ||||||
| Other assets |
954 | 659 | ||||||
| Total assets |
$ | 139,864 | $ | 120,473 | ||||
| LIABILITIES AND STOCKHOLDERS’ EQUITY | ||||||||
| Current liabilities: |
||||||||
| Revolving credit facility |
$ | — | $ | 4,227 | ||||
| Current maturities of long-term debt |
1,751 | 1,727 | ||||||
| Accounts payable |
25,137 | 13,939 | ||||||
| Accrued expenses and other current liabilities |
13,802 | 17,242 | ||||||
| Income taxes payable |
311 | 1,974 | ||||||
| Total current liabilities |
41,001 | 39,109 | ||||||
| Long-term debt |
9,704 | 11,246 | ||||||
| Other long-term liabilities |
527 | 810 | ||||||
| Total liabilities |
51,232 | 51,165 | ||||||
| Commitments and contingencies (Note 15) |
||||||||
| Stockholders’ equity: |
||||||||
| Common stock — $0.001 par value, 190,000 shares authorized, 23,129 and 20,182 shares issued and outstanding, respectively, at December 31, 2010 and 22,803 and 19,856 shares issued and outstanding, respectively, at December 31, 2009 |
23 | 23 | ||||||
| Additional paid-in-capital |
245,181 | 247,245 | ||||||
| Treasury stock, at cost — 2,947 shares held in treasury at December 31, 2010 and 2009 |
(16,323 | ) | (16,323 | ) | ||||
| Accumulated other comprehensive income |
1,063 | 410 | ||||||
| Accumulated deficit |
(141,312 | ) | (162,047 | ) | ||||
| Total stockholders’ equity |
88,632 | 69,308 | ||||||
| Total liabilities and stockholders’ equity |
$ | 139,864 | $ | 120,473 | ||||
The accompanying notes are an integral part of these consolidated financial statements
39
Table of Contents
CONSOLIDATED STATEMENTS OF OPERATIONS
(In thousands, except per share amounts)
| Year Ended December 31, | ||||||||||||
| 2010 | 2009 | 2008 | ||||||||||
| Net sales |
$ | 267,784 | $ | 157,991 | $ | 190,842 | ||||||
| Cost of goods sold |
208,385 | 128,778 | 152,058 | |||||||||
| Gross profit |
59,399 | 29,213 | 38,784 | |||||||||
| Operating expenses: |
||||||||||||
| Sales and marketing |
17,372 | 11,710 | 12,540 | |||||||||
| General and administrative |
16,688 | 13,329 | 14,004 | |||||||||
| Amortization of intangible assets |
760 | 760 | 4,975 | |||||||||
| Restructuring and other related charges |
1,138 | — | 295 | |||||||||
| Goodwill impairment |
— | — | 38,898 | |||||||||
| Operating income (loss) |
23,441 | 3,414 | (31,928 | ) | ||||||||
| Non-operating (income) expense: |
||||||||||||
| Interest expense |
1,457 | 813 | 502 | |||||||||
| Interest income |
(36 | ) | (189 | ) | (131 | ) | ||||||
| Other expense (income), net |
489 | 318 | (562 | ) | ||||||||
| Income (loss) before income tax expense |
21,531 | 2,472 | (31,737 | ) | ||||||||
| Income tax expense |
796 | 688 | 1,702 | |||||||||
| Net income (loss) |
$ | 20,735 | $ | 1,784 | $ | (33,439 | ) | |||||
| Net income (loss) per share: |
||||||||||||
| Basic |
$ | 1.04 | $ | 0.09 | $ | (1.60 | ) | |||||
| Diluted |
$ | 1.01 | $ | 0.09 | $ | (1.60 | ) | |||||
| Dividends declared per share |
$ | 0.22 | — | — | ||||||||
| Weighted-average shares used in per share computations: |
||||||||||||
| Basic |
19,920 | 19,732 | 20,961 | |||||||||
| Diluted |
20,573 | 19,838 | 20,961 | |||||||||
The accompanying notes are an integral part of these consolidated financial statements.
40
Table of Contents
CONSOLIDATED STATEMENTS OF COMPREHENSIVE INCOME (LOSS)
(In thousands)
| Year Ended December 31, | ||||||||||||
| 2010 | 2009 | 2008 | ||||||||||
| Net income (loss) |
$ | 20,735 | $ | 1,784 | $ | (33,439 | ) | |||||
| Other comprehensive income (loss): |
||||||||||||
| Foreign currency translation adjustments |
653 | 764 | (825 | ) | ||||||||
| Comprehensive income (loss) |
$ | 21,388 | $ | 2,548 | $ | (34,264 | ) | |||||
The accompanying notes are an integral part of these consolidated financial statements.
41
Table of Contents
CONSOLIDATED STATEMENTS OF STOCKHOLDERS’ EQUITY
(In thousands)
| Common Stock Outstanding |
Additional Paid-In Capital |
Treasury Stock Amount |
Accumulated Other Comprehensive Income (Loss) |
Accumulated Deficit |
Total | |||||||||||||||||||||||
| Shares | Amount | |||||||||||||||||||||||||||
| Balance, December 31, 2007 |
22,442 | $ | 23 | $ | 242,938 | $ | (1,875 | ) | $ | 471 | $ | (130,392 | ) | $ | 111,165 | |||||||||||||
| Stock-based compensation expense |
— | — | 2,651 | — | — | — | 2,651 | |||||||||||||||||||||
| Unvested restricted stock cancellations |
(8 | ) | — | — | — | — | — | — | ||||||||||||||||||||
| Repurchases of common stock |
(2,643 | ) | — | — | (14,448 | ) | — | — | (14,448 | ) | ||||||||||||||||||
| Foreign currency translation adjustment |
— | — | — | — | (825 | ) | — | (825 | ) | |||||||||||||||||||
| Net loss |
— | — | — | — | — | (33,439 | ) | (33,439 | ) | |||||||||||||||||||
| Balance, December 31, 2008 |
19,791 | $ | 23 | $ | 245,589 | $ | (16,323 | ) | $ | (354 | ) | $ | (163,831 | ) | $ | 65,104 | ||||||||||||
| Stock-based compensation expense |
— | — | 1,907 | — | — | — | 1,907 | |||||||||||||||||||||
| Unvested restricted stock cancellations |
(6 | ) | — | — | — | — | — | — | ||||||||||||||||||||
| Tax shares equivalent for restricted stock release |
(14 | ) | — | (251 | ) | — | — | — | (251 | ) | ||||||||||||||||||
| Issuance of restricted stock |
85 | — | — | — | — | — | — | |||||||||||||||||||||
| Foreign currency translation adjustment |
— | — | — | — | 764 | — | 764 | |||||||||||||||||||||
| Net income |
— | — | — | — | — | 1,784 | 1,784 | |||||||||||||||||||||
| Balance, December 31, 2009 |
19,856 | $ | 23 | $ | 247,245 | $ | (16,323 | ) | $ | 410 | $ | (162,047 | ) | $ | 69,308 | |||||||||||||
| Stock based compensation expense |
— | — | 1,309 | — | — | — | 1,309 | |||||||||||||||||||||
| Tax shares equivalent for restricted stock release |
(12 | ) | — | (515 | ) | — | — | — | (515 | ) | ||||||||||||||||||
| Dividends declared to common shareholders |
— | (4,411 | ) | — | — | — | (4,411 | ) | ||||||||||||||||||||
| Issuance of common stock upon exercise of stock options |
263 | — | 1,553 | — | — | — | 1,553 | |||||||||||||||||||||
| Issuance of restricted stock |
75 | — | — | — | — | — | — | |||||||||||||||||||||
| Foreign currency translation adjustment |
— | — | — | — | 653 | — | 653 | |||||||||||||||||||||
| Net income |
— | — | — | — | — | 20,735 | 20,735 | |||||||||||||||||||||
| Balance, December 31, 2010 |
20,182 | $ | 23 | $ | 245,181 | $ | (16,323 | ) | $ | 1,063 | $ | (141,312 | ) | $ | 88,632 | |||||||||||||
The accompanying notes are an integral part of these consolidated financial statements.
42
Table of Contents
CONSOLIDATED STATEMENTS OF CASH FLOWS
(In thousands)
| Year Ended December 31, | ||||||||||||
| 2010 | 2009 | 2008 | ||||||||||
| CASH FLOWS FROM OPERATING ACTIVITIES: |
||||||||||||
| Net income (loss) |
$ | 20,735 | $ | 1,784 | $ | (33,439 | ) | |||||
| Adjustments to reconcile net income (loss) to net cash provided by operating activities: |
||||||||||||
| Depreciation |
8,539 | 8,237 | 11,119 | |||||||||
| Amortization of intangible assets |
760 | 760 | 4,975 | |||||||||
| Amortization of debt issuance costs and discount |
60 | 130 | 103 | |||||||||
| Amortization of deferred lease liability |
(457 | ) | 469 | 535 | ||||||||
| Goodwill impairment |
— | — | 38,898 | |||||||||
| Non-cash stock-based compensation |
1,309 | 1,907 | 2,651 | |||||||||
| Other |
(116 | ) | (148 | ) | 460 | |||||||
| Change in operating assets and liabilities, (net of acquisitions and disposals): |
||||||||||||
| Accounts receivable |
(4,903 | ) | 621 | (273 | ) | |||||||
| Inventories |
(1,767 | ) | (316 | ) | (582 | ) | ||||||
| Prepaid expenses and other assets |
(253 | ) | 69 | (31 | ) | |||||||
| Accounts payable |
10,906 | (805 | ) | 1,255 | ||||||||
| Accrued expenses and other liabilities |
(4,076 | ) | (2,293 | ) | (970 | ) | ||||||
| Income taxes payable |
(1,226 | ) | (1,086 | ) | 424 | |||||||
| Net cash provided by operating activities |
29,511 | 9,329 | 25,125 | |||||||||
| CASH FLOWS FROM INVESTING ACTIVITIES: |
||||||||||||
| Purchases of property and equipment |
(11,011 | ) | (3,649 | ) | (11,495 | ) | ||||||
| Acquisition of Coretec Inc., net of cash acquired of $880 |
— | (5,800 | ) | — | ||||||||
| Net cash used in investing activities |
(11,011 | ) | (9,449 | ) | (11,495 | ) | ||||||
| CASH FLOWS FROM FINANCING ACTIVITIES: |
||||||||||||
| Payments on long-term debt |
(1,871 | ) | (244 | ) | (244 | ) | ||||||
| Payments of borrowings from revolving line of credit |
(4,290 | ) | — | — | ||||||||
| Payments of debt issuance costs |
(672 | ) | (50 | ) | — | |||||||
| Repurchases of common stock including commissions |
— | — | (14,448 | ) | ||||||||
| Cash dividend payments to common shareholders |
(4,411 | ) | — | — | ||||||||
| Proceeds from exercise of stock options |
1,553 | — | — | |||||||||
| Net cash used in financing activities |
(9,691 | ) | (294 | ) | (14,692 | ) | ||||||
| Effect of exchange rate changes on cash and cash equivalents |
146 | (275 | ) | 698 | ||||||||
| Net (decrease) increase in cash and cash equivalents |
8,955 | (689 | ) | (364 | ) | |||||||
| Cash and cash equivalents, beginning of period |
19,392 | 20,081 | 20,445 | |||||||||
| Cash and cash equivalents, end of period |
$ | 28,347 | $ | 19,392 | $ | 20,081 | ||||||
The accompanying notes are an integral part of these consolidated financial statements
43
Table of Contents
NOTES TO CONSOLIDATED FINANCIAL STATEMENTS
1. DESCRIPTION OF BUSINESS
The consolidated financial statements include the accounts of DDi Corp. and its wholly-owned subsidiaries. Collectively, DDi Corp. and its subsidiaries are referred to as the “Company” or “DDi.” DDi is a leading provider of time-critical, technologically-advanced printed circuit board (“PCB”) engineering and manufacturing services. The Company specializes in engineering and fabricating complex multi-layer PCBs on a quick-turn basis, with lead times as short as 24 hours. DDi has over 1,000 PCB customers in various market segments including communications and computing, military and aerospace, industrial electronics, instrumentation, medical and high-durability commercial markets. The Company’s engineering capabilities and manufacturing facilities located in the United States and Canada, together with its suppliers in Asia, enable it to respond to time-critical orders and technology challenges for its customers. DDi operates primarily in one geographical area, North America.
On December 31, 2009, the Company completed the acquisition of Coretec Inc. (“Coretec”), a publicly-held PCB manufacturer headquartered in Toronto, Ontario, which was previously a publicly-traded company listed on the Toronto Stock Exchange. See Note 3 – Acquisition of Coretec Inc.
On October 23, 2006, the Company completed the acquisition of Sovereign Circuits, Inc. (“Sovereign”) a privately-held PCB manufacturer in North Jackson, Ohio. See Note 5 – Goodwill and Intangible Assets.
2. SIGNIFICANT ACCOUNTING POLICIES
Principles of Consolidation
The consolidated financial statements include the accounts of the Company and its wholly-owned subsidiaries. All inter-company accounts and transactions have been eliminated in consolidation.
Management Estimates
The preparation of the Company’s consolidated financial statements, in accordance with accounting principles generally accepted in the United States of America, requires the Company to make estimates and judgments that affect the reported amount of assets and liabilities and disclosure of contingent assets and liabilities at the date of the financial statements and the reported amount of revenues and expenses for each period. The Company bases its estimates on historical experience and on various other assumptions that are believed to be reasonable under the circumstances, the results of which form the basis for making judgments about the carrying values of assets and liabilities that are not readily apparent from other sources. Actual results may differ from these estimates under different assumptions or conditions.
Fair Value of Financial Instruments
The fair value of financial instruments including cash, cash equivalents, accounts receivable, accounts payable, accrued liabilities and fixed and variable rate debt approximate book value as of December 31, 2010 and 2009.
Cash and Cash Equivalents
Management defines cash and cash equivalents as highly liquid deposits with original maturities of 90 days or less when purchased. The Company maintains cash and cash equivalents balances at certain financial institutions in excess of amounts insured by federal agencies. Management does not believe this concentration subjects it to any unusual financial risk beyond the normal risk associated with commercial banking relationships.
Revenue Recognition
The Company’s revenue consists primarily of the sale of PCBs using customer supplied engineering and design plans. Revenue from the sale of products is recognized when title and risk of loss has passed to the customer, typically at the time of shipment, persuasive evidence of an arrangement exists, including a fixed price, and collectability is reasonably assured. The Company does not have customer acceptance provisions, but it does provide customers a limited right of return for defective PCBs.
Shipping and handling fees billed to customers are included in net sales. The related freight costs and supplies are included as a component of cost of goods sold.
44
Table of Contents
DDi CORP.
NOTES TO CONSOLIDATED FINANCIAL STATEMENTS
The Company accrues warranty expense, which is included in cost of goods sold, at the time revenue is recognized for estimated future warranty obligations related to defective PCBs at the time of shipment, based upon the relationship between historical sales volumes and anticipated costs. Factors that affect the warranty liability include the number of units sold, historical and anticipated rates of warranty claims and the estimated cost of repair. The Company assesses the adequacy of the warranty accrual each quarter. To date, actual warranty claims and costs have been in line with the Company’s estimates. The warranty accrual is included in accrued expenses.
The changes in the Company’s warranty reserves were as follows (in thousands):
| Year Ended December 31, | ||||||||||||
| 2010 | 2009 | 2008 | ||||||||||
| Beginning balance |
$ | 1,100 | $ | 805 | $ | 750 | ||||||
| Warranties issued during the period |
6,700 | 4,474 | 4,274 | |||||||||
| Warranty liabilities assumed (1) |
— | 285 | — | |||||||||
| Warranty expenditures |
(6,633 | ) | (4,464 | ) | (4,219 | ) | ||||||
| Ending Balance |
$ | 1,167 | $ | 1,100 | $ | 805 | ||||||
| (1) | Assumed in connection with the Company’s acquisition of Coretec. |
Concentration of Credit Risk
Financial instruments which potentially expose the Company to concentration of credit risk consist principally of trade accounts receivable. To minimize this risk, the Company performs ongoing credit evaluations of customers’ financial condition and maintains relationships with its customers which allow the Company to monitor current changes in business operations so it can respond as needed; the Company, however, generally does not require collateral. In 2010, 2009 and 2008, no individual customer accounted for 10% or more of the Company’s net sales. At December 31, 2010 and 2009, one customer accounted for 8.6% and 6.9% of the Company’s total accounts receivable, respectively.
Receivables and Allowance for Doubtful Accounts
Trade accounts receivable are recorded at the invoiced amount and do not bear interest. The allowance for doubtful accounts is the Company’s best estimate of the amount of probable credit losses in the existing accounts receivable. The Company determines the allowance based on historical write-off experience and specific account review. The Company reviews its allowance for doubtful accounts at least quarterly. Past due balances over 90 days are reviewed individually for collectability. All other balances are reviewed on a pooled basis by age of receivable. Account balances are charged off against the allowance when it is probable the receivable will not be recovered. The Company does not have any off-balance-sheet credit exposure related to its customers.
Inventories
Inventories are stated at the lower of cost (using either a standard cost method which approximates first-in, first-out (FIFO) or an average cost method) or market. Provisions are made to reduce excess and obsolete inventories to their estimated net realizable value based on such factors as age, utilization levels compared to quantities on hand, and actual or foreseeable technological changes.
Property, Plant and Equipment
Property, plant and equipment are capitalized at historical cost and are presented net of accumulated depreciation. Assets purchased in conjunction with acquired subsidiaries are recorded at fair value and depreciated over their remaining useful lives. Depreciation is provided over the estimated useful lives of the assets using the straight-line method for financial reporting purposes. For leasehold improvements, amortization is provided over the shorter of the estimated useful lives of the assets or the remaining lease term and is included in depreciation expense. The depreciable life assigned to the Company’s buildings is 28 years. Machinery, office furniture, equipment and vehicles are each depreciated over three to seven years.
Debt Issuance Costs and Debt Discounts
The Company defers certain debt issuance costs relating to the establishment of its various debt facilities and the issuance of its debt instruments (see Note 6 – Revolving Credit Facilities and Long-Term Debt). These costs are capitalized and amortized over the term of the related indebtedness using the effective interest method or, if not materially different, the straight-line method.
45
Table of Contents
DDi CORP.
NOTES TO CONSOLIDATED FINANCIAL STATEMENTS
Goodwill and Other Long-Lived Assets
Goodwill and other intangible assets with indefinite lives are not subject to amortization, but are tested for impairment annually or whenever events or changes in circumstances indicate that the asset might be impaired. The Company operates in one operating segment and has one reporting unit; therefore, goodwill is tested for impairment at the consolidated level against the fair value of the Company. The fair value of a reporting unit refers to the amount at which the unit as a whole could be bought or sold in a current transaction between willing parties. Quoted market prices in active markets are the best evidence of fair value and are used as the basis on the last day of the year for the measurement, if available. The Company assesses potential impairment on an annual basis on the last day of its third quarter and compares its market capitalization to its carrying amount, including goodwill. A significant decrease in its stock price could indicate a material impairment of goodwill which, after further analysis, could result in a material charge to operations. If goodwill is considered impaired, the impairment loss to be recognized is measured by the amount by which the carrying amount of the goodwill exceeds the implied fair value of that goodwill. Inherent in the Company’s fair value determinations are certain judgments and estimates, including projections of future cash flows, the discount rate reflecting the risk inherent in future cash flows, the interpretation of current economic indicators and market valuations, and strategic plans with regard to operations. A change in these underlying assumptions would cause a change in the results of the tests, which could cause the fair value of the reporting unit to be less than its respective carrying amount.
The Company accounts for long-lived assets, including intangible assets subject to amortization, in accordance with the prescribed authoritative guidance, which requires impairment losses to be recorded on long-lived assets used in operations when indicators of impairment, such as reductions in demand or significant economic slowdowns in the PCB industry, are present. Reviews are performed to determine whether carrying value of an asset is impaired, based on comparisons to undiscounted expected future cash flows. If this comparison indicates that there is impairment, the impaired asset is written down to fair value, which is typically calculated using discounted expected future cash flows utilizing an appropriate discount rate. Impairment is based on the excess of the carrying amount over the fair value of those assets.
Income Taxes
The Company records on its balance sheet deferred tax assets and liabilities for expected future tax consequences of events that have been recognized in different periods for financial statement purposes versus tax return purposes. Management provides a valuation allowance for net deferred tax assets when it is more likely than not that a portion of such net deferred tax assets will not be recovered through future operations.
Comprehensive Income (Loss)
The Comprehensive Income Topic of Financial Accounting Standard board (“FASB”) Accounting Standards Codification (“ASC”) establishes requirements for reporting and disclosure of comprehensive income (loss) and its components. Comprehensive income (loss) for the Company consists of net income (loss) plus the effect of foreign currency translation adjustments.
Foreign Currency
A portion of the sales and expenses of the Company’s Canadian operations are transacted in Canadian dollars, which is deemed to be the functional currency for its Canadian entity. Thus, assets and liabilities are translated to U.S. dollars at period end exchange rates in effect. Sales and expenses are translated to U.S. dollars using an average monthly exchange rate. Translation adjustments are included in accumulated other comprehensive income (loss) in stockholders’ equity, except for translation adjustments related to an intercompany note denominated in Canadian dollars between the Company’s U.S. entity and its Canadian entity. Settlement of the note is planned in the foreseeable future; therefore currency adjustments are included in determining net income (loss) for the period in accordance with the Foreign Currency Matters Topic of FASB ASC and could have a material impact on results of operations and cash flows in the event of significant currency fluctuations. Gains and losses on foreign currency transactions are included in operations. The Company has foreign currency translation risk equal to its net investment in those operations. The Company does not use forward exchange contracts to hedge exposures to foreign currency denominated transactions and does not utilize any other derivative financial instruments for trading or speculative purposes.
Stock-Based Compensation
Effective January 1, 2006, the Company adopted the fair value recognition provisions of the Stock Compensation Topic of FASB ASC (“ASC 718”), using the modified prospective application transition method. Under this transition method, stock-based compensation cost recognized in the year ended December 31, 2008 included: (i) compensation cost for
46
Table of Contents
DDi CORP.
NOTES TO CONSOLIDATED FINANCIAL STATEMENTS
all unvested stock-based awards granted prior to January 1, 2006 based on the grant-date fair value estimated in accordance with the original provisions of SFAS No. 123, “Accounting for Stock-Based Compensation”, and (ii) compensation cost for all stock-based awards granted or modified subsequent to January 1, 2006, based on the grant-date fair value estimated in accordance with the provisions of ASC 718.
Stock-based compensation cost is measured at the grant date based on the fair value of the award and is recognized as expense over the requisite service period, which is the vesting period. The Company uses the Black-Scholes option-pricing model to estimate the fair values of stock options. The Black Scholes option-pricing model requires the input of certain assumptions that require our judgment including the expected term and the expected stock price volatility of the underlying stock options. The assumptions used in calculating the fair value of stock-based compensation represent management’s best estimates, but these estimates involve inherent uncertainties and the application of judgment. As a result, if factors change resulting in the use of different assumptions, stock-based compensation expense could be materially different in the future. In addition, the Company is required to estimate the expected forfeiture rate and only recognize expense for those shares expected to vest. If the actual forfeiture rate is materially different from management’s estimates, the stock-based compensation expense could be significantly different from what the Company has recorded in the current period.
Basic and Diluted Earnings Per Share
The Company reports both basic net income (loss) per share, which is based on the weighted average number of common shares outstanding, and diluted net income (loss) per share, which is based on the weighted average number of common shares outstanding and dilutive potential common shares outstanding.
Advertising Costs
Advertising costs are expensed as incurred. These costs are included in sales and marketing expense in the accompanying consolidated statements of operations. Advertising expense for the years ended December 31, 2010, 2009 and 2008 were $0.07 million, $0.08 million and $0.07 million, respectively.
Taxes Collected from Customers and Remitted to Governmental Authorities
Pursuant to authoritative guidance, the Company’s policy is to present taxes collected from customers and remitted to governmental authorities on a net basis.
Segment Reporting
The Segment Reporting Topic of FASB ASC established standards for reporting information about operating segments in annual financial statements and requires selected information about operating segments in interim financial reports issued to stockholders. It also established standards for related disclosures about products and services, geographic areas and major customers. Operating segments are defined as a component of an enterprise that engages in business activities from which it may earn revenues and incur expenses, whose separate financial information is available and is evaluated regularly by the Company’s chief operating decision makers, or decision making group, to perform resource allocations and performance assessments.
The Company’s chief operating decision maker is the Chief Executive Officer. Based on the evaluation of the Company’s financial information, management believes that the Company operates in one reportable segment which develops and manufactures multi-layer PCBs. The Company operates in one geographical area, North America. Revenues are attributed to the country in which the customer buying the product is located.
The following summarizes revenues by customer location (in thousands):
| Year Ended December 31, | ||||||||||||
| 2010 | 2009 | 2008 | ||||||||||
| Net sales: |
||||||||||||
| North America (1) |
$ | 238,541 | $ | 144,921 | $ | 174,776 | ||||||
| Asia |
24,355 | 10,583 | 13,822 | |||||||||
| Other |
4,888 | 2,487 | 2,244 | |||||||||
| Total |
$ | 267,784 | $ | 157,991 | $ | 190,842 | ||||||
| (1) | Sales to the United States represent the majority of sales to North America. |
47
Table of Contents
DDi CORP.
NOTES TO CONSOLIDATED FINANCIAL STATEMENTS
The following summarizes long-lived assets by location (in thousands):
| As of December 31, | ||||||||
| 2010 | 2009 | |||||||
| Long-lived assets: |
||||||||
| United States |
$ | 26,542 | $ | 26,341 | ||||
| Canada |
16,063 | 13,834 | ||||||
| Total |
$ | 42,605 | $ | 40,175 | ||||
Recent Accounting Pronouncements
In January 2010, the Financial Accounting Standards Board (“FASB”) issued Accounting Standards Update (“ASU”) No. 2010-06, “Fair Value Measurements and Disclosures (Topic 820) – Improving Disclosures about Fair Value Measurements”. ASU 2010-06 amends the fair value disclosure guidance to include new disclosures and changes to clarify existing disclosure requirements. These amended standards require disclosures about inputs and valuation techniques used to measure fair value as well as disclosures about significant transfers, beginning in the first quarter of 2010. Additionally, these amended standards require presentation of disaggregated activity within the reconciliation for fair value measurements using significant unobservable inputs (Level 3), beginning in the first quarter of 2011. The adoption of these new standards did not materially impact the Company’s consolidated financial statements.
In December 2007, the FASB issued ASC Topic 805, Business Combinations (“ASC 805”), which established principles and requirements for the acquirer of a business to recognize and measure in its financial statements the identifiable assets (including in-process research and development and defensive assets) acquired, the liabilities assumed, and any noncontrolling interest in the acquiree. ASC 805 is effective for financial statements issued for fiscal years beginning after December 15, 2008. Prior to the adoption of ASC 805, in-process research and development costs were immediately expensed and acquisition costs were capitalized. Under ASC 805 all acquisition costs are expensed as incurred. The standard also provides guidance for recognizing and measuring the goodwill acquired in the business combination and determines what information to disclose to enable users of financial statements to evaluate the nature and financial effects of the business combination. In April 2009, the FASB updated ASC 805 to amend the provisions for the initial recognition and measurement, subsequent measurement and accounting, and disclosures for assets and liabilities arising from contingencies in business combinations. This update also eliminates the distinction between contractual and non-contractual contingencies. The effect of ASC 805 is reflected in the Company’s 2009 consolidated financial statements, as the provisions of ASC 805 were applied in connection with the Company’s acquisition of Coretec. See Note 3 – Acquisition of Coretec Inc.
3. ACQUISITION OF CORETEC INC.
On December 31, 2009, the Company completed the acquisition of all of the issued and outstanding shares of capital stock of Coretec by way of a plan of arrangement under the Business Corporations Act (Ontario) (the “Arrangement”). As a result of the Arrangement, Coretec and its subsidiaries became wholly-owned subsidiaries of the Company. Under the Arrangement, (i) Coretec’s shareholders received CAD $0.38 (USD $0.36) per Coretec common share; and (ii) holders of outstanding Coretec stock options having an exercise price less than CAD $0.38 (USD $0.36) per share received an amount per Coretec stock option equal to the difference between the CAD $0.38 (USD $0.36) and the exercise price in respect of such Coretec stock options. The aggregate cash purchase price paid by the Company under the Arrangement was CAD $7.0 million (USD $6.7 million). In addition, as a result of the Arrangement, DDi effectively assumed approximately CAD $16.7 million (USD $15.9 million) of Coretec debt.
Immediately prior to the acquisition date, the Company owned 515,000 shares of Coretec with an acquisition date fair value of approximately USD $0.2 million. A gain in the amount of approximately USD $0.1 million was recognized by the Company as a result of remeasuring the fair value of this equity interest in Coretec on the acquisition date, and this gain was included in net other expense (income).
The acquisition of Coretec was recorded using the acquisition method of accounting in accordance with the revised authoritative guidance for business combinations. The components of the purchase price are as follows (in thousands):
| Purchase price: |
||||
| Cash |
$ | 6,680 | ||
| Assumption of debt (1) |
15,928 | |||
| Total |
$ | 22,608 | ||
| (1) | See Note 6 – Revolving Credit Facilities and Long-Term Debt |
48
Table of Contents
DDi CORP.
NOTES TO CONSOLIDATED FINANCIAL STATEMENTS
The Company’s primary reasons for this acquisition were to increase its overall production capacity, extend its presence in the military/aerospace and medical markets and strengthen its flex and rigid-flex product capabilities. The significant factors that resulted in goodwill were: (a) the purchase price was based on cash flow and return on capital projections assuming integration with our core business and (b) the calculation of the fair value of tangible assets acquired. The Company did not identify any intangible assets in connection with the acquisition of Coretec.
The purchase price of Coretec was allocated to the assets acquired and liabilities assumed based on their estimated fair values at the acquisition date. The excess of the purchase price over net tangible and identifiable intangible assets (for which there were none in this transaction) was recorded as goodwill. As a result of this acquisition, the Company recorded approximately $3.0 million of goodwill, representing the Company’s entire balance of goodwill as of December 31, 2009. The purchase price allocation used in the preparation of the consolidated financial statements at December 31, 2009 was preliminary due to the continuing analyses relating to the determination of the estimated fair values of the assets acquired and liabilities assumed in the Coretec acquisition. During 2010, the Company’s management finalized the analyses and determined that certain inventory balances as of December 31, 2009 required adjustment to decrease the net balance by $0.4 million, and property, plant and equipment required adjustment to decrease the net balance by $0.3 million which resulted in an increase to goodwill of $0.7 million.
The following table summarizes the estimated fair values of the assets acquired and liabilities assumed at the date of the acquisition (in thousands):
| Allocation of purchase price: |
||||
| Cash |
$ | 880 | ||
| Accounts receivable, net |
9,558 | |||
| Inventories |
4,871 | |||
| Prepaid expenses and other current assets |
571 | |||
| Property, plant and equipment |
16,704 | |||
| Goodwill |
2,986 | |||
| Accounts payable |
(4,317 | ) | ||
| Accrued expenses and other current liabilities |
(8,645 | ) | ||
| Total |
$ | 22,608 | ||
For the year ended December 31, 2009, the Company’s consolidated results of operations include acquisition-related expenses of approximately $0.5 million which are included in general and administrative expenses.
In connection with the acquisition, the Company assumed a liability with an estimated fair value in the amount of approximately $1.3 million representing an accrual of expected future remediation costs to exit a leased Coretec facility in Toronto, Ontario. The Company completed the remediation successfully in August 2010 for $1.3 million.
The following unaudited pro forma financial information for the Company summarizes the results of operations for the periods indicated as if the Coretec acquisition had been completed as of the beginning of the periods presented. This pro forma financial information gives effect to actual operating results prior to the acquisition, but is presented for informational purposes only and does not purport to be indicative of the results of future operations or of the results that would have occurred had the acquisition taken place at the beginning of 2008.
| 2009 | 2008 | |||||||
| (in thousands, except share data) |
||||||||
| Net sales |
$ | 220,096 | $ | 267,352 | ||||
| Net loss |
(5,208 | ) | (32,934 | ) | ||||
| Pro forma net loss per share—basic and diluted |
$ | (0.26 | ) | $ | (1.57 | ) | ||
| Pro forma weighted-average shares—basic and diluted |
19,732 | 20,961 | ||||||
49
Table of Contents
DDi CORP.
NOTES TO CONSOLIDATED FINANCIAL STATEMENTS
4. DETAIL OF CERTAIN ASSET ACCOUNTS
Accounts receivable, net consist of the following (in thousands):
| As of December 31, | ||||||||
| 2010 | 2009 | |||||||
| Accounts receivable |
$ | 41,392 | $ | 36,926 | ||||
| Less: Allowance for doubtful accounts |
(571 | ) | (1,646 | ) | ||||
| $ | 40,821 | $ | 35,280 | |||||
Inventories consist of the following (in thousands):
| As of December 31, | ||||||||
| 2010 | 2009 | |||||||
| Raw materials |
$ | 9,216 | $ | 8,173 | ||||
| Work-in-process |
7,093 | 6,264 | ||||||
| Finished goods |
4,661 | 4,905 | ||||||
| $ | 20,970 | $ | 19,342 | |||||
Property, plant and equipment consist of the following (in thousands):
| As of December 31, | ||||||||
| 2010 | 2009 | |||||||
| Land |
$ | 6,480 | $ | 6,346 | ||||
| Buildings and leasehold improvements |
21,156 | 19,800 | ||||||
| Machinery and equipment |
54,502 | 54,083 | ||||||
| Office furniture and equipment |
8,675 | 8,106 | ||||||
| Vehicles |
133 | 113 | ||||||
| Construction in progress |
7,002 | 2,172 | ||||||
| 97,948 | 90,620 | |||||||
| Less: Accumulated depreciation |
(55,343 | ) | (50,445 | ) | ||||
| $ | 42,605 | $ | 40,175 | |||||
5. GOODWILL AND INTANGIBLE ASSETS
Goodwill
On December 31, 2009, the Company completed the acquisition of all of the issued and outstanding shares of capital stock of Coretec by way of a plan of arrangement under the Business Corporations Act (Ontario) (the “Arrangement”). As a result of the Arrangement, Coretec and its subsidiaries became wholly-owned subsidiaries of the Company. (See Note 3).
During 2010, the Company’s management finalized the analyses relating to the determination of the estimated fair values of the assets acquired and liabilities assumed in the Coretec acquisition, and determined that certain inventory balances as of December 31, 2009 required adjustment to decrease the net balance by $0.4 million, and property, plant and equipment required adjustment to decrease the net balance by $0.3 million which resulted in an increase to goodwill of $0.7 million.
The changes in the carrying amount of goodwill are as follows (in thousands):
| For Year Ended December 31, | ||||||||||||
| 2010 | 2009 | 2008 | ||||||||||
| Beginning balance |
$ | 2,986 | $ | — | $ | 39,006 | ||||||
| Goodwill (including 2010 adjustments) resulting from Coretec acquisition |
678 | 2,986 | — | |||||||||
| Adjustments related to pre-fresh-start accounting tax contingencies and valuation allowances |
— | — | (108 | ) | ||||||||
| Impairment charges |
— | — | (38,898 | ) | ||||||||
| Ending balance |
$ | 3,664 | $ | 2,986 | $ | — | ||||||
50
Table of Contents
DDi CORP.
NOTES TO CONSOLIDATED FINANCIAL STATEMENTS
Annual Goodwill Impairment Test
The Company assesses potential impairment on an annual basis on the last day of its third quarter (prior to December 31, 2009, the Company performed its assessment on the last day of the year) using a two step method. The Company operates in one operating segment and has one reporting unit, and therefore, it tests goodwill for impairment at the consolidated level against the fair value of the Company.
As of December 31, 2008, the Company performed the first step of its impairment test by comparing its market capitalization to its carrying value, including goodwill. Due to a decline in the Company’s stock price and market capitalization during the fourth quarter of 2008 caused by adverse equity market conditions and the general economic environment, the analysis indicated that the Company’s book value was in excess of its fair value. As a result, the Company then performed the second step of the goodwill impairment analysis which involves calculating the implied fair value of its goodwill by allocating the fair value of the Company to all of its assets and liabilities other than goodwill (including both recognized and unrecognized intangible assets) and comparing the residual amount to the carrying value of goodwill. The Company determined that its goodwill was fully impaired and recorded a non-cash goodwill impairment charge to write off the entire carrying value of its goodwill of $38.9 million. The impairment charge had no impact on the Company’s tangible net book value, liquidity or availability under its previous asset-based credit facility.
The goodwill recorded by the Company as of December 31, 2009 resulted from its acquisition of Coretec on that date. As of September 30, 2010 the Company performed the first step of its impairment test by comparing its market capitalization to its carrying value, including goodwill. Market capitalization substantially exceeded the carrying value of the Company, and the value of the goodwill was not impaired.
Intangible Assets
As part of fresh-start accounting, an allocation of the reorganization value in 2003 resulted in identified intangible assets of $23.0 million related to customer relationships. The intangible assets were amortized over their estimated useful life of five years and were fully amortized as of November 2008. The Company further acquired $3.8 million of customer relationships intangible assets in connection with the acquisition of Sovereign which are also being amortized over their estimated useful life of five years. Amortization related to customer relationships for the years ended December 31, 2010, 2009, and 2008 was $0.8 million, $0.8 million, and $5.0 million, respectively.
Identifiable intangible assets consist of the following (in thousands):
| As of December 31, 2010 | As of December 31, 2009 | |||||||||||||||||||||||
| Gross Amount |
Accumulated Amortization |
Net Amount |
Gross Amount |
Accumulated Amortization |
Net Amount |
|||||||||||||||||||
| Customer relationships |
$ | 3,800 | $ | (3,186 | ) | $ | 614 | $ | 26,790 | $ | (25,416 | ) | $ | 1,374 | ||||||||||
Amortization expense for the remaining amortizable life of this asset in 2011 is $0.6 million.
6. REVOLVING CREDIT FACILITIES AND LONG-TERM DEBT
Revolving credit facility and long-term debt obligations consisted of the following (in thousands):
| As of December 31, | ||||||||
| 2010 | 2009 | |||||||
| Revolving credit facility |
$ | — | $ | 4,227 | ||||
| Notes payable |
11,455 | 12,973 | ||||||
| Sub-total |
11,455 | 17,200 | ||||||
| Less: current maturities of notes payable |
(1,751 | ) | (1,727 | ) | ||||
| Less: revolving credit facility |
— | (4,227 | ) | |||||
| Total long-term debt |
$ | 9,704 | $ | 11,246 | ||||
51
Table of Contents
DDi CORP.
NOTES TO CONSOLIDATED FINANCIAL STATEMENTS
Revolving Credit Facility with General Electric Capital Credit
On December 21, 2009, the Company terminated its Amended and Restated Credit Agreement, dated as of March 30, 2007, between the Company, certain of its subsidiaries, and General Electric Capital Credit and the related Canadian credit facility with GE Canada Finance Holding Company (the “Credit Agreements”). The terminations became effective on December 31, 2009 under the terms of the Credit Agreements. The Credit Agreements provided for a revolving unsecured credit facility of up to $25 million with a term of three years from the effective date of March 31, 2007. No borrowings were outstanding under the Credit Agreements at the time of termination, and no penalties resulted from the early terminations.
Coretec Credit Facility
In connection with the acquisition of Coretec on December 31, 2009, the Company assumed the liability for the outstanding balance on Coretec’s revolving credit line with Wells Fargo Canada. The three year, CAD $10 million asset-based lending facility was entered into by Coretec on March 24, 2009 and was to be used for day-to-day working capital and other expenditures. At December 31, 2009, the total outstanding principal and interest owed under the credit line was approximately USD $4.2 million. The Company terminated this credit line effective February 26, 2010 and paid the balance owed of approximately USD $3.1 million on that date in full as well as an additional fee of approximately USD $0.1 million for early termination and legal fees.
DDi Corp. Credit Agreement
On September 23, 2010, we entered into a Credit Agreement with JPMorgan Chase Bank, N.A. (“Chase”), as Administrative Agent and U.S. Lender and JPMorgan Chase Bank, N.A., Toronto Branch (“Chase/Toronto”), as Canadian Administrative Agent and Canadian Lender (the “Credit Agreement”).
The Credit Agreement provides for a revolving credit facility in an aggregate principal amount of $25 million, with a U.S. sub-limit of $25 million and a Canadian sub-limit of $10 million, none of which was drawn on the date of the Credit Agreement. Pursuant to its terms and subject to the conditions set forth therein, the aggregate principal amount of the facility may be increased from $25 to $40 million. The maturity date of the facility is September 23, 2013. Availability under the Credit Agreement is based on various borrowing base tests, including the Company’s eligible accounts receivable and inventories. Our wholly-owned U.S. operating subsidiaries are the borrowers under the U.S. sub-limit and our Canadian subsidiary, DDi Toronto Corp., is the borrower under the Canadian sub-limit.
The borrowings denominated in U.S. dollars bear interest at either (a) 3.25% plus the product (such product, the “Adjusted Libor Rate”) of (i) the rate for dollar deposits with a maturity comparable to the applicable interest period multiplied by (ii) the quotient obtained by dividing (A) 1.0 by (B) 1.0 minus the maximum reserve percentage expressed as a decimal to which Chase is subject for eurocurrency funding; or (b)(i) if such borrowings are made available to the U.S. borrowers, Chase’s prime rate or (ii) if such borrowings are made available to DDi Toronto Corp., the rate of interest announced by Chase/Toronto as its U.S. base rate for dollar-denominated commercial loans; provided that in neither event shall the interest rate for such borrowings be less than the sum of (A) 2.5% plus (B) the Adjusted Libor Rate for a one month interest period (such rate determined as applicable by this clause (b), the “CB Floating Rate”).
The borrowings denominated in Canadian dollars bear interest at either (y) 3.25% plus the sum of (i) the annual rate of interest determined with reference to the arithmetic average of the discount rate quotations of all institutions listed (the “CDOR Rate”) in respect of the relevant interest period for Canadian dollar-denominated bankers’ acceptances plus (ii) 0.10%; or (z) 1.00% plus the greater of (i) Chase/Toronto’s prime rate and (ii) the sum of (Y) the yearly interest rate to which the one-month CDOR Rate is equivalent plus (Z) 1.00%.
Borrowers may choose an interest period of one, two, three or six months. All interest is computed on the basis of a year of 360 days, except that interest computed by reference to the CB Floating Rate shall be computed on the basis of a year of 365 days (or 366 days in a leap year), in each case payable for the actual number of days elapsed. Accrued interest on each loan is payable in arrears on the first day of each calendar quarter for CB Floating Rate borrowings and those based on the Toronto Branch’s prime rate, and, with respect to other borrowings, accrued interest is payable on the last day of the applicable interest period, or if such interest period exceeds three months, then on the three month anniversary of such borrowing and on the last day of such interest period. During the occurrence and continuation of an event of default under the facility, the applicable interest rate may increase by 2% at the election of the administrative agent under the facility or the applicable Required Lenders.
52
Table of Contents
DDi CORP.
NOTES TO CONSOLIDATED FINANCIAL STATEMENTS
The Credit Agreement requires us to comply with customary covenants, including restrictions on incurring additional debt and liens, making acquisitions, our subsidiaries paying dividends to us and our ability to pay dividends or repurchase equity, liquidations, mergers and asset sales, changes in our business as well as incurring capital expenditures in excess of $20 million in any fiscal year. Additional covenants apply only when we have, in addition to other conditions, availability under the Credit Agreement of less than a certain amount. These additional covenants include (i) a requirement that we maintain a fixed charge coverage ratio of greater than 1.1 to 1 and (ii) a limitation that we make no more than $8 million in cash dividend payments and stock repurchases in any 12 month period and no more than $25 million over the term of the facility. As of December 31, 2010, we had no borrowings outstanding under the Credit Agreement and availability under the facility was above the applicable measurement levels.
Interest rates payable under the Credit Agreement will depend on the type of loan and are based on published rates plus an applicable margin. A commitment fee of 0.5% accrues on unused amounts of the commitments under the Credit Agreement. In 2010, the company paid approximately $0.03 million in fees for the unused amounts of the commitments.
All U.S. obligations under the Credit Agreement are guaranteed by us and each of our domestic wholly-owned subsidiaries (the “U.S. Subsidiary Guarantors”). All such obligations and the guarantees of those obligations are secured by (i) all of the capital stock of each of our subsidiaries, except that with respect to DDi Toronto Corp. such security interest is limited to 65% of its capital stock, and (ii) substantially all of our and our subsidiaries’ (other than DDi Toronto Corp.) tangible and intangible assets, other than real property and equipment, pursuant to a Pledge and Security Agreement dated September 23, 2010 (the “U.S. Security Agreement”). The obligations of DDi Toronto Corp. for the Canadian obligations are secured by substantially all of DDi Toronto Corp.’s tangible and intangible assets, other than real property and equipment, pursuant to a Pledge and Security Agreement dated September 23, 2010 (the “Canadian Security Agreement”).
The Company incurred $0.7 million in debt issuance costs in conjunction with this credit facility which will be amortized over the 3 year life of the loan.
Long-Term Debt
Sovereign Long-Term Debt
In April 2007, the Company consolidated two outstanding term loans assumed in the Sovereign acquisition with an aggregate outstanding balance totaling $1.9 million into one term loan collateralized by Sovereign’s real property. The note matures in April 2015, bears interest at LIBOR plus 1.5%, and has monthly payments of approximately $0.02 million plus accrued interest. In connection with this transaction, the lender released its liens on all assets of Sovereign other than the real property. At December 31, 2010, the effective interest rate of the term loan was 1.76% and the principal balance was $1.0 million.
Coretec Long-Term Debt
On December 31, 2009, the Company assumed all of the long-term debt of Coretec in connection with the acquisition. Coretec had six asset-backed term loans as of December 31, 2010, as follows:
Business Development Bank of Canada
There are four existing loans with Business Development Bank of Canada (the “BDC”) – a term loan, an infrastructure loan, an equipment loan and a building loan. The BDC loans are secured by the land and building of the Company’s Sheppard Avenue facility located in Toronto, Ontario, and 25% of the loan balance is guaranteed by the Company, a requirement of the BDC. During the second quarter of 2010, the BDC defined the target available funds coverage ratio to be at 1.5. As of December 31, 2010, the Company was in compliance with all required covenants.
The outstanding term loan had a principal balance of approximately USD $0.5 million and USD $1.1 million as of December 31, 2010 and 2009, respectively. The loan requires monthly principal payments of approximately $0.05 million over the loan term and bears interest, payable monthly, at BDC’s floating base rate less 1.5% (3.50% at December 31, 2010). The term loan matures in December 2011.
The infrastructure loan was provided to finance the completion of the Company’s Sheppard Avenue facility, located in Toronto, Ontario, for expanding infrastructure. The infrastructure loan had a principal balance of approximately USD $4.7 million and $4.8 million as of December 31, 2010 and 2009, respectively, requires monthly principal payments of approximately $0.02 million, and accrues interest at BDC’s floating base rate (5.0% at December 31, 2010). The loan matures in October 2028.
53
Table of Contents
DDi CORP.
NOTES TO CONSOLIDATED FINANCIAL STATEMENTS
The equipment loan had a principal balance of approximately USD $2.1 million and $2.5 million as of December 31, 2010 and 2009, respectively, requires monthly principal payments of approximately $0.04 million, and accrues interest at the 1-month USD $ floating base rate plus 0.6% (4.35% at December 31, 2010). The loan matures in October 2015.
The building loan had a principal balance of approximately USD $0.3 million and USD $0.4 million as of December 31, 2010 and 2009, respectively, requires monthly principal payments of approximately $0.02 million, and accrues interest at BDC’s floating base rate plus 0.25% (5.25% at December 31, 2010). The loan matures in March 2012.
Zions Bank Mortgage
The Company had an existing mortgage with Zions Bank with a principal balance of approximately USD $1.5 million as of December 31, 2010 and 2009, respectively, secured by the land and building of the Company’s Cuyahoga Falls, Ohio facility. The mortgage requires monthly principal and interest payments of approximately $0.01 million, accrues interest at the Federal Home Loan Bank rate plus 2% (6.92% at December 31, 2010), and matures in November 2032.
GE Real Estate Mortgage
The Company had an existing mortgage with GE Real Estate, with a principal balance of approximately USD $1.3 million and USD $1.4 million as of December 31, 2010 and 2009, respectively, secured by the land and building of the Company’s Littleton, Colorado facility. The mortgage requires monthly interest and principal payments of approximately $0.01 million, accrues interest at a fixed rate of 7.55% per annum, and matures in June 2032.
Maturities of long-term debt for the next five years and thereafter are as follows (in thousands):
| Year Ending December 31, |
||||
| 2011 |
$ | 1,751 | ||
| 2012 |
1,051 | |||
| 2013 |
1,004 | |||
| 2014 |
1,009 | |||
| 2015 |
752 | |||
| Thereafter |
5,888 | |||
| Total |
$ | 11,455 | ||
7. DETAIL OF CERTAIN LIABILITY ACCOUNTS
Accrued expenses and other current liabilities consist of the following (in thousands):
| As of December 31, | ||||||||
| 2010 | 2009 | |||||||
| Accrued salaries and related benefits |
$ | 9,536 | $ | 6,213 | ||||
| Facility remediation accrual (1) |
— | 1,334 | ||||||
| Accrued employee severance and stock-based compensation (1) |
— | 2,601 | ||||||
| Current portion of deferred lease liability |
353 | 497 | ||||||
| Accrued warranty expense |
1,167 | 1,100 | ||||||
| Other accrued expenses |
2,746 | 5,497 | ||||||
| $ | 13,802 | $ | 17,242 | |||||
| (1) | Related to Coretec acquisition |
Other long-term liabilities consist of the following (in thousands):
| As of December 31, | ||||||||
| 2010 | 2009 | |||||||
| Long-term portion of deferred lease liability |
$ | — | $ | 312 | ||||
| Income tax-related liabilities |
516 | 498 | ||||||
| Other long-term liabilities |
11 | — | ||||||
| $ | 527 | $ | 810 | |||||
54
Table of Contents
DDi CORP.
NOTES TO CONSOLIDATED FINANCIAL STATEMENTS
Deferred Lease Liability
This represents the excess of actual lease payments due under operating leases over market value of such leases (at net present value) which will be amortized through (a) a reduction of rent expense and (b) a charge to interest expense over the remaining term of the leases. The Company recognized a deferred lease liability of $8.1 million through fresh-start accounting, of which $0.3 million and $0.7 million of the deferred liability remained to be amortized at December 31, 2010 and 2009, respectively. In addition, approximately $0.073 million and $0.12 million of deferred lease liability associated with normal operating leases remained to be amortized at December 31, 2010 and 2009, respectively. Amortization for the years ended December 31, 2010, 2009 and 2008 was $0.4 million, $0.5 million, and $0.5 million, respectively. The non-cash interest expense associated with the deferred lease liability originating from fresh-start accounting was $0.6 million, $0.6 million, and $0.5 million for the years ended December 31, 2010, 2009 and 2008, respectively.
8. STOCKHOLDERS’ EQUITY
Repurchase Program
The Company’s board of directors (the “Board”) previously authorized a common stock repurchase program of up to 3,000,000 shares of the Company’s common stock in the open market at prevailing market prices or in privately-negotiated transactions. In February 2009, the Board amended the stock repurchase program to increase the amount of shares of common stock authorized to be repurchased by up to an additional $10 million worth of shares. The stock repurchase program is subject to applicable legal and regulatory requirements, may be modified or discontinued at any time, and the stock repurchase program may be modified or discontinued at any time. The Company will continue to review the value in repurchasing shares after considering its cash levels and operating needs as well as other uses for its cash that could create greater shareholder value.
No shares were repurchased during the quarter or year ended December 31, 2010 and 2009. As of December 31, 2010, the Company had repurchased a total of 2,946,986 shares since the inception of the program. Shares repurchased are recorded as treasury stock (accounted for under the cost method) and are available for reissuance under our 2005 Stock Incentive Plan or as otherwise determined by the Board.
9. STOCK-BASED COMPENSATION
Stock Options
In 2005, the Company adopted the DDi Corp. 2005 Stock Incentive Plan (the “2005 Plan”). Awards under the 2005 Plan may be made to key employees and directors of DDi whose participation in the 2005 Plan is determined to be in the best interests of the Company by the Compensation Committee of the Board of Directors (the “Compensation Committee”). The 2005 Plan permits the granting of options (both incentive and nonqualified stock options), share appreciation rights, restricted common stock, deferred share units and performance awards. The Company has reserved an aggregate of 3,142,857 shares of its common stock for issuance under the 2005 Plan. Of these shares, 1,071,429 may be made in a form other than stock options and stock appreciation rights. Generally, options granted to employees under the 2005 Plan vest annually over three years from the date of grant in equal installments and have a contractual term of 10 years. Certain of the grants vest on an accelerated basis.
In 2003, the Company adopted the DDi Corp. 2003 Management Equity Incentive Plan (the “2003 Plan”). Stock options granted under the 2003 Plan vest in equal installments, with one-third vesting immediately upon grant, one-third after 18 months and one-third after 36 months. The Company no longer grants options under the 2003 Plan.
In 2003, the Company also adopted the DDi Corp. 2003 Directors Equity Incentive plan (the “2003 Directors Plan”) for non-employee directors of the Company. Stock options granted under the 2003 Directors Plan vest 40% immediately upon approval of grant by stockholders and 20% each year thereafter on December 19 from 2004 through 2006. The Company no longer grants options under the 2003 Directors Plan.
55
Table of Contents
DDi CORP.
NOTES TO CONSOLIDATED FINANCIAL STATEMENTS
The following table summarizes the Company’s stock option activity under all the plans for the year ended December 31, 2010:
| Options Outstanding (in thousands) |
Weighted Average Exercise Price per Option |
Weighted Average Remaining Contractual Life in Years |
Aggregate Intrinsic Value (in thousands) |
|||||||||||||
| Balance as of December 31, 2009 |
2,228 | $ | 8.18 | 6.4 | $ | 227 | ||||||||||
| Granted |
606 | 5.82 | ||||||||||||||
| Exercised |
(263 | ) | 5.90 | 1,095 | ||||||||||||
| Forfeited |
(104 | ) | 7.67 | |||||||||||||
| Balance as of December 31, 2010 |
2,467 | 7.87 | 6.4 | 12,483 | ||||||||||||
| Options exercisable as of December 31, 2010 |
1,854 | 8.56 | 5.5 | 8,802 | ||||||||||||
The aggregate intrinsic value represents the difference between the exercise price of the underlying awards and the quoted price of DDi’s common stock for those awards that have an exercise price below the quoted price at December 31, 2010. The Company had outstanding at December 31, 2010 options to purchase an aggregate of 2,386,424 shares with an exercise price below the quoted price of the Company’s stock resulting in an aggregate intrinsic value of approximately $8.8 million. The aggregate intrinsic value of options exercised in 2010 under the Company’s stock option plans was approximately $1.1 million. No options were exercised in the years ended December 31, 2009 and 2008.
The Company made an estimate of expected forfeitures and recognized compensation costs in 2010 for those equity awards expected to vest. At December 31, 2010, the total compensation cost related to non-vested stock options not yet recognized was $0.8 million, net of estimated forfeitures. This cost will be amortized on a straight-line basis over a weighted-average period of approximately 1.8 years and will be adjusted for subsequent changes in estimated forfeitures.
Determining Stock Option Fair Value
Valuation and Amortization Method — In order to determine the fair value of stock options, we use the Black-Scholes option pricing model and apply the single-option valuation approach to the stock option valuation. In order to determine the fair value of restricted stock awards and restricted stock units we use the closing market price of DDi common stock on the date of grant. We recognize stock-based compensation expense on a straight-line basis over the requisite service period for time-based vesting awards of stock options, restricted stock awards and restricted stock units. Certain of the stock options may vest on an accelerated basis.
Expected Term — The Company’s expected term represents the period that the Company’s stock-based awards are expected to be outstanding and is determined based on historical option exercise patterns of similar awards, the contractual terms and vesting schedules of the stock-based awards and expectations of future employee stock option exercise behavior.
Expected Stock Price Volatility — Beginning January 1, 2006, and until December 31, 2007, the Company determined that the most appropriate indicators of its expected future stock volatility were its own historical volatility, combined with the historical volatility of its two most closely related competitors during the period immediately preceding the Company’s emergence from Chapter 11 bankruptcy in 2003. Beginning January 1, 2008, the Company determined that its own historical volatility alone was the most appropriate indicator of its expected future stock volatility, as four full years of stock trading data was then available.
Expected Dividend Yield — In 2010 the Company began applying an annual dividend rate to calculating the fair value of stock options, determined by dividing the dividends that are expected to be declared by the stock price. Both the future dividend payouts and the future stock price at the time the dividends will be paid are estimated. In 2010, the dividend yield was applied only to options that were granted after the first dividend declaration date. Therefore, the weighted average dividend yield takes into account only those grants.
Risk-Free Interest Rate — The Company uses the implied yield currently available on U.S. Treasury zero-coupon issues with an equivalent remaining term, approximating the expected term of the option, as a risk-free interest rate.
56
Table of Contents
DDi CORP.
NOTES TO CONSOLIDATED FINANCIAL STATEMENTS
Fair Value — The fair value of the Company’s stock options granted to employees for the years ended December 31, 2010, 2009 and 2008 were estimated using the following weighted average assumptions:
| For Year Ended December 31, | ||||||||||||
| 2010 | 2009 | 2008 | ||||||||||
| Expected term (years) |
4 | 4 | 4 | |||||||||
| Expected stock price volatility |
43.6 | % | 47.2 | % | 47.7 | % | ||||||
| Expected dividend yield |
3.4 | % | 0 | % | 0 | % | ||||||
| Risk-free interest rate |
1.93 | % | 1.7 | % | 2.5 | % | ||||||
| Weighted-average fair value per share |
$ | 2.07 | $ | 1.39 | $ | 1.81 | ||||||
Restricted Stock
The Company granted 25,000 and 395,000 restricted stock units (“RSUs”) in 2010 and 2008, respectively, under the 2005 Plan. The Company calculated compensation expense on these shares using the grant date fair market value of its common stock of $4.48 for the 2010 grant and $3.84 for the 2008 grant. At December 31, 2010, the total compensation cost related to non-vested restricted stock awards not yet recognized was $0.4 million, net of estimated forfeitures. This cost will be amortized on a straight-line basis over the remaining weighted-average period of approximately 1.04 years and will be adjusted for subsequent changes in estimated forfeitures.
A summary of the status of the Company’s non-vested restricted shares as of December 31, 2010, and changes during the year ended December 31, 2010 is presented below:
| Non-vested Shares Outstanding (in thousands) |
Weighted Average Grant-Date Fair Value |
|||||||
| Non-vested at January 1, 2010 |
263 | $ | 4.08 | |||||
| Granted |
30 | (a) | 4.37 | |||||
| Vested |
(148 | ) | 5.38 | |||||
| Forfeited |
— | — | ||||||
| Non-vested at December 31, 2010 |
145 | $ | 3.96 | |||||
| (a) | Under the terms of the DDi 2005 Stock Incentive Plan (the “Plan”), the number of shares subject to outstanding Restricted Stock Units (“RSUs”) are adjusted upon the payment of cash dividends. As a result of the dividend declarations on May 11, August 5, and October 19, 2010, the number of shares subject to outstanding RSUs increased by 5,237 shares. |
Stock Compensation Expense
The following table sets forth compensation cost related to stock-based compensation (in thousands):
| For Year Ended December 31, | ||||||||||||
| 2010 | 2009 | 2008 | ||||||||||
| Non-cash compensation expense: |
||||||||||||
| Cost of goods sold |
$ | 440 | $ | 532 | $ | 528 | ||||||
| Sales and marketing expenses |
241 | 362 | 298 | |||||||||
| General and administrative expenses |
628 | 1,013 | 1,825 | |||||||||
| Total non-cash compensation expense |
$ | 1,309 | $ | 1,907 | $ | 2,651 | ||||||
10. RESTRUCTURING AND OTHER RELATED CHARGES
On December 31, 2009, the Company completed the acquisition of all of the issued and outstanding shares of capital stock of Coretec by way of a plan of arrangement under the Business Corporations Act (Ontario) (the “Arrangement”). As a result of the Arrangement, Coretec and its subsidiaries became wholly-owned subsidiaries of the Company. (See Note 3).
In connection with the acquisition, the Company assumed a liability with an estimated fair value in the amount of approximately $1.3 million representing an accrual of expected future remediation costs to exit a leased Coretec facility in Toronto, Ontario. The Company completed the remediation successfully in August 2010 for $1.3 million, the amount of the assumed liability.
57
Table of Contents
DDi CORP.
NOTES TO CONSOLIDATED FINANCIAL STATEMENTS
The acquisition of Coretec presented DDi management with the opportunity to integrate the operations of DDi’s legacy facility in Toronto (McNicoll Avenue) with Coretec’s Toronto facility (Sheppard Avenue) which is expected to substantially reduce fixed overhead costs, eliminate excess capacity, and also take full advantage of the modern Sheppard Avenue manufacturing facility. The project was budgeted for $1.1 million and was completed on time in the fourth quarter as budgeted. These integration costs were composed of estimated site remediation, asset disposals, severance, and other typical integration expenses.
11. INCOME TAX MATTERS
The components of income (loss) before income taxes were as follows (in thousands):
| Year Ended December 31, | ||||||||||||
| 2010 | 2009 | 2008 | ||||||||||
| Domestic |
$ | 15,329 | $ | (620 | ) | $ | (36,353 | ) | ||||
| Foreign |
6,202 | 3,092 | 4,616 | |||||||||
| $ | 21,531 | $ | 2,472 | $ | (31,737 | ) | ||||||
The provision (benefit) for income taxes from continuing operations consisted of the following (in thousands):
| Year Ended December 31, | ||||||||||||
| 2010 | 2009 | 2008 | ||||||||||
| Current: |
||||||||||||
| Federal |
$ | 171 | $ | (113 | ) | $ | 172 | |||||
| State |
72 | (604 | ) | 545 | ||||||||
| Foreign |
553 | 1,379 | 1,010 | |||||||||
| 796 | 662 | 1,727 | ||||||||||
| Deferred: |
||||||||||||
| Foreign |
— | 26 | (25 | ) | ||||||||
| Provision for income taxes from continuing operations |
$ | 796 | $ | 688 | $ | 1,702 | ||||||
Deferred income tax assets and liabilities from continuing operations consist of the following (in thousands):
| As of December 31, | ||||||||
| 2010 | 2009 | |||||||
| Deferred tax assets: |
||||||||
| Net operating loss carryforwards |
$ | 36,427 | $ | 41,220 | ||||
| Tax credits |
14,289 | 11,421 | ||||||
| Accrued liabilities |
1,702 | 1,298 | ||||||
| Capitalized research and development costs |
2,277 | 3,142 | ||||||
| Property, plant and equipment |
2,931 | 3,276 | ||||||
| Other |
4,631 | 4,222 | ||||||
| 62,257 | 64,579 | |||||||
| Deferred tax liabilities: |
||||||||
| Intangible assets |
(225 | ) | (92 | ) | ||||
| Valuation allowance |
(62,032 | ) | (64,267 | ) | ||||
| Net deferred tax assets from continuing operations |
$ | — | $ | 220 | ||||
Deferred tax assets and liabilities are based on management’s best estimate of the ultimate realization of the tax benefits. Management will continually evaluate these matters.
Based upon the substantial net operating loss carryovers and current economic conditions that could impact future operating results, management concluded that it is more likely than not that all or substantially all of the deferred tax assets at December 31, 2010 may not be realized. Consequently, the Company established a valuation allowance for all of its deferred tax assets at December 31, 2010 including the deferred tax assets related to its Canadian Company. In addition, the Company expects to provide a full valuation allowance on future tax benefits realized in the United States and Canada until it can sustain a level of taxable income that demonstrates its ability to utilize the assets and the economy stabilizes. The change in the valuation allowance from the prior year is primarily due to the effect of IRS Sections 382 and 383 limitations on net operating losses and credits.
58
Table of Contents
DDi CORP.
NOTES TO CONSOLIDATED FINANCIAL STATEMENTS
The income tax provision from continuing operations differs from the amount of income tax determined by applying the U.S. federal statutory income tax rate of 35% to the income (loss) from continuing operations before income taxes as below (in thousands):
| Year Ended December 31, | ||||||||||||
| 2010 | 2009 | 2008 | ||||||||||
| Computed “expected” tax expense (benefit) from continuing operations |
$ | 7,536 | $ | 865 | $ | (11,108 | ) | |||||
| Increase (decrease) in income taxes resulting from: |
||||||||||||
| State tax |
136 | (604 | ) | 545 | ||||||||
| Goodwill |
— | — | 13,047 | |||||||||
| Resolution of tax controversies |
— | 1,007 | — | |||||||||
| Foreign tax differential |
(397 | ) | (124 | ) | 13 | |||||||
| Research and development credits |
123 | (411 | ) | (1,203 | ) | |||||||
| Change in effective tax rate |
— | 100 | — | |||||||||
| Net operating loss and credit limitation |
— | 16,298 | — | |||||||||
| Increase (decrease) in valuation allowance |
(6,557 | ) | (16,298 | ) | 501 | |||||||
| Other |
(45 | ) | (145 | ) | (93 | ) | ||||||
| Provision for income taxes from continuing operations |
$ | 796 | $ | 688 | $ | 1,702 | ||||||
At December 31, 2010, the Company had U.S. federal and state net operating loss (“NOL”) carryforwards of approximately $80.4 million and $24.7 million, respectively. The federal and state NOLs begin expiring in 2021 and 2017, respectively.
At December 31, 2010, the Company had U.S. federal and state research and experimentation (“R&E”) credits of approximately $3.3 million and $5.4 million, respectively. The federal R&E credits begin to expire in 2027 and the state R&E credits carryover indefinitely. In addition, the Company has AMT tax credits of approximately $0.5 million which carries forward indefinitely.
At December 31, 2010, Coretec Inc. had Canadian NOL carryforwards of approximately $27.6 million and research credit carryforwards of approximately $5.1 million. The net operating losses will expire in 2029 and the research credits will begin to expire in 2020.
Pursuant to Sections 382 and 383 of the Internal Revenue Code, the utilization of NOLs and other tax attribute carryovers may be subject to limitations if certain ownership changes occur. The Company experienced ownership changes under Sections 382 and 383 in 2003, 2005 and 2008. The NOLs and certain tax credits (deferred tax assets) and related valuation allowance has been written down to the amounts utilizable before their respective expirations. In 2009, the deferred tax assets were reduced by $16.3 million. The annual limitations will be used to calculate NOL and other tax attributes available for utilization in each future year.
A cash dividend was declared in 2005 to repatriate to the U.S. previously undistributed earnings of our Canadian subsidiary. DDi management does not currently have plans to repatriate additional Canadian earnings. U.S. income taxes have not been provided on approximately $7.2 million of undistributed earnings of foreign subsidiaries since management considers these earnings to be invested indefinitely or substantially offset by foreign tax credits. It is not practicable to estimate the amount of unrecognized deferred U.S. taxes on these undistributed earnings.
The Company is periodically under examination by various taxing authorities. The Company believes the results of these audits will not have a material impact on the Company’s financial position, cash flows or results of operations.
Unrecognized Tax Benefits
The Company is subject to income taxes in the United States and Canada. Significant judgment is required in evaluating the Company’s tax positions and determining its provision for income taxes. During the ordinary course of business, there are many transactions and calculations for which the ultimate tax determination is uncertain. The Company establishes reserves for tax-related uncertainties based on estimates of whether, and the extent to which, additional taxes will
59
Table of Contents
DDi CORP.
NOTES TO CONSOLIDATED FINANCIAL STATEMENTS
be due. These reserves are established when the Company believes that certain positions might be challenged despite a belief that its tax return positions are fully supportable. The Company adjusts these reserves in light of changing facts and circumstances, such as the outcome of income tax audits. The provision for income taxes includes the impact of reserve provisions and changes to reserves that are considered appropriate. Accruals for unrecognized tax benefits are provided for in accordance with the requirements of the prescribed authoritative guidance.
The reconciliation of the Company’s unrecognized tax benefits is as follows (in thousands):
| 2010 | 2009 | |||||||
| Balance at beginning of year |
$ | 446 | $ | 921 | ||||
| Settlements |
— | (313 | ) | |||||
| Increases in balances related to tax positions taken in prior periods |
— | 116 | ||||||
| Decreases in balances related to tax positions taken during prior periods |
(127 | ) | (434 | ) | ||||
| Increases in balances related to tax positions taken during current period |
45 | 156 | ||||||
| Balance at end of year |
$ | 364 | $ | 446 | ||||
As of December 31, 2010, the Company’s total unrecognized tax benefit was $0.4 million, which amount has been included in other long-term liabilities on the accompanying consolidated balance sheets. If recognized in future periods, there would be a favorable effect of $0.3 million to the effective tax rate. Management anticipates a decrease in the tax contingency reserve in the next twelve months due to statute expirations of approximately $0.06 million.
Interest and penalties related to income tax matters are included in current income tax expense. Accrued interest and penalties at December 31, 2010 and 2009 were $0.2 million and $0.1 million, respectively. The amount of interest and penalties accrued in 2010 was $0.1 million.
The Company files income tax returns in the U.S. federal jurisdiction, various states and Canada. The Company has substantially concluded all U.S. federal income tax matters for years through 2004. Canadian income tax matters have been examined through 2008 with the final results of the examination included in preparation of the 2009 consolidated financial statements. State jurisdictions that remain subject to examination range from 2003 to 2009.
12. NET INCOME (LOSS) PER SHARE
Basic net income (loss) per share is computed by dividing the net income (loss) for the period by the weighted-average number of common shares outstanding during the period. Diluted net income (loss) per share is computed by dividing the net income (loss) for the period by the weighted-average number of common and common equivalent shares outstanding during the period, if dilutive. The dilutive effect of outstanding options and restricted stock is reflected in diluted earnings per share by application of the treasury stock method, which includes consideration of share-based compensation.
The following table sets forth the calculation of basic and diluted net income (loss) per share of common stock (in thousands, except per share data):
| Year Ended December 31, | ||||||||||||
| 2010 | 2009 | 2008 | ||||||||||
| Weighted-average shares of common stock outstanding — basic |
19,920 | 19,732 | 20,961 | |||||||||
| Weighted common stock equivalents |
653 | 106 | — | |||||||||
| Weighted-average shares of common stock and common stock equivalents outstanding — diluted |
20,573 | 19,838 | 20,961 | |||||||||
| Net income (loss) |
$ | 20,735 | $ | 1,784 | $ | (33,439 | ) | |||||
| Net income (loss) per share — basic |
$ | 1.04 | $ | 0.09 | $ | (1.60 | ) | |||||
| Net income (loss) per share — diluted |
$ | 1.01 | $ | 0.09 | $ | (1.60 | ) | |||||
For the year ended December 31, 2010, common shares issuable upon exercise of outstanding stock options and restricted stock of 1,967,600 were excluded from the diluted net income per common share calculation as their impact would have been anti-dilutive.
For the year ended December 31, 2009, common shares issuable upon exercise of outstanding stock options and restricted stock of 2,385,591 were excluded from the diluted net income per common share calculation as their impact would have been anti-dilutive.
60
Table of Contents
DDi CORP.
NOTES TO CONSOLIDATED FINANCIAL STATEMENTS
As a result of the net loss incurred during the year ended December 31, 2008, common shares issuable upon exercise of outstanding stock options and restricted stock of 2,632,373 were excluded from the diluted net loss per common share calculation as their impact would have been anti-dilutive.
13. DIVIDENDS
The Company has paid quarterly cash dividends since the second quarter of 2010. The following table sets forth the dividend activities during 2010 and through the Form 10-K filing date (in thousands except per share data):
| Declaration Date |
Record Date |
Payment Date |
Dividend per Share |
Number of Shares Outstanding |
Total Payment | |||||||||||||
| May 11, 2010 | Jun 21, 2010 | Jul 6, 2010 | $ | 0.06 | 19,943 | $ | 1,197 | |||||||||||
| Aug 5, 2010 | Sep 15, 2010 | Sep 30, 2010 | $ | 0.06 | 19,952 | $ | 1,197 | |||||||||||
| Oct 19, 2010 | Nov 15, 2010 | Nov 30, 2010 | $ | 0.10 | 20,170 | $ | 2,017 | |||||||||||
| (a) |
Feb 17, 2011 | Mar 15, 2011 | Mar 30, 2011 | $ | 0.10 | 21,000 | $ | 2,100 | ||||||||||
| (a) | The first quarter of 2011 dividend declaration occurred after December 31, 2010. The numbers of shares outstanding and total payment as of the Record Date are estimated |
DDi Corp. is a Delaware corporation. The Delaware code allows a corporation to declare and pay dividends out of the corporation’s “surplus”, which is defined as total assets minus total liabilities minus par value of issued stock. DDi had a surplus as defined by the Delaware code of $89 million, $85 million and $79 million as of December 31, September 30, and June 30, 2010 respectively. When the Company records a dividend the charge is recorded to additional paid-in capital as opposed to retained earnings since the Company has accumulated deficits.
The payment of future cash dividends will be at the discretion of the board of directors and will depend upon earning levels, capital requirements and alternative uses of cash, such as acquisition opportunities.
Management believes that its cash and cash equivalents on hand at December 31, 2010 together with its cash flows from operations, if any, and available borrowing capacity in our line of credit will be sufficient to meet its working capital and capital expenditure requirements as well as any dividends to be paid in 2011.
14. FAIR VALUE MEASUREMENTS
Effective January 1, 2008, the Company began applying fair value measurements to assets and liabilities reported in its financial statements at fair value on a recurring basis as required by the Fair Value Measurements and Disclosures Topic of FASB ASC. This topic establishes a valuation hierarchy for disclosure of the inputs to valuation used to measure fair value. This hierarchy prioritizes the inputs into three broad levels as follows:
| Level 1: | Quoted market prices in active markets for identical assets or liabilities. | |
| Level 2: | Inputs other than Level 1 that are observable, either directly or indirectly, such as quoted prices for similar assets or liabilities; quoted prices in markets that are not active; or other inputs that can be corroborated by observable market data for substantially the full term of the assets or liabilities. | |
| Level 3: | Unobservable inputs that are not corroborated by market data. | |
A financial asset’s or liability’s classification within the hierarchy is determined based on the lowest level input that is significant to the fair value measurement. The estimated fair values of the Company’s financial instruments, which include cash and cash equivalents, accounts receivable, revolving credit facility, accounts payable, accrued liabilities and income taxes payable, approximate their carrying values due to their short maturities. These items are classified as either Level 1 or Level 2 inputs.
Cash equivalents consist of the Company’s excess cash invested in highly liquid money market accounts. These amounts are reflected within cash and cash equivalents on the consolidated balance sheet at a net value of 1:1 for each dollar invested. The cost and fair value of the Company’s cash equivalents was $28.3 million as of December 31, 2010 and was based on quoted market prices in active markets for identical assets, a Level 1 input.
61
Table of Contents
DDi CORP.
NOTES TO CONSOLIDATED FINANCIAL STATEMENTS
To calculate the estimated fair value of the Company’s variable and fixed rate notes payable and mortgage debt as of December 31, 2010, the Company estimated that in the current market the Company’s cost of borrowing on similar debt would, on average, be approximately 5.98% based on its current debt rating and an analysis of current market rates. Using this estimated interest rate and a discount rate of 8.0% (Level 2 and 3 inputs), the Company estimated the fair value of its debt to be approximately $0.2 million higher than its carrying value of $11.5 million.
As of December 31, 2009, the carrying amount of the Company’s revolving line of credit debt assumed in connection with the Coretec acquisition was representative of its fair value due to the fact that the line had just been entered into in March 2009, less than one year earlier, and because of its classification as short-term debt as it was paid off in full by the Company in February 2010.
15. COMMITMENTS, CONTINGENCIES AND GUARANTEES
Environmental matters
The Company’s operations are regulated under a number of federal, state and local environmental laws and regulations, which govern, among other things, the discharge of hazardous materials into the air and water as well as the handling, storage and disposal of such materials. Compliance with these environmental laws are major considerations for all PCB manufacturers because metals and other hazardous materials are used in the manufacturing process. In addition, because the Company is a generator of hazardous wastes, the Company, along with any other person who arranges for the disposal of such wastes, may be subject to potential financial exposure for costs associated with an investigation and remediation of sites at which it has arranged for the disposal of hazardous wastes, if such sites become contaminated. This is true even if the Company fully complies with applicable environmental laws. In addition, it is possible that in the future new or more stringent requirements could be imposed. Management believes it has complied with all applicable environmental laws and regulations. There have been no claims asserted nor is management aware of any unasserted claims for environmental matters.
Operating leases
The Company has entered into various operating leases principally for manufacturing facilities, office space, and equipment that expire at various dates through 2015, some of which contain escalating rent provisions. The Company recognizes rent expense using a straight-line method based on total lease payments. Future annual minimum lease payments under all non-cancelable operating leases with initial terms of one year or more, consist of the following at December 31, 2010 (in thousands):
| Year Ending December 31, |
||||
| 2011 |
$ | 3,955 | ||
| 2012 |
1,877 | |||
| 2013 |
1,038 | |||
| 2014 |
972 | |||
| 2015 |
972 | |||
| Total |
$ | 8,814 | ||
Rent expense for the years ended December 31, 2010, 2009 and 2008 was approximately $3.6 million, $3.5 million, and $3.4 million, respectively.
Litigation
From time to time the Company is involved in litigation and government proceedings incidental to its business. These proceedings are in various procedural stages. The Company believes as of the date of this report that provisions or accruals made for any potential losses, to the extent estimable, are adequate and that any liabilities or costs arising out of these proceedings are not likely to have a materially adverse effect on its consolidated financial statements. The outcome of any of these proceedings, however, is inherently uncertain, and if unfavorable outcomes were to occur, there is a possibility that they would, individually or in the aggregate, have a materially adverse effect on the Company’s consolidated financial statements.
Indemnification of Directors and Officers
The Company’s certificate of incorporation provides that it will indemnify its directors and officers to the fullest extent permitted by the Delaware General Corporation Law. The Company has also entered into individual indemnity agreements with each of its officers and directors. The Company has obtained liability insurance for its directors and officers with respect to liability arising out of their capacity or status as directors and officers against expenses (including attorney’s fees), judgments, fines and amounts paid in settlement which are reasonably incurred in connection with such action, suit or proceeding.
62
Table of Contents
DDi CORP.
NOTES TO CONSOLIDATED FINANCIAL STATEMENTS
16. SUPPLEMENTAL DISCLOSURE OF CASH FLOW INFORMATION
| Year Ended December 31, | ||||||||||||
| 2010 | 2009 | 2008 | ||||||||||
| (in thousands) | ||||||||||||
| Cash payments for: |
||||||||||||
| Income taxes |
$ | 330 | $ | 1,127 | $ | 1,210 | ||||||
| Interest |
$ | 740 | $ | 98 | $ | 134 | ||||||
| Acquisition of Coretec Inc.: |
||||||||||||
| Cash consideration |
$ | — | $ | 6,680 | $ | — | ||||||
| Fair value of non-cash tangible assets acquired |
— | (31,704 | ) | — | ||||||||
| Goodwill |
— | (2,986 | ) | — | ||||||||
| Liabilities assumed and incurred |
— | 28,890 | — | |||||||||
| Cash acquired |
$ | — | $ | 880 | $ | — | ||||||
| Non-cash investing activity: |
||||||||||||
| Adjustment of inventory balance to goodwill relating to acquisition of Coretec |
$ | 410 | — | — | ||||||||
| Adjustment of fixed assets balance to goodwill relating to acquisition of Coretec |
$ | 268 | — | — | ||||||||
63
Table of Contents
DDi CORP.
NOTES TO CONSOLIDATED FINANCIAL STATEMENTS
FINANCIAL STATEMENT SCHEDULE
The financial statement Schedule II — VALUATION AND QUALIFYING ACCOUNTS is filed as part of this Form 10-K.
SCHEDULE II — VALUATION AND QUALIFYING ACCOUNTS
| Column A |
Column B | Column C | Column D | Column E | ||||||||||||||||
| Balance at Beginning of Period |
Additions Charged to Costs and Expenses(1) (2) |
Additions Charged to Other Accounts |
Deductions | Balance at End of Period |
||||||||||||||||
| Description |
(in thousands) | |||||||||||||||||||
| Allowance for Doubtful Accounts: |
||||||||||||||||||||
| Year ended December 31, 2010 |
$ | 1,646 | $ | 32 | $ | — | $ | (1,107 | ) | $ | 571 | |||||||||
| Year ended December 31, 2009 |
$ | 1,578 | $ | 262 | $ | — | $ | (194 | ) | $ | 1,646 | |||||||||
| Year ended December 31, 2008 |
$ | 1,687 | $ | 301 | $ | — | $ | (410 | ) | $ | 1,578 | |||||||||
| Deferred Tax Valuation Allowance: |
||||||||||||||||||||
| Year ended December 31, 2010 |
$ | 64,267 | $ | (6,777 | ) | $ | 4,542 | $ | — | $ | 62,032 | |||||||||
| Year ended December 31, 2009 |
$ | 65,436 | $ | (16,298 | ) | $ | 15,129 | $ | — | $ | 64,267 | |||||||||
| Year ended December 31, 2008 |
$ | 63,290 | $ | 1,409 | $ | 737 | $ | — | $ | 65,436 | ||||||||||
| (1) | For the “Allowance for Doubtful Accounts” account specifically, data includes both amounts charged to general and administrative expense (for bad debts) and as a reduction to revenue (for sales returns and discounts). |
| (2) | Also includes any applicable opening reserve balances recorded in connection with the acquisition of Coretec on December 31, 2009. |
| Item 9. | Changes in and Disagreements With Accountants on Accounting and Financial Disclosure. |
None.
| Item 9A. | Controls and Procedures. |
Disclosure Controls and Procedures
Our President and Chief Executive Officer and our Chief Financial Officer performed an evaluation of the effectiveness of our disclosure controls and procedures (as defined in Rules 13a-15(e) and 15d-15(e) under the Securities Exchange Act of 1934, as amended) as of December 31, 2010 and, based on that evaluation, have concluded that the disclosure controls and procedures are effective.
Report of Management on Internal Control Over Financial Reporting
Our management is responsible for establishing and maintaining adequate internal control over financial reporting (as defined in Rules 13a-15(f) and 15d-15(f) of the Exchange Act). Internal control over financial reporting is a process designed by, or under the supervision of, our principal executive and financial officers, and effected by our board of directors, management, and other personnel, to provide reasonable assurance regarding the reliability of financial reporting and the preparation of financial statements for external purposes in accordance with generally accepted accounting principles and includes those policies and procedures that (i) pertain to the maintenance of records that in reasonable detail accurately and fairly reflect the transactions and dispositions of our assets; (ii) provide reasonable assurance that the transactions are recorded as necessary to permit preparation of financial statements in accordance with generally accepted accounting principles, and that our receipts and expenditures are being made only in accordance with authorizations of our management and our directors; and (iii) provide reasonable assurance regarding prevention or timely detection of unauthorized acquisition, use or disposition of our assets that could have a material effect on the financial statements.
Our management evaluated as of December 31, 2010 the effectiveness of our internal control over financial reporting using the criteria set forth by the Committee of Sponsoring Organizations of the Treadway Commission (COSO) in Internal Control — Integrated Framework. Based on this evaluation, our management concluded that our internal control over financial reporting was effective as of December 31, 2010. Our independent registered public accounting firm, Grant Thornton LLP, issued a report on the effectiveness of our internal control over financial reporting as of December 31, 2010, which appears on page 38 herein.
64
Table of Contents
Inherent Limitations of Effectiveness of Controls
Our management, including our President and Chief Executive Officer and our Chief Financial Officer, do not expect that our disclosure controls and procedures or our internal control over financial reporting will prevent all errors and all fraud. A control system, no matter how well conceived and operated, can provide only reasonable, not absolute, assurance that the objectives of the control system are met. Further, the benefits of controls must be considered relative to their costs. Because of the inherent limitations in all control systems, no evaluation of controls can provide absolute assurance that all control issues and instances of fraud, if any, have been detected. These inherent limitations include the realities that judgments in decision-making can be faulty, and that breakdowns can occur because of simple errors or mistakes. Additionally, controls can be circumvented by the individual acts of some persons, by collusion of two or more people or by management override of the control. The design of any system of controls is also based in part upon certain assumptions about the likelihood of future events, and there can be no assurance that any design will succeed in achieving its stated goals under all potential future conditions. Because of the inherent limitations in a cost-effective control system, misstatements due to error or fraud may occur and not be detected. Projections of any evaluation of controls effectiveness to future periods are subject to risks. Over time, controls may become inadequate because of changes in conditions or deterioration in the degree of compliance with policies or procedures.
Changes in Internal Control Over Financial Reporting
There have been no changes in our internal control over financial reporting that occurred during our fourth quarter ended December 31, 2010 that have materially affected, or are reasonably likely to materially affect, our internal control over financial reporting.
| Item 9B. | Other Information. |
NONE
PART III
| Item 10. | Directors, Executive Officers and Corporate Governance. |
Information regarding our executive officers is set forth in Part I of this report under “Item 1. Business — Executive Officers of the Registrant.” In addition, the information set forth under the captions “Election of Directors,” “Information About the board of directors and Committees of the Board” and “Transactions with Management and Others — Section 16(a) Beneficial Ownership Reporting Compliance” in our definitive proxy statement for our Annual Meeting of Stockholders to be held in 2011 (the “Proxy Statement”), which will be filed with the SEC within 120 days of the end of our fiscal year ended December 31, 2010, is incorporated herein by reference.
| Item 11. | Executive Compensation. |
Except as specifically provided, the information set forth under the captions “Compensation of Executive Officers” and “Information About the board of directors and Committees of the Board — Compensation of Directors” in the Proxy Statement is incorporated herein by reference.
| Item 12. | Security Ownership of Certain Beneficial Owners and Management and Related Stockholder Matters. |
The information set forth under the captions “Security Ownership of Certain Beneficial Owners and Management” and “Securities Authorized for Issuance under Equity Compensation Plans” in the Proxy Statement is incorporated herein by reference.
| Item 13. | Certain Relationships and Related Transactions, and Director Independence. |
The information set forth under the captions “Transactions with Management and Others” and “Information About the Board of Directors and Committees of the Board” in the Proxy Statement is incorporated herein by reference.
| Item 14. | Principal Accountant Fees and Services. |
The information set forth under the caption “Ratification of the Selection of Independent Registered Public Accounting Firm - Relationship of the Company with Independent Registered Public Accounting Firm” in the Proxy Statement is incorporated herein by reference.
65
Table of Contents
PART IV
| Item 15. | Exhibits and Financial Statement Schedules. |
(a)1. Financial Statements
Included in Part II of this Annual Report on Form 10-K:
Reports of Independent Registered Public Accounting Firms
Consolidated Balance Sheets as of December 31, 2010 and 2009
Consolidated Statements of Operations for the Years Ended December 31, 2010, 2009 and 2008
Consolidated Statements of Comprehensive Income (Loss) for the Years Ended December 31, 2010, 2009 and 2008
Consolidated Statements of Stockholders’ Equity for the Years Ended December 31, 2010, 2009 and 2008
Consolidated Statements of Cash Flows for the Years Ended December 31, 2010, 2009 and 2008
Notes to Consolidated Financial Statements
(a)2. Financial Statement Schedules
Included in Part II of this Annual Report on Form 10-K
Schedule II - Valuation and Qualifying Accounts. Schedules I, III, IV and V are not included because they are not required.
66
Table of Contents
(a)3 and (b). Exhibits
The exhibits listed below are hereby filed with the SEC as part of this Annual Report on Form 10-K. Certain of the following exhibits have been previously filed with the SEC pursuant to the requirements of the Securities Act or the Exchange Act. Such exhibits are identified in the chart to the right of the Exhibit and are incorporated herein by reference. We will furnish a copy of any exhibit upon request, but a reasonable fee will be charged to cover our expense in furnishing such exhibit.
| Incorporated by Reference | ||||||||||||||
| Exhibit |
Description |
Filed Herewith |
Form | Period Ending |
Exhibit | Filing Date | ||||||||
| 2.1 | Arrangement Agreement dated November 23, 2009 between DDi Corp. and Coretec Inc. | 8-K | 2.1 | 11/30/2009 | ||||||||||
| 3.1 | Amended and Restated Certificate of Incorporation of DDi Corp. | 8-K | 3.1 | 12/13/2003 | ||||||||||
| 3.4 | Certificate of Amendment to the Amended and Restated Certificate of Incorporation of DDi Corp. | 8-K | 3.1 | 8/10/2005 | ||||||||||
| 3.5 | Amended and Restated Bylaws of DDi Corp. | 8-K | 3.1 | 12/11/2007 | ||||||||||
| 10.1* | Dynamic Details Incorporated 2010 Senior Management Bonus Program | 10-K | 12/31/2009 | 10.2 | 3/6/2009 | |||||||||
| 10.2* | Dynamic Details Incorporated 2011 Senior Management Bonus Program | X | ||||||||||||
| 10.3* | Independent Director Compensation Policy | 10-K | 12/31/2006 | 10.3 | 3/12/2007 | |||||||||
| 10.4* | 2003 Directors Equity Incentive Plan | S-8 | 4.3 | 6/14/2004 | ||||||||||
| 10.5* | Form of Stock Option Agreement (2003 Directors Equity Incentive Plan) | S-8 | 4.4 | 6/14/2004 | ||||||||||
| 10.6* | DDi Corp. 2003 Management Incentive Plan | S-1 | 10.41 | 2/12/2004 | ||||||||||
| 10.7* | DDi Corp. 2005 Stock Incentive Plan, as Amended | S-8 | 4.4 | 11/7/2008 | ||||||||||
| 10.8* | Form of Stock Option Agreement under the DDi Corp 2005 Stock Incentive Plan | 8-K | 10 | 12/27/2005 | ||||||||||
| 10.9* | Form of Restricted Share Award Agreement under the DDi Corp 2005 Stock Incentive Plan | 8-K | 99.2 | 12/11/2007 | ||||||||||
| 10.10* | Employment Agreement dated April 7, 2008 between DDi Corp. and Mikel H. Williams | 8-K | 99.1 | 4/11/2008 | ||||||||||
| 10.11* | Employment Agreement dated April 7, 2008 between DDi Corp. and Michael R. Mathews | 8-K | 99.2 | 4/11/2008 | ||||||||||
| 10.12* | Employment Agreement dated April 7, 2008 between DDi Corp. and Gerald Barnes | 8-K | 99.3 | 4/11/2008 | ||||||||||
| 10.13* | Employment Letter between DDi Corp. and J. Michael Dodson dated January 19, 2010. | 8-K | 99.1 | 1/26/2010 | ||||||||||
67
Table of Contents
| Incorporated by Reference | ||||||||||||||
| Exhibit |
Description |
Filed Herewith |
Form | Period Ending |
Exhibit | Filing Date | ||||||||
| 10.14 | Credit Agreement dated September 23, 2010, by and between DDi Corp., DDi Global Corp., DDi Sales Corp., DDi North Jackson Corp., DDi Milpitas Corp., DDi Denver Corp., and DDi Cleveland Corp., DDi Toronto Corp., the other Loan Parties thereto, the lenders from time to time party thereto, JPMorgan Chase Bank, N.A., as Administrative Agent and U.S. Lender, and JPMorgan Chase Bank, N.A., Toronto Branch, as Canadian Administrative Agent and Canadian Lender. | 8-K | 10.1 | 9/29/2010 | ||||||||||
| 10.15 | Pledge and Security Agreement dated September 23, 2010 by and between DDi Corp., DDi Intermediate Holdings Corp., DDi Capital Corp., DDi Global Corp., DDi Sales Corp., DDi North Jackson Corp., DDi Milpitas Corp., Coretec Holdings Inc., DDi Cleveland Holdings Corp., DDi Denver Corp., Coretec Building Inc., DDi Cleveland Corp., Trumauga Properties, Ltd. and JPMorgan Chase Bank, N.A. | 8-K | 10.2 | 9/29/2010 | ||||||||||
| 10.16 | Pledge and Security Agreement dated as of September 23, 2010 by and between DDi Toronto Corp. and JPMorgan Chase Bank, N.A. | 8-K | 10.3 | 9/29/2010 | ||||||||||
| 10.17 | Form of Indemnity Agreement | 8-K | 10.1 | 10/25/2010 | ||||||||||
| 21.1 | Subsidiaries of DDi Corp. | X | ||||||||||||
| 23.1 | Consent of Grant Thornton LLP | X | ||||||||||||
| 23.2 | Consent of PricewaterhouseCoopers LLP | X | ||||||||||||
| 31.1 | Certification of Chief Executive Officer of DDi Corp., Pursuant to Rule 13a-14 of the Securities Exchange Act | X | ||||||||||||
| 31.2 | Certification of Chief Financial Officer of DDi Corp., Pursuant to Rule 13a-14 of the Securities Exchange Act | X | ||||||||||||
| 32.1 | Certification of Chief Executive Officer of DDi Corp., Pursuant to Section 906 of the Sarbanes-Oxley Act of 2002 | X | ||||||||||||
| 32.2 | Certification of Chief Financial Officer of DDi Corp., Pursuant to Section 906 of the Sarbanes-Oxley Act of 2002 | X | ||||||||||||
| * | Indicates a management contract or compensatory plan or arrangement |
| (c) | Financial Statement Schedules. |
The required financial statement schedule, Schedule II — Valuation and Qualifying Accounts, is set forth under Part II, Item 8. Financial Statements and Supplementary Data of this Annual Report on Form 10-K, and is hereby incorporated by reference in this Item 15 (c).
68
Table of Contents
Pursuant to the requirements of Section 13 or 15(d) of the Securities Exchange Act of 1934, DDi Corp. has duly caused this report to be signed on its behalf by the undersigned, thereto duly authorized, in the city of Anaheim, state of California, on the 22nd day of February, 2011.
| DDi CORP. | ||||||||
| Date: February 22, 2011 | By: | /s/ MIKEL H. WILLIAMS | ||||||
| Mikel H. Williams | ||||||||
| President and Chief Executive Officer | ||||||||
| Date: February 22, 2011 | /s/ J. MICHAEL DODSON | |||||||
| J. Michael Dodson | ||||||||
| Senior Vice President & Chief Financial Officer | ||||||||
| (Principal Financial Officer) | ||||||||
| Date: February 22, 2011 | /s/ COLEMAN C. BARNER | |||||||
| Coleman C. Barner | ||||||||
| Chief Accounting Officer | ||||||||
| (Principal Accounting Officer) | ||||||||
Pursuant to the requirements of the Securities Exchange Act of 1934, this report has been signed by the following persons on behalf of DDi Corp. and in the capacities and on the dates indicated.
| Signature |
Title |
Date | ||||
| /s/ MIKEL H. WILLIAMS | President, Chief Executive Officer and Director | February 22, 2011 | ||||
| Mikel H. Williams | (Principal Executive Officer) | |||||
| /s/ J. MICHAEL DODSON | Senior Vice President and Chief Financial Officer | February 22, 2011 | ||||
| J. Michael Dodson | (Principal Financial Officer) | |||||
| /s/ COLEMAN C. BARNER | Chief Accounting Officer | February 22, 2011 | ||||
| Coleman C. Barner | (Principal Accounting Officer) | |||||
| /s/ ROBERT J. AMMAN | Director | February 22, 2011 | ||||
| Robert J. Amman | ||||||
| /s/ JAY B. HUNT | Director | February 22, 2011 | ||||
| Jay B. Hunt | ||||||
| /s/ ANDREW E. LIETZ | Director | February 22, 2011 | ||||
| Andrew E. Lietz | ||||||
| /s/ BRYANT RILEY | Director | February 22, 2011 | ||||
| Bryant Riley | ||||||
| /s/ STEVEN C. SCHLEPP | Director | February 22, 2011 | ||||
| Steven C. Schlepp | ||||||
| /s/ CARL R. VERTUCA, JR. | Director | February 22, 2011 | ||||
| Carl R. Vertuca, Jr. | ||||||
69