Attached files
| file | filename |
|---|---|
| 8-K - FORM 8-K - ONCOR ELECTRIC DELIVERY TRANSITION BOND CO LLC | d79840e8vk.htm |
Exhibit 99.1
| 2010 Fourth Quarter And Year End Investor Call February 18, 2011 |
| Forward Looking Statements This presentation contains forward-looking statements, which are subject to various risks and uncertainties. Discussion of risks and uncertainties that could cause actual results to differ materially from management's current projections, forecasts, estimates and expectations is contained in filings made by Oncor Electric Delivery Company LLC (Oncor) with the Securities and Exchange Commission (SEC). Specifically, Oncor makes reference to the section entitled "Risk Factors" in its annual and quarterly reports. In addition to the risks and uncertainties set forth in Oncor's SEC filings, the forward-looking statements in this presentation could be affected by, among other things: prevailing governmental policies and regulatory actions; legal and administrative proceedings and settlements; weather conditions and other natural phenomena; acts of sabotage, wars or terrorist activities; economic conditions, including the impact of a recessionary environment; unanticipated population growth or decline, or changes in market demand and demographic patterns; changes in business strategy, development plans or vendor relationships; unanticipated changes in interest rates or rates of inflation; unanticipated changes in operating expenses, liquidity needs and capital expenditures; inability of various counterparties to meet their financial obligations to Oncor, including failure of counterparties to perform under agreements; general industry trends; hazards customary to the industry and the possibility that Oncor may not have adequate insurance to cover losses resulting from such hazards; changes in technology used by and services offered by Oncor; significant changes in Oncor's relationship with its employees; changes in assumptions used to estimate costs of providing employee benefits, including pension and other post-retirement employee benefits, and future funding requirements related thereto; significant changes in critical accounting policies material to Oncor; commercial bank and financial market conditions, access to capital, the cost of such capital, and the results of financing and refinancing efforts, including availability of funds in the capital markets and the potential impact of continued disruptions in US credit markets; circumstances which may contribute to future impairment of goodwill, intangible or other long-lived assets; financial restrictions under Oncor's revolving credit facility and indentures governing its debt instruments; Oncor's ability to generate sufficient cash flow to make interest payments on its debt instruments; actions by credit rating agencies; and Oncor's ability to effectively execute its operational strategy. Any forward-looking statement speaks only as of the date on which it is made, and Oncor undertakes no obligation to update any forward-looking statement to reflect events or circumstances after the date on which it is made or to reflect the occurrence of unanticipated events. Regulation G This presentation includes certain non-GAAP financial measures. A reconciliation of these measures to the most directly comparable GAAP measures is included in this presentation, which is available on Oncor's website, www.oncor.com, under the 'News' tab in the Investor Information section, and also filed with the SEC. |
| 4th Quarter and Year End 2010 Investor Call Agenda Financial Overview David Davis Chief Financial Officer Operational Review Bob Shapard Chairman and CEO Q&A |
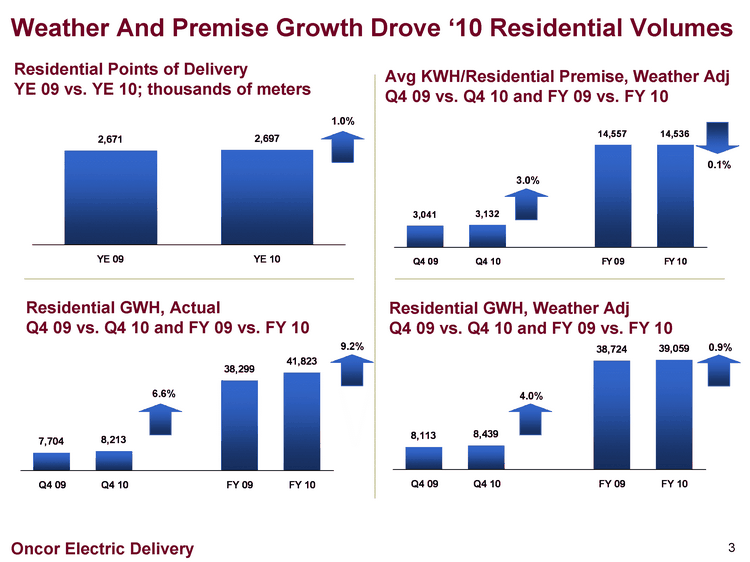
| Weather And Premise Growth Drove '10 Residential Volumes Avg KWH/Residential Premise, Weather Adj Q4 09 vs. Q4 10 and FY 09 vs. FY 10 Residential GWH, Actual Q4 09 vs. Q4 10 and FY 09 vs. FY 10 Residential Points of Delivery YE 09 vs. YE 10; thousands of meters Residential GWH, Weather Adj Q4 09 vs. Q4 10 and FY 09 vs. FY 10 Q4 09 Q4 10 FY 09 FY 10 7704 8213 38299 41823 Q4 09 Q4 10 FY 09 FY 10 3041 3132 14557 14536 Q4 09 Q4 10 FY 09 FY 10 8113 8439 38724 39059 YE 09 YE 10 2671 2697 1.0% 6.6% 4.0% 9.2% 0.9% 0.1% 3.0% |
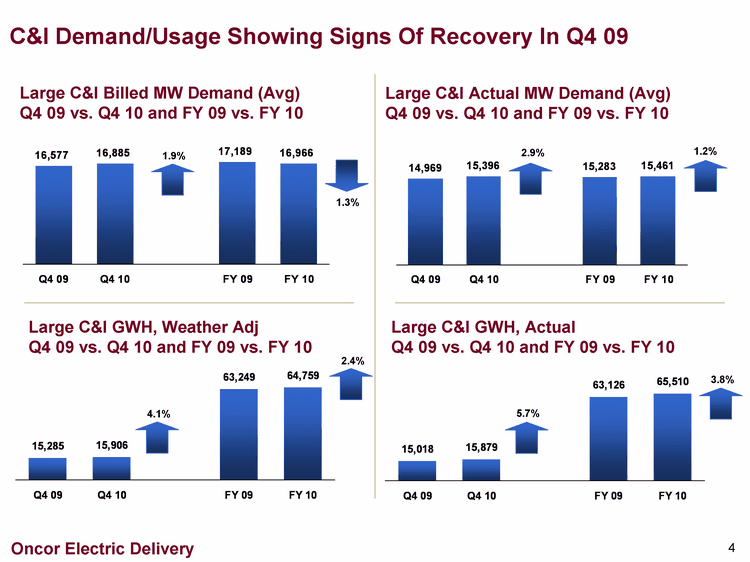
| C&I Demand/Usage Showing Signs Of Recovery In Q4 09 Large C&I GWH, Actual Q4 09 vs. Q4 10 and FY 09 vs. FY 10 Large C&I GWH, Weather Adj Q4 09 vs. Q4 10 and FY 09 vs. FY 10 Q4 09 Q4 10 FY 09 FY 10 15285 15906 63249 64759 1.3% 1.2% Q4 09 Q4 10 FY 09 FY 10 16577 16885 17189 16966 Large C&I Billed MW Demand (Avg) Q4 09 vs. Q4 10 and FY 09 vs. FY 10 Q4 09 Q4 10 FY 09 FY 10 15018 15879 63126 65510 Q4 09 Q4 10 FY 09 FY 10 14969 15396 15283 15461 Large C&I Actual MW Demand (Avg) Q4 09 vs. Q4 10 and FY 09 vs. FY 10 5.7% 2.4% 4.1% 3.8% 1.9% 2.9% |
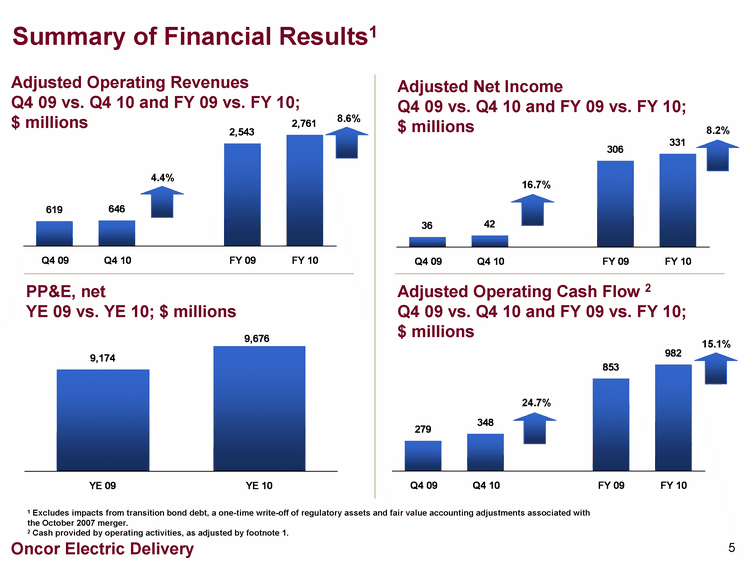
| Summary of Financial Results1 Adjusted Net Income Q4 09 vs. Q4 10 and FY 09 vs. FY 10; $ millions Q4 09 Q4 10 FY 09 FY 10 36 42 306 331 Adjusted Operating Revenues Q4 09 vs. Q4 10 and FY 09 vs. FY 10; $ millions Q4 09 Q4 10 FY 09 FY 10 619 646 2543 2761 PP&E, net YE 09 vs. YE 10; $ millions YE 09 YE 10 9174 9676 Adjusted Operating Cash Flow 2 Q4 09 vs. Q4 10 and FY 09 vs. FY 10; $ millions Q4 09 Q4 10 FY 09 FY 10 279 348 853 982 1 Excludes impacts from transition bond debt, a one-time write-off of regulatory assets and fair value accounting adjustments associated with the October 2007 merger. 2 Cash provided by operating activities, as adjusted by footnote 1. 8.6% 15.1% 8.2% 16.7% 24.7% 4.4% |
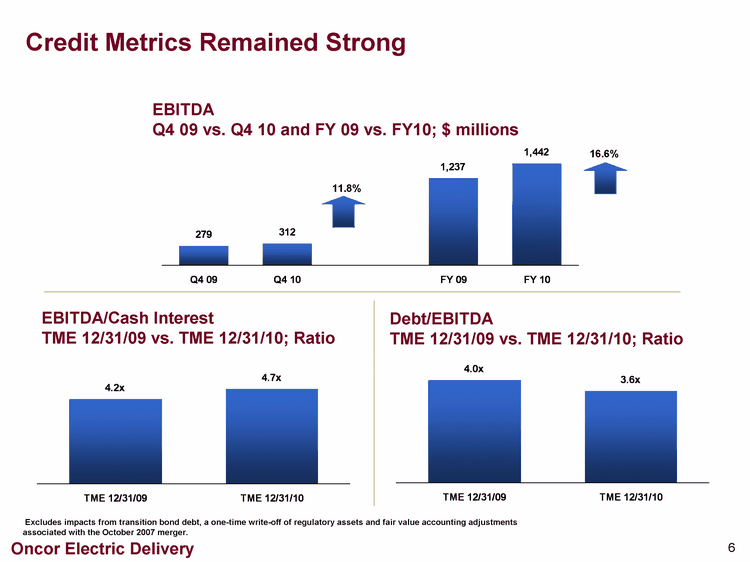
| Credit Metrics Remained Strong EBITDA Q4 09 vs. Q4 10 and FY 09 vs. FY10; $ millions EBITDA/Cash Interest TME 12/31/09 vs. TME 12/31/10; Ratio TME 12/31/09 TME 12/31/10 4.2 4.7 Debt/EBITDA TME 12/31/09 vs. TME 12/31/10; Ratio TME 12/31/09 TME 12/31/10 4 3.6 Excludes impacts from transition bond debt, a one-time write-off of regulatory assets and fair value accounting adjustments associated with the October 2007 merger. Q4 09 Q4 10 FY 09 FY 10 279 312 1237 1442 11.8% 16.6% |
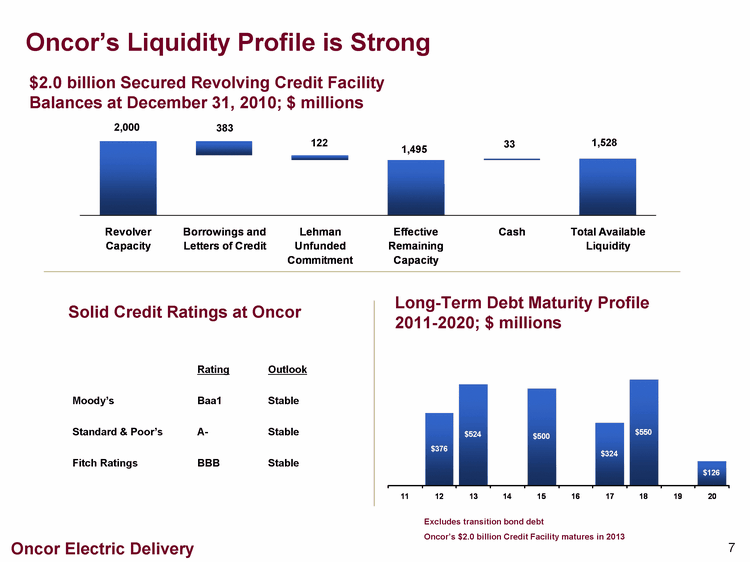
| Oncor's Financial Condition is Strong Revolver Capacity Borrowings and Letters of Credit Lehman Unfunded Commitment Effective Remaining Capacity Cash Total Available Liquidity 1617 1495 1495 2000 383 122 1495 33 1528 $2.0 billion Secured Revolving Credit Facility Balances at December 31, 2010; $ millions 2,000 383 122 1,495 33 1,528 Rating Outlook Moody's Baa1 Stable Standard & Poor's A- Stable Fitch Ratings BBB Stable Solid Credit Ratings at Oncor Excludes transition bond debt Oncor's $2.0 billion Credit Facility matures in 2013 11 12 13 14 15 16 17 18 19 20 Long-Term Debt Maturities 375.595 523.722 500 324.405 550 126.278 Long-Term Debt Maturity Profile 2011-2020; $ millions |
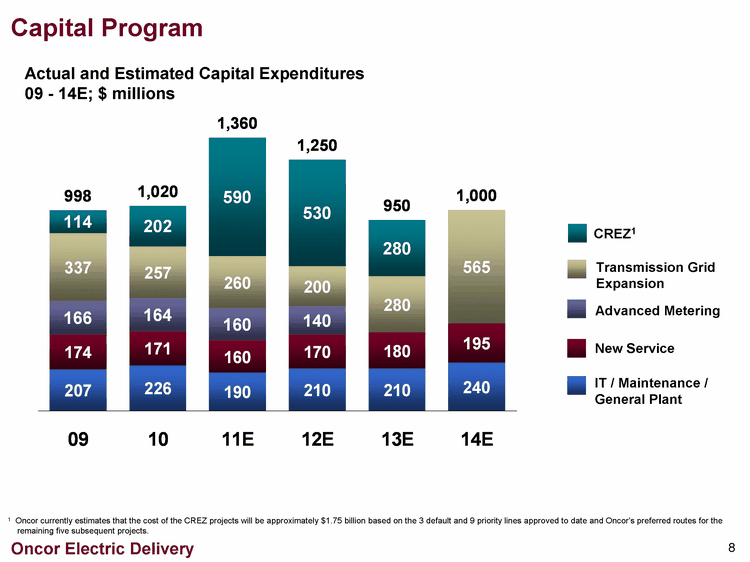
| 1st Qtr 2nd Qtr 3rd Qtr 4th Qtr East 27.4 90 20.4 West 30.6 38.6 34.6 31.6 North 45.9 46.9 45 43.9 09 10 11E 12E 13E 14E Maintenance/Other 207 226 190 210 210 240 Serve New 174 171 160 170 180 195 Automated Meters 166 164 160 140 Grid Expansion 337 257 260 200 280 565 CREZ 114 202 590 530 280 BPL Total 998 1020 1360 1250 950 1000 Actual and Estimated Capital Expenditures 09 - 14E; $ millions New Service Advanced Metering CREZ1 IT / Maintenance / General Plant Transmission Grid Expansion Large Capital Program 1 Oncor currently estimates that the cost of the CREZ projects will be approximately $1.75 billion based on the original ERCOT estimate of $1.3 billion, current estimates for the 3 default and 9 priority lines approved to date, the identification of additional costs not included in the original ERCOT estimate and Oncor's preferred routes for the remaining five subsequent projects. |

| Oncor Rate Case Filed Filed on January 7, 2011 Requested: $353 million increase 11.25% ROE 55% Debt / 45% Equity Capital Structure Hearings Scheduled for May 2nd through 6th ALJs Proposal for Decision expected June 30th Jurisdictional Deadline is July 31, 2011 |
| 4th Quarter and Year End 2010 Investor Call Agenda Financial Overview David Davis Chief Financial Officer Operational Review Bob Shapard Chairman and CEO Q&A |
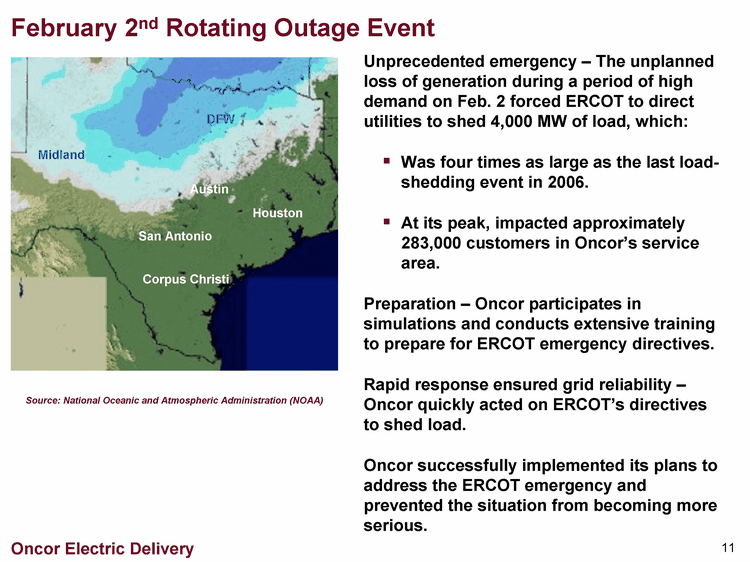
| Feb. 2 Rotating Outage Event Unprecedented emergency - The unplanned loss of generation during a period of high demand on Feb. 2 forced ERCOT to direct utilities to shed 4,000 MW of load, which: Was four times as large as the last load-shedding event in 2006. At its peak, impacted approximately 283,000 customers in Oncor's service area. Preparation - Oncor participates in simulations and conducts extensive training to prepare for ERCOT emergency directives. Rapid response ensured grid reliability - Oncor quickly acted on ERCOT's directives to shed load. Oncor successfully implemented its plans to address the ERCOT emergency and prevented the situation from becoming more serious. DFW Houston Austin San Antonio Corpus Christi Midland Source: National Oceanic and Atmospheric Administration (NOAA) |
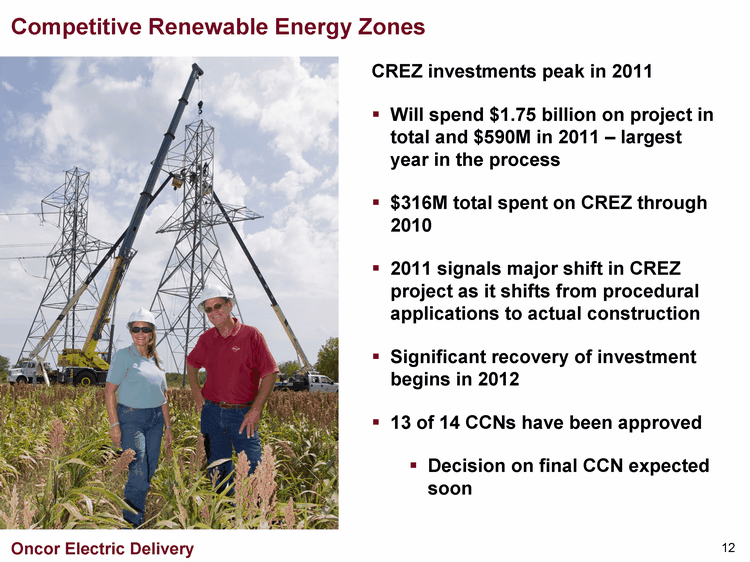
| Competitive Renewable Energy Zones CREZ investments peak in 2011 Will spend $1.75 billion on project in total and $590M in 2011 - largest year in the process $316M total spent on CREZ through 2010 2011 signals major shift in CREZ project as it shifts from procedural applications to actual construction No significant recovery on investments in 2011; recovery begins in 2012 CREZ project is moving according to plan Current status of construction and recovery was planned |
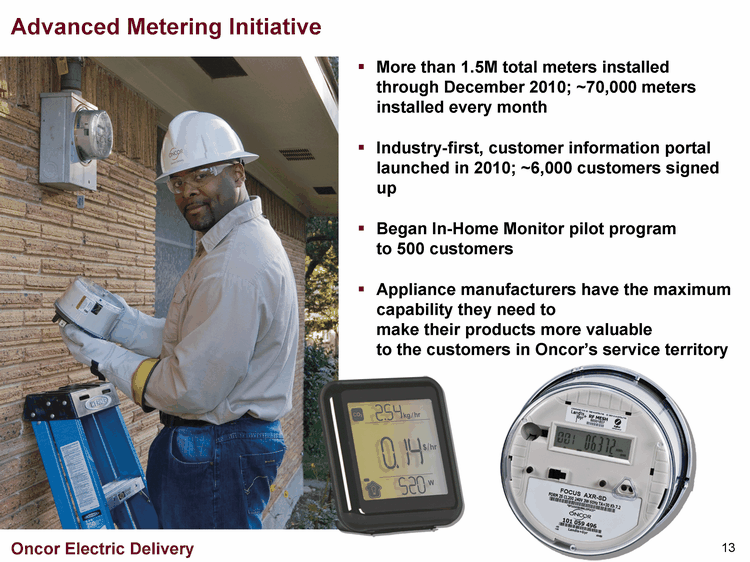
| Advanced Metering Initiative More than 1.5M total meters installed through December 2010; ~70,000 meters installed every month Industry-first, customer information portal launched in 2010; ~6,000 customers signed up Began In-Home Monitor pilot program to 500 customers Appliance manufacturers have the maximum capability they need to make their products more valuable to the customers in Oncor's service territory |
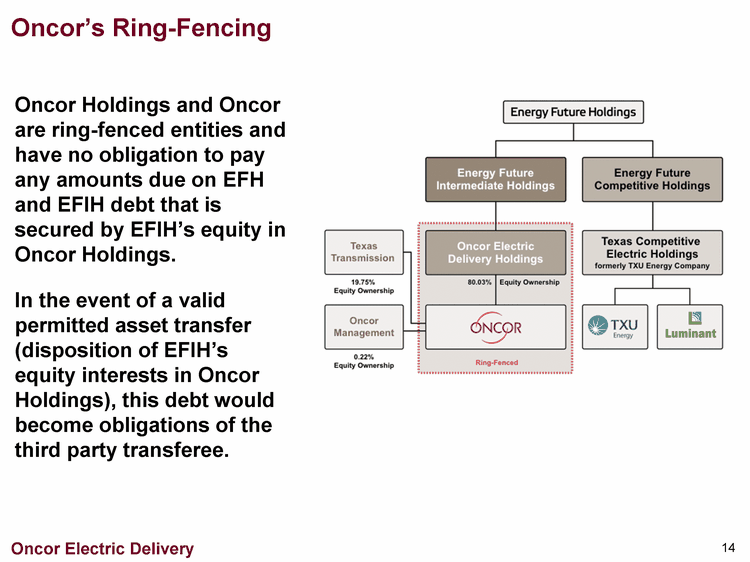
| Oncor's Ring-Fencing Oncor Holdings and Oncor are ring-fenced entities and have no obligation to pay any amounts due on EFH and EFIH debt that is secured by EFIH's equity in Oncor Holdings. In the event of a valid permitted asset transfer (disposition of EFIH's equity interests in Oncor Holdings), this debt would become obligations of the third party transferee. |
| Appendix - Regulation G Reconciliations |
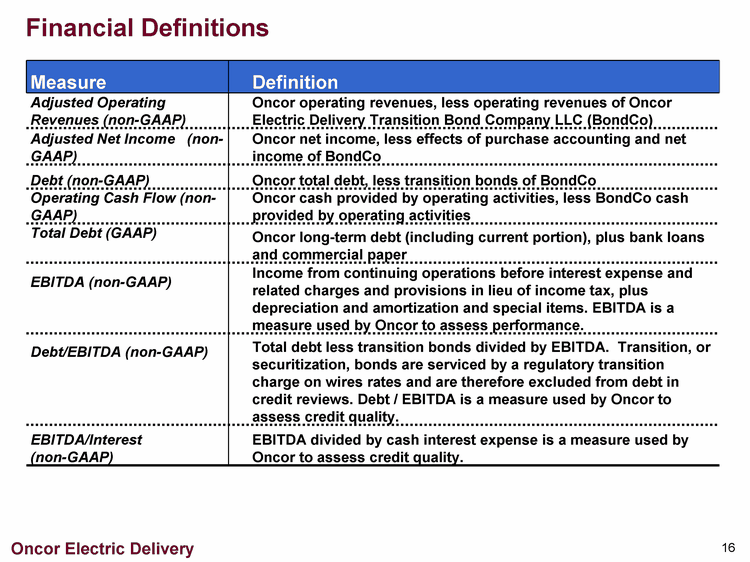
| Measure Definition Adjusted Operating Revenues (non-GAAP) Oncor operating revenues, less operating revenues of Oncor Electric Delivery Transition Bond Company LLC (BondCo) Adjusted Net Income (non-GAAP) Oncor net income, less effects of purchase accounting and net income of BondCo Debt (non-GAAP) Oncor total debt, less transition bonds of BondCo Operating Cash Flow (non-GAAP) Oncor cash provided by operating activities, less BondCo cash provided by operating activities Total Debt (GAAP) Oncor long-term debt (including current portion), plus bank loans and commercial paper EBITDA (non-GAAP) Income from continuing operations before interest expense and related charges and provisions in lieu of income tax, plus depreciation and amortization and special items. EBITDA is a measure used by Oncor to assess performance. Debt/EBITDA (non-GAAP) Total debt less transition bonds divided by EBITDA. Transition, or securitization, bonds are serviced by a regulatory transition charge on wires rates and are therefore excluded from debt in credit reviews. Debt / EBITDA is a measure used by Oncor to assess credit quality. EBITDA/Interest (non-GAAP) EBITDA divided by cash interest expense is a measure used by Oncor to assess credit quality. Financial Definitions |
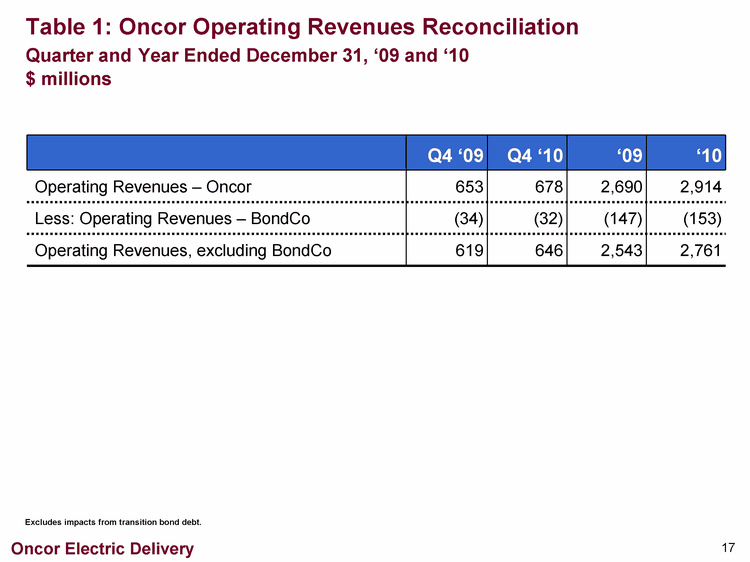
| Table 1: Oncor Operating Revenues Reconciliation Quarter and Year Ended December 31, '09 and '10 $ millions Q4 '09 Q4 '10 '09 '10 Operating Revenues - Oncor 653 678 2,690 2,914 Less: Operating Revenues - BondCo (34) (32) (147) (153) Operating Revenues, excluding BondCo 619 646 2,543 2,761 Excludes impacts from transition bond debt. |
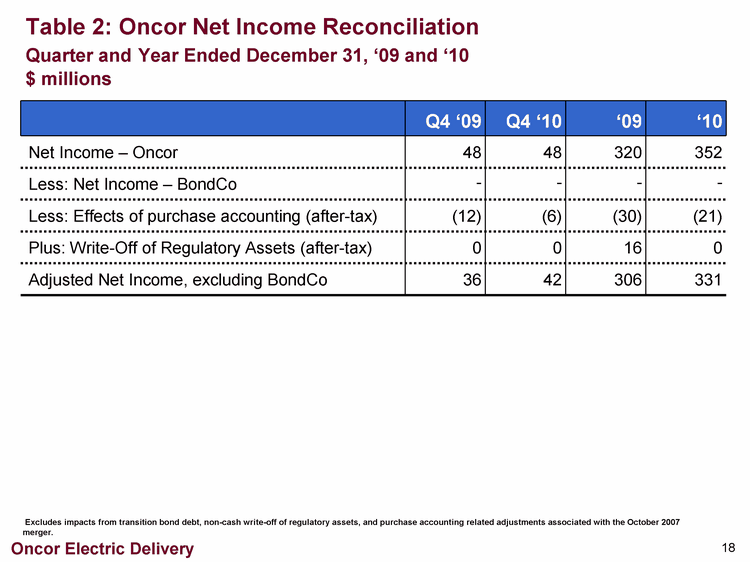
| Q4 '09 Q4 '10 '09 '10 Net Income - Oncor 48 48 320 352 Less: Net Income - BondCo - - - - Less: Effects of purchase accounting (after-tax) (12) (6) (30) (21) Plus: Write-Off of Regulatory Assets (after-tax) 0 0 16 0 Adjusted Net Income, excluding BondCo 36 42 306 331 Table 2: Oncor Net Income Reconciliation Quarter and Year Ended December 31, '09 and '10 $ millions Excludes impacts from transition bond debt, non-cash write-off of regulatory assets, and purchase accounting related adjustments associated with the October 2007 merger. |
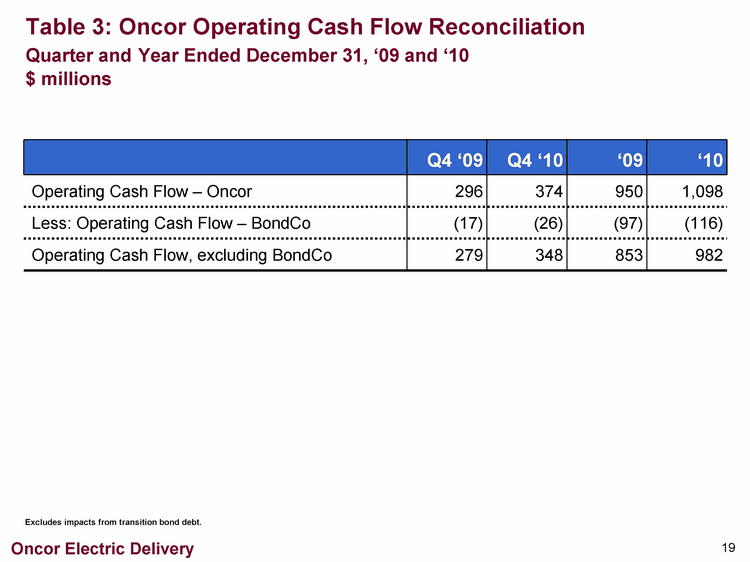
| Table 3: Oncor Operating Cash Flow Reconciliation Quarter and Year Ended December 31, '09 and '10 $ millions Q4 '09 Q4 '10 '09 '10 Operating Cash Flow - Oncor 296 374 950 1,098 Less: Operating Cash Flow - BondCo (17) (26) (97) (116) Operating Cash Flow, excluding BondCo 279 348 853 982 Excludes impacts from transition bond debt. |
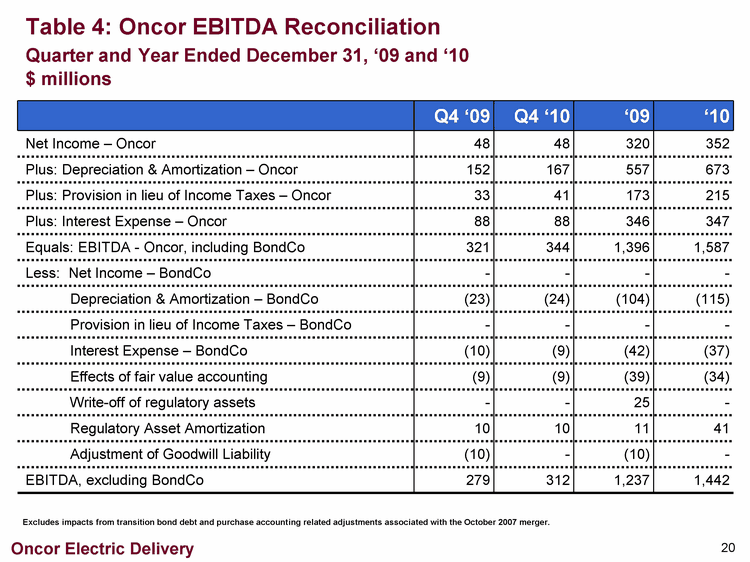
| Table 4: Oncor EBITDA Reconciliation Quarter and Year Ended December 31, '09 and '10 $ millions Q4 '09 Q4 '10 '09 '10 Net Income - Oncor 48 48 320 352 Plus: Depreciation & Amortization - Oncor 152 167 557 673 Plus: Provision in lieu of Income Taxes - Oncor 33 41 173 215 Plus: Interest Expense - Oncor 88 88 346 347 Equals: EBITDA - Oncor, including BondCo 321 344 1,396 1,587 Less: Net Income - BondCo - - - - Depreciation & Amortization - BondCo (23) (24) (104) (115) Provision in lieu of Income Taxes - BondCo - - - - Interest Expense - BondCo (10) (9) (42) (37) Effects of fair value accounting (9) (9) (39) (34) Write-off of regulatory assets - - 25 - Regulatory Asset Amortization 10 10 11 41 Adjustment of Goodwill Liability (10) - (10) - EBITDA, excluding BondCo 279 312 1,237 1,442 Excludes impacts from transition bond debt and purchase accounting related adjustments associated with the October 2007 merger. |
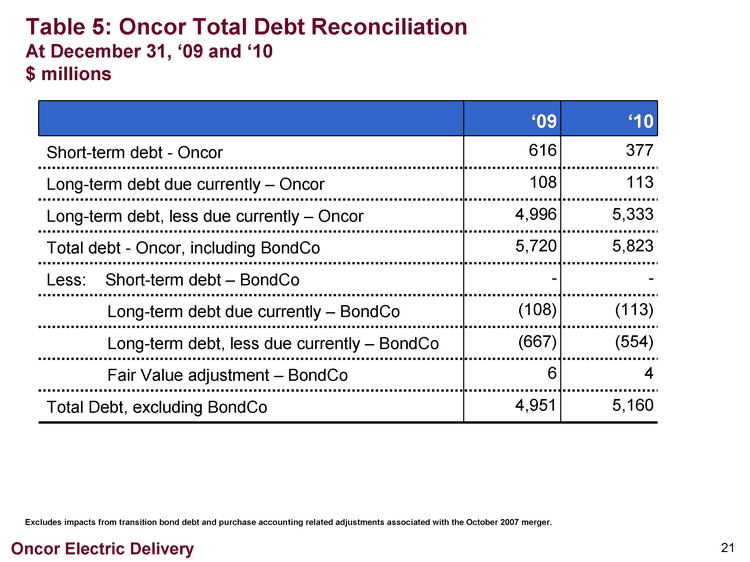
| Table 5: Oncor Total Debt Reconciliation At December 31, '09 and '10 $ millions '09 '10 Short-term debt - Oncor 616 377 Long-term debt due currently - Oncor 108 113 Long-term debt, less due currently - Oncor 4,996 5,333 Total debt - Oncor, including BondCo 5,720 5,823 Less: Short-term debt - BondCo - - Long-term debt due currently - BondCo (108) (113) Long-term debt, less due currently - BondCo (667) (554) Fair Value adjustment - BondCo 6 4 Total Debt, excluding BondCo 4,951 5,160 Excludes impacts from transition bond debt and purchase accounting related adjustments associated with the October 2007 merger. |
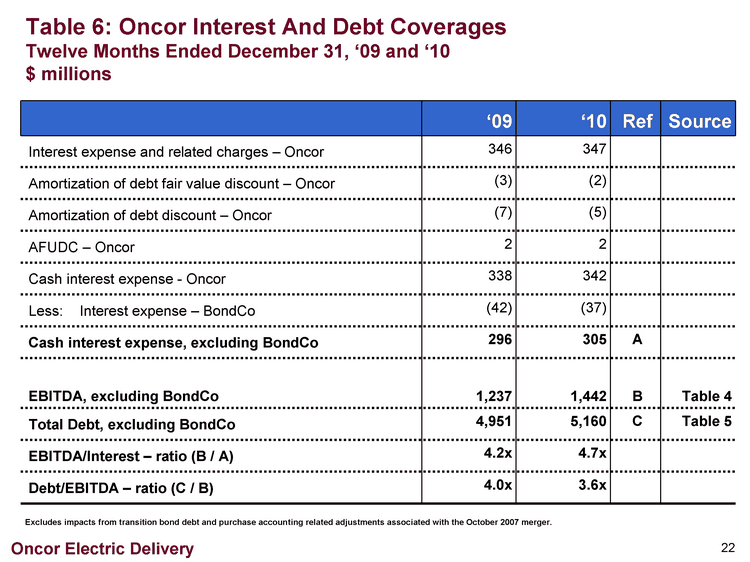
| Table 6: Oncor Interest And Debt Coverages Twelve Months Ended December 31, '09 and '10 $ millions '09 '10 Ref Source Interest expense and related charges - Oncor 346 347 Amortization of debt fair value discount - Oncor (3) (2) Amortization of debt discount - Oncor (7) (5) AFUDC - Oncor 2 2 Cash interest expense - Oncor 338 342 Less: Interest expense - BondCo (42) (37) Cash interest expense, excluding BondCo 296 305 A EBITDA, excluding BondCo 1,237 1,442 B Table 4 Total Debt, excluding BondCo 4,951 5,160 C Table 5 EBITDA/Interest - ratio (B / A) 4.2x 4.7x Debt/EBITDA - ratio (C / B) 4.0x 3.6x Excludes impacts from transition bond debt and purchase accounting related adjustments associated with the October 2007 merger. |
