Attached files
| file | filename |
|---|---|
| 8-K - FORM 8-K - LyondellBasell Industries N.V. | h79851e8vk.htm |
| EX-99.1 - EX-99.1 - LyondellBasell Industries N.V. | h79851exv99w1.htm |
Exhibit 99.2

| Fourth-Quarter 2010 Earnings Jim Gallogly, Chief Executive Officer Kent Potter, Chief Financial Officer Sergey Vasnetsov, SVP - Strategic Planning and Transactions February 18, 2011 |

| 2 Fourth-Quarter 2010 Earnings Cautionary Statement The information in this presentation includes forward-looking statements. These statements relate to future events, such as anticipated revenues, earnings, business strategies, competitive position or other aspects of our operations or operating results. Actual outcomes and results may differ materially from what is expressed or forecast in such forward^looking statements. These statements are not guarantees of future performance and involve certain risks, uncertainties and assumptions that are difficult to predict. Factors that could cause actual results to differ from forward-looking statement include, but are not limited to, availability, cost and price volatility of raw materials and utilities; supply/demand balances; industry production capacities and operating rates; uncertainties associated with worldwide economies; legal, tax and environmental proceedings; cyclical nature of the chemical and refining industries; operating interruptions; current and potential governmental regulatory actions; terrorist acts; international political unrest; competitive products and pricing; technological developments; the ability to comply with the terms of our credit facilities and other financing arrangements; the ability to implement business strategies; and other factors affecting our business generally as set forth in our filings with the Securities and Exchange Commission, which can be found at www.lyondellbasell.com on the Investor Relations page and on the Securities and Exchange Commission's website at www.sec.gov. This presentation contains time sensitive information that is accurate only as of the date hereof. Information contained in this presentation is unaudited and is subject to change. We undertake no obligation to update the information presented herein except as required by law. |
| 3 Fourth-Quarter 2010 Earnings Information Related to Financial Measures In this presentation, we have used non-GAAP financial measures, as defined in Regulation G of the U.S. Securities Exchange Act of 1934, as amended. These non-GAAP financial measures should be considered as a supplement to, and not as a substitute for, or superior to, financial measures prepared in accordance with GAAP. The company reports its financial information for a predecessor period ending on April 30, 2010, the date of emergence from chapter 11, and a successor period after such date in accordance with GAAP. We have presented "combined" results of operations for the full year 2010. Combined results of operations are non-GAAP because they combine two separate reporting entities. We have included the combined financial information because we believe it gives investors a better understanding of the year-over-year comparisons. We also use EBITDA, EBITDAR and EBITDA(R), as well as those measures on an adjusted basis. Reconciliations of non-GAAP measures to their nearest GAAP financial measures are provided in Table 9 of our earnings release, available on our website at www.lyondellbasell.com/investorrelations. In our predecessor period, we utilized a combination of First In-First Out and Last In-First Out inventory methods for financial reporting. For purposes of evaluating segment results, management reviewed operating results using current cost, which approximates LIFO. As supplementary information, and for our segment reporting, we also provide EBITDAR information on a current cost basis for predecessor periods. In our successor periods, we have utilized the LIFO inventory methodology and EBITDA information for periods after our emergence is on a LIFO basis. The combined financial results and measures that are disclosed in this presentation therefore use both current cost and LIFO methodologies. |
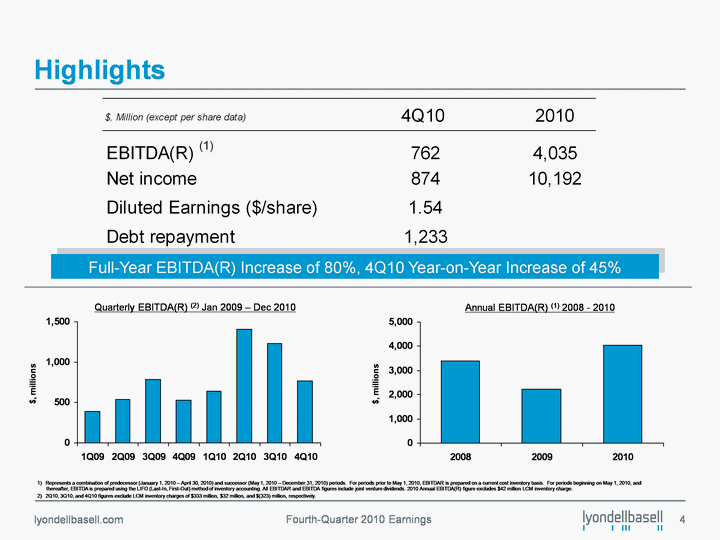
| 4 Fourth-Quarter 2010 Earnings Highlights 1Q09 2Q09 3Q09 4Q09 1Q10 2Q10 3Q10 4Q10 East 390 537 783 526 640 1403 1230 764 Quarterly EBITDA(R) (2) Jan 2009 - Dec 2010 1) Represents a combination of predecessor (January 1, 2010 - April 30, 2010) and successor (May 1, 2010 - December 31, 2010) periods. For periods prior to May 1, 2010, EBITDAR is prepared on a current cost inventory basis. For periods beginning on May 1, 2010, and thereafter, EBITDA is prepared using the LIFO (Last-In, First-Out) method of inventory accounting. All EBITDAR and EBITDA figures include joint venture dividends. 2010 Annual EBITDA(R) figure excludes $42 million LCM inventory charge. 2) 2Q10, 3Q10, and 4Q10 figures exclude LCM inventory charges of $333 million, $32 million, and $(323) million, respectively. 2008 2009 2010 East 3395 2236 4037 Annual EBITDA(R) (1) 2008 - 2010 Full-Year EBITDA(R) Increase of 80%, 4Q10 Year-on-Year Increase of 45% |
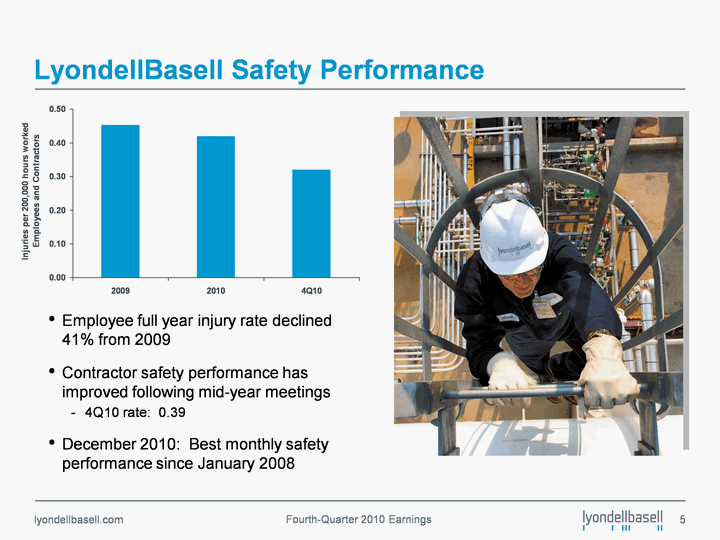
| 5 Fourth-Quarter 2010 Earnings LyondellBasell Safety Performance Employee full year injury rate declined 41% from 2009 Contractor safety performance has improved following mid-year meetings 4Q10 rate: 0.39 December 2010: Best monthly safety performance since January 2008 |
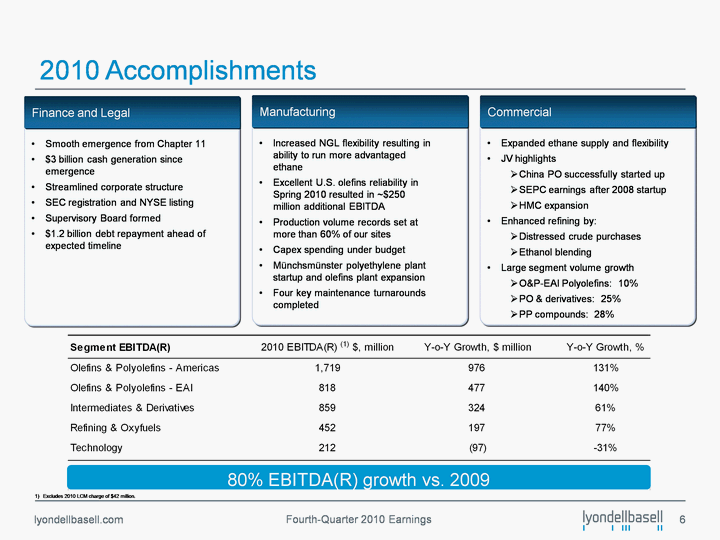
| 6 Fourth-Quarter 2010 Earnings Smooth emergence from Chapter 11 $3 billion cash generation since emergence Streamlined corporate structure SEC registration and NYSE listing Supervisory Board formed $1.2 billion debt repayment ahead of expected timeline Finance and Legal 2010 Accomplishments Increased NGL flexibility resulting in ability to run more advantaged ethane Excellent U.S. olefins reliability in Spring 2010 resulted in ~$250 million additional EBITDA Production volume records set at more than 60% of our sites Capex spending under budget Munchsmunster polyethylene plant startup and olefins plant expansion Four key maintenance turnarounds completed Manufacturing Expanded ethane supply and flexibility JV highlights China PO successfully started up SEPC earnings after 2008 startup HMC expansion Enhanced refining by: Distressed crude purchases Ethanol blending Large segment volume growth O&P-EAI Polyolefins: 10% PO & derivatives: 25% PP compounds: 28% Commercial 1) Excludes 2010 LCM charge of $42 million. 80% EBITDA(R) growth vs. 2009 |

| 7 Fourth-Quarter 2010 Earnings Key Volumes and Margins - 2008 - 2010 HRO Volumes PE Volumes PP Volumes Maya 2-1-1 Spreads PE Spreads PP Spreads Ethylene Volumes Ethylene Plant Cash Margins 2008 2009 2010 PO&D Volumes Intermediates Volumes |
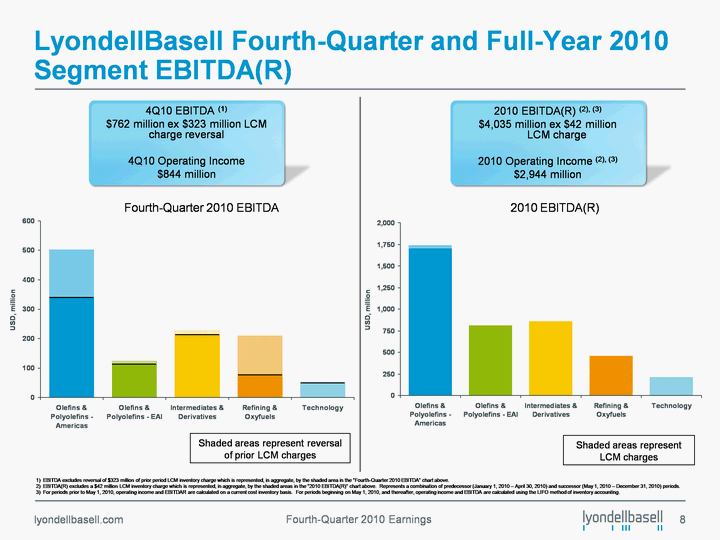
| 8 Fourth-Quarter 2010 Earnings LyondellBasell Fourth-Quarter and Full-Year 2010 Segment EBITDA(R) 2010 EBITDA(R) 2010 EBITDA(R) (2), (3) $4,035 million ex $42 million LCM charge 2010 Operating Income (2), (3) $2,944 million 4Q10 EBITDA (1) $762 million ex $323 million LCM charge reversal 4Q10 Operating Income $844 million Fourth-Quarter 2010 EBITDA 1) EBITDA excludes reversal of $323 million of prior period LCM inventory charge which is represented, in aggregate, by the shaded area in the "Fourth-Quarter 2010 EBITDA" chart above. 2) EBITDA(R) excludes a $42 million LCM inventory charge which is represented, in aggregate, by the shaded areas in the "2010 EBITDA(R)" chart above. Represents a combination of predecessor (January 1, 2010 - April 30, 2010) and successor (May 1, 2010 - December 31, 2010) periods. 3) For periods prior to May 1, 2010, operating income and EBITDAR are calculated on a current cost inventory basis. For periods beginning on May 1, 2010, and thereafter, operating income and EBITDA are calculated using the LIFO method of inventory accounting. Shaded areas represent LCM charges Shaded areas represent reversal of prior LCM charges |
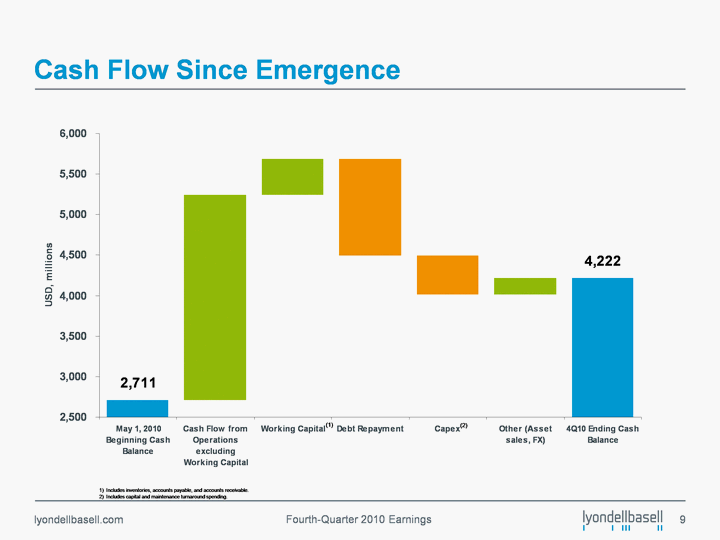
| 9 Fourth-Quarter 2010 Earnings Cash Flow Since Emergence 1) Includes inventories, accounts payable, and accounts receivable. 2) Includes capital and maintenance turnaround spending. (2) (1) |

| 10 Fourth-Quarter 2010 Earnings Working Capital and Liquidity Working Capital (1) Liquidity Snapshot at Dec. 31, 2010 Liquidity: ~ $6.1 billion Net Debt: ~ $1.9 billion 1) Beginning in the second quarter 2010, working capital accounts reflect the impact of reorganization and fresh-start accounting adjustments. |
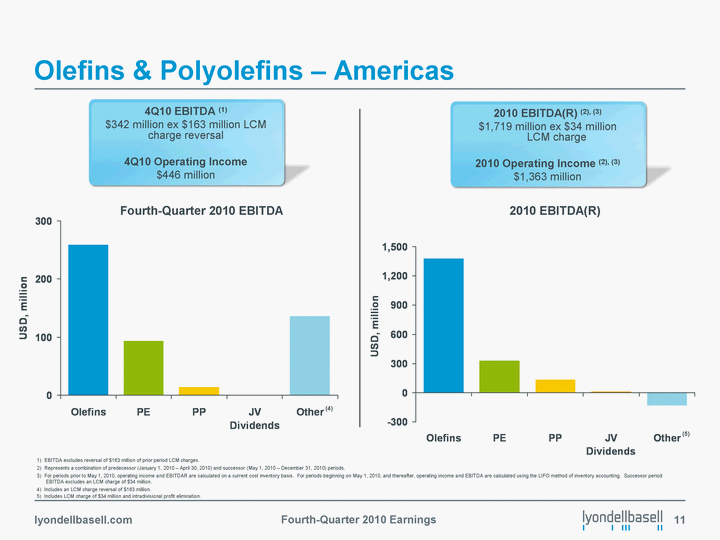
| 11 Fourth-Quarter 2010 Earnings Olefins & Polyolefins - Americas 2010 EBITDA(R) 2010 EBITDA(R) (2), (3) $1,719 million ex $34 million LCM charge 2010 Operating Income (2), (3) $1,363 million 1) EBITDA excludes reversal of $163 million of prior period LCM charges. 2) Represents a combination of predecessor (January 1, 2010 - April 30, 2010) and successor (May 1, 2010 - December 31, 2010) periods. 3) For periods prior to May 1, 2010, operating income and EBITDAR are calculated on a current cost inventory basis. For periods beginning on May 1, 2010, and thereafter, operating income and EBITDA are calculated using the LIFO method of inventory accounting. Successor period EBITDA excludes an LCM charge of $34 million. 4) Includes an LCM charge reversal of $163 million. 5) Includes LCM charge of $34 million and intradivisional profit elimination. 4Q10 EBITDA (1) $342 million ex $163 million LCM charge reversal 4Q10 Operating Income $446 million Fourth-Quarter 2010 EBITDA (4) (5) |
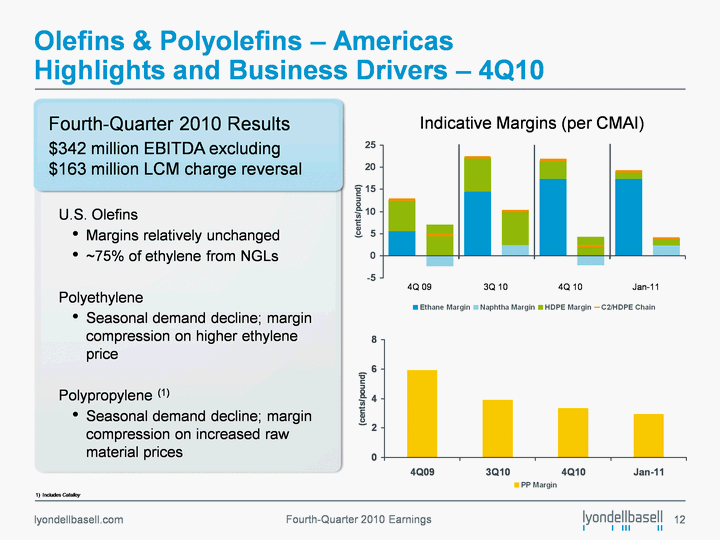
| 12 Fourth-Quarter 2010 Earnings Olefins & Polyolefins - Americas Highlights and Business Drivers - 4Q10 Fourth-Quarter 2010 Results $342 million EBITDA excluding $163 million LCM charge reversal U.S. Olefins Margins relatively unchanged ~75% of ethylene from NGLs Polyethylene Seasonal demand decline; margin compression on higher ethylene price Polypropylene (1) Seasonal demand decline; margin compression on increased raw material prices 1) Includes Catalloy Indicative Margins (per CMAI) 4Q 09 3Q 10 4Q 10 Jan-11 |
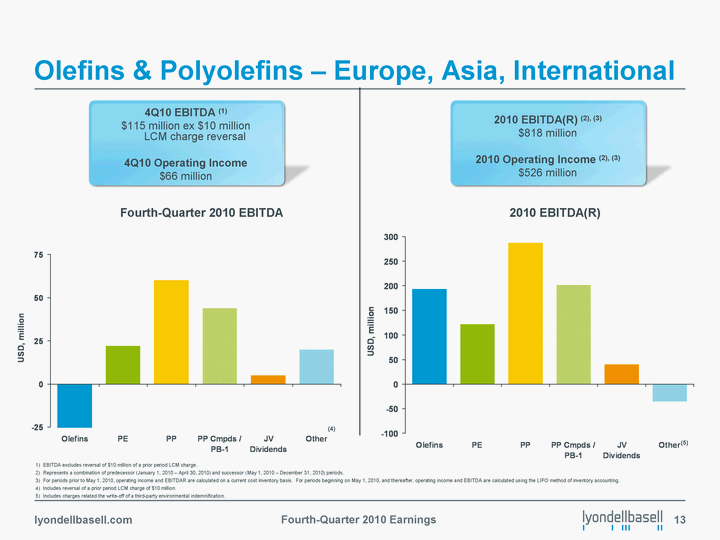
| 13 Fourth-Quarter 2010 Earnings 1) EBITDA excludes reversal of $10 million of a prior period LCM charge. 2) Represents a combination of predecessor (January 1, 2010 - April 30, 2010) and successor (May 1, 2010 - December 31, 2010) periods. 3) For periods prior to May 1, 2010, operating income and EBITDAR are calculated on a current cost inventory basis. For periods beginning on May 1, 2010, and thereafter, operating income and EBITDA are calculated using the LIFO method of inventory accounting. 4) Includes reversal of a prior period LCM charge of $10 million. 5) Includes charges related the write-off of a third-party environmental indemnification. (4) Olefins & Polyolefins - Europe, Asia, International 2010 EBITDA(R) 2010 EBITDA(R) (2), (3) $818 million 2010 Operating Income (2), (3) $526 million 4Q10 EBITDA (1) $115 million ex $10 million LCM charge reversal 4Q10 Operating Income $66 million Fourth-Quarter 2010 EBITDA (5) |
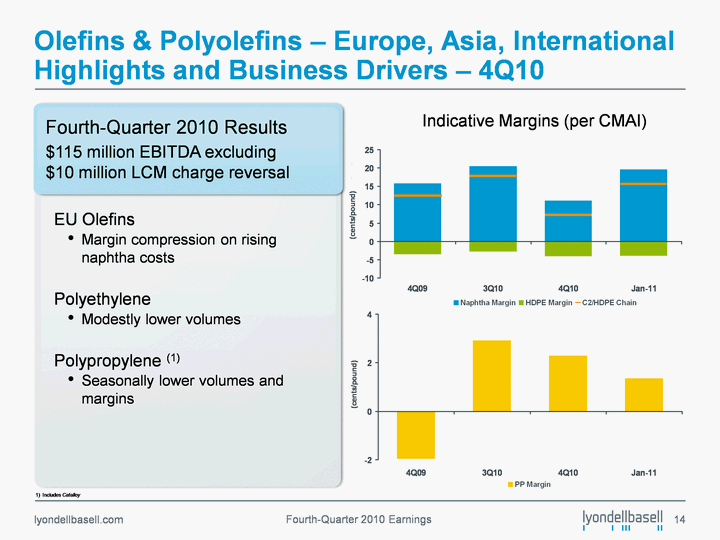
| 14 Fourth-Quarter 2010 Earnings Olefins & Polyolefins - Europe, Asia, International Highlights and Business Drivers - 4Q10 Fourth-Quarter 2010 Results $115 million EBITDA excluding $10 million LCM charge reversal Indicative Margins (per CMAI) EU Olefins Margin compression on rising naphtha costs Polyethylene Modestly lower volumes Polypropylene (1) Seasonally lower volumes and margins 1) Includes Catalloy |
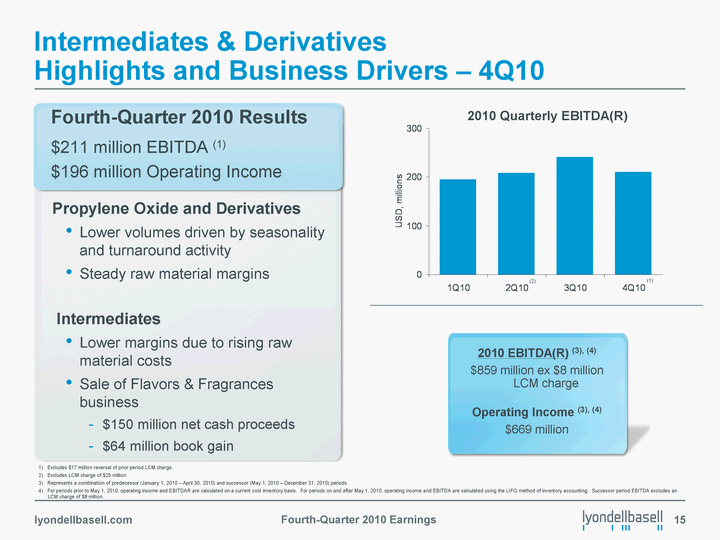
| 15 Fourth-Quarter 2010 Earnings Intermediates & Derivatives Highlights and Business Drivers - 4Q10 Propylene Oxide and Derivatives Lower volumes driven by seasonality and turnaround activity Steady raw material margins Intermediates Lower margins due to rising raw material costs Sale of Flavors & Fragrances business $150 million net cash proceeds $64 million book gain 2010 EBITDA(R) (3), (4) $859 million ex $8 million LCM charge Operating Income (3), (4) $669 million Fourth-Quarter 2010 Results $211 million EBITDA (1) $196 million Operating Income 2010 Quarterly EBITDA(R) 1) Excludes $17 million reversal of prior period LCM charge. 2) Excludes LCM charge of $25 million. 3) Represents a combination of predecessor (January 1, 2010 - April 30, 2010) and successor (May 1, 2010 - December 31, 2010) periods. 4) For periods prior to May 1, 2010, operating income and EBITDAR are calculated on a current cost inventory basis. For periods on and after May 1, 2010, operating income and EBITDA are calculated using the LIFO method of inventory accounting. Successor period EBITDA excludes an LCM charge of $8 million. (1) (2) |
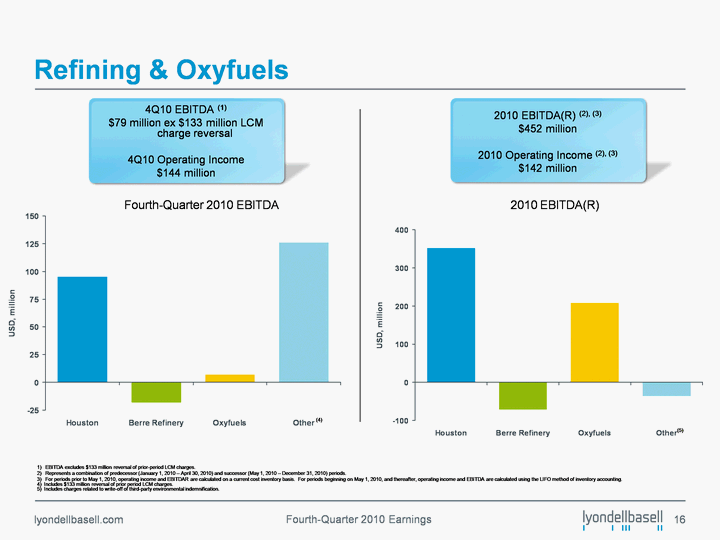
| 16 Fourth-Quarter 2010 Earnings Refining & Oxyfuels 2010 EBITDA(R) 2010 EBITDA(R) (2), (3) $452 million 2010 Operating Income (2), (3) $142 million 4Q10 EBITDA (1) $79 million ex $133 million LCM charge reversal 4Q10 Operating Income $144 million Fourth-Quarter 2010 EBITDA (4) 1) EBITDA excludes $133 million reversal of prior-period LCM charges. 2) Represents a combination of predecessor (January 1, 2010 - April 30, 2010) and successor (May 1, 2010 - December 31, 2010) periods. 3) For periods prior to May 1, 2010, operating income and EBITDAR are calculated on a current cost inventory basis. For periods beginning on May 1, 2010, and thereafter, operating income and EBITDA are calculated using the LIFO method of inventory accounting. 4) Includes $133 million reversal of prior period LCM charges. 5) Includes charges related to write-off of third-party environmental indemnification. (5) |
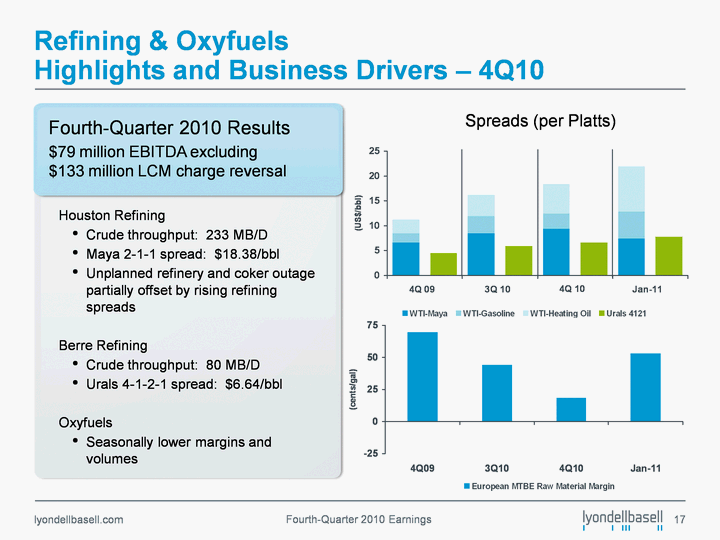
| 17 Fourth-Quarter 2010 Earnings Refining & Oxyfuels Highlights and Business Drivers - 4Q10 Spreads (per Platts) Fourth-Quarter 2010 Results $79 million EBITDA excluding $133 million LCM charge reversal Houston Refining Crude throughput: 233 MB/D Maya 2-1-1 spread: $18.38/bbl Unplanned refinery and coker outage partially offset by rising refining spreads Berre Refining Crude throughput: 80 MB/D Urals 4-1-2-1 spread: $6.64/bbl Oxyfuels Seasonally lower margins and volumes |
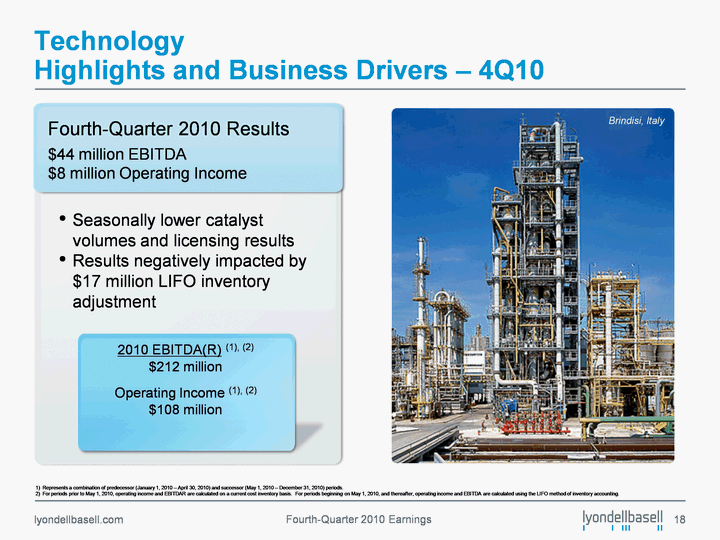
| 18 Fourth-Quarter 2010 Earnings Technology Highlights and Business Drivers - 4Q10 Seasonally lower catalyst volumes and licensing results Results negatively impacted by $17 million LIFO inventory adjustment 2010 EBITDA(R) (1), (2) $212 million Operating Income (1), (2) $108 million Brindisi, Italy Fourth-Quarter 2010 Results $44 million EBITDA $8 million Operating Income 1) Represents a combination of predecessor (January 1, 2010 - April 30, 2010) and successor (May 1, 2010 - December 31, 2010) periods. 2) For periods prior to May 1, 2010, operating income and EBITDAR are calculated on a current cost inventory basis. For periods beginning on May 1, 2010, and thereafter, operating income and EBITDA are calculated using the LIFO method of inventory accounting. |
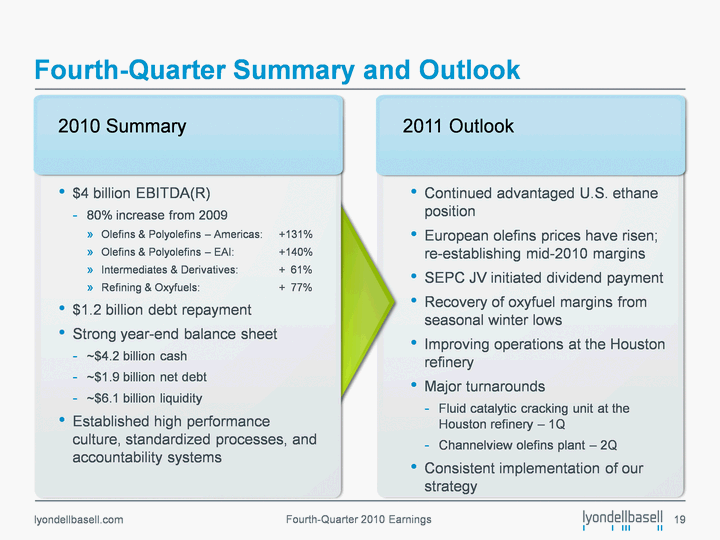
| 19 Fourth-Quarter 2010 Earnings Fourth-Quarter Summary and Outlook Continued advantaged U.S. ethane position European olefins prices have risen; re-establishing mid-2010 margins SEPC JV initiated dividend payment Recovery of oxyfuel margins from seasonal winter lows Improving operations at the Houston refinery Major turnarounds Fluid catalytic cracking unit at the Houston refinery - 1Q Channelview olefins plant - 2Q Consistent implementation of our strategy 2011 Outlook $4 billion EBITDA(R) 80% increase from 2009 Olefins & Polyolefins - Americas: +131% Olefins & Polyolefins - EAI: +140% Intermediates & Derivatives: + 61% Refining & Oxyfuels: + 77% $1.2 billion debt repayment Strong year-end balance sheet ~$4.2 billion cash ~$1.9 billion net debt ~$6.1 billion liquidity Established high performance culture, standardized processes, and accountability systems 2010 Summary |
