Attached files
| file | filename |
|---|---|
| 8-K - FORM 8-K - Energy Future Holdings Corp /TX/ | d8k.htm |
| EX-99.1 - PRESS RELEASE - Energy Future Holdings Corp /TX/ | dex991.htm |
 EFH
Corp. Q4 2010 Investor Call
February 18, 2011
Exhibit 99.2 |
 1
Safe Harbor Statement
Forward Looking Statements
This
presentation
contains
forward-looking
statements,
which
are
subject
to
various
risks
and
uncertainties.
Discussion
of
risks
and
uncertainties
that
could
cause
actual
results
to
differ
materially
from
management's
current
projections,
forecasts,
estimates
and
expectations
is
contained
in
EFH
Corp.'s
filings
with
the
Securities
and
Exchange
Commission
(SEC).
In
addition
to
the
risks
and
uncertainties
set
forth
in
EFH
Corp.'s
SEC
filings,
the
forward-looking
statements
in
this
presentation
regarding
the
company’s
long-term
hedging
program
could
be
affected
by,
among
other
things:
any
change
in
the
ERCOT
electricity
market,
including
a
regulatory
or
legislative
change,
that
results
in
wholesale
electricity
prices
not
being
largely
correlated
to
natural
gas
prices;
any
decrease
in
market
heat
rates
as
the
long-term
hedging
program
generally
does
not
mitigate
exposure
to
changes
in
market
heat
rates;
the
unwillingness
or
failure
of
any
hedge
counterparty
or
the
lenders
under
the
commodity
collateral
posting
facility
to
perform
their
respective
obligations;
or
any
other
unforeseen
event
that
results
in
the
inability
to
continue
to
use
a
first
lien
on
TCEH’s
assets
to
secure
a
substantial
portion
of
the
hedges
under
the
long-term
hedging
program.
Regulation G
This
presentation
includes
certain
non-GAAP
financial
measures.
A
reconciliation
of
these
measures
to
the
most
directly
comparable
GAAP
measures
is
included
in
the
appendix
to
this
presentation. |
 2
Today’s Agenda
Q&A
Financial and Operational
Overview
Q4 2010 Review
Paul Keglevic
Executive Vice President & CFO |
 Consolidated: reconciliation of GAAP net income to adjusted (non-GAAP) operating
results Q4
1
09
vs.
Q4
10
;
$
millions,
after
tax
1
Three months ended December 31
2
Q4 09 reflects $22 million of land impairment partially offset by $14 million of
reversal of purchase accounting reserves. EFH Corp.
Adjusted (Non-GAAP) Operating Results -
QTR
3
Factor
Q4 09
Q4 10
Change
EFH Corp. GAAP net income
137
161
24
Items excluded from adjusted (non-GAAP) operating results (after tax) -
noncash:
Unrealized commodity-related mark-to-market net (gains) losses
(330)
254
584
Unrealized mark-to-market net gains on interest rate swaps
(110)
(218)
(108)
Debt extinguishment gains –
debt exchanges and repurchases
(56)
(417)
(361)
Gain on termination of long-term power sales contract
-
(75)
(75)
Other (noncash)²
8
-
(8)
EFH Corp. adjusted (non-GAAP) operating loss
(351)
(295)
56 |
 Consolidated key drivers of the change in (non-GAAP) operating results
Q4
1
10 vs. Q4 09; $ millions, after tax
EFH Corp.
Adjusted
(Non-GAAP)
Operating
Results
Key
Drivers
(after
tax)
-
QTR
1
Three months ended December 31
2
Competitive business consists of Competitive Electric segment and Corp. &
Other. 4
Description/Drivers
Better
(Worse)
Than
Q4 09
Competitive
business²:
Impact of new lignite-fueled generation units
35
Higher production from legacy baseload generation units
26
Lower amortization of intangibles arising from purchase accounting
21
Lower net margin from asset management and retail activities
(22)
Higher fuel costs at legacy baseload units due to increased coal
transportation expenses and higher uranium and conversion costs
(19)
Lower retail volumes primarily due to weather
(17)
All other -
net
(3)
Contribution margin
21
Lower net interest expense driven by liability management program and lower noncash
amortization of swap losses 36
Improvement in effective tax rate due primarily to lower accrued
interest on uncertain tax positions
25
Lower costs related to outsourcing transition and other SG&A reductions
13
Lower retail bad debt expense
6
Higher depreciation reflecting the new lignite-fueled generation units and mining
facilities and ongoing investment in the generation fleet (31)
Higher operating costs related to the new and legacy baseload generation
units (12)
All other -
net
(7)
Total improvement -
Competitive business
51
Regulated business:
Higher revenues from transmission rate increases, distribution tariffs approved in
the September 2009 rate order and AMS surcharge 18
Higher depreciation reflecting infrastructure investment and higher depreciation
rates approved in the September 2009 rate order (9)
Lower volumes primarily due to weather
(4)
Total improvement –
Regulated business (~80% owned by EFH Corp.)
5
Total improvement in EFH Corp. adjusted (non-GAAP) operating results
56 |
 Factor
FY 09
FY 10
Change
EFH Corp. GAAP net income (loss)
344
(2,812)
(3,156)
Items excluded from adjusted (non-GAAP) operating results (after tax) -
noncash:
Unrealized commodity-related mark-to-market net gains
(788)
(786)
2
Unrealized mark-to-market net (gains) losses on interest rate swaps
(452)
134
586
Goodwill impairment
90
4,100
4,010
Debt extinguishment gains –
debt exchanges and repurchases
(56)
(1,168)
(1,112)
Reduction of income tax expense due to expected resolution of
IRS tax audit for 1997-
2002
-
(146)
(146)
Gain on termination of long-term power sales contract
-
(75)
(75)
Income tax charge recorded as a result of health care legislation
-
8
8
Other (noncash)
2
10
-
(10)
EFH Corp. adjusted (non-GAAP) operating loss
(852)
(745)
107
Consolidated: reconciliation of GAAP net income to adjusted (non-GAAP) operating
results FY
1
09
vs.
FY
10;
$
millions,
after
tax
1
Full year ended December 31
2
Full
year
09
reflects,
after
tax,
$22
million
of
land
impairment
and
$16
million
of
write-off
of
rate
case
disallowed
regulatory
assets,
partially
offset
by
$14
million
of
reversal
of
purchase
accounting
reserves
and
$14
million
arising
from
the
reversal
of
a
use
tax
accrual
recorded
in
purchase
accounting
related
to
periods
prior
to
the
October
2007
merger.
EFH Corp.
Adjusted (Non-GAAP) Operating Results –
Full Year
5 |
 Consolidated key drivers of the change in (non-GAAP) operating results
FY
1
10
vs.
FY
09;
$
millions,
after
tax
1
Full year ended December 31
2
Competitive business consists of Competitive Electric segment and Corp. &
Other. EFH Corp.
Adjusted
(Non-GAAP)
Operating
Results
Key
Drivers
(after
tax)
–
FY
6
Description/Drivers
Better
(Worse)
Than
FY 09
Competitive business²:
Impact of new lignite-fueled generation units
255
Lower amortization of intangibles arising from purchase accounting
87
Higher retail volumes primarily due to weather
8
Higher fuel costs at legacy baseload units due to increased coal
transportation expenses and higher uranium and conversion costs
(106)
Lower net margin from asset management and retail activities
(37)
All other -
net
(4)
Contribution margin
203
Lower costs related to outsourcing transition, new retail customer care system
and other SG&A reductions 75
Gains on sales of assets (reported in other income)
57
Improvement in effective tax rate due primarily to lower accrued
interest on uncertain tax positions
37
Lower retail bad debt expense
5
Higher depreciation reflecting the new lignite-fueled generation units and mining
facilities and ongoing investment in the generation fleet (135)
Higher operating costs related to the new and legacy baseload generation
units (95)
Higher net interest expense driven by lower capitalized interest
due to completion of the new generation units
(51)
Total improvement -
Competitive business
96
Regulated business:
Higher distribution tariffs, including the rates approved in the
September 2009 rate review order
62
Higher volumes primarily driven by the effects of weather
31
Surcharge to recover AMS deployment costs
30
Higher transmission revenues primarily due to a rate increase to
recover ongoing investment
17
Higher depreciation reflecting higher depreciation rates approved in the September
rate review order and infrastructure investment (75)
Higher costs reflecting amortization of regulatory assets approved for recovery, AMS
implementation and higher transmission fees (52)
Change in effective tax rate due to accrued interest adjustment in 2009 and tax on
Medicare subsidy (21)
All other –
net primarily includes noncontrolling interests and lower contractor, professional
and outsourced services 19
Total improvement –
Regulated business (~80% owned by EFH Corp.)
11
Total improvement in EFH Corp. adjusted (non-GAAP) operating results
107 |
 EFH
Corp. Adjusted EBITDA (Non-GAAP) FY 10
FY 09
5,240
4,857
1
See Appendix for Regulation G reconciliations and definition. Includes $(2)
million, $5 million, $13 million and $28 million in Q4 09, Q4 10, FY 09 and FY 10, respectively, of Corp. &
Other Adjusted EBITDA.
2
Three months ended December 31
3
Full year ended December 31
EFH Corp. Adjusted EBITDA (non-GAAP)
1
Q4
2
09
vs.
Q4
10
and
FY
3
09
vs.
FY
10;
$
millions
Q4 10
Q4 09
1,083
1,038
749
745
329
295
3,689
3,505
1,523
1,339
4%
12%
1%
14%
8%
5%
TCEH
Oncor
Q4 and FY 10 performance was largely driven by the same key drivers impacting
adjusted (non- GAAP) operating results.
7 |
 8
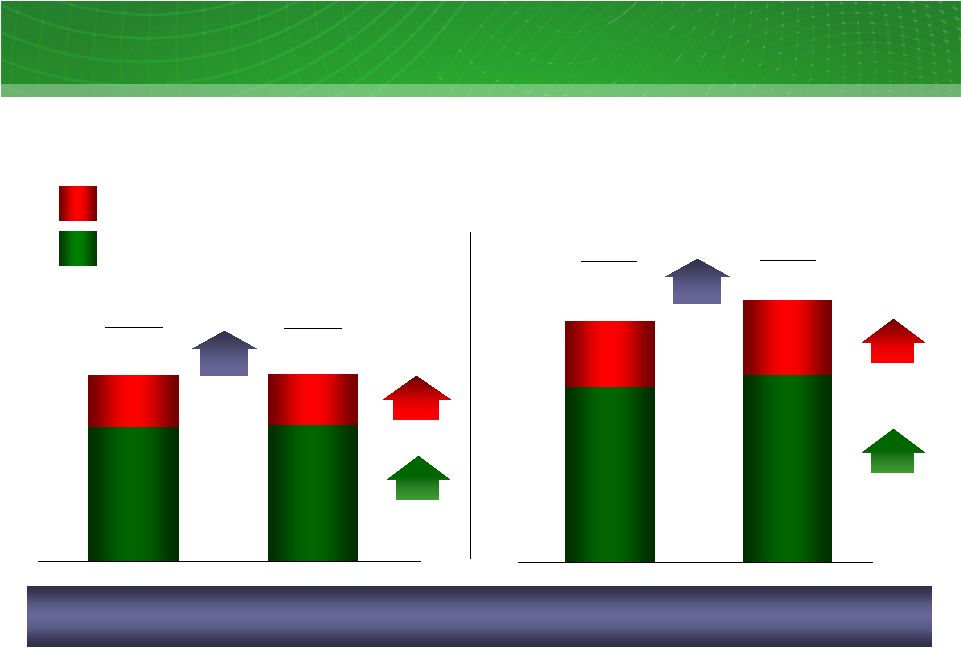
Luminant Operational Results
8
Nuclear-fueled generation; GWh
Coal-fueled generation; GWh
2,891
FY 10
Solid Nuclear performance
Q4 09
12,769
14,032
1
Variance does not include generation from Sandow 5 and Oak Grove
1 & 2.
Sandow 5 & Oak Grove
Legacy coal-fueled plants
Coal-fueled fleet benefiting from new units
Q4 10
Q4 09
4,592
20,104
FY 09
FY 10
20,208
5,368
11,384
54,775
Q4 10
FY 09
2%¹
QTR
2%¹
FY
45,684
17%
QTR
FY 2010 Nuclear Plant Results
Solid safety performance
3
rd
shortest Spring 2010 outage in the industry
Top decile industry performance for reliability
and cost
1%
FY
1,348
1,443
FY 2010 Coal-fueled Plant Results
New plants collectively operated at ~70%
capacity factor
Lower generation due to higher planned
outages and increased economic backdown
partially offset by improved performance
Top quartile industry performance
Q4 2010 Results
New plants generated 2.9 TWh
Nuclear performance 17% higher than Q4 2009
due to outage timing; 2010 outage in Q2, 2009
outage in Q4
Improved legacy coal-fueled plant performance
offset by higher economic backdown
11,421
11,141
44,241
43,391 |
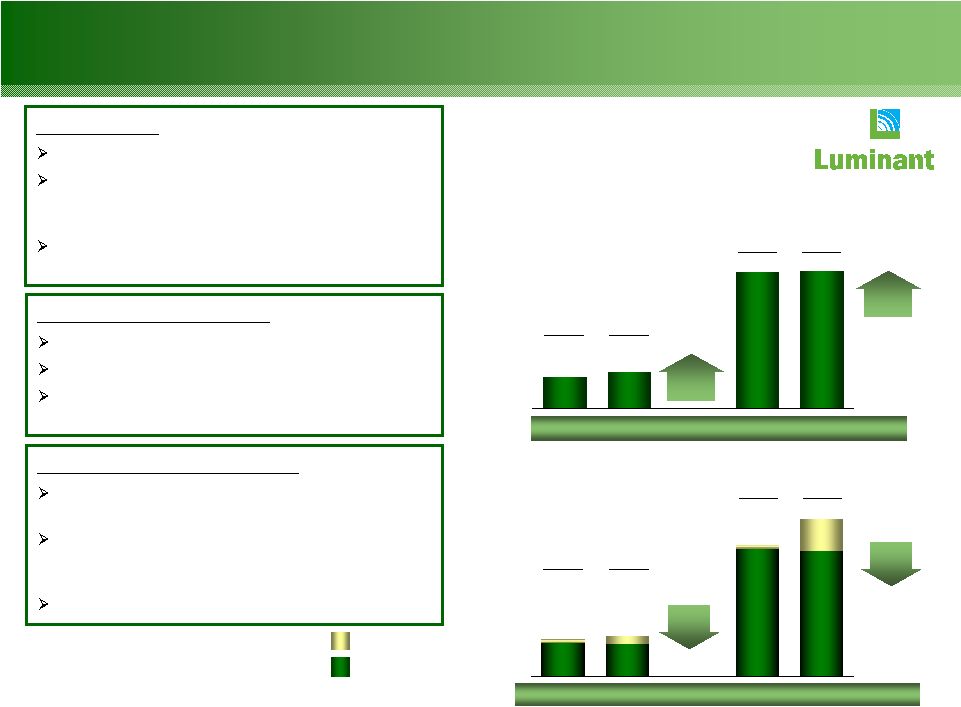
  TXU
Energy Operational Results 9
FY 2010 Results
Lower residential sales volumes
driven by lower customer counts
partially offset by favorable weather
Lower residential customer counts
reflect competitive activity in the
marketplace
Business load growth attributable to
new customers and improved
economy
Continued strong competitive activity
FY volume increases due to weather and improved economy
Total residential customers
End of period, thousands
Retail electricity sales volumes by customer class;
GWh
1,800
1,771
1
SMB –
small business
2
LCI -
large commercial and industrial
3
Latest twelve months
FY 09
SMB¹
LCI²
Residential
Q4 09
11,136
50,581
Q4 09
Q3 10
5% 3
LTM
2%
FY
28,208
5,734
15,339
3,668
1,734
8,042
Q4 10
Q4 10
1,771
1,862
2%
QTR
28,046
14,573
7,962
5,168
3,600
1,651
51,589
10,419
Q4 10
FY 10
6%
QTR
Q4 2010 Results
Lower residential sales volumes
driven by lower customer counts and
unfavorable weather |
 10
15,483
16,355
65,077
67,500
38,299
41,823
8,213
7,704
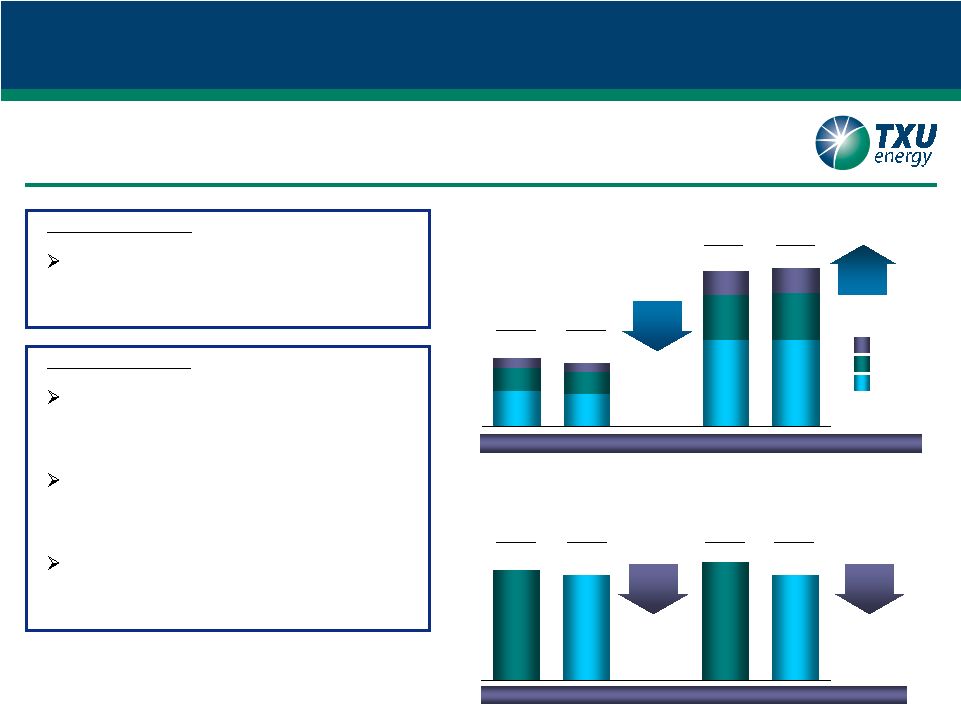
Oncor Operational Results
Billed electric energy volumes³; GWh
Q4 10
Q4 09
Q4 10
Volume increases due to weather and improved economy
Demand
growth
below
ERCOT
estimated
CAGR
of
1.9%
5
FY 2010 Results
Higher billed residential energy volumes due to
warmer weather in Q4 10 and colder weather in
Q1 10 compared to 2009 and premise growth
Higher SMB and LCI
2
energy volumes due to a
slightly improved economy
Execution of AMS
1
plan –
~854,000 advanced
meters installed during 2010; over 1.5 million
installed through December 2010
All CCNs filed with the PUCT; 13 of 14 CCNs
approved through December 2010
1
AMS –
Advanced Metering System
2
SMB –
small business; LCI –
large commercial and industrial
3
Billed volumes are on a 15-day lag therefore include impacts from the prior
quarter 4
Latest twelve months
5
ERCOT’s peak demand growth per May CDR for the period of 2010 to 2015
Residential
SMB & LCI²
23,187
3,145
3,171
1%
LTM
4
Electricity distribution points of delivery
End of period, thousands of meters
Q4 10
Q3 10
3,167
3,171
24,568
103,376
109,323
9%
FY
Q4 09
FY 09
FY 10
Q4 2010 Results
Higher SMB & LCI energy volumes due to
improved economy
Execution of AMS
1
plan –
~171,000 advanced
meters installed during Q4 10
2 Certificates of Convenience and Necessity
(CCNs) approved by the Public Utility
Commission of Texas (PUCT)
6%
QTR
4%
FY |
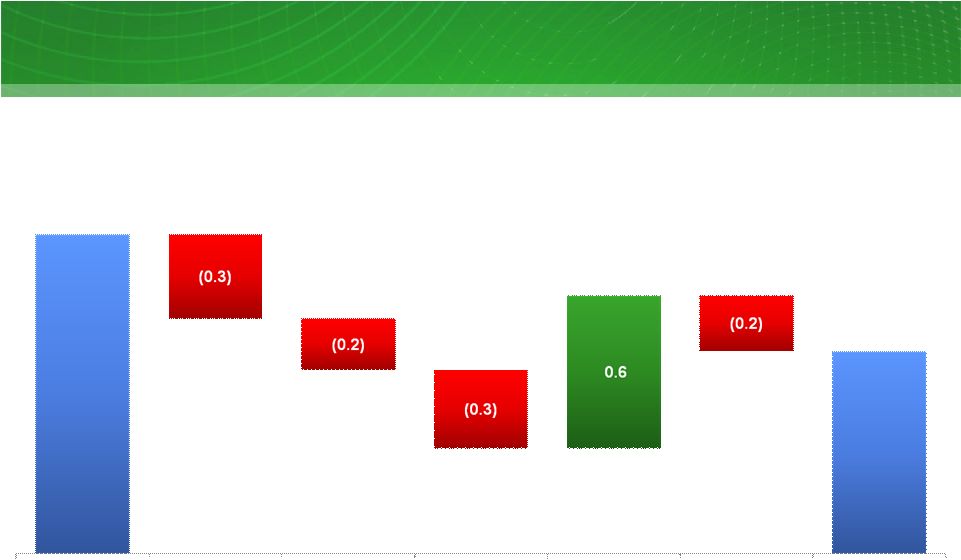 11
Ending Liquidity Walkforward
1
($ in billions)
2010 Ending Liquidity Walkforward
2009A –
2010A
3.7
3.2
1
Values may not foot due to rounding.
2
Free
Cash
Flow
defined
as
Operating
activities
plus
Investing
activities
excluding
changes
in
restricted
cash,
plus
Financing
activities
excluding
issuances
and
repayments
of
debt
and
changes
in
short
term
borrowings.
See
Table
4
for
Free
Cash
Flow
reconciliation.
Under liability
management
program: cash
repurchases net of
issuances
Amortization /
Maturities
Dec -
09
Dec -
10
LC Requirements
Free Cash Flow
2
Repayment of AR |
 12
12
12
Commodity Prices
Commodity
Units
Q4 09 Actual
Q4 10 Actual
YTD 10 Actual
11E
1
NYMEX gas price
2
$/MMBtu
$4.26
$3.78
$4.37
$4.55
HSC gas price
$/MMBtu
$4.25
$3.75
$4.34
$4.49
7x24 market heat rate (HSC)
3
MMBtu/MWh
7.52
7.70
8.34
7.93
North Hub 7x24 power price
$/MWh
$31.68
$28.64
$36.07
$35.59
TCEH weighted avg. hedge price
4
$/MMBtu
$8.07
$7.81
$7.80
$7.56
Gulf Coast ultra-low sulfur diesel
$/gallon
$1.96
$2.34
$2.15
$2.59
PRB 8400 coal
$/ton
$7.18
$9.80
$9.76
$11.03
LIBOR interest rate
5
percent
0.52%
0.45%
0.52%
0.78%
Commodity prices
Q4 09, Q4 10, YTD 10 and 11E; mixed measures
1
BOY 11 estimate based on commodity prices as of 12/31/10 for January 1, 2011
through December 31, 2011 2
Based on NYMEX forward curve
3
Based on ERCOT market clearing price for North Hub power
4
Weighted average prices in the TCEH long-term natural gas hedging
program. Based on NYMEX Henry Hub prices of forward natural gas sales positions in the long-term hedging
program
(excluding the impact of offsetting purchases for rebalancing and pricing point
basis transactions). 5
The index for the settled value is a 6-month LIBOR rate.
|
 13
13
Unrealized Mark-To-Market Impact Of Hedging
Unrealized mark-to-market impact of hedging program
12/31/10 vs. 9/30/10; mixed measures, pre-tax
Factor
Measure
2010
2011
2012
2013
2014
Total or
Avg.
9/30/10
Natural gas hedges
mm MMBtu
~84
~315
~454
~285
~112
~1,250
Wtd. avg. hedge price¹
$/MMBtu
~$7.82
~$7.56
~$7.36
~$7.19
~$7.80
Natural gas prices
$/MMBtu
~$3.94
~$4.44
~$5.07
~$5.29
~$5.42
Cum. MtM gain at 9/30/10²
$ billions
~$0.4
~$1.2
~$1.1
~$0.5
~$0.4
~$3.6
12/31/10
Natural gas hedges³
mm MMBtu
-
~220
~398
~282
~110
~1,010
Wtd. avg. hedge price¹
$/MMBtu
-
~$7.56
~$7.36
~$7.19
~$7.80
Natural gas prices
$/MMBtu
-
~$4.55
~$5.08
~$5.33
~$5.49
Cum. MtM gain at 12/31/10²
$ billions
~$0
~$1.2
~$1.1
~$0.5
~$0.4
~$3.2
Q4 10 MtM (loss) gain
$ billions
~$(0.4)
~$0.0
~$0.0
~$0.0
~$0.0
~$(0.4)
Forward positions in the hedge program slightly lost value due to higher natural gas
prices at the end of Q4, while additional losses resulted from the
reversal of previously recognized gains in the current period, resulting in a
~$400 million (~$260 million after tax) unrealized net loss. 1
Weighted
average
prices
are
based
on
NYMEX
Henry
Hub
prices
of
forward
natural
gas
sales
positions
in
the
long-term
hedging
program
(excluding
the
impact
of
offsetting
purchases
for
rebalancing
and
pricing
point
basis
transactions).
Where
collars
are
reflected,
sales
price
represents
the
collar
floor
price.
12/31/10
prices
for
2011
represent
January
1,
2011
through
December
31,
2011
values.
2
MtM
values
include
the
effects
of
all
transactions
in
the
long-term
hedging
program
including
offsetting
purchases
(for
re-balancing)
and
natural
gas
basis
deals.
3
As
of
12/31/10.
2011
represents
January
1,
2011
through
December
31,
2011
volumes.
Where
collars
are
reflected,
the
volumes
are
estimated
based
on
the
natural
gas
price
sensitivity
(i.e.,
delta
position)
of
the
derivatives.
The
notional
volumes
for
collars
are
approximately
150
million
MMBtu,
which
corresponds
to
a
delta
position
of
approximately
110
million
MMBtu
in
2014. |
 14
14
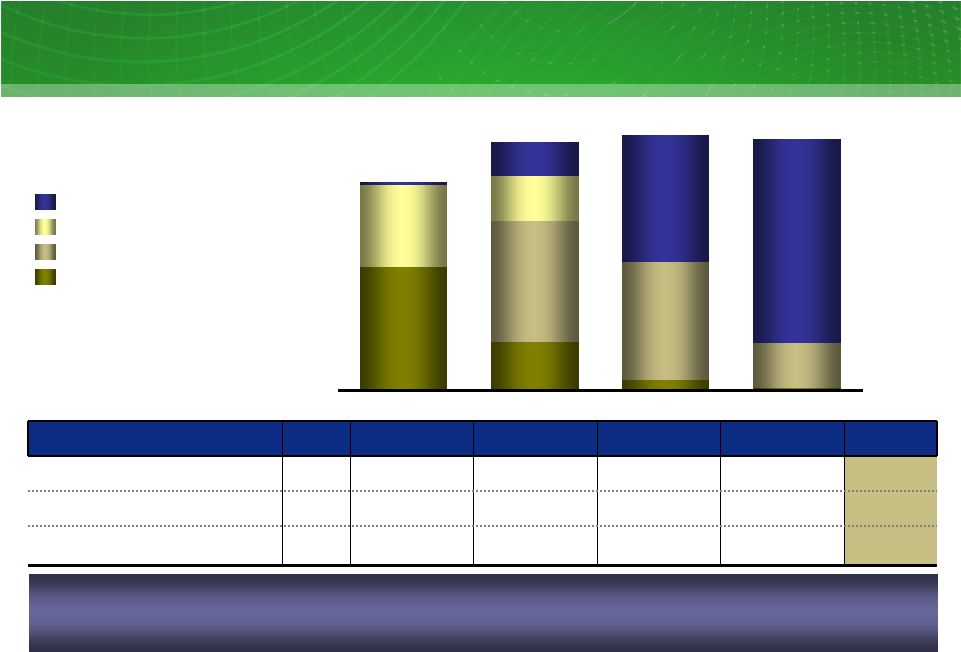
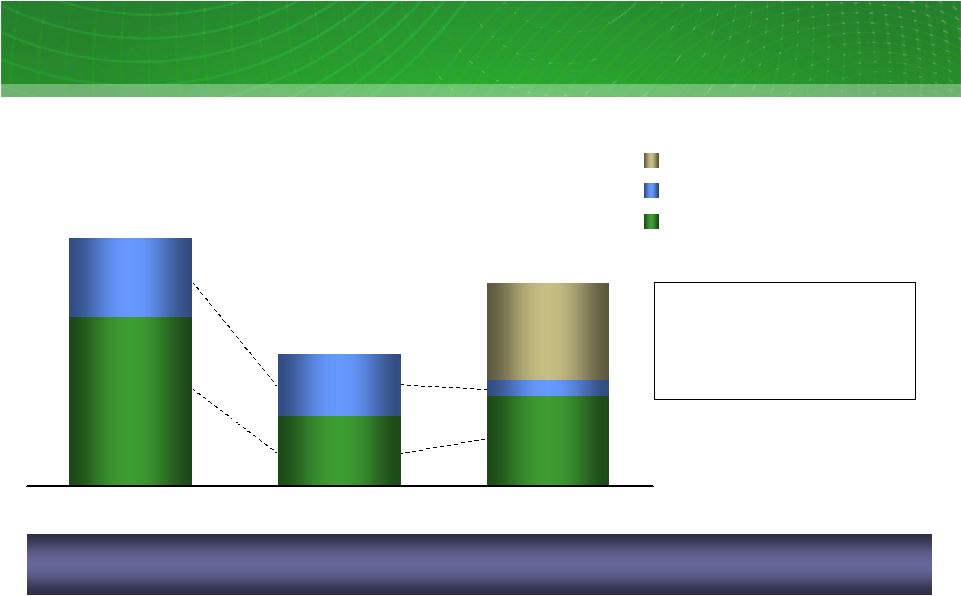
TCEH Natural Gas Exposure
TCEH Natural Gas Position
11-14
1
; million MMBtu
Hedges Backed by Asset First Lien
Open Position
1
As
of
12/31/10.
Balance
of
2011
is
from
February
1,
2011
to
December
31,
2011.
Assumes
conversion
of
electricity
positions
based
on
a
~8.0
heat
rate
with
natural
gas
being
on
the
margin
~75-90%
of
the
time
(i.e.
when
other
technologies
are
forecast
to
be
on
the
margin,
no
natural
gas
position
is
assumed
to
be
generated).
2
Includes
estimated
retail/wholesale
effects.
2011
position
includes
~8
million
MMBtu
of
short
gas
positions
associated
with
proprietary
trading
positions;
excluding
these
positions,
2011
position
is
~97%
hedged.
295
117
27
5
290
282
110
198
108
7
80
303
488
500
595
612
603
BAL 11
2012
2013
2014
Factor
Measure
BAL 11
2012
2013
2014
Total or
Average
Natural gas hedging program
million
MMBtu
~198
~398
~282
~110
~988
TXUE and Luminant net positions
million
MMBtu
~295
~117
~27
~5
~444
Overall estimated percent of total NG
position hedged
percent
~99%
~87%
~51%
~19%
~62%
TXUE and Luminant Net Positions²
TCEH
has
hedged
approximately
62%
of
its
estimated
Henry
Hub-based
natural
gas
price
exposure
from
February
1,
2011
through
December
31,
2014.
More
than
95%
of
the
NG
Hedges
are
supported
directly
by
a
first
lien
or
by
the
TCEH
Commodity
Collateral
Posting
Facility.
Hedges Backed by CCP |
 15
15
15
EFH Corp. Adjusted EBITDA Sensitivities
Commodity
Percent Hedged at
December 31, 2010
Change
BOY 11E
Impact
$ millions
7X24 market heat rate (MMBtu/MWh)
2
>85
0.1 MMBtu/MWh
~4
NYMEX gas price ($/MMBtu)
3
>95
$1/MMBtu
~5
Texas gas vs. NYMEX Henry Hub price ($/MMBtu)
3,4
>95
$0.10/MMBtu
~1
Diesel ($/gallon)
5
~100
$1/gallon
~0
Base coal ($/ton)
6
>95
$5/ton
~2
Generation operations
Baseload generation (TWh)
n.a.
1 TWh
~15
Retail operations
FY 2011
Residential contribution margin ($/MWh)
26 TWh
$1/MWh
~25
Residential consumption
26 TWh
1%
~11
Business markets consumption
24 TWh
1%
~4
Impact on EFH Corp. Adjusted EBITDA
1
11E; mixed measures
The majority of 2011 commodity-related risks are significantly mitigated.
1
2011
estimate
based
on
commodity
positions
as
of
12/31/10,
net
of
long-term
hedges
and
wholesale/retail
effects,
excludes
gains
and
losses
incurred
prior
to
December
31,
2010.
See
Appendix for definition.
2
Simplified
representation
of
heat
rate
position
in
a
single
TWh
position.
In
reality,
heat
rate
impacts
are
differentiated
across
plants
and
respective
pricing
periods:
baseload
(linked
primarily
to
changes
in
North
Hub
7x24),
natural
gas
plants
(primarily
North
Hub
5x16)
and
wind
(primarily
West
Hub7x8).
3
Assumes
conversion
of
electricity
positions
based
on
a
~8.0
market
heat
rate
with
natural
gas
being
on
the
margin
~75-90%
of
the
time
(i.e.,
when
coal
is
forecast
to
be
on
the
margin,
no
natural
gas
position
is
assumed
to
be
generated).
4
The
percentage
hedged
represents
the
amount
of
estimated
natural
gas
exposure
based
on
Houston
Ship
Channel
(HSC)
gas
price
sensitivity
as
a
proxy
for
Texas
gas
price.
5
Includes
positions
related
to
fuel
surcharge
on
rail
transportation.
6
Excludes
fuel
surcharge
on
rail
transportation. |
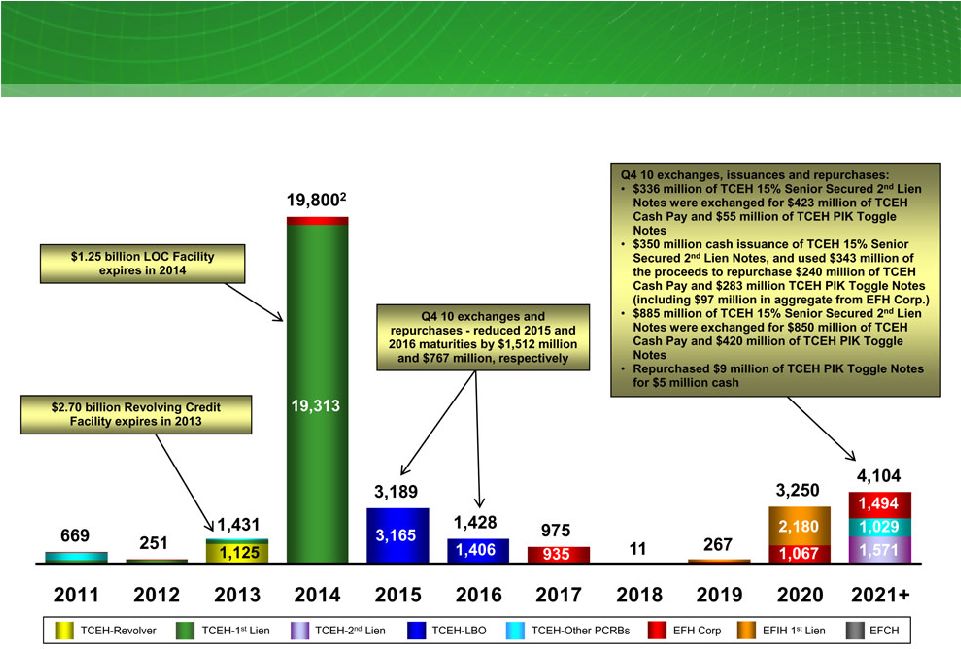 Current Maturity Profile
EFH Corp. debt maturities
1
(excluding Oncor), 2011-2021 and thereafter
As of 12/31/10; $ millions
1
Includes amortization of the $16.5 billion Initial Term Loan, $4.1 billion Delayed
Draw Term Loan and excludes unamortized discounts and premiums. 2
Excludes the Deposit Letter of Credit Facility maturing in 2014.
16 |
 17
Today’s Agenda
Q&A
Financial and Operational
Overview
Q4 2010 Review
John Young
President & CEO |
 18
Today’s Agenda
Q&A
Financial and Operational
Overview
Q4 2010 Review
EFH Corp. Senior Executive Team |
 19
Questions & Answers |
 20
Appendix –
Additional Slides and
Regulation G Reconciliations
Appendix |
 2,700
1,440
1,125
1,250
261
989
1,534
Facility Limit
LOCs/Cash Borrowings
Availability
EFH Corp. Liquidity Management
21
Cash and Equivalents
TCEH
Letter
of
Credit
Facility
TCEH
Revolving
Credit
Facility
2,114
3,950
EFH Corp. and TCEH have sufficient liquidity to meet their anticipated short-term
needs, but will continue to monitor market conditions to ensure financial
flexibility. 1
Facility
to
be
used
for
issuing
letters
of
credit
for
general
corporate
purposes.
Cash
borrowings
of
$1.250
billion
were
drawn
on
this
facility
in
October
2007,
and
except
for
$115
million
related
to
a
letter
of
credit
drawn
in
June
2009,
have
been
retained
as
restricted
cash.
Outstanding
letters
of
credit
are
supported
by
the
restricted
cash.
2
Facility
availability
includes
$94
million
of
undrawn
commitments
from
a
subsidiary
of
Lehman
Brothers
that
is
in
bankruptcy.
These
funds
are
only
available
from
the
fronting
banks
and
the
swingline
lender,
and
exclude
$135
million
of
requested
draws
not
funded
by
the
Lehman
subsidiary.
3
Total
capacity
remaining
for
natural
gas
hedges
under
the
CCP
facility
is
~420
million
MMBtu
of
which
TCEH
currently
has
~329
million
MMBtu
of
hedges
outstanding.
EFH Corp. (excluding Oncor) available liquidity
As of 12/31/10; $ millions
Liquidity reflected in the table
does not include the unlimited
capacity available under the
Commodity Collateral Posting
Facility
for
~329
million
MMBtu³
of
natural gas hedges outstanding.
1
2
3,235 |
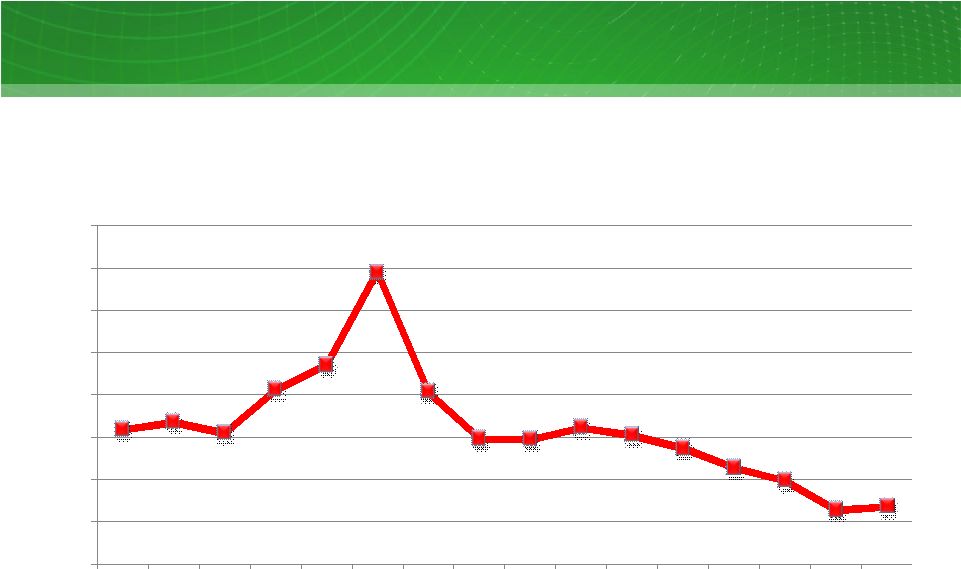 Historical 2014 Forward Natural Gas Prices
Historical 2014 Forward Houston Ship Channel (HSC) Gas Prices
Q1’07-Q4’10; $/MMBtu
$7.18
$7.37
$7.10
$8.12
$8.71
$10.92
$8.09
$6.96
$6.95
$7.23
$7.05
$6.73
$6.27
$5.97
$5.28
$5.36
$4
$5
$6
$7
$8
$9
$10
$11
$12
Q1'07
Q2'07
Q3'07
Q4'07
Q1'08
Q2'08
Q3'08
Q4'08
Q1'09
Q2'09
Q3'09
Q4'09
Q1'10
Q2'10
Q3'10
Q4'10
22 |
 23
23
Unrealized Mark-To-Market Impact Of Hedging
Unrealized mark-to-market impact of hedging program
12/31/10 vs. 12/31/09; mixed measures, pre-tax
Factor
Measure
2010
2011
2012
2013
2014
Total or
Avg.
12/31/09
Natural gas hedges
mm MMBtu
~240
~447
~490
~300
~97
~1,574
Wtd. avg. hedge price¹
$/MMBtu
~$7.79
~$7.56
~$7.36
~$7.19
~$7.80
Natural gas prices
$/MMBtu
~$5.79
~$6.34
~$6.53
~$6.67
~$6.84
Cum. MtM gain at 12/31/09²
$ billions
~$0.8
~$0.4
~$0.4
~$0.2
~$0.2
~$2.0
12/31/10
Natural gas hedges³
mm MMBtu
-
~220
~398
~282
~110
~1,010
Wtd. avg. hedge price¹
$/MMBtu
-
~$7.56
~$7.36
~$7.19
~$7.80
Natural gas prices
$/MMBtu
-
~$4.55
~$5.08
~$5.33
~$5.49
Cum. MtM gain at 12/31/10²
$ billions
~$0
~$1.2
~$1.1
~$0.5
~$0.4
~$3.2
YTD10 MtM (loss) gain
$ billions
~($0.8)
~$0.8
~$0.7
~$0.3
~$0.2
~$1.2
Forward positions in the hedge program gained value due to lower natural gas prices
as of the end of 2010, partially offset by losses resulting from the reversal
of previously recognized gains during the year. Overall result for the
year was a ~$1.2 billion (~$780 million after tax) unrealized net gain.
1
Weighted
average
prices
are
based
on
NYMEX
Henry
Hub
prices
of
forward
natural
gas
sales
positions
in
the
long-term
hedging
program
(excluding
the
impact
of
offsetting
purchases
for
rebalancing
and
pricing
point
basis
transactions).
Where
collars
are
reflected,
sales
price
represents
the
collar
floor
price.
12/31/10
prices
for
2011
represent
January
1,
2011
through
December
31,
2011
values.
2
MtM
values
include
the
effects
of
all
transactions
in
the
long-term
hedging
program
including
offsetting
purchases
(for
re-balancing)
and
natural
gas
basis
deals.
3
As
of
12/31/10.
2011
represents
January
1,
2011
through
December
31,
2011
volumes.
Where
collars
are
reflected,
the
volumes
are
estimated
based
on
the
natural
gas
price
sensitivity
(i.e.,
delta
position)
of
the
derivatives.
The
notional
volumes
for
collars
are
approximately
150
million
MMBtu,
which
corresponds
to
a
delta
position
of
approximately
110
million
MMBtu
in
2014. |
 24
Currently Installed
1
Environmental Control Equipment At
Luminant Coal Units
Coal Unit
Capacity
(MW)
FGD
(Scrubber)
2
Activated
Carbon
Injection³
ESP
4
SNCR
5
SCR
5
Bag-
house
4
Oak Grove 1
800
Oak Grove 2
800
Sandow 4
557
Sandow 5
580
Martin Lake 1
750
Martin Lake 2
750
Martin Lake 3
750
Monticello 1
565
Monticello 2
565
Monticello 3
750
Big Brown 1
575
Big Brown 2
575
Currently installed
1
There is no assurance that the currently installed control equipment will satisfy
the requirements under any change to applicable law or any future Environmental Protection Agency or
Texas Commission on Environmental Quality regulations.
2
FGD refers to flue gas desulfurization systems that reduce SO2 emissions with
co-benefits of other emissions reductions. 3
Activated carbon injection systems reduce mercury emissions.
4
ESP refers to electro-static precipitation systems . ESP and
bag-house systems reduce particulate emissions with co-benefits of other emissions reductions.
5
SNCR refers to selective non-catalytic reduction systems. SCR refers to
selective catalytic reduction systems. Both systems reduce Nox emissions. |
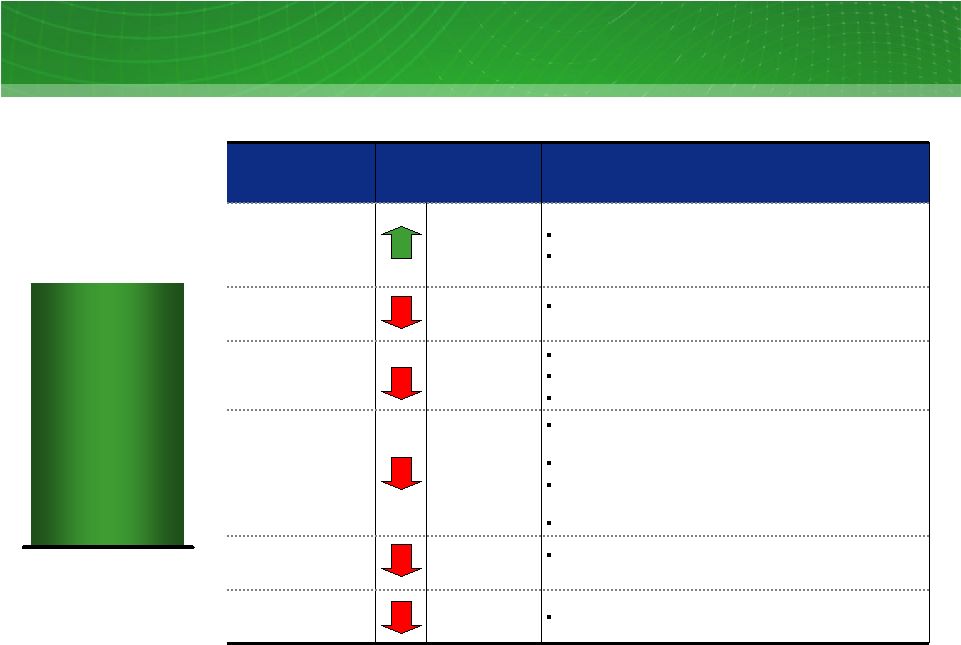 Key
Drivers 2011 Est. Impact vs
2010 (millions)
Assumptions
Higher Baseload
Generation
$50 -
$60
3 –
4 incremental TWh from new lignite units
~$15 / MWh average incremental margin¹
Nuclear Outage
$50 -
$60
2 refueling outages in 2011 vs 1 in 2010 and
related outage expenses
Mining / Expenses
$60 -
$70
Higher emissions control costs (~$25mm)
Higher lignite costs driven by aging deposits
Higher healthcare, pension/OPEB expenses
Commodity
$200 -
$300
Lower
weighted
average
NG
hedge
price²
of
~$0.22 -
$0.25/mmbtu for ~540 mm mmbtu
Higher
heat
rate
of
~0.10
–
0.15
on
~73
-
75
TWh³
Impact of normal weather & load related costs on
2011 asset management margins relative to 2010
Delivered PRB prices up ~$4/ton on ~14 mm tons
Retail
$25 -
$125
Potential decline driven by lower customer count,
price environment and normal weather in 2011
Development
$50 -
$70
Reduced non-core asset sales in 2011
2010 TCEH
Adjusted EBITDA
$3,689
FY
12/31/10
2011 TCEH Adjusted EBITDA (non-GAAP) Key Drivers
1
Based on ERCOT North Hub 7X24 HSC power prices for 2011 of ~$33/MWh as of
9/30/10. 2
Weighted average prices are based on NYMEX Henry Hub prices of forward natural gas
sales positions in the long-term hedging program (excluding the impact of
offsetting purchases for rebalancing and pricing point basis transactions).
3
Excludes volume committed under a long term purchase contract.
25
Illustrative for discussion purposes |
 2011
TCEH Open EBITDA (non-GAAP) Estimate $800 - $1,400
2011E
1
Open
EBITDA
estimates
assume
generation
is
sold
at
market
observed
forward
prices
less
production
costs
and
retail
volumes
are
sold
at
market
observed
retail
rates
and
historical
retail
profitability
percentage.
Estimates
exclude
all
impacts
of
natural
gas
and
power
hedging
activities,
specifically
the
impacts
of
the
TCEH
Long-Term
Hedging
Program
and
any
heat
rate
hedges.
Additionally,
this
calculation
includes
provisions
for
fuel
expense
and
O&M
based
on
expected
power
generation
output
along
with
purchased
power
for
sales
to
retail
customers,
and
SG&A
based
on
the
generation
output
and
sales
to
retail
customers.
See
Appendix
for
Regulation
G
definition.
2
Estimated
wholesale
power
prices
for
2011
is
based
on
average
ERCOT
North
Hub
prices
as
of
9/30/10.
3
Includes
fuel
(excluding
nuclear
fuel
amortization),
O&M
and
SG&A
expenses
4
Based
on
an
10¢
/
kWh
average
residential
new
offer
pricing
as
reflected
on
thewww.powertochoose.org
and
$
2.3
billion
of
small
and
large
business
revenue
based
on
trailing
12
months.
5
Calculation
assumes
a
35%
overall
tax
rate
Assumptions
Units
2011E
Wholesale
Total baseload generation
TWh
78 –
81
Estimated
power
price
2
$/MWh
$32 -
$34
Average
baseload
cost
3
$/MWh
$26 -
$28
Retail
Revenues
4
$
$4.8 -
$5.2B
Profitability
percentage
(after
tax)
5
%
5-10%
TCEH Open EBITDA (non-GAAP)¹
Estimate
11E: $ millions
Open EBITDA does not
include:
•
TXU Energy value
proposition relative to
competitors
•
Asset management results
•
Long-term wholesale
contracts with load serving
entities
26 |
 27
Financial Definitions
Measure
Definition
Adjusted (non-GAAP)
Operating Results
Net
income
(loss)
adjusted
for
items
representing
income
or
losses
that
are
not
reflective
of
underlying
operating
results.
These
items
include
unrealized
mark-to-market
gains
and
losses,
noncash
impairment
charges
and
other
charges,
credits
or
gains
that
are
unusual
or
nonrecurring.
EFH
uses
adjusted
(non-GAAP)
operating
results
as
a
measure
of
performance
and
believes
that
analysis
of
its
business
by
external
users
is
enhanced
by
visibility
to
both
net
income
(loss)
prepared
in
accordance
with
GAAP
and
adjusted
(non-GAAP)
operating
earnings
(losses).
Adjusted EBITDA
(non-GAAP)
EBITDA
adjusted
to
exclude
interest
income,
noncash
items,
unusual
items,
income
from
discontinued
operations
and
other
adjustments
allowable
under
the
EFH
senior
secured
notes
indenture.
Adjusted
EBITDA
plays
an
important
role
in
respect
of
certain
covenants
contained
in
this
indenture.
Adjusted
EBITDA
is
not
intended
to
be
an
alternative
to
GAAP
results
as
a
measure
of
operating
performance
or
an
alternative
to
cash
flows
from
operating
activities
as
a
measure
of
liquidity
or
an
alternative
to
any
other
measure
of
financial
performance
presented
in
accordance
with
GAAP,
nor
is
it
intended
to
be
used
as
a
measure
of
free
cash
flow
available
for
EFH’s
discretionary
use,
as
the
measure
excludes
certain
cash
requirements
such
as
interest
payments,
tax
payments
and
other
debt
service
requirements.
Because
not
all
companies
use
identical
calculations,
Adjusted
EBITDA
may
not
be
comparable
to
similarly
titled
measures
of
other
companies.
See
EFH’s
filings
with
the
SEC
for
a
detailed
reconciliation
of
EFH’s
net
income
prepared
in
accordance
with
GAAP
to
Adjusted
EBITDA.
Competitive Business
Results
Refers to the combined results of the Competitive Electric segment and Corporate
& Other. Contribution Margin (non-
GAAP)
Operating revenues less fuel, purchased power costs, and delivery fees, plus or
minus net gain (loss) from commodity hedging and trading activities, which on
an adjusted (non-GAAP) basis, exclude unrealized gains and losses.
EBITDA
(non-GAAP)
Net income (loss) before interest expense and related charges, income tax expense
(benefit) and depreciation and amortization. GAAP
Generally accepted accounting principles.
Purchase Accounting
The
purchase
method
of
accounting
for
a
business
combination
as
prescribed
by
GAAP,
whereby
the
purchase
price
of
a
business
combination
is
allocated
to
identifiable
assets
and
liabilities
(including
intangible
assets)
based
upon
their
fair
values.
The
excess
of
the
purchase
price
over
the
fair
values
of
assets
and
liabilities
is
recorded
as
goodwill.
Depreciation
and
amortization
due
to
purchase
accounting
represents
the
net
increase
in
such
noncash
expenses
due
to
recording
the
fair
market
values
of
property,
plant
and
equipment,
debt
and
other
assets
and
liabilities,
including
intangible
assets
such
as
emission
allowances,
customer
relationships
and
sales
and
purchase
contracts
with
pricing
favorable
to
market
prices
at
the
date
of
the
Merger.
Amortization
is
reflected
in
revenues,
fuel,
purchased
power
costs
and
delivery
fees,
depreciation
and
amortization and interest expense in the income statement.
Regulated Business
Results
Refers to the results of Oncor and the Oncor ring-fenced entities.
|
 28
Table 1: EFH Corp. Adjusted EBITDA Reconciliation
Three and Twelve Months Ended December 31, 2009 and 2010
$ millions
Note: Table and footnotes to this table continue on following page
Factor
Q4 09
Q4 10
FY 09
FY 10
Net income (loss) attributable to EFH Corp.
137
161
344
(2,812)
Income tax expense
113
54
367
389
Interest expense and related charges
776
465
2,912
3,554
Depreciation and amortization
467
363
1,754
1,407
EBITDA
1,493
1,043
5,377
2,538
Adjustments to EBITDA (pre-tax):
-
Oncor EBITDA
(310)
-
(1,354)
-
Oncor distributions
99
28
216
169
Interest income
(15)
(2)
(45)
(10)
Amortization of nuclear fuel
28
38
101
140
Purchase accounting adjustments¹
83
51
340
210
Impairment of goodwill²
-
-
90
4,100
Impairment of assets and inventory write-down
37
12
42
15
Net gain on debt exchange offers
(87)
(648)
(87)
(1,814)
Net income attributable to noncontrolling interests
10
-
64
-
Equity in earnings of unconsolidated subsidiary
-
(37)
-
(277)
EBITDA amount attributable to consolidated unrestricted
subsidiaries
-
1
3
1
Unrealized net (gain) loss resulting from hedging transactions
(513)
394
(1,225)
(1,221)
Amortization of ”day one”
net loss on Sandow 5 power purchase
agreement
(3)
(3)
(10)
(22)
Losses on sale of receivables
3
-
12
- |
 29
1
Includes
amortization
of
the
intangible
net
asset
value
of
retail
and
wholesale
power
sales
agreements,
environmental
credits,
coal
purchase
contracts,
nuclear
fuel
contracts
and
power
purchase
agreements
and
the
stepped-up
value
of
nuclear
fuel.
Also
includes
certain
credits
not
recognized
in
net
income
due
to
purchase
accounting.
2
Reflects
the
noncash
goodwill
impairment
recorded
in
the
third
quarter
of
2010
and
the
completion
in
the
first
quarter
of
2009
of
the
fair
value
calculation
supporting
the noncash goodwill impairment charge that was recorded in the fourth quarter of
2008. 3
Accounted for under accounting standards related to stock compensation and excludes
capitalized amounts. 4
Includes
amounts
incurred
related
to
outsourcing,
restructuring
and
other
amounts
deemed
to
be
in
excess
of
normal
recurring
amounts.
5
Includes
professional
fees
primarily
for
retail
billing
and
customer
care
systems
enhancements
and
certain
incentive
compensation.
6
Includes
costs
related
to
the
2007
merger
and
abandoned
strategic
transactions,
outsourcing
transition
costs,
administrative
costs
related
to
the
cancelled
program
to
develop
coal-fueled
facilities,
the
Sponsor
Group
management
fee,
costs
related
to
certain
growth
initiatives
and
costs
related
to
the
Oncor
sale
of
noncontrolling
interests.
7
2010
includes
a
gain
on
termination
of
a
long-term
power
sales
contract.
2009
includes
reversal
of
certain
liabilities
accrued
in
purchase
accounting.
8
Reflects noncapital outage costs.
Table 1: EFH Adjusted EBITDA Reconciliation (continued from previous page)
Three and Twelve Months Ended December 31, 2009 and 2010
$ millions
Factor
Q4 09
Q4 10
FY 09
FY 10
Noncash compensation expense³
2
5
11
18
Severance expense
4
1
1
10
4
Transition and business optimization costs
5
-
6
22
4
Transaction and merger expenses
6
16
11
81
48
Restructuring and other
7
(3)
(118)
(14)
(117)
Expenses incurred to upgrade or expand a generation station
8
-
-
100
100
EFH Corp. Adjusted EBITDA per Incurrence Covenant
841
782
3,734
3,886
Add Oncor Adjusted EBITDA (reduced by Oncor distributions)
197
301
1,123
1,354
EFH Corp. Adjusted EBITDA per Restricted Payments Covenant
1,038
1,083
4,857
5,240 |
 30
Table 2: TCEH Adjusted EBITDA Reconciliation
Three and Twelve Months Ended December 31, 2009 and 2010
$ millions
Note: Table and footnotes continue on following page
Factor
Q4 09
Q4 10
FY 09
FY 10
Net income (loss)
216
263
709
(3,383)
Income tax expense
117
142
447
402
Interest expense and related charges
502
320
1,833
2,837
Depreciation and amortization
310
353
1,172
1,380
EBITDA
1,145
1,078
4,161
1,236
Adjustments to EBITDA (pre-tax):
Interest income
(24)
(26)
(64)
(91)
Amortization of nuclear fuel
28
38
101
140
Purchase accounting adjustments¹
71
39
293
163
Impairment of goodwill²
-
-
70
13
Impairment of assets and inventory writedown
34
12
36
4,100
Net gain on debt exchange offers
-
(687)
-
(687)
EBITDA amount attributable to consolidated unrestricted subsidiaries
-
1
3
1
Unrealized net (gain) loss resulting from hedging transactions
(513)
394
(1,225)
(1,221)
Amortization of ”day one”
net loss on Sandow 5 power purchase
agreement
(3)
(3)
(10)
(22)
Corp. depreciation, interest and income tax expense included in SG&A
1
-
6
9
Losses on sale of receivables
3
-
12
-
Noncash compensation expense³
-
3
1
14
Severance expense
4
1
-
10
3
Transition and business optimization costs
5
3
7
25
9
Transaction and merger expenses
6
2
9
5
38 |
 31
Table 2: TCEH Adjusted EBITDA Reconciliation (continued from previous page)
Three and Twelve Months Ended December 31, 2009 and 2010
$ millions
1
Includes
amortization
of
the
intangible
net
asset
value
of
retail
and
wholesale
power
sales
agreements,
environmental
credits,
coal
purchase
contracts,
nuclear
fuel
contracts
and
power
purchase
agreements
and
the
stepped
up
value
of
nuclear
fuel.
Also
includes
certain
credits
not
recognized
in
net
income
due
to
purchase
accounting.
2
Reflects
the
noncash
goodwill
impairment
recorded
in
the
third
quarter
of
2010
and
the
completion
in
the
first
quarter
of
2009
of
the
fair
value
calculation
supporting
the noncash goodwill impairment charge that was recorded in the fourth quarter of
2008. 3
Excludes capitalized amounts.
4
Includes amounts incurred related to outsourcing, restructuring and other amounts
deemed to be in excess of normal recurring amounts. 5
Includes professional fees primarily for retail billing and customer care systems
enhancements and certain incentive compensation. 6
Includes costs related to the 2007 merger, outsourcing transition costs and costs
related to certain growth initiatives. 7
2010 includes a gain on termination of a long-term power sales contract. 2009
includes reversal of certain liabilities accrued in purchase accounting.
8
Reflects noncapital outage costs.
9
Primarily pre-operating expenses related to Oak Grove and Sandow 5 generation
facilities. Factor
Q4 09
Q4 10
FY 09
FY 10
Restructuring and other
7
(3)
(116)
(19)
(116)
Expenses incurred to upgrade or expand a generation station
8
-
-
100
100
TCEH Adjusted EBITDA per Incurrence Covenant
745
749
3,505
3,689
Expenses related to unplanned generation station outages
30
10
91
132
Other adjustments allowed to determine Adjusted EBITDA per
Maintenance Covenant
9
17
10
38
29
TCEH Adjusted EBITDA per Maintenance Covenant
792
769
3,634
3,850 |
 32
1
Purchase accounting adjustments consist of amounts related to the accretion of an
adjustment (discount) to regulatory assets resulting from purchase accounting.
Table 3: Oncor Adjusted EBITDA Reconciliation
Three and Twelve Months Ended December 31, 2009 and 2010
$ millions
Factor
Q4 09
Q4 10
FY 09
FY 10
Net income
48
48
320
352
Income tax expense
33
41
173
215
Interest expense and related charges
88
88
346
347
Depreciation and amortization
152
166
557
673
EBITDA
321
343
1,396
1,587
Interest income
(11)
(9)
(43)
(38)
Purchase accounting adjustments¹
(9)
(8)
(39)
(34)
Transition and business optimization costs
(6)
3
25
8
Oncor Adjusted EBITDA
295
329
1,339
1,523 |
 33
Table 4: EFH Free Cash Flow
1
Reconciliation
Twelve Months Ended December 31, 2010
$ millions
Factor
FY 10
Cash provided by operating activities
1,106
Cash used in investing activities
(468)
Other changes in restricted cash
33
Cash used in financing activities
(264)
Issuances of long-term debt
(853)
Repayments of long-term debt
1,351
Net short-term borrowings under accounts receivable securitization program
(96)
Increase (decrease) in other short-term borrowings
(172)
Free Cash Flow
637
1
Free Cash Flow defined as Operating activities plus Investing activities excluding
changes in restricted cash, plus Financing activities excluding issuances and
repayments of debt and changes in short term borrowings.
|