Attached files
| file | filename |
|---|---|
| 8-K - FORM 8-K - SUSQUEHANNA BANCSHARES INC | d8k.htm |
 Sterne Agee 2011
Financial Institutions
Investor Conference
February 17, 2011
Exhibit 99.1 |
 Investor Presentation
February 17, 2011
Investor Presentation
February 17, 2011
Susquehanna Bancshares, Inc.
Lititz, Pennsylvania
William J. Reuter –
Chairman and CEO
Drew K. Hostetter –
Chief Financial Officer
2 |
 Forward-Looking Statements
During the course of this conference call, we may make projections and other
forward-looking statements regarding events or the future financial performance
of Susquehanna, including the impact of the announced acquisition of
Abington Bancorp. We wish to caution you that these
forward-looking statements may differ materially from actual results due
to a number of risks and uncertainties. For a more detailed
description of the factors that may affect Susquehanna’s operating
results, we refer you to our filings with the Securities & Exchange
Commission, including our quarterly report on Form 10-Q for the quarter ended
September 30, 2010, and our annual report on Form 10-K for the year
ended December 31, 2009. Susquehanna assumes no obligation to update the
forward-looking statements made during this presentation.
For more information, please visit our Web site at:
www.susquehanna.net
3 |
 Susquehanna Profile
4
Headquartered in Lititz, PA
Offers tailored products and services through its community bank, trust
and investment company, asset management, P&C insurance brokerage,
and leasing companies
222 branches in PA, NJ, MD, WV
$14.0 billion in assets
$9.2 billion in deposits
$6.3 billion in assets under management & administration
130.0 million shares outstanding
28,100 shareholders (record and street)
67% institutional holders (as of 9/30/10)
Overview
Geography
Size
Shareholder
base |
 November
2008
Received
$300mm
TARP
preferred
equity
April 2002
Announced
acquisition
of Addis
Group
(Deal
value:
$17mm)
April 1998
Announced
acquisition
of Cardinal
Bancorp
(Deal
value:
$49mm)
April 1998
Announced
acquisition
of First
Capitol
Bank
(Deal
value:
$27mm)
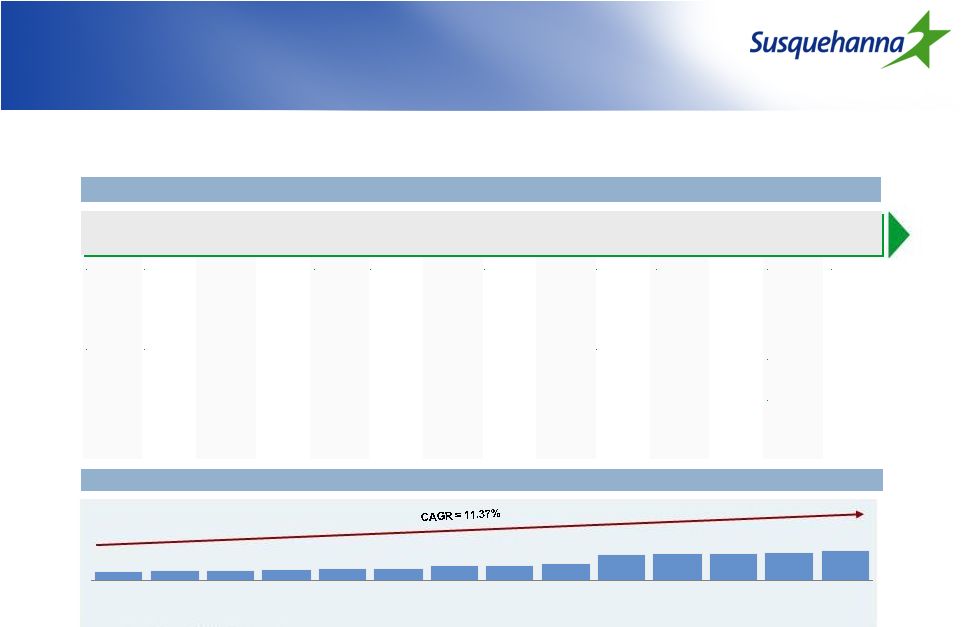
Susquehanna has built a strong
franchise over time
Susquehanna has built a strong
franchise over time
Assets ($ millions)
Source: Company filings, FactSet, SNL Financial
¹
Pro forma for Abington acquisition
1998
2000
2001
November
1999
Announced
acquisition
of Hann
Finl. Corp.
(Deal value:
$42mm)
December
1999
Announced
acquisition
of Valley
Forge Asset
Mgmt
(Deal value:
$19mm)
2002
2004
December
2003
Announced
acquisition
of Patriot
Bank
(Deal value:
$210mm)
2006
2003
November
2005
Announced
acquisition
of Minotola
Bank
(Deal value
$166mm)
2005
2007
April 2007
Announced
acquisition
of
Community
Banks
(Deal value
$852mm)
December
2007
Announced
acquisition
of Stratton
Holding
Company
2008
2009
2010
5
2011
January
2011
Announced
acquisition
of Abington
Bancorp
(Deal value:
$268mm)
1999
March 2010
Raised
$345mm in
common
equity and
$50mm of
Trust
preferred
securities
April 2010
Repaid
$200mm
TARP
December
2010
Repaid the
remaining
$100mm
TARP
$13,954
$15,201
$4,176
$4,805
$4,793
$5,089
$5,545
$5,953
$7,475
$7,466
$8,225
$13,078
$13,683
$13,689
1998
1999
2000
2001
2002
2003
2004
2005
2006
2007
2008
2009
2010
2010 pro
forma¹ |
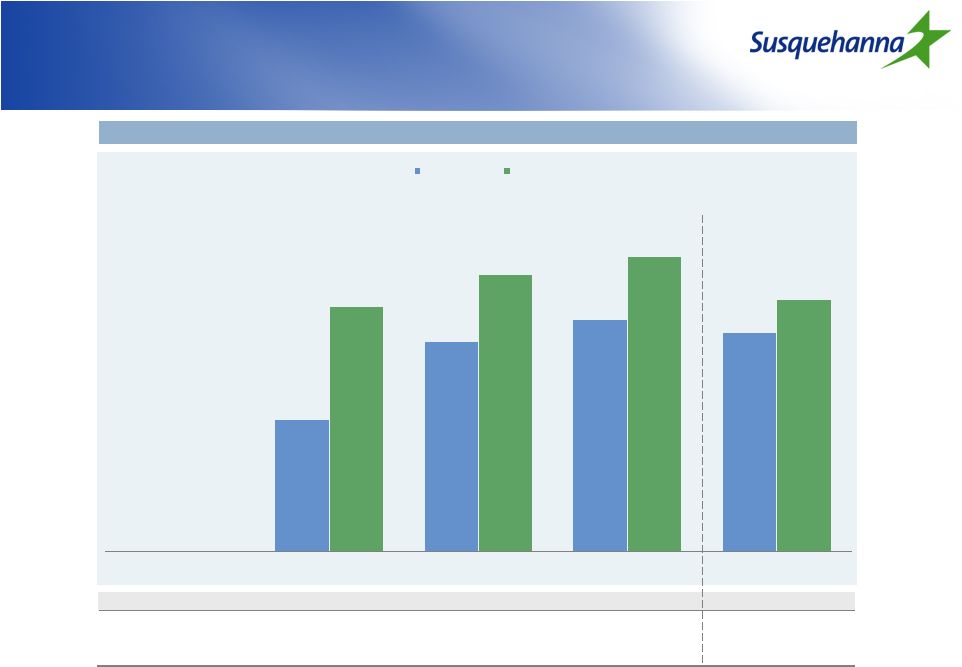
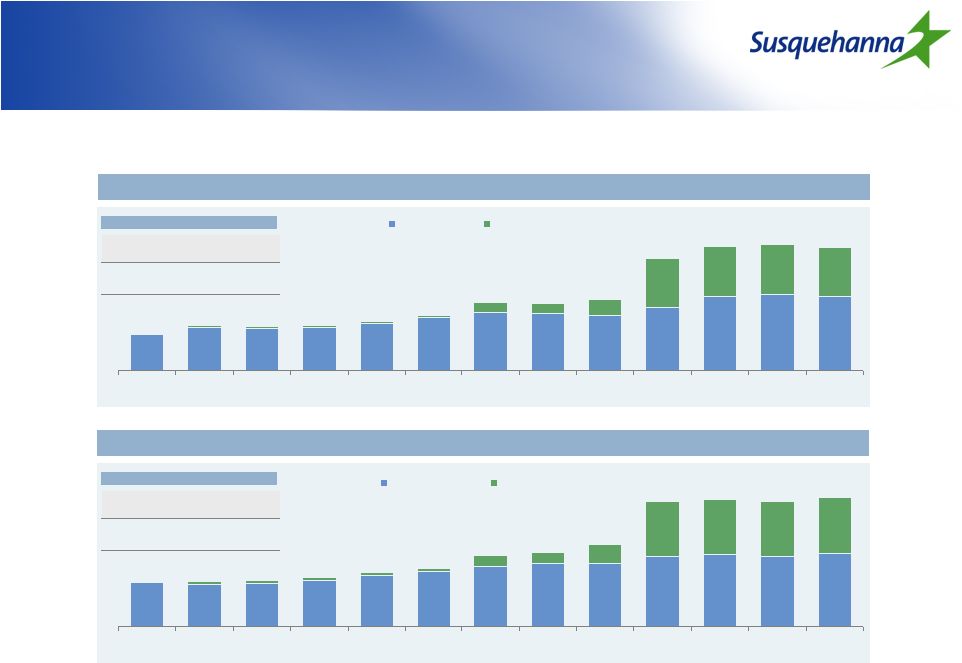 Strong
organic growth supported by acquisitions
Strong organic growth supported by
acquisitions
$2,767
$3,314
$3,278
$3,364
$3,675
$4,108
$4,463
$4,433
$4,281
$4,913
$5,815
$5,988
$5,794
$790
$786
$1,280
$3,839
$3,839
$3,839
$3,839
$80
$156
$156
$156
$156
$156
$2,847
$3,470
$3,434
$3,520
$3,831
$4,264
$5,253
$5,219
$5,561
$8,752
$9,633
$9,827
$9,654
1998
1999
2000
2001
2002
2003
2004
2005
2006
2007
2008
2009
2010
Organic loans
Acquired loans
Loan growth ($mm)
Deposit growth ($mm)
$3,103
$2,983
$3,051
$3,286
$3,633
$3,936
$4,292
$4,470
$4,500
$5,038
$5,159
$5,067
$5,284
$3,907
$3,907
$3,907
$3,907
$1,378
$839
$839
$198
$198
$198
$198
$198
$114
$9,191
$5,878
$5,309
$5,131
$4,134
$3,831
$3,484
$3,249
$3,181
$3,217
$8,945
$9,066
$8,974
1998
1999
2000
2001
2002
2003
2004
2005
2006
2007
2008
2009
2010
Organic deposits
Acquired deposits
Loan growth (%)
CAGR
1998-2010
Organic
6.4%
Total
10.7%
Deposit growth (%)
CAGR
1998-2010
Organic
4.5%
Total
9.1%
Source: Company filings, SNL Financial
6 |
 Improved Market Position in Focus
Markets
Improved Market Position in Focus
Markets
Sorted by 2010 market rank
7
Market share
MSA rank by market share
MSA
2005
2010
% change
2005
2010
Change
Current rank 1-3
Cumberland, MD-WV
24.8%
32.2%
7.4%
2
1
+ 1
Sunbury, PA
18.7%
23.1%
4.4%
1
1
Flat
Hagerstown-Martinsburg, MD-WV
19.0%
18.5%
(0.5%)
1
1
Flat
Lancaster, PA
12.9%
18.2%
5.3%
3
2
+ 1
Williamsport, PA
14.2%
13.2%
(1.0%)
3
2
+ 1
York-Hanover, PA
3.5%
12.3%
8.9%
11
2
+ 9
Chambersburg, PA
13.4%
17.3%
3.9%
5
2
+ 3
Vineland-Millville-Bridgeton, NJ
0.0%
16.3%
16.3%
NA
3
NA
Gettysburg, PA
0.0%
10.5%
10.5%
NA
3
NA
Current rank 4-8
Selinsgrove, PA
8.4%
12.2%
3.9%
5
4
+ 1
Pottsville, PA
0.0%
11.1%
11.1%
NA
4
NA
Lewisburg, PA
2.5%
2.4%
(0.1%)
7
7
Flat
Atlantic City-Hammonton, NJ
0.0%
5.8%
5.8%
NA
8
NA
Reading, PA
2.9%
4.7%
1.8%
9
8
+ 1
Baltimore-Towson, MD
2.0%
1.7%
(0.3%)
9
8
+ 1
Other
Ocean Pines, MD
2.0%
3.1%
1.2%
9
10
-
1
Harrisburg-Carlisle, PA
0.0%
4.3%
4.3%
NA
11
NA
Allentown-Bethlehem-Easton, PA-NJ
1.7%
1.5%
(0.2%)
13
18
-
5
Philadelphia-Camden-Wilmington, PA-NJ-DE-MD
0.4%
0.6%
0.1%
24
18
+ 6
Scranton-Wilkes-Barre, PA
0.0%
1.2%
1.2%
NA
19
NA
Source: SNL Financial |
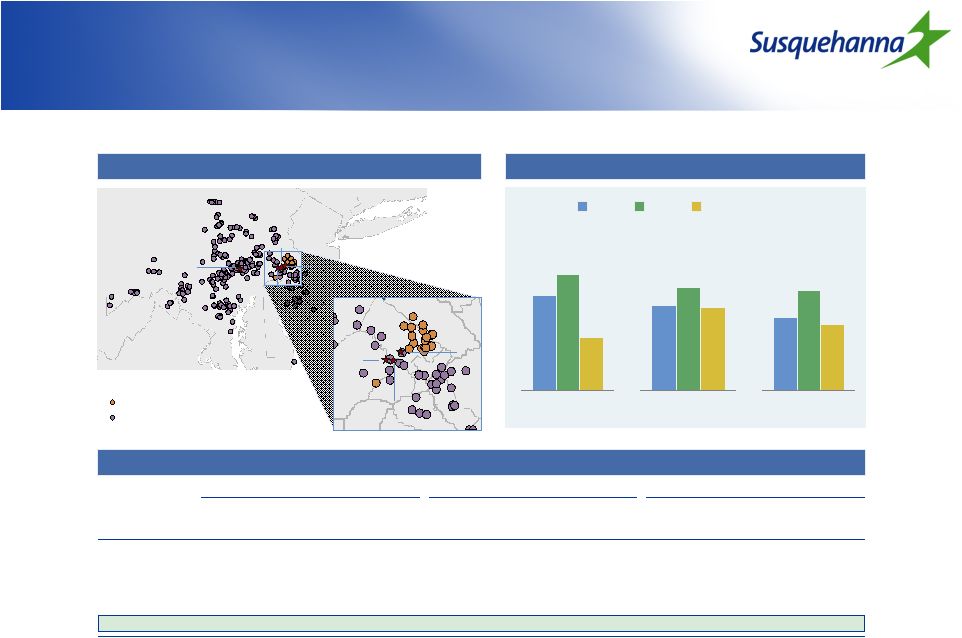
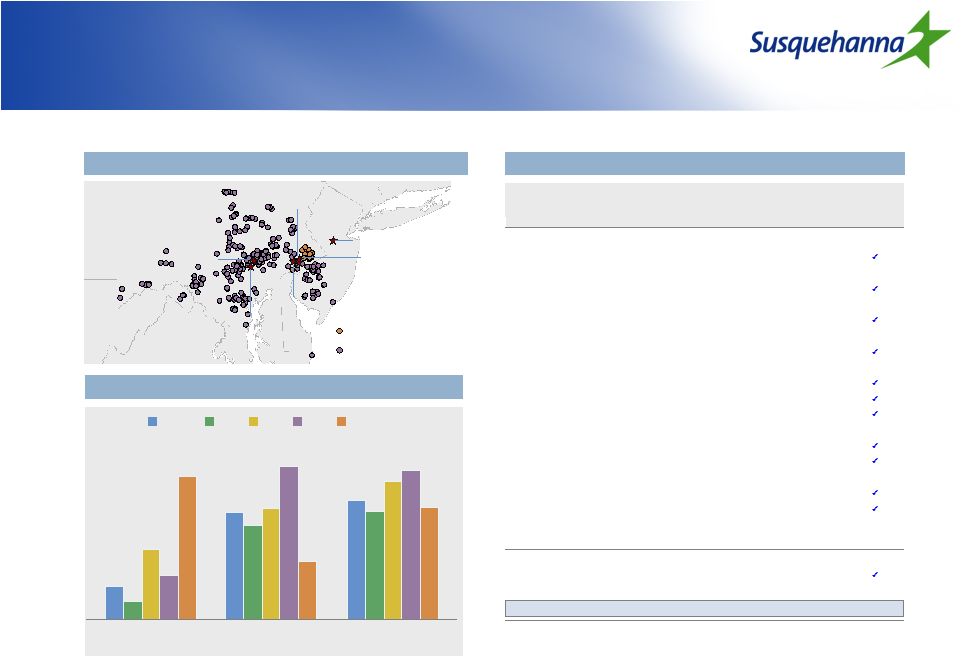 Footprint overview
SUSQ
PA
MD
NJ
US
8
Source: SNL Financial
Note: Susquehanna demographics pro-forma for Abington
SUSQ / ABBC branch map
ABBC (20 branches)
SUSQ (222 branches)
NJ
DE
PA
VA
WV
MD
Susquehanna Demographics
Projected population
change 2010-2015
0.9%
0.5%
1.9%
1.2%
3.9%
Projected HH income
change 2010-2015
13.6%
13.3%
13.7%
14.7%
12.4%
$58.1
$52.7
$66.9
$72.5
$54.4
Median HH income
2010 ($000)
Deposits in
Percent of
Market
Branches in
MSA
Franchise
Presence
MSA
Rank
MSA
($mm)
(%)
strength¹
Philadelphia, PA²
18
54
$2,193
21.8%
Lancaster, PA
2
41
1,736
17.3%
Baltimore-Towson, MD
8
24
1,003
10.0%
York-Hanover, PA
2
19
768
7.6%
Harrisburg-Carlisle, PA
11
14
466
4.6%
Hagerstown-Martinsburg, MD-WV
1
13
595
5.9%
Reading, PA
8
9
368
3.7%
Sunbury, PA
1
8
289
2.9%
Allentown-Bethlehem-Easton, PA-NJ
18
7
220
2.2%
Williamsport, PA
2
6
247
2.5%
Pottsville, PA
4
6
216
2.2%
Chambersburg, PA
2
6
325
3.2%
Atlantic City-Hammonton, NJ
8
6
271
2.7%
Vineland-Millville-Bridgeton, NJ
3
6
415
4.1%
Cumberland, MD-WV
1
5
300
3.0%
Scranton-Wilkes-Barre, PA
19
3
126
1.3%
Selinsgrove, PA
4
3
71
0.7%
Gettysburg, PA
3
3
125
1.2%
Lewisburg, PA
7
1
16
0.2%
Ocean Pines, MD
10
1
40
0.4%
Counties (not in any MSA)
Bedford, PA
1
5
$173
1.7%
Garrett, MD
3
2
82
0.8%
Total Pro Forma
242
$10,045
100.0%
Source: SNL Financial; company filings; deposit and branch data as of June 30, 2010
¹ Greater than 10% of deposits in market
² Pro forma for Abington acquisition
Strength of presence (sorted by # of branches)
Susquehanna
Bank
Valley Forge
Addis Group
Stratton
Management
Hann
Financial
Susquehanna Trust
& Investment |
 Few
remaining players of scale Few remaining players of scale
9
Total PA/MD/NJ
Deposits in
# of branches
Rank
Company
Deposits
% of total deposits
# of branches
PA
MD
NJ
PA
MD
NJ
1
Fulton
$11.7
95%
254
$7.1
$1.7
$2.9
137
41
76
2
Susquehanna
10.0
99%
239¹
6.6
2.0
1.4
165
44
30
3
F.N.B.
6.9
100%
238
6.9
0.0
0.0
238
0
0
4
National Penn
6.4
98%
130
6.4
0.0
0.0
129
1
0
5
Provident
4.9
100%
83
0.0
0.0
4.9
0
0
83
6
First Commonwealth
4.8
100%
115
4.8
0.0
0.0
115
0
0
7
S&T
3.3
100%
54
3.3
0.0
0.0
54
0
0
8
Sun
3.0
100%
67
0.0
0.0
3.0
0
0
67
9
Sandy Spring
2.5
96%
38
0.0
2.5
0.0
0
38
0
10
Tower
2.3
100%
51
2.2
0.1
0.0
48
3
0
11
Lakeland
2.2
100%
49
0.0
0.0
2.2
0
0
49
12
Kearny
2.1
100%
40
0.0
0.0
2.1
0
0
40
13
Metro
1.9
100%
33
1.9
0.0
0.0
33
0
0
14
OceanFirst
1.5
100%
23
0.0
0.0
1.5
0
0
23
15
Oritani
1.3
100%
23
0.0
0.0
1.3
0
0
23
Source: SNL Financial
Note: Regulatory deposit data as of June 30, 2010; Susquehanna pro forma for Abington acquisition;
banks and thrifts with PA/MD/NJ deposits = 90% of total deposits ¹ Susquehanna has 3
additional branches in West Virginia Sorted by deposits
|
 2006
2007
2008
2009
2010
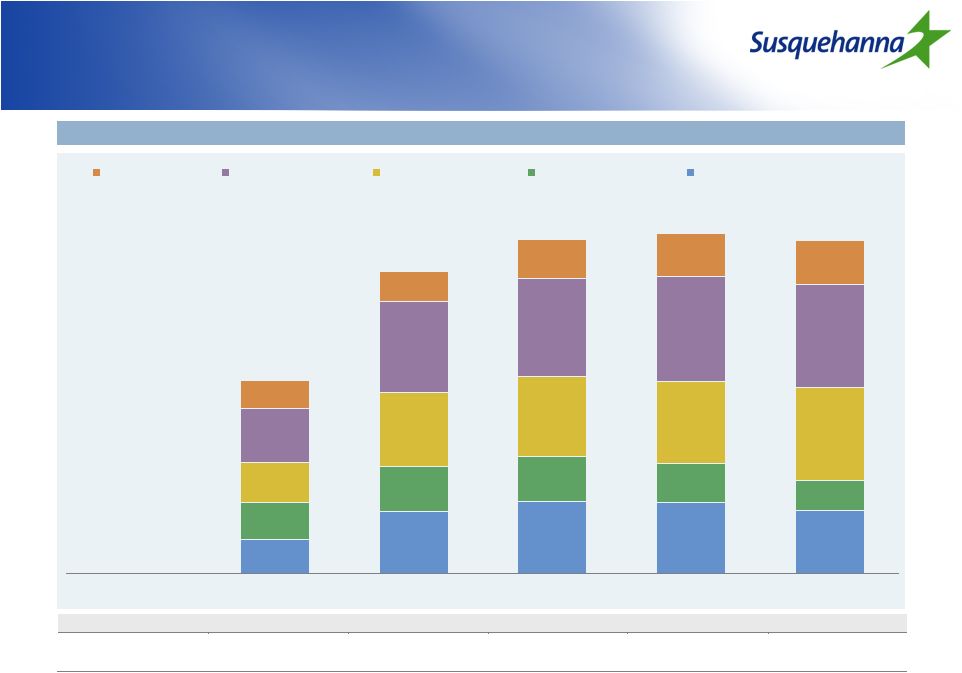
Loan trends
Loan trends
$5,561
$8,752
$9,654
$9,827
$9,633
17.6%
20.4%
21.4%
20.9%
18.9%
19.1%
14.8%
13.6%
11.3%
9.1%
20.6%
24.6%
23.8%
24.1%
27.7%
30.4%
29.8%
31.1%
31.1%
14.3%
9.9%
11.4%
12.5%
13.2%
28.4%
2006Y
2007Y
2008Y
2009Y
2010Y
Yield on loans
7.37%
7.48%
6.49%
5.70%
5.23%
Loans/deposits
95%
98%
106%
109%
105%
Source: Company filings
10
Commercial financial and agricultural
Real estate -
construction
Real estate -
residential
Real estate -
commercial
Consumer & leases |
 Deposit Trends
11
2006
2007
2008
2009
2010
$5,878
$8,945
$9,066
$8,974
$9,191
16.3%
14.5%
13.3%
14.1%
14.9%
34.1%
31.6%
27.9%
36.4%
39.7%
26.0%
30.8%
33.6%
28.3%
23.6%
15.2%
17.6%
13.0%
13.4%
15.4%
2006Y
2007Y
2008Y
2009Y
2010Y
Cost of int. bearing deposits
3.27%
3.54%
2.66%
2.05%
1.13%
Loans/deposits
95%
98%
106%
109%
105%
Source: Company filings
Jumbo time
Retail time
Savings
Interest bearing demand
Demand
8.1%
8.0%
7.7%
8.3%
8.4% |
 Earnings Trends
2010
2010
2006
2007
2008
2009
1st Q
2nd Q
3rd Q
4th Q
full year
Net interest income
$256.8
$275.9
$398.3
$408.8
$108.3
$106.2
$105.4
$106.6
$426.5
Net interest margin (%)
3.77%
3.67%
3.62%
3.58%
3.80%
3.69%
3.58%
3.61%
3.67%
Non-interest income
136.3
120.7
142.3
163.7
38.7
38.3
35.4
39.8
152.1
Non-interest expense
262.8
277.0
367.2
382.5
94.3
96.2
96.2
96.0
382.7
Pre-provision, pre-tax income
$130.3
$119.6
$173.4
$190.0
$52.7
$48.3
$44.6
$50.4
$196.0
Provision expense
8.7
21.8
63.8
188.0
45.0
43.0
40.0
35.0
163.0
Pre-tax income
$121.6
$97.8
$109.6
$2.0
$7.7
$5.3
$4.6
$15.4
$33.0
Source: Company filings
12
($mm) |
 Fee
Generating
Subsidiaries
13 |
 Valley Forge Asset Management
Offers investment advisory, asset management and brokerage
services for institutional and high net worth individuals
$2.8 billion in assets under management
14
Revenue (In millions)
2006
2007
2008
2009
2010
$19.3
$20.9
$15.6
$13.8
$14.4 |
 Stratton Management
Focuses on institutions, pensions, endowments
and high net worth individuals
Manages and advises the Stratton Mutual Funds
which includes Morningstar rated:
Stratton Small-Cap Value Fund, 4 star
Stratton Multi-Cap Fund, 3 star
Stratton Monthly Dividend REIT Shares, 5 star
$2.0 billion in assets under management
2008
2009
2010
$14.8
$12.2
$13.1
Revenue (In millions)
15 |
 Susquehanna Trust & Investment
Company
Susquehanna Trust & Investment
Company
Offers traditional trust and custodial services to high net worth individuals,
businesses and non-profit entities
$902 million in assets under management
$ 519 million in assets under administration
16
Revenue (In millions)
2006
2007
2008
2009
2010
$11.0
$13.2
$15.6
$15.7
$15.2 |
 Hann
Financial Service Corporation Hann Financial Service Corporation
Provides comprehensive consumer vehicle financing services to
customers in New Jersey, eastern Pennsylvania and southeastern
New York
$850 million portfolio serviced for others
17
Revenue (In millions)¹
2006
2007
2008
2009
2010
$30.9
$27.3
$23.9
$29.9
$35.6
¹
Includes benefit of spread income earned |
 The
Addis Group The Addis Group
Provides tailored insurance products to medium and large sized
companies primarily located in southeastern Pennsylvania,
southern New Jersey and northern Delaware
18
Revenue (In millions)
2006
2007
2008
2009
2010
$12.7
$12.8
$12.7
$12.6
$12.0 |
 Credit
Quality
19 |
 Aggressive actions taken to offset
weak economic backdrop
Aggressive actions taken to offset
weak economic backdrop
Redesigned processes to handle weak economic outlook
Loan Review given dual focus of evaluating the greatest risk in the portfolio on a
quarterly
basis
and
continuing
their
18
month
cycle
of
review
of
credits
deemed
to
have low risk to the company.
Asset Recovery focus on prevention of negative migration and reduction of NPA
through Note Sales, enhance work out strategies and TDR’s.
Enhanced
Loan
Quality
Meetings
focusing
on
the
categories
titled
WATCH;
Other
Assets Especially Mentioned and Substandard Loans categories. The Primary
Regulator attends once a year prior to their annual review.
Implementation of SunGard’s Risk Rating System to automate the rating process
and to assist in the analysis of the each loan’s Probability of Default
and Loss Given Probability of Default for “Point in Time and Point In
Time Through The Cycle”. 20 |
 Summary of Credit Metrics
21
($mm)
2010
2010
2006
2007
2008
2009
1st Q
2nd Q
3rd Q
4th Q
Full year
Provision
$8.7
$21.8
$63.8
$188.0
$45.0
$43.0
$40.0
$35.0
$163.0
Net charge-offs (NCO)
5.3
15.0
38.7
129.4
38.5
36.0
34.7
34.3
143.5
Non-performing assets (NPA)
31.9
68.7
115.6
243.8
268.4
254.8
246.3
215.4
215.4
Reserves
62.6
88.6
113.7
172.4
178.8
185.8
191.1
191.8
191.8
NPA generation
17.1
51.8
85.6
257.6
63.1
22.4
26.2
3.4
115.1
Key ratios:
NCO / Avg. Loans and Leases
SUSQ
0.10%
0.25%
0.42%
1.32%
1.56%
1.46%
1.42%
1.42%
1.46%
In-market peer median
0.09%
0.26%
0.49%
1.21%
1.32%
1.69%
1.44%
1.64%
1.57%
NPA
/ Total Loans and Leases + OREO
SUSQ
0.57%
0.78%
1.20%
2.48%
2.69%
2.60%
2.53%
2.23%
2.23%
In-market peer median
0.35%
0.73%
1.51%
2.17%
2.23%
2.40%
2.60%
2.60%
2.60%
Source: Company filings and SNL Financial
Note: In-market peers include FULT, WL, NPBC
1
Excludes renegotiated loans
1
1 |
 Credit Migration by Portfolio Type
Year ended
3 months ended
Non-performing Loans (%)
12/31/2007
12/31/2008
12/31/2009
3/31/2010
6/30/2010
9/30/2010
12/31/2010
Commercial, financial and agricultural
0.29
0.80
0.99
1.17
1.32
1.23
1.10
Real estate construction
1.62
3.79
8.77
8.97
9.45
8.35
6.59
Real estate secured -residential
0.55
0.79
1.57
2.01
1.82
1.79
1.91
Real estate secured -commercial
0.69
0.81
1.93
2.33
2.33
2.58
2.18
Consumer & leases
0.34
0.01
0.42
0.32
0.32
0.24
0.22
Total
0.68
1.12
2.23
2.49
2.43
2.35
2.04
Total Past Due Loans (%)
Commercial, financial and agricultural
1.61
1.39
0.99
1.08
0.51
0.58
0.63
Real estate construction
2.91
1.57
0.73
1.31
0.40
0.35
0.69
Real estate secured -residential
1.39
1.65
1.52
1.56
0.98
1.44
1.43
Real estate secured -commercial
0.90
1.90
0.94
1.84
0.57
0.58
0.79
Consumer & leases
1.25
1.30
1.65
1.36
1.27
1.41
2.07
Total
1.50
1.62
1.16
1.50
0.74
0.90
1.10
Net Charge-offs (Annualized) (%)
Commercial, financial and agricultural
0.28
0.78
1.42
0.78
1.63
0.93
0.33
Real estate construction
0.19
0.68
5.80
4.23
5.00
6.51
9.32
Real estate secured -residential
0.11
0.16
0.30
0.93
0.46
0.46
0.81
Real estate secured -commercial
0.22
0.06
0.49
1.94
1.39
1.33
0.55
Consumer & leases
0.64
0.75
1.10
0.95
0.93
0.66
0.79
Total
0.25
0.42
1.32
1.56
1.46
1.42
1.42
22 |
 Liquidity
and capital position
23 |
 Strong liquidity position
24
As of December 31, 2010
Unused
(In billions)
Capacity
Outstanding
Capacity
Brokered CDs
$
0.9
$
0.3
$
0.6
FRB -
Discount Window
0.9
0.0
0.9
Federal Funds Purchased
1.3
0.4
0.9
FHLB Advances
2.1
1.1
1.0
Subtotal
$
5.2
$
1.8
$
3.4
Repos
0.3
Long-term Debt Other
0.5
Total Outstanding
$
2.6 |
 Conservative investment portfolio
2008
2009
2010
SUSQ OTTI
$17.6
$1.1
$3.9
SUSQ cumulative OTTI
17.6
18.7
22.6
SUSQ cumulative OTTI as % of 2007 securities portfolio¹
0.85%
0.91%
1.10%
Peer median² cumulative OTTI as % of 2007 securities portfolio
2.94%
3.16%
3.21%
Source: SNL Financial, company filings
¹ 2007 securities portfolio of $2.06bn
² Peers include WBS, FULT, VLY, FMER, WL, NPBC, FNFG; 4Q 2010 OTTI included for peers where
available 25
Amortized
Fair
cost
value
Difference
Available-for-sale:
U.S. Government agencies
$268.8
$268.2
($0.6)
State and municipal
397.8
396.7
(1.1)
Agency residential mortgage-backed
1,321.8
1,323.5
1.7
Non-agency residential mortgage-backed
129.2
116.8
(12.4)
Commercial mortgage-backed
99.5
104.8
5.3
Other¹
66.5
53.5
(13.0)
Equities
146.0
145.4
(0.6)
Subtotal
$2,429.6
$2,408.9
($20.7)
Held-to-maturity:
$8.7
$8.7
$0.0
Total investment securities
$2,438.3
$2,417.6
($20.7)
Source: Company information
¹ Includes other structured financial products, and other debt securities
Securities portfolio 12/31/10 ($mm)
Other than temporary impairments ($mm) |
 Strong Capital Position
6.03%
9.58%
10.58%
10.01%
11.17%
12.65%
13.45%
11.49%
2009
2010
Pro forma ABBC
Peer median
Tier 1 common
Tier 1
26
Source: SNL Financial
¹
Peers include WBS, VLY, WL, NPBC, FNFG; FULT and FMER regulatory ratios are 3Q as
4Q not yet disclosed ²
Includes deferred tax liability associated with intangibles
(%)
2009
2010
Pro forma ABBC
Peer median¹
TCE / TA
4.97
7.56²
8.16²
7.46
Leverage
9.73
10.27
10.67
8.31
Total Risk-based Capital
13.48
14.72
15.42
13.99
|
 Strategic Acquisition of
Abington Bancorp
27 |
 Transaction highlights
Strong Strategic
Rationale
Attractive Financial
Returns
Low Risk
Low-risk fill-in acquisition of an in-market community bank in
Montgomery and Bucks counties
—
Adds 20 branches and $900mm of deposits; no branch overlap
Strengthens presence in attractive Montgomery and Delaware counties and provides
entry into Bucks County
—
Top
10
market
share
in
Montgomery
County
–
20
th
wealthiest
in
U.S.
—
3 counties rank among top 5 highest HHI in PA
Tremendous opportunity for deposit, loan and fee income growth
—
Wealth management and insurance subsidiaries (Valley Forge, Stratton, and
Addis) located in Montgomery County with strong customer contacts
—
Expand Susquehanna’s in-market mortgage origination capability
—
Potential for commercial loan growth
20% IRR
100bps accretive to Tier I common at close
Breakeven to 2012 EPS, without considering benefits of excess capital
Comprehensive due diligence process
In-market transaction with similar demographics
Proven track record of integrating acquisitions
28 |
 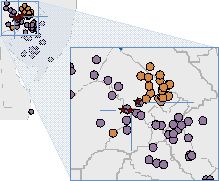  Expands
Susquehanna into attractive markets
Expands Susquehanna into attractive
markets
SUSQ
ABBC
Projected population
change 2010-2015
Pennsylvania
Projected HH income
change 2010-2015
Median HH income
2010 ($000)
Source: SNL Financial
Note: Branch and deposit data as of June 2010
0.9%
1.1%
0.5%
13.3%
16.4%
13.6%
$52.7
$79.7
$58.6
ABBC (20 branches)
SUSQ (222 branches)
NJ
DE
PA
VA
WV
MD
Bucks
Montgomery
Chester
Philadelphia
Delaware
Susquehanna
Bank
Valley
Forge
Addis
Group
Stratton Management
Susquehanna
Abington
Pro forma
Deposit mkt
Deposit mkt
Deposit mkt
Market
Deposits
share
Market
Deposits
share
Market
Deposits
share
rank
Branches
($mm)
(%)
rank
Branches
($mm)
(%)
rank
Branches
($mm)
(%)
Montgomery, PA
18
6
$271
1.2%
8
14
$728
3.3%
7
20
$999
4.6%
Bucks, PA
-
-
-
-
22
5
155
1.1%
22
5
155
1.1%
Delaware, PA
16
3
138
1.2%
29
1
31
0.3%
14
4
169
1.5%
All other counties
213
8,723
0
0
213
8,723
Pro forma franchise
222
$9,132
20
$913
242
$10,045
29
S.M
A.G
V.F
SUSQ / ABBC branch map
Susquehanna Demographics
Pro forma market share by county |
 Pro
forma financial impact Pro forma financial impact
Attractive financial returns:
20% IRR
60 bps accretive to TCE and 100bps to Tier I common
Breakeven accretion to SUSQ normalized EPS without considering any benefit from
excess capital; 3% accretive to SUSQ current 2012 median analyst
estimate¹ Tangible book value dilution less than 2%
Strong
pro
forma
capital
position
(approximately
$95mm
capital
accretive):
Assumptions:
8.5% cumulative lifetime credit losses through the cycle (since 2008)
Cost savings of $8.1mm or 31%², phased in 50% in 2011 and 100% in 2012
One time pre-tax restructuring charge of $21mm
30
12/31/2010
Actual (%)
Pro forma (%)
TCE/TA
7.6%
8.2%
Tier I common
9.6%
10.6%
Tier I
12.7%
13.5%
Note: Based on SUSQ and ABBC stock prices at announcement
¹
Susquehanna normalized analyst estimate of $0.80 and 2012 analyst estimate of
$0.66 ²
Excluding stock based compensation expenses, core cost synergies are approximately
24% of non interest expenses |
 Pricing metrics
31
Based on Jan. 26, 2011
(Announcement date)
1 day
Deal price per share ($)
$12.80
Implied premium (%)
10.3%
Price / 4Q net income (adjusted for excess capital)¹
24.1x
Price / Tangible book value
1.2x
Price / Adjusted tangible book value²
1.3x
Core deposit premium³
8.2%
Memo:
Susquehanna price per share ($)
$9.70
Financial information as of December 31, 2010
¹4Q 2010 net income annualized; price and earnings adjusted for excess capital of $95mm; assumes
1% pre-tax earnings on excess capital ²Adjusted for credit marks of $31mm and loan loss
reserve of $4mm ³ Core deposits of $680 excludes time deposits >$100mm
|
 Transaction Summary
32
Low-risk, fill-in transaction expanding Susquehanna’s footprint into
highly attractive demographic markets
Significant opportunity for deposit, loan, and fee income generation
by delivering on Susquehanna’s full-service platform to wealthy
markets
Capital accretive transaction; potential to drive earnings accretion
through deployment of excess capital |
 Reasons to invest in Susquehanna
33
Diversified financial holding company
Strong fee income generating subsidiaries
Well positioned in attractive growth markets (Philadelphia, Baltimore)
Fortress balance sheet with strong capital position
Current stock price not reflective of underlying franchise potential
|
 |