Attached files
| file | filename |
|---|---|
| 8-K - FORM 8-K - BlueLinx Holdings Inc. | c12759e8vk.htm |
| EX-99.1 - EXHIBIT 99.1 - BlueLinx Holdings Inc. | c12759exv99w1.htm |
Exhibit 99.2
| 1 BlueLinx Quarterly Review 4th Quarter 2010 |
| 2 BlueLinx Holdings Inc. Forward-Looking Statement Safe Harbor - This presentation includes "forward-looking statements" within the meaning of the Private Securities Litigation Reform Act of 1995. All of these forward-looking statements are based on estimates and assumptions made by our management that, although believed by us to be reasonable, are inherently uncertain. Forward-looking statements involve risks and uncertainties, including, but not limited to, economic, competitive, governmental and technological factors outside of our control, that may cause our business, strategy or actual results to differ materially from the forward-looking statements. These risks and uncertainties may include, among other things: changes in the supply and/or demand for products which we distribute, especially as a result of conditions in the residential housing market; general economic and business conditions in the United States; the activities of competitors; changes in significant operating expenses; changes in the availability of capital; the ability to identify acquisition opportunities and effectively and cost-efficiently integrate acquisitions; adverse weather patterns or conditions; acts of war or terrorist activities; variations in the performance of the financial markets; and other factors described in the "Risk Factors" section in our Annual Report on Form 10-K for the fiscal year ended January 2, 2010, and in our other periodic reports filed with the SEC. In addition, the statements in this presentation are made as of February 17, 2011. We undertake no obligation to update any of the forward-looking statements made herein, whether as a result of new information, future events, changes in expectation or otherwise. These forward-looking statements should not be relied upon as representing our views as of any date subsequent to February 17, 2011. Use of Non-GAAP and Adjusted Financial Information - To supplement GAAP financial information, we use adjusted measures of operating results which are non-GAAP measures. This non-GAAP adjusted financial information is provided as additional information for investors. These adjusted results exclude certain costs, expenses, gains and losses, and we believe their exclusion can enhance an overall understanding of our past financial performance and also our prospects for the future. These adjustments to our GAAP results are made with the intent of providing both management and investors a more complete understanding of our operating performance by excluding non-recurring, infrequent or other non-cash charges that are not believed to be material to the ongoing performance of our business. The presentation of this additional information is not meant to be considered in isolation or as a substitute for GAAP measures of net earnings, diluted earnings per share or net cash provided by (used in) operating activities prepared in accordance with generally accepted accounting principles in the United States. |
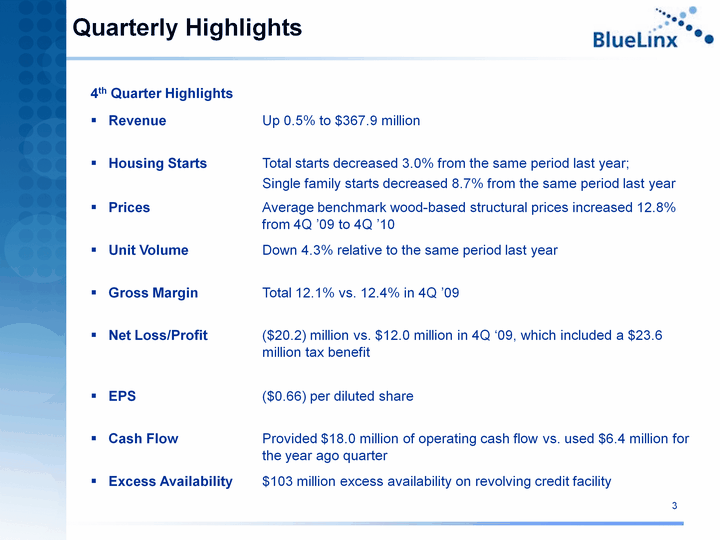
| 3 4th Quarter Highlights 4th Quarter Highlights Revenue Up 0.5% to $367.9 million Up 0.5% to $367.9 million Housing Starts Total starts decreased 3.0% from the same period last year; Single family starts decreased 8.7% from the same period last year Total starts decreased 3.0% from the same period last year; Single family starts decreased 8.7% from the same period last year Prices Average benchmark wood-based structural prices increased 12.8% from 4Q '09 to 4Q '10 Average benchmark wood-based structural prices increased 12.8% from 4Q '09 to 4Q '10 Unit Volume Down 4.3% relative to the same period last year Down 4.3% relative to the same period last year Gross Margin Total 12.1% vs. 12.4% in 4Q '09 Total 12.1% vs. 12.4% in 4Q '09 Net Loss/Profit ($20.2) million vs. $12.0 million in 4Q '09, which included a $23.6 million tax benefit ($20.2) million vs. $12.0 million in 4Q '09, which included a $23.6 million tax benefit EPS ($0.66) per diluted share ($0.66) per diluted share Cash Flow Provided $18.0 million of operating cash flow vs. used $6.4 million for the year ago quarter Provided $18.0 million of operating cash flow vs. used $6.4 million for the year ago quarter Excess Availability $103 million excess availability on revolving credit facility $103 million excess availability on revolving credit facility Quarterly Highlights |
| 4 Doug Goforth Chief Financial Officer and Treasurer Introduction and Financial Review |
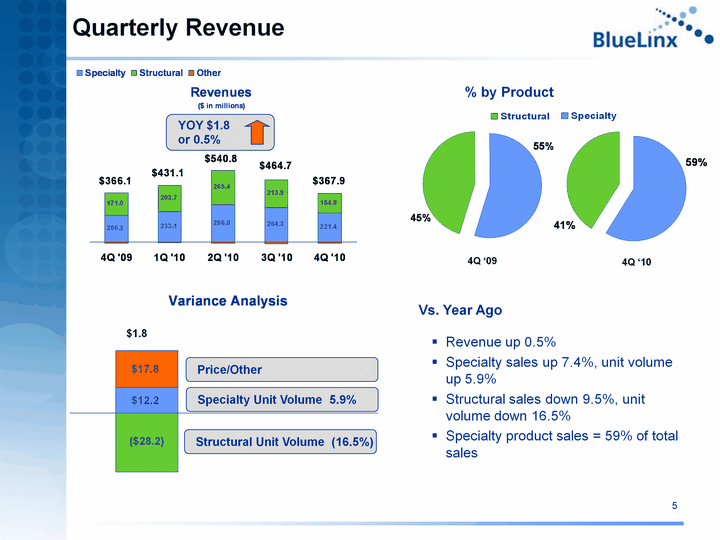
| 5 Quarterly Revenue 4Q '05 1Q '06 2Q '06 3Q '06 4Q '06 1Q '07 2Q '07 3Q '07 4Q '07 1Q '08 2Q '08 3Q '08 4Q '08 1Q '09 2Q '09 3Q '09 4Q '09 1Q '10 2Q '10 3Q '10 4Q '10 Specialty 539.5 580 603.3 553.5 460 456.5 500.8 462.9 381.5 354 402.8 375.9 278.7 233.9 250 257.9 206.2 233.1 286 264.3 221.4 Structural 815.2 813.4 798.7 666.6 509.2 518.9 598.1 571.4 409.6 373 442.4 365.8 240.9 182.5 183 202.1 171 203.7 265.4 213.9 154.8 Other -25.4 -16.8 -23 -16.6 -28.9 -18.3 -16.9 -18.4 -12.2 -10.2 -10.5 -14.9 -18.1 -9.3 -9.5 -10.6 -11.1 -5.7 -10.62 -13.5 -8.3 Specialty Unit Volume 5.9% YOY $1.8 or 0.5% Structural Unit Volume (16.5%) Price/Other $1.8 4Q '10 Specialty 221.4 Structural 154.8 4Q '09 4Q '10 3Q '09 Specialty 206.2 Structural 171 Vs. Year Ago Revenue up 0.5% Specialty sales up 7.4%, unit volume up 5.9% Structural sales down 9.5%, unit volume down 16.5% Specialty product sales = 59% of total sales % by Product |
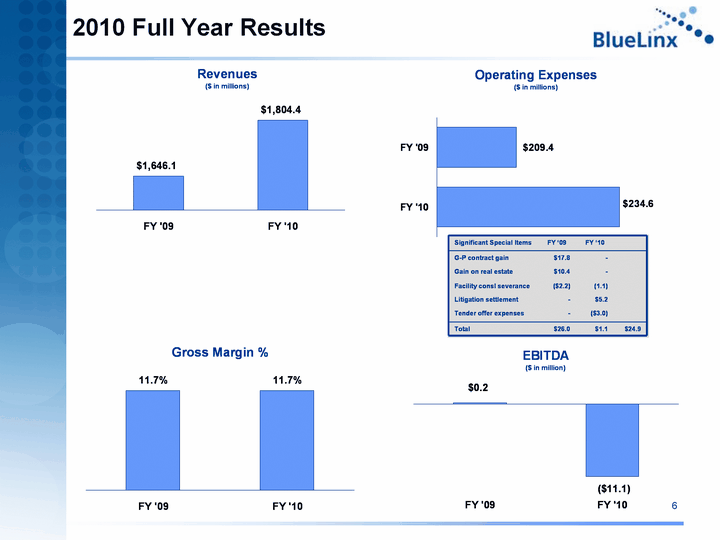
| 6 2010 Full Year Results revenue FY '09 1646.107 FY '10 1804.4 FY '09 FY '10 GM % 0.117 0.117 Operating Expense FY '09 209.428 FY '10 234.55 FY '09 FY '10 EBITDA 0.2 -11.1 Significant Special Items FY '09 FY '10 G-P contract gain $17.8 - Gain on real estate $10.4 - Facility consl severance ($2.2) (1.1) Litigation settlement - $5.2 Tender offer expenses - ($3.0) Total $26.0 $1.1 $24.9 |
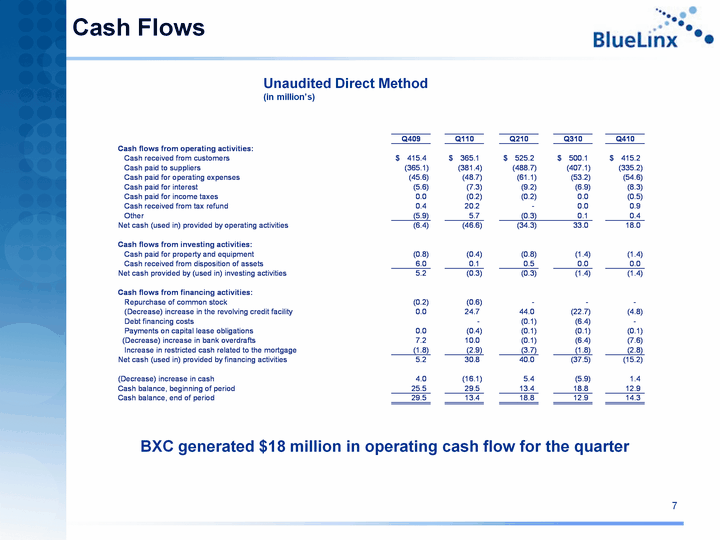
| 7 Cash Flows BXC generated $18 million in operating cash flow for the quarter Unaudited Direct Method (in million's) (in million's) (in million's) |
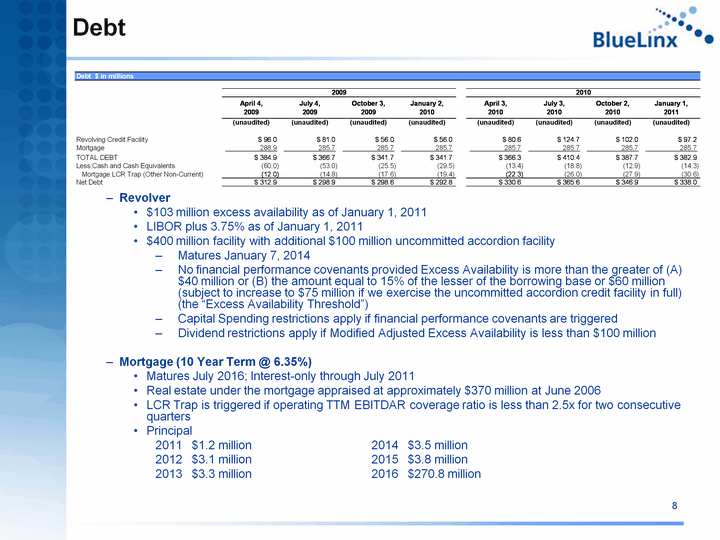
| 8 Debt Revolver $103 million excess availability as of January 1, 2011 LIBOR plus 3.75% as of January 1, 2011 $400 million facility with additional $100 million uncommitted accordion facility Matures January 7, 2014 No financial performance covenants provided Excess Availability is more than the greater of (A) $40 million or (B) the amount equal to 15% of the lesser of the borrowing base or $60 million (subject to increase to $75 million if we exercise the uncommitted accordion credit facility in full) (the "Excess Availability Threshold") Capital Spending restrictions apply if financial performance covenants are triggered Dividend restrictions apply if Modified Adjusted Excess Availability is less than $100 million Mortgage (10 Year Term @ 6.35%) Matures July 2016; Interest-only through July 2011 Real estate under the mortgage appraised at approximately $370 million at June 2006 LCR Trap is triggered if operating TTM EBITDAR coverage ratio is less than 2.5x for two consecutive quarters Principal 2011 $1.2 million 2014 $3.5 million 2012 $3.1 million 2015 $3.8 million 2013 $3.3 million 2016 $270.8 million |
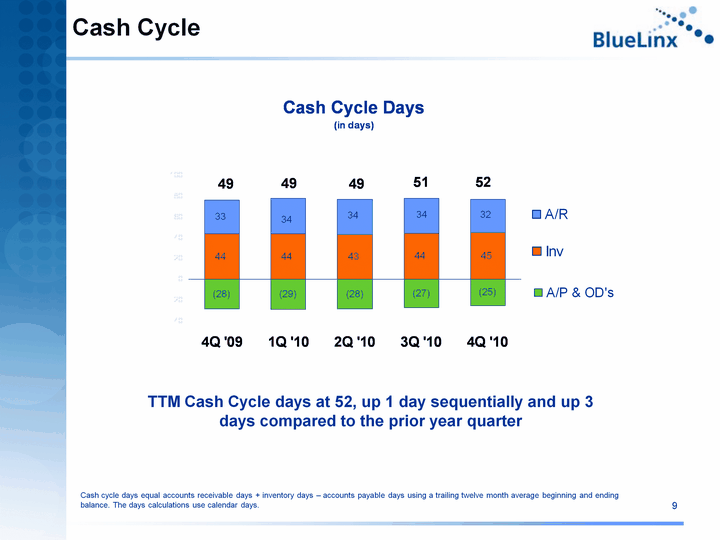
| 9 Cash Cycle TTM Cash Cycle days at 52, up 1 day sequentially and up 3 days compared to the prior year quarter 3Q '07 4Q '07 1Q '08 2Q '08 3Q '08 4Q '08 1Q '09 2Q '09 3Q '09 4Q '09 1Q '10 2Q '10 3Q '10 4Q '10 Inv 45.8 44.7 46.3 46.3 45.3 43.9 44 44.7 45.1 43.9 43.9 43.2 44.2 45 A/R 34.7 32.9 34.5 35.3 34.7 32.4 33 35.6 35.9 32.6 34.4 34 33.9 32 A/P & OD's -28.7 -27.3 -28.3 -28.8 -27.8 -26.4 -27 -28.4 -28.9 -28 -28.7 -28 -27.2 -25 MSGraph.Chart.8 MSGraph.Chart.8 Cash cycle days equal accounts receivable days + inventory days - accounts payable days using a trailing twelve month average beginning and ending balance. The days calculations use calendar days. |
| 10 George Judd Chief Executive Officer Business Review |
| 11 4th Quarter focus Customer care Revenue growth Gross margin Cost discipline Cash flow Long term strategic objectives: Profitably grow specialty revenues to 60+% of total sales Profitably manage structural Profitably outgrow the market over the long term Remarks |
| 12 Appendix Appendix |
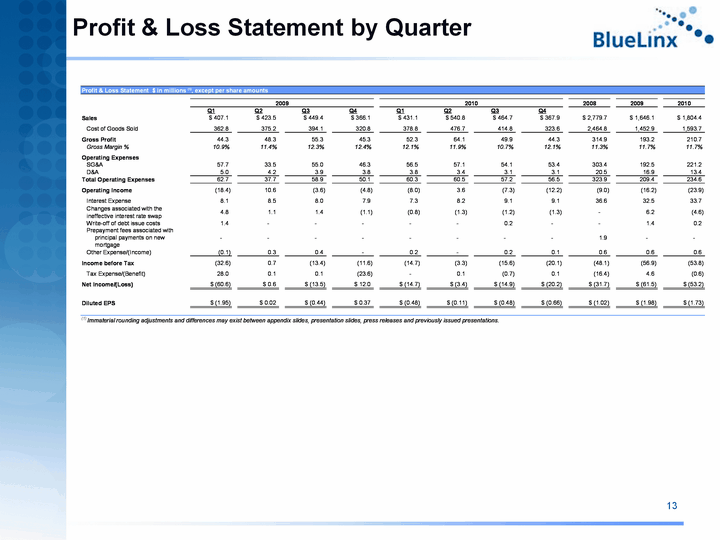
| 13 Profit & Loss Statement by Quarter Profit & Loss Statement by Quarter |
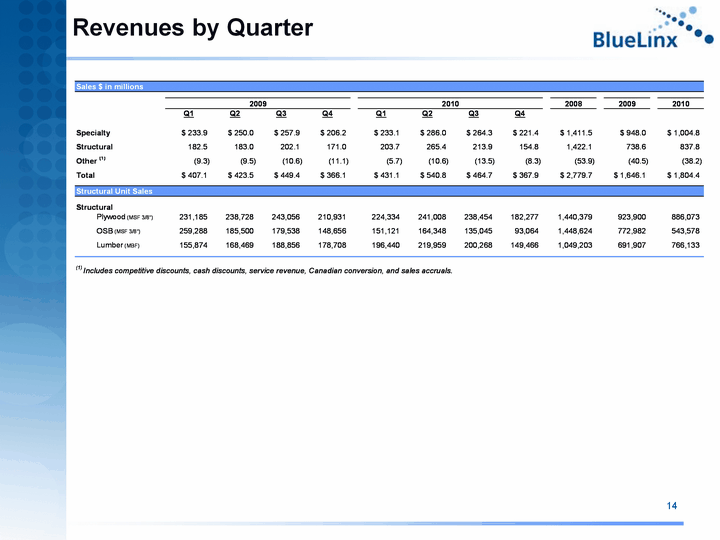
| 14 Revenues by Quarter Revenues by Quarter |
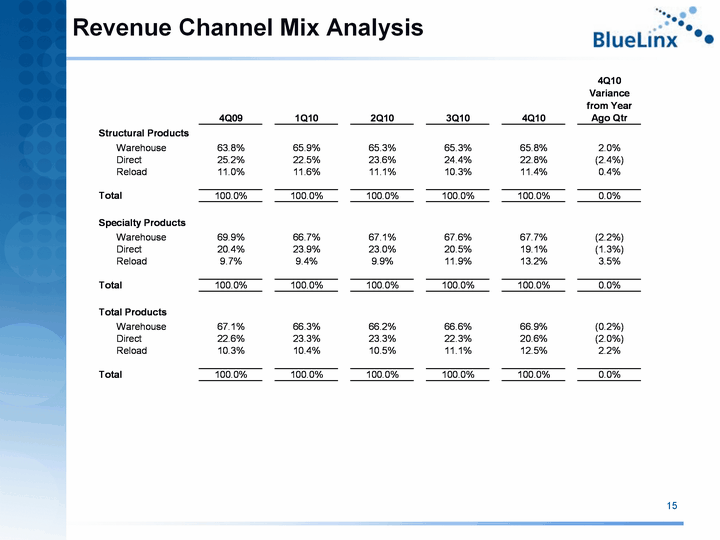
| 15 Revenue Channel Mix Analysis Revenue Channel Mix Analysis |
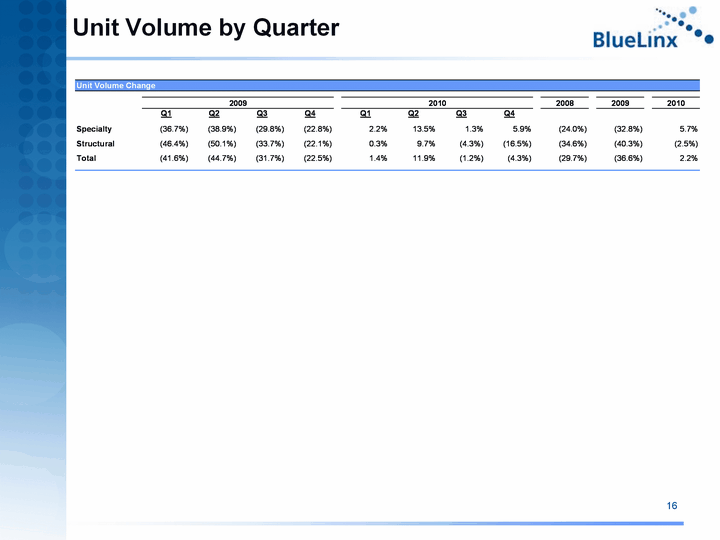
| 16 Unit Volume by Quarter Unit Volume by Quarter |
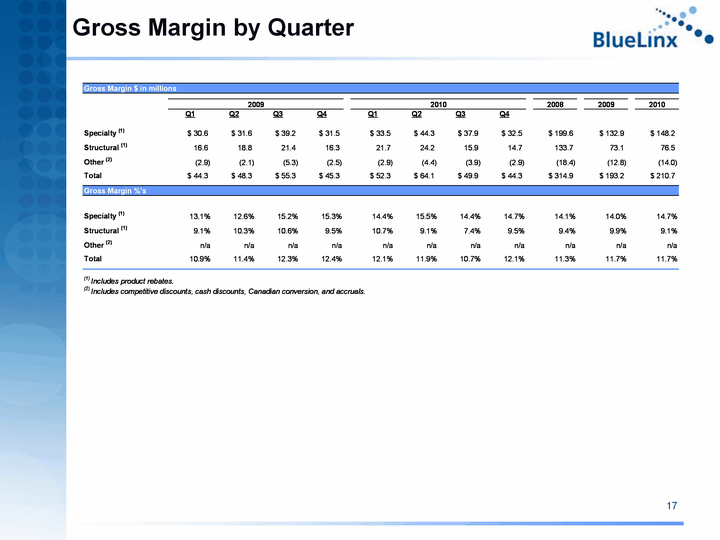
| 17 Gross Margin by Quarter Gross Margin by Quarter |
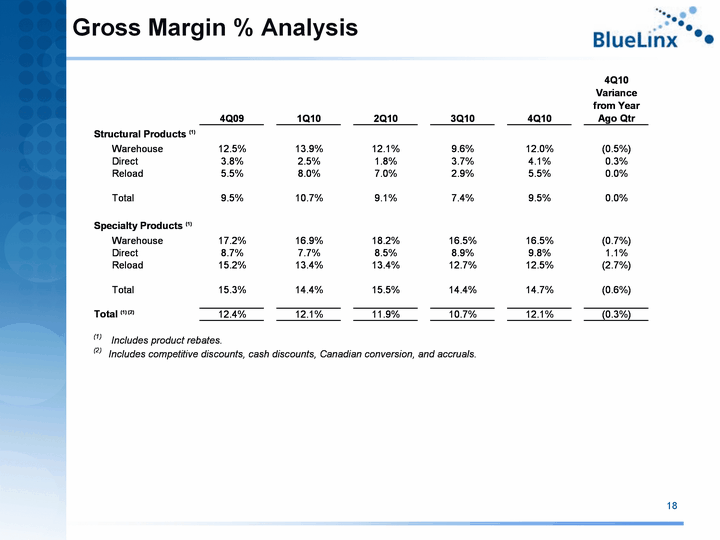
| 18 Gross Margin % Analysis Gross Margin % Analysis |
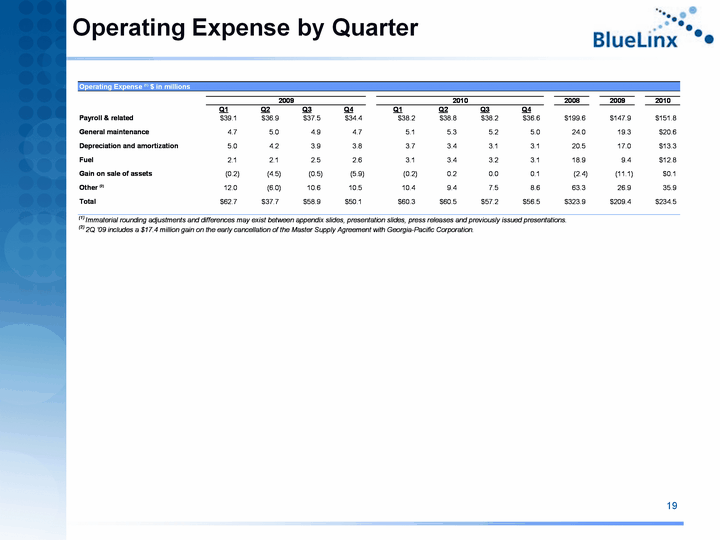
| 19 Operating Expense by Quarter Operating Expense by Quarter |
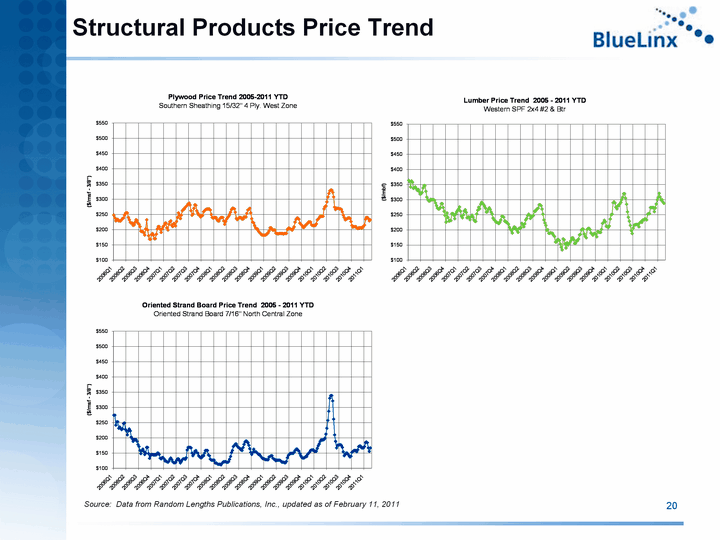
| 20 Structural Products Price Trend Source: Data from Random Lengths Publications, Inc., updated as of February 11, 2011 Source: Data from Random Lengths Publications, Inc., updated as of February 11, 2011 Source: Data from Random Lengths Publications, Inc., updated as of February 11, 2011 Source: Data from Random Lengths Publications, Inc., updated as of February 11, 2011 |
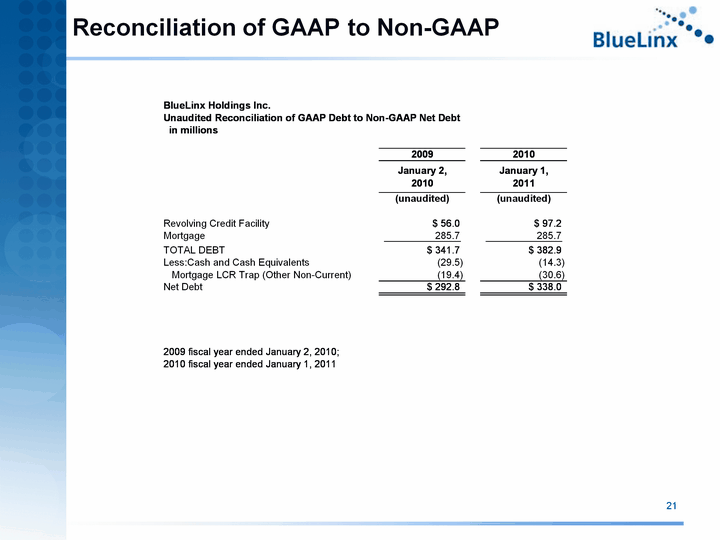
| 21 Reconciliation of GAAP to Non-GAAP Reconciliation of GAAP to Non-GAAP |
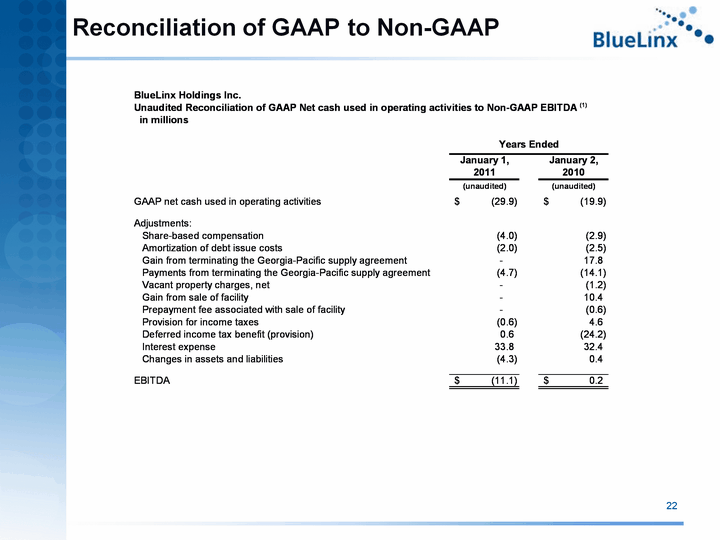
| 22 Reconciliation of GAAP to Non-GAAP Reconciliation of GAAP to Non-GAAP |