Attached files
| file | filename |
|---|---|
| 8-K - 8-K - Ameris Bancorp | d8k.htm |
Exhibit 99.1
Sterne Agee
Financial Institutions Investor Conference February 2011
Cautionary Statements
This presentation contains certain performance measures determined by methods other than in accordance with accounting principles generally accepted in the United States of America (“GAAP”) . Management of Ameris Bancorp (the “Company”) uses these non-GAAP measures in its analysis of the Company’s performance. These measures are useful when evaluating the underlying performance and efficiency of the Company’s operations and balance sheet. The Company’s management believes that these non-GAAP measures provide a greater understanding of ongoing operations, enhance comparability of results with prior periods and demonstrate the effects of significant gains and charges in the current period. The Company’s management believes that investors may use these non-GAAP financial measures to evaluate the Company’s financial performance without the impact of unusual items that may obscure trends in the Company’s underlying performance. These disclosures should not be viewed as a substitute for financial measures determined in accordance with GAAP, nor are they necessarily comparable to non-GAAP performance measures that may be presented by other companies. Tangible common equity and
Tier 1 capital ratios are non-GAAP measures. The Company calculates the Tier 1 capital using current call report instructions. The Company’s management uses these measures to assess the quality of capital and believes that investors may find them useful in their evaluation of the Company. These capital measures may, or may not be necessarily comparable to similar capital measures that may be presented by other companies.
This presentation may contain statements that constitute “forward -looking statements” within the meaning of Section 27A of the Securities
Act of 1933, as amended, and Section 21E of the Securities Exchange Act of 1934, as amended. The words “believe”,”estimate”,”expect”, “intend”,”anticipate” and similar expressions and variations thereof identify certain of such forward-looking statements, which speak only as of the dates which they were made. The Company undertakes no obligation to publicly update or revise any forward-looking statements, whether as a result of new information, future events or otherwise. Readers are cautioned that any such forward-looking statements are not guarantees of future performance and involve risks and uncertainties and that actual results may differ materially from those indicated in the forward-looking statements as a result of various factors. Readers are cautioned not to place undue reliance on these forward-looking statements and are referred to the Company’s periodic filings with the Securities and Exchange Commission for a summary of certain factors that may impact the Company’s results of operations and financial condition.
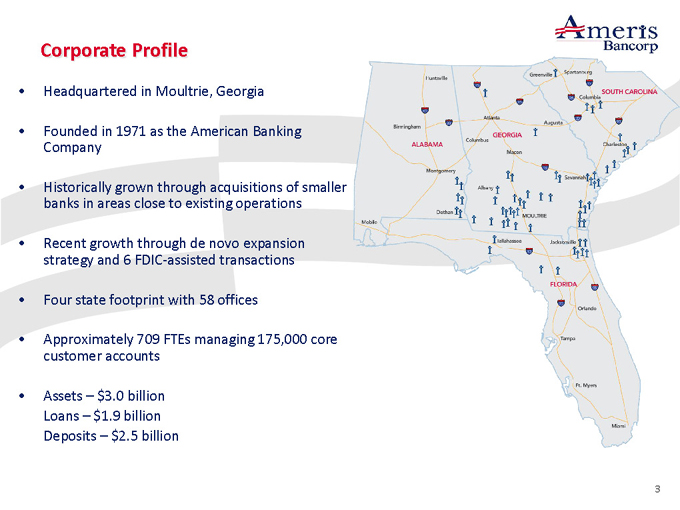
Corporate Profile
Headquartered in Moultrie, Georgia
Founded in 1971 as the American Banking Company
Historically grown through acquisitions of smaller banks in areas close to existing operations
Recent growth through de novo expansion strategy and 6 FDIC-assisted transactions
Four state footprint with 58 offices
Approximately 709 FTEs managing 175,000 core customer accounts
Assets $3.0 billion Loans $1.9 billion Deposits $2.5 billion
| 3 |
|
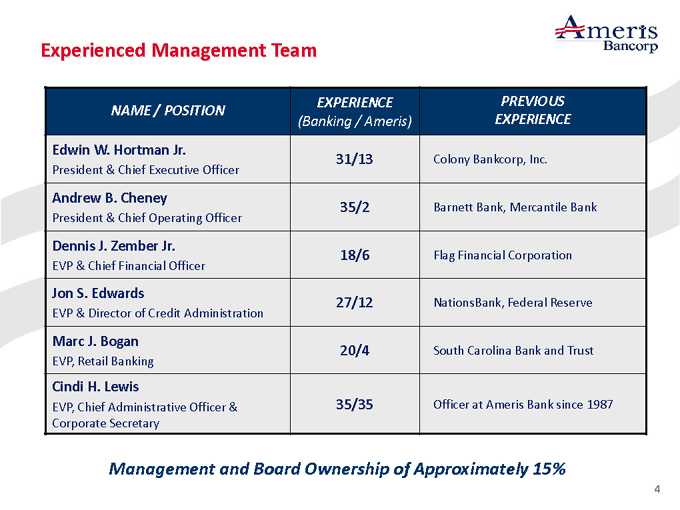
Experienced Management Team
NAME / POSITION EXPERIENCE (Banking / Ameris) PREVIOUS EXPERIENCE
Edwin W. Hortman Jr. President & Chief Executive Officer 31/13 Colony Bankcorp, Inc.
Andrew B. Cheney President & Chief Operating Officer 35/2 Barnett Bank, Mercantile Bank
Dennis J. Zember Jr. EVP & Chief Financial Officer 18/6 Flag Financial Corporation
Jon S. Edwards EVP & Director of Credit Administration 27/12 NationsBank, Federal Reserve
Marc J. Bogan EVP, Retail Banking 20/4 South Carolina Bank and Trust
Cindi H. Lewis EVP, Chief Administrative Officer & Corporate Secretary 35/35 Officer at Ameris Bank since 1987
Management and Board Ownership of Approximately 15%
| 4 |
|
Current Focus
Complete Consolidation of Acquired Institutions, Remain Positioned to Participate Further
-Realize the operational efficiencies from $1 billion of acquisitions over the past year
-Leverage our unique position as a traditional community bank in the Southeast, consolidating our markets through FDIC or whole bank transactions
Continue Improving Credit Quality
-Continue to be aggressive in recognizing and charging off problem credits -Aggressively value problem loans and OREO
Position the Company to Realize a normal ROA as soon as Possible
-Rebuild loan pipelines for FDIC cash flows, continue focusing on deposit mix
-Identify strategic alternatives for improving revenue from non-interest income sources -Improve operational efficiency, benefitting from asset growth through consolidation
| 5 |
|
Loan Portfolio Detail
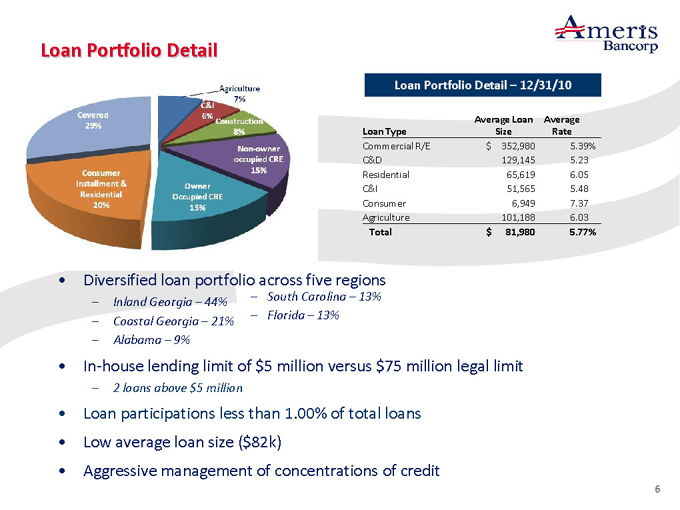
Loan Portfolio Detail 12/31/10
Loan Type Average Loan Size Average Rate
Commercial R/E $ 352,980 5.39%
C&D 129,145 5.23
Residential 65,619 6.05
C&I 51,565 5.48
Consumer 6,949 7.37
Agriculture 101,188 6.03
Total $ 81,980 5.77%
Diversified loan portfolio across five regions
South Carolina 13%
Inland Georgia 44%
Florida 13%
Coastal Georgia 21%
Alabama 9%
In-house lending limit of $5 million versus $75 million legal limit
| 2 |
|
loans above $5 million |
Loan participations less than 1.00% of total loans Low average loan size ($82k) Aggressive management of concentrations of credit
| 6 |
|
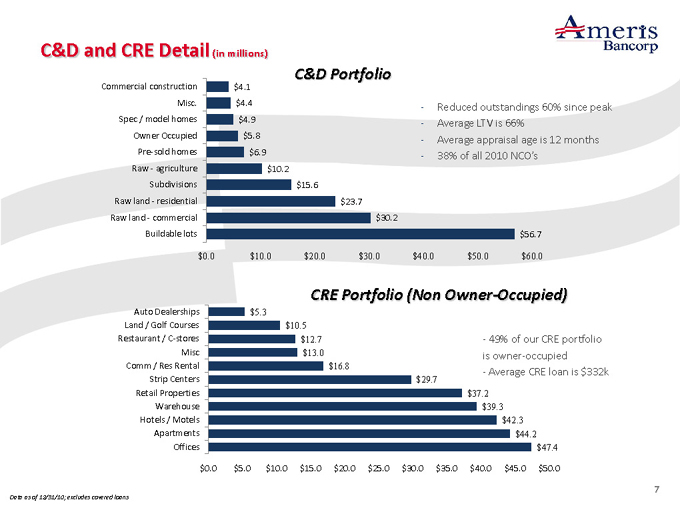
C&D and CRE Detail (in millions)
C&D Portfolio
Commercial construction
Misc.
Spec / model homes Owner Occupied Pre-sold homes Raw—agriculture Subdivisions Raw land—residential Raw land—commercial Buildable lots $4.1 $4.4 $4.9 $5.8 $6.9 $10.2 $15.6 $23.7 $30.2 $0.0 $10.0 $20.0 $30.0 $40.0 $50.0 $60.0 $56.7
Reduced outstandings 60% since peak Average LTV is 66%
Average appraisal age is 12 months
38% of all 2010 NCO’S
CRE Portfolio (Non Owner-Occupied)
Auto Dealerships Land / Golf Courses Restaurant / C-stores Misc Comm / Res Rental Strip Centers Retail Properties Warehouse Hotels / Motels Apartments Offices $0.0 $5.0 $10.0 $15.0 $20.0 $25.0 $30.0 $35.0 $40.0 $45.0 $50.0 $5.3 $10.5 $12.7 $13.0 $16.8 $29.7 $37.2 $39.3 $42.3 $44.2 $47.4
- 49% of our CRE portfolio is owner-occupied
- Average CRE loan is $332k
Data as of 12/31/10; excludes covered loans
| 7 |
|
Credit Quality
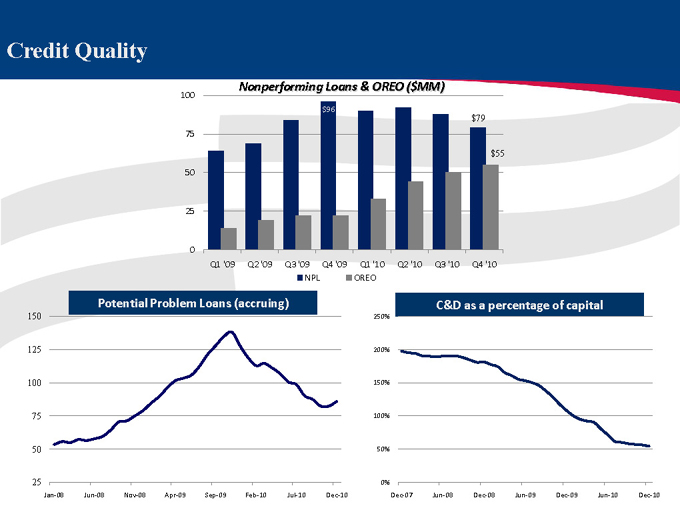
Nonperforming Loans & OREO ($MM)
100 75 50 25 0 $96 $79
$55
Q1 ‘09 Q2 ‘09 Q3 ‘09 Q4 ‘09 Q1 ‘10 Q2 ‘10 Q3 ‘10 Q4 ‘10
NPL OREO
Potential Problem Loans (accruing)
150 125 100 75 50 25
Jan-08 Jun-08 Nov-08 Apr-09 Sep-09 Feb-10 Jul-10 Dec-10
C&D as a percentage of capital
250% 200% 150% 100% 50% 0%
Dec-07 Jun-08 Dec-08 Jun-09 Dec-09 Jun-10 Dec-10
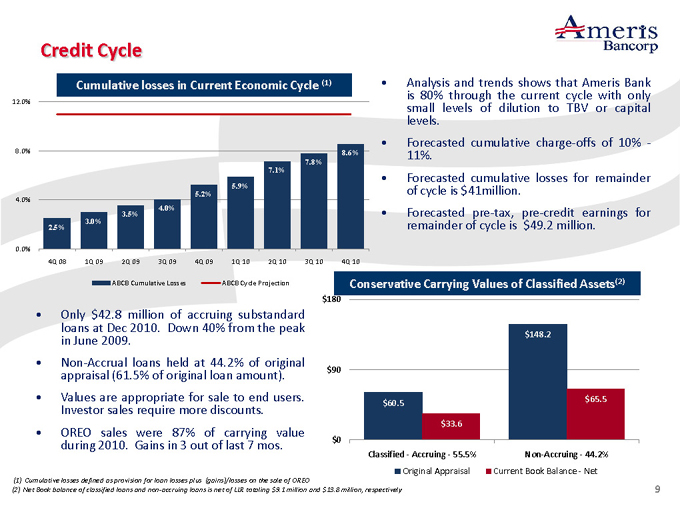
Credit Cycle
Cumulative losses in Current Economic Cycle (1)
12.0% 8.0% 4.0% 0.0%
8.6% 7.8% 7.1%
5.9% 5.2% 4.0% 3.5% 3.0% 2.5%
4Q 08 1Q 09 2Q 09 3Q 09 4Q 09 1Q 10 2Q 10 3Q 10 4Q 10
ABCB Cumulative Losses ABCB Cycle Projection
Analysis and trends shows that Ameris Bank is 80% through the current cycle with only small levels of dilution to TBV or capital levels.
Forecasted cumulative charge-offs of 10% -11%.
Forecasted cumulative losses for remainder of cycle is $41million.
Forecasted pre-tax, pre-credit earnings for remainder of cycle is $49.2 million.
Only $42.8 million of accruing substandard loans at Dec 2010. Down 40% from the peak in June 2009.
Non-Accrual loans held at 44.2% of original appraisal (61.5% of original loan amount). Values are appropriate for sale to end users. Investor sales require more discounts. OREO sales were 87% of carrying value during 2010. Gains in 3 out of last 7 mos.
Conservative Carrying Values of Classified Assets(2) $180 $90 $0 $148.2
$65.5 $60.5
$33.6
Classified—Accruing—55.5% Non-Accruing—44.2%
Original Appraisal Current Book Balance—Net
| (1) |
|
Cumulative losses defined as provision for loan losses plus (gains)/losses on the sale of OREO |
(2) Net Book balance of classified loans and non-accruing loans is net of LLR totaling $9.1 million and $13.8 million, respectively
9
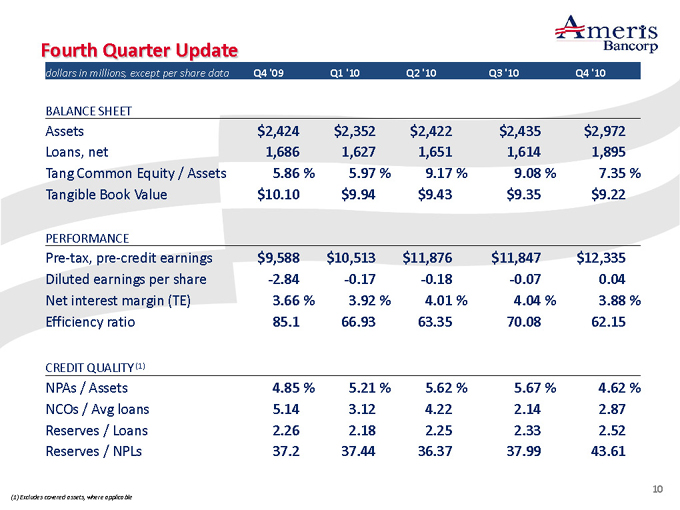
Fourth Quarter Update dollars in millions, except per share data Q4 ‘09 Q1 ‘10 Q2 ‘10 Q3 ‘10 Q4 ‘10
BALANCE SHEET
Assets $2,424 $2,352 $2,422 $2,435 $2,972
Loans, net 1,686 1,627 1,651 1,614 1,895
Tang Common Equity / Assets 5.86 % 5.97 % 9.17 % 9.08 % 7.35 %
Tangible Book Value $10.10 $9.94 $9.43 $9.35 $9.22
PERFORMANCE
Pre-tax, pre-credit earnings $9,588 $10,513 $11,876 $11,847 $12,335
Diluted earnings per share -2.84 -0.17 -0.18 -0.07 0.04
Net interest margin (TE) 3.66 % 3.92 % 4.01 % 4.04 % 3.88 %
Efficiency ratio 85.1 66.93 63.35 70.08 62.15
CREDIT QUALITY (1)
NPAs / Assets 4.85 % 5.21 % 5.62 % 5.67 % 4.62 %
NCOs / Avg loans 5.14 3.12 4.22 2.14 2.87
Reserves / Loans 2.26 2.18 2.25 2.33 2.52
Reserves / NPLs 37.2 37.44 36.37 37.99 43.61
| (1) |
|
Excludes covered assets, where applicable |
10
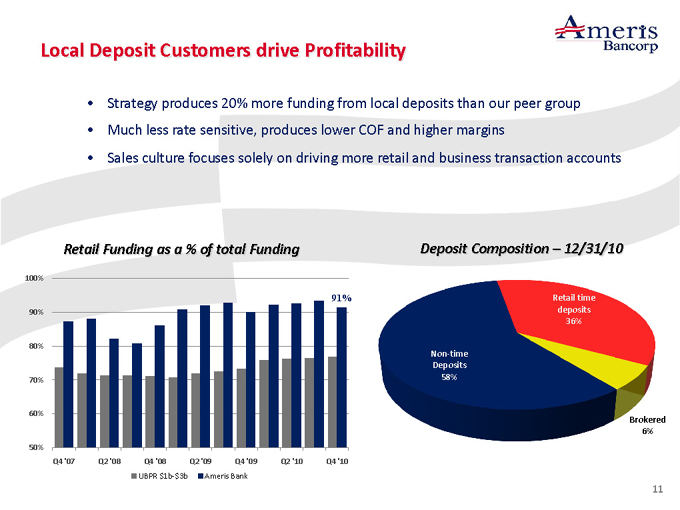
Local Deposit Customers drive Profitability
Strategy produces 20% more funding from local deposits than our peer group Much less rate sensitive, produces lower COF and higher margins Sales culture focuses solely on driving more retail and business transaction accounts
Retail Funding as a % of total Funding
100% 90% 80% 70% 60% 50%
Q4 ‘07 Q2 ‘08 Q4 ‘08 Q2 ‘09 Q4 ‘09 Q2 ‘10 Q4 ‘10
UBPR $1b-$3b Ameris Bank
91%
Deposit Composition - 12/31/10
Non-time Deposits 58%
Retail time deposits 36%
Brokered 6%
11
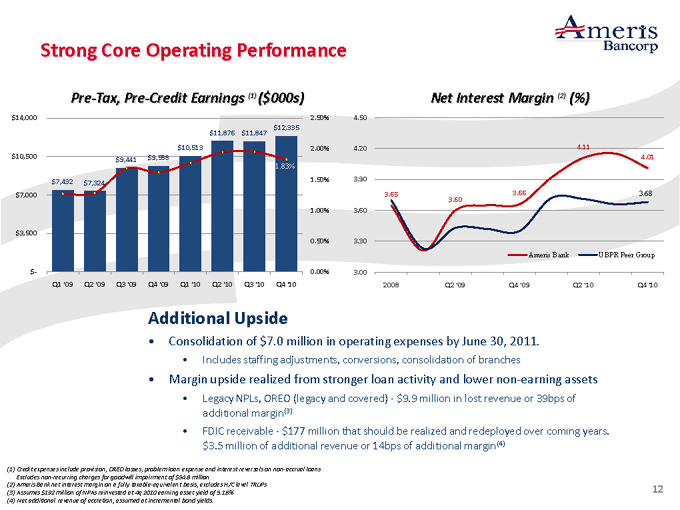
Strong Core Operating Performance
Pre-Tax, Pre-Credit Earnings (1) ($000s) $14,000 $10,500 $7,000 $3,500 $-$12,335 $11,876 $11,847
$10,513 $9,441 $9,588
1.83%
$7,432 $7,324
Q1 ‘09 Q2 ‘09 Q3 ‘09 Q4 ‘09 Q1 ‘10 Q2 ‘10 Q3 ‘10 Q4 ‘10
2.50% 2.00% 1.50% 1.00% 0.50% 0.00%
Net Interest Margin (2) (%)
4.50 4.20 3.90 3.60 3.30 3.00
2008 Q2 ‘09 Q4 ‘09 Q2 ‘10 Q4 ‘10
4.11
4.01
3.65 3.66 3.68 3.60
Ameris Bank UBPR Peer Group
Additional Upside
Consolidation of $7.0 million in operating expenses by June 30, 2011.
Includes staffing adjustments, conversions, consolidation of branches
Margin upside realized from stronger loan activity and lower non-earning assets
Legacy NPLs, OREO (legacy and covered)—$9.9 million in lost revenue or 39bps of additional margin(3)
FDIC receivable—$177 million that should be realized and redeployed over coming years. $3.5 million of additional revenue or 14bps of additional margin(4)
(1) Credit expenses include provision, OREO losses, problem loan expense and interest reversals on non-accrual loans Excludes non-recurring charges for goodwill impairment of $54.8 million (2) Ameris Bank net interest margin on a fully taxable-equivalent basis, excludes H/C level TRUPs (3) Assumes $192 million of NPAs reinvested at 4q 2010 earning asset yield of 5.18% (4) Net additional revenue of accretion, assumed at incremental bond yields.
12
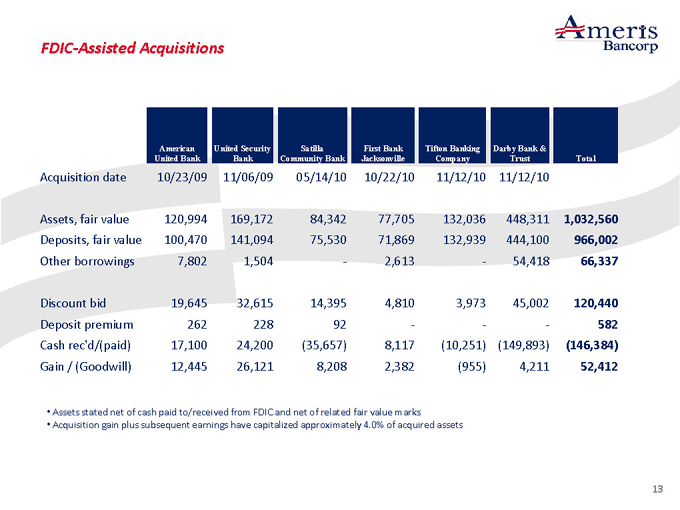
FDIC-Assisted Acquisitions
American United Bank United Security Bank Satilla Community Bank First Bank Jacksonville Tifton Banking Company Darby Bank & Trust Total
Acquisition date 10/23/09 11/06/09 05/14/10 10/22/10 11/12/10 11/12/10
Assets, fair value 120,994 169,172 84,342 77,705 132,036 448,311 1,032,560
Deposits, fair value 100,470 141,094 75,530 71,869 132,939 444,100 966,002
Other borrowings 7,802 1,504 — 2,613 — 54,418 66,337
Discount bid 19,645 32,615 14,395 4,810 3,973 45,002 120,440
Deposit premium 262 228 92 ——— 582
Cash rec’d/(paid) 17,100 24,200 (35,657) 8,117 (10,251) (149,893) (146,384)
Gain / (Goodwill) 12,445 26,121 8,208 2,382 (955) 4,211 52,412
Assets stated net of cash paid to/received from FDIC and net of related fair value marks
Acquisition gain plus subsequent earnings have capitalized approximately 4.0% of acquired assets
13
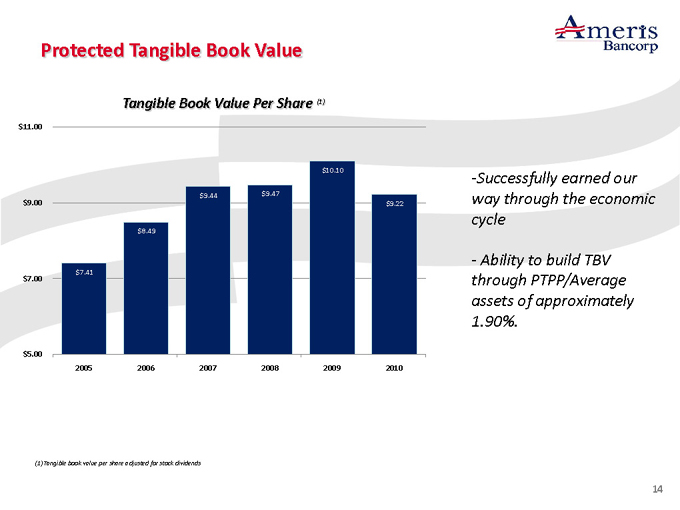
Protected Tangible Book Value
Tangible Book Value Per Share (1) $11.00 $9.00 $7.00 $5.00 $10.10
$9.44 $9.47 $9.22
$8.49
$7.41
2005 2006 2007 2008 2009 2010
-Successfully earned our way through the economic cycle
- Ability to build TBV through PTPP/Average assets of approximately
1.90%.
| (1) |
|
Tangible book value per share adjusted for stock dividends |
14
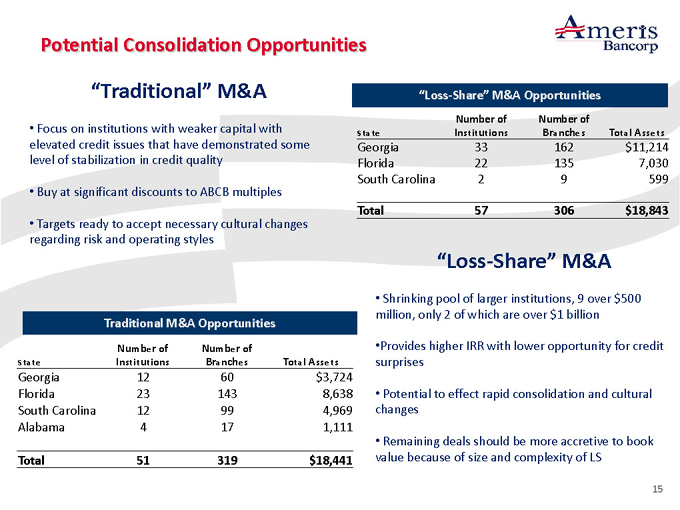
Potential Consolidation Opportunities
Focus on institutions with weaker capital with elevated credit issues that have demonstrated some level of stabilization in credit quality
Buy at significant discounts to ABCB multiples
Targets ready to accept necessary cultural changes regarding risk and operating styles
M&A “Loss -Share” M&A
State Number of Institutions Number of Branches Total Assets
Georgia 33 162 $ 11,214
Florida 22 135 7,030
South Carolina 2 9 599
Total 57 306 $ 18,843
Traditional M&A Opportunities
State Number of Institutions Number of Branches Total Assets
Georgia 12 60 $ 3,724
Florida 23 143 8,638
South Carolina 12 99 4,969
Alabama 4 17 1,111
Total 51 319 $ 18,441
“Loss -Share”
Shrinking pool of larger institutions, 9 over $500 million, only 2 of which are over $1 billion
Provides higher IRR with lower opportunity for credit surprises
Potential to effect rapid consolidation and cultural changes
Remaining deals should be more accretive to book value because of size and complexity of LS
15
Sterne Agee
Financial Institutions Investor Conference February 2011