Attached files
| file | filename |
|---|---|
| 8-K - 8-K - Rockwood Holdings, Inc. | a11-6107_18k.htm |
| EX-99.1 - EX-99.1 - Rockwood Holdings, Inc. | a11-6107_1ex99d1.htm |
Exhibit 99.2
|
|
February 16, 2011 Fourth Quarter Results |
|
|
Forward Looking Statements This conference call may contain certain "forward-looking statements" within the meaning of the Private Securities Litigation Reform Act of 1995 concerning the business, operations and financial condition of Rockwood Holdings, Inc. and its subsidiaries (“Rockwood”). Although Rockwood believes the expectations reflected in such forward-looking statements are based upon reasonable assumptions, there can be no assurance that its expectations will be realized. "Forward-looking statements" consist of all non-historical information, including the statements referring to the prospects and future performance of Rockwood. Actual results could differ materially from those projected in Rockwood’s forward-looking statements due to numerous known and unknown risks and uncertainties, including, among other things, the "Risk Factors" described in Rockwood’s Form 10-K filed with the Securities and Exchange Commission. Rockwood does not undertake any obligation to publicly update any forward-looking statement to reflect events or circumstances after the date on which any such statement is made or to reflect the occurrence of unanticipated events. |
|
|
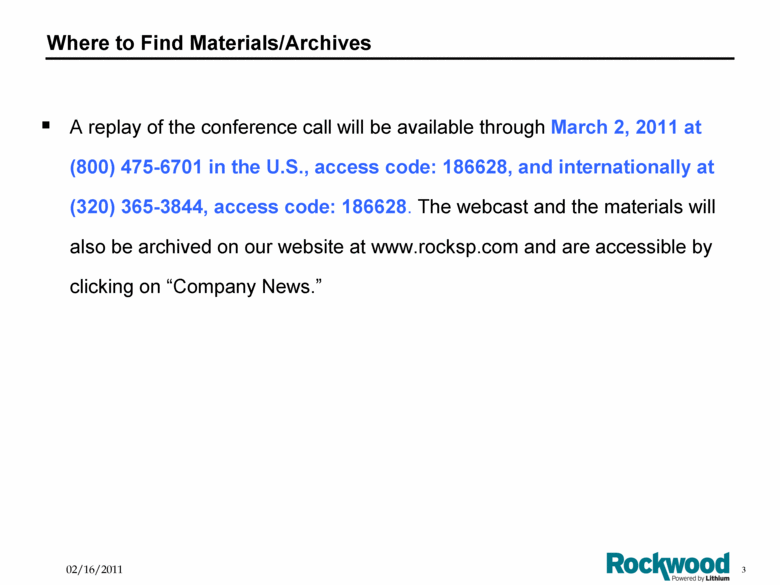
Where to Find Materials/Archives A replay of the conference call will be available through March 2, 2011 at (800) 475-6701 in the U.S., access code: 186628, and internationally at (320) 365-3844, access code: 186628. The webcast and the materials will also be archived on our website at www.rocksp.com and are accessible by clicking on “Company News.” |
|
|
Agenda Fourth Quarter Highlights Financial Summary Summary Appendices Note: All ’10 and ’09 data, other than as noted, are for continuing operations only. |
|
|
Fourth Quarter Highlights |
|
|
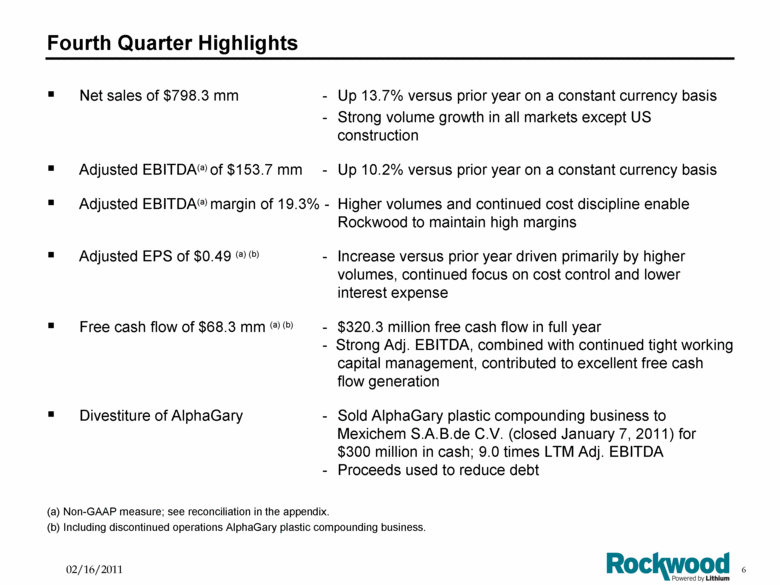
Fourth Quarter Highlights Net sales of $798.3 mm - Up 13.7% versus prior year on a constant currency basis - Strong volume growth in all markets except US construction Adjusted EBITDA(a) of $153.7 mm - Up 10.2% versus prior year on a constant currency basis Adjusted EBITDA(a) margin of 19.3% - Higher volumes and continued cost discipline enable Rockwood to maintain high margins Adjusted EPS of $0.49 (a) (b) - Increase versus prior year driven primarily by higher volumes, continued focus on cost control and lower interest expense Free cash flow of $68.3 mm (a) (b) - $320.3 million free cash flow in full year - Strong Adj. EBITDA, combined with continued tight working capital management, contributed to excellent free cash flow generation Divestiture of AlphaGary - Sold AlphaGary plastic compounding business to Mexichem S.A.B.de C.V. (closed January 7, 2011) for $300 million in cash; 9.0 times LTM Adj. EBITDA - Proceeds used to reduce debt (a) Non-GAAP measure; see reconciliation in the appendix. (b) Including discontinued operations AlphaGary plastic compounding business. |
|
|
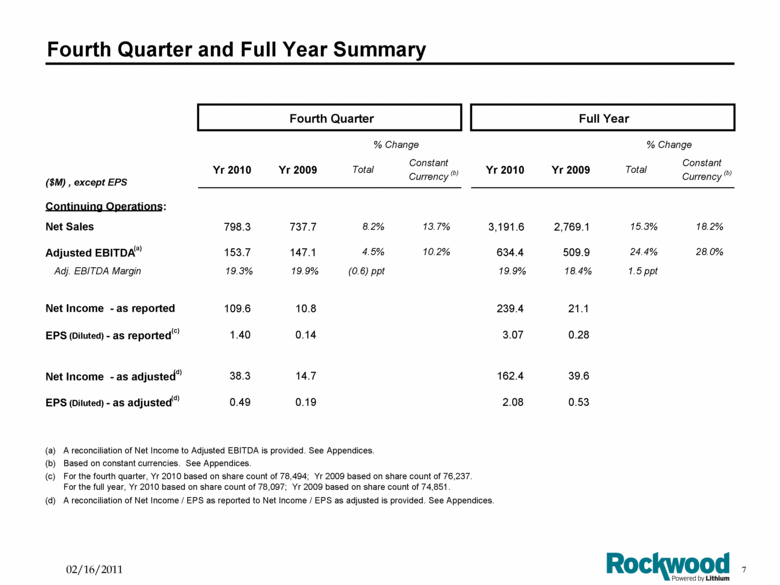
Fourth Quarter and Full Year Summary Fourth Quarter Full Year % Change % Change ($M) , except EPS Yr 2010 Yr 2009 Total Constant Currency (b) Yr 2010 Yr 2009 Total Constant Currency (b) Continuing Operations: Net Sales 798.3 737.7 8.2% 13.7% 3,191.6 2,769.1 15.3% 18.2% Adjusted EBITDA (a) 153.7 147.1 4.5% 10.2% 634.4 509.9 24.4% 28.0% Adj. EBITDA Margin 19.3% 19.9% (0.6) ppt 19.9% 18.4% 1.5 ppt Net Income - as reported 109.6 10.8 239.4 21.1 EPS (Diluted) - as reported (c) 1.40 0.14 3.07 0.28 Net Income - as adjusted (d) 38.3 14.7 162.4 39.6 EPS (Diluted) - as adjusted (d) 0.49 0.19 2.08 0.53 (a) A reconciliation of Net Income to Adjusted EBITDA is provided. See Appendices. (b) Based on constant currencies. See Appendices. (c) (d) A reconciliation of Net Income / EPS as reported to Net Income / EPS as adjusted is provided. See Appendices. For the fourth quarter, Yr 2010 based on share count of 78,494; Yr 2009 based on share count of 76,237. For the full year, Yr 2010 based on share count of 78,097; Yr 2009 based on share count of 74,851. |
|
|
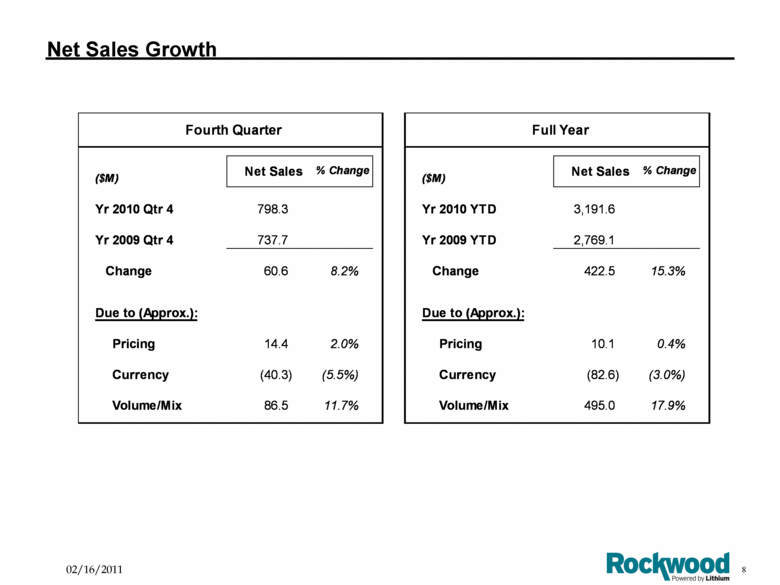
Net Sales Growth Fourth Quarter Full Year ($M) Net Sales % Change ($M) Net Sales % Change Yr 2010 Qtr 4 798.3 Yr 2010 YTD 3,191.6 Yr 2009 Qtr 4 737.7 Yr 2009 YTD 2,769.1 Change 60.6 8.2% Change 422.5 15.3% Due to (Approx.): Due to (Approx.): Pricing 14.4 2.0% Pricing 10.1 0.4% Currency (40.3) (5.5%) Currency (82.6) (3.0%) Volume/Mix 86.5 11.7% Volume/Mix 495.0 17.9% |
|
|
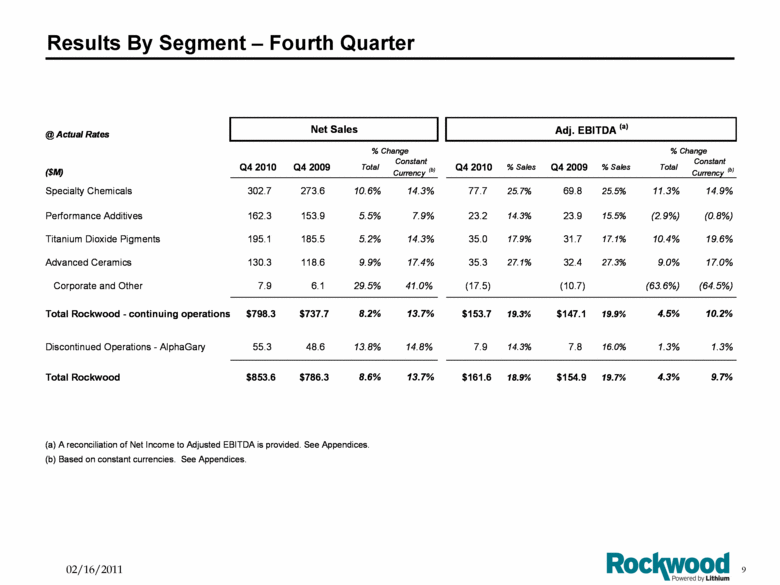
Results By Segment – Fourth Quarter @ Actual Rates Net Sales Adj. EBITDA (a) % Change % Change ($M) Q4 2010 Q4 2009 Total Constant Currency (b) Q4 2010 % Sales Q4 2009 % Sales Total Constant Currency (b) Specialty Chemicals 302.7 273.6 10.6% 14.3% 77.7 25.7% 69.8 25.5% 11.3% 14.9% Performance Additives 162.3 153.9 5.5% 7.9% 23.2 14.3% 23.9 15.5% (2.9%) (0.8%) Titanium Dioxide Pigments 195.1 185.5 5.2% 14.3% 35.0 17.9% 31.7 17.1% 10.4% 19.6% Advanced Ceramics 130.3 118.6 9.9% 17.4% 35.3 27.1% 32.4 27.3% 9.0% 17.0% Corporate and Other 7.9 6.1 29.5% 41.0% (17.5) (10.7) (63.6%) (64.5%) Total Rockwood - continuing operations $798.3 $737.7 8.2% 13.7% $153.7 19.3% $147.1 19.9% 4.5% 10.2% Discontinued Operations - AlphaGary 55.3 48.6 13.8% 14.8% 7.9 14.3% 7.8 16.0% 1.3% 1.3% Total Rockwood $853.6 $786.3 8.6% 13.7% $161.6 18.9% $154.9 19.7% 4.3% 9.7% (a) A reconciliation of Net Income to Adjusted EBITDA is provided. See Appendices. (b) Based o n constant currencies. See Appendices. |
|
|
Results By Segment – Full Year @ Actual Rates Net Sales Adj. EBITDA (a) % Change % Change ($M) FY 2010 FY 2009 Total Constant Currency (b) FY 2010 % Sales FY 2009 % Sales Total Constant Currency (b) Specialty Chemicals 1,163.2 996.6 16.7% 17.8% 295.7 25.4% 245.7 24.7% 20.4% 21.6% Performance Additives 726.7 671.5 8.2% 9.6% 123.8 17.0% 95.1 14.2% 30.2% 32.3% Titanium Dioxide Pigments 759.2 666.3 13.9% 20.0% 129.5 17.1% 97.3 14.6% 33.1% 40.5% Advanced Ceramics 515.6 412.2 25.1% 30.2% 153.2 29.7% 107.7 26.1% 42.2% 48.4% Corporate and Other 26.9 22.5 19.6% 26.2% (67.8) (35.9) (88.9%) (89.7%) Total Rockwood - continuing operations $3,191.6 $2,769.1 15.3% 18.2% $634.4 19.9% $509.9 18.4% 24.4% 28.0% Discontinued Operations - AlphaGary 231.3 193.8 19.3% 19.0% 33.5 14.5% 30.6 15.8% 9.5% 8.8% Total Rockwood $3,422.9 $2,962.9 15.5% 18.3% $667.9 19.5% $540.5 18.2% 23.6% 27.0% (a) A reconciliation of Net Income to Adjusted EBITDA is provided. See Appendices. (b) Based on constant currencies. See Appendices. |

|
|
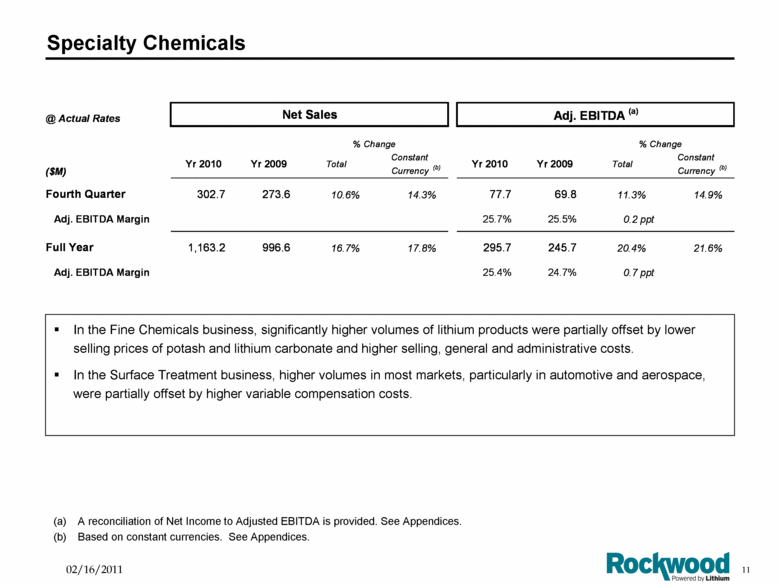
Specialty Chemicals In the Fine Chemicals business, significantly higher volumes of lithium products were partially offset by lower selling prices of potash and lithium carbonate and higher selling, general and administrative costs. In the Surface Treatment business, higher volumes in most markets, particularly in automotive and aerospace, were partially offset by higher variable compensation costs. (a) A reconciliation of Net Income to Adjusted EBITDA is provided. See Appendices. (b) Based on constant currencies. See Appendices. @ Actual Rates Net Sales Adj. EBITDA (a) % Change % Change ($M) Yr 2010 Yr 2009 Total Constant Currency (b) Yr 2010 Yr 2009 Total Constant Currency (b) Fourth Quarter 302.7 273.6 10.6% 14.3% 77.7 69.8 11.3% 14.9% Adj. EBITDA Margin 25.7% 25.5% 0.2 ppt Full Year 1,163.2 996.6 16.7% 17.8% 295.7 245.7 20.4% 21.6% Adj. EBITDA Margin 25.4% 24.7% 0.7 ppt |
|
|
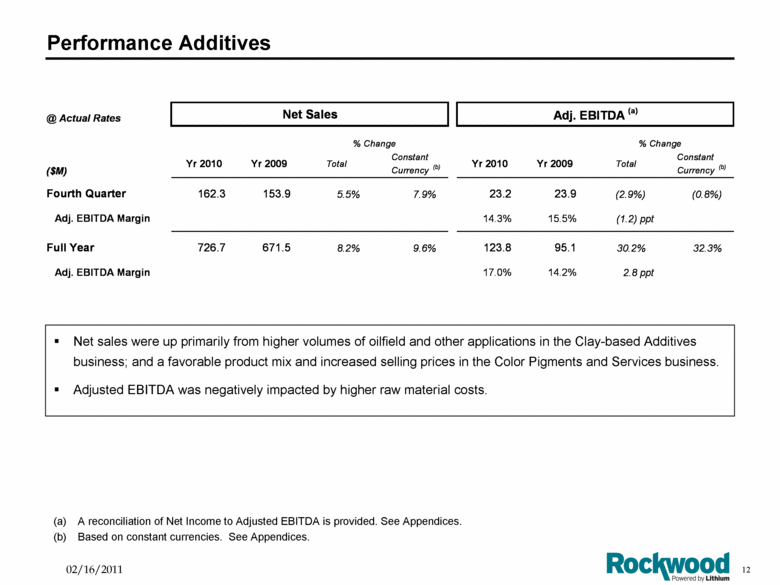
Performance Additives Net sales were up primarily from higher volumes of oilfield and other applications in the Clay-based Additives business; and a favorable product mix and increased selling prices in the Color Pigments and Services business. Adjusted EBITDA was negatively impacted by higher raw material costs. (a) A reconciliation of Net Income to Adjusted EBITDA is provided. See Appendices. (b) Based on constant currencies. See Appendices. @ Actual Rates Net Sales Adj. EBITDA (a) % Change % Change ($M) Yr 2010 Yr 2009 Total Constant Currency (b) Yr 2010 Yr 2009 Total Constant Currency (b) Fourth Quarter 162.3 153.9 5.5% 7.9% 23.2 23.9 (2.9%) (0.8%) Adj. EBITDA Margin 14.3% 15.5% (1.2) ppt Full Year 726.7 671.5 8.2% 9.6% 123.8 95.1 30.2% 32.3% Adj. EBITDA Margin 17.0% 14.2% 2.8 ppt |
|
|
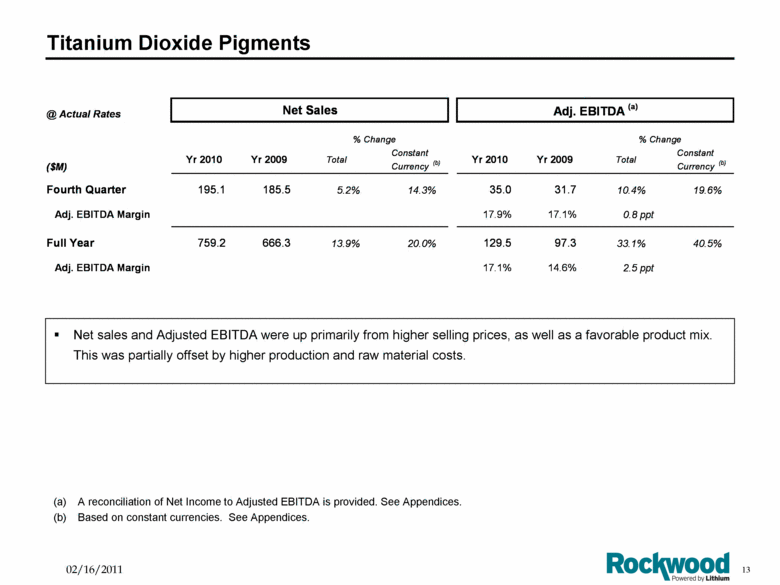
Titanium Dioxide Pigments Net sales and Adjusted EBITDA were up primarily from higher selling prices, as well as a favorable product mix. This was partially offset by higher production and raw material costs. A reconciliation of Net Income to Adjusted EBITDA is provided. See Appendices. Based on constant currencies. See Appendices. @ Actual Rates Net Sales Adj. EBITDA (a) % Change % Change ($M) Yr 2010 Yr 2009 Total Constant Currency (b) Yr 2010 Yr 2009 Total Constant Currency (b) Fourth Quarter 195.1 185.5 5.2% 14.3% 35.0 31.7 10.4% 19.6% Adj. EBITDA Margin 17.9% 17.1% 0.8 ppt Full Year 759.2 666.3 13.9% 20.0% 129.5 97.3 33.1% 40.5% Adj. EBITDA Margin 17.1% 14.6% 2.5 ppt |
|
|
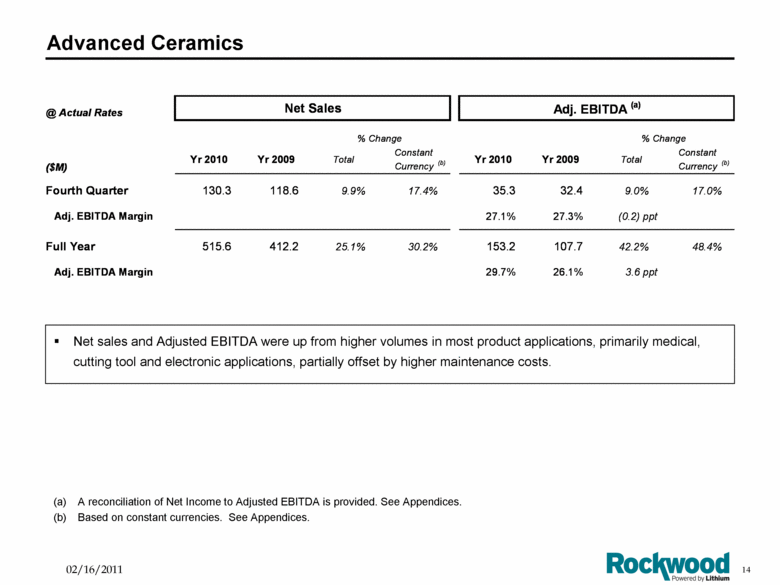
Advanced Ceramics Net sales and Adjusted EBITDA were up from higher volumes in most product applications, primarily medical, cutting tool and electronic applications, partially offset by higher maintenance costs. A reconciliation of Net Income to Adjusted EBITDA is provided. See Appendices. Based on constant currencies. See Appendices. @ Actual Rates Net Sales Adj. EBITDA (a) % Change % Change ($M) Yr 2010 Yr 2009 Total Constant Currency (b) Yr 2010 Yr 2009 Total Constant Currency (b) Fourth Quarter 130.3 118.6 9.9% 17.4% 35.3 32.4 9.0% 17.0% Adj. EBITDA Margin 27.1% 27.3% (0.2) ppt Full Year 515.6 412.2 25.1% 30.2% 153.2 107.7 42.2% 48.4% Adj. EBITDA Margin 29.7% 26.1% 3.6 ppt |
|
|
Financial Summary |
|
|
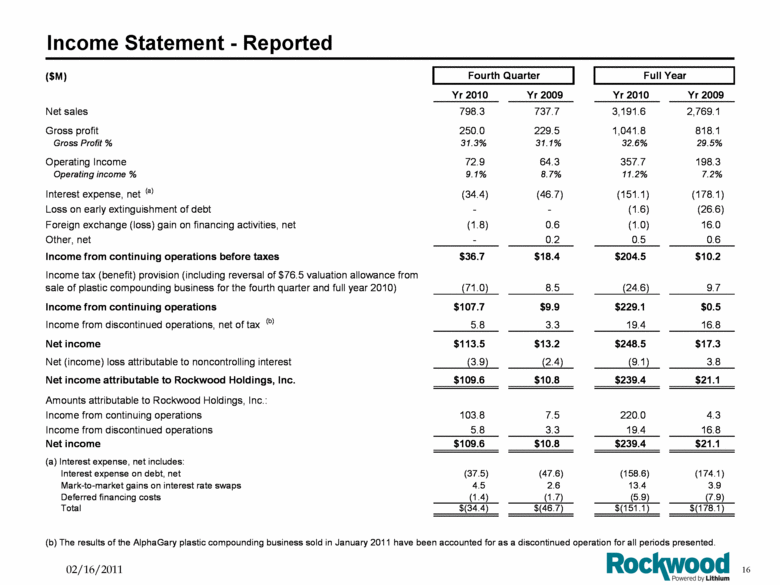
Income Statement - Reported ($M) Fourth Quarter Full Year Yr 2010 Yr 2009 Yr 2010 Yr 2009 Net sales 798.3 737.7 3,191.6 2,769.1 Gross profit 250.0 229.5 1,041.8 818.1 Gross Profit % 31.3% 31.1% 32.6% 29.5% Operating Income 72.9 64.3 357.7 198.3 Operating income % 9.1% 8.7% 11.2% 7.2% Interest expense, net (a) (34.4) (46.7) (151.1) (178.1) Loss on early extinguishment of debt - - (1.6) (26.6) Foreign exchange (loss) gain on financing activities, net (1.8) 0.6 (1.0) 16.0 Other, net - 0.2 0.5 0.6 Income from continuing operations before taxes $36.7 $18.4 $204.5 $10.2 Income tax (benefit) provision (including reversal of $76.5 valuation allowance from sale of plastic compounding business for the fourth quarter and full year 2010) (71.0) 8.5 (24.6) 9.7 Income from continuing operations $107.7 $9.9 $229.1 $0.5 Income from discontinued operations, net of tax (b) 5.8 3.3 19.4 16.8 Net income $113.5 $13.2 $248.5 $17.3 Net (income) loss attributable to noncontrolling interest (3.9) (2.4) (9.1) 3.8 Net income attributable to Rockwood Holdings, Inc. $109.6 $10.8 $239.4 $21.1 Amounts attributable to Rockwood Holdings, Inc.: Income from continuing operations 103.8 7.5 220.0 4.3 Income from discontinued operations 5.8 3.3 19.4 16.8 Net income $109.6 $10.8 $239.4 $21.1 (a) Interest expense, net includes: Interest expense on debt, net (37.5) (47.6) (158.6) (174.1) Mark-to-market gains on interest rate swaps 4.5 2.6 13.4 3.9 Deferred financing costs (1.4) (1.7) (5.9) (7.9) Total $(34.4) $(46.7) $(151.1) $(178.1) (b) The results of the AlphaGary plastic compounding business sold in January 2011 have been accounted for as a discontinued operation for all periods presented. |
|
|
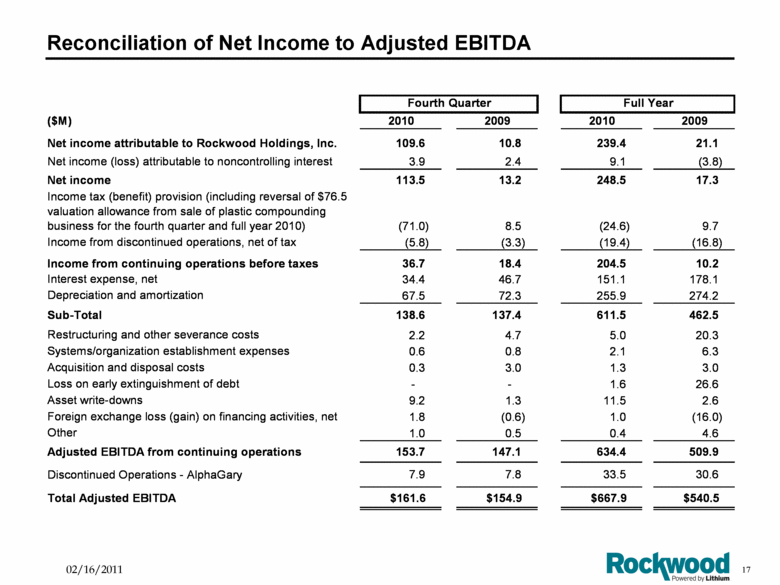
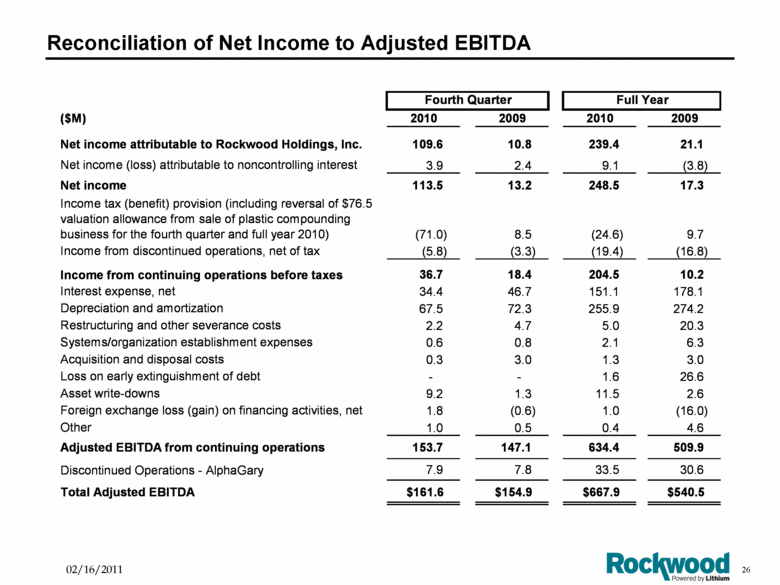
Reconciliation of Net Income to Adjusted EBITDA ($M) 2010 2009 2010 2009 Net income attributable to Rockwood Holdings, Inc. 109.6 10.8 239.4 21.1 Net income (loss) attributable to noncontrolling interest 3.9 2.4 9.1 (3.8) Net income 113.5 13.2 248.5 17.3 Income tax (benefit) provision (including reversal of $76.5 valuation allowance from sale of plastic compounding business for the fourth quarter and full year 2010) (71.0) 8.5 (24.6) 9.7 Income from discontinued operations, net of tax (5.8) (3.3) (19.4) (16.8) Income from continuing operations before taxes 36.7 18.4 204.5 10.2 Interest expense, net 34.4 46.7 151.1 178.1 Depreciation and amortization 67.5 72.3 255.9 274.2 Sub-Total 138.6 137.4 611.5 462.5 Restructuring and other severance costs 2.2 4.7 5.0 20.3 Systems/organization establishment expenses 0.6 0.8 2.1 6.3 Acquisition and disposal costs 0.3 3.0 1.3 3.0 Loss on early extinguishment of debt - - 1.6 26.6 Asset write-downs 9.2 1.3 11.5 2.6 Foreign exchange loss (gain) on financing activities, net 1.8 (0.6) 1.0 (16.0) Other 1.0 0.5 0.4 4.6 Adjusted EBITDA from continuing operations 153.7 147.1 634.4 509.9 Discontinued Operations - AlphaGary 7.9 7.8 33.5 30.6 Total Adjusted EBITDA $161.6 $154.9 $667.9 $540.5 Full Year Fourth Quarter |
|
|
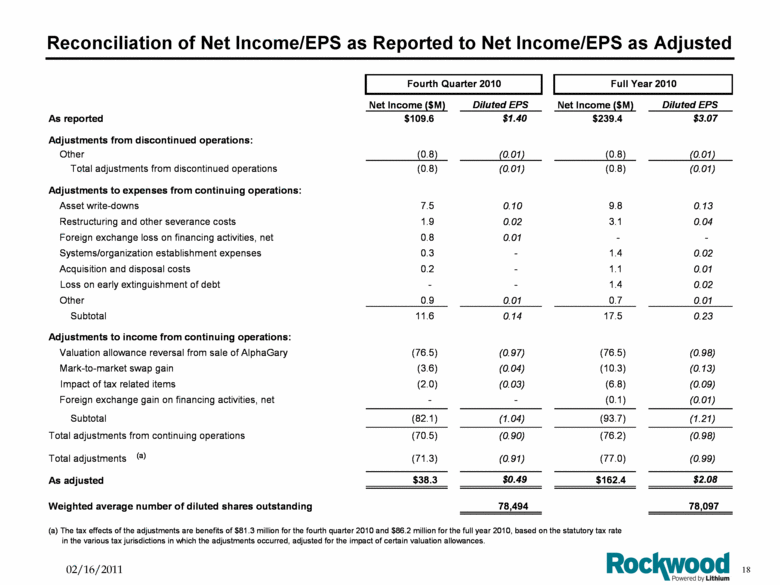
Reconciliation of Net Income/EPS as Reported to Net Income/EPS as Adjusted Net Income ($M) Diluted EPS Net Income ($M) Diluted EPS As reported $109.6 $1.40 $239.4 $3.07 Adjustments from discontinued operations: Other (0.8) (0.01) (0.8) (0.01) Total adjustments from discontinued operations (0.8) (0.01) (0.8) (0.01) Adjustments to expenses from continuing operations: Asset write-downs 7.5 0.10 9.8 0.13 Restructuring and other severance costs 1.9 0.02 3.1 0.04 Foreign exchange loss on financing activities, net 0.8 0.01 - - Systems/organization establishment expenses 0.3 - 1.4 0.02 Acquisition and disposal costs 0.2 - 1.1 0.01 Loss on early extinguishment of debt - - 1.4 0.02 Other 0.9 0.01 0.7 0.01 Subtotal 11.6 0.14 17.5 0.23 Adjustments to income from continuing operations: Valuation allowance reversal from sale of AlphaGary (76.5) (0.97) (76.5) (0.98) Mark-to-market swap gain (3.6) (0.04) (10.3) (0.13) Impact of tax related items (2.0) (0.03) (6.8) (0.09) Foreign exchange gain on financing activities, net - - (0.1) (0.01) Subtotal (82.1) (1.04) (93.7) (1.21) Total adjustments from continuing operations (70.5) (0.90) (76.2) (0.98) Total adjustments (71.3) (0.91) (77.0) (0.99) As adjusted $38.3 $0.49 $162.4 $2.08 Weighted average number of diluted shares outstanding 78,494 78,097 (a) The tax effects of the adjustments are benefits of $81.3 million for the fourth quarter 2010 and $86.2 million for the full year 2010, based on the statutory tax rate in the various tax jurisdictions in which the adjustments occurred, adjusted for the impact of certain valuation allowances. Full Year 2010 Fourth Quarter 2010 (a) |
|
|
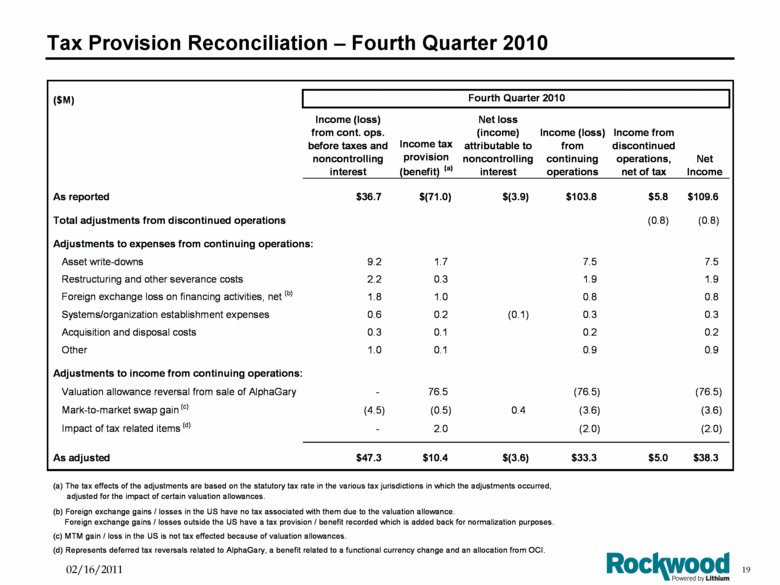
Tax Provision Reconciliation – Fourth Quarter 2010 ($M) Income (loss) from cont. ops. before taxes and noncontrolling interest Income tax provision (benefit) (a) Net loss (income) attributable to noncontrolling interest Income (loss) from continuing operations Income from discontinued operations, net of tax Net Income As reported $36.7 $(71.0) $(3.9) $103.8 $5.8 $109.6 Total adjustments from discontinued operations (0.8) (0.8) Adjustments to expenses from continuing operations: Asset write-downs 9.2 1.7 7.5 7.5 Restructuring and other severance costs 2.2 0.3 1.9 1.9 Foreign exchange loss on financing activities, net (b) 1.8 1.0 0.8 0.8 Systems/organization establishment expenses 0.6 0.2 (0.1) 0.3 0.3 Acquisition and disposal costs 0.3 0.1 0.2 0.2 Other 1.0 0.1 0.9 0.9 Adjustments to income from continuing operations: Valuation allowance reversal from sale of AlphaGary - 76.5 (76.5) (76.5) Mark-to-market swap gain (c) (4.5) (0.5) 0.4 (3.6) (3.6) Impact of tax related items (d) - 2.0 (2.0) (2.0) As adjusted $47.3 $10.4 $(3.6) $33.3 $5.0 $38.3 (c) MTM gain / loss in the US is not tax effected because of valuation allowances. Fourth Quarter 2010 (a) The tax effects of the adjustments are based on the statutory tax rate in the various tax jurisdictions in which the adjustments occurred, adjusted for the impact of certain valuation allowances. (d) Represents deferred tax reversals related to AlphaGary, a benefit related to a functional currency change and an allocation from OCI. (b) Foreign exchange gains / losses in the US have no tax associated with them due to the valuation allowance. Foreign exchange gains / losses outside the US have a tax provision / benefit recorded which is added back for normalization purposes. |
|
|
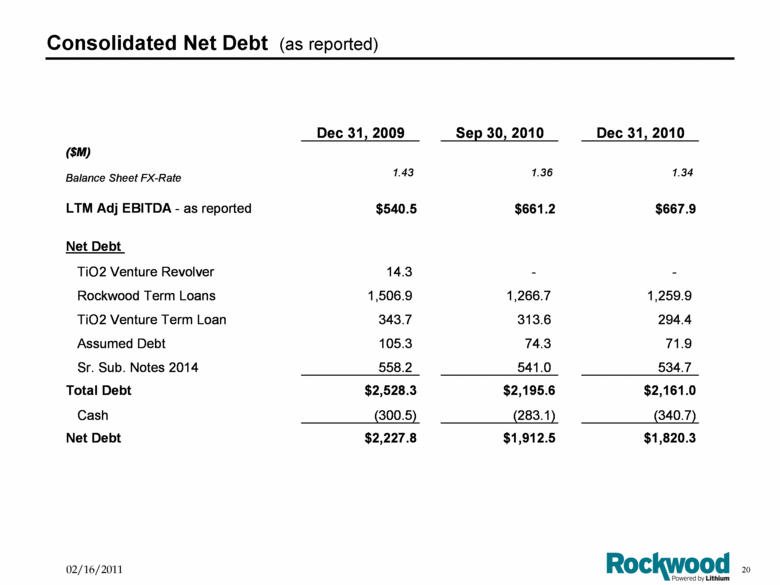
Consolidated Net Debt (as reported) Dec 31, 2009 Sep 30, 2010 Dec 31, 2010 ($M) Balance Sheet FX-Rate 1.43 1.36 1.34 LTM Adj EBITDA - as reported $540.5 $661.2 $667.9 Net Debt TiO2 Venture Revolver 14.3 - - Rockwood Term Loans 1,506.9 1,266.7 1,259.9 TiO2 Venture Term Loan 343.7 313.6 294.4 Assumed Debt 105.3 74.3 71.9 Sr. Sub. Notes 2014 558.2 541.0 534.7 Total Debt $2,528.3 $2,195.6 $2,161.0 Cash (300.5) (283.1) (340.7) Net Debt $2,227.8 $1,912.5 $1,820.3 |
|
|
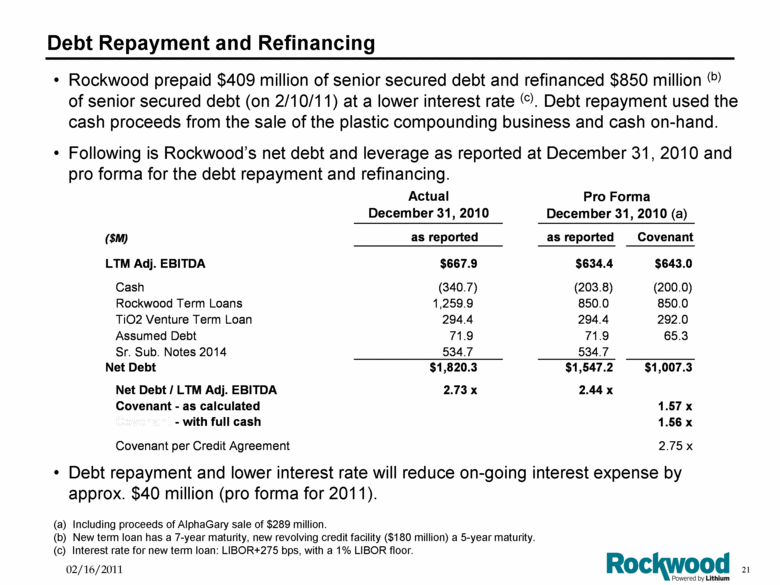
Debt Repayment and Refinancing Rockwood prepaid $409 million of senior secured debt and refinanced $850 million (b) of senior secured debt (on 2/10/11) at a lower interest rate (c). Debt repayment used the cash proceeds from the sale of the plastic compounding business and cash on-hand. Following is Rockwood’s net debt and leverage as reported at December 31, 2010 and pro forma for the debt repayment and refinancing. Debt repayment and lower interest rate will reduce on-going interest expense by approx. $40 million (pro forma for 2011). (a) Including proceeds of AlphaGary sale of $289 million. (b) New term loan has a 7-year maturity, new revolving credit facility ($180 million) a 5-year maturity. (c) Interest rate for new term loan: LIBOR+275 bps, with a 1% LIBOR floor. Pro Forma December 31, 2010 (a) ($M) as reported as reported Covenant LTM Adj. EBITDA $667.9 $634.4 $643.0 Cash (340.7) (203.8) (200.0) Rockwood Term Loans 1,259.9 850.0 850.0 TiO2 Venture Term Loan 294.4 294.4 292.0 Assumed Debt 71.9 71.9 65.3 Sr. Sub. Notes 2014 534.7 534.7 Net Debt $1,820.3 $1,547.2 $1,007.3 Net Debt / LTM Adj. EBITDA 2.73 x 2.44 x Covenant - as calculated 1.57 x Covenant - with full cash 1.56 x Covenant per Credit Agreement 2.75 x Actual December 31, 2010 |
|
|
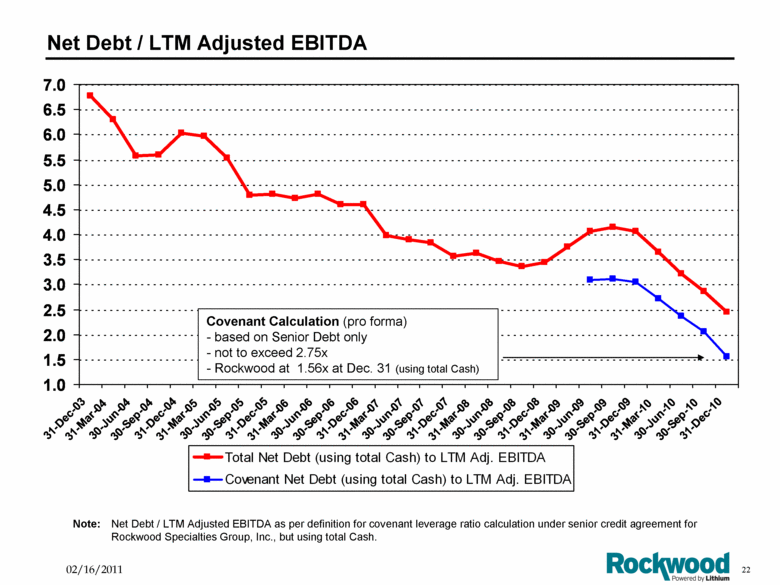
Net Debt / LTM Adjusted EBITDA Note: Net Debt / LTM Adjusted EBITDA as per definition for covenant leverage ratio calculation under senior credit agreement for Rockwood Specialties Group, Inc., but using total Cash. Covenant Calculation (pro forma) based on Senior Debt only not to exceed 2.75x Rockwood at 1.56x at Dec. 31 (using total Cash) 1.0 1.5 2.0 2.5 3.0 3.5 4.0 4.5 5.0 5.5 6.0 6.5 7.0 31-Dec-03 31-Mar-04 30-Jun-04 30-Sep-04 31-Dec-04 31-Mar-05 30-Jun-05 30-Sep-05 31-Dec-05 31-Mar-06 30-Jun-06 30-Sep-06 31-Dec-06 31-Mar-07 30-Jun-07 30-Sep-07 31-Dec-07 31-Mar-08 30-Jun-08 30-Sep-08 31-Dec-08 31-Mar-09 30-Jun-09 30-Sep-09 31-Dec-09 31-Mar-10 30-Jun-10 30-Sep-10 31-Dec-10 Total Net Debt (using total Cash) to LTM Adj. EBITDA Covenant Net Debt (using total Cash) to LTM Adj. EBITDA |
|
|
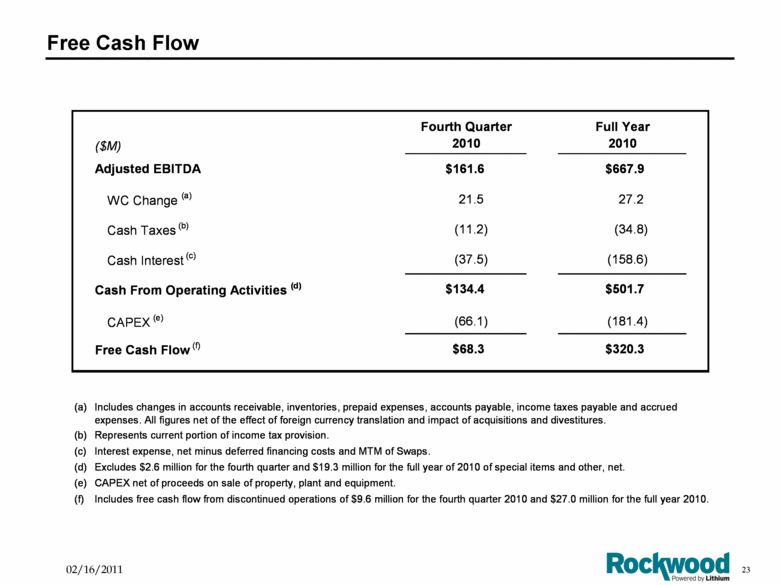
Free Cash Flow ($M) Fourth Quarter 2010 Full Year 2010 Adjusted EBITDA $161.6 $667.9 WC Change (a) 21.5 27.2 Cash Taxes (b) (11.2) (34.8) Cash Interest (c) (37.5) (158.6) Cash From Operating Activities (d) $134.4 $501.7 CAPEX (e) (66.1) (181.4) Free Cash Flow (f) $68.3 $320.3 (a) (b) Represents current portion of income tax provision. (c) Interest expense, net minus deferred financing costs and MTM of Swaps. (d) Excludes $2.6 million for the fourth quarter and $19.3 million for the full year of 2010 of special items and other, net. (e) CAPEX net of proceeds on sale of property, plant and equipment. (f) Includes free cash flow from discontinued operations of $9.6 million for the fourth quarter 2010 and $27.0 million for the full year 2010. Includes changes in accounts receivable, inventories, prepaid expenses, accounts payable, income taxes payable and accrued expenses. All figures net of the effect of foreign currency translation and impact of acquisitions and divestitures. |
|
|
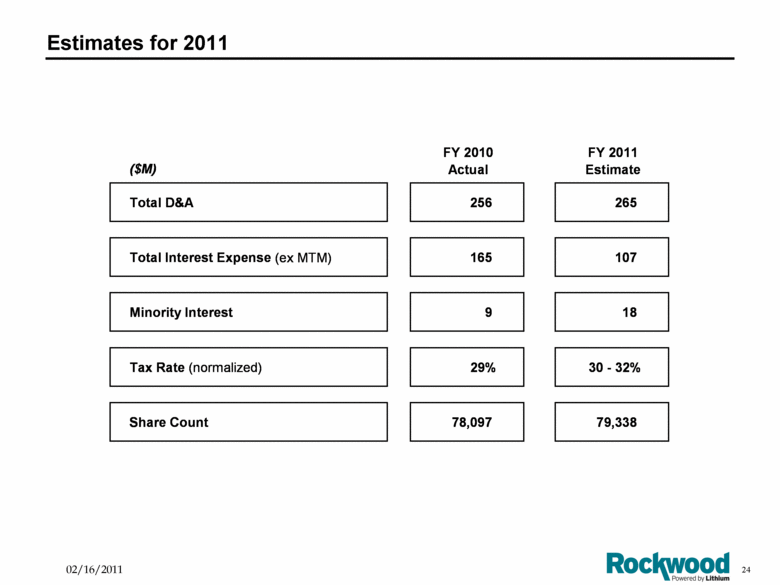
Estimates for 2011 ($M) FY 2010 Actual FY 2011 Estimate Total D&A 256 265 Total Interest Expense (ex MTM) 165 107 Minority Interest 9 18 Tax Rate (normalized) 29% 30 - 32% Share Count 78,097 79,338 |
|
|
Appendices |
|
|
Reconciliation of Net Income to Adjusted EBITDA ($M) 2010 2009 2010 2009 Net income attributable to Rockwood Holdings, Inc. 109.6 10.8 239.4 21.1 Net income (loss) attributable to noncontrolling interest 3.9 2.4 9.1 (3.8) Net income 113.5 13.2 248.5 17.3 Income tax (benefit) provision (including reversal of $76.5 valuation allowance from sale of plastic compounding business for the fourth quarter and full year 2010) (71.0) 8.5 (24.6) 9.7 Income from discontinued operations, net of tax (5.8) (3.3) (19.4) (16.8) Income from continuing operations before taxes 36.7 18.4 204.5 10.2 Interest expense, net 34.4 46.7 151.1 178.1 Depreciation and amortization 67.5 72.3 255.9 274.2 Restructuring and other severance costs 2.2 4.7 5.0 20.3 Systems/organization establishment expenses 0.6 0.8 2.1 6.3 Acquisition and disposal costs 0.3 3.0 1.3 3.0 Loss on early extinguishment of debt - - 1.6 26.6 Asset write-downs 9.2 1.3 11.5 2.6 Foreign exchange loss (gain) on financing activities, net 1.8 (0.6) 1.0 (16.0) Other 1.0 0.5 0.4 4.6 Adjusted EBITDA from continuing operations 153.7 147.1 634.4 509.9 Discontinued Operations - AlphaGary 7.9 7.8 33.5 30.6 Total Adjusted EBITDA $161.6 $154.9 $667.9 $540.5 Full Year Fourth Quarter |
|
|
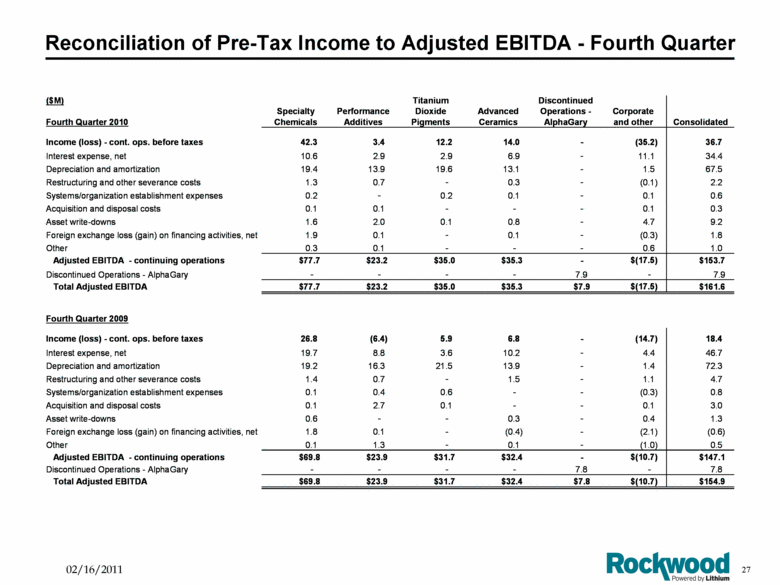
Reconciliation of Pre-Tax Income to Adjusted EBITDA - Fourth Quarter ($M) Titanium Discontinued Specialty Performance Dioxide Advanced Operations - Corporate Fourth Quarter 2010 Chemicals Additives Pigments Ceramics AlphaGary and other Consolidated Income (loss) - cont. ops. before taxes 42.3 3.4 12.2 14.0 - (35.2) 36.7 Interest expense, net 10.6 2.9 2.9 6.9 - 11.1 34.4 Depreciation and amortization 19.4 13.9 19.6 13.1 - 1.5 67.5 Restructuring and other severance costs 1.3 0.7 - 0.3 - (0.1) 2.2 Systems/organization establishment expenses 0.2 - 0.2 0.1 - 0.1 0.6 Acquisition and disposal costs 0.1 0.1 - - - 0.1 0.3 Asset write-downs 1.6 2.0 0.1 0.8 - 4.7 9.2 Foreign exchange loss (gain) on financing activities, net 1.9 0.1 - 0.1 - (0.3) 1.8 Other 0.3 0.1 - - - 0.6 1.0 Adjusted EBITDA - continuing operations $77.7 $23.2 $35.0 $35.3 - $(17.5) $153.7 Discontinued Operations - AlphaGary - - - - 7.9 - 7.9 Total Adjusted EBITDA $77.7 $23.2 $35.0 $35.3 $7.9 $(17.5) $161.6 Fourth Quarter 2009 Income (loss) - cont. ops. before taxes 26.8 (6.4) 5.9 6.8 - (14.7) 18.4 Interest expense, net 19.7 8.8 3.6 10.2 - 4.4 46.7 Depreciation and amortization 19.2 16.3 21.5 13.9 - 1.4 72.3 Restructuring and other severance costs 1.4 0.7 - 1.5 - 1.1 4.7 Systems/organization establishment expenses 0.1 0.4 0.6 - - (0.3) 0.8 Acquisition and disposal costs 0.1 2.7 0.1 - - 0.1 3.0 Asset write-downs 0.6 - - 0.3 - 0.4 1.3 Foreign exchange loss (gain) on financing activities, net 1.8 0.1 - (0.4) - (2.1) (0.6) Other 0.1 1.3 - 0.1 - (1.0) 0.5 Adjusted EBITDA - continuing operations $69.8 $23.9 $31.7 $32.4 - $(10.7) $147.1 Discontinued Operations - AlphaGary - - - - 7.8 - 7.8 Total Adjusted EBITDA $69.8 $23.9 $31.7 $32.4 $7.8 $(10.7) $154.9 |
|
|
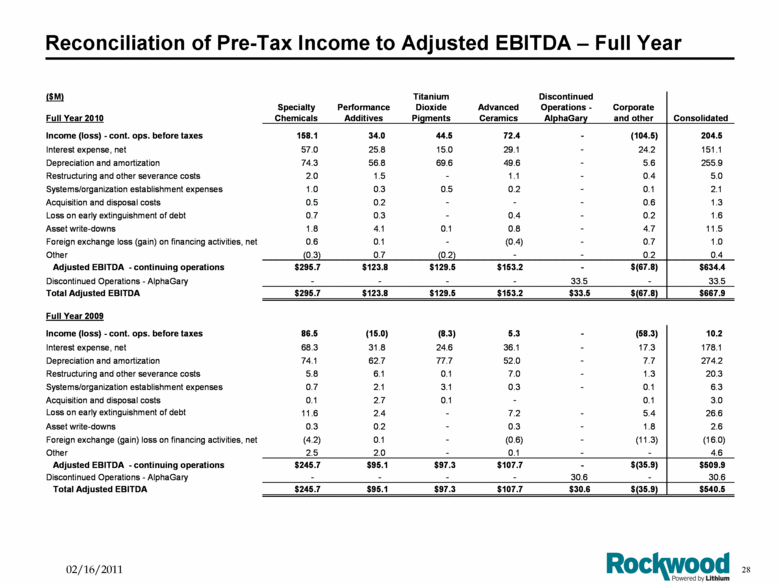
Reconciliation of Pre-Tax Income to Adjusted EBITDA – Full Year ($M) Titanium Discontinued Specialty Performance Dioxide Advanced Operations - Corporate Full Year 2010 Chemicals Additives Pigments Ceramics AlphaGary and other Consolidated Income (loss) - cont. ops. before taxes 158.1 34.0 44.5 72.4 - (104.5) 204.5 Interest expense, net 57.0 25.8 15.0 29.1 - 24.2 151.1 Depreciation and amortization 74.3 56.8 69.6 49.6 - 5.6 255.9 Restructuring and other severance costs 2.0 1.5 - 1.1 - 0.4 5.0 Systems/organization establishment expenses 1.0 0.3 0.5 0.2 - 0.1 2.1 Acquisition and disposal costs 0.5 0.2 - - - 0.6 1.3 Loss on early extinguishment of debt 0.7 0.3 - 0.4 - 0.2 1.6 Asset write-downs 1.8 4.1 0.1 0.8 - 4.7 11.5 Foreign exchange loss (gain) on financing activities, net 0.6 0.1 - (0.4) - 0.7 1.0 Other (0.3) 0.7 (0.2) - - 0.2 0.4 Adjusted EBITDA - continuing operations $295.7 $123.8 $129.5 $153.2 - $(67.8) $634.4 Discontinued Operations - AlphaGary - - - - 33.5 - 33.5 Total Adjusted EBITDA $295.7 $123.8 $129.5 $153.2 $33.5 $(67.8) $667.9 Full Year 2009 Income (loss) - cont. ops. before taxes 86.5 (15.0) (8.3) 5.3 - (58.3) 10.2 Interest expense, net 68.3 31.8 24.6 36.1 - 17.3 178.1 Depreciation and amortization 74.1 62.7 77.7 52.0 - 7.7 274.2 Restructuring and other severance costs 5.8 6.1 0.1 7.0 - 1.3 20.3 Systems/organization establishment expenses 0.7 2.1 3.1 0.3 - 0.1 6.3 Acquisition and disposal costs 0.1 2.7 0.1 - 0.1 3.0 Loss on early extinguishment of debt 11.6 2.4 - 7.2 - 5.4 26.6 Asset write-downs 0.3 0.2 - 0.3 - 1.8 2.6 Foreign exchange (gain) loss on financing activities, net (4.2) 0.1 - (0.6) - (11.3) (16.0) Other 2.5 2.0 - 0.1 - - 4.6 Adjusted EBITDA - continuing operations $245.7 $95.1 $97.3 $107.7 - $(35.9) $509.9 Discontinued Operations - AlphaGary - - - - 30.6 - 30.6 Total Adjusted EBITDA $245.7 $95.1 $97.3 $107.7 $30.6 $(35.9) $540.5 |
|
|
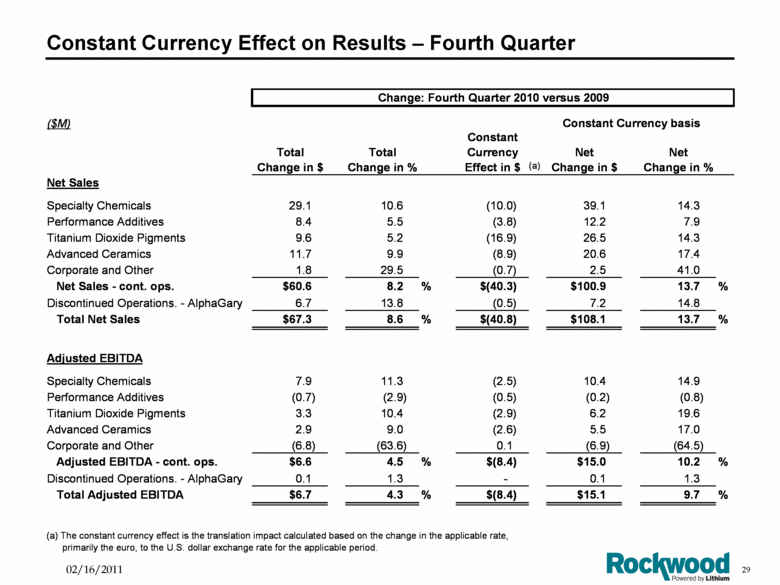
Constant Currency Effect on Results – Fourth Quarter ($M) Constant Currency basis Total Change in $ Total Change in % Constant Currency Effect in $ Net Change in $ Net Change in % Net Sales Specialty Chemicals 29.1 10.6 (10.0) 39.1 14.3 Performance Additives 8.4 5.5 (3.8) 12.2 7.9 Titanium Dioxide Pigments 9.6 5.2 (16.9) 26.5 14.3 Advanced Ceramics 11.7 9.9 (8.9) 20.6 17.4 Corporate and Other 1.8 29.5 (0.7) 2.5 41.0 Net Sales - cont. ops. $60.6 8.2 % $(40.3) $100.9 13.7 % Discontinued Operations. - AlphaGary 6.7 13.8 (0.5) 7.2 14.8 Total Net Sales $67.3 8.6 % $(40.8) $108.1 13.7 % Adjusted EBITDA Specialty Chemicals 7.9 11.3 (2.5) 10.4 14.9 Performance Additives (0.7) (2.9) (0.5) (0.2) (0.8) Titanium Dioxide Pigments 3.3 10.4 (2.9) 6.2 19.6 Advanced Ceramics 2.9 9.0 (2.6) 5.5 17.0 Corporate and Other (6.8) (63.6) 0.1 (6.9) (64.5) Adjusted EBITDA - cont. ops. $6.6 4.5 % $(8.4) $15.0 10.2 % Discontinued Operations. - AlphaGary 0.1 1.3 - 0.1 1.3 Total Adjusted EBITDA $6.7 4.3 % $(8.4) $15.1 9.7 % Change: Fourth Quarter 2010 versus 2009 (a) The constant currency effect is the translation impact calculated based on the change in the applicable rate, primarily the euro, to the U.S. dollar exchange rate for the applicable period. (a) |
|
|
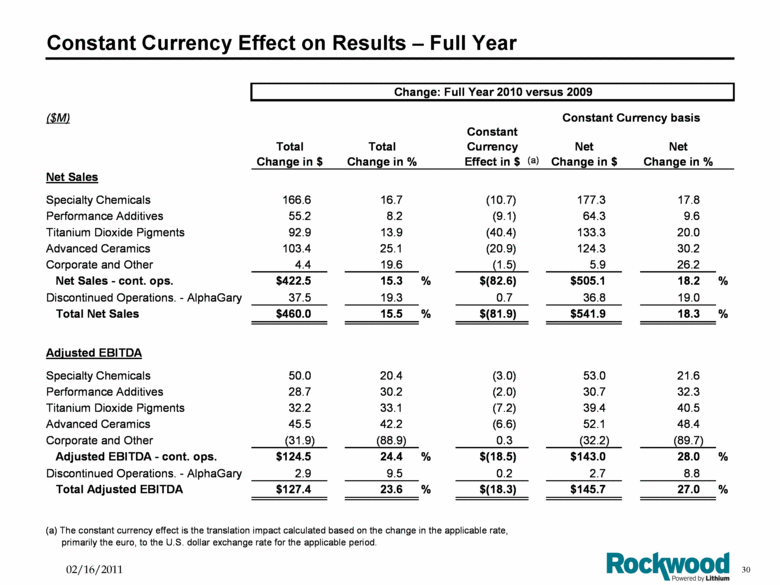
Constant Currency Effect on Results – Full Year ($M) Constant Currency basis Total Change in $ Total Change in % Constant Currency Effect in $ Net Change in $ Net Change in % Net Sales Specialty Chemicals 166.6 16.7 (10.7) 177.3 17.8 Performance Additives 55.2 8.2 (9.1) 64.3 9.6 Titanium Dioxide Pigments 92.9 13.9 (40.4) 133.3 20.0 Advanced Ceramics 103.4 25.1 (20.9) 124.3 30.2 Corporate and Other 4.4 19.6 (1.5) 5.9 26.2 Net Sales - cont. ops. $422.5 15.3 % $(82.6) $505.1 18.2 % Discontinued Operations. - AlphaGary 37.5 19.3 0.7 36.8 19.0 Total Net Sales $460.0 15.5 % $(81.9) $541.9 18.3 % Adjusted EBITDA Specialty Chemicals 50.0 20.4 (3.0) 53.0 21.6 Performance Additives 28.7 30.2 (2.0) 30.7 32.3 Titanium Dioxide Pigments 32.2 33.1 (7.2) 39.4 40.5 Advanced Ceramics 45.5 42.2 (6.6) 52.1 48.4 Corporate and Other (31.9) (88.9) 0.3 (32.2) (89.7) Adjusted EBITDA - cont. ops. $124.5 24.4 % $(18.5) $143.0 28.0 % Discontinued Operations. - AlphaGary 2.9 9.5 0.2 2.7 8.8 Total Adjusted EBITDA $127.4 23.6 % $(18.3) $145.7 27.0 % Change: Full Year 2010 versus 2009 (a) The constant currency effect is the translation impact calculated based on the change in the applicable rate, primarily the euro, to the U.S. dollar exchange rate for the applicable period. (a) |
|
|
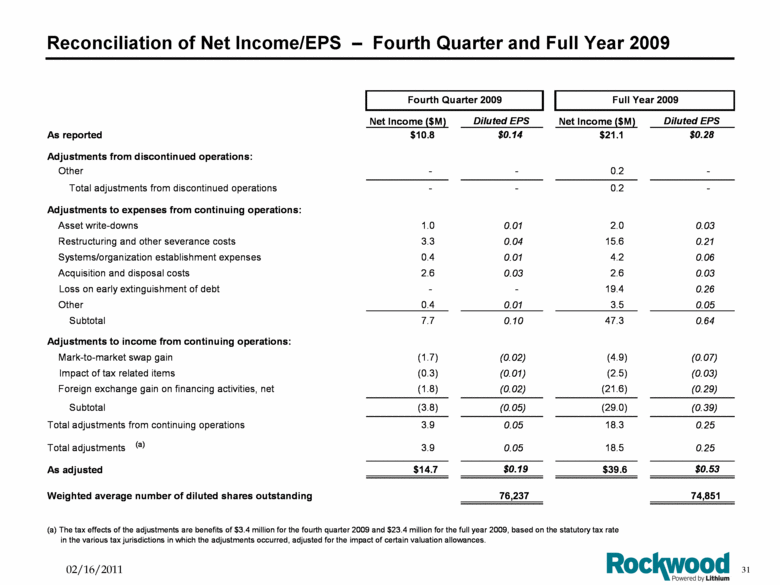
Reconciliation of Net Income/EPS – Fourth Quarter and Full Year 2009 Net Income ($M) Diluted EPS Net Income ($M) Diluted EPS As reported $10.8 $0.14 $21.1 $0.28 Adjustments from discontinued operations: Other - - 0.2 - Total adjustments from discontinued operations - - 0.2 - Adjustments to expenses from continuing operations: Asset write-downs 1.0 0.01 2.0 0.03 Restructuring and other severance costs 3.3 0.04 15.6 0.21 Systems/organization establishment expenses 0.4 0.01 4.2 0.06 Acquisition and disposal costs 2.6 0.03 2.6 0.03 Loss on early extinguishment of debt - - 19.4 0.26 Other 0.4 0.01 3.5 0.05 Subtotal 7.7 0.10 47.3 0.64 Adjustments to income from continuing operations: Mark-to-market swap gain (1.7) (0.02) (4.9) (0.07) Impact of tax related items (0.3) (0.01) (2.5) (0.03) Foreign exchange gain on financing activities, net (1.8) (0.02) (21.6) (0.29) Subtotal (3.8) (0.05) (29.0) (0.39) Total adjustments from continuing operations 3.9 0.05 18.3 0.25 Total adjustments 3.9 0.05 18.5 0.25 As adjusted $14.7 $0.19 $39.6 $0.53 Weighted average number of diluted shares outstanding 76,237 74,851 Fourth Quarter 2009 Full Year 2009 (a) The tax effects of the adjustments are benefits of $3.4 million for the fourth quarter 2009 and $23.4 million for the full year 2009, based on the statutory tax rate in the various tax jurisdictions in which the adjustments occurred, adjusted for the impact of certain valuation allowances. (a) |
|
|
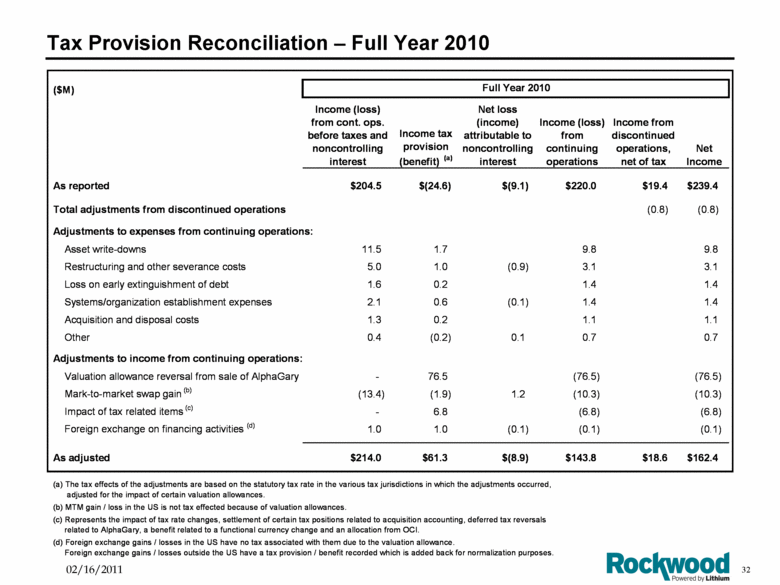
Tax Provision Reconciliation – Full Year 2010 ($M) Income (loss) from cont. ops. before taxes and noncontrolling interest Income tax provision (benefit) (a) Net loss (income) attributable to noncontrolling interest Income (loss) from continuing operations Income from discontinued operations, net of tax Net Income As reported $204.5 $(24.6) $(9.1) $220.0 $19.4 $239.4 Total adjustments from discontinued operations (0.8) (0.8) Adjustments to expenses from continuing operations: Asset write-downs 11.5 1.7 9.8 9.8 Restructuring and other severance costs 5.0 1.0 (0.9) 3.1 3.1 Loss on early extinguishment of debt 1.6 0.2 1.4 1.4 Systems/organization establishment expenses 2.1 0.6 (0.1) 1.4 1.4 Acquisition and disposal costs 1.3 0.2 1.1 1.1 Other 0.4 (0.2) 0.1 0.7 0.7 Adjustments to income from continuing operations: Valuation allowance reversal from sale of AlphaGary - 76.5 (76.5) (76.5) Mark-to-market swap gain (b) (13.4) (1.9) 1.2 (10.3) (10.3) Impact of tax related items (c) - 6.8 (6.8) (6.8) Foreign exchange on financing activities (d) 1.0 1.0 (0.1) (0.1) (0.1) As adjusted $214.0 $61.3 $(8.9) $143.8 $18.6 $162.4 Full Year 2010 (d) Foreign exchange gains / losses in the US have no tax associated with them due to the valuation allowance. Foreign exchange gains / losses outside the US have a tax provision / benefit recorded which is added back for normalization purposes. (b) MTM gain / loss in the US is not tax effected because of valuation allowances. (a) The tax effects of the adjustments are based on the statutory tax rate in the various tax jurisdictions in which the adjustments occurred, adjusted for the impact of certain valuation allowances. (c) Represents the impact of tax rate changes, settlement of certain tax positions related to acquisition accounting, deferred tax reversals related to AlphaGary, a benefit related to a functional currency change and an allocation from OCI. |
|
|
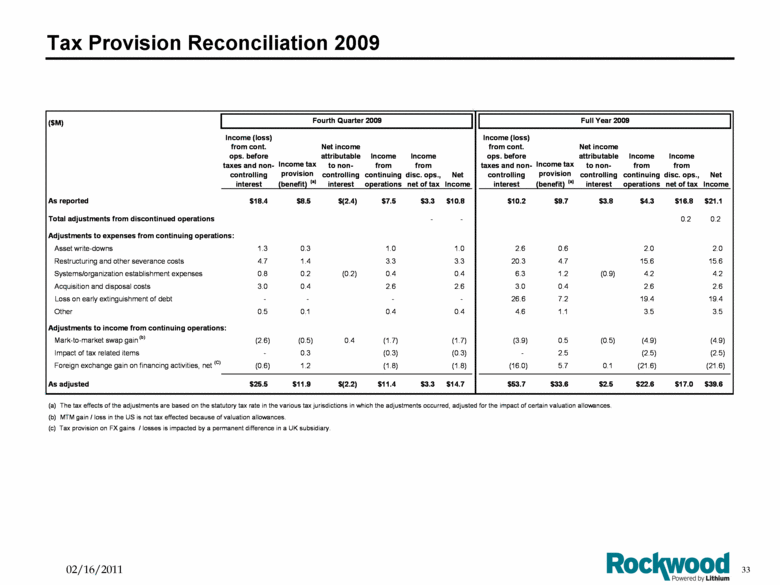
Tax Provision Reconciliation 2009 ($M) Income (loss) from cont. ops. before taxes and non- controlling interest Income tax provision (benefit) (a) Net income attributable to non- controlling interest Income from continuing operations Income from disc. ops., net of tax Net Income Income (loss) from cont. ops. before taxes and non- controlling interest Income tax provision (benefit) (a) Net income attributable to non- controlling interest Income from continuing operations Income from disc. ops., net of tax Net Income As reported $18.4 $8.5 $(2.4) $7.5 $3.3 $10.8 $10.2 $9.7 $3.8 $4.3 $16.8 $21.1 Total adjustments from discontinued operations - - 0.2 0.2 Adjustments to expenses from continuing operations: Asset write-downs 1.3 0.3 1.0 1.0 2.6 0.6 2.0 2.0 Restructuring and other severance costs 4.7 1.4 3.3 3.3 20.3 4.7 15.6 15.6 Systems/organization establishment expenses 0.8 0.2 (0.2) 0.4 0.4 6.3 1.2 (0.9) 4.2 4.2 Acquisition and disposal costs 3.0 0.4 2.6 2.6 3.0 0.4 2.6 2.6 Loss on early extinguishment of debt - - - - 26.6 7.2 19.4 19.4 Other 0.5 0.1 0.4 0.4 4.6 1.1 3.5 3.5 Adjustments to income from continuing operations: Mark-to-market swap gain (b) (2.6) (0.5) 0.4 (1.7) (1.7) (3.9) 0.5 (0.5) (4.9) (4.9) Impact of tax related items - 0.3 (0.3) (0.3) - 2.5 (2.5) (2.5) Foreign exchange gain on financing activities, net (C) (0.6) 1.2 (1.8) (1.8) (16.0) 5.7 0.1 (21.6) (21.6) As adjusted $25.5 $11.9 $(2.2) $11.4 $3.3 $14.7 $53.7 $33.6 $2.5 $22.6 $17.0 $39.6 (b) MTM gain / loss in the US is not tax effected because of valuation allowances. Full Year 2009 (c) Tax provision on FX gains / losses is impacted by a permanent difference in a UK subsidiary. (a) The tax effects of the adjustments are based on the statutory tax rate in the various tax jurisdictions in which the adjustments occurred, adjusted for the impact of certain valuation allowances. Fourth Quarter 2009 |
|
|
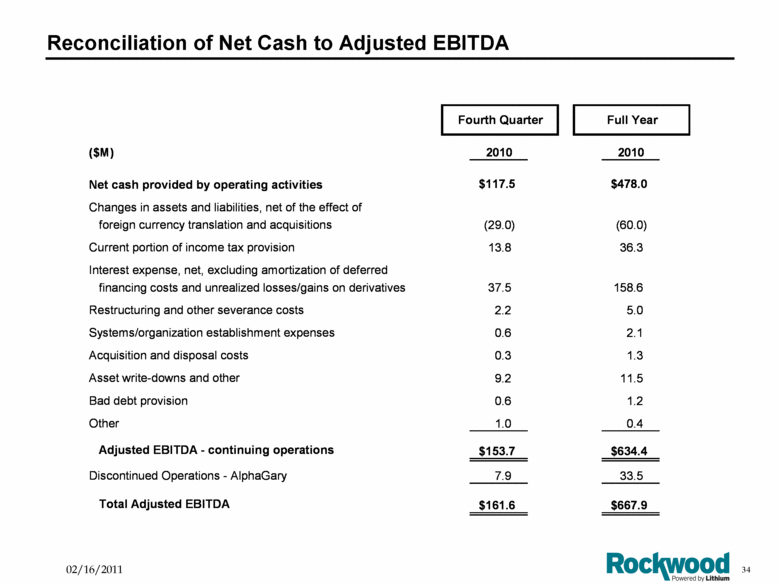
Reconciliation of Net Cash to Adjusted EBITDA Fourth Quarter Full Year ($M) 2010 2010 Net cash provided by operating activities $117.5 $478.0 Changes in assets and liabilities, net of the effect of foreign currency translation and acquisitions (29.0) (60.0) Current portion of income tax provision 13.8 36.3 Interest expense, net, excluding amortization of deferred financing costs and unrealized losses/gains on derivatives 37.5 158.6 Restructuring and other severance costs 2.2 5.0 Systems/organization establishment expenses 0.6 2.1 Acquisition and disposal costs 0.3 1.3 Asset write-downs and other 9.2 11.5 Bad debt provision 0.6 1.2 Other 1.0 0.4 Adjusted EBITDA - continuing operations $153.7 $634.4 Discontinued Operations - AlphaGary 7.9 33.5 Total Adjusted EBITDA $161.6 $667.9 |