Attached files
| file | filename |
|---|---|
| 8-K - FORM 8-K - OCEANFIRST FINANCIAL CORP | d8k.htm |
 NASDAQ: OCFC
1
OceanFirst
OceanFirst
Financial Corp.
Financial Corp.
John
John
R.
R.
Garbarino
Garbarino
-
-
Chairman,
Chairman,
CEO
CEO
Michael
Michael
J.
J.
Fitzpatrick
Fitzpatrick
-
-
Executive
Executive
Vice
Vice
President,
President,
CFO
CFO
STERNE AGEE
STERNE AGEE
FINANCIAL INSTITUTION INVESTOR CONFERENCE
FINANCIAL INSTITUTION INVESTOR CONFERENCE
FEBRUARY 2011
FEBRUARY 2011
Exhibit 99.1 |
 NASDAQ: OCFC
2
OceanFirst
OceanFirst
Financial Corp.
Financial Corp.
Forward Looking Statements:
This
presentation
contains
certain
forward-looking
statements
within
the
meaning
of
the
Private
Securities
Reform
Act
of
1995,
which
are
based
on
certain
assumptions
and
describe
future
plans,
strategies
and
expectations
of
the
Company.
These
forward-
looking
statements
are
generally
identified
by
use
of
the
words
“believe”,
“expect”,
“intend”,
“anticipate”,
“estimate”,
“project”,
“will”,
“should”,
“may”,
“view”,
“opportunity”,
“potential”,
“confident”
or
similar
expressions.
The
Company’s
ability
to
predict
results
or
the
actual
effect
of
future
plans
or
strategies
is
inherently
uncertain.
Factors
which
could
have
a
material
adverse
effect
on
the
operations
of
the
Company
and
the
subsidiaries
include,
but
are
not
limited
to,
changes
in
interest
rates,
general
economic
conditions,
legislative/regulatory
changes,
monetary
and
fiscal
policies
of
the
U.S.
Government,
including
policies
of
the
U.S.
Treasury
and
the
Board
of
Governors
of
the
Federal
Reserve
System,
the
quality
or
composition
of
the
loan
or
investment
portfolios,
demand
for
loan
products,
deposit
flows,
competition,
demand
for
financial
services
in
the
Company’s
market
area
and
accounting
principles
and
guidelines.
These
risks
and
uncertainties
are
further
discussed
in
the
Company’s
Annual
Report
on
Form
10-K
for
the
year
ended
December
31,
2009
and
should
be
considered
in
evaluating
forward-
looking
statements
and
undue
reliance
should
not
be
placed
on
such
statements.
The
Company
does
not
undertake
–
and
specifically
disclaims
any
obligation
–
to
publicly
release
the
result
of
any
revisions
which
may
be
made
to
any
forward-looking
statements
to
reflect
events
or
circumstances
after
the
date
of
such
statements
or
to
reflect
the
occurrence
of
anticipated
or
unanticipated
events. |
 NASDAQ: OCFC
3
Our 108-Year History
Our 108-Year History
Founded in Point Pleasant, NJ, in 1902, OceanFirst has
grown from a small one-town savings and loan to a full-service
community bank serving the Jersey shore.
Completed a follow-on common stock offering in November 2009
with part of the
$54.2 million proceeds used on December 30 to redeem the Preferred Stock
investment made by the U.S. Treasury. OceanFirst went public in 1996 and since
then has been successful
as a public company generating value for our shareholders.
|
 NASDAQ: OCFC
4
#
#
#
#
#
!
(
!
(
!
(
!
(
!
(
!
(
!
(
!
(
!
(
!
(
!
(
!
(
!
(
!
(
!
(
!
(
!
(
!
(
!
(
!
(
!
(
!
(
!
(
Ocean
Burlington
Morris
Sussex
Atlantic
Salem
Warren
Monmouth
Hunterdon
Cumberland
Bergen
Mercer
Somerset
Middlesex
Gloucester
Camden
Passaic
Cape May
Essex
Union
Hudson
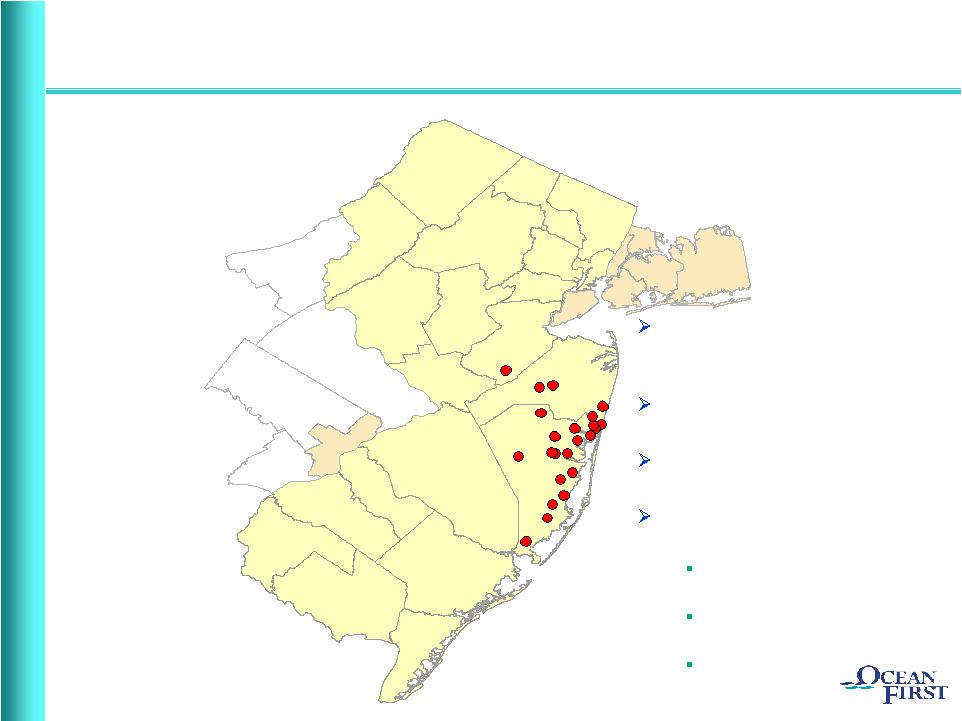
Community Bank serving the
Jersey Shore -
$2.3 billion in
assets and 23 branch offices
Market Cap $259.0 million (as of
February 11, 2011)
Core deposit funded –
82.9% of
total deposits
Locally originated loan portfolio
with no brokered loans
Residential and commercial
mortgages
Consumer equity loans and
lines
C&I loans and lines
Corporate Profile
Corporate Profile
Philadelphia
New York
Note: See Appendix 1 for Market Demographic information.
|
 NASDAQ: OCFC
5
Experienced Executive Management Team
Experienced Executive Management Team
Insider ownership of 28.0% is substantial –
aligned with shareholders
OceanFirst Bank ESOP 10.5%
OceanFirst Foundation 7.4%
Directors & Senior Executive Officers 10.1% (CEO 4.9%)
As of the March 9, 2010 proxy record date.
Name
Position
# of Years in
Banking
# of Years
at OCFC
John R. Garbarino
Chairman, Chief Executive Officer
39
39
Vito R. Nardelli
President, Chief Operating Officer
36
6
Michael J. Fitzpatrick
Executive Vice President, Chief Financial Officer
29
18 |
 NASDAQ: OCFC
6
Our Strategy
Our Strategy
Positioned as the leading Community Bank alternative in attractive
Central
Jersey
Shore
market
–
growing
revenue
and
creating
additional value for our shareholders
Offering a full range of consumer and commercial banking products
generating diversified income streams
Guarding
credit
quality
in
ALL
business
cycles
Transitioning the balance sheet with emphasis on core deposit
funding and commercial lending growth
Ready for in-market roll-up opportunities presented by smaller,
“regulatory fatigued”
competitors |
 NASDAQ: OCFC
7
Highlights –2010
Highlights –2010
Record $20.4 million of net income for 2010
Total
revenue
(i.e.,
net
interest
income
and
total
other
income)
of
$92.4 million for 2010 also set a record for the Company, an
increase of 14.0% over 2009
Diluted earnings per share year-over-year increased 14.3% to
$1.12.
Return
on
average
stockholders’
equity
was
10.6%
for
2010
Core
deposits
(i.e.,
all
deposits
excluding
time
deposits)
increased
31.1%,
$326.8
million
for
the
year,
and
now
comprise
82.9%
of
total
deposits
Strong capital position, tangible common equity of 8.9% of assets
|
 NASDAQ: OCFC
8
Increasing Primary Market Deposit Share
Increasing Primary Market Deposit Share
June 30, 2010
# of
Dep. In Mkt.
Mkt. Shr.
Rank
Institution
Branches
($000)
(%)
Ocean County, NJ
1
Hudson City Bancorp Inc. (NJ)
13
2,773,130
21.66
2
Wells Fargo & Co. (CA)
27
1,810,777
14.14
3
TD Bank National Association (Canada)
20
1,776,218
13.87
4
OceanFirst
Financial Corp. (NJ)
18
1,282,436
10.02
5
Banco
Santander S.A. (Spain)
25
1,254,237
9.80
6
Bank of America Corp. (NC)
23
1,234,572
9.64
7
Investors Bancorp Inc. (MHC) (NJ)
7
637,788
4.98
8
PNC Financial Services Group (PA)
12
420,227
3.28
9
Sun Bancorp Inc. (NJ)
6
235,558
1.84
10
Manasquan Savings Bank (NJ)
3
225,540
1.76
Total For Institutions In Market
191
12,803,921
Source: FDIC
Moving from 6
th
to 4
th
in Last Year |
 NASDAQ: OCFC
9
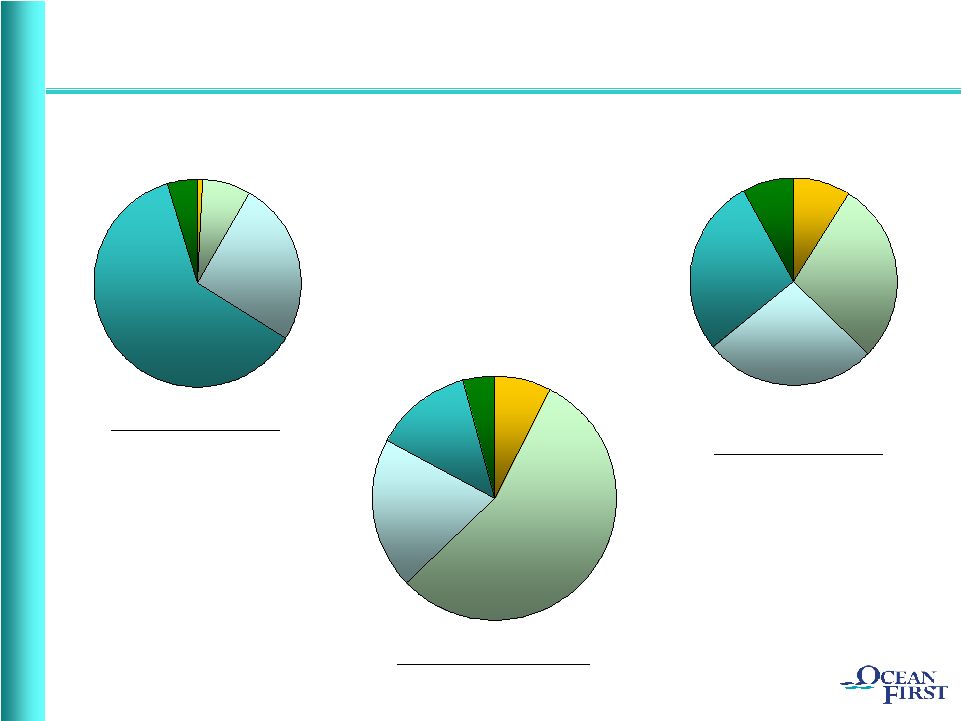
Interest
Bearing
Demand
Deposits,
28.2%
Non-Interest
Bearing
Demand
Deposits,
8.9%
Jumbo Time
Deposits(1),
8.1%
Retail Time
Deposits,
27.7%
MMDA &
Savings,
27.1%
Deposit Composition Transition
Deposit Composition Transition
Interest
Bearing
Demand
Deposits,
7.6%
Non-Interest
Bearing
Demand
Deposits,
0.7%
Jumbo Time
Deposits(1),
4.7%
Retail Time
Deposits,
61.4%
MMDA &
Savings,
25.6%
Interest
Bearing
Demand
Deposits,
55.3%
Non-Interest
Bearing
Demand
Deposits,
7.6%
Jumbo Time
Deposits(1),
4.3%
Retail Time
Deposits,
12.8%
MMDA &
Savings,
20.0%
(1) Jumbo CDs have a balance of $100,000 or greater.
December 31, 2005
December 31, 2010
December 31, 1996 |
 NASDAQ: OCFC
10
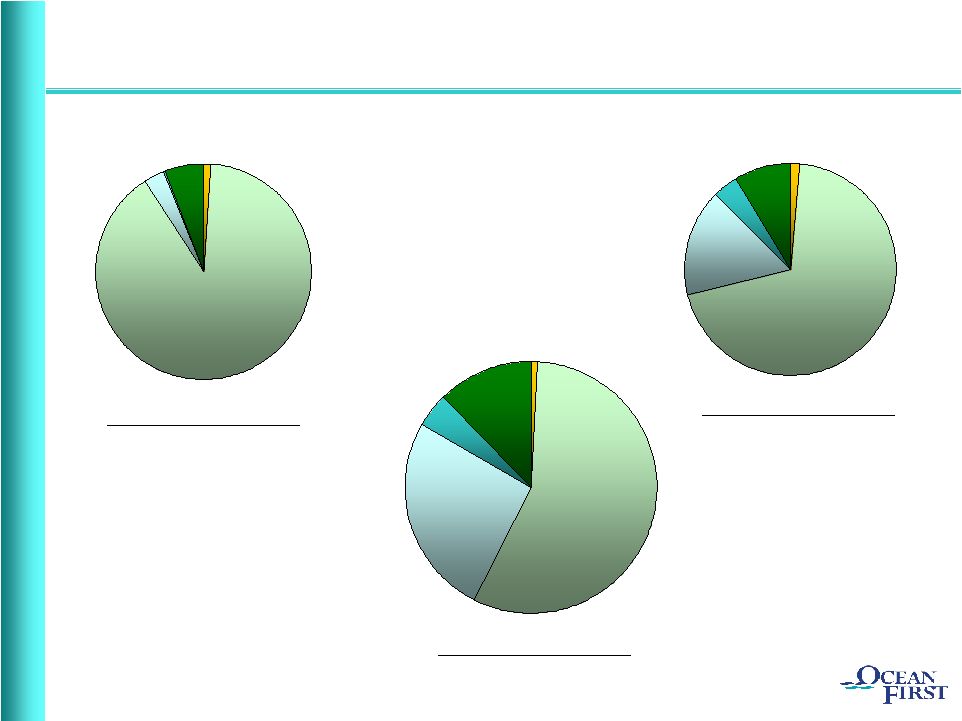
Commercial
R.E., 25.8%
Residential
R.E., 56.6%
Commercial
& Industrial,
4.6%
Construction
R.E., 0.8%
Consumer &
Other(1),
12.2%
Loan Composition Transition
Loan Composition Transition
Commercial
R.E., 3.2%
Residential
R.E., 89.6%
Commercial
& Industrial,
0.4%
Construction
R.E., 1.1%
Consumer &
Other(1),
5.7%
Commercial
R.E., 16.5%
Residential
R.E., 69.8%
Commercial
& Industrial,
3.8%
Construction
R.E., 1.3%
Consumer &
Other(1),
8.6%
(1)
Consumer and other loans primarily consist of home equity lines and loans.
Note:
See Appendix 2 for specific portfolio metrics and commercial portfolio
segmentation. December 31, 2005
December 31, 2010
December 31, 1996 |
 NASDAQ: OCFC
11
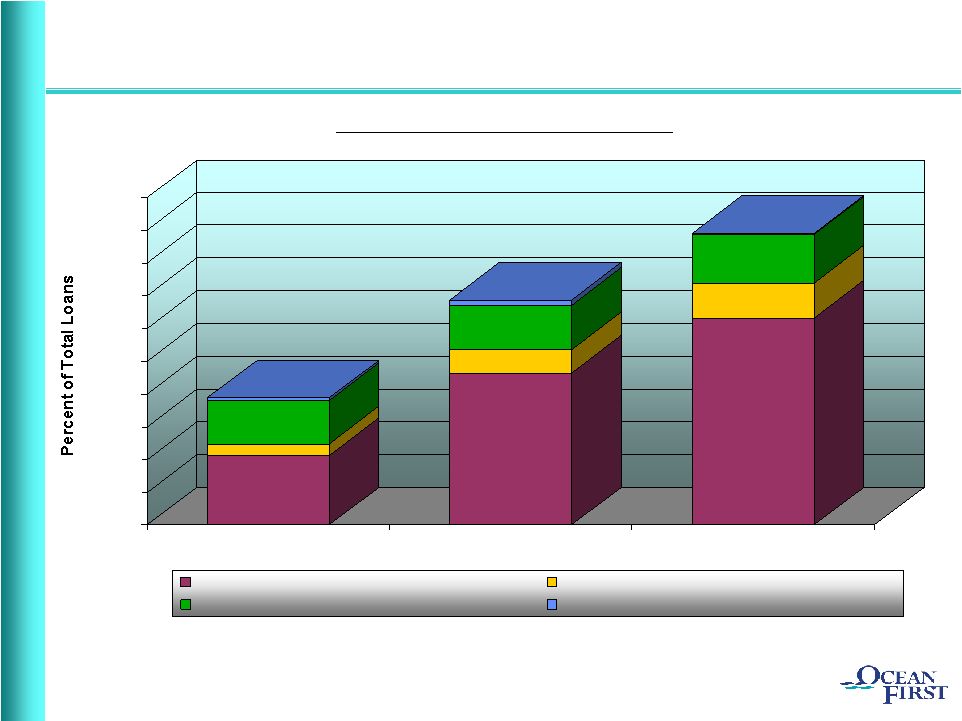
NPL’s in a Diversified Portfolio
NPL’s in a Diversified Portfolio
Non-performing loan (“NPL”).
Data as of December 31.
0.00%
0.25%
0.50%
0.75%
1.00%
1.25%
1.50%
1.75%
2.00%
2.25%
2.50%
2008
2009
2010
One-to-Four Family
Consumer
Commercial Real Estate and Construction
Commercial
Stable Commercial Credit Quality |
 NASDAQ: OCFC
12
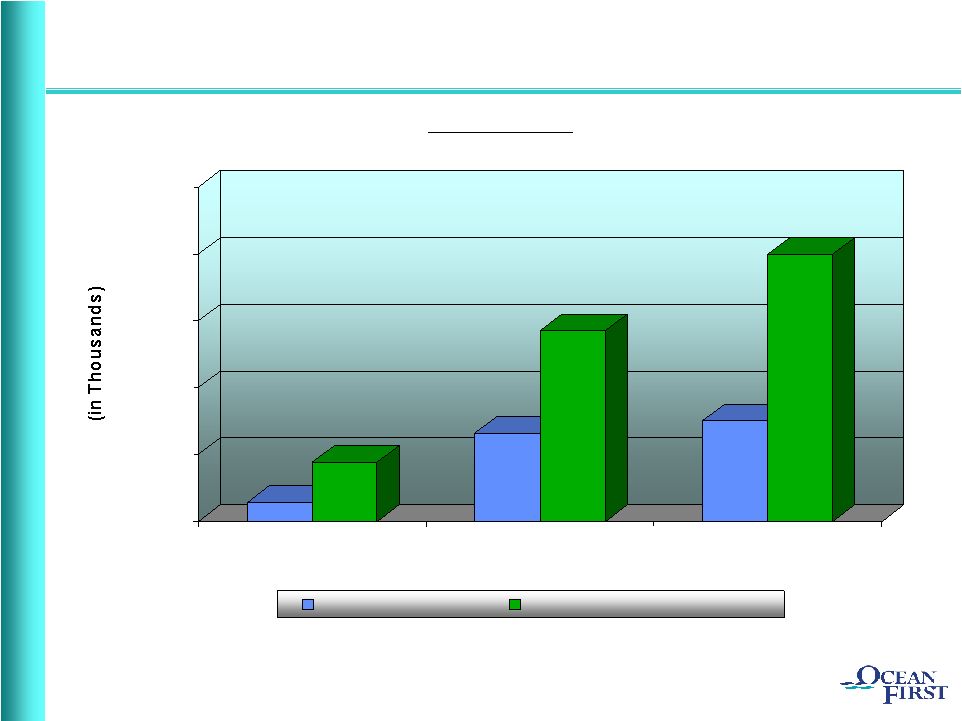
Provision for Loan Losses Exceed Charge-Offs
Provision for Loan Losses Exceed Charge-Offs
Building ALLL
$0
$2,000
$4,000
$6,000
$8,000
$10,000
12/31/08
12/31/09
12/31/10
Net Charge-Offs
Provision for Loan Losses
Year-Ended |
 NASDAQ: OCFC
13
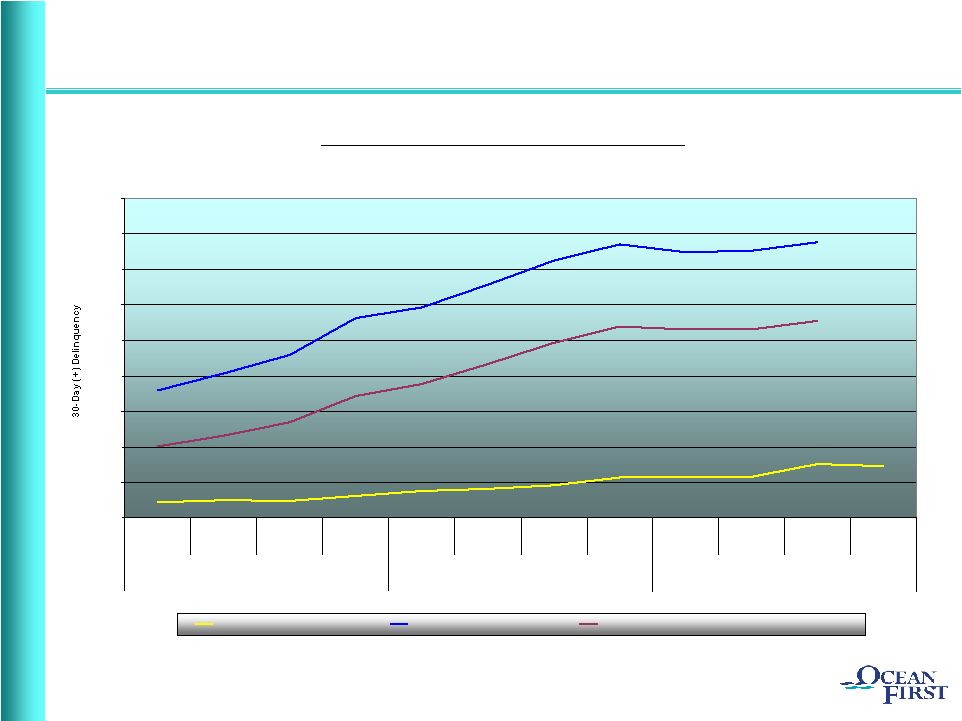
Quarterly Residential Delinquency Trends
Quarterly Residential Delinquency Trends
OceanFirst
Well
Below
Benchmarks
0.00%
2.00%
4.00%
6.00%
8.00%
10.00%
12.00%
14.00%
16.00%
18.00%
2008
2009
2010
OCFC All Mortgage Loans
MBA NJ Mortgage Loans
MBA NJ Conventional (Prime) Mortgage Loans |
 NASDAQ: OCFC
14
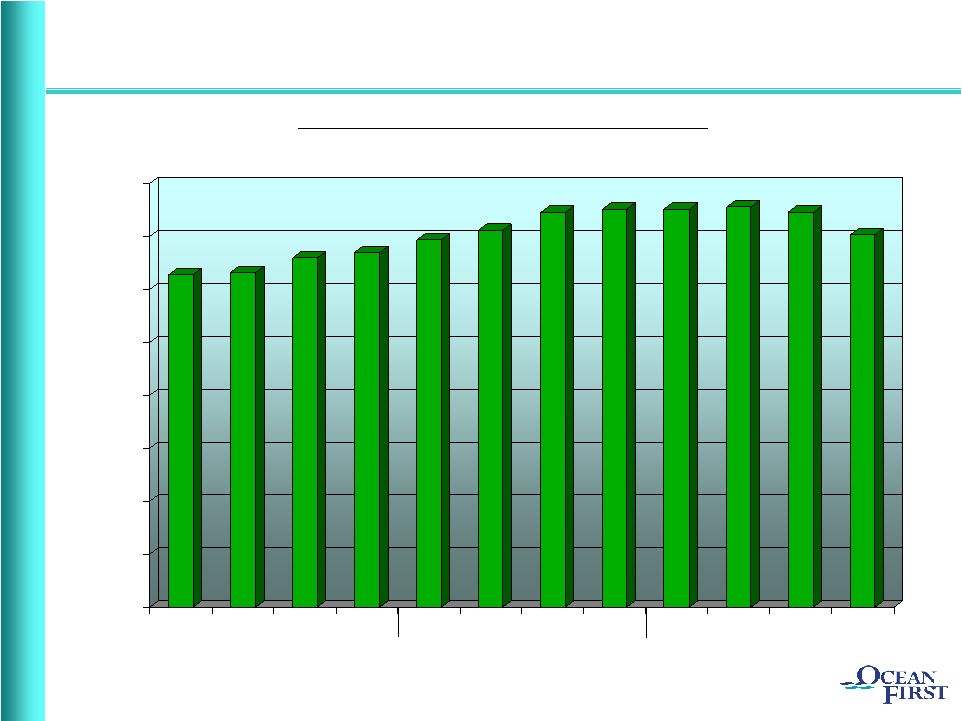
Net Interest Margin
Net Interest Margin
Expansion has Run its Course –
for Now
0.00%
0.50%
1.00%
1.50%
2.00%
2.50%
3.00%
3.50%
4.00%
2008
2009
2010 |
 NASDAQ: OCFC
15
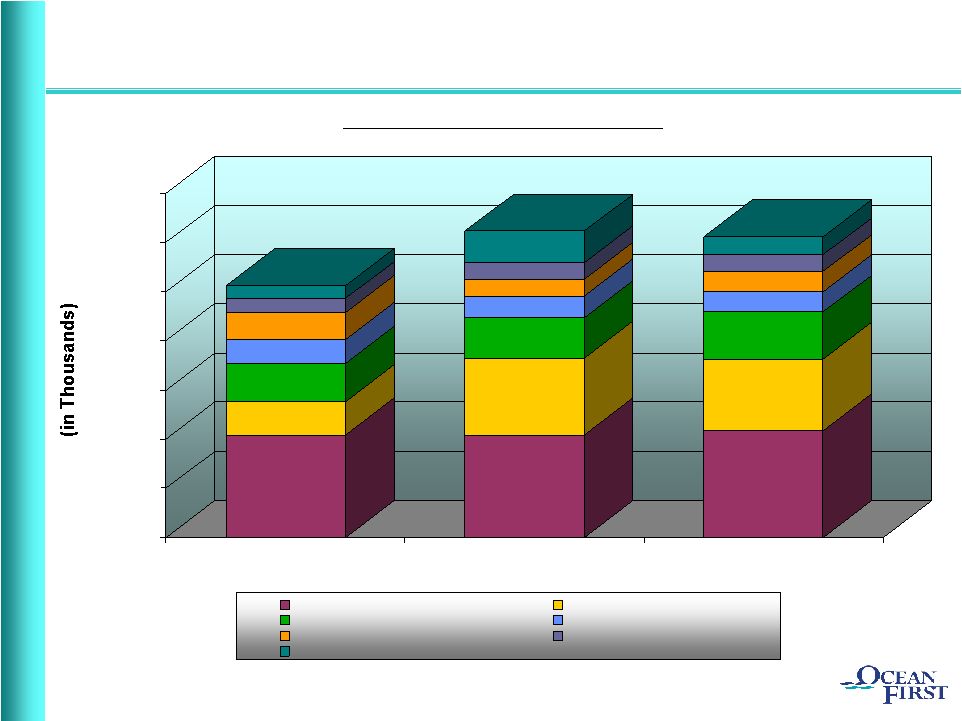
Diversified Streams of Non-Interest Income
Diversified Streams of Non-Interest Income
$0
$2,500
$5,000
$7,500
$10,000
$12,500
$15,000
$17,500
2008
2009
2010
Deposit Fees
Gain on Sale of Loans
Merchant Services
Investment Services
Trust
BOLI
Other
70
bps.
of
2010
Average
Assets |
 NASDAQ: OCFC
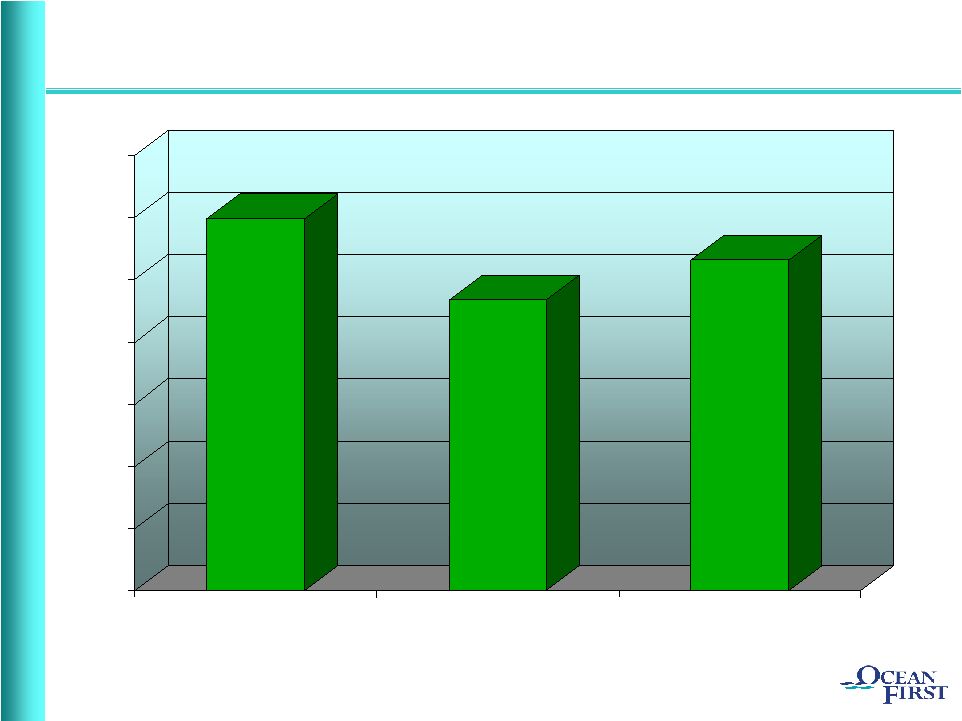
16
Delivering Double-Digit Return on Equity
Delivering Double-Digit Return on Equity
0.0%
2.0%
4.0%
6.0%
8.0%
10.0%
12.0%
14.0%
2008
2009
2010 |
 NASDAQ: OCFC
17
Challenge Today is to Grow Revenue
Challenge Today is to Grow Revenue
Build Shareholder Value
Build Shareholder Value
Business
Plan
targets
growth
within
existing
footprint
–
increasing
market share
Twelve
new
branches
since
2000
have
performed
well
–
still
present
room
for
growth
Non-interest
income
streams
have
been
diversified
–
offering
significant
growth
–
more
important
as
margin
expansion
struggles
in the near term
Opportunistic
roll-up
of
smaller
community
banks
in
market
Financial
performance
to
Plan
earns
OceanFirst
the
right
to
remain
independent |
 NASDAQ: OCFC
18
¹
Peers include: ALNC, CNBC, DCOM, FFIC, HUVL, LBAI, PBNY, PGC, SMTB, STBC, STL,
SUBK, and TRST Note:
Financial data for the period ended December 31, 2010. Share price as of
February 11, 2011. Source: Sandler O’Neill.
Attractive Valuation Metrics
Attractive Valuation Metrics
OCFC
Peers¹
Valuation
Price / Tang. Book Value
129%
152%
Price / LQA EPS
10.8x
13.4x
Price / Estimated EPS
12.4x
13.2x
Cash Dividend Yield
3.49%
2.81% |
 NASDAQ: OCFC
19
Why OCFC…?
Why OCFC…?
Fundamental
franchise
value
–
superior
market
demographics
Experienced management team with substantial insider ownership –
aligned with shareholders
Increasing deposit market share
Conservative credit culture and profile
Solid financial performance –
developing shareholder value
Strong balance sheet and capital base
Attractive current valuation |
 NASDAQ: OCFC
20
THANK YOU
THANK YOU
FOR YOUR INTEREST IN
FOR YOUR INTEREST IN
OCEANFIRST FINANCIAL CORP.
OCEANFIRST FINANCIAL CORP. |
 NASDAQ: OCFC
21
Market Demographics
Market Demographics
APPENDIX 1
Ocean
Monmouth
Middlesex
New Jersey
National
Number of Offices
18
4
1
% of OceanFirst Deposits
83.3
13.4
3.3
Market Rank
4
17
34
Market Share (%)
10.0
1.1
0.2
Population
578,728
649,429
794,605
Projected 2010-2015
Population Growth (%)
4.0
2.0
1.8
1.2
3.8
Median Household Income ($)
60,936
82,974
78,561
72,519
54,442
Projected 2010-2015 Median
Household Income Growth (%)
15.5
14.3
17.5
14.7
12.4
Deposit data as of June 30, 2010.
Demographic data as of June 30, 2010.
Source: SNL Financial |
 NASDAQ: OCFC
22
One-to-Four Family Loans
Average size of mortgage loans
$186,000
Interest-only loans - Amount
$80.1 million
- Percent of total one-to-four family
loans 8.4%
Stated income loans - Amount
$62.7 million
- Percent of total
one-to-four family loans 6.6%
Portfolio weighted average loan-to-value ratio (using original appraisal)
58%
Weighted average loan-to-value ratio of loans originated for the year ended December 31, 2009
62%
Weighted average loan-to-value ratio of loans originated for the year ended December 31, 2010
60%
Average FICO score
746
Average FICO score of loans originated for the year ended December 31, 2009
756
Average FICO score of loans originated for the year ended December 31, 2010
764
Percent of jumbo loans at origination
45.7%
Percent of loans outside the New York/New Jersey market
6.1%
Percent of loans for second homes
7.5%
APPENDIX 2
Residential Portfolio Metrics
Residential Portfolio Metrics
As of December 31, 2010, unless otherwise noted. |
 NASDAQ: OCFC
23
Commercial Real Estate
Average size of commercial real estate loans
$711,000
Largest commercial real estate loan
$13.6 million
Commercial Loans
Average size of commercial loan
$277,000
Largest commercial loan
$16.5 million
APPENDIX 2
(Cont’d)
Commercial Portfolio Metrics
Commercial Portfolio Metrics
As of December 31, 2010. |
 NASDAQ: OCFC
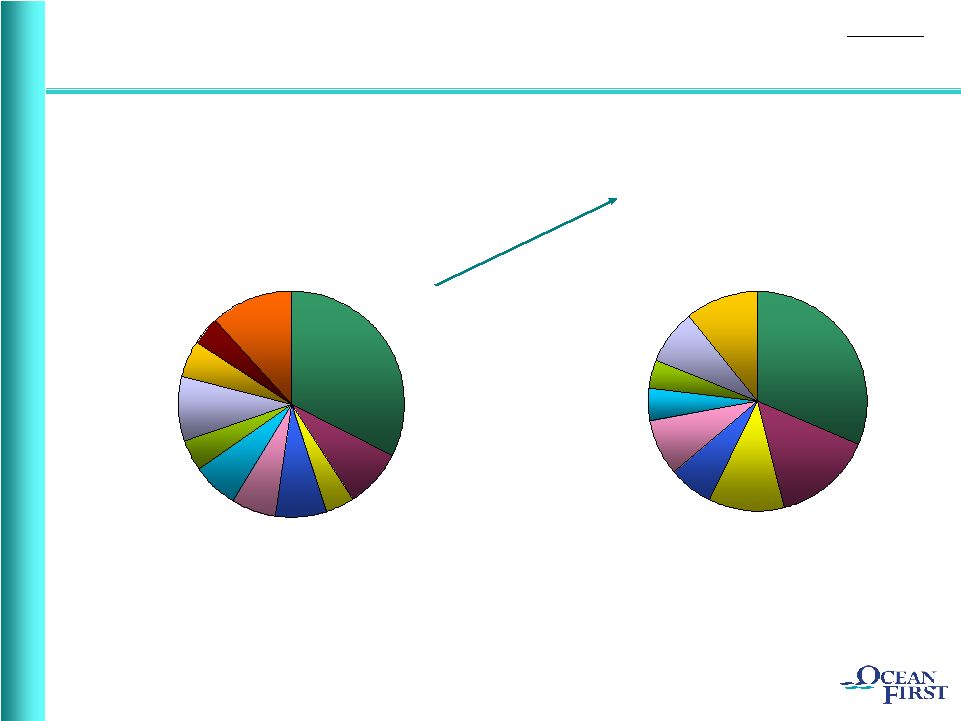
24
Commercial Portfolio Segmentation
Commercial Portfolio Segmentation
Construction, 8.2%
Retail Trade, 4.3%
Miscellaneous, 11.6%
Healthcare, 6.3%
Accommodations/
Food Services, 6.6%
Wholesale Trade,
7.2%
Arts/Entertainment/
Recreation, 9.1%
Manufacturing, 5.4%
Real Estate
Investment, 32.6%
Educational Services,
4.1%
Other Services, 4.6%
Total Commercial Loan Exposure
by Industry Concentration
Real Estate Investment by
Property Concentration
Office, 31.3%
Multi-Family, 8.5%
Land, 4.7%
Commercial
Development, 4.1%
Residential
Development, 8.0%
Miscellaneous, 10.9%
Retail Store, 6.5%
Industrial/
Warehouse, 14.7%
Shopping Center, 11.3%
As of December 31, 2010.
APPENDIX 2
(Cont’d) |