Attached files
| file | filename |
|---|---|
| 8-K - FORM 8-K - Simplicity Bancorp, Inc. | t69783_8k.htm |
Exhibit 99.1
 |
February 2011
Kay M. Hoveland, President and Chief Executive Officer
|
 |
FORWARD LOOKING STATEMENTS
This presentation may contain certain forward-looking statements regarding our prospective performance and strategies within the meaning of Section 21E of the Securities Exchange Act of 1934, as amended. We intend such forward-looking statements to be covered by the safe harbor provisions for forward-looking statements contained in the Private Securities Litigation Reform Act of 1995, and are including this statement for purposes of safe harbor provisions.
This presentation contains “forward-looking statements.” You can identify these forward-looking statements through our use of words such as “may,” “will,” “anticipate,” “assume,” “should,” “indicate,” “would,” “believe,” “contemplate,” “expect,” “estimate,” “continue,” “plan,” “project,” “could,” “intend,” “target,” and other similar words and expressions of the future. These forward-looking statements include but are not limited to:
•statements of our goals, intentions and expectations;
•statements regarding our business plans, prospects, growth and operating strategies;
•statements regarding the asset quality of our loan and investment portfolios; and
•estimates of our risks and future costs and benefits.
These forward-looking statements are based on current beliefs and expectations of our management and are inherently subject to significant business and economic and competitive uncertainties and contingencies, many of which are beyond our control. In addition, these forward-looking statements are subject to assumptions with respect to future business strategies and decisions are subject to change.
Throughout this presentation, the peer companies include PVSA, BFIN, UBNK, BOFI, ABBC, FPTB, HOME, FSBI, and HBNK. The data presented in this presentation relating to peer companies is based on the calendar year, not KFFG’s fiscal year. Data for peers is sourced from SNL Financial LC.
February 2011 KFFG
|
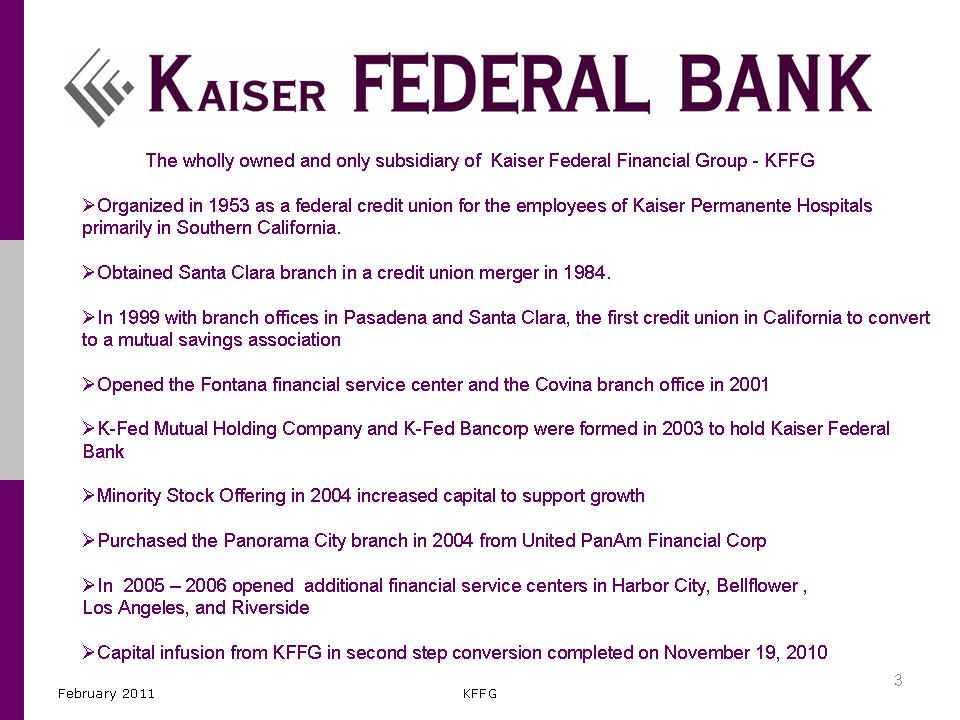 |
The wholly owned and only subsidiary of Kaiser Federal Financial Group -KFFG
..Organized in 1953 as a federal credit union for the employees of Kaiser Permanente Hospitals primarily in Southern California.
..Obtained Santa Clara branch in a credit union merger in 1984.
..In 1999 with branch offices in Pasadena and Santa Clara, the first credit union in California to convert
to a mutual savings association
..Opened the Fontana financial service center and the Covina branch office in 2001
..K-Fed Mutual Holding Company and K-Fed Bancorp were formed in 2003 to hold Kaiser Federal Bank
..Minority Stock Offering in 2004 increased capital to support growth
..Purchased the Panorama City branch in 2004 from United PanAm Financial Corp
..In 2005 – 2006 opened additional financial service centers in Harbor City, Bellflower , Los Angeles, and Riverside
..Capital infusion from KFFG in second step conversion completed on November 19, 2010
February 2011 KFFG
|
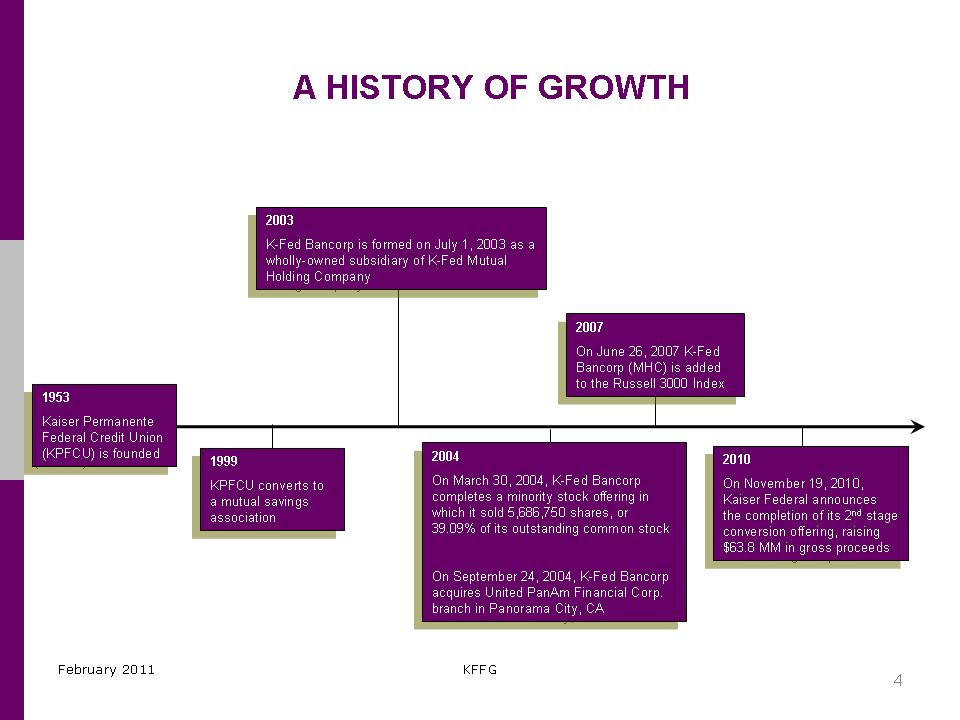 |
1953
Kaiser Permanente
Federal Credit Union
(KPFCU) is founded
1953
Kaiser Permanente
Federal Credit Union
(KPFCU) is founded
1999
KPFCU converts to
a mutual savings
association
1999
KPFCU converts to
a mutual savings
association
2003
K-Fed Bancorp is formed on July 1, 2003 as a
wholly-owned subsidiary of K-Fed Mutual
Holding Company
2003
K-Fed Bancorp is formed on July 1, 2003 as a
wholly-owned subsidiary of K-Fed Mutual
Holding Company
2004
On March 30, 2004, K-Fed Bancorp
completes a minority stock offering in
which it sold 5,686,750 shares, or
39.09% of its outstanding common stock
On September 24, 2004, K-Fed Bancorp
acquires United PanAm Financial Corp.
branch in Panorama City, CA
2004
On March 30, 2004, K-Fed Bancorp
completes a minority stock offering in
which it sold 5,686,750 shares, or
39.09% of its outstanding common stock
On September 24, 2004, K-Fed Bancorp
acquires United PanAm Financial Corp.
branch in Panorama City, CA
2007
On June 26, 2007 K-Fed
Bancorp (MHC) is added
to the Russell 3000 Index
2007
On June 26, 2007 K-Fed
Bancorp (MHC) is added
to the Russell 3000 Index
2010
On November 19, 2010,
Kaiser Federal announces
the completion of its 2nd stage
conversion offering, raising
$63.8 MM in gross proceeds
2010
On November 19, 2010,
Kaiser Federal announces
the completion of its 2nd stage
conversion offering, raising
$63.8 MM in gross proceeds
A HISTORY OF GROWTH
February 2011 KFFG
4
|
 |
EXPERIENCED MANAGEMENT TEAM
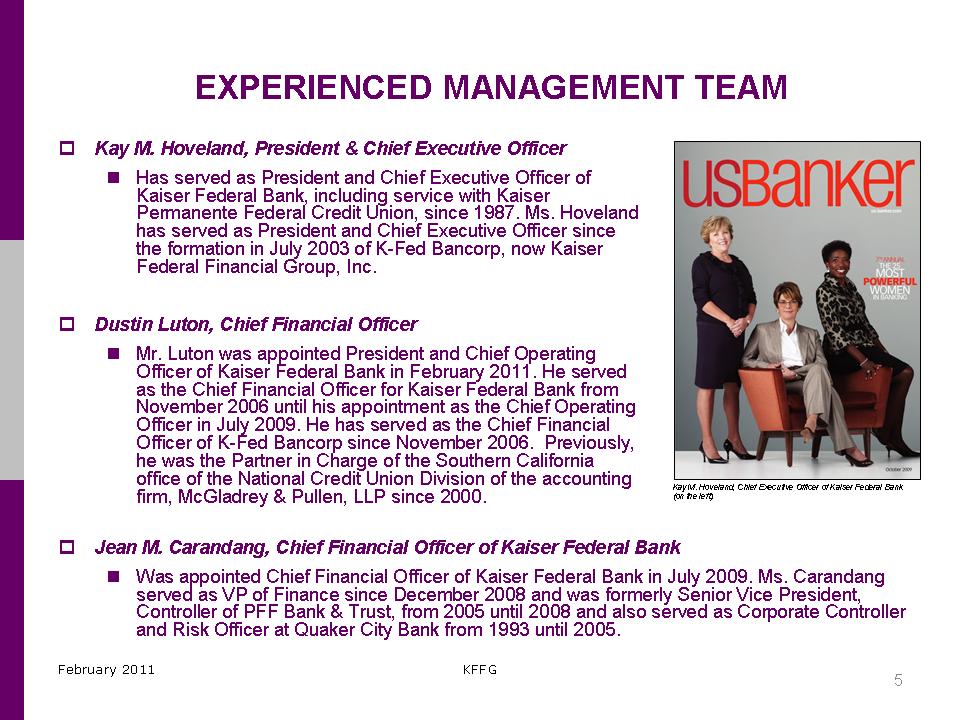
. Kay M. Hoveland, President & Chief Executive Officer
. Has served as President and Chief Executive Officer of
Kaiser Federal Bank, including service with Kaiser
Permanente Federal Credit Union, since 1987. Ms. Hoveland
has served as President and Chief Executive Officer since
the formation in July 2003 of K-Fed Bancorp, now Kaiser
Federal Financial Group, Inc.
. Dustin Luton, Chief Financial Officer
. Mr. Luton was appointed President and Chief Operating
Officer of Kaiser Federal Bank in February 2011. He served
as the Chief Financial Officer for Kaiser Federal Bank from
November 2006 until his appointment as the Chief Operating
Officer in July 2009. He has served as the Chief Financial
Officer of K-Fed Bancorp since November 2006. Previously,
he was the Partner in Charge of the Southern California
office of the National Credit Union Division of the accounting
firm, McGladrey & Pullen, LLP since 2000.
. Jean M. Carandang, Chief Financial Officer of Kaiser Federal Bank
. Was appointed Chief Financial Officer of Kaiser Federal Bank in July 2009. Ms. Carandang
served as VP of Finance since December 2008 and was formerly Senior Vice President,
Controller of PFF Bank & Trust, from 2005 until 2008 and also served as Corporate Controller
and Risk Officer at Quaker City Bank from 1993 until 2005.
February 2011 KFFG
Kay M. Hoveland, Chief Executive Officer of Kaiser Federal Bank
(on the left)
|
 |
EXPERIENCED MANAGEMENT TEAM
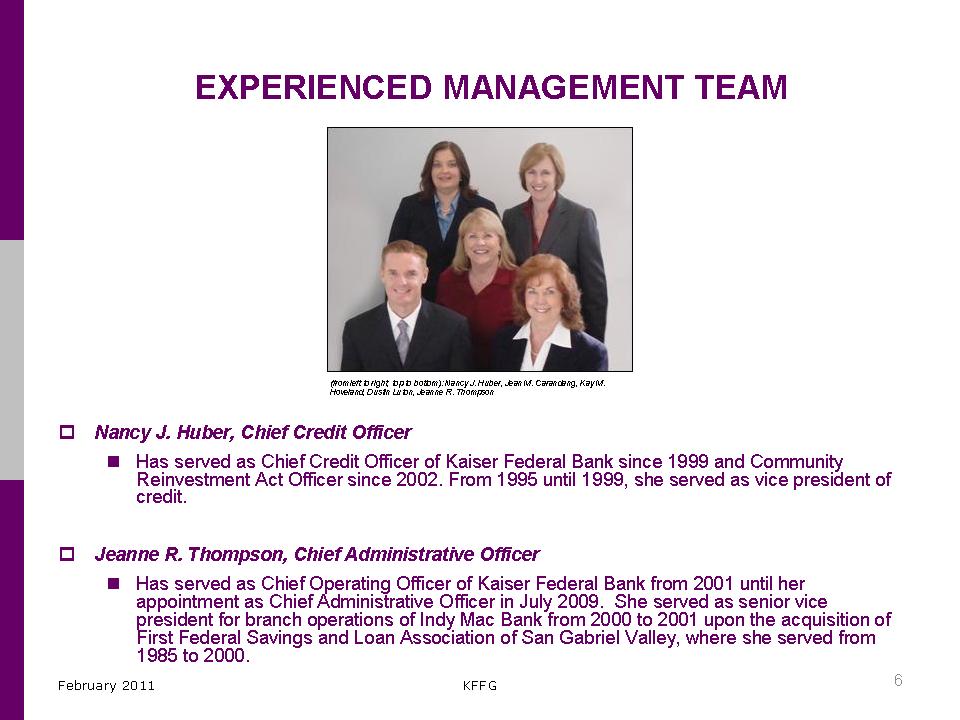
(from left to right, top to bottom): Nancy J. Huber, Jean M. Carandang, Kay M.
Hoveland, Dustin Luton, Jeanne R. Thompson
. Nancy J. Huber, Chief Credit Officer
. Has served as Chief Credit Officer of Kaiser Federal Bank since 1999 and Community
Reinvestment Act Officer since 2002. From 1995 until 1999, she served as vice president of credit.
. Jeanne R. Thompson, Chief Administrative Officer
. Has served as Chief Operating Officer of Kaiser Federal Bank from 2001 until her
appointment as Chief Administrative Officer in July 2009. She served as senior vice
president for branch operations of Indy Mac Bank from 2000 to 2001 upon the acquisition of
First Federal Savings and Loan Association of San Gabriel Valley, where she served from 1985 to 2000.
February 2011 KFFG
|
 |
KFFG OPERATES IN A NICHE MARKET
. We have been an attractive choice to local depositors, specifically employees of the Kaiser Permanente Medical Care Program
. Approximately 55,000 Kaiser Permanente employees are located in Southern California
. The Kaiser Permanente Medical Care Program employs a large percentage of our account holders
. At June 30, 2010, approximately 27% of the Bank’s deposits were from current Kaiser
Permanente employees
. Our three branch offices and six financial service centers are located in close proximity to the Kaiser Permanente Medical Centers
. We have 48 ATMs strategically located in Kaiser Permanente medical office buildings
. Such a strong relationship with Kaiser Permanente employees produces a steady stream of new accounts and deposits
. Ex: Bi-weekly Kaiser Permanente employee direct deposits
. The Bank is represented at new employee orientations for Kaiser Permanente
. Kaiser Permanente provides the Bank with access for other business development
opportunities
. We intend to expand our deposit base by building upon our niche of Kaiser Permanente
employees and our existing market locations
February 2011 KFFG 7
|
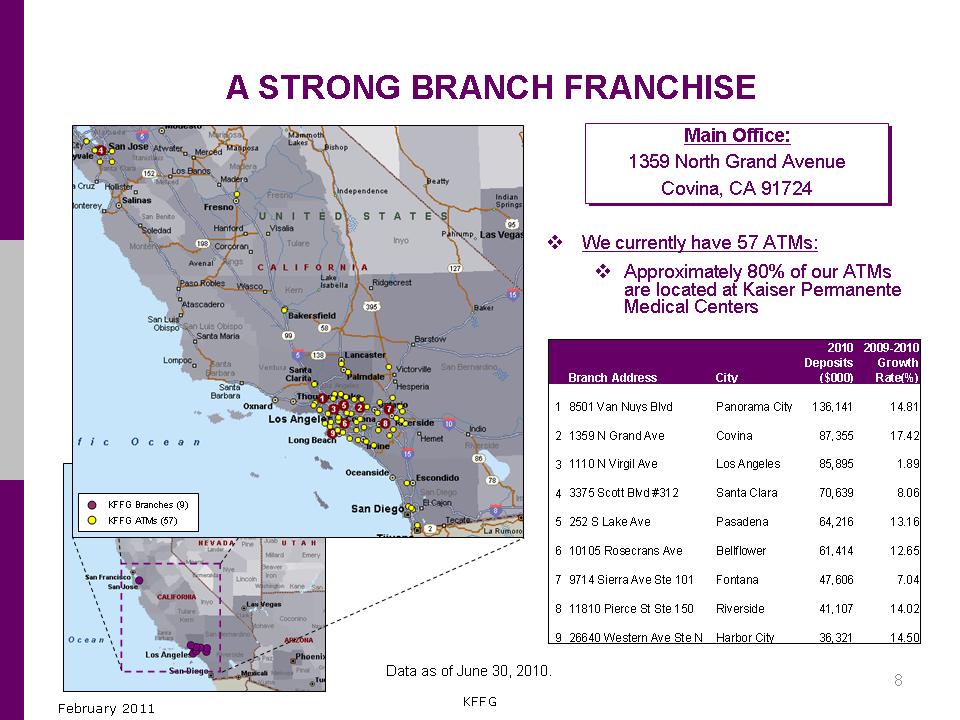 |
A STRONG BRANCH FRANCHISE
KFFG Branches (9)
KFFG ATMs (57)
Data as of June 30, 2010.
Main Office:
1359 North Grand Avenue
Covina, CA 91724
. We currently have 57 ATMs:
. Approximately 80% of our ATMs
are located at Kaiser Permanente
Medical Centers
2010 2009-2010
Deposits Growth
Branch Address City ($000) Rate(%)
1 8501 Van Nuys Blvd Panorama City 136,141 14.81
2 1359 N Grand Ave Covina 87,355 17.42
3 1110 N Virgil Ave Los Angeles 85,895 1.89
4 3375 Scott Blvd #312 Santa Clara 70,639 8.06
5 252 S Lake Ave Pasadena 64,216 13.16
6 10105 Rosecrans Ave Bellflower 61,414 12.65
7 9714 Sierra Ave Ste 101 Fontana 47,606 7.04
8 11810 Pierce St Ste 150 Riverside 41,107 14.02
9 26640 Western Ave Ste N Harbor City 36,321 14.50
February 2011 KFFG
|
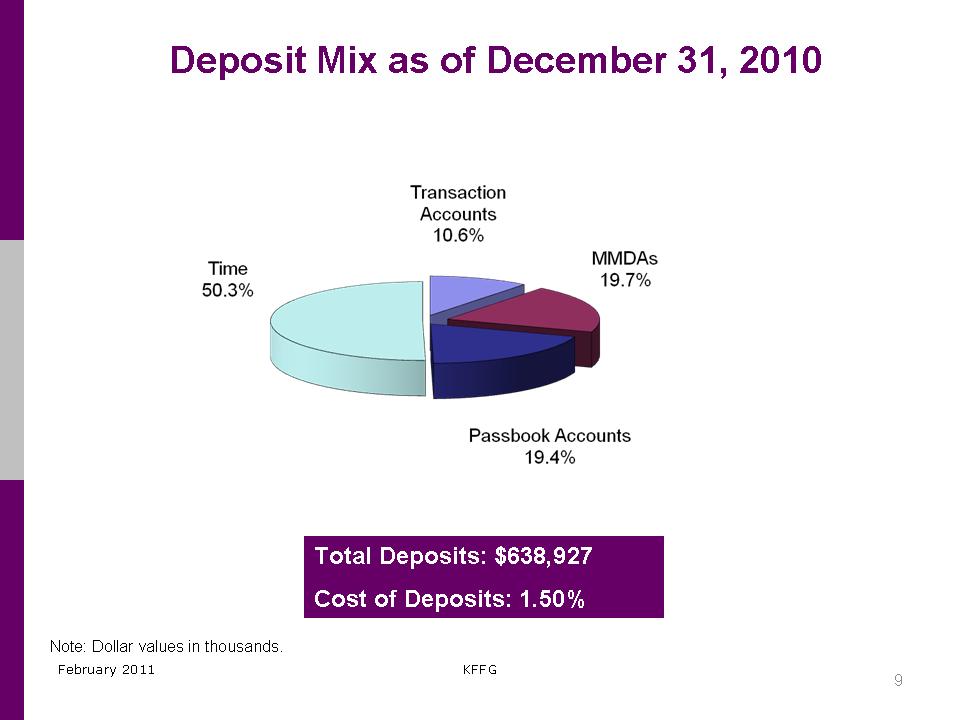 |
Deposit Mix as of December 31, 2010
Total Deposits: $638,927
Cost of Deposits: 1.50%
Note: Dollar values in thousands.
February 2011 KFFG
|
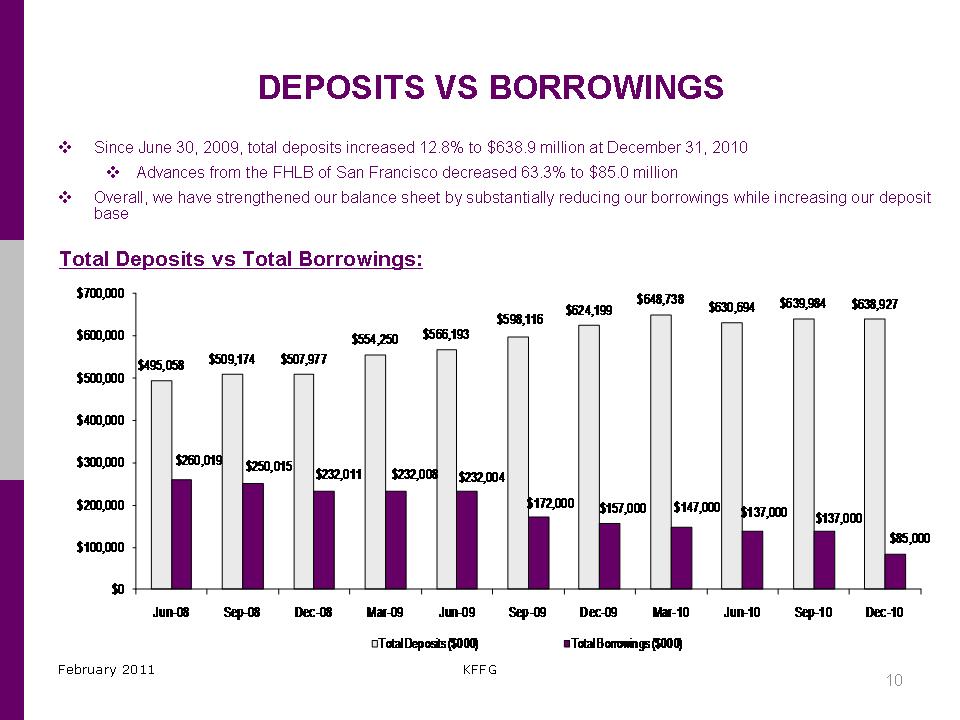 |
DEPOSITS VS BORROWINGS
. Since June 30, 2009, total deposits increased 12.8% to $638.9 million at December 31, 2010
. Advances from the FHLB of San Francisco decreased 63.3% to $85.0 million
. Overall, we have strengthened our balance sheet by substantially reducing our borrowings while increasing our deposit
base
Total Deposits vs Total Borrowings:
$700,000
$624,199
$648,738 $630,694 $639,984 $638,927
$598,116
$600,000
$554,250 $566,193
$495,058 $509,174 $507,977
$500,000
$400,000
$300,000
$260,019 $250,015
$232,011 $232,008 $232,004
$200,000
$172,000 $157,000 $147,000 $137,000 $137,000
$85,000
$100,000
$0
Jun-08 Sep-08 Dec-08 Mar-09 Jun-09 Sep-09 Dec-09 Mar-10 Jun-10 Sep-10 Dec-10
Total Deposits ($000) Total Borrowings ($000)
February 2011 KFFG
|
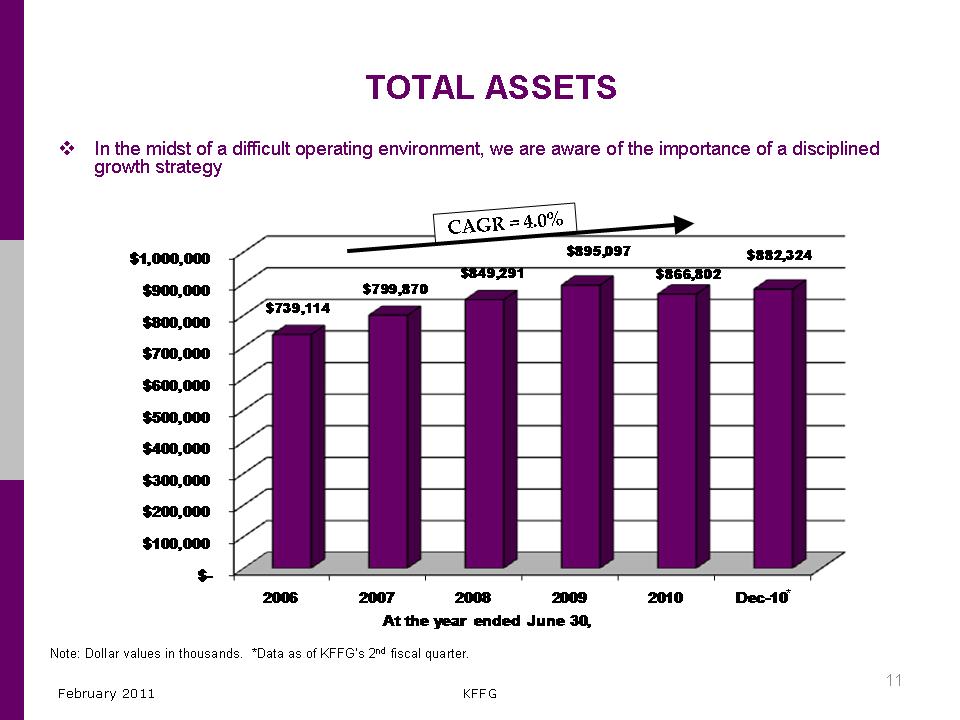 |
TOTAL ASSETS
. In the midst of a difficult operating environment, we are aware of the importance of a disciplined
growth strategy
$895,097 $882,324
$1,000,000
$900,000
$800,000
$700,000
$600,000
$500,000
$400,000
$300,000
$200,000
$100,000
CAGR=4.0%
$739,114
$799,870
$849,291 $866,802
$
2006 2007 2008 2009 2010 Dec-10 *
At the year ended June 30,
Note: Dollar values in thousands. *Data as of KFFG’s 2nd fiscal quarter.
February 2011 KFFG
|
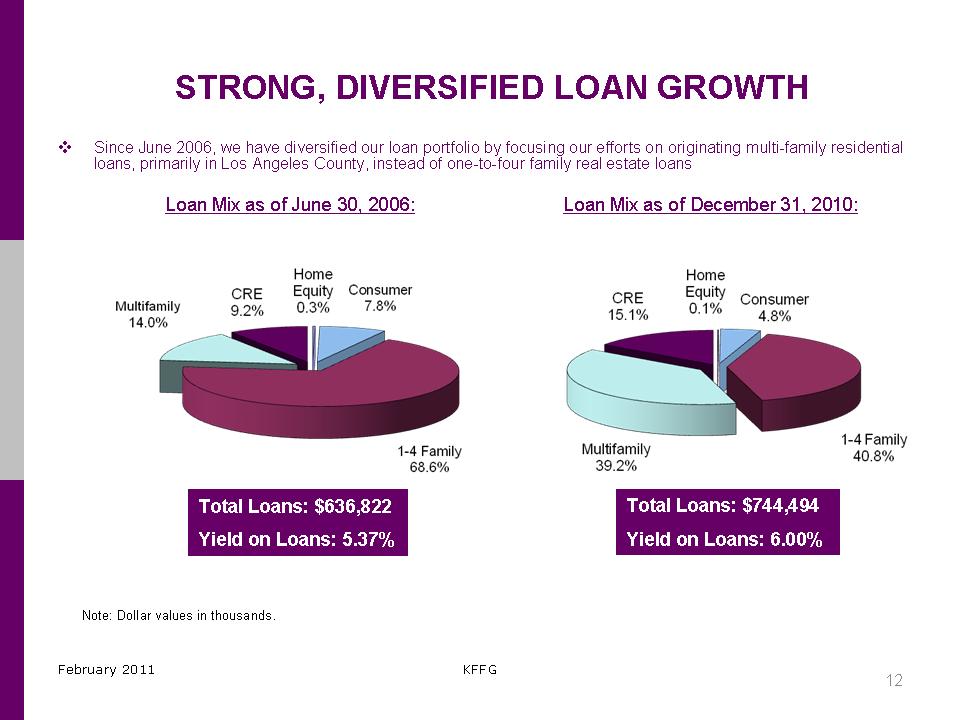 |
STRONG, DIVERSIFIED LOAN GROWTH
. Since June 2006, we have diversified our loan portfolio by focusing our efforts on originating multi-family residential
loans, primarily in Los Angeles County, instead of one-to-four family real estate loans
Loan Mix as of June 30, 2006: Loan Mix as of December 31, 2010:
Total Loans: $744,494
Yield on Loans: 6.00%
Total Loans: $636,822
Yield on Loans: 5.37%
Note: Dollar values in thousands.
February 2011 KFFG
|
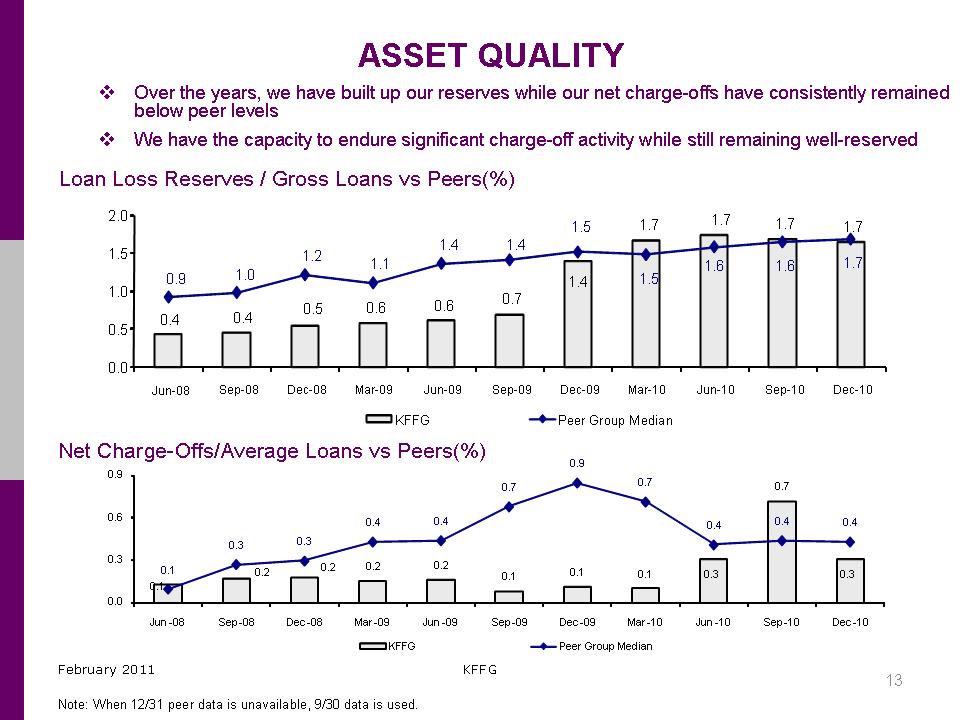 |
ASSET QUALITY
. Over the years, we have built up our reserves while our net charge-offs have consistently remained below peer levels
. We have the capacity to endure significant charge-off activity while still remaining well-reserved
Loan Loss Reserves / Gross Loans vs Peers(%)
2.0
1.5
1.0
0.5
0.0
0.4 0.4 0.5 0.6 0.6 0.7
1.4
1.7 1.7 1.7 1.7
0.9 1.0
1.2 1.1
1.4 1.4
1.5
1.5
1.6 1.6 1.7
Jun-08 Sep-08 Dec-08 Mar-09 Jun-09 Sep-09 Dec-09 Mar-10 Jun-10 Sep-10 Dec-10
KFFG Peer Group Median
Net Charge-Offs/Average Loans vs Peers(%)
0.9
0.9
0.6
0.3
0.0
0.1
0.2 0.2 0.2 0.2
0.1 0.1 0.1 0.3
0.7
0.30.1
0.3 0.3
0.4 0.4
0.70.7
0.4 0.4 0.4
Jun -08 Sep-08 Dec-08 Mar-09 Jun -09 Sep-09 Dec-09 Mar-10 Jun -10 Sep-10 Dec-10
KFFG Peer Group Median
February 2011 KFFG
13
Note: When 12/31 peer data is unavailable, 9/30 data is used.
|
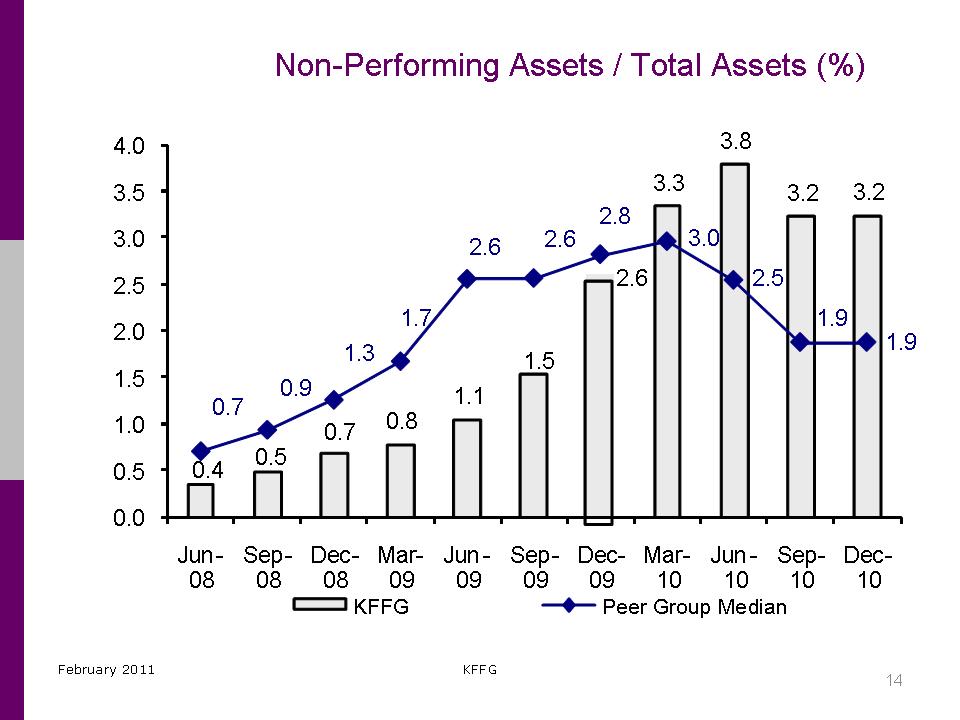 |
Non-Performing Assets / Total Assets (%)
3.8
4.0
3.5
3.0
2.5
2.0
1.5
1.0
0.5
0.0
0.4 0.5
0.7 0.8
1.1
1.5
2.6
3.3 3.2 3.2
0.7
0.9
1.3
1.7
2.6 2.6
2.8
3.0
2.5
1.9
1.9
Jun-Sep-Dec-Mar-Jun-Sep-Dec-Mar-Jun-Sep-Dec08 08 08 09 09 09 09 10 10 10 10
KFFG
Peer Group Median
February 2011 KFFG
14
|
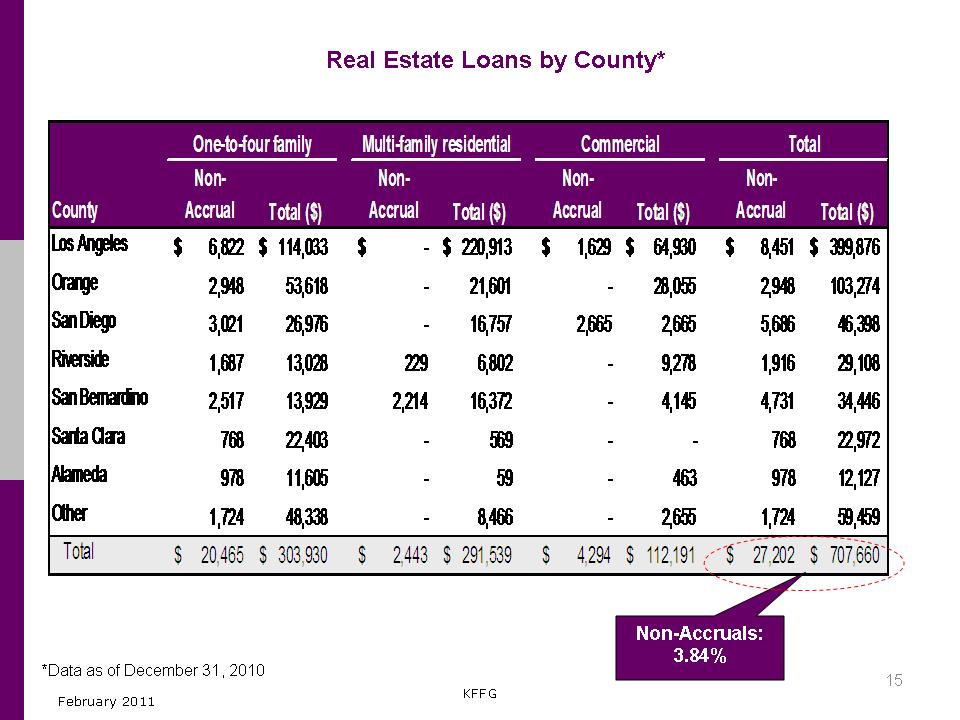 |
Real Estate Loans by County*
One-to-four family Multi-family residential Commercial Total
County
Non-
Accrual Total ($)
Non-
Accrual Total ($)
Non-
Accrual Total ($)
Non-
Accrual Total ($)
Los Angeles $ 6,822 $ 114,033 $
-
$ 220,913 $ 1,629 $ 64,930 $ 8,451 $ 399,876
Orange 2,948 53,618 - 21,601 - 28,055 2,948 103,274
San Diego 3,021 26,976 - 16,757 2,665 2,665 5,686 46,398
Riverside 1,687 13,028
229
6,802 -9,278 1,916 29,108
San Bernardino 2,517 13,929 2,214 16,372 -4,145 4,731 34,446
Santa Clara 768 22,403 -
569
--
768 22,972
Alameda 978 11,605 - 59 - 463 978 12,127
Other 1,724 48,338 - 8,466 -2,655 1,724 59,459
Total $ 20,465 $ 303,930 $ 2,443 $ 291,539 $ 4,294 $ 112,191 $ 27,202 $ 707,660
*Data as of December 31, 2010
Non-Accruals:
3.84%
KFFG
February 2011
|
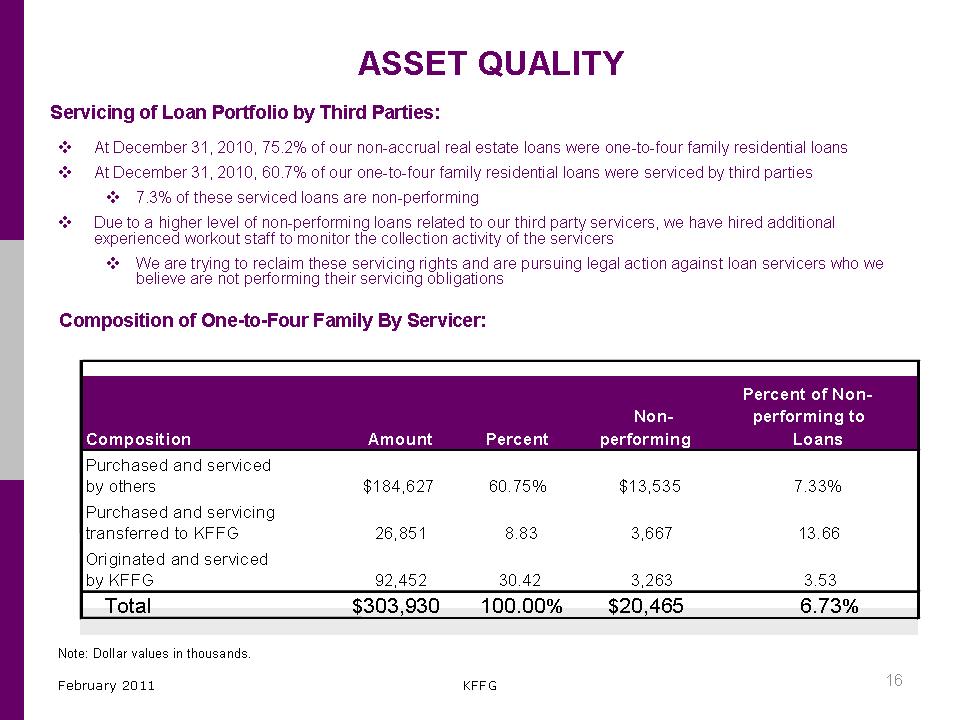 |
ASSET QUALITY
Servicing of Loan Portfolio by Third Parties:
. At December 31, 2010, 75.2% of our non-accrual real estate loans were one-to-four family residential loans
. At December 31, 2010, 60.7% of our one-to-four family residential loans were serviced by third parties
. 7.3% of these serviced loans are non-performing
. Due to a higher level of non-performing loans related to our third party servicers, we have hired additional experienced workout staff to monitor the collection activity of the servicers
. We are trying to reclaim these servicing rights and are pursuing legal action against loan servicers who we believe are not performing their servicing obligations
Composition of One-to-Four Family By Servicer:
Percent of Non-
Non-performing to
Composition Amount Percent performing Loans
Purchased and serviced by others $184,627 60.75% $13,535 7.33%
Purchased and servicing transferred to KFFG 26,851 8.83 3,667 13.66
Originated and serviced by KFFG 92,452 30.42 3,263 3.53
Total $303,930 100.00% $20,465 6.73%
Note: Dollar values in thousands.
February 2011 KFFG
|
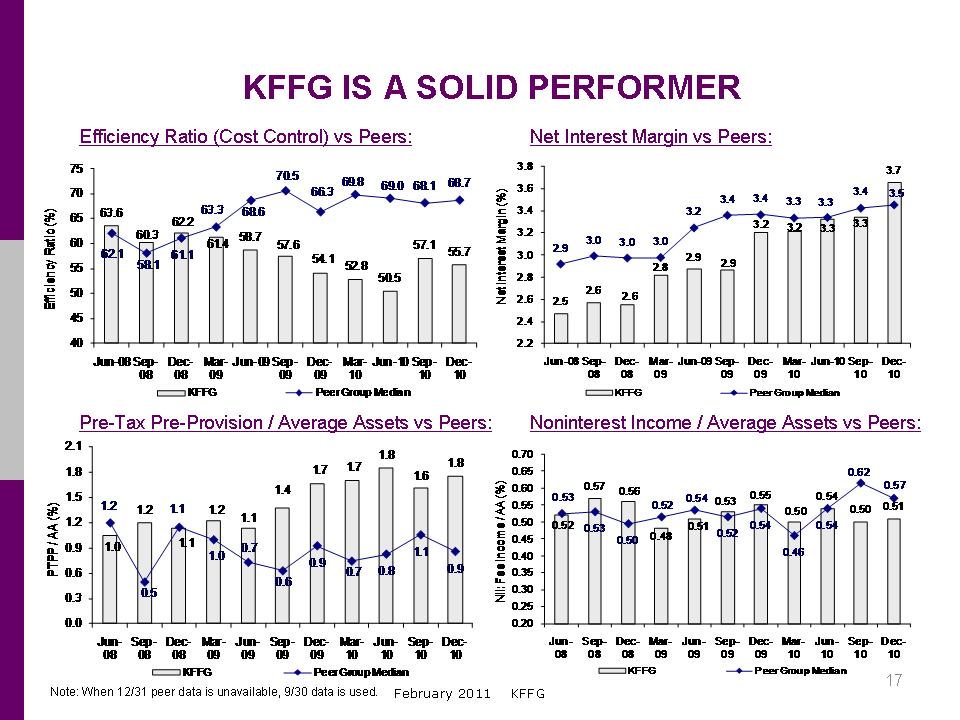 |
KFFG IS A SOLID PERFORMER
Efficiency Ratio (Cost Control) vs Peers: Net Interest Margin vs Peers:
75
70
)
(%65
tio
a 60
R
y
c55
n
ie
fic 50
E
45
40
Jun-08 Sep-Dec-Mar-Jun-09 Sep-Dec-Mar-Jun-10 Sep-Dec080809 090910 1010
KFFG
Peer Group Median
Pre-Tax Pre-Provision / Average Assets vs Peers:
2.1
1.8
) 1.5
(%
A1.2
/A
P0.9
P
T
P0.6
0.3
0.0
Jun-Sep-Dec-Mar-Jun-Sep-Dec-Mar-Jun-Sep-Dec
08 08080909090910 101010
KFFG
Peer Group Median
Note: When 12/31 peer data is unavailable, 9/30 data is used. February 2011
63.6
60.3
62.2
61.4 58.7 57.6
54.1 52.8
50.5
57.1 55.762.1
58.1
61.1
63.3 68.6
70.5
66.3
69.8 69.0 68.1 68.7
1.0
1.2
1.1
1.2
1.1
1.4
1.7 1.7
1.8
1.6
1.8
1.2
0.5
1.1
1.0
0.7
0.6
0.9
0.7 0.8
1.1
0.9
3.8
3.7
) 3.6
3.4
3.4 3.4 3.3 3.3
(%
in3.4
3.2
g
r
3.2 3.2
a 3.2
M
3.0 3.0 3.0
t
2.9
s
e 3.0
2.9 2.9
r
e
2.8
t
n 2.8
I
t
e
N2.6
2.5
2.6 2.6
2.4
2.2
Jun-08 Sep-Dec-Mar-Jun-09 Sep-Dec-Mar-Jun-10 Sep-Dec080809 090910 1010
KFFG
Peer Group Median
Noninterest Income / Average Assets vs Peers:
0.70
0.65
)
(%0.60
A0.55
/A
0.50
em0.45
o
c
n
e
I0.40
e 0.35
F
I:0.30
N
0.25
0.20
Jun-Sep-Dec-Mar-Jun-Sep-Dec-Mar-Jun-Sep-Dec0808 080909 090910 101010
KFFG
Peer Group Median
17
KFFG
3.3 3.3
3.5
0.52
0.57 0.56
0.48
0.51
0.53 0.55
0.50
0.54
0.50 0.51
0.53
0.53
0.50
0.52 0.54
0.52
0.54
0.46
0.54
0.62
0.57
|
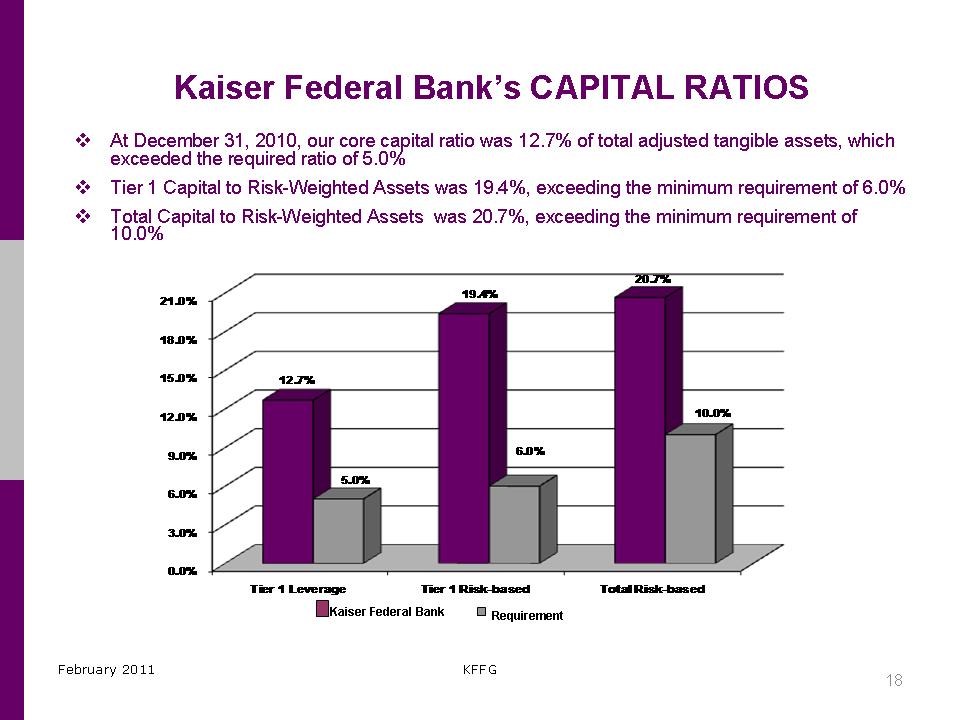 |
Kaiser Federal Bank’s CAPITAL RATIOS
. At December 31, 2010, our core capital ratio was 12.7% of total adjusted tangible assets, which exceeded the required ratio of 5.0%
. Tier 1 Capital to Risk-Weighted Assets was 19.4%, exceeding the minimum requirement of 6.0%
. Total Capital to Risk-Weighted Assets was 20.7%, exceeding the minimum requirement of
10.0%
21.0%
18.0%
15.0%
12.0%
9.0%
6.0%
3.0%
12.7%
19.4%
20.7%
5.0%
6.0%
10.0%
0.0%
Tier 1 Leverage Tier 1 Risk-based Total Risk-based
Kaiser Federal Bank
Requirement
February 2011 KFFG
|
 |
BUSINESS STRATEGY
Our goal is to promote the financial well being of our customers and the communities we serve by:
Capitalizing on current and new customer relationships by expanding such relationships
through internet banking and on-line bill payment services to increase our core deposits
Maintaining cost efficiencies and reducing our non-performing assets
Our business strategy in a difficult economic and operating environment has retained shareholder value.
Our goal is to build shareholder value
We have maintained a strong history of paying quarterly dividends to our public shareholders
We have continued to pay a quarterly dividend
Being in excess of well capitalized allows us to continue to pay a dividend unlike some of our peers
From March 31, 2004 thru September 20, 2010, we repurchased 1,438,240 shares for an
aggregate amount of $18.3 million
We intend to repurchase shares of our common stock in the future
Under current OTS regulations, we may not repurchase shares of our common stock during the first year following the completion of the November 19, 2010, conversion, except when extraordinary circumstances exist and with prior regulatory approval.
February 2011 KFFG
|
 |
Why Invest in Kaiser Federal Financial Group?
..Experienced management team
..Strong asset quality
..Historically consistent capital management strategies
..Sustained performance even in a tough economic environment
..Operates in a niche market
..Strong franchise in an attractive market area
..Solid growth potential
February 2011 KFFG
|
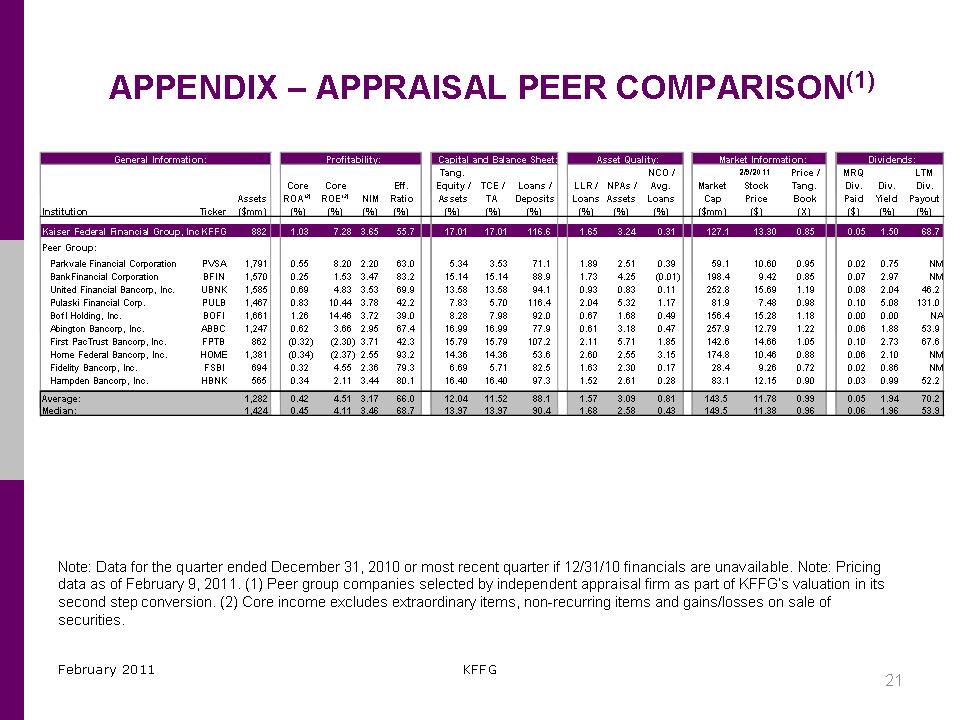 |
APPENDIX – APPRAISAL PEER COMPARISON(1)
General Information: Profitability: Capital and Balance Sheet: Asset Quality: Market Information: Dividends:
Tang. NCO / 2/9/2011 Price / MRQ LTM
Core Core Eff. Equity / TCE / Loans / LLR / NPAs / Avg. Market Stock Tang. Div. Div. Div.
Assets ROA(2) ROE(2) NIM Ratio Assets TA Deposits Loans Assets Loans Cap Price Book Paid Yield Payout
Institution Ticker ($mm) (%) (%) (%) (%) (%) (%) (%) (%) (%) (%) ($mm) ($) (X) ($) (%) (%)
Kaiser Federal Financial Group, Inc KFFG 882 1.03 7.28 3.65 55.7 17.01 17.01 116.6 1.65 3.24 0.31 127.1 13.30 0.85 0.05 1.50 68.7
Peer Group:
Parkvale Financial Corporation PVSA 1,791 0.55 8.20 2.20 63.0 5.34 3.53 71.1 1.89 2.51 0.39 59.1 10.60 0.95 0.02 0.75 NM
BankFinancial Corporation BFIN 1,570 0.25 1.53 3.47 83.2 15.14 15.14 88.9 1.73 4.25 (0.01) 198.4 9.42 0.85 0.07 2.97 NM
United Financial Bancorp, Inc. UBNK 1,585 0.69 4.83 3.53 69.9 13.58 13.58 94.1 0.93 0.83 0.11 252.8 15.69 1.19 0.08 2.04 46.2
Pulaski Financial Corp. PULB 1,467 0.83 10.44 3.78 42.2 7.83 5.70 116.4 2.04 5.32 1.17 81.9 7.48 0.98 0.10 5.08 131.0
BofI Holding, Inc. BOFI 1,661 1.26 14.46 3.72 39.0 8.28 7.98 92.0 0.67 1.68 0.49 156.4 15.28 1.18 0.00 0.00 NA
Abington Bancorp, Inc. ABBC 1,247 0.62 3.66 2.95 67.4 16.99 16.99 77.9 0.61 3.18 0.47 257.9 12.79 1.22 0.06 1.88 53.9
First PacTrust Bancorp, Inc. FPTB 862 (0.32) (2.30) 3.71 42.3 15.79 15.79 107.2 2.11 5.71 1.85 142.6 14.66 1.05 0.10 2.73 67.6
Home Federal Bancorp, Inc. HOME 1,381 (0.34) (2.37) 2.55 93.2 14.36 14.36 53.6 2.60 2.55 3.15 174.8 10.46 0.88 0.06 2.10 NM
Fidelity Bancorp, Inc. FSBI 694 0.32 4.55 2.36 79.3 6.69 5.71 82.5 1.63 2.30 0.17 28.4 9.26 0.72 0.02 0.86 NM
Hampden Bancorp, Inc. HBNK 565 0.34 2.11 3.44 80.1 16.40 16.40 97.3 1.52 2.61 0.28 83.1 12.15 0.90 0.03 0.99 52.2
Average: 1,282 0.42 4.51 3.17 66.0 12.04 11.52 88.1 1.57 3.09 0.81 143.5 11.78 0.99 0.05 1.94 70.2
Median: 1,424 0.45 4.11 3.46 68.7 13.97 13.97 90.4 1.68 2.58 0.43 149.5 11.38 0.96 0.06 1.96 53.9
Note: Data for the quarter ended December 31, 2010 or most recent quarter if 12/31/10 financials are unavailable. Note: Pricing
data as of February 9, 2011. (1) Peer group companies selected by independent appraisal firm as part of KFFG’s valuation in its
second step conversion. (2) Core income excludes extraordinary items, non-recurring items and gains/losses on sale of
securities.
February 2011 KFFG
|